 Quarterly and Year-End Results December 31, 2014 ACI Worldwide February 26, 2015 Exhibit 99.2 |
 2 Private Securities Litigation Reform Act of 1995 Safe Harbor For Forward-Looking Statements This presentation contains forward-looking statements based on current expectations that involve a number of risks and uncertainties. The forward-looking statements are made pursuant to safe harbor provisions of the Private Securities Litigation Reform Act of 1995. A discussion of these forward-looking statements and risk factors that may affect them is set forth at the end of this presentation. The Company assumes no obligation to update any forward-looking statement in this presentation, except as required by law. MEETS THE CHALLENGE OF CHANGE |
 ANNUAL OVERVIEW Phil Heasley Chief Executive Officer |
 2014 in Review 4 • SNET bookings up 17% • Strong market interest in Universal Payments • Better-than-expected demand for new applications and hosted solutions • Large UP contracts in pipeline progressing • Completed acquisition of Retail Decisions (ReD) • Non-GAAP Revenue up 17% • Adjusted EBITDA up 9% • Repurchased 3.6 million shares • Providing 2015 guidance MEETS THE CHALLENGE OF CHANGE |
 FINANCIAL REVIEW Scott Behrens Chief Financial Officer |
 6 Key Takeaways from the Quarter • Sales Bookings Q4 SNET up 10% • Backlog 60-month backlog of $4.2 billion, up $79 million from Q3 2014, after adjusting for foreign currency fluctuations 12-month backlog of $903 million, up $13 million from Q3 2014, after adjusting for foreign currency fluctuations • Revenue Growth Non-GAAP revenue was $291 million, up $6 million from Q4 last year Recurring revenue grew 16% to $203 million, representing 70% of total revenue, and offset a decline in non-recurring revenue • Adjusted EBITDA Adjusted EBITDA of $107 million declined 9% from Q4 last year • Operating Free Cash Flow Operating free cash flow of $72 million increased 16% from $62 million in Q4 last year • Debt and Liquidity Ended the year with $77 million in cash and $892 million in debt MEETS THE CHALLENGE OF CHANGE |
 Key Takeaways from the Year Operating free cash flow of $134 million decreased from $151 million last year 7 MEETS THE CHALLENGE OF CHANGE • Sales Bookings 2014 new sales bookings up 17%, or 10% excluding Official Payments and ReD Total sales bookings exceed $1 billion Hosted bookings growth up 61% over last year Impacts timing of revenue recognition • Revenue Growth Non-GAAP revenue growth of 17%, down 2% organically Continuing trend of higher recurring revenues offset by decline in non-recurring revenues as we transition to a higher hosted mix SaaS subscription and transaction revenues up 59% over prior year representing 41% of total revenue • Strong Adjusted EBITDA Adjusted EBITDA of $261 million, up 9% from 2013 • Operating Free Cash Flow • Share Repurchase Activity Repurchased ~ 3.6 million shares in 2014 $138 million remaining on share buy-back authorization |
  2015 Guidance • Guidance - 2014 Pro forma adjusted to reflect full year impact of ReD acquisition and fx rate changes - Sales, net of term extensions, growth in the high single digits - Revenue and margin phasing by quarter consistent with seasonal history - Q1 non-GAAP revenue expected to represent $225 to $235 million • Other Guidance Assumptions: - Interest expense of $42 million and cash interest of $36 million - Capital expenditures to be $40-$50 million - Depreciation and amortization expected to approximate $95-$100 million - Non-cash compensation expense of approximately $20 million - Pass through interchange revenues to approximate $115 million - GAAP tax rate of 35% and cash taxes paid of $25-$30 million - Diluted share count to approximate 117 million (excluding future share buy-back activity) - These metrics exclude approximately $8-$10 million in significant transaction-related expenses for datacenter and facilities consolidation and bill payment platform rationalization 8 2014 Incremental FX 2014 Key Metrics Actual ReD Impact Impact* Pro Forma Guidance Low High Non-GAAP Revenue 1,018 28 (23) 1,023 1,050 1,080 Adjusted EBITDA 261 6 - 267 280 290 $s in millions, foreign currency rates as of 12/31/14 2015 Non-GAAP MEETS THE CHALLENGE OF CHANGE |
 APPENDIX |
 Monthly Recurring Revenue 10 MEETS THE CHALLENGE OF CHANGE Quarter Ended Monthly Recurring Revenue (millions) December 31, 2014 2013 Monthly Software license fees $22.9 $23.4 Maintenance fees 67.4 60.3 Processing services 112.6 91.9 Monthly Recurring Revenue $202.8 $175.6 |
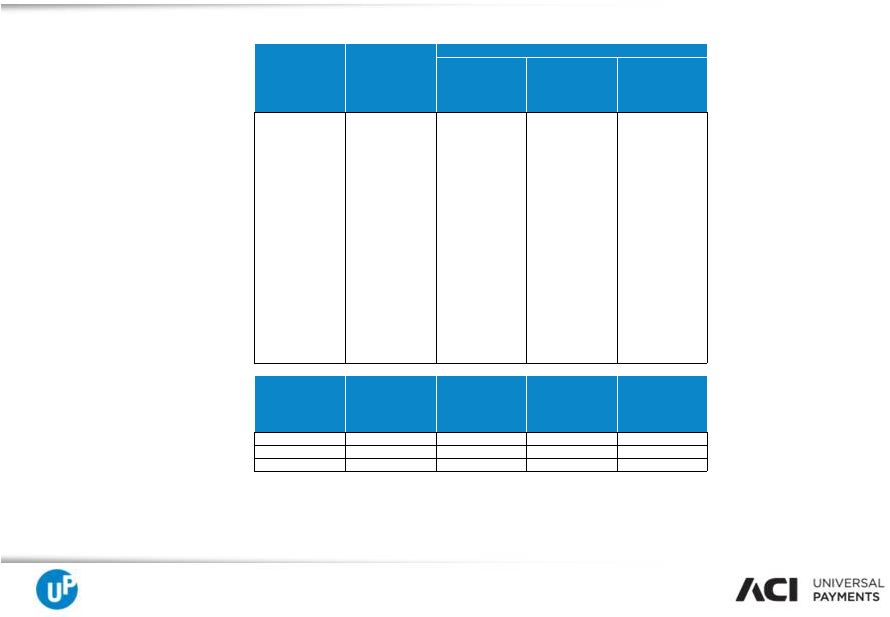 MEETS THE CHALLENGE OF CHANGE 11 Historic Sales Bookings By Quarter 2012-2014 Quarter-End Total Economic Value of Sales Sales Mix by Category inc. Capacity Upgrades & Services Term Extension New Accounts / New Applications 12/31/2012 $309,143 $52,206 $145,917 $111,020 12% 53% 34% 3/31/2013 $111,588 $5,778 $70,736 $35,074 5% 63% 31% 6/30/2013 $180,107 $33,717 $95,461 $50,929 19% 53% 28% 9/30/2013 $211,827 $42,345 $105,609 $63,874 20% 50% 30% 12/31/2013 $384,322 $45,846 $200,748 $137,729 12% 52% 36% 3/31/2014 $170,212 $36,928 $84,974 $48,311 22% 50% 28% 6/30/2014 $234,346 $44,321 $106,056 $83,969 19% 45% 36% 9/30/2014 $250,802 $63,396 $94,071 $93,336 25% 38% 37% 12/31/2014 $391,120 $99,972 $172,387 $118,761 26% 44% 30% Sales New Accounts / New Applications Add-on Business inc. Capacity Upgrades & Services Term Extension DEC YTD 14 $1,046,479 $244,616 $457,487 $344,377 DEC YTD 13 $887,844 $127,685 $472,553 $287,606 Variance $158,635 $116,930 ($15,066) $56,771 Add-on Business |
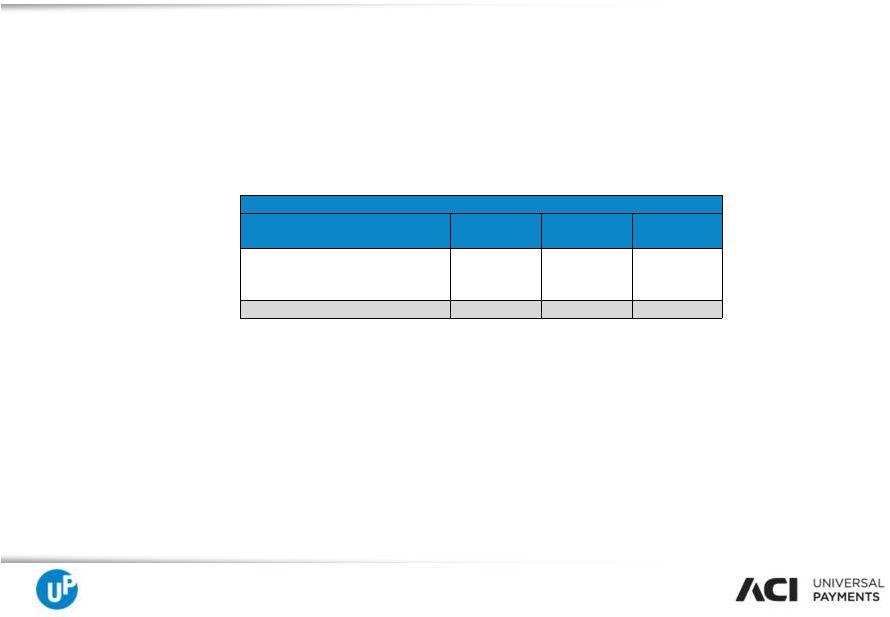 MEETS THE CHALLENGE OF CHANGE Sales Bookings, Net of Term Extensions (SNET) 12 Sales Net of Term Extensions Channel Qtr Ended Dec 14 Qtr Ended Dec 13 % Growth or Decline Americas $144,422 $117,011 23.4% EMEA 105,631 104,408 1.2% Asia-Pacific 22,306 25,175 -11.4% Total Sales (Net of Term Ext.) $272,358 $246,594 10.4% |
 MEETS THE CHALLENGE OF CHANGE Non-GAAP Operating Income 13 Quarter Ended Non-GAAP Operating Income (millions) December 31, 2014 2013 Operating income $79.3 $86.0 Plus: Deferred revenue fair value adjustment 0.3 0.9 Employee related actions 3.4 1.2 Facility closure costs - 1.2 Significant transaction related expenses 2.9 4.5 Non-GAAP Operating Income $ 85.9 Year Ended Non-GAAP Operating Income (millions) December 31, 2014 2013 Operating income $138.2 $123.0 Plus: Deferred revenue fair value adjustment 1.8 5.8 Employee related actions 10.4 10.7 Facility closure costs - 2.2 Significant transaction related expenses 12.5 13.2 Non-GAAP Operating Income $ 162.9 $ 154.9 $ 93.8 |
 MEETS THE CHALLENGE OF CHANGE Year Ended Adjusted EBITDA (millions) December 31, 2014 2013 Net income $67.6 $63.9 Plus: Income tax expense 31.2 29.3 Net interest expense 39.2 26.6 Net other expense (income) 0.2 3.3 Depreciation expense 20.5 18.8 Amortization expense 66.2 51.2 Non-cash compensation expense 11.0 13.6 Adjusted EBIDTA $235.9 $206.7 Deferred revenue fair value adjustment 1.8 5.8 Employee related actions 10.4 10.7 Facility closure costs - 2.2 Significant transaction related expenses 12.5 13.2 Adjusted EBIDTA excluding one-time transaction expenses 260.6 Adjusted EBITDA 14 Quarter Ended Adjusted EBITDA (millions) December 31, 2014 2013 Net income $46.4 $50.4 Plus: Income tax expense 23.3 24.1 Net interest expense 10.7 9.7 Net other expense (income) (1.1) 1.8 Depreciation expense 5.4 5.2 Amortization expense 18.0 15.0 Non-cash compensation expense (2.7) 2.5 Adjusted EBITDA $100.0 $108.7 Deferred revenue fair value adjustment 0.3 0.9 Employee related actions 3.4 1.2 Facility closure costs - 1.2 Significant transaction related expenses 2.9 4.5 Adjusted EBITDA excluding significant transaction related expenses $ $ $ 106.6 $ 116.5 238.6 |
 MEETS THE CHALLENGE OF CHANGE Reconciliation of Operating Free Cash Flow (millions) Quarter Ended December 31, 2014 2013 Net cash provided by operating activities $77.0 $51.9 Payments associated with cash settlement of acquisition related options - 10.2 Payments associated with acquired opening balance sheet liabilties 0.2 4.5 Net after-tax payments associated with employee-related actions 1.5 1.8 Net after-tax payments associated with lease terminations - 0.4 Net after-tax payments associated with significant transaction related expenses 1.8 6.9 Less capital expenditures (8.9) (14.2) Operating Free Cash Flow $71.6 $61.5 Operating Free Cash Flow 15 * Tax effected at 35% Reconciliation of Operating Free Cash Flow (millions) Year Ended December 31, 2014 2013 Net cash provided by operating activities $149.0 $138.4 Payments associated with cash settlement of acquisition related options - 10.2 Payments associated with acquired opening balance sheet liabilities 4.8 4.5 Net after-tax payments associated with employee-related actions 6.3 9.7 Net after-tax payments associated with lease terminations 1.0 1.0 Net after-tax payments associated with significant transaction related expenses 8.1 18.1 Net after-tax payments associated with IBM IT Outsourcing Transition - 1.9 Less capital expenditures (34.9) (32.5) Operating Free Cash Flow $134.3 $151.3 |
 MEETS THE CHALLENGE OF CHANGE 60-Month Backlog 16 Quarter Ended Backlog 60-Month (millions) December 31, December 31, 2014 2013 Americas $3,014 $2,831 EMEA 855 747 Asia/Pacific 291 283 Backlog 60-Month $4,160 $3,861 Deferred Revenue $181 $168 Other 3,979 3,693 Backlog 60-Month $4,160 $3,861 |
 MEETS THE CHALLENGE OF CHANGE Backlog as a Contributor of Quarterly Revenue • Backlog from monthly recurring revenues and project go-lives continues to drive current quarter GAAP revenue • Revenue from current quarter sales consistent with prior quarters 17 Backlog as Contributor of Revenue (thousands) Quarter Ended December 31, % Growth 2014 2013 Revenue from Backlog $ 268,586 $ 268,845 -0.1% Revenue from Sales 21,638 14,317 51.1% Total Revenue $ 290,224 $ 283,162 2.5% Revenue from Backlog 93% 95% Revenue from Sales 7% 5% |
 MEETS THE CHALLENGE OF CHANGE Non-Cash Compensation, Acquisition Intangibles and Software, and Significant Transaction Related Expenses 18 All references to per share amounts have been retroactively adjusted to reflect the July 10, 2014 three-for-one stock split for all periods presented. Acquisition Intangibles & Software, Non-cash equity based compensation Quarter Ended (millions) December 31, 2014 2013 EPS Impact $ in Millions (Net of Tax) EPS Impact $ in Millions (Net of Tax) Significant transaction related expenses $ 0.04 $ 4.1 $ 0.04 Deferred revenue fair value adjustment 0.00 0.2 0.01 0.6 Amortization of acquisition-related intangibles 0.04 4.1 0.03 3.4 Amortization of acquisition-related software 0.04 4.1 0.03 3.0 Non-cash equity-based compensation (0.02) (1.8) 0.01 1.6 Total $ 10.7 $ 0.11 * Tax Effected at 35% Acquisition Intangibles & Software, Non-cash equity based compensation YTD (millions) December 31, 2014 2013 EPS Impact $ in Millions (Net of Tax) EPS Impact $ in Millions (Net of Tax) Significant transaction related expenses $ 0.13 $ 14.9 $ 0.14 Deferred revenue fair value adjustment 0.01 1.2 0.03 3.8 Amortization of acquisition-related intangibles 0.14 16.0 0.10 12.1 Amortization of acquisition-related software 0.12 14.5 0.09 10.9 Non-cash equity-based compensation 0.06 7.2 0.07 8.9 Total $ 0.43 $ 52.6 * Tax Effected at 35% $ 4.5 $ 13.1 $ 0.09 16.9 $ 53.8 $ 0.46 $ |
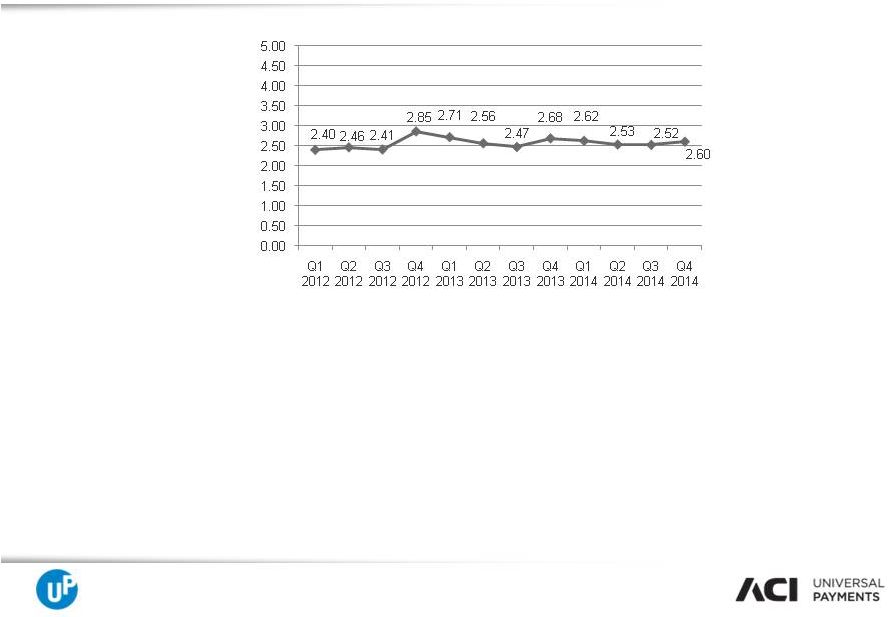 MEETS THE CHALLENGE OF CHANGE Contract Duration Metric • Represents dollar average remaining contract life (in years) for term license software contracts • Excludes perpetual contracts (primarily heritage S1 licensed software contracts) • Excludes all hosted contracts as both cash and revenue are ratable over the contract term 19 |
 MEETS THE CHALLENGE OF CHANGE Non-GAAP Financial Measures To supplement our financial results presented on a GAAP basis, we use the non-GAAP measure indicated in the tables, which exclude certain business combination accounting entries related to the acquisitions of Online Resources and S1 and significant transaction related expenses, as well as other significant non-cash expenses such as depreciation, amortization and share-based compensation, that we believe are helpful in understanding our past financial performance and our future results. The presentation of these non-GAAP financial measures should be considered in addition to our GAAP results and are not intended to be considered in isolation or as a substitute for the financial information prepared and presented in accordance with GAAP. Management generally compensates for limitations in the use of non-GAAP financial measures by relying on comparable GAAP financial measures and providing investors with a reconciliation of non-GAAP financial measures only in addition to and in conjunction with results presented in accordance with GAAP. We believe that these non-GAAP financial measures reflect an additional way of viewing aspects of our operations that, when viewed with our GAAP results, provide a more complete understanding of factors and trends affecting our business. Certain non-GAAP measures include: • • • 20 Non-GAAP revenue: revenue plus deferred revenue that would have been recognized in the normal course of business by S1 and Online Resources if not for GAAP purchase accounting requirements. Non-GAAP revenue should be considered in addition to, rather than as a substitute for, revenue. Non-GAAP operating income: operating income plus deferred revenue that would have been recognized in the normal course of business by S1 and Online Resources if not for GAAP purchase accounting requirements and significant transaction related expenses. Non-GAAP operating income should be considered in addition to, rather than as a substitute for, operating income. Adjusted EBITDA: net income plus income tax expense, net interest income (expense), net other income (expense), depreciation, amortization and non-cash compensation, as well as deferred revenue that would have been recognized in the normal course of business by S1 and Online Resources if not for GAAP purchase accounting requirements and significant transaction related expenses. Adjusted EBITDA should be considered in addition to, rather than as a substitute for, operating income. |
 MEETS THE CHALLENGE OF CHANGE Non-GAAP Financial Measures ACI is also presenting operating free cash flow, which is defined as net cash provided by operating activities, plus payments associated with cash settlement of acquisition related options and opening balance sheet liabilities, net after- tax payments associated with employee-related actions and facility closures, net after-tax payments associated with significant transaction related expenses, payments associated with acquired opening balance sheet liabilities, and less capital expenditures. Operating free cash flow is considered a non-GAAP financial measure as defined by SEC Regulation G. We utilize this non-GAAP financial measure, and believe it is useful to investors, as an indicator of cash flow available for debt repayment and other investing activities, such as capital investments and acquisitions. We utilize operating free cash flow as a further indicator of operating performance and for planning investing activities. Operating free cash flow should be considered in addition to, rather than as a substitute for, net cash provided by operating activities. A limitation of operating free cash flow is that it does not represent the total increase or decrease in the cash balance for the period. This measure also does not exclude mandatory debt service obligations and, therefore, does not represent the residual cash flow available for discretionary expenditures. We believe that operating free cash flow is useful to investors to provide disclosures of our operating results on the same basis as that used by our management. ACI also includes backlog estimates, which include all software license fees, maintenance fees and services specified in executed contracts, as well as revenues from assumed contract renewals to the extent that we believe recognition of the related revenue will occur within the corresponding backlog period. We have historically included assumed renewals in backlog estimates based upon automatic renewal provisions in the executed contract and our historic experience with customer renewal rates. 21 |
 MEETS THE CHALLENGE OF CHANGE Non-GAAP Financial Measures Backlog is considered a non-GAAP financial measure as defined by SEC Regulation G. Our 60-month backlog estimate represents expected revenues from existing customers using the following key assumptions: • • • • • Estimates of future financial results are inherently unreliable. Our backlog estimates require substantial judgment and are based on a number of assumptions as described above. These assumptions may turn out to be inaccurate or wrong, including for reasons outside of management’s control. For example, our customers may attempt to renegotiate or terminate their contracts for a number of reasons, including mergers, changes in their financial condition, or general changes in economic conditions in the customer’s industry or geographic location, or we may experience delays in the development or delivery of products or services specified in customer contracts which may cause the actual renewal rates and amounts to differ from historical experiences. Changes in foreign currency exchange rates may also impact the amount of revenue actually recognized in future periods. Accordingly, there can be no assurance that contracts included in backlog estimates will actually generate the specified revenues or that the actual revenues will be generated within the corresponding 60-month period. Backlog should be considered in addition to, rather than as a substitute for, reported revenue and deferred revenue. 22 Maintenance fees are assumed to exist for the duration of the license term for those contracts in which the committed maintenance term is less than the committed license term. License, facilities management, and software hosting arrangements are assumed to renew at the end of their committed term at a rate consistent with our historical experiences. Non-recurring license arrangements are assumed to renew as recurring revenue streams. Foreign currency exchange rates are assumed to remain constant over the 60-month backlog period for those contracts stated in currencies other than the U.S. dollar. Our pricing policies and practices are assumed to remain constant over the 60-month backlog period. |
 MEETS THE CHALLENGE OF CHANGE Forward-Looking Statements This presentation contains forward-looking statements based on current expectations that involve a number of risks and uncertainties. Generally, forward-looking statements do not relate strictly to historical or current facts and may include words or phrases such as “believes,” “ will,” “expects,” “anticipates,” “intends,” and words and phrases of similar impact. The forward-looking statements are made pursuant to safe harbor provisions of the Private Securities Litigation Reform Act of 1995. Forward-looking statements in this presentation include, but are not limited to, statements regarding: • • • • • • 23 23 Strong market interest in Universal Payments; Better-than-expected demand for new applications and hosted solutions; Large UP contracts in pipeline progressing; Expectations regarding 2015 financial guidance related to non-GAAP revenue, adjusted EBITDA, Expectations regarding Q1 2015 non-GAAP revenue; and Expectations regarding full year SNET and other guidance assumptions |
 MEETS THE CHALLENGE OF CHANGE Forward-Looking Statements All of the foregoing forward-looking statements are expressly qualified by the risk factors discussed in our filings with the Securities and Exchange Commission. Such factors include but are not limited to, increased competition, the performance of our strategic product, UP, BASE24-eps, demand for our products, restrictions and other financial covenants in our credit facility, consolidations and failures in the financial services industry, customer reluctance to switch to a new vendor, the accuracy of management’s backlog estimates, the maturity of certain products, our strategy to migrate customers to our next generation products, ratable or deferred recognition of certain revenue associated with customer migrations and the maturity of certain of our products, failure to obtain renewals of customer contracts or to obtain such renewals on favorable terms, delay or cancellation of customer projects or inaccurate project completion estimates, volatility and disruption of the capital and credit markets and adverse changes in the global economy, our existing levels of debt, impairment of our goodwill or intangible assets, litigation, future acquisitions, strategic partnerships and investments, risks related to the expected benefits to be achieved in the transaction with Online Resources, OPAY and ReD, the complexity of our products and services and the risk that they may contain hidden defects or be subjected to security breaches or viruses, compliance of our products with applicable legislation, governmental regulations and industry standards, our compliance with privacy regulations, the protection of our intellectual property in intellectual property litigation, the cyclical nature of our revenue and earnings and the accuracy of forecasts due to the concentration of revenue generating activity during the final weeks of each quarter, business interruptions or failure of our information technology and communication systems, our offshore software development activities, risks from operating internationally, including fluctuations in currency exchange rates, exposure to unknown tax liabilities, and volatility in our stock price. For a detailed discussion of these risk factors, parties that are relying on the forward-looking statements should review our filings with the Securities and Exchange Commission, including our most recently filed Annual Report on Form 10-K, Registration Statement on Form S-4, and subsequent reports on Forms 10-Q and 8-K. 24 24 |
 |