UNITED STATES
SECURITIES AND EXCHANGE COMMISSION
Washington, D.C. 20549
Form N-CSR
CERTIFIED SHAREHOLDER REPORT OF
REGISTERED MANAGEMENT INVESTMENT COMPANIES
Investment Company Act file number: 811-08934
Voya Strategic Allocation Portfolios, Inc.
(Exact name of registrant as specified in charter)
| 7337 East Doubletree Ranch Road, Suite 100, Scottsdale, AZ | 85258 |
| (Address of principal executive offices) | (Zip code) |
The Corporation Trust Incorporated, 300 East Lombard Street, Baltimore, MD 21201
(Name and address of agent for service)
Registrant’s telephone number, including area code: 1-800-992-0180
Date of fiscal year end: December 31
Date of reporting period: December 31, 2022
Item 1. Reports to Stockholders.
(a) The following is a copy of the report transmitted to stockholders pursuant to Rule 30e-1 under the Act (17 CFR 270.30e-1):
Annual Report
December 31, 2022
| Strategic Allocation Funds-of-Funds | | ■ | Voya Strategic Allocation Moderate Portfolio |
| ■ | Voya Strategic Allocation Conservative Portfolio | | ■ | Voya Strategic Allocation Growth Portfolio |
As permitted by regulations adopted by the U.S. Securities and Exchange Commission, paper copies of each portfolio’s annual and semi-annual shareholder reports, like this annual report, are not sent by mail, unless you specifically request paper copies of the reports. Instead, the reports will be made available on a website and you will be notified by mail each time a report is posted and provided with a website link to access the report.
If you already elected to receive shareholder reports electronically, you need not take any action. You may elect to receive shareholder reports and other communications from your insurance carrier electronically by contacting them directly.
You may elect to receive all future reports in paper free of charge. If you received this document in the mail, please follow the instructions provided to elect to continue receiving paper copies of your shareholder reports. You can inform us that you wish to continue receiving paper copies by calling 1-866-345-5954. Your election to receive reports in paper will apply to all the funds in which you invest. |
This report is submitted for general information to shareholders of the Voya mutual funds. It is not authorized for distribution to prospective shareholders unless accompanied or preceded by a prospectus which includes details regarding the funds’ investment objectives, risks, charges, expenses and other information. This information should be read carefully. |
INVESTMENT MANAGEMENT voyainvestments.com |  |
TABLE OF CONTENTS
| | 2 |
| | 8 |
| | 9 |
| | 10 |
| | 11 |
| | 12 |
| | 14 |
| | 15 |
| | 23 |
| | 31 |
| | 32 |
| | 35 |
PROXY VOTING INFORMATION
A description of the policies and procedures that the Portfolios use to determine how to vote proxies related to portfolio securities is available: (1) without charge, upon request, by calling Shareholder Services toll-free at (800) 992-0180; (2) on the Portfolios’ website at www.voyainvestments.com; and (3) on the U.S. Securities and Exchange Commission’s (“SEC’s”) website at www.sec.gov. Information regarding how the Portfolios voted proxies related to portfolio securities during the most recent 12-month period ended June 30 is available without charge on the Portfolios’ website at www.voyainvestments.com and on the SEC’s website at www.sec.gov.
QUARTERLY PORTFOLIO HOLDINGS
The Portfolios file their complete schedule of portfolio holdings with the SEC for the first and third quarters of each fiscal year on Form NPORT-P. The Portfolios’ Forms NPORT-P are available on the SEC’s website at www.sec.gov. Each Portfolio’s complete schedule of portfolio holdings is available at: www.voyainvestments.com and without charge upon request from the Portfolio by calling Shareholder Services toll-free at (800) 992-0180.
(THIS PAGE INTENTIONALLY LEFT BLANK)
BENCHMARK DESCRIPTIONS
| Index | Description |
|---|
| Bloomberg U.S. Aggregate Bond Index (“Bloomberg U.S. Aggregate Bond”) | An index of publicly issued investment grade U.S. government, mortgage-backed, asset-backed and corporate debt securities. |
Russell 3000® Index | An index that measures the performance of the largest 3000 U.S. companies representing approximately 98% of the investable U.S. equity market. |
1
| VOYA STRATEGIC ALLOCATION PORTFOLIOS | PORTFOLIOS MANAGERS’ REPORT |
Voya Strategic Allocation Conservative Portfolio seeks to provide total return (i.e., income and capital growth, both realized and unrealized) consistent with preservation of capital. Voya Strategic Allocation Growth Portfolio seeks to provide capital appreciation. Voya Strategic Allocation Moderate Portfolio seeks to provide total return (i.e., income and capital appreciation, both realized and unrealized). Each Portfolio seeks to achieve its investment objective by investing in a combination of underlying funds which are actively managed funds or passively managed funds (index funds). Each Portfolio uses an asset allocation strategy (“Target Asset Allocation”) designed for investors seeking the risk profile applicable to that Portfolio. These Target Asset Allocations as of December 31, 2022 are set out in the table below. Voya Strategic Allocation Conservative Portfolio, Voya Strategic Allocation Growth Portfolio and Voya Strategic Allocation Moderate Portfolio (each a “Portfolio” and collectively, the “Portfolios”) are managed by Paul Zemsky, CFA and Chief Investment Officer, and Barbara Reinhard, CFA, Portfolio Managers of Voya Investment Management Co. LLC (“Voya IM”) — the Sub-Adviser.
Performance: For the year ended December 31, 2022, Voya Strategic Allocation Conservative Portfolio’s Class I shares provided a total return of -16.46% compared to the Bloomberg U.S. Aggregate Bond Index (“Bloomberg U.S. Aggregate Bond”) and the Voya Strategic Allocation Conservative Composite which returned -13.01% and -14.41%, respectively, for the same period. For the year ended December 31, 2022, Voya Strategic Allocation Moderate Portfolio’s Class I shares provided a total return of -18.16% compared to the Russell 3000® Index and the Voya Strategic Allocation Moderate Composite which returned -19.21% and -15.84%, respectively, for the same period. For the year ended December 31, 2022, Voya Strategic Allocation Growth Portfolio’s Class I shares provided a total return of -19.35% compared to the Russell 3000® Index and the Voya Strategic Allocation Growth Composite which returned -19.21% and -16.74%, respectively, for the same period.
Portfolio Specifics: For the twelve-month reporting period ended December 31, 2022, the Portfolios underperformed their respective strategic allocation benchmarks. Both tactical asset allocation and manager selection detracted. Voya Strategic Allocation Conservative and Voya Strategic Allocation Moderate Portfolios started the year with modest overweights to equities, while Voya Strategic Allocation Growth Portfolio was neutral relative to its strategic asset allocation. Within equities, the Portfolios favored US large and small-cap over US mid-cap and core US fixed income in varying degrees.
In January and February, the Portfolios lowered their allocations to high yield, taking advantage of the relatively stable credit markets as equities experienced sharp volatility. Also in February, the strategy reduced its US large-cap position and added to emerging market and developed international equities. The non-US equity markets offer less tech exposure and less long duration equity exposure which has shown to be more sensitive to rising US real yields.
In March, the Portfolios lowered their international equity exposure in favor of short-term Eurodollar futures, believing that international equities remain vulnerable to the economic fallout from the first major war in the Europe post-World War II. We believe recession risk in the Eurozone is rising quickly as war wages, gasoline prices continue to rise and an inflation problem is forcing the European Central Bank’s (ECB) hand to tighten financial conditions. In addition, slowing Chinese growth is a challenge for emerging markets (“EM”). Any stimulus to occur will likely not be enough to revive a slowing economy and to meeting Beijing’s growth target, in our opinion. We believe strong forward guidance by the US Federal Reserve to increase policy rates and a faster balance sheet roll-off than other central banks are US dollar positives.
As part of its annual review in early April, the Portfolios equity weightings were marginally reduced. US large cap equities were used as the source of the increase to core fixed income positions. Still, the Portfolios held modest overweights to US large cap equities overall. This was a drag over the quarter as both international developed and EM equities performed better after lagging in the first three months of the year. However, overweights to US assets helped within the fixed income segments of the Portfolios, as US aggregate bonds performed better than global bonds and significantly outperformed EM debt, which struggled due to those countries’ generally weaker growth outlook and a substantial strengthening in the dollar. In May, a new position in Japanese equities was initiated, funded by selling US large cap stocks. Japan is acting more defensive than the rest of the world given the Bank of Japan’s (BOJ) use of yield curve control, which, along with relatively cheap valuations, we believe makes their equity markets more attractive in this highly uncertain macro environment. In addition, during times of market stress, the Japanese yen serves as a safe haven for investors. Furthermore, the yen has fallen dramatically since the beginning of 2021 and has not been this cheap relative to the dollar since 2002 from both purchasing power parity and real effective exchange rate perspective. We believe this should help the nation’s export-oriented businesses and could support earnings.
In the third quarter, portfolio managers (PMs) increased US large cap and small cap equities. The large cap increase was funded by a reduction to international developed equites, as the United States continues to be our favorite region given the relatively insulated economic and geopolitical position, strong currency and generally healthier companies. Within the United States, small caps have retraced all their stimulus driven gains and now trade at a discount to large caps. Given the severely oversold conditions, there is potential for an unwind and small caps would disproportionally benefit from the bounce. Within fixed income, PMs lengthened duration across Portfolios by increasing exposure to long-term US government bonds and reducing short-term bonds and cash. We believe declining energy and core goods prices, reduced shelter costs, softening labor market and decreased domestic demand will pull inflation down to the 4—5% range by the middle of next year. The necessary drop in nominal gross domestic product (GDP) or expectation thereof should weigh heavily on long dated yields. As a result, we have extended duration in fixed income Portfolio and maintain our preference for high-quality credit. Finally, toward the end of the quarter, PMs closed the long Japan position, reallocating proceeds to US large cap. The BOJ has held firm in its policy of “unlimited” purchases of 10-year Japanese Government Bonds (JGBs) to keep the yield at or below 0.25%. As Treasury yields climb and the yen weakens, the BOJ seems to have only two options: eliminate or raise the yield cap or intervene in currency markets to support the weakening yen. The BOJ has chosen the latter for now, but we are skeptical of their ability to defend the yen while maintaining yield curve control.
During the final quarter of the year, late in October, PMs lessened the tactical underweight to US large cap equities by selling EM equities. This short-term tactical trade to underweight in EM equity and add to US large caps was due to increased tensions between Beijing and Washington related to Taiwan. However, by December, relations between the two superpowers seemed to improve such that an escalation of hostilities was much less likely. As a result, the brief EM equity underweight was closed by selling international developed equities. International developed equities were used as the source of funds because Europe looked increasingly unappealing after the strong rally in the first two months of the quarter and their still challenged fundamental outlook with the ECB struggling to contain inflation in the face of a gas embargo with Russia that
2
| PORTFOLIO MANAGERS’ REPORT | VOYA STRATEGIC ALLOCATION PORTFOLIOS |
is likely to continue for a multi-year period and local governments having spent their fiscal firepower on helping households meet their increased energy costs. Europe looks to have used a short-term patch to try and fix a long-term problem, which will likely pressure European equities in 2023. Additionally, the emerging and developing international stocks relationship looked to be making an important bottom that favored EM, as China reopens and refocuses on growth. Also, toward the end of the period, after strong returns from stocks in October and November, US large cap equities were decreased and US core bonds were increased, as recession risks accumulated, leading to concerns deteriorating earnings would drive a sell-off into year end. Within fixed income, Portfolios continue to hold long duration postures as a hedge against equity beta in the event of a risk-off flight to safety and given PM’s expectations a weak growth environment will weigh down the back-end of the yield curve.
During the full year period, tactical moves relative to our strategic benchmarks had a negative performance impact across the Portfolios.
Allocation to Underlying Funds were also a hurdle over the year for the Portfolios. Top performing underlying strategies for the year were Voya Large Cap Value Portfolio, Voya U.S. High Dividend Low Volatility Portfolio and Voya Multi-Manager Mid Cap Value Fund. Bottom performers include VY® T. Rowe Price Growth Equity Portfolio, Voya MidCap Opportunities Portfolio and Voya Multi-Manager International Equity Fund.
Current Strategy and Outlook: Inflation dominated the headlines in 2022, and its progression and policy makers’ responses will continue to be the principal global macro drivers in the year ahead. Although it remains unacceptably high, data suggests to use that it has peaked with meaningfully lower core goods and energy prices. Income sensitive components of the price Index baskets, such as shelter and services, are proving sticker given the still strong labor market and high personal income. However, we are beginning to see the effects of declining demand with wage gains cooling, which we expect will continue and contribute to a steady fall in inflation to the low single digits by the end of the year. However, we do not expect a shift in policy from the Fed or ECB. With more tightening in store and explicit declarations that there will be no rate cuts in 2023, a contraction in developed market growth seems likely and should cause top line revenues to fall. Additionally, the prolonged period of rising costs is likely to erode profit margins ahead, including those of US large cap companies, which have thus far been relatively successful in maintaining pricing power. In general, US stocks are not cheap, but they are well of peaks and seem, in our opinion, reasonable. On the other side of this year, however, we believe we will see moderate inflation, more normal interest rates and slow but positive growth, which should be good for equities. Until investors begin to price in that outcome, volatility will likely be high.
We think the bond bear market is over. Following one of the worst years on record, bonds now look attractive. Positive real yields across the interest rate curve offer attractive carry for the first time in years. We expect the hand-off from inflation risk to growth risk should pressure yields lower to the benefit of duration sensitive assets. Additionally, the volatility in rates and the correlation between stocks and bonds should normalize, as fixed income reassumes its place of ballast within multi-asset portfolios.
The US continues to be our favorite region. It is further along in the inflation fight and still more geopolitically insulated as compared to the Eurozone, which still faces an increased probability and expected magnitude of a decline in output. China’s move away from zero covid and the seeming relaxation of tensions with the United States from their boiling point are pluses for EM. While the dollar is less likely to be a challenge to international assets, it should retain its defensive properties in risk-off scenarios, providing motivation for keeping close to home for now.
The views expressed in this commentary are informed opinions. They should not be considered promises or advice. The views expressed reflect those of the portfolio managers, only through the end of the period as stated on the cover. The portfolio managers’ views are subject to change at any time based on market and other conditions.
Portfolio holdings and characteristics are subject to change and may not be representative of current holdings and characteristics. Portfolio holdings are subject to change daily. The outlook for this Portfolio may differ from that presented for other Voya mutual funds. This report contains statements that may be “forward-looking” statements. Actual results may differ materially from those projected in the “forward-looking” statements. The Portfolio’s performance returns shown reflect applicable fee waivers and/or expense limits in effect during this period. Absent such fee waivers/expense limitations, if any, performance would have been lower. Performance for the different classes of shares will vary based on differences in fees associated with each class. An index has no cash in its portfolio and imposes no sales charges. An investor cannot invest directly in an index.
3
| VOYA STRATEGIC ALLOCATION PORTFOLIOS | PORTFOLIOS MANAGERS’ REPORT |
Annual Target Asset Allocations as of December 31, 2022(1)
(as a percentage of net assets)
Sub Asset Class
| | Conservative | | Moderate | | Growth |
|---|
| US Large Blend | | | 14.0 | % | | | 32.0 | % | | | 42.0 | % |
| US Large Growth | | | 6.0 | % | | | 7.0 | % | | | 5.0 | % |
| US Large Value | | | 8.0 | % | | | 7.0 | % | | | 5.0 | % |
| US Mid Cap Blend | | | 2.0 | % | | | 5.0 | % | | | 8.0 | % |
| US Small Cap | | | 4.0 | % | | | 5.0 | % | | | 7.0 | % |
| International | | | 2.0 | % | | | 3.0 | % | | | 8.0 | % |
| Emerging Markets | | | 2.0 | % | | | 2.0 | % | | | 3.0 | % |
| Core Fixed Income | | | 37.5 | % | | | 28.5 | % | | | 15.5 | % |
| High Yield | | | 5.0 | % | | | — | | | | — | |
| International Bonds | | | 4.0 | % | | | — | | | | — | |
| TIPS | | | 2.0 | % | | | 1.0 | % | | | 1.0 | % |
| Short Duration | | | 10.5 | % | | | 6.5 | % | | | 2.5 | % |
| Long Govt Bonds | | | 3.0 | % | | | 3.0 | % | | | 3.0 | % |
Total Equity | | | 38.0 | % | | | 61.0 | % | | | 78.0 | % |
Total Fixed Income | | | 62.0 | % | | | 39.0 | % | | | 22.0 | % |
| | | | 100.0 | % | | | 100.0 | % | | | 100.0 | % |
(1) | | As these are target allocations, the actual allocations of each Portfolio’s assets may deviate from the percentages shown. Although the Portfolios expect to be fully invested at all times, they may maintain liquidity reserves to meet redemption requests. |
Portfolio holdings are subject to change daily.
4
| PORTFOLIO MANAGERS’ REPORT | VOYA STRATEGIC ALLOCATION
CONSERVATIVE PORTFOLIO |
| Average Annual Total Returns for the Periods Ended December 31, 2022 | |
|---|
| | 1 Year | | | 5 Year | | | 10 Year | |
|---|
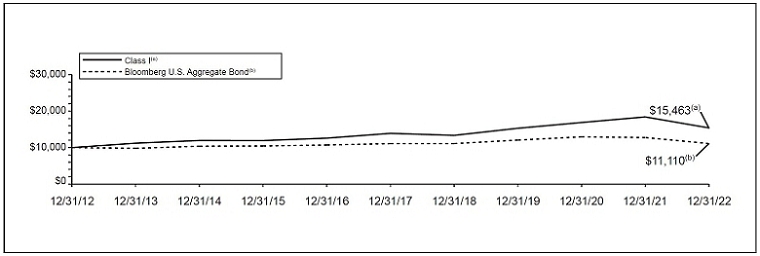
| Class I | | | –16.46 | % | | | 2.10 | % | | | 4.45 | % |
| Class S | | | –16.69 | % | | | 1.85 | % | | | 4.19 | % |
| Bloomberg U.S. Aggregate Bond | | | –13.01 | % | | | 0.02 | % | | | 1.06 | % |
Based on a $10,000 initial investment, the graph and table above illustrate the total return of Voya Strategic Allocation Conservative Portfolio against the index indicated. The index is unmanaged and has no cash in its portfolio and imposes no sales charges. An investor cannot invest directly in an index.
The Portfolio’s performance is shown without the imposition of any expenses or charges which are, or may be, imposed under your variable annuity contract or variable life insurance policy. Total returns would have been lower if such expenses or charges were included.
The performance graph and table do not reflect the deduction of taxes that a shareholder will pay on Portfolio distributions or the redemption of Portfolio shares.
The performance shown includes, if applicable the effect of fee waivers and/or expense reimbursements by the Investment Adviser and/or other
service providers, which have the effect of increasing total return. Had all fees and expenses been considered, the total returns would have been lower.
The performance update illustrates performance for a variable investment option available through a variable annuity contract or a variable life insurance policy. The performance shown indicates past performance and is not a projection or prediction of future results. Actual investment returns and principal value will fluctuate so that shares and/or units, at redemption, may be worth more or less than their original cost. Please log on to www.voyainvestments.com or call (800) 992-0180 to get performance through the most recent month end.
Portfolio holdings are subject to change daily.
5
VOYA STRATEGIC ALLOCATION
MODERATE PORTFOLIO | PORTFOLIOS MANAGERS’ REPORT |
| Average Annual Total Returns for the Periods Ended December 31, 2022 |
|---|
| | 1 Year | | | 5 Year | | | 10 Year | |
|---|
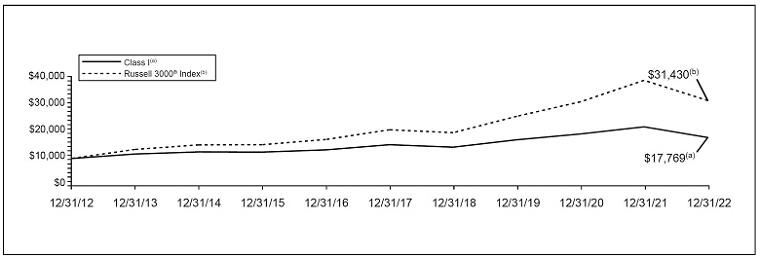
| Class I | | | –18.16 | % | | | 3.31 | % | | | 5.92 | % |
| Class S | | | –18.34 | % | | | 3.05 | % | | | 5.65 | % |
Russell 3000® Index | | | –19.21 | % | | | 8.79 | % | | | 12.13 | % |
Based on a $10,000 initial investment, the graph and table above illustrate the total return of Voya Strategic Allocation Moderate Portfolio against the index indicated. The index is unmanaged and has no cash in its portfolio and imposes no sales charges. An investor cannot invest directly in an index.
The Portfolio’s performance is shown without the imposition of any expenses or charges which are, or may be, imposed under your variable annuity contract or variable life insurance policy. Total returns would have been lower if such expenses or charges were included.
The performance graph and table do not reflect the deduction of taxes that a shareholder will pay on Portfolio distributions or the redemption of Portfolio shares.
The performance shown includes, if applicable, the effect of fee waivers and/or expense reimbursements by the Investment Adviser and/or other
service providers, which have the effect of increasing total return. Had all fees and expenses been considered, the total returns would have been lower.
The performance update illustrates performance for a variable investment option available through a variable annuity contract or a variable life insurance policy. The performance shown indicates past performance and is not a projection or prediction of future results. Actual investment returns and principal value will fluctuate so that shares and/or units, at redemption, may be worth more or less than their original cost. Please log on to www.voyainvestments.com or call (800) 992-0180 to get performance through the most recent month end.
Portfolio holdings are subject to change daily.
6
| PORTFOLIO MANAGER’S REPORT | VOYA STRATEGIC ALLOCATION
GROWTH PORTFOLIO |

| Average Annual Total Returns for the Periods Ended December 31, 2022 |
|---|
| | 1 Year | | | 5 Year | | | 10 Year | |
|---|
| Class I | | | –19.35 | % | | | 4.05 | % | | | 7.08 | % |
| Class S | | | –19.55 | % | | | 3.79 | % | | | 6.80 | % |
Russell 3000® Index | | | –19.21 | % | | | 8.79 | % | | | 12.13 | % |
Based on a $10,000 initial investment, the graph and table above illustrate the total return of Voya Strategic Allocation Growth Portfolio against the index indicated. The index is unmanaged and has no cash in its portfolio and imposes no sales charges. An investor cannot invest directly in an index.
The Portfolio’s performance is shown without the imposition of any expenses or charges which are, or may be, imposed under your variable annuity contract or variable life insurance policy. Total returns would have been lower if such expenses or charges were included.
The performance graph and table do not reflect the deduction of taxes that a shareholder will pay on Portfolio distributions or the redemption of Portfolio shares.
The performance shown includes, if applicable, the effect of fee waivers and/or expense reimbursements by the Investment Adviser and/or other
service providers, which have the effect of increasing total return. Had all fees and expenses been considered, the total returns would have been lower.
The performance update illustrates performance for a variable investment option available through a variable annuity contract or a variable life insurance policy. The performance shown indicates past performance and is not a projection or prediction of future results. Actual investment returns and principal value will fluctuate so that shares and/or units, at redemption, may be worth more or less than their original cost. Please log on to www.voyainvestments.com or call (800) 992-0180 to get performance through the most recent month end.
Portfolio holdings are subject to change daily.
7
SHAREHOLDER EXPENSE EXAMPLES (UNAUDITED) As a shareholder of a Portfolio, you incur two types of costs: (1) transaction costs, including redemption fees, and exchange fees; and (2) ongoing costs, including management fees, distribution and/or service (12b-1) fees, and other Portfolio expenses. These Examples are intended to help you understand your ongoing costs (in dollars) of investing in a Portfolio and to compare these costs with the ongoing costs of investing in other mutual funds.
The Examples are based on an investment of $1,000 invested at the beginning of the period and held for the entire period from July 1, 2022 through December 31, 2022. The Portfolios’ expenses are shown without the imposition of any charges which are, or may be, imposed under your variable annuity contract, variable life insurance policy, qualified pension, or retirement plan. Expenses would have been higher if such charges were included.
Actual Expenses
The left section of the table shown below, “Actual Portfolio Return,” provides information about actual account values and actual expenses. You may use the information in this section, together with the amount you invested, to estimate the expenses that you paid over the period. Simply divide your account value by $1,000 (for example, an $8,600 account value divided by $1,000 = 8.6), then multiply the result by the number in the first section under the heading entitled “Expenses Paid During the Period” to estimate the expenses you paid on your account during this period.
Hypothetical Example for Comparison Purposes
The right section of the table shown below, “Hypothetical (5% return before expenses),” provides information about hypothetical account values and hypothetical expenses based on a Portfolio’s actual expense ratio and an assumed rate of return of 5% per year before expenses, which is not a Portfolio’s actual return. The hypothetical account values and expenses may not be used to estimate the actual ending account balance or expenses you paid for the period. You may use this information to compare the ongoing costs of investing in each Portfolio and other mutual funds. To do so, compare this 5% hypothetical example with the 5% hypothetical examples that appear in the shareholder reports of the other mutual funds.
Please note that the expenses shown in the table are meant to highlight your ongoing costs only and do not reflect any transactional costs, such as redemption fees, or exchange fees. Therefore, the hypothetical section of the table is useful in comparing ongoing costs only, and will not help you determine the relative total costs of owning different mutual funds. In addition, if these transactional costs were included, your costs would have been higher.
| | Actual Portfolio Return | | Hypothetical (5% return before expenses) |
|---|
| | Beginning
Account
Value
July 1,
2022 | | Ending
Account
Value
December 31,
2022 | | Annualized
Expense
Ratio* | | Expenses Paid
During the
Period Ended
December 31,
2022** | | Beginning
Account
Value
July 1,
2022 | | Ending
Account
Value
December 31,
2022 | | Annualized
Expense
Ratio* | | Expenses Paid
During the
Period Ended
December 31,
2022** |
|---|
Voya Strategic Allocation Conservative Portfolio |
| Class I | | $ | 1,000.00 | | | $ | 988.70 | | | | 0.30 | % | | $ | 1.50 | | | $ | 1,000.00 | | | $ | 1,023.69 | | | | 0.30 | % | | $ | 1.53 | |
| Class S | | | 1,000.00 | | | | 987.70 | | | | 0.55 | | | | 2.76 | | | | 1,000.00 | | | | 1,022.43 | | | | 0.55 | | | | 2.80 | |
Voya Strategic Allocation Moderate Portfolio |
| Class I | | $ | 1,000.00 | | | $ | 997.40 | | | | 0.33 | % | | $ | 1.66 | | | $ | 1,000.00 | | | $ | 1,023.54 | | | | 0.33 | % | | $ | 1.68 | |
| Class S | | | 1,000.00 | | | | 996.50 | | | | 0.58 | | | | 2.92 | | | | 1,000.00 | | | | 1,022.28 | | | | 0.58 | | | | 2.96 | |
Voya Strategic Allocation Growth Portfolio |
| Class I | | $ | 1,000.00 | | | $ | 1,008.40 | | | | 0.31 | % | | $ | 1.57 | | | $ | 1,000.00 | | | $ | 1,023.64 | | | | 0.31 | % | | $ | 1.58 | |
| Class S | | | 1,000.00 | | | | 1,006.80 | | | | 0.56 | | | | 2.83 | | | | 1,000.00 | | | | 1,022.38 | | | | 0.56 | | | | 2.85 | |
| * | | The annualized expense ratios do not include expenses of the underlying funds. |
| ** | | Expenses are equal to each Portfolio’s respective annualized expense ratios multiplied by the average account value over the period, multiplied by 184/365 to reflect the most recent fiscal half-year. |
8
REPORT OF INDEPENDENT REGISTERED PUBLIC ACCOUNTING FIRM To the Shareholders of Voya Strategic Allocation Conservative Portfolio, Voya Strategic Allocation Moderate Portfolio and Voya Strategic Allocation Growth Portfolio and the Board of Directors of Voya Strategic Allocation Portfolios, Inc.
Opinion on the Financial Statements
We have audited the accompanying statements of assets and liabilities of Voya Strategic Allocation Conservative Portfolio, Voya Strategic Allocation Moderate Portfolio and Voya Strategic Allocation Growth Portfolio (collectively referred to as the “Portfolios”) (three of the portfolios constituting Voya Strategic Allocation Portfolios, Inc. (the “Company”)), including the portfolios of investments, as of December 31, 2022, and the related statements of operations for the year then ended, the statements of changes in net assets for each of the two years in the period then ended, the financial highlights for each of the three years in the period then ended and the related notes (collectively referred to as the “financial statements”). In our opinion, the financial statements present fairly, in all material respects, the financial position of each of the Portfolios (three of the portfolios constituting Voya Strategic Allocation Portfolios, Inc.) at December 31, 2022, the results of their operations for the year then ended, the changes in their net assets for each of the two years in the period then ended and their financial highlights for each of the three years in the period then ended, in conformity with U.S. generally accepted accounting principles.
The financial highlights for each of the years in the two-year period ended December 31, 2019, were audited by another independent registered public accounting firm whose report, dated February 26, 2020, expressed an unqualified opinion on those financial highlights.
Basis for Opinion
These financial statements are the responsibility of the Company’s management. Our responsibility is to express an opinion on each of the Portfolios’ financial statements based on our audits. We are a public accounting firm registered with the Public Company Accounting Oversight Board (United States) (“PCAOB”) and are required to be independent with respect to the Company in accordance with the U.S. federal securities laws and the applicable rules and regulations of the Securities and Exchange Commission and the PCAOB.
We conducted our audits in accordance with the standards of the PCAOB. Those standards require that we plan and perform the audits to obtain reasonable assurance about whether the financial statements are free of material misstatement, whether due to error or fraud. The Company is not required to have, nor were we engaged to perform, an audit of the Company’s internal control over financial reporting. As part of our audits, we are required to obtain an understanding of internal control over financial reporting, but not for the purpose of expressing an opinion on the effectiveness of the Company’s internal control over financial reporting. Accordingly, we express no such opinion.
Our audits included performing procedures to assess the risks of material misstatement of the financial statements, whether due to error or fraud, and performing procedures that respond to those risks. Such procedures included examining, on a test basis, evidence regarding the amounts and disclosures in the financial statements. Our procedures included confirmation of securities owned as of December 31, 2022, by correspondence with the custodian, brokers and others; when replies were not received from brokers and others, we performed other auditing procedures. Our audits also included evaluating the accounting principles used and significant estimates made by management, as well as evaluating the overall presentation of the financial statements. We believe that our audits provide a reasonable basis for our opinion.
We have served as the auditor of one or more Voya investment companies since 2019.
Boston, Massachusetts
February 28, 2023
9
STATEMENTS OF ASSETS AND LIABILITIES AS OF DECEMBER 31, 2022
| | Voya
Strategic
Allocation
Conservative
Portfolio | | Voya
Strategic
Allocation
Moderate
Portfolio | | Voya
Strategic
Allocation
Growth
Portfolio |
|---|
ASSETS: | | | | | | | | | | | | |
| Investments in affiliated underlying funds at fair value* | | $ | 52,551,137 | | | $ | 108,118,816 | | | $ | 117,728,066 | |
| Investments in unaffiliated underlying funds at fair value** | | | 3,930,873 | | | | 3,361,033 | | | | 3,589,929 | |
| Cash | | | 66,433 | | | | 85,794 | | | | 112,364 | |
| Cash collateral for futures contracts | | | — | | | | 226,193 | | | | 231,917 | |
| Receivables: | | | | | | | | | | | | |
| Investments in affiliated underlying funds sold | | | — | | | | 199,264 | | | | — | |
| Fund shares sold | | | 6,219 | | | | 131 | | | | 70,070 | |
| Interest | | | 628 | | | | 1,072 | | | | — | |
| Variation margin on futures contracts | | | — | | | | 6,728 | | | | 7,960 | |
| Prepaid expenses | | | 311 | | | | 597 | | | | 643 | |
| Reimbursement due from Investment Adviser | | | 2,753 | | | | — | | | | 3,832 | |
| Other assets | | | 6,406 | | | | 11,599 | | | | 11,327 | |
| Total assets | | | 56,564,760 | | | | 112,011,227 | | | | 121,756,108 | |
LIABILITIES: | | | | | | | | | | | | |
| Payable for investments in affiliated underlying funds purchased | | | 6,015 | | | | — | | | | 40,627 | |
| Payable for fund shares redeemed | | | 207 | | | | 199,394 | | | | 29,443 | |
| Payable for investment management fees | | | 9,541 | | | | 18,104 | | | | 19,674 | |
| Payable for distribution and shareholder service fees | | | 636 | | | | 261 | | | | 469 | |
| Payable for directors fees | | | 158 | | | | 307 | | | | 328 | |
| Payable to directors under the deferred compensation plan (Note 6) | | | 6,406 | | | | 11,599 | | | | 11,327 | |
| Other accrued expenses and liabilities | | | 24,875 | | | | 35,524 | | | | 38,038 | |
| Total liabilities | | | 47,838 | | | | 265,189 | | | | 139,906 | |
NET ASSETS | | $ | 56,516,922 | | | $ | 111,746,038 | | | $ | 121,616,202 | |
NET ASSETS WERE COMPRISED OF: | | | | | | | | | | | | |
| Paid-in capital | | $ | 61,996,090 | | | $ | 118,275,260 | | | $ | 124,793,370 | |
| Total distributable loss | | | (5,479,168 | ) | | | (6,529,222 | ) | | | (3,177,168 | ) |
NET ASSETS | | $ | 56,516,922 | | | $ | 111,746,038 | | | $ | 121,616,202 | |
| * Cost of investments in affiliated underlying funds | | $ | 57,959,414 | | | $ | 119,238,640 | | | $ | 127,100,259 | |
| ** Cost of investments in unaffiliated underlying funds | | $ | 4,566,785 | | | $ | 4,207,670 | | | $ | 4,493,410 | |
| | | | | | | | | | | | | |
Class I | | | | | | | | | | | | |
| Net assets | | $ | 53,576,938 | | | $ | 110,540,763 | | | $ | 119,443,839 | |
| Shares authorized | | | 100,000,000 | | | | 100,000,000 | | | | 100,000,000 | |
| Par value | | $ | 0.001 | | | $ | 0.001 | | | $ | 0.001 | |
| Shares outstanding | | | 5,086,400 | | | | 9,544,602 | | | | 9,955,146 | |
| Net asset value and redemption price per share | | $ | 10.53 | | | $ | 11.58 | | | $ | 12.00 | |
| | | | | | | | | | | | | |
Class S | | | | | | | | | | | | |
| Net assets | | $ | 2,939,984 | | | $ | 1,205,275 | | | $ | 2,172,363 | |
| Shares authorized | | | 100,000,000 | | | | 100,000,000 | | | | 100,000,000 | |
| Par value | | $ | 0.001 | | | $ | 0.001 | | | $ | 0.001 | |
| Shares outstanding | | | 282,285 | | | | 104,709 | | | | 183,284 | |
| Net asset value and redemption price per share | | $ | 10.41 | | | $ | 11.51 | | | $ | 11.85 | |
See Accompanying Notes to Financial Statements
10
STATEMENTS OF OPERATIONS FOR THE YEAR ENDED DECEMBER 31, 2022
| | Voya
Strategic
Allocation
Conservative
Portfolio | | Voya
Strategic
Allocation
Moderate
Portfolio | | Voya
Strategic
Allocation
Growth
Portfolio |
|---|
INVESTMENT INCOME: | | | | | | | | | | | | |
| Dividends from affiliated underlying funds | | $ | 1,210,522 | | | $ | 1,942,955 | | | $ | 1,795,150 | |
| Dividends from unaffiliated underlying funds | | | 129,012 | | | | 168,309 | | | | 178,702 | |
| Interest | | | 1,023 | | | | 5,671 | | | | 3,669 | |
| Total investment income | | | 1,340,557 | | | | 2,116,935 | | | | 1,977,521 | |
EXPENSES: | | | | | | | | | | | | |
| Investment management fees | | | 124,786 | | | | 237,042 | | | | 256,240 | |
| Distribution and shareholder service fees: | | | | | | | | | | | | |
| Class S | | | 8,142 | | | | 3,398 | | | | 5,962 | |
| Transfer agent fees: | | | | | | | | | | | | |
| Class I | | | 48,946 | | | | 94,654 | | | | 113,299 | |
| Class S | | | 2,652 | | | | 1,058 | | | | 2,100 | |
| Shareholder reporting expense | | | 7,300 | | | | 11,680 | | | | 14,949 | |
| Registration fees | | | 65 | | | | 53 | | | | — | |
| Professional fees | | | 11,680 | | | | 29,200 | | | | 34,630 | |
| Custody and accounting expense | | | 12,775 | | | | 15,330 | | | | 16,425 | |
| Directors fees | | | 1,585 | | | | 3,068 | | | | 3,286 | |
| Miscellaneous expense | | | 8,735 | | | | 10,966 | | | | 8,722 | |
| Interest expense | | | 162 | | | | — | | | | — | |
| Total expenses | | | 226,828 | | | | 406,449 | | | | 455,613 | |
| Waived and reimbursed fees | | | (26,371 | ) | | | — | | | | (39,028 | ) |
| Net expenses | | | 200,457 | | | | 406,449 | | | | 416,585 | |
| Net investment income | | | 1,140,100 | | | | 1,710,486 | | | | 1,560,936 | |
REALIZED AND UNREALIZED GAIN (LOSS): | | | | | | | | | | | | |
| Net realized gain (loss) on: | | | | | | | | | | | | |
| Sale of affiliated underlying funds | | | (3,423,151 | ) | | | (7,638,105 | ) | | | (8,156,333 | ) |
| Sale of unaffiliated underlying funds | | | 1,225,279 | | | | 1,228,137 | | | | 1,814,711 | |
| Capital gain distributions from affiliated underlying funds | | | 3,380,772 | | | | 12,512,170 | | | | 14,133,984 | |
| Futures | | | — | | | | 149,897 | | | | 193,971 | |
| Net realized gain | | | 1,182,900 | | | | 6,252,099 | | | | 7,986,333 | |
| Net change in unrealized appreciation (depreciation) on: | | | | | | | | | | | | |
| Affiliated underlying funds | | | (12,074,179 | ) | | | (30,880,725 | ) | | | (35,288,001 | ) |
| Unaffiliated underlying funds | | | (2,320,786 | ) | | | (3,055,901 | ) | | | (4,275,161 | ) |
| Futures | | | — | | | | 21,976 | | | | 30,514 | |
| Net change in unrealized appreciation (depreciation) | | | (14,394,965 | ) | | | (33,914,650 | ) | | | (39,532,648 | ) |
| Net realized and unrealized loss | | | (13,212,065 | ) | | | (27,662,551 | ) | | | (31,546,315 | ) |
Decrease in net assets resulting from operations | | $ | (12,071,965 | ) | | $ | (25,952,065 | ) | | $ | (29,985,379 | ) |
See Accompanying Notes to Financial Statements
11
STATEMENTS OF CHANGES IN NET ASSETS
| | Voya Strategic Allocation
Conservative Portfolio | | Voya Strategic Allocation
Moderate Portfolio |
|---|
| | Year Ended
December 31,
2022 | | Year Ended
December 31,
2021 | | Year Ended
December 31,
2022 | | Year Ended
December 31,
2021 |
|---|
FROM OPERATIONS: | | | | | | | | | | | | | | | | |
| Net investment income | | $ | 1,140,100 | | | $ | 1,478,827 | | | $ | 1,710,486 | | | $ | 2,223,479 | |
| Net realized gain | | | 1,182,900 | | | | 5,785,686 | | | | 6,252,099 | | | | 13,903,477 | |
| Net change in unrealized appreciation (depreciation) | | | (14,394,965 | ) | | | (799,073 | ) | | | (33,914,650 | ) | | | 1,786,848 | |
| Increase (decrease) in net assets resulting from operations | | | (12,071,965 | ) | | | 6,465,440 | | | | (25,952,065 | ) | | | 17,913,804 | |
FROM DISTRIBUTIONS TO SHAREHOLDERS: | | | | | | | | | | | | | | | | |
| Total distributions (excluding return of capital): | | | | | | | | | | | | | | | | |
| Class I | | | (7,001,681 | ) | | | (1,965,059 | ) | | | (15,985,509 | ) | | | (7,361,065 | ) |
| Class S | | | (369,519 | ) | | | (98,241 | ) | | | (178,171 | ) | | | (80,773 | ) |
| Total distributions | | | (7,371,200 | ) | | | (2,063,300 | ) | | | (16,163,680 | ) | | | (7,441,838 | ) |
FROM CAPITAL SHARE TRANSACTIONS: | | | | | | | | | | | | | | | | |
| Net proceeds from sale of shares | | | 6,086,984 | | | | 8,546,135 | | | | 4,444,559 | | | | 7,909,864 | |
| Reinvestment of distributions | | | 7,371,200 | | | | 2,063,300 | | | | 16,163,680 | | | | 7,441,838 | |
| | | | 13,458,184 | | | | 10,609,435 | | | | 20,608,239 | | | | 15,351,702 | |
| Cost of shares redeemed | | | (12,720,367 | ) | | | (10,344,216 | ) | | | (11,713,539 | ) | | | (13,343,829 | ) |
| Net increase in net assets resulting from capital share transactions | | | 737,817 | | | | 265,219 | | | | 8,894,700 | | | | 2,007,873 | |
| Net increase (decrease) in net assets | | | (18,705,348 | ) | | | 4,667,359 | | | | (33,221,045 | ) | | | 12,479,839 | |
NET ASSETS: | | | | | | | | | | | | | | | | |
| Beginning of year or period | | | 75,222,270 | | | | 70,554,911 | | | | 144,967,083 | | | | 132,487,244 | |
| End of year or period | | $ | 56,516,922 | | | $ | 75,222,270 | | | $ | 111,746,038 | | | $ | 144,967,083 | |
See Accompanying Notes to Financial Statements
12
STATEMENTS OF CHANGES IN NET ASSETS
| | Voya Strategic Allocation
Growth Portfolio |
|---|
| | Year Ended
December 31,
2022 | | Year Ended
December 31,
2021 |
|---|
FROM OPERATIONS: | | | | | | | | |
| Net investment income | | $ | 1,560,936 | | | $ | 2,043,930 | |
| Net realized gain | | | 7,986,333 | | | | 18,890,159 | |
| Net change in unrealized appreciation (depreciation) | | | (39,532,648 | ) | | | 3,161,747 | |
| Increase (decrease) in net assets resulting from operations | | | (29,985,379 | ) | | | 24,095,836 | |
FROM DISTRIBUTIONS TO SHAREHOLDERS: | | | | | | | | |
| Total distributions (excluding return of capital): | | | | | | | | |
| Class I | | | (20,520,510 | ) | | | (5,750,466 | ) |
| Class S | | | (376,391 | ) | | | (104,047 | ) |
| Total distributions | | | (20,896,901 | ) | | | (5,854,513 | ) |
FROM CAPITAL SHARE TRANSACTIONS: | | | | | | | | |
| Net proceeds from sale of shares | | | 6,061,692 | | | | 6,920,238 | |
| Reinvestment of distributions | | | 20,896,901 | | | | 5,854,513 | |
| | | | 26,958,593 | | | | 12,774,751 | |
| Cost of shares redeemed | | | (11,912,836 | ) | | | (16,951,362 | ) |
| Net increase (decrease) in net assets resulting from capital share transactions | | | 15,045,757 | | | | (4,176,611 | ) |
| Net increase (decrease) in net assets | | | (35,836,523 | ) | | | 14,064,712 | |
NET ASSETS: | | | | | | | | |
| Beginning of year or period | | | 157,452,725 | | | | 143,388,013 | |
| End of year or period | | $ | 121,616,202 | | | $ | 157,452,725 | |
See Accompanying Notes to Financial Statements
13
Selected data for a share of beneficial interest outstanding throughout each year or period.
| | | | Income (loss)
from investment
operations | | | | Less distributions | | | | | | | | | | Ratios to average
net assets | | Supplemental
data |
| | | Net asset
value,
beginning
of year
or period | | Net
investment
income
(loss) | | Net
realized
and
unrealized
gain (loss) | | Total from
investment
operations | | From net
investment
income | | From net
realized
gains | | From
return of
capital | | Total
distributions | | Payment by
affiliate | | Net asset
value,
end of
year or
period | | Total
Return(1) | | Expenses
before
reductions/
additions(2)(3)(4) | | Expenses
net of fee
waivers
and/or
recoupments
if any(2)(3)(4) | | Expenses
net of all
reductions/
additions(2)(3)(4) | | Net
investment
income
(loss)(2)(3) | | Net assets,
end of
year or
period | | Portfolio
turnover
rate |
| Year or period ended | | ($) | | ($) | | ($) | | ($) | | ($) | | ($) | | ($) | | ($) | | ($) | | ($) | | (%) | | (%) | | (%) | | (%) | | (%) | | ($000’s) | | (%) |
Voya Strategic Allocation Conservative Portfolio |
Class I | | | | | | | | | | | | | | | | | | | | | | | | | | | | | | | | | | | | | | | | | | | | | | | | | | | | | | | | | | | | | | | | | | | | |
| 12-31-22 | | | 14.26 | | | | 0.21 | • | | | (2.51 | ) | | | (2.30 | ) | | | 0.44 | | | | 0.99 | | | | — | | | | 1.43 | | | | — | | | | 10.53 | | | | (16.46 | ) | | | 0.34 | | | | 0.30 | | | | 0.30 | | | | 1.81 | | | | 53,577 | | | | 74 | |
| 12-31-21 | | | 13.45 | | | | 0.28 | • | | | 0.92 | | | | 1.20 | | | | 0.36 | | | | 0.03 | | | | — | | | | 0.39 | | | | — | | | | 14.26 | | | | 9.14 | | | | 0.36 | | | | 0.28 | | | | 0.28 | | | | 2.01 | | | | 71,425 | | | | 44 | |
| 12-31-20 | | | 13.02 | | | | 0.30 | • | | | 0.91 | | | | 1.21 | | | | 0.33 | | | | 0.45 | | | | — | | | | 0.78 | | | | — | | | | 13.45 | | | | 10.45 | | | | 0.40 | | | | 0.27 | | | | 0.27 | | | | 2.44 | | | | 66,933 | | | | 71 | |
| 12-31-19 | | | 12.34 | | | | 0.33 | | | | 1.41 | | | | 1.74 | | | | 0.36 | | | | 0.70 | | | | — | | | | 1.06 | | | | — | | | | 13.02 | | | | 14.82 | | | | 0.30 | | | | 0.26 | | | | 0.26 | | | | 2.53 | | | | 60,959 | | | | 74 | |
| 12-31-18 | | | 13.51 | | | | 0.29 | • | | | (0.80 | ) | | | (0.51 | ) | | | 0.36 | | | | 0.30 | | | | — | | | | 0.66 | | | | — | | | | 12.34 | | | | (4.03 | ) | | | 0.31 | | | | 0.26 | | | | 0.26 | | | | 2.26 | | | | 56,221 | | | | 60 | |
Class S | | | | | | | | | | | | | | | | | | | | | | | | | | | | | | | | | | | | | | | | | | | | | | | | | | | | | | | | | | | | | | | | | | | | |
| 12-31-22 | | | 14.11 | | | | 0.18 | • | | | (2.49 | ) | | | (2.31 | ) | | | 0.40 | | | | 0.99 | | | | — | | | | 1.39 | | | | — | | | | 10.41 | | | | (16.69 | ) | | | 0.59 | | | | 0.55 | | | | 0.55 | | | | 1.57 | | | | 2,940 | | | | 74 | |
| 12-31-21 | | | 13.31 | | | | 0.24 | • | | | 0.92 | | | | 1.16 | | | | 0.33 | | | | 0.03 | | | | — | | | | 0.36 | | | | — | | | | 14.11 | | | | 8.91 | | | | 0.61 | | | | 0.53 | | | | 0.53 | | | | 1.76 | | | | 3,797 | | | | 44 | |
| 12-31-20 | | | 12.89 | | | | 0.30 | | | | 0.87 | | | | 1.17 | | | | 0.30 | | | | 0.45 | | | | — | | | | 0.75 | | | | — | | | | 13.31 | | | | 10.19 | | | | 0.65 | | | | 0.52 | | | | 0.52 | | | | 2.20 | | | | 3,622 | | | | 71 | |
| 12-31-19 | | | 12.23 | | | | 0.30 | • | | | 1.39 | | | | 1.69 | | | | 0.33 | | | | 0.70 | | | | — | | | | 1.03 | | | | — | | | | 12.89 | | | | 14.47 | | | | 0.55 | | | | 0.51 | | | | 0.51 | | | | 2.36 | | | | 3,572 | | | | 74 | |
| 12-31-18 | | | 13.39 | | | | 0.26 | • | | | (0.80 | ) | | | (0.54 | ) | | | 0.32 | | | | 0.30 | | | | — | | | | 0.62 | | | | — | | | | 12.23 | | | | (4.25 | ) | | | 0.56 | | | | 0.51 | | | | 0.51 | | | | 2.02 | | | | 2,670 | | | | 60 | |
Voya Strategic Allocation Moderate Portfolio |
Class I | | | | | | | | | | | | | | | | | | | | | | | | | | | | | | | | | | | | | | | | | | | | | | | | | | | | | | | | | | | | | | | | | | | | |
| 12-31-22 | | | 16.36 | | | | 0.18 | • | | | (3.10 | ) | | | (2.92 | ) | | | 0.43 | | | | 1.43 | | | | — | | | | 1.86 | | | | — | | | | 11.58 | | | | (18.16 | ) | | | 0.33 | | | | 0.33 | | | | 0.33 | | | | 1.40 | | | | 110,541 | | | | 63 | |
| 12-31-21 | | | 15.21 | | | | 0.25 | • | | | 1.77 | | | | 2.02 | | | | 0.37 | | | | 0.50 | | | | — | | | | 0.87 | | | | — | | | | 16.36 | | | | 13.84 | | | | 0.33 | | | | 0.33 | | | | 0.33 | | | | 1.60 | | | | 143,341 | | | | 44 | |
| 12-31-20 | | | 14.62 | | | | 0.30 | | | | 1.31 | | | | 1.61 | | | | 0.33 | | | | 0.69 | | | | — | | | | 1.02 | | | | — | | | | 15.21 | | | | 12.73 | | | | 0.37 | | | | 0.30 | | | | 0.30 | | | | 2.08 | | | | 131,004 | | | | 53 | |
| 12-31-19 | | | 13.59 | | | | 0.29 | • | | | 2.18 | | | | 2.47 | | | | 0.41 | | | | 1.03 | | | | — | | | | 1.44 | | | | — | | | | 14.62 | | | | 19.26 | | | | 0.30 | | | | 0.28 | | | | 0.28 | | | | 2.07 | | | | 126,475 | | | | 57 | |
| 12-31-18 | | | 14.80 | | | | 0.29 | • | | | (1.16 | ) | | | (0.87 | ) | | | 0.34 | | | | — | | | | — | | | | 0.34 | | | | — | | | | 13.59 | | | | (6.05 | ) | | | 0.28 | | | | 0.25 | | | | 0.25 | | | | 1.96 | | | | 117,049 | | | | 48 | |
Class S | | | | | | | | | | | | | | | | | | | | | | | | | | | | | | | | | | | | | | | | | | | | | | | | | | | | | | | | | | | | | | | | | | | | |
| 12-31-22 | | | 16.26 | | | | 0.15 | • | | | (3.08 | ) | | | (2.93 | ) | | | 0.39 | | | | 1.43 | | | | — | | | | 1.82 | | | | — | | | | 11.51 | | | | (18.34 | ) | | | 0.58 | | | | 0.58 | | | | 0.58 | | | | 1.13 | | | | 1,205 | | | | 63 | |
| 12-31-21 | | | 15.12 | | | | 0.21 | • | | | 1.76 | | | | 1.97 | | | | 0.33 | | | | 0.50 | | | | — | | | | 0.83 | | | | — | | | | 16.26 | | | | 13.55 | | | | 0.58 | | | | 0.58 | | | | 0.58 | | | | 1.34 | | | | 1,626 | | | | 44 | |
| 12-31-20 | | | 14.52 | | | | 0.24 | • | | | 1.33 | | | | 1.57 | | | | 0.28 | | | | 0.69 | | | | — | | | | 0.97 | | | | — | | | | 15.12 | | | | 12.46 | | | | 0.62 | | | | 0.55 | | | | 0.55 | | | | 1.74 | | | | 1,483 | | | | 53 | |
| 12-31-19 | | | 13.50 | | | | 0.26 | | | | 2.16 | | | | 2.42 | | | | 0.37 | | | | 1.03 | | | | — | | | | 1.40 | | | | — | | | | 14.52 | | | | 18.94 | | | | 0.55 | | | | 0.53 | | | | 0.53 | | | | 1.81 | | | | 1,885 | | | | 57 | |
| 12-31-18 | | | 14.71 | | | | 0.25 | • | | | (1.16 | ) | | | (0.91 | ) | | | 0.30 | | | | — | | | | — | | | | 0.30 | | | | — | | | | 13.50 | | | | (6.31 | ) | | | 0.53 | | | | 0.50 | | | | 0.50 | | | | 1.69 | | | | 1,725 | | | | 48 | |
| | | | | | | | | | | | | | | | | | | | | | | | | | | | | | | | | | | | | | | | | | | | | | | | | | | | | | | | | | | | | | | | | | | | | |
Voya Strategic Allocation Growth Portfolio |
Class I | | | | | | | | | | | | | | | | | | | | | | | | | | | | | | | | | | | | | | | | | | | | | | | | | | | | | | | | | | | | | | | | | | | | |
| 12-31-22 | | | 17.81 | | | | 0.16 | • | | | (3.57 | ) | | | (3.41 | ) | | | 0.48 | | | | 1.92 | | | | — | | | | 2.40 | | | | — | | | | 12.00 | | | | (19.35 | ) | | | 0.34 | | | | 0.31 | | | | 0.31 | | | | 1.19 | | | | 119,444 | | | | 58 | |
| 12-31-21 | | | 15.80 | | | | 0.23 | • | | | 2.44 | | | | 2.67 | | | | 0.33 | | | | 0.33 | | | | — | | | | 0.66 | | | | — | | | | 17.81 | | | | 17.35 | | | | 0.36 | | | | 0.32 | | | | 0.32 | | | | 1.35 | | | | 154,678 | | | | 42 | |
| 12-31-20 | | | 15.62 | | | | 0.26 | • | | | 1.49 | | | | 1.75 | | | | 0.32 | | | | 1.25 | | | | — | | | | 1.57 | | | | — | | | | 15.80 | | | | 14.40 | | | | 0.39 | | | | 0.29 | | | | 0.29 | | | | 1.87 | | | | 140,657 | | | | 56 | |
| 12-31-19 | | | 14.40 | | | | 0.28 | | | | 2.79 | | | | 3.07 | | | | 0.43 | | | | 1.42 | | | | — | | | | 1.85 | | | | — | | | | 15.62 | | | | 22.84 | | | | 0.30 | | | | 0.26 | | | | 0.26 | | | | 1.76 | | | | 130,989 | | | | 66 | |
| 12-31-18 | | | 16.03 | | | | 0.28 | • | | | (1.58 | ) | | | (1.30 | ) | | | 0.33 | | | | — | | | | — | | | | 0.33 | | | | — | | | | 14.40 | | | | (8.32 | ) | | | 0.27 | | | | 0.23 | | | | 0.23 | | | | 1.77 | | | | 114,461 | | | | 45 | |
Class S | | | | | | | | | | | | | | | | | | | | | | | | | | | | | | | | | | | | | | | | | | | | | | | | | | | | | | | | | | | | | | | | | | | | |
| 12-31-22 | | | 17.61 | | | | 0.12 | • | | | (3.52 | ) | | | (3.40 | ) | | | 0.44 | | | | 1.92 | | | | — | | | | 2.36 | | | | — | | | | 11.85 | | | | (19.55 | ) | | | 0.59 | | | | 0.56 | | | | 0.56 | | | | 0.93 | | | | 2,172 | | | | 58 | |
| 12-31-21 | | | 15.64 | | | | 0.18 | • | | | 2.41 | | | | 2.59 | | | | 0.29 | | | | 0.33 | | | | — | | | | 0.62 | | | | — | | | | 17.61 | | | | 16.98 | | | | 0.61 | | | | 0.57 | | | | 0.57 | | | | 1.05 | | | | 2,775 | | | | 42 | |
| 12-31-20 | | | 15.46 | | | | 0.22 | • | | | 1.48 | | | | 1.70 | | | | 0.27 | | | | 1.25 | | | | — | | | | 1.52 | | | | — | | | | 15.64 | | | | 14.16 | | | | 0.64 | | | | 0.54 | | | | 0.54 | | | | 1.57 | | | | 2,731 | | | | 56 | |
| 12-31-19 | | | 14.27 | | | | 0.22 | • | | | 2.77 | | | | 2.99 | | | | 0.38 | | | | 1.42 | | | | — | | | | 1.80 | | | | — | | | | 15.46 | | | | 22.49 | | | | 0.55 | | | | 0.51 | | | | 0.51 | | | | 1.45 | | | | 2,968 | | | | 66 | |
| 12-31-18 | | | 15.88 | | | | 0.24 | • | | | (1.56 | ) | | | (1.32 | ) | | | 0.29 | | | | — | | | | — | | | | 0.29 | | | | — | | | | 14.27 | | | | (8.50 | ) | | | 0.52 | | | | 0.48 | | | | 0.48 | | | | 1.53 | | | | 2,799 | | | | 45 | |
(1) | | Total return is calculated assuming reinvestment of all dividends, capital gain distributions and return of capital distributions, if any, at net asset value and does not reflect the effect of insurance contract charges. Total return for periods less than one year is not annualized. |
(2) | | Annualized for periods less than one year. |
(3) | | Ratios reflect operating expenses of a Portfolio. Expenses before reductions/additions do not reflect amounts reimbursed or recouped by the Investment Adviser and/or Distributor or reductions from brokerage service arrangements or other expense offset arrangements and do not represent the amount paid by a Portfolio during periods when reimbursements or reductions occur. |
| | Expenses net of fee waivers reflect expenses after reimbursement by the Investment Adviser and/or Distributor or recoupment of previously reimbursed fees by the Investment Adviser, but prior to reductions from brokerage service arrangements or other expense offset arrangements. Expenses net of all reductions/additions represent the net expenses paid by a Portfolio. Net investment income (loss) is net of all such additions or reductions. |
(4) | | Ratios do not include expenses of underlying funds and do not include fees and expenses charged under the variable annuity contract or variable life insurance policy. |
| • | | Calculated using average number of shares outstanding throughout the year or period. |
See Accompanying Notes to Financial Statements
14
NOTES TO FINANCIAL STATEMENTS AS OF DECEMBER 31, 2022
NOTE 1 — ORGANIZATION
Voya Strategic Allocation Portfolios, Inc. (the “Company”) is registered under the Investment Company Act of 1940, as amended (“1940 Act”), as an open-end management investment company. The Company was incorporated under the laws of Maryland on October 14, 1994. There are three active separate investment series (each a “Portfolio” and collectively the “Portfolios”) that comprise the Company: Voya Strategic Allocation Conservative Portfolio (“Strategic Allocation Conservative”), Voya Strategic Allocation Moderate Portfolio (“Strategic Allocation Moderate”), and Voya Strategic Allocation Growth Portfolio (“Strategic Allocation Growth”), each a diversified series of the Company. Each Portfolio currently seeks to achieve its investment objective by investing primarily in other investment companies (“Underlying Funds”) and each uses asset allocation strategies to determine how to invest in the Underlying Funds. The investment objective of the Portfolios is described in the respective Portfolio’s Prospectus.
The classes of shares included in this report are: Class I and Class S. With the exception of class specific matters, each class has equal voting rights as to voting privileges. For class specific proposals, only the applicable class would have voting privileges. The two classes differ principally in the applicable distribution and service fees, as well as differences in the amount of waiver of fees and reimbursement of expenses, if any. Generally, shareholders of each class also bear certain expenses that pertain to that particular class. All shareholders are allocated the common expenses of a portfolio and earn income and realized gains/losses from a portfolio pro rata based on the daily ending net assets of each class, without distinction between share classes. Expenses that are specific to a portfolio or a class are charged directly to that portfolio or class. Other operating expenses shared by several portfolios are generally allocated among those portfolios based on average net assets. Distributions are determined separately for each class based on income and expenses allocated to each class. Realized gain distributions are allocated to each class pro rata based on the shares outstanding of each class on the date of distribution. Differences in per share dividend rates generally result from differences in separate class expenses, including distribution and shareholder service fees, if any, as well as differences in the amount of waiver of fees and reimbursement of expenses between the separate classes, if any.
Voya Investments, LLC (“Voya Investments” or the “Investment Adviser”), an Arizona limited liability company, serves as the Investment Adviser to the Portfolios. Voya Investment Management Co. LLC (“Voya IM” or the “Sub-
Adviser”), a Delaware limited liability company, serves as the Sub-Adviser to the Portfolios. Voya Investments Distributor, LLC (“VID” or the “Distributor”), a Delaware limited liability company, serves as the principal underwriter to the Portfolios.
NOTE 2 — SIGNIFICANT ACCOUNTING POLICIES
The following significant accounting policies are consistently followed by the Portfolios in the preparation of their financial statements. Each Portfolio is considered an investment company under U.S. generally accepted accounting principles (“GAAP”) and follows the accounting and reporting guidance applicable to investment companies.
A. Security Valuation. Each Portfolio is open for business every day the New York Stock Exchange (“NYSE”) opens for regular trading (each such day, a “Business Day”). The net asset value (“NAV”) per share for each class of each Portfolio is determined each Business Day as of the close of the regular trading session (“Market Close”), as determined by the Consolidated Tape Association (“CTA”), the central distributor of transaction prices for exchange-traded securities (normally 4:00 p.m. Eastern time unless otherwise designated by the CTA). The NAV per share of each class of each Portfolio is calculated by taking the value of the Portfolio’s assets attributable to that class, subtracting the Portfolio’s liabilities attributable to that class, and dividing by the number of shares of that class that are outstanding. On days when a Portfolio is closed for business, Portfolio shares will not be priced and a Portfolio does not transact purchase and redemption orders. To the extent a Portfolio’s assets are traded in other markets on days when a Portfolio does not price its shares, the value of a Portfolio’s assets will likely change and you will not be able to purchase or redeem shares of a Portfolio.
Portfolio securities for which market quotations are readily available are valued at market value. Investments in open-end registered investment companies that do not trade on an exchange are valued at the end of day NAV per share. The prospectuses of the open-end registered investment companies in which each Portfolio may invest explain the circumstances under which they will use fair value pricing and the effects of using fair value pricing. Foreign securities’ prices are converted into U.S. dollar amounts using the applicable exchange rates as of Market Close.
When a market quotation for a portfolio security is not readily available or is deemed unreliable (for example when trading has been halted or there are unexpected market closures or other material events that would suggest that the market quotation is unreliable) and for purposes of determining the value of other Portfolio assets, the asset is priced at its fair value. The Board has
15
NOTES TO FINANCIAL STATEMENTS AS OF DECEMBER 31, 2022 (CONTINUED)
NOTE 2 — SIGNIFICANT ACCOUNTING POLICIES (continued)
designated the Investment Adviser, as the valuation designee, to make fair value determinations in good faith. In determining the fair value of each Portfolio’s assets, the Investment Adviser, pursuant to its fair valuation policy, may consider inputs from pricing service providers, broker-dealers, or each Portfolio’s sub-adviser(s). Issuer specific events, transaction price, position size, nature and duration of restrictions on disposition of the security, market trends, bid/ask quotes of brokers and other market data may be reviewed in the course of making a good faith determination of an asset’s fair value. Because trading hours for certain foreign securities end before Market Close, closing market quotations may become unreliable. The prices of foreign securities will generally be adjusted based on inputs from an independent pricing service that are intended to reflect valuation changes through the NYSE close. Because of the inherent uncertainties of fair valuation, the values used to determine each Portfolio’s NAV may materially differ from the value received upon actual sale of those investments. Thus, fair valuation may have an unintended dilutive or accretive effect on the value of shareholders’ investments in each Portfolio.
The Portfolios’ financial instruments are valued at the close of the NYSE and are reported at fair value, which GAAP defines as the price that would be received to sell an asset or paid to transfer a liability in an orderly transaction between market participants at the measurement date.
Various valuation techniques and inputs are used to determine the fair value of financial instruments. GAAP establishes the following fair value hierarchy that categorizes the inputs used to measure fair value:
Level 1 — quoted prices (unadjusted) in active markets for identical financial instruments that the portfolio can access at the reporting date.
Level 2 — inputs other than Level 1 quoted prices that are observable, either directly or indirectly (including, but not limited to, quoted prices for similar financial instruments in active markets, quoted prices for identical or similar financial instruments in inactive markets, interest rates and yield curves, implied volatilities, and credit spreads).
Level 3 — unobservable inputs (including the portfolio’s own assumptions in determining fair value).
Observable inputs are developed using market data, such as publicly available information about actual events or transactions, and reflect the assumptions that market participants would use to price the financial instrument. Unobservable inputs are those for which market data are not available and are developed using the best information available about the assumptions that market participants
would use to price the financial instrument. GAAP requires valuation techniques to maximize the use of relevant observable inputs and minimize the use of unobservable inputs. When multiple inputs are used to derive fair value, the financial instrument is assigned to the level within the fair value hierarchy based on the lowest-level input that is significant to the fair value of the financial instrument. Input levels are not necessarily an indication of the risk or liquidity associated with financial instruments at that level but rather the degree of judgment used in determining those values.
A table summarizing each Portfolio’s investments under these levels of classification is included within each Portfolio of Investments.
Each investment asset or liability of a Portfolio is assigned a level at measurement date based on the significance and source of the inputs to its valuation. Quoted prices in active markets for identical securities are classified as “Level 1,” inputs other than quoted prices for an asset or liability that are observable are classified as “Level 2” and significant unobservable inputs, including the Sub-Adviser’s or Pricing Committee’s judgment about the assumptions that a market participant would use in pricing an asset or liability are classified as “Level 3.” The inputs used for valuing securities are not necessarily an indication of the risks associated with investing in those securities. Short-term securities of sufficient credit quality are generally considered to be Level 2 securities under applicable accounting rules. The Portfolios classify each of their investments in the Underlying Funds as Level 1, without consideration as to the classification level of the specific investments held by the Underlying Funds. A table summarizing each Portfolio’s investments under these levels of classification is included within the Portfolio of Investments.
GAAP requires a reconciliation of the beginning to ending balances for reported fair values that presents changes attributable to total realized and unrealized gains or losses, purchases and sales, and transfers in or out of the Level 3 category during the period. A reconciliation of Level 3 investments within the Portfolio of Investments is presented only when a Portfolio has a significant amount of Level 3 investments.
B. Securities Transactions and Revenue Recognition. Security transactions are accounted for on the trade date. Dividend income received from the Underlying Funds is recognized on the ex-dividend date and is recorded as dividends from underlying funds in the Statements of Operations. Capital gain distributions received from the Underlying Funds are recognized on the ex-dividend date and are recorded on the Statements of Operations as such. Realized gains and losses are reported on the basis of identified cost of securities sold.
16
NOTES TO FINANCIAL STATEMENTS AS OF DECEMBER 31, 2022 (CONTINUED)
NOTE 2 — SIGNIFICANT ACCOUNTING POLICIES (continued)
C. Distributions to Shareholders. The Portfolios record distributions to their shareholders on the ex-dividend date. Dividends from net investment income and capital gain distributions, if any, are declared and paid annually by the Portfolios. The Portfolios may make distributions on a more frequent basis to comply with the distribution requirements of the Internal Revenue Code. The characteristics of income and gains to be distributed are determined in accordance with income tax regulations, which may differ from U.S. GAAP for investment companies.
D. Federal Income Taxes. It is the policy of each Portfolio to comply with the requirements of subchapter M of the Internal Revenue Code and related excise tax provisions applicable to regulated investment companies and to distribute substantially all of its net investment income and any net realized capital gains to its shareholders. Therefore, no federal income tax provision is required. Management has considered the sustainability of the Portfolios’ tax positions taken on federal income tax returns for all open tax years in making this determination. No capital gain distributions shall be made until any capital loss carryforwards have been fully utilized.
The Portfolios may utilize equalization accounting for tax purposes, whereby a portion of redemption payments are treated as distributions of income or gain.
E. Use of Estimates. The preparation of financial statements in conformity with GAAP requires management to make estimates and assumptions that affect the reported amounts of assets and liabilities and disclosure of contingent assets and liabilities at the date of the financial statements and the reported amounts of increases and decreases in net assets from operations during the reporting period. Actual results could differ from those estimates.
F. Risk Exposures and the Use of Derivative Instruments. Each Portfolio’s investment strategies permit it to enter into various types of derivatives contracts, including, but not limited to, futures contracts. In doing so, a Portfolio will employ strategies in differing combinations to permit it to increase or decrease the level of risk, or change the level or types of exposure to risk factors. This may allow a Portfolio to pursue its objectives more quickly and efficiently than if it were to make direct purchases or sales of securities capable of affecting a similar response to market or credit factors.
In pursuit of its investment objectives, a Portfolio may seek to increase or decrease its exposure to the following market or credit risk factors:
Equity Risk. Stock prices may be volatile or have reduced liquidity in response to real or perceived impacts of factors including, but not limited to, economic conditions, changes in market interest rates, and political events. Stock markets tend to be cyclical, with periods when stock prices generally rise and periods when stock prices generally decline. Any given stock market segment may remain out of favor with investors for a short or long period of time, and stocks as an asset class may underperform bonds or other asset classes during some periods. Additionally, legislative, regulatory or tax policies or developments in these areas may adversely impact the investment techniques available to a manager, add to costs and impair the ability of a Portfolio to achieve its investment objectives.
Risks of Investing in Derivatives. Each Portfolio’s use of derivatives can result in losses due to unanticipated changes in the market or credit risk factors and the overall market. In instances where a Portfolio is using derivatives to decrease, or hedge, exposures to market or credit risk factors for securities held by a Portfolio, there are also risks that those derivatives may not perform as expected resulting in losses for the combined or hedged positions.
Derivative instruments are subject to a number of risks, including the risk of changes in the market price of the underlying securities, credit risk with respect to the counterparty, risk of loss due to changes in market interest rates and liquidity and volatility risk. The amounts required to purchase certain derivatives may be small relative to the magnitude of exposure assumed by a Portfolio. Therefore, the purchase of certain derivatives may have an economic leveraging effect on a Portfolio and exaggerate any increase or decrease in the NAV. Derivatives may not perform as expected, so a Portfolio may not realize the intended benefits. When used for hedging purposes, the change in value of a derivative may not correlate as expected with the currency, security or other risk being hedged. When used as an alternative or substitute for direct cash investments, the return provided by the derivative may not provide the same return as direct cash investment. In addition, given their complexity, derivatives expose a Portfolio to the risk of improper valuation.
Generally, derivatives are sophisticated financial instruments whose performance is derived, at least in part, from the performance of an underlying asset or assets. Derivatives include, among other things, swap agreements, options, forwards and futures. Investments in derivatives are generally negotiated over-the-counter (“OTC”), with a single counterparty and as a result are subject to credit risks related to the counterparty’s ability or willingness to perform its obligations; any deterioration in the counterparty’s creditworthiness could adversely affect the value of the derivative. In addition, derivatives and their
17
NOTES TO FINANCIAL STATEMENTS AS OF DECEMBER 31, 2022 (CONTINUED)
NOTE 2 — SIGNIFICANT ACCOUNTING POLICIES (continued)
underlying securities may experience periods of illiquidity which could cause a Portfolio to hold a security it might otherwise sell, or to sell a security it otherwise might hold at inopportune times or at an unanticipated price. A manager might imperfectly judge the direction of the market. For instance, if a derivative is used as a hedge to offset investment risk in another security, the hedge might not correlate to the market’s movements and may have unexpected or undesired results such as a loss or a reduction in gains.
G. Futures Contracts. Each Portfolio may enter into futures contracts involving foreign currency, interest rates, securities and security indices. A futures contract is a commitment to buy or sell a specific amount of a financial instrument at a negotiated price on a stipulated future date. Each Portfolio may buy and sell futures contracts. Futures contracts traded on a commodities or futures exchange will be valued at the final settlement price or official closing price on the principal exchange as reported by such principal exchange at its trading session ending at, or most recently prior to, the time when the Portfolio’s assets are valued.
Upon entering into a futures contract, each Portfolio is required to deposit either cash or securities (initial margin) in an amount equal to a certain percentage of the contract value. Subsequent payments (variation margin) are made or received by the Portfolio each day. The variation margin payments are equal to the daily changes in the contract value and are recorded as unrealized gains and losses and, if any, shown as variation margin receivable or payable on futures contracts on the Statement of Assets and Liabilities.
Open futures contracts are reported on a table following each Portfolio’s Portfolio of Investments. Securities held in collateralized accounts to cover initial margin requirements on open futures contracts, if any, are footnoted in the Portfolio of Investments. Cash collateral held by the broker to cover initial margin requirements on open futures contracts are noted in the Statements of Assets and Liabilities. The net change in unrealized appreciation and depreciation is reported in the Statements of Operations. Realized gains (losses) are reported in the Statements of Operations at the closing or expiration of futures contracts.
Futures contracts are exposed to the market risk factor of the underlying financial instrument. During the year ended December 31, 2022, the Portfolios used futures to enact tactical positions and to provide the Portfolios with greater liquidity. Strategic Allocation Moderate and Strategic Allocation Growth had purchased and sold futures contracts on various equity indices. Strategic Allocation Moderate and Strategic Allocation Growth also purchased
futures contracts on Eurodollars and U.S. Treasury Notes. Futures contracts are purchased to provide immediate market exposure proportionate to the size of the Portfolio’s respective cash flows and residual cash balances in order to decrease potential tracking error if the cash remained uninvested in the market. Additional associated risks of entering into futures contracts include the possibility that there may be an illiquid market where the Portfolios are unable to liquidate the contract or enter into an offsetting position and, if used for hedging purposes, the risk that the price of the contract will correlate imperfectly with the prices of the Portfolios’ securities. With futures, there is minimal counterparty credit risk to the Portfolios since futures are exchange traded and the exchange’s clearinghouse, as counterparty to all exchange traded futures, guarantees the futures against default.
During the year ended December 31, 2022, Strategic Allocation Moderate and Strategic Allocation Growth had average notional values on futures contracts purchased and sold as disclosed below. Please refer to the tables within the respective Portfolio of Investments for Strategic Allocation Moderate and Strategic Allocation Growth for open futures contracts at December 31, 2022. Strategic Allocation Conservative did not enter into any futures contracts during the year ended December 31, 2022.
| | | Purchased | | Sold |
| Strategic Allocation Moderate | | $ | 4,123,618 | | | $ | 4,012,219 | |
| Strategic Allocation Growth | | | 3,966,167 | | | | 4,001,953 | |
H. Indemnifications. In the normal course of business, the Company may enter into contracts that provide certain indemnifications. The Company’s maximum exposure under these arrangements is dependent on future claims that may be made against the Portfolios and, therefore, cannot be estimated; however, based on experience, management considers the risk of loss from such claims remote.
NOTE 3 — INVESTMENTS IN UNDERLYING FUNDS
For the year ended December 31, 2022, the cost of purchases and the proceeds from the sales of the Underlying Funds were as follows:
| | | Purchases | | Sales |
| Strategic Allocation Conservative | | $ | 47,368,996 | | | $ | 52,860,531 | |
| Strategic Allocation Moderate | | | 77,543,702 | | | | 83,170,391 | |
| Strategic Allocation Growth | | | 76,754,447 | | | | 81,048,962 | |
NOTE 4 — INVESTMENT MANAGEMENT FEES
The Portfolios have entered into an investment management agreement (“Management Agreement”) with the Investment Adviser. The Investment Adviser has overall responsibility for the management of the Portfolios. The Investment Adviser oversees all investment
18
NOTES TO FINANCIAL STATEMENTS AS OF DECEMBER 31, 2022 (CONTINUED)
NOTE 4 — INVESTMENT MANAGEMENT FEES
(continued)
management and portfolio management services for the Portfolios and assists in managing and supervising all aspects of the general day-to-day business activities and operations of the Portfolios, including custodial, transfer agency, dividend disbursing, accounting, auditing, compliance and related services. The Management Agreement compensates the Investment Adviser with a management fee, computed daily and payable monthly, based on the average daily net assets of each Portfolio, at the following annual rates: 0.18% of each Portfolio’s average daily net assets invested in affiliated Underlying Funds, 0.70% of each Portfolio’s average daily net assets invested in direct investments and 0.40% of each Portfolio’s average daily net assets invested in unaffiliated Underlying Funds and other investments.
The Investment Adviser has entered into a sub-advisory agreement with Voya IM with respect to each Portfolio. Voya IM provides investment advice for the Portfolios and is paid by the Investment Adviser based on the average daily net assets of each respective Portfolio. Subject to such policies as the Board or the Investment Adviser may determine, Voya IM manages the Portfolios’ assets in accordance with the Portfolios’ investment objectives, policies, and limitations.
NOTE 5 — DISTRIBUTION AND SERVICE FEES
Class S shares of the Portfolios have a shareholder services and distribution plan (the “Plan”), whereby the Distributor is compensated by each Portfolio for expenses incurred for shareholder servicing and/or distribution of each Portfolio’s Class S shares. Pursuant to the Plan, the Distributor is entitled to a payment each month to compensate for expenses incurred in the distribution and promotion of each Portfolio’s Class S shares, including expenses incurred in printing prospectuses and reports used for sales purposes, expenses incurred in preparing and printing sales literature and other such distribution related expenses, including any distribution or shareholder servicing fees paid to securities dealers who have executed a distribution agreement with the Distributor. Under the Plan, Class S shares of the Portfolios pay the Distributor a fee calculated at an annual rate of 0.25% of average daily net assets.
NOTE 6 — OTHER TRANSACTIONS WITH AFFILIATES AND RELATED PARTIES
At December 31, 2022, the following direct or indirect, wholly-owned subsidiaries of Voya Financial, Inc. owned more than 5% of the following Portfolios:
| Subsidiary | | Portfolio | | Percentage |
| ReliaStar Life Insurance Company | | Strategic Allocation Conservative | | 9.47 | % |
| | Strategic Allocation Moderate | | 12.04 | |
| | Strategic Allocation Growth | | 8.75 | |
| Voya Retirement Insurance and Annuity Company | | Strategic Allocation Conservative | | 84.30 | |
| | Strategic Allocation Moderate | | 84.87 | |
| | Strategic Allocation Growth | | 86.39 | |
The Portfolios have adopted a deferred compensation plan (the “DC Plan”), which allows eligible independent directors, as described in the DC Plan, to defer the receipt of all or a portion of the directors’ fees that they are entitled to receive from the Portfolios. For purposes of determining the amount owed to the director under the DC Plan, the amounts deferred are invested in shares of the funds selected by the director (the “Notional Funds”). When the Portfolios purchase shares of the Notional Funds, which are all advised by Voya Investments, in amounts equal to the directors’ deferred fees, this results in a Portfolio asset equal to the deferred compensation liability. Such assets, if applicable, are included as a component of “Other assets” on the accompanying Statements of Assets and Liabilities. Deferral of directors’ fees under the DC Plan will not affect net assets of the Portfolios, and will not materially affect the Portfolios’ assets, liabilities or net investment income per share. Amounts will be deferred until distributed in accordance with the DC Plan.
The Portfolios may pay per account fees to affiliates of Voya Investments for recordkeeping services provided on certain assets. For the year ended December 31, 2022, the per account fees for affiliated recordkeeping services paid by each Portfolio were as follows:
| Portfolio | | Amount |
| Strategic Allocation Conservative | | $ | 51,387 | |
| Strategic Allocation Moderate | | | 95,455 | |
| Strategic Allocation Growth | | | 115,063 | |
NOTE 7 — EXPENSE LIMITATION AGREEMENTS
The Investment Adviser entered into written expense limitation agreement (“Expense Limitation Agreement”) with each Portfolio whereby the Investment Adviser has agreed to limit expenses, excluding interest, taxes, investment-related costs, leverage expenses and extraordinary expenses to the levels listed below:
| Portfolio(1)(2) | | Class I | | Class S |
| Strategic Allocation Conservative | | | 0.71 | % | | | 0.96 | % |
| Strategic Allocation Moderate | | | 0.75 | % | | | 1.00 | % |
| Strategic Allocation Growth | | | 0.77 | % | | | 1.02 | % |
19
NOTES TO FINANCIAL STATEMENTS AS OF DECEMBER 31, 2022 (CONTINUED)
NOTE 7 — EXPENSE LIMITATION AGREEMENTS (continued)
(1) | These operating expense limits take into account operating expenses incurred at the Underlying Fund level. The amount of fees and expenses of an Underlying Fund borne by each Portfolio will vary based on each Portfolio’s allocation of assets to, and the net expenses of, a particular Underlying Fund. |
(2) | Any fees waived pursuant to the Expense Limitation Agreement shall not be eligible for recoupment. |
The Expense Limitation Agreement is contractual through May 1, 2023 and shall renew automatically for one-year terms. Termination or modification of this obligation requires approval by the Board.
NOTE 8 — CAPITAL SHARES
Transactions in capital shares and dollars were as follows:
| | Shares
sold | | Shares
issued in
merger | | Reinvestment
of
distributions | | Shares
redeemed | | Net
increase
(decrease)
in shares
outstanding | | Shares
sold | | Proceeds
from shares
issued in
merger | | Reinvestment
of
distributions | | Shares
redeemed | | Net
increase
(decrease) |
| Year or period ended | | # | | # | | # | | # | | # | | ($) | | ($) | | ($) | | ($) | | ($) |
Strategic Allocation Conservative | | | | | | | | | | | | | | | | | | | | | | | | | | | | | |
Class I | | | | | | | | | | | | | | | | | | | | | | | | | | | | | | | | | | | | | | | | |
| 12/31/2022 | | | 521,264 | | | | — | | | | 644,129 | | | | (1,087,027 | ) | | | 78,366 | | | | 6,062,081 | | | | — | | | | 7,001,681 | | | | (12,461,688 | ) | | | 602,074 | |
| 12/31/2021 | | | 601,134 | | | | — | | | | 146,865 | | | | (717,231 | ) | | | 30,768 | | | | 8,302,592 | | | | — | | | | 1,965,059 | | | | (9,953,209 | ) | | | 314,442 | |
Class S | | | | | | | | | | | | | | | | | | | | | | | | | | | | | | | | | | | | | | | | |
| 12/31/2022 | | | 2,205 | | | | — | | | | 34,310 | | | | (23,321 | ) | | | 13,194 | | | | 24,903 | | | | — | | | | 369,519 | | | | (258,679 | ) | | | 135,743 | |
| 12/31/2021 | | | 17,867 | | | | — | | | | 7,409 | | | | (28,316 | ) | | | (3,040 | ) | | | 243,543 | | | | — | | | | 98,241 | | | | (391,007 | ) | | | (49,223 | ) |
Strategic Allocation Moderate | | | | | | | | | | | | | | | | | | | | | | | | | | | | | |
Class I | | | | | | | | | | | | | | | | | | | | | | | | | | | | | | | | | | | | | | | | |
| 12/31/2022 | | | 341,311 | | | | — | | | | 1,345,581 | | | | (904,319 | ) | | | 782,573 | | | | 4,396,939 | | | | — | | | | 15,985,509 | | | | (11,539,805 | ) | | | 8,842,643 | |
| 12/31/2021 | | | 496,729 | | | | — | | | | 492,379 | | | | (840,097 | ) | | | 149,011 | | | | 7,864,093 | | | | — | | | | 7,361,065 | | | | (13,242,848 | ) | | | 1,982,310 | |
Class S | | | | | | | | | | | | | | | | | | | | | | | | | | | | | | | | | | | | | | | | |
| 12/31/2022 | | | 3,730 | | | | — | | | | 15,074 | | | | (14,063 | ) | | | 4,741 | | | | 47,620 | | | | — | | | | 178,171 | | | | (173,734 | ) | | | 52,057 | |
| 12/31/2021 | | | 2,928 | | | | — | | | | 5,425 | | | | (6,454 | ) | | | 1,899 | | | | 45,771 | | | | — | | | | 80,773 | | | | (100,981 | ) | | | 25,563 | |
Strategic Allocation Growth | | | | | | | | | | | | | | | | | | | | | | | | | | | | |
Class I | | | | | | | | | | | | | | | | | | | | | | | | | | | | | | | | | | | | | | | | |
| 12/31/2022 | | | 437,888 | | | | — | | | | 1,680,631 | | | | (850,547 | ) | | | 1,267,972 | | | | 5,938,823 | | | | — | | | | 20,520,510 | | | | (11,743,124 | ) | | | 14,716,209 | |
| 12/31/2021 | | | 401,780 | | | | — | | | | 357,838 | | | | (972,683 | ) | | | (213,065 | ) | | | 6,811,201 | | | | — | | | | 5,750,466 | | | | (16,452,724 | ) | | | (3,891,057 | ) |
Class S | | | | | | | | | | | | | | | | | | | | | | | | | | | | | | | | | | | | | | | | |
| 12/31/2022 | | | 9,409 | | | | — | | | | 31,158 | | | | (14,838 | ) | | | 25,729 | | | | 122,869 | | | | — | | | | 376,391 | | | | (169,712 | ) | | | 329,548 | |
| 12/31/2021 | | | 6,516 | | | | — | | | | 6,536 | | | | (30,106 | ) | | | (17,054 | ) | | | 109,037 | | | | — | | | | 104,047 | | | | (498,638 | ) | | | (285,554 | ) |
NOTE 9 — LINE OF CREDIT
Effective June 13, 2022, the Portfolios, in addition to certain other funds managed by the Investment Adviser, entered into a 364-day unsecured committed revolving line of credit agreement (the “Credit Agreement”) with The Bank of New York Mellon (“BNY”) for an aggregate amount of $400,000,000 through June 12, 2023. The proceeds may be used only to finance temporarily: (1) the purchase or sale of investment securities; or (2) the repurchase or redemption of shares of the Portfolio or certain other funds managed by the Investment Adviser. The funds to which the line of credit is available pay a commitment fee equal to 0.15% per annum on the daily unused portion of the committed line amount payable quarterly in arrears. Prior to June 13, 2022, the predecessor line of credit was for an aggregate amount of $400,000,000 and the funds to which the line of credit was available paid a commitment fee equal
to 0.15% per annum on the daily unused portion of the committed line amount through June 13, 2022.
Borrowings under the Credit Agreement accrue interest at the federal funds rate plus a specified margin. Repayments generally must be made within 60 days after the date of a revolving credit advance.
The following Portfolio utilized the line of credit during the year ended December 31, 2022:
| Portfolio | | Days
Utilized | | Approximate
Average
Daily Balance
For Days
Utilized | | Approximate
Weighted
Average
Interest Rate
For Days
Utilized |
| Strategic Allocation Conservative | | 2 | | $ | 1,342,000 | | | | 2.17% | |
20
NOTES TO FINANCIAL STATEMENTS AS OF DECEMBER 31, 2022 (CONTINUED)
NOTE 10 — FEDERAL INCOME TAXES
The amount of distributions from net investment income and net realized capital gains are determined in accordance with federal income tax regulations, which may differ from GAAP for investment companies. These book/tax differences may be either temporary or permanent. Permanent differences are reclassified within the capital accounts based on their federal tax-basis treatment; temporary differences are not reclassified. Key differences include the treatment of short-term capital gains, futures contracts and wash sale deferrals.
Dividends paid by the Portfolios from net investment income and distributions of net realized short-term capital gains are, for federal income tax purposes, taxable as ordinary income to shareholders.
The tax composition of dividends and distributions to shareholders was as follows:
| | | Year Ended December 31, 2022 | | Year Ended December 31, 2021 |
| | | Ordinary
Income | | Long-term
Capital Gains | | Ordinary
Income | | Long-term
Capital Gains |
| Strategic Allocation Conservative | | $ | 4,016,276 | | | $ | 3,354,924 | | | $ | 2,056,811 | | | $ | 6,489 | |
| Strategic Allocation Moderate | | | 5,032,502 | | | | 11,131,178 | | | | 3,980,014 | | | | 3,461,824 | |
| Strategic Allocation Growth | | | 6,032,460 | | | | 14,864,441 | | | | 3,623,759 | | | | 2,230,754 | |
The tax-basis components of distributable earnings as of December 31, 2022 were:
| | | Undistributed
Ordinary
Income | | Undistributed
Long-term
Capital Gains | | Unrealized
Appreciation/
(Depreciation) | | Total
Distributable
Earnings/(Loss) |
| Strategic Allocation Conservative | | $ | 1,934,571 | | | $ | 1,648,169 | | | $ | (9,061,908) | | | $ | (5,479,168) | |
| Strategic Allocation Moderate | | | 4,664,100 | | | | 5,257,588 | | | | (16,450,910) | | | | (6,529,222) | |
| Strategic Allocation Growth | | | 4,442,463 | | | | 7,853,520 | | | | (15,473,151) | | | | (3,177,168) | |
At December 31, 2022, the Portfolios did not have any capital loss carryforwards for U.S. federal income tax purposes.
The Portfolios’ major tax jurisdictions are U.S. federal and Arizona state.
As of December 31, 2022, no provision for income tax is required in the Portfolios’ financial statements as a result of tax positions taken on federal and state income tax returns for open tax years. The Portfolios’ federal and state income and federal excise tax returns for tax years for which the applicable statutes of limitations have not expired are subject to examination by the Internal Revenue Service and state department of revenue. Generally, the preceding four tax years remain subject to examination by these jurisdictions.
NOTE 11—LONDON INTERBANK OFFERED RATE (“LIBOR”)
In 2017, the UK Financial Conduct Authority announced its intention to cease compelling banks to provide the quotations needed to sustain LIBOR after 2021. On March 5, 2021, ICE Benchmark Administration, the administrator of LIBOR, stated that non-U.S. dollar LIBOR reference rates and the one-week and two-month LIBOR reference rates ceased to be provided or no longer be representative immediately after December 31, 2021 and the remaining more commonly used LIBOR settings will cease to be provided or no longer be representative immediately after June 30, 2023. In addition, global regulators have announced that, with limited exceptions, no new LIBOR-based contracts should be entered into after 2021. Actions by regulators have resulted in the establishment of alternative reference rates to LIBOR in most major currencies (e.g., the Secured Overnight Financing Rate for U.S. Dollar LIBOR and the Sterling Overnight Interbank Average Rate for Sterling LIBOR).
Discontinuance of LIBOR and adoption/implementation of alternative rates pose a number of risks, including among others whether any substitute rate will experience the market participation and liquidity necessary to provide a workable substitute for LIBOR; the effect on parties’ existing contractual arrangements, hedging transactions, and investment strategies generally from a conversion from LIBOR to alternative rates; the effect on a Portfolio’s existing investments (including, for example, fixed-income investments, senior loans, CLOs and CDOs, and derivatives transactions), including the possibility that some of those investments may terminate or their terms may be adjusted to the disadvantage of a Portfolio; and the risk of general market disruption during the period of the conversion. It is difficult to predict at this time the likely impact of the transition away from LIBOR on a Portfolio.
NOTE 12 — MARKET DISRUPTION
A Portfolio is subject to the risk that geopolitical events will disrupt securities markets and adversely affect global economies and markets. Due to the increasing interdependence among global economies and markets,
21
NOTES TO FINANCIAL STATEMENTS AS OF DECEMBER 31, 2022 (CONTINUED)
NOTE 12 — MARKET DISRUPTION (continued)
conditions in one country, market, or region might adversely impact markets, issuers and/or foreign exchange rates in other countries, including the U.S. Wars, terrorism, global health crises and pandemics, and other geopolitical events that have led, and in the future may continue to lead, to increased market volatility and may have adverse short- or long-term effects on U.S. and global economies and markets generally. For example, the COVID-19 pandemic has resulted, and may continue to result, in significant market volatility, exchange suspensions and closures, declines in global financial markets, higher default rates, supply chain disruptions, and a substantial economic downturn in economies throughout the world. Natural and environmental disasters and systemic market dislocations are also highly disruptive to economies and markets. In addition, military action by Russia in Ukraine has, and may continue to, adversely affect global energy and financial markets and therefore could affect the value of the Portfolio’s investments,
including beyond the Portfolio’s direct exposure to Russian issuers or nearby geographic regions. The extent and duration of the military action, sanctions and resulting market disruptions are impossible to predict and could be substantial. Those events as well as other changes in foreign (non-U.S.) and domestic economic, social, and political conditions also could adversely affect individual issuers or related groups of issuers, securities markets, interest rates, credit ratings, inflation, investor sentiment, and other factors affecting the Portfolios’ investments. Any of these occurrences could disrupt the operations of a Portfolio and of the Portfolios’ service providers.
NOTE 13 — SUBSEQUENT EVENTS
The Portfolios have evaluated events occurring after the Statements of Assets and Liabilities date through the date that the financial statements were issued (“subsequent events”) to determine whether any subsequent events necessitated adjustment to or disclosure in the financial statements. No such subsequent events were identified.
22
VOYA STRATEGIC ALLOCATION
CONSERVATIVE PORTFOLIO | PORTFOLIO OF INVESTMENTS
as of December 31, 2022 |
| Shares | | | | | Value | | | Percentage
of Net
Assets |
| | | | | | | | | | | | |
EXCHANGE-TRADED FUNDS: 6.9% | | | |
| 17,255 | | | iShares 20+ Year Treasury Bond ETF | | $ | 1,717,908 | | | | 3.0 | |
| 11,687 | | | iShares Core S&P Small-Cap ETF | | | 1,106,058 | | | | 1.9 | |
| 21,373 | | | Schwab U.S. TIPS ETF | | | 1,106,907 | | | | 2.0 | |
| | | | Total Exchange-Traded Funds
(Cost $4,566,785) | | | 3,930,873 | | | | 6.9 | |
| | | | | | | | | | | | |
MUTUAL FUNDS: 93.0% | | | |
| | Affiliated Investment Companies: 93.0% |
| 318,104 | | | Voya Global Bond Fund — Class R6 | | | 2,312,617 | | | | 4.1 | |
| 427,846 | | | Voya High Yield Bond Fund — Class R6 | | | 2,810,948 | | | | 5.0 | |
| 2,021,238 | | | Voya Intermediate Bond Fund — Class R6 | | | 17,281,587 | | | | 30.6 | |
| 332,513 | | | Voya Large Cap Value Portfolio — Class R6 | | | 1,732,394 | | | | 3.1 | |
| 48,053 | | | Voya Large-Cap Growth Fund — Class R6 | | | 1,619,861 | | | | 2.9 | |
| 621,746 | | | Voya Limited Maturity Bond Portfolio — Class I | | | 5,856,846 | | | | 10.3 | |
| 134,348 | | | Voya MidCap Opportunities Portfolio — Class R6 | | | 552,171 | | | | 1.0 | |
| 138,123 | | | Voya Multi-Manager Emerging Markets Equity Fund — Class I | | | 1,185,091 | | | | 2.1 | |
| 34,807 | | | Voya Multi-Manager International Equity Fund — Class I | | | 307,690 | | | | 0.5 | |
| Shares | | | | | Value | | | Percentage
of Net
Assets |
| | | | | | | | | | | | |
MUTUAL FUNDS: (continued) | |
| | Affiliated Investment Companies: (continued) |
| 118,852 | | | Voya Multi-Manager International Factors Fund — Class I | | $ | 957,946 | | | | 1.7 | |
| 65,096 | | | Voya Multi-Manager Mid Cap Value Fund — Class I | | | 570,240 | | | | 1.0 | |
| 87,067 | | | Voya Small Company Fund — Class R6 | | | 1,113,588 | | | | 2.0 | |
| 186,399 | | | Voya U.S. Bond Index Portfolio — Class I | | | 1,701,821 | | | | 3.0 | |
| 284,000 | | | Voya U.S. High Dividend Low Volatility Fund — Class R6 | | | 2,891,124 | | | | 5.1 | |
| 495,148 | | | Voya U.S. Stock Index Portfolio — Class I | | | 7,813,436 | | | | 13.8 | |
| 243,642 | | | VY® BrandywineGLOBAL — Bond Portfolio —
Class I | | | 2,263,432 | | | | 4.0 | |
| 26,849 | | | VY®T. Rowe Price Growth Equity Portfolio — Class I | | | 1,580,345 | | | | 2.8 | |
| | | | | | | | | | | | |
| | | | Total Mutual Funds
(Cost $57,959,414) | | | 52,551,137 | | | | 93.0 | |
| | | | Total Investments in Securities
(Cost $62,526,199) | | $ | 56,482,010 | | | | 99.9 | |
| | | | Assets in Excess of Other Liabilities | | | 34,912 | | | | 0.1 | |
| | | | Net Assets | | $ | 56,516,922 | | | | 100.0 | |
Fair Value Measurementsˆ
The following is a summary of the fair valuations according to the inputs used as of December 31, 2022 in valuing the assets and liabilities:
| | Quoted Prices
in Active Markets
for Identical
Investments
(Level 1) | | Significant
Other
Observable
Inputs
(Level 2) | | Significant
Unobservable
Inputs
(Level 3) | | Fair Value
at
December 31, 2022 |
Asset Table | | | | | | | | | | | | | | | | | | | | |
Investments, at fair value | | | | | | | | | | | | | | | | | | | | |
| Exchange-Traded Funds | | | $ | 3,930,873 | | | | $ | — | | | | $ | — | | | | $ | 3,930,873 | |
| Mutual Funds | | | | 52,551,137 | | | | | — | | | | | — | | | | | 52,551,137 | |
| Total Investments, at fair value | | | $ | 56,482,010 | | | | $ | — | | | | $ | — | | | | $ | 56,482,010 | |
| ˆ | See Note 2, “Significant Accounting Policies” in the Notes to Financial Statements for additional information. |
See Accompanying Notes to Financial Statements
23
VOYA STRATEGIC ALLOCATION
CONSERVATIVE PORTFOLIO | PORTFOLIO OF INVESTMENTS
as of December 31, 2022 (CONTINUED) |
Transactions with Affiliates
An investment of at least 5% of the voting securities of an issuer, or a company which is under common control with the issuer, results in that issuer becoming an affiliated person as defined by the 1940 Act.
The following table provides transactions during the year ended December 31, 2022, where the following issuers were considered an affiliate:
| Issuer | | Beginning
Fair Value
at 12/31/2021 | | Purchases
at Cost | | Sales
at Cost | | Change in
Unrealized
Appreciation/
(Depreciation) | | Ending Fair
Value at
12/31/2022 | | Investment
Income | | Realized
Gains/(Losses) | | Net
Capital Gain
Distributions |
|---|
Voya Global Bond
Fund — Class R6 | | | $ | 2,954,609 | | | | $ | 389,738 | | | | $ | (579,553 | ) | | | $ | (452,177 | ) | | | $ | 2,312,617 | | | | $ | 16,273 | | | | $ | (79,433 | ) | | | $ | — | |
| Voya High Yield Bond Fund — Class R6 | | | | 9,794,752 | | | | | 624,309 | | | | | (6,780,527 | ) | | | | (827,586 | ) | | | | 2,810,948 | | | | | 198,812 | | | | | (5,703 | ) | | | | 38,482 | |
| Voya Intermediate Bond Fund — Class R6 | | | | 17,119,861 | | | | | 9,524,645 | | | | | (6,767,642 | ) | | | | (2,595,277 | ) | | | | 17,281,587 | | | | | 496,161 | | | | | (730,979 | ) | | | | 44 | |
| Voya Large Cap Value Portfolio — Class R6 | | | | — | | | | | 3,364,733 | | | | | (816,895 | ) | | | | (815,444 | ) | | | | 1,732,394 | | | | | 28,636 | | | | | (404,013 | ) | | | | 1,088,469 | |
| Voya Large-Cap Growth Fund — Class R6 | | | | 1,906,044 | | | | | 1,090,997 | | | | | (539,168 | ) | | | | (838,012 | ) | | | | 1,619,861 | | | | | — | | | | | (88,453 | ) | | | | 277,269 | |
| Voya Limited Maturity Bond Portfolio — Class I | | | | 3,716,334 | | | | | 6,303,105 | | | | | (3,942,258 | ) | | | | (220,335 | ) | | | | 5,856,846 | | | | | 108,143 | | | | | (122,281 | ) | | | | — | |
| Voya MidCap Opportunities Portfolio — Class R6 | | | | 1,065,126 | | | | | 668,378 | | | | | (749,875 | ) | | | | (431,458 | ) | | | | 552,171 | | | | | — | | | | | (270,755 | ) | | | | 424,277 | |
| Voya Multi-Manager Emerging Markets Equity Fund — Class I | | | | 1,433,411 | | | | | 945,311 | | | | | (1,073,319 | ) | | | | (120,312 | ) | | | | 1,185,091 | | | | | 24,878 | | | | | (330,715 | ) | | | | — | |
| Voya Multi-Manager International Equity Fund — Class I | | | | 1,832,057 | | | | | 326,149 | | | | | (1,802,471 | ) | | | | (48,045 | ) | | | | 307,690 | | | | | 3,669 | | | | | (360,324 | ) | | | | — | |
| Voya Multi-Manager International Factors Fund — Class I | | | | 3,351,626 | | | | | 500,314 | | | | | (2,703,643 | ) | | | | (190,351 | ) | | | | 957,946 | | | | | 53,231 | | | | | (340,132 | ) | | | | — | |
| Voya Multi-Manager Mid Cap Value Fund — Class I | | | | 1,159,655 | | | | | 150,127 | | | | | (623,941 | ) | | | | (115,601 | ) | | | | 570,240 | | | | | 8,888 | | | | | (43,976 | ) | | | | 36,756 | |
| Voya Small Company Fund — Class R6 | | | | — | | | | | 1,391,133 | | | | | (197,992 | ) | | | | (79,553 | ) | | | | 1,113,588 | | | | | 5,242 | | | | | (13,887 | ) | | | | — | |
| Voya U.S. Bond Index Portfolio — Class I | | | | 5,210,873 | | | | | 355,831 | | | | | (3,554,445 | ) | | | | (310,438 | ) | | | | 1,701,821 | | | | | 60,369 | | | | | (297,156 | ) | | | | — | |
| Voya U.S. High Dividend Low Volatility Fund — Class R6 | | | | 2,669,909 | | | | | 1,662,842 | | | | | (1,030,246 | ) | | | | (411,381 | ) | | | | 2,891,124 | | | | | 70,752 | | | | | (42,727 | ) | | | | 280,534 | |
| Voya U.S. Stock Index Portfolio — Class I | | | | 14,634,416 | | | | | 6,707,578 | | | | | (10,211,553 | ) | | | | (3,317,005 | ) | | | | 7,813,436 | | | | | 110,625 | | | | | 240,767 | | | | | 781,949 | |
VY® BrandywineGLOBAL — Bond Portfolio — Class I | | | | — | | | | | 3,217,308 | | | | | (607,877 | ) | | | | (345,999 | ) | | | | 2,263,432 | | | | | 24,843 | | | | | (54,837 | ) | | | | 124,971 | |
VY® T. Rowe Price Growth Equity Portfolio —
Class I | | | | 2,951,457 | | | | | 1,276,002 | | | | | (1,691,909 | ) | | | | (955,205 | ) | | | | 1,580,345 | | | | | — | | | | | (478,547 | ) | | | | 328,021 | |
| | | | $ | 69,800,130 | | | | $ | 38,498,500 | | | | $ | (43,673,314 | ) | | | $ | (12,074,179 | ) | | | $ | 52,551,137 | | | | $ | 1,210,522 | | | | $ | (3,423,151 | ) | | | $ | 3,380,772 | |
The financial statements for the above mutual fund[s] can be found at www.sec.gov.
At December 31, 2022, the aggregate cost of securities and other investments and the composition of unrealized appreciation and depreciation of securities and other investments on a tax basis were:
| Cost for federal income tax purposes was $65,543,918. |
| Net unrealized depreciation consisted of: | | | | |
| Gross Unrealized Appreciation | | $ | 846,034 | |
| Gross Unrealized Depreciation | | | (9,907,942 | ) |
| Net Unrealized Depreciation | | $ | (9,061,908 | ) |
See Accompanying Notes to Financial Statements
24
VOYA STRATEGIC ALLOCATION
MODERATE PORTFOLIO | PORTFOLIO OF INVESTMENTS
as of December 31, 2022 |
| Shares | | | | | | | Value | | Percentage
of Net
Assets | |
|---|
| | | | | | | | | | | | |
EXCHANGE-TRADED FUNDS: 3.0% |
| 22,760 | | | | iShares 20+ Year Treasury Bond ETF | | $ | 2,265,985 | | | 2.0 | |
| 21,144 | | | | Schwab U.S. TIPS ETF | | | 1,095,048 | | | 1.0 | |
| | | | | | | | | | | | |
| | | | | Total Exchange-Traded Funds
(Cost $4,207,670) | | | 3,361,033 | | | 3.0 | |
| | | | | | | | | | | | |
MUTUAL FUNDS: 96.8% | |
| | | | | Affiliated Investment Companies: 96.8% | |
| 3,209,469 | | | | Voya Intermediate Bond Fund — Class R6 | | | 27,440,957 | | | 24.6 | |
| 1,515,297 | | | | Voya Large Cap Value Portfolio — Class R6 | | | 7,894,696 | | | 7.1 | |
| 79,149 | | | | Voya Large-Cap Growth Fund — Class R6 | | | 2,668,114 | | | 2.4 | |
| 769,183 | | | | Voya Limited Maturity Bond Portfolio — Class I | | | 7,245,701 | | | 6.5 | |
| 663,632 | | | | Voya MidCap Opportunities Portfolio — Class R6 | | | 2,727,527 | | | 2.4 | |
| 273,129 | | | | Voya Multi-Manager Emerging Markets Equity Fund — Class I | | | 2,343,446 | | | 2.1 | |
| 212,329 | | | | Voya Multi-Manager International Equity
Fund — Class I | | | 1,876,988 | | | 1.7 | |
| 381,212 | | | | Voya Multi-Manager International Factors
Fund — Class I | | | 3,072,571 | | | 2.7 | |
| Shares | | | | | | | Value | | Percentage
of Net
Assets | |
|---|
| | | | | | | | | | | | |
MUTUAL FUNDS: (continued) | |
| | | | | Affiliated Investment Companies: (continued) | |
| 321,660 | | | | Voya Multi-Manager Mid Cap Value Fund — Class I | | $ | 2,817,739 | | | 2.5 | |
| 32,402 | | (1) | | Voya Small Cap Growth Fund — Class R6 | | | 1,067,001 | | | 1.0 | |
| 173,024 | | | | Voya Small Company Fund — Class R6 | | | 2,212,980 | | | 2.0 | |
| 2,374,480 | | | | Voya U.S. Stock Index Portfolio — Class I | | | 37,469,293 | | | 33.5 | |
| 481,654 | | | | VY® BrandywineGLOBAL — Bond Portfolio —
Class I | | | 4,474,564 | | | 4.0 | |
| 81,672 | | | | VY® T. Rowe Price Growth Equity Portfolio — Class I | | | 4,807,239 | | | 4.3 | |
| | | | | | | | | | | | |
| | | | | Total Mutual Funds
(Cost $119,238,640) | | | 108,118,816 | | | 96.8 | |
| | | | | Total Investments in Securities
(Cost $123,446,310) | | $ | 111,479,849 | | | 99.8 | |
| | | | | Assets in Excess of Other Liabilities | | | 266,189 | | | 0.2 | |
| | | | | Net Assets | | $ | 111,746,038 | | | 100.0 | |
| (1) | Non-income producing security. |
Fair Value Measurementsˆ
The following is a summary of the fair valuations according to the inputs used as of December 31, 2022 in valuing the assets and liabilities:
| | Quoted Prices
in Active Markets
for Identical
Investments
(Level 1) | | Significant
Other
Observable
Inputs
(Level 2) | | Significant
Unobservable
Inputs
(Level 3) | | Fair Value
at
December 31, 2022 |
|---|
Asset Table | | | | | | | | | | | | | | | | | | | | |
Investments, at fair value | | | | | | | | | | | | | | | | | | | | |
| Exchange-Traded Funds | | | $ | 3,361,033 | | | | $ | — | | | | $ | — | | | | $ | 3,361,033 | |
| Mutual Funds | | | | 108,118,816 | | | | | — | | | | | — | | | | | 108,118,816 | |
| Total Investments, at fair value | | | $ | 111,479,849 | | | | $ | — | | | | $ | — | | | | $ | 111,479,849 | |
Other Financial Instruments+ | | | | | | | | | | | | | | | | | | | | |
| Futures | | | | 135,851 | | | | | — | | | | | — | | | | | 135,851 | |
| Total Assets | | | $ | 111,615,700 | | | | $ | — | | | | $ | — | | | | $ | 111,615,700 | |
Liabilities Table | | | | | | | | | | | | | | | | | | | | |
Other Financial Instruments+ | | | | | | | | | | | | | | | | | | | | |
| Futures | | | $ | (113,875 | ) | | | $ | — | | | | $ | — | | | | $ | (113,875 | ) |
| Total Liabilities | | | $ | (113,875 | ) | | | $ | — | | | | $ | — | | | | $ | (113,875 | ) |
| ˆ | | See Note 2, “Significant Accounting Policies” in the Notes to Financial Statements for additional information. |
| + | | Other Financial Instruments may include open forward foreign currency contracts, futures, centrally cleared swaps, OTC swaps and written options. Forward foreign currency contracts, futures and centrally cleared swaps are fair valued at the unrealized appreciation (depreciation) on the instrument. OTC swaps and written options are valued at the fair value of the instrument. |
See Accompanying Notes to Financial Statements
25
VOYA STRATEGIC ALLOCATION
MODERATE PORTFOLIO | PORTFOLIO OF INVESTMENTS
as of December 31, 2022 (CONTINUED) |
Transactions with Affiliates
An investment of at least 5% of the voting securities of an issuer, or a company which is under common control with the issuer, results in that issuer becoming an affiliated person as defined by the 1940 Act.
The following table provides transactions during the year ended December 31, 2022, where the following issuers were considered an affiliate:
| Issuer | | Beginning
Fair Value
at 12/31/2021 | | Purchases
at Cost | | Sales
at Cost | | Change in
Unrealized
Appreciation/
(Depreciation) | | Ending Fair
Value at
12/31/2022 | | Investment
Income | | Realized
Gains/(Losses) | | Net
Capital Gain
Distributions | |
|---|
Voya High Yield Bond
Fund — Class R6 | | | $ | 11,576,825 | | | | $ | 62,194 | | | | $ | (10,951,692 | ) | | | $ | (687,327 | ) | | | $ | — | | | | $ | 50,825 | | | | $ | 361,701 | | | | $ | — | | |
Voya Intermediate Bond
Fund — Class R6 | | | | 25,781,112 | | | | | 15,451,721 | | | | | (9,657,376 | ) | | | | (4,134,500 | ) | | | | 27,440,957 | | | | | 818,491 | | | | | (1,087,222 | ) | | | | — | | |
| Voya Large Cap Value Portfolio — Class R6 | | | | 5,816,856 | | | | | 9,264,981 | | | | | (3,219,956 | ) | | | | (3,967,185 | ) | | | | 7,894,696 | | | | | 130,688 | | | | | (1,364,345 | ) | | | | 4,839,448 | | |
Voya Large-Cap Growth
Fund — Class R6 | | | | 3,660,398 | | | | | 1,061,839 | | | | | (575,532 | ) | | | | (1,478,591 | ) | | | | 2,668,114 | | | | | — | | | | | (100,630 | ) | | | | 457,961 | | |
| Voya Limited Maturity Bond Portfolio — Class I | | | | 2,855,360 | | | | | 5,681,579 | | | | | (1,078,235 | ) | | | | (213,003 | ) | | | | 7,245,701 | | | | | 81,015 | | | | | (46,246 | ) | | | | — | | |
| Voya MidCap Opportunities Portfolio — Class R6 | | | | 3,409,118 | | | | | 2,847,228 | | | | | (1,733,884 | ) | | | | (1,794,935 | ) | | | | 2,727,527 | | | | | — | | | | | (1,119,809 | ) | | | | 2,022,359 | | |
Voya Multi-Manager Emerging Markets Equity
Fund — Class I | | | | 2,756,425 | | | | | 3,077,630 | | | | | (3,279,545 | ) | | | | (211,064 | ) | | | | 2,343,446 | | | | | 49,303 | | | | | (934,229 | ) | | | | — | | |
Voya Multi-Manager International Equity
Fund — Class I | | | | 7,030,839 | | | | | 590,574 | | | | | (4,957,935 | ) | | | | (786,490 | ) | | | | 1,876,988 | | | | | 28,939 | | | | | (674,727 | ) | | | | — | | |
Voya Multi-Manager International Factors
Fund — Class I | | | | 4,289,062 | | | | | 1,950,526 | | | | | (2,627,012 | ) | | | | (540,005 | ) | | | | 3,072,571 | | | | | 126,861 | | | | | (399,296 | ) | | | | — | | |
| Voya Multi-Manager Mid Cap Value Fund — Class I | | | | 3,715,491 | | | | | 406,900 | | | | | (775,641 | ) | | | | (529,011 | ) | | | | 2,817,739 | | | | | 44,034 | | | | | (98,683 | ) | | | | 182,105 | | |
Voya Small Cap Growth
Fund — Class R6 | | | | — | | | | | 1,260,063 | | | | | (120,226 | ) | | | | (72,836 | ) | | | | 1,067,001 | | | | | — | | | | | (4,882 | ) | | | | 27 | | |
| Voya Small Company Fund — Class R6 | | | | — | | | | | 2,559,899 | | | | | (178,690 | ) | | | | (168,229 | ) | | | | 2,212,980 | | | | | 10,449 | | | | | (12,740 | ) | | | | — | | |
| Voya U.S. Bond Index Portfolio — Class I | | | | 5,719,247 | | | | | 51,996 | | | | | (5,605,356 | ) | | | | (165,887 | ) | | | | — | | | | | 23,379 | | | | | (261,548 | ) | | | | — | | |
| Voya U.S. Stock Index Portfolio — Class I | | | | 53,435,261 | | | | | 14,192,068 | | | | | (18,020,211 | ) | | | | (12,137,825 | ) | | | | 37,469,293 | | | | | 531,608 | | | | | (1,300,181 | ) | | | | 3,817,981 | | |
VY® Brandywine GLOBAL — Bond Portfolio — Class I | | | | — | | | | | 6,062,493 | | | | | (850,616 | ) | | | | (737,313 | ) | | | | 4,474,564 | | | | | 47,363 | | | | | (66,657 | ) | | | | 238,252 | | |
VY® T. Rowe Price Growth Equity Portfolio — Class I | | | | 6,382,074 | | | | | 3,066,985 | | | | | (1,385,296 | ) | | | | (3,256,524 | ) | | | | 4,807,239 | | | | | — | | | | | (528,611 | ) | | | | 954,037 | | |
| | | | $ | 136,428,068 | | | | $ | 67,588,676 | | | | $ | (65,017,203 | ) | | | $ | (30,880,725 | ) | | | $ | 108,118,816 | | | | $ | 1,942,955 | | | | $ | (7,638,105 | ) | | | $ | 12,512,170 | | |
The financial statements for the above mutual fund[s] can be found at www.sec.gov.
At December 31, 2022, the following futures contracts were outstanding for Voya Strategic Allocation Moderate Portfolio:
| Description | | Number
of Contracts | | Expiration
Date | | Notional
Amount | | Unrealized
Appreciation/
(Depreciation) |
|---|
| Long Contracts: | | | | | | | | | | | | | | | | | | | | |
E-mini Russell 2000® Index | | | | 25 | | | | | 03/17/23 | | | | $ | 2,213,625 | | | | $ | (79,242 | ) |
| U.S. Treasury Ultra Long Bond | | | | 9 | | | | | 03/22/23 | | | | | 1,208,813 | | | | | (34,633 | ) |
| | | | | | | | | | | | | | $ | 3,422,438 | | | | $ | (113,875 | ) |
| Short Contracts: | | | | | | | | | | | | | | | | | | | | |
| MSCI EAFE Index | | | | (13 | ) | | | | 03/17/23 | | | | | (1,267,110 | ) | | | | 45,930 | |
S&P 500® E-Mini | | | | (11 | ) | | | | 03/17/23 | | | | | (2,123,550 | ) | | | | 89,921 | |
| | | | | | | | | | | | | | $ | (3,390,660 | ) | | | $ | 135,851 | |
See Accompanying Notes to Financial Statements
26
VOYA STRATEGIC ALLOCATION
MODERATE PORTFOLIO | PORTFOLIO OF INVESTMENTS
as of December 31, 2022 (CONTINUED) |
A summary of derivative instruments by primary risk exposure is outlined in the following tables.
The fair value of derivative instruments as of December 31, 2022 was as follows:
| Derivatives not accounted for as hedging instruments | | | Location on Statement
of Assets and Liabilities | | Fair Value |
|---|
Asset Derivatives | | | | | | | | |
| Equity contracts | | | Variation margin receivable on futures contracts* | | | $ | 135,851 | |
Total Asset Derivatives | | | | | | $ | 135,851 | |
| | | | | | | | | |
Liability Derivatives | | | | | | | | |
| Equity contracts | | | Variation margin payable on futures contracts* | | | $ | 79,242 | |
| Interest rate contracts | | | Variation margin payable on futures contracts* | | | | 34,633 | |
Total Liability Derivatives | | | | | | $ | 113,875 | |
| * | The fair value presented above represents the cumulative unrealized appreciation (depreciation) on futures contracts as reported in the table within the Portfolio of Investments. In the Statement of Assets and Liabilities, only current day’s unsettled variation margin is reported in receivables or payables on futures contracts and the net cumulative unrealized appreciation (depreciation) is included in total distributable earnings (loss). |
The effect of derivative instruments on the Portfolio’s Statement of Operations for the year ended December 31, 2022 was as follows:
| | Amount of Realized Gain or (Loss) on
Derivatives Recognized in Income |
|---|
| Derivatives not accounted for as hedging instruments | | Futures |
|---|
| Equity contracts | | | $ | 264,023 | |
| Interest rate contracts | | | | (114,126 | ) |
Total | | | $ | 149,897 | |
| | | |
| | Change in Unrealized Appreciation or (Depreciation)
on Derivatives Recognized in Income |
|---|
| Derivatives not accounted for as hedging instruments | | Futures |
|---|
| Equity contracts | | | $ | 56,609 | |
| Interest rate contracts | | | | (34,633 | ) |
Total | | | $ | 21,976 | |
At December 31, 2022, the aggregate cost of securities and other investments and the composition of unrealized appreciation and depreciation of securities and other investments on a tax basis were:
| Cost for federal income tax purposes was $127,952,734. |
| Net unrealized depreciation consisted of: | | | | |
| Gross Unrealized Appreciation | | $ | 2,600,569 | |
| Gross Unrealized Depreciation | | | (19,051,479 | ) |
| Net Unrealized Depreciation | | $ | (16,450,910 | ) |
See Accompanying Notes to Financial Statements
27
VOYA STRATEGIC ALLOCATION
GROWTH PORTFOLIO | PORTFOLIO OF INVESTMENTS
as of December 31, 2022 |
| Shares | | | | | | | Value | | Percentage
of Net
Assets | |
|---|
| | | | | | | | | | | | |
EXCHANGE-TRADED FUNDS: 3.0% | |
| 24,310 | | | | iShares 20+ Year Treasury Bond ETF | | $ | 2,420,304 | | | 2.0 | |
| 22,584 | | | | Schwab U.S. TIPS ETF | | | 1,169,625 | | | 1.0 | |
| | | | | | | | | | | | |
| | | | | Total Exchange-Traded Funds
(Cost $4,493,410) | | | 3,589,929 | | | 3.0 | |
| | | | | | | | | | | | |
MUTUAL FUNDS: 96.8% | |
| | | | | Affiliated Investment Companies: 96.8% | |
| 1,638,302 | | | | Voya Intermediate Bond Fund — Class R6 | | | 14,007,479 | | | 11.5 | |
| 1,183,689 | | | | Voya Large Cap Value Portfolio — Class R6 | | | 6,167,018 | | | 5.1 | |
| 324,629 | | | | Voya Limited Maturity Bond Portfolio — Class I | | | 3,058,008 | | | 2.5 | |
| 1,152,177 | | | | Voya MidCap Opportunities Portfolio — Class R6 | | | 4,735,448 | | | 3.9 | |
| 448,982 | | | | Voya Multi-Manager Emerging Markets Equity Fund — Class I | | | 3,852,268 | | | 3.2 | |
| 742,185 | | | | Voya Multi-Manager International Equity
Fund — Class I | | | 6,560,912 | | | 5.4 | |
| 643,358 | | | | Voya Multi-Manager International Factors
Fund — Class I | | | 5,185,467 | | | 4.3 | |
| Shares | | | | | | | Value | | Percentage
of Net
Assets | |
|---|
| | | | | | | | | | | | |
MUTUAL FUNDS: (continued) | |
| | | | | Affiliated Investment Companies: (continued) | |
| 558,267 | | | | Voya Multi-Manager Mid Cap Value Fund — Class I | | $ | 4,890,418 | | | 4.0 | |
| 71,181 | | (1) | | Voya Small Cap Growth Fund — Class R6 | | | 2,343,974 | | | 1.9 | |
| 284,353 | | | | Voya Small Company Fund — Class R6 | | | 3,636,881 | | | 3.0 | |
| 3,339,308 | | | | Voya U.S. Stock Index Portfolio — Class I | | | 52,694,277 | | | 43.3 | |
| 522,424 | | | | VY® BrandywineGLOBAL — Bond Portfolio —
Class I | | | 4,853,319 | | | 4.0 | |
| 97,564 | | | | VY® T. Rowe Price Growth Equity Portfolio — Class I | | | 5,742,597 | | | 4.7 | |
| | | | | | | | | | | | |
| | | | | Total Mutual Funds
(Cost $127,100,259) | | | 117,728,066 | | | 96.8 | |
| | | | | Total Investments in Securities
(Cost $131,593,669) | | $ | 121,317,995 | | | 99.8 | |
| | | | | Assets in Excess of Other Liabilities | | | 298,207 | | | 0.2 | |
| | | | | Net Assets | | $ | 121,616,202 | | | 100.0 | |
| (1) | Non-income producing security. |
Fair Value Measurementsˆ
The following is a summary of the fair valuations according to the inputs used as of December 31, 2022 in valuing the assets and liabilities:
| | Quoted Prices
in Active Markets
for Identical
Investments
(Level 1) | | Significant
Other
Observable
Inputs
(Level 2) | | Significant
Unobservable
Inputs
(Level 3) | | Fair Value
at
December 31, 2022 |
|---|
Asset Table | | | | | | | | | | | | | | | | | | | | |
Investments, at fair value | | | | | | | | | | | | | | | | | | | | |
| Exchange-Traded Funds | | | $ | 3,589,929 | | | | $ | — | | | | $ | — | | | | $ | 3,589,929 | |
| Mutual Funds | | | | 117,728,066 | | | | | — | | | | | — | | | | | 117,728,066 | |
| Total Investments, at fair value | | | $ | 121,317,995 | | | | $ | — | | | | $ | — | | | | $ | 121,317,995 | |
Other Financial Instruments+ | | | | | | | | | | | | | | | | | | | | |
| Futures | | | | 147,559 | | | | | — | | | | | — | | | | | 147,559 | |
| Total Assets | | | $ | 121,465,554 | | | | $ | — | | | | $ | — | | | | $ | 121,465,554 | |
Liabilities Table | | | | | | | | | | | | | | | | | | | | |
Other Financial Instruments+ | | | | | | | | | | | | | | | | | | | | |
| Futures | | | $ | (117,045 | ) | | | $ | — | | | | $ | — | | | | $ | (117,045 | ) |
| Total Liabilities | | �� | $ | (117,045 | ) | | | $ | — | | | | $ | — | | | | $ | (117,045 | ) |
| ˆ | | See Note 2, “Significant Accounting Policies” in the Notes to Financial Statements for additional information. |
| + | | Other Financial Instruments may include open forward foreign currency contracts, futures, centrally cleared swaps, OTC swaps and written options. Forward foreign currency contracts, futures and centrally cleared swaps are fair valued at the unrealized appreciation (depreciation) on the instrument. OTC swaps and written options are valued at the fair value of the instrument. |
See Accompanying Notes to Financial Statements
28
VOYA STRATEGIC ALLOCATION
GROWTH PORTFOLIO | PORTFOLIO OF INVESTMENTS
as of December 31, 2022 (continued) |
Transactions with Affiliates
An investment of at least 5% of the voting securities of an issuer, or a company which is under common control with the issuer, results in that issuer becoming an affiliated person as defined by the 1940 Act.
The following table provides transactions during the year ended December 31, 2022, where the following issuers were considered an affiliate:
| Issuer | | Beginning
Fair Value
at 12/31/2021 | | Purchases
at Cost | | Sales
at Cost | | Change in
Unrealized
Appreciation/
(Depreciation) | | Ending Fair
Value at
12/31/2022 | | Investment
Income | | Realized
Gains/(Losses) | | Net
Capital Gain
Distributions |
|---|
| Voya High Yield Bond Fund — Class R6 | | | $ | 9,427,935 | | | | $ | 44,809 | | | | $ | (8,826,732 | ) | | | $ | (646,012 | ) | | | $ | — | | | | $ | 38,298 | | | | $ | 397,592 | | | | $ | — | |
| Voya Intermediate Bond Fund — Class R6 | | | | 15,551,266 | | | | | 8,146,578 | | | | | (7,628,792 | ) | | | | (2,061,573 | ) | | | | 14,007,479 | | | | | 383,481 | | | | | (722,009 | ) | | | | — | |
| Voya Large Cap Value Portfolio — Class R6 | | | | 6,315,839 | | | | | 5,444,978 | | | | | (2,398,194 | ) | | | | (3,195,605 | ) | | | | 6,167,018 | | | | | 101,979 | | | | | (828,847 | ) | | | | 3,674,952 | |
| Voya Large Cap Value Portfolio — Class R6 | | | | — | | | | | 3,073,562 | | | | | (2,592 | ) | | | | (12,962 | ) | | | | 3,058,008 | | | | | 3,394 | | | | | (5 | ) | | | | — | |
Voya MidCap Opportunities
Portfolio — Class R6 | | | | 5,926,825 | | | | | 4,801,248 | | | | | (2,318,454 | ) | | | | (3,674,171 | ) | | | | 4,735,448 | | | | | — | | | | | (1,308,401 | ) | | | | 3,436,253 | |
| Voya Multi-Manager Emerging Markets Equity Fund — Class I | | | | 4,489,856 | | | | | 3,661,167 | | | | | (3,911,427 | ) | | | | (387,328 | ) | | | | 3,852,268 | | | | | 105,927 | | | | | (1,268,359 | ) | | | | — | |
| Voya Multi-Manager International Equity Fund — Class I | | | | 13,732,988 | | | | | 1,462,204 | | | | | (7,018,804 | ) | | | | (1,615,476 | ) | | | | 6,560,912 | | | | | 92,105 | | | | | (1,363,246 | ) | | | | — | |
| Voya Multi-Manager International Factors Fund — Class I | | | | 4,658,212 | | | | | 3,437,649 | | | | | (2,056,471 | ) | | | | (853,923 | ) | | | | 5,185,467 | | | | | 179,904 | | | | | (276,935 | ) | | | | — | |
| Voya Multi-Manager Mid Cap Value Fund — Class I | | | | 6,453,501 | | | | | 723,940 | | | | | (1,271,165 | ) | | | | (1,015,858 | ) | | | | 4,890,418 | | | | | 75,935 | | | | | (67,953 | ) | | | | 314,031 | |
| Voya Small Cap Growth Fund — Class R6 | | | | — | | | | | 2,698,142 | | | | | (194,174 | ) | | | | (159,994 | ) | | | | 2,343,974 | | | | | — | | | | | (6,821 | ) | | | | — | |
| Voya Small Company Fund — Class R6 | | | | — | | | | | 4,109,317 | | | | | (194,223 | ) | | | | (278,213 | ) | | | | 3,636,881 | | | | | 17,114 | | | | | (12,972 | ) | | | | — | |
| Voya U.S. Stock Index Portfolio — Class I | | | | 70,896,040 | | | | | 17,072,604 | | | | | (18,501,399 | ) | | | | (16,772,968 | ) | | | | 52,694,277 | | | | | 746,645 | | | | | (1,666,173 | ) | | | | 5,327,919 | |
VY® BrandywineGLOBAL — Bond Portfolio — Class I | | | | — | | | | | 6,283,378 | | | | | (652,730 | ) | | | | (777,329 | ) | | | | 4,853,319 | | | | | 50,368 | | | | | (49,410 | ) | | | | 253,367 | |
VY® T. Rowe Price Growth Equity Portfolio —
Class I | | | | 9,233,296 | | | | | 3,762,075 | | | | | (3,416,185 | ) | | | | (3,836,589 | ) | | | | 5,742,597 | | | | | — | | | | | (982,794 | ) | | | | 1,127,462 | |
| | | | $ | 146,685,758 | | | | $ | 64,721,651 | | | | $ | (58,391,342 | ) | | | $ | (35,288,001 | ) | | | $ | 117,728,066 | | | | $ | 1,795,150 | | | | $ | (8,156,333 | ) | | | $ | 14,133,984 | |
The financial statements for the above mutual fund[s] can be found at www.sec.gov.
At December 31, 2022, the following futures contracts were outstanding for Voya Strategic Allocation Growth Portfolio:
| Description | | Number
of Contracts | | Expiration
Date | | Notional
Amount | | Unrealized
Appreciation/
(Depreciation) |
|---|
| Long Contracts: | | | | | | | | | | | | | | | | | | | | |
E-mini Russell 2000® Index | | | | 26 | | | | | 03/17/23 | | | | $ | 2,302,170 | | | | $ | (82,412 | ) |
| U.S. Treasury Ultra Long Bond | | | | 9 | | | | | 03/22/23 | | | | | 1,208,812 | | | | | (34,633 | ) |
| | | | | | | | | | | | | | $ | 3,510,982 | | | | $ | (117,045 | ) |
| Short Contracts: | | | | | | | | | | | | | | | | | | | | |
| MSCI EAFE Index | | | | (14 | ) | | | | 03/17/23 | | | | | (1,364,580 | ) | | | | 49,463 | |
S&P 500® E-Mini | | | | (12 | ) | | | | 03/17/23 | | | | | (2,316,600 | ) | | | | 98,096 | |
| | | | | | | | | | | | | | $ | (3,681,180 | ) | | | $ | 147,559 | |
See Accompanying Notes to Financial Statements
29
VOYA STRATEGIC ALLOCATION
GROWTH PORTFOLIO | PORTFOLIO OF INVESTMENTS
as of December 31, 2022 (continued) |
A summary of derivative instruments by primary risk exposure is outlined in the following tables.
The fair value of derivative instruments as of December 31, 2022 was as follows:
| Derivatives not accounted for as hedging instruments | | | Location on Statement
of Assets and Liabilities | | | Fair Value |
|---|
Asset Derivatives | | | | | | | | |
| Equity contracts | | | Variation margin receivable on futures contracts* | | | $ | 147,559 | |
Total Asset Derivatives | | | | | | $ | 147,559 | |
| | | | | | | | | |
Liability Derivatives | | | | | | | | |
| Equity contracts | | | Variation margin payable on futures contracts* | | | $ | 82,412 | |
| Interest rate contracts | | | Variation margin payable on futures contracts* | | | | 34,633 | |
Total Liability Derivatives | | | | | | $ | 117,045 | |
| * | The fair value presented above represents the cumulative unrealized appreciation (depreciation) on futures contracts as reported in the table within the Portfolio of Investments. In the Statement of Assets and Liabilities, only current day’s unsettled variation margin is reported in receivables or payables on futures contracts and the net cumulative unrealized appreciation (depreciation) is included in total distributable earnings (loss). |
The effect of derivative instruments on the Portfolio’s Statement of Operations for the year ended December 31, 2022 was as follows:
| | Amount of Realized Gain or (Loss) on
Derivatives Recognized in Income |
|---|
| Derivatives not accounted for as hedging instruments | | Futures |
|---|
| Equity contracts | | | $ | 318,942 | |
| Interest rate contracts | | | | (124,971 | ) |
Total | | | $ | 193,971 | |
| | | |
| | Change in Unrealized Appreciation or (Depreciation)
on Derivatives Recognized in Income |
|---|
| Derivatives not accounted for as hedging instruments | | Futures |
|---|
| Equity contracts | | | $ | 65,147 | |
| Interest rate contracts | | | | (34,633 | ) |
Total | | | $ | 30,514 | |
At December 31, 2022, the aggregate cost of securities and other investments and the composition of unrealized appreciation and depreciation of securities and other investments on a tax basis were:
| Cost for federal income tax purposes was $136,821,660. |
| Net unrealized depreciation consisted of: | | | | |
| Gross Unrealized Appreciation | | $ | 3,116,786 | |
| Gross Unrealized Depreciation | | | (18,589,937 | ) |
| Net Unrealized Depreciation | | $ | (15,473,151 | ) |
See Accompanying Notes to Financial Statements
30
TAX INFORMATION (UNAUDITED) Dividends and distributions paid during the year ended December 31, 2022 were as follows:
| Portfolio Name | | Type | | Per Share Amount |
|---|
Voya Strategic Allocation
Conservative Portfolio | | | | | | | | |
| Class I | | NII | | $ | 0.4390 | |
| Class S | | NII | | $ | 0.4035 | |
| All Classes | | STCG | | $ | 0.3394 | |
| All Classes | | LTCG | | $ | 0.6487 | |
Voya Strategic Allocation Moderate
Portfolio | | | | | | | | |
| Class I | | NII | | $ | 0.4256 | |
| Class S | | NII | | $ | 0.3856 | |
| All Classes | | STCG | | $ | 0.1526 | |
| All Classes | | LTCG | | $ | 1.2779 | |
| Portfolio Name | | Type | | Per Share Amount |
|---|
| Voya Strategic Allocation Growth Portfolio | | | | | | | | |
| Class I | | NII | | $ | 0.4847 | |
| Class S | | NII | | $ | 0.4409 | |
| All Classes | | STCG | | $ | 0.2104 | |
| All Classes | | LTCG | | $ | 1.7108 | |
NII—Net investment income
STCG—Short-term capital gain
LTCG—Long-term capital gain
Of the ordinary distributions made during the year ended December 31, 2022, the following percentages qualify for the dividends received deduction (DRD) available to corporate shareholders:
| Voya Strategic Allocation Conservative Portfolio | | | 9.45 | % |
| Voya Strategic Allocation Moderate Portfolio | | | 18.35 | % |
| Voya Strategic Allocation Growth Portfolio | | | 19.48 | % |
The Portfolios designate the following amounts of long-term capital gain distributions as 20% rate long-term capital gain dividends under Internal Revenue Code Section 852(b)(3)(C):
| Voya Strategic Allocation Conservative Portfolio | | $ | 3,354,924 | |
| Voya Strategic Allocation Moderate Portfolio | | $ | 11,131,178 | |
| Voya Strategic Allocation Growth Portfolio | | $ | 14,864,441 | |
The Regulated Investment Company Modernization Act of 2010 allows qualified fund-of-funds to elect to pass through the ability to take foreign tax credits (or deductions) to the extent that foreign taxes are passed through from underlying funds. A qualified fund-of-funds is a regulated investment company that has at least 50% of the value of its total assets invested in other regulated investment companies at the end of each quarter of the taxable year. Pursuant to Section 853 of the Internal Revenue Code, the Portfolios designate the following amounts as foreign taxes paid for the year ended December 31, 2022:
| | Creditable
Foreign Taxes
Paid | | Per Share
Amount | | Portion of Ordinary Income
Distribution Derived from
Foreign Sourced Income* |
|---|
| Voya Strategic Allocation Conservative Portfolio | | $ | 12,957 | | | $ | 0.0024 | | | | 4.31 | % |
| Voya Strategic Allocation Moderate Portfolio | | $ | 36,540 | | | $ | 0.0038 | | | | 6.50 | % |
| Voya Strategic Allocation Growth Portfolio | | $ | 98,721 | | | $ | 0.0097 | | | | 8.24 | % |
| * | None of the Portfolios listed above derived any income from ineligible foreign sources as defined under Section 901(j) of the Internal Revenue Code. |
Foreign taxes paid or withheld must be included in taxable income with an offsetting deduction from gross income or as a credit for taxes paid to foreign governments. Shareholders are strongly advised to consult their own tax advisors regarding the appropriate treatment of foreign taxes paid.
Above figures may differ from those cited elsewhere in this report due to differences in the calculation of income and gains under U.S. generally accepted accounting principles (book) purposes and Internal Revenue Service (tax) purposes.
Shareholders are strongly advised to consult their own tax advisers with respect to the tax consequences of their investments in the Portfolios. In January, shareholders, excluding corporate shareholders, receive an IRS 1099-DIV regarding the federal tax status of the dividends and distributions they received in the calendar year.
31
DIRECTOR AND OFFICER INFORMATION (UNAUDITED) The business and affairs of the Company are managed under the direction of the Board. A Director, who is not an interested person of the Company, as defined in the 1940 Act, is an independent director (“Independent Director”). The Directors and Officers of the Company are listed below. The Statement of Additional Information includes additional information about Directors of the Company and is available, without charge, upon request at (800) 992-0180.
| Name, Address and Age | | Position(s)
Held with
the Company | | Term of Office
and Length of
Time Served(1) | | Principal Occupation(s) —
During the Past 5 Years | | Number of
funds in
Fund Complex
Overseen
by
Director(2) | | Other Board Positions
Held by Director |
|---|
| | | | | | | | | | | |
|---|
Independent Directors*: | | | | | | | | | | |
| | | | | | | | | | | |
Colleen D. Baldwin
7337 East Doubletree Ranch Rd.
Suite 100
Scottsdale, Arizona 85258
Age: 62 | | Chairperson
Director | | January
2020–Present
May
2013–Present | | President, Glantuam Partners, LLC, a business consulting firm (January 2009–Present). | | 132 | | RSR Partners, Inc, (2016–Present). |
| | | | | | | | | | | |
John V. Boyer
7337 East Doubletree Ranch Rd.
Suite 100
Scottsdale, Arizona 85258
Age: 69 | | Director | | May
2013–Present | | Retired. Formerly, President and Chief Executive Officer, Bechtler Arts Foundation, an arts and education foundation (January 2008– December 2019). | | 132 | | None. |
| | | | | | | | | | | |
Patricia W. Chadwick
7337 East Doubletree Ranch Rd.
Suite 100
Scottsdale, Arizona 85258
Age: 74 | | Director | | May
2013–Present | | Consultant and President, Ravengate Partners LLC, a consulting firm that provides advice regarding financial markets and the global economy (January 2000–Present). | | 132 | | The Royce Funds (22 funds) (December 2009–Present). AMICA Mutual Insurance Company
(1992–Present). |
| | | | | | | | | | | |
Martin J. Gavin
7337 East Doubletree Ranch Rd.
Suite 100
Scottsdale, AZ 85258
Age: 72 | | Director | | August
2015–Present | | Retired. | | 132 | | None. |
| | | | | | | | | | | |
Joseph E. Obermeyer
7337 East Doubletree Ranch Rd.
Suite 100
Scottsdale, Arizona 85258
Age: 65 | | Director | | January
2003–Present | | President, Obermeyer & Associates, Inc., a provider of financial and economic consulting services (November 1999–Present). | | 132 | | None. |
| | | | | | | | | | | |
Sheryl K. Pressler
7337 East Doubletree Ranch Rd.
Suite 100
Scottsdale, Arizona 85258
Age: 72 | | Director | | May
2013–Present | | Consultant (May
2001–Present). | | 132 | | Centerra Gold Inc. (May 2008–Present). |
| | | | | | | | | | | |
Christopher P. Sullivan
7337 East Doubletree Ranch Rd.
Suite 100
Scottsdale, Arizona 85258
Age: 69 | | Director | | October
2015–Present | | Retired. | | 132 | | None. |
(1) | | Directors serve until their successors are duly elected and qualified. The tenure of each Director who is not an “interested person” as defined in the 1940 Act, of each Portfolio (“Independent Director”) is subject to the Board’s retirement policy which states that each duly elected or appointed Independent Director shall retire from and cease to be a member of the Board of Directors at the close of business on December 31 of the calendar year in which the Independent Director attains the age of 75. A majority vote of the Board’s other Independent Directors may extend the retirement date of an Independent Director if the retirement would trigger a requirement to hold a meeting of shareholders of the Company under applicable law, whether for the purposes of appointing a successor to the Independent Director or otherwise comply under applicable law, in which case the extension would apply until such time as the shareholder meeting can be held or is no longer required (as determined by a vote of a majority of the other Independent Directors). |
| | | |
(2) | | For the purposes of this table, “Fund Complex” means the Voya family of funds including the following investment companies: Voya Asia Pacific High Dividend Equity Income Fund; Voya Balanced Portfolio, Inc.; Voya Credit Income Fund; Voya Emerging Markets High Dividend Equity Fund; Voya Equity Trust; Voya Funds Trust; Voya Global Advantage and Premium Opportunity Fund; Voya Global Equity Dividend and Premium Opportunity Fund; Voya Government Money Market Portfolio; Voya Infrastructure, Industrials and Materials Fund; Voya Intermediate Bond Portfolio; Voya Investors Trust; Voya Mutual Funds; Voya Partners, Inc.; Voya Separate Portfolios Trust; Voya Strategic Allocation Portfolios, Inc.; Voya Variable Funds; Voya Variable Insurance Trust; Voya Variable Portfolios, Inc.; and Voya Variable Products Trust. The number of funds in the Fund Complex is as of January 31, 2023. |
32
DIRECTOR AND OFFICER INFORMATION (UNAUDITED) (CONTINUED)
| Name, Address and Age | | Position(s) Held
With the Company | | Term of Office
and Length of
Time Served(1) | | Principal Occupation(s) —
During the Past 5 Years |
|---|
Andy Simonoff
5780 Powers Ferry Road NW
Atlanta, Georgia 30327
Age: 50 | | President and Chief Executive Officer | | January 2023–Present | | Director, President and Chief Executive Officer, Voya Funds Services, LLC, Voya Capital, LLC and Voya Investments, LLC (January 1, 2023–Present); Managing Director, Chief Strategy and Transformation Officer, Voya Investment Management (January 2020–Present). Formerly, Managing Director, Head of Business Management, Voya Investment Management (March 2019–January 2020); Managing Director, Head of Business Management, Fixed Income, Voya Investment Management (November 2015–March 2019). |
| | | | | | | |
Jonathan Nash
230 Park Avenue
New York, New York 10169
Age: 55 | | Executive Vice President and Chief Investment Risk Officer | | March 2020–Present | | Executive Vice President and Chief Investment Risk Officer, Voya Investments, LLC (March 2020–Present); Senior Vice President, Investment Risk Management, Voya Investment Management (March 2017–Present). Formerly, Vice President, Voya Investments, LLC (September 2018–March 2020); Consultant, DA Capital LLC (January 2016–March 2017). |
| | | | | | | |
James M. Fink
5780 Powers Ferry Road NW
Atlanta, Georgia 30327
Age: 64 | | Executive Vice President | | March 2018–Present | | Senior Vice President, Voya Investments Distributor, LLC (April 2018–Present); Managing Director, Voya Investments, LLC, Voya Capital, LLC, and Voya Funds Services, LLC (March 2018–Present); Chief Administrative Officer, Voya Investment Management (September 2017–Present). Formerly, Managing Director, Operations, Voya Investment Management (March 1999–September 2017). |
| | | | | | | |
Steven Hartstein
230 Park Avenue
New York, NY 10169
Age: 59 | | Chief Compliance Officer | | December 2022–Present | | Senior Vice President, Voya Investment Management (December 2022–Present). Formerly, Brighthouse Financial, Inc.—Head of Funds Compliance; Chief Compliance Officer—Brighthouse Funds and Brighthouse Investment Advisers, LLC (March 2017–December 2022). |
| | | | | | | |
Todd Modic
7337 East Doubletree Ranch Rd.
Suite 100
Scottsdale, Arizona 85258
Age:55 | | Senior Vice President, Chief/Principal Financial Officer and Assistant Secretary | | March 2005–Present | | Director and Senior Vice President, Voya Capital, LLC, and Voya Funds Services, LLC (September 2022–Present); Director, Voya Investments, LLC (September 2022–Present); Senior Vice President, Voya Investments, LLC (April 2005–Present). Formerly, President, Voya Funds Services, LLC (March 2018–September 2022). |
| | | | | | | |
Kimberly A. Anderson
7337 East Doubletree Ranch Rd.
Suite 100
Scottsdale, Arizona 85258
Age: 58 | | Senior Vice President | | December 2003–Present | | Senior Vice President, Voya Investments, LLC (September 2003 Present) |
| | | | | | | |
Sara M. Donaldson
7337 East Doubletree Ranch Rd.
Suite 100
Scottsdale, Arizona 85258
Age: 63 | | Senior Vice President | | June 2022–Present | | Senior Vice President, Voya Investments, LLC (February 2022–Present); Senior Vice President, Head of Active Ownership, Voya Investment Management (September 2021–Present). Formerly, Vice President, Voya Investments, LLC (October 2015–February 2022); Vice President, Head of Proxy Voting, Voya Investment Management (October 2015–August 2021). |
| | | | | | | |
Andrew K. Schlueter
7337 East Doubletree Ranch Rd.
Suite 100
Scottsdale, Arizona 85258
Age: 46 | | Senior Vice President | | June 2022–Present | | Senior Vice President, Head of Mutual Fund Operations, Voya Investment Management (March 2022–Present); Vice President, Voya Investments Distributor, LLC (April 2018–Present); Vice President, Voya Investments, LLC and Voya Funds Services, LLC (March 2018–Present); Formerly, Vice President, Head of Mutual Fund Operations, Voya Investment Management (February 2018–February 2022); Vice President, Voya Investment Management (March 2014–February 2018). |
33
DIRECTOR AND OFFICER INFORMATION (UNAUDITED) (CONTINUED)
| Name, Address and Age | | Position(s) Held
With the Company | | Term of Office
and Length of
Time Served(1) | | Principal Occupation(s) —
During the Past 5 Years |
|---|
| | | | | | | |
Robert Terris
5780 Powers Ferry Road NW
Atlanta, Georgia 30327
Age: 52 | | Senior Vice President | | June 2006–Present | | Senior Vice President, Voya Investments Distributor, LLC (April 2018–Present); Senior Vice President, Head of Investment Services, Voya Investments, LLC (April 2018–Present); Senior Vice President, Head of Investment Services, Voya Funds Services, LLC (March 2006–Present). Formerly, Senior Vice President, Head of Division Operations, Voya Investments, LLC (October 2015–April 2018).. |
| | | | | | | |
Joanne F. Osberg
7337 East Doubletree Ranch Rd.
Suite 100
Scottsdale, Arizona 85258
Age: 41 | | Vice President Secretary | | June 2022–Present
September 2020–Present | | Vice President and Senior Counsel, Voya Investment Management—Mutual Fund Legal Department (September 2020–Present). Formerly, Vice President and Counsel, Voya Investment Management—Mutual Fund Legal Department (January 2013–September 2020). |
| | | | | | | |
Fred Bedoya
7337 East Doubletree Ranch Rd.
Suite 100
Scottsdale, Arizona 85258
Age: 50 | | Vice President
Principal Accounting Officer and Treasurer | | September 2012–Present | | Vice President, Voya Investments, LLC (October 2015–Present); Vice President, Voya Funds Services, LLC (July 2012–Present). |
| | | | | | | |
Robyn L. Ichilov
7337 East Doubletree Ranch Rd.
Suite 100
Scottsdale, Arizona 85258
Age: 55 | | Vice President | | March 2002–Present | | Vice President, Voya Investments, LLC (August 1997–Present); Vice President, Voya Funds Services, LLC (November 1995–Present). |
| | | | | | | |
Jason Kadavy
7337 East Doubletree Ranch Rd.
Suite 100
Scottsdale, Arizona 85258
Age: 46 | | Vice President | | September 2012–Present | | Vice President, Voya Investments, LLC (October 2015–Present); Vice President, Voya Funds Services, LLC (July 2007–Present). |
| | | | | | | |
Erica McKenna
7337 East Doubletree Ranch Rd.
Suite 100
Scottsdale, Arizona 85258
Age:50 | | Vice President | | June 2022–Present | | Vice President, Head of Mutual Fund Compliance, and Chief Compliance Officer, Voya Investments, LLC (May 2022–Present). Formerly, Vice President, Fund Compliance Manager, Voya Investments, LLC (March 2021–May 2022); Assistant Vice President, Fund Compliance Manager, Voya Investments, LLC (December 2016–March 2021). |
| | | | | | | |
Craig Wheeler
7337 East Doubletree Ranch Rd.
Suite 100
Scottsdale, Arizona 85258
Age: 53 | | Vice President | | May 2013–Present | | Vice President—Director of Tax, Voya Investments, LLC (October 2015–Present). |
| | | | | | | |
Nicholas C.D. Ward
7337 East Doubletree Ranch Rd.
Suite 100
Scottsdale, Arizona 85258
Age:29 | | Assistant Vice President and Assistant Secretary | | June 2022–Present | | Counsel, Voya Investment Management—Mutual Fund Legal Department (November 2021–Present). Formerly, Associate, Dechert LLP (October 2018–November 2021). |
| | | | | | | |
Gizachew Wubishet
7337 East Doubletree Ranch Rd.
Suite 100
Scottsdale, Arizona 85258
Age: 46 | | Assistant Vice President and Assistant Secretary | | June 2022–Present | | Assistant Vice President and Counsel, Voya Investment Management—Mutual Fund Legal Department (May 2019–Present). Formerly, Attorney, Ropes & Gray LLP (October 2011–April 2019). |
| | | | | | | |
Monia Piacenti
One Orange Way
Windsor, Connecticut 06095
Age: 46 | | Anti-Money Laundering Officer | | June 2018–Present | | Compliance Consultant, Voya Financial, Inc. (January 2019–Present); Anti-Money Laundering Officer, Voya Investments Distributor, LLC, Voya Investment Management and Voya Investment Management Trust Co. (June 2018–Present); Formerly, Senior Compliance Officer, Voya Investment Management (December 2009–December 2018). |
(1) | | The Officers hold office until the next annual meeting of the Board of Directors and until their successors shall have been elected and qualified. |
34
ADVISORY AND SUB-ADVISORY CONTRACT APPROVAL DISCUSSION (UNAUDITED) BOARD CONSIDERATION AND APPROVAL OF INVESTMENT MANAGEMENT CONTRACT AND SUB-ADVISORY CONTRACT
At a meeting held on November 17, 2022, the Board of Directors (“Board”) of Voya Strategic Allocation Portfolios, Inc. (the “Company”), including a majority of the Board members who have no direct or indirect interest in the investment management and sub-advisory contracts, and who are not “interested persons” of Voya Strategic Allocation Conservative Portfolio, Voya Strategic Allocation Growth Portfolio, and Voya Strategic Allocation Moderate Portfolio, each a series of the Company (the “Portfolios”), as such term is defined under the Investment Company Act of 1940, as amended (the “Independent Directors”), considered and approved the renewal of the investment management contracts (the “Management Contracts”) between Voya Investments, LLC (the “Manager”) and the Company, on behalf of the Portfolios, and the sub-advisory contracts (the “Sub-Advisory Contracts,” and together with the Management Contracts, the “Contracts”) with Voya Investment Management Co. LLC, the sub-adviser to each Portfolio (the “Sub-Adviser”), for an additional one-year period ending November 30, 2023.
In addition to the Board meeting on November 17, 2022, the Independent Directors also held meetings outside the presence of representatives of the Manager and Sub-Adviser (collectively, such persons are referred to herein as “management”) on October 12-13, 2022, and November 15, 2022. At those meetings, the Board members reviewed and considered materials related to the proposed continuance of the Contracts that they had requested and believed to be relevant to the renewal of the Contracts in light of their own business judgment and the legal advice furnished to them by K&L Gates LLP, their independent legal counsel. The Board also considered information furnished to it throughout the year at meetings of the Board and its committees, including information regarding performance, expenses, and other relevant matters. While the Board considered the renewal of the management contracts and sub-advisory contracts for all of the applicable investment companies in the Voya family of funds at the same meetings, the Board considered each Voya fund’s investment management and sub-advisory relationships separately.
The Board has established a Contracts Committee and two Investment Review Committees (the “IRCs”), each of which includes only Independent Directors as members. The Contracts Committee meets several times throughout the year to provide oversight with respect to the management and sub-advisory contracts approval and renewal process for the Voya funds, among other functions, and each IRC meets several times throughout
the year with respect to each Voya fund (assigned to that IRC) to provide oversight regarding the investment performance of the sub-advisers, as well as the Manager’s role in monitoring the sub-advisers.
The Contracts Committee oversees, and annually recommends Board approval of updates to, a methodology guide for the Voya funds (“Methodology Guide”), which sets out a framework pursuant to which the Independent Directors request, and management provides, certain information that the Independent Directors deem to be important or potentially relevant to the contracts renewal process for the Voya funds. The Independent Directors retain the services of an independent consultant with experience in the mutual fund industry to assist the Contracts Committee in developing and recommending to the Board: (1) a selected peer group of investment companies for each Portfolio (“Selected Peer Group”) based on that Portfolio’s particular attributes, such as fund type and size, fund category (as determined by Morningstar, Inc., an independent provider of mutual fund data (“Morningstar”)), sales channels and structure and the Portfolio share class being compared to the Selected Peer Group; and (2) updates to the Methodology Guide with respect to the content and format of various data prepared in connection with the renewal process, including, but not limited to, investment performance, fee structure, and expense information. In addition, the Independent Directors periodically have retained an independent firm to test and verify the accuracy of certain information presented to the Board for a representative sample of the Voya funds.
The Manager or Sub-Adviser may not have been able to, or opted not to, provide information in response to certain information requests, in which case the Board conducted its evaluation based on the information that was provided. In such cases, the Board determined that the omission of any such information was not material to its considerations. Additionally, the Board considered the impact of significant periods of market volatility that occurred during and after the period for which information was requested in conducting its evaluation of the Manager and Sub-Adviser.
Provided below is an overview of certain material factors that the Board considered at its meetings regarding the renewal of the Contracts and the compensation to be paid thereunder. The Board members did not identify any particular information or factor that was most relevant to its consideration.
Nature, Extent and Quality of Services
The Manager oversees, subject to the authority of the Board, and is responsible for the provision of, all investment advisory and portfolio management services for the Portfolios, but may delegate certain of these
35
ADVISORY AND SUB-ADVISORY CONTRACT APPROVAL DISCUSSION (UNAUDITED) (CONTINUED)
responsibilities to one or more sub-advisers. In addition, the Manager provides administrative services reasonably necessary for the operation of the Portfolios as set forth in the Management Contracts, including oversight of the Portfolios’ operations and risk management and the oversight of their various other service providers.
The Board considered the “manager-of-managers” structure of the Voya funds that has been developed by the Manager pursuant to which the Manager selects, subject to the Board’s approval, sub-advisers to provide day-to-day management services to all or a portion of each Voya fund. The Board recognized that the Manager is responsible for monitoring the Sub-Adviser’s investment program, performance, developments, ongoing operations, and compliance with applicable regulations and investment policies and restrictions with respect to the Portfolios under this manager-of-managers arrangement. The Board also considered the techniques and resources that the Manager has developed to provide this ongoing due diligence and oversight with respect to the sub-advisers and to recommend appropriate changes in investment strategies, sub-advisers, or allocation among sub-advisers in an effort to improve a Voya fund’s performance. In connection with the Manager’s performance of these duties, the Board considered that the Manager has developed an oversight process formulated by its Manager Research & Selection Group that reviews, among other matters, performance data, the Sub-Adviser’s management team, portfolio data and attribution analysis related to the Sub-Adviser through various means, including, but not limited to, in-person meetings, on-site or virtual visits, and telephonic meetings with the Sub-Adviser.
Further, the Board considered periodic compliance reports it receives from the Company’s Chief Compliance Officer evaluating, among other related matters, whether the regulatory compliance systems and procedures of the Manager and Sub-Adviser are reasonably designed to ensure compliance with the federal securities laws and whether the investment policies and restrictions for each Portfolio are complied with on a consistent basis.
The Board considered the portfolio management team assigned by the Sub-Adviser to the Portfolios and the level of resources committed to the Portfolios (and other relevant funds in the Voya funds) by the Manager and Sub-Adviser, and whether those resources are sufficient to provide high-quality services to the Portfolios.
Based on their deliberations and the materials presented to them, the Board concluded that the nature, extent and quality of the overall services provided by the Manager and Sub-Adviser under the Contracts were appropriate.
Portfolio Performance
In assessing the investment management and sub-advisory relationships, the Board placed emphasis on the investment returns of each Portfolio, including its investment performance over certain time periods compared to the Portfolio’s Morningstar category and primary benchmark, a broad-based securities market index identified in the Portfolio’s prospectus. The Board also considered information from the Manager Research & Selection Group and received reports summarizing a separate analysis of each Portfolio’s performance and risk, including risk-adjusted investment return information, from the Company’s Chief Investment Risk Officer.
Economies of Scale
When evaluating the reasonableness of the management fee schedules, the Board considered whether economies of scale have been or likely will be realized by the Manager and the Sub-Adviser as a Portfolio grows larger and the extent to which any such economies are shared with the Portfolio. The Board considered that, while the Portfolios do not have management fee breakpoints, they have fee waiver and expense reimbursement arrangements. The Board considered the extent to which economies of scale realized by the Manager could be shared with each Portfolio through such fee waivers, expense reimbursements or other expense reductions. In evaluating these matters, the Board also considered periodic management reports, Selected Peer Group comparisons, and industry information regarding economies of scale.
Information Regarding Services, Performance, and Fee Schedules Offered to Other Clients
The Board considered comparative information regarding the nature of services, performance, and fee schedules offered by the Manager and Sub-Adviser to other clients with similar investment objectives, if applicable, including other registered investment companies and relevant institutional accounts. When the fee schedules offered to or the performance of such other clients differed materially from a Portfolio, the Board took into account the underlying rationale provided by the Manager or Sub-Adviser, as applicable, for these differences.
Fee Schedules, Profitability, and Fall-out Benefits
The Board reviewed and considered the contractual management fee schedule and net management fee rate payable by each Portfolio to the Manager compared to the Portfolio’s Selected Peer Group. The Board also considered the compensation payable by the Manager to the Sub-Adviser for sub-advisory services for each Portfolio, including the portion of the contractual and net management fee rates that are paid to the Sub-Adviser, as compared to the compensation paid to the Manager. In
36
ADVISORY AND SUB-ADVISORY CONTRACT APPROVAL DISCUSSION (UNAUDITED) (CONTINUED)
addition, the Board considered the fee waivers, expense limitations, and recoupment arrangements that apply to the fees payable by the Portfolios, including whether the Manager intends to propose any changes thereto. For each Portfolio, the Board separately determined that the fees payable to the Manager and the fee schedule payable to the Sub-Adviser are reasonable for the services that each performs, which were considered in light of the nature, extent and quality of the services that each has performed and is expected to perform.
For each Portfolio, the Board considered information on revenues, costs and profits or losses realized by the Manager and the Voya-affiliated Sub-Adviser related to their services to the Portfolio. In analyzing the profitability of the Manager and its affiliates in connection with services they render to a Portfolio, the Board took into account the sub-advisory fee rate payable by the Manager to the Sub-Adviser. The Board also considered the profitability of the Manager and its affiliated Sub-Adviser attributable to servicing each Portfolio both with and without taking into account the profitability of the distributor of the Portfolios and any revenue sharing payments made by the Manager and both before and after giving effect to any expenses incurred by the Manager.
Although the Methodology Guide establishes a framework for profit calculation, the Board recognized that there is no uniform methodology within the asset management industry for determining profitability for this purpose. The Board also recognized that the use of different reasonable methodologies can give rise to dramatically different reported profit and loss results with respect to the Manager and the Voya-affiliated Sub-Adviser, as well as other industry participants with whom the profits of the Manager and its affiliated Sub-Adviser could be compared. In addition, the Board recognized that management’s calculations regarding its costs incurred in establishing the infrastructure necessary for the Portfolios’ operations may not be fully reflected in the expenses allocated to each Portfolio in determining profitability. The Board also recognized that the information presented may not portray all of the costs borne by the Manager or reflect all of the risks associated with offering and managing a mutual fund complex in the current regulatory and market environment, including entrepreneurial, regulatory, legal and operational risks.
The Board also considered that the Manager and the Voya-affiliated Sub-Adviser are entitled to earn a reasonable level of profits for the services that they provide to the Portfolios. The Board also considered information regarding the potential fall-out benefits to the Manager and Sub-Adviser and their respective affiliates from their association with the Portfolios, including their ability to engage in soft-dollar transactions on behalf of the
Portfolios. Following its reviews, the Board determined that the Manager’s and the Voya-affiliated Sub-Adviser’s profitability with respect to their services to the Portfolios and the Manager and Sub-Adviser’s potential fall-out benefits were not unreasonable.
Portfolio-by-Portfolio Analysis
Set forth below are certain of the specific factors that the Board considered at its October 12-13, 2022, November 15, 2022, and/or November 17, 2022 meetings in relation to approving each Portfolio’s Contracts and the conclusions reached by the Board. These specific factors are in addition to those considerations discussed above. In each case, the Portfolio’s performance was compared to its Morningstar category, as well as its primary benchmark. The performance data provided to the Board primarily was for various periods ended March 31, 2022. In addition, the Board also considered at its October 12-13, 2022, November 15, 2022, and/or November 17, 2022 meetings certain additional data regarding each Portfolio’s more recent performance, asset levels and asset flows. Each Portfolio’s management fee rate and expense ratio were compared to the management fee rates and expense ratios of the funds in its Selected Peer Group. With respect to the quintile rankings noted below, the first quintile represents the range of funds with the highest performance or the lowest management fee rate or expense ratio, as applicable, and the fifth quintile represents the range of funds with the lowest performance or the highest management fee rate or expense ratio, as applicable.
Voya Strategic Allocation Conservative Portfolio
In considering whether to approve the renewal of the Contracts for Voya Strategic Allocation Conservative Portfolio, the Board considered that, based on performance data for the periods ended March 31, 2022: (1) the Portfolio is ranked in the first quintile of its Morningstar category for the ten-year period, third quintile for the one-year, three-year and five-year periods, and the fifth quintile for the year-to-date period; and (2) the Portfolio outperformed its primary benchmark for all periods presented, with the exception of the year-to-date period, during which it underperformed.
In considering the fees payable under the Contracts for the Portfolio, the Board took into account the factors described above and also considered: (1) the fairness of the compensation under a Management Contract with a level fee rate that does not include breakpoints; and (2) the pricing structure (including the net expense ratio to be borne by shareholders) of the Portfolio, as compared to its Selected Peer Group, including that: (a) the net management fee rate for the Portfolio is ranked in the third quintile of net management fee rates of the funds in its Selected Peer Group; (b) the contractual management fee
37
ADVISORY AND SUB-ADVISORY CONTRACT APPROVAL DISCUSSION (UNAUDITED) (CONTINUED)
rate for the Portfolio is ranked in the fourth quintile of contractual management fee rates of the funds in its Selected Peer Group; and (c) the all-in net expense ratio for the Portfolio, inclusive of the Acquired Fund Fees and Expenses (“AFFE”), is ranked in the second quintile of all-in net expense ratios of the funds in its Selected Peer Group, and the net expense ratio for the Portfolio, not inclusive of AFFE, is above the median of net expense ratios of the funds in its Selected Peer Group. In analyzing this fee data, the Board took into account: (1) that, as reflected in the AFFE, the Portfolio indirectly bears the fees payable by the underlying funds in which the Portfolio invests; and (2) management’s representations regarding the competitiveness of the Portfolio’s management fee rate and all-in net expense ratio.
Voya Strategic Allocation Growth Portfolio
In considering whether to approve the renewal of the Contracts for Voya Strategic Allocation Growth Portfolio, the Board considered that, based on performance data for the periods ended March 31, 2022: (1) the Portfolio is ranked in the second quintile of its Morningstar category for the three-year and ten-year periods, the third quintile for the one-year and five-year periods, and the fourth quintile for the year-to-date period; and (2) the Portfolio underperformed its primary benchmark for all periods presented. In analyzing this performance data, the Board took into account management’s representations regarding the competitiveness of the Portfolio’s performance during certain periods.
In considering the fees payable under the Contracts for the Portfolio, the Board took into account the factors described above and also considered: (1) the fairness of the compensation under a Management Contract with a level fee rate that does not include breakpoints; and (2) the pricing structure (including the net expense ratio to be borne by shareholders) of the Portfolio, as compared to its Selected Peer Group, including that: (a) the net management fee rate for the Portfolio is ranked in the fifth quintile of net management fee rates of the funds in its Selected Peer Group; (b) the contractual management fee rate for the Portfolio is ranked in the fourth quintile of contractual management fee rates of the funds in its Selected Peer Group; and (c) the all-in net expense ratio for the Portfolio, inclusive of the Acquired Fund Fees and Expenses (“AFFE”), is ranked in the second quintile of all-in net expense ratios of the funds in its Selected Peer Group, and the net expense ratio for the Portfolio, not inclusive of AFFE, is above the median of net expense ratios of the funds in its Selected Peer Group. In analyzing this fee data, the Board took into account: (1) that, as reflected in the AFFE, the Portfolio indirectly bears the fees payable by the underlying funds in which the Portfolio invests; and
(2) management’s representations regarding the competitiveness of the Portfolio’s all-in net expense ratio.
Voya Strategic Allocation Moderate Portfolio
In considering whether to approve the renewal of the Contracts for Voya Strategic Allocation Moderate Portfolio, the Board considered that, based on performance data for the periods ended March 31, 2022: (1) the Portfolio is ranked in the third quintile of its Morningstar category for the one-year, three-year, five-year and ten-year periods, and the fifth quintile for the year-to-date period; and (2) the Portfolio underperformed its primary benchmark for all periods presented. In analyzing this performance data, the Board took into account management’s representations regarding the competitiveness of the Portfolio’s performance during certain periods.
In considering the fees payable under the Contracts for the Portfolio, the Board took into account the factors described above and also considered: (1) the fairness of the compensation under a Management Contract with a level fee rate that does not include breakpoints; and (2) the pricing structure (including the net expense ratio to be borne by shareholders) of the Portfolio, as compared to its Selected Peer Group, including that: (a) the net management fee rate for the Portfolio is ranked in the fifth quintile of net management fee rates of the funds in its Selected Peer Group; (b) the contractual management fee rate for the Portfolio is ranked in the fourth quintile of contractual management fee rates of the funds in its Selected Peer Group; and (c) the all-in net expense ratio for the Portfolio, inclusive of the Acquired Fund Fees and Expenses (“AFFE”), is ranked in the second quintile of all-in net expense ratios of the funds in its Selected Peer Group, and the net expense ratio for the Portfolio, not inclusive of AFFE, is above the median of net expense ratios of the funds in its Selected Peer Group. In analyzing this fee data, the Board took into account: (1) that, as reflected in the AFFE, the Portfolio indirectly bears the fees payable by the underlying funds in which the Portfolio invests; and (2) management’s representations regarding the competitiveness of the Portfolio’s management fee rate and all-in net expense ratio.
Board Conclusions
After its deliberation, the Board concluded that, in its business judgment, the terms of the Contracts are fair and reasonable to each Portfolio and that approval of the continuation of the Contracts is in the best interests of each Portfolio and its shareholders. In doing so, the Board reviewed all factors it considered to be material, including those discussed above. Within the context of its overall conclusions regarding the Contracts, and based on the information provided and management’s related representations, the Board concluded that it was satisfied
38
ADVISORY AND SUB-ADVISORY CONTRACT APPROVAL DISCUSSION (UNAUDITED) (CONTINUED)
with management’s responses relating to each Portfolio’s investment performance and the fees payable under the Contracts. During this renewal process, each Board member may have accorded different weight to various factors in reaching his or her conclusions. Based on these conclusions and other factors, the Board voted to renew the Contracts for each Portfolio for the year ending November 30, 2023.
39
Investment Adviser
Voya Investments, LLC
7337 East Doubletree Ranch Road, Suite 100
Scottsdale, Arizona 85258
Distributor
Voya Investments Distributor, LLC
7337 East Doubletree Ranch Road, Suite 100
Scottsdale, Arizona 85258
Transfer Agent
BNY Mellon Investment Servicing (U.S.) Inc.
301 Bellevue Parkway
Wilmington, Delaware 19809
Independent Registered Public Accounting Firm
Ernst & Young LLP
200 Clarendon Street
Boston, Massachusetts 02116
Custodian
The Bank of New York Mellon
225 Liberty Street
New York, New York 10286
Legal Counsel
Ropes & Gray LLP
Prudential Tower
800 Boylston Street
Boston, Massachusetts 02199
Before investing, carefully consider the investment objectives, risks, charges and expenses of the variable annuity contract or variable life insurance policy and the underlying variable investment options. This and other information is contained in the prospectus for the variable annuity contract or variable life insurance policy and the underlying variable investment options. Obtain these prospectuses from your agent/registered representative and read them carefully before investing.
| | | |
RETIREMENT | INVESTMENTS | INSURANCE voyainvestments.com
| |
VPAR-SAIS (1222-021623) |
(b) Not applicable.
Item 2. Code of Ethics.
As of the end of the period covered by this report, Registrant had adopted a code of ethics, as defined in Item 2 of Form N-CSR, that applies to the Registrant’s principal executive officer and principal financial officer. There were no amendments to the Code during the period covered by the report. The Registrant did not grant any waivers, including implicit waivers, from any provisions of the Code during the period covered by this report. The code of ethics is filed herewith pursuant to Item 13(a)(1), Ex-99.CODE ETH.
Item 3. Audit Committee Financial Expert.
The Board of Trustees has determined that Colleen D. Baldwin, Martin J. Gavin, and Joseph E. Obermeyer are audit committee financial experts, as defined in Item 3 of Form N-CSR. Ms. Baldwin, Mr. Gavin, and Mr. Obermeyer are “independent” for purposes of Item 3 of Form N-CSR.
Item 4. Principal Accountant Fees and Services.
Below are the amount of fees that Ernst & Young LLP (“EY”), the Registrant’s current Independent Registered Public Accounting Firm, billed and paid to the Fund during the Fund’s fiscal year ended December 31, 2022 and December 31, 2021.
| (a) | Audit Fees: The aggregate fees billed and paid for each of the last two fiscal years for professional services rendered by EY, the principal accountant for the audit of the registrant’s annual financial statements or services that are normally provided by the accountant in connection with statutory and regulatory filings or engagements for those fiscal years were $54,000 for the year ended December 31, 2022 and $54,000 for the year ended December 31, 2021. |
| (b) | Audit-Related Fees: The aggregate fees billed and paid in each of the last two fiscal years for assurance and related services by EY that are reasonably related to the performance of each respective audit of the registrant’s financial statements and are not reported under paragraph (a) of this Item were $0 for the year ended December 31, 2022 and $0 for the year ended December 31, 2021. |
| (c) | Tax Fees: The aggregate fees billed and paid in each of the last two fiscal years for professional services rendered by EY for tax compliance, tax advice, and tax planning were $10,500 for the year ended December 31, 2022 and $10,500 for the year ended December 31, 2021. Such services included review of excise distribution calculations (if applicable), preparation of the Registrants’ federal, state, and excise tax returns, tax services related to mergers and routine consulting. |
| (d) | All Other Fees: The aggregate fees billed and paid in each of the last two fiscal years for products and services provided by EY, other than the services reported in paragraphs (a) through (c) of this Item were $0 for the year ended December 31, 2022 and $0 for the year ended December 31, 2021. |
| | |
| (e)(1) | Audit Committee Pre-Approval Policies and Procedures |
Appendix A
AUDIT AND NON-AUDIT SERVICES
PRE-APPROVAL POLICY
| I. | Statement of Principles |
Under the Sarbanes-Oxley Act of 2002 (the “Act”), the Audit Committee of the Board of Directors or Trustees (the “Committee”) of the Voya funds (each a “Fund,” collectively, the “Funds”) set out on Exhibit A to this Audit and Non-Audit Services Pre-Approval Policy (“Policy”) is responsible for the oversight of the work of the Funds’ independent auditors. As part of its responsibilities, the Committee must pre-approve the audit and non-audit services performed by the auditors in order to assure that the provision of these services does not impair the auditors’ independence from the Funds. The Committee has adopted, and the Board has ratified, this Policy, which sets out the procedures and conditions under which the services of the independent auditors may be pre-approved.
Under Securities and Exchange Commission (“SEC”) rules promulgated in accordance with the Act, the Funds may establish two different approaches to pre-approving audit and non-audit services. The Committee may approve services without consideration of specific case-by-case services (“general pre-approval”) or it may pre-approve specific services (“specific pre-approval”). The Committee believes that the combination of these approaches contemplated in this Policy results in an effective and efficient method for pre-approving audit and non-audit services to be performed by the Funds’ independent auditors. Under this Policy, services that are not of a type that may receive general pre-approval require specific pre-approval by the Committee. Any proposed services that exceed pre-approved cost levels or budgeted amounts will also require the Committee’s specific pre-approval.
For both types of approval, the Committee considers whether the subject services are consistent with the SEC’s rules on auditor independence and that such services are compatible with maintaining the auditors independence. The Committee also considers whether a particular audit firm is in the best position to provide effective and efficient services to the Funds. Reasons that the auditors are in the best position include the auditors’ familiarity with the Funds’ business, personnel, culture, accounting systems, risk profile, and other factors, and whether the services will enhance the Funds’ ability to manage and control risk or improve audit quality. Such factors will be considered as a whole, with no one factor being determinative.
The appendices attached to this Policy describe the audit, audit-related, tax-related, and other services that have the Committee’s general pre-approval. For any service that has been approved through general pre-approval, the general pre-approval will remain in place for a period 12 months from the date of pre-approval, unless the Committee determines that a different period is appropriate. The Committee will annually review and pre-approve the services that may be provided by the independent auditors without specific pre-approval. The Committee will revise the list of services subject to general pre-approval as appropriate. This Policy does not serve as a delegation to Fund management of the Committee’s duty to pre-approve services performed by the Funds’ independent auditors.
The annual audit services engagement terms and fees are subject to the Committee’s specific pre-approval. Audit services are those services that are normally provided by auditors in connection with statutory and regulatory filings or engagements or those that generally only independent auditors can reasonably provide. They include the Funds’ annual financial statement audit and procedures that the independent auditors must perform in order to form an opinion on the Funds’ financial statements (e.g., information systems and procedural reviews and testing). The Committee will monitor the audit services engagement and approve any changes in terms, conditions or fees deemed by the Committee to be necessary or appropriate.
The Committee may grant general pre-approval to other audit services, such as statutory audits and services associated with SEC registration statements, periodic reports and other documents filed with the SEC or issued in connection with securities offerings.
The Committee has pre-approved the audit services listed on Appendix A. The Committee must specifically approve all audit services not listed on Appendix A.
| III. | Audit-related Services |
Audit-related services are assurance and related services that are reasonably related to the performance of the audit or the review of the Funds’ financial statements or are traditionally performed by the independent auditors. The Committee believes that the provision of audit-related services will not impair the independent auditors’ independence, and therefore may grant pre-approval to audit-related services. Audit-related services include accounting consultations related to accounting, financial reporting or disclosure matters not classified as “audit services;” assistance with understanding and implementing new accounting and financial reporting guidance from rulemaking authorities; agreed-upon or expanded audit procedures relating to accounting and/or billing records required to respond to or comply with financial, accounting or regulatory reporting matters; and assistance with internal control reporting requirements under Form N-CEN or Form N-CSR.
The Committee has pre-approved the audit-related services listed on Appendix B. The Committee must specifically approve all audit-related services not listed on Appendix B.
The Committee believes the independent auditors can provide tax services to the Funds, including tax compliance, tax planning, and tax advice, without compromising the auditors’ independence. Therefore, the Committee may grant general pre-approval with respect to tax services historically provided by the Funds’ independent auditors that do not, in the Committee’s view, impair auditor independence and that are consistent with the SEC’s rules on auditor independence.
The Committee will not grant pre-approval if the independent auditors initially recommends a transaction the sole business purpose of which is tax avoidance and the tax treatment of which may not be supported in the Internal Revenue Code and related regulations. The Committee may consult outside counsel to determine that tax planning and reporting positions are consistent with this Policy.
The Committee has pre-approved the tax-related services listed on Appendix C. The Committee must specifically approve all tax-related services not listed on Appendix C.
The Committee believes it may grant approval of non-audit services that are permissible services for independent auditors to a Fund. The Committee has determined to grant general pre-approval to other services that it believes are routine and recurring, do not impair auditor independence, and are consistent with SEC rules on auditor independence.
The Committee has pre-approved the non-audit services listed on Appendix D. The Committee must specifically approve all non-audit services not listed on Appendix D.
A list of the SEC’s prohibited non-audit services is attached to this Policy as Appendix E. The SEC’s rules and relevant guidance should be consulted to determine the precise definitions of these impermissible services and the applicability of exceptions to certain of the SEC’s prohibitions.
| VI. | Pre-approval of Fee levels and Budgeted Amounts |
The Committee will annually establish pre-approval fee levels or budgeted amounts for audit, audit-related, tax and non-audit services to be provided to the Funds by the independent auditors. Any proposed services exceeding these levels or amounts require the Committee’s specific pre-approval. The Committee considers fees for audit and non-audit services when deciding whether to pre-approve services. The Committee may determine, for a pre-approval period of 12 months, the appropriate ratio between the total amount of fees for the Fund’s audit, audit-related, and tax services (including fees for services provided to Fund affiliates that are subject to pre-approval), and the total amount of fees for certain permissible non-audit services for the Fund classified as other services (including any such services provided to Fund affiliates that are subject to pre-approval).
Requests or applications for services to be provided by the independent auditors will be submitted to management. If management determines that the services do not fall within those services generally pre-approved by the Committee and set out in the appendices to these procedures, management will submit the services to the Committee or its delagee. Any such submission will include a detailed description of the services to be rendered. Notwithstanding this paragraph, the Committee will, on a quarterly basis, receive from the independent auditors a list of services provided for the previous calendar quarter on a cumulative basis by the auditors during the Pre-Approval Period.
The Committee may delegate pre-approval authority to one or more of the Committee’s members. Any member or members to whom such pre-approval authority is delegated must report any pre-approval decisions, including any pre-approved services, to the Committee at its next scheduled meeting. The Committee will identify any member to whom pre-approval authority is delegated in writing. The member will retain such authority for a period of 12 months from the date of pre-approval unless the Committee determines that a different period is appropriate. The period of delegated authority may be terminated by the Committee or at the option of the member.
| IX. | Additional Requirements |
The Committee will take any measures the Committee deems necessary or appropriate to oversee the work of the independent auditors and to assure the auditors’ independence from the Funds. This may include reviewing a formal written statement from the independent auditors delineating all relationships between the auditors and the Funds, consistent with Independence Standards Board No. 1, and discussing with the auditors their methods and procedures for ensuring independence.
Last Approved: November 18, 2021
Appendix A
Pre-Approved Audit Services for the Pre-Approval Period January 1, 2022 through December 31, 2022
| Service |
| | The Fund(s) | Fee Range |
| Statutory audits or financial audits (including tax services associated with audit services) | √ | As presented to Audit Committee1 |
| Services associated with SEC registration statements, periodic reports and other documents filed with the SEC or other documents issued in connection with securities offerings (e.g., consents), and assistance in responding to SEC comment letters. | √ | Not to exceed $9,750 per filing |
| Consultations by Fund management with respect to accounting or disclosure treatment of transactions or events and/or the actual or potential effect of final or proposed rules, standards or interpretations by the SEC, Financial Accounting Standards Board, or other regulatory or standard setting bodies. | √ | Not to exceed $8,000 during the Pre-Approval Period |
| Seed capital audit and related review and issuance of consent on the N-2 registration statement | √ | Not to exceed $14,750 per audit |
| Audit of summary portfolio of investments | √ | Not to exceed $750 per fund |
| 1 | For new Funds launched during the Pre-Approval Period, the fee ranges pre-approved will be the same as those for existing Funds, pro-rated in accordance with inception dates as provided in the auditors’ Proposal or any Engagement Letter covering the period at issue. Fees in the Engagement Letter will be controlling. |
Appendix B
Pre-Approved Audit-Related Services for the Pre-Approval Period January 1, 2022 through December 31, 2022
| Service |
| | The Fund(s) | Fund Affiliates | Fee Range |
| Services related to Fund mergers (Excludes tax services - See Appendix C for tax services associated with Fund mergers) | √ | √ | Not to exceed $10,000 per merger |
| Consultations by Fund management with respect to accounting or disclosure treatment of transactions or events and/or the actual or potential effect of final or proposed rules, standards or interpretations by the SEC, Financial Accounting Standards Board, or other regulatory or standard setting bodies. [Note: Under SEC rules some consultations may be “audit” services and others may be “audit-related” services.] | √ | | Not to exceed $5,000 per occurrence during the Pre-Approval Period |
| Review of the Funds’ semi-annual and quarterly financial statements | √ | | Not to exceed $2,700 per set of financial statements per fund |
| Reports to regulatory or government agencies related to the annual engagement | √ | | Up to $5,000 per occurrence during the Pre-Approval Period |
| Regulatory compliance assistance | √ | √ | Not to exceed $5,000 per quarter |
| Training courses | | √ | Not to exceed $5,000 per course |
Appendix C
Pre-Approved Tax Services for the Pre-Approval Period January 1, 2022 through December 31, 2022
| Service |
| | The Fund(s) | Fund Affiliates | Fee Range |
| Preparation of federal and state income tax returns and federal excise tax returns for the Funds including assistance and review with excise tax distributions | √ | | As presented to Audit Committee2 |
| Review of IRC Sections 851(b) and 817(h) diversification testing on a real-time basis | √ | | As presented to Audit Committee2 |
| Tax assistance and advice regarding statutory, regulatory or administrative developments | √ | √ | Not to exceed $5,000 for the Funds or for the Funds’ investment adviser during the Pre-Approval Period |
| 2 | For new Funds launched during the Pre-Approval Period, the fee ranges pre-approved will be the same as those for existing Funds, pro-rated in accordance with inception dates as provided in the auditors’ Proposal or any Engagement Letter covering the period at issue. Fees in the Engagement Letter will be controlling. |
Appendix C, continued Pre-Approved Tax Services for the Pre-Approval Period January 1, 2022 through December 31, 2022
| Service |
| | The Fund(s) | Fund Affiliates | Fee Range |
| Tax and technology training sessions | | √ | Not to exceed $5,000 per course during the Pre-Approval Period |
| Tax services associated with Fund mergers | √ | √ | Not to exceed $4,000 per fund per merger during the Pre-Approval Period |
| Ernst & Young LLP Passive Foreign Investment Company (“PFIC”) Analyzer | | √ | Not to exceed $95,000 during the Pre-Approval Period |
| Other tax-related assistance and consultation, including, without limitation, assistance in evaluating derivative financial instruments and international tax issues, qualification and distribution issues, year-end reporting for 1099’s, tax compliance services in foreign jurisdictions and similar routine tax consultations as requested. | √ | | Not to exceed $300,000 during the Pre-Approval Period |
Appendix D
Pre-Approved Other Services for the Pre-Approval Period January 1, 2022 through December 31, 2022
| Service |
| | The Fund(s) | Fund Affiliates | Fee Range |
| Agreed-upon procedures for Class B share 12b-1 programs | | √ | Not to exceed $60,000 during the Pre-Approval Period |
Security counts performed pursuant to Rule 17f-2 of the 1940 Act (i.e., counts for Funds holding securities with affiliated sub-custodians) Cost to be borne 50% by the Funds and 50% by Voya Investments, LLC. | √ | √ | Not to exceed $5,700 per Fund during the Pre-Approval Period |
| Agreed upon procedures for 15 (c) FACT Books | √ | | Not to exceed $50,000 during the Pre-Approval Period |
Appendix E
Prohibited Non-Audit Services
Dated: January 1, 2022 to December 31, 2022
| ● | Bookkeeping or other services related to the accounting records or financial statements of the Funds |
| ● | Financial information systems design and implementation |
| ● | Appraisal or valuation services, fairness opinions, or contribution-in-kind reports |
| ● | Internal audit outsourcing services |
| ● | Broker-dealer, investment adviser, or investment banking services |
| ● | Expert services unrelated to the audit |
| ● | Any other service that the Public Company Accounting Oversight Board determines, by regulation, is impermissible |
EXHIBIT A
VOYA ASIA PACIFIC HIGH DIVIDEND EQUITY INCOME FUND
VOYA BALANCED PORTFOLIO, INC.
VOYA EMERGING MARKETS HIGH DIVIDEND EQUITY FUND
VOYA EQUITY TRUST
VOYA FUNDS TRUST
VOYA GLOBAL ADVANTAGE AND PREMIUM OPPORTUNITY FUND
VOYA GLOBAL EQUITY DIVIDEND AND PREMIUM OPPORTUNITY FUND
VOYA INFRASTRUCTURE, INDUSTRIALS, AND MATERIALS FUND
VOYA INTERMEDIATE BOND PORTFOLIO
VOYA INVESTORS TRUST
VOYA GOVERNMENT MONEY MARKET PORTFOLIO
VOYA MUTUAL FUNDS
VOYA PARTNERS, INC.
VOYA CREDIT INCOME FUND
VOYA SEPARATE PORTFOLIOS TRUST
VOYA STRATEGIC ALLOCATIONS PORTFOLIOS, INC.
VOYA VARIABLE FUNDS
VOYA VARIABLE INSURANCE TRUST
VOYA VARIABLE PORTFOLIOS INC,
VOYA VARIABLE PRODUCTS TRUST
| (e)(2) | Percentage of services referred to in 4(b) – (4)(d) that were approved by the audit committee |
100% of the services were approved by the audit committee.
| (f) | Percentage of hours expended attributable to work performed by other than full time employees of EY if greater than 50% |
Not applicable.
| (g) | Non-Audit Fees: The following table presents (i) the aggregate non-audit fees (i.e., fees for audit-related, tax, and other services) billed and paid to the Registrant by the independent registered public accounting firm for the Registrant’s fiscal years ended December 31, 2022 and December 31, 2021; and (ii) the aggregate non-audit fees billed to the investment adviser, or any of its affiliates that provide ongoing services to the registrant, by the independent registered public accounting firm for the same time periods. |
| Registrant/Investment Adviser | | 2022 | | 2021 |
Voya Strategic Allocation Portfolios, Inc. | | $ | 10,500 | | $ | 10,500 |
| Voya Investments, LLC (1) | | $ | 12,831,317 | | $ | 13,583,983 |
__________________________________
(1) The Registrant’s investment adviser and any of its affiliates, which are subsidiaries of Voya Financial, Inc.
| (h) | Principal Accountants Independence: The Registrant’s Audit committee has considered whether the provision of non-audit services that were rendered to the registrant’s investment adviser and any entity controlling, controlled by, or under common control with the investment adviser that provides ongoing services to the registrant that were not pre-approved pursuant to Rule 2-01(c)(7)(ii) of Regulation S-X is compatible with maintaining EY’s independence. |
| (i) | Not applicable. |
| | |
| (j) | Not applicable. |
Item 5. Audit Committee of Listed Registrants.
Not applicable.
Item 6. Schedule of Investments.
| (a) | Schedule is included as part of the report to shareholders filed under Item 1 of this Form. |
| | |
| (b) | Not applicable. |
Item 7. Disclosure of Proxy Voting Policies and Procedures for Closed-End Management Investment Companies.
Not applicable.
Item 8. Portfolio Managers of Closed-End Management Investment Companies.
Not applicable.
Item 9. Purchases of Equity Securities by Closed-End Management Investment Company and Affiliated Purchasers.
Not applicable.
Item 10. Submission of Matters to a Vote of Security Holders.
Not applicable.
Item 11. Controls and Procedures.
| (a) | Based on our evaluation conducted within 90 days of the filing date, hereof, the design and operation of the registrant’s disclosure controls and procedures are effective to ensure that material information relating to the registrant is made known to the certifying officers by others within the appropriate entities, particularly during the period in which Forms N-CSR are being prepared, and the registrant’s disclosure controls and procedures allow timely preparation and review of the information for the registrant’s Form N-CSR and the officer certifications of such Form N-CSR. |
| (b) | There were no significant changes in the registrant’s internal controls that occurred during the second fiscal quarter of the period covered by this report that has materially affected, or is reasonably likely to materially affect, the registrant’s internal control over financial reporting. |
Item 12. Disclosure of Securities Lending Activities for Closed-End Management Investment Companies.
Not applicable
Item 13. Exhibits.
SIGNATURES
Pursuant to the requirements of the Securities Exchange Act of 1934 and the Investment Company Act of 1940, the registrant has duly caused this report to be signed on its behalf by the undersigned, thereunto duly authorized.
(Registrant): Voya Strategic Allocation Portfolios, Inc.
| By | /s/ Andy Simonoff | |
| | Andy Simonoff | |
| | Chief Executive Officer | |
Date: March 8, 2023
Pursuant to the requirements of the Securities Exchange Act of 1934 and the Investment Company Act of 1940, this report has been signed below by the following persons on behalf of the registrant and in the capacities and on the dates indicated.
| By | / s/ Andy Simonoff | |
| | Andy Simonoff | |
| | Chief Executive Officer | |
| | | |
| Date: March 8, 2023 | |
| | | |
| By | /s/ Todd Modic | |
| | Todd Modic | |
| | Senior Vice President and Chief Financial Officer | |
Date: March 8, 2023