Semi-Annual Financial Statements and Other Information
June 30, 2024
Classes I and S
Strategic Allocation Funds-of-Funds
g Voya Strategic Allocation Conservative Portfolio
g Voya Strategic Allocation Moderate Portfolio
g Voya Strategic Allocation Growth Portfolio
This report is submitted for general information to shareholders of the Voya mutual funds. It is not authorized for distribution to prospective shareholders unless accompanied or preceded by a prospectus which includes details regarding the funds’ investment objectives, risks, charges, expenses and other information. This information should be read carefully.
| |  | E-Delivery Sign-up – details inside |
INVESTMENT MANAGEMENT voyainvestments.com |  |
TABLE OF CONTENTS
| | Go Paperless with E-Delivery! | |
| | | |
| Sign up now for on-line prospectuses, tailored shareholder reports, and proxy statements. |
| |
| Just go to individuals.voya.com/page/e-delivery, follow the directions and complete the quick 5 Steps to Enroll. |
| |
| You will be notified by e-mail when these communications become available on the internet. |
PROXY VOTING INFORMATION
A description of the policies and procedures that the Portfolios use to determine how to vote proxies related to portfolio securities is available: (1) without charge, upon request, by calling Shareholder Services toll-free at (800) 992-0180; (2) on the Portfolios’ website at www.voyainvestments.com; and (3) on the U.S. Securities and Exchange Commission’s (“SEC’s”) website at www.sec.gov. Information regarding how the Portfolios voted proxies related to portfolio securities during the most recent 12-month period ended June 30 is available without charge on the Portfolios’ website at www. voyainvestments.com and on the SEC’s website at www.sec.gov.
QUARTERLY PORTFOLIO HOLDINGS
The Portfolios file their complete schedule of portfolio holdings with the SEC for the first and third quarters of each fiscal year on Form NPORT-P. The Portfolios’ Forms NPORT-P are available on the SEC’s website at www.sec.gov. Each Portfolio’s complete schedule of portfolio holdings is available at: https://individuals.voya.com/product/mutual-fund/ prospectuses-reports and without charge upon request from the Portfolio by calling Shareholder Services toll-free at (800) 992-0180.
STATEMENTS OF ASSETS AND LIABILITIES AS OF JUNE 30, 2024 (UNAUDITED)
| | | Voya Strategic
Allocation
Conservative
Portfolio | | | Voya Strategic
Allocation
Moderate
Portfolio | | | Voya Strategic
Allocation
Growth
Portfolio | |
| ASSETS: | | | | | | | | | | | | |
| Investments in affiliated underlying funds at fair value* | | $ | 55,300,265 | | | $ | 128,346,716 | | | $ | 143,441,375 | |
| Investments in unaffiliated underlying funds at fair value** | | | 2,851,038 | | | | 2,525,807 | | | | 2,793,096 | |
| Cash | | | 133,886 | | | | 183,052 | | | | 211,337 | |
| Receivables: | | | | | | | | | | | | |
| Fund shares sold | | | 35,944 | | | | 96,952 | | | | 69,169 | |
| Interest | | | 205 | | | | 303 | | | | – | |
| Prepaid expenses | | | 245 | | | | 501 | | | | 552 | |
| Reimbursement due from Investment Adviser | | | 25,733 | | | | 9,256 | | | | 11,272 | |
| Other assets | | | 7,136 | | | | 12,957 | | | | 12,692 | |
| Total assets | | | 58,354,452 | | | | 131,175,544 | | | | 146,539,493 | |
| LIABILITIES: | | | | | | | | | | | | |
| Payable for investments in affiliated underlying funds purchased | | | 35,499 | | | | 60,208 | | | | 8,056 | |
| Payable for fund shares redeemed | | | 393 | | | | 36,674 | | | | 61,066 | |
| Payable for investment management fees | | | 10,053 | | | | 66,879 | | | | 34,993 | |
| Payable for distribution and shareholder service fees | | | 676 | | | | 258 | | | | 493 | |
| Payable to directors under the deferred compensation plan (Note 6) | | | 7,136 | | | | 12,957 | | | | 12,692 | |
| Payable for directors fees | | | 70 | | | | 1,314 | | | | 397 | |
| Payable for shareholder notification costs (Note 6) | | | 48,666 | | | | 59,074 | | | | 58,609 | |
| Other accrued expenses and liabilities | | | 32,859 | | | | 62,999 | | | | 60,930 | |
| Total liabilities | | | 135,352 | | | | 300,363 | | | | 237,236 | |
| NET ASSETS | | $ | 58,219,100 | | | $ | 130,875,181 | | | $ | 146,302,257 | |
| NET ASSETS WERE COMPRISED OF: | | | | | | | | | | | | |
| Paid-in capital | | $ | 60,049,535 | | | $ | 124,686,021 | | | $ | 132,696,930 | |
| Total distributable earnings (loss) | | | (1,830,435 | ) | | | 6,189,160 | | | | 13,605,327 | |
| NET ASSETS | | $ | 58,219,100 | | | $ | 130,875,181 | | | $ | 146,302,257 | |
| * | Cost of investments in affiliated underlying funds | | $ | 52,294,716 | | | $ | 114,573,035 | | | $ | 122,958,472 | |
| ** | Cost of investments in unaffiliated underlying funds | | $ | 3,059,634 | | | $ | 2,656,353 | | | $ | 2,937,322 | |
| Class I |
| Net assets | | $ | 54,938,183 | | | $ | 129,620,253 | | | $ | 143,944,362 | |
| Shares authorized | | | 100,000,000 | | | | 100,000,000 | | | | 100,000,000 | |
| Par value | | $ | 0.001 | | | $ | 0.001 | | | $ | 0.001 | |
| Shares outstanding | | | 4,892,729 | | | | 10,145,886 | | | | 10,663,413 | |
| Net asset value and redemption price per share | | $ | 11.23 | | | $ | 12.78 | | | $ | 13.50 | |
| Class S |
| Net assets | | $ | 3,280,917 | | | $ | 1,254,928 | | | $ | 2,357,895 | |
| Shares authorized | | | 100,000,000 | | | | 100,000,000 | | | | 100,000,000 | |
| Par value | | $ | 0.001 | | | $ | 0.001 | | | $ | 0.001 | |
| Shares outstanding | | | 295,489 | | | | 98,731 | | | | 176,838 | |
| Net asset value and redemption price per share | | $ | 11.10 | | | $ | 12.71 | | | $ | 13.33 | |
See Accompanying Notes to Financial Statements
STATEMENTS OF OPERATIONS FOR THE SIX MONTHS ENDED JUNE 30, 2024 (UNAUDITED)
| | | Voya Strategic
Allocation
Conservative
Portfolio | | | Voya Strategic
Allocation
Moderate
Portfolio | | | Voya Strategic
Allocation
Growth
Portfolio | |
| INVESTMENT INCOME: | | | | | | | | | | | | |
| Dividends from affiliated underlying funds | | $ | 709,603 | | | $ | 979,992 | | | $ | 529,174 | |
| Dividends from unaffiliated underlying funds | | | 37,694 | | | | 41,691 | | | | 46,085 | |
| Interest | | | 1,374 | | | | 3,547 | | | | 179 | |
| Other | | | 180 | | | | 395 | | | | 437 | |
| Total investment income | | | 748,851 | | | | 1,025,625 | | | | 575,875 | |
| EXPENSES: | | | | | | | | | | | | |
| Investment management fees | | | 54,869 | | | | 116,995 | | | | 130,041 | |
| Distribution and shareholder service fees: | | | | | | | | | | | | |
| Class S | | | 4,176 | | | | 1,538 | | | | 2,941 | |
| Transfer agent fees: | | | | | | | | | | | | |
| Class I | | | 26,591 | | | | 55,210 | | | | 67,703 | |
| Class S | | | 1,644 | | | | 541 | | | | 1,148 | |
| Shareholder reporting expense | | | 3,568 | | | | 3,608 | | | | 4,078 | |
| Registration fees | | | — | | | | 179 | | | | 307 | |
| Professional fees | | | 11,916 | | | | 20,804 | | | | 23,474 | |
| Proxy and solicitation costs (Note 6) | | | — | | | | 33,000 | | | | — | |
| Custody and accounting expense | | | 3,276 | | | | 5,136 | | | | 5,824 | |
| Shareholder notification costs (Note 6) | | | 100,800 | | | | 81,900 | | | | 120,800 | |
| Directors fees | | | 1,092 | | | | 2,688 | | | | 2,366 | |
| Miscellaneous expense | | | 4,118 | | | | 5,361 | | | | 5,019 | |
| Interest expense | | | 1,138 | | | | 3,099 | | | | 5,723 | |
| Total expenses | | | 213,188 | | | | 330,059 | | | | 369,424 | |
| Waived and reimbursed fees | | | (121,738 | ) | | | (90,333 | ) | | | (149,478 | ) |
| Net expenses | | | 91,450 | | | | 239,726 | | | | 219,946 | |
| Net investment income | | | 657,401 | | | | 785,899 | | | | 355,929 | |
| REALIZED AND UNREALIZED GAIN (LOSS): | | | | | | | | | | | | |
| Net realized gain (loss) on: | | | | | | | | | | | | |
| Sale of affiliated underlying funds | | | (109,525 | ) | | | (1,169,372 | ) | | | 268,399 | |
| Sale of unaffiliated underlying funds | | | (3,417 | ) | | | 248 | | | | 164 | |
| Net realized gain (loss) | | | (112,942 | ) | | | (1,169,124 | ) | | | 268,563 | |
| Net change in unrealized appreciation (depreciation) on: | | | | | | | | | | | | |
| Affiliated underlying funds | | | 2,021,992 | | | | 9,400,394 | | | | 11,166,749 | |
| Unaffiliated underlying funds | | | (75,832 | ) | | | (161,784 | ) | | | (178,590 | ) |
| Net change in unrealized appreciation (depreciation) | | | 1,946,160 | | | | 9,238,610 | | | | 10,988,159 | |
| Net realized and unrealized gain | | | 1,833,218 | | | | 8,069,486 | | | | 11,256,722 | |
| Increase in net assets resulting from operations | | $ | 2,490,619 | | | $ | 8,855,385 | | | $ | 11,612,651 | |
| | | | | | | | | | | | | |
See Accompanying Notes to Financial Statements
STATEMENTS OF CHANGES IN NET ASSETS
| | | Voya Strategic Allocation | | | Voya Strategic Allocation | |
| | | Conservative Portfolio | | | Moderate Portfolio | |
| | | Six Months | | | | | | Six Months | | | | |
| | | Ended | | | Year Ended | | | Ended | | | Year Ended | |
| | | June 30, 2024 | | | December 31, | | | June 30, 2024 | | | December 31, | |
| | | (Unaudited) | | | 2023 | | | (Unaudited) | | | 2023 | |
| FROM OPERATIONS: | | | | | | | | | | | | | | | | |
| Net investment income | | $ | 657,401 | | | $ | 1,546,515 | | | $ | 785,899 | | | $ | 2,312,799 | |
| Net realized loss | | | (112,942 | ) | | | (2,125,418 | ) | | | (1,169,124 | ) | | | (1,031,913 | ) |
| Net change in unrealized appreciation (depreciation) | | | 1,946,160 | | | | 6,894,982 | | | | 9,238,610 | | | | 16,349,010 | |
| Increase in net assets resulting from operations | | | 2,490,619 | | | | 6,316,079 | | | | 8,855,385 | | | | 17,629,896 | |
| FROM DISTRIBUTIONS TO SHAREHOLDERS: | | | | | | | | | | | | | | | | |
| Total distributions (excluding return of capital): | | | | | | | | | | | | | | | | |
| Class I | | | (1,462,192 | ) | | | (3,417,526 | ) | | | (3,608,775 | ) | | | (10,020,875 | ) |
| Class S | | | (84,592 | ) | | | (193,656 | ) | | | (32,207 | ) | | | (105,042 | ) |
| Total distributions | | | (1,546,784 | ) | | | (3,611,182 | ) | | | (3,640,982 | ) | | | (10,125,917 | ) |
| FROM CAPITAL SHARE TRANSACTIONS: | | | | | | | | | | | | | | | | |
| Net proceeds from sale of shares | | | 3,450,417 | | | | 3,554,900 | | | | 4,312,966 | | | | 7,315,580 | |
| Reinvestment of distributions | | | 1,546,784 | | | | 3,611,182 | | | | 3,640,982 | | | | 10,125,917 | |
| | | | 4,997,201 | | | | 7,166,082 | | | | 7,953,948 | | | | 17,441,497 | |
| Cost of shares redeemed | | | (4,297,059 | ) | | | (9,812,778 | ) | | | (7,785,536 | ) | | | (11,199,148 | ) |
| Net increase (decrease) in net assets resulting from capital share transactions | | | 700,142 | | | | (2,646,696 | ) | | | 168,412 | | | | 6,242,349 | |
| Net increase in net assets | | | 1,643,977 | | | | 58,201 | | | | 5,382,815 | | | | 13,746,328 | |
| NET ASSETS: | | | | | | | | | | | | | | | | |
| Beginning of year or period | | | 56,575,123 | | | | 56,516,922 | | | | 125,492,366 | | | | 111,746,038 | |
| End of year or period | | $ | 58,219,100 | | | $ | 56,575,123 | | | $ | 130,875,181 | | | $ | 125,492,366 | |
See Accompanying Notes to Financial Statements
STATEMENTS OF CHANGES IN NET ASSETS
| | | Voya Strategic Allocation | |
| | | Growth Portfolio | |
| | | Six Months | | | | |
| | | Ended | | | Year Ended | |
| | | June 30, 2024 | | | December 31, | |
| | | (Unaudited) | | | 2023 | |
| FROM OPERATIONS: | | | | | | | | |
| Net investment income | | $ | 355,929 | | | $ | 2,059,934 | |
| Net realized gain | | | 268,563 | | | | 495,234 | |
| Net change in unrealized appreciation (depreciation) | | | 10,988,159 | | | | 19,595,677 | |
| Increase in net assets resulting from operations | | | 11,612,651 | | | | 22,150,845 | |
| FROM DISTRIBUTIONS TO SHAREHOLDERS: | | | | | | | | |
| Total distributions (excluding return of capital): | | | | | | | | |
| Class I | | | (4,426,493 | ) | | | (12,261,210 | ) |
| Class S | | | (68,632 | ) | | | (224,668 | ) |
| Total distributions | | | (4,495,125 | ) | | | (12,485,878 | ) |
| FROM CAPITAL SHARE TRANSACTIONS: | | | | | | | | |
| Net proceeds from sale of shares | | | 3,299,900 | | | | 6,797,427 | |
| Reinvestment of distributions | | | 4,495,125 | | | | 12,485,878 | |
| | | | 7,795,025 | | | | 19,283,305 | |
| Cost of shares redeemed | | | (5,900,144 | ) | | | (13,274,624 | ) |
| Net increase in net assets resulting from capital share transactions | | | 1,894,881 | | | | 6,008,681 | |
| Net increase in net assets | | | 9,012,407 | | | | 15,673,648 | |
| NET ASSETS: | | | | | | | | |
| Beginning of year or period | | | 137,289,850 | | | | 121,616,202 | |
| End of year or period | | $ | 146,302,257 | | | $ | 137,289,850 | |
See Accompanying Notes to Financial Statements
FINANCIAL HIGHLIGHTS
Selected data for a share of beneficial interest outstanding throughout each year or period.
| | | | | | Income (loss)
from investment
operations | | | | | Less Distributions | | | | | | | | | | | | | | Ratios to average net assets | | | Supplemental
Data | |
| Year or | | | Net
asset
value,
beginning
of year
or period | | | Net
investment
income
(loss) | | | | Net
realized
and
unrealized
gain
(loss) | | | Total
from
investment
operations | | | | From
net
investment
income | | | From
net
realized
gains | | | | From
return
of
capital | | | Total
distributions | | | | Payment
by
affiliate | | | Net
asset
value,
end of
year or
period | | | | Total
Return
(1) | | | Expenses
before
reductions/
additions
(2)(3)(4) | | | | Expenses
net of fee
waivers
and/or
recoupments
if any
(2)(3)(4) | | | Expenses
net of all
reductions/
additions
(2)(3)(4) | | | | Net
investment
income
(loss)
(2)(3)(5) | | | Net
assets,
end of
year or
period | | | | Portfolio
turnover
rate | |
| period ended | | | ($) | | | ($) | | | | ($) | | | ($) | | | | ($) | | | ($) | | | | ($) | | | ($) | | | | ($) | | | ($) | | | | (%) | | | (%) | | | | (%) | | | (%) | | | | (%) | | | ($000’s) | | | | (%) | |
| | | | | | | | | | | | | | | | | | | | | | | | | | | | | | | | | | | | | | | | | | | | | | | | | | | | | | | | | | | | | |
| Voya Strategic Allocation Conservative Portfolio | | | | | | | | | | | | | | | | | | | | | | | | | | | | | | | | | | | | | | | | | | | | | |
| Class I | | | | | | | | | | | | | | | | | | | | | | | | | | | | | | | | | | | | | | | | | | | | | | | | | | | | | | | | | | | | |
| 06-30-24+ | | | 11.05 | | | 0.13• | | | | 0.35 | | | 0.48 | | | | 0.30 | | | — | | | | — | | | 0.30 | | | | — | | | 11.23 | | | | 4.39 | | | 0.73 | | | | 0.30 | | | 0.30 | | | | 2.31 | | | 54,938 | | | | 20 | |
| 12-31-23 | | | 10.53 | | | 0.29• | | | | 0.92 | | | 1.21 | | | | 0.37 | | | 0.32 | | | | — | | | 0.69 | | | | — | | | 11.05 | | | | 11.92 | | | 0.36 | | | | 0.29 | | | 0.29 | | | | 2.73 | | | 53,288 | | | | 30 | |
| 12-31-22 | | | 14.26 | | | 0.21• | | | | (2.51 | ) | | (2.30 | ) | | | 0.44 | | | 0.99 | | | | — | | | 1.43 | | | | — | | | 10.53 | | | | (16.46 | ) | | 0.34 | | | | 0.30 | | | 0.30 | | | | 1.81 | | | 53,577 | | | | 74 | |
| 12-31-21 | | | 13.45 | | | 0.28• | | | | 0.92 | | | 1.20 | | | | 0.36 | | | 0.03 | | | | — | | | 0.39 | | | | — | | | 14.26 | | | | 9.14 | | | 0.36 | | | | 0.28 | | | 0.28 | | | | 2.01 | | | 71,425 | | | | 44 | |
| 12-31-20 | | | 13.02 | | | 0.30• | | | | 0.91 | | | 1.21 | | | | 0.33 | | | 0.45 | | | | — | | | 0.78 | | | | — | | | 13.45 | | | | 10.45 | | | 0.40 | | | | 0.27 | | | 0.27 | | | | 2.44 | | | 66,933 | | | | 71 | |
| 12-31-19 | | | 12.34 | | | 0.33 | | | | 1.41 | | | 1.74 | | | | 0.36 | | | 0.70 | | | | — | | | 1.06 | | | | — | | | 13.02 | | | | 14.82 | | | 0.30 | | | | 0.26 | | | 0.26 | | | | 2.53 | | | 60,959 | | | | 74 | |
| Class S | | | | | | | | | | | | | | | | | | | | | | | | | | | | | | | | | | | | | | | | | | | | | | | | | | | | | | | | | | | | |
| 06-30-24+ | | | 10.91 | | | 0.11• | | | | 0.35 | | | 0.46 | | | | 0.27 | | | — | | | | — | | | 0.27 | | | | — | | | 11.10 | | | | 4.30 | | | 0.98 | | | | 0.55 | | | 0.55 | | | | 2.05 | | | 3,281 | | | | 20 | |
| 12-31-23 | | | 10.41 | | | 0.26• | | | | 0.90 | | | 1.16 | | | | 0.34 | | | 0.32 | | | | — | | | 0.66 | | | | — | | | 10.91 | | | | 11.57 | | | 0.61 | | | | 0.54 | | | 0.54 | | | | 2.48 | | | 3,287 | | | | 30 | |
| 12-31-22 | | | 14.11 | | | 0.18• | | | | (2.49 | ) | | (2.31 | ) | | | 0.40 | | | 0.99 | | | | — | | | 1.39 | | | | — | | | 10.41 | | | | (16.69 | ) | | 0.59 | | | | 0.55 | | | 0.55 | | | | 1.57 | | | 2,940 | | | | 74 | |
| 12-31-21 | | | 13.31 | | | 0.24• | | | | 0.92 | | | 1.16 | | | | 0.33 | | | 0.03 | | | | — | | | 0.36 | | | | — | | | 14.11 | | | | 8.91 | | | 0.61 | | | | 0.53 | | | 0.53 | | | | 1.76 | | | 3,797 | | | | 44 | |
| 12-31-20 | | | 12.89 | | | 0.30 | | | | 0.87 | | | 1.17 | | | | 0.30 | | | 0.45 | | | | — | | | 0.75 | | | | — | | | 13.31 | | | | 10.19 | | | 0.65 | | | | 0.52 | | | 0.52 | | | | 2.20 | | | 3,622 | | | | 71 | |
| 12-31-19 | | | 12.23 | | | 0.30• | | | | 1.39 | | | 1.69 | | | | 0.33 | | | 0.70 | | | | — | | | 1.03 | | | | — | | | 12.89 | | | | 14.47 | | | 0.55 | | | | 0.51 | | | 0.51 | | | | 2.36 | | | 3,572 | | | | 74 | |
| Voya Strategic Allocation Moderate Portfolio | | | | | | | | | | | | | | | | | | | | | | | | | | | | | | | | | | | | | | | | | | | | |
| Class I | | | | | | | | | | | | | | | | | | | | | | | | | | | | | | | | | | | | | | | | | | | | | | | | | | | | | | | | | | | | |
| 06-30-24+ | | | 12.27 | | | 0.08• | | | | 0.80 | | | 0.88 | | | | 0.24 | | | 0.13 | | | | — | | | 0.37 | | | | — | | | 12.78 | | | | 7.19 | | | 0.52 | | | | 0.38 | | | 0.38 | | | | 1.24 | | | 129,620 | | | | 13 | |
| 12-31-23 | | | 11.58 | | | 0.23• | | | | 1.53 | | | 1.76 | | | | 0.49 | | | 0.58 | | | | — | | | 1.07 | | | | — | | | 12.27 | | | | 16.11 | | | 0.34 | | | | 0.31 | | | 0.31 | | | | 1.98 | | | 124,233 | | | | 25 | |
| 12-31-22 | | | 16.36 | | | 0.18• | | | | (3.10 | ) | | (2.92 | ) | | | 0.43 | | | 1.43 | | | | — | | | 1.86 | | | | — | | | 11.58 | | | | (18.16 | ) | | 0.33 | | | | 0.33 | | | 0.33 | | | | 1.40 | | | 110,541 | | | | 63 | |
| 12-31-21 | | | 15.21 | | | 0.25• | | | | 1.77 | | | 2.02 | | | | 0.37 | | | 0.50 | | | | — | | | 0.87 | | | | — | | | 16.36 | | | | 13.84 | | | 0.33 | | | | 0.33 | | | 0.33 | | | | 1.60 | | | 143,341 | | | | 44 | |
| 12-31-20 | | | 14.62 | | | 0.30 | | | | 1.31 | | | 1.61 | | | | 0.33 | | | 0.69 | | | | — | | | 1.02 | | | | — | | | 15.21 | | | | 12.73 | | | 0.37 | | | | 0.30 | | | 0.30 | | | | 2.08 | | | 131,004 | | | | 53 | |
| 12-31-19 | | | 13.59 | | | 0.29• | | | | 2.18 | | | 2.47 | | | | 0.41 | | | 1.03 | | | | — | | | 1.44 | | | | — | | | 14.62 | | | | 19.26 | | | 0.30 | | | | 0.28 | | | 0.28 | | | | 2.07 | | | 126,475 | | | | 57 | |
| Class S | | | | | | | | | | | | | | | | | | | | | | | | | | | | | | | | | | | | | | | | | | | | | | | | | | | | | | | | | | | | |
| 06-30-24+ | | | 12.19 | | | 0.06• | | | | 0.79 | | | 0.85 | | | | 0.20 | | | 0.13 | | | | — | | | 0.33 | | | | — | | | 12.71 | | | | 7.04 | | | 0.77 | | | | 0.63 | | | 0.63 | | | | 0.99 | | | 1,255 | | | | 13 | |
| 12-31-23 | | | 11.51 | | | 0.20• | | | | 1.51 | | | 1.71 | | | | 0.45 | | | 0.58 | | | | — | | | 1.03 | | | | — | | | 12.19 | | | | 15.78 | | | 0.59 | | | | 0.56 | | | 0.56 | | | | 1.73 | | | 1,259 | | | | 25 | |
| 12-31-22 | | | 16.26 | | | 0.15• | | | | (3.08 | ) | | (2.93 | ) | | | 0.39 | | | 1.43 | | | | — | | | 1.82 | | | | — | | | 11.51 | | | | (18.34 | ) | | 0.58 | | | | 0.58 | | | 0.58 | | | | 1.13 | | | 1,205 | | | | 63 | |
| 12-31-21 | | | 15.12 | | | 0.21• | | | | 1.76 | | | 1.97 | | | | 0.33 | | | 0.50 | | | | — | | | 0.83 | | | | — | | | 16.26 | | | | 13.55 | | | 0.58 | | | | 0.58 | | | 0.58 | | | | 1.34 | | | 1,626 | | | | 44 | |
| 12-31-20 | | | 14.52 | | | 0.24• | | | | 1.33 | | | 1.57 | | | | 0.28 | | | 0.69 | | | | — | | | 0.97 | | | | — | | | 15.12 | | | | 12.46 | | | 0.62 | | | | 0.55 | | | 0.55 | | | | 1.74 | | | 1,483 | | | | 53 | |
| 12-31-19 | | | 13.50 | | | 0.26 | | | | 2.16 | | | 2.42 | | | | 0.37 | | | 1.03 | | | | — | | | 1.40 | | | | — | | | 14.52 | | | | 18.94 | | | 0.55 | | | | 0.53 | | | 0.53 | | | | 1.81 | | | 1,885 | | | | 57 | |
| Voya Strategic Allocation Growth Portfolio | | | | | | | | | | | | | | | | | | | | | | | | | | | | | | | | | | | | | | | | | | | | | |
| Class I | | | | | | | | | | | | | | | | | | | | | | | | | | | | | | | | | | | | | | | | | | | | | | | | | | | | | | | | | | | | |
| 06-30-24+ | | | 12.84 | | | 0.03• | | | | 1.05 | | | 1.08 | | | | 0.19 | | | 0.23 | | | | — | | | 0.42 | | | | — | | | 13.50 | | | | 8.52 | | | 0.52 | | | | 0.31 | | | 0.31 | | | | 0.51 | | | 143,944 | | | | 12 | |
| 12-31-23 | | | 12.00 | | | 0.19• | | | | 1.91 | | | 2.10 | | | | 0.45 | | | 0.81 | | | | — | | | 1.26 | | | | — | | | 12.84 | | | | 18.65 | | | 0.34 | | | | 0.30 | | | 0.30 | | | | 1.60 | | | 134,911 | | | | 24 | |
| 12-31-22 | | | 17.81 | | | 0.16• | | | | (3.57 | ) | | (3.41 | ) | | | 0.48 | | | 1.92 | | | | — | | | 2.40 | | | | — | | | 12.00 | | | | (19.35 | ) | | 0.34 | | | | 0.31 | | | 0.31 | | | | 1.19 | | | 119,444 | | | | 58 | |
| 12-31-21 | | | 15.80 | | | 0.23• | | | | 2.44 | | | 2.67 | | | | 0.33 | | | 0.33 | | | | — | | | 0.66 | | | | — | | | 17.81 | | | | 17.35 | | | 0.36 | | | | 0.32 | | | 0.32 | | | | 1.35 | | | 154,678 | | | | 42 | |
| 12-31-20 | | | 15.62 | | | 0.26• | | | | 1.49 | | | 1.75 | | | | 0.32 | | | 1.25 | | | | — | | | 1.57 | | | | — | | | 15.80 | | | | 14.40 | | | 0.39 | | | | 0.29 | | | 0.29 | | | | 1.87 | | | 140,657 | | | | 56 | |
| 12-31-19 | | | 14.40 | | | 0.28 | | | | 2.79 | | | 3.07 | | | | 0.43 | | | 1.42 | | | | — | | | 1.85 | | | | — | | | 15.62 | | | | 22.84 | | | 0.30 | | | | 0.26 | | | 0.26 | | | | 1.76 | | | 130,989 | | | | 66 | |
| Class S | | | | | | | | | | | | | | | | | | | | | | | | | | | | | | | | | | | | | | | | | | | | | | | | | | | | | | | | | | | | |
| 06-30-24+ | | | 12.67 | | | 0.02• | | | | 1.03 | | | 1.05 | | | | 0.16 | | | 0.23 | | | | — | | | 0.39 | | | | — | | | 13.33 | | | | 8.36 | | | 0.77 | | | | 0.56 | | | 0.56 | | | | 0.26 | | | 2,358 | | | | 12 | |
| 12-31-23 | | | 11.85 | | | 0.16• | | | | 1.88 | | | 2.04 | | | | 0.41 | | | 0.81 | | | | — | | | 1.22 | | | | — | | | 12.67 | | | | 18.40 | | | 0.59 | | | | 0.55 | | | 0.55 | | | | 1.35 | | | 2,379 | | | | 24 | |
| 12-31-22 | | | 17.61 | | | 0.12• | | | | (3.52 | ) | | (3.40 | ) | | | 0.44 | | | 1.92 | | | | — | | | 2.36 | | | | — | | | 11.85 | | | | (19.55 | ) | | 0.59 | | | | 0.56 | | | 0.56 | | | | 0.93 | | | 2,172 | | | | 58 | |
| 12-31-21 | | | 15.64 | | | 0.18• | | | | 2.41 | | | 2.59 | | | | 0.29 | | | 0.33 | | | | — | | | 0.62 | | | | — | | | 17.61 | | | | 16.98 | | | 0.61 | | | | 0.57 | | | 0.57 | | | | 1.05 | | | 2,775 | | | | 42 | |
| 12-31-20 | | | 15.46 | | | 0.22• | | | | 1.48 | | | 1.70 | | | | 0.27 | | | 1.25 | | | | — | | | 1.52 | | | | — | | | 15.64 | | | | 14.16 | | | 0.64 | | | | 0.54 | | | 0.54 | | | | 1.57 | | | 2,731 | | | | 56 | |
| 12-31-19 | | | 14.27 | | | 0.22• | | | | 2.77 | | | 2.99 | | | | 0.38 | | | 1.42 | | | | — | | | 1.80 | | | | — | | | 15.46 | | | | 22.49 | | | 0.55 | | | | 0.51 | | | 0.51 | | | | 1.45 | | | 2,968 | | | | 66 | |
See Accompanying Notes to Financial Statements
FINANCIAL HIGHLIGHTS (CONTINUED)
| (1) | Total return is calculated assuming reinvestment of all dividends, capital gain distributions and return of capital distributions, if any, at net asset value and does not reflect the effect of insurance contract charges. Total return for periods less than one year is not annualized. |
| (2) | Annualized for periods less than one year. |
| (3) | Ratios reflect operating expenses of a Portfolio. Expenses before reductions/additions do not reflect amounts reimbursed or recouped by the Investment Adviser and/or Distributor or reductions from brokerage service arrangements or other expense offset arrangements and do not represent the amount paid by a Portfolio during periods when reimbursements or reductions occur. Expenses net of fee waivers reflect expenses after reimbursement by the Investment Adviser and/or Distributor or recoupment of previously reimbursed fees by the Investment Adviser, but prior to reductions from brokerage service arrangements or other expense offset arrangements. Expenses net of all reductions/additions represent the net expenses paid by a Portfolio. Net investment income (loss) is net of all such additions or reductions. |
| (4) | Ratios do not include expenses of underlying funds and do not include fees and expenses charged under the variable annuity contract or variable life insurance policy. |
| (5) | Net investment income (loss) is affected by the timing of the declaration of dividends by any underlying mutual funds or exchange-traded funds ("ETFs"). Net investment income (loss) of any underlying mutual funds or ETFs is not included in a Portfolio net investment income (loss) ratio to average net assets. |
| + | Unaudited. |
| • | Calculated using average number of shares outstanding throughout the year or period. |
See Accompanying Notes to Financial Statements
NOTES TO FINANCIAL STATEMENTS AS OF JUNE 30, 2024 (UNAUDITED)
NOTE 1 — ORGANIZATION
Voya Strategic Allocation Portfolios, Inc. (the “Company”) is registered under the Investment Company Act of 1940, as amended (“1940 Act”), as an open-end management investment company. The Company was incorporated under the laws of Maryland on October 14, 1994. There are three active separate investment series (each a “Portfolio” and collectively the “Portfolios”) that comprise the Company: Voya Strategic Allocation Conservative Portfolio (“Strategic Allocation Conservative”), Voya Strategic Allocation Moderate Portfolio (“Strategic Allocation Moderate”), and Voya Strategic Allocation Growth Portfolio (“Strategic Allocation Growth”), each a diversified series of the Company. Each Portfolio currently seeks to achieve its investment objective by investing primarily in other investment companies (“Underlying Funds”) and each uses asset allocation strategies to determine how to invest in the Underlying Funds. The investment objective of the Portfolios is described in the respective Portfolio’s Prospectus.
The classes of shares included in this report are: Class I and Class S. With the exception of class specific matters, each class has equal voting rights as to voting privileges. For class specific proposals, only the applicable class would have voting privileges. The two classes differ principally in the applicable distribution and service fees, as well as differences in the amount of waiver of fees and reimbursement of expenses, if any. Generally, shareholders of each class also bear certain expenses that pertain to that particular class. All shareholders are allocated the common expenses of a portfolio and earn income and realized gains/ losses from a portfolio pro rata based on the daily ending net assets of each class, without distinction between share classes. Expenses that are specific to a portfolio or a class are charged directly to that portfolio or class. Other operating expenses shared by several portfolios are generally allocated among those portfolios based on average net assets. Distributions are determined separately for each class based on income and expenses allocated to each class. Realized gain distributions are allocated to each class pro rata based on the shares outstanding of each class on the date of distribution. Differences in per share dividend rates generally result from differences in separate class expenses, including distribution and shareholder service fees, if any, as well as differences in the amount of waiver of fees and reimbursement of expenses between the separate classes, if any.
Voya Investments, LLC (“Voya Investments” or the “Investment Adviser”), an Arizona limited liability company, serves as the Investment Adviser to the Portfolios. Voya Investment Management Co. LLC (“Voya IM” or the “Sub-Adviser”), a Delaware limited liability company, serves as the Sub-Adviser to the Portfolios. Voya Investments Distributor, LLC (“VID” or the “Distributor”), a Delaware
limited liability company, serves as the principal underwriter to the Portfolios.
NOTE 2 — SIGNIFICANT ACCOUNTING POLICIES
The Portfolios are investment companies and accordingly follow the investment company accounting and reporting guidance of the Financial Accounting Standards Board ("FASB") Accounting Standards Board Codification Topic 946 Financial Services - Investment Companies.
The following significant accounting policies are consistently followed by the Portfolios in the preparation of their financial statements. Each Portfolio is considered an investment company under U.S. generally accepted accounting principles (“GAAP”) and follows the accounting and reporting guidance applicable to investment companies.
A. Security Valuation. Each Portfolio is open for business every day the New York Stock Exchange (“NYSE”) opens for regular trading (each such day, a “Business Day”). The net asset value (“NAV”) per share for each class of each Portfolio is determined each Business Day as of the close of the regular trading session (“Market Close”), as determined by the Consolidated Tape Association (“CTA”), the central distributor of transaction prices for exchange-traded securities (normally 4:00 p.m. Eastern Time unless otherwise designated by the CTA). The NAV per share of each class of each Portfolio is calculated by taking the value of the Portfolio’s assets attributable to that class, subtracting the Portfolio’s liabilities attributable to that class, and dividing by the number of shares of that class that are outstanding. On days when a Portfolio is closed for business, Portfolio shares will not be priced and a Portfolio does not transact purchase and redemption orders. To the extent a Portfolio’s assets are traded in other markets on days when a Portfolio does not price its shares, the value of a Portfolio’s assets will likely change and you will not be able to purchase or redeem shares of a Portfolio.
Portfolio securities for which market quotations are readily available are valued at market value. Investments in open-end registered investment companies that do not trade on an exchange are valued at the end of day NAV per share. The prospectuses of the open-end registered investment companies in which each Portfolio may invest explain the circumstances under which they will use fair value pricing and the effects of using fair value pricing. Foreign securities’ prices are converted into U.S. dollar amounts using the applicable exchange rates as of Market Close.
When a market quotation for a portfolio security is not readily available or is deemed unreliable (for example when trading has been halted or there are unexpected market closures or other material events that would suggest that the market quotation is unreliable) and for purposes of determining the value of other Portfolio assets, the asset
NOTES TO FINANCIAL STATEMENTS AS OF JUNE 30, 2024 (UNAUDITED) (CONTINUED)
NOTE 2 — SIGNIFICANT ACCOUNTING POLICIES (continued)
is priced at its fair value. The Board has designated the Investment Adviser, as the valuation designee, to make fair value determinations in good faith. In determining the fair value of each Portfolio’s assets, the Investment Adviser, pursuant to its fair valuation policy, may consider inputs from pricing service providers, broker-dealers, or each Portfolio’s sub-adviser(s). Issuer specific events, transaction price, position size, nature and duration of restrictions on disposition of the security, market trends, bid/ask quotes of brokers and other market data may be reviewed in the course of making a good faith determination of an asset’s fair value. Because trading hours for certain foreign securities end before Market Close, closing market quotations may become unreliable. The prices of foreign securities will generally be adjusted based on inputs from an independent pricing service that are intended to reflect valuation changes through the NYSE close. Because of the inherent uncertainties of fair valuation, the values used to determine each Portfolio’s NAV may materially differ from the value received upon actual sale of those investments. Thus, fair valuation may have an unintended dilutive or accretive effect on the value of shareholders’ investments in each Portfolio.
The Portfolios’ financial instruments are valued at the close of the NYSE and are reported at fair value, which GAAP defines as the price that would be received to sell an asset or paid to transfer a liability in an orderly transaction between market participants at the measurement date.
Various valuation techniques and inputs are used to determine the fair value of financial instruments. GAAP establishes the following fair value hierarchy that categorizes the inputs used to measure fair value:
Level 1 — quoted prices (unadjusted) in active markets for identical financial instruments that the portfolio can access at the reporting date.
Level 2 — inputs other than Level 1 quoted prices that are observable, either directly or indirectly (including, but not limited to, quoted prices for similar financial instruments in active markets, quoted prices for identical or similar financial instruments in inactive markets, interest rates and yield curves, implied volatilities, and credit spreads).
Level 3 — unobservable inputs (including the portfolio’s own assumptions in determining fair value).
Observable inputs are developed using market data, such as publicly available information about actual events or transactions, and reflect the assumptions that market participants would use to price the financial instrument. Unobservable inputs are those for which market data are not available and are developed using the best information
available about the assumptions that market participants would use to price the financial instrument. GAAP requires valuation techniques to maximize the use of relevant observable inputs and minimize the use of unobservable inputs. When multiple inputs are used to derive fair value, the financial instrument is assigned to the level within the fair value hierarchy based on the lowest-level input that is significant to the fair value of the financial instrument. Input levels are not necessarily an indication of the risk or liquidity associated with financial instruments at that level but rather the degree of judgment used in determining those values.
A table summarizing each Portfolio’s investments under these levels of classification is included within each Portfolio of Investments.
Each investment asset or liability of a Portfolio is assigned a level at measurement date based on the significance and source of the inputs to its valuation. Quoted prices in active markets for identical securities are classified as “Level 1,” inputs other than quoted prices for an asset or liability that are observable are classified as “Level 2” and significant unobservable inputs, including the Sub-Adviser’s or Pricing Committee’s judgment about the assumptions that a market participant would use in pricing an asset or liability are classified as “Level 3.” The inputs used for valuing securities are not necessarily an indication of the risks associated with investing in those securities. Short-term securities of sufficient credit quality are generally considered to be Level 2 securities under applicable accounting rules. The Portfolios classify each of their investments in the Underlying Funds as Level 1, without consideration as to the classification level of the specific investments held by the Underlying Funds. A table summarizing each Portfolio’s investments under these levels of classification is included within the Portfolio of Investments.
GAAP requires a reconciliation of the beginning to ending balances for reported fair values that presents changes attributable to total realized and unrealized gains or losses, purchases and sales, and transfers in or out of the Level 3 category during the period. A reconciliation of Level 3 investments within the Portfolio of Investments is presented only when a Portfolio has a significant amount of Level 3 investments.
B. Securities Transactions and Revenue Recognition. Security transactions are accounted for on the trade date. Dividend income received from the Underlying Funds is recognized on the ex-dividend date and is recorded as dividends from underlying funds in the Statements of Operations. Capital gain distributions received from the Underlying Funds are recognized on the ex-dividend date and are recorded on the Statements of Operations as such. Realized gains and losses are reported on the basis of identified cost of securities sold.
NOTES TO FINANCIAL STATEMENTS AS OF JUNE 30, 2024 (UNAUDITED) (CONTINUED)
NOTE 2 — SIGNIFICANT ACCOUNTING POLICIES (continued)
C. Distributions to Shareholders. The Portfolios record distributions to their shareholders on the ex-dividend date. Dividends from net investment income and capital gain distributions, if any, are declared and paid annually by the Portfolios. The Portfolios may make distributions on a more frequent basis to comply with the distribution requirements of the Internal Revenue Code. The characteristics of income and gains to be distributed are determined in accordance with income tax regulations, which may differ from U.S. GAAP for investment companies.
D. Federal Income Taxes. It is the policy of each Portfolio to comply with the requirements of subchapter M of the Internal Revenue Code and related excise tax provisions applicable to regulated investment companies and to distribute substantially all of its net investment income and any net realized capital gains to its shareholders. Therefore, no federal income tax provision is required. Management has considered the sustainability of the Portfolios’ tax positions taken on federal income tax returns for all open tax years in making this determination. No capital gain distributions shall be made until any capital loss carryforwards have been fully utilized.
The Portfolios may utilize equalization accounting for tax purposes, whereby a portion of redemption payments are treated as distributions of income or gain.
E. Use of Estimates. The preparation of financial statements in conformity with GAAP requires management to make estimates and assumptions that affect the reported amounts of assets and liabilities and disclosure of contingent assets and liabilities at the date of the financial statements and the reported amounts of increases and decreases in net assets from operations during the reporting period. Actual results could differ from those estimates.
F. Risk Exposures and the Use of Derivative Instruments. Each Portfolio’s investment strategies permit it to enter into various types of derivatives contracts, including, but not limited to, futures contracts. In doing so, a Portfolio will employ strategies in differing combinations to permit it to increase or decrease the level of risk, or change the level or types of exposure to risk factors. This may allow a Portfolio to pursue its objectives more quickly and efficiently than if it were to make direct purchases or sales of securities capable of affecting a similar response to market or credit factors.
In pursuit of its investment objectives, a Portfolio may seek to increase or decrease its exposure to the following market or credit risk factors:
Equity Risk. Stock prices may be volatile or have reduced liquidity in response to real or perceived impacts of factors
including, but not limited to, economic conditions, changes in market interest rates, and political events. Stock markets tend to be cyclical, with periods when stock prices generally rise and periods when stock prices generally decline. Any given stock market segment may remain out of favor with investors for a short or long period of time, and stocks as an asset class may underperform bonds or other asset classes during some periods. Additionally, legislative, regulatory or tax policies or developments in these areas may adversely impact the investment techniques available to a manager, add to costs and impair the ability of a Portfolio to achieve its investment objectives.
Risks of Investing in Derivatives. Each Portfolio’s use of derivatives can result in losses due to unanticipated changes in the market or credit risk factors and the overall market. In instances where a Portfolio is using derivatives to decrease, or hedge, exposures to market or credit risk factors for securities held by a Portfolio, there are also risks that those derivatives may not perform as expected resulting in losses for the combined or hedged positions.
Derivative instruments are subject to a number of risks, including the risk of changes in the market price of the underlying securities, credit risk with respect to the counterparty, risk of loss due to changes in market interest rates and liquidity and volatility risk. The amounts required to purchase certain derivatives may be small relative to the magnitude of exposure assumed by a Portfolio. Therefore, the purchase of certain derivatives may have an economic leveraging effect on a Portfolio and exaggerate any increase or decrease in the NAV. Derivatives may not perform as expected, so a Portfolio may not realize the intended benefits. When used for hedging purposes, the change in value of a derivative may not correlate as expected with the currency, security or other risk being hedged. When used as an alternative or substitute for direct cash investments, the return provided by the derivative may not provide the same return as direct cash investment. In addition, given their complexity, derivatives expose a Portfolio to the risk of improper valuation.
Generally, derivatives are sophisticated financial instruments whose performance is derived, at least in part, from the performance of an underlying asset or assets. Derivatives include, among other things, swap agreements, options, forwards and futures. Investments in derivatives are generally negotiated over-the-counter (“OTC”), with a single counterparty and as a result are subject to credit risks related to the counterparty’s ability or willingness to perform its obligations; any deterioration in the counterparty’s creditworthiness could adversely affect the value of the derivative. In addition, derivatives and their underlying securities may experience periods of illiquidity which could cause a Portfolio to hold a security it might otherwise sell, or to sell a security it otherwise
NOTES TO FINANCIAL STATEMENTS AS OF JUNE 30, 2024 (UNAUDITED) (CONTINUED)
NOTE 2 — SIGNIFICANT ACCOUNTING POLICIES (continued)
might hold at inopportune times or at an unanticipated price. A manager might imperfectly judge the direction of the market. For instance, if a derivative is used as a hedge to offset investment risk in another security, the hedge might not correlate to the market’s movements and may have unexpected or undesired results such as a loss or a reduction in gains.
G. Futures Contracts. Each Portfolio may enter into futures contracts involving foreign currency, interest rates, securities and security indices. A futures contract is a commitment to buy or sell a specific amount of a financial instrument at a negotiated price on a stipulated future date. Each Portfolio may buy and sell futures contracts. Futures contracts traded on a commodities or futures exchange will be valued at the final settlement price or official closing price on the principal exchange as reported by such principal exchange at its trading session ending at, or most recently prior to, the time when the Portfolio’s assets are valued.
Upon entering into a futures contract, each Portfolio is required to deposit either cash or securities (initial margin) in an amount equal to a certain percentage of the contract value. Subsequent payments (variation margin) are made or received by the Portfolio each day. The variation margin payments are equal to the daily changes in the contract value and are recorded as unrealized gains and losses and, if any, shown as variation margin receivable or payable on futures contracts on the Statement of Assets and Liabilities.
Open futures contracts are reported on a table following each Portfolio’s Portfolio of Investments. Securities held in collateralized accounts to cover initial margin requirements on open futures contracts, if any, are footnoted in the Portfolio of Investments. Cash collateral held by the broker to cover initial margin requirements on open futures contracts are noted in the Statements of Assets and Liabilities. The net change in unrealized appreciation and depreciation is reported in the Statements of Operations. Realized gains (losses) are reported in the Statements of Operations at the closing or expiration of futures contracts.
During the period ended June 30, 2024, there were no futures contracts entered into by any Portfolio.
H. Indemnifications. In the normal course of business, the Company may enter into contracts that provide certain indemnifications. The Company’s maximum exposure under these arrangements is dependent on future claims that may be made against the Portfolios and, therefore, cannot be estimated; however, based on experience, management considers the risk of loss from such claims remote.
NOTE 3 — INVESTMENTS IN UNDERLYING FUNDS
For the period ended June 30, 2024, the cost of purchases and the proceeds from the sales of the Underlying Funds were as follows:
| | | Purchases | | | Sales | |
| Strategic Allocation Conservative | | $ | 11,325,688 | | | $ | 11,541,930 | |
| Strategic Allocation Moderate | | | 16,784,941 | | | | 19,292,503 | |
| Strategic Allocation Growth | | | 17,625,582 | | | | 19,804,313 | |
NOTE 4 — INVESTMENT MANAGEMENT FEES
The Portfolios have entered into an investment management agreement (“Management Agreement”) with the Investment Adviser. The Investment Adviser has overall responsibility for the management of the Portfolios. The Investment Adviser oversees all investment management and portfolio management services for the Portfolios and assists in managing and supervising all aspects of the general day-to-day business activities and operations of the Portfolios, including custodial, transfer agency, dividend disbursing, accounting, auditing, compliance and related services. The Management Agreement compensates the Investment Adviser with a management fee, computed daily and payable monthly, based on the average daily net assets of each Portfolio, at the following annual rates: 0.18% of each Portfolio’s average daily net assets invested in affiliated Underlying Funds, 0.70% of each Portfolio’s average daily net assets invested in direct investments and 0.40% of each Portfolio’s average daily net assets invested in unaffiliated Underlying Funds and other investments.
The Investment Adviser has entered into a sub-advisory agreement with Voya IM with respect to each Portfolio. Voya IM provides investment advice for the Portfolios and is paid by the Investment Adviser based on the average daily net assets of each respective Portfolio. Subject to such policies as the Board or the Investment Adviser may determine, Voya IM manages the Portfolios’ assets in accordance with the Portfolios’ investment objectives, policies, and limitations.
NOTE 5 — DISTRIBUTION AND SERVICE FEES
Class S shares of the Portfolios have a shareholder services and distribution plan (the “Plan”), whereby the Distributor is compensated by each Portfolio for expenses incurred for shareholder servicing and/or distribution of each Portfolio’s Class S shares. Pursuant to the Plan, the Distributor is entitled to a payment each month to compensate for expenses incurred in the distribution and promotion of each Portfolio’s Class S shares, including expenses incurred in printing prospectuses and reports used for sales purposes, expenses incurred in preparing and printing sales literature and other such distribution related expenses, including any distribution or shareholder servicing fees paid to securities dealers who have executed a distribution agreement with
NOTES TO FINANCIAL STATEMENTS AS OF JUNE 30, 2024 (UNAUDITED) (CONTINUED)
NOTE 5 — DISTRIBUTION AND SERVICE FEES (continued)
the Distributor. Under the Plan, Class S shares of the Portfolios pay the Distributor a fee calculated at an annual rate of 0.25% of average daily net assets.
NOTE 6 — OTHER TRANSACTIONS WITH AFFILIATES AND RELATED PARTIES
During the period ended June 30, 2024, Strategic Allocation Conservative, Strategic Allocation Moderate and Strategic Allocation Growth incurred $100,800, $81,900 and $120,800 of shareholder notification costs associated with the Portfolio’s merger with and into Voya Solution Conservative Portfolio, Voya Solution Balanced Portfolio and Voya Solution Aggressive Portfolio, respectively (which are not included in this report).The Investment Adviser or an affiliate reimbursed each Portfolio for these costs.
During the period ended June 30, 2024, Strategic Allocation Moderate incurred $33,000 of proxy and solicitation costs associated with obtaining shareholder approval relating to its merger with and into Voya Solution Balanced Portfolio, which is not included in this report.
At June 30, 2024, the following direct or indirect, wholly-owned subsidiaries of Voya Financial, Inc. owned more than 5% of the following Portfolios:
| Subsidiary | | Portfolio | | | Percentage |
| ReliaStar Life Insurance Company | | Strategic Allocation Conservative | | | 5.99 | % |
| | | Strategic Allocation Moderate | | | 11.08 | |
| | | Strategic Allocation Growth | | | 8.16 | |
| Voya Retirement Insurance and Annuity Company | | Strategic Allocation Conservative | | | 85.91 | |
| | | Strategic Allocation Moderate | | | 85.90 | |
| | | Strategic Allocation Growth | | | 87.10 | |
The Portfolios have adopted a deferred compensation plan (the “DC Plan”), which allows eligible independent directors, as described in the DC Plan, to defer the receipt of all or a portion of the directors’ fees that they are entitled to receive from the Portfolios. For purposes of determining the amount owed to the director under the DC Plan, the amounts deferred are invested in shares of the funds selected by the director (the “Notional Funds”). When the Portfolios purchase shares of the Notional Funds, which are all advised by Voya Investments, in amounts equal to the directors’ deferred fees, this results in a Portfolio asset equal to the deferred compensation liability. Such assets, if
applicable, are included as a component of “Other assets” on the accompanying Statements of Assets and Liabilities. Deferral of directors’ fees under the DC Plan will not affect net assets of the Portfolios, and will not materially affect the Portfolios’ assets, liabilities or net investment income per share. Amounts will be deferred until distributed in accordance with the DC Plan.
The Portfolios may pay per account fees to affiliates of Voya Investments for recordkeeping services provided on certain assets. For the period ended June 30, 2024, the per account fees for affiliated recordkeeping services paid by each Portfolio were as follows:
| Portfolio | | Amount |
| Strategic Allocation Conservative | | $28,119 |
| Strategic Allocation Moderate | | 55,655 |
| Strategic Allocation Growth | | 68,757 |
NOTE 7— EXPENSE LIMITATION AGREEMENTS
The Investment Adviser entered into written expense limitation agreement (“Expense Limitation Agreement”) with each Portfolio whereby the Investment Adviser has agreed to limit expenses, excluding interest, taxes, investment-related costs, leverage expenses and extraordinary expenses to the levels listed below:
| | | Class | | Class |
| Portfolio(1)(2) | | I | | S |
| Strategic Allocation Conservative | | 0.71% | | 0.96% |
| Strategic Allocation Moderate | | 0.75% | | 1.00% |
| Strategic Allocation Growth | | 0.77% | | 1.02% |
| (1) | The operating expense limits take into account the operating expenses incurred at the Underlying Fund level. The amount of fees and expenses of an Underlying Fund borne by each Portfolio will vary based on each Portfolio’s allocation of assets to, and the net expenses of, a particular Underlying Fund. |
| (2) | Any fees waived pursuant to the expense limitation agreement shall not be eligible for recoupment. |
The Expense Limitation Agreement is contractual through May 1, 2026, and shall renew automatically for one-year terms. Termination or modification of this obligation requires approval by the Board.
NOTES TO FINANCIAL STATEMENTS AS OF JUNE 30, 2024 (UNAUDITED) (CONTINUED)
NOTE 8 — CAPITAL SHARES
Transactions in capital shares and dollars were as follows:
| | | | | | | | | | | | | Net | | | | | | | | | | | | |
| | | | | | | | | | | | | increase | | | | Proceeds | | | | | | | | |
| | | | | | | | | | | | | (decrease) | | | | from | | | | | | | | |
| | | | | Shares | | Reinvestment | | | | | | in | | | | shares | | Reinvestment | | | | | | |
| | | Shares | | issued in | | of | | Shares | | Shares | | shares | | Shares | | issued in | | of | | Shares | | Shares | | Net increase |
| | | sold | | merger | | distributions | | redeemed | | converted | | outstanding | | sold | | merger | | distributions | | redeemed | | converted | | (decrease) |
| Year or | | | | | | | | | | | | | | | | | | | | | | | | |
| period ended | | # | | # | | # | | # | | # | | # | | ($) | | ($) | | ($) | | ($) | | ($) | | ($) |
| | | | | | | | | | | | | | | | | | | | | | | | | |
| Strategic Allocation Conservative | | | | | | | | | | | | | | | | | | | | |
| Class I | | | | | | | | | | | | | | | | | | | | | | | | |
| 6/30/2024 | | 295,234 | | — | | 132,685 | | (358,218) | | — | | 69,701 | | 3,300,321 | | — | | 1,462,192 | | (3,998,848) | | — | | 763,665 |
| 12/31/2023 | | 295,515 | | — | | 330,835 | | (889,721) | | — | | (263,371) | | 3,127,326 | | — | | 3,417,526 | | (9,380,760) | | — | | (2,835,908) |
| Class S | | | | | | | | | | | | | | | | | | | | | | | | |
| 6/30/2024 | | 13,636 | | — | | 7,761 | | (27,063) | | — | | (5,666) | | 150,096 | | — | | 84,592 | | (298,211) | | — | | (63,523) |
| 12/31/2023 | | 40,774 | | — | | 18,930 | | (40,834) | | — | | 18,870 | | 427,574 | | — | | 193,656 | | (432,018) | | — | | 189,212 |
| Strategic Allocation Moderate | | | | | | | | | | | | | | | | | | | | | | |
| Class I | | | | | | | | | | | | | | | | | | | | | | | | |
| 6/30/2024 | | 341,031 | | — | | 289,165 | | (610,807) | | — | | 19,389 | | 4,290,253 | | — | | 3,608,775 | | (7,675,106) | | — | | 223,922 |
| 12/31/2023 | | 626,466 | | — | | 896,322 | | (940,892) | | — | | 581,896 | | 7,263,560 | | — | | 10,020,875 | | (11,019,962) | | — | | 6,264,473 |
| Class S | | | | | | | | | | | | | | | | | | | | | | | | |
| 6/30/2024 | | 1,816 | | — | | 2,593 | | (8,937) | | — | | (4,528) | | 22,713 | | — | | 32,207 | | (110,430) | | — | | (55,510) |
| 12/31/2023 | | 4,487 | | — | | 9,438 | | (15,373) | | — | | (1,448) | | 52,020 | | — | | 105,042 | | (179,186) | | — | | (22,124) |
| Strategic Allocation Growth | | | | | | | | | | | | | | | | | | | | | | |
| Class I | | | | | | | | | | | | | | | | | | | | | | | | |
| 6/30/2024 | | 242,437 | | — | | 335,849 | | (422,756) | | — | | 155,530 | | 3,232,999 | | — | | 4,426,493 | | (5,622,206) | | — | | 2,037,286 |
| 12/31/2023 | | 547,676 | | — | | 1,066,192 | | (1,061,131) | | — | | 552,737 | | 6,661,860 | | — | | 12,261,210 | | (12,958,194) | | — | | 5,964,876 |
| Class S | | | | | | | | | | | | | | | | | | | | | | | | |
| 6/30/2024 | | 5,117 | | — | | 5,271 | | (21,278) | | — | | (10,890) | | 66,901 | | — | | 68,632 | | (277,938) | | — | | (142,405) |
| 12/31/2023 | | 11,321 | | — | | 19,760 | | (26,637) | | — | | 4,444 | | 135,567 | | — | | 224,668 | | (316,430) | | — | | 43,805 |
NOTE 9 — LINE OF CREDIT
Effective June 10, 2024, the Portfolios, in addition to certain other funds managed by the Investment Adviser, entered into a 364-day unsecured committed revolving line of credit agreement (the “Credit Agreement”) with The Bank of New York Mellon (“BNY”) for an aggregate amount of $400,000,000 through June 9, 2025. The proceeds may be used only to finance temporarily: (1) the purchase or sale of investment securities; or (2) the repurchase or redemption of shares of the Portfolio or certain other funds managed by the Investment Adviser. The funds to which the line of credit is available pay a commitment fee equal to 0.15% per annum on the daily unused portion of the committed line amount payable quarterly in arrears. Prior to June 10, 2024, the predecessor line of credit was for an aggregate amount of $400,000,000 and the funds to which the line of credit was available paid a commitment fee equal to 0.15% per annum on the daily unused portion of the committed line amount through June 10, 2024.
Borrowings under the Credit Agreement accrue interest at the federal funds rate plus a specified margin. Repayments generally must be made within 60 days after the date of a revolving credit advance.
The following Portfolios utilized the line of credit during the period ended June 30, 2024:
Portfolio | | Days
Utilized | | Approximate
Average
Daily Balance
For Days Utilized | | Approximate
Weighted
Average
Interest Rate
For Days Utilized | |
| Strategic Allocation Conservative | | 5 | | $ | 1,294,000 | | | 6.33% | |
| Strategic Allocation Moderate | | 5 | | | 3,525,000 | | | 6.33 | |
| Strategic Allocation Growth | | 5 | | | 6,510,000 | | | 6.33 | |
NOTES TO FINANCIAL STATEMENTS AS OF JUNE 30, 2024 (UNAUDITED) (CONTINUED)
NOTE 10 — FEDERAL INCOME TAXES
The amount of distributions from net investment income and net realized capital gains are determined in accordance with federal income tax regulations, which may differ from GAAP for investment companies. These book/tax differences may be either temporary or permanent. Permanent differences are reclassified within the capital accounts based on their federal tax-basis treatment; temporary differences are not reclassified. Key differences include the treatment of short-term capital gains, futures contracts and wash sale deferrals.
Dividends paid by the Portfolios from net investment income and distributions of net realized short-term capital gains are, for federal income tax purposes, taxable as ordinary income to shareholders.
The tax composition of dividends and distributions to shareholders was as follows:
| | | Year Ended December 31, 2023 | | | Year Ended December 31, 2022 | |
| | | Ordinary Income | | | Long-term Capital Gains | | | Ordinary Income | | | Long-term Capital Gains | |
| Strategic Allocation Conservative | | $ | 1,934,754 | | | $ | 1,676,427 | | | $ | 4,016,276 | | | $ | 3,354,924 | |
| Strategic Allocation Moderate | | | 4,618,266 | | | | 5,507,651 | | | | 5,032,502 | | | | 11,131,178 | |
| Strategic Allocation Growth | | | 4,442,527 | | | | 8,043,351 | | | | 6,032,460 | | | | 14,864,441 | |
The tax-basis components of distributable earnings as of December 31, 2023 were:
| | | Undistributed Ordinary | | | Undistributed Long-term | | | Unrealized Appreciation/ | | | Capital Loss Carryforwards | | | Total Distributable | |
| | | Income | | | Capital Gains | | | (Depreciation) | | | Amount | | | Character | | | Earnings/(Loss) | |
| Strategic Allocation Conservative | | $ | 1,546,082 | | | $ | — | | | $ | (3,040,312) | | | $ | (399,092) | | | Short-term | | | $ | (2,774,270) | |
| | | | | | | | | | | | | | | | (880,948) | | | Long-term | | | | | |
| | | | | | | | | | | | | | | $ | (1,280,040) | | | | | | | | |
| Strategic Allocation Moderate | | | 2,358,632 | | | | 1,261,243 | | | | (2,645,118) | | | | — | | | — | | | | 974,757 | |
| Strategic Allocation Growth | | | 2,059,872 | | | | 2,406,650 | | | | 2,021,279 | | | | — | | | — | | | | 6,487,801 | |
The Portfolios’ major tax jurisdictions are U.S. federal and Arizona state.
As of June 30, 2024, no provision for income tax is required in the Portfolios’ financial statements as a result of tax positions taken on federal and state income tax returns for open tax years. The Portfolios’ federal and state income and federal excise tax returns for tax years for which the applicable statutes of limitations have not expired are subject to examination by the Internal Revenue Service and state department of revenue. Generally, the preceding four tax years remain subject to examination by these jurisdictions.
NOTE 11 — LONDON INTERBANK OFFERED RATE (“LIBOR”)
The London Interbank Offered Rate (“LIBOR”) was the offered rate for short-term Eurodollar deposits between major international banks. The terms of investments, financings or other transactions (including certain derivatives transactions) to which the Portfolio may be a party have historically been tied to LIBOR. In connection with the global transition away from LIBOR led by regulators and market participants, LIBOR was last published on a representative basis at the end of June 2023. Alternative reference rates to LIBOR have been established in most major currencies and markets in these new rates are continuing to develop. The transition away from LIBOR to the use of replacement rates has gone relatively smoothly on the Portfolio and the
financial instruments in which it invests; however, longer-term impacts are still uncertain.
In addition, interest rates or other types of rates and indices which are classed as “benchmarks” have been the subject of ongoing national and international regulatory reform, including under the European Union regulation on indices used as benchmarks in financial instruments and financial contracts (known as the “Benchmarks Regulation”). The Benchmarks Regulation has been enacted into United Kingdom law by virtue of the European Union (Withdrawal) Act 2018 (as amended), subject to amendments made by the Benchmarks (Amendment and Transitional Provision) (EU Exit) Regulations 2019 (SI 2019/657) and other statutory instruments. Following the implementation of these reforms, the manner of administration of benchmarks has changed and may further change in the future, with the
NOTES TO FINANCIAL STATEMENTS AS OF JUNE 30, 2024 (UNAUDITED) (CONTINUED)
NOTE 11 — LONDON INTERBANK OFFERED RATE (“LIBOR”) (continued)
result that relevant benchmarks may perform differently than in the past, the use of benchmarks that are not compliant with the new standards by certain supervised entities may be restricted, and certain benchmarks may be eliminated entirely. Such changes could cause increased market volatility and disruptions in liquidity for instruments that rely on or are impacted by such benchmarks. Additionally, there could be other consequences which cannot be predicted.
NOTE 12 — MARKET DISRUPTION AND GEOPOLITCAL RISK
A Portfolio is subject to the risk that geopolitical events will disrupt securities markets and adversely affect global economies and markets. Due to the increasing interdependence among global economies and markets, conditions in one country, market, or region might adversely impact markets, issuers and/or foreign exchange rates in other countries, including the United States. Wars, terrorism, global health crises and pandemics, and other geopolitical events that have led, and may continue to lead, to increased market volatility and may have adverse short- or long-term effects on U.S. and global economies and markets, generally. For example, the COVID-19 pandemic resulted in significant market volatility, exchange suspensions and closures, declines in global financial markets, higher default rates, supply chain disruptions, and a substantial economic downturn in economies throughout the world. The economic impacts of COVID-19 have created a unique challenge for real estate markets.
Many businesses have either partially or fully transitioned to a remote-working environment and this transition may negatively impact the occupancy rates of commercial real estate over time. Natural and environmental disasters and systemic market dislocations are also highly disruptive to economies and markets. In addition, military action by Russia in Ukraine has, and may continue to, adversely affect global energy and financial markets and therefore could affect the value of investments, including beyond the direct exposure to Russian issuers or nearby geographic regions. The extent and duration of the military action, sanctions, and resulting market disruptions are impossible to predict and could be substantial. A number of U.S. domestic banks and foreign (non-U.S.) banks have recently experienced financial difficulties and, in some cases, failures. There can be no certainty that the actions taken by regulators to limit the effect of those financial difficulties and failures on other banks or other financial institutions or on the U.S. or foreign (non-U.S.) economies generally will be successful. It is possible that more banks or other financial institutions will experience financial difficulties or fail, which may affect adversely other U.S. or foreign (non-U.S.) financial institutions and economies. These events as well as other changes in foreign (non-U.S.) and domestic economic, social, and political conditions also could adversely affect individual issuers or related groups of issuers, securities markets, interest rates, credit ratings, inflation, investor sentiment, and other factors affecting the value of a Portfolio's investments. Any of these occurrences could disrupt the operations of a Portfolio and of a Portfolio's service providers.
NOTE 13 — SUBSEQUENT EVENTS
Dividends: Subsequent to June 30, 2024, the Portfolio declared and paid dividends and distributions of:
| | PER SHARE AMOUNTS | | | | |
| | Net Investment | | | Long-term | | | | |
| | Income | | | Capital Gains | | Payable Date | | Record Date |
| Strategic Allocation Conservative | | | | | | | | |
| Class I | $0.1456 | | $0.1236 | | July 12, 2024 | | July 10, 2024 |
| Class S | $0.1311 | | $0.1236 | | July 12, 2024 | | July 10, 2024 |
| Strategic Allocation Moderate | | | | | | | | |
| Class I | $0.0861 | | $- | | July 12, 2024 | | July 10, 2024 |
| Class S | $0.0704 | | $- | | July 12, 2024 | | July 10, 2024 |
| Strategic Allocation Growth | | | | | | | | |
| Class I | $0.0402 | | $- | | July 12, 2024 | | July 10, 2024 |
| Class S | $0.0227 | | $- | | July 12, 2024 | | July 10, 2024 |
Reorganization: On January 10, 2024, the Board approved a proposal to reorganize Strategic Allocation Conservative (the “Merging Portfolio”) with and into Voya Solution Conservative Portfolio (the “Reorganization”), which is not included in this report. The merger was completed at the close of business July 12, 2024.
NOTES TO FINANCIAL STATEMENTS AS OF JUNE 30, 2024 (UNAUDITED) (CONTINUED)
NOTE 13 — SUBSEQUENT EVENTS (continued)
Reorganization: On January 10, 2024, the Board approved a proposal to reorganize Strategic Allocation Growth (the “Merging Portfolio”) with and into Voya Solution Aggressive Portfolio (the “Reorganization”), which is not included in this report. The merger was completed at the close of business July 12, 2024.
Reorganization: On January 10, 2024, the Board approved a proposal to reorganize Strategic Allocation Moderate (the “Merging Portfolio”) with and into Voya Solution Balanced Portfolio (the “Reorganization”), which is not included in this report. The Reorganization was approved by the shareholders of the Merging Portfolio at a shareholder meeting held on June 27, 2024. The Reorganization was completed at the close of business July 12, 2024.
The Portfolios have evaluated events occurring after the Statements of Assets and Liabilities date through the date that the financial statements were issued (“subsequent events”) to determine whether any subsequent events necessitated adjustment to or disclosure in the financial statements. Other than above, no such subsequent events were identified.
| Voya Strategic Allocation | PORTFOLIO OF INVESTMENTS |
| Conservative Portfolio | as of June 30, 2024 (Unaudited) |
| | | | | | | | | Percentage | |
| | | | | | | | | of Net | |
| Shares | | | | | Value | | | Assets | |
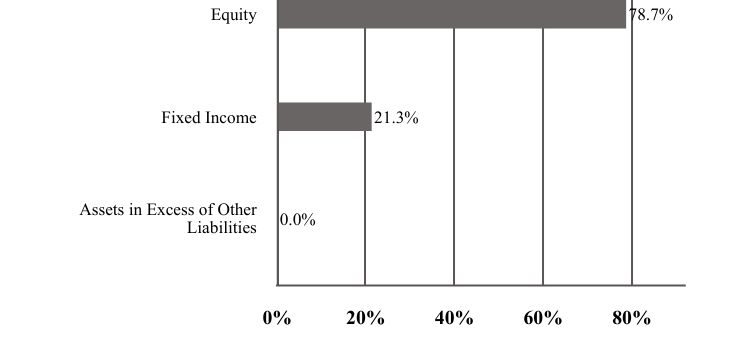
| EXCHANGE-TRADED FUNDS: 4.9% | |
| 33,158 | | | Schwab U.S. TIPS ETF | | $ | 1,724,548 | | | 3.0 | |
| 19,530 | | | Vanguard Long-Term Treasury ETF | | | 1,126,490 | | | 1.9 | |
| | | | Total Exchange-Traded Funds
(Cost $3,059,634) | | | 2,851,038 | | | 4.9 | |
| MUTUAL FUNDS: 95.0% | | | | | | | |
| | | | Affiliated Investment Companies: 95.0% | |
| 316,951 | | | Voya Global Bond Fund - Class R6 | | | 2,256,692 | | | 3.9 | |
| 422,947 | | | Voya High Yield Bond Fund - Class R6 | | | 2,897,190 | | | 5.0 | |
| 2,025,090 | | | Voya Intermediate Bond Fund - Class R6 | | | 17,496,773 | | | 30.1 | |
| 466,962 | | | Voya Large Cap Value Portfolio - Class R6 | | | 2,927,853 | | | 5.0 | |
| 32,380 | | | Voya Large-Cap Growth Fund - Class R6 | | | 1,854,064 | | | 3.2 | |
| 669,866 | | | Voya Limited Maturity Bond Portfolio - Class I | | | 6,310,140 | | | 10.8 | |
| 256,861 (1) | | | Voya MidCap Opportunities Portfolio - Class R6 | | | 1,381,914 | | | 2.4 | |
| 251,212 | | | Voya Multi-Manager International Equity Fund - Class I | | | 2,615,113 | | | 4.5 | |
| 141,932 | | | Voya Multi-Manager Mid Cap Value Fund - Class I | | | 1,410,800 | | | 2.4 | |
| 76,974 | | | Voya Small Company Fund - Class R6 | | | 1,142,293 | | | 2.0 | |
| 520,134 | | | Voya U.S. Stock Index Portfolio - Class I | | | 10,657,542 | | | 18.3 | |
| 330,899 | | | VY® BrandywineGLOBAL - Bond Portfolio - Class I | | | 3,100,522 | | | 5.3 | |
| 12,143 | | | VY® T. Rowe Price Growth Equity Portfolio - Class I | | | 1,249,369 | | | 2.1 | |
| | | | Total Mutual Funds
(Cost $52,294,716) | | | 55,300,265 | | | 95.0 | |
| | | | Total Long-Term Investments
(Cost $55,354,350) | | | 58,151,303 | | | 99.9 | |
| | | | Total Investments in Securities
(Cost $55,354,350) | | $ | 58,151,303 | | | 99.9 | |
| | | | Assets in Excess of Other Liabilities | | | 67,797 | | | 0.1 | |
| | | | Net Assets | | $ | 58,219,100 | | | 100.0 | |
| (1) | Non-income producing security. |
See Accompanying Notes to Financial Statements
| Voya Strategic Allocation | PORTFOLIO OF INVESTMENTS |
| Conservative Portfolio | as of June 30, 2024 (Unaudited) (continued) |
Fair Value Measurements^
The following is a summary of the fair valuations according to the inputs used as of June 30, 2024 in valuing the assets and liabilities:
| | | Quoted Prices | | | | | | | | | | |
| | | in Active Markets | | | Significant Other | | | Significant | | | | |
| | | for Identical | | | Observable | | | Unobservable | | | Fair Value | |
| | | Investments | | | Inputs | | | Inputs | | | at | |
| | | (Level 1) | | | (Level 2) | | | (Level 3) | | | June 30, 2024 | |
| Asset Table | | | | | | | | | | | | | | | | |
| Investments, at fair value | | | | | | | | | | | | | | | | |
| Exchange-Traded Funds | | $ | 2,851,038 | | | $ | — | | | $ | — | | | $ | 2,851,038 | |
| Mutual Funds | | | 55,300,265 | | | | — | | | | — | | | | 55,300,265 | |
| Total Investments, at fair value | | $ | 58,151,303 | | | $ | — | | | $ | — | | | $ | 58,151,303 | |
| ^ | See Note 2, “Significant Accounting Policies” in the Notes to Financial Statements for additional information. |
Transactions with Affiliates
An investment of at least 5% of the voting securities of an issuer, or a company which is under common control with the issuer, results in that issuer becoming an affiliated person as defined by the 1940 Act.
The following table provides transactions during the period ended June 30, 2024, where the following issuers were considered an affiliate:
| | | | | | | | | | | | | | Change In | | | Ending | | | | | | | | | | Net | |
| | | Beginning | | | | | | | | | | Unrealized | | | Fair | | | | | | | Realized | | Capital | |
| | | Fair Value | | | Purchases | | | Sales | | Appreciation/ | | | Value at | | | Investment | | | Gains/ | | Gain | |
| Issuer | | at 12/31/2023 | | | at Cost | | | at Cost | | (Depreciation) | | | 6/30/2024 | | | Income | | | (Losses) | | Distributions | |
| Voya Global Bond Fund - Class R6 | | $ | 2,251,808 | | $ | 266,349 | | $ | (209,671) | | $ | (51,794) | | $ | 2,256,692 | | $ | 50,234 | | $ | (50,402) | | $ | — | |
| Voya High Yield Bond Fund - Class R6 | | | 2,863,790 | | | | 266,223 | | | | (222,070) | | | | (10,753) | | | | 2,897,190 | | | | 97,825 | | | | (13,741) | | | | — | |
| Voya Intermediate Bond Fund - Class R6 | | | 17,463,528 | | | | 2,050,482 | | | | (1,963,119) | | | | (54,118) | | | | 17,496,773 | | | | 405,501 | | | | (249,735) | | | | — | |
| Voya Large Cap Value Portfolio - Class R6 | | | 1,740,938 | | | | 1,250,886 | | | | (519,678) | | | | 455,707 | | | | 2,927,853 | | | | — | | | | (264,098) | | | | — | |
| Voya Large-Cap Growth Fund - Class R6 | | | 1,759,789 | | | | 90,165 | | | | (332,946) | | | | 337,056 | | | | 1,854,064 | | | | — | | | | 33,437 | | | | — | |
| Voya Limited Maturity Bond Portfolio - Class I | | | 6,076,810 | | | | 711,238 | | | | (451,642) | | | | (26,266) | | | | 6,310,140 | | | | 156,043 | | | | (13,652) | | | | — | |
| Voya MidCap Opportunities Portfolio - Class R6 | | | 866,693 | | | | 644,695 | | | | (153,973) | | | | 24,499 | | | | 1,381,914 | | | | — | | | | 13,101 | | | | — | |
| Voya Multi-Manager Emerging Markets Equity Fund - Class I | | | 1,144,632 | | | | 48,331 | | | | (1,085,925) | | | | (107,038) | | | | — | | | | — | | | | 119,080 | | | | — | |
| Voya Multi-Manager International Equity Fund - Class I | | | 1,272,540 | | | | 1,450,856 | | | | (148,280) | | | | 39,997 | | | | 2,615,113 | | | | — | | | | (391) | | | | — | |
| Voya Multi-Manager International Factors Fund - Class I | | | 1,292,984 | | | | 57,710 | | | | (1,147,991) | | | | (202,703) | | | | — | | | | — | | | | 284,163 | | | | — | |
| Voya Multi-Manager Mid Cap Value Fund - Class I | | | 852,709 | | | | 644,694 | | | | (109,185) | | | | 22,582 | | | | 1,410,800 | | | | — | | | | 1,192 | | | | — | |
| Voya Small Company Fund - Class R6 | | | 1,191,782 | | | | 76,100 | | | | (108,773) | | | | (16,816) | | | | 1,142,293 | | | | — | | | | 1,910 | | | | — | |
| Voya U.S. High Dividend Low Volatility Fund - Class R6 | | | 1,695,982 | | | | 23,755 | | | | (1,740,514) | | | | 20,777 | | | | — | | | | — | | | | 52,473 | | | | — | |
| Voya U.S. Stock Index Portfolio - Class I | | | 8,388,800 | | | | 3,187,836 | | | | (2,211,222) | | | | 1,292,128 | | | | 10,657,542 | | | | — | | | | 64,359 | | | | — | |
| VY® BrandywineGLOBAL - Bond Portfolio - Class I | | | 3,011,401 | | | | 409,211 | | | | (290,162) | | | | (29,928) | | | | 3,100,522 | | | | — | | | | (41,304) | | | | — | |
| VY® T. Rowe Price Growth Equity Portfolio - Class I | | | 1,767,377 | | | | 68,028 | | | | (914,698) | | | | 328,662 | | | | 1,249,369 | | | | — | | | | (45,917) | | | | — | |
| | | $ | 53,641,563 | | | $ | 11,246,559 | | $ | (11,609,849) | | | $ | 2,021,992 | | | $ | 55,300,265 | | | $ | 709,603 | | | $ | (109,525) | | | $ | — | |
The financial statements for the above mutual fund[s] can be found at www.sec.gov.
See Accompanying Notes to Financial Statements
| Voya Strategic Allocation | PORTFOLIO OF INVESTMENTS |
| Conservative Portfolio | as of June 30, 2024 (Unaudited) (continued) |
At June 30, 2024, the aggregate cost of securities and other investments and the composition of unrealized appreciation and depreciation of securities and other investments on a tax basis were:
| Cost for federal income tax purposes was $59,245,456. |
| Net unrealized depreciation consisted of: | | | |
| Gross Unrealized Appreciation | | $ | 4,817,810 | |
| Gross Unrealized Depreciation | | (5,911,963) | |
| Net Unrealized Depreciation | | $ | (1,094,153) | |
See Accompanying Notes to Financial Statements
| Voya Strategic Allocation | PORTFOLIO OF INVESTMENTS |
| Moderate Portfolio | as of June 30, 2024 (Unaudited) |
| Shares | | | | | Value | | | Percentage
of Net
Assets | |
| EXCHANGE-TRADED FUNDS: 1.9% | |
| 43,790 | | | Vanguard Long-Term Treasury ETF | | $ | 2,525,807 | | | 1.9 | |
| | | | Total Exchange-Traded Funds
(Cost $2,656,353) | | | 2,525,807 | | | 1.9 | |
| MUTUAL FUNDS: 98.1% | |
| | | | Affiliated Investment Companies: 98.1% | |
| 3,695,955 | | | Voya Intermediate Bond Fund - Class R6 | | | 31,933,052 | | | 24.4 | |
| 1,456,482 | | | Voya Large Cap Value Portfolio - Class R6 | | | 9,132,140 | | | 7.0 | |
| 59,970 | | | Voya Large-Cap Growth Fund - Class R6 | | | 3,433,866 | | | 2.6 | |
| 1,082,560 | | | Voya Limited Maturity Bond Portfolio - Class I | | | 10,197,716 | | | 7.8 | |
| 680,250 (1) | | | Voya MidCap Opportunities Portfolio - Class R6 | | | 3,659,748 | | | 2.8 | |
| 257,488 | | | Voya Multi-Manager Emerging Markets Equity Fund - Class I | | | 2,667,575 | | | 2.0 | |
| 682,933 | | | Voya Multi-Manager International Equity Fund - Class I | | | 7,109,332 | | | 5.4 | |
| 382,616 | | | Voya Multi-Manager Mid Cap Value Fund - Class I | | | 3,803,204 | | | 2.9 | |
| 29,868 (1) | | | Voya Small Cap Growth Fund - Class R6 | | | 1,330,625 | | | 1.0 | |
| 171,248 | | | Voya Small Company Fund - Class R6 | | | 2,541,321 | | | 2.0 | |
| 2,015,321 | | | Voya U.S. Stock Index Portfolio - Class I | | | 41,293,921 | | | 31.6 | |
| 535,994 | | | VY® BrandywineGLOBAL - Bond Portfolio - Class I | | | 5,022,260 | | | 3.8 | |
| 60,472 | | | VY® T. Rowe Price Growth Equity Portfolio - Class I | | | 6,221,956 | | | 4.8 | |
| | | | Total Mutual Funds
(Cost $114,573,035) | | | 128,346,716 | | | 98.1 | |
| | | | Total Long-Term Investments
(Cost $117,229,388) | | | 130,872,523 | | | 100.0 | |
| | | | Total Investments in Securities
(Cost $117,229,388) | | $ | 130,872,523 | | | 100.0 | |
| | | | Assets in Excess of Other Liabilities | | | 2,658 | | | 0.0 | |
| | | | Net Assets | | $ | 130,875,181 | | | 100.0 | |
| (1) | Non-income producing security. |
See Accompanying Notes to Financial Statements
| Voya Strategic Allocation | PORTFOLIO OF INVESTMENTS |
| Moderate Portfolio | as of June 30, 2024 (Unaudited) (continued) |
Fair Value Measurements^
The following is a summary of the fair valuations according to the inputs used as of June 30, 2024 in valuing the assets and liabilities:
| | | Quoted Prices | | | | | | | | | | |
| | | in Active Markets | | | Significant Other | | | Significant | | | | |
| | | for Identical | | | Observable | | | Unobservable | | | Fair Value | |
| | | Investments | | | Inputs | | | Inputs | | | at | |
| | | (Level 1) | | | (Level 2) | | | (Level 3) | | | June 30, 2024 | |
| Asset Table | | | | | | | | | | | | | | | | |
| Investments, at fair value | | | | | | | | | | | | | | | | |
| Exchange-Traded Funds | | $ | 2,525,807 | | | $ | — | | | $ | — | | | $ | 2,525,807 | |
| Mutual Funds | | | 128,346,716 | | | | — | | | | — | | | | 128,346,716 | |
| Total Investments, at fair value | | $ | 130,872,523 | | | $ | — | | | $ | — | | | $ | 130,872,523 | |
| ^ | See Note 2, “Significant Accounting Policies” in the Notes to Financial Statements for additional information. |
Transactions with Affiliates
An investment of at least 5% of the voting securities of an issuer, or a company which is under common control with the issuer, results in that issuer becoming an affiliated person as defined by the 1940 Act.
The following table provides transactions during the period ended June 30, 2024, where the following issuers were considered an affiliate:
| Issuer | | Beginning
Fair Value
at 12/31/2023 | | | Purchases
at Cost | | | Sales
at Cost | | | Change In
Unrealized
Appreciation/
(Depreciation) | | | Ending
Fair
Value at
6/30/2024 | | | Investment
Income | | | Realized
Gains/
(Losses) | | | Net
Capital
Gain
Distributions | |
| Voya Intermediate Bond Fund - Class R6 | | $ | 32,050,200 | | | $ | 2,914,913 | | | $ | (2,874,081) | | | $ | (157,980) | | | $ | 31,933,052 | | | $ | 733,098 | | | $ | (399,562) | | | $ | — | |
| Voya Large Cap Value Portfolio - Class R6 | | | 8,916,620 | | | | 245,118 | | | | (1,767,048) | | | | 1,737,450 | | | | 9,132,140 | | | | — | | | | (976,589) | | | | — | |
| Voya Large-Cap Growth Fund - Class R6 | | | 3,220,664 | | | | 87,542 | | | | (498,849) | | | | 624,509 | | | | 3,433,866 | | | | — | | | | 54,425 | | | | — | |
| Voya Limited Maturity Bond Portfolio - Class I | | | 6,050,934 | | | | 4,697,639 | | | | (521,872) | | | | (28,985) | | | | 10,197,716 | | | | 218,970 | | | | (15,430) | | | | — | |
| Voya MidCap Opportunities Portfolio - Class R6 | | | 3,813,880 | | | | 105,050 | | | | (447,760) | | | | 188,578 | | | | 3,659,748 | | | | — | | | | 35,307 | | | | — | |
| Voya Multi-Manager Emerging Markets Equity Fund - Class I | | | 3,762,735 | | | | 262,414 | | | | (1,517,950) | | | | 160,376 | | | | 2,667,575 | | | | — | | | | 38,416 | | | | — | |
| Voya Multi-Manager International Equity Fund - Class I | | | 3,423,973 | | | | 3,822,581 | | | | (241,416) | | | | 104,194 | | | | 7,109,332 | | | | — | | | | 2,039 | | | | — | |
| Voya Multi-Manager International Factors Fund - Class I | | | 3,472,985 | | | | 114,801 | | | | (3,461,560) | | | | (126,226) | | | | — | | | | — | | | | 345,528 | | | | — | |
| Voya Multi-Manager Mid Cap Value Fund - Class I | | | 3,754,626 | | | | 128,234 | | | | (256,975) | | | | 177,319 | | | | 3,803,204 | | | | — | | | | 703 | | | | — | |
| Voya Short Term Bond Fund - Class R6 | | | 3,632,142 | | | | 236,947 | | | | (3,853,930) | | | | (15,159) | | | | — | | | | 27,924 | | | | (9,549) | | | | — | |
| Voya Small Cap Growth Fund - Class R6 | | | 1,290,588 | | | | 35,017 | | | | (129,188) | | | | 134,208 | | | | 1,330,625 | | | | — | | | | 16,147 | | | | — | |
| Voya Small Company Fund - Class R6 | | | 2,604,044 | | | | 125,341 | | | | (154,927) | | | | (33,137) | | | | 2,541,321 | | | | — | | | | 1,238 | | | | — | |
| Voya U.S. Stock Index Portfolio - Class I | | | 36,153,813 | | | | 3,066,165 | | | | (3,224,469) | | | | 5,298,412 | | | | 41,293,921 | | | | — | | | | 77,183 | | | | — | |
| VY® BrandywineGLOBAL - Bond Portfolio - Class I | | | 4,881,111 | | | | 561,614 | | | | (358,518) | | | | (61,947) | | | | 5,022,260 | | | | — | | | | (53,462) | | | | — | |
| VY® T. Rowe Price Growth Equity Portfolio - Class I | | | 5,818,929 | | | | 157,576 | | | | (1,153,331) | | | | 1,398,782 | | | | 6,221,956 | | | | — | | | | (285,766) | | | | — | |
| | | $ | 122,847,244 | | | $ | 16,560,952 | | | $ | (20,461,874) | | | $ | 9,400,394 | | | $ | 128,346,716 | | | $ | 979,992 | | | $ | (1,169,372) | | | $ | — | |
The financial statements for the above mutual fund[s] can be found at www.sec.gov.
See Accompanying Notes to Financial Statements
| Voya Strategic Allocation | PORTFOLIO OF INVESTMENTS |
| Moderate Portfolio | as of June 30, 2024 (Unaudited) (continued) |
At June 30, 2024, the aggregate cost of securities and other investments and the composition of unrealized appreciation and depreciation of securities and other investments on a tax basis were:
| Cost for federal income tax purposes was $124,279,031. | | | |
| Net unrealized appreciation consisted of: | | | |
| Gross Unrealized Appreciation | | $ | 16,698,364 | |
| Gross Unrealized Depreciation | | | (10,104,873) | |
| Net Unrealized Appreciation | | $ | 6,593,491 | |
See Accompanying Notes to Financial Statements
| Voya Strategic Allocation | PORTFOLIO OF INVESTMENTS |
| Growth Portfolio | as of June 30, 2024 (Unaudited) |
| Shares | | | | | Value | | | Percentage
of Net
Assets | |
| EXCHANGE-TRADED FUNDS: 1.9% | |
| 48,424 | | | Vanguard Long-Term Treasury ETF | | $ | 2,793,096 | | | 1.9 | |
| | | | Total Exchange-Traded Funds
(Cost $2,937,322) | | | 2,793,096 | | | 1.9 | |
| MUTUAL FUNDS: 98.1% | |
| | | | Affiliated Investment Companies: 98.1% | |
| 2,139,036 | | | Voya Intermediate Bond Fund - Class R6 | | | 18,481,273 | | | 12.6 | |
| 1,158,155 | | | Voya Large Cap Value Portfolio - Class R6 | | | 7,261,629 | | | 5.0 | |
| 301,724 | | | Voya Limited Maturity Bond Portfolio - Class I | | | 2,842,237 | | | 2.0 | |
| 1,396,355 (1) | | | Voya MidCap Opportunities Portfolio - Class R6 | | | 7,512,388 | | | 5.1 | |
| 286,665 | | | Voya Multi-Manager Emerging Markets Equity Fund - Class I | | | 2,969,852 | | | 2.0 | |
| 1,313,752 | | | Voya Multi-Manager International Equity Fund - Class I | | | 13,676,159 | | | 9.4 | |
| 778,988 | | | Voya Multi-Manager Mid Cap Value Fund - Class I | | | 7,743,136 | | | 5.3 | |
| 153,237 | | | Voya Short Term Bond Fund - Class R6 | | | 1,420,510 | | | 1.0 | |
| 66,510 (1) | | | Voya Small Cap Growth Fund - Class R6 | | | 2,963,017 | | | 2.0 | |
| 286,013 | | | Voya Small Company Fund - Class R6 | | | 4,244,428 | | | 2.9 | |
| 2,979,272 | | | Voya U.S. Stock Index Portfolio - Class I | | | 61,045,291 | | | 41.7 | |
| 596,199 | | | VY® BrandywineGLOBAL - Bond Portfolio - Class I | | | 5,586,384 | | | 3.8 | |
| 74,789 | | | VY® T. Rowe Price Growth Equity Portfolio - Class I | | | 7,695,071 | | | 5.3 | |
| | | | Total Mutual Funds
(Cost $122,958,472) | | | 143,441,375 | | | 98.1 | |
| | | | Total Long-Term Investments
(Cost $125,895,794) | | | 146,234,471 | | | 100.0 | |
| | | | Total Investments in Securities
(Cost $125,895,794) | | $ | 146,234,471 | | | 100.0 | |
| | | | Assets in Excess of Other Liabilities | | | 67,786 | | | 0.0 | |
| | | | Net Assets | | $ | 146,302,257 | | | 100.0 | |
| (1) | Non-income producing security. |
See Accompanying Notes to Financial Statements
| Voya Strategic Allocation | PORTFOLIO OF INVESTMENTS |
| Growth Portfolio | as of June 30, 2024 (Unaudited) (continued) |
Fair Value Measurements^
The following is a summary of the fair valuations according to the inputs used as of June 30, 2024 in valuing the assets and liabilities:
| | | Quoted Prices | | | | | | | | | | |
| | | in Active Markets | | | Significant Other | | | Significant | | | | |
| | | for Identical | | | Observable | | | Unobservable | | | Fair Value | |
| | | Investments | | | Inputs | | | Inputs | | | at | |
| | | (Level 1) | | | (Level 2) | | | (Level 3) | | | June 30, 2024 | |
| Asset Table | | | | | | | | | | | | | | | | |
| Investments, at fair value | | | | | | | | | | | | | | | | |
| Exchange-Traded Funds | | $ | 2,793,096 | | | $ | — | | | $ | — | | | $ | 2,793,096 | |
| Mutual Funds | | | 143,441,375 | | | | — | | | | — | | | | 143,441,375 | |
| Total Investments, at fair value | | $ | 146,234,471 | | | $ | — | | | $ | — | | | $ | 146,234,471 | |
| ^ | See Note 2, “Significant Accounting Policies” in the Notes to Financial Statements for additional information. |
Transactions with Affiliates
An investment of at least 5% of the voting securities of an issuer, or a company which is under common control with the issuer, results in that issuer becoming an affiliated person as defined by the 1940 Act.
The following table provides transactions during the period ended June 30, 2024, where the following issuers were considered an affiliate:
| Issuer | | Beginning
Fair Value
at 12/31/2023 | | | Purchases
at Cost | | | Sales
at Cost | | | Change In
Unrealized
Appreciation/
(Depreciation) | | | Ending
Fair
Value at
6/30/2024 | | | Investment
Income | | | Realized
Gains/
(Losses) | | | Net
Capital
Gain
Distributions | |
| Voya Intermediate Bond Fund - Class R6 | | $ | 18,723,891 | | | $ | 1,714,092 | | | $ | (1,884,542) | | | $ | (72,168) | | | $ | 18,481,273 | | | $ | 427,748 | | | $ | (260,614) | | | $ | — | |
| Voya Large Cap Value Portfolio - Class R6 | | | 6,943,433 | | | | 119,328 | | | | (918,620) | | | | 1,117,488 | | | | 7,261,629 | | | | — | | | | (515,887) | | | | — | |
| Voya Limited Maturity Bond Portfolio - Class I | | | 2,643,489 | | | | 321,248 | | | | (105,330) | | | | (17,170) | | | | 2,842,237 | | | | 69,234 | | | | (816) | | | | — | |
| Voya MidCap Opportunities Portfolio - Class R6 | | | 6,225,912 | | | | 1,571,191 | | | | (716,380) | | | | 431,665 | | | | 7,512,388 | | | | — | | | | (95,080) | | | | — | |
| Voya Multi-Manager Emerging Markets Equity Fund - Class I | | | 4,107,052 | | | | 269,775 | | | | (1,566,390) | | | | 159,415 | | | | 2,969,852 | | | | — | | | | 63,453 | | | | — | |
| Voya Multi-Manager International Equity Fund - Class I | | | 6,749,771 | | | | 7,063,967 | | | | (383,181) | | | | 245,602 | | | | 13,676,159 | | | | — | | | | (17,169) | | | | — | |
| Voya Multi-Manager International Factors Fund - Class I | | | 6,190,447 | | | | 179,438 | | | | (5,744,269) | | | | (625,616) | | | | — | | | | — | | | | 1,025,393 | | | | — | |
| Voya Multi-Manager Mid Cap Value Fund - Class I | | | 6,126,817 | | | | 1,662,753 | | | | (305,849) | | | | 259,415 | | | | 7,743,136 | | | | — | | | | (4,497) | | | | — | |
| Voya Short Term Bond Fund - Class R6 | | | 1,322,607 | | | | 159,184 | | | | (52,671) | | | | (8,610) | | | | 1,420,510 | | | | 32,192 | | | | (414) | | | | — | |
| Voya Small Cap Growth Fund - Class R6 | | | 2,808,731 | | | | 47,731 | | | | (198,661) | | | | 305,216 | | | | 2,963,017 | | | | — | | | | 29,141 | | | | — | |
| Voya Small Company Fund - Class R6 | | | 4,248,830 | | | | 201,303 | | | | (154,841) | | | | (50,864) | | | | 4,244,428 | | | | — | | | | 1,931 | | | | — | |
| Voya U.S. Stock Index Portfolio - Class I | | | 56,040,331 | | | | 3,283,386 | | | | (6,155,712) | | | | 7,877,286 | | | | 61,045,291 | | | | — | | | | 348,422 | | | | — | |
| VY® BrandywineGLOBAL - Bond Portfolio - Class I | | | 5,293,156 | | | | 656,428 | | | | (278,245) | | | | (84,955) | | | | 5,586,384 | | | | — | | | | (43,088) | | | | — | |
| VY® T. Rowe Price Growth Equity Portfolio - Class I | | | 7,016,921 | | | | 119,328 | | | | (1,071,223) | | | | 1,630,045 | | | | 7,695,071 | | | | — | | | | (262,376) | | | | — | |
| | | $ | 134,441,388 | | | $ | 17,369,152 | | | $ | (19,535,914) | | | $ | 11,166,749 | | | $ | 143,441,375 | | | $ | 529,174 | | | $ | 268,399 | | | $ | — | |
The financial statements for the above mutual fund[s] can be found at www.sec.gov.
See Accompanying Notes to Financial Statements
| Voya Strategic Allocation | PORTFOLIO OF INVESTMENTS |
| Growth Portfolio | as of June 30, 2024 (Unaudited) (continued) |
At June 30, 2024, the aggregate cost of securities and other investments and the composition of unrealized appreciation and depreciation of securities and other investments on a tax basis were:
| Cost for federal income tax purposes was $133,225,032. | | | |
| Net unrealized appreciation consisted of: | | | |
| Gross Unrealized Appreciation | | $ | 22,302,517 | |
| Gross Unrealized Depreciation | | | (9,293,079) | |
| Net Unrealized Appreciation | | $ | 13,009,438 | |
See Accompanying Notes to Financial Statements
SHAREHOLDER MEETING INFORMATION (UNAUDITED)
Proposal:
| 1 | At this meeting, a proposal was submitted to approve an Agreement and Plan of Reorganization by and between Voya Strategic Allocation Portfolios, Inc., on behalf of its series, Strategic Allocation Moderate Portfolio, and Voya Partner, Inc., on behalf of its series, Voya Solution Balanced Portfolio (“Solution Balanced Portfolio”), providing for the reorganization of Strategic Allocation Moderate Portfolio with and into Solution Balanced Portfolio (the "Reorganization") at the close of business July 12, 2024. |
A shareholder meeting of Voya Strategic Allocation Moderate Portfolio was held on June 27, 2024.
| | | | | Proposal | | | Shares voted for | | | Shares voted
against or
withheld | | | Shares
abstained | | | Broker
non-vote | | Total Shares
Voted |
| Class I Trustees | | Voya Strategic Allocation Moderate Portfolio | | | | | | | | | | | | | | | | | | | |
| | | | | 1* | | | | 6,165,100.235 | | | | 392,695.973 | | | | 419,425.939 | | | N/A | | 6,977,222.147 |
* Proposal Passed.
| Investment Adviser | Custodian |
| Voya Investments, LLC | The Bank of New York Mellon |
| 7337 East Doubletree Ranch Road, Suite 100 | 225 Liberty Street |
| Scottsdale, Arizona 85258 | New York, New York 10286 |
| | |
| Distributor | Legal Counsel |
| Voya Investments Distributor, LLC | Ropes & Gray LLP |
| 7337 East Doubletree Ranch Road, Suite 100 | Prudential Tower |
| Scottsdale, Arizona 85258 | 800 Boylston Street |
| | Boston, Massachusetts 02199 |
| | |
| Transfer Agent | |
| BNY Mellon Investment Servicing (U.S.) Inc. | |
| 301 Bellevue Parkway | |
| Wilmington, Delaware 19809 | |
Before investing, carefully consider the investment objectives, risks, charges and expenses of the variable annuity contract or variable life insurance policy and the underlying variable investment options. This and other information is contained in the prospectus for the variable annuity contract or variable life insurance policy and the underlying variable investment options. Obtain these prospectuses from your agent/registered representative and read them carefully before investing.
VPSAR-SAIS (0624)