 The PMI Group, Inc. Supplemental Portfolio Information As of June 30, 2008 Exhibit 99.2 * * * |
 2 The PMI Group, Inc. Forward-Looking Statement Cautionary Statement: Statements in this presentation that are not historical facts or that relate to future plans, events or performance are "forward-looking" statements within the meaning of the Private Securities Litigation Reform Act of 1995. Forward-looking statements in this presentation include our discussion and estimate of expected benefits from our captive reinsurance arrangements. Forward- looking statements are subject to a number of risks and uncertainties including, but not limited to, the following factors: changes in economic conditions, economic recession or slowdowns, adverse changes in consumer confidence, declining housing values, higher unemployment, deteriorating borrower credit, changes in interest rates, changes in housing demand or mortgage originations, changes in credit spreads, credit market disruptions including further deterioration in the housing, mortgage and related credit markets, the loss of a key customer, increased severity or frequency of losses associated with our mortgage insurance and other credit enhancement products, losses associated with the aging of our mortgage insurance portfolio, ratings actions with respect to our or our subsidiaries’ credit ratings or insurer financial strength ratings assigned by the major ratings agencies, heightened competition from other insurance providers, federal and state governmental or quasi-governmental entities, and from alternative products, changes in the charters or business practices of Fannie Mae and Freddie Mac, changes in political and regulatory environments and the application of consumer, lending, insurance and other applicable laws and regulations, the possibility that we may fail to estimate accurately the likelihood, magnitude and timing of losses in connection with establishing loss reserves for our mortgage insurance or financial guaranty businesses or to estimate accurately the fair value amounts of derivative contracts in determining gains and losses on these contracts, limitations on the amount of dividends that The PMI Group may receive from its insurance subsidiaries, or a combination of these and other factors. Other risks and uncertainties are discussed in our SEC filings, including our Annual Report Form 10-K for the year ended December 31, 2007 (in Item 1A) and Form 10-Q for the quarter ended March 31, 2008. We undertake no obligation to update forward-looking statements. |
 3 The PMI Group, Inc. Definition of Terms 2/28s – refers to loans with interest rates that are fixed for two years and reset to a new interest rate at the end of year two for the remaining term of the loan. ARMs – refers to loans with adjustable interest rates. We consider a loan an ARM if its interest rate may be adjusted prior to the loan’s fifth anniversary. A Quality Loans – we define A quality to include loans with credit scores of 620 and greater. Alt-A Loans – we consider a loan Alt-A if it has a credit score of 620 or greater and the borrower requests and is given the option of providing reduced documentation verifying income, assets, deposit information and/or employment. Captive Reinsurance – refers to agreements in which a portion of risk insured by PMI is reinsured by a captive reinsurance company affiliated with the mortgage originator or investor. Defaults – our primary mortgage insurance master policy defines “default” as the borrower’s failure to pay when due an amount equal to the scheduled monthly mortgage payment under the terms of the mortgage. Generally, the master policies require an insured to notify PMI of a default no later than the last business day of the month following the month in which the borrower becomes three monthly payments in default. For reporting purposes and internal tracking purposes, we do not consider a loan to be in default until the borrower has missed to consecutive payments. Depending upon its scheduled payment date, a loan delinquent for two consecutive monthly payments could be reported to PMI between the 31 st and the 60 th day after a missed payment. Flow – generally refers to mortgage insurance offered on a loan-by-loan basis to lenders. GSE Pool – refers to a traditional pool product for mortgage loans sold by PMI’s customers to the GSEs. This product was available from 1997 to 2001. Interest Only Loans – refers to loans that do not reduce principal during the initial deferral period (usually between two and ten years) and therefore do not accumulate equity through loan amortization during the initial deferral period. Approximately 91% of our interest only loans have an initial deferral period of 5 years or greater. The average initial deferral period for loans insured in 2007 was 9 years. Insurance in Force (IIF) – refers to the current principal balance of all outstanding mortgage loans with insurance coverage as of a given date. Less-than-A Quality Loans – we define less-than-A credit quality loans to include loans with credit scores of 619 or below. The majority of our less-than-A-quality loans have credit scores above 575. |
 4 The PMI Group, Inc. Definition of Terms Modified Pool Insurance – modified pool insurance may be used in addition to primary mortgage insurance or may be placed on loans that do not require primary insurance. Coverage of modified pool products varies. Some products provide first loss protection by covering a percentage of the losses on individual loans held within the pool of insured loans up to a stated aggregate loss limit (“stop loss limit”) for the entire pool. Some modified pool products offer mezzanine-level coverage by providing for claims payments only after a predetermined cumulative claims level, or deductible, is reached. New Insurance Written (NIW) – refers to the original principal balance of all loans that receive new primary mortgage insurance coverage during a given period. New Risk Written (NRW) – refers to the aggregate dollar amount of each insured mortgage loan’s current principal balance multiplied by the insurance coverage percentage specified in the policy for all loans that receive new primary mortgage insurance coverage during a given period. Old Pool – refers to a traditional pool product for mortgage loans sold by PMI’s customers to capital market participants. Payment Option ARMs – generally refers to loans that provide the borrower an option every month to make a payment consisting of principal and interest, interest only, or an amount established by the lender that may be less than the interest owed. Primary Insurance – refers to mortgage insurance placed on a loan-by-loan basis through our “flow” channel and mortgage insurance issued for mortgage-backed securities and portfolio investors through our “structured transactions” channel. Primary information does not include pool or modified pool information. Primary Risk in Force – refers to the aggregate dollar amount of each insured mortgage loan’s current principal balance multiplied by the insurance coverage percentage specified in the policy for insurance policies issued through our “flow” and “structured transactions” channels only. Risk in Force (RIF) – refers to the aggregate dollar amount of each insured mortgage loan’s current principal balance multiplied by the insurance coverage percentage specified in the policy. Structured – generally refers to mortgage insurance offered by PMI that covers large portfolios of mortgage loans and is provided to issuers of mortgage backed securities (“MBS”) and portfolio investors. Traditional Pool – covers the entire loss on a defaulted mortgage loan that exceeds the claim payment under any primary insurance coverage, up to a stated aggregate loss limit, or stop loss, for all of the loans in a pool. PMI is not currently offering traditional pool insurance to its customers. |
 5 The PMI Group, Inc. Contents of Presentation PMI Australia Portfolio Characteristics Part 6 Primary Portfolio Characteristics by Vintage Part 3 Focus on Particular Portfolio Segments Part 2 Primary Portfolio Characteristics Part 1 Captive Reinsurance Arrangements Part 5 Modified Pool Portfolio Part 4 |
 Primary Portfolio Characteristics |
 7 The PMI Group, Inc. 2.1% 0.4% 1.6% 3.4% 9.5% 9.4% 14.0% 17.9% 33.2% 8.4% 0% 10% 20% 30% 40% 50% Prior to 2000 2000 2001 2002 2003 2004 2005 2006 2007 2008 $123.2 Billion Primary IIF $30.6 Billion Primary RIF U.S. Portfolio Age Distribution Average Rate (1) (1) Average PMI fixed annual mortgage interest rate 2.2% 0.4% 1.6% 3.4% 9.2% 9.8% 14.3% 18.3% 33.2% 7.6% 0% 10% 20% 30% 40% 50% Prior to 2000 2000 2001 2002 2003 2004 2005 2006 2007 2008 7.18% 7.11% 6.30% 6.15% 6.00% 6.86% 7.52% 8.48% 8.02% Note: Due to rounding, the sum of percentages may not total 100% 6.39% |
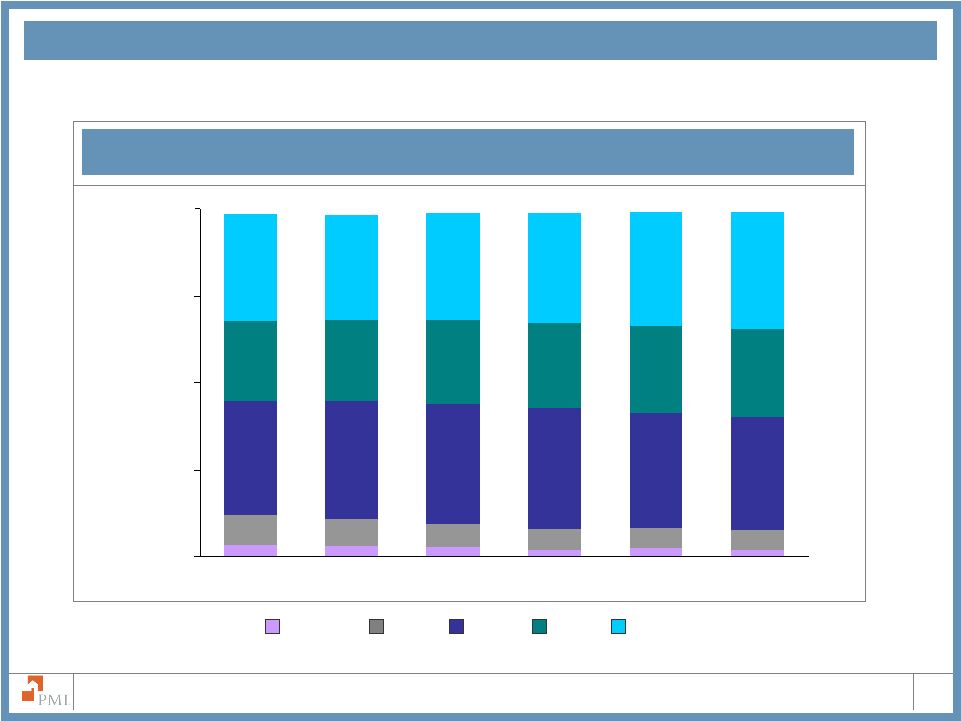 8 The PMI Group, Inc. Primary Risk in Force by FICO Score 8.6% 7.8% 6.8% 5.9% 32.7% 33.8% 34.6% 34.7% 23.3% 23.4% 24.1% 30.5% 30.3% 30.7% 31.5% 32.7% 2.0% 3.3% 3.0% 2.5% 2.2% 2.1% 5.6% 5.9% 32.5% 33.1% 25.4% 24.6% 25.1% 33.5% 0% 25% 50% 75% 100% 2003 2004 2005 2006 2007 Jun-08 Less than 575 720 and above 680 - 719 620 - 679 575 - 619 U.S. Portfolio Credit Score Distribution Excludes unreported FICO scores |
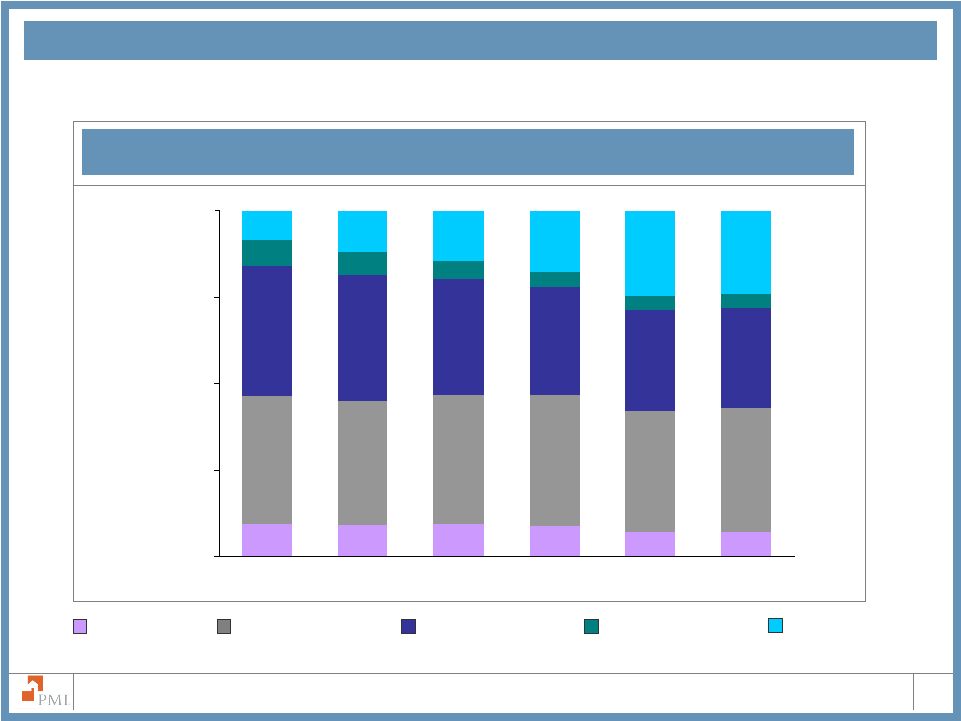 9 The PMI Group, Inc. LTVs between 85.01% and 90% Primary Risk in Force by Loan to Value 9.4% 9.2% 9.3% 7.1% 7.1% 35.7% 37.6% 36.4% 33.7% 31.0% 29.3% 7.4% 6.6% 5.3% 4.6% 3.9% 8.6% 11.9% 14.3% 24.0% 8.9% 37.9% 35.0% 37.4% 35.9% 37.0% 29.5% 3.8% 24.6% 17.6% 0% 25% 50% 75% 100% 2003 2004 2005 2006 2007 Jun-08 LTVs above 97% LTVs between 95.01% and 97% LTVs between 90.01% and 95% LTVs of 85% and below U.S. Portfolio Loan to Value Distribution Note: Due to rounding, the sum of percentages may not total 100% |
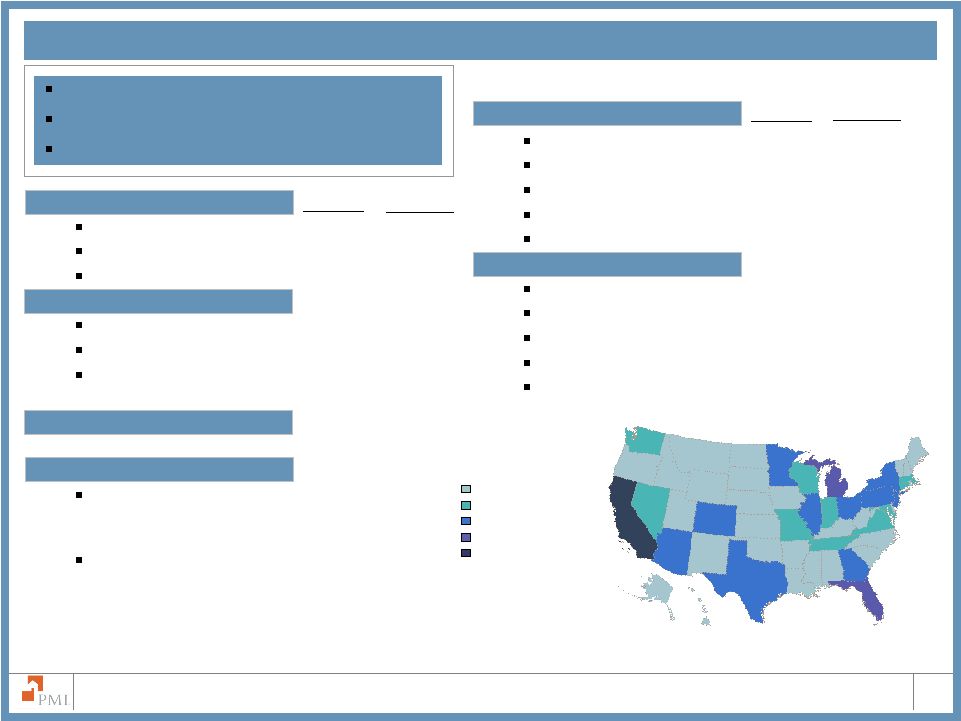
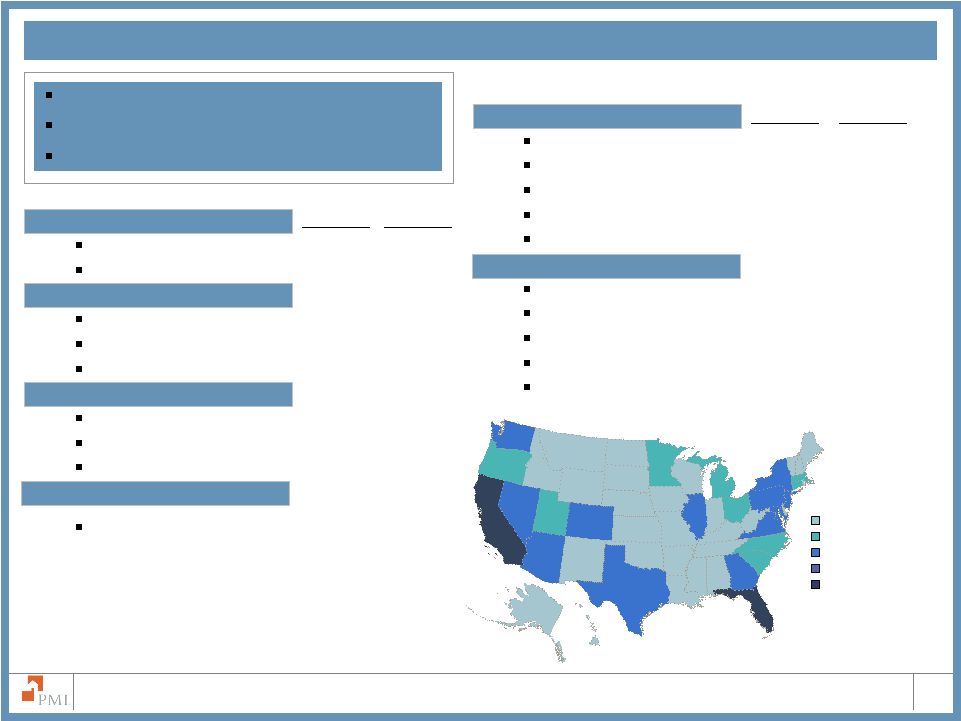
 10 The PMI Group, Inc. U.S. Portfolio Geographic Distribution 1 Top ten states as determined by primary RIF on June 30, 2008 2 Default rates as of June 30 for 2008 and as of December 31 for 2007 and 2006 10.8% 7.2% 8.4% 5.0% 3.8% 3.3% 3.7% 3.0% 4.7% 3.1% Florida 10.8% 18.17% 10.56% 3.44% California 8.4% 18.01% 10.92% 3.56% Texas 7.2% 6.88% 6.03% 5.63% Illinois 5.0% 10.80% 8.19% 5.58% Georgia 4.7% 10.63% 9.50% 7.86% % of RIF June 2008 YE 2007 YE 2006 Ohio 3.8% 11.44% 10.83% 8.79% New York 3.7% 8.19% 6.78% 5.40% Pennsylvania 3.3% 8.41% 7.47% 6.00% Washington 3.1% 5.35% 3.58% 2.76% New Jersey 3.0% 10.59% 7.53% 4.62% % of RIF June 2008 YE 2007 YE 2006 Top Ten States – Percent of Primary Risk in Force and Default Rates Primary Default Rates Primary Default Rates 1 1 2 2 |
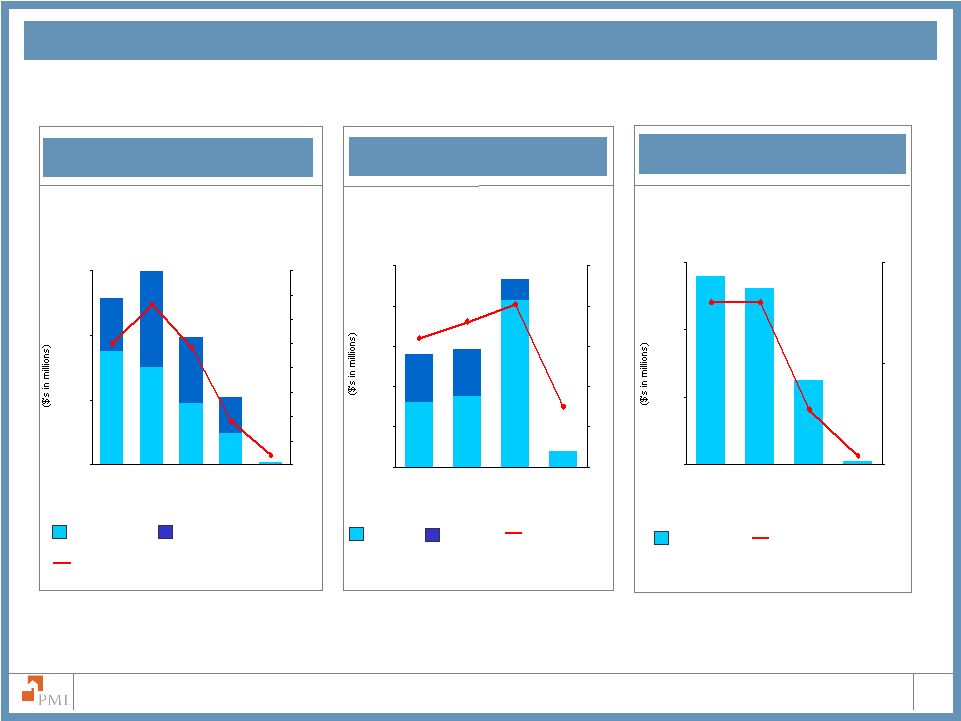
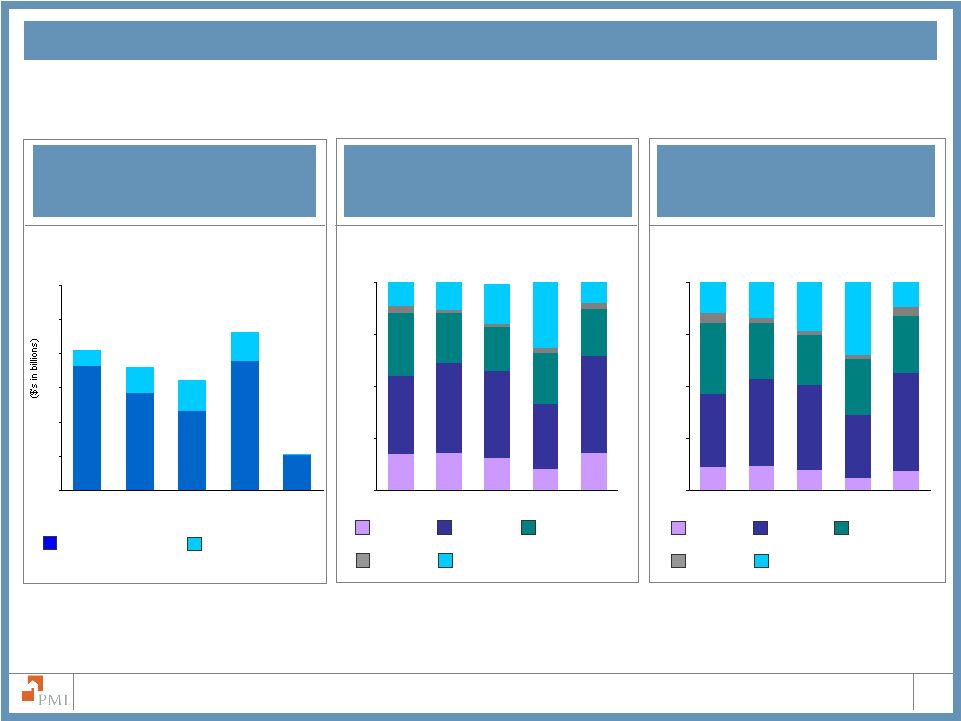 11 The PMI Group, Inc. U.S. Portfolio Primary NIW Characteristics Flow and Structured Primary NIW New Insurance Written by LTV New Risk Written by LTV Note: Due to rounding, the sum of percentages may not total 100% Flow Primary NIW Structured Primary NIW 90.01 – 95% 85.01 – 90% 85 and below Above 97% 95.01%- 97% The increased percentage of above 97% LTV loans in 2007 is due to the reduced availability of alternative mortgage products including piggyback loans and increased activity by the GSEs. With the exception of previous commitments, effective March 1, 2008, PMI discontinued insuring loans with LTV ratios above 97%. 90.01 – 95% 85.01 – 90% 85 and below Above 97% 95.01%- 97% 36.3 28.2 23.3 37.6 10.3 4.9 7.7 8.9 8.6 $41.2 $35.9 $32.2 0.4 $10.7 $46.1 $0 $10 $20 $30 $40 $50 $60 2004 2005 2006 2007 1H 2008 17% 18% 15% 10% 38% 43% 42% 31% 30% 24% 21% 24% 12% 13% 18% 46% 22% 3% 2% 2% 3% 4% 19% 32% 10% 0% 25% 50% 75% 100% 2004 2005 2006 2007 1H 2008 11% 12% 10% 6% 35% 42% 41% 30% 34% 27% 24% 27% 15% 18% 10% 47% 28% 4% 2% 2% 2% 5% 24% 35% 12% 0% 25% 50% 75% 100% 2004 2005 2006 2007 1H 2008 |
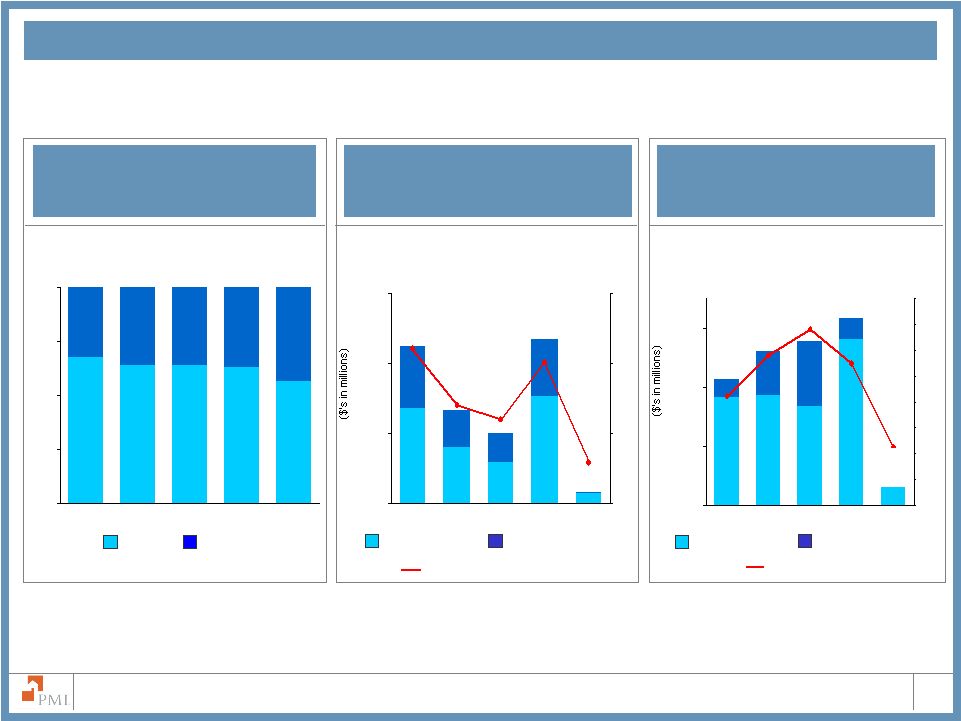 12 The PMI Group, Inc. U.S. Portfolio Primary NIW Characteristics Refinances and Purchases as a % of Primary NIW Less-Than-A Quality Loans - NIW Alt-A Loans – NIW Note: Due to rounding, the sum of percentages may not total 100% Refinances Purchases Less-Than-A Quality Loans - Structured Channel Less-Than-A Quality Loans – Flow Channel Less-Than-A Quality Loans as a percentage of Total Primary NIW Alt-A Loans – Flow Channel Alt-A Loans as a % of Total Primary NIW Alt-A Loan – Structured Channel The increase in less-than-A quality loans as a percentage of total primary NIW is due to the GSEs’ expansion of high-LTV, lower FICO programs. With the exception of previous commitments, effective October 1, 2007, PMI discontinued insuring loans with LTVs above 95% and FICO scores below 620. 57% 63% 64% 64% 68% 43% 37% 36% 36% 32% 0% 25% 50% 75% 100% 2004 2005 2006 2007 1H 2008 3,067 281 1,588 1,153 2,703 1,605 1,084 838 1,780 $4,483 $2,672 $1,991 $306 $4,672 11% 7% 6% 10% 3% $0 $2,000 $4,000 $6,000 2004 2005 2006 2007 1H 2008 0% 5% 10% 15% 1,172 7,304 6,691 7,425 11,242 1,204 4,410 3,002 1,397 $12,639 $1,180 $11,101 $10,427 $8,508 11% 27% 34% 29% 21% $0 $4,000 $8,000 $12,000 2004 2005 2006 2007 1H 2008 0% 5% 10% 15% 20% 25% 30% 35% 40% |
 The PMI Group, Inc. Interest Only Loans - NIW Payment Option ARMs - NIW U.S. Portfolio Primary NIW Characteristics Payment Option ARMS – Flow Channel Total Payment Option ARMs as a percentage of Total Primary NIW Interest Only – Structured Channel Interest Only – Flow Channel Total Interest Only Loans as a percentage of Total Primary NIW ARMs - NIW ARM amounts Primary NIW – Flow Channel ARM amounts Primary NIW – Structured Channel ARMs as a percentage of Total Primary NIW Approximately 3% of Total Primary RIF is subject to rate adjustment in 2008. Approximately 1% is subject to adjustment in 2009. Approximately 98% of interest only loans written in 2007 have an initial deferral period of 5 years or greater and 85% have an initial deferral period of 7 years or greater. For 2006 NIW, initial deferral periods of 5 and 7 years or greater were 89% and 62%, respectively. 13 $6,992 $6,024 $3,802 $1,907 $3,262 $5,889 $4,081 $2,238 $4,145 $200 $7,883 $11,913 $10,254 2% 9% 24% 33% 25% $0 $4,000 $8,000 $12,000 2004 2005 2006 2007 1H 2008 0% 5% 10% 15% 20% 25% 30% 35% 40% 777 3,235 8,296 3,507 2,386 1,025 2,329 $786 $9,321 $5,836 $5,621 7% 20% 18% 16% $0 $2,000 $4,000 $6,000 $8,000 $10,000 2005 2006 2007 1H 2008 0% 5% 10% 15% 20% 25% 2,617 1,252 2,799 0% 8% 8% 3% $0 $1,000 $2,000 $3,000 2005 2006 2007 1H 2008 0% 5% 10% |
 Focus on Particular Portfolio Segments |
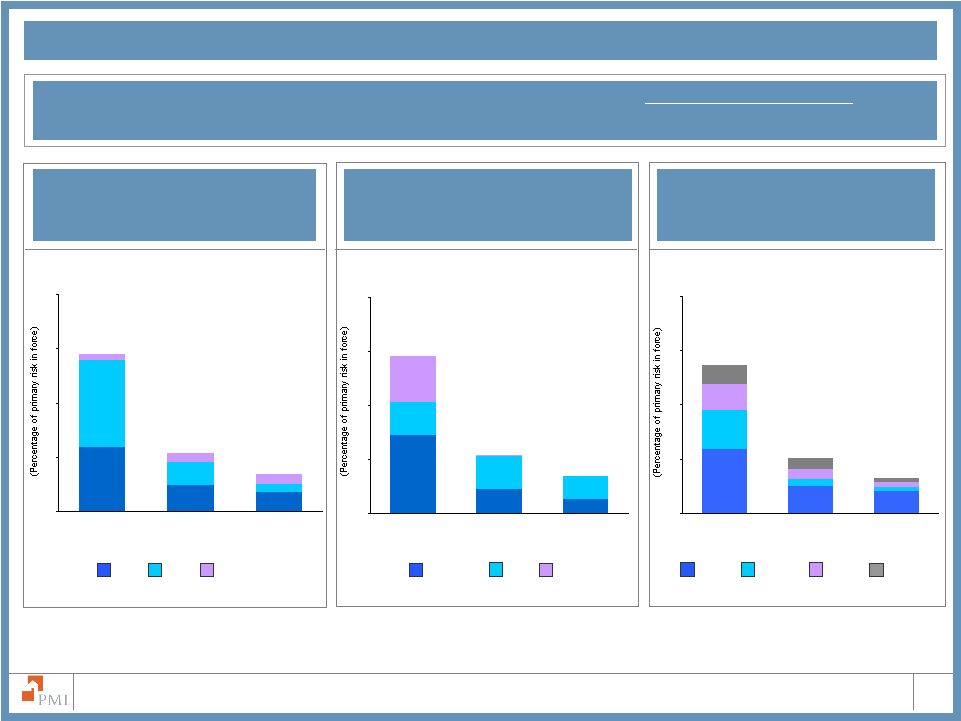 15 The PMI Group, Inc. U.S. Portfolio Interest Rate Adjustments Rate Adjustments by Credit Quality Rate Adjustments of Hybrid Loans and Other ARMs Rate Adjustments in Distressed Geographic Regions Other ARMs 3/27s 2/28s Prime Alt-A Less than A Quality Note: 2/28s resets in 2009 and 2010 are 0.01% and 0.00%, respectively California All Other Florida Auto States Note: Auto states include Michigan, Ohio, Illinois and Indiana 0.08% 0.08% 0.08% Note: Percentages are of total Primary RIF at June 30, 2008 2008 2009 2010 Total interest rate adjustments as a percentage of primary risk in force: 2.9% 1.1% 0.7% 1.18% 0.48% 0.36% 1.59% 0.43% 0.15% 0.12% 0.16% 0.18% 0% 1% 2% 3% 4% 2008 2009 2010 1.44% 0.44% 0.26% 0.61% 0.62% 0.43% 0.85% 0% 1% 2% 3% 4% 2008 2009 2010 1.18% 0.51% 0.40% 0.72% 0.11% 0.48% 0.20% 0.19% 0.34% 0% 1% 2% 3% 4% 2008 2009 2010 ` |
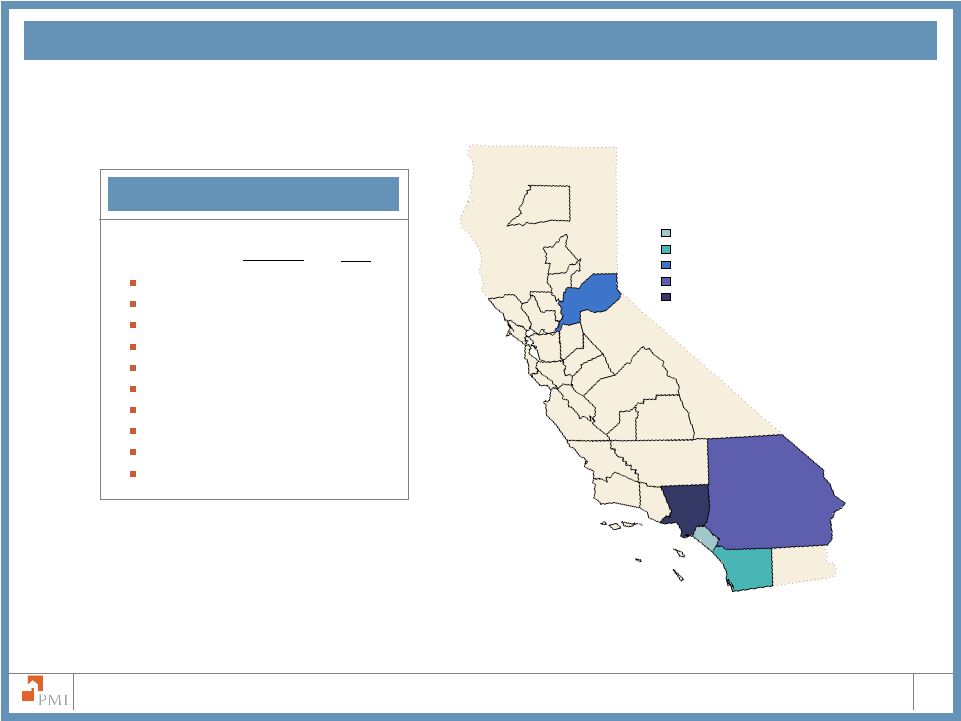
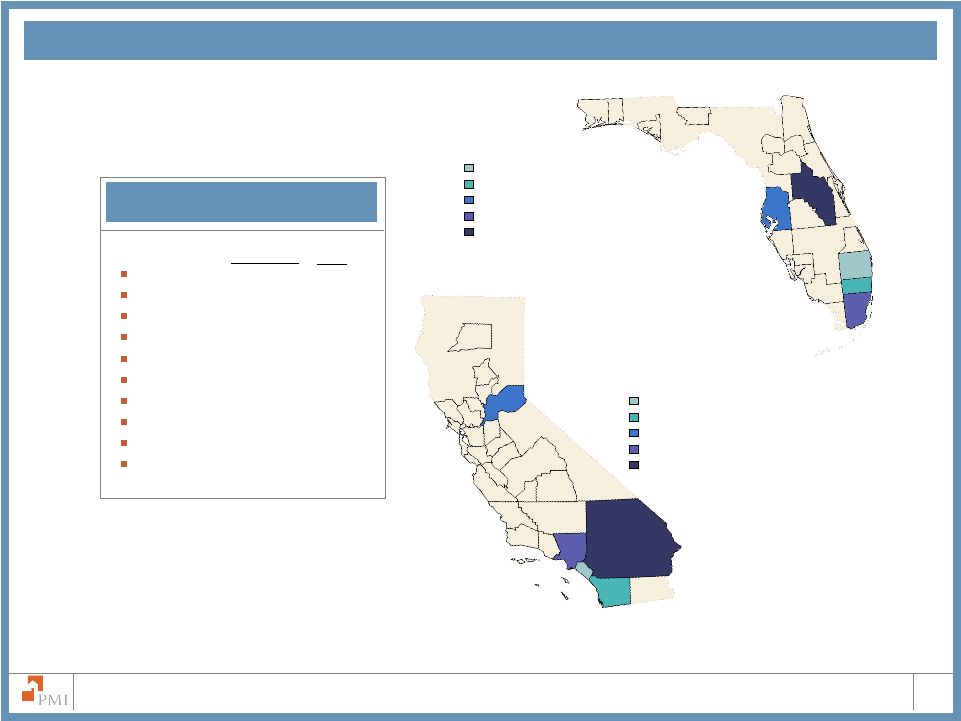
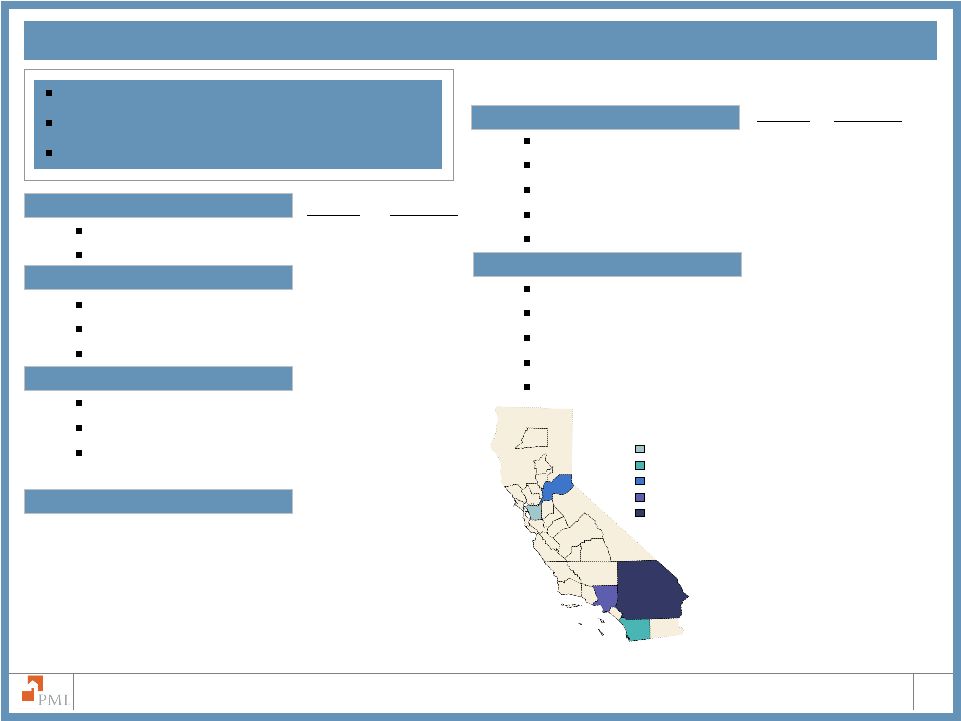 16 The PMI Group, Inc. California at June 30, 2008 1 Condominium includes Townhouses and Cooperatives 2 Excludes unreported FICO scores % of CA RIF % of Total RIF % of CA RIF % of Total RIF $2.6 Billion of Total Risk in Force 8.4% of PMI’s Primary Risk in Force $303,779 Average Loan Size Note: Due to rounding, the sum of percentages may not total 100% FICO Scores² 720 and above 34.3% 2.9% 680-719 31.1% 2.6% 620-679 31.3% 2.6% 575-619 2.4% 0.2% Less than 575 0.6% 0.1% Loan to Value Above 97.00% 17.0% 1.4% 95.01% to 97.00% 1.8% 0.2% 90.01% to 95.00% 23.3% 2.0% 85.01% to 90.00% 44.8% 3.8% 85.00% and below 13.1% 1.1% Oakland-Fremont-Hayward, CA– 0.4% San Diego-Carlsbad-San Marcos – 0.6% Sacramento--Arden-Arcade—Roseville – 0.8% Riverside-San Bernardino-Ontario – 1.8% Los Angeles-Long Beach-Glendale – 1.7% MSA Distribution of Total Primary RIF Loan Type Fixed Rate 70.8% 6.0% ARM 29.2% 2.5% Property Type¹ Single Family 82.0% 6.9% Condominium 13.8% 1.2% Multi-Family and other 4.2% 0.4% Occupancy Primary Residence 91.5% 7.7% Second Home 2.7% 0.2% Non-owner occupied 5.8% 0.5% Alt-A 41.6% 3.5% |
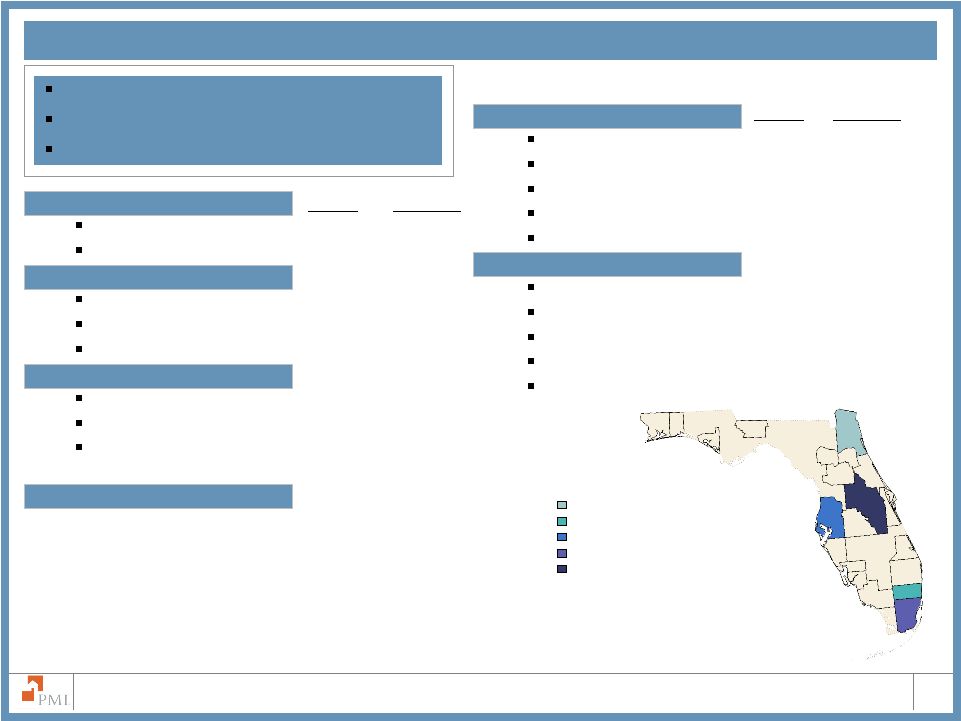 17 The PMI Group, Inc. Florida at June 30, 2008 1 Condominium includes Townhouses and Cooperatives 2 Excludes unreported FICO scores % of FL RIF % of Total RIF % of FL RIF % of Total RIF $3.3 Billion of Total Risk in Force 10.8% of PMI’s Primary Risk in Force $179,824 Average Loan Size Note: Due to rounding, the sum of percentages may not total 100% Map and MSA data have not yet been updated FICO Scores² 720 and above 34.6% 3.7% 680-719 28.4% 3.1% 620-679 31.4% 3.4% 575-619 4.0% 0.4% Less than 575 1.2% 0.1% Loan to Value Above 97.00% 21.6% 2.3% 95.01% to 97.00% 2.5% 0.3% 90.01% to 95.00% 30.3% 3.3% 85.01% to 90.00% 39.1% 4.2% 85.00% and below 6.5% 0.7% MSA Distribution of Total Primary RIF Jacksonville, FL– 0.7% Fort Lauderdale-Deerfield Beach, FL– 1.2% Miami-Miami Beach-Kendall, FL– 1.7% Orlando-Kissimmee, FL– 1.7% Tampa-St. Petersburg-Clearwater, FL– 1.5% Loan Type Fixed Rate 83.3% 9.0% ARM 16.7% 1.8% Property Type¹ Single Family 71.4% 7.7% Condominium 26.4% 2.9% Multi-Family and other 2.2% 0.2% Occupancy Primary Residence 77.9% 8.4% Second Home 12.4% 1.3% Non-owner occupied 9.7% 1.0% Alt-A 38.1% 4.1% |
 The PMI Group, Inc. Loan Type Fixed Rate 88.7% 11.9% ARM 11.3% 1.5% Property Type¹ Single Family 83.5% 11.2% Condominium 12.1% 1.6% Multi-Family and other 4.4% 0.6% Occupancy Primary Residence 92.0% 12.3% Second Home 1.3% 0.2% Non-owner occupied 6.6% 0.9% Alt-A 14.7% 2.0% Auto States (Michigan, Ohio, Illinois, Indiana) at June 30, 2008 1 Condominium includes Townhouses and Cooperatives 2 Excludes unreported FICO scores % of Auto States RIF % of Total RIF % of Auto States RIF % of Total RIF $4.1 Billion of Total Risk in Force 13.4% of PMI’s Primary Risk in Force $132,845 Average Loan Size MSA Distribution of Total Primary RIF Note: Due to rounding, the sum of percentages may not total 100% FICO Scores² 720 and above 31.4% 4.2% 680-719 23.6% 3.2% 620-679 34.3% 4.6% 575-619 6.9% 0.9% Less than 575 3.2% 0.4% Loan to Value Above 97.00% 22.2% 3.0% 95.01% to 97.00% 5.2% 0.7% 90.01% to 95.00% 30.6% 4.1% 85.01% to 90.00% 34.4% 4.6% 85.00% and below 7.6% 1.0% Cleveland-Elyria-Mentor, OH -1.0% Chicago – Naperville –Joliet, IL -3.8% Columbus, OH -0.8% Indianapolis–Carmel, IN -0.7% Warren-Troy-Farmington Hills, MI-0.9% 18 |
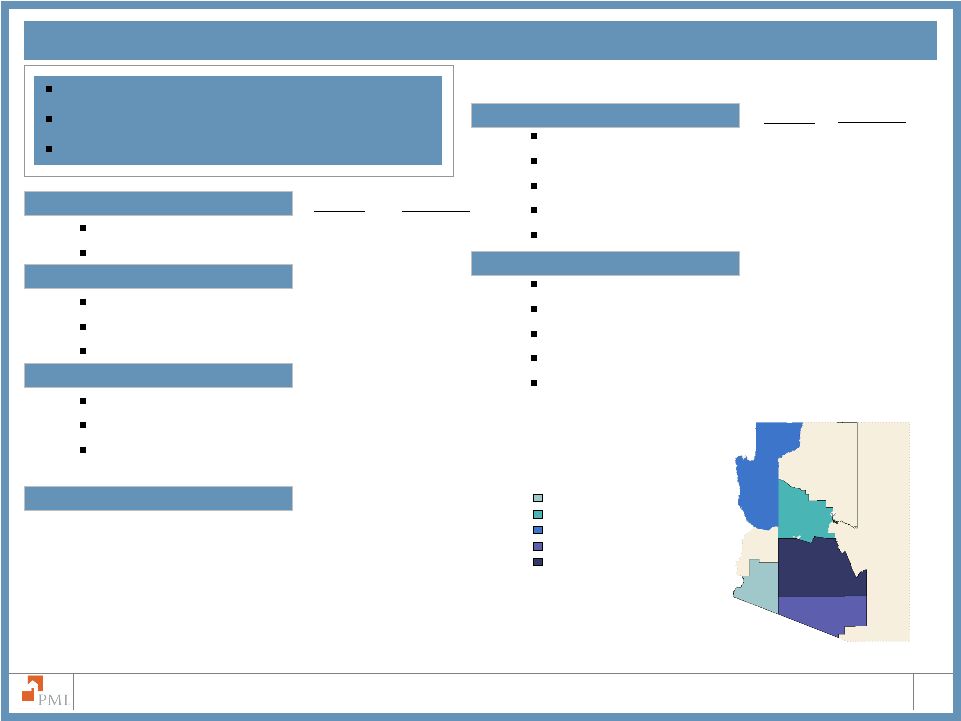 19 The PMI Group, Inc. Loan Type Fixed Rate 86.8% 2.6% ARM 13.2% 0.4% Property Type¹ Single Family 85.2% 2.5% Condominium 11.5% 0.3% Multi-Family and other 3.3% 0.1% Occupancy Primary Residence 83.3% 2.5% Second Home 8.6% 0.3% Non-owner occupied 8.1% 0.2% Alt-A 28.3% 0.8% Arizona at June 30, 2008 1 Condominium includes Townhouses and Cooperatives 2 Excludes unreported FICO scores % of % of AZ RIF Total RIF % of AZ RIF % of Total RIF FICO Scores² 720 and above 35.5% 1.0% 680-719 27.0% 0.8% 620-679 31.1% 0.9% 575-619 4.1% 0.1% Less than 575 1.1% 0.0% Loan to Value Above 97.00% 29.6% 0.9% 95.01% to 97.00% 2.4% 0.1% 90.01% to 95.00% 25.5% 0.8% 85.01% to 90.00% 35.8% 1.1% 85.00% and below 6.8% 0.2% $0.9 Billion of Total Risk in Force 3.0% of PMI’s Primary Risk in Force $191,347 Average Loan Size Note: Due to rounding, the sum of percentages may not total 100% Lake Havasu City-Kingman, AZ-0.1% Yuma, AZ – 0.1% Prescott, AZ-0.1% Tucson, AZ-0.4%% Phoenix-Mesa, AZ – 2.2% MSA Distribution of Total Primary RIF |
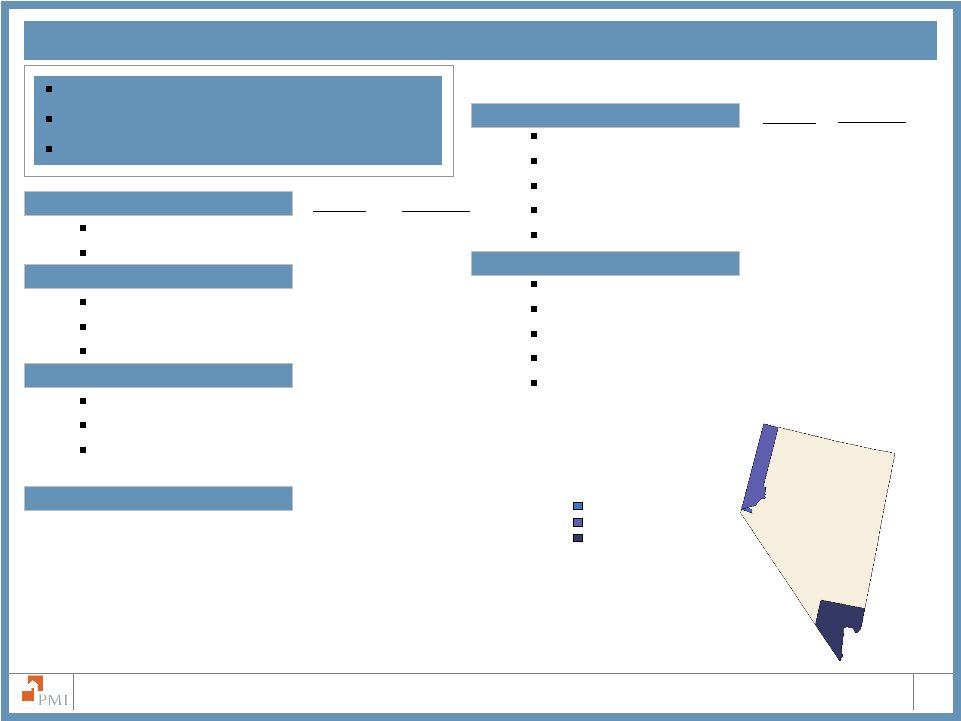 20 The PMI Group, Inc. Loan Type Fixed Rate 78.8% 1.4% ARM 21.2% 0.4% Property Type¹ Single Family 79.6% 1.5% Condominium 18.6% 0.3% Multi-Family and other 1.8% 0.0% Occupancy Primary Residence 80.8% 1.5% Second Home 12.7% 0.2% Non-owner occupied 6.4% 0.1% Alt-A 37.2% 0.7% Nevada at June 30, 2008 1 Condominium includes Townhouses and Cooperatives 2 Excludes unreported FICO scores % of % of NV RIF Total RIF % of NV RIF % of Total RIF FICO Scores² 720 and above 37.5% 0.7% 680-719 28.9% 0.5% 620-679 29.6% 0.5% 575-619 2.9% 0.1% Less than 575 0.5% 0.0% Loan to Value Above 97.00% 21.9% 0.4% 95.01% to 97.00% 1.5% 0.0% 90.01% to 95.00% 28.7% 0.5% 85.01% to 90.00% 40.9% 0.7% 85.00% and below 7.0% 0.1% $0.6 Billion of Total Risk in Force 1.8% of PMI’s Primary Risk in Force $238,899 Average Loan Size Note: Due to rounding, the sum of percentages may not total 100% Las Vegas-Paradise, NV-1.5% Reno-Sparks, NV-0.2% Carson city, NV-0.01% MSA Distribution of Total Primary RIF |
 21 The PMI Group, Inc. Notes 2/28 Hybrid ARMS at June 30, 2008 1Condominium includes Townhouses and Cooperatives 2 Excludes unreported FICO scores FICO Scores² 720 and above 12.5% 0.3% 680-719 22.5% 0.6% 620-679 51.5% 1.4% 575-619 8.5% 0.2% Less than 575 5.0% 0.1% Loan to Value Above 97.00% 9.6% 0.3% 95.01% to 97.00% 0.1% 0.0% 90.01% to 95.00% 21.9% 0.6% 85.01% to 90.00% 37.2% 1.0% 85.00% and below 31.2% 0.9% % of 2/28 RIF % of Total RIF % of Total RIF % of 2/28 RIF $0.9 Billion of Total Risk in Force 2.8% of PMI’s Primary Risk in Force $186,339 Average Loan Size 2/28 Hybrid ARMs that are subject to reset in 2008 represent approximately 1% of Total Primary RIF. 2/28 hybrid ARMs monthly reported notices of default peaked in August 2007. Property Type¹ Single Family 80.7% 2.3% Condominium 7.0% 0.2% Multi-Family and other 12.3% 0.3% Occupancy Primary Residence 75.5% 2.1% Second Home 2.4% 0.1% Non-owner occupied 22.1% 0.6% Alt-A 45.6% 1.3% Note: Due to rounding, the sum of percentages may not total 100% 0% - 1% 1.01% - 2% 2.01% - 5% >10.00% 5.01% - 10% State Distribution of 2/28 RIF |
 22 The PMI Group, Inc. California 31.0% 0.9% Florida 9.3% 0.3% Michigan 5.5% 0.2% Illinois 4.9% 0.1% New York 4.3% 0.1% Ohio 3.6% 0.1% Texas 3.4% 0.1% Arizona 3.4% 0.1% Minnesota 2.4% 0.1% Pennsylvania 2.4% 0.1% 2/28 Hybrid ARMS at June 30, 2008 1 Top ten states as determined by Primary RIF on June 30, 2008 % Total 2/28 RIF % Total RIF Top States¹ MSA Distribution of CA Bulk 2/28 RIF Santa Ana-Anaheim-Irvine –7.1% San Diego-Carlsbad-San Marcos –7.1% Sacramento--Arden-Arcade—Roseville –7.4% Riverside-San Bernardino-Ontario –19.6% Los Angeles-Long Beach-Glendale –21.4% |
 23 The PMI Group, Inc. Greater Than 97% LTV at June 30, 2008 1 Condominium includes Townhouses and Cooperatives 2 Excludes unreported FICO scores FICO Scores² 720 and above 27.8% 6.7% 680-719 23.0% 5.5% 620-679 36.7% 8.8% 575-619 8.5% 2.0% Less than 575 2.8% 0.7% % of >97 RIF % of Total RIF % of >97 RIF % of Total RIF Loan Type Fixed Rate 94.7% 22.7% ARM 5.3% 1.3% Property Type¹ Single Family 85.4% 20.5% Condominium 12.6% 3.0% Multi-Family and other 2.0% 0.5% Occupancy Primary Residence 94.5% 22.6% Second Home 1.3% 0.3% Non-owner occupied 4.2% 1.0% Alt-A 15.3% 3.7% $7.3 Billion of Total Risk in Force 24.0% of PMI’s Primary Risk in Force $151,566 Average Loan Size With the exception of previous commitments, effective March 1, 2008, PMI no longer insures loans with LTV ratios above 97% Guideline Changes Note: Due to rounding, the sum of percentages may not total 100% State Distribution of > 97% LTV RIF 0.00% to 1.00% 1.00% to 2.00% 2.00% to 5.00% 5.00% to 10.00% >10.00% |
 24 The PMI Group, Inc. Top States 1 Florida 9.8% 2.3% Texas 9.3% 2.2% California 6.0% 1.4% Georgia 5.4% 1.3% Illinois 4.9% 1.2% Virginia 3.7% 0.9% Arizona 3.6% 0.9% Washington 3.5% 0.8% Maryland 3.4% 0.8% North Carolina 3.0% 0.7% Greater Than 97% LTV at June 30, 2008 1 Top ten states as determined by Primary RIF on June 30, 2008 % Total > 97% RIF % Total RIF MSA Distribution of FL > 97% LTV RIF Fort Lauderdale-Deerfield Beach, FL-10.5% Tampa-St. Petersburg-Clearwater, FL-14.0% Miami-Miami Beach-Kendall, FL-18.2% Orlando-Kissimmee, FL-16.9% Jacksonville, FL-8.7% MSA Distribution of TX > 97% LTV RIF Dallas – Plano -Irving, TX-20.6% Houston – Sugar Land - Baytown, TX-30.7% Round Rock, TX-6.8% San Antonio, TX-6.9% Fort Worth – Arlington, TX-10.8% MSA Distribution of CA > 97% LTV RIF Bakersfield, CA -5.5% San Diego-Carlsbad-San Marcos –7.7% Sacramento--Arden-Arcade—Roseville –10.2% Riverside-San Bernardino-Ontario – 25.1% Los Angeles-Long Beach-Glendale –16.5% |
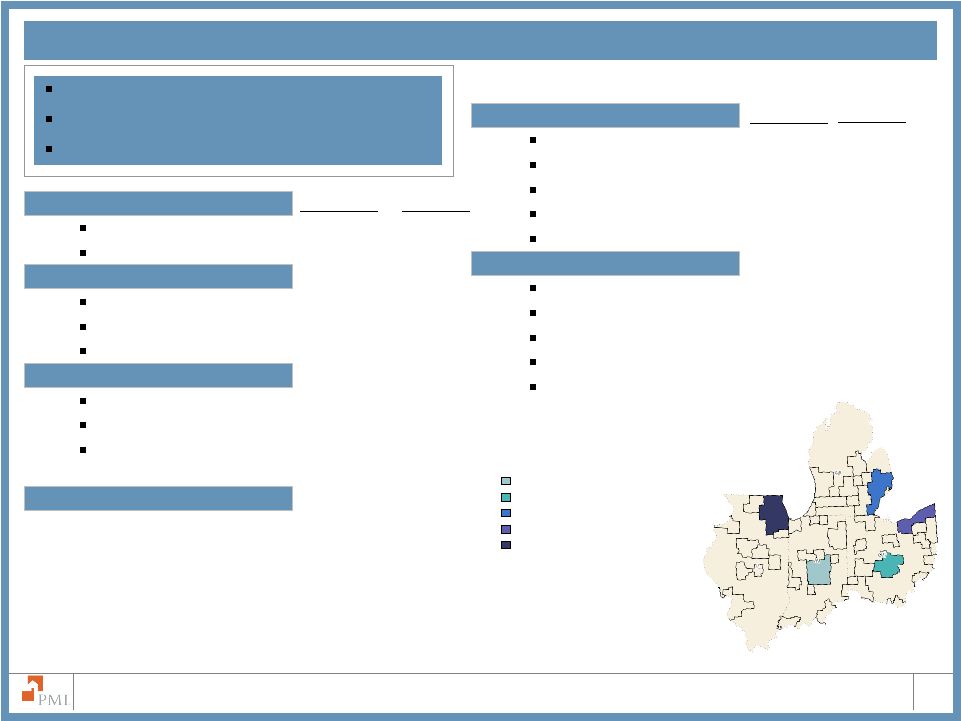
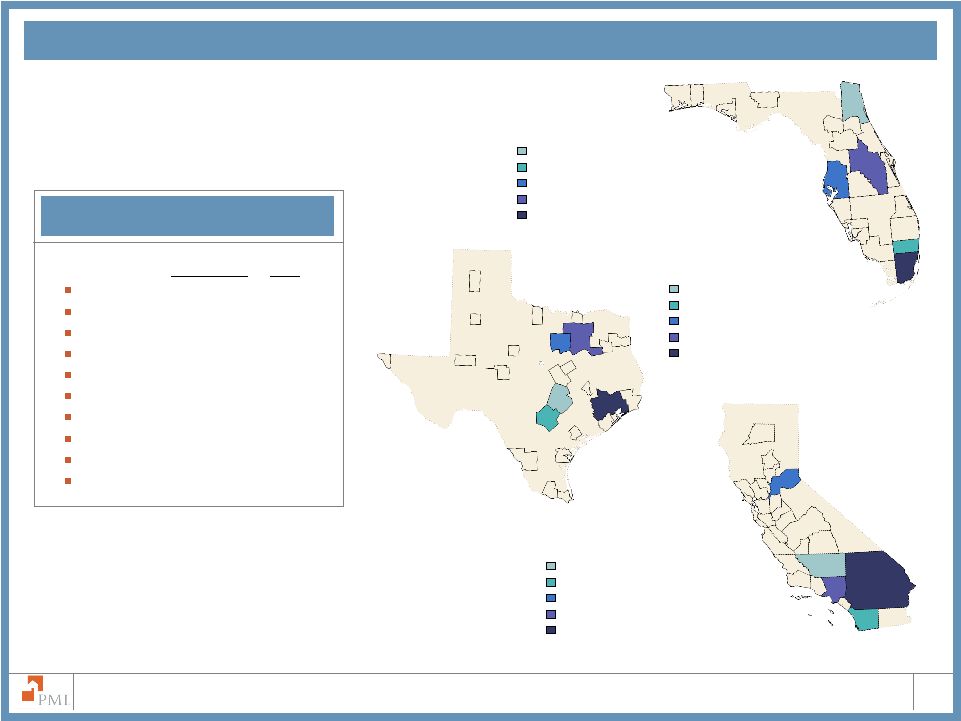
 25 The PMI Group, Inc. Alt-A at June 30, 2008 1 Condominium includes Townhouses and Cooperatives 2 Excludes unreported FICO scores % of Alt-A RIF % of Total RIF % of Total RIF Loan Type Fixed Rate 76.0% 16.6% ARM 24.0% 5.2% Property Type 1 Single Family 78.1% 17.1% Condominium 14.9% 3.3% Multi-Family and other 7.0% 1.5% Occupancy Primary Residence 79.6% 17.4% Second Home 7.0% 1.5% Non-owner occupied 13.4% 2.9% $6.7 Billion of Total Risk in Force 21.9% of PMI’s Primary Risk in Force $217,089 Average Loan Size Guideline Changes % of Alt-A RIF Note: Due to rounding, the sum of percentages may not total 100% State Distribution of Alt-A RIF 0.00% to 1.00% 1.00% to 2.00% 2.00% to 5.00% 5.00% to 10.00% >10.00% FICO Scores 2 720 and above 37.4% 8.2% 680-719 35.6% 7.8% 620-679 26.9% 5.9% 575-619 0.0% 0.0% Less than 575 0.0% 0.0% Loan to Value Above 97.00% 16.8% 3.7% 95.01% to 97.00% 0.2% 0.0% 90.01% to 95.00% 26.4% 5.8% 85.01% to 90.00% 47.3% 10.3% 85.00% and below 9.3% 2.0% With the exception of previous commitments, effective June 1, 2008, PMI no longer insures Alt-A |
 26 The PMI Group, Inc. Top States¹ Florida 18.9% 4.1% California 16.0% 3.5% Illinois 4.9% 1.1% New York 4.8% 1.0% Texas 4.4% 1.0% New Jersey 4.2% 0.9% Arizona 3.8% 0.8% Maryland 3.2% 0.7% Virginia 3.2% 0.7% Nevada 3.1% 0.7% Alt-A at June 30, 2008 1 Top ten states as determined by Primary RIF on June 30, 2008 % Total Alt-A RIF % Total RIF Tampa-St. Petersburg-Clearwater, FL-12.3% MSA Distribution of FL Alt-A RIF West Palm Beach-Boca Raton, FL-7.7% Fort Lauderdale-Deerfield Beach, FL-11.5% Miami-Miami Beach-Kendall, FL-15.2% Orlando-Kissimmee, FL-18.9% MSA Distribution of CA Alt-A RIF Santa Ana-Anaheim-Irvine –5.7% San Diego-Carlsbad-San Marcos –7.8% Sacramento--Arden-Arcade—Roseville –8.5% Riverside-San Bernardino-Ontario –22.9% Los Angeles-Long Beach-Glendale –22.0% |
 Primary Portfolio Characteristics by Vintage |
 28 The PMI Group, Inc. $30.6 Billion Primary Risk in Force and $2.8 Billion Pool Risk in Force* Primary Flow 77% Domestic Mortgage Insurance Primary Structured 14% Domestic MI 57% Modified Pool 8% General Portfolio Categories Primary Flow Insurance $26.0 billion of risk in force Primary mortgage insurance offered to lenders on a loan-by-loan basis Primary Structured Insurance $4.6 billion of risk in force Credit enhancement solutions offered across the credit spectrum to agency and non-agency MBS issuers as well as portfolio investors Modified Pool Risk in Force $2.3 billion of risk in force Insurance offered to agency and non-agency MBS issuers and investors Other Pool $0.5 billion of risk in force Prior to 2002, PMI offered certain pool insurance products, referred to principally as GSE or Old Pool, to lenders, the GSEs and non-agency market Other Pool 1% * At June 30, 2008 |
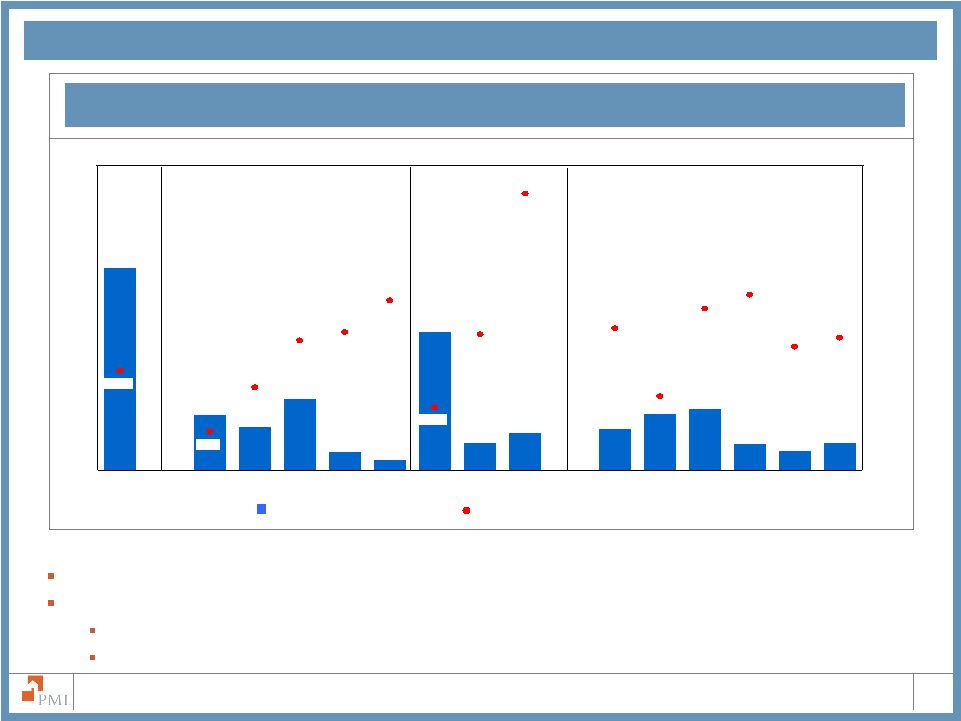
 29 The PMI Group, Inc. $4,099 $855 $621 $4,241 $2,687 $3,317 $2,576 $6,693 $7,341 $1,727 $30,633 $10,252 $9,944 $7,787 $27,091 30.6% 12.1% 8.6% 18.2% 18.0% 21.7% 12.4% 19.3% 45.4% 20.2% 10.3% 4.7% 9.0% 13.1% 23.4% Total 720 and above 680 - 719 620 - 679 575 - 619 Less than 575 Fixed Rate ARMs 2/28s Interest Only LTV>97 Alt-A Calif. Florida Auto States Risk Characteristics Risk Characteristics: Total Primary Portfolio Risk in Force (dollars in millions) Default Rate (as measured by policies) Credit Score Total Loan Type Total Primary Portfolio: PMI’s total primary book is primarily driven by the flow channel Loans are primarily fixed rate and owner occupied with FICO scores greater than 620 Certain geographies and select products have exhibited heightened levels of defaults Total Primary Risk in Force as of June 30, 2008 |
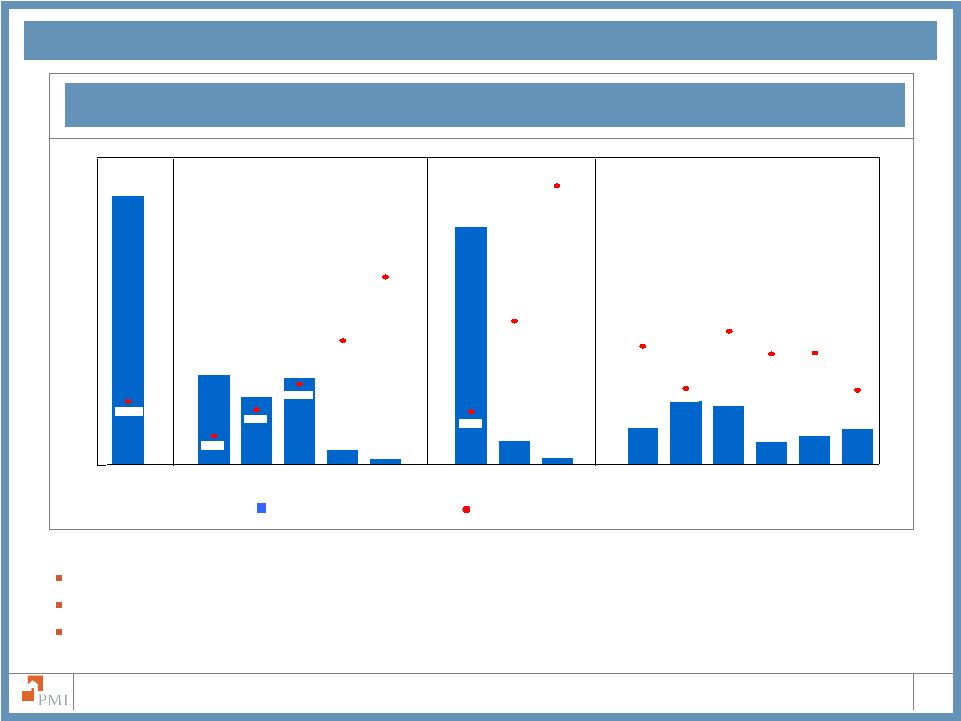
 30 The PMI Group, Inc. Loan Type Credit Score¹ Primary Portfolio Characteristics Primary RIF as of June 30, 2008 1 Excludes unreported FICO scores 2 At origination Note: - Interest rate adjustments as a percentage of Total Risk in Force are approximately 3% and 1% in 2008 and 2009, respectively. - Categories are not mutually exclusive except for Credit Score and Loan Type 2/28s All $ in Millions, except for Average Loan Size Specific Portfolio Characteristics Interest Only LTV > 97% Alt-A California Florida Auto States Avg Loan Size Avg LTV² Avg FICO Total Fixed RateFixed Rate Less than 575 575 - 619 720 and above ARM 620 - 679 680 - 719 Total 2/28s Total Portfolio $30,632.8 $620.6 $1,727.3 $9,943.6 $7,787.3 $10,251.6 $27,091.4 $2,686.5 $854.9 Default Rate 10.3% 30.6% 20.2% 13.1% 9.0% 4.7% 8.6% 23.4% 45.4% 2008 Vintage $2,325.7 $10.6 $56.4 $556.5 $644.4 $1,055.7 $2,282.0 $43.7 $0.0 Default Rate 1.9% 23.4% 7.3% 2.8% 1.7% 0.8% 1.9% 2.6% n/a 2007 Vintage $10,163.8 $254.8 $641.4 $3,078.7 $2,682.4 $3,478.7 $9,435.5 $664.3 $64.0 Default Rate 11.0% 28.6% 18.6% 12.1% 10.1% 5.8% 10.4% 17.2% 26.3% 2006 Vintage $5,618.5 $72.4 $238.3 $1,984.8 $1,471.8 $1,822.2 $4,398.8 $798.2 $421.5 Default Rate 15.2% 36.9% 24.7% 19.3% 14.8% 8.0% 11.4% 29.6% 48.6% 2005 Vintage $4,370.3 $57.2 $195.3 $1,589.3 $1,121.2 $1,374.9 $3,365.2 $690.6 $314.5 Default Rate 12.3% 36.6% 24.0% 16.1% 11.2% 5.6% 8.3% 27.0% 45.0% 2004 Vintage and Prior $8,154.5 $225.6 $595.9 $2,734.3 $1,867.5 $2,520.1 $7,609.9 $489.7 $54.9 Default Rate 8.5% 29.9% 20.0% 10.9% 6.0% 3.0% 7.6% 21.9% 44.6% Total Portfolio $4,240.7 $7,340.6 $6,693.4 $2,576.3 $3,317.0 $4,098.7 $157,509 93% 690 Default Rate 19.3% 12.4% 21.7% 18.0% 18.2% 12.1% 2008 Vintage $177.1 $286.6 $255.6 $245.5 $174.2 $270.8 $202,671 91% 711 Default Rate 2.4% 3.7% 4.4% 3.3% 5.4% 2.1% 2007 Vintage $2,287.0 $3,622.8 $2,970.9 $1,107.9 $1,125.2 $1,102.6 $192,978 94% 687 Default Rate 17.9% 13.4% 20.6% 17.5% 21.4% 11.0% 2006 Vintage $1,076.8 $1,468.2 $1,900.4 $536.4 $825.7 $721.7 $176,064 93% 692 Default Rate 22.8% 13.4% 27.4% 35.2% 29.1% 16.3% 2005 Vintage $601.8 $823.0 $975.8 $396.9 $589.9 $642.4 $159,336 92% 693 Default Rate 22.3% 12.9% 24.7% 27.9% 20.2% 13.8% 2004 Vintage and Prior $98.0 $1,140.0 $590.7 $289.6 $602.0 $1,361.2 $114,308 92% 687 Default Rate 17.6% 10.4% 13.6% 6.1% 8.4% 11.9% |
 31 The PMI Group, Inc. $3,466 $0 $383 $3,308 $2,058 $2,866 $1,980 $5,284 $6,059 $1,322 $25,983 $8,975 $8,312 $6,787 $23,925 32.7% 10.2% 8.4% 17.8% 15.3% 20.2% 12.5% 18.2% 19.2% 9.3% 4.5% 8.4% 11.5% 23.9% Total 720 and above 680 - 719 620 - 679 575 - 619 Less than 575 Fixed Rate ARMs 2/28s Interest Only LTV>97 Alt-A Calif. Florida Auto States Flow Risk in Force as of June 30, 2008 Risk Characteristics: Flow Risk in Force (dollars in millions) Default Rate (as measured by policies) Credit Score Total Loan Type Risk Characteristics Primary Flow Portfolio: PMI’s primary flow book represents 85% of primary insurance and is primarily owner occupied, fixed rate loans with FICO scores greater than 620 Approximately 94% of flow risk in force is within conforming loan limits Approximately 58% of flow risk in force is in captive reinsurance agreements |
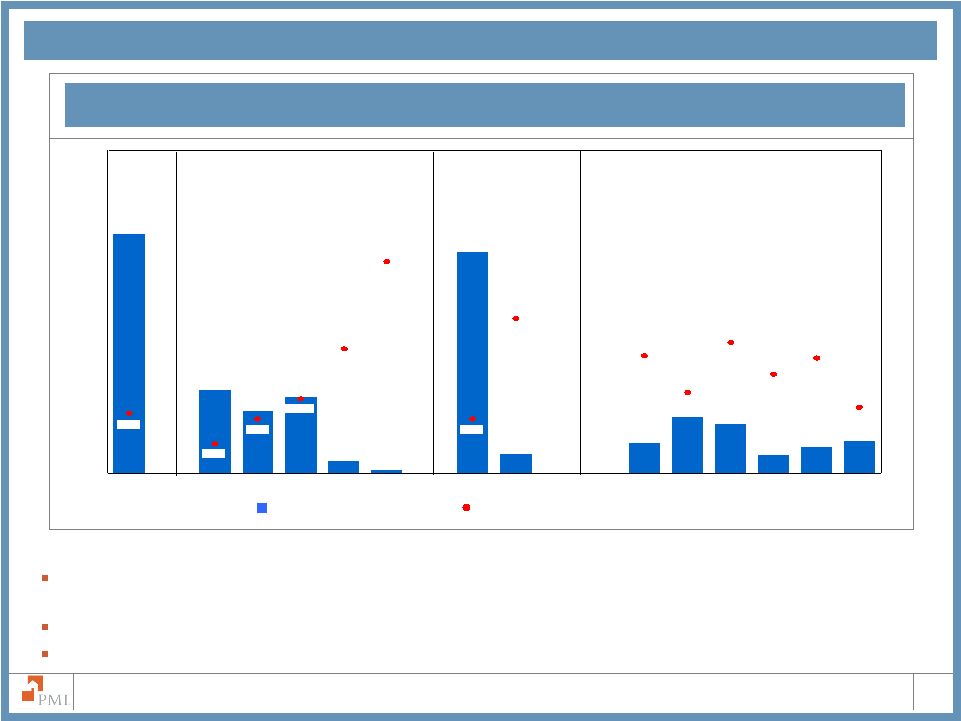
 32 The PMI Group, Inc. Flow Portfolio Characteristics Flow RIF as of June 30, 2008 All $ in Millions, except for Average Loan Size 1 Excludes unreported FICO scores 2 At origination Note: Categories are not mutually exclusive except for Credit Score and Loan Type Interest Only LTV > 97% Alt-A California Florida Auto States Avg Loan Size Avg LTV2 Avg FICO 620 - 679 680 - 719 Fixed Rate Credit Score¹ Loan Type Less than 575 575 - 619 720 and above ARM 620 - 679 680 - 719 Total 2/28s Total Portfolio $3,308.4 $6,059.4 $5,283.9 $1,979.7 $2,866.1 $3,465.9 $156,995 93% 694 Default Rate 18.2% 12.5% 20.2% 15.3% 17.8% 10.2% 2008 Vintage $176.0 $264.8 $254.8 $244.4 $172.4 $265.5 $202,856 91% 711 Default Rate 2.4% 3.9% 4.4% 3.3% 5.4% 2.1% 2007 Vintage $2,028.1 $3,105.7 $2,641.2 $979.8 $957.3 $929.7 $195,763 94% 689 Default Rate 18.5% 14.3% 21.0% 18.2% 23.5% 11.0% 2006 Vintage $649.1 $1,096.6 $1,189.8 $285.3 $652.0 $503.6 $175,443 93% 696 Default Rate 21.9% 12.9% 25.9% 29.5% 27.7% 10.8% 2005 Vintage $369.2 $725.0 $703.2 $222.1 $542.8 $518.0 $156,781 92% 697 Default Rate 17.7% 11.3% 21.8% 23.4% 19.2% 10.5% 2004 Vintage and Prior $86.0 $867.3 $494.9 $248.1 $541.6 $1,249.1 $115,078 92% 692 Default Rate 16.0% 10.2% 12.7% 5.5% 8.2% 10.9% Total Portfolio $25,982.9 $383.4 $1,321.9 $8,311.5 $6,786.5 $8,975.4 $23,925.3 $2,057.7 $0.0 Default Rate 9.3% 32.7% 19.2% 11.5% 8.4% 4.5% 8.4% 23.9% n/a 2008 Vintage $2,273.4 $9.6 $53.4 $541.0 $631.0 $1,036.3 $2,235.2 $38.2 $0.0 Default Rate 1.9% 25.9% 7.6% 2.9% 1.7% 0.8% 1.9% 3.2% n/a 2007 Vintage $8,575.3 $187.1 $521.6 $2,665.9 $2,321.5 $2,851.5 $8,152.9 $422.4 $0.0 Default Rate 11.5% 35.6% 20.1% 12.4% 10.8% 6.3% 11.1% 22.6% n/a 2006 Vintage $4,123.2 $30.3 $158.7 $1,351.8 $1,119.1 $1,434.4 $3,486.8 $636.4 $0.0 Default Rate 12.2% 37.8% 21.1% 14.5% 12.6% 7.2% 10.2% 30.8% n/a 2005 Vintage $3,663.4 $25.4 $136.6 $1,255.4 $959.9 $1,253.7 $3,117.7 $545.7 $0.0 Default Rate 9.9% 34.6% 20.3% 12.8% 9.5% 5.0% 8.0% 26.2% n/a 2004 Vintage and Prior $7,347.6 $131.0 $451.6 $2,497.4 $1,755.0 $2,399.5 $6,932.7 $415.0 $0.0 Default Rate 7.9% 28.8% 18.7% 10.5% 5.9% 3.0% 7.4% 18.1% n/a |
 33 The PMI Group, Inc. Risk Characteristics: Structured Transactions $237 $932 $1,281 $855 $633 $3,166 $451 $597 $1,410 $406 $4,650 $1,276 $1,632 $1,001 $629 45.4% 27.9% 22.3% 21.7% 10.3% 20.3% 28.8% 26.5% 12.1% 23.3% 22.7% 16.3% 6.3% 13.6% 21.3% Total 720 and above 680 - 719 620 - 679 575 - 619 Less than 575 Fixed Rate ARMs 2/28s Interest Only LTV>97 Alt-A Calif. Florida Auto States ` Risk in Force (dollars in millions) Default Rate (as measured by policies) Credit Score Total Loan Type Risk Characteristics Primary Structured Portfolio: PMI’s primary structured book represents approximately 15% of total primary insurance Highest defaults are reported in the 2/28 hybrid ARMs product, in which: Approximately 83% of 2/28 hybrid ARM risk in force has passed the interest rate reset date Monthly reporting of notices of default began to decline in August 2007 Structured Transactions Risk in Force as of June 30, 2008 |
 34 The PMI Group, Inc. Structured Portfolio Characteristics Structured RIF as of June 30, 2008 All $ in Millions, except for Average Loan Size 1 Excludes unreported FICO scores 2 At origination Note: - Approximately 3% of Total Primary RIF is subject to a rate adjustment in 2008. 2/28 Hybrid ARMs that are subject to a rate reset in 2008 represent approximately 1% of Total Primary RIF. - 2/28 hybrid ARMs monthly reported notices of default peaked in late 2007. - Categories are not mutually exclusive except for Credit Score and Loan Type Avg FICO Interest Only LTV > 97% Alt-A California Florida Auto States Avg Loan Size Avg LTV2 Avg FICO Credit Score¹ Fixed Rate Loan Type Less than 575 575 - 619 720 and above ARM 620 - 679 680 - 719 Total 2/28s Total Portfolio $4,649.9 $237.2 $405.4 $1,632.1 $1,000.8 $1,276.2 $3,166.1 $628.8 $854.9 Default Rate 16.3% 27.9% 22.7% 21.3% 13.6% 6.3% 10.3% 22.3% 45.4% 2008 Vintage $52.3 $1.0 $3.0 $15.5 $13.4 $19.4 $46.8 $5.5 $0.0 Default Rate 1.2% 9.8% 4.4% 1.3% 0.7% 0.2% 1.3% 0.0% n/a 2007 Vintage $1,588.5 $67.7 $119.8 $412.8 $360.9 $627.2 $1,282.6 $241.9 $64.0 Default Rate 8.9% 17.2% 14.8% 11.0% 6.6% 3.5% 7.0% 13.9% 26.3% 2006 Vintage $1,495.3 $42.1 $79.6 $633.0 $352.7 $387.8 $912.0 $161.8 $421.5 Default Rate 24.5% 36.2% 32.1% 31.3% 22.7% 11.2% 16.4% 26.4% 48.6% 2005 Vintage $706.9 $31.8 $58.7 $333.9 $161.3 $121.2 $247.5 $144.9 $314.5 Default Rate 27.2% 38.5% 34.5% 32.2% 23.8% 12.0% 12.6% 30.3% 45.0% 2004 Vintage and Prior $806.9 $94.6 $144.3 $236.9 $112.5 $120.6 $677.2 $74.7 $54.9 Default Rate 13.6% 31.4% 23.8% 14.8% 7.0% 3.1% 9.6% 38.4% 44.6% Total Portfolio $932.3 $1,281.2 $1,409.5 $596.6 $450.9 $632.8 $160,296 92% 669 Default Rate 23.3% 12.1% 26.5% 28.8% 20.3% 21.7% 2008 Vintage $1.1 $21.8 $0.8 $1.1 $1.8 $5.3 $197,446 93% 693 Default Rate 0.0% 1.9% 0.0% 0.0% 6.0% 1.9% 2007 Vintage $258.9 $517.1 $329.7 $128.1 $167.9 $172.9 $181,525 94% 676 Default Rate 13.8% 9.5% 18.0% 13.1% 12.2% 10.8% 2006 Vintage $427.7 $371.6 $710.6 $251.1 $173.7 $218.1 $177,977 91% 679 Default Rate 24.5% 15.5% 29.6% 43.2% 34.4% 29.3% 2005 Vintage $232.6 $98.0 $272.6 $174.8 $47.1 $124.4 $175,167 89% 667 Default Rate 32.5% 27.8% 33.8% 35.8% 31.4% 27.7% 2004 Vintage and Prior $12.0 $272.7 $95.8 $41.5 $60.4 $112.1 $108,404 91% 648 Default Rate 27.1% 11.0% 17.8% 10.1% 10.4% 21.2% |
 35 The PMI Group, Inc. Modified Pool Portfolio Characteristics All $ in Millions Modified Pool: Data shown in this exhibit is an aggregation of unique pools into book years Risk reduction features of modified pool, which may include deductibles and stop loss limits, mitigate risk of loss from loans insured Modified Pool with Deductibles Modified Pool without Deductibles All $ in Millions 2004 and Prior 2005 2006 2007 2008 Original Insured Balance $35,500 $13,234 $18,913 $9,056 $0 Insurance in Force $8,308 $7,247 $14,136 $8,116 $0 Original Stop Loss Amount $1,315 $367 $640 $273 $0 Original Deductible Amount $266 $78 $136 $81 $0 Original Risk in Force $1,049 $289 $504 $192 $0 Losses Applicable to Deductible $90 $14 $12 $1 $0 PMI's Claims Paid to Date $0 $0 $0 $0 $0 Deductible Balance $176 $64 $124 $80 $0 2004 and Prior 2005 2006 2007 2008 Original Insured Balance $16,375 $2,577 $8,442 $0 $0 Insurance in Force $2,566 $1,511 $4,990 $0 $0 Original Stop Loss Amount $483 $54 $317 $0 $0 PMI's Claims Paid to Date $34 $4 $5 $0 $0 Stop Loss Balance (Remaining RIF) $450 $49 $312 $0 $0 |
 36 The PMI Group, Inc. Modified Pool Portfolio Characteristics Modified Pool IIF as of June 30, 2008 1 Excludes unreported FICO scores ² Excludes Balloon, Buy Down, and Other ³ At origination Note: Categories are not mutually exclusive except for Credit Score and Loan Type All $ in Millions, except for Average Loan Size Specific Portfolio Characteristics Specific Portfolio Characteristics Credit Score1 Loan Type2 Credit Score1 Loan Type2 Total Total Fixed Rate ARM 2/28s Fixed Rate ARM 2/28s Deductible Non Deductible Less than 575 575 - 619 620 - 679 680 - 719 720 and above Less than 575 575 - 619 620 - 679 680 - 719 720 and above Interest Only LTV > 97% Alt-A California Florida Auto States Avg Loan Size Avg LTV3 Avg FICO Interest Only LTV > 97% Alt-A California Florida Auto States Avg Loan Size Avg LTV3 Avg FICO Total Portfolio $37,807 $570 $1,299 $11,973 $11,361 $12,593 $35,328 $2,304 $3 2008 Vintage $0 $0 $0 $0 $0 $0 $0 $0 $0 2007 Vintage $8,116 $144 $329 $2,843 $2,739 $2,060 $7,620 $494 $0 2006 Vintage $14,136 $72 $161 $5,368 $4,763 $3,772 $13,947 $188 $2 2005 Vintage $7,247 $7 $58 $1,763 $2,298 $3,120 $5,883 $1,362 $1 2004 Vintage and Prior $8,308 $347 $751 $1,999 $1,561 $3,641 $7,878 $260 $0 Total Portfolio $9,067 $398 $906 $3,358 $2,156 $2,028 $5,620 $3,362 $26 2008 Vintage $0 $0 $0 $0 $0 $0 $0 $0 $0 2007 Vintage $0 $0 $0 $0 $0 $0 $0 $0 $0 2006 Vintage $4,990 $387 $858 $2,186 $1,003 $555 $1,849 $3,115 $26 2005 Vintage $1,511 $0 $6 $310 $450 $727 $1,487 $24 $0 2004 Vintage and Prior $2,566 $11 $42 $862 $703 $746 $2,284 $223 $0 Total Portfolio $1,234 $1,857 $3,363 $1,410 $797 $1,016 $152,856 86 673 2008 Vintage $0 $0 $0 $0 $0 $0 n/a n/a n/a 2007 Vintage $0 $0 $0 $0 $0 $0 n/a n/a n/a 2006 Vintage $360 $1,784 $402 $565 $490 $788 $157,544 93 651 2005 Vintage $703 $1 $1,075 $322 $116 $64 $197,957 76 718 2004 Vintage and Prior $171 $72 $1,887 $523 $191 $164 $128,232 78 694 Total Portfolio $12,271 $921 $23,978 $6,262 $3,906 $3,856 $170,694 78 694 2008 Vintage $0 $0 $0 $0 $0 $0 n/a n/a n/a 2007 Vintage $3,471 $753 $5,361 $1,563 $792 $748 $204,451 82 686 2006 Vintage $5,282 $56 $10,260 $2,320 $1,671 $1,326 $188,915 79 693 2005 Vintage $2,723 $41 $5,030 $1,312 $919 $678 $176,263 79 709 2004 Vintage and Prior $795 $71 $3,327 $1,067 $524 $1,104 $126,165 75 691 |
 Captive Reinsurance |
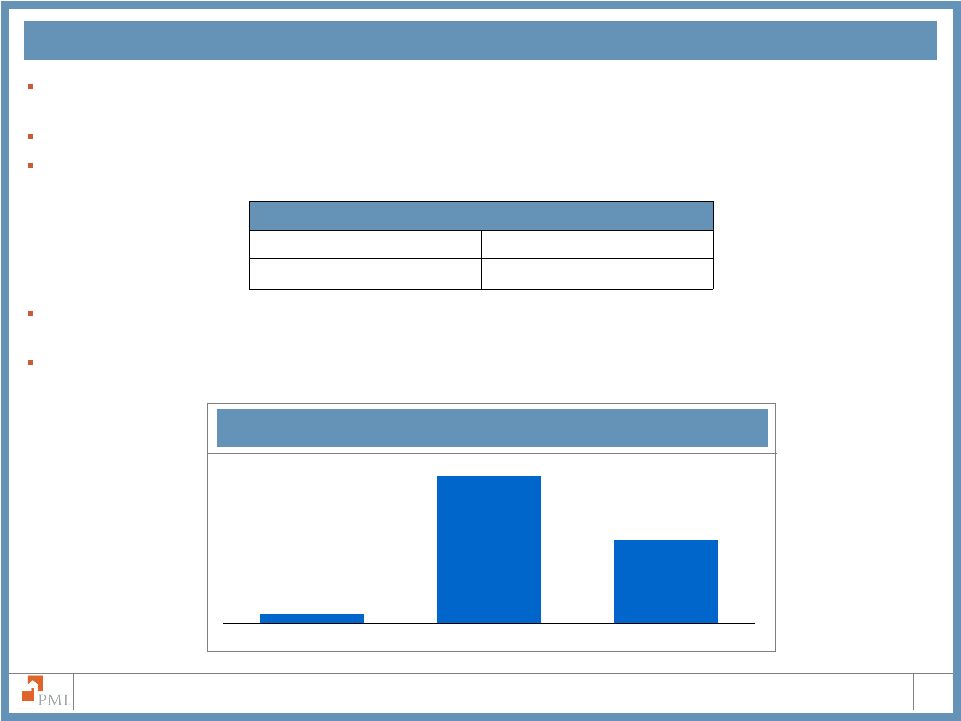 38 The PMI Group, Inc. $310 $550 $34 2007 2008 2009 Captive reinsurers are wholly-owned, bankruptcy remote subsidiaries of originators that provide mezzanine level reinsurance for loans for which PMI has provided primary mortgage insurance coverage. PMI is the named beneficiary on captive trust balances totaling approximately $788 million as of June 30, 2008. At June 30, 2008, approximately 62.4% of flow risk in force was covered by captive reinsurance agreements, including: Captive trust balances will continue to grow with new insurance written in the flow channel. Future ceded premiums can be used to meet capital adequacy for existing book years. Based on current expectations of defaults, PMI forecasts approximately the following reductions to total incurred losses as a result of captive reinsurance agreements in 2008 and 2009: Expected Benefit from Captive Reinsurance Agreements PMI’s Captive Reinsurance Agreements (Dollars in Millions) Flow Risk in Force Covered by Captives ~ 56% of LTVs >97%* ~ 66% of less-than-A quality ~ 47% of Alt-A ~ 66% of prime * Captive coverage for LTVs greater than 97% may overlap with other listed categories |
 39 The PMI Group, Inc. PMI’s Captive Reinsurance Agreements PMI Mortgage Insurance Co. Captive Reinsurance Agreements Analysis (Dollars in Millions) Note: For the combined captive trust arrangements, the weighted average entry point is 4.10% and the weighted average exit point is 12.15%. $3,368 $273.0 1,159 130.4 249 55.4 187 49.9 $4,963 $508.8 $5.4 $0.3 $769 $19.4 496 21.8 1,371 72.9 324 26.4 $2,959 $140.6 $9.4 $0.0 $380 $6.0 542 18.5 1,442 57.6 720 42.3 $3,083 $124.4 $16.8 $0.0 $4,086 $53.1 559 13.4 132 3.1 3 0.2 $4,780 $69.8 $0.4 $0.0 $32.1 $0.3 $703.0 Ever to Losses Date Incurred RIF Current Cumulative Cumulative Benefit Incurred Loss Paid Loss Captive Captive Benefit December 31, 2007 Progression Original to Attachment RIF Point 2004 Book Year $16,006 0 - 50% $1,973 $227.6 $2,266 $224.1 6,427 50 - 75% 1,125 158.1 1,697 187.9 4,134 75-99% 1,065 117.1 525 70.1 1,742 Attached 187 62.5 173 50.2 $28,308 $4,350 $565.3 $8.5 $0.6 $4,662 $532.3 $6.6 $0.3 2005 Book Year $116 0 - 50% $75 $1.8 $362 $9.1 479 50 - 75% 290 11.0 527 25.7 944 75-99% 542 34.6 289 17.7 3,203 Attached 1,761 200.8 1,643 136.8 $4,742 $2,668 $248.2 $82.0 $0.0 $2,821 $189.3 $31.3 $0.0 2006 Book Year $70 0 - 50% $53 $0.5 $57 $0.4 1 50 - 75% 1 0.0 347 10.3 367 75-99% 277 12.6 473 24.0 3,209 Attached 2,434 248.1 2,027 143.8 $3,646 $2,765 $261.2 $115.9 $0.0 $2,903 $178.5 $48.2 $0.0 2007 Book Year $110 0 - 50% $99 $1.1 $455 $6.1 235 50 - 75% 220 5.9 2,797 80.5 267 75-99% 240 8.4 855 29.9 4,966 Attached 4,605 285.1 1,213 51.1 $5,579 $5,163 $300.5 $97.6 $0.0 $5,320 $167.5 $16.5 $0.0 Cumulative Captive Benefit $304.1 $0.8 $102.7 $0.3 Total Captive Trust Balances $787.8 $747.0 Paid Loss Ever to Cumulative Cumulative Cumulative Benefit Captive Benefit Current RIF Date Incurred Losses March 31, 2008 June 30, 2008 Current Date Incurred Captive Paid Loss Ever to Captive Incurred Loss Captive Cumulative Incurred Loss RIF Losses Benefit Benefit Note: Due to rounding, the totals may not equal the sum of each category |
 PMI Australia Portfolio Characteristics |
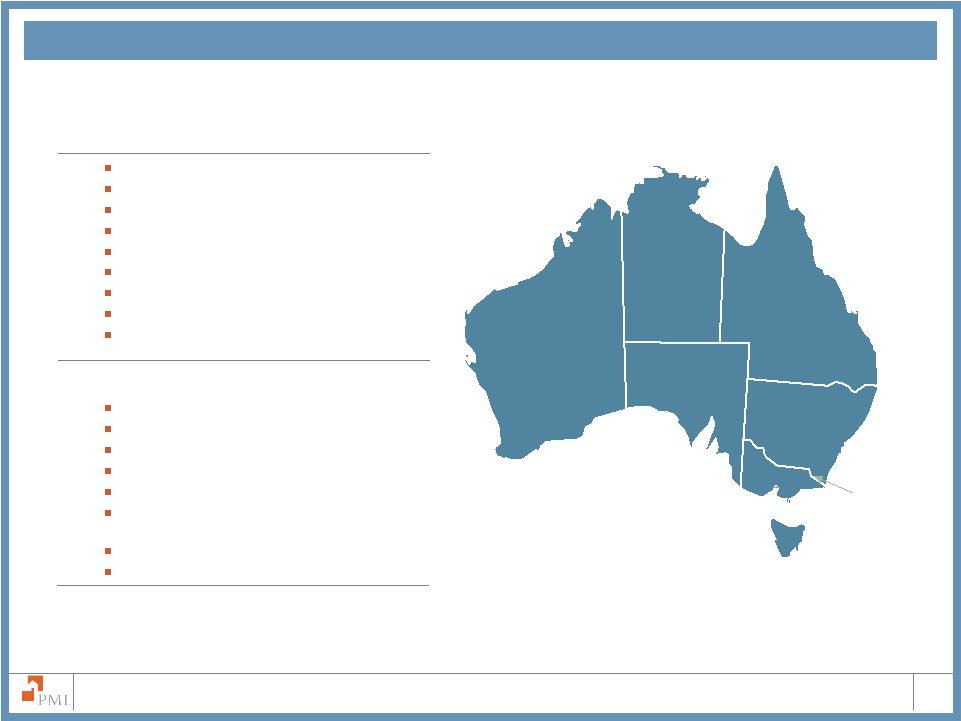 41 The PMI Group, Inc. Australian Portfolio Geographic Distribution Risk in Force by State¹ New South Wales 33.0% Queensland 23.0% Victoria 18.3% Western Australia 12.3% South Australia 7.2% New Zealand 2.9% Australian Capital Territory (ACT) 1.8% Tasmania 0.9% Northern Territory 0.6% Australian Population by State² New South Wales 6,927,000 32.7% Victoria 5,246,100 24.8% Queensland 4,228,300 20.0% Western Australia 2,130,800 10.0% South Australia 1,591,900 7.5% Australian Capital Territory (ACT) 340,800 1.6% Tasmania 495,800 2.3% Northern Territory 217,600 1.0% 21,180,600 100.0% 1 Risk in force as of June 30, 2008 2 Source: Australian Bureau of Statistics, December 2007 (Does not add due to rounding) Western Australia South Australia Northern Territory Queensland New South Wales Victoria Tasmania ACT |
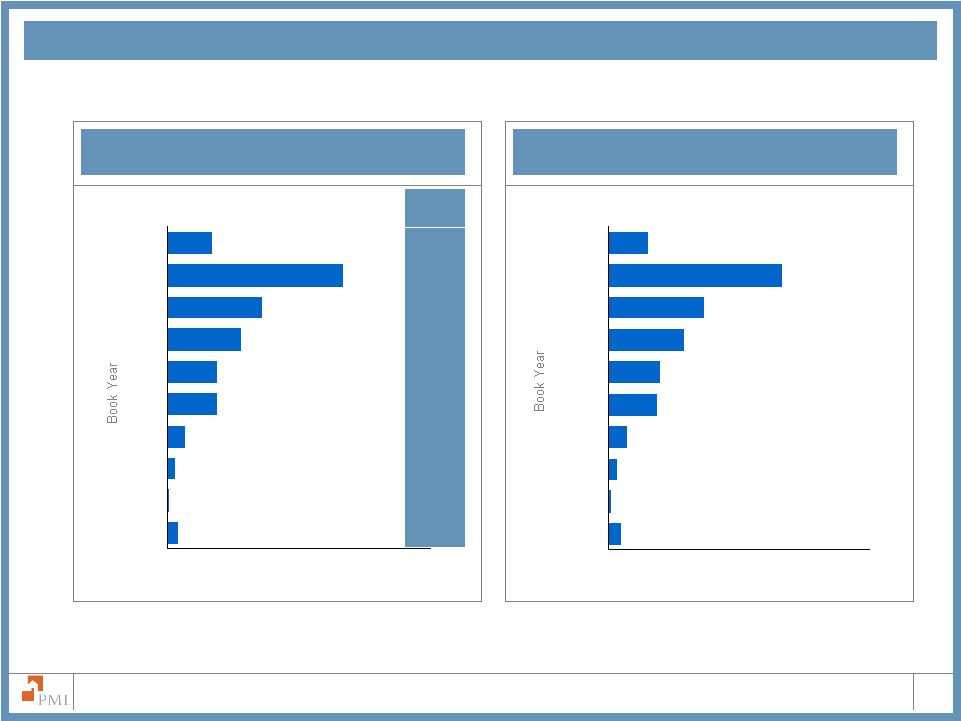
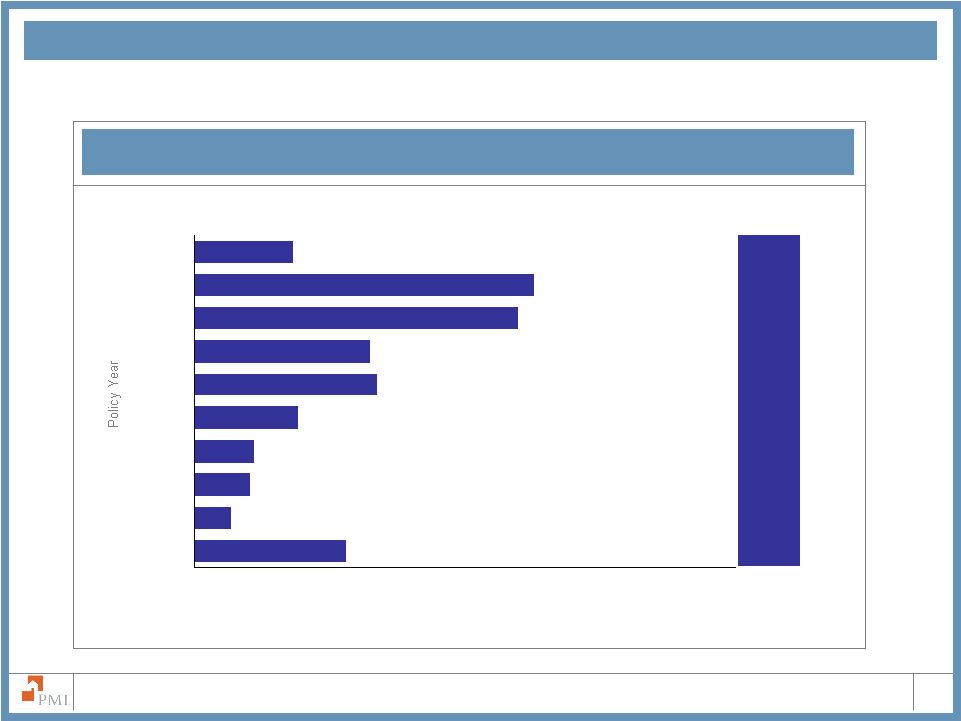 42 The PMI Group, Inc. 6.5% $169.8 Billion Primary RIF 22.2% $16,930 $4,052 $6,196 $6,718 $11,540 $20,259 $35,955 $37,622 $10,967 $19,562 $0 $10,000 $20,000 $30,000 $40,000 $50,000 Prior to 2000 2000 2001 2002 2003 2004 2005 2006 2007 2008 Percent of Total 21.2% 11.5% 11.9% 6.8% 4.0% 3.6% 2.4% 10.0% Australian Portfolio Age Distribution U.S. Dollars in Millions |
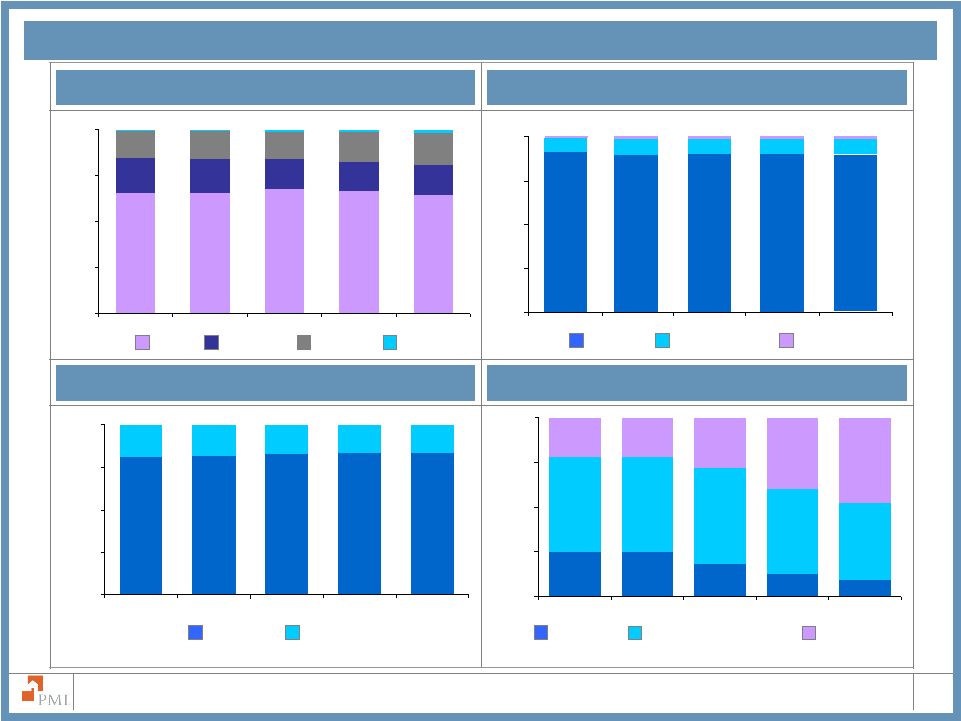 43 The PMI Group, Inc. Australian Portfolio Characteristics LTVs as a % of RIF Property Type as a % of RIF Occupancy Status as a % of RIF Loan Amount as a % of RIF 65.7% 65.8% 67.7% 66.8% 19.0% 18.5% 16.2% 15.7% 17.6% 64.5% 16.5% 15.0% 15.3% 16.3% 14.8% 0.5% 0.7% 0.9% 1.2% 1.5% 0% 25% 50% 75% 100% 2004 2005 2006 2007 Jun-08 81.0% 81.5% 83.2% 83.5% 83.4% 19.0% 18.5% 16.8% 16.5% 16.6% 0% 25% 50% 75% 100% 2004 2005 2006 2007 Jun-08 24.9% 24.7% 18.3% 12.4% 9.5% 53.2% 53.4% 53.6% 47.8% 42.4% 21.9% 28.1% 39.8% 48.1% 21.9% 0% 25% 50% 75% 100% 2004 2005 2006 2007 Jun-08 Condominium, townhouse, cooperative Non-Owner Occupied Owner Occupied Over $100,000 and up to $250,000 $100,000 or less Over $250,000 LTVs between 90.01% and 95% LTVs of 85% and below LTVs above 95% LTVs between 85.01% and 90% Note: Due to rounding, the sum of percentages may not total 100% The increase in loan size in Australia reflects the combination of higher property prices for newer policies and lower loan sizes on terminating policies. 90.9% 89.6% 90.2% 89.7% 7.9% 8.9% 8.4% 8.8% 1.4% 1.3% 1.5% 1.3% 0% 25% 50% 75% 100% 2004 2005 2006 2007 Jun-08 Multi-family dwelling and other Single-Family Detached 89.2% 9.3% 1.5% |
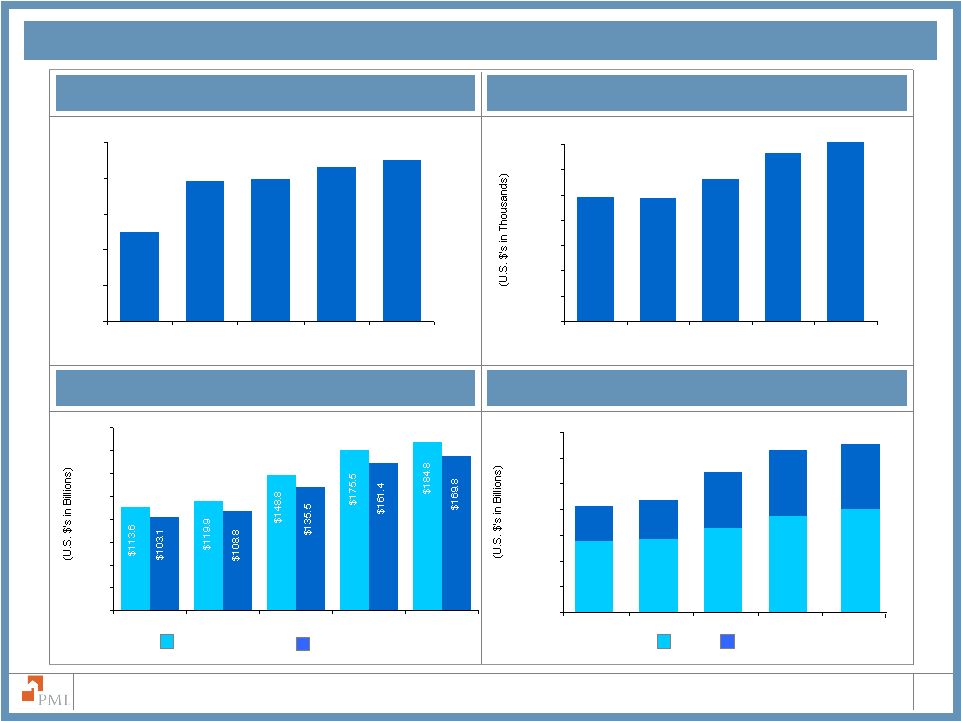 44 The PMI Group, Inc. Australian Portfolio Characteristics Low Documentation Loans as a % of RIF Average Primary Loan Size IIF and RIF Flow and RMBS RIF $0 $25 $50 $75 $100 $125 $150 $175 $200 2004 2005 2006 2007 Jun-08 5.0% 7.8% 7.9% 8.6% 9.0% 0% 2% 4% 6% 8% 10% 2004 2005 2006 2007 Jun-08 $122.7 $122.2 $141.0 $166.9 $185.8 $0 $25 $50 $75 $100 $125 $150 $175 2004 2005 2006 2007 Jun-08 Insurance in Force Risk in Force $0 $25 $50 $75 $100 $125 $150 $175 Note: Due to rounding, the sum of percentages may not total 100% Flow RMBS 68.9 71.2 81.5 96.0 37.6 54.0 65.4 $103.1 $108.8 34.2 $135.5 $161.4 2004 2005 2006 2007 Jun-08 105.2 64.6 $169.8 |
 |