 The PMI Group, Inc. Investor Conference December 4, 2008 Exhibit 99.1 |
 Agenda Strategy and Overview STEVE SMITH Economic Outlook Q&A DAVID BERSON Washington Panel Q&A HOWARD GLASER DOYLE BARTLETT BRIAN GARDNER U.S. MI Operations Q&A DAVID KATKOV Summary STEVE SMITH Luncheon Financial and Capital Matters Q&A DON LOFE Question & Answer PMI MANAGEMENT TEAM |
   2 The PMI Group, Inc. Forward-Looking Statements Cautionary Statement: Statements in this presentation and made during this conference that are not historical facts, or that relate to future plans, events or performance are "forward-looking" statements within the meaning of the Private Securities Litigation Reform Act of 1995. Forward-looking statements in this release include our expectations relating to the credit quality of our new business writings, potential positive trends within portions our U.S. mortgage insurance portfolio, our claims paid guidance, our homeownership preservation initiatives, and our captive reinsurance arrangements. Readers are cautioned that forward-looking statements by their nature involve risk and uncertainty because they relate to events and depend on circumstances that will occur in the future. Many factors could cause actual results and developments to differ materially from those expressed or implied by forward-looking statements. Such factors include, among others, national or regional recessions, and further deterioration in the housing, mortgage and related credit markets. In particular, further declines in housing values and/or housing demand, deterioration of borrower credit, higher unemployment rates, changes in interest rates, higher levels of consumer credit, higher mortgage default and claim rates, lower cure rates, higher claim sizes, the aging of our mortgage insurance portfolios, and adverse changes in liquidity in the capital markets could negatively affect our losses. There can be no assurance that the sale of PMI Asia will be completed on the terms that have been announced or at all. In addition, there can be no assurance that the note issued to PMI in connection with the sale of PMI Australia will not be reduced prior to its repayment. Readers should not infer that the lowering of our paid claims guidance for 2008 represents a particular trend for paid claims in 2008 or 2009. Paid claims is only one component of U.S. Mortgage Insurance Operations’ total losses. Other components include loss reserve increases and loss adjustment expenses and such components have significantly increased in 2008 and could continue to increase in the future, thereby causing U.S. Mortgage Insurance Operations’ total losses to continue to increase. Unless we raise new capital and/or reduce PMI’s NIW or risk-in-force, PMI’s policyholders position will likely decline and its risk-to-capital ratio could increase beyond the levels necessary to meet certain regulatory capital adequacy requirements and/or credit facility financial covenants. There can be no assurance that we will be able to raise capital or procure capital relief in the future, either on acceptable terms and in a timely manner, or at all. Other risks and uncertainties are discussed in our SEC filings, including our Annual Report Form 10-K for the year ended December 31, 2007 (in Item 1A) and our Quarterly Report on Form 10-Q for the quarter ended September 30, 2008. We undertake no obligation to update forward-looking statements. |
 Steve Smith Chairman and Chief Executive Officer The PMI Group, Inc. Investor Conference December 4, 2008 |
   4 The PMI Group, Inc. For over 36 years PMI has provided innovative credit and risk transfer solutions that expand homeownership and fund essential services for our customers and the communities they serve. PMI’s mortgage insurance products most frequently provide first loss protection on insured loans sold to the GSEs (or the “agency market”) and on loans held by portfolio lenders. By mitigating default risk, mortgage insurance facilitates the origination of mortgages with down payments of less than 20% of the value of the home. The PMI Group, Inc. |
   5 The PMI Group, Inc. Mission, Vision, Values To expand homeownership and strengthen communities by delivering innovative solutions to financial markets. • Potential of every individual… To make a difference • Power of teams… To deliver extraordinary results • Perfecting our performance… To create lasting value • Personal and corporate commitment… To build strong communities • Promise of integrity… In all that we do PMI’s Mission To be the premier provider of financial products that reduce risks, lower costs, and expand market access for our customers. PMI’s Vision PMI’s Values |
   6 The PMI Group, Inc. PMI’s Five-Point Plan for Progress Focus on Core Mortgage Insurance Business Book High Quality New Business Mitigate Losses Manage Expenses Enhancing Company Capital and Liquidity Goal: Return to Profitability |
   7 The PMI Group, Inc. Renegotiated revolving credit facility. Borrowed $200 million from the revolving credit facility. Reduced per annum common stock dividend from $0.21 to $0.01 per share. Entered reinsurance agreement for PMI Guaranty and repatriated approximately $152 million of capital, of which $144 million was contributed to U.S. mortgage insurance operations. Completed sale of PMI Australia to QBE Insurance Group for an aggregate purchase price of $920 million. Reached an agreement for the sale of PMI Asia to QBE. Closed Canadian operations with plans to repatriate between $40 and $50 million of capital to U.S. Mortgage Insurance Operations. Announced reconfiguration of PMI Europe’s operations to conserve capital and liquidity. Realigned our business to focus on the core mortgage insurance company. Book high quality new business. Reduced expenses throughout the organization. Five-Point Plan for Progress Accomplishments Accomplishments of the Five-Point Plan for Progress: |
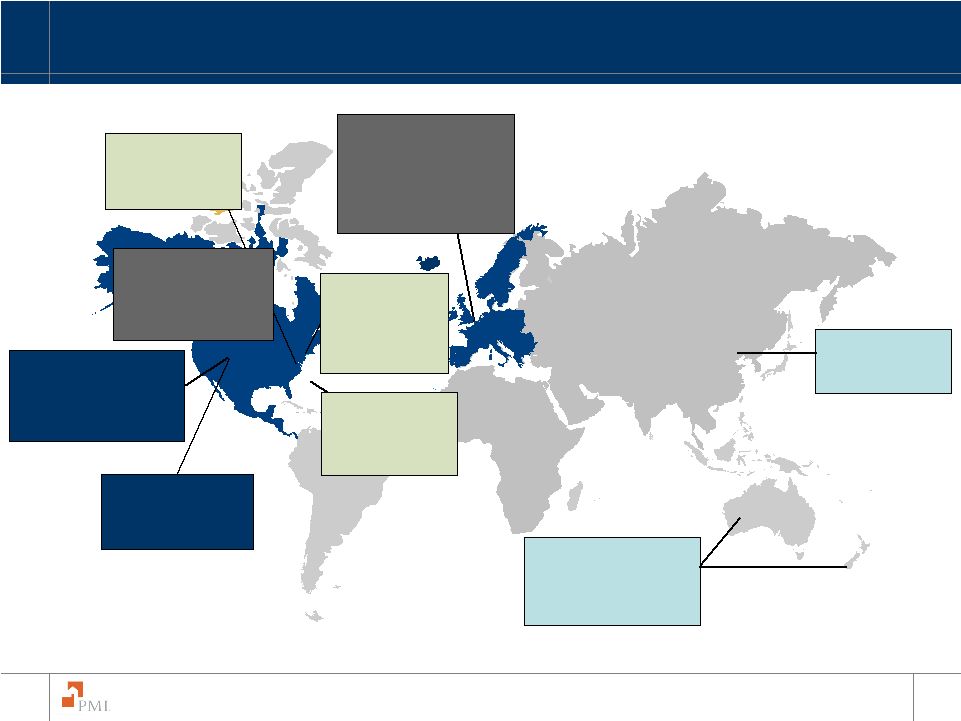   8 The PMI Group, Inc. PMI Europe Reconfigured operations $255 M of cash and investments $101 M shareholders’ equity RAM Re 24% ownership Carrying value reduced to $6.5 M As of September 30, 2008 PMI’s Focus: U.S. Mortgage Insurance Operations FGIC 42% ownership Carrying value reduced to $0 Asia Agreement to sell to QBE U.S. Mortgage Insurance Primary IIF $123 B Loss Reserves $2.3 B CMG 50% Joint Venture Primary IIF $21 B Australia + New Zealand Sold to QBE for $920 M net tangible asset value PMI Canada Closing operations & repatriating between $40 and $50 M in capital PMI Guaranty Repatriated ~$152 M in excess capital |
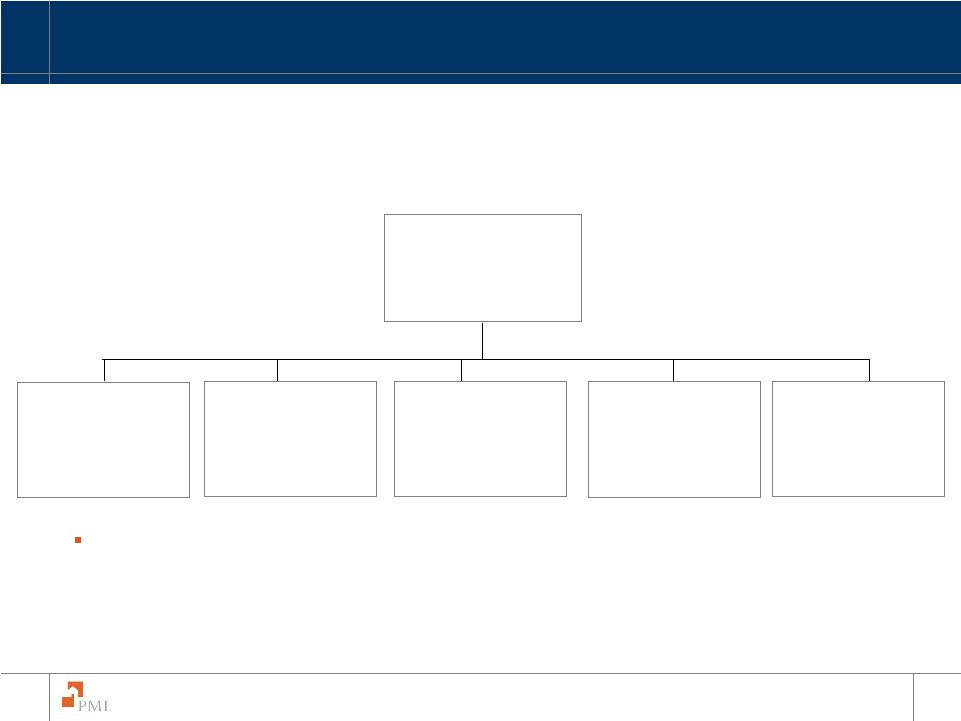   9 The PMI Group, Inc. Chief Business Officer Chief Insurance Operations Officer Chief Risk Officer Chief Financial Officer and Chief Administrative Officer General Counsel Reduced headcount from approximately 1,100 at year end 2007 to less than 700 at the end of the third quarter 2008 • Asset sales • Early retirement • Reduction in force Don Lofe Andy Cameron Tony Porter Joanne Berkowitz David Katkov New Organizational Structure Realigned the organization to focus on our core U.S. mortgage insurance business Chairman and Chief Executive Officer Steve Smith |
   10 The PMI Group, Inc. Private MI Value Proposition Liquidity and capital relief Credit protection Independent risk analysis Focus on sustainable home ownership The private MI industry brings unique benefits to the mortgage market Government Sponsored Enterprises Office of the Comptroller of the Currency Office of Thrift Supervision National Credit Union Administration Private MI is recognized as a valuable counterparty by regulatory agencies MI tax deductibility Recognized as a risk mitigant (e.g. Basel Accords) Repriced products Elimination of XOL captives High quality new business Fewer alternatives for low down payment loans Positive industry trends |
       11 The PMI Group, Inc. Private MI: Critical to the Nation’s Housing Recovery 15x =60x 4x At 15:1 regulatory risk-to- capital At 25% risk coverage ratio 400,000 homes financed $1 billion of capital $15 billion of risk in force $60 billion of insurance in force Average industry loan size $150,000 Key Industry Driver Industry Multiplier Private MI Essential to GSE’s MI Provides Efficient Solution GSE’s rely on private mortgage insurance to support $181 billion of insurance coverage supporting approximately $750 billion of existing mortgages. In 2007, we estimate that more than 20% of the loan volume purchased by the GSE’s utilized private mortgage insurance. Approximately one out of every seven homebuyers utilized Private MI to achieve homeownership. No other industry can provide this level of support for housing and mortgage activity. |
   12 The PMI Group, Inc. We are executing our five-point plan for progress. Continue to see strong fundamentals in the mortgage insurance industry. PMI’s entire management team, and each and every PMI employee, is committed to executing our five-point plan, as well as fostering sustainable home ownership, which we believe will bring long term value to our shareholders. Summary |
 Dr. David W. Berson Chief Economist The PMI Group, Inc. Investor Conference December 4, 2008 |
   14 The PMI Group, Inc. There are Three Separate, but Related, Problems Weighing on the Housing Market The inventory of houses for sale and record home price declines. The credit crunch, making it difficult for existing homeowners to refinance problem mortgages and for potential homebuyers to get new mortgages. The downturn in the economy, which is leading to rising unemployment. Introduction |
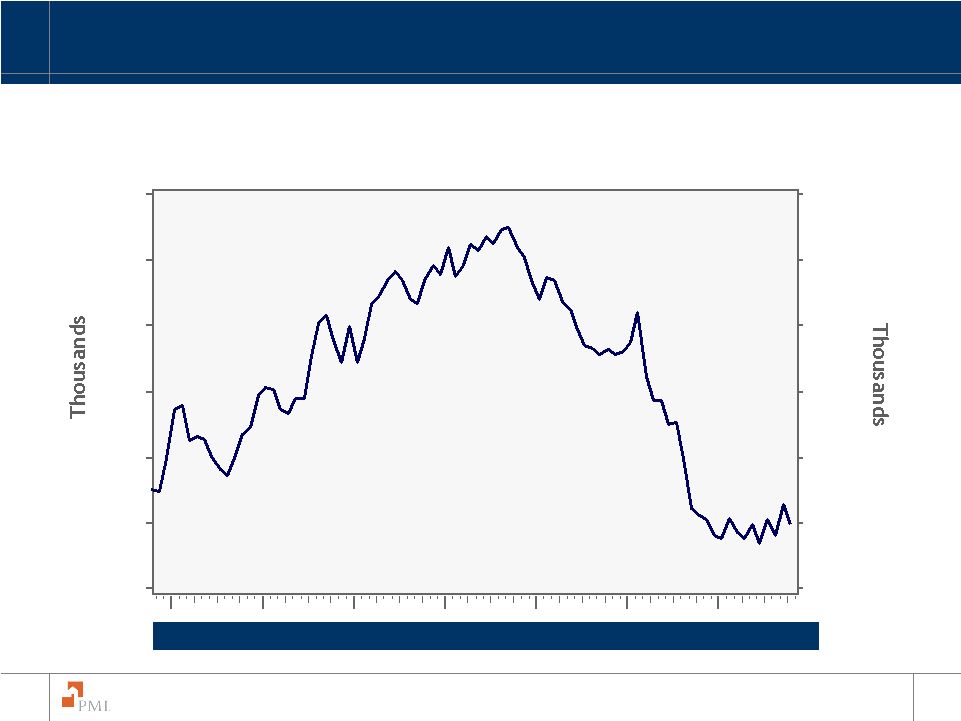
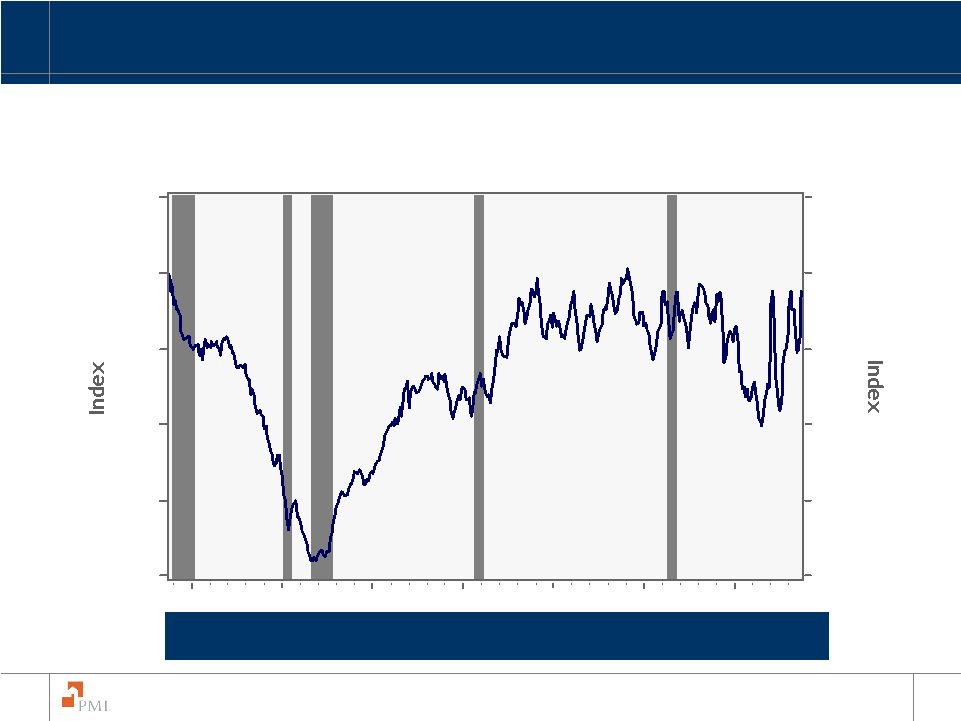
   15 The PMI Group, Inc. New Sales Compete with Foreclosures 08 07 06 05 04 03 02 1400 1200 1000 800 600 400 1400 1200 1000 800 600 400 - Lower Prices on Foreclosures Reduce Demand for New Homes - As the Foreclosed Inventory Falls in 2009, New Sales will Pick up - Pent-up Demand Rising with Sales Below Trend for Three Years Source: Census Bureau/ Haver Analytics |
   16 The PMI Group, Inc. Existing Home Sales 08 07 06 05 04 03 02 7500 7000 6500 6000 5500 5000 4500 7500 7000 6500 6000 5500 5000 4500 Source: National Association of Realtors/ Haver Analytics - Existing Sales Today are Boosted by Foreclosure and Short Sales - Surge in Affordability will Boost Sales Further in 2009 - Pent-up Demand Rising with Sales Below Trend for Two Years |
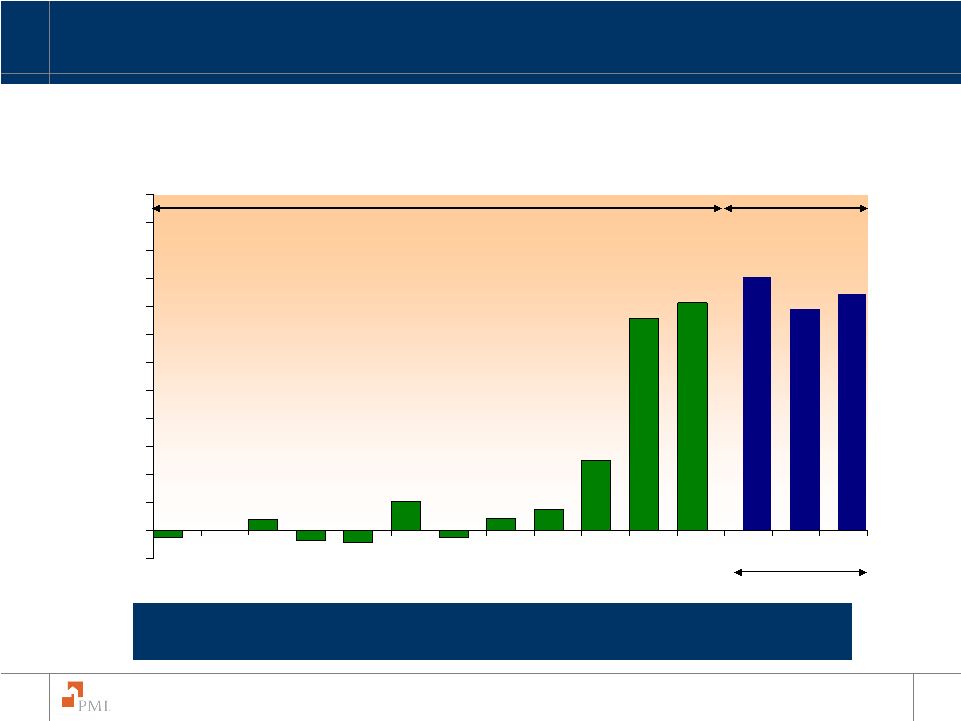   17 The PMI Group, Inc. Inventory Surplus Of Homes For Sale Remains Large -100 0 100 200 300 400 500 600 700 800 900 1000 1100 1200 1996 2000 2004 Source: Bureau of Census, Freddie Mac (1996-2004:Annual Data, 2005Q1–2008Q2:Quarterly Data) Note: The excess unsold homes were estimated based on the average vacancy rate from 1995Q1 to 2004Q4. Excess Unsold Homes for Sale (Numbers in Thousands) Annual Data Quarterly Data 2002 1998 2006 Q1 Q2 2008 Q3 - Should Decline in 2009 as Sales Rise |
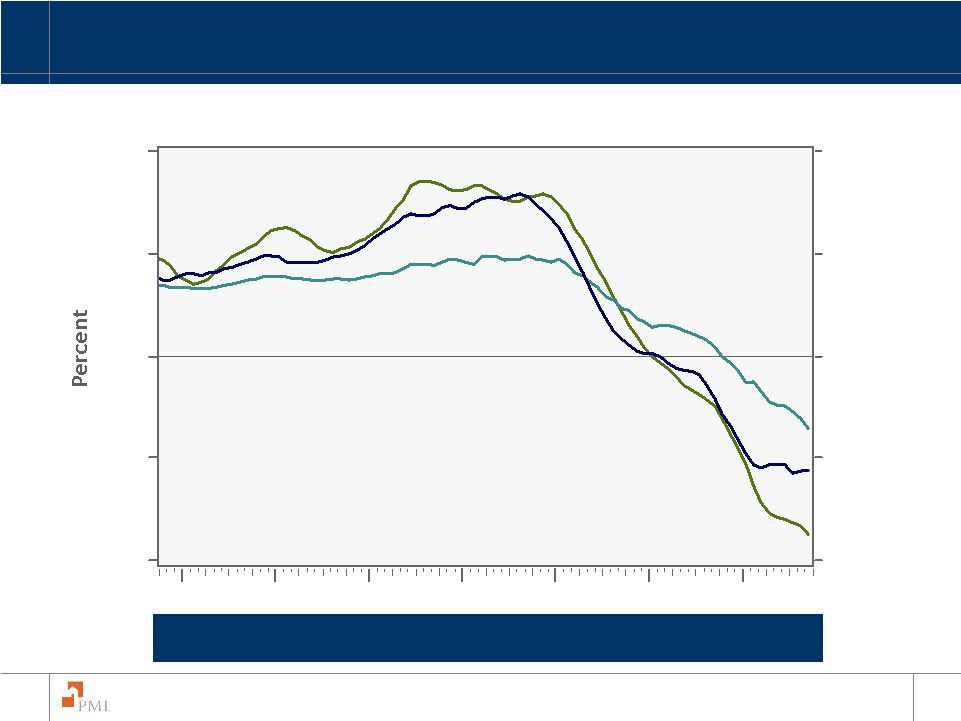
   18 The PMI Group, Inc. Banks are Tightening Mortgage Lending Standards -20 0 20 40 60 80 100 2003 Q1 2003 Q3 2004 Q1 2004 Q3 2005 Q1 2005 Q3 2006 Q1 2006 Q3 2007 Q1 2007 Q3 2008 Q1 2008 Q3 All Prime Nontraditional Subprime Source: Federal Reserve Board/Haver Analytics - Some Improvement for Prime Loans - Subprime and Nontraditional (Alt-A) Unlikely to Come Back Anytime Soon - GSEs Have Also Tightened, but Generally Not Unreasonably |
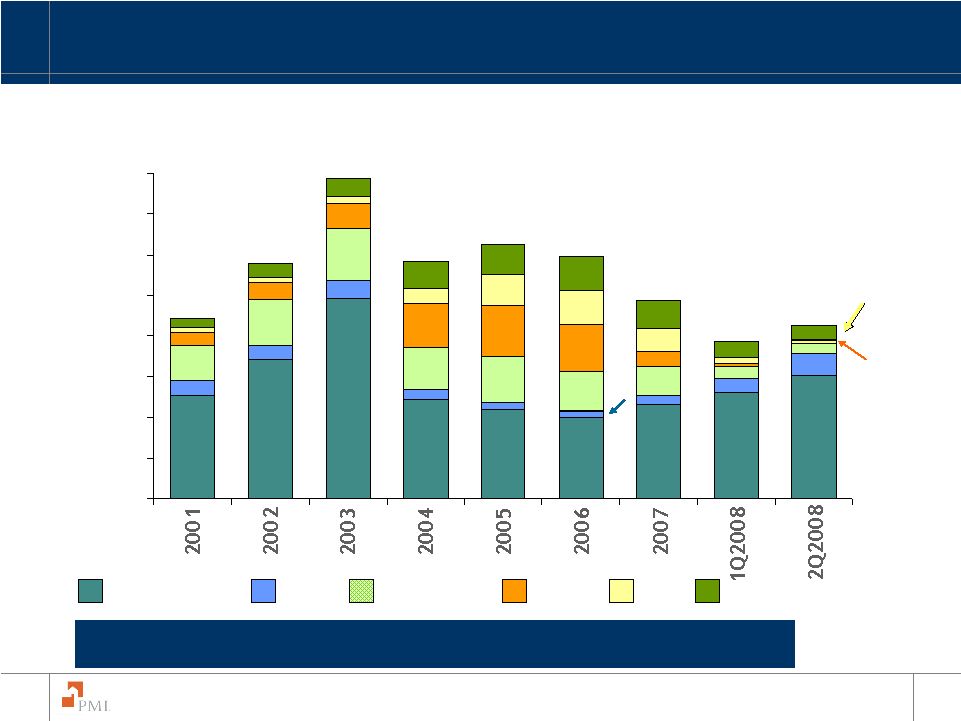
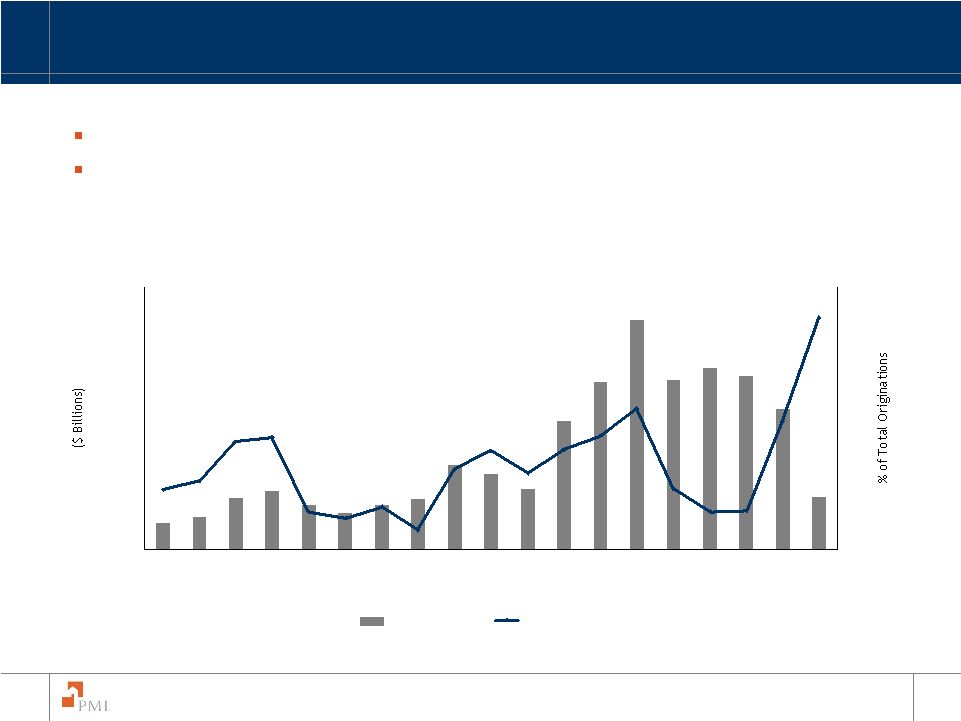
   19 The PMI Group, Inc. Subprime Mortgages Now Make Up 1% of Loan Originations, Down from 20% in 2006 - Subprime and Alt-A Should Remain Low - Fannie, Freddie, FHA are Surging - and Should Continue in 2009 Home Equity Loans Conventional, Conforming Prime Jumbo Prime Subprime Alt-A FHA & VA $2,21 $2,980 $2,885 $3,945 $2,920 $2,430 $1,924 20% 1% 2% 33% 70% 3% $2,154 $3,120 Source: Inside Mortgage Finance, Freddie Mac (by dollar amount); Note: 2Q 2008 values adjusted to reflect the undercount of Fannie Mae, Freddie Mac and FHA activity in the IMF data. $0 $500 $1,000 $1,500 $2,000 $2,500 $3,000 $3,500 $4,000 13% 14% 16% |
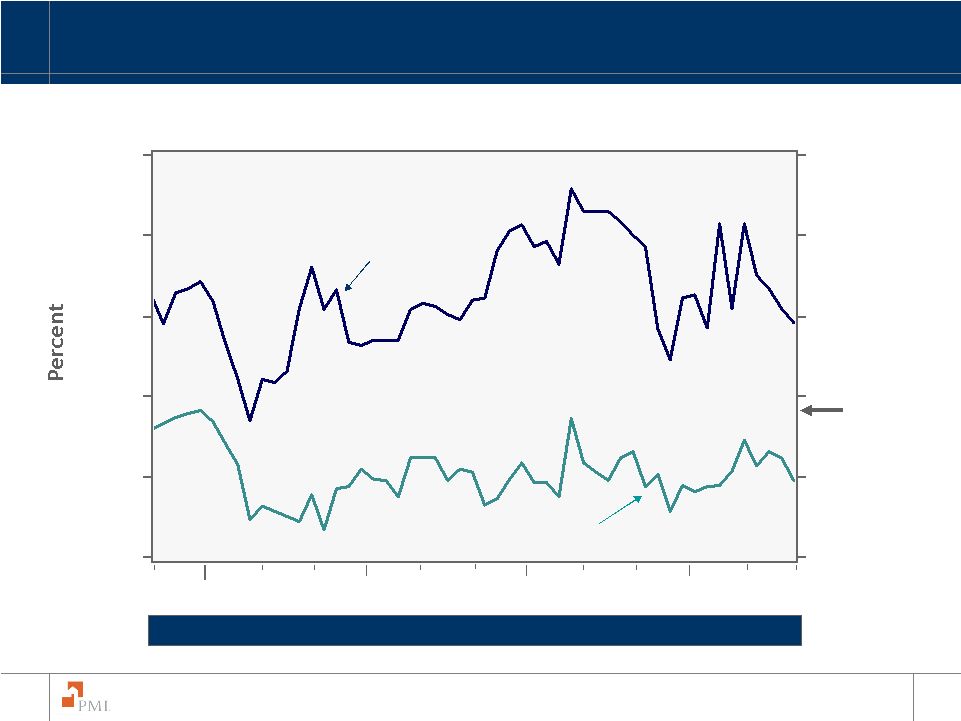
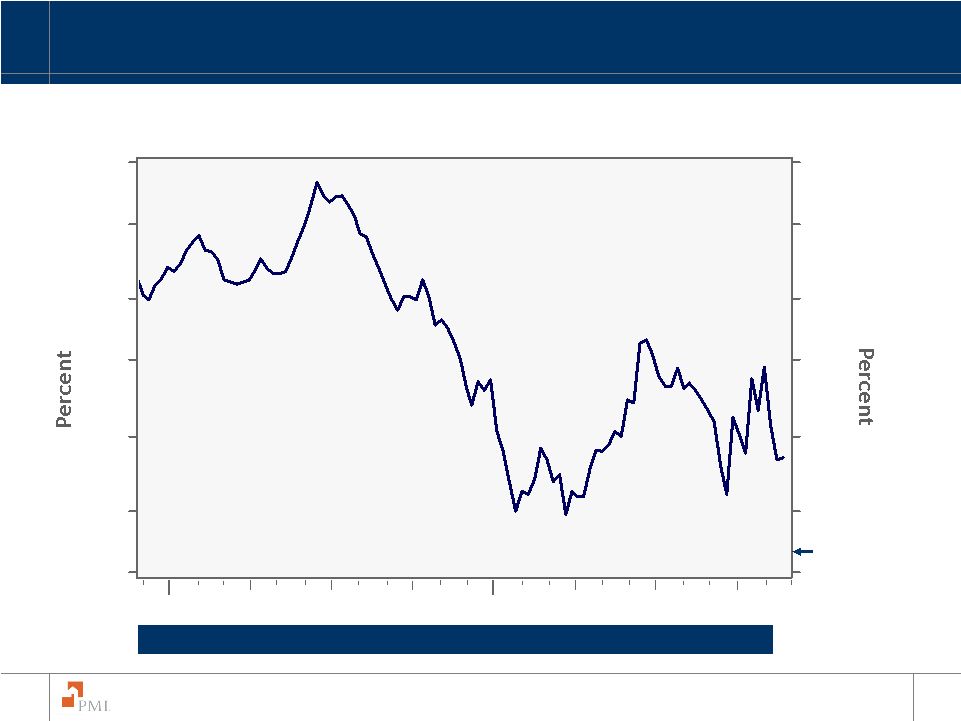
   20 The PMI Group, Inc. 6-Month LIBOR Spreads Remain Elevated Source: Federal Reserve Board/Financial Times/Haver Analytics 08 07 06 05 04 6 5 4 3 2 1 0 6 5 4 3 2 1 0 Federal Funds Rate 6-Month London Interbank Offered Rate 2.07 on 12/2 - But the Spreads are Falling, Suggesting Some Amelioration of the Credit Crunch - Spreads Should Fall Further in 2009 as Liquidity Flows |
   21 The PMI Group, Inc. Good News on Mortgage Rates NOV OCT SEP AUG JUL JUN 08 MAY APR MAR FEB JAN DEC 6.8 6.4 6.0 5.6 5.2 4.8 6.8 6.4 6.0 5.6 5.2 4.8 Source: Freddie Mac/Haver Analytics 1 – Year Adjustable Rate Mortgage 30 – Year Fixed Rate Mortgage 5.5 on 12/4 estimate - Fed Purchases of GSE Debt and MBS Pushing Rates Down - Rates May Test 2004 Lows, Boosting Affordability and Home Sales |
   22 The PMI Group, Inc. GSE Borrowing Costs Finally Falling 08 07 5.6 5.2 4.7 4.3 3.8 3.3 2.9 5.6 5.2 4.7 4.3 3.8 3.3 2.9 Source: Fannie Mae/Haver Analytics 2.95 on 11/28 - Thanks to the Fed - Pushing Mortgage Rates Down |
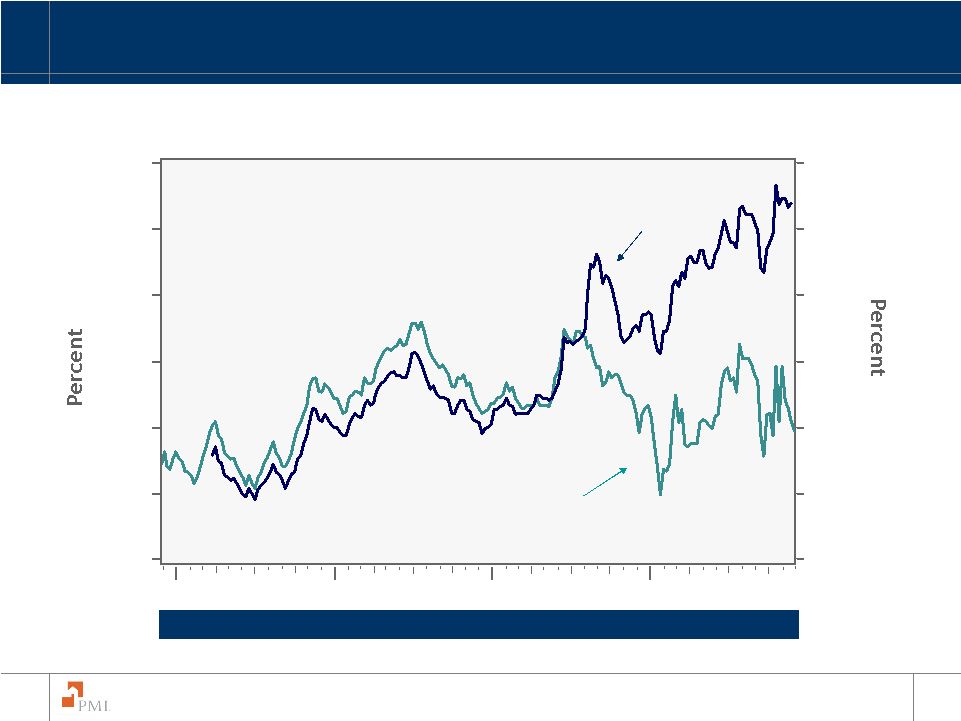   23 The PMI Group, Inc. Jumbo Mortgage Rates Continue to Soar 08 07 06 05 8.0 7.5 7.0 6.5 6.0 5.5 5.0 8.0 7.5 7.0 6.5 6.0 5.5 5.0 Source: Freddie Mac/ Wall Street Journal/Haver Analytics Jumbo Conforming 30-Year - No GSE Activity Here, so no Help from the Fed - Should Moderate Some in 2009, but Spreads will Stay Wider than Normal |
   24 The PMI Group, Inc. Are House Price Declines Finally Stabilizing? 08 07 06 05 04 03 02 20 10 0 -10 -20 20 10 0 -10 -20 Source: FHFA/S&P Case Shiller/Loan Performance/Haver Analytics 12 Month Change in House Prices Case-Shiller (Composite 20) FHFA Purchase–Only Loan Performance (LP) - Broadest Measure (Loan Performance) Suggests So |
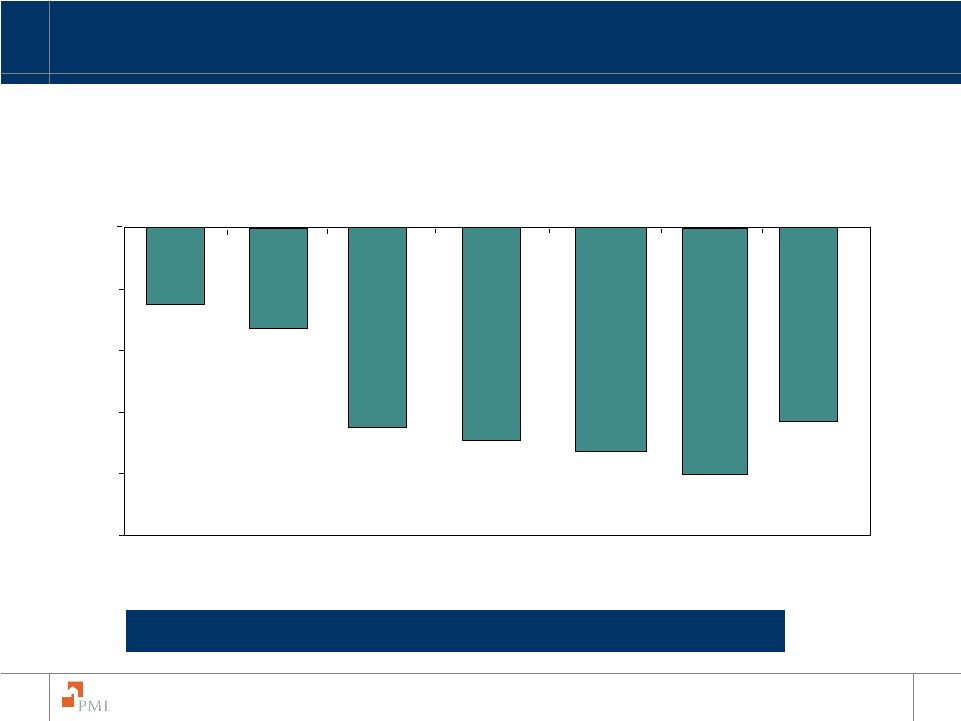   25 The PMI Group, Inc. Home Price Deflation in Major Indices - 6.0% -17.0% -20.4% -26.3% -22.1% -15.0% -25.0% -20.0% -15.0% -10.0% -5.0% 0.0% Freddie Mac Purchase- Only Index -7.9% Source:NAR, Census Bureau, FHFA, Freddie Mac, Case-Shiller, Loan Performance Decline of Home Price Indices from Respective Peak Levels FHFA Purchase- Only Index Median New Home Price Median Existing Home Price Case-Shiller Composite- 20 Index Loan Performance National Index Case-Shiller National Index - Big Differences Between Indices - PMI Book Most Closely tied to Freddie Mac/FHFA Indices, not Case Shiller |
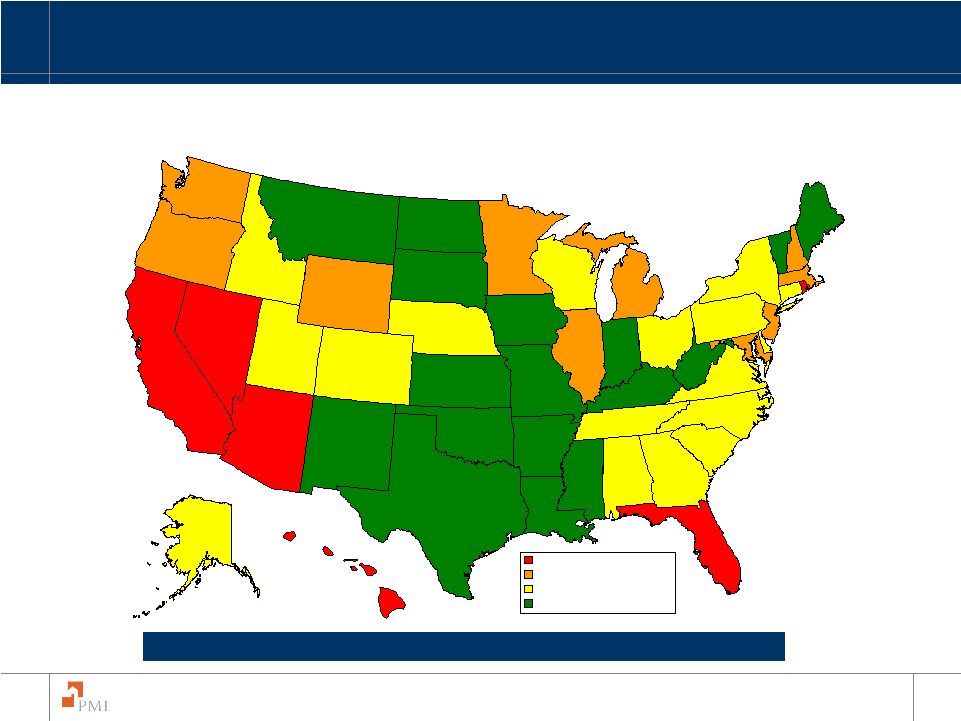   26 The PMI Group, Inc. 12-Month Growth in Home Prices September 2008 Source: First American CoreLogic, LoanPerformance HPI - Prices Still Up in One-Third of States - Double-Digit Declines in the Sandy States (especially California) -28.85% to -10.00% -9.99% to -5.00% -4.99% to 0.00% 0.01% to 4.96% |
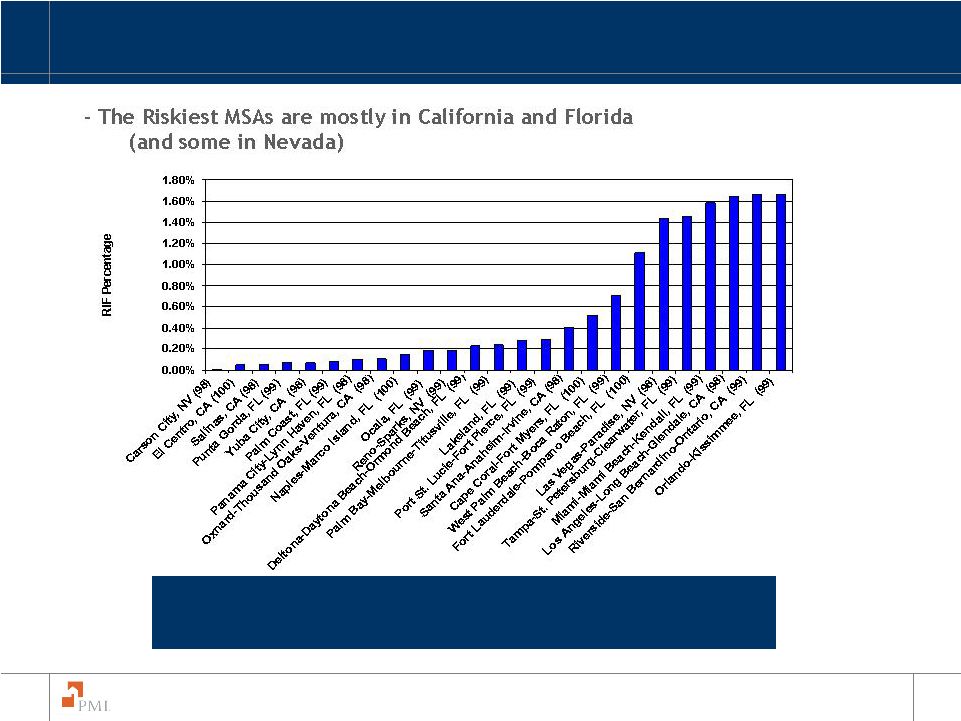   27 The PMI Group, Inc. Top 25 Riskiest MSA’s Source: The PMI Group, Inc.: US Mortgage Risk Index Note: 1. Fall 2008 Risk Scores are shown in parentheses 2. Sum of RIF Percentage = 14.3% |
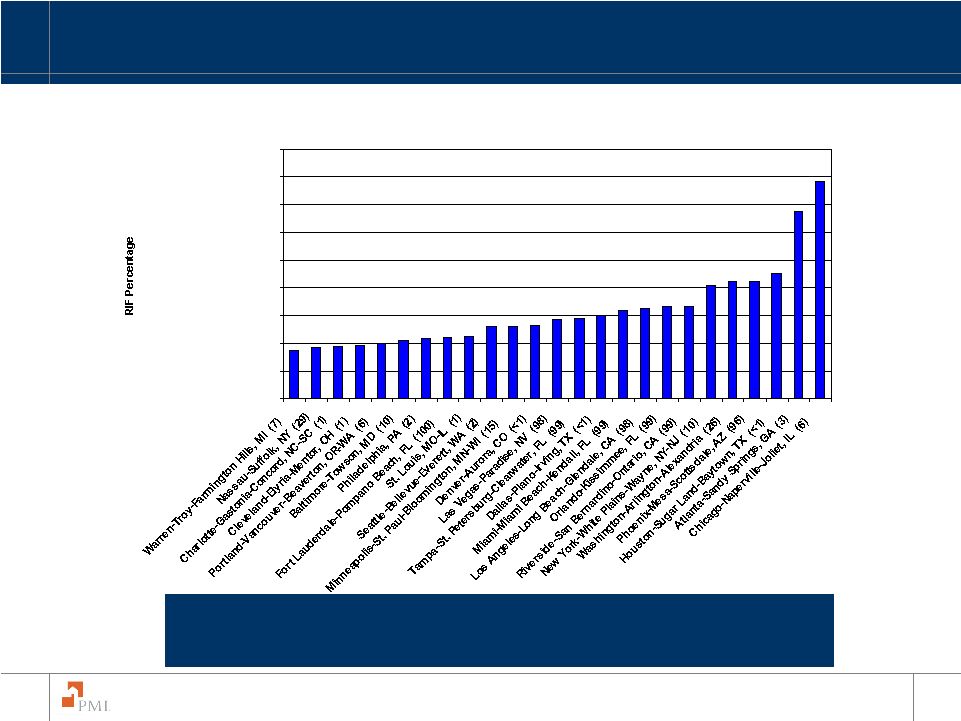   28 The PMI Group, Inc. - Most are not High Risk Top 25 MSAs Sorted by Risk-in-Force Source:The PMI Group, Inc.: US Mortgage Risk Index Note: 1. Fall 2008 Risk Scores are shown in parentheses 2. Sum of RIF Percentage = 39.74% 0.00% 0.50% 1.00% 1.50% 2.00% 2.50% 3.00% 3.50% 4.00% 4.50% |
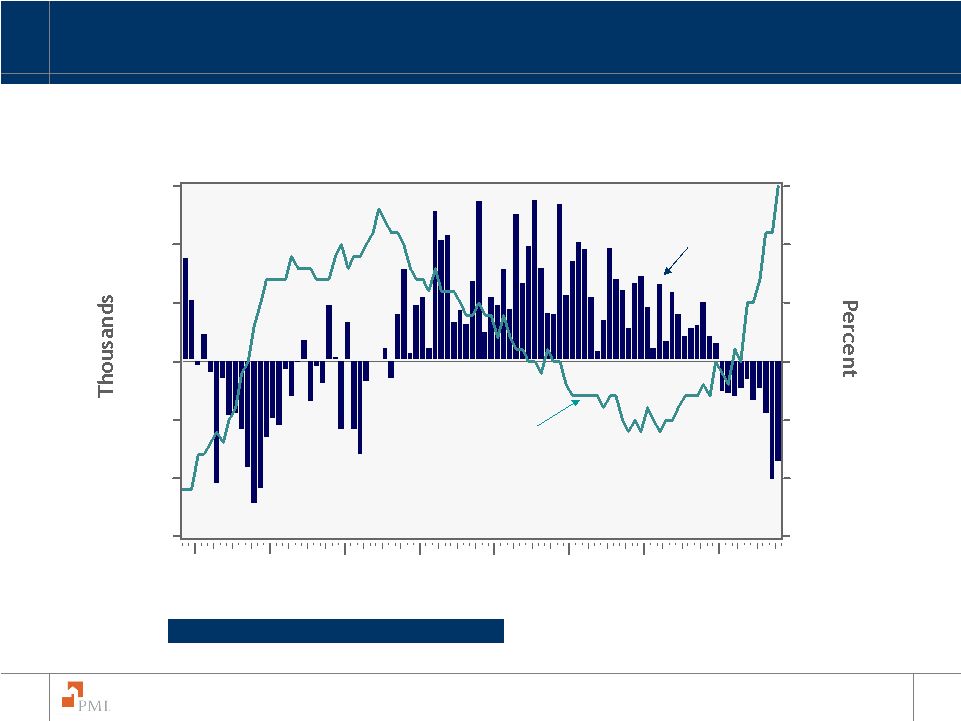   29 The PMI Group, Inc. The U.S. Job Market is Weakening Source: Bureau of Labor Statistics/Haver Analytics 08 07 06 05 04 03 02 01 0.3 0.2 0.1 0.0 -0.1 -0.2 -0.3 6.5 6.0 5.5 5.0 4.5 4.0 3.5 Civilian Unemployment Rate (Right Axis) Change in Payroll Employment (Left Axis) - Unemployment rate up to 8% at end of 2009 - But Home Sales Always Rebound before Recessions End and Unemployment Peaks |
   30 The PMI Group, Inc. Affordability is High 05 00 95 90 85 80 75 160 140 120 100 80 60 160 140 120 100 80 60 Source: National Association of Realtors/ Haver Analytics Median Income=Qualifying Income=100 - Will Move Higher as Mortgage Rates and House Prices Fall Further – Perhaps to Record Highs - This will Sow the Seeds of a Housing Rebound Beginning in 2009 |
 Doyle Bartlett Brian Gardner Howard Glaser The PMI Group, Inc. Investor Conference December 4, 2008 |
   32 The PMI Group, Inc. Overview of the new administration Overview of the new congress The reaction from Wall Street Democrats control executive and legislative branches of government Foreclosure mitigation and new rules for servicers The future of Freddie Mac and Fannie Mae Regulatory restructuring The role of FHA Predatory lending TARP Issues that will shape the financial services industry Policy and Political Perspectives from Washington D.C. The views expressed by the panel members are their own and do not necessarily represent The PMI Group, Inc. or its management team. |
 David Katkov Chief Business Officer The PMI Group, Inc. Investor Conference December 4, 2008 |
   34 The PMI Group, Inc. What are the key demand drivers for private MI? • Positive industry trends for mortgage insurance. How has PMI reshaped the credit characteristics of its portfolio? • New business is higher quality and higher priced. Where is PMI in its loss cycle? • Portions of portfolio are exhibiting positive signs. What is PMI doing to mitigate loss? • Our Homeownership Preservation Initiatives (HPI) are gaining traction. U.S. MI Business Overview: Four Key Themes |
   35 The PMI Group, Inc. GSEs: Growth in Market Share; Higher Loan Quality Highest market penetration in 17 years Historically, high correlation between increased GSE market share and improved loan quality because of co-insurance features Source: Inside Mortgage Finance – July 25, 2008 Mortgage Originations Volume $458 $562 $894 $1,020 $859 $1,450 $1,310 $1,048 $3,945 $2,920 $3,120 $2,980 $2,430 $910 $639 $785 $2,885 $2,215 $773 $0 $500 $1,000 $1,500 $2,000 $2,500 $3,000 $3,500 $4,000 $4,500 1990 1991 1992 1993 1994 1995 1996 1997 1998 1999 2000 2001 2002 2003 2004 2005 2006 2007 2008 YTD 30% 35% 40% 45% 50% 55% 60% 65% 70% 75% 80% Total Originations GSE Market Share |
   36 The PMI Group, Inc. Recent mortgage insurance eligibility announcements: • Roll-back of captive reinsurance to 25% maximum, net premium cession • PMI discontinued XOL captives effective January 1, 2009 • Acceptance of our remediation plan PMI and MICA companies are partnering with the GSEs and FHFA to provide liquidity to the nation’s housing market. • The MI industry is the GSEs’ largest risk counterparty GSEs: Positive for Mortgage Insurance |
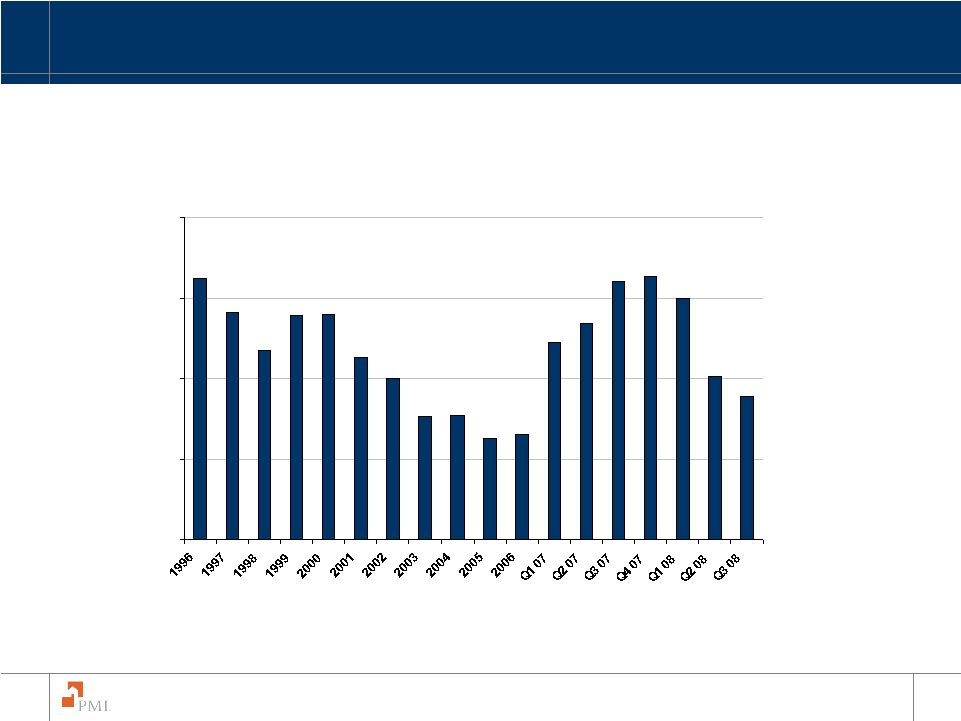   37 The PMI Group, Inc. Private mortgage insurance penetration rate is down from peak levels Penetration rate is MICA channel volume over Total Originations. Historical MICA market data from Inside Mortgage Finance. Private Mortgage Insurance Market Share 0% 5% 10% 15% 20% |
   38 The PMI Group, Inc. Fewer lending institutions comprise a majority of the mortgage market Leveraged technology advancement to improve efficiencies • Reduced the number of underwriting offices from 18 to 2 since 2004 PMI has realigned the sales force to adapt to the changing market • 68 salespeople currently, down from a high of 120 in the late 1990s Bank of America Countrywide Washington Mutual JPMorgan Chase Wells Fargo Wachovia Citibank Projected $1.7 Trillion¹ Mortgage Market in 2009 Credit Unions Regional Banks 1 Based on average forecast from Fannie Mae, Freddie Mac, Mortgage Bankers Association and Moody’s Economy.com Realignment of Business to Service the New Market |
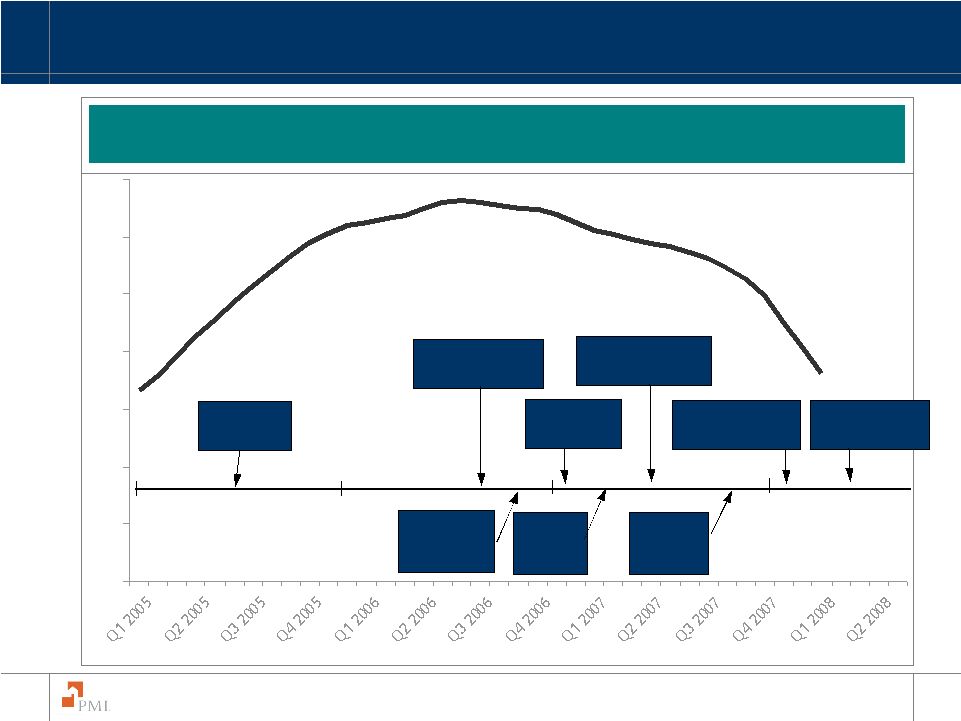   39 The PMI Group, Inc. Leadership in Managing Risk and Pricing 160 170 180 190 200 210 220 230 PMI makes first of many bulk guideline & pricing changes Additional Bulk guideline changes PMI leads industry on 100 LTV guideline & pricing changes LPMI guideline changes Origination fraud detection tools implemented PMI leads on Alt-A guideline changes PMI Field UW Investigations Unit formed Action Time Line PMI implements MSA level distressed markets policy Standard & Poor’s Case Shiller Composite Index PMI introduces risk based pricing in BPMI channel |
   40 The PMI Group, Inc. In response to the challenging environment and market conditions, PMI has led the industry in both guideline and pricing changes. PMI was the first MI to implement risk based pricing. Rate structure takes into consideration new rating agency capital requirements, encourages high quality business and provides significant protection against distribution shifts. The table below provides a summary of the price increases PMI has implemented since October 2007: Pricing and Guideline Changes Product Segment Monthly Premium Borrower Paid Fixed Rate 30-year Term +24% 1% ARM 30-year Term +69% 2% ARM 30-year Term +57% 95.01% to 97.00% LTV +55% Lender Paid Fixed Rate 30-year Term +50% Non-Fixed Rate 30-year Term +77% PMI’s internal, as well as external models, indicate the credit quality of new business writings is superior to that of the mid-1990s. |
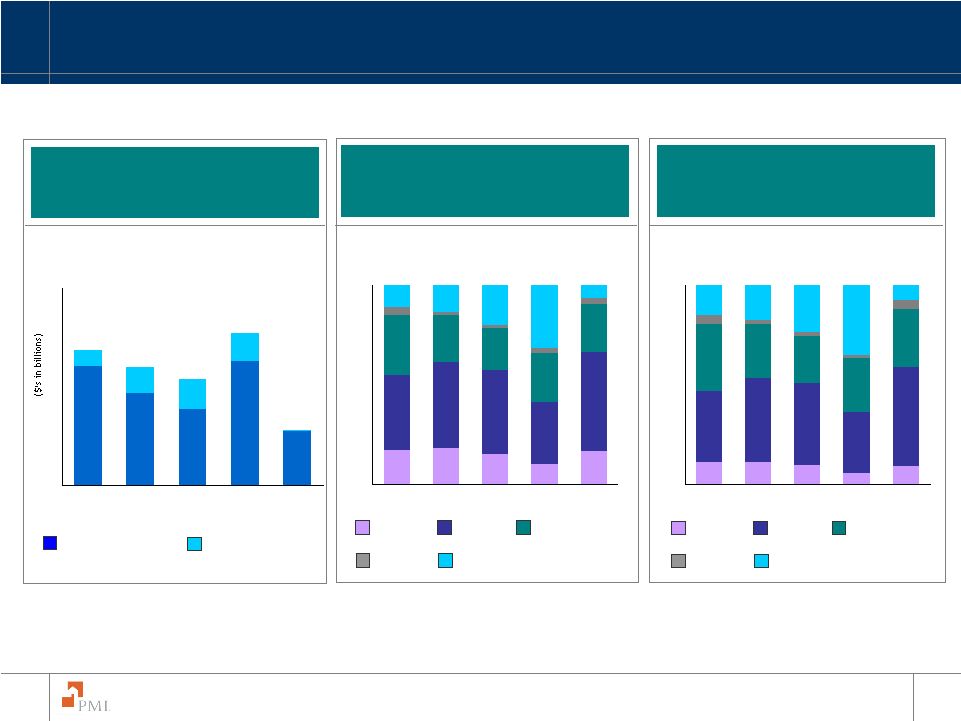   41 The PMI Group, Inc. U.S. Portfolio Primary NIW Characteristics Flow and Structured Primary NIW New Insurance Written by LTV New Risk Written by LTV Note: Due to rounding, the sum of percentages may not total 100%. Flow Primary NIW Structured Primary NIW 90.01 – 95% 85.01 – 90% 85 and below Above 97% 95.01% – 97% With the exception of previous commitments, effective March 1, 2008, PMI discontinued insuring loans with LTV ratios above 97%. 90.01 – 95% 85.01 – 90% 85 and below Above 97% 95.01% – 97% 36.3 28.2 23.3 37.6 16.5 4.9 7.7 9.0 8.6 $41.2 $35.9 $32.2 $16.9 $46.1 $0 $10 $20 $30 $40 $50 $60 2004 2005 2006 2007 9 Mos 2008 17% 18% 15% 10% 38% 43% 42% 31% 30% 24% 21% 24% 12% 13% 17% 50% 24% 4% 2% 2% 3% 4% 20% 32% 6% 0% 25% 50% 75% 100% 2004 2005 2006 2007 9 Mos 2008 11% 12% 10% 6% 35% 42% 41% 30% 34% 27% 24% 27% 15% 18% 9% 50% 29% 5% 2% 2% 2% 5% 24% 35% 8% 0% 25% 50% 75% 100% 2004 2005 2006 2007 9 Mos 2008 |
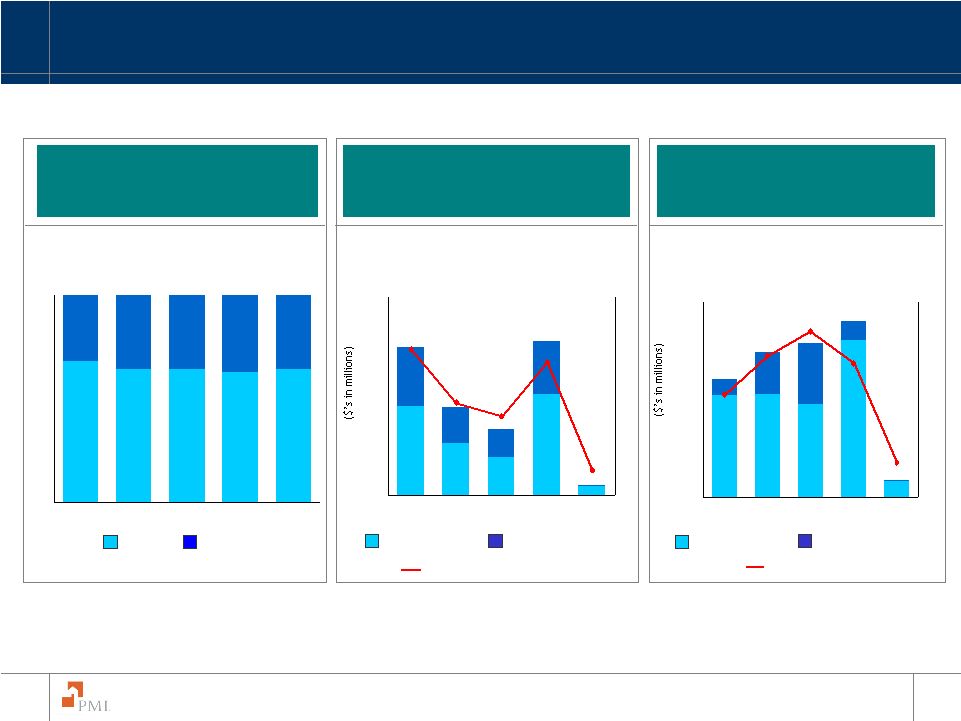   42 The PMI Group, Inc. U.S. Portfolio Primary NIW Characteristics Refinances and Purchases as a % of Primary NIW Less-Than-A Quality Loans - NIW Alt-A Loans – NIW Note: Due to rounding, the sum of percentages may not total 100%. Refinances Purchases Less-Than-A Quality Loans - Structured Channel Less-Than-A Quality Loans – Flow Channel Less-Than-A Quality Loans as a percentage of Total Primary NIW Alt-A Loans – Flow Channel Alt-A Loans as a % of Total Primary NIW Alt-A Loan – Structured Channel With the exception of previous commitments, effective October 1, 2007, PMI discontinued insuring loans with LTVs above 97% and FICO scores below 620. 65% 63% 64% 64% 68% 35% 37% 36% 36% 32% 0% 25% 50% 75% 100% 2004 2005 2006 2007 9 Mos 2008 3,067 289 2,703 1,153 1,588 1,780 838 1,084 1,605 $4,672 $315 $1,991 $2,672 $4,483 2% 10% 6% 7% 11% $0 $2,000 $4,000 $6,000 2004 2005 2006 2007 9 Mos 2008 0% 5% 10% 15% 1,176 7,304 6,691 7,425 11,242 1,204 4,410 3,002 1,397 $12,639 $1,188 $11,101 $10,427 $8,508 7% 27% 34% 29% 21% $0 $4,000 $8,000 $12,000 2004 2005 2006 2007 9 Mos 2008 0% 5% 10% 15% 20% 25% 30% 35% 40% |
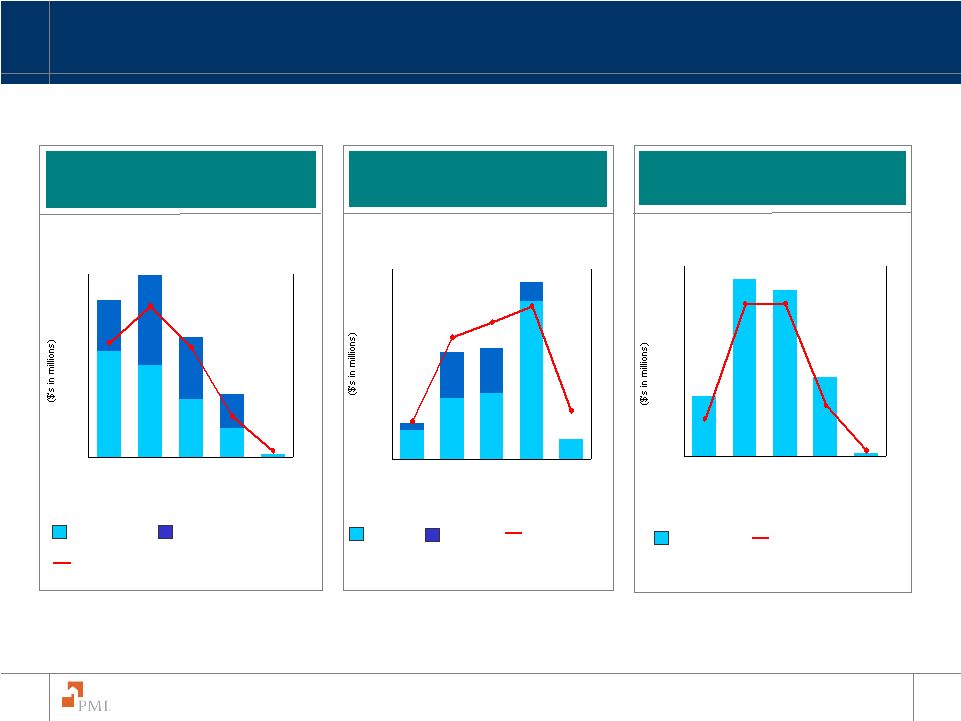   43 The PMI Group, Inc. U.S. Portfolio Primary NIW Characteristics Interest Only Loans - NIW Payment Option ARMs - NIW Payment Option ARMS – Flow Channel Total Payment Option ARMs as a percentage of Total Primary NIW Interest Only – Structured Channel Interest Only – Flow Channel Total Interest Only Loans as a percentage of Total Primary NIW ARMs - NIW ARM amounts Primary NIW – Flow Channel ARM amounts Primary NIW – Structured Channel ARMs as a percentage of Total Primary NIW Approximately 3% of Total Primary RIF is subject to rate adjustment in 2008. Approximately 1% is subject to adjustment in 2009. Approximately 98% of interest only loans written in 2007 have an initial deferral period of 5 years or greater and 85% have an initial deferral period of 7 years or greater. For 2006 NIW, initial deferral periods of 5 and 7 years or greater were 89% and 62%, respectively. $6,992 $6,024 $3,802 $1,907 $3,262 $4,081 $5,889 $2,238 $4,145 $257 $7,883 $11,913 $10,254 24% 2% 9% 25% 33% $0 $4,000 $8,000 $12,000 2004 2005 2006 2007 9 Mos 2008 0% 5% 10% 15% 20% 25% 30% 35% 40% 1,064 8,296 1,533 3,507 3,235 $1,025 410 2,329 2,386 $9,321 $1,075 $5,836 $5,621 $1,943 6% 5% 16% 18% 20% $0 $2,000 $4,000 $6,000 $8,000 $10,000 2004 2005 2006 2007 9 Mos 2008 0% 5% 10% 15% 20% 25% 2,799 952 1,252 2,617 0% 3% 8% 2% 8% $0 $1,000 $2,000 $3,000 2004 2005 2006 2007 9 Mos 2008 0% 5% 10% |
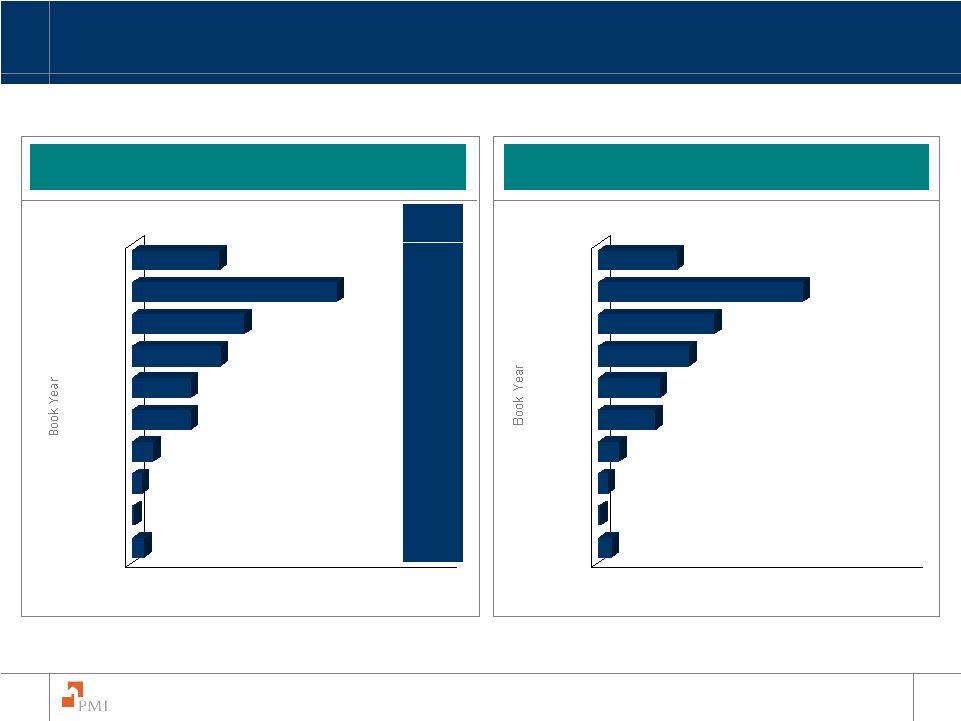   44 The PMI Group, Inc. U.S. Portfolio Age Distribution 2.0% 0.4% 1.6% 3.2% 9.0% 9.0% 13.4% 17.1% 31.1% 13.2% 0% 10% 20% 30% 40% 50% Prior to 2000 2000 2001 2002 2003 2004 2005 2006 2007 2008 $123.1 Billion Primary IIF $30.4 Billion Primary RIF Average Rate (1) (1) Average PMI fixed annual mortgage interest rate. 7.11% 7.03% 6.24% 6.13% 6.02% 6.86% 7.65% 8.64% 7.56% 6.42% Note: Due to rounding, the sum of percentages may not total 100%. 2.1% 0.4% 1.5% 3.3% 8.8% 9.4% 13.8% 17.7% 31.0% 12.0% 0% 10% 20% 30% 40% 50% Prior to 2000 2000 2001 2002 2003 2004 2005 2006 2007 2008 |
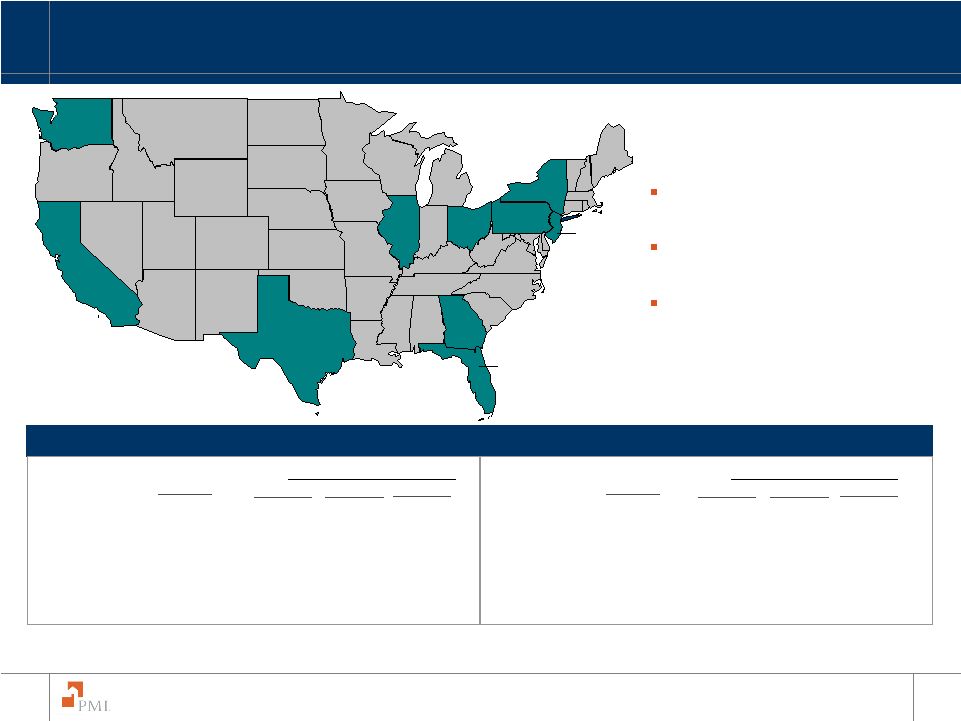   45 The PMI Group, Inc. U.S. Portfolio Geographic Distribution 1 As of September 30, 2008. 2 Default rates as of September 30 and June 30 for 2008 and as of December 31 for 2007. Note: Top ten states as determined by primary RIF on September 30, 2008. 10.5% 7.2% 8.2% 5.1% 3.8% 3.3% 3.8% 3.1% 4.7% 3.1% • Florida 10.5% 22.64% 18.17% 10.56% • California 8.2% 20.95% 18.01% 10.92% • Texas 7.2% 8.05% 6.88% 6.03% • Illinois 5.1% 12.63% 10.80% 8.19% • Georgia 4.7% 12.25% 10.63% 9.50% % of RIF Sep 2008 Jun 2008 Dec 2007 • New York 3.8% 9.63% 8.19% 6.78% • Ohio 3.8% 12.57% 11.44% 10.83% • Pennsylvania 3.3% 9.68% 8.41% 7.47% • Washington 3.1% 6.40% 5.35% 3.58% • New Jersey 3.1% 11.99% 10.59% 7.53% % of RIF Sep 2008 Jun 2008 Dec 2007 Top Ten States – Percent of Primary Risk in Force and Default Rates Primary Default Rates Primary Default Rates Top 10 States represent 52.8% of the total primary RIF Top 10 States have a collective default rate of 13.55% The other 40 States have a collective default rate of 10.62% 1 1 1 1 2 2 1 |
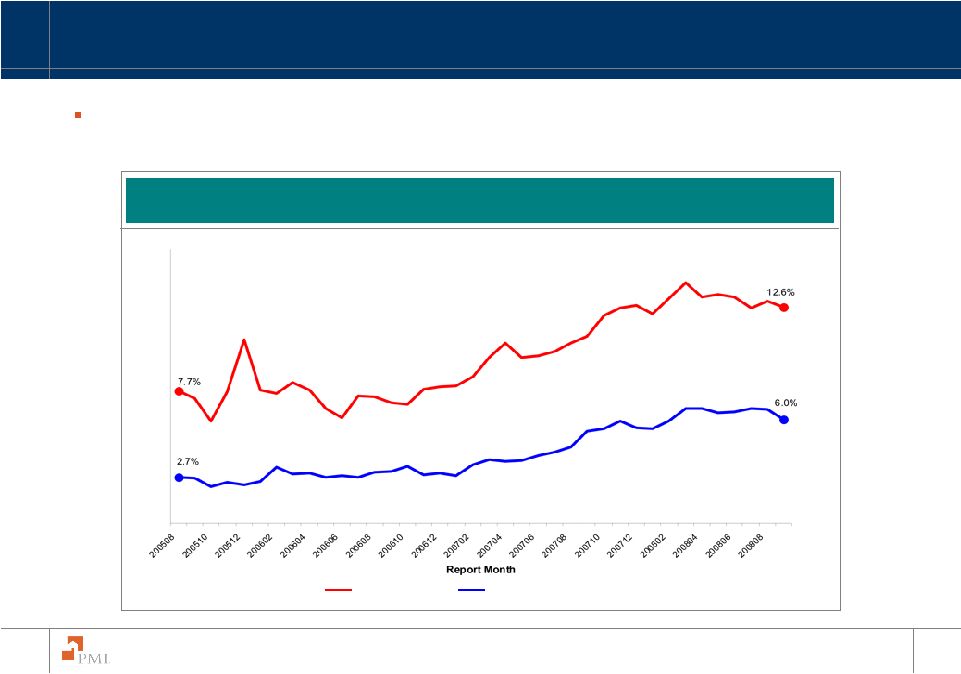   46 The PMI Group, Inc. Newly reported delinquencies from Florida and California have exhibited stabilization in recent periods Percentage of Reported Notices of Default Florida California California and Florida Notices of Default |
   47 The PMI Group, Inc. 15.3% 10.9% 0% 20% Q1 07 Q2 07 Q3 07 Q4 07 Q1 08 Q2 08 Q3 08 13.7% 17.2% 0% 20% Q1 07 Q2 07 Q3 07 Q4 07 Q1 08 Q2 08 Q3 08 California Reported Risk 12.7% 7.5% 0% 20% Q1 07 Q2 07 Q3 07 Q4 07 Q1 08 Q2 08 Q3 08 Florida Reported Risk Great Lakes Reported Risk Arizona & Nevada Reported Risk 6.4% 3.3% 0% 20% Q1 07 Q2 07 Q3 07 Q4 07 Q1 08 Q2 08 Q3 08 Delinquent Risk Reported by State Dollar weighted mix of newly reported delinquencies. |
   48 The PMI Group, Inc. 6.7% 12.0% 0% 25% Q1 07 Q2 07 Q3 07 Q4 07 Q1 08 Q2 08 Q3 08 18.1% 12.7% 0% 25% Q1 07 Q2 07 Q3 07 Q4 07 Q1 08 Q2 08 Q3 08 9.1% 19.3% 0% 25% Q1 07 Q2 07 Q3 07 Q4 07 Q1 08 Q2 08 Q3 08 Flow Alt-A Structured Alt-A Flow >97% LTV Structured 2/28s 5.0% 3.3% 0% 25% Q1 07 Q2 07 Q3 07 Q4 07 Q1 08 Q2 08 Q3 08 Pending Notices of Default by Category Notices of default by category as a percentage of all delinquent policies. Note: Categories shown above are mutually exclusive: Flow > 97% LTV does not include Flow Alt-A loans. |
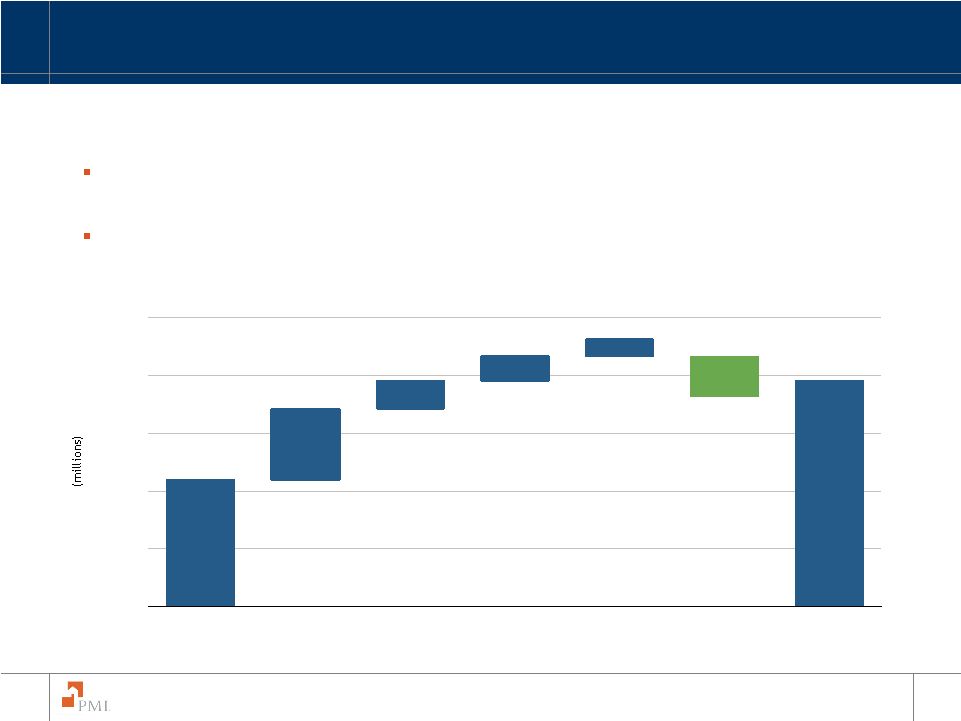   49 The PMI Group, Inc. $1,097 $1,957 $ 355 $ 0 $ 500 $ 1,000 $ 1,500 $ 2,000 $ 2,500 Dec 31, 2007 Net Reserves for Losses NOD Inventory Increase in Claim Rate Increase in Claim Size Other Reserve Changes Captive Recoveries Sept 30, 2008 Net Reserves for Losses Significant additions to reserves have been driven by increases in claim frequency, severity and size. Seeing some potential stabilization in claim rate and claim size. Primary & Pool Loss Reserve Development Net of Captives |
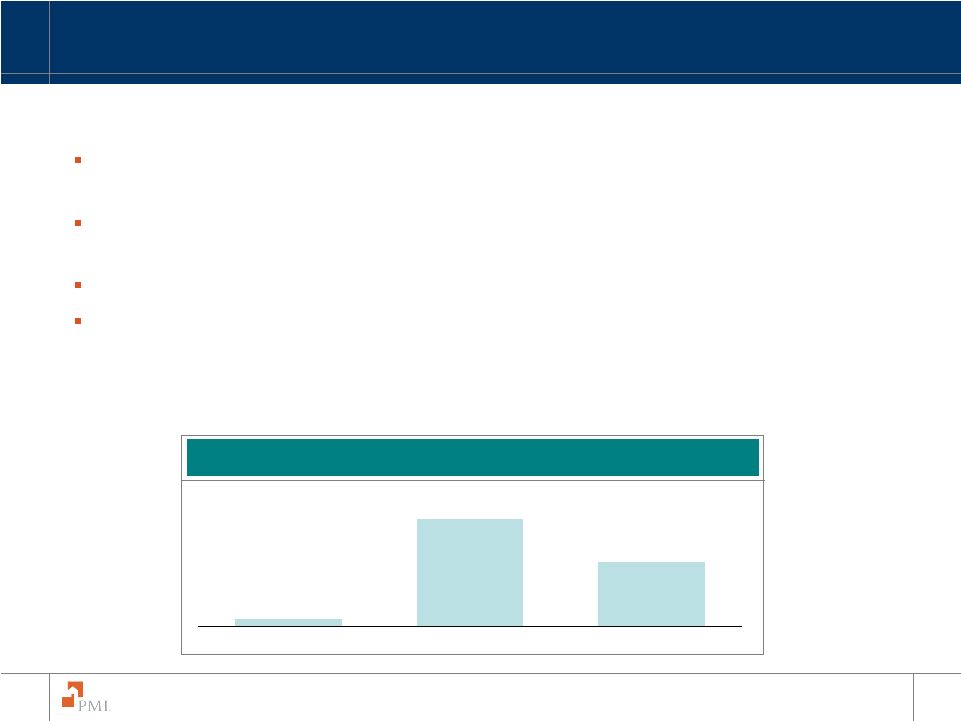   50 The PMI Group, Inc. Future ceded premiums can be used to meet capital adequacy for existing book years. Termination of all existing excess-of-loss reinsurance arrangements effective January 1, 2009. Total captive trust balance at September 30, 2008 was $824.5 million. 93% and 96% of the 2007 and 2006 vintages, respectively, have reached their captive attachment point. Expected Benefit from Captive Reinsurance Agreements 2007 2008 2009 (Dollars in Millions) $34 $500 ~$250 - 300 PMI’s Captive Reinsurance Agreements |
   51 The PMI Group, Inc. $8.9 $9.5 $12.8 $16.7 $25.2 $23.4 $21.5 Q1 2007 Q2 2007 Q3 2007 Q4 2007 Q1 2008 Q2 2008 Q3 2008 Reserves for Losses and LAE per Primary Loan in Default Reserves per delinquent loan have increased and are consistent with the industry average. $349 $403 $651 $1,054 $1,499 $2,037 $2,195 Q1 2007 Q2 2007 Q3 2007 Q4 2007 Q1 2008 Q2 2008 Q3 2008 Reserves for Losses and LAE and Notices of Default Primary Notices of Default Reserves for Losses and LAE Primary Reserves for Losses and Notices of Default |
   52 The PMI Group, Inc. Expect full year 2008 paid claims between $810 - $835 million Prior guidance was for full year 2008 paid claims to be between $850 - $900 million On November 3 rd , paid claims guidance reduction was due to PMI’s Homeownership Preservation Initiatives (HPI) Now, the reduction in paid claims guidance incorporates the potential for some deferral of claims driven by GSE foreclosure moratoriums and other initiatives potentially mitigated by HPI (Dollar’s in millions) $72.8 $75.7 $95.9 $117.9 $198.8 $210.3 $168.8 Q1 2007 Q2 2007 Q3 2007 Q4 2007 Q1 2008 Q2 2008 Q3 2008 Total Claims Paid Including LAE FY 2007 $362.3 9 Mos 2008 $577.9 Paid Claims |
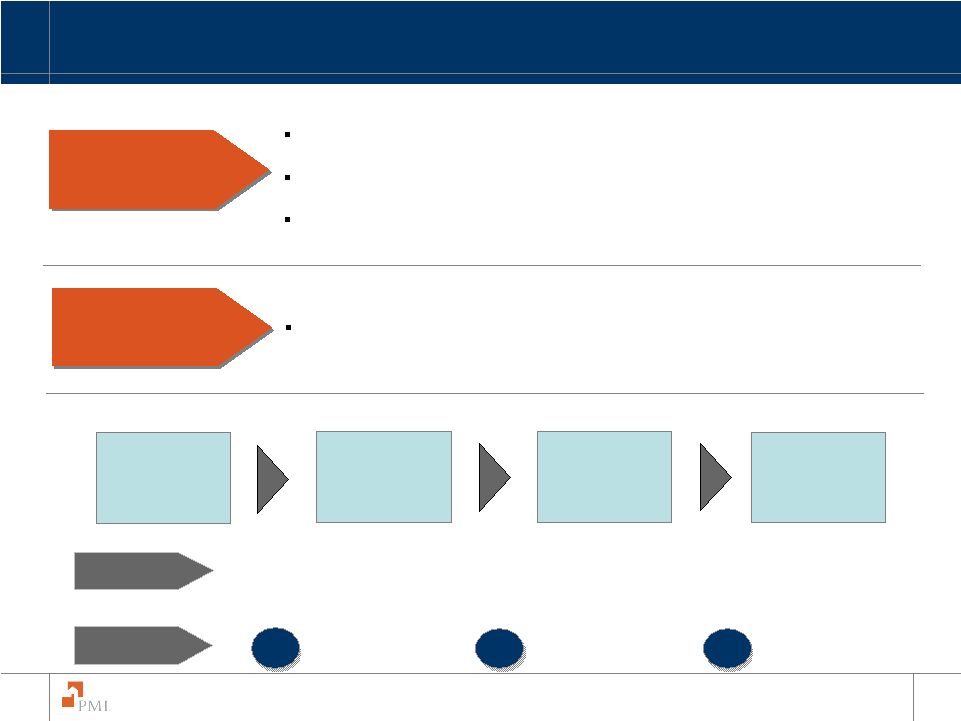
   53 The PMI Group, Inc. PMI’s Homeownership Preservation Initiative (HPI) seeks to generate more workouts on delinquent, PMI insured loans Homeowner Preservation Initiative Expansion of PMI's Delegation Program Delegation for Loan Modifications to all servicers Provide Training to Servicer Staff, Job Aids, Advisory Boards, other support Implement Servicer Workout Reporting Claim Advance Program (e.g. SHARP): Partner with GSEs to find new workout opportunities Servicer and GSE Initiatives PMI and Vendor based outreach PMI onsite Consultants CCCS “No-contact” Program HOPE NOW & other community based events Special Campaigns (i.e. letters, PR, etc.) PMI Borrower Outreach Initiatives |
   54 The PMI Group, Inc. PMI’s loss mitigation programs have enabled 10,200 borrowers to retain their homes and 2,700 to avoid foreclosure through the first 9 months of 2008 Expecting approximately 16,000 homes retained for full year 2008 and approximately 30,500 homes retained in full year 2009. Payment Plan Homeownership Preservation Initiative Home Ownership Retained Foreclosures Avoided Note: HomeSaver Advance is a Fannie Mae program enabling servicers to offer an unsecured, personal loan to cure a payment default. 0 500 1,000 1,500 2,000 2,500 3,000 Q4 2007 Q1 2008 Q2 2008 Q3 2008 Payment Plan Modification HomeSaver 0 200 400 600 800 1,000 1,200 1,400 Q4 2007 Q1 2008 Q2 2008 Q3 2008 Presale Deed in Lieu |
   55 The PMI Group, Inc. CMG Mortgage Insurance Company CMG Mortgage Insurance Company offers mortgage insurance for loans originated by credit unions. Joint venture, equally owned by PMI and CUNA Mutual Group. • PMI’s carrying value is $132.6 million Ratings of AA-(negative) and AA (negative)¹. CMG is the dominant market share leader among credit unions. Primary insurance in force of $21.4 billion, primary risk in force of $5.3 billion. Announced extensive pricing changes across all LTVs and FICO scores. Strong credit performance • Primary default rate 2.03% • Year to date primary paid claims $16 million Year-to-date equity earnings of $13.6 million. ($’s as of September 30, 2008) ¹ Financial strength ratings by Standard & Poor’s and Fitch as of December 1, 2008. |
   56 The PMI Group, Inc. Positive industry trends for mortgage insurance. New business is higher quality. Portions of our portfolio are showing signs of stabilization. HPI and captive recoveries will continue to be important. Summary of Four Key Themes |
 Don Lofe Chief Financial Officer and Chief Administrative Officer The PMI Group, Inc. Investor Conference December 4, 2008 |
   58 The PMI Group, Inc. Monetized investments Significantly enhancing liquidity at the mortgage insurance company and the holding company Redeployed financial resources to core businesses • Holding Company Liquidity – PMI Asia • Capital at U.S. MI - PMI Guaranty • Liquidity at U.S. MI – PMI Australia, PMI Canada Reduced expenses Financial Initiatives under the Five-Point Plan PMI Australia Sale PMI Asia Sale Agreement PMI Guaranty Capital Repatriation PMI Canada Capital Repatriation Revolving Credit Facility Common Stock Dividend |
   59 The PMI Group, Inc. Renegotiated revolving credit facility and borrowed $200 million Cash and investments of $232 million at the holding company as of Sept. 30, 2008 • $45 million redemption of senior notes on November 17, 2008 Agreement for sale of PMI Asia Cash and liquidity of $1.8 billion (plus $732 million from sale of Australia in October) High quality investment portfolio Premium revenue from $123 billion of insurance in force Net investment income Expense management Repatriation of capital: • PMI Guaranty - $152 million, $144 million down-streamed to U.S. MI Operations Liquidity The PMI Group, Inc. PMI Mortgage Insurance Co. ($’s as of September 30, 2008) |
   60 The PMI Group, Inc. (2) Effective January 1, 2008, the ten and thirty year debt issuances are recorded at fair value. (unaudited) (3) Excludes fixed income and unconsolidated subsidiary net investment gains/losses. ($’s in millions) Par Value Sept.30, 2008 Debt (2) Junior Subordinated Debentures (unaudited) GAAP Basis Sept.30, 2008 30 Year Senior Notes 52 150 Five Year Revolving Credit Facility 200 Total Debt 697 Shareholders' Equity Total Capitalization 10 Year Senior Notes 250 Debt / Total Capitalization (GAAP Basis) 26.8% Debt / Total Capitalization (Rating Agency Basis) 30.9% 52 80 200 155 532 1,453 $1,985 Senior Notes $ 45 $ 45 (2) Total Capitalization $2,084 (3) (1) (1) Senior Notes were repaid on November 17, 2008. Capitalization Table (4) (4) Rating Agency Basis utilizes par value and gives equity credit for junior subordinated debentures. |
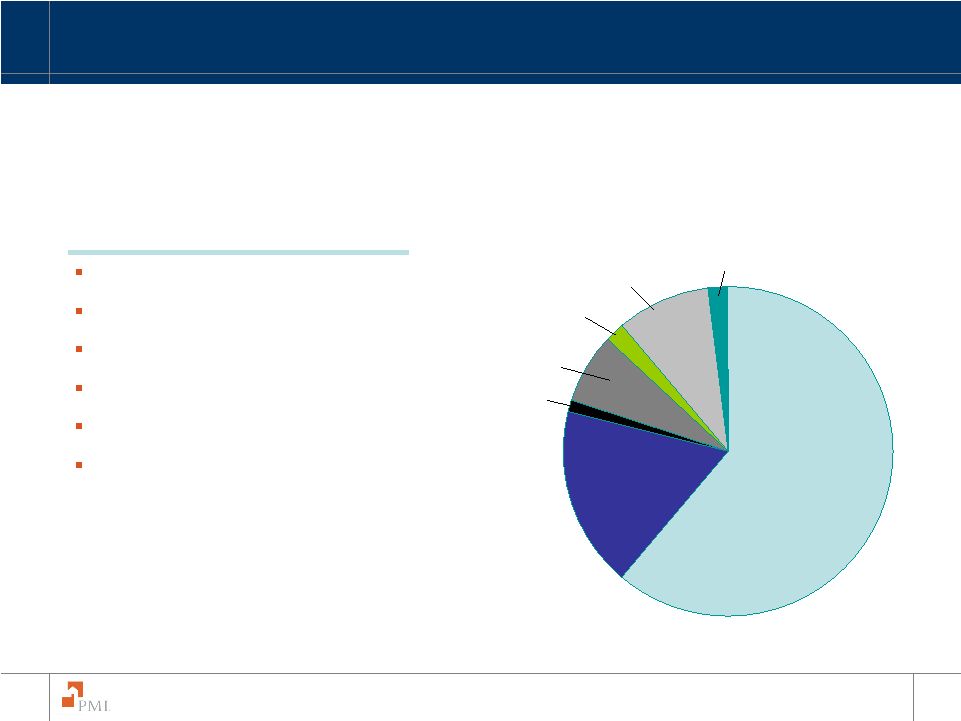   61 The PMI Group, Inc. Consolidated Credit Quality AAA or equivalent 51.8% AA 28.0% A 16.2% BBB 3.7% Non-investment grade 0.3% Consolidated Duration 6.5 Municipal Bonds, 61% PMI Europe 9% Common Stocks 1% Cash and Cash Equivalents, 18% Preferred Stocks 7% Corporate, U.S. Government and Agency, 2% PMI Canada 2% Consolidated Investment Portfolio (As of September 30, 2008) Total portfolio value of $2.96 billion |
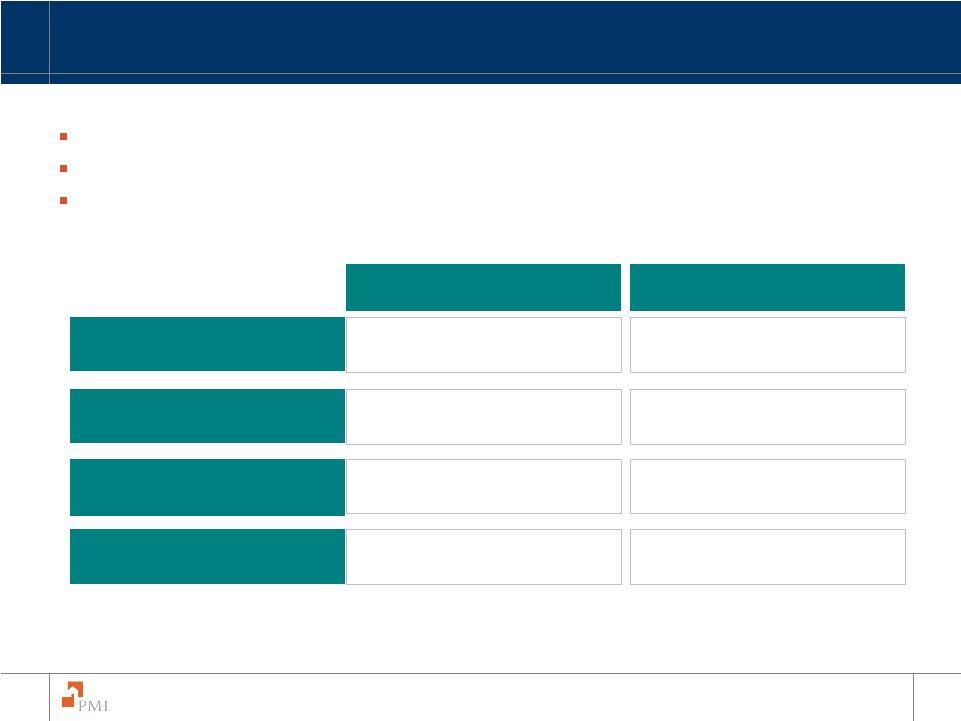   62 The PMI Group, Inc. Renegotiated our revolving credit facility $200 million outstanding on the total $250 million facility Maturity date is October 2011 PMI Mortgage Insurance Co. maintains a financial strength rating of Baa (Moody’s) or BBB (S&P) Adjusted Consolidated Net Worth Maximum Total Debt to Total Capitalization Maintenance of Ratings PMI Mortgage Insurance Co. ratings are A3 (under review) by Moody’s and A- (negative) by S&P Less than or equal to 35% 26.8% (GAAP Basis) Maximum Risk to Statutory Capital Ratio No greater than 20 to 1 15.75 to 1 $1.9 billion Must be at least $1.505 billion Requirement At September 30, 2008 Revolving Credit Facility |
   63 The PMI Group, Inc. Ratings of The PMI Group, Inc. A3 (under review) Not rated A3 (under review) Baa3 (under review) Moody’s BBB+ (negative) Not rated A- (negative) PMI Europe AA (negative) Not rated AA- (negative) CMG Mortgage Insurance Co. BBB+ (negative) AA (stable) A- (negative) PMI Mortgage Insurance Co. BB (negative) Not rated BBB- (negative) The PMI Group, Inc. Fitch DBRS S&P |
   64 The PMI Group, Inc. 65 Unique investment available to mortgage insurance and financial guaranty companies. Allows quick recovery to pay claims and can be redeemed at any time. PMI has actively used tax and loss bonds to accelerate tax recoveries in U.S. MI operations. Tax and loss bonds are admitted assets, and accordingly are components of statutory surplus. Tax and loss bonds provide for better tax management, as well as investment income, and provide a valuable source of liquidity for paying claims. 2008 YTD Redemptions $299 M Tax and Loss Bond Holdings $410 M 1 As of September 30, 2008. Tax and Loss Bonds 1 1 |
   65 The PMI Group, Inc. Sale of PMI Australia is a significantly positive transaction Capital plan centered on monetizing our investments in our subsidiaries — highest and best source of capital and liquidity. Sale of PMI Australia demonstrated our ability to execute this critical transaction in a very challenging operating environment. Sale valuation of approximately $920 million realized from our initial investment of $155 million in 1999. Unsecured note payable on September 20, 2011; timing aligned with the credit facility expiration of October 2011 Can be sold / transferred after eighteen months Non-cash payment note accreting at 3 month LIBOR as of June 30, 2008 plus 1% compounded semi-annually (3.875%)(fixed) Settlement value based on loss performance of existing book of business for the three year period ending June 30, 2011 Reinsurance will cover excess of loss for incurred losses of 100% of closing unearned premium reserve PMI funded premiums of $46.5 million with the profit sharing for one-half of the reinsurance premiums at the end of the three year period, subject to certain conditions PMI Australia Sale Note Reinsurance Cover |
   66 The PMI Group, Inc. PMI Australia note of $184 million dollars, plus accrued interest Note counterparty is an “A” category rated entity Accounting guidance governs treatment under GAAP Our sales contract with QBE provides the ability to sell the notes 18 months after the sale date. We are seeking regulatory admissibility of this note. This will determine our ability to obtain statutory credit for all or some of the note value. PMI Australia Note |
   67 The PMI Group, Inc. AUD 0.40 AUD 0.50 AUD 0.60 AUD 0.70 AUD 0.80 AUD 0.90 AUD 1.00 Aug-99 Jun-00 Apr-01 Feb-02 Dec-02 Oct-03 Aug-04 Jun-05 Apr-06 Feb-07 Dec-07 Oct-08 PMI entered into sale agreement with QBE and locked in an exchange rate of US $1.00/AU $0.95 Australian Dollar Exchange Rate PMI Australia Sale Time period shown: August 6, 1999, the acquisition date of PMI Australia, through October 22, 2008. |
   68 The PMI Group, Inc. Europe has been reconfigured to conserve capital and reduce expenses. Nearing risk limits for reserves on U.S. subprime reinsurance transactions (BBB attachment point). Other U.S. subprime transaction at a “AA” attachment point; no reserves established to date. Rating agency actions and future loss development on CDS exposures may require additional collateral to be posted. Ratings downgrades give certain counterparties the right to terminate agreements, which could result in termination payments. (1) As of September 30, 2008. $207 million risk in force $70.2 million in reserves $58.1 million in pledged collateral $22.5 million pledged collateral $0.9 million YTD mark-to-market PMI Europe (1) (1) U.S. Subprime Reinsurance Credit Default Swap Transactions |
   69 The PMI Group, Inc. We have made substantial progress on our strategic plan to monetize existing assets, rationalize the organization and explore all options available. However, we are considering capital / capital relief initiatives to meet and balance statutory capital, credit facility and rating agency requirements and GSE remediation plans, as well as to optimize new business writings. Capital initiatives, to the extent available, could include: • Equity or equity-like instruments • Other options (e.g. QBE note, etc.) Capital relief initiatives could include: • Loss mitigation initiatives • Restructuring initiatives • Reduced new business writings • Reinsurance • Other (i.e. expense reduction initiatives) Capital |
 Steve Smith Chairman and Chief Executive Officer The PMI Group, Inc. Investor Conference December 4, 2008 |
   71 The PMI Group, Inc. The key to economic recovery lies in the revitalization of our housing markets and the prevention of unnecessary foreclosures. Central to this objective is the availability of new mortgage funds at reasonable rates. Without a vibrant and active private mortgage insurance industry, loan availability will be diminished and millions of creditworthy consumers will be locked out of the housing market. The PMI Group is a critical participant in the revitalization of the nation’s housing market PMI: Critical to Housing Market Revitalization |
   72 The PMI Group, Inc. Challenging time for the global economy, including the private mortgage insurance industry PMI has made significant progress on its five-point plan New business fundamentals are favorable We are evaluating capital / capital relief initiatives to maintain adequate liquidity and capital adequacy and allow us to optimize growth opportunities going forward. PMI’s entire management team, and each and every PMI employee, is committed to executing our five-point plan, as well as fostering sustainable home ownership, which we believe will bring long term value to our shareholders. Summary |
 Question & Answer The PMI Group, Inc. Investor Conference December 4, 2008 |
 Executive Officers |
   75 The PMI Group, Inc. L. Stephen Smith Chairman and Chief Executive Officer The PMI Group, Inc. L. Stephen Smith is Chairman and Chief Executive Officer of The PMI Group, Inc. He became the company’s President and Chief Operating Officer in 1998. He is also Chairman and CEO of PMI Mortgage Insurance Co., a subsidiary of The PMI Group, Inc., which is also the second largest mortgage insurance company in the United States. Smith has more than 35 years of experience in mortgage insurance, housing finance, and banking. He began his career with PMI in 1979 and has held a variety of positions, including account executive, secondary market executive, and area sales director before being promoted to Vice President of PMI’s Eastern Zone. Smith was later promoted to Senior Vice President of Marketing, where he oversaw the implementation of corporate strategic growth initiatives. He was later promoted to Executive Vice President of Field Operations, and then to President and Chief Operating Officer in 1998. In 2004 he became CEO of PMI Mortgage Insurance Co. Prior to joining PMI, Smith spent eight years as a Vice President with Citizens and Southern National Bank in Atlanta. Smith has served as President of the Mortgage Insurance Companies of America, the industry trade group, and as a member of the Board of Directors of National Association of Hispanic Real Estate Professionals. He is an active participant in a variety of industry and community organizations. A graduate of Georgia Tech, Smith has a B.S. in industrial management. Smith is also a graduate of the Stanford Executive Program. L. Stephen Smith |
   76 The PMI Group, Inc. David H. Katkov Executive Vice President, Chief Business Officer The PMI Group, Inc. President PMI Mortgage Insurance Co. As Chief Business Officer of The PMI Group, Inc. and President of PMI Mortgage Insurance Co. (PMI), David H. Katkov is responsible for leading PMI’s sales, product development, government and public relations teams in the delivery of mortgage insurance as the preferred form of credit default protection for low-down payment mortgages. Katkov also oversees PMI’s joint venture ownership interest in CMG Mortgage Insurance Company. Katkov has been Executive Vice President of The PMI Group, Inc. since August 2001 and Chief Business Officer since November 2008. Prior to joining PMI, Katkov was a Vice President of US Bank Corporation in Minneapolis, Minnesota. Katkov represents PMI with industry trade associations that focus on public policy issues in the housing and mortgage marketplace. He is on the Executive Committee of the Mortgage Insurance Companies of America (MICA) and represents PMI with the Mortgage Bankers Association of America. Katkov serves on the Executive Committee of the Housing Policy Council which is an affiliate of the Financial Services Roundtable. Katkov is the Chairman of the Board of Social Compact, a Washington, D.C. non-profit organization dedicated to promoting the revitalization of America’s Inner Cities. Katkov holds Bachelors and Masters degrees in business from the University of Minnesota’s Carlson School of Management. David H. Katkov |
   77 The PMI Group, Inc. Donald P. Lofe, Jr. Executive Vice President, Chief Financial Officer and Chief Administrative Officer The PMI Group, Inc. As Executive Vice President, Chief Financial Officer, and Chief Administrative Officer, Donald P. Lofe, Jr. is responsible for corporate-wide GAAP, SEC, and statutory accounting and reporting, capital planning and analysis, management of the rating agencies, investments and asset management, treasury services, taxation, investor and certain public relations aspects, internal audit, human resources, as well as facilities administration. Prior to joining The PMI Group, Inc., Lofe was a Senior Vice President in the Corporate Finance Department of The CNA Financial Corporation, where he was responsible for capital management, including treasury services, capital planning and risk assessment, rating agencies and industry analysis, insurance regulatory analysis and compliance, mergers and acquisitions activities, investor relations, and investment operations and analysis. Lofe was also the partner-in-charge of the Northeast Ohio Insurance Practice, resident in the Cleveland office of PricewaterhouseCoopers LLP (PwC), and the engagement partner for The Progressive Corporation. Lofe serves as a member of numerous boards of directors as well as audit and other committees for profit and not-for-profit organizations. He also has served as a member of PwC’s Insurance Industry Chairman’s Leadership Group. A graduate of Westminster College, Lofe majored in accounting and political science. He holds an MBA in finance and business policy from the University of Chicago and is a certified public accountant. Donald P. Lofe, Jr. |
   78 The PMI Group, Inc. David W. Berson Senior Vice President, Chief Economist and Strategist The PMI Group, Inc. David W. Berson joined PMI as chief economist and strategist on October 30, 2007. Dr. Berson’s responsibilities include analyses and forecasts of the economy, housing, and mortgage markets; domestic/global market research and planning; support of government relations and public policy; and strategic environmental planning. He also acts as a PMI spokesperson on topics related to global economic housing, as well as mortgage market conditions, prospects and policy. In addition, Dr. Berson manages PMI’s Portfolio Management, Analytics and Pricing group, which is responsible for all credit analytic models and projections for the company. Berson previously was vice president and chief economist at Fannie Mae, where he advised the company on national and regional economic, housing and mortgage policy and conditions, including forecasts and analyses of the economy, interest rates, and housing and mortgage finance markets. He has also been chief financial economist at Wharton Econometrics, visiting scholar at the Federal Reserve Bank of Kansas City, and assistant professor of economics at Claremont McKenna College and Claremont Graduate School. His government experience has included staff economist on the Council of Economic Advisors and economic analyst at the Treasury Department and the Office of Special Trade Representative. Dr. Berson is a Past President of the National Association for Business Economics and is a frequent speaker to media and to industry groups on the economic outlook, housing, and mortgage markets. He has a doctorate in economics and a master's degree in public policy from the University of Michigan, and a bachelor's degree in history and economics from Williams College. David W. Berson |
   79 The PMI Group, Inc. Doyle Bartlett Principal Eris Group Doyle Bartlett served for five years as Chief of Staff to Representative Bill McCollum (R-FL), supporting Congressman McCollum’s work as Vice Chairman of the House Banking Committee and Chairman of the House Judiciary Committee’s Crime Subcommittee. In this role, he managed all aspects of the Congressman’s Washington, DC and district offices. Before founding Bartlett & Bendall, he was a Senior Vice President at the Smith-Free Group. He is an active political fundraiser and contributor, and oversaw Bill McCollum’s race for the U.S. Senate in 1999-2000 and his successful campaign for Florida Attorney General in 2006. From 1988 to 1994, Bartlett was General Counsel and Senior Vice President for Legislative Services with the Conference of State Bank Supervisors, the professional association of state banking regulators. Before joining CSBS, Bartlett was Manager of State Government Relations at Freddie Mac. Bartlett came to Washington in 1984 as staff to the House Banking Committee, supporting Congressman Bill McCollum in his position as ranking member of the Subcommittee on Domestic Monetary Policy. He had previously served as McCollum’s district representative in Orlando, Florida. A Florida native, Bartlett holds a business degree from the University of Florida and a law degree from the National Law Center at George Washington University. Bartlett is a member of the Bar in both Oklahoma and the District of Columbia, and was recently named one of DC’s top “Hired Guns,” in the Hill newspaper for the fifth year in a row. Doyle Bartlett |
   80 The PMI Group, Inc. Howard B. Glaser President Glaser Group Howard B. Glaser is one of Washington’s leading real estate finance and mortgage industry consultants. Mr. Glaser specializes in advising clients on legislative, regulatory and government matters with particular emphasis on the real estate finance, housing, and financial services industries. Clients of the Glaser Group include mortgage insurance companies, real estate and housing trade associations, mortgage bankers, and investment research companies. Prior to establishing his consulting practice Mr. Glaser served as Senior Vice President for Government Affairs and General Counsel at the Mortgage Bankers Association of America where he led the MBA to a string of important legislative and regulatory victories. From 1994 to 2000, Mr. Glaser served in several senior management roles at the Department of Housing and Urban Development, including Counselor to the Secretary, Deputy Assistant Secretary, and Acting General Counsel. For his work in reforming federal housing programs, Mr. Glaser was a recipient of the 1996 John F. Kennedy School of Government “Innovations in Government” award. Before joining the federal government, Mr. Glaser was a senior advisor to New York Governor Mario Cuomo. Mr. Glaser has testified before Congress numerous times and is a regular advisor to congressional committees on real estate finance and housing industry issues. His analysis is frequently sought and reported by the Wall Street Journal, New York Times, Washington Post, American Banker and other national media. Mr. Glaser is a graduate of Harvard Law School and is a member of the New York State Bar. Howard B. Glaser |
   81 The PMI Group, Inc. Brian Gardner Washington Policy Analyst KBW, Inc. Brian has been KBW’s Washington Analyst since 2004. In his role, Brian follows and analyzes political, legislative, and regulatory developments and advises KBW’s clients on what these events mean to the financial markets and investors. He collaborates with KBW’s fundamental research analysts as they incorporate political events into their industry and company analysis. Before assuming the role as Washington Analyst, Brian was an associate on KBW’s Bank Research team. Prior to joining KBW, Brian was an associate in the Bank Regulatory Group with the New York law firm Schulte Roth & Zabel. Brian began his professional career in Washington as a Legislative Assistant to former Congressman Rick Lazio. He then served as Staff Director and Counsel for former Congressman Richard Baker. Brian handled financial service issues for both of these former members of the House Financial Services Committee. Brian received both his BA and JD from Fordham University in New York. ABOUT KBW KBW, Inc. is the parent of Keefe, Bruyette & Woods, Inc., Keefe, Bruyette & Woods Limited and KBW Asset Management. Keefe, Bruyette & Woods, Inc. is a full service investment bank specializing in the financial services industry. Founded in 1962, it is widely recognized as a leading authority in the banking, insurance, brokerage, asset management, mortgage banking and specialty finance sectors. The firm has established industry-leading positions in the areas of research, corporate finance, mergers and acquisitions, as well as sales and trading for financial services companies. Brian Gardner |
 Appendix |
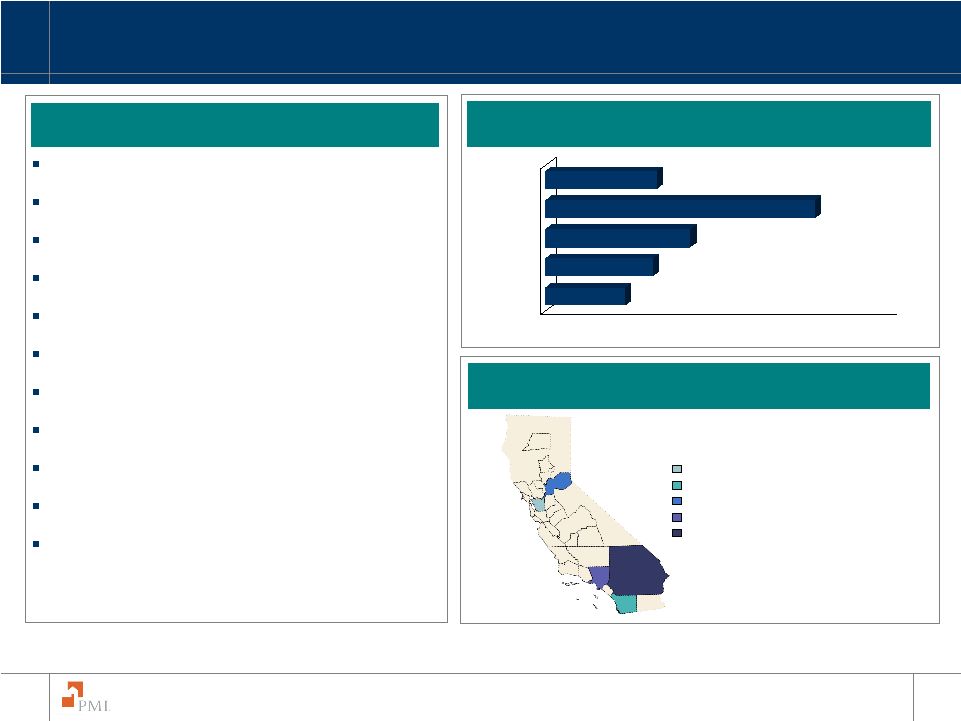   83 The PMI Group, Inc. California at September 30, 2008 $2.5 billion of Primary Risk in Force 8.2% of PMI’s Primary Risk in Force 33,405 policies in force 20.95% default rate $303,177 Average Loan Size 702 Average FICO¹ 90.5% Average Original Loan to Value¹ 71.9% Fixed Rate Loan² 81.8% Single Family Property² 91.8% Primary Residence² 36.7% Alt-A² Oakland-Fremont-Hayward, CA– 0.4% San Diego-Carlsbad-San Marcos – 0.6% Sacramento--Arden-Arcade—Roseville – 0.7% Riverside-San Bernardino-Ontario – 1.7% Los Angeles-Long Beach-Glendale – 1.7% MSA Distribution of Total Primary RIF 11.2% 15.1% 20.3% 37.8% 15.6% 0% 10% 20% 30% 40% 50% Prior to 2005 2005 2006 2007 2008 California Primary Risk in Force by Vintage Top 5 California MSAs California Primary Risk in Force 1 Average is calculated by taking the sum of the category and dividing by the number of policies in force 2 Represents percentage of PMI’s California primary risk in force |
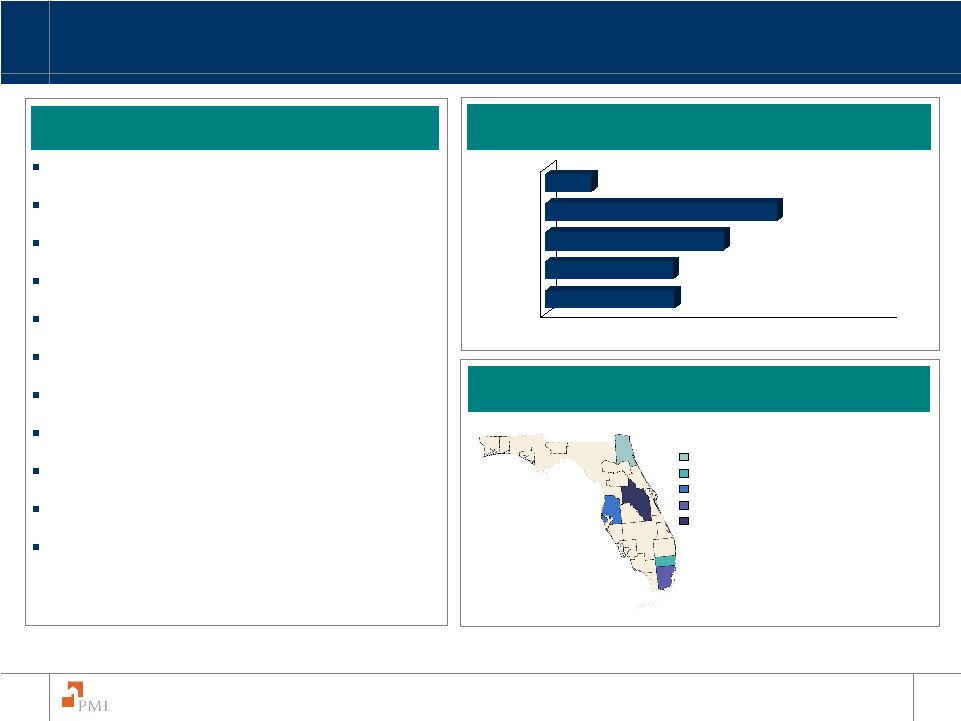   84 The PMI Group, Inc. Florida at September 30, 2008 $3.2 billion of Primary Risk in Force 10.5% of PMI’s Primary Risk in Force 70,123 policies in force 22.64% default rate $179,098 Average Loan Size 696 Average FICO¹ 92.3% Average Original Loan to Value¹ 83.4% Fixed Rate Loan² 71.4% Single Family Property² 77.9% Primary Residence² 36.8% Alt-A² 1 Average is calculated by taking the sum of the category and dividing by the number of policies in force 2 Represents percentage of PMI’s Florida primary risk in force 18.1% 17.9% 25.0% 32.5% 6.5% 0% 10% 20% 30% 40% 50% Prior to 2005 2005 2006 2007 2008 Florida Primary Risk in Force by Vintage Top 5 Florida MSAs Florida Primary Risk in Force Jacksonville, FL – 0.7% Fort Lauderdale-Deerfield Beach, FL – 1.1% Miami-Miami Beach-Kendall, FL – 1.6% MSA Distribution of Total Primary RIF Orlando-Kissimmee, FL – 1.7% Tampa-St. Petersburg-Clearwater, FL – 1.5% |
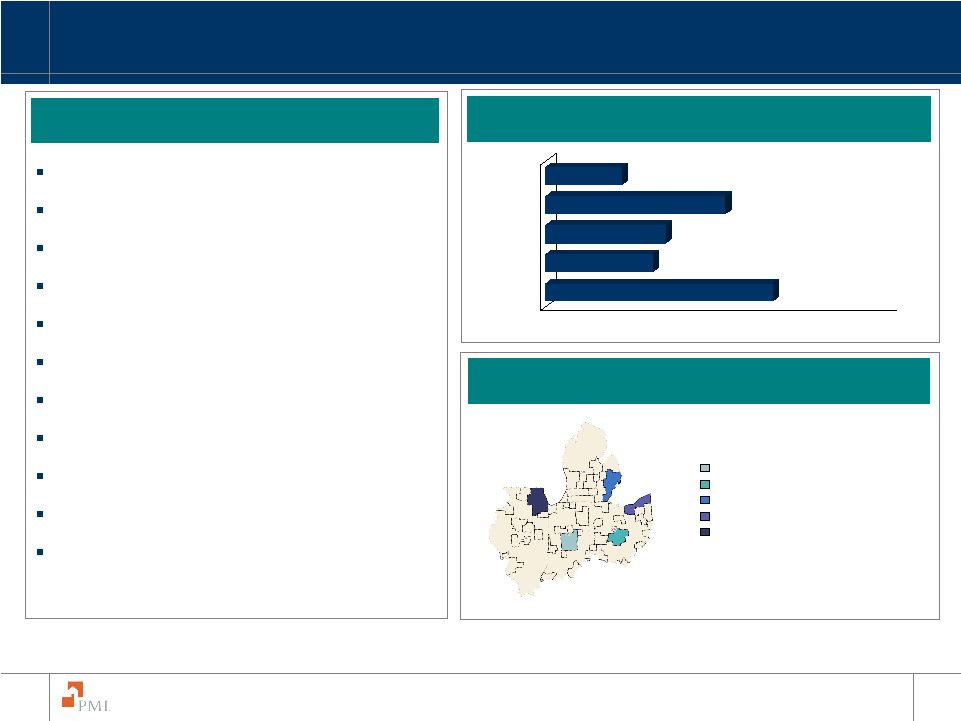   85 The PMI Group, Inc. Auto States at September 30, 2008 $4.1 billion of Primary Risk in Force 13.5% of PMI’s Primary Risk in Force 125,613 policies in force 13.64% default rate $133,939 Average Loan Size² 687 Average FICO² 92.4% Average Original Loan to Value² 89.3% Fixed Rate Loan³ 82.8% Single Family Property³ 92.2% Primary Residence³ 13.5% Alt-A³ 1 The Auto States, as defined in this presentation, are Illinois, Indiana, Michigan and Ohio 2 Average is calculated by taking the sum of the category and dividing by the number of policies in force 3 Represents percentage of PMI’s Auto States primary risk in force 31.9% 15.1% 16.9% 25.3% 10.8% 0% 10% 20% 30% 40% 50% Prior to 2005 2005 2006 2007 2008 Auto States¹ Primary Risk in Force by Vintage Top 5 Auto States¹ MSAs Auto States¹ Primary Risk in Force Cleveland-Elyria-Mentor, OH -1.0% Chicago – Naperville –Joliet, IL -3.9% Columbus, OH -0.8% Indianapolis–Carmel, IN -0.7% Warren-Troy-Farmington Hills, MI-0.9% MSA Distribution of Total Primary RIF |
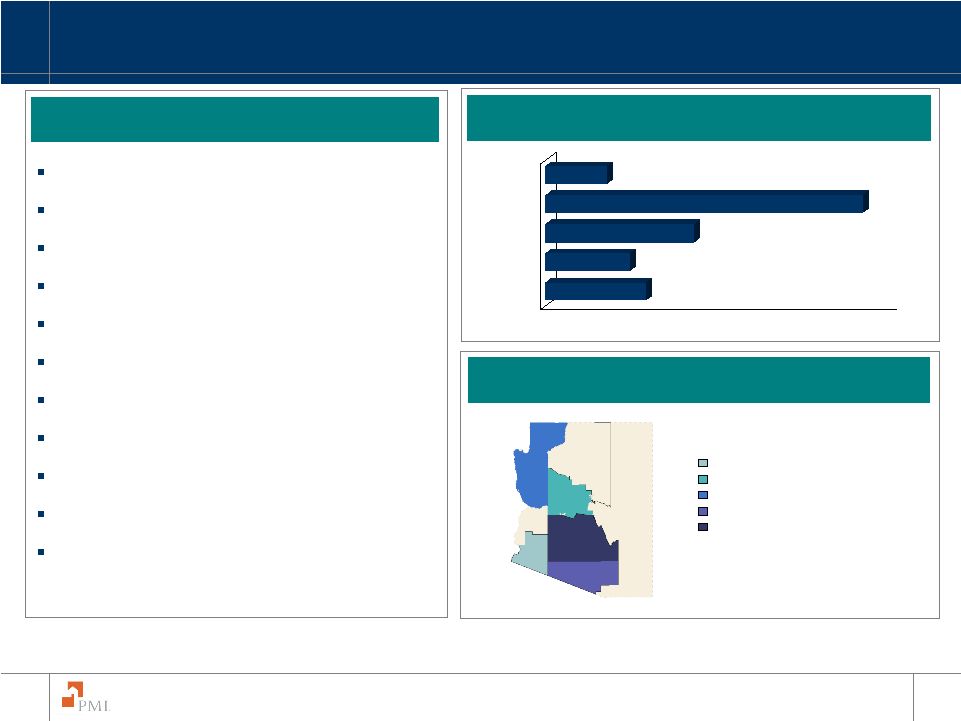   86 The PMI Group, Inc. Arizona at September 30, 2008 $882.6 million of Primary Risk in Force 2.9% of PMI’s Primary Risk in Force 18,590 policies in force 15.30% default rate $191,258 Average Loan Size¹ 697 Average FICO¹ 92.7% Average Original Loan to Value¹ 87.2% Fixed Rate Loan² 85.1% Single Family Property² 83.4% Primary Residence² 26.6% Alt-A² 1 Average is calculated by taking the sum of the category and dividing by the number of policies in force 2 Represents percentage of PMI’s Arizona primary risk in force 14.1% 11.8% 20.9% 44.5% 8.6% 0% 10% 20% 30% 40% 50% Prior to 2005 2005 2006 2007 2008 Arizona Primary Risk in Force by Vintage Top 5 Arizona MSAs Arizona Primary Risk in Force Yuma, AZ – 0.1% Prescott, AZ-0.1% Lake Havasu City-Kingman, AZ-0.1% Tucson, AZ-0.4% Phoenix-Mesa, AZ – 2.1% MSA Distribution of Total Primary RIF |
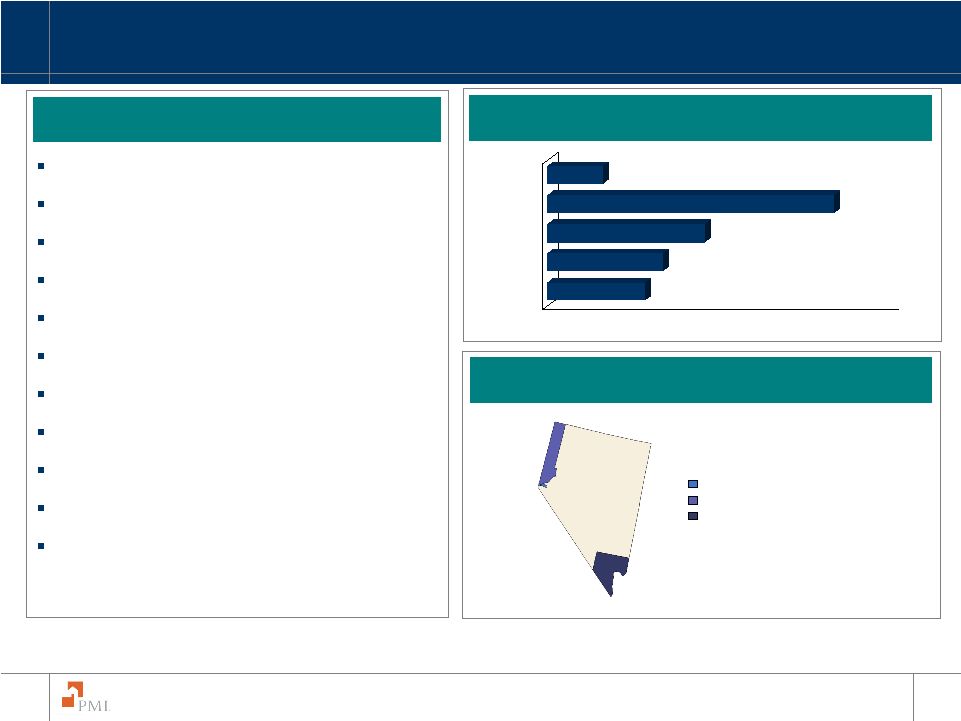   87 The PMI Group, Inc. Nevada at September 30, 2008 $533.9 million of Primary Risk in Force 1.8% of PMI’s Primary Risk in Force 8,883 policies in force 18.55% default rate $237,831 Average Loan Size¹ 703 Average FICO¹ 91.8% Average Original Loan to Value¹ 71.1% Fixed Rate Loan² 79.1% Single Family Property² 80.7% Primary Residence² 34.8% Alt-A² 13.7% 16.2% 22.1% 40.2% 7.8% 0% 10% 20% 30% 40% 50% Prior to 2005 2005 2006 2007 2008 Nevada Primary Risk in Force by Vintage Top 5 Nevada MSAs Nevada Primary Risk in Force Las Vegas-Paradise, NV-1.4% Reno-Sparks, NV-0.2% Carson city, NV-0.01% MSA Distribution Total Primary RIF 1 Average is calculated by taking the sum of the category and dividing by the number of policies in force 2 Represents percentage of PMI’s Nevada primary risk in force |
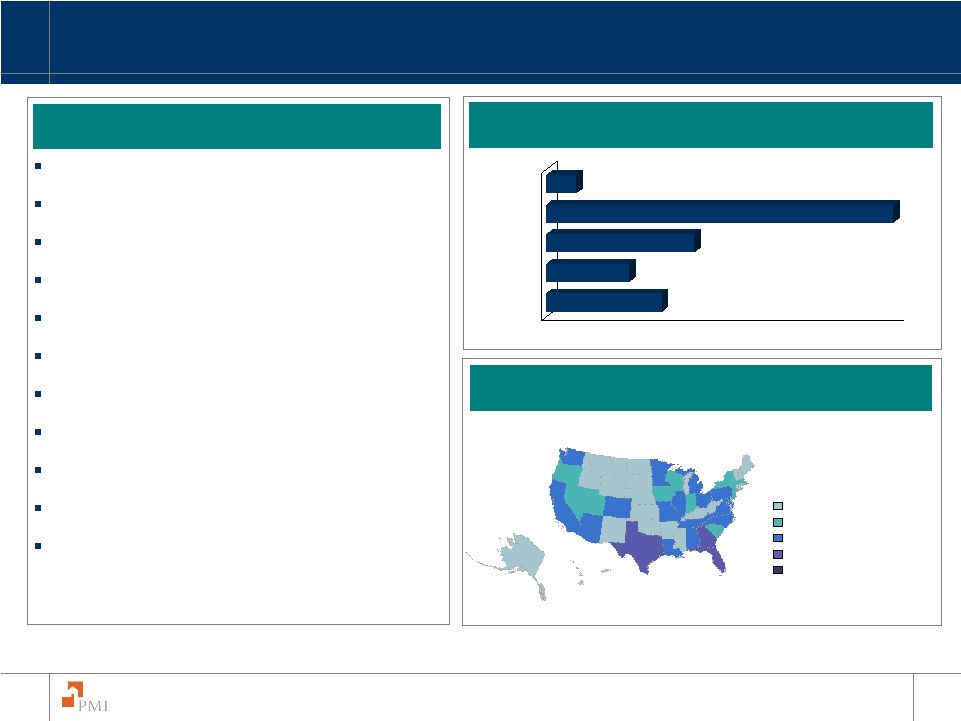   88 The PMI Group, Inc. Greater Than 97% LTV at September 30, 2008 $6.8 billion of Primary Risk in Force 22.1% of PMI’s Primary Risk in Force 162,657 policies in force 15.24% default rate $149,227 Average Loan Size¹ 675 Average FICO¹ 99.9% Average Loan to Value¹ 94.7% Fixed Rate Loan² 85.6% Single Family Property² 94.5% Primary Residence² 13.0% Alt-A² 16.0% 11.5% 20.5% 47.9% 4.1% 0% 10% 20% 30% 40% 50% Prior to 2005 2005 2006 2007 2008 Greater Than 97% LTV Primary Risk in Force by Vintage Greater Than 97% LTV Geographic Distribution Greater Than 97% LTV Primary Risk in Force 0% - 1% 1.01% - 2% 2.01% - 5% 10.01% - 100% 5.01% - 10% State Distribution of > 97% LTV RIF 1 Average is calculated by taking the sum of the category and dividing by the number of policies in force 2 Represents percentage of PMI’s Greater than 97% LTV primary risk in force |
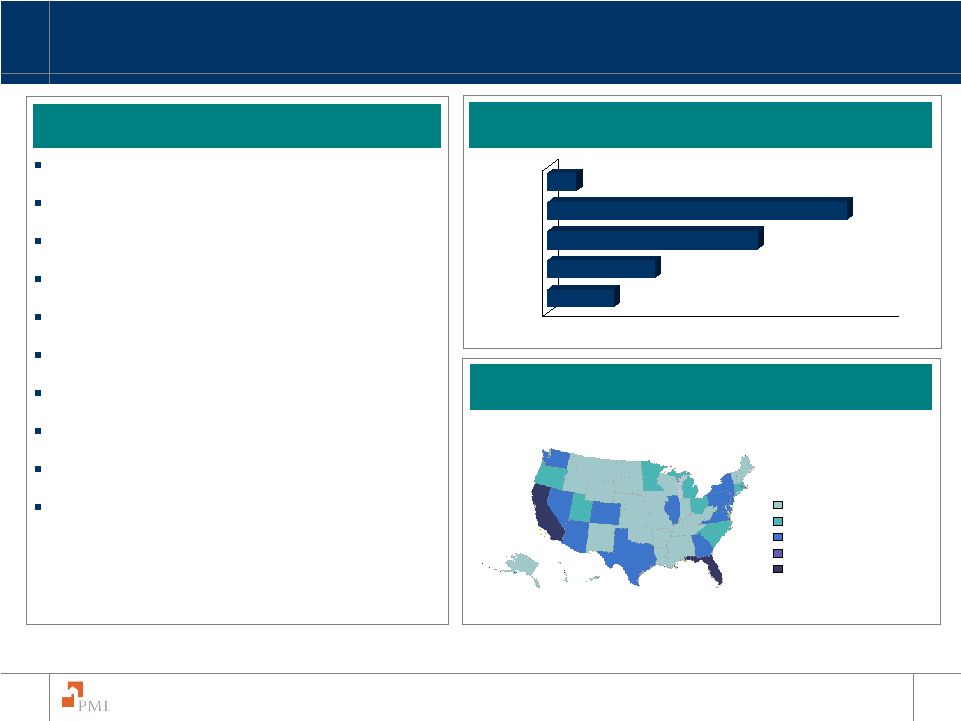   89 The PMI Group, Inc. Alt-A at September 30, 2008 $6.1 billion of Primary Risk in Force 20.2% of PMI’s Primary Risk in Force 106,267 policies in force 25.80% default rate $214,235 Average Loan Size¹ 706 Average FICO¹ 90.9% Average Loan to Value¹ 75.2% Fixed Rate Loan² 77.9% Single Family Property² 79.1% Primary Residence² 9.3% 15.1% 29.5% 42.0% 4.1% 0% 10% 20% 30% 40% 50% Prior to 2005 2005 2006 2007 2008 Alt-A Primary Risk in Force by Vintage Alt-A Primary Risk in Force Alt-A Geographic Distribution 0% - 1% 1.01% - 2% 2.01% - 5% 10.01% - 100% 5.01% - 10% State Distribution of Alt-A RIF 1 Average is calculated by taking the sum of the category and dividing by the number of policies in force 2 Represents percentage of PMI’s Alt-A primary risk in force |
   90 The PMI Group, Inc. 2/28 Hybrid ARMs at September 30, 2008 $767.6 million of Primary Risk in Force 2.6% of PMI’s Primary Risk in Force 13,296 policies in force 47.38% default rate $187,381 Average Loan Size¹ 654 Average FICO¹ 87.9% Average Original Loan to Value¹ 80.5% Single Family Property² 76.2% Primary Residence² 45.3% Alt-A² 6.6% 36.7% 48.8% 7.9% 0.0% 0% 10% 20% 30% 40% 50% Prior to 2005 2005 2006 2007 2008 2/28 Hybrid ARMs Primary Risk in Force by Vintage 2/28 Hybrid ARMs Geographic Distribution 2/28 Hybrid ARMs Primary Risk in Force 0% - 1% 1.01% - 2% 2.01% - 5% 10.01% - 100% 5.01% - 10% State Distribution of 2/28 RIF 1 Average is calculated by taking the sum of the category and dividing by the number of policies in force 2 Represents percentage of PMI’s 2/28 Hybrid ARMs primary risk in force |
   91 The PMI Group, Inc. Primary RIF as of September 30, 2008 All $ in Millions, except for Average Loan Size Credit Score¹ Loan Type ARM Less than 575 575 - 619 720 and above Fixed Rate 620 - 679 680 - 719 Total 2/28s Specific Portfolio Characteristics Interest Only LTV > 97% Alt-A California Florida Auto States Avg Loan Size Avg LTV² Avg FICO 1 Excludes unreported FICO scores 2 At origination Note: - Interest rate adjustments as a percentage of Total Risk in Force are approximately 3% and 1% in 2008 and 2009, respectively. - Categories are not mutually exclusive except for Credit Score and Loan Type $30,439.1 $592.8 $1,660.9 $9,655.6 $7,672.4 $10,561.3 $27,104.1 $2,567.5 $767.6 12.1% 35.2% 23.9% 15.5% 10.6% 5.5% 10.3% 27.4% 47.4% $3,659.1 $10.3 $56.2 $743.1 $969.3 $1,876.7 $3,605.8 $53.3 $0.0 2.8% 36.2% 15.0% 5.0% 2.8% 1.2% 2.8% 7.0% n/a $9,434.8 $243.1 $620.2 $2,883.4 $2,434.7 $3,226.6 $8,736.2 $638.1 $60.5 14.4% 35.9% 24.0% 16.3% 13.2% 7.7% 13.7% 22.7% 35.9% $5,383.7 $67.8 $227.6 $1,896.4 $1,412.1 $1,751.9 $4,246.7 $762.2 $374.9 17.7% 39.2% 27.6% 22.5% 17.3% 9.6% 13.7% 35.1% 52.2% $4,189.2 $53.9 $186.3 $1,521.7 $1,076.8 $1,319.1 $3,255.5 $652.0 $281.8 13.9% 39.4% 26.9% 17.7% 12.8% 6.8% 9.8% 31.0% 44.9% $7,772.2 $217.7 $570.7 $2,611.0 $1,779.5 $2,386.9 $7,259.9 $461.8 $50.4 9.8% 32.8% 22.6% 12.6% 7.1% 3.5% 8.9% 23.3% 43.3% $3,797.7 $6,871.5 $6,080.9 $2,480.8 $3,205.0 $4,092.4 $158,577 93% 692 23.5% 15.2% 25.8% 21.0% 22.6% 13.6% $238.0 $283.8 $246.4 $387.9 $207.2 $441.9 $206,071 91% 718 5.1% 7.1% 10.8% 5.0% 10.2% 3.0% $1,871.6 $3,289.2 $2,551.9 $938.4 $1,043.2 $1,034.7 $190,284 94% 686 23.9% 17.0% 26.6% 24.1% 28.5% 14.5% $1,022.7 $1,409.6 $1,796.8 $503.4 $801.6 $692.2 $175,405 93% 692 26.8% 15.8% 31.2% 40.7% 35.0% 18.1% $572.8 $791.2 $921.2 $374.1 $573.5 $618.7 $159,029 92% 693 25.0% 14.5% 27.2% 30.6% 24.1% 15.1% $92.7 $1,097.8 $564.6 $277.1 $579.6 $1,304.8 $113,823 92% 687 18.7% 12.8% 15.0% 7.1% 10.3% 13.2% Total Portfolio Default Rate 2008 Vintage Default Rate 2007 Vintage Default Rate 2005 Vintage Default Rate 2004 Vintage and Prior Default Rate 2006 Vintage Default Rate Total Portfolio Default Rate 2008 Vintage Default Rate 2007 Vintage Default Rate 2005 Vintage Default Rate 2004 Vintage and Prior Default Rate 2006 Vintage Default Rate |
   92 The PMI Group, Inc. Flow RIF as of September 30, 2008 All $ in Millions, except for Average Loan Size Credit Score¹ Loan Type Specific Portfolio Characteristics Interest Only LTV > 97% Alt-A California Florida Auto States Avg Loan Size Avg LTV² Avg FICO 1 Excludes unreported FICO scores 2 At origination Note: - Categories are not mutually exclusive except for Credit Score and Loan Type $25,981.1 $365.6 $1,272.7 $8,109.7 $6,711.3 $9,322.9 $24,012.6 $1,968.5 $0.0 10.9% 37.5% 23.0% 13.9% 10.0% 5.3% 10.0% 28.1% n/a $3,597.9 $9.3 $53.1 $725.5 $953.2 $1,853.2 $3,550.5 $47.3 $0.0 2.8% 39.1% 15.3% 5.1% 2.8% 1.2% 2.8% 8. 1% n/a $7,885.0 $177.1 $504.3 $2,484.0 $2,081.8 $2,611.1 $7,481.7 $403.3 $0.0 15.1% 42.6% 25.6% 16.6% 14.1% 8.5% 14.6% 30.1% n/a $3,976.9 $28.6 $152.8 $1,305.6 $1,079.7 $1,382.3 $3,367.2 $609.7 $0.0 14.7% 39.5% 24.4% 17.7% 15.2% 8.9% 12.4% 36.4% n/a $3,527.7 $24.2 $130.9 $1,210.2 $925.6 $1,205.2 $3,010.9 $516.7 $0.0 11.6% 39.4% 23.5% 14.7% 11.2% 6.3% 9.4% 30.2% n/a $6,993.6 $126.4 $431.6 $2,384.4 $1,671.0 $2,271.0 $6,602.2 $391.5 $0.0 9.1% 31.8% 20.9% 12.1% 6.9% 3.5% 8.6% 19.6% n/a $2,914.0 $5,636.9 $4,755.2 $1,921.0 $2,765.8 $3,490.1 $158,335 93% 695 22.8% 15.3% 24.8% 18.4% 22.3% 11.8% $236.6 $261.5 $245.0 $386.5 $205.4 $436.2 $206,221 91% 719 5.2% 7.5% 10.9% 5.0% 10.1% 3.0% $1,621.9 $2,787.4 $2,235.6 $813.6 $877.4 $867.6 $192,530 94% 689 24.9% 18.0% 27.3% 25.4% 31.3% 14.5% $619.7 $1,055.8 $1,132.8 $272.2 $634.1 $487.4 $174,830 93% 696 25.9% 15.3% 30.4% 35.2% 33.5% 12.8% $354.4 $699.7 $668.6 $211.7 $528.3 $501.5 $156,530 92% 697 21.4% 13.0% 24.9% 27.4% 23.1% 11.9% $81.4 $832.5 $473.1 $237.0 $520.7 $1,197.4 $114,608 92% 692 17.5% 12.0% 14.1% 6.4% 10.0% 12.2% ARM Less than 575 575 - 619 720 and above Fixed Rate 620 - 679 680 - 719 Total 2/28s Total Portfolio Default Rate 2008 Vintage Default Rate 2007 Vintage Default Rate 2005 Vintage Default Rate 2004 Vintage and Prior Default Rate 2006 Vintage Default Rate Total Portfolio Default Rate 2008 Vintage Default Rate 2007 Vintage Default Rate 2005 Vintage Default Rate 2004 Vintage and Prior Default Rate 2006 Vintage Default Rate |
   93 The PMI Group, Inc. Structured RIF as of September 30, 2008 All $ in Millions, except for Average Loan Size Credit Score¹ Loan Type Specific Portfolio Characteristics Interest Only LTV > 97% Alt-A California Florida Auto States Avg Loan Size Avg LTV² Avg FICO Note: - 2/28 Hybrid ARMs that are subject to a rate reset in 2008 represent approximately 1% of Total Primary RIF. - Categories are not mutually exclusive except for Credit Score and Loan Type 1 Excludes unreported FICO scores 2 At origination $4,458.0 $227.2 $388.2 $1,545.9 $961.0 $1,238.3 $3,091.5 $598.9 $767.6 18.4% 32.2% 26.4% 23.9% 15.4% 7.4% 12.6% 26.0% 47.4% $61.2 $1.0 $3.1 $17.6 $16.1 $23.5 $55.3 $6.0 $0.0 2.9% 21.4% 11.1% 4.1% 1.7% 0.3% 3.0% 0.9% n/a $1,549.8 $66.0 $115.9 $399.4 $352.9 $615.5 $1,254.5 $234.9 $60.5 12.0% 25.2% 19.7% 14.7% 8.6% 4.5% 9.6% 18.1% 35.9% $1,406.8 $39.2 $74.7 $590.8 $332.4 $369.6 $879.5 $152.5 $374.9 27.1% 39.0% 34.6% 34.7% 25.1% 12.9% 18.9% 31.5% 52.2% $661.6 $29.6 $55.4 $311.5 $151.2 $113.8 $244.5 $135.3 $281.8 28.3% 39.3% 36.5% 33.3% 25.2% 12.7% 14.5% 34.2% 44.9% $778.6 $91.3 $139.1 $226.6 $108.5 $115.9 $657.8 $70.4 $50.4 15.3% 34.1% 27.3% 16.6% 8.6% 3.8% 11.6% 39.3% 43.3% $883.8 $1,234.6 $1,325.7 $559.8 $439.2 $602.3 $159,932 92% 670 26.1% 15.1% 29.0% 31.6% 24.6% 23.7% $1.4 $22.3 $1.3 $1.4 $1.9 $5.6 $200,411 93% 696 0.0% 4.4% 0.0% 3.4% 14.1% 3.1% $249.7 $501.7 $316.4 $124.8 $165.8 $167.1 $181,353 94% 677 17.1% 12.8% 21.9% 17.2% 17.0% 14.8% $403.0 $353.8 $664.0 $231.2 $167.5 $204.8 $177,214 92% 679 28.4% 18.0% 32.4% 48.9% 40.4% 30.7% $218.4 $91.5 $252.6 $162.4 $45.2 $117.2 $174,858 89% 668 33.3% 29.4% 34.6% 36.2% 35.4% 28.4% $11.2 $265.3 $91.4 $40.0 $58.9 $107.5 $107,914 91% 648 25.7% 14.5% 18.8% 11.4% 12.4% 22.9% Total Portfolio Default Rate 2008 Vintage Default Rate 2007 Vintage Default Rate 2005 Vintage Default Rate 2004 Vintage and Prior Default Rate 2006 Vintage Default Rate Total Portfolio Default Rate 2008 Vintage Default Rate 2007 Vintage Default Rate 2005 Vintage Default Rate 2004 Vintage and Prior Default Rate 2006 Vintage Default Rate ARM Less than 575 575 - 619 720 and above Fixed Rate 620 - 679 680 - 719 Total 2/28s |
   94 The PMI Group, Inc. Modified Pool IIF as of September 30, 2008 All $ in Millions, except for Average Loan Size 1 Excludes unreported FICO scores 2 Excludes Balloon, Buy Down, and Other 3 At origination Specific Portfolio Characteristics Specific Portfolio Characteristics Credit Score¹ Loan Type² Credit Score¹ Loan Type² Total Total Fixed Rate ARM 2/28s Fixed Rate ARM 2/28s Deductible Non Deductible Less than 575 575 - 619 620 - 679 680 - 719 720 and above Less than 575 575 - 619 620 - 679 680 - 719 720 and above Interest Only LTV > 97% Alt-A California Florida Auto States Avg Loan Size Avg LTV³ Avg FICO Interest Only LTV > 97% Alt-A California Florida Auto States Avg Loan Size Avg LTV³ Avg FICO Total Portfolio $36,627 $550 $1,256 $11,603 $11,008 $12,200 $34,252 $2,203 $2 2008 Vintage $0 $0 $0 $0 $0 $0 $0 $0 $0 2007 Vintage $7 ,901 $139 $321 $2,767 $2,667 $2,005 $7,418 $482 $0 2006 Vintage $13,685 $69 $155 $5,195 $4,610 $3,656 $13,501 $183 $2 2005 Vintage $7,019 $6 $ 57 $1,710 $2,226 $3,019 $5,721 $1,296 $1 $8 ,022 $336 $722 $1,930 $1,505 $3,520 $243 $0 Total P ortfolio $ 11,875 $897 $ 23,187 $6,055 $3,825 $3,731 $170,061 78 694 2008 Vintage $0 $0 $0 $0 $0 $0 n/a n/a n/a 2007 Vintage $3,377 $737 $5,211 $1,528 $780 $725 $204,172 82 686 2006 Vintage $5,109 $52 $9,909 $2,232 $1,636 $1,283 $188,547 79 693 2005 Vintage $2,629 $39 $4,870 $1,263 $901 $658 $175,655 79 709 $761 $68 $3,197 $1,032 $508 $1,066 $125,074 75 691 Total Portfolio $8,670 $384 $86 7 $3,210 $2,056 $1,943 $5,411 $3,182 $21 2008 Vintage $0 $0 $0 $0 $0 $0 $0 $0 $0 2007 Vintage $0 $0 $0 $0 $0 $0 $0 $0 $0 2006 Vintage $4,754 $373 $82 1 $2,084 $950 $525 $1,787 $2,946 $21 2005 Vintage $1,450 $0 $6 $297 $430 $702 $1,428 $23 $0 $2,466 $11 $40 $829 $675 $717 $2,196 $213 $0 T otal Portfolio $1,184 $1,768 $3,230 $1,367 $775 $975 $152,275 86 673 2 008 Vintage $0 $0 $0 $0 $0 $0 $0 $0 $0 2 007 Vintage $0 $0 $0 $0 $0 $0 $0 $0 $0 2 006 Vintage $345 $1,696 $384 $549 $478 $754 $157,356 93 651 2 005 Vintage $673 $1 $1,029 $312 $112 $62 $197,356 76 718 $166 $71 $1,817 $505 $185 $159 $127,257 78 694 2004 Vintage and Prior 2004 Vintage and Prior 2004 Vintage and Prior 2004 Vintage and Prior $7,613 |
   95 The PMI Group, Inc. PMI Mortgage Insurance Co. Captive Reinsurance Agreements Analysis (Dollars in Millions) PMI’s Captive Reinsurance Agreements $1,973 $227.6 $2,266 $224.1 1,125 158.1 1,697 187.9 1,065 117.1 525 70.1 187 62.5 173 50.2 $4,350 $565.3 $8.5 $0.6 $4,662 $532.3 $6.6 $0.3 $75 $1.8 $362 $9.1 290 11.0 527 25.7 542 34.6 289 17.7 1,761 200.8 1,643 136.8 $2,668 $248.2 $82.0 $0.0 $2,821 $189.3 $31.3 $0.2 $53 $0.5 $57 $0.4 1 0.0 347 10.3 277 12.6 473 24.0 2,434 248.1 2,027 143.8 $2,765 $261.2 $115.9 $0.0 $2,903 $178.5 $48.2 $0.0 $99 $1.1 $455 $6.1 220 5.9 2,797 80.5 240 8.4 855 29.9 4,605 285.1 1,213 51.1 $5,163 $300.5 $97.6 $0.0 $5,320 $167.5 $16.5 $0.0 $304.1 $0.6 $102.7 $0.6 $787.8 $747.0 Current RIF Ever to Date Incurred Losses Paid Loss RIF Incurred Loss Current June 30, 2008 March 31, 2008 Cumulative Cumulative Cum ulative Cumulative Benefit Benefit Incurred Loss Paid Loss Captive Captive Incurred Losses Everto Date Benefit Captive Benefit Captive Original Progression to Book Year RIF Attachm ent Point 2004 & Prior Total $14,124 0 -50% $1,489 $193.7 7,519 50 -75% 1,303 184.8 4,343 75-99% 1,104 127.3 1,612 Attached 141 57.8 $27,598 $4,037 $563.6 $8.3 $0.8 2005 Total $91 0 -50% $62 $1.3 443 50 -75% 258 11.4 281 75-99% 156 12.2 3,784 Attached 2,023 245.9 $4,600 $2,498 $270.7 $99.6 $0.0 2006 Total $68 0 -50% $50 $0.9 0 50 -75% 0 0.0 60 75-99% 43 2.7 3,264 Attached 2,406 279.3 $3,392 $2,499 $282.9 $130.1 $0.0 2007 Total $96 0 -50% $84 $1.2 89 50 -75% 80 2.9 161 75-99% 149 5.2 4,835 Attached 4,398 345.1 $5,181 $4,711 $354.3 $144.9 $0.0 Cumulative Benefit (MM) $383.0 $0.8 Total Captive Trust Balances (MM) $824.5 Cumulative September 30, 2008 Incurred Loss Cumulativ e Paid Loss Captive RIF Incurred Losses Benefit Captive Benefit Current Ever to Date Captive |
 * * * * * * * * * * * * * * * * * * * * |