SUPPLEMENTAL PORTFOLIO INFORMATION As of December 31, 2010 THE PMI GROUP, INC. Exhibit 99.3 |
DEFINITION OF TERMS 2/28s – refers to loans with interest rates that are fixed for two years and reset to a new interest rate at the end of year two for the remaining term of the loan. ARMs – refers to loans with adjustable interest rates. We consider a loan an ARM if its interest rate may be adjusted prior to the loan’s fifth anniversary. A Quality Loans – we define A quality to include loans with credit scores of 620 and greater. Alt-A Loans – we consider a loan Alt-A if it has a credit score of 620 or greater and the borrower requests and is given the option of providing reduced documentation verifying income, assets, deposit information and/or employment. Captive Reinsurance – refers to agreements in which a portion of risk insured by PMI is reinsured by a captive reinsurance company affiliated with the mortgage originator or investor. Defaults – our primary mortgage insurance master policy defines “default” as the borrower’s failure to pay when due an amount equal to the scheduled monthly mortgage payment under the terms of the mortgage. Generally, the master policies require an insured to notify PMI of a default no later than the last business day of the month following the month in which the borrower becomes three monthly payments in default. For reporting purposes and internal tracking purposes, we do not consider a loan to be in default until the borrower has missed two consecutive payments. Depending upon its scheduled payment date, a loan delinquent for two consecutive monthly payments could be reported to PMI between the 31 st and the 60 th day after the first missed payment. Flow – generally refers to mortgage insurance offered on a loan-by-loan basis to lenders. GSE Pool – refers to a traditional pool product for mortgage loans sold by PMI’s customers to the GSEs. This product was available from 1997 to 2001. Interest Only Loans – refers to loans that do not reduce principal during the initial deferral period (usually between two and ten years) and therefore do not accumulate equity through loan amortization during the initial deferral period. Insurance in Force (IIF) – refers to the current principal balance of all outstanding mortgage loans with insurance coverage as of a given date. Less-than-A Quality Loans – we define less-than-A credit quality loans to include loans with credit scores of 619 or below. The majority of our less-than-A-quality loans have credit scores above 575. 2 |
DEFINITION OF TERMS Modified Pool Insurance – modified pool insurance may be used in addition to primary mortgage insurance or may be placed on loans that do not require primary insurance. Coverage of modified pool products varies. Some products provide first loss protection by covering a percentage of the losses on individual loans held within the pool of insured loans up to a stated aggregate loss limit (“stop loss limit”) for the entire pool. Some modified pool products offer mezzanine-level coverage by providing for claims payments only after a predetermined cumulative claims level, or deductible, is reached. New Insurance Written (NIW) – refers to the original principal balance of all loans that receive new primary mortgage insurance coverage during a given period. New Risk Written (NRW) – refers to the aggregate dollar amount of each insured mortgage loan’s current principal balance multiplied by the insurance coverage percentage specified in the policy for all loans that receive new primary mortgage insurance coverage during a given period. Old Pool – refers to a traditional pool product for mortgage loans sold by PMI’s customers to capital market participants. Payment Option ARMs – generally refers to loans that provide the borrower an option every month to make a payment consisting of principal and interest, interest only, or an amount established by the lender that may be less than the interest owed. Primary Insurance – refers to mortgage insurance placed on a loan-by-loan basis through our “flow” channel and mortgage insurance issued for mortgage-backed securities and portfolio investors through our “structured transactions” channel. Primary insurance does not include pool or modified pool information. Primary Risk in Force – refers to the aggregate dollar amount of each insured mortgage loan’s current principal balance multiplied by the insurance coverage percentage specified in the policy for insurance policies issued through our “flow” and “structured transactions” channels only. Risk in Force (RIF) – refers to the aggregate dollar amount of each insured mortgage loan’s current principal balance multiplied by the insurance coverage percentage specified in the policy. Structured – generally refers to mortgage insurance offered by PMI that covers large portfolios of mortgage loans and is provided to issuers of mortgage backed securities (“MBS”) and portfolio investors. Traditional Pool – covers the entire loss on a defaulted mortgage loan that exceeds the claim payment under any primary insurance coverage, up to a stated aggregate loss limit, or stop loss, for all of the loans in a pool. PMI is not currently offering traditional pool insurance to its customers. 3 |
INDICATIVE PORTFOLIO PROFITABILITY PORTFOLIO CATEGORIES PRIMARY PORTFOLIO CHARACTERISTICS FOCUS ON PARTICULAR PRIMARY PORTFOLIO SEGMENTS PRIMARY PORTFOLIO CHARACTERISTICS BY VINTAGE PRIMARY PORTFOLIO VINTAGE DEVELOPMENT MODIFIED POOL CHARACTERISTICS BY VINTAGE 5 9 13 18 25 32 34 4 CONTENTS OF PRESENTATION CAPTIVE REINSURANCE 37 PRIMARY RESERVES PER NOTICE OF DEFAULT 7 |
INDICATIVE PORTFOLIO PROFITABILITY 5 |
INDICATIVE PORTFOLIO PROFITABILITY as of December 31, 2010 6 Projected Primary and Pool portfolio performance was forecast over a 10 year period. Gross primary and pool paid claims include expected benefits as a result of estimated future loan modification, policy rescission and claim denial activity. Estimated future loan modifications and workouts reduce paid claims by approximately $1.3 billion (1) . Estimated future rescissions and claim denials reduce paid claims by approximately $0.9 billion (1) . Other assumptions include: 74% average persistency / 54 bps average premium yield on $101 billion of primary insurance in force and $606 million of pool risk in force. Operating expenses and net investment income are excluded. Present value calculations utilize a discount rate of 5%. (1) Net of re-defaults for estimated future loan modifications and workouts and net of reversals for estimated rescissions and claim denials. (2) Includes benefits from estimated future loan modification, workout, rescission and claim denial activity. ($ billions) Undiscounted primary and pool paid claims + LAE (2) ($5.19) PV of primary and pool paid claims + LAE (2) ($4.49) PV of expected premiums $2.00 Net loss reserves for primary and pool $2.48 PV capitve reinsurance benefit $0.63 Indicative Profitability at 12/31/2010 $0.62 |
PRIMARY RESERVES PER NOTICE OF DEFAULT 7 * * * * * * * * * * * * * * * * * * * * * * * * * * * * * * * * * * * * * * * * |
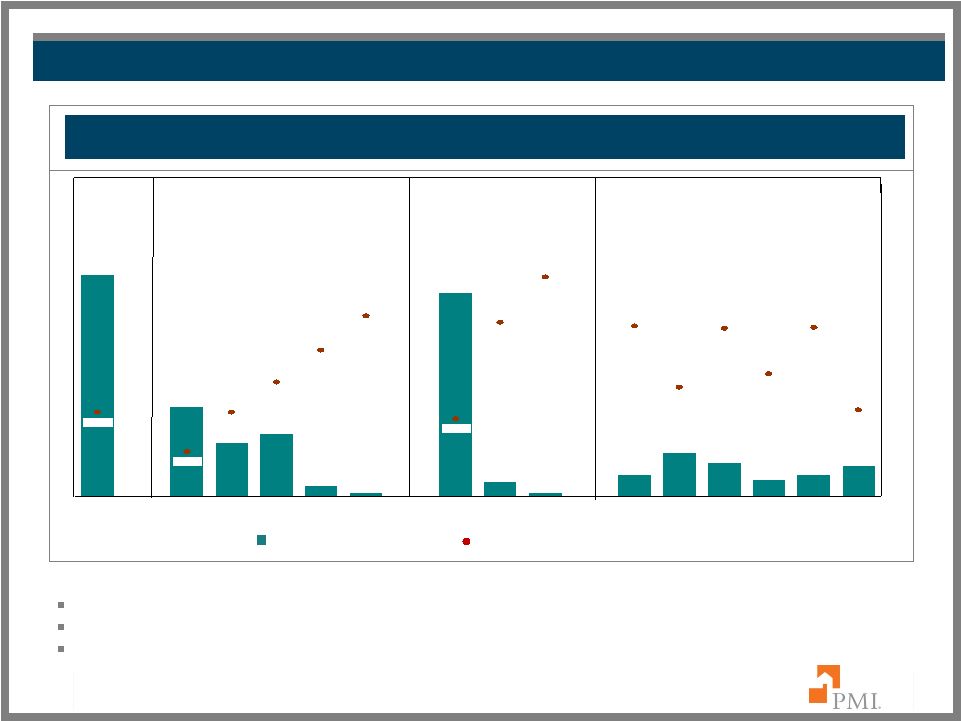
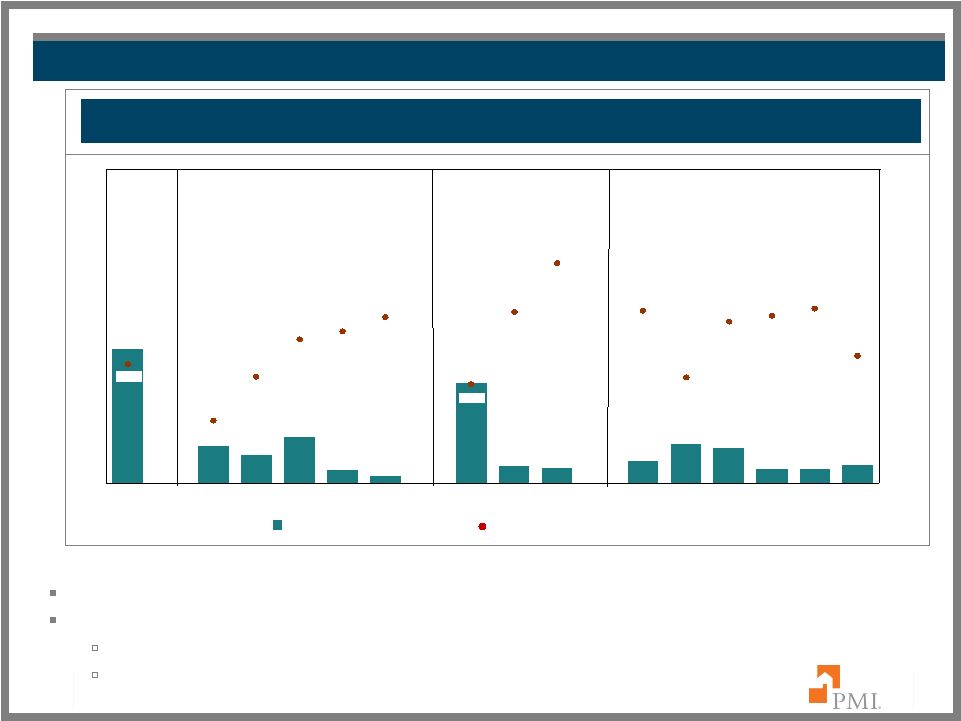
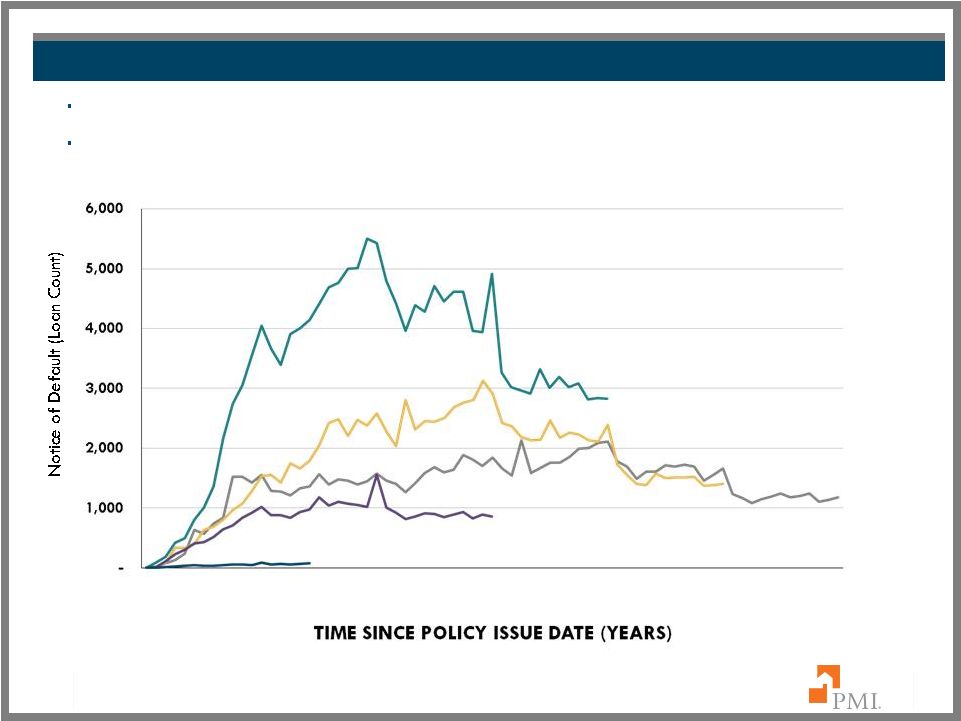
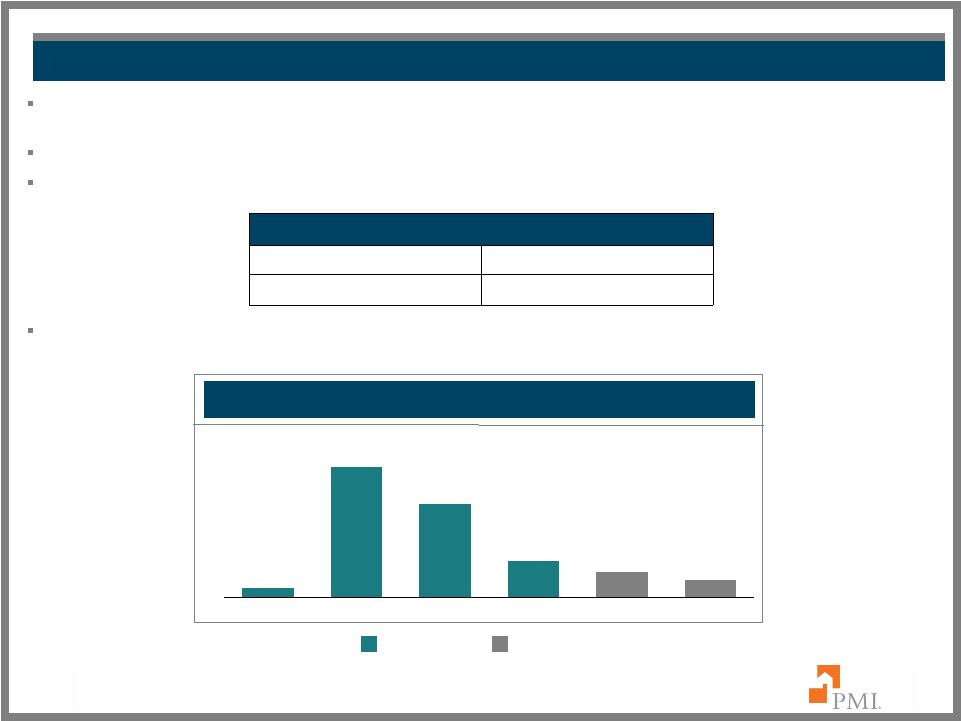
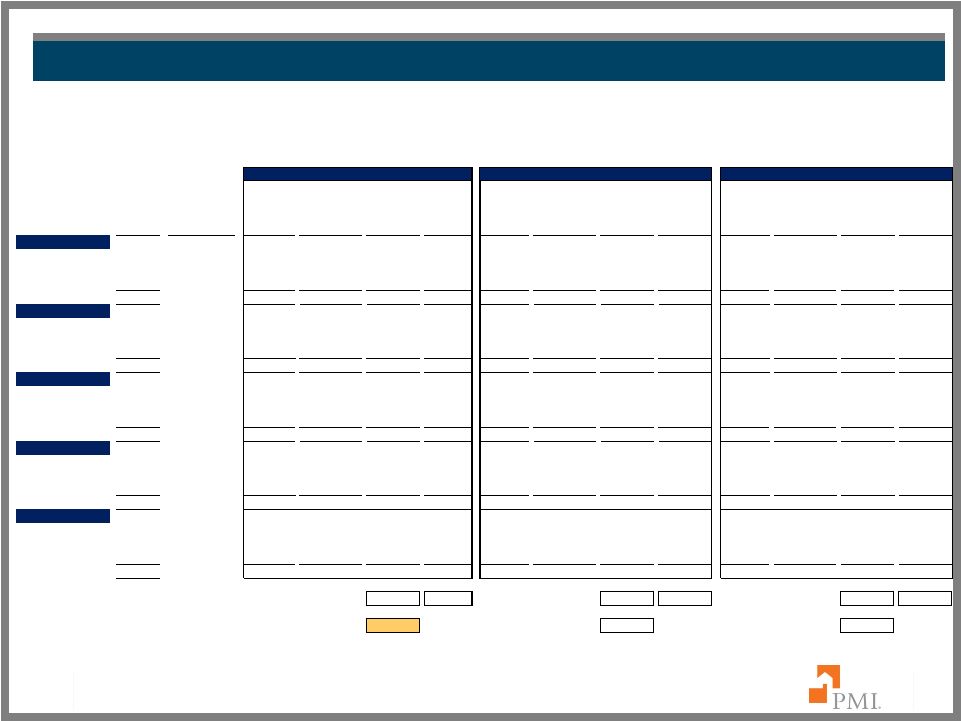
Primary Reserves per Notice of Default 8 Our U.S. Mortgage Insurance Operations (“PMI”) reports a loan in default when a borrower has missed two consecutive monthly payments which could be as early as 31 days after the first missed payment. Alternate convention counts a loan in default only at sixty days after the first missed payment. The table compares PMI’s ‘As Reported’ with the ‘>= 60 days’ convention (1) . At December 31, 2010, PMI’s primary reserves per NOD of $21,646 would have been $23,955 under the ‘>=60 days’ convention. Note: NOD is Notice of Default. Due to rounding, the sum of categories may not equal the total. (1) Days delinquent is based on the number of days a borrower is delinquent as of the date when the NOD is reported to us, not as of month end. We typically receive NOD reporting from servicers between the 20th and 25th of each month. (2) Adjusted Primary Reserves + LAE represents an allocation of loss reserves based on the age of a notice of default. 1st Qtr. 2nd Qtr. 3rd Qtr. 4th Qtr. 1st Qtr. 2nd Qtr. 3rd Qtr. 4th Qtr. NODs by Days Delinquent <=59 22,637 22,079 22,670 21,762 18,822 17,916 18,578 18,283 >=60 94,866 104,351 118,591 129,164 128,426 120,515 113,313 109,195 Total: 117,503 126,431 141,261 150,925 147,248 138,431 131,891 127,478 Primary Reserves + LAE ($'s 000s) 2,445,200 $ 2,560,400 $ 2,694,400 $ 2,931,100 $ 2,924,400 $ 2,896,300 $ 2,803,900 $ 2,759,400 $ Adjusted Primary Reserves + LAE ($'s 000s) (2) 2,240,127 $ 2,360,382 $ 2,489,028 $ 2,733,954 $ 2,776,501 $ 2,755,520 $ 2,657,918 $ 2,615,736 $ Reserves Per NOD As Reported $20,810 $20,252 $19,074 $19,421 $19,860 $20,922 $21,259 $21,646 >=60 days $23,614 $22,620 $20,988 $21,167 $21,619 $22,865 $23,456 $23,955 Delinquency Rate Primary Policies in Force 768,441 745,551 725,029 705,417 683,888 666,204 647,319 629,154 Primary Default Rate As Reported 15.29% 16.96% 19.48% 21.40% 21.53% 20.78% 20.37% 20.26% >+ 60 Days 12.35% 14.00% 16.36% 18.31% 18.78% 18.09% 17.50% 17.36% 2009 2010 |
PORTFOLIO CATEGORIES 9 * * * * * * * * * * * * * * * * * * * * * * * * * * * * * * * * * * * * * * * * |
10 $24.9 BILLION PRIMARY RISK IN FORCE AND $0.6 BILLION POOL RISK IN FORCE* GENERAL PORTFOLIO CATEGORIES Primary Flow Insurance $21.9 billion of risk in force. Primary mortgage insurance offered to lenders on a loan-by-loan basis. Primary Structured Insurance $3.0 billion of risk in force. Credit enhancement solutions offered across the credit spectrum to agency and non-agency MBS issuers as well as portfolio investors. Modified Pool Risk in Force $0.3 billion of remaining risk in force. (1) Insurance offered to agency and non-agency MBS issuers and investors. Other Pool $0.3 billion of remaining risk in force. (1) Prior to 2002, PMI offered certain pool insurance products, referred to principally as GSE or Old Pool, to lenders, the GSEs and non-agency market. * At December 31, 2010. Note: Due to rounding, the sum of percentages may not total 100%. (1) Remaining risk in force for modified and other pool excludes non-performing risk exposures, for which loss reserves have been established. |
11 $24.9 BILLION PRIMARY RISK IN FORCE* Legacy: Performing 57% New writings 20% GENERAL PORTFOLIO CATEGORIES Legacy (1) : Performing $14.2 billion of risk in force. Continues to perform through the housing downturn and generates strong annual revenues. Legacy (1) : Non-performing $5.6 billion of risk in force. Key focus of PMI’s loss mitigation efforts. PMI’s Homeownership Preservation Initiatives. Home Affordable Modification Program (HAMP). Other loan modification and workout programs. New writings (2) $5.0 billion of risk in force. High quality business originated under new guidelines and higher premium rates. * At December 31, 2010. Note: Due to rounding, the sum of percentages may not total 100%. Legacy: Non-performing 23% (1) Legacy refers to risk in force from 1H 2008 and prior. (2) New writings refers to risk in force originated in 2H 2008, 2009 and 2010. |
12 NEW WRITINGS* New writings $5.0 billion of risk in force from $27.7 billion of new insurance written in 2H 2008, 2009 and 2010. High quality business originated under new guidelines and higher premium rates. * At December 31, 2010. (1) Condominium includes Townhouses and Cooperatives. New writings characteristics as percentage of risk in force: Loan Type 100% Fixed Rate Documentation 100% Full Documentation Property Type 84% Single Family 15% Condominium (1) Occupancy 96% Owner Occupied 3% Second Home Average FICO of 745 94% FICO 680 and above 74% FICO 720 and above Average Loan to Value of 90% 98% at 95% LTV and below 61% at 90% LTV and below Average loan size of $215,500 |
PRIMARY PORTFOLIO CHARACTERISTICS 13 * * * * * * * * * * * * * * * * * * * * * * * * * * * * * * * * * * * * * * * * |
U.S. PORTFOLIO AGE DISTRIBUTION 14 $24.9 BILLION PRIMARY RIF (1) Average loan fixed annual mortgage interest rate. Note: Due to rounding, the sum of percentages may not total 100%. $101.7 BILLION PRIMARY IIF |
15 PRIMARY RISK IN FORCE BY FICO SCORE Less than 575 720 and above 680 - 719 620 - 679 575 - 619 U.S. PORTFOLIO CREDIT SCORE DISTRIBUTION |
16 Note: Due to rounding, the sum of percentages may not total 100%. PRIMARY RISK IN FORCE BY LOAN TO VALUE (1) LTVs between 85.01% and 90% LTVs above 97% LTVs between 95.01% and 97% LTVs between 90.01% and 95% LTVs of 85% and below (1) At origination. U.S. PORTFOLIO LOAN TO VALUE DISTRIBUTION |
U.S. PORTFOLIO GEOGRAPHIC DISTRIBUTION 17 (1) Top ten states as determined by primary RIF on December 31, 2010. (2) Default rates as of December 31, 2010, June 30, 2010 and December 31, 2009. 9.6% 8.0% 7.4% 5.2% 4.0% 3.5% 4.1% 3.3% 4.6% 3.3% Florida 9.6% 40.57% 40.75% 41.14% Texas 8.0% 11.45% 11.88% 12.97% California 7.4% 29.48% 33.82% 36.68% Illinois 5.2% 24.63% 24.92% 24.96% Georgia 4.6% 20.59% 22.19% 23.15% % of RIF (1) Dec 2010 Jun 2010 Dec 2009 New York 4.1% 20.39% 19.55% 18.50% Ohio 4.0% 17.20% 17.03% 18.04% Pennsylvania 3.5% 15.80% 15.05% 15.46% New Jersey 3.3% 25.35% 24.88% 24.06% Washington 3.3% 17.76% 17.12% 16.50% % of RIF (1) Dec 2010 Jun 2010 Dec 2009 TOP TEN STATES – PERCENT OF PRIMARY RISK IN FORCE AND DEFAULT RATES Primary Default Rates (2) Primary Default Rates (2) |
18 FOCUS ON PARTICULAR PRIMARY PORTFOLIO SEGMENTS * * * * * * * * * * * * * * * * * * * * * * * * * * * * * * * * * * * * * * * * |
19 RATE ADJUSTMENTS BY CREDIT QUALITY RATE ADJUSTMENTS OF HYBRID LOANS AND OTHER ARMS RATE ADJUSTMENTS IN DISTRESSED GEOGRAPHIC REGIONS Other ARMs 3/27s Less than A Quality Prime Alt-A Note: 2/28s resets in 2010 and 2011 are 0.01% and 0.00%, respectively. California All Other Florida Auto States Note: Auto states include Michigan, Ohio, Illinois and Indiana. 0.01% 0.01% 2010 2011 2012 TOTAL INTEREST RATE ADJUSTMENTS AS A PERCENTAGE OF PRIMARY RISK IN FORCE: 0.48% 0.06% 0.00% U.S. PORTFOLIO INTEREST RATE ADJUSTMENTS Note: Primary risk in force subject to a an interest rate adjustment in 2010 was $119.3 million and in 2011, as of December 31, 2010, is $14.1 million. |
FICO SCORES (2) 720 and above 45.2% 3.3% 680-719 25.7% 1.9% 620-679 26.0% 1.9% 575-619 2.3% 0.2% Less than 575 0.6% 0.0% LOAN TO VALUE Above 97.00% 12.0% 0.9% 95.01% to 97.00% 2.1% 0.2% 90.01% to 95.00% 20.0% 1.5% 85.01% to 90.00% 53.0% 3.9% 85.00% and below 12.9% 0.9% 20 (1) Condominium includes Townhouses and Cooperatives. (2) Excludes unreported FICO scores. % of CA RIF CA % of Total RIF CA % of Total RIF % of CA RIF CALIFORNIA AT DECEMBER 31, 2010 $1.8 BILLION OF TOTAL RISK IN FORCE 7.4% OF PMI’S PRIMARY RISK IN FORCE $289,573 AVERAGE LOAN SIZE MSA Distribution of Total Primary RIF Oakland-Fremont-Hayward, CA– 0.4% San Diego-Carlsbad-San Marcos – 0.6% Sacramento--Arden-Arcade—Roseville – 0.7% Riverside-San Bernardino-Ontario – 1.3% Los Angeles-Long Beach-Glendale – 1.5% LOAN TYPE Fixed Rate 81.9% 6.0% ARM 18.1% 1.3% PROPERTY TYPE (1) Single Family 80.7% 5.9% Condominium 16.0% 1.2% Multi-Family and other 3.3% 0.2% OCCUPANCY Primary Residence 94.2% 6.9% Second Home 2.6% 0.2% Non-owner occupied 3.2% 0.2% ALT-A 25.8% 1.9% Note: Due to rounding, the sum of percentages may not total 100%. |
(1) Condominium includes Townhouses and Cooperatives. (2) Excludes unreported FICO scores. LOAN TYPE Fixed Rate 85.4% 8.2% ARM 14.6% 1.4% PROPERTY TYPE (1) Single Family 72.6% 7.0% Condominium 25.4% 2.4% Multi-Family and other 2.0% 0.2% OCCUPANCY Primary Residence 80.9% 7.8% Second Home 11.3% 1.1% Non-owner occupied 7.8% 0.7% ALT-A 31.4% 3.0% FLORIDA AT DECEMBER 31, 2010 21 % of FL RIF FL % of Total RIF % of FL RIF FL % of Total RIF $2.4 BILLION OF TOTAL RISK IN FORCE 9.6% OF PMI’S PRIMARY RISK IN FORCE $172,229 AVERAGE LOAN SIZE Note: Due to rounding, the sum of percentages may not total 100%. Tampa-St. Petersburg-Clearwater, FL– 1.4% MSA Distribution of Total Primary RIF Jacksonville, FL– 0.7% Fort Lauderdale-Deerfield Beach, FL– 1.0% Miami-Miami Beach-Kendall, FL– 1.5% Orlando-Kissimmee, FL– 1.4% FICO SCORES (2) 720 and above 36.4% 3.5% 680-719 26.9% 2.6% 620-679 30.7% 3.0% 575-619 4.2% 0.4% Less than 575 1.3% 0.1% LOAN TO VALUE Above 97.00% 20.0% 1.9% 95.01% to 97.00% 2.8% 0.3% 90.01% to 95.00% 29.6% 2.8% 85.01% to 90.00% 41.0% 3.9% 85.00% and below 6.6% 0.6% |
FICO SCORES (2) 720 and above 39.5% 1.0% 680-719 25.6% 0.6% 620-679 28.8% 0.7% 575-619 3.9% 0.1% Less than 575 1.0% 0.0% LOAN TO VALUE Above 97.00% 26.0% 0.6% 95.01% to 97.00% 2.7% 0.1% 90.01% to 95.00% 23.9% 0.6% 85.01% to 90.00% 40.2% 1.0% 85.00% and below 7.1% 0.2% LOAN TYPE Fixed Rate 91.2% 2.2% ARM 8.8% 0.2% PROPERTY TYPE (1) Single Family 85.4% 2.1% Condominium 11.5% 0.3% Multi-Family and other 3.1% 0.1% OCCUPANCY Primary Residence 87.4% 2.1% Second Home 7.8% 0.2% Non-owner occupied 4.8% 0.1% ALT-A 18.3% 0.4% ARIZONA AT DECEMBER 31, 2010 22 % of AZ AZ RIF % of Total RIF AZ % of Total RIF $0.6 BILLION OF TOTAL RISK IN FORCE 2.4% OF PMI’S PRIMARY RISK IN FORCE $183,312 AVERAGE LOAN SIZE Lake Havasu City-Kingman, AZ-0.1% Prescott, AZ – 0.1% Yuma, AZ-0.1% Tucson, AZ-0.4% Phoenix-Mesa, AZ – 1.7% MSA Distribution of Total Primary RIF (1) Condominium includes Townhouses and Cooperatives. (2) Excludes unreported FICO scores. Note: Due to rounding, the sum of percentages may not total 100%. % of AZ RIF |
FICO SCORES (2) 720 and above 41.4% 0.6% 680-719 26.8% 0.4% 620-679 28.3% 0.4% 575-619 2.5% 0.0% Less than 575 0.4% 0.0% LOAN TO VALUE Above 97.00% 17.5% 0.3% 95.01% to 97.00% 1.6% 0.0% 90.01% to 95.00% 27.2% 0.4% 85.01% to 90.00% 46.2% 0.7% 85.00% and below 7.5% 0.1% LOAN TYPE Fixed Rate 84.2% 1.2% ARM 15.8% 0.2% PROPERTY TYPE (1) Single Family 79.2% 1.2% Condominium 19.0% 0.3% Multi-Family and other 1.7% 0.0% OCCUPANCY Primary Residence 83.6% 1.2% Second Home 11.8% 0.2% Non-owner occupied 4.6% 0.1% ALT-A 26.0% 0.4% NEVADA AT DECEMBER 31, 2010 23 % of NV RIF NV % of Total RIF $0.4 BILLION OF TOTAL RISK IN FORCE 1.5% OF PMI’S PRIMARY RISK IN FORCE $224,755 AVERAGE LOAN SIZE (1) Condominium includes Townhouses and Cooperatives. (2) Excludes unreported FICO scores. Note: Due to rounding, the sum of percentages may not total 100%. Las Vegas-Paradise, NV-1.2% Reno-Sparks, NV-0.2% Carson City, NV-0.01% MSA Distribution of Total Primary RIF % of NV RIF NV % of Total RIF |
ALT-A AT DECEMBER 31, 2010 24 % of Alt-A RIF Alt-A % of Total RIF Alt-A % of Total RIF $3.8 BILLION OF TOTAL RISK IN FORCE 15.3% OF PMI’S PRIMARY RISK IN FORCE $203,304 AVERAGE LOAN SIZE GUIDELINE CHANGES % of Alt-A RIF With the exception of previously issued commitments, effective June 1, 2008, PMI no longer insures Alt-A LOAN TYPE Fixed Rate 78.4% 12.0% ARM 21.6% 3.3% PROPERTY TYPE (1) Single Family 77.8% 11.9% Condominium 15.0% 2.3% Multi-Family and other 7.2% 1.1% OCCUPANCY Primary Residence 82.4% 12.6% Second Home 6.4% 1.0% Non-owner occupied 11.1% 1.7% FICO SCORES (2) 720 and above 37.8% 5.8% 680-719 35.2% 5.4% 620-679 27.0% 4.1% 575-619 0.0% 0.0% Less than 575 0.0% 0.0% LOAN TO VALUE Above 97.00% 12.3% 1.9% 95.01% to 97.00% 0.2% 0.0% 90.01% to 95.00% 27.5% 4.2% 85.01% to 90.00% 50.5% 7.7% 85.00% and below 9.5% 1.5% State Distribution of Alt-A RIF 0.00% to 1.00% 1.00% to 2.00% 2.00% to 5.00% 5.00% to 10.00% >10.00% (1) Condominium includes Townhouses and Cooperatives. (2) Excludes unreported FICO scores. Note: Due to rounding, the sum of percentages may not total 100%. |
25 PRIMARY PORTFOLIO CHARACTERISTICS BY VINTAGE * * * * * * * * * * * * * * * * * * * * * * * * * * * * * * * * * * * * * * * * |
RISK CHARACTERISTICS: TOTAL PRIMARY PORTFOLIO $3,365 $343 $422 $2,427 $1,652 $2,386 $1,827 $3,793 $4,851 $1,205 $24,856 $10,094 $6,992 $5,976 $22,862 43.4% 20.8% 18.7% 40.6% 29.5% 40.4% 26.3% 40.9% 52.7% 35.2% 20.3% 10.8% 20.2% 27.5% 41.8% Total 720 and above 680 - 719 620 - 679 575 - 619 Less than 575 Fixed Rate ARMs 2/28s Interest Only LTV>97 Alt-A Calif. Florida Auto States RISK CHARACTERISTICS Risk in Force (dollars in millions). Default Rate (as measured by policies). CREDIT SCORE LOAN TYPE TOTAL PRIMARY RISK IN FORCE AS OF DECEMBER 31, 2010 Total Primary Portfolio: PMI’s total primary book is primarily driven by the flow channel. Loans are primarily fixed rate and owner occupied with FICO scores greater than 620. Certain geographies and select products have exhibited heightened levels of defaults. 26 TOTAL |
PORTFOLIO CHARACTERISTICS – PRIMARY RIF AS OF DECEMBER 31, 2010 (1) Excludes unreported FICO scores. (2 ) At origination. Note: Categories are not mutually exclusive except for Credit Score and Loan Type. Vintage refers to the year that the insurance was issued. All $ in Millions, except for Average Loan Size CREDIT SCORE (1) LOAN TYPE Total Less than 575 575 - 619 620 - 679 680 - 719 720 and above Fixed Rate ARM 2/28s Total Portfolio $24,856.3 $421.8 $1,204.5 $6,992.0 $5,976.1 $10,094.2 $22,861.9 $1,651.9 $342.5 Default Rate 20.3% 43.4% 35.2% 27.5% 20.2% 10.8% 18.7% 41.8% 52.7% 2010 Vintage $1,499.7 $0.1 $0.0 $0.8 $247.5 $1,250.6 $1,498.6 $1.1 $0.0 Default Rate 0.1% 0.0% 0.0% 0.0% 0.2% 0.0% 0.1% 0.0% 0.0% 2009 Vintage $1,615.3 $0.2 $0.2 $60.7 $288.8 $1,262.7 $1,611.3 $4.0 $0.0 Default Rate 1.6% 0.0% 0.0% 8.9% 2.9% 1.0% 1.6% 7.7% 0.0% 2008 Vintage $3,585.8 $4.6 $43.3 $666.0 $948.7 $1,919.4 $3,541.0 $44.8 $0.0 Default Rate 13.2% 48.8% 35.6% 23.1% 14.9% 7.9% 13.1% 25.0% 0.0% 2007 Vintage $6,652.2 $164.5 $451.9 $2,105.1 $1,684.6 $2,228.4 $6,220.2 $399.2 $32.9 Default Rate 29.4% 50.5% 40.8% 33.1% 28.5% 19.9% 28.6% 40.5% 59.4% 2006 Vintage $3,602.7 $48.1 $163.1 $1,298.3 $931.4 $1,143.0 $2,960.4 $467.9 $174.4 Default Rate 29.4% 46.6% 38.5% 34.2% 29.7% 20.8% 25.9% 52.6% 56.6% 2005 Vintage $2,902.2 $40.2 $133.5 $1,075.1 $739.2 $891.8 $2,369.3 $425.1 $107.8 Default Rate 23.8% 42.7% 34.3% 28.5% 23.9% 15.3% 20.0% 46.8% 51.8% 2004 Vintage and Prior $4,998.4 $164.1 $412.5 $1,786.1 $1,135.8 $1,398.3 $4,661.3 $309.8 $27.3 Default Rate 17.1% 37.0% 29.7% 20.7% 14.1% 8.5% 16.2% 31.1% 39.2% SPECIFIC PORTFOLIO CHARACTERISTICS Interest Only LTV > 97% Alt-A California Florida Auto States Avg Loan Size Avg LTV (2) Avg FICO Total Portfolio $2,426.8 $4,851.2 $3,793.1 $1,827.0 $2,385.6 $3,365.2 $161,661 93% 698 Default Rate 40.9% 26.3% 40.4% 29.5% 40.6% 20.8% 2010 Vintage $0.0 $0.0 $0.0 $109.4 $17.3 $180.4 $219,732 90% 758 Default Rate 0.0% 0.0% 0.0% 0.1% 0.3% 0.0% 2009 Vintage $2.5 $0.0 $2.1 $52.7 $31.8 $191.7 $209,935 90% 750 Default Rate 6.1% 0.0% 66.7% 1.0% 2.8% 1.7% 2008 Vintage $195.3 $217.4 $177.8 $365.5 $187.2 $441.4 $200,849 91% 721 Default Rate 23.9% 22.7% 33.8% 16.6% 29.2% 14.1% 2007 Vintage $1,205.7 $2,293.4 $1,543.3 $609.1 $741.3 $752.7 $184,193 94% 686 Default Rate 43.3% 31.0% 44.1% 43.4% 52.0% 28.3% 2006 Vintage $612.6 $966.0 $1,092.0 $274.0 $543.4 $484.6 $168,694 93% 691 Default Rate 42.8% 26.2% 45.3% 53.2% 56.3% 26.7% 2005 Vintage $343.6 $571.7 $577.4 $222.5 $426.5 $446.4 $152,031 92% 692 Default Rate 41.3% 22.9% 40.6% 44.3% 44.4% 22.8% 2004 Vintage and Prior $67.1 $802.6 $400.5 $193.9 $438.1 $867.9 $107,610 93% 683 Default Rate 32.2% 19.2% 25.0% 15.3% 23.3% 20.5% |
$20,610 $5,343 $5,959 $9,256 $21,864 $916 $3,978 $2,996 $1,507 $2,072 $1,254 $1,925 $248 $0 $2,959 42.2% 26.2% 19.5% 10.5% 19.1% 34.8% 40.9% 26.5% 41.0% 27.6% 40.4% 18.0% 19.4% 46.4% Total 720 and above 680 - 719 620 - 679 575 - 619 Less than 575 Fixed Rate ARMs 2/28s Interest Only LTV>97 Alt-A Calif. Florida Auto States CREDIT SCORE LOAN TYPE RISK CHARACTERISTICS RISK CHARACTERISTICS: FLOW 28 TOTAL Primary Flow Portfolio: PMI’s primary flow book represents 88% of primary risk in force and is primarily owner occupied, fixed rate loans with FICO scores greater than 620. Approximately 94% of flow risk in force is within conforming loan limits. Approximately 41% of flow risk in force is in captive reinsurance agreements. FLOW RISK IN FORCE AS OF DECEMBER 31, 2010 Risk in Force (dollars in millions). Default Rate (as measured by policies). |
PORTFOLIO CHARACTERISTICS – FLOW RIF AS OF DECEMBER 31, 2010 29 All $ in Millions, except for Average Loan Size CREDIT SCORE (1) LOAN TYPE Total Less than 575 575 - 619 620 - 679 680 - 719 720 and above Fixed Rate ARM 2/28s CREDIT SCORE (1) CREDIT SCORE (1) CREDIT SCORE (1) CREDIT SCORE (1) CREDIT SCORE (1) Total Portfolio $21,863.6 $247.5 $916.1 $5,959.1 $5,342.5 $9,255.7 $20,609.7 $1,253.9 n/a Default Rate 19.1% 46.4% 34.8% 26.2% 19.5% 10.5% 18.0% 42.2% n/a 2010 Vintage $1,499.7 $0.1 $0.0 $0.8 $247.5 $1,250.6 $1,498.6 $1.1 n/a Default Rate 0.1% 0.0% 0.0% 0.0% 0.2% 0.0% 0.1% 0.0% n/a 2009 Vintage $1,615.2 $0.2 $0.2 $60.6 $288.8 $1,262.7 $1,611.2 $4.0 n/a Default Rate 1.6% 0.0% 0.0% 8.9% 2.9% 1.0% 1.6% 7.7% n/a 2008 Vintage $3,535.7 $3.8 $41.0 $651.7 $935.6 $1,899.9 $3,496.1 $39.6 n/a Default Rate 13.1% 44.8% 35.2% 22.9% 14.9% 7.9% 13.0% 25.6% n/a 2007 Vintage $5,526.0 $114.0 $363.4 $1,814.0 $1,431.1 $1,785.7 $5,278.0 $247.9 n/a Default Rate 30.0% 56.6% 41.6% 33.2% 29.5% 21.2% 29.4% 49.3% n/a 2006 Vintage $2,716.9 $20.2 $112.4 $927.5 $729.0 $909.0 $2,350.4 $366.5 n/a Default Rate 27.6% 48.7% 36.3% 31.2% 28.7% 20.7% 25.1% 54.9% n/a 2005 Vintage $2,503.4 $17.8 $95.8 $889.4 $652.2 $825.7 $2,163.5 $339.8 n/a Default Rate 22.1% 42.4% 31.7% 26.0% 22.9% 15.2% 19.7% 44.8% n/a 2004 Vintage and Prior $4,466.8 $91.3 $303.2 $1,615.1 $1,058.3 $1,322.2 $4,211.8 $254.9 n/a Default Rate 16.4% 38.0% 29.3% 20.5% 14.1% 8.6% 15.9% 28.3% n/a SPECIFIC PORTFOLIO CHARACTERISTICS Interest Only LTV > 97% Alt-A California Florida Auto States Avg Loan Size Avg LTV (2) Avg FICO Total Portfolio $1,925.1 $3,978.1 $2,995.8 $1,507.4 $2,071.5 $2,958.6 $162,424 93% 702 Default Rate 40.9% 26.5% 41.0% 27.6% 40.4% 19.4% 2010 Vintage $0.0 n/a n/a $109.4 $17.3 $180.4 $219,732 90% 758 Default Rate 0.0% n/a n/a 0.1% 0.3% 0.0% 2009 Vintage $2.5 $0.0 $2.1 $52.7 $31.8 $191.7 $209,937 90% 750 Default Rate 6.1% 0.0% 66.7% 1.0% 2.8% 1.7% 2008 Vintage $194.5 $199.4 $176.4 $364.2 $185.6 $437.0 $200,957 91% 721 Default Rate 23.9% 22.8% 34.2% 16.6% 28.9% 13.8% 2007 Vintage $1,045.8 $1,935.7 $1,339.0 $515.6 $611.1 $630.8 $185,261 94% 688 Default Rate 44.6% 31.6% 45.1% 45.0% 55.0% 27.8% 2006 Vintage $384.1 $733.8 $696.6 $158.2 $439.3 $355.6 $168,073 93% 695 Default Rate 44.4% 26.0% 48.3% 54.2% 55.9% 24.0% 2005 Vintage $239.2 $510.4 $448.7 $143.4 $395.9 $373.3 $150,674 93% 696 Default Rate 37.1% 21.7% 39.4% 42.5% 43.7% 21.3% 2004 Vintage and Prior $59.1 $598.7 $333.0 $163.8 $390.5 $789.9 $107,677 93% 688 Default Rate 29.8% 19.2% 25.0% 14.6% 23.4% 19.8% (1) Excludes unreported FICO scores. (2 ) At origination. Note: Categories are not mutually exclusive except for Credit Score and Loan Type. Vintage refers to the year that the insurance was issued. |
RISK CHARACTERISTICS: STRUCTURED TRANSACTIONS 30 Primary Structured Portfolio: PMI’s primary structured book represents approximately 12% of total primary risk in force. Highest defaults are reported in the 2/28 hybrid ARMs product, in which: All of the 2/28 hybrid ARM risk in force has passed the interest rate reset date. Monthly reporting of notices of default began to decline in August 2007. STRUCTURED TRANSACTIONS RISK IN FORCE AS OF DECEMBER 31, 2010 $2,252 $634 $1,033 $839 $2,992 $289 $873 $797 $320 $314 $398 $502 $174 $343 $407 34.5% 25.5% 15.0% 28.4% 36.3% 52.7% 41.2% 25.3% 38.6% 40.0% 41.8% 23.7% 30.5% 39.8% 41.0% Total 720 and above 680 - 719 620 - 679 575 - 619 Less than 575 Fixed Rate ARMs 2/28s Interest Only LTV>97 Alt-A Calif. Florida Auto States Risk in Force (dollars in millions). Default Rate (as measured by policies). CREDIT SCORE LOAN TYPE RISK CHARACTERISTICS TOTAL |
PORTFOLIO CHARACTERISTICS – STRUCTURED RIF AT DECEMBER 31, 2010 31 (1) Excludes unreported FICO scores. (2 ) At origination. Note: Categories are not mutually exclusive except for Credit Score and Loan Type. Vintage refers to the year that the insurance was issued. All $ in Millions, except for Average Loan Size CREDIT SCORE (1) LOAN TYPE Total Less than 575 575 - 619 620 - 679 680 - 719 720 and above Fixed Rate ARM 2/28s CREDIT SCORE (1) CREDIT SCORE (1) CREDIT SCORE (1) CREDIT SCORE (1) CREDIT SCORE (1) Total Portfolio $2,992.8 $174.3 $288.5 $1,032.9 $633.5 $838.5 $2,252.2 $398.0 $342.5 Default Rate 28.4% 39.8% 36.3% 34.5% 25.5% 15.0% 23.7% 41.0% 52.7% 2010 Vintage n/a n/a n/a n/a n/a n/a n/a n/a n/a Default Rate n/a n/a n/a n/a n/a n/a n/a n/a n/a 2009 Vintage $0.1 $0.0 $0.0 $0.1 $0.0 $0.0 $0.1 $0.0 $0.0 Default Rate 0.0% 0.0% 0.0% 0.0% 0.0% 0.0% 0.0% 0.0% 0.0% 2008 Vintage $50.1 $0.8 $2.3 $14.3 $13.1 $19.6 $44.9 $5.2 $0.0 Default Rate 18.4% 60.6% 40.2% 27.9% 16.6% 6.3% 18.2% 21.6% 0.0% 2007 Vintage $1,126.3 $50.5 $88.5 $291.1 $253.5 $442.7 $942.1 $151.2 $32.9 Default Rate 27.0% 42.0% 38.6% 32.7% 23.7% 14.4% 24.6% 34.8% 59.4% 2006 Vintage $885.8 $27.9 $50.7 $370.9 $202.4 $234.0 $610.0 $101.4 $174.4 Default Rate 35.5% 44.9% 43.5% 42.8% 33.6% 21.6% 29.3% 46.8% 56.6% 2005 Vintage $398.8 $22.3 $37.6 $185.7 $87.0 $66.1 $205.7 $85.3 $107.8 Default Rate 35.8% 42.9% 41.7% 43.0% 33.6% 16.4% 24.0% 55.0% 51.8% 2004 Vintage and Prior $531.7 $72.8 $109.3 $171.0 $77.6 $76.1 $449.4 $54.9 $27.3 Default Rate 21.7% 35.8% 30.7% 22.6% 14.2% 7.1% 18.8% 41.0% 39.2% SPECIFIC PORTFOLIO CHARACTERISTICS Interest Only LTV > 97% Alt-A California Florida Auto States Avg Loan Size Avg LTV (2) Avg FICO Total Portfolio $501.6 $873.1 $797.3 $319.6 $314.1 $406.6 $156,544 92% 668 Default Rate 41.2% 25.3% 38.6% 40.0% 41.8% 30.5% 2010 Vintage n/a n/a n/a n/a n/a n/a n/a n/a n/a Default Rate n/a n/a n/a n/a n/a n/a 2009 Vintage n/a n/a n/a n/a n/a n/a $188,461 89% 716 Default Rate n/a n/a n/a n/a n/a n/a 2008 Vintage $0.8 $18.1 $1.5 $1.3 $1.6 $4.5 $195,938 93% 697 Default Rate 23.8% 21.8% 8.9% 18.5% 48.3% 31.2% 2007 Vintage $159.9 $357.7 $204.2 $93.5 $130.3 $121.9 $179,924 94% 677 Default Rate 34.7% 28.4% 37.9% 36.0% 40.9% 30.5% 2006 Vintage $228.5 $232.1 $395.4 $115.8 $104.1 $129.1 $170,795 91% 678 Default Rate 39.7% 27.1% 40.8% 51.4% 58.3% 34.1% 2005 Vintage $104.4 $61.3 $128.7 $79.0 $30.6 $73.1 $161,522 89% 665 Default Rate 55.0% 36.0% 45.4% 48.8% 53.5% 29.8% 2004 Vintage and Prior $8.0 $203.9 $67.5 $30.1 $47.5 $78.1 $107,131 91% 644 Default Rate 50.3% 19.0% 25.0% 19.6% 22.5% 26.9% |
32 PRIMARY PORTFOLIO VINTAGE DEVELOPMENT * * * * * * * * * * * * * * * * * * * * * * * * * * * * * * * * * * * * * * * * |
PRIMARY PORTFOLIO VINTAGE DEVELOPMENT 33 NOTICE OF DEFAULT RECEIVED BY VINTAGE Note: Vintage refers to the origination year. 1 2 3 4 5 6 New notices of default have declined from their peaks for 2005, 2006 and 2007 vintages. The 2008 and 2009 vintages are exhibiting fewer new notices of default than previous vintages. 2007 2006 2008 2005 2009 |
34 MODIFIED POOL CHARACTERISTICS BY VINTAGE * * * * * * * * * * * * * * * * * * * * * * * * * * * * * * * * * * * * * * * * |
MODIFIED POOL PORTFOLIO CHARACTERISTICS AT DECEMBER 31, 2010 35 (1) PMI’s claims paid to date relates to the modified pool contracts in force as of December 31, 2010 and therefore excludes any payments made as part of restructurings. (2) Established loss reserves for non-performing (i.e. delinquent) modified pool loans, which represents PMI’s estimate of losses for those loans at December 31, 2010. (3) Remaining risk in force excludes non-performing risk exposures, for which loss reserves have been established. All $ in Millions Modified Pool: Data shown in this exhibit is an aggregation of unique pools by book years. Remaining risk in force³ for modified pool was approximately $348 million at December 31, 2010. Modified Pool with Deductibles remaining risk in force³ was approximately $85 million. Modified Pool without Deductibles remaining risk in force³ was approximately $263 million. All $ in Millions 2004 and Prior 2005 2006 2007 2008 / 2009 Insurance in Force $3,064 $179 $104 $1,011 n/a Stop Loss Amount $121 $24 $12 $44 n/a Losses Applicable to Deductible $24 $10 $2 $9 n/a Deductible Balance $33 $1 $0 $12 n/a PMI's Claims Paid to Date (1) $0 $1 $1 $0 n/a Reserves for Losses (2) $11 $7 $2 $3 n/a Remaining Risk In Force (3) $54 $4 $7 $20 n/a 2004 and Prior 2005 2006 2007 2008 / 2009 Insurance in Force $1,313 $578 $3,341 n/a n/a Stop Loss Amount $208 $25 $305 n/a n/a PMI's Claims Paid to Date (1) $34 $8 $81 n/a n/a Reserves for Losses (2) $21 $11 $53 n/a n/a Remaining Risk In Force (3) $86 $6 $171 n/a n/a |
MODIFIED POOL PORTFOLIO CHARACTERISTICS AT DECEMBER 31, 2010 36 (1) Excludes unreported FICO scores. (2) Excludes Balloon, Buy Down, and Other. (3) At origination. Note: PMI did not insure any modified pool contracts with deductibles in 2008 or 2009 and did not insure any modified pool contracts without deductibles in 2007, 2008 or 2009. Categories are not mutually exclusive except for Credit Score and Loan Type. Vintage refers to the year that the insurance was issued. All $ in Millions, except for Average Loan Size Modified Pool Portfolio Insurance in Force DEDUCTIBLE Total Less than 575 575 - 619 620 - 679 680 - 719 720 and above Fixed Rate ARM 2/28s Total Portfolio $4,359 $176 $355 $1,162 $879 $1,786 $3,889 $469 $0 2007 Vintage $1,011 $109 $237 $424 $172 $69 $636 $376 $0 2006 Vintage $104 $34 $37 $29 $4 $0 $104 $0 $0 2005 Vintage $179 $0 $0 $62 $46 $72 $111 $68 $0 2004 Vintage and Prior $3,064 $33 $80 $647 $657 $1,646 $3,039 $25 $0 Interest Only LTV > 97% Alt-A California Florida Auto States Avg Loan Size Avg LTV (3) Avg FICO Total Portfolio $99 $555 $1,415 $602 $278 $584 $132,329 74 704 2007 Vintage $0 $541 $0 $103 $82 $130 $172,530 95 639 2006 Vintage $0 $13 $0 $5 $9 $14 $139,702 82 595 2005 Vintage $0 $0 $146 $33 $21 $15 $181,592 77 706 2004 Vintage and Prior $99 $1 $1,269 $461 $166 $425 $120,896 69 723 Avg LTV (2) NON DEDUCTIBLE Total Less than 575 575 - 619 620 - 679 680 - 719 720 and above Fixed Rate ARM 2/28s Total Portfolio $5,232 $285 $645 $2,005 $1,196 $942 $3,014 $2,213 $0 2006 Vintage $3,341 $282 $628 $1,493 $647 $290 $1,203 $2,138 $0 2005 Vintage $578 $0 $4 $142 $181 $239 $573 $5 $0 2004 Vintage and Prior $1,313 $2 $14 $370 $368 $414 $1,237 $70 $0 Interest Only LTV > 97% Alt-A California Florida Auto States Avg Loan Size Avg LTV (3) Avg FICO Total Portfolio $293 $1,243 $1,552 $809 $464 $665 $148,962 87 667 2006 Vintage $100 $1,240 $139 $369 $341 $559 $150,487 94 647 2005 Vintage $64 $0 $450 $150 $27 $25 $188,548 74 713 2004 Vintage and Prior $128 $3 $964 $289 $95 $81 $133,207 76 702 SPECIFIC PORTFOLIO CHARACTERISTICS CREDIT SCORES (1) LOAN TYPE (2) SPECIFIC PORTFOLIO CHARACTERISTICS CREDIT SCORES (1) LOAN TYPE (2) |
37 CAPTIVE REINSURANCE * * * * * * * * * * * * * * * * * * * * * * * * * * * * * * * * * * * * * * * * |
Captive reinsurers are wholly-owned, bankruptcy remote subsidiaries of originators that provide mezzanine level reinsurance for loans for which PMI has provided primary mortgage insurance coverage. PMI is the named beneficiary on captive trust balances totaling approximately $724 million as of December 31, 2010. At December 31, 2010, approximately 40.8% of flow risk in force was covered by captive reinsurance agreements, including: Based on current expectations of defaults, PMI forecasts the following approximate reductions to total incurred losses as a result of captive reinsurance agreements in 2010 and 2011: PMI’S CAPTIVE REINSURANCE AGREEMENTS FLOW RISK IN FORCE COVERED BY CAPTIVES ~ 46% of prime ~ 45% of Alt-A ~ 52% of less-than-A quality ~ 50% of LTVs >97%* 38 * Captive coverage for LTVs greater than 97% may overlap with other listed categories. BENEFIT FROM CAPTIVE REINSURANCE AGREEMENTS (Dollars in Millions) Actual Projected $66 $94 $137 $350 $491 $34 2007 2008 2009 2010 2011 2012 |
PMI’S CAPTIVE REINSURANCE AGREEMENTS 39 Note: Due to rounding, the totals may not equal the sum of each category. Note: For the combined captive trust arrangements, the weighted average entry point is 4.05% and the weighted average exit point is 11.71%. Original RIF has been recalculated for the impact of rescissions. The cumulative captive benefit on this page is for excess-of-loss (XOL) captive reinsurance agreements only. Original Progression to Book Year RIF Attachment Point 2004 & Prior Total $12,018 0 - 50% $373 $155.9 5,912 50 - 75% 672 196.1 2,044 75 - 99% 432 98.3 7,069 Attached 974 290.7 $27,043 $2,450 $741.0 $65.6 $6.8 2005 Total $24 0 - 50% $7 $0.3 32 50 - 75% 19 1.0 8 75 - 99% 0 0.0 4,502 Attached 1,650 575.7 $4,566 $1,676 $577.0 $284.8 $179.8 2006 Total $4 0 - 50% $2 $0.1 27 50 - 75% 7 0.4 22 75 - 99% 14 1.1 3,266 Attached 1,567 619.9 $3,319 $1,589 $621.6 $273.1 $191.0 2007 Total $35 0 - 50% $12 $0.1 0 50 - 75% 7 0.4 9 75 - 99% 0 0.0 4,818 Attached 3,025 789.8 $4,862 $3,045 $790.3 $317.6 $140.5 2008 Total $167 0 - 50% $43 $0.8 212 50 - 75% 143 6.3 98 75 - 99% 139 8.2 1,259 Attached 938 95.6 $1,736 $1,263 $110.9 $32.9 $0.5 Cumulative Captive Benefit (MM) $974.0 $518.5 Total Captive Trust Balances (MM) $724.3 Paid Loss Captive RIF Incurred Losses Benefit Cumulative December 31, 2010 Incurred Loss Cumulative Captive Benefit Current Ever to Date $645 $183.1 $802 $184.9 605 165.0 640 161.1 336 70.0 534 82.4 1,251 308.4 1,154 259.0 $2,838 $726.5 $59.6 $4.4 $3,129 $687.4 $44.1 $2.8 $8 $0.3 $32 $1.0 21 0.8 0 0.0 4 0.4 22 2.4 1,916 525.4 2,037 456.8 $1,949 $526.9 $242.5 $125.6 $2,091 $460.1 $212.4 $74.6 $2 $0.1 $19 $0.8 15 0.7 4 0.2 12 0.9 11 0.9 1,892 558.6 2,052 488.6 $1,921 $560.3 $246.1 $124.1 $2,087 $490.5 $235.3 $56.7 $22 $0.6 $24 $0.5 0 0.0 0 0.0 7 0.4 8 0.5 3,653 756.1 3,911 667.8 $3,681 $757.1 $327.1 $41.8 $3,943 $668.8 $318.2 $0.0 $123 $2.3 $245 $4.7 167 6.8 366 13.1 79 3.8 8 0.4 1,038 89.0 874 66.8 $1,408 $101.9 $30.0 $0.0 $1,493 $85.0 $23.8 $0.0 $905.3 $295.9 $833.8 $134.2 $900.2 $940.7 Ever to Date Incurred Losses Paid Loss RIF Incurred Loss Captive Current Current RIF Cumulative Cumulative Cumulative Cumulative June 30, 2010 December 31, 2009 Benefit Benefit Incurred Loss Paid Loss Captive Captive Incurred Losses Ever to Date Benefit Captive Benefit PMI MORTGAGE INSURANCE CO. CAPTIVE REINSURANCE AGREEMENTS ATTACHMENT ANALYSIS (Dollars in millions) |
FORWARD-LOOKING STATEMENT 40 CAUTIONARY STATEMENT: Statements in this portfolio supplement that are not historical facts, or that relate to future plans, events or performance, are “forward-looking” statements within the meaning of the Private Securities Litigation Reform Act of 1995. Such forward-looking statements include our estimate of the embedded profitability of our U.S. Mortgage Insurance portfolio as of December 31, 2010 and our estimates with respect to the future benefits of captive reinsurance. Readers are cautioned that forward-looking statements by their nature involve risk and uncertainty because they relate to events and depend on circumstances that will occur in the future. Many factors could cause actual results and developments to differ materially from those expressed or implied by forward-looking statements. Such factors include, among others: Potential significant future losses as a result of a variety of factors that are outside our control and difficult to predict. Among other factors affecting future losses and that could cause losses to increase more rapidly or to higher levels than expected are the following: Future national and regional economic conditions, including continued slow economic recovery from the most recent recession or the potential of the U.S. economy to reenter a recessionary period, unemployment rates, interest rates, borrower access to credit and home prices. Negative economic changes in geographic regions where our insurance in force is more concentrated; The level of new delinquencies, the cure and claim rates of delinquencies (including the level of future modifications of delinquent loans) and the claim severity within MIC’s mortgage insurance portfolio. The levels of future loan modifications, rescissions and claim denials and future reversals of rescissions and claim denials. The timing of future claims paid. Future levels of new insurance written (and the profitability of such business), which will impact future premiums written and earned and future losses. In the absence of additional capital or capital relief, higher than expected losses or an acceleration of expected losses would likely cause PMI to be out of compliance with applicable regulatory requirements in 2011. In sixteen states, so long as a mortgage insurer does not meet a required minimum policyholders’ position or exceeds a maximum permitted risk-to- capital ratio (generally 25 to 1), it may be prohibited from writing new business. Several of these states require a mortgage insurer to immediately cease writing new business if it exceeds the applicable state capital requirement. In other states, including Arizona, MIC’s state of domicile, the applicable regulator has discretion as to whether the mortgage insurer may continue to write new business. On January 13, 2011, we submitted a waiver request to the Arizona Department of Insurance (the “Department”). There can be no assurance that the Department will approve MIC’s waiver request and exercise its discretion to permit MIC to continue writing new business in the event MIC fails to maintain Arizona’s minimum policyholders’ position. In the event MIC does not meet Arizona’s minimum policyholders’ position and the Department declines to issue it a waiver, MIC shall be required to cease writing new business in all states. Even if Arizona were to permit MIC to continue writing new business, other states could require MIC to cease new business writings if it fails to maintain the other state’s applicable capital adequacy requirements. Thirteen states in addition to Arizona permit the insurance regulator to exercise its discretion to as to whether the mortgage insurer may continue to write new business if it fails to meet the state’s capital requirement. MIC has waivers from California and Missouri, and plans to request waivers from the additional states whose regulators may exercise discretion in the event MIC’s capital position approaches the regulatory thresholds. There is no assurance that MIC will be able to obtain additional waivers. |
FORWARD-LOOKING STATEMENT In the event that we are unable to write new mortgage insurance in a limited number of states for the reasons discussed above, we have a plan to enable us to write new mortgage insurance in those states out of an existing subsidiary, PMI Mortgage Assurance Co. There can be no assurance that we will be able to effectuate this plan. The risk that our underwriting policies may not anticipate all risks and/or the magnitude of potential loss; The performance of our insured portfolio of higher risk loans, such as Alternative-A (“Alt-A”) and less than-A quality loans, and adjustable rate and interest-only loans, which have resulted in increased losses in prior periods and are expected to result in further losses; The aging of our mortgage insurance portfolio and changes in severity or frequency of losses associated with our mortgage insurance policies; The possibility that we may not estimate accurately the likelihood, magnitude and timing of losses in connection with establishing loss reserves; The risk that we overestimate the number of loans that ultimately cure, which management factors in when establishing loss reserve estimates, and which could result in loss reserves that are insufficient to cover our losses on existing delinquent loans; The heightened litigation risk relating to rescissions and claim denials and, in the event that we are unsuccessful in defending our rescissions or claim denials, the need to establish loss reserves for, and reassume risk on, delinquent rescinded loans; Our expectation that, because our loss reserves are not intended to be an estimate of total future losses, our ultimate actual losses will be higher than, and could substantially exceed, our loss reserve estimates; Further reduction in, or prolonged period of depressed levels of, home mortgage originations due to reduced liquidity in the lending market, tighter underwriting standards and the decrease in housing demand in the U.S.; The concentration of our business among a relatively small number of large customers; Heightened competition from the Federal Housing Administration and the Veterans’ Administration or other private mortgage insurers; Potential changes in the charters or business practices of the GSEs, the largest purchasers of mortgages, including potential GSE reforms Congress may adopt in 2011 and the amount of loan level delivery fees assessed by the GSEs on loans they purchase, which result on higher lending costs; The uncertainty surrounding Fannie Mae and/or Freddie Mac’s (collectively, the “GSEs”) adoption of revised mortgage insurer eligibility requirements and the risk that the GSEs determine that we are no longer an eligible provider of mortgage insurance; Changes to the current housing finance system as a result of regulatory or legislative action, including the possibility that private mortgage insurance is no longer required for GSE-eligible loans or that the use for our products and services is severely limited; Effect of the Dodd-Frank Wall Street Reform and Consumer Protection Act (the “Dodd-Frank Act”) on the financial services industry in general, and on our mortgage insurance business in particular, including whether and to what extent loans with mortgage insurance are considered “qualified residential mortgages” for purposes of the Dodd-Frank Act risk-retention, securitization provisions; 41 |
FORWARD-LOOKING STATEMENT Other heightened regulatory and litigation risks faced by the financial services industry, the mortgage insurance industry and the Company and MIC; Further downgrades or other ratings actions with respect to our credit ratings or insurer financial strength ratings assigned by the major rating agencies; The potential future impairment of the value of equity or other securities held in our investment portfolios as a result of continued volatility in the capital markets; Volatility in our earnings caused by changes in the fair value of our derivative contracts and our need to reevaluate the premium deficiencies in our mortgage insurance business on a quarterly basis; The risk that we may not be able to realize all of our deferred tax assets and may be required to record a full valuation allowance or increase the current partial valuation allowance against our remaining net deferred tax assets; Our ability to return to a period of sustained profitability, which would allow us to reverse all or a portion of the valuation allowance that was established against our net deferred tax asset; The risk that the value of the contingent note we received in connection with the sale of PMI Australia is reduced and, therefore, reduces or eliminates the commitments of the lenders under our credit facility and requires us to repay amounts borrowed under the credit facility; and Potential additional losses in our European operations and the potential that we must make additional capital contributions to those operations, and/or CMG Mortgage Insurance Company, pursuant to capital support agreements. Other risks and uncertainties are discussed in our SEC filings, including in Item 1A of our Quarterly Reports on Form 10-Q for the quarters ended March 31, 2010, June 30, 2010 and September 30, 2010, and our Annual Report on Form 10-K for the year ended December 31, 2009. We undertake no obligation to update forward-looking statements. 42 |