ANNUAL REPORT TO STOCKHOLDERS FOR THE
FISCAL YEAR ENDED SEPTEMBER 30, 2006
|
|
|
|
|
|
COASTALFINANCIALCORPORATION | |
|
|
2006 ANNUAL
|
|
|
|
The Guiding Vision of Coastal Financial Corporation | QUEST FOR EXCELLENCE |
Thanks to the most incredible group of Associates imaginable, 2006 was another exciting, fast-paced and successful year for Coastal Financial Corporation.
2006 marked the 13th year since the introduction of ourQUEST FOR EXCELLENCE Business Model. This was a defining moment in our history, because it launched us on a never-ending journey toward theTransformation Of Our Very Good Organization Into An Exceptional Organization.
The Mission Statement element of that foundation document clearly maps our journey with the statement “We are totally Committed to Exceeding the Expectations of our Customer,” and defines success in this journey as extraordinary execution of ourExperienceof FANtastic! Customer Service Model.
Coastal Financial Corporation’s continued success is the direct result of our laser-like focus on understanding and exceeding the expectations of our Customer. Over the years, our strong emphasis on continuously improving the Customer experience has inspired us to introduce an ever-increasing range of innovative products, services and convenience offerings. Several good examples are:6 Day Branch BankingWith Extended Operating Hours,Totally Free Business and Personal CheckingWith A Free Gift,Instantly Issued Debit Cards, and Penny Pavilion Totally Free Coin Counting For Customers and Non-Customers at every Branch. At Coastal Financial, we continuously push the Customer Service envelope because of our collective belief that nothing will ever be good enough for our Customers.
Due to the overwhelming response from the Businesses and residents of our Community to our launch ofThe Carolinas’ Most Convenient Bank in February of 2005, we continued to raise the bar during 2006 by taking even more steps to transform Coastal Financial into a financial services retailer. That is, a company that delivers a full range of banking services while maintaining the business hours and Customer focus of a successful retailer. This is in keeping with our strong belief that the best way to attract, retain and develop broad and durable Customer relationships is by actively competing for their business in the same aggressive way as the great retailers. Our approach involves reaching out to Customers with attractive promotions, offering a warm welcome and an inviting branch environment and consistently providing superior personal service that we callTheExperienceof FANtastic! Customer Service.
Over the sixteen years since becoming a publicly owned company, we have always viewed change and continuous improvement as essential to the accomplishment ofOur Basic Corporate Objective Of Maximizing The Value Of Our Shareholders’ Investment andOur Long-Term Goal Of Being The Best Financial Services Company In Our Marketplace.
And, thanks to our incredible Associates and their extraordinary execution ofTheExperienceof FANtastic! Customer Service Model, 2006 was certainly no exception. Our ever-increasing commitment to ourQUEST FOR EXCELLENCE Business Model has enabled another year of exceptional progress towardThe Transformation Of Our Very Good Organization Into An Exceptional Organizationand produced outstanding results for our Shareholders.
The share price performance of Coastal Financial Corporation’s common stock has grown at a compounded annual rate of over 28% since 1990. The share price performance reflects all stock splits, stock dividends and reinvestment of cash dividends. These historical results may not be indicative of future stock price performance.
2
|
|
| |
| |
The following table sets forth certain information concerning the financial position of the Company (including data from operations of its subsidiaries) as of the dates and for the periods indicated. The consolidated data is derived from, and should be read in conjunction with, the Consolidated Financial Statements of the Company and its subsidiaries presented herein.
|
|
|
|
|
|
|
|
|
|
|
|
|
|
|
|
|
|
| At or for Years Ended September 30, |
| |||||||||||||
|
|
| ||||||||||||||
|
| 2002 |
| 2003 |
| 2004 |
| 2005 |
| 2006 |
| |||||
|
|
|
|
|
|
| ||||||||||
|
| (Dollars in thousands, except per share data) |
| |||||||||||||
Financial Condition Data: |
|
|
|
|
|
|
|
|
|
|
|
|
|
|
|
|
Total assets |
| $ | 950,796 |
| $ | 1,181,209 |
| $ | 1,305,094 |
| $ | 1,543,459 |
| $ | 1,659,475 |
|
Loans receivable, net |
|
| 536,851 |
|
| 682,737 |
|
| 790,730 |
|
| 924,260 |
|
| 1,088,231 |
|
Mortgage-backed securities |
|
| 331,808 |
|
| 383,324 |
|
| 374,283 |
|
| 399,655 |
|
| 392,989 |
|
Cash, interest-bearing deposits and investment securities |
|
| 27,816 |
|
| 37,484 |
|
| 62,304 |
|
| 127,141 |
|
| 88,252 |
|
Deposits |
|
| 637,081 |
|
| 697,012 |
|
| 753,379 |
|
| 1,070,918 |
|
| 1,063,105 |
|
Borrowings |
|
| 228,622 |
|
| 392,797 |
|
| 451,144 |
|
| 346,408 |
|
| 468,139 |
|
Stockholders’ equity |
|
| 66,386 |
|
| 73,707 |
|
| 85,348 |
|
| 97,221 |
|
| 112,824 |
|
|
|
|
|
|
|
|
|
|
|
|
|
|
|
|
|
|
Operating Data: |
|
|
|
|
|
|
|
|
|
|
|
|
|
|
|
|
Interest income |
| $ | 53,873 |
| $ | 59,214 |
| $ | 65,805 |
| $ | 78,558 |
| $ | 99,653 |
|
Interest expense |
|
| 21,846 |
|
| 22,998 |
|
| 23,524 |
|
| 29,730 |
|
| 45,073 |
|
|
|
|
|
|
|
| ||||||||||
Net interest income |
|
| 32,027 |
|
| 36,216 |
|
| 42,281 |
|
| 48,828 |
|
| 54,580 |
|
Provision for loan losses |
|
| 1,235 |
|
| 2,655 |
|
| 1,750 |
|
| 1,697 |
|
| 1,385 |
|
|
|
|
|
|
|
| ||||||||||
Net interest income after provision for loan losses |
|
| 30,792 |
|
| 33,561 |
|
| 40,531 |
|
| 47,131 |
|
| 53,195 |
|
|
|
|
|
|
|
| ||||||||||
Other Income: |
|
|
|
|
|
|
|
|
|
|
|
|
|
|
|
|
Fees and service charges on loan and deposit accounts |
|
| 3,148 |
|
| 3,489 |
|
| 3,771 |
|
| 6,137 |
|
| 9,385 |
|
Gain on sales of loans held for sale |
|
| 1,462 |
|
| 2,985 |
|
| 1,523 |
|
| 1,201 |
|
| 1,176 |
|
Gain (loss) on sales of investment securities, net |
|
| 102 |
|
| — |
|
| (100 | ) |
| 226 |
|
| 97 |
|
Gain (loss) on sales of mortgage-backed securities, net |
|
| 238 |
|
| 469 |
|
| (997 | ) |
| (551 | ) |
| (494 | ) |
Gain (loss) from real estate operations |
|
| (137 | ) |
| (18 | ) |
| 3 |
|
| (76 | ) |
| 3 |
|
Other income |
|
| 3,326 |
|
| 3,983 |
|
| 4,971 |
|
| 5,587 |
|
| 6,898 |
|
|
|
|
|
|
|
| ||||||||||
Total other income |
|
| 8,139 |
|
| 10,908 |
|
| 9,171 |
|
| 12,524 |
|
| 17,065 |
|
Total general and administrative expense |
|
| 22,824 |
|
| 27,156 |
|
| 27,269 |
|
| 33,519 |
|
| 41,058 |
|
|
|
|
|
|
|
| ||||||||||
Income before income taxes |
|
| 16,107 |
|
| 17,313 |
|
| 22,433 |
|
| 26,136 |
|
| 29,202 |
|
Income taxes |
|
| 5,901 |
|
| 6,141 |
|
| 7,627 |
|
| 8,982 |
|
| 10,201 |
|
|
|
|
|
|
|
| ||||||||||
Net income |
| $ | 10,206 |
| $ | 11,172 |
| $ | 14,806 |
| $ | 17,154 |
| $ | 19,001 |
|
|
|
|
|
|
|
| ||||||||||
Net income per common diluted share |
| $ | .48 |
| $ | .52 |
| $ | .67 |
| $ | .76 |
| $ | .85 |
|
|
|
|
|
|
|
| ||||||||||
Cash dividends per common share |
| $ | .11 |
| $ | .12 |
| $ | .14 |
| $ | .16 |
| $ | .14 |
|
|
|
|
|
|
|
| ||||||||||
Weighted average shares outstanding diluted |
|
| 21,319 |
|
| 21,647 |
|
| 22,128 |
|
| 22,465 |
|
| 22,406 |
|
|
|
|
|
|
|
|
All share and per share data have been restated as applicable to reflect 10% stock dividends declared on May 27, 2003, August 28, 2003, February 18, 2004, July 30, 2004, December 15, 2004, October 26, 2005, and August 24, 2006.
Key Operating Ratios:
The table below sets forth certain performance ratios of the Company at the dates or for the periods indicated.
|
|
|
|
|
|
|
|
|
|
|
|
|
|
|
|
|
|
| At or for Years Ended September 30, |
| |||||||||||||
|
|
| ||||||||||||||
|
| 2002 |
| 2003 |
| 2004 |
| 2005 |
| 2006 |
| |||||
|
|
|
|
|
|
| ||||||||||
Other Data: |
|
|
|
|
|
|
|
|
|
|
|
|
|
|
|
|
Return on assets (net income divided by average assets) |
|
| 1.23 | % |
| 1.04 | % |
| 1.18 | % |
| 1.20 | % |
| 1.18 | % |
Return on average equity (net income divided by average equity) |
|
| 16.92 | % |
| 15.84 | % |
| 18.77 | % |
| 18.75 | % |
| 18.55 | % |
Average equity to average assets |
|
| 7.29 | % |
| 6.59 | % |
| 6.31 | % |
| 6.38 | % |
| 6.36 | % |
Book value per share |
| $ | 3.22 |
| $ | 3.55 |
| $ | 4.04 |
| $ | 4.54 |
| $ | 5.20 |
|
Dividend payout ratio |
|
| 21.77 | % |
| 23.20 | % |
| 19.91 | % |
| 19.54 | % |
| 15.51 | % |
Interest rate spread (difference between average yield on interest-earning assets and average cost of interest-bearing liabilities) |
|
| 4.14 | % |
| 3.65 | % |
| 3.64 | % |
| 3.70 | % |
| 3.67 | % |
Net interest margin (net interest income as a percentage of average interest-earning assets) |
|
| 4.24 | % |
| 3.67 | % |
| 3.64 | % |
| 3.69 | % |
| 3.66 | % |
Allowance for loan losses to total net loans at end of period |
|
| 1.42 | % |
| 1.40 | % |
| 1.39 | % |
| 1.25 | % |
| 1.17 | % |
Ratio of non-performing assets to total assets (1) |
|
| 0.48 | % |
| 0.77 | % |
| 0.51 | % |
| 0.22 | % |
| 0.21 | % |
Tangible capital ratio |
|
| 6.57 | % |
| 7.14 | % |
| 7.44 | % |
| 7.25 | % |
| 7.78 | % |
Core capital ratio |
|
| 6.57 | % |
| 7.14 | % |
| 7.44 | % |
| 7.25 | % |
| 7.78 | % |
Risk-based capital ratio |
|
| 12.74 | % |
| 13.17 | % |
| 13.55 | % |
| 13.29 | % |
| 14.34 | % |
|
|
(1) | Non-performing assets consist of nonaccrual loans 90 days or more past due and real estate acquired through foreclosure. |
3
|
|
| |
| |
On behalf of our entire team at Coastal Financial Corporation, I am pleased to report that 2006 was another very good year.
It was also a year of continued growth and progress resulting from the extraordinary execution of the strategies emanating from ourQUEST FOR EXCELLENCE Business Model.
Undergirding these efforts is ourThe Carolinas’ Most Convenient Bank initiative, which we first unveiled on February 25, 2005. The philosophy behind this new paradigm of banking in the Carolinas is simple: Because we are totally committed to Exceeding the Expectations of our Customer, we continually think of every possible way we can make banking easier for them – from making it quicker, more convenient and more accessible, to creating a fun and memorable experience. This mind-set has prompted us to offer 6 Day Branch Banking, holiday hours and extended weekday hours in all of our branches.
Our commitment to convenience is focused on meeting the busy schedules of our Customers. We also provide convenience by providing free services, like Totally Free Business and Personal CheckingWith A Gift,Totally Free Online Banking and Bill Pay, Instantly Issued Debit Cards and Totally Free Coin Counting by Penny Pavilion coin counters in every branch for both Customers and non-Customers alike. Then we top all that off by supporting our Customers with a Customer Service Center, which offers telephone support from real, live Customer Service Representatives from 7:30 am until 7:30 pm, Monday through Friday of each week and from 7:30 am until 1:30 pm on Saturday.
At the heart of ourThe Carolinas’ Most Convenient Bank initiative is Coastal Federal’s outstanding level of personal service, which is focused on giving every CustomerTheExperience of FANtastic! Customer Service during every Coastal Federal interaction, every day. We hold celebrations for our Front of the House and Heart of The House service award winners each month and bring our Penny Pavilion mascot to our branches and special events for guest appearances. We complementTheExperienceof FANtastic! Customer Service branch experience through Community programs like The Penny Pavilion “FLIERS” (Financial Literacy and Education Resources) initiative. This program teaches 4 year Kindergarten through 5th grade students in the Horry County School district, more than 20,000 students in over 900 classrooms, the basics of money, economics and investing.
Every Friday at Coastal Federal is known as “Red Friday.” We feature those days to express our appreciation to our Customers and to demonstrate the “Passion and energy” we have for Customer Service by offering gifts to those Customers who dress in red (one of our primary Corporate colors).
The Coastal Federal Leadership team not only establishes the standards for our Customer Service Model, but they also personally take charge of managing for quality by working closely with our Associates to makeTheExperienceof FANtastic! Customer Servicea reality. Everyone in our Leadership Group works aggressively toward instilling a passion for Customer Service excellence by educating our Associates about our Customer Service Model and by providing recognition and rewards for those who inspire Customer praise. Our efforts have resulted in an inspired and passionate team which is rapidly developing a legend for Customer Service excellence.
Thanks largely to our laser-like focus on ensuring the consistent delivery ofTheExperienceof FANtastic! Customer Service,in addition to achieving record results in Customer Satisfaction measurements, Core Deposits, Loans Receivable, Total Assets, Net Income and Share Price during 2006, we also witnessed a new level of genuinely caring conduct towards our Customers and each other.
Our progress this year elevated our confidence in and commitment to ourQUEST FOR EXCELLENCE Business Model to new levels and also produced another year of exceptional financial results and noteworthy accomplishments:
|
|
|
| • | Coastal Financial Corporation’s net income for 2006 totaled $19.0 million, compared to $17.2 million in 2005. On a fully diluted basis, these results equated to a 11.8% increase, from $0.76 per share in 2005 to $0.85 per share in 2006. This growth was fueled by continued strong Core Deposit and loan growth and low credit loss expense. |
|
|
|
| • | Customer Deposits, which are Total Deposits less Brokered Deposits, increased by approximately $8.8 million, or 1.0% to $910 million. Over the past three years, our average rate of Customer Deposit growth has been 10% per year. |
|
|
|
| • | Loans grew by 16%, primarily reflecting our continued strong focus on the Business Banking element of our operations. |
|
|
|
| • | Exceptional progress toward attainment of our quest for Exceeding the Expectations of Our Customer was reflected in the 7,489 independently conducted “Mystery Shops,” which produced an organizational score for the year of 92.6%. This outstanding result is the workproduct of our focus on giving every CustomerTheExperienceof FANtastic! Customer Service during every Coastal Federal interaction, every day. |
|
|
|
| • | We continued to raise the bar for Customer Service and Convenience in our marketplace with the following unique Community Service and Customer Convenience and Service offerings: |
|
|
|
| • | ThePenny FLIERS (Financial Literacy and Education Resources) Initiative - designed to teach the basics of |
4
|
|
|
|
| |
|
| |
|
|
|
|
|
|
|
| money, economics and investing to K-4 through 5th Grade students throughout our Community. | |||
|
|
| |||
| • | Totally Free Business CheckingWith A Gift and Totally Free Online Banking and Bill Pay features | |||
|
|
| |||
| • | Instantly Issued Debit Cards – No more long waits for the arrival of a Debit Card upon opening a new account or losing a card. Coastal Federal Debit Cards are issued to Customers at the Branch during the account opening process, or replaced immediately upon a loss of a card. | |||
|
|
| |||
| • | The significant expansion of ourCustomer Service Center which offers our Customers telephone support from real, live Customer Service Representatives - no more confusing electronic commands to interpret and decipher. This service, which offers our Customers the ultimate in ease and convenience, is provided from 7:30 am until 7:30 pm, Monday through Friday and from 7:30 am until 1:30 pm on Saturday. | |||
|
|
| |||
| • | Our exceptionalBranch Delivery Channel continued to expand to serve more of the Communities of coastal North and South Carolina. Since 1998, Coastal Federal has added 14 new branches to our rapidly growing network – 58 percent of our existing branches. During fiscal 2006, we opened the following new branch facilities: | |||
|
|
| |||
|
|
| † | North Carolina: | |
|
|
|
|
| |
|
|
|
| † | Oak Island |
|
|
|
|
|
|
|
|
| † | South Carolina: | |
|
|
|
|
| |
|
|
|
| † | Stephens Crossroad |
|
|
|
|
|
|
|
|
|
| † | North Conway |
|
|
|
|
|
|
|
|
|
| † | Hwy 544 West |
|
|
|
|
|
|
|
|
|
| † | Hwy 544 – SayeBrook Village |
|
|
|
|
|
|
| • | Coastal Federal University significantly expanded both its teaching staff and curriculum offerings in support ofOur Basic Corporate Objective of Maximizing The Value Of Our Shareholders’ Investment by making continual progress toward OurLong-Term Goal of Being The Best Financial Services Company In Our Marketplace. Each of our new Associates attends CFU’s Pledge To Excellence offering which introduces them to our QUEST FOR EXCELLENCE Business Model by taking a look back at our rich history and legacy and then a look forward by learning about our overriding focus on enriching the Customer experience through approaches such asTheExperienceof FANtastic! Customer Service and other initiatives designed to instill a passion for excellence. |
Since 1990, our net income has increased at a compound annualized rate in excess of 17%.
Equally as important, since becoming a publicly owned company in 1990 Coastal Financial Corporation’s stock has grown at a compound annual rate of over 28%, taking our market capitalization from $4.6 million in October 1990, to $273.3 million at the close of this fiscal year. Put another way, an initial investment of $10,000 in October of 1990 would have grown to $543,000 at September 30, 2006.
One of the best indicators of performance is Return On Shareholders’ Equity, and this measure for 2006 was, again, outstanding. Our Return On Average Shareholders’ Equity of 18.6% ranks us among the top performing financial services companies in the United States.
Our own sense of satisfaction with these financial results during 2006 was augmented with continued public recognition of our progress toward the attainment ofOur Basic Corporate Objective Of Maximizing The Value Of Our Shareholders’ Investment andOur Long-Term Goal Of Being The Best Financial Services Company In Our Marketplace. Consider these very good examples:
|
|
|
| • | Coastal Financial Corporation, for the 7th consecutive year, was ranked the #1 Community Bank in the Carolinas byU. S. Banker Magazine, in its September 2006 publication. In this edition,U. S. Banker Magazine featured its Ranking of the Top 100 Publicly Traded Mid-Tier Banks. This ranking spotlighted banks with assets between $1 and $10 billion, based upon a 3-year average measure of Return On Average Equity. Coastal Financial Corporation was ranked 1st in the Carolinas and 20th nationally in this listing. |
|
|
|
| • | Coastal Federal Bank, for the ninth consecutive year, placed 1st in voting by the readers of the (Myrtle Beach)SUN NEWS in the Financial Institutions category of theSUN NEWSBest Of The Beach Competition for 2006. |
|
|
|
| • | Coastal Federal Bank, for the fifth consecutive year, placed 1st in voting by the readers of theSUN NEWS in the Mortgage Company category of theSUN NEWSBest of the Beach Competition for 2006. |
|
|
|
| • | Raymond James Financial Services, Inc., for the fifth consecutive year, placed 1st in voting by the readers of the (Myrtle Beach)SUN NEWS in the Financial Planning category of theSUN NEWSBest Of The Beach Competition for 2006. |
|
|
|
| • | The2006 FDIC SUMMARY OF DEPOSITS REPORT, for the 6th consecutive year, ranked Coastal Federal Bank the leader in deposit market share for Horry County for the twelve months ended June 30, 2006. Coastal Federal Bank has enjoyed this top ranking for eight of the past eleven years. This report also showed that Coastal Federal Bank is ranked 3rd in deposit market share for Brunswick County, North Carolina. |
5
|
|
|
|
| |
Our continued evolution toward the organization envisioned in ourQUEST FOR EXCELLENCEBusiness Model has enabled the financial performance during fiscal 2006, which again met our high expectations
Noteworthy Financial Results for Fiscal 2006
|
|
DILUTED EARNINGS PER SHARE | |
|
|
• | Net income for 2006 totaled $19.0 million, compared to $17.2 million in 2005. On a fully diluted basis, these results equated to a 11.8% increase, from $0.76 per share in 2005 to $0.85 per share in 2006. |
|
| |
BOOK VALUE PER SHARE | ||
|
| |
• | Book value per share grew 14.5% to $5.20. | |
|
| |
• | Shareholders’ equity advanced 16.0% to $112.8 million. |
6
|
|
|
|
| |
|
|
ASSETS | |
| |
• | Total Assets increased 7.6%, from $1.5 billion to $1.7 billion, the highest level in the Company’s history. |
|
|
• | Customer Deposits increased from $901.0 million to $909.8 million. |
|
|
• | Net Loans increased 15.7%, from $942.4 million to $1,090.1 million. |
|
|
NON-PERFORMING ASSETS TO TOTAL ASSETS | |
| |
• | Non-performing Assets to Total Assets declined from 0.22% to 0.21%. |
|
|
ALLOWANCE FOR LOAN LOSSES TO NET LOANS | |
| |
• | Allowance for Loan Losses to Net Loans was 1.17%. |
|
|
• | The Company had Net Loan Charge Offs as a percentage of Average Loans of 0.04% in 2006. |
Our success in these key measures of performance is the result of the commitment, dedication and aligned effort of a truly outstanding group of Associates who share a passion for ensuring the consistent delivery ofTheExperienceof FANtastic! Customer Serviceand continuously raising the bar in our quest to Exceed the Expectations of our Customer. This continuing trend of exceptional performance has been rewarded in the financial markets by a 4,166% increase in the price of our shares since becoming a public company in October of 1990, vs. 340% for the Standard & Poors 500 Index over the same period.
7
|
|
|
|
| |
The momentum we have built since our conversion to public ownership has resulted from the methodical focus of our individual and collective efforts on accomplishingOur Basic Corporate Objective Of Maximizing The Value Of Our Shareholders’ Investment by working diligently toward the achievement ofOur Long-Term Goal Of Being The Best Financial Services Company In Our Marketplace.
Over the past sixteen years, our compounded Shareholder return of 28% has, indeed, been impressive. In evaluating our progress toward the attainment ofOur Basic Corporate Objective since becoming publicly owned in 1990, it is both informative and illustrative to compare the share price performance of Coastal Financial Corporation to the share price performance of other publicly traded financial services companies operating within our marketplace over that period, and to the financial markets as a whole.
In the following graphs, we have compared the share price performance of (CFCP) Coastal Financial Corporation to the Nasdaq, S&P 500 and Dow Indices, and to (TSFG) The South Financial Group, the parent company of Carolina First Bank, (WB) Wachovia Corporation, the parent company of Wachovia Bank, (SNV) Synovus Financial Corporation, the parent company of NBSC, (BBT) BB&T Corporation, the parent company of BB&T, (BAC) Bank of America Corporation, the parent company of Bank of America, (FFCH) First Financial Holdings, Inc., the parent company of First Federal Savings and Loan Association of Charleston and (COOP) Cooperative Bankshares, Inc., the parent company of Cooperative Bank.
As shown by these graphic representations, which take a look back over our history as a publicly owned company, the price of Coastal Financial Corporation’s shares has significantly outperformed the price of the shares of the other publicly traded financial services companies in our marketplace, as well as the Nasdaq, S&P 500 and Dow Indices.
16 Year Peer Group Price Performance
These historical results may not be indicative of future stock price performance.
CFCP Relative Price Performance
8
|
|
|
|
| |
Albert Einstein once said, “The significant problems we face today cannot be solved at the same level of thinking we were at when we created them.”
Einstein was describing paradigms . . . the way individuals perceive, understand and interpret the surrounding world. Our culture, as a learning organization, embraces change as the catalyst for growth and progress. Consequently, we have learned that, if we want to achieve significant change, we must first change our paradigms.
Accordingly, as we began our Vision 2010 Strategic Planning Process in early 2003, we started by examining our existing paradigms about what the businesses and residents of our marketplace expected from their bank. This critical review process, together with the ensuing initiatives, resulted in the launch ofThe Carolinas’ Most Convenient Bankin February of 2005.
Over the past 18 months, our progress toward rebranding Coastal Federal in this manner has resonated with our Customers as a hallmark of exceptional convenience and phenomenal service. Through following ourQUEST FOR EXCELLENCEBusiness Model, we have successfully leveraged our 53 year-old reputation by building systems and processes to ensure that every Customer, on every occasion, every day, always receivesTheExperienceof FANtastic! Customer Service.
So, as you can see from this description of the growth and progress we experienced during this past year, our journey towardTransforming Coastal Financial From A Very Good Organization Into An Exceptional Organization proceeded nicely in 2006. However, as good as our results were, it is very important that we not lose sight of the fact that our efforts can never be viewed as a sprint to a well-defined finishing point, but rather as merely one more waypoint in a never-ending marathon.
|
|
| |
SOUTH CAROLINA | |
| |
1. Carolina Forest | |
| |
2. Conway | |
| |
3. Dunes | |
| |
4. Hwy. 544 West | |
| |
5. Little River | |
| |
6. Loris | |
| |
7. Murrells Inlet | |
| |
8. Myrtle Beach/BI-LO | |
| |
9. North Conway | |
| |
10. North Myrtle Beach | |
| |
11. Oak Street | |
| |
12. Pawleys Island | |
| |
13. SayeBrook | |
| |
14. Socastee | |
| |
15. Stephens Crossroads | |
| |
16. Surfside | |
| |
17. Waccamaw Medical Park | |
| |
NORTH CAROLINA | |
| |
18. Oak Island | |
| |
19. Shallotte | |
| |
20. Southport | |
| |
21. Sunset Beach | |
| |
22. Wilmington - Downtown | |
| |
23. Wilmington - 17th Street | |
| |
24. Wilmington - Oleander | |
| |
in North Carolina | |
| |
25. Boiling Spring Lakes | |
| |
in South Carolina | |
| |
26. Windy Hill |
9
|
|
|
|
| |
Fiscal 2007 will be a year of significant challenges. Coastal Federal, as well as the banking industry as a whole, is facing increasing headwinds in the forms of the inverted-to-flat yield curve, intense loan and deposit pricing competition, the rising costs of delivering Customer Service and Convenience and maintaining compliance with a rapidly escalating regulatory environment.
Our plan for addressing these challenges involves the continuation of our focus on attracting significant growth in both Business and Personal Checking Accounts and Checking Account based banking relationships, and in retaining and developing our Business and Personal banking relationships by remaining focused on our Mission of Exceeding the Expectations of our Customer.
Over the 13 years since its introduction in 1993, our ever-increasing commitment to ourQUEST FOR EXCELLENCEBusiness Model has well positioned us for this ambitious quest. And, while we are very fortunate to be located in one of the best markets in America, and enjoy many competitive advantages, all of the success that has been achieved over these years is due to our exceptional Coastal Financial team. And we have the best team imaginable.
My sincere appreciation goes to our Board of Directors, Leadership Group and Associates. Their never-ending quest for improving the Customer experience enabled our 2006 results, and are a direct reflection of their commitment toOur Basic Corporate Objective Of Maximizing The Value Of Our Shareholders’ Investment by working diligently toward the achievement ofOur Long-Term Goal Of Being The Best Financial Services Company In Our Marketplace.
All of us at Coastal Financial Corporation appreciate your continued encouragement, loyalty and support.
Michael C. Gerald
President and
Chief Executive Officer
10
Management’s Report on Internal Control Over Financial Reporting
The management of Coastal Financial Corporation and subsidiaries (the “Company”) is responsible for establishing and maintaining adequate internal control over financial reporting. The internal control process has been designed under our supervision to provide reasonable assurance regarding the reliability of financial reporting and the preparation of the Company’s financial statements for external reporting purposes in accordance with accounting principles generally accepted in the United States of America.
Management conducted an assessment of the effectiveness of the Company’s internal control over financial reporting as of September 30, 2006, utilizing the framework established in Internal Control - Integrated Framework issued by the Committee of Sponsoring Organizations of the Treadway Commission. Based on this assessment, management has determined that the Company’s internal control over financial reporting as of September 30, 2006 is effective.
Our internal control over financial reporting includes policies and procedures that pertain to the maintenance of records that accurately and fairly reflect, in reasonable detail, transactions and dispositions of assets; and provide reasonable assurance that (i) transactions are recorded as necessary to permit preparation of financial statements in accordance with accounting principles generally accepted in the United States; (ii) receipts and expenditures are being made only in accordance with authorizations of management and the directors of the Company; and (iii) provide reasonable assurance regarding prevention or timely detection of unauthorized acquisition, use, or disposition of the Company’s assets that could have a material effect on the Company’s financial statements.
All internal control systems, no matter how well designed, have inherent limitations. Therefore, even those systems determined to be effective can provide only reasonable assurance with respect to financial statement preparation and presentation. Also, projections of any evaluation of effectiveness to future periods are subject to the risk that controls may become inadequate because of changes in conditions, or that the degree of compliance with the policies or procedures may deteriorate.
Management’s assessment of the effectiveness of the Company’s internal control over financial reporting as of September 30, 2006 has been audited by KPMG LLP, an independent registered public accounting firm, as stated in their report.
11
Report of Independent Registered Public Accounting Firm
The Board of Directors
Coastal Financial Corporation:
Myrtle Beach, South Carolina
We have audited management’s assessment, included in the accompanying,Management’s Report on Internal Control Over Financial Reporting, that Coastal Financial Corporation and subsidiaries (the “Company”) maintained effective internal control over financial reporting as of September 30, 2006, based on criteria established inInternal Control—Integrated Framework issued by the Committee of Sponsoring Organizations of the Treadway Commission (COSO). The Company’s management is responsible for maintaining effective internal control over financial reporting and for its assessment of the effectiveness of internal control over financial reporting. Our responsibility is to express an opinion on management’s assessment and an opinion on the effectiveness of the Company’s internal control over financial reporting based on our audit.
We conducted our audit in accordance with the standards of the Public Company Accounting Oversight Board (United States). Those standards require that we plan and perform the audit to obtain reasonable assurance about whether effective internal control over financial reporting was maintained in all material respects. Our audit included obtaining an understanding of internal control over financial reporting, evaluating management’s assessment, testing and evaluating the design and operating effectiveness of internal control, and performing such other procedures as we considered necessary in the circumstances. We believe that our audit provides a reasonable basis for our opinion.
A company’s internal control over financial reporting is a process designed to provide reasonable assurance regarding the reliability of financial reporting and the preparation of financial statements for external purposes in accordance with generally accepted accounting principles. A company’s internal control over financial reporting includes those policies and procedures that (1) pertain to the maintenance of records that, in reasonable detail, accurately and fairly reflect the transactions and dispositions of the assets of the company; (2) provide reasonable assurance that transactions are recorded as necessary to permit preparation of financial statements in accordance with generally accepted accounting principles, and that receipts and expenditures of the company are being made only in accordance with authorizations of management and directors of the company; and (3) provide reasonable assurance regarding prevention or timely detection of unauthorized acquisition, use, or disposition of the company’s assets that could have a material effect on the financial statements.
Because of its inherent limitations, internal control over financial reporting may not prevent or detect misstatements. Also, projections of any evaluation of effectiveness to future periods are subject to the risk that controls may become inadequate because of changes in conditions, or that the degree of compliance with the policies or procedures may deteriorate.
In our opinion, management’s assessment that the Company maintained effective internal control over financial reporting as of September 30, 2006, is fairly stated, in all material respects, based on criteria established inInternal Control—Integrated Framework issued by the Committee of Sponsoring Organizations of the Treadway Commission (COSO). Also, in our opinion, the Company maintained, in all material respects, effective internal control over financial reporting as of September 30, 2006, based on criteria established inInternal Control—Integrated Framework issued by the Committee of Sponsoring Organizations of the Treadway Commission (COSO).
We also have audited, in accordance with the standards of the Public Company Accounting Oversight Board (United States), the consolidated statements of financial condition of Coastal Financial Corporation and subsidiaries as of September 30, 2006 and 2005, and the related consolidated statements of operations, stockholders’ equity and comprehensive income, and cash flows for each of the years in the three-year period ended September 30, 2006, and our report dated December 14, 2006, expressed an unqualified opinion on those consolidated financial statements. Our report refers to the fact that Coastal Financial Corporation and subsidiaries adopted, effective October 1, 2005, the provisions of Statement of Financial Accounting Standard No. 123R, Share-Based Payment.
Raleigh, North Carolina
December 14, 2006
12
Report of Independent Registered Public Accounting Firm
The Board of Directors
Coastal Financial Corporation:
Myrtle Beach, South Carolina
We have audited the accompanying consolidated statements of financial condition of Coastal Financial Corporation and subsidiaries (the “Company”) as of September 30, 2006 and 2005, and the related consolidated statements of operations, stockholders’ equity and comprehensive income, and cash flows for each of the years in the three-year period ended September 30, 2006. These consolidated financial statements are the responsibility of the Company’s management. Our responsibility is to express an opinion on these consolidated financial statements based on our audits.
We conducted our audits in accordance with the standards of the Public Company Accounting Oversight Board (United States). Those standards require that we plan and perform the audit to obtain reasonable assurance about whether the financial statements are free of material misstatement. An audit includes examining, on a test basis, evidence supporting the amounts and disclosures in the financial statements. An audit also includes assessing the accounting principles used and significant estimates made by management, as well as evaluating the overall financial statement presentation. We believe that our audits provide a reasonable basis for our opinion.
In our opinion, the consolidated financial statements referred to above present fairly, in all material respects, the financial condition of the Company as of September 30, 2006 and 2005, and the results of its operations and its cash flows for each of the years in the three-year period ended September 30, 2006, in conformity with U.S. generally accepted accounting principles.
We also have audited, in accordance with the standards of the Public Company Accounting Oversight Board (United States), the effectiveness of the Company’s internal control over financial reporting as of September 30, 2006, based on criteria established in Internal Control—Integrated Framework issued by the Committee of Sponsoring Organizations of the Treadway Commission (COSO), and our report dated December 14, 2006 expressed an unqualified opinion on management’s assessment of, and the effective operation of, internal control over financial reporting.
As discussed in Note 1 to the consolidated financial statements, the Company adopted, effective October 1, 2005, the provisions of Statement of Financial Accounting Standard No. 123R, Share-Based Payment.
Raleigh, North Carolina
December 14, 2006
13
COASTAL FINANCIAL CORPORATION AND SUBSIDIARIES
Consolidated Statements of Financial Condition
September 30, 2005 and 2006
|
|
|
|
|
|
|
|
|
| 2005 |
| 2006 |
| ||
|
|
|
| ||||
|
| (Dollars in thousands, |
| ||||
ASSETS |
|
|
|
|
|
|
|
Cash and amounts due from banks |
| $ | 52,592 |
|
| 31,055 |
|
Short-term interest-bearing deposits |
|
| 33,742 |
|
| 5,797 |
|
Federal funds sold |
|
| 5,191 |
|
| 103 |
|
Investment securities available for sale |
|
| 25,616 |
|
| 39,300 |
|
Mortgage-backed securities available for sale |
|
| 399,655 |
|
| 392,989 |
|
Investment securities held to maturity (market value of $10,049 at September 30, 2005 and $12,000 at September 30, 2006) |
|
| 10,000 |
|
| 11,997 |
|
Loans receivable (net of allowance for loan losses of $11,748 at September 30, 2005 and $12,726 at September 30, 2006) |
|
| 924,260 |
|
| 1,088,231 |
|
Loans receivable held for sale |
|
| 18,121 |
|
| 1,853 |
|
Real estate acquired through foreclosure, net |
|
| 818 |
|
| 571 |
|
Office property and equipment, net |
|
| 22,758 |
|
| 29,926 |
|
Federal Home Loan Bank (FHLB) stock, at cost |
|
| 15,775 |
|
| 20,291 |
|
Accrued interest receivable on loans |
|
| 3,807 |
|
| 5,000 |
|
Accrued interest receivable on securities |
|
| 2,351 |
|
| 2,898 |
|
Bank-owned life insurance |
|
| 22,574 |
|
| 23,541 |
|
Other assets |
|
| 6,199 |
|
| 5,923 |
|
|
|
|
| ||||
|
| $ | 1,543,459 |
|
| 1,659,475 |
|
|
|
|
| ||||
LIABILITIES AND STOCKHOLDERS’ EQUITY |
|
|
|
|
|
|
|
Liabilities: |
|
|
|
|
|
|
|
Deposits |
|
| 1,070,918 |
|
| 1,063,105 |
|
Securities sold under agreements to repurchase |
|
| 41,937 |
|
| 72,095 |
|
Advances from FHLB |
|
| 289,007 |
|
| 380,580 |
|
Junior subordinated debt |
|
| 15,464 |
|
| 15,464 |
|
Drafts outstanding |
|
| 12,890 |
|
| 2,023 |
|
Advances by borrowers for property taxes and insurance |
|
| 1,221 |
|
| 1,422 |
|
Accrued interest payable |
|
| 3,415 |
|
| 4,718 |
|
Other liabilities |
|
| 11,386 |
|
| 7,244 |
|
|
|
|
| ||||
Total liabilities |
|
| 1,446,238 |
|
| 1,546,651 |
|
|
|
|
| ||||
|
|
|
|
|
|
|
|
Stockholders’ equity: |
|
|
|
|
|
|
|
Serial preferred stock, 1,000,000 shares authorized and unissued |
|
| — |
|
| — |
|
Common stock $.01 par value per share, 50,000,000 shares authorized; 21,403,241 shares at September 30, 2005 and 21,686,542 shares at September 30, 2006 issued and outstanding |
|
| 214 |
|
| 217 |
|
Additional paid-in capital |
|
| 11,391 |
|
| 12,856 |
|
Retained earnings, restricted |
|
| 86,723 |
|
| 102,777 |
|
Accumulated other comprehensive loss, net of tax |
|
| (1,107 | ) |
| (3,026 | ) |
|
|
|
| ||||
Total stockholders’ equity |
|
| 97,221 |
|
| 112,824 |
|
|
|
|
| ||||
|
| $ | 1,543,459 |
|
| 1,659,475 |
|
|
|
|
|
See accompanying notes to consolidated financial statements.
14
COASTAL FINANCIAL CORPORATION AND SUBSIDIARIES
Consolidated Statements of Operations
Years ended September 30, 2004, 2005 and 2006
|
|
|
|
|
|
|
|
|
|
|
|
| 2004 |
| 2005 |
| 2006 |
| |||
|
|
|
|
| ||||||
|
| (In thousands, except share data) |
| |||||||
Interest: |
|
|
|
|
|
|
|
|
|
|
Loans receivable |
| $ | 46,765 |
|
| 56,826 |
|
| 75,932 |
|
Investment securities |
|
| 2,886 |
|
| 4,971 |
|
| 6,934 |
|
Mortgage-backed securities |
|
| 16,067 |
|
| 16,392 |
|
| 15,852 |
|
Other |
|
| 87 |
|
| 369 |
|
| 935 |
|
|
|
|
|
| ||||||
Total interest income |
|
| 65,805 |
|
| 78,558 |
|
| 99,653 |
|
|
|
|
|
| ||||||
|
|
|
|
|
|
|
|
|
|
|
Interest expense: |
|
|
|
|
|
|
|
|
|
|
Deposits |
|
| 10,024 |
|
| 14,079 |
|
| 26,743 |
|
Securities sold under agreements to repurchase |
|
| 2,114 |
|
| 2,418 |
|
| 2,335 |
|
Advances from FHLB |
|
| 10,724 |
|
| 12,341 |
|
| 14,803 |
|
Other borrowings |
|
| 662 |
|
| 892 |
|
| 1,192 |
|
|
|
|
|
| ||||||
Total interest expense |
|
| 23,524 |
|
| 29,730 |
|
| 45,073 |
|
|
|
|
|
| ||||||
Net interest income |
|
| 42,281 |
|
| 48,828 |
|
| 54,580 |
|
Provision for loan losses |
|
| 1,750 |
|
| 1,697 |
|
| 1,385 |
|
|
|
|
|
| ||||||
Net interest income after provision for loan losses |
|
| 40,531 |
|
| 47,131 |
|
| 53,195 |
|
|
|
|
|
| ||||||
Other income: |
|
|
|
|
|
|
|
|
|
|
Fees and service charges on deposit accounts |
|
| 3,771 |
|
| 6,137 |
|
| 9,385 |
|
Income from ATM and debit card transactions |
|
| 954 |
|
| 1,532 |
|
| 2,334 |
|
Income from sales of non-depository products |
|
| 1,909 |
|
| 1,840 |
|
| 1,631 |
|
Gain on sales of loans and loans receivable held for sale |
|
| 1,523 |
|
| 1,201 |
|
| 1,176 |
|
Gain (loss) on sales of investment securities, net |
|
| (100 | ) |
| 66 |
|
| 97 |
|
Gain (loss) on sales of mortgage-backed securities, net |
|
| (997 | ) |
| (551 | ) |
| (494 | ) |
Gain on call of investment securities held to maturity |
|
| — |
|
| 160 |
|
| — |
|
Gain (loss) from real estate acquired through foreclosure |
|
| 3 |
|
| (76 | ) |
| 3 |
|
Federal Home Loan Bank stock dividends |
|
| 499 |
|
| 668 |
|
| 1,016 |
|
Bank-owned life insurance |
|
| 962 |
|
| 948 |
|
| 967 |
|
Other income |
|
| 647 |
|
| 599 |
|
| 950 |
|
|
|
|
|
| ||||||
Total other income |
|
| 9,171 |
|
| 12,524 |
|
| 17,065 |
|
|
|
|
|
| ||||||
|
|
|
|
|
|
|
|
|
|
|
General and administrative expenses: |
|
|
|
|
|
|
|
|
|
|
Salaries and employee benefits |
|
| 16,099 |
|
| 18,460 |
|
| 22,242 |
|
Net occupancy, furniture and fixtures and data processing expense |
|
| 4,001 |
|
| 4,844 |
|
| 6,784 |
|
Depreciation |
|
| 2,175 |
|
| 2,757 |
|
| 3,561 |
|
FDIC insurance premium |
|
| 104 |
|
| 108 |
|
| 137 |
|
FHLB prepayment penalties |
|
| 77 |
|
| — |
|
| — |
|
Marketing expense |
|
| 905 |
|
| 1,809 |
|
| 2,000 |
|
Expense from ATM and debit card transactions |
|
| 630 |
|
| 1,039 |
|
| 1,399 |
|
Other expense |
|
| 3,278 |
|
| 4,502 |
|
| 4,935 |
|
|
|
|
|
| ||||||
Total general and administrative expense |
|
| 27,269 |
|
| 33,519 |
|
| 41,058 |
|
|
|
|
|
| ||||||
Income before income taxes |
|
| 22,433 |
|
| 26,136 |
|
| 29,202 |
|
Income taxes |
|
| 7,627 |
|
| 8,982 |
|
| 10,201 |
|
|
|
|
|
| ||||||
Net income |
| $ | 14,806 |
|
| 17,154 |
|
| 19,001 |
|
|
|
|
|
| ||||||
Net income per common share |
|
|
|
|
|
|
|
|
|
|
Basic |
| $ | 0.71 |
|
| 0.81 |
|
| 0.88 |
|
|
|
|
|
| ||||||
Diluted |
| $ | 0.67 |
|
| 0.76 |
|
| 0.85 |
|
|
|
|
|
| ||||||
Dividends declared per common share |
| $ | 0.14 |
|
| 0.16 |
|
| 0.14 |
|
|
|
|
|
| ||||||
Average common shares outstanding |
|
|
|
|
|
|
|
|
|
|
Basic |
|
| 20,966,000 |
|
| 21,274,000 |
|
| 21,509,000 |
|
|
|
|
|
| ||||||
Diluted |
|
| 22,128,000 |
|
| 22,465,000 |
|
| 22,406,000 |
|
|
|
|
|
|
See accompanying notes to consolidated financial statements.
15
COASTAL FINANCIAL CORPORATION AND SUBSIDIARIES
Consolidated Statements of Stockholders’ Equity and Comprehensive Income
Years ended September 30, 2004, 2005 and 2006
|
|
|
|
|
|
|
|
|
|
|
|
|
|
|
|
|
|
|
|
|
| Common |
| Additional |
| Retained |
| Treasury |
| Accumulated |
| Total |
| ||||||
|
|
|
|
|
|
|
| ||||||||||||
|
| (In thousands) |
| ||||||||||||||||
Balance at September 30, 2003 |
| $ | 209 |
|
| 10,155 |
|
| 63,030 |
|
| (3,375 | ) |
| 3,688 |
|
| 73,707 |
|
Exercise of stock options |
|
| 3 |
|
| 432 |
|
| (1,355 | ) |
| 2,193 |
|
| — |
|
| 1,273 |
|
Cash dividends |
|
| — |
|
| — |
|
| (2,948 | ) |
| — |
|
| — |
|
| (2,948 | ) |
Net income |
|
| — |
|
| — |
|
| 14,806 |
|
| — |
|
| — |
|
| 14,806 |
|
Other comprehensive income, net of tax: |
|
|
|
|
|
|
|
|
|
|
|
|
|
|
|
|
|
|
|
Unrealized losses arising during period, net of taxes of $1,330 |
|
| — |
|
| — |
|
| — |
|
| — |
|
| (2,170 | ) |
| — |
|
Less: reclassification adjustment for losses included in net income, net of tax benefit of $417 |
|
| — |
|
| — |
|
| — |
|
| — |
|
| 680 |
|
| — |
|
|
|
|
|
|
|
|
| ||||||||||||
Other comprehensive loss |
|
| — |
|
| — |
|
| — |
|
| — |
|
| (1,490 | ) |
| (1,490 | ) |
|
|
|
|
|
|
|
| ||||||||||||
Comprehensive income |
|
| — |
|
| — |
|
| — |
|
| — |
|
| — |
|
| 13,316 |
|
|
|
|
|
|
|
|
| ||||||||||||
Balance at September 30, 2004 |
|
| 212 |
|
| 10,587 |
|
| 73,533 |
|
| (1,182 | ) |
| 2,198 |
|
| 85,348 |
|
Exercise of stock options |
|
| 2 |
|
| 728 |
|
| (603 | ) |
| 1,182 |
|
| — |
|
| 1,309 |
|
| |||||||||||||||||||
Stock compensation related to accelerated vesting |
|
| — |
|
| 76 |
|
| — |
|
| — |
|
| — |
|
| 76 |
|
Cash dividends |
|
| — |
|
| — |
|
| (3,361 | ) |
| — |
|
| — |
|
| (3,361 | ) |
Net income |
|
| — |
|
| — |
|
| 17,154 |
|
| — |
|
| — |
|
| 17,154 |
|
Other comprehensive income, net of tax: |
|
|
|
|
|
|
|
|
|
|
|
|
|
|
|
|
|
|
|
Unrealized losses arising during period, net of taxes of $2,210 |
|
| — |
|
| — |
|
| — |
|
| — |
|
| (3,606 | ) |
| — |
|
Less: reclassification adjustment for losses included in net income, net of tax benefit of $184 |
|
| — |
|
| — |
|
| — |
|
| — |
|
| 301 |
|
| — |
|
|
|
|
|
|
|
|
| ||||||||||||
Other comprehensive loss |
|
| — |
|
| — |
|
| — |
|
| — |
|
| (3,305 | ) |
| (3,305 | ) |
|
|
|
|
|
|
|
| ||||||||||||
Comprehensive income |
|
| — |
|
| — |
|
| — |
|
| — |
|
| — |
|
| 13,849 |
|
|
|
|
|
|
|
|
| ||||||||||||
Balance at September 30, 2005 |
|
| 214 |
|
| 11,391 |
|
| 86,723 |
|
| — |
|
| (1,107 | ) |
| 97,221 |
|
Exercise of stock options |
|
| 3 |
|
| 1,374 |
|
| — |
|
| — |
|
| — |
|
| 1,377 |
|
Stock compensation expense, net of tax of $55 |
|
| — |
|
| 91 |
|
| — |
|
| — |
|
| — |
|
| 91 |
|
Cash dividends |
|
| — |
|
| — |
|
| (2,947 | ) |
| — |
|
| — |
|
| (2,947 | ) |
Net income |
|
| — |
|
| — |
|
| 19,001 |
|
| — |
|
| — |
|
| 19,001 |
|
Other comprehensive income, net of tax: |
|
|
|
|
|
|
|
|
|
|
|
|
|
|
|
|
|
|
|
Unrealized losses arising during period, net of taxes of $1,327 |
|
| — |
|
| — |
|
| — |
|
| — |
|
| (2,165 | ) |
| — |
|
Less: reclassification adjustment for losses included in net income, net of tax benefit of $151 |
|
| — |
|
| — |
|
| — |
|
| — |
|
| 246 |
|
| — |
|
|
|
|
|
|
|
|
| ||||||||||||
Other comprehensive loss |
|
| — |
|
| — |
|
| — |
|
| — |
|
| (1,919 | ) |
| (1,919 | ) |
|
|
|
|
|
|
|
| ||||||||||||
Comprehensive income |
|
| — |
|
| — |
|
| — |
|
| — |
|
| — |
|
| 15,603 |
|
|
|
|
|
|
|
|
| ||||||||||||
Balance at September 30, 2006 |
| $ | 217 |
|
| 12,856 |
|
| 102,777 |
|
| — |
|
| (3,026 | ) |
| 112,824 |
|
|
|
|
|
|
|
|
|
See accompanying notes to consolidated financial statements.
16
COASTAL FINANCIAL CORPORATION AND SUBSIDIARIES
Consolidated Statements of Cash Flows
Years ended September 30, 2004, 2005 and 2006
|
|
|
|
|
|
|
|
|
|
|
|
| 2004 |
| 2005 |
| 2006 |
| |||
|
|
|
|
| ||||||
|
| (In thousands) |
| |||||||
Cash flows from operating activities: |
|
|
|
|
|
|
|
|
|
|
Net income |
| $ | 14,806 |
|
| 17,154 |
|
| 19,001 |
|
Adjustments to reconcile net income to net cash used in operating activities: |
|
|
|
|
|
|
|
|
|
|
Depreciation |
|
| 2,175 |
|
| 2,757 |
|
| 3,561 |
|
Provision for loan losses |
|
| 1,750 |
|
| 1,697 |
|
| 1,385 |
|
Loss on sale of mortgage-backed securities available for sale |
|
| 997 |
|
| 551 |
|
| 494 |
|
(Gain) loss on sale of investment securities available or sale |
|
| 100 |
|
| (66 | ) |
| (97 | ) |
(Gain) on call of investment security called by issuer |
|
| — |
|
| (160 | ) |
| — |
|
Loss on disposal of office properties and equipment |
|
| — |
|
| 128 |
|
| 16 |
|
Stock-based compensation |
|
| — |
|
| 76 |
|
| 146 |
|
Origination of loans receivable held for sale |
|
| (63,448 | ) |
| (81,207 | ) |
| (42,198 | ) |
Proceeds from sales of loans receivable held for sale |
|
| 27,453 |
|
| 18,704 |
|
| 18,012 |
|
Proceeds from securitization and sales of loans receivable held for sale |
|
| 46,845 |
|
| 52,628 |
|
| 27,512 |
|
Loss on early extinguishment of debt |
|
| 77 |
|
| — |
|
| — |
|
Tax benefit of stock options |
|
| (434 | ) |
| (394 | ) |
| (345 | ) |
Increase in: |
|
|
|
|
|
|
|
|
|
|
Cash value of life insurance |
|
| (962 | ) |
| (947 | ) |
| (967 | ) |
Other assets |
|
| (536 | ) |
| (174 | ) |
| 276 |
|
Accrued interest receivable |
|
| (1,018 | ) |
| (808 | ) |
| (1,740 | ) |
Increase (decrease) in: |
|
|
|
|
|
|
|
|
|
|
Accrued interest payable |
|
| 239 |
|
| 1,913 |
|
| 1,303 |
|
Other liabilities |
|
| (125 | ) |
| 4,627 |
|
| (2,676 | ) |
|
|
|
|
| ||||||
Net cash provided by operating activities |
|
| 27,919 |
|
| 16,479 |
|
| 23,683 |
|
|
|
|
|
| ||||||
Cash flows from investing activities: |
|
|
|
|
|
|
|
|
|
|
Proceeds from sales of investment securities available for sale |
|
| 2,881 |
|
| 4,163 |
|
| 10,567 |
|
Proceeds from issuer call of investment securities available for sale |
|
| — |
|
| 1,950 |
|
| — |
|
Proceeds from issuer call of investment securities held to maturity |
|
| — |
|
| 8,000 |
|
| — |
|
Proceeds from maturities of investment securities available for sale |
|
| 2,000 |
|
| — |
|
| — |
|
Purchases of investment securities available for sale |
|
| (11,866 | ) |
| (8,255 | ) |
| (24,110 | ) |
Purchases of investment securities held to maturity |
|
| (7,840 | ) |
| (10,000 | ) |
| (1,997 | ) |
Proceeds from sales of mortgage-backed securities available for sale |
|
| 124,479 |
|
| 178,849 |
|
| 51,647 |
|
Purchases of mortgage-backed securities available for sale |
|
| (234,672 | ) |
| (312,217 | ) |
| (125,734 | ) |
Principal collected on mortgage-backed securities available for sale |
|
| 115,179 |
|
| 102,155 |
|
| 77,120 |
|
Origination of loans receivable, net |
|
| (513,858 | ) |
| (718,477 | ) |
| (758,558 | ) |
Proceeds from sale of commercial loan participations |
|
| — |
|
| 21,228 |
|
| 4,369 |
|
Proceeds from sale of credit card portfolio |
|
| — |
|
| — |
|
| 3,618 |
|
Principal collected on loans receivable |
|
| 403,501 |
|
| 560,469 |
|
| 597,228 |
|
Purchase of bank-owned life insurance |
|
| (4,500 | ) |
| — |
|
| — |
|
Proceeds from sales of real estate acquired through foreclosure |
|
| 1,456 |
|
| 1,521 |
|
| 1,176 |
|
Proceeds from sale of office properties and equipment |
|
| 58 |
|
| — |
|
| — |
|
Purchases of office properties and equipment |
|
| (4,989 | ) |
| (6,800 | ) |
| (10,745 | ) |
Change in FHLB stock, net |
|
| (2,909 | ) |
| 1,125 |
|
| (4,516 | ) |
|
|
|
|
| ||||||
Net cash used in investing activities |
|
| (131,080 | ) |
| (176,289 | ) |
| (179,935 | ) |
|
|
|
|
| ||||||
Cash flows from financing activities: |
|
|
|
|
|
|
|
|
|
|
Increase (decrease) in deposits |
|
| 56,367 |
|
| 317,539 |
|
| (7,813 | ) |
Increase (decrease) in securities sold under agreements to repurchase |
|
| (26,429 | ) |
| (65,236 | ) |
| 30,158 |
|
Proceeds from FHLB advances |
|
| 686,476 |
|
| 565,650 |
|
| 970,210 |
|
Repayment of FHLB advances |
|
| (602,083 | ) |
| (605,150 | ) |
| (878,637 | ) |
Repayments of other borrowings, net |
|
| (81 | ) |
| — |
|
| — |
|
Prepayment penalties on early extinguishment of debt |
|
| (77 | ) |
| — |
|
| — |
|
Increase (decrease) in advance payments by borrowers for property taxes and insurance |
|
| (45 | ) |
| (529 | ) |
| 201 |
|
Increase in drafts outstanding, net |
|
| 148 |
|
| 10,098 |
|
| (10,867 | ) |
Cash dividends to stockholders and cash for fractional shares |
|
| (2,948 | ) |
| (3,361 | ) |
| (2,947 | ) |
Proceeds from exercise of stock options |
|
| 839 |
|
| 915 |
|
| 1,032 |
|
Tax benefit of stock options |
|
| 434 |
|
| 394 |
|
| 345 |
|
|
|
|
|
| ||||||
Net cash provided by financing activities |
|
| 112,601 |
|
| 220,320 |
|
| 101,682 |
|
|
|
|
|
| ||||||
Net increase (decrease) in cash and cash equivalents |
|
| 9,440 |
|
| 60,510 |
|
| (54,570 | ) |
|
|
|
|
| ||||||
Cash and cash equivalents at beginning of year |
|
| 21,575 |
|
| 31,015 |
|
| 91,525 |
|
|
|
|
|
| ||||||
Cash and cash equivalents at end of year |
| $ | 31,015 |
|
| 91,525 |
|
| 36,955 |
|
|
|
|
|
| ||||||
Supplemental information: |
|
|
|
|
|
|
|
|
|
|
Interest paid |
| $ | 23,285 |
|
| 27,817 |
|
| 43,771 |
|
|
|
|
|
| ||||||
Income taxes paid |
| $ | 7,762 |
|
| 6,970 |
|
| 10,118 |
|
|
|
|
|
| ||||||
Supplemental schedule of non-cash investing and financing transactions: |
|
|
|
|
|
|
|
|
|
|
Securitization of mortgage loans into mortgage-backed securities |
| $ | 46,845 |
|
| 52,628 |
|
| 27,512 |
|
|
|
|
|
| ||||||
Transfer of mortgage loans to real estate acquired through foreclosure |
| $ | 614 |
|
| 1,554 |
|
| 929 |
|
|
|
|
|
| ||||||
Increase in other assets and junior subordinated debt resulting from deconsolidation under FIN 46R |
| $ | 464 |
|
| — |
|
| — |
|
|
|
|
|
|
See accompanying notes to consolidated financial statements.
17
COASTAL FINANCIAL CORPORATION AND SUBSIDIARIES
Notes to Consolidated Financial Statements
|
|
(1) | SUMMARY OF SIGNIFICANT ACCOUNTING POLICIES |
The following is a summary of the more significant accounting policies used in the preparation and presentation of the accompanying consolidated financial statements. The preparation of financial statements in conformity with U.S. generally accepted accounting principles requires management to make estimates and assumptions. These estimates and assumptions affect the reported amount of assets and liabilities and the disclosure of contingent assets and liabilities at the date of the financial statements. In addition, they affect the reported amounts of income and expenses during the reporting period. Actual results could differ from these estimates and assumptions. Material estimates that are particularly susceptible to significant change relate to the determination of the allowance for loan losses and income tax assets or liabilities. To a lesser extent, significant estimates are also associated with the valuation of derivative instruments and valuation of mortgage servicing rights.
|
|
|
| (a) | Principles of Consolidation |
The accompanying consolidated financial statements include the accounts of Coastal Financial Corporation (the “Company”), and its wholly-owned subsidiaries, Coastal Investor Services, Inc., Coastal Planners Holding Corporation (and Coastal Planners Holding Corporation’s wholly-owned subsidiary, Coastal Retirement, Estate and Tax Planners, Inc.), Coastal Federal Bank (the “Bank”) (and the Bank’s wholly-owned subsidiaries, Coastal Federal Holding Company (and Coastal Federal Holding Company’s wholly-owned subsidiary, Coastal Real Estate Investment Corporation)), and Coastal Mortgage Bankers and Realty Co., Inc. (and Coastal Mortgage Bankers and Realty Co. Inc.’s wholly-owned subsidiary, Sherwood Development Corporation).
The Company also has an investment in Coastal Financial Capital Trust I, a statutory trust that is not consolidated in accordance with Financial Accounting Board Interpretation No. 46 (see Note 11).
In consolidation, all significant intercompany balances and transactions have been eliminated. Coastal Financial Corporation is a unitary thrift holding company organized under the laws of the state of Delaware.
|
|
|
| (b) | Cash and Cash Equivalents |
For purposes of reporting cash flows, cash and cash equivalents include cash and amounts due from banks, short-term interest-bearing deposits and federal funds sold. Cash and cash equivalents have maturities of three months or less. Accordingly, the carrying amount of such instruments is considered to be a reasonable estimate of fair value.
|
|
|
| (c) | Investment and Mortgage-backed Securities |
Investment and mortgage-backed securities are accounted for in accordance with Statement of Financial Accounting Standards (“SFAS”) No. 115, “Accounting for Certain Investments in Debt and Equity Securities”. Investments are classified into three categories as follows: (1) Held to Maturity - debt securities that the Company has the positive intent and ability to hold to maturity, which are reported at amortized cost; (2) Trading - debt and equity securities that are bought and held principally for the purpose of selling them in the near term, which are reported at fair value, with unrealized gains and losses included in earnings and (3) Available for Sale - debt and equity securities that may be sold under certain conditions, which are reported at fair value, with unrealized gains and losses excluded from earnings and reported in accumulated other comprehensive income as a separate component of stockholders’ equity, net of income taxes.
The Company determines investment and mortgage-backed securities classification at the time of purchase. Premiums and discounts on securities are accreted or amortized as an adjustment to income over the estimated life of the security using a method which approximates a level yield. Dividends and interest income are recognized when earned. Unrealized losses on securities, reflecting a decline in value judged by the Company to be other than temporary, are charged to income in the consolidated statements of operations.
The cost basis of securities sold is determined by specific identification. Purchases and sales of securities are recorded on a trade date basis. The fair value of securities is based on quoted market prices or dealer quotes.
|
|
|
| (d) | Loans Receivable Held for Sale |
Mortgage loans originated and intended for sale in the secondary market, which generally consist of conforming fixed rate loans, are carried at the lower of cost or estimated market value in the aggregate. Net unrealized losses are provided for in a valuation allowance by charges to operations. At September 30, 2005 and 2006, the Company had approximately $18.1 million and $1.9 million in mortgage loans held for sale, respectively. Gains or losses on sales of loans are recognized when control over these assets has been surrendered in accordance with SFAS No. 140, “Accounting for Transfer and Servicing of Financial Assets and Extinguishment of Liabilities” (“SFAS No. 140”).
18
COASTAL FINANCIAL CORPORATION AND SUBSIDIARIES
Notes to Consolidated Financial Statements – Continued
|
|
(1) | SUMMARY OF SIGNIFICANT ACCOUNTING POLICIES – CONTINUED |
|
|
|
| (e) | Loans Receivable |
Loans receivable are stated at unpaid principal balances adjusted for unamortized premiums and unearned discounts and deferred loan fees/costs. The Company recognizes interest income on loans using the simple interest method.
The Company follows SFAS No. 114, “Accounting by Creditors for Impairment of a Loan,” for determining impairment on certain loans. SFAS No. 114 requires that nonhomogenous impaired loans and certain restructured loans be measured at the present value of expected future cash flows discounted at the loan’s effective interest rate, at the loan’s observable market price or at the fair value of the collateral if the loan is collateral dependent. A specific reserve, if deemed necessary, is set up for each impaired loan. Accrual of interest income on impaired loans is suspended when, in management’s judgment, doubt exists as to the collectibility of principal and interest. If amounts are received on impaired or restructured loans for which the accrual of interest has been discontinued, a determination is made as to whether payments received should be recorded as a reduction of the principal balance or as interest income depending on management’s judgment as to the collectibility of principal. The loan is returned to accrual status when, in management’s judgment, the borrower has demonstrated the ability to make periodic interest and principal payments on a timely basis.
Loans are charged-off when the amount of loss is reasonably quantifiable and the loss is likely to occur. Commercial, consumer and mortgage loans are placed in nonaccrual status when they become 90 days delinquent or earlier if full collection of principal and interest becomes doubtful. Interest payments received after a loan is placed in nonaccrual are applied as a principal reduction until such time as the loan is returned to accrual status. Generally, loans are returned to accrual status when the loan is brought current and the ultimate collectibility of principal and interest is no longer in doubt. The Company maintains an allowance for the loss of uncollected interest primarily on loans which are 90 days or more past due. This allowance is reviewed periodically and necessary adjustments, if any, are included in the determination of current interest income. The allowance for uncollectible interest totaled $427,000 and $194,000 as of September 30, 2005 and 2006, respectively.
|
|
|
| (f) | Loan Fees and Discounts |
The net of origination fees received and direct costs incurred in the origination of loans are deferred as part of the basis of loans and amortized to interest income over the contractual life of the loans adjusted for actual principal repayments using a method approximating a level yield.
|
|
|
| (g) | Allowance for Loan Losses |
The allowance for loan losses is based on management’s ongoing evaluation of the loan portfolio and reflects an amount, that in management’s opinion, is adequate to absorb probable losses in the existing portfolio. All loan losses are charged to the allowance and all recoveries are credited to the allowance. Additions to the allowance for loan losses are provided by charges to operations based on various factors which, in management’s judgment, deserve current recognition in estimating losses. Such factors considered by management include the market value of the underlying collateral, growth and composition of credit risk within the loan portfolio, loss experience, review of problem assets, delinquency trends, and local and regional economic conditions. Management evaluates the carrying value of loans periodically and the allowance is adjusted accordingly. While management uses the best information available to make evaluations, future adjustments to the allowance may be necessary if economic conditions differ substantially from the assumptions used in making the evaluation. The allowance for loan losses is subject to periodic evaluation by various regulatory authorities and may be subject to adjustment upon their examination.
|
|
|
| (h) | Concentration of Credit Risk |
The Company’s primary market area includes northeastern South Carolina and southeastern North Carolina, predominately along the coastal regions. At September 30, 2006, the majority of the total loan portfolio, as well as a substantial portion of the commercial and real estate loan portfolios, were to borrowers within this region.
The Company has identified one concentration of credit risk that it is monitoring. This concentration involves loans for the acquisition of land and loans for the development of land, which totaled $162.5 million at September 30, 2006, representing 144.1% of total equity and 15.0% of net loans receivable. At September 30, 2005, this concentration totaled $121.2 million, representing 124.6% of total equity and 13.1% of net loans receivable. Economic growth and low interest rate environments have created opportunities for land acquisition and development activities in the Company’s market area. Adverse changes in such factors can also slow absorption of developing projects and moderate market values of land and developed lots. Management continues to monitor this concentration of credit risk at this time and has considered this concentration in its evaluation of the allowance for loan losses. The Company experienced no significant loan losses related to this identified risk during the years ending September 30, 2004, 2005 and 2006.
19
COASTAL FINANCIAL CORPORATION AND SUBSIDIARIES
Notes to Consolidated Financial Statements – Continued
|
|
(1) | SUMMARY OF SIGNIFICANT ACCOUNTING POLICIES – CONTINUED |
|
|
|
| (i) | Loan Securitizations |
The Company packages and sells loans receivable as securities to investors. These transactions are recorded as sales in accordance with SFAS No. 140 when control over these assets has been surrendered. The Company does not retain any interest in the securities sold other than the servicing rights.
|
|
|
| (j) | Real Estate Owned |
Real estate acquired in settlement of loans is initially recorded at the lower of cost or net fair value (less estimated costs to sell). If cost exceeds net fair value, the asset is written down to net fair value with the difference being charged against the allowance for loan losses. Subsequent to foreclosure, such assets are carried at the lower of cost or net fair value with any additional write downs being charged as real estate losses.
|
|
|
| (k) | Office Properties and Equipment |
Office properties and equipment are carried at cost less accumulated depreciation. Depreciation is computed primarily on the straight-line method over the shorter of the estimated useful lives or the lease term. Estimated lives range up to thirty-nine years for buildings and improvements and up to ten years for furniture, fixtures and equipment. Maintenance and repairs are charged to expense as incurred. Improvements which extend the lives of the respective assets are capitalized. When property or equipment is sold or otherwise disposed of, the cost and related accumulated depreciation are removed from the respective accounts and the resulting gain or loss is reflected in income.
|
|
|
| (l) | Mortgage Servicing Rights |
The Company follows SFAS No. 140, which requires the recognition of originated mortgage servicing rights (“mortgage servicing rights” or “MSRs”) as assets by allocating total costs incurred between the originated loan and the servicing rights retained based on their relative fair values. SFAS No. 140 also requires the recognition of purchased mortgage servicing rights at fair value, which is presumed to be the price paid for the rights. MSRs are amortized in proportion to the servicing income over the estimated life of the related mortgage loan. The amortization method is designed to approximate a level-yield method, taking into consideration the estimated prepayment of the underlying loans. For purposes of measuring impairment, MSRs are reviewed for impairment by management on a quarterly basis, primarily considering prepayments and interest rates. Impairment is measured on a disaggregated basis. The Company establishes an impairment valuation allowance to record any impairment for MSRs. Subsequent increases in value are recognized only to the extent of the impairment valuation allowance within the same tranche. (See Note 5).
|
|
|
| (m) | Income Taxes |
Deferred tax assets and liabilities are recognized for the estimated future tax consequences attributable to differences between the financial statement carrying amounts of existing assets and liabilities and their respective tax basis. Deferred tax assets and liabilities are measured using the enacted tax rates expected to apply to taxable income in the years in which those temporary differences are expected to be recovered or settled. The effect of a change in tax rates on deferred tax assets and liabilities is recognized in the period that includes the statutory enactment date. A deferred tax asset valuation allowance is recorded when it is more likely than not that deferred tax assets will not be realized.
|
|
|
| (n) | Drafts Outstanding |
The Company invests all excess funds on deposit at other banks (including amounts on deposit for payment of outstanding disbursement checks) on a daily basis in an overnight interest-bearing account. Accordingly, outstanding checks are reported as a liability.
|
|
|
| (o) | Securities Sold Under Agreement to Repurchase |
The Company maintains collateral for certain Customers who wish to deposit amounts greater than $100,000. These agreements function similarly to a certificate of deposit in that the agreement is for a fixed length of time at a fixed interest rate. However, these deposits are not insured by the Federal Deposit Insurance Corporation (the “FDIC”), but are collateralized by an interest in the pledged securities. The Company has classified these borrowings separately from deposits.
The Company enters into sales of securities under agreements to repurchase. Fixed-coupon, repurchase agreements are treated as financing, with the obligation to repurchase securities sold being reflected as a liability and the securities underlying the agreements remaining as assets.
20
COASTAL FINANCIAL CORPORATION AND SUBSIDIARIES
Notes to Consolidated Financial Statements – Continued
|
|
(1) | SUMMARY OF SIGNIFICANT ACCOUNTING POLICIES – CONTINUED |
|
|
|
| (p) | Stock Based Compensation |
In December 2004, the FASB issued SFAS No. 123 (revised), “Share-Based Payment” (“SFAS 123(R)”). SFAS 123(R) replaces SFAS No. 123, “Accounting for Stock-Based Compensation” (“SFAS 123”), and supersedes APB Opinion No. 25, “Accounting for Stock Issued to Employees” (“APB 25”). SFAS 123(R) requires compensation costs related to share-based payment transactions to be recognized ratably in the financial statements over the period that an employee provides service in exchange for the award. Public companies are required to adopt, and the Company has adopted effective October 1, 2005, the new standard using a modified prospective method. Under the modified prospective method, companies are allowed to record compensation cost for new and modified awards over the related vesting period of such awards prospectively and record compensation cost prospectively on the nonvested portion, at the date of adoption, of previously issued and outstanding awards over the remaining vesting period of such awards. No change to prior periods presented is permitted under the modified prospective method. At September 30, 2006, the Company had one stock-based payment plan for directors, officers and other key Associates, which is described below. Prior to October 1, 2005, the Company, as permitted under SFAS 123, applied the intrinsic value method under APB 25, and related interpretations in accounting for its stock-based compensation plan.
Effective October 1, 2005, the Company adopted the provisions of SFAS 123(R) thereby expensing employee stock-based compensation using the fair value method prospectively for all awards granted, modified, or settled on or after October 1, 2005. The fair value at the date of grant of the stock option is estimated using the Black-Scholes option-pricing model based on assumptions noted in a table below. The dividend yield is based on estimated future dividend yields. The risk-free rate for periods within the contractual term of the share option is based on the U.S. Treasury yield curve in effect at the time of grant. Expected volatilities are generally based on historical volatilities. The expected term of share options granted is generally derived from historical experience. Compensation expense is recognized on a straight-line basis over the stock option vesting period. The impact of adoption of the fair value based method for expense recognition of employee awards resulting in net expense of approximately $91,000, net of tax benefit of approximately $55,000, during the twelve months ended September 30, 2006.
The Company’s stock option plan, which is stockholder approved, provides for stock options to be granted primarily to directors, officers and other key Associates. Options granted under the stock option plan may be incentive stock options or non-incentive stock options. Share option awards are generally granted with an exercise price equal to, or higher than, the market price of the Company’s shares at the date of grant. Options vest ratably over a five-year period and expire after ten years from the date of grant, except as discussed below. Share options awards provide for accelerated vesting if there is a change in control, as defined in the stock option plan. The remaining shares of stock reserved under the stock option plan at September 30, 2006 amounted to approximately 128,000 shares.
Options awarded prior to September 21, 2005 vest ratably over a five-year period. Effective September 21, 2005, upon recommendation of the Compensation Committee of the Board of Directors of Coastal Financial Corporation, the vesting period for approximately 804,000 options awarded during fiscal 2003, 2004 and 2005 through September 20, 2005 that would have otherwise vested at various times through fiscal 2010 was accelerated (the “Acceleration”). All other terms and conditions of the accelerated options remain unchanged as a result of the Acceleration.
The Board of Directors determined that the Acceleration was in the best interests of the Company and its stockholders because it reduced compensation expense that the Company would otherwise be required to record in future periods when the Company becomes subject to the requirements of Financial Accounting Standards Board (“FASB”) Statement No. 123 “Share-Based Payment (Revised 2004)” (“SFAS 123R”). As a result of the Acceleration and based on estimated Black-Scholes value calculations, the Company expected to not incur pre-tax compensation expense related to the options subject to the Acceleration of approximately $965,000 in fiscal 2006, $885,000 in fiscal 2007, $670,000 in fiscal 2008, $400,000 in fiscal 2009, and $50,000 in fiscal 2010.
The Acceleration met the criteria for variable accounting under FIN No. 44. Based upon past experience, the Company believed that the majority of the holders of the options subject to the Acceleration would remain employed or otherwise affiliated with the Company and/or its affiliates over the full term of the original vesting period. Consequently, under the provisions included in FIN No. 44, the Company recorded in the fourth fiscal quarter ending September 30, 2005, a pre-tax charge to earnings of $76,000, in the form of compensation expense, related to the Acceleration.
The weighted average fair value of all of the options granted during the twelve months ended September 30 have been estimated using the Black-Scholes option-pricing model with the following assumptions:
|
|
|
|
|
|
|
|
|
|
|
|
| 2004 |
| 2005 |
| 2006 |
| |||
|
|
|
|
| ||||||
Dividend yield |
|
| 1.25 | % |
| 1.50 | % |
| 1.52 | % |
Weighted average risk-free interest rate |
|
| 4.21 | % |
| 4.01 | % |
| 4.92 | % |
Weighted average expected volatility |
|
| 40.00 | % |
| 29.00 | % |
| 29.00 | % |
Weighted average expected life in years |
|
| 7.50 |
|
| 5.00 |
|
| 7.50 |
|
21
COASTAL FINANCIAL CORPORATION AND SUBSIDIARIES
Notes to Consolidated Financial Statements – Continued
|
|
(1) | SUMMARY OF SIGNIFICANT ACCOUNTING POLICIES – CONTINUED |
|
|
|
| (p) | Stock Based Compensation - CONTINUED |
Had the compensation cost for the Company’s stock-based compensation plan been determined under the fair value-based method, the Company’s net income and earnings per share would have been adjusted to the pro forma amounts below for the years ended September 30 (Dollars in thousands, except per share data):
|
|
|
|
|
|
|
|
|
|
|
|
| 2004 |
| 2005 |
| 2006 |
| |||
|
|
|
|
| ||||||
|
| (Unaudited) |
| |||||||
Information as reported in the Financial Statements: |
|
|
| |||||||
Net income |
| $ | 14,806 |
| $ | 17,154 |
| $ | 19,001 |
|
|
|
|
|
| ||||||
Basic earnings per share |
| $ | 0.71 |
| $ | 0.81 |
| $ | 0.88 |
|
|
|
|
|
| ||||||
Diluted earnings per share |
| $ | 0.67 |
| $ | 0.76 |
| $ | 0.85 |
|
|
|
|
|
| ||||||
Share-based compensation cost, net of related tax effects |
| $ | (599 | ) | $ | (3,710 | ) | $ | (91 | ) |
|
|
|
|
| ||||||
Information calculated as if fair value method had been applied to all awards: |
|
|
|
|
|
|
|
|
|
|
Net income, as reported |
| $ | 14,806 |
|
| 17,154 |
|
| 19,001 |
|
Add: Stock-based compensation expense recognized during the period, net of related tax effects |
|
| — |
|
| 76 |
|
| 91 |
|
Less: Stock-based compensation expense determined under the fair value-based method, net of related tax effects |
|
| (599 | ) |
| (3,710 | ) |
| (91 | ) |
|
|
|
|
| ||||||
| ||||||||||
Pro forma net income |
| $ | 14,207 |
| $ | 13,520 |
| $ | 19,001 |
|
|
|
|
|
| ||||||
| ||||||||||
Pro forma basic earnings per share |
| $ | 0.68 |
| $ | 0.64 |
| $ | 0.88 |
|
|
|
|
|
| ||||||
Pro forma diluted earnings per share |
| $ | 0.64 |
| $ | 0.60 |
| $ | 0.85 |
|
|
|
|
|
|
A summary of share option activity for the twelve months ended September 30, 2006 follows:
|
|
|
|
|
|
|
|
|
|
|
|
|
|
|
| Number |
| Weighted Average |
| Weighted Average |
| Aggregate |
| ||||
|
|
|
|
|
| ||||||||
Outstanding at September 30, 2005 |
|
| 3,092,770 |
| $ | 7.75 |
|
|
|
|
|
|
|
Granted |
|
| 4,400 |
| $ | 11.95 |
|
|
|
|
|
|
|
Exercised |
|
| (333,942 | ) | $ | 4.97 |
|
|
|
|
|
|
|
Forfeited or expired |
|
| (14,598 | ) | $ | 10.95 |
|
|
|
|
|
|
|
|
|
|
|
|
|
|
|
|
|
|
| ||
|
|
|
|
|
|
|
|
|
|
|
|
|
|
Outstanding at September 30, 2006 |
|
| 2,748,630 |
| $ | 8.07 |
|
| 5.7 |
| $ | 11,578,000 |
|
|
|
|
|
|
|
|
| ||||||
|
|
|
|
|
|
|
|
|
|
|
|
|
|
Exercisable at September 30, 2006 |
|
| 2,687,913 |
| $ | 8.14 |
|
| 5.7 |
| $ | 11,161,000 |
|
|
|
|
|
|
|
|
|
The weighted average grant-date fair value of options granted during the twelve months ended September 30, 2004, 2005 and 2006 was $4.52 per share, $4.11 per share and $4.22 per share, respectively. The total intrinsic value of options exercised during the twelve months ended September 30, 2004, 2005 and 2006 was $2,718,000, $2,206,000 and $2,560,000, respectively.
Subsequent to September 30, 2006, the Company issued approximately 23,000 options to Associates on November 16, 2006 at an exercise price of $13.97 per share.
A summary of the status of the Company’s nonvested options as of September 30, 2006, and changes during the twelve months then ended, is presented below:
|
|
|
|
|
|
|
|
|
| Number |
| Weighted Average |
| ||
|
|
|
| ||||
Nonvested at September 30, 2005 |
|
| 159,928 |
| $ | 2.09 |
|
Granted |
|
| 4,400 |
| $ | 4.22 |
|
Vested |
|
| (102,412 | ) | $ | 1.62 |
|
Forfeited |
|
| (1,199 | ) | $ | 3.65 |
|
|
|
|
|
|
| ||
Nonvested at September 30, 2006 |
|
| 60,717 |
| $ | 2.51 |
|
|
|
|
|
|
|
Fair values have been retroactively restated for all stock dividends since the date the option was granted.
As of September 30, 2006, there was approximately $29,000 of total unrecognized compensation cost related to nonvested share-based compensation arrangements. That cost is expected to be recognized over a weighted average period of approximately three years.
The Company generally issues authorized but previously unissued shares to satisfy option exercises.
22
COASTAL FINANCIAL CORPORATION AND SUBSIDIARIES
Notes to Consolidated Financial Statements — Continued
|
|
1) | SUMMARY OF SIGNIFICANT ACCOUNTING POLICIES – CONTINUED |
|
|
|
| (q) | Comprehensive Income |
SFAS No. 130, “Reporting Comprehensive Income” establishes standards for the reporting and presentation of comprehensive income and its components in a full set of financial statements. Comprehensive income consists of net income and net unrealized gains (losses) on securities and is presented in the statements of stockholders’ equity and comprehensive income.
|
|
|
| (r) | Disclosures Regarding Segments |
The Company reports operating segments in accordance with SFAS No. 131, “Disclosures about Segments of an Enterprise and Related Information” (“SFAS No. 131”). Operating segments are components of an enterprise about which separate financial information is available that is evaluated regularly by the chief operating decision maker in deciding how to allocate resources and assess performance. SFAS No. 131 requires that a public enterprise report a measure of segment profit or loss, certain specific revenue and expense items, segment assets, information about the way that the operating segments were determined and other items. The Company has one reportable operating segment, Coastal Federal Bank.
|
|
|
| (s) | Derivative Instruments and Hedging Activities |
Statement of Financial Accounting Standards No. 133, “Accounting for Derivative Instruments and Hedging Activities” (“SFAS 133”) as amended by SFAS No. 137, 138, and 149 establishes accounting and reporting standards for derivatives and hedging activities. It requires an entity to recognize all derivatives as either assets or liabilities in the balance sheet, and measures those instruments at fair value. Changes in the fair value of those derivatives are reported in current earnings or other comprehensive income depending on the purpose for which the derivative is held and whether the derivative qualifies for hedge accounting. The Company does not currently engage in any activities that qualify for hedge accounting under SFAS 133. Accordingly, changes in fair value of these derivative instruments are included in gain on sales of loans held for sale in the consolidated statements of operations. (See Note 23).
|
|
|
| (t) | Reclassifications |
Certain amounts in the 2004 and 2005 consolidated financial statements have been reclassified to conform to the 2006 presentation. Such reclassifications did not change net income or equity as previously reported.
|
|
(2) | INVESTMENT SECURITIES |
The amortized cost and fair value of investment securities available for sale at September 30, 2005 are summarized as follows:
|
|
|
|
|
|
|
|
|
|
|
|
|
|
|
| 2005 |
| ||||||||||
|
|
| |||||||||||
|
| Amortized |
| Gross |
| Gross |
| Fair |
| ||||
|
|
|
|
|
| ||||||||
|
| (In thousands) |
| ||||||||||
U.S. Government and agency obligations: |
|
|
|
|
|
|
|
|
|
|
|
|
|
Due after five years |
| $ | 3,947 |
|
| — |
|
| (13 | ) |
| 3,934 |
|
State and municipal obligations: |
|
|
|
|
|
|
|
|
|
|
|
|
|
Due after five years |
|
| 21,285 |
|
| 434 |
|
| (37 | ) |
| 21,682 |
|
|
|
|
|
|
| ||||||||
|
| $ | 25,232 |
|
| 434 |
|
| (50 | ) |
| 25,616 |
|
|
|
|
|
|
|
23
COASTAL FINANCIAL CORPORATION AND SUBSIDIARIES
Notes to Consolidated Financial Statements – Continued
|
|
(2) | INVESTMENT SECURITIES – CONTINUED |
The amortized cost and fair value of investment securities available for sale at September 30, 2006 are summarized as follows:
|
|
|
|
|
|
|
|
|
|
|
|
|
|
|
| 2006 |
| ||||||||||
|
|
| |||||||||||
|
|
|
| Gross |
| Gross |
|
|
|
| |||
|
| Amortized |
| Unrealized |
| Unrealized |
| Fair |
| ||||
|
| Cost |
| Gains |
| Losses |
| Value |
| ||||
|
|
|
|
|
| ||||||||
|
| (In thousands) |
| ||||||||||
U.S. Government and agency obligations: |
|
|
|
|
|
|
|
|
|
|
|
|
|
Due after five years |
| $ | 15,489 |
|
| 170 |
|
| (29 | ) |
| 15,630 |
|
State and municipal obligations: |
|
|
|
|
|
|
|
|
|
|
|
|
|
Due after five years |
|
| 23,383 |
|
| 322 |
|
| (35 | ) |
| 23,670 |
|
|
|
|
|
|
| ||||||||
|
| $ | 38,872 |
|
| 492 |
|
| (64 | ) |
| 39,300 |
|
|
|
|
|
|
|
The Company had no gross realized gains and gross realized losses were $100,000 for the year ended September 30, 2004. For the year ended September 30, 2005, gross realized gains were $92,000 and gross realized losses were $26,000. For the year ended September 30, 2006, gross realized gains were $153,000 and gross realized losses were $56,000.
The unrealized losses on investment securities were attributable to increases in interest rates, rather than credit quality. The unrealized losses are comprised of nine securities that have had continuous losses of less than 12 months and seven securities that have had continuous losses 12 months totaling $19,000 and seven securities that have had continuous losses for 12 months or longer totaling $45,000. None of the individual investment securities had an unrealized loss which exceeded 10% of its amortized cost. None of the Company’s securities were considered impaired at September 30, 2006 and substantially all investment securities were rated AAA or higher.
At September 30, 2005 and 2006, investment securities held to maturity due after five years totaled $10.0 million and $12.0 million, respectively.
The Company had one investment security held to maturity with an amortized cost and fair value of $7.8 million that was called by the issuer, which resulted in a gross realized gain of $160,000 in fiscal 2005.
The following table sets forth the final maturities and weighted average yields of the securities available for sale and held to maturity at fair value at September 30, 2006:
|
|
|
|
|
|
|
|
|
|
|
|
|
|
|
|
|
|
|
|
|
|
|
|
|
|
|
| 2006 |
| ||||||||||||||||||||||
|
|
| |||||||||||||||||||||||
|
| One year |
| More than one |
| More than five |
| More than |
| ||||||||||||||||
|
| or less |
| to five years |
| to ten years |
| ten years |
| ||||||||||||||||
|
|
|
|
|
| ||||||||||||||||||||
|
| Fair Value |
| Yield |
| Fair Value |
| Yield |
| Fair Value |
| Yield |
| Fair Value |
| Yield |
| ||||||||
|
|
|
|
|
|
|
|
|
| ||||||||||||||||
|
| (Dollars in thousands) |
| ||||||||||||||||||||||
U.S. Government and agency obligations: |
|
|
|
|
|
|
|
|
|
|
|
|
|
|
|
|
|
|
|
|
|
|
|
|
|
FFCB |
| $ | — |
|
| — | % | $ | — |
|
| — | % | $ | 2,969 |
|
| 5.33 | % | $ | — |
|
| — | % |
FHLB |
|
| — |
|
| — |
|
| — |
|
| — |
|
| 19,503 |
|
| 4.28 |
|
| 5,157 |
|
| 5.30 |
|
State and municipal obligations |
|
| — |
|
| — |
|
| 265 |
|
| 5.55 |
|
| 4,120 |
|
| 4.10 |
|
| 19,286 |
|
| 4.37 |
|
|
|
|
|
|
|
|
|
|
| ||||||||||||||||
Total |
| $ | — |
|
| — | % | $ | 265 |
|
| 5.55 | % | $ | 26,592 |
|
| 4.37 | % | $ | 24,443 |
|
| 4.57 | % |
|
|
|
|
|
|
|
|
|
|
The yield on state and municipal obligations is not computed on a tax-equivalent basis.
|
|
(3) | MORTGAGE-BACKED SECURITIES |
Mortgage–backed securities available for sale at September 30, 2005 consisted of the following:
|
|
|
|
|
|
|
|
|
|
|
|
|
|
|
| 2005 |
| ||||||||||
|
|
| |||||||||||
|
|
|
|
| Gross |
| Gross |
|
|
|
| ||
|
| Amortized |
| Unrealized |
| Unrealized |
| Fair |
| ||||
|
| Cost |
| Gains |
| Losses |
| Value |
| ||||
|
|
|
|
|
| ||||||||
|
| (In thousands) |
| ||||||||||
|
|
|
|
|
|
|
|
|
|
|
|
|
|
Collateralized Mortgage Obligations |
| $ | 84,387 |
|
| 37 |
|
| (1,130 | ) |
| 83,294 |
|
FNMA |
|
| 152,075 |
|
| 1,052 |
|
| (1,346 | ) |
| 151,781 |
|
GNMA |
|
| 45,963 |
|
| 274 |
|
| (416 | ) |
| 45,821 |
|
FHLMC |
|
| 119,399 |
|
| 447 |
|
| (1,087 | ) |
| 118,759 |
|
|
|
|
|
|
| ||||||||
|
| $ | 401,824 |
|
| 1,810 |
|
| (3,979 | ) |
| 399,655 |
|
|
|
|
|
|
|
24
COASTAL FINANCIAL CORPORATION AND SUBSIDIARIES
Notes to Consolidated Financial Statements – Continued
|
|
(3) | MORTGAGE-BACKED SECURITIES – CONTINUED |
Mortgage–backed securities available for sale at September 30, 2006 consisted of the following:
|
|
|
|
|
|
|
|
|
|
|
|
|
|
|
| 2006 |
| ||||||||||
|
|
| |||||||||||
|
|
|
|
| Gross |
| Gross |
|
|
|
| ||
|
| Amortized |
| Unrealized |
| Unrealized |
| Fair |
| ||||
|
| Cost |
| Gains |
| Losses |
| Value |
| ||||
|
|
|
|
|
| ||||||||
|
| (In thousands) |
| ||||||||||
| |||||||||||||
Collateralized Mortgage Obligations |
| $ | 111,827 |
|
| 75 |
|
| (1,869 | ) |
| 110,033 |
|
FNMA |
|
| 133,530 |
|
| 608 |
|
| (2,094 | ) |
| 132,044 |
|
GNMA |
|
| 38,532 |
|
| 153 |
|
| (509 | ) |
| 38,176 |
|
FHLMC |
|
| 114,409 |
|
| 104 |
|
| (1,777 | ) |
| 112,736 |
|
|
|
|
|
|
| ||||||||
|
| $ | 398,298 |
|
| 940 |
|
| (6,249 | ) |
| 392,989 |
|
|
|
|
|
|
|
The Company had gross realized gains of $772,000 and gross realized losses of $1.8 million for the year ended September 30, 2004. For the year ended September 30, 2005, the Company had gross realized gains of $719,000 and gross realized losses of $1.3 million. For the year ended September 30, 2006, the Company had gross realized gains of $102,000 and gross realized losses of $596,000.
Gross unrealized losses on mortgage-backed securities and the length of time the securities have been in a continuous unrealized loss position, at September 30, 2006, were as follows:
|
|
|
|
|
|
|
|
|
|
|
|
|
|
|
|
|
|
|
|
|
| 2006 |
| ||||||||||||||||
|
|
| |||||||||||||||||
|
| Less than 12 Months |
| 12 Months or Longer |
| Total |
| ||||||||||||
|
|
|
|
| |||||||||||||||
|
| Fair |
| Unrealized |
| Fair |
| Unrealized |
| Fair |
| Unrealized |
| ||||||
|
| Value |
| Losses |
| Value |
| Losses |
| Value |
| Losses |
| ||||||
|
|
|
|
|
|
|
| ||||||||||||
|
| (In thousands) |
| ||||||||||||||||
Collateralized Mortgage Obligations |
| $ | 45,525 |
|
| (377 | ) |
| 53,531 |
|
| (1,492 | ) |
| 99,056 |
|
| (1,869 | ) |
FNMA |
|
| 45,174 |
|
| (532 | ) |
| 57,518 |
|
| (1,562 | ) |
| 102,692 |
|
| (2,094 | ) |
GNMA |
|
| 9,582 |
|
| (61 | ) |
| 20,078 |
|
| (448 | ) |
| 29,660 |
|
| (509 | ) |
FHLMC |
|
| 49,593 |
|
| (521 | ) |
| 58,982 |
|
| (1,256 | ) |
| 108,575 |
|
| (1,777 | ) |
|
|
|
|
|
|
|
| ||||||||||||
|
| $ | 149,874 |
|
| (1,491 | ) |
| 190,109 |
|
| (4,758 | ) |
| 339,983 |
|
| (2,649 | ) |
|
|
|
|
|
|
|
|
The unrealized losses on mortgage-backed securities summarized above were attributable to increases in interest rates, rather than credit quality. The unrealized losses are comprised of 54 securities that have had continuous losses of less than 12 months and 67 securities that have had continuous losses 12 months or longer. None of the Company’s securities were considered impaired at September 30, 2006. None of the individual mortgage-backed securities had an unrealized loss which exceeded 10% of it’s amortized costs and all mortgage-backed securities were rated AAA or higher.
Certain mortgage-backed securities are pledged to secure other borrowed money, Federal Home Loan Bank advances and customer deposits in excess of FDIC insurance coverage. The carrying value of the securities pledged at September 30, 2006 was $367.7 million with a fair value of $362.8 million.
The following table sets forth the final contractural maturities and weighted average yields of the mortgage-backed securities at fair value at September 30, 2006:
|
|
|
|
|
|
|
|
|
|
|
|
|
|
|
|
|
|
|
|
|
|
|
|
|
|
|
| 2006 |
| ||||||||||||||||||||||
|
|
| |||||||||||||||||||||||
|
| One year |
| More than one |
| More than five |
| More than |
| ||||||||||||||||
|
| or less |
| to five years |
| to ten years |
| ten years |
| ||||||||||||||||
|
|
|
|
|
| ||||||||||||||||||||
|
| Fair Value |
| Yield |
| Fair Value |
| Yield |
| Fair Value |
| Yield |
| Fair Value |
| Yield |
| ||||||||
|
|
|
|
|
|
|
|
|
| ||||||||||||||||
|
| (Dollars in thousands) |
| ||||||||||||||||||||||
Mortgage-backed securities: |
|
|
|
|
|
|
|
|
|
|
|
|
|
|
|
|
|
|
|
|
|
|
|
|
|
FHLMC |
| $ | — |
|
| — | % | $ | — |
|
| — | % | $ | — |
|
| — | % | $ | 112,736 |
|
| 5.32 | % |
FNMA |
|
| — |
|
| — |
|
| — |
|
| — |
|
| 341 |
|
| 6.00 |
|
| 131,703 |
|
| 5.45 |
|
GNMA |
|
| — |
|
| — |
|
| — |
|
| — |
|
| 42 |
|
| 6.50 |
|
| 38,134 |
|
| 5.63 |
|
Collateralized Mortgage Obligations |
|
| — |
|
| — |
|
| — |
|
| — |
|
| — |
|
| — |
|
| 110,033 |
|
| 5.13 |
|
|
|
|
|
|
|
|
|
|
| ||||||||||||||||
Total |
| $ | — |
|
| — | % | $ | — |
|
| — | % | $ | 383 |
|
| 6.05 | % | $ | 392,606 |
|
| 5.42 | % |
|
|
|
|
|
|
|
|
|
|
25
COASTAL FINANCIAL CORPORATION AND SUBSIDIARIES
Notes to Consolidated Financial Statements – Continued
|
|
(4) | LOANS RECEIVABLE, NET |
Loans receivable, net at September 30 consisted of the following:
|
|
|
|
|
|
|
|
|
| 2005 |
| 2006 |
| ||
|
|
|
| ||||
|
| (In thousands) |
| ||||
Mortgage loans: |
|
|
|
|
|
|
|
Single family to 4 family units |
| $ | 352,893 |
|
| 390,572 |
|
Land and land development |
|
| 121,170 |
|
| 162,538 |
|
Residential lots |
|
| 37,112 |
|
| 39,377 |
|
Other, primarily commercial real estate |
|
| 211,432 |
|
| 236,053 |
|
Residential construction loans |
|
| 127,970 |
|
| 197,345 |
|
Commercial construction loans |
|
| 14,989 |
|
| 6,410 |
|
Consumer and commercial loans: |
|
|
|
|
|
|
|
Installment consumer loans |
|
| 19,115 |
|
| 14,182 |
|
Mobile home loans |
|
| 4,308 |
|
| 5,194 |
|
Savings account loans |
|
| 1,883 |
|
| 2,035 |
|
Equity lines of credit |
|
| 34,019 |
|
| 40,331 |
|
Commercial and other loans |
|
| 38,691 |
|
| 38,656 |
|
|
|
|
| ||||
|
|
| 963,582 |
|
| 1,132,693 |
|
Less: |
|
|
|
|
|
|
|
Allowance for loan losses |
|
| 11,748 |
|
| 12,726 |
|
Deferred loan cost, net |
|
| (771 | ) |
| (246 | ) |
Undisbursed portion of loans in process |
|
| 28,345 |
|
| 31,982 |
|
|
|
|
| ||||
|
| $ | 924,260 |
|
| 1,088,231 |
|
|
|
|
|
The changes in the allowance for loan losses for the years ended September 30 consisted of the following:
|
|
|
|
|
|
|
|
|
|
|
|
| 2004 |
| 2005 |
| 2006 |
| |||
|
|
|
|
| ||||||
|
| (In thousands) |
| |||||||
Beginning allowance |
| $ | 9,832 |
|
| 11,077 |
|
| 11,748 |
|
Provision for loan losses |
|
| 1,750 |
|
| 1,697 |
|
| 1,385 |
|
Loan recoveries |
|
| 249 |
|
| 224 |
|
| 307 |
|
Loan charge-offs |
|
| (754 | ) |
| (1,250 | ) |
| (714 | ) |
|
|
|
|
| ||||||
|
| $ | 11,077 |
|
| 11,748 |
|
| 12,726 |
|
|
|
|
|
|
Nonaccrual loans, which are all loans ninety days or more delinquent, totaled approximately $2.6 million and $3.0 million at September 30, 2005 and 2006, respectively. In fiscal years 2004, 2005 and 2006, interest income which would have been recorded would have been approximately $277,000, $285,000 and $255,000, respectively, had non accruing loans been current in accordance with their original terms.
There were $2.6 million in impaired loans at September 30, 2005. At September 30, 2006, impaired loans totaled $3.5 million. Included in the allowance for loan losses at September 30, 2005 was $434,000 related to impaired loans compared to $235,000 at September 30, 2006. The average recorded investment in impaired loans for the year ended September 30, 2005 was $3.7 million compared to $2.8 million for the year ended September 30, 2006. Interest income recognized on impaired loans in fiscal 2004, 2005 and 2006 was $607,000, $292,000 and $168,000, respectively.
In the normal course of business, to meet the financing needs of its Customers, the Company is a party to financial instruments with off-balance-sheet risk. These financial instruments include commitments to extend credit and stand by letters of credit. These instruments involve, to varying degrees, elements of credit and interest rate risk in excess of the amount recognized in the balance sheet.
The Company’s exposure to credit loss in the event of non-performance by the other party to the financial instrument is represented by the contractual amount of these instruments. The Company uses the same credit policies in making commitments and conditional obligations as it does for on-balance-sheet instruments.
Commitments to extend credit are agreements to lend as long as there is no violation of any condition established in the contract. Commitments generally have fixed expiration dates or other termination clauses and may require payment of a fee. Since many of the commitments may expire without being drawn upon, the total commitment amounts do not necessarily represent future cash requirements. The Company evaluates each Customer’s creditworthiness on a case-by-case basis. The amount of collateral obtained, if deemed necessary by the Company upon extension of credit, is based on management’s credit evaluation.
26
COASTAL FINANCIAL CORPORATION AND SUBSIDIARIES
Notes to Consolidated Financial Statements – Continued
|
|
(4) | LOANS RECEIVABLE, NET – CONTINUED |
Standby letters of credit obligate the Company to meet certain financial obligations of its Customers, if, under the contractual terms of the agreement, the Customers are unable to do so. Payment is only guaranteed under these letters of credit upon the borrower’s failure to perform its obligations to the beneficiary. The Company can seek recovery of the amounts paid from the borrower and the letters of credit are generally collateralized. Commitments under standby letters of credit are usually one year or less. At September 30, 2006, the Company has recorded no liability for the current carrying amount of the obligation to perform as a guarantor, as such amounts are not considered material. The maximum potential amount of undiscounted future payments related to standby letters of credit at September 30, 2006 was $11.4 million.
A summary of loans receivable with undisbursed commitments to extend credit at September 30, 2005 and September 30, 2006 follows (in thousands):
|
|
|
|
|
|
|
|
|
| 2005 |
| 2006 |
| ||
|
|
|
| ||||
Residential mortgage loans in process |
| $ | 28,345 |
|
| 31,982 |
|
Business and consumer credit card lines |
|
| 14,065 |
|
| — |
|
Consumer home equity lines |
|
| 43,388 |
|
| 48,811 |
|
Other consumer lines of credit |
|
| 4,547 |
|
| 6,721 |
|
Standby letters of credit |
|
| 5,777 |
|
| 11,356 |
|
Commercial real estate and construction and land development lines of credit |
|
| 107,731 |
|
| 122,877 |
|
Other commercial lines of credit |
|
| 10,527 |
|
| 12,760 |
|
|
|
|
| ||||
|
| $ | 214,380 |
|
| 234,507 |
|
|
|
|
|
During fiscal 2006, the Bank sold its business and consumer credit card portfolio.
In addition, the Company had commitments to originate $23.3 million in residential loans at September 30, 2006.
Loans serviced for the benefit of others amounted to approximately $250.5 million, $291.9 million and $292.5 million at September 30, 2004, 2005 and 2006, respectively. Loans serviced for others at September 30, 2004 and September 30, 2005 consisted primarily of residential mortgage loans. At September 30, 2006, residential mortgage loans serviced for others was $279.2 million and commercial mortgage loans serviced for others was $13.3 million.
During fiscal 2006, the Company securitized $27.5 million of mortgage loans and concurrently sold these mortgage-backed securities to outside third parties and recognized a net gain on sale of $485,000, which included the recognition of a $418,000 mortgage servicing right asset. During fiscal 2005 the Company securitized $52.6 million of mortgage loans and concurrently sold these mortgage-backed securities to outside third parties and recognized a net gain on sale of $1.0 million, which included the recognition of a $690,000 mortgage servicing right asset. The gain is included in gains on sales of loans held for sale in the consolidated statement of operations. The proceeds from sale are included in proceeds from sales of mortgage-backed securities available for sale in the consolidated statement of cash flows.
As disclosed in Note 9, certain mortgage loans are pledged to secure advances from the Federal Home Loan Bank (“FHLB”) of Atlanta.
The Bank offers mortgage and consumer loans to its directors, and Associates for the financing of their personal residences and for other personal purposes. The Bank also offers commercial loans to companies affiliated with directors. These loans are made in the ordinary course of business and, in management’s opinion, are made on substantially the same terms, including interest rates and collateral, prevailing at the time for comparable transactions with other persons and companies. Management does not believe these loans involve more than the normal risk of collectibility or present other unfavorable features. At September 30, 2006, such loans were current with respect to their payment terms.
The following is a summary of the activity of loans outstanding to certain executive officers, directors and their affiliates for the year ended September 30, 2006 (in thousands):
|
|
|
|
|
Balance at September 30, 2005 |
| $ | 833 |
|
New loans |
|
| 3 |
|
Repayments |
|
| (282 | ) |
|
|
| ||
Balance at September 30, 2006 |
| $ | 554 |
|
|
|
|
27
COASTAL FINANCIAL CORPORATION AND SUBSIDIARIES
Notes to Consolidated Financial Statements – Continued
|
|
(5) | MORTGAGE SERVICING RIGHTS |
Mortgage servicing rights, net of the valuation allowance, are included in other assets and totaled $3.2 million and $3.1 million at September 30, 2005 and 2006, respectively. Amortization expense for MSRs, included in interest on loans receivable, totaled $1.0 million, $1.1 million and $807,000 for the years ended September 30, 2004, 2005 and 2006, respectively. The estimated amortization expense for MSRs held as of September 30, 2006, is $728,000, $716,000, $666,000, $596,000 and $350,000 for fiscal 2007, 2008, 2009, 2010 and 2011 respectively. The estimated amortization expense is based on current information regarding loan payments and prepayments. Amortization expense could change in future periods based on changes in the volume of prepayments and various economic factors.
At September 30, 2005, the valuation allowance for MSRs totaled $5,000. There was no MSR valuation allowance at September 30, 2006. In 2005 and 2006, the Company recorded $294,000 and $5,000 for impairment recoveries, respectively. MSR impairment recovery is included in other expense.
|
|
|
|
|
|
|
|
|
| 2005 |
| 2006 |
| ||
|
|
|
| ||||
|
| (In thousands) |
| ||||
Balance at beginning of year |
| $ | 3,005 |
|
| 3,187 |
|
MSRs capitalized |
|
| 941 |
|
| 671 |
|
MSRs amortized |
|
| (1,053 | ) |
| (807 | ) |
Recovery of impairment |
|
| 294 |
|
| 5 |
|
|
|
|
| ||||
Balance at end of year |
| $ | 3,187 |
|
| 3,056 |
|
|
|
|
|
|
|
(6) | OFFICE PROPERTY AND EQUIPMENT, NET |
Office property and equipment, net at September 30 consisted of the following:
|
|
|
|
|
|
|
|
|
| 2005 |
| 2006 |
| ||
|
|
|
| ||||
|
| (In thousands) |
| ||||
Land |
| $ | 7,530 |
|
| 8,354 |
|
Building and improvements |
|
| 15,493 |
|
| 20,728 |
|
Furniture, fixtures and equipment |
|
| 20,510 |
|
| 24,428 |
|
|
|
|
| ||||
|
|
| 43,533 |
|
| 53,510 |
|
Less accumulated depreciation |
|
| (20,775 | ) |
| (23,584 | ) |
|
|
|
| ||||
|
| $ | 22,758 |
|
| 29,926 |
|
|
|
|
|
The Company has eight leases for office space and two land leases under noncancelable operating leases with initial terms that expire over the next one to thirty years. Seven of these leases contain renewal options for periods ranging from one to thirty years and require the Company to pay all executory costs such as property taxes, utilities and insurance. Rental payments are based on contractual amounts as set forth in the lease agreements and do not include contingent rentals. All rental payments, including escalating rents, are recognized as rental expense on a straight-line basis over the term of the lease. The rent expense for the years ended September 30, 2004, 2005, and 2006 was approximately $285,000, $307,000 and $721,000, respectively.
Future minimum rental payments for operating leases having remaining noncancelable lease terms in excess of one year at September 30, 2006 are as follows (in thousands):
|
|
|
|
|
2007 |
| $ | 478 |
|
2008 |
|
| 362 |
|
2009 |
|
| 274 |
|
2010 |
|
| 250 |
|
2011 |
|
| 183 |
|
Thereafter |
|
| 3,105 |
|
|
|
| ||
|
| $ | 4,652 |
|
|
|
|
|
|
(7) | INVESTMENT REQUIRED BY LAW |
The Bank, as a member of the FHLB of Atlanta, is required to acquire and hold shares of capital stock in the FHLB of Atlanta in an amount equal to the greater of (i) $500 (ii) 1.0% of the aggregate outstanding principal amount of home mortgage loans, home purchase contracts and similar obligations at the end of each calendar year, or (iii) 5% of its advances (borrowings) from the FHLB of Atlanta at the end of each calendar year. The Bank is in compliance with this requirement with an investment in FHLB stock of $20.3 million, carried at cost, at September 30, 2006. No ready market exists for this stock and it has no quoted market value. However, redemption of this stock has historically been at par value.
28
COASTAL FINANCIAL CORPORATION AND SUBSIDIARIES
Notes to Consolidated Financial Statements – Continued
|
|
(8) | DEPOSITS |
|
|
| Deposits at September 30 consisted of the following: |
|
|
|
|
|
|
|
|
|
|
|
|
|
|
|
| 2005 |
| 2006 |
| ||||||||
|
|
|
| ||||||||||
|
| Amount |
| Weighted |
| Amount |
| Weighted |
| ||||
|
|
|
|
|
| ||||||||
|
| (Dollars in thousands) |
| ||||||||||
Transaction accounts: |
|
|
|
|
|
|
|
|
|
|
|
|
|
Noninterest bearing |
| $ | 219,080 |
|
| —% |
| $ | 231,081 |
|
| —% |
|
NOW |
|
| 139,810 |
|
| 0.52 |
|
| 126,373 |
|
| 0.54 |
|
Money market checking |
|
| 213,078 |
|
| 2.26 |
|
| 198,500 |
|
| 3.44 |
|
|
|
|
|
|
|
|
|
|
| ||||
Total transaction accounts |
|
| 571,968 |
|
| 0.97 |
|
| 555,954 |
|
| 1.35 |
|
|
|
|
|
|
|
|
|
|
| ||||
|
|
|
|
|
|
|
|
|
|
|
|
|
|
Statement savings accounts: |
|
|
|
|
|
|
|
|
|
|
|
|
|
Regular |
|
| 71,119 |
|
| 1.47 |
|
| 75,790 |
|
| 2.37 |
|
Money market |
|
| 705 |
|
| 1.24 |
|
| 473 |
|
| 1.87 |
|
|
|
|
|
|
|
|
|
|
| ||||
Total statement savings accounts |
|
| 71,824 |
|
| 1.47 |
|
| 76,263 |
|
| 2.37 |
|
|
|
|
|
|
|
|
|
|
| ||||
Certificate accounts: |
|
|
|
|
|
|
|
|
|
|
|
|
|
0.00-1.99% |
|
| 15,660 |
|
|
|
|
| 247 |
|
|
|
|
2.00-3.99% |
|
| 381,253 |
|
|
|
|
| 44,235 |
|
|
|
|
4.00-5.99% |
|
| 29,545 |
|
|
|
|
| 385,564 |
|
|
|
|
6.00-7.99% |
|
| 8 |
|
|
|
|
| 122 |
|
|
|
|
8.00-10.00% |
|
| 660 |
|
|
|
|
| 720 |
|
|
|
|
|
|
|
|
|
|
|
|
|
| ||||
Total certificate accounts |
|
| 427,126 |
|
| 3.39 |
|
| 430,888 |
|
| 4.83 |
|
|
|
|
|
|
|
|
|
|
| ||||
|
| $ | 1,070,918 |
|
| 1.97% |
| $ | 1,063,105 |
|
| 2.83% |
|
|
|
|
|
|
|
|
|
|
|
The aggregate amount of all deposit accounts with a minimum denomination of $100,000 or more was $637.9 million and $633.6 million at September 30, 2005 and 2006, respectively.
The amounts and scheduled maturities of certificate accounts at September 30, are as follows:
|
|
|
|
|
|
|
|
|
| 2005 |
| 2006 |
| ||
|
|
|
| ||||
|
| (In thousands) |
| ||||
Within 1 year |
| $ | 392,731 |
|
| 389,272 |
|
After 1 but within 2 years |
|
| 22,666 |
|
| 33,154 |
|
After 2 but within 3 years |
|
| 8,555 |
|
| 4,000 |
|
Thereafter |
|
| 3,174 |
|
| 4,462 |
|
|
|
|
| ||||
|
| $ | 427,126 |
|
| 430,888 |
|
|
|
|
|
Included in certificate accounts (“CDs”) are $153.3 million of brokered CDs at September 30, 2006. There were $169.9 million of brokered CDs at September 30, 2005. The average rate and remaining term of brokered CDs at September 30, 2006 was 5.16% and approximately five months, respectively.
Interest expense on deposits for the years ended September 30 consisted of the following:
|
|
|
|
|
|
|
|
|
|
|
|
| 2004 |
| 2005 |
| 2006 |
| |||
|
|
|
|
| ||||||
|
| (In thousands) |
| |||||||
Transaction accounts |
| $ | 3,331 |
|
| 4,457 |
|
| 7,058 |
|
Passbook accounts |
|
| 405 |
|
| 663 |
|
| 1,496 |
|
Certificate accounts |
|
| 6,288 |
|
| 8,959 |
|
| 18,189 |
|
|
|
|
|
| ||||||
|
| $ | 10,024 |
|
| 14,079 |
|
| 26,743 |
|
|
|
|
|
|
29
COASTAL FINANCIAL CORPORATION AND SUBSIDIARIES
Notes to Consolidated Financial Statements – Continued
|
|
(9) | ADVANCES FROM FHLB |
|
|
| Maturities for advances from the FHLB by fiscal year at September 30 consisted of the following: |
|
|
|
|
|
|
|
|
|
|
|
|
|
|
|
| 2005 |
| 2006 |
| ||||||||
|
|
|
| ||||||||||
|
| Amount |
| Weighted |
| Amount |
| Weighted |
| ||||
|
|
|
|
|
| ||||||||
|
| (Dollars in thousands) |
| ||||||||||
Fiscal Year Maturity |
|
|
|
|
|
|
|
|
|
|
|
|
|
Year 1 |
| $ | 4,177 |
|
| 2.79% |
| $ | 11,810 |
|
| 4.77% |
|
Year 2 |
|
| 3,560 |
|
| 2.83 |
|
| 3,977 |
|
| 3.18 |
|
Year 3 |
|
| 3,977 |
|
| 3.18 |
|
| 16,803 |
|
| 4.60 |
|
Year 4 |
|
| 31,803 |
|
| 2.36 |
|
| 73,651 |
|
| 5.58 |
|
Year 5 |
|
| 63,651 |
|
| 5.74 |
|
| 40,440 |
|
| 5.36 |
|
After Year 5 |
|
| 181,839 |
|
| 3.64 |
|
| 233,899 |
|
| 3.89 |
|
|
|
|
|
|
|
|
|
|
| ||||
|
| $ | 289,007 |
|
| 3.93% |
| $ | 380,580 |
|
| 4.43% |
|
|
|
|
|
|
|
|
|
|
|
Stock in the FHLB of Atlanta and specific first mortgage loans and mortgage-backed securities of approximately $378.3 million and $470.2 million at September 30, 2005 and 2006, respectively, are pledged as collateral for these advances. The Bank has adopted the policy of pledging excess collateral to facilitate future advances. At September 30, 2006, the excess first mortgage loan and mortgage-backed securities collateral pledged to the FHLB will support additional borrowings of approximately $69.3 million. At September 30, 2006, included in the one, two, three, and five year maturities were $228.0 million with a weighted average rate of 3.98% of advances subject to call provisions. Callable advances at September 30, 2006 are summarized as follows: $91.0 million callable in fiscal 2007, with a weighted average rate of 4.05%; $37.0 million callable in fiscal 2008, with a weighted average rate of 2.98%; $75.0 million callable in fiscal 2009, with a weighted average rate of 4.11%; and $25.0 million callable in fiscal 2011, with a weighted average rate of 4.89%. Call provisions are more likely to be exercised by the FHLB when interest rates rise. If exercised, the Company may have to replace called advances with borrowings at a higher interest rate.
During fiscal 2004, the Company prepaid approximately $4.6 million of advances from FHLB and incurred gross penalties of approximately $77,000. During fiscal 2005 and 2006, the Company did not prepay any FHLB advances.
|
|
(10) | REPURCHASE AGREEMENTS |
The following tables set forth certain information regarding repurchase agreements by the Bank at the end of and during the periods indicated:
|
|
|
|
|
|
|
|
|
|
|
|
| At September 30, |
| |||||||
|
|
| ||||||||
|
| 2004 |
| 2005 |
| 2006 |
| |||
|
|
|
|
| ||||||
|
| (Dollars in thousands) |
| |||||||
Outstanding balance: |
|
|
|
|
|
|
|
|
|
|
Securities sold under agreements to repurchase: |
|
|
|
|
|
|
|
|
|
|
Customer |
| $ | 12,931 |
| $ | 31,937 |
| $ | 42,095 |
|
Broker |
|
| 94,242 |
|
| 10,000 |
|
| 30,000 |
|
|
|
|
|
|
|
|
|
|
|
|
Weighted average rate (at month end) paid on: |
|
|
|
|
|
|
|
|
|
|
Securities sold under agreements to repurchase: |
|
|
|
|
|
|
|
|
|
|
Customer |
|
| 1.42 | % |
| 2.82 | % |
| 3.79 | % |
Broker |
|
| 1.74 |
|
| 2.39 |
|
| 4.44 |
|
|
|
|
|
|
|
|
|
|
|
|
Maximum amount of borrowings outstanding at any month end: |
|
|
|
|
|
|
|
|
|
|
Securities sold under agreements to repurchase: |
|
|
|
|
|
|
|
|
|
|
Customer |
| $ | 12,931 |
| $ | 39,317 |
| $ | 76,706 |
|
Broker |
|
| 184,129 |
|
| 109,958 |
|
| 30,000 |
|
|
|
|
|
|
|
|
|
|
|
|
Approximate average outstanding with respect to: |
|
|
|
|
|
|
|
|
|
|
Securities sold under agreements to repurchase: |
|
|
|
|
|
|
|
|
|
|
Customer |
| $ | 9,033 |
| $ | 27,498 |
| $ | 42,754 |
|
Broker |
|
| 134,809 |
|
| 73,723 |
|
| 19,632 |
|
|
|
|
|
|
|
|
|
|
|
|
Weighted average rate (year to date) paid on: |
|
|
|
|
|
|
|
|
|
|
Securities sold under agreements to repurchase: |
|
|
|
|
|
|
|
|
|
|
Customer |
|
| 1.01 | % |
| 2.43 | % |
| 3.76 | % |
Broker |
|
| 1.50 |
|
| 2.37 |
|
| 3.70 |
|
The Company has three securities sold under agreements to repurchase with $10 million maturing in approximately one month and $20 million maturing in ten years. These reverse repurchase agreements are collateralized by securities of the United States government or its agencies, which have been delivered to a third party custodian for safekeeping. Assets pledged to collateralize
30
COASTAL FINANCIAL CORPORATION AND SUBSIDIARIES
Notes to Consolidated Financial Statements – Continued
|
|
(10) | REPURCHASE AGREEMENTS - CONTINUED |
securities sold under agreements to repurchase had a fair value of $32.8 million at September 30, 2006 and are included in mortgage-backed securities available for sale in the consolidated statement of condition.
At September 30, 2006, two of these reverse repurchase agreements contain one time call provisions as follows: $10 million callable September 6, 2007 with a rate of 3.57% and $10 million callable on November 22, 2010 with a rate of 4.42%
|
|
(11) | JUNIOR SUBORDINATED DEBT |
The Company determines whether it has a controlling financial interest in an entity by first evaluating whether the entity is a voting interest entity or a variable interest entity under accounting principles generally accepted in the United States of America. Voting interest entities are entities in which the total equity investment at risk is sufficient to enable each entity to finance itself independently and provides the equity holders with the obligation to absorb losses, the right to receive residual returns and the right to make decisions about the entity’s activities. The Company consolidates voting interest entities in which it has all, or at least a majority of, the voting interest. As defined in applicable accounting standards, variable interest entities (“VIEs”) are entities that lack one or more of the characteristics of a voting interest entity described above. A controlling financial interest in an entity is present when an enterprise has a variable interest or a combination of variable interests that will absorb a majority of the entity’s expected losses, receive a majority of the entity’s expected residual returns, or both. The enterprise with a controlling financial interest, known as the primary beneficiary, consolidates the VIE.
Prior to January 1, 2005, the Company consolidated its wholly-owned subsidiary, Coastal Financial Capital Trust I (“Trust”). In December 2003, the Financial Accounting Standards Board issued a revised version of Interpretation No. 46 (“FIN 46”) “Consolidation of Variable Interest Entities.” The revised FIN 46 clarifies some of the provisions of the original interpretation and adds new scope exceptions. As a result of the changes, the Company deconsolidated the Trust, increasing other assets by $464,000, increasing junior subordinated debt-trust preferred securities by $15.5 million and reducing debt associated with trust preferred securities (“Capital Securities”) by $15.0 million.
The junior subordinated debentures are unsecured obligations of the Company and are subordinate and junior in right of payment to all present and future senior indebtedness of the Company. The Company has entered into a guarantee, which together with its obligations under the junior subordinated debentures and the declaration of trust governing the Trust, provides a full and unconditional guarantee of the Capital Securities.
The Capital Securities accrue and pay distributions at a rate per annum equal to 90-day LIBOR plus 305 basis points. At September 30, 2006, the distribution rate on the Capital Securities was 8.55%. The distributions payable on the Capital Securities are cumulative and payable quarterly in arrears. The Capital Securities interest payments for fiscal 2004, 2005 and 2006 were $662,000, $892,000 and $1.2 million, respectively, and are included in interest expense on other borrowings. The Company has the right, subject to events of default, to defer payments of interest on the Capital Securities for a period not to exceed 20 consecutive quarters. The Company has no current intention to exercise its right to defer payment of interest on the Capital Securities.
The Capital Securities are mandatorily redeemable upon maturity on July 3, 2033. The Company has the right to redeem the Capital Securities in whole or in part, on or after July 3, 2008. If the Capital Securities are redeemed on or after July 3, 2008, the redemption price will be 100% of the principal amount plus accrued and unpaid interest. In addition, the Company may redeem the Capital Securities in whole (but not in part) at any time within 90 days following the occurrence of a tax event, an investment company event, or a capital treatment event at a special redemption price (as defined in the indenture).
|
|
(12) | INCOME TAXES |
Income tax expense (benefit) for the years ended September 30 consisted of the following:
|
|
|
|
|
|
|
|
|
|
|
|
| Current |
| Deferred |
| Total |
| |||
|
|
|
|
| ||||||
|
| (In thousands) |
| |||||||
2004: |
|
|
|
|
|
|
|
|
|
|
Federal |
| $ | 7,070 |
|
| 126 |
|
| 7,196 |
|
State |
|
| 433 |
|
| (2 | ) |
| 431 |
|
|
|
|
|
| ||||||
|
| $ | 7,503 |
|
| 124 |
|
| 7,627 |
|
|
|
|
|
| ||||||
2005: |
|
|
|
|
|
|
|
|
|
|
Federal |
| $ | 7,739 |
|
| 582 |
|
| 8,321 |
|
State |
|
| 614 |
|
| 47 |
|
| 661 |
|
|
|
|
|
| ||||||
|
| $ | 8,353 |
|
| 629 |
|
| 8,982 |
|
|
|
|
|
| ||||||
2006: |
|
|
|
|
|
|
|
|
|
|
Federal |
| $ | 9,501 |
|
| (202 | ) |
| 9,299 |
|
State |
|
| 979 |
|
| (77 | ) |
| 902 |
|
|
|
|
|
| ||||||
|
| $ | 10,480 |
|
| (279 | ) |
| 10,201 |
|
|
|
|
|
|
31
COASTAL FINANCIAL CORPORATION AND SUBSIDIARIES
Notes to Consolidated Financial Statements – Continued
|
|
(12) | INCOME TAXES - CONTINUED |
The tax effect of the Company’s temporary differences between the financial statement carrying amounts and tax basis of assets and liabilities that give rise to the net deferred tax asset (liability) at September 30, 2005 and 2006 relate to the following:
|
|
|
|
|
|
|
|
|
| 2005 |
| 2006 |
| ||
|
|
|
| ||||
|
| (In thousands) |
| ||||
Deferred tax assets: |
|
|
|
|
|
|
|
Allowance for loan losses |
| $ | 4,406 |
|
| 4,823 |
|
Accrued medical reserves |
|
| 85 |
|
| 80 |
|
Other real estate reserves and deferred gains on other real estate |
|
| 20 |
|
| 24 |
|
Net operating loss carryforwards |
|
| 81 |
|
| 137 |
|
Unrealized loss on securities available for sale |
|
| 679 |
|
| 1,855 |
|
Other |
|
| 282 |
|
| 385 |
|
|
|
|
| ||||
|
|
|
|
|
|
|
|
Total deferred tax assets |
|
| 5,553 |
|
| 7,304 |
|
Less valuation allowance |
|
| (81 | ) |
| (137 | ) |
|
|
|
| ||||
Net deferred tax assets |
|
| 5,472 |
|
| 7,167 |
|
|
|
|
| ||||
|
|
|
|
|
|
|
|
Deferred tax liabilities: |
|
|
|
|
|
|
|
Property and equipment principally due to differences in depreciation |
|
| 398 |
|
| 185 |
|
Deferred loan fees |
|
| 885 |
|
| 911 |
|
Book over tax basis in investment in unconsolidated subsidiary |
|
| 5,053 |
|
| 5,425 |
|
Mortgage servicing rights |
|
| 1,221 |
|
| 1,183 |
|
Other |
|
| 417 |
|
| 510 |
|
|
|
|
| ||||
|
|
|
|
|
|
|
|
Total deferred tax liabilities |
|
| 7,974 |
|
| 8,214 |
|
|
|
|
| ||||
|
|
|
|
|
|
|
|
Net deferred tax liability |
| $ | (2,502 | ) |
| (1,047 | ) |
|
|
|
|
The Company has a Real Estate Investment Trust (REIT) that acquires, holds and manages real estate loans. The REIT is consolidated with the Bank and is, therefore, included in the consolidated financial statements of the Company. The REIT must meet specific provisions of the Internal Revenue Code and state tax laws. If the REIT fails to meet any of the required provisions of federal and state tax laws, the Company’s tax expense could increase.
The valuation allowance for deferred tax assets was $81,000 and $137,000 at September 30, 2005 and 2006, respectively. The net change in the total valuation allowance for the years ended September 30, 2005 and 2006 was an increase of $43,000 and $56,000, respectively. In assessing the realizability of deferred tax assets, management considers whether it is more likely than not that some portion or all of the deferred tax assets will not be realized. The ultimate realization of deferred tax assets is dependent upon the generation of future taxable income during the periods in which those temporary differences become deductible. Management considers the scheduled reversal of deferred tax liabilities, projected future taxable income, and tax planning strategies in making this assessment. In order to fully realize the deferred tax asset, the company will need to generate future taxable income prior to the expiration of the deferred tax assets governed by the tax code. Based upon the level of historical taxable income and projections for future taxable income over the periods, which the deferred tax assets are deductible, management believes it more likely than not the Company will realize the benefits of these deductible differences, net of the existing valuation allowances at September 30, 2006. The amount of the deferred tax asset considered realizable, however, could be reduced in the near term if estimates of future taxable income during the carryforward period are reduced.
The net deferred tax asset (liability) is included in other liabilities in the consolidated financial statements. The valuation allowance relates to the state loss carryforwards which may not be ultimately realized to reduce taxes of the Company. A portion of the change in the net deferred tax liability relates to unrealized gains and losses on securities available for sale. A current period deferred tax benefit of $1.2 million unrealized loss on securities available for sale has been recorded directly to stockholders’ equity. The balance of the change in the deferred tax liability results from the current period deferred tax expense of $279,000.
Income taxes of the Company attributable to income before income taxes differ from the amounts computed by applying the Federal income tax rate of 35% for the years ended September 30 to earnings before income taxes as follows:
|
|
|
|
|
|
|
|
|
|
|
|
| 2004 |
| 2005 |
| 2006 |
| |||
|
|
|
|
| ||||||
|
| (In thousands) |
| |||||||
Computed federal income taxes |
| $ | 7,852 |
|
| 9,148 |
|
| 10,221 |
|
State tax, net of federal benefit |
|
| 280 |
|
| 430 |
|
| 586 |
|
Bank-owned life insurance |
|
| (337 | ) |
| (332 | ) |
| (338 | ) |
Tax exempt securities net |
|
| (220 | ) |
| (275 | ) |
| (230 | ) |
Other, net |
|
| 52 |
|
| 11 |
|
| (38 | ) |
|
|
|
|
| ||||||
Total income tax expense |
| $ | 7,627 |
|
| 8,982 |
|
| 10,201 |
|
|
|
|
|
|
32
COASTAL FINANCIAL CORPORATION AND SUBSIDIARIES
Notes to Consolidated Financial Statements – Continued
|
|
(12) | INCOME TAXES - CONTINUED |
The Bank had been permitted under the Internal Revenue Code to deduct an annual addition to the tax reserve for bad debts in determining taxable income, subject to certain limitations. This addition may differ significantly from the bad debt expense for financial reporting purposes and was based on either 8% of taxable income (the “Percentage of Taxable Income Method”) or actual loan loss experience (the “Experience Method”) for the years prior to 1997. As a result of tax legislation, the Bank recaptured tax bad debt reserves in excess of pre-1988 based year amounts over a six-year period ended September 30, 2004.
Retained earnings at September 30, 2006 includes approximately $5.2 million representing pre-1988 tax bad debt base year reserve amounts for which no deferred income tax liability has been provided since these reserves are not expected to reverse until indefinite future periods and may never reverse. Circumstances that would require an accrual of a portion or all of this unrecorded tax liability are a reduction in qualifying loan levels relative to the end of 1987, failure to meet the tax definition of a savings bank, dividend payments in excess of current year or accumulated tax earnings and profits, or other distributions in dissolution, liquidation or redemption of the Bank’s stock.
|
|
(13) | BENEFIT PLAN |
The Company has a defined contribution plan covering substantially all Associates. The Company matches Associate contributions based upon the Company meeting certain return on equity operating results. Matching contribution expense was approximately $684,000, $435,000 and $474,000 for fiscal years 2004, 2005 and 2006, respectively.
|
|
(14) | REGULATORY MATTERS |
The Bank is subject to various capital requirements administered by federal banking agencies. Failure to meet minimum capital requirements can initiate mandatory and possibly additional discretionary actions by regulators that, if undertaken, could have a direct material adverse effect on the Company’s financial statements. Under capital adequacy guidelines and the regulatory framework for prompt corrective action, the Bank must meet specific capital guidelines that involve quantitative measures of the assets, liabilities and certain off-balance sheet items as calculated under regulatory accounting practices. The Bank’s capital amounts and classifications are also subject to qualitative judgments by the regulators about components, risk-weighting and other factors. Quantitative measures established by regulation to ensure capital adequacy require the Bank to maintain minimum amounts and ratios (set forth in the following table) of total and tier 1 capital (as defined in the regulation) to risk-weighted assets (as defined) and to average assets (as defined). At September 30, 2006, the Bank’s loans-to-one borrower limit was approximately $21.1 million. Management believes, as of September 30, 2006, that the Bank met all capital adequacy requirements and loans-to-one-borrower limits.
As of September 30, 2006, the most recent notification from federal banking agencies categorized the Bank as “well capitalized” under the regulatory framework. To be categorized as “well capitalized,” the Bank must maintain minimum total risk-based capital, tier 1 capital, and tier 1 leverage ratios as set forth in the table. Since September 30, 2006, there have been no events or conditions that management believes have changed the Bank’s categories. (Dollars in thousands)
|
|
|
|
|
|
|
|
|
|
|
|
|
|
|
|
|
|
|
|
|
| Actual |
| For Capital |
| Amount to be |
| ||||||||||||
|
|
|
|
| |||||||||||||||
|
| Amount |
| Ratio |
| Amount |
| Ratio |
| Amount |
| Ratio |
| ||||||
|
|
|
|
|
|
|
| ||||||||||||
As of September 30, 2005: |
|
|
|
|
|
|
|
|
|
|
|
|
|
|
|
|
|
|
|
Total Capital: |
| $ | 122,693 |
|
| 13.29 | % | $ | 73,877 |
|
| 8.00 | % | $ | 92,347 |
|
| 10.00 | % |
(To Risk Weighted Assets) |
|
|
|
|
|
|
|
|
|
|
|
|
|
|
|
|
|
|
|
Tier 1 Capital: |
| $ | 112,055 |
|
| 12.13 | % |
| N/A |
|
| N/A |
| $ | 55,408 |
|
| 6.00 | % |
(To Risk Weighted Assets) |
|
|
|
|
|
|
|
|
|
|
|
|
|
|
|
|
|
|
|
Tier 1 Capital: |
| $ | 112,055 |
|
| 7.25 | % | $ | 46,356 |
|
| 3.00 | % | $ | 77,260 |
|
| 5.00 | % |
(To Adjusted Total Assets) |
|
|
|
|
|
|
|
|
|
|
|
|
|
|
|
|
|
|
|
Tangible Capital: |
| $ | 112,055 |
|
| 7.25 | % | $ | 23,178 |
|
| 1.50 | % |
| N/A |
|
| N/A |
|
(To Adjusted Total Assets) |
|
|
|
|
|
|
|
|
|
|
|
|
|
|
|
|
|
|
|
|
|
|
|
|
|
|
|
|
|
|
|
|
|
|
|
|
|
|
|
As of September 30, 2006: |
|
|
|
|
|
|
|
|
|
|
|
|
|
|
|
|
|
|
|
Total Capital: |
| $ | 140,946 |
|
| 14.34 | % | $ | 78,638 |
|
| 8.00 | % | $ | 98,298 |
|
| 10.00 | % |
(To Risk Weighted Assets) |
|
|
|
|
|
|
|
|
|
|
|
|
|
|
|
|
|
|
|
Tier 1 Capital: |
| $ | 129,643 |
|
| 13.19 | % |
| N/A |
|
| N/A |
| $ | 58,979 |
|
| 6.00 | % |
(To Risk Weighted Assets) |
|
|
|
|
|
|
|
|
|
|
|
|
|
|
|
|
|
|
|
Tier 1 Capital: |
| $ | 129,643 |
|
| 7.78 | % | $ | 49,891 |
|
| 3.00 | % | $ | 83,151 |
|
| 5.00 | % |
(To Adjusted Total Assets) |
|
|
|
|
|
|
|
|
|
|
|
|
|
|
|
|
|
|
|
Tangible Capital: |
| $ | 129,643 |
|
| 7.78 | % | $ | 24,945 |
|
| 1.50 | % |
| N/A |
|
| N/A |
|
(To Adjusted Total Assets) |
|
|
|
|
|
|
|
|
|
|
|
|
|
|
|
|
|
|
|
33
COASTAL FINANCIAL CORPORATION AND SUBSIDIARIES
Notes to Consolidated Financial Statements – Continued
|
|
(15) | LIQUIDATION ACCOUNT |
In conjunction with the Bank’s conversion to stock form on October 4, 1990, the Bank established, as required by Office of Thrift Supervision (the “OTS”) regulations, a liquidation account and maintains this account for the benefit of the remaining eligible account holders as defined under the Bank’s plan of conversion. The initial balance of this liquidation account was equal to the Bank’s net worth defined by OTS regulations as of the date of the latest statement of financial condition contained in the final offering circular. In the event of a complete liquidation of the Bank (and only in such event) each eligible holder shall be entitled to receive a liquidation distribution from this account in the amount of the then current adjusted balance for deposits then held, before any liquidation distribution may be made to the stockholders. The Bank is prohibited from declaring cash dividends or repurchasing its capital stock if it would cause a reduction in the Bank’s net worth below either the balance of the liquidation account or the statutory net worth requirements set by the OTS.
The Company’s ability to pay dividends depends primarily on the Bank’s ability to pay dividends to the Company. The Bank is prohibited from declaring cash dividends on its common stock or repurchasing its common stock if the effect thereof would cause its net worth to be reduced below either the amount required for the liquidation account or the minimum regulatory capital requirement. In addition, the Bank is also prohibited from declaring cash dividends and repurchasing its own stock without prior regulatory approval if the total amount of all dividends and stock repurchases (including any proposed dividends and stock repurchases) for the applicable year exceeds its current year’s net income plus its retained net income for the preceding two years.
|
|
(16) | EARNINGS PER SHARE |
Basic earnings per share are computed by dividing net income by the weighted-average number of common shares outstanding. Diluted earnings per share are computed by dividing net income by the weighted average number of common shares and potential common shares outstanding. Potential common shares consist of dilutive stock options determined using the treasury stock method and the average market price of common stock. All share and per share data have been retroactively restated for all common stock dividends. At September 30, 2006 the Company had antidilutive securities of approximately 245,000 options to purchase shares by Directors and Associates. The average exercise price for such shares was $13.86 per share.
The following is a summary of the reconciliation of average shares outstanding for the years ended September 30:
|
|
|
|
|
|
|
|
|
|
|
|
|
|
|
| 2004 |
| 2005 |
| 2006 |
| ||||||
|
|
|
|
| |||||||||
|
| Basic |
| Diluted |
| Basic |
| Diluted |
| Basic |
| Diluted |
|
|
|
|
|
|
|
|
| ||||||
Weighted average shares outstanding |
| 20,966,000 |
| 20,966,000 |
| 21,274,000 |
| 21,274,000 |
| 21,509,000 |
| 21,509,000 |
|
Effect of dilutive securities – Stock options |
| — |
| 1,162,000 |
| — |
| 1,191,000 |
| — |
| 897,000 |
|
|
|
|
|
|
|
|
| ||||||
Average shares outstanding |
| 20,966,000 |
| 22,128,000 |
| 21,274,000 |
| 22,465,000 |
| 21,509,000 |
| 22,406,000 |
|
|
|
|
|
|
|
|
|
|
|
(17) | STOCK OPTION PLAN |
At September 30, 2006, the Company had the following options outstanding:
|
|
|
|
|
|
|
|
|
|
|
|
|
|
|
|
|
|
|
Fiscal |
| Range of exercise prices: |
| Number |
| Weighted |
| Weighted |
| Number |
| Weighted |
| |||||
|
|
|
|
|
|
| ||||||||||||
1997 |
| $ 3.30 - $3.42 |
|
| 34,434 |
|
| 0.3 Years |
| $ | 3.30 |
|
| 34,434 |
| $ | 3.30 |
|
1998 |
| $ 4.81 - $7.33 |
|
| 239,831 |
|
| 1.2 Years |
| $ | 5.45 |
|
| 239,831 |
| $ | 5.45 |
|
1999 |
| $ 5.33 - $5.77 |
|
| 256,519 |
|
| 2.1 Years |
| $ | 5.38 |
|
| 256,519 |
| $ | 5.38 |
|
2000 |
| $ 3.25 - $4.23 |
|
| 213,806 |
|
| 3.2 Years |
| $ | 3.85 |
|
| 213,806 |
| $ | 3.85 |
|
2001 |
| $ 3.12 - $4.87 |
|
| 218,888 |
|
| 4.1 Years |
| $ | 3.19 |
|
| 218,888 |
| $ | 3.19 |
|
2002 |
| $ 4.67 - $7.67 |
|
| 248,375 |
|
| 5.1 Years |
| $ | 4.75 |
|
| 192,058 |
| $ | 4.76 |
|
2003 |
| $ 6.21 - $7.89 |
|
| 318,504 |
|
| 6.1 Years |
| $ | 7.45 |
|
| 318,504 |
| $ | 7.45 |
|
2004 |
| $ 10.00 - $10.89 |
|
| 363,437 |
|
| 7.2 Years |
| $ | 10.46 |
|
| 363,437 |
| $ | 10.46 |
|
2005 |
| $ 11.20 - $14.20 |
|
| 850,436 |
|
| 8.6 Years |
| $ | 12.30 |
|
| 850,436 |
| $ | 12.31 |
|
2006 |
| $ 11.45 - $12.12 |
|
| 4,400 |
|
| 9.6 Years |
| $ | 11.95 |
|
| — |
| $ | — |
|
|
|
|
|
|
|
|
|
| ||||||||||
|
| $ 3.12 - $14.20 |
|
| 2,748,630 |
|
| 5.7 Years |
| $ | 8.07 |
|
| 2,687,913 |
| $ | 8.14 |
|
|
|
|
|
|
|
|
|
|
34
COASTAL FINANCIAL CORPORATION AND SUBSIDIARIES
Notes to Consolidated Financial Statements – Continued
|
|
(17) | STOCK OPTION PLAN - CONTINUED |
The following is a summary of the activity of the stock option plans for the years 2004, 2005, and 2006.
|
|
|
|
|
|
|
|
|
|
|
|
|
|
|
|
|
|
|
|
|
| 2004 |
| 2005 |
| 2006 |
| ||||||||||||
|
|
|
|
| |||||||||||||||
|
| Shares |
| Weighted |
| Shares |
| Weighted |
| Shares |
| Weighted |
| ||||||
|
|
|
|
|
|
|
| ||||||||||||
Outstanding, October 1 |
|
| 2,544,623 |
| $ | 4.74 |
|
| 2,533,676 |
| $ | 5.84 |
|
| 3,092,770 |
| $ | 7.75 |
|
Granted |
|
| 397,158 |
|
| 10.46 |
|
| 879,735 |
|
| 11.18 |
|
| 4,400 |
|
| 11.95 |
|
Cancelled |
|
| (6,714 | ) |
| 6.85 |
|
| (51,666 | ) |
| 8.41 |
|
| (14,598 | ) |
| 10.95 |
|
Exercised |
|
| (401,391 | ) |
| 3.40 |
|
| (268,975 | ) |
| 4.51 |
|
| (333,942 | ) |
| 4.97 |
|
|
|
|
|
|
|
|
| ||||||||||||
Outstanding, September 30 |
|
| 2,533,676 |
| $ | 5.84 |
|
| 3,092,770 |
| $ | 7.75 |
|
| 2,748,630 |
| $ | 8.07 |
|
|
|
|
|
|
|
|
|
|
|
(18) | COMMON STOCK DIVIDENDS |
On each of February 18, 2004, July 30, 2004, December 15, 2004, October 26, 2005 and August 24, 2006, the Company declared a 10% stock dividend aggregating approximately 1,308,000, 1,442,000, 1,594,000, 1,770,000 and 1,971,000 shares, respectively. All share and per share data has been retroactively restated to give effect to the common stock dividends.
|
|
(19) | CASH DIVIDENDS |
On each of December 15, 2003, March 17, 2004 and June 16, 2004, the Company declared quarterly cash dividends of $0.034 per share. On each of September 29, 2004, December 17, 2004 and March 16, 2005, the Company declared quarterly cash dividends of $0.037 per share. On each of June 22, 2005 and September 21, 2005, the Company declared quarterly cash dividends of $0.041 per share. On each of December 21, 2005, March 15, 2006 and June 21, 2006, the Company declared quarterly cash dividends of $0.045 per share. Under Delaware law, the Company is permitted to declare and pay dividends either out of its surplus or, if there is no surplus, out of its net profits for the fiscal year in which the dividend is declared and/or the preceding fiscal year.
Subsequent to September 30, 2006, the Company declared a $0.05 per share cash dividend on October 3, 2006, payable November 3, 2006 to Stockholders of record as of October 20, 2006.
|
|
(20) | LEGAL MATTERS |
The Company is not a defendant in any lawsuits. The subsidiaries are defendants in lawsuits arising out of the normal course of business. Based upon current information received from counsel representing the subsidiaries in these matters, the Company believes none of the lawsuits would have a material impact on the Company’s financial status.
|
|
(21) | QUARTERLY FINANCIAL DATA (UNAUDITED) |
Quarterly operating data for the years ended September 30 is summarized as follows (in thousands, except share data):
|
|
|
|
|
|
|
|
|
|
|
|
|
|
|
| First |
| Second |
| Third |
| Fourth |
| ||||
|
|
|
|
|
| ||||||||
2005: |
|
|
|
|
|
|
|
|
|
|
|
|
|
Total interest income |
| $ | 17,946 |
|
| 18,912 |
|
| 20,337 |
|
| 21,363 |
|
Total interest expense |
|
| 6,431 |
|
| 7,016 |
|
| 7,831 |
|
| 8,452 |
|
|
|
|
|
|
| ||||||||
Net interest income |
|
| 11,515 |
|
| 11,896 |
|
| 12,506 |
|
| 12,911 |
|
Provision for loan losses |
|
| 350 |
|
| 625 |
|
| 550 |
|
| 172 |
|
|
|
|
|
|
| ||||||||
Net interest income after provision for loan losses |
|
| 11,165 |
|
| 11,271 |
|
| 11,956 |
|
| 12,739 |
|
Other income |
|
| 2,767 |
|
| 3,336 |
|
| 3,101 |
|
| 3,320 |
|
General and administrative expenses |
|
| 7,781 |
|
| 8,319 |
|
| 8,420 |
|
| 8,999 |
|
|
|
|
|
|
| ||||||||
Income before income taxes |
|
| 6,151 |
|
| 6,288 |
|
| 6,637 |
|
| 7,060 |
|
Income taxes |
|
| 2,106 |
|
| 2,153 |
|
| 2,281 |
|
| 2,442 |
|
|
|
|
|
|
| ||||||||
Net income |
| $ | 4,045 |
|
| 4,135 |
|
| 4,356 |
|
| 4,618 |
|
|
|
|
|
|
| ||||||||
Net income per common share - diluted |
| $ | 0.18 |
|
| 0.18 |
|
| 0.19 |
|
| 0.20 |
|
|
|
|
|
|
| ||||||||
Weighted average shares outstanding-diluted |
|
| 22,400,000 |
|
| 22,576,000 |
|
| 22,547,00 |
|
| 22,567,000 |
|
|
|
|
|
|
|
35
COASTAL FINANCIAL CORPORATION AND SUBSIDIARIES
Notes to Consolidated Financial Statements – Continued
|
|
(21) | QUARTERLY FINANCIAL DATA (UNAUDITED) – CONTINUED |
|
|
|
|
|
|
|
|
|
|
|
|
|
|
|
| First |
| Second |
| Third |
| Fourth |
| ||||
|
|
|
|
|
| ||||||||
2006: |
|
|
|
|
|
|
|
|
|
|
|
|
|
Total interest income |
| $ | 23,038 |
|
| 24,138 |
|
| 25,572 |
|
| 26,905 |
|
Total interest expense |
|
| 9,762 |
|
| 10,970 |
|
| 11,661 |
|
| 12,680 |
|
|
|
|
|
|
| ||||||||
Net interest income |
|
| 13,276 |
|
| 13,168 |
|
| 13,911 |
|
| 14,225 |
|
Provision for loan losses |
|
| 400 |
|
| 330 |
|
| 430 |
|
| 225 |
|
|
|
|
|
|
| ||||||||
Net interest income after provision for loan losses |
|
| 12,876 |
|
| 12,838 |
|
| 13,481 |
|
| 14,000 |
|
Other income |
|
| 3,588 |
|
| 4,202 |
|
| 4,671 |
|
| 4,604 |
|
General and administrative expenses |
|
| 9,680 |
|
| 9,926 |
|
| 10,556 |
|
| 10,896 |
|
|
|
|
|
|
| ||||||||
Income before income taxes |
|
| 6,784 |
|
| 7,114 |
|
| 7,596 |
|
| 7,708 |
|
Income taxes |
|
| 2,341 |
|
| 2,469 |
|
| 2,659 |
|
| 2,732 |
|
|
|
|
|
|
| ||||||||
Net income |
| $ | 4,443 |
|
| 4,645 |
|
| 4,937 |
|
| 4,976 |
|
|
|
|
|
|
| ||||||||
Net income per common share - diluted |
| $ | 0.20 |
|
| 0.21 |
|
| 0.22 |
|
| 0.22 |
|
|
|
|
|
|
| ||||||||
Weighted average shares outstanding-diluted |
|
| 22,413,000 |
|
| 22,484,000 |
|
| 22,480,000 |
|
| 22,477,000 |
|
|
|
|
|
|
|
|
|
(22) | COASTAL FINANCIAL CORPORATION FINANCIAL STATEMENTS (PARENT COMPANY ONLY) |
The following is condensed financial information of Coastal Financial Corporation (parent company only), the primary asset of which is its investment in its bank subsidiary, for the periods indicated (In thousands):
Coastal Financial Corporation
Condensed Balance Sheets
September 30, 2005 and 2006
|
|
|
|
|
|
|
|
|
| 2005 |
| 2006 |
| ||
|
|
|
| ||||
Assets: |
|
|
|
|
|
|
|
Cash |
| $ | 297 |
|
| 19 |
|
Investment in subsidiaries |
|
| 111,034 |
|
| 126,740 |
|
Deferred tax asset |
|
| 50 |
|
| 50 |
|
Other assets |
|
| 2,214 |
|
| 1,526 |
|
|
|
|
| ||||
Total assets |
| $ | 113,595 |
|
| 128,335 |
|
|
|
|
| ||||
|
|
|
|
|
|
|
|
Liabilities and Stockholders’ Equity: |
|
|
|
|
|
|
|
Accounts payable (principally dividends) |
|
| 910 |
|
| 47 |
|
Junior subordinated debt |
|
| 15,464 |
|
| 15,464 |
|
Total stockholders’ equity |
|
| 97,221 |
|
| 112,824 |
|
|
|
|
| ||||
Total liabilities and stockholders’ equity |
| $ | 113,595 |
|
| 128,335 |
|
|
|
|
|
36
COASTAL FINANCIAL CORPORATION AND SUBSIDIARIES
Notes to Consolidated Financial Statements – Continued
|
|
(22) | COASTAL FINANCIAL CORPORATION FINANCIAL STATEMENTS (PARENT COMPANY ONLY) - CONTINUED |
Coastal Financial Corporation
Condensed Statements of Operations
Years Ended September 30, 2004, 2005 and 2006
|
|
|
|
|
|
|
|
|
|
|
|
| 2004 |
| 2005 |
| 2006 |
| |||
|
|
|
|
| ||||||
Income: |
|
|
|
|
|
|
|
|
|
|
Interest income |
| $ | 2 |
|
| 2 |
|
| 2 |
|
Management fees |
|
| 242 |
|
| 242 |
|
| 242 |
|
Dividends from subsidiary |
|
| 2,230 |
|
| 3,400 |
|
| 2,500 |
|
Equity in undistributed earnings of subsidiaries |
|
| 13,063 |
|
| 14,444 |
|
| 17,432 |
|
|
|
|
|
| ||||||
Total income |
|
| 15,537 |
|
| 18,088 |
|
| 20,176 |
|
|
|
|
|
| ||||||
|
|
|
|
|
|
|
|
|
|
|
Expenses: |
|
|
|
|
|
|
|
|
|
|
Professional fees |
|
| 72 |
|
| 83 |
|
| 72 |
|
Supplies and printing |
|
| 33 |
|
| 40 |
|
| 51 |
|
Interest expense |
|
| 662 |
|
| 892 |
|
| 1,192 |
|
Other expenses |
|
| 213 |
|
| 280 |
|
| 359 |
|
Income tax benefit |
|
| (249 | ) |
| (361 | ) |
| (499 | ) |
|
|
|
|
| ||||||
Total expenses |
|
| 731 |
|
| 934 |
|
| 1,175 |
|
|
|
|
|
| ||||||
Net income |
| $ | 14,806 |
|
| 17,154 |
|
| 19,001 |
|
|
|
|
|
|
Coastal Financial Corporation
Condensed Statements of Cash Flows
Years Ended September 30, 2004, 2005 and 2006
|
|
|
|
|
|
|
|
|
|
|
|
| 2004 |
| 2005 |
| 2006 |
| |||
|
|
|
|
| ||||||
Operating activities: |
|
|
|
|
|
|
|
|
|
|
Net income |
| $ | 14,806 |
|
| 17,154 |
|
| 19,001 |
|
Adjustments to reconcile net income to net cash provided by |
|
|
|
|
|
|
|
|
|
|
Stock-based compensation |
|
| — |
|
| 76 |
|
| 91 |
|
Equity in undistributed net income of subsidiary |
|
| (13,063 | ) |
| (14,444 | ) |
| (17,432 | ) |
(Increase) decrease in other assets |
|
| (624 | ) |
| (489 | ) |
| 688 |
|
Increase (decrease) in other liabilities |
|
| 43 |
|
| 107 |
|
| (864 | ) |
|
|
|
|
| ||||||
Total cash provided by operating activities |
|
| 1,162 |
|
| 2,404 |
|
| 1,484 |
|
|
|
|
|
| ||||||
|
|
|
|
|
|
|
|
|
|
|
Financing activities: |
|
|
|
|
|
|
|
|
|
|
Cash dividends to stockholders |
|
| (2,948 | ) |
| (3,361 | ) |
| (2,957 | ) |
Proceeds from stock options |
|
| 1,273 |
|
| 1,309 |
|
| 1,377 |
|
Capital contribution to subsidiary |
|
| (100 | ) |
| (150 | ) |
| (200 | ) |
Other financing activities, net |
|
| (74 | ) |
| 9 |
|
| 18 |
|
|
|
|
|
| ||||||
Total cash used by financing activities |
|
| (1,849 | ) |
| (2,193 | ) |
| (1,762 | ) |
|
|
|
|
| ||||||
Net increase (decrease) in cash and cash equivalents |
|
| (687 | ) |
| 211 |
|
| (278 | ) |
Cash and cash equivalents at beginning of the year |
|
| 773 |
|
| 86 |
|
| 297 |
|
|
|
|
|
| ||||||
| ||||||||||
Cash and cash equivalents at end of the years |
| $ | 86 |
|
| 297 |
|
| 19 |
|
|
|
|
|
|
37
COASTAL FINANCIAL CORPORATION AND SUBSIDIARIES
Notes to Consolidated Financial Statements – Continued
|
|
(23) | CARRYING AMOUNTS AND FAIR VALUE OF FINANCIAL INSTRUMENTS |
The carrying amounts and fair value of financial instruments as of September 30, 2005 and 2006 are summarized below:
|
|
|
|
|
|
|
|
|
|
|
|
|
|
|
| 2005 |
| 2006 |
| ||||||||
|
|
|
| ||||||||||
|
| Carrying |
| Estimated |
| Carrying |
| Estimated |
| ||||
|
|
|
|
|
| ||||||||
|
| (In thousands) |
| ||||||||||
Financial Assets: |
|
|
|
|
|
|
|
|
|
|
|
|
|
Cash and cash equivalents |
| $ | 91,525 |
|
| 91,525 |
| $ | 36,955 |
|
| 36,955 |
|
Investment securities available for sale |
|
| 25,616 |
|
| 25,616 |
|
| 39,300 |
|
| 39,300 |
|
Mortgage-backed securities available for sale |
|
| 399,655 |
|
| 399,655 |
|
| 392,989 |
|
| 392,989 |
|
Investment securities held to maturity |
|
| 10,000 |
|
| 10,049 |
|
| 11,997 |
|
| 12,000 |
|
Loans receivable held for sale |
|
| 18,121 |
|
| 18,126 |
|
| 1,853 |
|
| 1,868 |
|
Loans receivable, net |
|
| 924,260 |
|
| 938,058 |
|
| 1,088,231 |
|
| 1,102,547 |
|
FHLB stock |
|
| 15,775 |
|
| 15,775 |
|
| 20,291 |
|
| 20,291 |
|
Bank-owned life insurance |
|
| 22,574 |
|
| 22,574 |
|
| 23,541 |
|
| 23,541 |
|
Financial Liabilities: |
|
|
|
|
|
|
|
|
|
|
|
|
|
Deposits: |
|
|
|
|
|
|
|
|
|
|
|
|
|
Demand accounts |
|
| 643,792 |
|
| 643,792 |
|
| 632,217 |
|
| 632,217 |
|
Certificate accounts |
|
| 427,126 |
|
| 426,482 |
|
| 430,888 |
|
| 430,529 |
|
Advances from Federal Home Loan Bank |
|
| 289,007 |
|
| 286,993 |
|
| 380,580 |
|
| 376,417 |
|
Securities sold under agreements to repurchase and reverse repurchase agreements |
|
| 41,937 |
|
| 41,937 |
|
| 72,095 |
|
| 71,828 |
|
Junior subordinated debt |
|
| 15,464 |
|
| 15,464 |
|
| 15,464 |
|
| 15,464 |
|
Drafts outstanding |
|
| 12,890 |
|
| 12,890 |
|
| 2,023 |
|
| 2,023 |
|
SFAS 107, “Disclosures about Fair Value of Financial Instruments,” requires disclosure of fair value information, whether or not recognized in the statement of financial position, when it is practicable to estimate the fair value. SFAS 107 defines a financial instrument as cash, evidence of an ownership interest in an entity or contractual obligations, which require the exchange of cash, or other financial instruments. Certain items are specifically excluded from the disclosure requirements, including the Company’s common stock, premises and equipment, accrued interest receivable and payable, and other assets and liabilities.
Fair value approximates book value for the following financial instruments due to the short-term nature of the instrument: cash and due from banks, interest-bearing bank balances, federal funds sold, federal funds purchased, drafts outstanding and other short-term borrowings. Investments and mortgage-backed securities are valued using quoted market prices.
Fair value for variable rate loans and bank-owned life insurance that reprice frequently is based on the carrying value. Fair values for mortgage loans, consumer loans and all other loans (primarily commercial) which have fixed rates of interest are based on the discounted present value of the estimated future cash flows. Discount rates used in these computations approximates the rates currently offered for similar loans of comparable terms and credit quality.
Fair value for demand deposit accounts and interest-bearing accounts with no fixed maturity date is equal to the carrying value. Certificate of deposit accounts are estimated by discounting cash flows from expected maturities using current interest rates on similar instruments.
Fair value for FHLB advances, repurchase and reverse repurchase agreements and fixed rate long-term debt is based on discounted cash flows using the Company’s current incremental borrowing rate.
The junior subordinated debentures are unsecured obligations of the Company and are subordinate and junior in right of payment to all present and future senior indebtedness of the Company. The Company has entered into a guarantee, which together with its obligations under the junior subordinated debentures and the declaration of trust governing the Trust provides a full and unconditional guarantee of the Capital Securities. The variable interest rate of the junior subordinated debentures reprices quarterly. Accordingly, fair value approximates carrying cost. See Note 11 for additional disclosure.
The Company has used management’s best estimate of fair value based upon the above assumptions. Therefore, the fair values presented may not be the amounts which could be realized in an immediate sale or settlement of the instrument. In addition, any income taxes or other expenses, which would be incurred in an actual sale or settlement, are not taken into consideration in the fair values presented.
38
COASTAL FINANCIAL CORPORATION AND SUBSIDIARIES
Notes to Consolidated Financial Statements – Continued
|
|
(23) | CARRYING AMOUNTS AND FAIR VALUE OF FINANCIAL INSTRUMENTS - CONTINUED |
The Company had $257.8 million of off-balance sheet financial commitments as of September 30, 2006, which are commitments to originate loans, unused consumer lines of credit, letters of credit and undisbursed portion of loans in process. Since these obligations are based on current market rates, the carrying amount is considered to be a reasonable estimate of fair value.
The Company originates certain fixed rate residential loans with the intention of selling these loans. Between the time that the Company enters into an interest rate lock or a commitment to originate a fixed rate residential loan with a potential borrower and the time the closed loan is sold, the Company is subject to variability in the market prices related to these commitments. The Company believes that it is prudent to limit the variability of expected proceeds from the sales through forward sales of “to be issued” mortgage backed securities and loans (“forward sales commitments”). The commitment to originate fixed rate residential loans and forward sales commitments are freestanding derivative instruments. They do not generally qualify for hedge accounting treatment so their fair value adjustments are recorded through the income statement in net gains on sale of loans. The commitments to originate fixed rate conforming loans totaled $5.6 million at September, 30 2006. The fair value of these commitments was an asset of approximately $41,000 at September 30, 2006, and is reflected in gain on sales of loans held for sale in the consolidated statements of operations. The forward sales commitments totaled $4.0 million at September 30, 2006. The fair value of these commitments was a liability of approximately $10,000 at September 30, 2006, and is reflected in gain on sales of loans held for sale in the consolidated statements of operations.
Fair value estimates are made at the dates indicated above, based on relevant market information and information about the financial instrument. These estimates do not reflect any premium or discount that could result from offering for sale the Company’s entire holdings of a particular financial instrument. Because no active market exists for a significant portion of the Company’s financial instruments, fair value estimates are based on judgments regarding future expected loss experience, current economic conditions, current interest rates and prepayment trends, risk characteristics of various financial instruments, and other factors. These estimates are subjective in nature and involve uncertainties and matters of significant judgment and therefore cannot be determined with precision. Changes in any of these assumptions used in calculating fair value would also significantly affect the estimates. Changes in market interest rates and prepayment assumptions could significantly change the fair value.
Fair value estimates are based on existing on and off-balance sheet financial instruments without attempting to estimate the value of anticipated future business and the value of assets and liabilities that are not considered financial instruments. For example, the Company has significant assets and liabilities that are not considered financial assets or liabilities including deposit franchise value, loan servicing portfolio, real estate, deferred tax liabilities, premises and equipment, and goodwill. In addition, the tax ramifications related to the realization of the unrealized gains and losses can have a significant effect on fair value estimates and have not been considered in any of these estimates.
|
|
(24) | COMMITMENTS AND CONTINGENCIES |
The Company has entered into three contracts to purchase land. At September 30, 2006, the undisbursed future obligations under these signed contracts approximated $3.1 million. These contracts are scheduled to close during fiscal 2007. Additionally, the Company has entered into two contracts to license specialized banking computer software for approximately $300,000. It is anticipated that the installation will be completed prior to the end of the second quarter of fiscal 2007.
In the first quarter of fiscal 2006, the Company entered into a lease for 5.48 acres of land and building with an option to purchase this property after one year for $2.75 million. In December 2006, the Company exercised its option to purchase the property.
The Company has an unsecured unused short-term line of credit to purchase federal funds from an unrelated bank totaling $20.0 million. This line of credit expires January 1, 2007.
39
COASTAL FINANCIAL CORPORATION AND SUBSIDIARIES
Management’s Discussion and Analysis
Forward Looking Statements
This report may contain certain “forward-looking statements” within the meaning of Section 27A of the Securities Exchange Act of 1934, as amended, that represent the Company’s expectations or beliefs concerning future events. All forward-looking statements are based on assumptions and involve risks and uncertainties, many of which are beyond the Company’s control and which may cause its actual results, performance or achievements to differ materially from the results, performance or achievements contemplated by the forward-looking statements. Forward-looking statements can be identified by the fact that they do not relate strictly to historical or current facts. They often include words such as “believe,” “expect,” “anticipate,” “intend,” “plan,” “estimate” or words of similar meaning, or future or conditional verbs such as “will,” “would,” “should,” “could” or “may.” Forward-looking statements speak only as of the date they are made. Such risks and uncertainties include, among other things:
|
|
|
| • | Competitive pressures among depository and other financial institutions in the Company’s market areas may increase significantly. |
|
|
|
| • | Adverse changes in the economy or business conditions, either nationally or in the Company’s market areas, could increase credit-related losses and expenses and/or limit growth |
|
|
|
| • | Increases in defaults by borrowers and other delinquencies could result in increases in the Company’s provision for losses on loans and related expenses. |
|
|
|
| • | The Company’s inability to manage growth effectively, including the successful expansion of the Company’s Customer support, administrative infrastructure and internal management systems, could adversely affect the Company’s results of operations and prospects. |
|
|
|
| • | Fluctuations in interest rates and market prices could reduce the Company’s net interest margin and asset valuations and increase expenses. |
|
|
|
| • | The consequences of continued bank acquisitions and mergers in the Company’s market areas, resulting in fewer but much larger and financially stronger competitors, could increase competition for financial services to the Company’s detriment. |
|
|
|
| • | The Company’s continued growth will depend in part on its ability to enter new markets successfully and capitalize on other growth opportunities. |
|
|
|
| • | Changes in legislative or regulatory requirements, or actions by the Securities and Exchange Commission (“SEC”), the Financial Accounting Standards Board (“FASB”), or the Public Company Accounting Oversight Board, applicable to the Company and its subsidiaries could increase costs, limit certain operations and adversely affect results of operations. |
|
|
|
| • | Changes in tax requirements, including tax rate changes, new tax laws and revised tax law interpretations may increase the Company’s tax expense or adversely affect its Customers’ businesses. |
|
|
|
| • | Company initiatives now in place or introduced in the future, not producing results consistent with historic growth rates or results which justify their costs. |
In light of these risks, uncertainties and assumptions, you should not place undue reliance on any forward-looking statements in this report. Except as may be required by applicable law or regulation, the Company undertakes no obligation to publicly update or otherwise revise any forward-looking statements, whether as a result of new information, future events or otherwise.
Overview
Coastal Financial Corporation is a unitary thrift holding company incorporated in Delaware with one wholly-owned banking subsidiary, Coastal Federal Bank (the “Bank” or “Coastal Federal”). The Company also owns Coastal Planners Holding Corporation, whose subsidiary, Coastal Retirement, Estate and Tax Planners, Inc., offers fee-based financial planning and tax preparation services. The primary business activities of the Company are conducted by the Bank. The Company and Bank’s principal executive offices are located in Myrtle Beach, South Carolina.
Coastal Federal Bank is a full service financial services company with 24 branches located in four counties throughout the coastal regions of South Carolina and North Carolina. The Bank has sixteen offices in Horry County, South Carolina; one office in Georgetown County, South Carolina; four offices in Brunswick County, North Carolina; and three offices in New Hanover County, North Carolina.
The Bank’s primary market areas are located along the coastal regions of South Carolina and North Carolina and predominately center around the Metro regions of Myrtle Beach, South Carolina and Wilmington, North Carolina, and their surrounding counties.
40
COASTAL FINANCIAL CORPORATION AND SUBSIDIARIES
Management’s Discussion and Analysis - Continued
Coastal Federal’s primary market is Horry County, South Carolina, where the Bank has the number one market share of deposits as of June 30, 2006 (the most recent date for which published data is available) with 15.7% of deposits as reported by the FDIC Summary of Deposits Report. The Bank also has the third highest market share of deposits as of June 30, 2006 in Brunswick County, North Carolina, with 8.7% of deposits as reported by the FDIC Summary of Deposits Report.
The primary business activities in Horry County are centered around the tourism industry. To the extent that Horry County businesses rely heavily on tourism business, decreased tourism would have a significant adverse effect on Coastal Federal’s primary deposit base and lending area. Moreover, the Bank would likely experience a higher degree of loan delinquencies should the local economy be materially and adversely affected.
Coastal Federal’s principal business consists of attracting core deposits from Customers in its primary market locations and using these funds to meet the lending needs of its Customers as well as providing numerous financial products and services for its Customers.
Through its branch locations, the Bank provides a wide range of banking products, including interest-bearing and non-interest bearing checking accounts; business sweep accounts; business cash management services; statement savings accounts; money market accounts; certificate of deposit accounts; individual retirement accounts; merchant services; commercial, business, personal, real estate, residential mortgage and home equity loans; safe deposit boxes; and electronic banking services. The Bank has six ATMs at off-site locations and an ATM at each branch. The Bank also makes available a wide range of financial products through its relationship with Raymond James Financial Services, including stocks, bonds, mutual funds, annuities, insurance, and retirement products.
In the fourth fiscal quarter of 2004, the Bank began two significant new initiatives. The first was “The Experience of FANtastic! Customer Service”. This initiative focuses on Customer service and convenience. The Bank has been in the process of redesigning its infrastructure, software and products to improve Customer service and convenience. In addition, in order to improve Customer service and convenience, the Bank added an extended-hours Call Center and introduced “6 Day Branch Banking” with extended operating hours. The Call Center employs approximately 30 Associates. The Bank experienced increased salary and benefit expenses in fiscal 2005 and 2006 and anticipates these expenses continuing thereafter associated with the hiring, training and placement of these new Associates.
The second initiative was “The Carolinas’ Best Totally Free Checking With A Gift” that was introduced in September 2004. The Bank has incurred, and will continue to incur, significant marketing costs associated with this campaign. In fiscal 2006, 2005, and 2004 marketing expenses were $2.0 million, $1.8 million and $905,000 respectively.
The Bank expects to realize significant benefits from these strategies consisting of increased Bank lobby traffic, increased number of personal checking accounts and higher fee income as a result of those checking accounts. In 2006, the number of personal checking accounts increased approximately 7,000 accounts or 21.7% over fiscal 2005. Primarily, as a result of the increase in the number of personal checking accounts, fees and service charges on deposit accounts has increased approximately $3.3 million coupled with an increase in ATM and Debit Card income of $802,000.
Critical Accounting Policies
The Company’s significant accounting policies are set forth in Note 1 of the Notes to Consolidated Financial Statements. Of these policies, the Company considers the allowance for loan losses and the income taxes to be the most critical accounting policies, because they require many of management’s most subjective and complex judgments. For additional discussion concerning the Company’s allowance for loan losses and related matters, see “Allowance for Loan Losses” and see “Income Taxes” for additional discussion concerning income taxes.
General
The Company reported $19.0 million in net income for the year ended September 30, 2006, compared to $17.2 million for the year ended September 30, 2005. Net interest income increased $5.8 million as a result of increased interest income of $21.1 million offset by an increase of $15.3 million in interest expense. Provision for loan losses decreased from $1.7 million for the year ended September 30, 2005, to $1.4 million for the year ended September 30, 2006. Other income increased 36.3% from $12.5 million in fiscal 2005, to $17.1 million in 2006. General and administrative expenses increased $7.5 million, or 22.5%, for fiscal 2006 as compared to fiscal 2005.
Total assets increased from $1.5 billion at September 30, 2005 to $1.7 billion at September 30, 2006, or 7.5%. Liquid assets, consisting of cash, interest-bearing deposits, and securities, decreased from $526.8 million at September 30, 2005, to $481.2 million
41
COASTAL FINANCIAL CORPORATION AND SUBSIDIARIES
Management’s Discussion and Analysis - Continued
at September 30, 2006. Loans receivable increased 17.7% from $924.3 million at September 30, 2005, to $1.1 billion at September 30, 2006. Total loan originations for fiscal 2006 were $800.1 million as compared to $799.7 million for fiscal 2005.
The decrease in liquid assets was the net result of an increase in loans receivable of $147.7 million, an increase in advances from the Federal Home Loan Bank (“FHLB”) of Atlanta of $91.6 million and an increase in repurchase and reverse repurchase agreements of $30.2 million offset by a decrease in deposits of $7.8 million. During the same period, noninterest bearing checking accounts increased $12.0 million.
As a result of $19.0 million in net earnings, proceeds from the exercise of stock options of approximately $1.4 million, less cash dividends paid to stockholders of approximately $2.9 million, and the net change in unrealized loss on securities available for sale, stockholders’ equity increased from $97.2 million at September 30, 2005 to $112.8 million at September 30, 2006.
Liquidity and Capital Resources
Historically, the Company has maintained its liquidity at levels believed by management to be adequate to meet requirements of normal operations, potential deposit outflows and expected loan demand and still allow for optimal investment of funds and return on assets. The following table summarizes future contractual obligations as of September 30, 2006.
|
|
|
|
|
|
|
|
|
|
|
|
|
|
|
|
|
|
| Payment Due by Period |
| |||||||||||||
|
|
| ||||||||||||||
|
| Total |
| Less than |
| 1-3 |
| 4-5 |
| After 5 |
| |||||
|
|
|
|
|
|
| ||||||||||
|
| (Dollars in thousands) |
| |||||||||||||
Contractual Obligations: |
|
|
| |||||||||||||
Time deposits |
| $ | 430,888 |
| $ | 389,272 |
| $ | 37,154 |
| $ | 3,867 |
| $ | 595 |
|
Short-term borrowings |
|
| 63,905 |
|
| 63,905 |
|
| — |
|
| — |
|
| — |
|
Long-term debt |
|
| 404,234 |
|
| — |
|
| 20,780 |
|
| 114,091 |
|
| 269,363 |
|
Construction contracts |
|
| 1,737 |
|
| 1,737 |
|
| — |
|
| — |
|
| — |
|
Operating leases |
|
| 4,652 |
|
| 478 |
|
| 636 |
|
| 433 |
|
| 3,105 |
|
|
|
|
|
|
|
| ||||||||||
Total contractual cash obligations |
| $ | 905,416 |
| $ | 455,392 |
| $ | 58,570 |
| $ | 118,391 |
| $ | 273,063 |
|
|
|
|
|
|
|
|
The Company has entered into three commitments to purchase land. See Note 24 of the Notes to Consolidated Financial Statements for information regarding these commitments.
The principal sources of cash flows for the Company consist mainly of mortgage, consumer and commercial loan payments, retail customer deposits, repurchase agreements securitized by mortgage-backed securities and advances from the FHLB of Atlanta.
The principal use of cash flows is the origination of loans receivable. The Company originated loans receivable of $577.3 million, $799.7 million and $800.8 million for the years ended September 30, 2004, 2005 and 2006, respectively. A large portion of these loan originations were financed through loan principal repayments which amounted to $403.5 million, $560.5 million and $597.2 million for the years ended September 30, 2004, 2005 and 2006, respectively. In addition, the Company has generally sold conforming fixed rate mortgage loans, primarily servicing retained, to correspondent financial institutions in the secondary market to finance future loan originations. For the years ended September 30, 2004, 2005 and 2006, the Company sold residential loans amounting to $27.5 million, $18.7 million and $18.0 million, respectively. During fiscal 2005 and 2006, the Company sold commercial loan participations totaling $21.2 million and $4.4 million, respectively. The Company sold no commercial loan participations in fiscal 2004.
During fiscal 2006, the Company securitized $27.5 million of mortgage loans, concurrently sold these mortgage-backed securities to outside third parties and recognized a net gain on sale of $485,000, which included $418,000 related to mortgage servicing rights. The gain is included in gains on sales of loans and loans receivable held for sale in the consolidated statement of operations. The proceeds from sale are included in proceeds from securitization and sales of loans receivable held for sale in the consolidated statement of cash flows. The Company has no retained interest in the securities that were sold other than the servicing rights.
In fiscal 2006 deposits remained comparable to fiscal 2005 at $1.1 billion. Savings accounts and CD’s increased $8.2 million as customers moved into higher yield accounts. This is offset by a decrease in transaction accounts.
At September 30, 2006, the Company had commitments to originate $23.3 million in loans, disburse $32.0 million in mortgage loans, and $202.5 million in unused lines of credit, which the Company expects to fund from normal operations. Traditionally, a significant portion of the unused lines of credit may never be used by the Customer.
At September 30, 2006, the Company had $430.9 million of certificates of deposit, including $153.3 million of brokered CDs, which were due to mature within one year. Based upon previous experience, the Company believes that a major portion of these certificates, excluding the brokered CDs, will be redeposited. At September 30, 2006, the Company had excess collateral pledged to the FHLB which would support additional FHLB advance borrowings of $69.3 million. Additionally, at September 30, 2006, the Company had excess available collateral consisting of investment securities and mortgage-backed securities to support additional borrowings of up to $129.0 million, as well as a federal funds line available of $20.0 million.
42
COASTAL FINANCIAL CORPORATION AND SUBSIDIARIES
Management’s Discussion and Analysis - Continued
As a condition of deposit insurance, OTS regulations require that the Bank calculate and maintain a minimum regulatory capital requirement on a quarterly basis and satisfy such requirement at the calculation date and throughout the ensuing quarter. The Bank’s tangible and core capital approximated $129.6 million at September 30, 2006, exceeding the Bank’s tangible and core capital requirements by $104.7 million and $62.6 million, respectively. At September 30, 2006, the Bank’s capital exceeded its current risk-based minimum capital requirement by $63.0 million. The risk-based capital requirement may increase in the future. Also see Note 14 of the Notes to Consolidated Financial Statements.
Results of Operations
Comparison of the Years Ended September 30, 2005 and 2006
Interest Income
Interest income for the year ended September 30, 2006, increased to $99.7 million as compared to $78.6 million for the year ended September 30, 2005. The earning asset yield for the year ended September 30, 2006, was 6.68% compared to a yield of 5.94% for the year ended September 30, 2005. The average yield on loans receivable for the year ended September 30, 2006, was 7.48% compared to 6.50% for the year ended September 30, 2005. The increased yield on loans is primarily due to the increased yield on commercial loans with interest rates tied to the prime lending rate. The prime rate was 8.25% at September 30, 2006, compared to 6.75% at September 30, 2005. The yield on investments increased to 4.98% for the year ended September 30, 2006, from 4.84% for the year ended September 30, 2005. Total average interest-earning assets were $1.5 billion for the year ended September 30, 2006 as compared to $1.3 billion for the year ended September 30, 2005. The increase in average interest-earning assets is primarily due to an increase in average loans receivable of approximately $140.7 million resulting primarily from growth in the commercial loan portfolio. Average investment securities, mortgage-backed securities and other interest-earning assets increased $27.1 million, primarily funded by borrowings, including brokered CD’s.
Interest Expense
Interest expense on interest-bearing liabilities was $45.1 million for the year ended September 30, 2006, as compared to $29.7 million for the year ended September 30, 2005. The average cost of customer deposits for the year ended September 30, 2006, was 2.14% compared to 1.42% for the year ended September 30, 2005. The cost of interest-bearing liabilities was 3.01% for the year ended September 30, 2006 compared to 2.24% for the year ended September 30, 2005. The average cost of FHLB advances, reverse repurchase agreements and other borrowings was 4.23%, 3.70% and 7.95%, respectively, for the year ended September 30, 2006. For the year ended September 30, 2005, the average cost of FHLB advances, reverse repurchase agreements and other borrowings was 3.83%, 2.37% and 5.95%, respectively. The increased cost of funds on other borrowings is due to the increased short-term interest rates. At September 30, 2006, the federal funds rate was 5.34% compared to 3.93% at September 30, 2005. Total average interest-bearing liabilities increased from $1.3 billion at September 30, 2005 to $1.5 billion at September 30, 2006. The increase in average interest-bearing liabilities is due to an increase in average customer deposits of approximately $79.8 million as a result of the Company’s focus on checking growth, increased average FHLB advances of $28.0 million used to fund loan and investment securities growth and increased average Customer repurchase agreements of $15.3 million. Average brokered CD’s increased by $95.4 million in average balances when comparing the two periods. This increase was partially offset by a decrease in average reverse repurchase agreements of $54.1 million.
Net Interest Income
Net interest income was $54.6 million for the year ended September 30, 2006, as compared to $48.8 million for the year ended September 30, 2005. The net interest margin was 3.67% for the year ended September 30, 2006, compared to 3.70% for the year ended September 30, 2005.
43
COASTAL FINANCIAL CORPORATION AND SUBSIDIARIES
Management’s Discussion and Analysis - Continued
The following table summarizes the average balance sheet and the related yields on interest-earning assets and deposits and borrowings for the year ended September 30, 2005 and 2006 (Dollars in thousands):
|
|
|
|
|
|
|
|
|
|
|
|
|
|
|
|
|
|
|
|
|
| 2005 |
| 2006 |
| ||||||||||||||
|
|
|
| ||||||||||||||||
|
| Average |
| Income/ |
| Yield/Rate |
| Average |
| Income/ |
| Yield/Rate |
| ||||||
|
|
|
|
|
|
|
| ||||||||||||
Assets |
|
|
|
|
|
|
|
|
|
|
|
|
|
|
|
|
|
|
|
Earning assets |
|
|
|
|
|
|
|
|
|
|
|
|
|
|
|
|
|
|
|
Loans (2) |
| $ | 873,797 |
| $ | 56,826 |
| 6.50 | % |
| $ | 1,014,501 |
| $ | 75,932 |
| 7.48 | % |
|
Investment securities, MBS securities and others (3) |
|
| 449,402 |
|
| 21,732 |
| 4.84 | % |
|
| 476,536 |
|
| 23,721 |
| 4.98 | % |
|
|
|
|
|
|
|
|
|
|
|
|
| ||||||||
Total earning assets |
| $ | 1,323,199 |
| $ | 78,558 |
| 5.94 | % |
| $ | 1,491,037 |
| $ | 99,653 |
| 6.68 | % |
|
|
|
|
|
|
|
|
|
|
|
|
| ||||||||
|
|
|
|
|
|
|
|
|
|
|
|
|
|
|
|
|
|
|
|
Liabilities |
|
|
|
|
|
|
|
|
|
|
|
|
|
|
|
|
|
|
|
Customer Deposits |
| $ | 811,623 |
| $ | 11,556 |
| 1.42 | % |
| $ | 891,456 |
| $ | 19,095 |
| 2.14 | % |
|
Brokered CD’s |
|
| 79,369 |
|
| 2,523 |
| 3.18 | % |
|
| 174,761 |
|
| 7,648 |
| 4.38 | % |
|
FHLB Advances |
|
| 322,108 |
|
| 12,341 |
| 3.83 | % |
|
| 350,064 |
|
| 14,803 |
| 4.23 | % |
|
Customer Repurchase Agreements |
|
| 27,498 |
|
| 668 |
| 2.43 | % |
|
| 42,754 |
|
| 1,608 |
| 3.76 | % |
|
Junior Subordinated Debt |
|
| 15,000 |
|
| 892 |
| 5.95 | % |
|
| 15,000 |
|
| 1,192 |
| 7.95 | % |
|
Reverse Repurchase Agreements |
|
| 73,723 |
|
| 1,750 |
| 2.37 | % |
|
| 19,632 |
|
| 727 |
| 3.70 | % |
|
|
|
|
|
|
|
|
|
|
|
|
| ||||||||
Total interest-bearing liabilities |
| $ | 1,329,321 |
| $ | 29,730 |
| 2.24 | % |
| $ | 1,493,667 |
| $ | 45,073 |
| 3.01 | % |
|
|
|
|
|
|
|
|
|
|
|
|
| ||||||||
|
|
|
|
|
|
|
|
|
|
|
|
|
|
|
|
|
|
|
|
Net interest income |
|
|
|
| $ | 48,828 |
|
|
|
|
|
|
| $ | 54,580 |
|
|
|
|
|
|
|
|
|
|
|
|
|
|
|
|
|
|
|
| ||||
Net interest margin |
|
|
|
|
|
|
| 3.70 | % |
|
|
|
|
|
|
| 3.67 | % |
|
Net yield on earning assets |
|
|
|
|
|
|
| 3.69 | % |
|
|
|
|
|
|
| 3.66 | % |
|
|
|
(1) | The average balances are derived from monthly balances. |
|
|
(2) | Nonaccrual loans are included in average balances for yield computations. |
|
|
(3) | Investment securities include taxable and tax-exempt securities. Net interest income has not been adjusted to produce a tax-equivalent yield. |
Provision for Loan Losses
The Company’s provision for loan losses decreased from $1.7 million for the year ended September 30, 2005, to $1.4 million for the year ended September 30, 2006 primarily due to the risk factors related to the underlying portfolio. The allowance for loan losses as a percentage of loans was 1.17% at September 30, 2006 as compared to 1.25% at September 30, 2005. Loans delinquent 90 days or more were $3.0 million or 0.27% of total loans at September 30, 2006, compared to $2.6 million or 0.28% of total loans at September 30, 2005. The allowance for loan losses was 426% of loans delinquent 90 days or more at September 30, 2006, compared to 445% at September 30, 2005. Net charge-offs for the year ended September 30, 2006 were $407,000 compared to $1.0 million for the year ended September 30, 2005. Management believes that the level of the allowance for loan losses at September 30, 2006 is adequate considering the composition of the loan portfolio, the portfolio’s loss experience, delinquency trends, current regional and local economic conditions and other factors at that date.
Other Income
For the year ended September 30, 2006, other income was $17.1 million compared to $12.5 million for the year ended September 30, 2005. Fees and service charges from deposit accounts increased $3.2 million or 52.9% to $9.4 million for the year ended September 30, 2006, compared to $6.1 million for the year ended September 30, 2005. The majority of this increase is due to fee income from increased number of personal checking accounts. In fiscal 2006, the number of personal checking account balances grew approximately 7,000 accounts. During the year ended September 30, 2005, the Company securitized and concurrently sold $52.6 million of mortgage loans compared to $27.5 million for the year ended September 30, 2006. Gain on sale of loans was $485,000 for the year ended September 30, 2006, compared to $1.2 million for the year ended September 30, 2005. In addition, gain on sale of loans and loans receivable held for sale included a gain on the sale of the Company’s credit card portfolio totaling $507,000 in fiscal 2006. Losses on sales of securities available for sale were $397,000 for the year ended September 30, 2006, compared to losses of $485,000 for the year ended September 30, 2005. In addition, the Company had a gain on call of an investment security held to maturity called by the issuer of $160,000 for the year ended September 30, 2005. Due to the increase in checking accounts, income from ATM and debit card transactions increased 52.4% from $1.5 million in fiscal 2005 to $2.3 million in fiscal 2006.
44
COASTAL FINANCIAL CORPORATION AND SUBSIDIARIES
Management’s Discussion and Analysis - Continued
General and Administrative Expenses
General and administrative expenses were $41.1 million for the year ended September 30, 2006 compared to $33.5 million for the year ended September 30, 2005. Salaries and employee benefits were $22.2 million for the year ended September 30, 2006, as compared to $18.5 million for the year ended September 30, 2005, an increase of 20.5%, primarily due to an increase in the number of banking Associates in business banking, Associates in the Company’s expanded hours call center, Associates in new branches and normal salary increases. The Company has added several Associates in a Banking Group that is focused on growing small to medium sized business banking relationships. Also, as a result of new branches, equipment purchased to improve Customer convenience and increased checking activity, net occupancy, furniture and fixtures and data processing expenses increased $1.9 million and depreciation expense increased $804,000, when comparing the two periods. Marketing expenses were $1.8 million for the year ended September 30, 2005, compared to $2.0 million for the year ended September 30, 2006. This is primarily attributed to the Bank’s “The Carolinas’ Best Totally Free Checking With A Gift” initiative; continued marketing of Penny Pavilion, the Bank’s free coin counting service into new branches coupled with on-going advertising support; marketing of the Bank’s expanded banking hours, including Saturday banking at all Bank branches; and marketing of the Bank’s new branches in South Carolina and North Carolina. The Bank’s “The Carolinas’ Best Totally Free Checking With A Gift” promotion involves significant direct mail advertising as well as direct media advertising. Expenses related to ATM and debit card transactions increased $360,000 or 34.7% when comparing fiscal 2005 to 2006. Other expense was $4.5 million for the year ended September 30, 2005 compared to $4.9 million for the year ended September 30, 2006. Other expense increased due increased bank clearing charges of $115,000; legal expenses primarily associated with Home Equity Lines of Credit of $110,000; increased costs for professional liability insurance of $66,000; and courier services of $58,000.
Income Taxes
Income taxes were $9.0 million for the year ended September 30, 2005 compared to $10.2 million for the year ended September 30, 2006. The effective income tax rate as a percentage of pretax income was 34.4% and 34.9% for the years ended September 30, 2005 and 2006, respectively. The effective income tax rate differs from the statutory rate primarily due to income generated by bank-owned life insurance, and municipal securities that are exempt from federal and certain state taxes. The Company’s effective income tax rates take into consideration certain assumptions and estimates made by management. No assurance can be given that either the tax returns submitted by management or the income tax reported on the consolidated financial statements will not be adjusted by either adverse rulings by the U.S. Tax court, changes in the tax code, or assessments made by the Internal Revenue Service. The Company is subject to potential adverse adjustments, including but not limited to: an increase in the statutory federal or state income tax rates, the permanent non-deductibility of amounts currently considered deductible either now or in future periods, and the dependency on the generation of future taxable income, in order to ultimately realize deferred income tax assets.
Results of Operations
Comparison of the Years Ended September 30, 2004 and 2005
Interest Income
Interest income for the year ended September 30, 2005, increased to $78.6 million as compared to $65.8 million for the year ended September 30, 2004. The earning asset yield for the year ended September 30, 2005, was 5.94% compared to a yield of 5.67% for the year ended September 30, 2004. The average yield on loans receivable for the year ended September 30, 2005, was 6.50% compared to 6.17% for the year ended September 30, 2004. The increased yield on loans is primarily due to the increased yield on commercial loans with interest rates tied to the prime lending rate. The prime rate was 6.75% at September 30, 2005, compared to 4.75% at September 30, 2004. The yield on investments increased to 4.84% for the year ended September 30, 2005, from 4.72% for the year ended September 30, 2004. Total average interest-earning assets were $1.3 billion for the year ended September 30, 2005 as compared to $1.2 billion for the year ended September 30, 2004. The increase in average interest-earning assets is primarily due to an increase in average loans receivable of approximately $116.2 million resulting primarily from growth in the commercial loan portfolio. Average investment securities, mortgage-backed securities and other interest-earning assets increased $45.8 million, primarily funded by borrowings, including brokered CD’s.
Interest Expense
Interest expense on interest-bearing liabilities was $29.7 million for the year ended September 30, 2005, as compared to $23.5 million for the year ended September 30, 2004. The average cost of deposits for the year ended September 30, 2005, was 1.58% compared to 1.39% for the year ended September 30, 2004. The cost of interest-bearing liabilities was 2.24% for the year ended September 30, 2005 compared to 2.03% for the year ended September 30, 2004. The cost of FHLB advances, reverse repurchase agreements and other borrowings was 3.83%, 2.37% and 5.95%, respectively, for the year ended September 30, 2005. For the year
45
COASTAL FINANCIAL CORPORATION AND SUBSIDIARIES
Management’s Discussion and Analysis - Continued
ended September 30, 2004, the cost of FHLB advances, reverse repurchase agreements and other borrowings was 3.81%, 1.50% and 4.41%, respectively. The increased cost of funds on other borrowings is due to the increased short-term interest rates. At September 30, 2005, the federal funds rate was 3.93% compared to 1.94% at September 30, 2004. Total average interest-bearing liabilities increased from $1.2 billion at September 30, 2004 to $1.3 billion at September 30, 2005. The increase in average interest-bearing liabilities is due to an increase in average deposits of approximately $171.9 million as a result of the Company’s focus on checking growth, increased average FHLB advances of $40.7 million used to fund loan and investment securities growth and increased average Customer repurchase agreements of $18.5 million. Included in increased average deposits, were brokered CD’s which increased by $79.4 million in average balances when comparing the two periods. This increase was partially offset by a decrease in average reverse repurchase agreements of $61.1 million.
Net Interest Income
Net interest income was $48.8 million for the year ended September 30, 2005, as compared to $42.3 million for the year ended September 30, 2004. The net interest margin was 3.70% for the year ended September 30, 2005, compared to 3.64% for the year ended September 30, 2004.
The following table summarizes the average balance sheet and the related yields on interest-earning assets and deposits and borrowings for the year ended September 30, 2004 and 2005 (Dollars in thousands):
|
|
|
|
|
|
|
|
|
|
|
|
|
|
|
|
|
|
|
|
|
| 2004 |
| 2005 |
| ||||||||||||||
|
|
|
| ||||||||||||||||
|
| Average |
| Income/ |
| Yield/Rate | Average |
| Income/ |
| Yield/Rate | ||||||||
|
|
|
|
|
| ||||||||||||||
Assets |
|
|
|
|
|
|
|
|
|
|
|
|
|
|
|
|
|
|
|
Earning assets |
| $ | 757,633 |
| $ | 46,765 |
|
| 6.17 | % | $ | 873,797 |
| $ | 56,826 |
|
| 6.50 | % |
Investment securities, MBS securities and others (3) |
|
| 403,610 |
|
| 19,040 |
|
| 4.72 | % |
| 449,402 |
|
| 21,732 |
|
| 4.84 | % |
|
|
|
|
|
|
|
|
|
|
|
| ||||||||
Total earning assets |
| $ | 1,161,243 |
| $ | 65,805 |
|
| 5.67 | % | $ | 1,323,199 |
| $ | 78,558 |
|
| 5.94 | % |
|
|
|
|
|
|
|
|
|
|
|
| ||||||||
|
|
|
|
|
|
|
|
|
|
|
|
|
|
|
|
|
|
|
|
Liabilities |
|
|
|
|
|
|
|
|
|
|
|
|
|
|
|
|
|
|
|
Deposits |
| $ | 719,125 |
| $ | 10,024 |
|
| 1.39 | % | $ | 890,992 |
| $ | 14,079 |
|
| 1.58 | % |
Borrowings |
|
| 440,279 |
|
| 13,500 |
|
| 3.07 | % |
| 438,329 |
|
| 15,651 |
|
| 3.57 | % |
|
|
|
|
|
|
|
|
|
|
|
| ||||||||
Total interest-bearing liabilities |
| $ | 1,159,404 |
| $ | 23,524 |
|
| 2.03 | % | $ | 1,329,321 |
| $ | 29,730 |
|
| 2.24 | % |
|
|
|
|
|
|
|
|
|
|
|
| ||||||||
| |||||||||||||||||||
Net interest income |
|
|
|
| $ | 42,281 |
|
|
|
|
|
|
| $ | 48,828 |
|
|
|
|
|
|
|
|
|
|
|
|
|
|
|
|
|
|
|
| ||||
Net interest margin |
|
|
|
|
|
|
|
| 3.64 | % |
|
|
|
|
|
|
| 3.70 | % |
Net yield on earning assets |
|
|
|
|
|
|
|
| 3.64 | % |
|
|
|
|
|
|
| 3.69 | % |
|
|
(1) | The average balances are derived from monthly balances. |
|
|
(2) | Nonaccrual loans are included in average balances for yield computations. |
|
|
(3) | Investment securities include taxable and tax-exempt securities. Net interest income has not been adjusted to produce a tax-equivalent yield. |
Provision for Loan Losses
The Company’s provision for loan losses decreased from $1.8 million for the year ended September 30, 2004, to $1.7 million for the year ended September 30, 2005 primarily due to the risk factors related to the underlying portfolio. The allowance for loan losses as a percentage of loans was 1.25% at September 30, 2005 as compared to 1.39% at September 30, 2004. Loans delinquent 90 days or more were $2.6 million or 0.28% of total loans at September 30, 2005, compared to $5.9 million or 0.73% of total loans at September 30, 2004. The allowance for loan losses was 445% of loans delinquent 90 days or more at September 30, 2005, compared to 189% at September 30, 2004. Net charge-offs for the year ended September 30, 2005 were $1.0 million compared to $505,000 for the year ended September 30, 2004. Included in charge-offs for the year ended September 30, 2005 were two loans totaling $196,000 guaranteed by the Small Business Administration (SBA). The SBA has denied the guarantee. The Bank is appealing this decision. Management believes that the level of the allowance for loan losses at September 30, 2005 is adequate considering the composition of the loan portfolio, the portfolio’s loss experience, delinquency trends, current regional and local economic conditions and other factors at that date.
46
COASTAL FINANCIAL CORPORATION AND SUBSIDIARIES
Management’s Discussion and Analysis - Continued
Other Income
For the year ended September 30, 2005, other income was $12.5 million compared to $9.2 million for the year ended September 30, 2004. Fees and service charges from deposit accounts increased $2.4 million or 62.7% to $6.1 million for the year ended September 30, 2005, compared to $3.8 million for the year ended September 30, 2004. The majority of this increase is due to fee income from increased number of personal checking accounts. In fiscal 2005, checking account balances grew approximately 54%. During the year ended September 30, 2004, the Company securitized and concurrently sold $46.8 million of mortgage loans compared to $52.6 million for the year ended September 30, 2005. Gain on sale of loans was $1.2 million for the year ended September 30, 2005, compared to $1.5 million for the year ended September 30, 2004. Losses on sales of securities available for sale were $485,000 for the year ended September 30, 2005, compared to losses of $1.1 million for the year ended September 30, 2004. In addition, the Company had a gain on call of an investment security held to maturity called by the issuer of $160,000 for the year ended September 30, 2005 and $0 for the year ended September 30, 2004. Due to the increase in checking accounts, income from ATM and debit card transactions increased 60.6% from $954,000 in fiscal 2004 to $1.5 million in fiscal 2005.
General and Administrative Expenses
General and administrative expenses were $33.5 million for the year ended September 30, 2005 compared to $27.3 million for the year ended September 30, 2004. Salaries and employee benefits were $18.5 million for the year ended September 30, 2005, as compared to $16.1 million for the year ended September 30, 2004, an increase of 14.7%, primarily due to an increase in the number of banking Associates in business banking, Associates in the Company’s expanded hours call center, Associates in new branches and normal salary increases. The Company has added several Associates in a Banking Group that is focused on growing small to medium sized business banking relationships. Also, as a result of new branches, equipment purchased to improve Customer convenience and increased checking activity, net occupancy, furniture and fixtures and data processing expenses increased $843,000 and depreciation expense increased $582,000, when comparing the two periods. Marketing expenses were $905,000 for the year ended September 30, 2004, compared to $1.8 million for the year ended September 30, 2005. This is primarily attributed to the Bank’s “The Carolinas’ Best Totally Free Checking With A Gift” initiative; introduction of Penny Pavilion, the Bank’s free coin counting service; marketing of the Bank’s expanded banking hours, including Saturday banking at all Bank branches; and marketing of the Bank’s new branch in Wilmington, NC. The Bank’s “The Carolinas’ Best Totally Free Checking With A Gift” promotion involves significant direct mail advertising as well as direct media advertising. Expenses related to ATM and debit card transactions increased $409,000 or 64.9% when comparing fiscal 2004 to 2005. Other expense was $3.3 million for the year ended September 30, 2004 compared to $4.5 million for the year ended September 30, 2005. Other expense increased due to loss on write-off of signage related to the Bank’s re-branding efforts in conjunction with the initiation of “6 Day Branch Banking” of $122,000, increased costs incurred related to compliance with Sarbanes-Oxley of $428,000 and increased deposit account losses of $370,000. The increase in net deposit losses is directly attributed to the increased number of personal checking accounts.
Income Taxes
Income taxes were $7.6 million for the year ended September 30, 2004 compared to $9.0 million for the year ended September 30, 2005. The effective income tax rate as a percentage of pretax income was 34.0% and 34.4% for the years ended September 30, 2004 and 2005, respectively. The effective income tax rate differs from the statutory rate primarily due to income generated by bank-owned life insurance, municipal securities that are exempt from federal and certain state taxes, and the increase in the current fiscal year earnings over the comparable prior year earnings that are subject to higher incremental tax rates. The Company’s effective income tax rates take into consideration certain assumptions and estimates made by management. No assurance can be given that either the tax returns submitted by management or the income tax reported on the consolidated financial statements will not be adjusted by either adverse rulings by the U.S. Tax court, changes in the tax code, or assessments made by the Internal Revenue Service. The Company is subject to potential adverse adjustments, including but not limited to: an increase in the statutory federal or state income tax rates, the permanent non-deductibility of amounts currently considered deductible either now or in future periods, and the dependency on the generation of future taxable income, in order to ultimately realize deferred income tax assets.
Non-performing Assets
Non-performing assets were $3.6 million at September 30, 2006 compared to $3.5 million at September 30, 2005. Loans past due 90 days or more increased to $3.0 million at September 30, 2006, from $2.6 million at September 30, 2005. Real estate acquired through foreclosure decreased slightly from $818,000 at September 30, 2005, to $571,000 at September 30, 2006.
At September 30, 2005, impaired loans totaled $2.6 million. There were $3.5 million in impaired loans at September 30, 2006. Included in the allowance for loan losses at September 30, 2005 was $434,000 related to impaired loans compared to $235,000 at September 30, 2006. The average recorded investment in impaired loans for the year ended September 30, 2005 was $3.7 million compared to $2.8 million for the year ended September 30, 2006. Interest income recognized on impaired loans in fiscal 2005 was $292,000. Interest income recognized on impaired loans in fiscal 2006 was $168,000.
47
COASTAL FINANCIAL CORPORATION AND SUBSIDIARIES
Management’s Discussion and Analysis - Continued
Loans are reviewed on a regular basis and an allowance for uncollectible interest is established on loans where collection is questionable, generally when such loans become 90 days delinquent. Loan balances for which interest amounts have been reserved and all loans more than 90 days delinquent are placed on nonaccrual status. Typically, payments received on a nonaccrual loan are applied to the outstanding principal or recognized as interest based upon the collectability of the loan as determined by management.
Allowance for Loan Losses
The adequacy of the allowance is analyzed on a quarterly basis. For purposes of this analysis, adequacy is defined as a level of reserves sufficient to absorb probable losses inherent in the portfolio. The methodology employed for this analysis considers historical loan loss experience, the results of loan reviews, current economic conditions, and other qualitative and quantitative factors that warrant current consideration in determining an adequate allowance.
The evaluation of the allowance is segregated into general allocations and specific allocations. For general allocations, the portfolio is segregated into risk-similar segments for which historical loss ratios are calculated and adjusted for identified trends or changes in current portfolio characteristics. Historical loss ratios are calculated by product type for consumer loans (installment and revolving), mortgage loans, and commercial loans and may be adjusted for other risk factors. To allow for modeling error, a range of probable loss ratios is then derived for each segment. The resulting percentages are then applied to the dollar amounts of the loans in each segment to arrive at each segment’s range of probable loss levels.
Certain non-performing loans are individually assessed for impairment under SFAS 114 and assigned specific allocations. Other identified high-risk loans or credit relationships based on internal risk ratings are also individually assessed and assigned specific allocations.
The general allocation also includes a component for probable losses inherent in the portfolio, based on management’s analysis, that are not fully captured elsewhere in the allowance. This component serves to address the inherent estimation and imprecision risk in the methodology as well as address management’s evaluation of various factors or conditions not otherwise directly measured in the evaluation of the general and specific allocations. Such factors or conditions may include evaluation of current general economic and business conditions; geographic, collateral, or other concentrations; system, procedural, policy, or underwriting changes; experience of lending staff; entry into new markets or new product offerings; and results from internal and external portfolio examinations.
The allocation of the allowance to the respective loan segments is an approximation and not necessarily indicative of future losses or future allocations. The entire allowance is available to absorb losses occurring in the overall loan portfolio.
Assessing the adequacy of the allowance is a process that requires considerable judgment. Management’s methodology and judgments are based on the information currently available and includes numerous assumptions about current events, which we believe to be reasonable, but which may or may not be valid. Thus, there can be no assurance that loan losses in future periods will not exceed the current allowance amount or that future increases in the allowance will not be required. No assurance can be given that management’s ongoing evaluation of the loan portfolio in light of changing economic conditions and other relevant circumstances will not require significant future additions to the allowance, thus adversely affecting the operating results of the Company. Management believes that the current level of the allowance for loan losses is presently adequate considering the composition of the loan portfolio, the portfolio’s loss experience, delinquency trends, current regional and local economic conditions and other factors.
The allowance is also subject to examination and adequacy testing by regulatory agencies, which may consider such factors as the methodology used to determine adequacy and the size of the allowance relative to that of peer institutions, and other adequacy tests. In addition, such regulatory agencies could require the Company to adjust the allowance based on information available to them at the time of their examination.
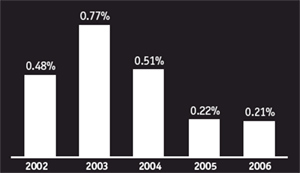
The Company established provisions for loan losses for the years ended September 30, 2004, 2005 and 2006, of $1.8 million, $1.7 million and $1.4 million, respectively. For the years ended September 30, 2004, 2005 and 2006, the Company had net charge-offs of $505,000, $1.0 million and $407,000, respectively. Net charge-offs as a percentage of average outstanding loans were ..07%, .12%, and .04% for fiscal years ended 2004, 2005 and 2006, respectively. At September 30, 2006, the Company had an allowance for loan losses of $12.7 million, which was 1.17% of net loans.
Off-Balance Sheet Arrangements
In the normal course of operations, the Company engages in a variety of financial transactions that, in accordance with generally accepted accounting principles, are not recorded in the financial statements, or are recorded in amounts that differ from the notional amounts. These transactions involve, to varying degrees, elements of credit, interest rate, and liquidity risk. Such transactions are used
48
COASTAL FINANCIAL CORPORATION AND SUBSIDIARIES
Management’s Discussion and Analysis - Continued
by the Company for general corporate purposes or for Customer needs. Corporate purpose transactions are used to help manage credit, interest rate, and liquidity risk or to optimize capital. Customer transactions are used to manage Customers’ requests for funding.
The Company’s off-balance sheet arrangements, which principally include lending commitments and derivatives are described below.
Lending Commitments. Lending commitments include loan commitments, standby letters of credit and unused business and personal credit card lines. These instruments are not recorded in the consolidated statements of financial condition until funds are advanced under the commitments. The Company provides these lending commitments to Customers in the normal course of business.
Loan commitments for residential housing and land totaled $23.3 million. For retail Customers, loan commitments are generally lines of credit secured by residential property. At September 30, 2006 retail loan commitments totaled $55.5 million. Standby letters of credit are conditional commitments to guarantee performance, typically contract or financial integrity, of a Customer to a third party and totaled $11.4 million at September 30, 2006. Commercial lines of credit and unused business and personal credit card lines, which totaled $135.6 million at September 30, 2006, are generally for short-term borrowings.
The Company applies essentially the same credit policies and standards as it does in the lending process when making these commitments.
Derivatives. In accordance with SFAS No. 133, the Company records derivatives at fair value, as either assets or liabilities, on the consolidated balance sheet. Derivative transactions are measured in terms of the notional amount, but this amount is not recorded on the balance sheet and is not, when viewed in isolation, a meaningful measure of the risk profile of the instrument. The notional amount is not exchanged, but is used only as the basis upon which interest and other payments are calculated.
At September 30, 2006, the fair value of derivative assets totaled $31,000, net. The related notional amounts, which are not recorded on the consolidated balance sheet, totaled $5.6 million for the derivative assets and $4.0 million for the derivative liabilities. (See Note 23 of the Notes to Consolidated Financial Statements).
Interest Rate Risk Disclosure
The Bank’s Asset Liability Management Committee (“ALCO”) monitors and considers methods of managing exposure to interest rate risk. The ALCO consists of members of the Board of Directors and Senior Leadership of the Company and meets quarterly. The Bank’s exposure to interest rate risk is reviewed on at least a quarterly basis by the ALCO. Interest rate risk exposure is measured using interest rate sensitivity analysis to determine the Bank’s change in net portfolio value in the event of hypothetical changes in interest rates. The ALCO is charged with the responsibility to maintain the level of sensitivity of the Bank’s net portfolio value within Board approved limits.
Net portfolio value (NPV) represents the market value of portfolio equity and is equal to the market value of assets minus the market value of liabilities, with adjustments made for off-balance sheet items over a range of assumed changes in market interest rates. The Bank’s Board of Directors has adopted an interest rate risk policy which establishes maximum allowable decreases in NPV in the event of a sudden and sustained one hundred to four hundred basis point increase or decrease in market interest rates. The following table presents the Bank’s projected change in NPV as computed by the OTS for the various rate shock levels as of September 30, 2006.
|
|
|
|
|
|
|
|
|
|
|
|
|
|
|
|
|
Change in Interest Rates |
|
| Board Limit |
| Board Limit | Market Value |
| Market Value |
|
| NPV | |||||
|
|
|
|
|
| |||||||||||
300 basis point rise |
|
| 5.00 | % |
| 400 BPS |
| $ | 1,658,193 |
| $ | 176,374 |
|
| 10.64 | % |
200 basis point rise |
|
| 6.00 | % |
| 300 BPS |
| $ | 1,679,009 |
| $ | 187,916 |
|
| 11.19 | % |
100 basis point rise |
|
| 6.00 | % |
| 250 BPS |
| $ | 1,698,259 |
| $ | 196,866 |
|
| 11.59 | % |
No Change |
|
| 6.00 | % |
|
|
| $ | 1,715,670 |
| $ | 203,444 |
|
| 11.86 | % |
100 basis point decline |
|
| 6.00 | % |
| 250 BPS |
| $ | 1,733,420 |
| $ | 209,896 |
|
| 12.11 | % |
200 basis point decline |
|
| 6.00 | % |
| 300 BPS |
| $ | 1,747,920 |
| $ | 212,466 |
|
| 12.18 | % |
300 basis point decline |
|
| 6.00 | % |
| 350 BPS |
|
| N/A |
|
| N/A |
|
| N/A |
|
The preceding table indicates that at September 30, 2006, in the event of a sudden and sustained increase in prevailing market interest rates, the Bank’s NPV would be expected to decrease, and that in the event of a sudden decrease in prevailing market interest rates, the Bank’s NPV would be expected to increase minimally. At September 30, 2006, the Bank’s estimated changes in NPV were within the limits established by the Board of Directors.
49
COASTAL FINANCIAL CORPORATION AND SUBSIDIARIES
Management’s Discussion and Analysis - Continued
Computation of prospective effects of hypothetical interest rate changes are based on numerous assumptions, including relative levels of market interest rates, loan prepayments and deposit decay, and should not be relied upon as indicative of actual results. Further, the computations do not contemplate any actions the ALCO could undertake in response to sudden changes in interest rates.
The Bank also uses interest rate sensitivity gap analysis to monitor the relationship between the maturity and repricing of its interest-earning assets and interest-bearing liabilities. Interest rate sensitivity gap is defined as the difference between the amount of interest-earning assets maturing or repricing within a specific time period and the amount of interest-bearing liabilities maturing or repricing within the same time period. A gap is considered positive when the amount of interest-rate-sensitive assets exceeds the amount of interest-rate-sensitive liabilities. Generally, during a period of rising rates, a positive gap would result in an increase in net interest income. Conversely, during a period of falling interest rates, a positive gap would result in a decrease in net interest income. It is ALCO’s goal to maintain reasonable balance between exposure to interest rate fluctuations and earnings.
Recently Adopted Accounting Pronouncements
In December 2004, the Financial Accounting Standards Board issued Statement of Financial Accounting Standard No. 123R, Share-Based Payment which revised SFAS No. 123, Accounting for Stock-Based Compensation. This Statement supersedes APB Opinion No. 25, Accounting for Stock Issued to Employees, and related implementation guidance and amends SFAS No. 95, Statement of Cash Flows. It requires that all stock-based compensation now be measured at fair value and recognized as expense in the income statement. This Statement also clarifies and expands guidance on measuring fair value of stock compensation, requires estimation of forfeitures when determining expense, and requires that excess tax benefits be shown as financing cash inflows versus a reduction of taxes paid in the Statement of Cash Flows. Various other changes are also required. The Company adopted this Statement effective beginning October 1, 2005. The Company experienced no significant effect on its financial statements as a result of the adoption of this Statement. The adoption of this pronouncement and its effects on the consolidated financial statements of the Company are more fully described in Note 1(p) in the Notes to Consolidated Financial Statements.
On November 10, 2005, the FASB issued FASB Staff Position (FSP) FAS 123R-3,Transition Election Related to Accounting for the Effects of Share-Based Payment Awards(FSP FAS 123R-3). This FSP provides a practical transition election related to accounting for the tax effects of share-based payment awards to employees. An entity shall follow either the transition guidance for additional paid-in capital pool in SFAS 123R or the alternative transition method described in a one-time election to adopt the transition method described in this FSP. The Company may take up to one year from its initial adoption of SFAS 123R to evaluate its available alternatives and makes its one-time election. Effective October 1, 2006, the Company adopted the alternative transition method under FSP FAS 123R-3. Adoption of this FSP is not expected to have a significant impact on the Company’s financial position and is expected to increase fully diluted earnings per share by approximately $.01. In addition, the effects of applying this FSP will be reported as a change in accounting principle in accordance with FASB Statement No. 154 “Accounting Changes and Error Corrections” in the year of adoption. The adoption of this pronouncement and its effects on the consolidated financial statements of the Company are more fully described in Note 1(p) in the Notes to Consolidated Financial Statements.
Recently Issued Accounting Pronouncements
In May 2005, the Financial Accounting Standards Board (FASB) issued Statement of Financial Accounting Standards No. 154, “Accounting for Changes and Error Corrections – a replacement of Accounting Principles Board Opinion No. 20 and FASB Statement No. 3 (FAS 154),” which eliminates the requirement to reflect changes in accounting principles as cumulative adjustments to net income in the period of change and requires retrospective application to prior periods’ financial statements for voluntary changes in accounting principle, unless it is impracticable to determine either the period-specific effects or the cumulative effect of the change. If it is impracticable to determine the cumulative effect of the change to all prior periods, FAS 154 requires the new accounting principle to be adopted prospectively. For new accounting pronouncements, the transition guidance in the pronouncement should be followed. Retrospective application refers to the application of a different accounting principle to previously issued financial statements as if that principle had always been used. FAS 154 did not change the guidance for reporting corrections of errors, changes in estimates or for justification of a change in accounting principle on the basis of preferability. FAS 154 is effective for accounting changes made in fiscal years beginning after December 15, 2005 (October 1, 2006 for the Company). The Company does not expect the adoption of FAS 154 to have a material effect on the results of operations or statement of condition.
In February 2006, the FASB issued SFAS No. 155, “Accounting for Certain Hybrid Financial Instruments” an amendment of FASB Statements No. 133 and 140 (FAS 155). FAS 155 permits fair value re-measurement for any hybrid financial instrument that contains an embedded derivative that otherwise would require bifurcation, clarifies which interest only-strips and principal-only strips are not subject to the requirements of Statement 133, establishes a requirement to evaluate interests in securitized financial assets to identify
50
COASTAL FINANCIAL CORPORATION AND SUBSIDIARIES
Management’s Discussion and Analysis - Continued
interests that are freestanding derivatives or that are hybrid financial instruments that contain an embedded derivative requiring bifurcation, clarifies that concentrations of credit risk in the form of subordination are not embedded derivatives, and amends Statement 140 to eliminate the prohibition on a qualifying special purpose entity from holding a derivative financial instrument that pertains to a beneficial interest other than another derivative financial instrument. FAS 155 is effective for all financial instruments acquired or issued after the beginning of an entity’s first fiscal year that begins after September 15, 2006 (October 1, 2006 for the Company). The Company does not expect the adoption of FAS 155 to have a material effect on the results of operations or statement of condition.
In March 2006, FASB issued SFAS No. 156 “Accounting for Servicing of Financials Assets” an amendment of FASB Statement No. 140 (FAS 140 and FAS 156). FAS 140 establishes, among other things, the accounting for all separately recognized servicing assets and servicing liabilities. This Statement amends FAS 140 to require that all separately recognized servicing assets and servicing liabilities be initially measured at fair value, if practicable. This Statement permits, but does not require, the subsequent measurement of separately recognized servicing assets and servicing liabilities at fair value. Under this Statement, an entity can elect subsequent fair value measurement to account for its separately recognized servicing assets and servicing liabilities. Adoption of this Statement is required as of the beginning of the first fiscal year that begins after September 15, 2006. Upon adoption, the Company will apply the requirements for recognition and initial measurement of servicing assets and servicing liabilities prospectively to all transactions. The Company will adopt FAS 156 for the fiscal year beginning October 1, 2006 and currently has not determined if it will adopt FAS 156 using the fair value election.
In September 2006, the FASB issued SFAS No. 157 (FAS 157), “Fair Value Measurements”, which defines fair value, establishes guidlines for measuring fair value and expands disclosure regarding fair value measurements. FAS 157 does not require any new fair value measurements, but rather eliminates inconsistencies found in various prior accounting pronouncements. FAS 157 is effective for fiscal years beginning after November 15, 2007 (October 1, 2008 for the Company). The Company is currently not in a position to determine the effect of adopting this standard on its consolidated financial statements.
In July 2006, The FASB issued Interpretation No. 48 (FIN 48), “Accounting for Uncertainty in Income Taxes,” which clarifies the accounting for uncertainty in income taxes recognized in the financial statements in accordance with FASB Statement No. 109, “Accounting for Income Taxes.” FIN 48 provides guidance on the financial statement recognition and measurement of a tax position taken or expected to be taken in a tax return. FIN 48 also provides guidance on de-recognition, classification, interest and penalties, accounting in interim periods, disclosures and transition. FIN 48 is effective for fiscal years beginning after December 15, 2006 (October 1, 2007 for the Company). The Company is currently evaluating the impact of this standard on its results of operations and statement of condition.
In September 2006, the Securities and Exchange Commission (SEC) Office of the Chief Accountant and Divisions of Corporation Finance and Investment Management released Staff Accounting Bulletin No. 108 (SAB 108), “Considering the Effects of Prior Year Misstatements when Quantifying Misstatements in Current Year Financial Statements,” that provides interpretive guidance on how the effects of the carryover or reversal of prior year misstatements should be considered in quantifying a current year misstatement. The SEC staff believes that registrants should quantify errors using both a balance sheet and an income statement approach to evaluate whether either approach results in quantifying a misstatement that, when all relevant quantitative and qualitative factors are considered, is material. SAB 108 is effective for fiscal years ending after November 15, 2006 (September 30, 2007 for the Company). The Company is currently evaluating the impact of this standard on its results of operations and statement of condition.
Capital Standards and Regulatory Matters
The Bank’s capital standards include: (1) a leverage limit requiring all OTS chartered financial institutions to maintain core capital in an amount not less than 4% of the financial institution’s total assets; (2) a tangible capital requirement of not less than 1.5% of total assets; and (3) a risk-based capital requirement of not less than 8.0% of risk weighted assets. For further information concerning the Bank’s capital standards, refer to Note 14 of the Notes to the Consolidated Financial Statements.
Effects of Inflation and Changing Prices
The consolidated financial statements have been prepared in accordance with U.S. generally accepted accounting principles which require the measurement of financial position and results of operations in terms of historical dollars, without consideration of change in the relative purchasing power over time due to inflation. Unlike most industrial companies, virtually all of the assets and liabilities of a financial institution are monetary in nature. As a result, interest rates have a more significant impact on a financial institution’s performance than the effect of inflation. Interest rates do not necessarily change in the same magnitude as the price of goods and services.
51
Board of Directors
|
|
Coastal Financial Corporation | |
|
|
| E. Lawton Benton |
| President |
| C.L. Benton & Sons, Inc. |
|
|
| G. David Bishop |
| Managing Director |
| White Harvest Trading Co., LLC |
|
|
| J. Robert Calliham |
| President and Chief Executive Officer |
| Smith, Sapp, Bookhout, Crumpler & |
| Calliham, P.A. |
|
|
| James T. Clemmons |
| Chairman |
| Coastal Financial Corporation |
|
|
| James P. Creel |
| President |
| Creel Corporation |
|
|
| James. H. Dusenbury |
| Retired – Attorney |
| Dusenbury and Clarkson Law Firm |
|
|
| Michael C. Gerald |
| President and Chief Executive Officer |
| Coastal Financial Corporation |
|
|
| William O. Marsh |
| President |
| Palmetto Chevrolet |
|
|
| Frank A. Thompson, II |
| President |
| Peoples Underwriters, Inc. |
|
|
| W. Cecil Worsley, III |
| President and Chief Executive Officer |
| Worsley Companies |
|
|
Coastal Federal Bank | |
|
|
| E. Lawton Benton |
| President |
| C.L. Benton & Sons, Inc. |
|
|
| G. David Bishop |
| Managing Director |
| White Harvest Trading Co., LLC |
|
|
| J. Robert Calliham |
| President and Chief Executive Officer |
| Smith, Sapp, Bookhout, Crumpler & |
| Calliham, P.A. |
|
|
| James T. Clemmons |
| Chairman |
| Coastal Federal Bank |
|
|
| James P. Creel |
| President |
| Creel Corporation |
|
|
| James. H. Dusenbury |
| Retired – Attorney |
| Dusenbury and Clarkson Law Firm |
|
|
| Michael C. Gerald |
| President and Chief Executive Officer |
| Coastal Federal Bank |
|
|
| William O. Marsh |
| President |
| Palmetto Chevrolet |
|
|
| Frank A. Thompson, II |
| President |
| Peoples Underwriters, Inc. |
|
|
| W. Cecil Worsley, III |
| President and Chief Executive Officer |
| Worsley Companies |
|
|
Coastal Planners Holding Corporation | |
|
|
| James T. Clemmons |
| Chairman |
| Coastal Financial Corporation |
|
|
| Michael C. Gerald |
| President and Chief Executive Officer |
| Coastal Financial Corporation |
|
|
| Jerry L. Rexroad, CPA |
| Chief Financial Officer |
| Coastal Planners Holding Corporation |
52
COASTAL FINANCIAL CORPORATION
Leadership Group
| Sherri Adams |
| Branch Manager |
| North Myrtle Beach Branch |
|
|
| Ginger Allen |
| AVP Underwriter Group Leader |
|
|
| Tony Ambuhl |
| AVP Commercial Banking Officer |
|
|
| Phillip Ammons |
| VP Community Banking Leader |
|
|
| Donna Bailey |
| AVP Branch Operations Specialist |
|
|
| Randy Baker |
| VP Network Services |
| Group Leader |
|
|
| Jeffrey Benjamin |
| SVP Credit Administration |
| Group Leader |
|
|
| April Benton |
| Staffing Group Leader |
|
|
| Steven Brockmann |
| AVP Investment Rep-CIS |
|
|
| Cynthia Buffington |
| AVP Item Processing |
| Group Leader |
|
|
| Ronnie Burbank |
| VP Sr. Banking Leader |
|
|
| Anne Caldwell |
| VP - Deposit Servicing |
| Group Leader |
|
|
| Marie Canady |
| Mortgage Specialist |
| Group Leader |
|
|
| Tamra Cannon |
| AVP Sr. Branch Manager |
|
|
Christopher Carbone | |
| VP Senior Business Banking Officer |
|
|
| Shonda Chestnut |
| AVP Loan Officer II |
|
|
| Christopher Clark |
| AVP Business Banking Officer |
|
|
| Deanna Cooke |
| AVP Fiserv Applications Support |
| Group Leader |
|
|
| Susan J. Cooke |
| SVP Adminstrative Services |
| Group Leader |
| Corporate Secretary |
|
|
| Marshall Cooper |
| AVP Sr. Banking Leader |
| |
| Benjamin Corley |
| Sr. Branch Manager |
| Southport Branch |
|
|
| Joe Cox |
| VP Community Banking Leader |
|
|
| John Creamer |
| VP Investment Rep-CIS |
|
|
Perry L. Dalton | |
| Service Leader |
| Oak Street Branch |
|
|
| Gwendolyn Davis |
| Branch Manager |
| Murrells Inlet Branch |
|
|
| Deborah Dillard |
| Branch Manager |
| Sunset Beach Branch |
|
|
| Robert D. Douglas |
| EVP Human Resources |
| Group Leader |
|
|
| Tiffany Dudley |
| AVP Electronic Banking |
| Group Leader |
|
|
| Trina Dusenbury |
| SVP Residential Banking |
| Operations Group Leader |
|
|
| Brandon Edens |
| AVP Sr. Branch Manager |
|
|
| Michael Evans |
| VP Loan Review Group Leader |
|
|
| Rita Fecteau |
| VP Accounting Group Leader |
|
|
| Patricia Floyd |
| VP Branch Development |
| Coordinator |
|
|
| Daniel Fogle |
| VP Community Banking Leader |
|
|
| Joel Foster |
| SVP Loan Administration |
| Group Leader |
|
|
| William Gehman |
| SVP Corporate Controller |
|
|
| Mary Geist |
| VP IT Administration |
|
|
| Michael C. Gerald |
| President & CEO |
|
|
| Jimmy R. Graham |
| EVP Chief Operations Officer |
| |
| E. Haden Hamilton Jr. |
| President -CIS |
|
|
| Don Hamilton |
| VP Residential Brokerage Leader |
|
|
| Kathy Hane |
| AVP Sr. Branch Manager |
|
|
| Lauren Henson |
| SVP Dean Of CFU |
|
|
| Jennifer Henthorn |
| Branch Manager |
| Southport Branch |
|
|
| Mike Hill |
| VP Investment Rep-CIS |
|
|
| Debra Hinson |
| VP Operations Group Leader-CIS |
|
|
| Christopher Hipp |
| Branch Manager |
| Stephen’s Crossroads Branch |
|
|
| Glenn Humbert |
| SVP NC Banking Group Leader |
|
|
| Cameron Jackson |
| AVP Consumer Loan Administrator |
|
|
| Mike Jackson |
| VP Sr. Banking Leader |
|
|
| Lisa James |
| SVP Operations Group Leader |
|
|
| Wendy Johnson |
| Branch Manager |
| Loris Branch |
|
|
| Jennifer Julian |
| AVP Facility Services |
| Group Leader |
|
|
| Ruthie Kearns |
| SVP Community Relations Officer |
|
|
| Alvin Kennedy |
| Branch Manager |
| Hwy 544 West Branch |
|
|
| Kara Kessinger |
| President-CRETP |
|
|
| Eric Keys |
| VP - Sr. Commercial Banking Leader |
|
|
| Linwood Koonce Jr |
| AVP Banking Closing Group Leader |
53
COASTAL FINANCIAL CORPORATION
Leadership Group - Continued
|
|
| Louis LaBruce |
| VP Sr. Banking Leader |
|
|
| Justin Lee |
| AVP Commercial/Residential Officer |
|
|
| Edward Loehr Jr. |
| VP Budgeting & Treasury |
|
|
| Mary Lundy |
| Branch Manager |
| Shallotte Branch |
|
|
| Kathleen Lutes |
| AVP Secondary Marketing |
| Group Leader |
|
|
| Leslie Lydon |
| VP Residential Banking Sales |
|
|
| Patsy Madden |
| Residential Loan Servicing |
| Group Leader |
|
|
| Michael Mauney |
| VP Collections Group Leader |
|
|
| Amy McLaurin |
| AVP Sr. Banking Leader |
|
|
| Carol Mercolini |
| Branch Manager |
| Surfside Branch |
|
|
| Janice Metz |
| AVP Advertising Officer |
|
|
| Joy Metz |
| Sales Leader |
| Oak Street Branch |
|
|
| Abigail Mishoe |
| AVP Residential Banking Officer |
|
|
| Phyllis Monarch |
| Branch Manager |
| North Conway Branch |
|
|
| Leslie Morse |
| Commercial/Consumer Loan |
| Servicing Group Leader |
|
|
| Lynn Murray |
| SVP Checking Acct Product |
| Development & Managment Officer |
|
|
| Deborah Orobello |
| Branch Manager |
| Little River Branch |
|
|
| Bruce Patonay |
| Sr. Branch Manager |
| Dunes Branch |
|
|
| Charles Page |
| VP Commercial Banking Officer |
| |
| Dan Rettig |
| AVP Security Officer |
|
|
| Jerry L. Rexroad |
| EVP Chief Financial Officer |
|
|
| David Roe |
| SVP Business Banking Leader |
|
|
| Eulette Sauls |
| AVP Information Management |
| Group Leader |
|
|
| Sherry G. Schoolfield |
| VP Compliance Officer |
|
|
| Douglas E. Shaffer |
| SVP Horry County Banking |
| Group Leader |
|
|
| Steven J. Sherry |
| EVP Marketing Group Leader |
|
|
| Joseph Shumbo |
| AVP Residential Banking Officer |
|
|
| Leeann Slack |
| Operations Leader |
| Oak Street Branch |
|
|
| Dawn Small |
| AVP Branch Operations Leader |
|
|
| J. Marcus Smith Jr. |
| SVP Internal Audit |
| Group Leader |
|
|
| Marcus Smith |
| AVP Commercial Banking Officer |
|
|
| Phillip Stalvey |
| EVP Banking Group Leader |
|
|
| Allison Stout |
| Electronic Banking Business Services |
| Leader |
|
|
| Annette Stroud |
| Sr. Branch Manager |
| Carolina Forest Branch |
|
|
| Charlene Sullivan |
| Branch Manager |
| Socastee Branch |
|
|
| Sandra Szarek |
| AVP Commercial Loan Servicing |
| Group Leader |
|
|
| Andrea Taiani |
| Customer Service Group Leader |
| |
| James Talerico |
| AVP Sr. Business Banking Officer |
|
|
| Gary Thompson |
| VP Financial Reporting & |
| Compliance Leader |
|
|
| Matthew Towns |
| VP Credit Administration |
|
|
| Audrey Waldron |
| Branch Manager |
| Oak Island Branch |
|
|
| Douglas Walters |
| VP Residential Banking Officer |
|
|
| Brian White |
| SVP Chief Information Officer |
|
|
| Theresa Whitley |
| Construction Group Leader |
|
|
| Josh Wise |
| AVP Business Banking Loan |
| Administrator |
|
|
| Sandra R. Zanfini |
| AVP Corp. Support Group Leader |
| Asst. Corporate Secretary |
54
Branch Locations
|
|
| Coastal Federal Bank |
|
|
| Carolina Forest Branch |
| 3894 Renee Drive |
| Myrtle Beach, SC 29579 |
| 843.205.2016 |
|
|
| Conway Branch |
| 310 Wright Boulevard |
| Conway, SC 29526 |
| 843.205.2005 |
|
|
| Dunes Branch |
| 7500 North Kings Highway |
| Myrtle Beach, SC 29572 |
| 843.205.2001 |
|
|
| Highway 544 West Branch |
| 1571 Hwy 544 |
| Conway, SC 29526 |
| 843.205.2023 |
|
|
| Little River Branch |
| 1602 Highway 17 |
| Little River, SC 29566 |
| 843.205.2014 |
|
|
| Loris Branch |
| 3610 Broad Street |
| Loris, SC 29569 |
| 843.205.2018 |
|
|
| Murrells Inlet Branch |
| 3348 Highway 17 South |
| & Inlet Crossing |
| Murrells Inlet, SC 29576 |
| 843.205.2008 |
|
|
| North Conway Branch |
| 2600 Main Street |
| Conway, SC 29526 |
| 843.205.2017 |
|
|
| North Myrtle Beach Branch |
| 521 Main Street |
| North Myrtle Beach, SC 29582 |
| 843.205.2002 |
|
|
| Oak Island Branch |
| 8001 East Oak Island Drive |
| Oak Island, NC 28465 |
| 843.205.2036 |
| 910.201.1481 |
| |
| Oak Street Branch |
| 2619 Oak Street |
| Myrtle Beach, SC 29577-3129 |
| 843.205.2000 |
|
|
| Pawleys Island Branch |
| Coastal Federal Town Center |
| 11403 Ocean Highway |
| Pawleys Island, SC 29585 |
| 843.205.2020 |
|
|
| SayeBrook Branch |
| 201 Chartwell Court |
| Myrtle Beach, SC 29588 |
| 843.205.2024 |
|
|
| Shallotte Branch |
| 200 Smith Avenue |
| Shallotte, NC 28470 |
| 843.205.2035 |
| 910.754.6186 |
|
|
| Socastee Branch |
| 4801 Socastee Boulevard |
| Myrtle Beach, SC 29575 |
| 843.205.2007 |
|
|
| Southport Branch |
| 4956-1 Long Beach Road SE |
| Southport, NC 28461 |
| 843.205.2032 |
| 910.454.4173 |
|
|
| Stephens Crossroads Branch |
| 2496 Highway 9 East |
| Highways 9 and 57 |
| Little River, SC 29566 |
| 843.205.2013 |
|
|
| Sunset Beach Branch |
| 1625 Seaside Road SW |
| Sunset Beach, NC 28468 |
| 843.205.2012 |
| 910.579.8160 |
| |
| Surfside Branch |
| 112 Highway 17 South |
| & Glenns Bay Road |
| Surfside Beach, SC 29575 |
| 843.205.2003 |
|
|
| Waccamaw Medical Park Branch |
| 112 Waccamaw Medical Park Drive |
| Conway, SC 29526 |
| 843.205.2009 |
|
|
| 38th Avenue Branch (BI-LO) |
| 1245 38th Avenue North |
| Myrtle Beach, SC 29577 |
| 843.205.2041 |
|
|
| Wilmington Branch |
| 4320 17th Street Extension |
| Wilmington, NC 28412 |
| 843.205.2034 |
| 910.392.2265 |
|
|
| Wilmington Branch |
| 5710 Oleander Drive, Suite 209 |
| Wilmington, NC 28403 |
| 843.205.2031 |
| 910.313.1161 |
|
|
| Wilmington Branch |
| 109 Market Street |
| Wilmington, NC 28401 |
| 843.205.2033 |
| 910.763.2372 |
55
Corporate Information
Common Stock and Dividend Information
The common stock of Coastal Financial Corporation is quoted through the Nasdaq Stock Market under the symbol CFCP. For information contact the Stockholder Relations office.
As of November 30, 2006, the Corporation had 1,137 stockholders and 21,701,967 shares of Common Stock outstanding. This does not reflect the number of persons or entities who hold stock in nominee or “street name.”
The Company’s ability to pay dividends depends primarily on the ability of Coastal Federal Bank to pay dividends to the Company. See Notes 14, 15, and 19 of the Notes to Consolidated Financial Statements for further information.
Market Price of Common Stock
The table below reflects the high and low bid stock prices published by Nasdaq for each quarter. Such prices may reflect inter-dealer prices, without retail mark-up, mark-down or commissions, and may not necessarily represent actual transactions. The prices have been adjusted retroactive to reflect stock dividends.
|
|
|
|
|
|
|
|
|
|
|
|
| HIGH |
| LOW |
| CASH |
| |||
|
| BID |
| BID |
| DIVIDEND |
| |||
|
|
|
|
|
|
|
|
|
|
|
Fiscal Year 2006: |
|
|
|
|
|
|
|
|
|
|
First Quarter |
| $ | 15.20 |
| $ | 12.75 |
| $ | 0.045 |
|
Second Quarter |
|
| 14.50 |
|
| 12.55 |
|
| 0.045 |
|
Third Quarter |
|
| 14.12 |
|
| 12.23 |
|
| 0.045 |
|
Fourth Quarter |
|
| 13.64 |
|
| 11.55 |
|
| — |
|
|
|
|
|
|
|
|
|
|
|
|
Note: On October 3, 2006, the Company declared a $0.05 per share cash dividend payable November 3, 2006 to stockholders of record as of October 20, 2006. | ||||||||||
|
|
|
|
|
|
|
|
|
|
|
Fiscal Year 2005: |
|
|
|
|
|
|
|
|
|
|
First Quarter |
| $ | 14.39 |
| $ | 10.15 |
| $ | 0.037 |
|
Second Quarter |
|
| 14.91 |
|
| 10.18 |
|
| 0.037 |
|
Third Quarter |
|
| 11.67 |
|
| 10.52 |
|
| 0.041 |
|
Fourth Quarter |
|
| 11.84 |
|
| 10.65 |
|
| 0.041 |
|
| ||||||||||
Form 10-K |
|
|
|
|
|
|
|
|
|
|
A copy of Coastal Financial Corporation’s Annual Report on Form 10-K, as filed with the Securities Exchange Commission for the year ended September 30, 2006, may be obtained or viewed on www.coastalfederal.com by clicking on Investor Services.
Annual Meeting of Stockholders
The Annual Meeting of Stockholders of Coastal Financial Corporation will be held at Ocean Reef Resort, 7100 North Ocean Boulevard, Myrtle Beach, South Carolina, on Monday, January 29, 2007 at 2:00 p.m., Eastern Standard Time.
Additional Information
If you are receiving duplicate mailing of stockholder reports due to multiple accounts, we can consolidate the mailings without affecting your account registration. To do this, or for additional information, contact the Stockholder Relations Office, at the Corporate address shown below.
|
Corporate Offices |
Coastal Financial Corporation |
2619 Oak Street |
Myrtle Beach, South Carolina 29577 |
843.205.2000 |
|
Transfer Agent and Registrar |
Registrar and Transfer Company |
P.O. Box 1010 |
Cranford, NJ 07016 |
1.800.866.1340 Ext. 2514 |
|
Independent Registered Public Accounting Firm |
KPMG LLP |
150 Fayetteville Street Mall |
Suite 1200 |
Raleigh, NC 27601 |
|
Special Counsel |
Muldoon Murphy & Aguggia LLP |
5101 Wisconsin Avenue |
Washington, DC 20016 |
|
Stockholder Relations Officer |
Susan J. Cooke |
Coastal Financial Corporation |
2619 Oak Street |
Myrtle Beach, South Carolina 29577 |
843.205.2000 |
Coastal Financial Corporation is an equal opportunity employer and pledges equal opportunities without regard to religion, citizenship, race, color, creed, sex, age, national origin, disability or status as a disabled or Vietnam-Era veteran.
|
|
|
| Securities and investment advisory services offered exclusively through Raymond James Financial Services, Inc., member NASD/SIPC, an independent broker/dealer, and are not insured by the FDIC or any other bank insurance, are not deposits or obligations of the bank, are not guaranteed by the bank, and are subject to risk, including the possible loss of principal. | |
|
| |
|
| Coastal Investor Services is a division of Coastal Federal Bank. |
56