UNITED STATES
SECURITIES AND EXCHANGE COMMISSION
WASHINGTON, D.C. 20549
FORM N-CSR
CERTIFIED SHAREHOLDER REPORT OF REGISTERED
MANAGEMENT INVESTMENT COMPANIES
Investment Company Act file number 811-3614
Oppenheimer Rochester Fund Municipals
(Exact name of registrant as specified in charter)
6803 South Tucson Way, Centennial, Colorado 80112-3924
(Address of principal executive offices) (Zip code)
Arthur S. Gabinet
OFI Global Asset Management, Inc.
225 Liberty Street, New York, New York 10281-1008
(Name and address of agent for service)
Registrant’s telephone number, including area code: (303) 768-3200
Date of fiscal year end: December 31
Date of reporting period: 12/31/2014
| Item 1. | Reports to Stockholders. |
Table of Contents
Class A Shares
AVERAGE ANNUAL TOTAL RETURNS AT 12/31/14
| | | | | | | | |
| | | Class A Shares of the Fund | | | | |
| | | Without Sales Charge | | With Sales Charge | | Barclays Municipal
Bond Index | | |
1-Year | | 14.43% | | 9.00% | | 9.05% | | |
| | |
5-Year | | 5.89 | | 4.87 | | 5.16 | | |
| | |
10-Year | | 4.47 | | 3.97 | | 4.74 | | |
| | |
Performance data quoted represents past performance, which does not guarantee future results. The investment return and principal value of an investment in the Fund will fluctuate so that an investor’s shares, when redeemed, may be worth more or less than their original cost. Fund returns include changes in share price, reinvested distributions, and a 4.75% maximum applicable sales charge except where “without sales charge” is indicated. Current performance may be lower or higher than the performance quoted. Returns do not consider capital gains or income taxes on an individual’s investment. For performance data current to the most recent month-end, visit oppenheimerfunds.com or call 1.800.CALL OPP (225.5677).
Oppenheimer Rochester is using social media to provide timely information related to muni market developments at www.twitter.com/RochesterFunds.
2 OPPENHEIMER ROCHESTER FUND MUNICIPALS
Fund Performance Discussion
At the end of this reporting period, the Class A shares of Oppenheimer Rochester Fund Municipals provided a tax-free distribution yield of 6.33% at net asset value (NAV). For New Yorkers in the top federal and state income tax brackets, the Fund delivered an amount equivalent to a 2014 taxable investment with a yield of 11.86%; for high-income taxpayers in New York City, the amount was comparable to a taxable investment with a yield of 12.39%. At 14.43%, the annual total return at NAV for the Fund’s Class A shares significantly exceeded the Barclays Municipal Bond Index by 538 basis points this reporting period.
MARKET OVERVIEW
Overall, the muni market rallied during the 12 months ended December 31, 2014, thanks in part to positive reports from the Federal Reserve.
It came as no surprise to Fed watchers that the Federal Open Market Committee (FOMC) voted in October 2014 to end quantitative easing the next month.
Considered by many to be the largest intervention in the Fed’s history, the program was initiated in 2008 to stimulate the economy by adding billions to its holdings of mortgage-backed and Treasury securities. According to a statement released December 17, 2014, the FOMC
observed an expanding economy, solid job gains, a lower unemployment rate and increases in household and business spending. However, a range of labor market indicators suggested that labor resources continued to be underutilized and the recovery in the housing sector remained slow.
The committee’s concerns about falling energy prices, among other factors, played into its decision to maintain its policy of reinvesting principal payments from its holdings of agency debt and agency mortgage-backed securities and rolling over maturing Treasury securities at auction.
| | | | | | | | |
| | | |
YIELDS & DISTRIBUTIONS FOR CLASS A SHARES | | | | | | | | |
| | | |
Dividend Yield w/o sales charge | | | 6.33 | % | | | | |
| | | |
Dividend Yield with sales charge | | | 6.03 | | | | | |
| | | |
Standardized Yield | | | 6.12 | | | | | |
| | | |
Taxable Equivalent Yield | | | 11.86 | | | | | |
| | | |
Last distribution (12/31/14) | | $ | 0.081 | | | | | |
| | | |
Total distributions (1/1/14 to 12/31/14) | | $ | 0.960 | | | | | |
Endnotes for this discussion begin on page 14 of this report
3 OPPENHEIMER ROCHESTER FUND MUNICIPALS
Also in December 2014, the Fed slightly modified its long-standing assurance that it planned to keep the Fed Funds target rate at its current level “for a considerable time” after the end of its bond-buying program. In its end-of-year assessment, the FOMC said it could be “patient” about normalizing its stance on monetary policy, especially if projected inflation continues to run below the committee’s longer-run goal of 2%. At a press conference following the December 2014 meeting, Fed Chair Janet Yellen said it would be unlikely for policymakers to consider an increase in the Fed’s benchmark short-term rate before its April meeting.
Given the current Fed Funds rate, the only plausible change would be an increase. We remind investors that a change in the Fed Funds rate does not automatically translate into a change in longer-term interest rates, which are determined by the marketplace.
The Fund’s investment team will continue to search for value in the muni market as it seeks to produce competitive levels of tax-free income amid stable or changing market conditions.
As of December 31, 2014, the average yield on
30-year, AAA-rated muni bonds was 3.05%, down 136 basis points from December 31, 2013. The average yield on 10-year, AAA-rated muni bonds was 2.07% on December 31, 2014, down 72 basis points from the December 2013 date, and the average yield on 1-year, AAA-rated muni bonds was 0.19%,
down 4 basis points from the December 2013 date.
In New York State, Governor Andrew Cuomo was elected for a second 4 year term in November 2014. Earlier in the reporting period he announced the state had passed its fourth consecutive on-time budget. The $138 billion spending plan for fiscal year 2015 earmarked $300 million for pre-kindergarten in New York City, and called for the state to redirect $40 million from transit operations to pay for debt service on $2.4 billion of bonds issued by the Metropolitan Transit Authority (MTA) in 2002. Overall, the state’s annual spending is expected to be 2% higher in fiscal 2015, which began April 1, 2014, than it was in fiscal 2014.
In October 2014, New York State sold $1 billion of sales tax revenue bonds. Following credit rating upgrades from all 3 major credit rating agencies, these 30-year bonds were sold at the best rates in more than 50 years. The bonds were sold to finance previously authorized capital projects such as higher education facilities, highway and bridge projects, library construction, court facilities and hazardous waste remediation.
Moody’s Investors Service, citing New York State’s fourth consecutive on-time budget and a decline in outstanding state-related debt as a percentage of personal income, upgraded the state’s general obligation (G.O.) bonds to Aa1. The credit rating agency said that “New York has reversed historical financial management patterns and now benefits from
4 OPPENHEIMER ROCHESTER FUND MUNICIPALS
a sustained record of on-time budgets, contained spending growth, and lack of relying on external borrowing for liquidity purposes.” Fitch Ratings upgraded New York to AA-plus, its highest ever rating for the state, and Standard & Poor’s also upgraded the G.O.s to AA-plus.
The state’s first 10-year Statewide Capital Plan was released during this reporting period. It called for $9.4 billion in fiscal year 2015 capital infrastructure spending that would be financed through bond sales and “pay-as-you-go” funding.
In late June 2014, New York City’s Mayor de Blasio and the City Council agreed on a $75 billion, “social-justice themed” budget for its fiscal 2015. Spending in the new budget rose $5 billion and included a new 9-year contract with the United Federation of Teachers. The spending plan also set aside $6.2 million to hire 200 new civilian police administrative aides to relieve 200 police officers from desk jobs, and extended the free school lunch program to all of New York City’s middle school students.
In November 2014, the New York City Transitional Finance Authority (TFA) sold $850 million of future tax secured, fixed-rate subordinate bonds, including $700 million of tax-exempt new money bonds and $150 million of taxable new money bonds. S&P and Fitch rated the TFA subordinate lien bonds at AAA, and Moody’s Investors Service’s rating was Aa1. Also in November 2014, the New York City Municipal Water Finance Authority
came to market with $375 million of new water and sewer system revenue bonds, rated AA-plus by both S&P and Fitch.
Successful investors, we have found, maintain a long-term perspective regardless of the specific developments associated with any given reporting period. To maximize the benefits that municipal bond funds seek to provide, many investors reinvest their dividends and allow the income generated from their investments to compound over time.
FUND PERFORMANCE
Oppenheimer Rochester Fund Municipals held more than 710 securities as of December 31, 2014. The Fund was invested in a broad range of sectors, providing shareholders with a diversity of holdings that we believe would be difficult and costly to replicate in an individual portfolio.
The Class A shares had a distribution yield of 6.33% at NAV as of December 31, 2014. As long-time investors know, yields on fixed-income funds rise when share prices fall, and yields have historically contributed the lion’s share of the long-term total returns generated by bonds.
The Fund’s dividend trend this reporting period shows the positive impact a yield-driven approach can have amid challenging market conditions. This Fund’s Class A dividend, which was 7.9 cents per share at the outset of the reporting period, increased to 8.0 cents
5 OPPENHEIMER ROCHESTER FUND MUNICIPALS

per share beginning with the March 2014 payout and again to 8.1 cents per share with the November 2014 payout. In all, the Fund distributed 96 cents per Class A share this reporting period.
Securities issued in the Commonwealth of Puerto Rico, which are exempt from federal, state and local income taxes, represented 22.5% of the Fund’s total assets (22.9% of net assets) at the end of this reporting period. Puerto Rico’s “tobacco bonds” are excluded from this figure, as they are backed by proceeds from the Master Settlement Agreement (MSA) and included in this Fund’s tobacco holdings, as discussed later in this report.
The Fund’s holdings, some of which are insured, include G.O. debt and securities from
many different sectors. Most of the Fund’s investments in securities issued in Puerto Rico are supported by taxes and other revenues and are designed to help finance electric utilities, highways and education, among other things. Our holdings in bonds issued in Puerto Rico contributed favorably to performance this reporting period.
Expanding on the fiscal discipline that was the hallmark of Luis Fortuño, his predecessor, first-time Governor Alejandro García Padilla has strengthened the island’s balance sheet, cut the government payrolls, enacted comprehensive pension reforms, and raised revenues via tax rate changes and improved enforcement.
In late June 2014, news about the Commonwealth’s first balanced general fund
6 OPPENHEIMER ROCHESTER FUND MUNICIPALS

budget in more than 20 years was overshadowed by Gov. Padilla’s decision to sign legislation allowing Puerto Rico’s public corporations – PREPA (the electric utility authority), PRASA (the aqueduct and sewer authority) and PRHTA (the highway authority) – to restructure their debt. Were issuers to make use of this law – the Puerto Rico Public Corporation Debt Enforcement and Recovery Act (the “Recovery Act”) – they could potentially seek to lessen debt-service payments to their creditors.
During this reporting period, we filed a lawsuit in federal court in Puerto Rico, challenging the constitutional validity of the Recovery Act, which we will pursue vigorously. We are determined to protect our shareholders’ best interests and enforce the bond covenants that have been negotiated.
Puerto Rico debt continued to be the subject of a variety of critical reports during this reporting period as the media focused on the Recovery Act and the potential for debt restructuring. While most of the muni bonds issued by Puerto Rico faced some pricing pressure during this reporting period, the tide turned for many of the island’s securities before the end of 2014 and prices were rallying.
Investors should note that deterioration of the Puerto Rican economy could have an adverse impact on Puerto Rico bonds and the performance of the Oppenheimer Rochester municipal funds that hold them, including this Fund. Our investment team will continue to monitor credit rating changes and other developments related to our Puerto Rico holdings closely and will post information on
7 OPPENHEIMER ROCHESTER FUND MUNICIPALS
our website (oppenheimerfunds.com) and on our Twitter feed (twitter.com/RochesterFunds). We also encourage investors to contact their financial advisors for the latest information, as the situation remains quite fluid.
Given the degree to which Oppenheimer Rochester funds have been cited in news coverage about the economic and fiscal challenges facing Puerto Rico, we feel compelled to remind investors that all fund investments are actively managed. Our team is responsive to the dynamics of the market and may choose to adjust trading strategies in the interest of maximizing the potential benefits to our shareholders – and minimizing their potential losses.
Further, while we remain committed to keeping investors informed about our basic investing strategies, we do not provide comment about near-term trading strategies as we believe doing so might allow other market participants to impair our team’s ability to deliver shareholder value.
Municipal bonds backed by proceeds from the tobacco MSA, the national litigation settlement with U.S. tobacco manufacturers, represented 24.5% of the Fund’s total assets (24.8% of net assets) at the end of this reporting period and contributed favorably to the Fund’s total return this reporting period.
We believe the securities we hold in this sector are fundamentally sound credits, and we like that “tobacco bonds” can provide tax-exempt income for investors as well as benefits to the
issuing states and territories. Our long-term view of the sector remains bullish and, given attractive valuations, we believe that it is likely we will continue to hold a greater percentage of tobacco bonds in our portfolios than our peers. As in prior reporting periods, the tobacco bonds this Fund held during this reporting period made all scheduled payments of interest and principal on time and in full.
As of December 31, 2014, holdings in the electric utilities sector represented 7.9% of total assets (8.0% of net assets). This sector, which included securities issued by PREPA as well as securities issued in New York State and Guam, contributed favorably to the Fund’s total return this reporting period, although PREPA was a detractor.
The Fund’s airline holdings represented 7.9% of total assets (8.0% of net assets) as of December 31, 2014. Many of the Fund’s holdings in this sector are backed by a security interest in the airport terminal buildings or maintenance facilities whose construction they finance, and we believe that these bonds offer investors valuable collateral. This sector also contributed favorably to the Fund’s total return this reporting period.
At the end of this reporting period, the Special Tax sector represented 7.6% of the Fund’s total assets (7.7% of net assets) and included some securities issued in Puerto Rico. The Fund’s holdings in this sector are backed by various taxes, all of which have had consistently strong cash flows that must be used to cover the debt service obligations and
8 OPPENHEIMER ROCHESTER FUND MUNICIPALS
have consistently done so. The sector as a whole and the Special Tax bonds issued in Puerto Rico in particular were positive contributors to Fund performance this reporting period.
The Fund was also invested in securities used to finance marine and aviation facilities this reporting period. Many of these securities are high-grade investments that are backed by the valuable collateral of the projects whose construction they finance. As of December 31, 2014, the Fund’s holdings in this sector represented 5.7% of total assets (5.8% of net assets). This sector also contributed favorably to performance this reporting period.
More than three-quarters of the sales tax revenue bonds held by the Fund this reporting period were issued in Puerto Rico. In all, this sector represented 5.6% of the Fund’s total assets (5.7% of net assets) as of December 31, 2014, and included bonds issued in Guam, the U.S. Virgin Islands and various New York municipalities. Debt-service payments on securities in this sector are paid using the issuing municipality’s sales tax revenue. This sector also contributed favorably to the Fund’s total return.
The Fund continued to be invested in the highways and commuter facilities sector this reporting period, which represented 5.0% of total assets (5.1% of net assets) as of December 31, 2014. The bonds in this sector, including some issued in Puerto Rico, are used to build and maintain roadways and highway amenities. The sector as a whole and the
PRHTA bonds in particular made favorable contributions to the Fund’s performance this reporting period.
As of December 31, 2014, the Fund’s holdings in the higher education sector represented 4.8% of total assets (4.8% of net assets). The investment-grade bonds we hold in this sector have regularly provided high levels of tax-free income with what we believe to be far less credit risk than their external ratings would suggest, and contributed favorably to total return this reporting period.
G.O. securities, which are backed by the full faith and taxing authority of state and local governments, comprised 4.4% of the Fund’s total assets (4.4% of net assets) as of December 31, 2014. The Fund’s holdings in this sector include bonds issued by the Commonwealth of Puerto Rico and the Northern Mariana Islands. As of the end of the reporting period, the G.O. sector contributed favorably to the Fund’s total return.
As of December 31, 2014, the Fund was invested in the hospital/healthcare sector, which represented 4.0% of its total assets (4.1% of net assets). Our holdings in this sector consist of securities across the credit spectrum, and the bonds contributed favorably to the Fund’s total return this reporting period.
The commercial services and supplies sector, which represented less than 0.1% of total and net assets as of December 31, 2014, was a slight detractor from the Fund’s performance.
9 OPPENHEIMER ROCHESTER FUND MUNICIPALS
During this reporting period, the Fund maintained an investment in municipal inverse-floating rate securities, which are tax-exempt securities with interest payments that move inversely to changes in short-term interest rates. “Inverse floaters” continued to provide high levels of income to funds across the industry during this reporting period, which was characterized by rising prices among high-grade municipal securities. We continue to believe that “inverse floaters” are an essential element of this Fund’s portfolio because they can produce attractive yields under certain market conditions. The Fund’s inverse floaters, in aggregate, contributed positively to Fund performance this reporting period.
Our approach to municipal bond investing is flexible and responsive to market conditions. Shareholders should note that market conditions during this reporting period did not affect the Fund’s overall investment goals or cause it to pay any capital gain distributions. In closing, we believe that the Fund’s structure and sector composition as well as our time-tested strategies will continue to benefit fixed-income investors through interest rate and economic cycles.
INVESTMENT STRATEGY
The Rochester investment team focuses exclusively on municipal bonds and has consistently used a time-tested, value-oriented and security-specific approach to fund management. We know that market conditions can and do fluctuate, but we do not waver in our belief in the power of tax-free
yield to help investors achieve their long-term objectives.
This Fund invests primarily in investment-grade municipal securities. It may invest up to 25% of its total assets in below-investment grade securities, or “junk” bonds; the percentage of assets is measured at the time of purchase as is the credit quality of the securities. Additionally, the credit quality is based on Nationally Recognized Statistical Rating Organization (“NRSRO”) ratings or, if no NRSRO rating, on internal ratings. As of December 31, 2014, market movements or rating changes of municipal bonds, notably the Fund’s investments in Puerto Rico paper, caused the Fund’s below-investment-grade holdings to exceed this threshold. As a result, no further purchases of below-investment-grade bonds will be made until the Fund’s holdings of these types of bonds is once again below 25% of total assets.
Our team continually searches for bonds that we believe are undervalued and can provide a meaningful level of tax-free income until maturity. Rather than making allocation shifts based on expected market conditions, we search the marketplace for what we believe to be the best values for generating income. It remains important to note that we do not manage our funds based on predictions of interest rate changes.
Instead, our investment approach involves scouring the market for municipal securities that meet our stringent credit criteria and buying bonds that we believe will deliver
10 OPPENHEIMER ROCHESTER FUND MUNICIPALS
above-average yields relative to peer funds. We focus on identifying inefficiencies in market pricing that can lead to investment advantages. We seek to maintain a thoughtful mix of industry sectors, maturities and credit ratings in this Fund’s portfolio.
The Rochester team also prospects for yield-enhancing opportunities in the secondary market, often picking up odd lots that we believe can add significant incremental yield
to our portfolios. We will also look for non-rated issues with solid credit qualities, which we believe can often help enhance a fund’s tax-free yield. Investors should note that non-rated or unrated securities may or may not be the equivalent of investment grade securities.
The Rochester Way, we believe, distinguishes our approach to municipal investing from those of our competitors.

Daniel G. Loughran,
Senior Vice President, Senior Portfolio Manager and Team Leader, on behalf of the rest of the Rochester portfolio management team: Scott S. Cottier, Troy E. Willis, Mark R. DeMitry, Michael L. Camarella, Charles S. Pulire and Elizabeth S. Mossow.
11 OPPENHEIMER ROCHESTER FUND MUNICIPALS
Top Holdings and Allocations
TOP TEN CATEGORIES
| | | | |
Tobacco Master Settlement Agreement | | | 24.5% | |
Electric Utilities | | | 7.9 | |
Airlines | | | 7.9 | |
Special Tax | | | 7.6 | |
Marine/Aviation Facilities | | | 5.7 | |
Sales Tax Revenue | | | 5.6 | |
Highways/Commuter Facilities | | | 5.0 | |
Higher Education | | | 4.8 | |
General Obligation | | | 4.4 | |
Hospital/Healthcare | | | 4.0 | |
Portfolio holdings and allocations are subject to change. Percentages are as of December 31, 2014, and are based on total assets.
CREDIT ALLOCATION
| | | | | | | | | | | | |
| | | NRSRO-
Rated | | | Sub-
Adviser-
Rated | | | Total | |
AAA | | | 1.0 | % | | | 0.1 | % | | | 1.1% | |
AA | | | 19.8 | | | | 0.7 | | | | 20.5 | |
A | | | 9.0 | | | | 0.5 | | | | 9.5 | |
BBB | | | 10.3 | | | | 13.2 | | | | 23.5 | |
BB or lower | | | 39.9 | | | | 5.5 | | | | 45.4 | |
Total | | | 80.0 | | | | 20.0 | | | | 100.0 | |
The percentages above are based on the market value of the securities as of December 31, 2014, and are subject to change. OppenheimerFunds, Inc. determines the credit allocation of the Fund’s assets using ratings by nationally recognized statistical rating organizations (NRSROs), such as Standard & Poor’s. For any security rated by an NRSRO other than S&P, the sub-adviser, OppenheimerFunds, Inc., converts that security’s rating to the equivalent S&P rating. If two or more NRSROs have assigned a rating to a security, the highest rating is used. For securities not rated by an NRSRO, the sub-adviser uses its own credit analysis to assign ratings in categories similar to those of S&P. The use of similar categories is not an indication that the sub-adviser’s credit analysis process is consistent or comparable with any NRSRO’s process were that NRSRO to rate the same security.
For the purposes of this Credit Allocation table, securities rated within the NRSROs’ four highest categories—AAA, AA, A and BBB—are investment-grade securities. For further details, please consult the Fund’s prospectus or Statement of Additional Information.
12 OPPENHEIMER ROCHESTER FUND MUNICIPALS
Performance
DISTRIBUTION YIELDS
As of 12/31/14
| | | | | | | | | | |
| | | Without Sales
Charge | | | | With Sales Charge | | | | |
Class A | | 6.33% | | | | 6.03% | | | | |
Class B | | 5.32 | | | | N/A | | | | |
Class C | | 5.33 | | | | N/A | | | | |
Class Y | | 6.51 | | | | N/A | | | | |
STANDARDIZED YIELDS
For the 30 Days Ended 12/31/14
| | | | | | | | |
Class A | | | 6.12 | % | | | | |
Class B | | | 5.55 | | | | | |
Class C | | | 5.56 | | | | | |
Class Y | | | 6.58 | | | | | |
TAXABLE EQUIVALENT YIELDS
As of 12/31/14
| | | | | | |
Class A | | | 11.86 | % | | |
Class B | | | 10.76 | | | |
Class C | | | 10.78 | | | |
Class Y | | | 12.75 | | | |
AVERAGE ANNUAL TOTAL RETURNS WITHOUT SALES CHARGE AS OF 12/31/14
| | | | | | | | | | | | | | | | | | |
| | | Inception Date | | | 1-Year | | | 5-Year | | | 10-Year | | | Since Inception |
Class A (RMUNX) | | | 5/15/86 | | | | 14.43% | | | | 5.89% | | | | 4.47% | | | 6.39% |
Class B (RMUBX) | | | 3/17/97 | | | | 13.41 | | | | 4.94 | | | | 3.92 | | | 4.88 |
Class C (RMUCX) | | | 3/17/97 | | | | 13.50 | | | | 5.00 | | | | 3.58 | | | 4.28 |
Class Y (RMUYX) | | | 4/28/00 | | | | 14.60 | | | | 6.05 | | | | 4.62 | | | 5.56 |
AVERAGE ANNUAL TOTAL RETURNS WITH SALES CHARGE AS OF 12/31/14
| | | | | | | | | | | | | | | | | | |
| | | Inception Date | | | 1-Year | | | 5-Year | | | 10-Year | | | Since Inception |
Class A (RMUNX) | | | 5/15/86 | | | | 9.00% | | | | 4.87% | | | | 3.97% | | | 6.20% |
Class B (RMUBX) | | | 3/17/97 | | | | 8.41 | | | | 4.61 | | | | 3.92 | | | 4.88 |
Class C (RMUCX) | | | 3/17/97 | | | | 12.50 | | | | 5.00 | | | | 3.58 | | | 4.28 |
Class Y (RMUYX) | | | 4/28/00 | | | | 14.60 | | | | 6.05 | | | | 4.62 | | | 5.56 |
13 OPPENHEIMER ROCHESTER FUND MUNICIPALS
COMPARISON OF CHANGE IN VALUE OF $10,000 HYPOTHETICAL INVESTMENTS IN:
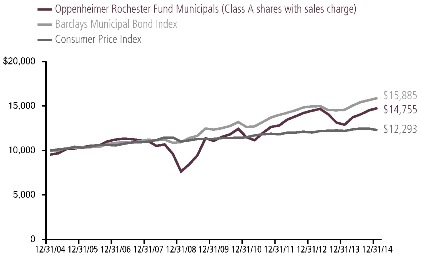
Performance data quoted represents past performance, which does not guarantee future results. The investment return and principal value of an investment in the Fund will fluctuate so that an investor’s shares, when redeemed, may be worth more or less than their original cost. Current performance may be lower or higher than the performance quoted. Returns do not consider capital gains or income taxes on an individual’s investments. For performance data current to the most recent month-end, visit oppenheimerfunds.com or call 1.800.CALL OPP (225.5677). Fund returns include changes in share price, reinvested distributions, and the applicable sales charge: for Class A shares, the current maximum initial sales charge of 4.75%; for Class B shares, the contingent deferred sales charge of 5% (1-year) and 2% (5-year); and for Class C, the contingent deferred sales charge of 1% for the 1-year period. There is no sales charge for Class Y shares. Because Class B shares convert to Class A shares 72 months after purchase, the 10-year return for Class B shares uses Class A performance for the period after conversion.
The Fund’s performance is compared to the performance of the Barclays Municipal Bond Index, an unmanaged index of a broad range of investment-grade municipal bonds that is a measure of the general municipal bond market. The Fund’s performance is also compared to the Consumer Price Index, a non-securities index that measures changes in the inflation rate. Indices are unmanaged and cannot be purchased by investors. While index comparisons may be useful to provide a benchmark for the Fund’s performance, it must be noted that the Fund’s investments are not limited to the investments comprising the index. Index performance includes reinvestment of income, but does not reflect transaction costs, fees, expenses or taxes. Index performance is shown for illustrative purposes only as a benchmark for the Fund’s performance, and does not predict or depict performance of the Fund. The Fund’s performance reflects the effects of the Fund’s business and operating expenses.
Distribution yields for Class A shares are based on dividends of $0.081 for the 36-day accrual period ended December 31, 2014. The yield without sales charge for Class A shares is calculated by dividing annualized dividends by the Class A net asset value on December 31, 2014; for the yield with sales charge, the denominator is the Class A maximum offering price on that date. Distribution yields for Class B, C and Y are annualized based on dividends of
14 OPPENHEIMER ROCHESTER FUND MUNICIPALS
$0.0679, $0.0681 and $0.0832, respectively, for the 36-day accrual period ended December 31, 2014, and on the corresponding net asset values on that date.
Standardized yield is based on the Fund’s net investment income for the 30-day period ended December 31, 2014, and either that date’s maximum offering price (for Class A shares) or net asset value (for the other classes). Each result is compounded semiannually and annualized. Falling share prices artificially increase yields.
Taxable equivalent yields are based on the standardized yield and the 2014 top federal and New York combined tax rate of 48.4% for New York State residents and 50.6% for New York City residents. Calculations factor in the 3.8% tax on unearned income under the Patient Protection and Affordable Care Act, as applicable. A portion of the Fund’s distributions may be subject to tax; distributions may also increase an investor’s exposure to the alternative minimum tax. Capital gains distributions are taxable as capital gains. Tax treatments of the Fund’s distributions and capital gains may vary by state; investors should consult a tax advisor to determine if the Fund is appropriate for them. Each result is compounded semiannually and annualized. Falling share prices artificially increase yields. This Report must be preceded or accompanied by a Fund prospectus.
The average yields for AAA-rated municipal securities are provided by Municipal Market Advisors (MMA) and are based on its benchmark of general obligation bonds structured with a 5% coupon. The MMA 5% benchmark is constructed using yields from the leading underwriters, who represent a significant percentage of the primary activity of the top 10 underwriters and therefore the total issuance.
Investments in “tobacco bonds,” which are backed by the proceeds a state or territory receives from the 1998 national litigation settlement with tobacco manufacturers, may be vulnerable to economic and/or legislative events that affect issuers in a particular municipal market sector. Annual payments by MSA-participating manufacturers, for example, hinge on many factors, including annual domestic cigarette shipments, inflation and the relative market share of non-participating manufacturers. To date, we believe consumption figures remain within an acceptable range of the assumptions used to structure MSA bonds. Future MSA payments could be reduced if consumption were to fall more rapidly than originally forecast.
The Fund’s investment strategy and focus can change over time. The mention of specific fund holdings does not constitute a recommendation by OppenheimerFunds, Inc. or its affiliates.
Before investing in any of the Oppenheimer funds, investors should carefully consider a fund’s investment objectives, risks, charges and expenses. Fund prospectuses and summary prospectuses contain this and other information about the funds, and may be obtained by asking your financial advisor, visiting oppenheimerfunds.com, or calling 1.800.CALL OPP (225.5677). Read prospectuses and summary prospectuses carefully before investing.
Shares of Oppenheimer funds are not deposits or obligations of any bank, are not guaranteed by any bank, are not insured by the FDIC or any other agency and involve investment risks, including the possible loss of the principal amount invested.
15 OPPENHEIMER ROCHESTER FUND MUNICIPALS
Fund Expenses
Fund Expenses. As a shareholder of the Fund, you incur two types of costs: (1) transaction costs, which may include sales charges (loads) on purchase payments, contingent deferred sales charges on redemptions; and (2) ongoing costs, including management fees; distribution and service fees; and other Fund expenses. These examples are intended to help you understand your ongoing costs (in dollars) of investing in the Fund and to compare these costs with the ongoing costs of investing in other mutual funds.
The examples are based on an investment of $1,000.00 invested at the beginning of the period and held for the entire 6-month period ended December 31, 2014.
Actual Expenses. The first section of the table provides information about actual account values and actual expenses. You may use the information in this section for the class of shares you hold, together with the amount you invested, to estimate the expense that you paid over the period. Simply divide your account value by $1,000.00 (for example, an $8,600.00 account value divided by $1,000.00 = 8.60), then multiply the result by the number in the first section under the heading entitled “Expenses Paid During 6 Months Ended December 31, 2014” to estimate the expenses you paid on your account during this period.
Hypothetical Example for Comparison Purposes. The second section of the table provides information about hypothetical account values and hypothetical expenses based on the Fund’s actual expense ratio for each class of shares, and an assumed rate of return of 5% per year for each class before expenses, which is not the Fund’s actual return. The hypothetical account values and expenses may not be used to estimate the actual ending account balance or expenses you paid for the period. You may use this information to compare the ongoing costs of investing in the Fund and other funds. To do so, compare this 5% hypothetical example for the class of shares you hold with the 5% hypothetical examples that appear in the shareholder reports of the other funds.
Please note that the expenses shown in the table are meant to highlight your ongoing costs only and do not reflect any transactional costs, such as front-end or contingent deferred sales charges (loads). Therefore, the “hypothetical” section of the table is useful in comparing ongoing costs only, and will not help you determine the relative total costs of owning different funds. In addition, if these transactional costs were included, your costs would have been higher.
16 OPPENHEIMER ROCHESTER FUND MUNICIPALS
| | | | | | |
| Actual | | Beginning Account Value July 1, 2014 | | Ending Account Value December 31, 2014 | | Expenses Paid During 6 Months Ended December 31, 2014 |
Class A | | $ 1,000.00 | | $ 1,048.60 | | $ 5.33 |
Class B | | 1,000.00 | | 1,044.20 | | 9.94 |
Class C | | 1,000.00 | | 1,044.30 | | 9.73 |
Class Y | | 1,000.00 | | 1,049.40 | | 4.45 |
| | | |
Hypothetical (5% return before expenses) | | | | | | |
Class A | | 1,000.00 | | 1,020.01 | | 5.26 |
Class B | | 1,000.00 | | 1,015.53 | | 9.80 |
Class C | | 1,000.00 | | 1,015.73 | | 9.60 |
Class Y | | 1,000.00 | | 1,020.87 | | 4.39 |
Expenses are equal to the Fund’s annualized expense ratio for that class, multiplied by the average account value over the period, multiplied by 184/365 (to reflect the one-half year period). Those annualized expense ratios, excluding indirect expenses from affiliated funds, based on the 6-month period ended December 31, 2014 are as follows:
| | | | | | |
| Class | | Expense Ratios | | | |
Class A | | | 1.03 | % | | |
Class B | | | 1.92 | | | |
Class C | | | 1.88 | | | |
Class Y | | | 0.86 | | | |
The “Financial Highlights” tables in the Fund’s financial statements, included in this report, also show the gross expense ratios, without waivers or reimbursements and reduction to custodian expenses, if applicable.
17 OPPENHEIMER ROCHESTER FUND MUNICIPALS
STATEMENT OF INVESTMENTS December 31, 2014
| | | | | | | | | | | | | | | | | | |
Principal Amount | | | | | Coupon | | | Maturity | | | Value | | | |
| |
| Municipal Bonds and Notes—108.8% | | | |
| New York—80.8% | | | |
| | $605,000 | | | Albany County, NY IDA (Wildwood Programs)1 | | | 4.900 | % | | | 07/01/2021 | | | $ | 608,473 | | | |
| | 8,165,000 | | | Albany, NY Capital Resource Corp. (College Saint Rose)1 | | | 5.875 | | | | 07/01/2041 | | | | 9,238,044 | | | |
| | 1,315,000 | | | Albany, NY Capital Resource Corp. (College Saint Rose)1 | | | 5.625 | | | | 07/01/2031 | | | | 1,488,448 | | | |
| | 1,525,000 | | | Albany, NY Capital Resource Corp. (College Saint Rose)1 | | | 5.375 | | | | 07/01/2026 | | | | 1,716,357 | | | |
| | 1,420,000 | | | Albany, NY Hsg. Authority (Lark Drive)1 | | | 5.500 | | | | 12/01/2028 | | | | 1,422,130 | | | |
| | 600,000 | | | Albany, NY IDA (Albany Rehabilitation)1 | | | 8.375 | | | | 06/01/2023 | | | | 600,240 | | | |
| | 900,000 | | | Albany, NY IDA (Brighter Choice Charter School)1 | | | 5.000 | | | | 04/01/2037 | | | | 903,924 | | | |
| | 1,350,000 | | | Albany, NY IDA (Brighter Choice Charter School)1 | | | 5.000 | | | | 04/01/2032 | | | | 1,358,734 | | | |
| | 3,125,000 | | | Albany, NY IDA (Brighter Choice Charter School)1 | | | 5.000 | | | | 04/01/2027 | | | | 3,159,187 | | | |
| | 900,000 | | | Albany, NY IDA (New Covenant Charter School)2 | | | 7.000 | | | | 05/01/2025 | | | | 11,232 | | | |
| | 1,760,000 | | | Albany, NY IDA (Sage Colleges)1 | | | 5.300 | | | | 04/01/2029 | | | | 1,735,976 | | | |
| | 985,000 | | | Albany, NY Parking Authority | | | 1.232 | 3 | | | 11/01/2017 | | | | 878,324 | | | |
| | 5,000,000 | | | Amherst, NY IDA (Beechwood Health Care Center)1 | | | 5.200 | | | | 01/01/2040 | | | | 5,071,100 | | | |
| | 420,000 | | | Blauvelt, NY Volunteer Fire Company | | | 6.250 | | | | 10/15/2017 | | | | 420,773 | | | |
| | 2,735,000 | | | Brookhaven, NY IDA (Enecon Corp.)1 | | | 6.300 | | | | 11/01/2033 | | | | 2,700,594 | | | |
| | 1,435,000 | | | Brookhaven, NY IDA (Stony Brook Foundation)1 | | | 6.500 | | | | 11/01/2020 | | | | 1,446,753 | | | |
| | 1,770,000 | | | Buffalo & Erie County, NY Industrial Land Devel. (Buffalo State College Foundation Hsg. Corp.)1 | | | 5.375 | | | | 10/01/2041 | | | | 1,972,630 | | | |
| | 870,000 | | | Buffalo & Erie County, NY Industrial Land Devel. (Buffalo State College Foundation Hsg. Corp.)1 | | | 6.000 | | | | 10/01/2031 | | | | 1,031,028 | | | |
| | 500,000 | | | Build NYC Resource Corp. (New York Methodist Hospital)1 | | | 5.000 | | | | 07/01/2030 | | | | 570,585 | | | |
| | 1,500,000 | | | Build NYC Resource Corp. (Pratt Paper)1 | | | 4.500 | | | | 01/01/2025 | | | | 1,534,830 | | | |
| | 3,250,000 | | | Build NYC Resource Corp. (Pratt Paper)1 | | | 5.000 | | | | 01/01/2035 | | | | 3,363,815 | | | |
| | 860,000 | | | Build NYC Resource Corp. (YMCA of Greater New York) | | | 5.000 | | | | 08/01/2032 | | | | 950,971 | | | |
| | 3,000,000 | | | Bushnell Basin, NY Fire Assoc. (Volunteer Fire Dept.)1 | | | 5.750 | | | | 11/01/2030 | | | | 3,061,140 | | | |
| | 1,000,000 | | | Canton, NY Resource Corp. Student Hsg. Facility (Grasse River-SUNY Canton)1 | | | 5.000 | | | | 05/01/2040 | | | | 1,095,530 | | | |
| | 250,000 | | | Cattaraugus County, NY Capital Resource Corp. (St. Bonaventure University)1 | | | 5.000 | | | | 05/01/2039 | | | | 268,795 | | | |
| | 200,000 | | | Cattaraugus County, NY Capital Resource Corp. (St. Bonaventure University)1 | | | 5.000 | | | | 05/01/2034 | | | | 217,962 | | | |
| | 830,000 | | | Cattaraugus County, NY IDA (St. Bonaventure University)1 | | | 5.450 | | | | 09/15/2019 | | | | 831,013 | | | |
| | 105,000 | | | Chautauqua, NY Utility District1 | | | 5.000 | | | | 06/01/2025 | | | | 108,137 | | | |
| | 95,000 | | | Chautauqua, NY Utility District1 | | | 5.000 | | | | 06/01/2023 | | | | 98,049 | | | |
| | 1,515,000 | | | Chemung County, NY IDA (Hathorn Redevel. Company)1 | | | 5.000 | | | | 07/01/2033 | | | | 1,517,424 | | | |
| | 740,000 | | | Chemung County, NY IDA (Hathorn Redevel. Company) | | | 4.850 | | | | 07/01/2023 | | | | 742,398 | | | |
| | 1,515,000 | | | Clifton Springs, NY Hospital & Clinic1 | | | 8.000 | | | | 01/01/2020 | | | | 1,517,439 | | | |
18 OPPENHEIMER ROCHESTER FUND MUNICIPALS
| | | | | | | | | | | | | | | | |
Principal Amount | | | | | Coupon | | | Maturity | | | Value | |
| New York (Continued) | | | | | |
| | $2,200,000 | | | Dutchess County, NY IDA (Elant Fishkill)1 | | | 5.250 | % | | | 01/01/2037 | | | $ | 2,082,036 | |
| | 650,000 | | | Dutchess County, NY Local Devel. Corp. (Health Quest System)1 | | | 5.750 | | | | 07/01/2040 | | | | 729,852 | |
| | 1,000,000 | | | Dutchess County, NY Water & Wastewater Authority | | | 5.400 | 3 | | | 06/01/2027 | | | | 701,430 | |
| | 2,055,000 | | | East Rochester, NY Hsg. Authority (Jefferson Park Apartments)1 | | | 6.750 | | | | 03/01/2030 | | | | 2,057,404 | |
| | 2,460,000 | | | East Rochester, NY Hsg. Authority (Woodland Village)1 | | | 5.500 | | | | 08/01/2033 | | | | 2,505,092 | |
| | 2,675,000 | | | Elmira, NY Hsg. Authority (Eastgate Apartments)1 | | | 6.250 | | | | 06/01/2044 | | | | 2,646,431 | |
| | 7,050,000 | | | Erie County, NY IDA (Charter School Applied Tech)1 | | | 6.875 | | | | 06/01/2035 | | | | 7,221,315 | |
| | 2,845,000 | | | Erie County, NY IDA (Global Concepts Charter School)1 | | | 6.250 | | | | 10/01/2037 | | | | 2,995,244 | |
| | 715,000 | | | Erie County, NY IDA (The Episcopal Church Home)1 | | | 6.000 | | | | 02/01/2028 | | | | 716,158 | |
| | 135,450,000 | | | Erie County, NY Tobacco Asset Securitization Corp. | | | 6.488 | 3 | | | 06/01/2050 | | | | 3,265,699 | |
| | 194,300,000 | | | Erie County, NY Tobacco Asset Securitization Corp. | | | 7.196 | 3 | | | 06/01/2055 | | | | 1,766,187 | |
| | 1,024,000,000 | | | Erie County, NY Tobacco Asset Securitization Corp. | | | 7.650 | 3 | | | 06/01/2060 | | | | 4,270,080 | |
| | 25,330,000 | | | Erie County, NY Tobacco Asset Securitization Corp.1 | | | 5.000 | | | | 06/01/2038 | | | | 20,620,646 | |
| | 93,000,000 | | | Erie County, NY Tobacco Asset Securitization Corp. | | | 6.140 | 3 | | | 06/01/2047 | | | | 3,329,400 | |
| | 72,595,000 | | | Erie County, NY Tobacco Asset Securitization Corp.1 | | | 5.000 | | | | 06/01/2045 | | | | 57,552,590 | |
| | 1,410,000 | | | Essex County, NY IDA (International Paper Company)1 | | | 4.600 | | | | 03/01/2027 | | | | 1,434,647 | |
| | 1,500,000 | | | Essex County, NY IDA (International Paper Company)1 | | | 6.625 | | | | 09/01/2032 | | | | 1,696,020 | |
| | 410,000 | | | Essex County, NY IDA (North Country Community College Foundation)1 | | | 5.200 | | | | 06/01/2025 | | | | 412,981 | |
| | 1,100,000 | | | Essex County, NY IDA (North Country Community College Foundation)1 | | | 5.300 | | | | 06/01/2035 | | | | 1,106,182 | |
| | 975,000 | | | Essex County, NY IDA (North Country Community College Foundation)1 | | | 5.000 | | | | 06/01/2020 | | | | 985,364 | |
| | 1,235,000 | | | Essex County, NY IDA (North Country Community College Foundation)1 | | | 5.200 | | | | 06/01/2025 | | | | 1,245,411 | |
| | 320,000 | | | Essex County, NY IDA (North Country Community College Foundation)1 | | | 5.000 | | | | 06/01/2020 | | | | 323,005 | |
| | 185,000 | | | Fishkill, NY GO1 | | | 5.000 | | | | 04/15/2029 | | | | 185,368 | |
| | 900,000 | | | Franklin County, NY IDA (North Country Community College Foundation)1 | | | 5.200 | | | | 06/01/2025 | | | | 907,587 | |
| | 100,000 | | | Glens Falls, NY GO1 | | | 6.000 | | | | 02/01/2040 | | | | 112,385 | |
| | 1,945,000 | | | Hempstead, NY IDA (Adelphi University)1 | | | 5.000 | | | | 10/01/2030 | | | | 2,015,234 | |
| | 3,665,000 | | | Hempstead, NY IDA (Peninsula Counseling Center)1 | | | 6.500 | | | | 11/01/2038 | | | | 3,673,576 | |
19 OPPENHEIMER ROCHESTER FUND MUNICIPALS
STATEMENT OF INVESTMENTS Continued
| | | | | | | | | | | | | | | | |
Principal
Amount | | | | | Coupon | | | Maturity | | | Value | |
| New York (Continued) | | | | | |
| | $1,250,000 | | | Hempstead, NY Local Devel. Corp. (Molloy College)1 | | | 5.000 | % | | | 07/01/2039 | | | $ | 1,358,800 | |
| | 1,000,000 | | | Hempstead, NY Local Devel. Corp. (Molloy College)1 | | | 5.000 | | | | 07/01/2044 | | | | 1,080,440 | |
| | 1,500,000 | | | Hempstead, NY Local Devel. Corp. (Molloy College)1 | | | 5.000 | | | | 07/01/2034 | | | | 1,658,160 | |
| | 1,700,000 | | | Hempstead, NY Local Devel. Corp. (Molloy College)1 | | | 5.000 | | | | 07/01/2029 | | | | 1,914,098 | |
| | 34,450,000 | | | Hudson Yards, NY Infrastructure Corp.1 | | | 5.750 | | | | 02/15/2047 | | | | 39,871,741 | |
| | 4,840,000 | | | Hudson Yards, NY Infrastructure Corp.1 | | | 5.000 | | | | 02/15/2047 | | | | 5,158,278 | |
| | 10,475,000 | | | L.I., NY Power Authority, Series A1 | | | 5.750 | | | | 04/01/2039 | | | | 11,897,086 | |
| | 6,315,000 | | | L.I., NY Power Authority, Series A1 | | | 5.000 | | | | 09/01/2039 | | | | 7,110,753 | |
| | 1,250,000 | | | L.I., NY Power Authority, Series A1 | | | 5.000 | | | | 09/01/2044 | | | | 1,402,050 | |
| | 29,735,000 | | | L.I., NY Power Authority, Series A | | | 5.000 | | | | 09/01/2037 | | | | 32,994,848 | |
| | 20,000,000 | | | L.I., NY Power Authority, Series A | | | 5.000 | | | | 09/01/2042 | | | | 22,107,200 | |
| | 3,400,000 | | | L.I., NY Power Authority, Series A1 | | | 5.000 | | | | 05/01/2036 | | | | 3,788,416 | |
| | 1,900,000 | | | L.I., NY Power Authority, Series B1 | | | 5.750 | | | | 04/01/2033 | | | | 2,168,052 | |
| | 65,000 | | | L.I., NY Power Authority, Series B1 | | | 5.000 | | | | 12/01/2035 | | | | 68,450 | |
| | 7,000,000 | | | L.I., NY Power Authority, Series B | | | 5.000 | | | | 09/01/2029 | | | | 7,975,380 | |
| | 455,000 | | | Lockport City, NY GO1 | | | 5.000 | | | | 10/15/2021 | | | | 507,270 | |
| | 435,000 | | | Lockport City, NY GO1 | | | 5.000 | | | | 10/15/2020 | | | | 481,958 | |
| | 505,000 | | | Lockport City, NY GO1 | | | 5.000 | | | | 10/15/2023 | | | | 564,777 | |
| | 530,000 | | | Lockport City, NY GO1 | | | 5.000 | | | | 10/15/2024 | | | | 587,420 | |
| | 480,000 | | | Lockport City, NY GO1 | | | 5.000 | | | | 10/15/2022 | | | | 536,112 | |
| | 3,000,000 | | | Madison County, NY IDA (Colgate University)1 | | | 5.000 | | | | 07/01/2040 | | | | 3,069,390 | |
| | 5,300,000 | | | Madison County, NY IDA (Commons II Student Hsg.)1 | | | 5.000 | | | | 06/01/2040 | | | | 5,499,227 | |
| | 100,000 | | | Madison County, NY IDA (Commons II Student Hsg.)1 | | | 5.000 | | | | 06/01/2033 | | | | 104,411 | |
| | 860,000 | | | Madison County, NY IDA (Morrisville State College Foundation)1 | | | 5.000 | | | | 06/01/2028 | | | | 872,840 | |
| | 1,100,000 | | | Madison County, NY IDA (Morrisville State College Foundation)1 | | | 5.000 | | | | 06/01/2032 | | | | 1,115,554 | |
| | 570,000 | | | Middletown, NY IDA (Flanagan Design & Display)2 | | | 7.500 | | | | 11/01/2018 | | | | 285,000 | |
| | 2,375,000 | | | Monroe County, NY IDA (Parma Senior Hsg. Assoc.)1 | | | 6.500 | | | | 12/01/2042 | | | | 2,432,285 | |
| | 3,660,000 | | | Monroe County, NY IDA (Summit at Brighton)1 | | | 5.500 | | | | 07/01/2027 | | | | 2,942,823 | |
| | 2,345,000 | | | Monroe County, NY IDA (Summit at Brighton)1 | | | 5.375 | | | | 07/01/2032 | | | | 1,704,018 | |
| | 375,000 | | | Monroe County, NY IDA (Volunteers of America)1 | | | 5.700 | | | | 08/01/2018 | | | | 374,962 | |
| | 2,765,000 | | | Monroe County, NY IDA (Volunteers of America)1 | | | 5.750 | | | | 08/01/2028 | | | | 2,725,184 | |
| | 850,000 | | | Monroe County, NY Industrial Devel. Corp. (Monroe Community College)1 | | | 5.000 | | | | 01/15/2038 | | | | 955,417 | |
| | 850,000 | | | Monroe County, NY Industrial Devel. Corp. (Nazareth College of Rochester)1 | | | 5.000 | | | | 10/01/2026 | | | | 934,464 | |
| | 500,000 | | | Monroe County, NY Industrial Devel. Corp. (Nazareth College of Rochester)1 | | | 5.250 | | | | 10/01/2031 | | | | 548,865 | |
| | 1,840,000 | | | Monroe County, NY Industrial Devel. Corp. (Nazareth College of Rochester)1 | | | 5.500 | | | | 10/01/2041 | | | | 2,024,000 | |
20 OPPENHEIMER ROCHESTER FUND MUNICIPALS
| | | | | | | | | | | | | | | | |
Principal
Amount | | | | | Coupon | | | Maturity | | | Value | |
| New York (Continued) | | | | | |
| | $850,000 | | | Monroe County, NY Industrial Devel. Corp. (St. John Fisher College)1 | | | 5.625 | % | | | 06/01/2026 | | | $ | 961,885 | |
| | 500,000 | | | Monroe County, NY Industrial Devel. Corp. (St. John Fisher College)1 | | | 5.000 | | | | 06/01/2029 | | | | 564,205 | |
| | 1,515,000 | | | Monroe County, NY Industrial Devel. Corp. (St. John Fisher College)1 | | | 5.000 | | | | 06/01/2044 | | | | 1,628,549 | |
| | 960,000 | | | Monroe County, NY Industrial Devel. Corp. (St. John Fisher College)1 | | | 5.500 | | | | 06/01/2034 | | | | 1,104,970 | |
| | 1,495,000 | | | Monroe County, NY Industrial Devel. Corp. (St. John Fisher College)1 | | | 6.000 | | | | 06/01/2034 | | | | 1,692,938 | |
| | 15,100,000 | | | Monroe County, NY Industrial Devel. Corp. (Unity Hospital Rochester)1 | | | 5.750 | | | | 08/15/2035 | | | | 18,034,987 | |
| | 650,000,000 | | | Monroe County, NY Tobacco Asset Securitization Corp. (TASC) | | | 7.701 | 3 | | | 06/01/2061 | | | | 2,671,500 | |
| | 580,000 | | | Monroe, NY Newpower Corp1 | | | 5.625 | | | | 01/01/2026 | | | | 584,246 | |
| | 2,305,000 | | | Monroe, NY Newpower Corp.1 | | | 5.500 | | | | 01/01/2034 | | | | 2,318,323 | |
| | 700,000 | | | Mount Vernon, NY IDA (Kings Court)1 | | | 5.200 | | | | 12/01/2033 | | | | 704,242 | |
| | 1,385,000 | | | Mount Vernon, NY IDA (Meadowview)1 | | | 6.150 | | | | 06/01/2019 | | | | 1,387,964 | |
| | 2,600,000 | | | Mount Vernon, NY IDA (Meadowview)1 | | | 6.200 | | | | 06/01/2029 | | | | 2,602,678 | |
| | 802,824 | | | Municipal Assistance Corp. for Troy, NY | | | 5.733 | 3 | | | 07/15/2021 | | | | 702,913 | |
| | 1,218,573 | | | Municipal Assistance Corp. for Troy, NY | | | 5.741 | 3 | | | 01/15/2022 | | | | 1,047,437 | |
| | 450,000 | | | Nassau County, NY IDA (ACDS)1 | | | 5.950 | | | | 11/01/2022 | | | | 452,250 | |
| | 100,000 | | | Nassau County, NY IDA (ALIA-ACDS)1 | | | 7.500 | | | | 06/01/2015 | | | | 100,271 | |
| | 310,000 | | | Nassau County, NY IDA (ALIA-HH)1 | | | 7.125 | | | | 06/01/2017 | | | | 310,347 | |
| | 240,000 | | | Nassau County, NY IDA (ALIA-HHS)1 | | | 7.125 | | | | 06/01/2017 | | | | 240,269 | |
| | 15,000 | | | Nassau County, NY IDA (ALIA-LVH)1 | | | 7.500 | | | | 06/01/2015 | | | | 15,041 | |
| | 5,823,750 | | | Nassau County, NY IDA (Amsterdam at Harborside)1 | | | 6.700 | | | | 01/01/2049 | | | | 5,709,139 | |
| | 2,101,661 | | | Nassau County, NY IDA (Amsterdam at Harborside)2 | | | 2.000 | | | | 01/01/2049 | | | | 21 | |
| | 3,665,000 | | | Nassau County, NY IDA (CSMR)1 | | | 5.950 | | | | 11/01/2022 | | | | 3,683,325 | |
| | 435,000 | | | Nassau County, NY IDA (Epilepsy Foundation of L.I.)1 | | | 5.950 | | | | 11/01/2022 | | | | 437,175 | |
| | 1,660,000 | | | Nassau County, NY IDA (Hispanic Counseling Center) | | | 6.500 | | | | 11/01/2037 | | | | 1,664,748 | |
| | 3,150,000 | | | Nassau County, NY IDA (Keyspan-Glenwood Energy Center) | | | 5.250 | | | | 06/01/2027 | | | | 3,162,190 | |
| | 480,000 | | | Nassau County, NY IDA (Life’s WORCA)1 | | | 5.950 | | | | 11/01/2022 | | | | 482,400 | |
| | 3,535,000 | | | Nassau County, NY IDA (New York Water Service Corp.)1 | | | 5.000 | | | | 12/01/2035 | | | | 3,582,793 | |
| | 1,695,000 | | | Nassau County, NY IDA (North Shore CFGA)1 | | | 6.750 | | | | 05/01/2024 | | | | 1,695,966 | |
| | 800,000 | | | Nassau County, NY IDA (PLUS Group Home)1 | | | 6.150 | | | | 11/01/2022 | | | | 811,272 | |
| | 645,000 | | | Nassau County, NY IDA (United Veteran’s Beacon House)1 | | | 6.500 | | | | 11/01/2037 | | | | 655,520 | |
| | 460,000 | | | Nassau County, NY IDA, Series A-A1 | | | 6.000 | | | | 06/01/2021 | | | | 466,895 | |
| | 4,800,000 | | | Nassau County, NY IDA, Series A-B1 | | | 6.000 | | | | 06/01/2021 | | | | 4,871,952 | |
| | 465,000 | | | Nassau County, NY IDA, Series A-C1 | | | 6.000 | | | | 06/01/2021 | | | | 471,970 | |
| | 515,000 | | | Nassau County, NY IDA, Series A-D1 | | | 6.000 | | | | 06/01/2021 | | | | 522,720 | |
| | 105,975,000 | | | Nassau County, NY Tobacco Settlement Corp. | | | 6.221 | 3 | | | 06/01/2046 | | | | 3,548,043 | |
| | 1,055,215,000 | | | Nassau County, NY Tobacco Settlement Corp. | | | 5.646 | 3 | | | 06/01/2060 | | | | 5,402,701 | |
| | 122,875,000 | | | Nassau County, NY Tobacco Settlement Corp.1 | | | 5.125 | | | | 06/01/2046 | | | | 95,704,880 | |
21 OPPENHEIMER ROCHESTER FUND MUNICIPALS
STATEMENT OF INVESTMENTS Continued
| | | | | | | | | | | | | | | | |
Principal
Amount | | | | | Coupon | | | Maturity | | | Value | |
| New York (Continued) | | | | | |
| | $20,000,000 | | | Nassau County, NY Tobacco Settlement Corp. | | | 5.820 | %3 | | | 06/01/2046 | | | $ | 728,800 | |
| | 40,000,000 | | | Nassau County, NY Tobacco Settlement Corp. | | | 6.350 | 3 | | | 06/01/2060 | | | | 166,800 | |
| | 22,780,000 | | | Nassau County, NY Tobacco Settlement Corp. (TASC)1 | | | 5.000 | | | | 06/01/2035 | | | | 19,262,085 | |
| | 3,670,000 | | | New Rochelle, NY IDA (Soundview Apartments)1 | | | 5.375 | | | | 04/01/2036 | | | | 3,708,425 | |
| | 1,500,000 | | | Niagara County, NY IDA (Niagara Falls Memorial Medical Center) | | | 5.750 | | | | 06/01/2018 | | | | 1,502,640 | |
| | 125,000 | | | Niagara Falls, NY Public Water Authority1 | | | 5.500 | | | | 07/15/2034 | | | | 126,431 | |
| | 850,000 | | | Niagara, NY Area Devel. Corp. (Niagara University) | | | 5.000 | | | | 05/01/2042 | | | | 913,300 | |
| | 500,000 | | | Niagara, NY Area Devel. Corp. (Niagara University) | | | 5.000 | | | | 05/01/2035 | | | | 541,220 | |
| | 2,055,000 | | | North Tonawanda, NY HDC (Bishop Gibbons Associates)1 | | | 7.375 | | | | 12/15/2021 | | | | 2,409,672 | |
| | 6,245,000 | | | NY Counties Tobacco Trust I | | | 6.500 | | | | 06/01/2035 | | | | 6,244,688 | |
| | 19,230,000 | | | NY Counties Tobacco Trust I1 | | | 6.625 | | | | 06/01/2042 | | | | 19,228,077 | |
| | 3,720,000 | | | NY Counties Tobacco Trust I | | | 6.250 | | | | 06/01/2028 | | | | 3,719,814 | |
| | 29,770,000 | | | NY Counties Tobacco Trust II (TASC)1 | | | 5.625 | | | | 06/01/2035 | | | | 29,810,189 | |
| | 53,880,000 | | | NY Counties Tobacco Trust II (TASC)1 | | | 5.750 | | | | 06/01/2043 | | | | 54,137,008 | |
| | 245,000 | | | NY Counties Tobacco Trust III | | | 6.000 | | | | 06/01/2043 | | | | 244,995 | |
| | 7,000,000 | | | NY Counties Tobacco Trust IV1 | | | 5.000 | | | | 06/01/2038 | | | | 5,735,310 | |
| | 131,335,000 | | | NY Counties Tobacco Trust IV | | | 4.866 | 3 | | | 06/01/2050 | | | | 3,176,994 | |
| | 304,690,000 | | | NY Counties Tobacco Trust IV | | | 5.373 | 3 | | | 06/01/2055 | | | | 4,250,425 | |
| | 608,700,000 | | | NY Counties Tobacco Trust IV | | | 5.823 | 3 | | | 06/01/2060 | | | | 2,538,279 | |
| | 38,275,000 | | | NY Counties Tobacco Trust IV (TASC)1 | | | 5.000 | | | | 06/01/2045 | | | | 29,374,914 | |
| | 82,300,000 | | | NY Counties Tobacco Trust IV (TASC)1 | | | 6.250 | | | | 06/01/2041 | | | | 74,661,737 | |
| | 52,535,000 | | | NY Counties Tobacco Trust IV (TASC)1 | | | 5.000 | | | | 06/01/2042 | | | | 40,375,774 | |
| | 234,750,000 | | | NY Counties Tobacco Trust V | | | 6.071 | 3 | | | 06/01/2038 | | | | 42,337,162 | |
| | 643,195,000 | | | NY Counties Tobacco Trust V | | | 6.850 | 3 | | | 06/01/2055 | | | | 7,711,908 | |
| | 596,125,000 | | | NY Counties Tobacco Trust V | | | 5.171 | 3 | | | 06/01/2050 | | | | 16,441,127 | |
| | 3,179,100,000 | | | NY Counties Tobacco Trust V | | | 6.736 | 3 | | | 06/01/2060 | | | | 14,369,532 | |
| | 62,345,000 | | | NY Liberty Devel. Corp. (Bank of America Tower at One Bryant Park)4 | | | 5.625 | | | | 01/15/2046 | | | | 71,212,865 | |
| | 15,000,000 | | | NY Liberty Devel. Corp. (Bank of America Tower)4 | | | 5.125 | | | | 01/15/2044 | | | | 16,744,050 | |
| | 2,199,995 | | | NY Liberty Devel. Corp. (National Sports Museum)2 | | | 6.125 | | | | 02/15/2019 | | | | 22 | |
| | 795,000 | | | NY MTA, Series A1 | | | 5.000 | | | | 11/15/2025 | | | | 932,026 | |
| | 500,000 | | | NY MTA, Series A | | | 5.000 | | | | 11/15/2027 | | | | 588,925 | |
| | 500,000 | | | NY MTA, Series A | | | 5.000 | | | | 11/15/2026 | | | | 593,885 | |
| | 3,400,000 | | | NY MTA, Series A | | | 5.000 | | | | 11/15/2029 | | | | 3,953,316 | |
| | 6,800,000 | | | NY MTA, Series A1 | | | 5.250 | | | | 11/15/2038 | | | | 7,786,680 | |
| | 5,985,000 | | | NY MTA, Series B1 | | | 5.000 | | | | 11/15/2024 | | | | 6,663,879 | |
| | 4,035,000 | | | NY MTA, Series B1 | | | 5.000 | | | | 11/15/2029 | | | | 4,443,423 | |
| | 4,000,000 | | | NY MTA, Series C | | | 5.000 | | | | 11/15/2038 | | | | 4,523,440 | |
| | 2,150,000 | | | NY MTA, Series D | | | 5.000 | | | | 11/15/2032 | | | | 2,486,131 | |
| | 1,100,000 | | | NY MTA, Series D | | | 5.250 | | | | 11/15/2032 | | | | 1,303,269 | |
| | 1,100,000 | | | NY MTA, Series D | | | 5.250 | | | | 11/15/2031 | | | | 1,307,064 | |
| | 1,100,000 | | | NY MTA, Series D | | | 5.250 | | | | 11/15/2033 | | | | 1,299,485 | |
| | 1,100,000 | | | NY MTA, Series D | | | 5.250 | | | | 11/15/2029 | | | | 1,313,730 | |
22 OPPENHEIMER ROCHESTER FUND MUNICIPALS
| | | | | | | | | | | | | | | | |
Principal
Amount | | | | | Coupon | | | Maturity | | | Value | |
| New York (Continued) | | | | | |
| | $27,675,000 | | | NY MTA, Series D | | | 5.000 | % | | | 11/15/2030 | | | $ | 32,278,459 | |
| | 10,000,000 | | | NY MTA, Series D | | | 5.000 | | | | 11/15/2027 | | | | 11,502,600 | |
| | 1,225,000 | | | NY MTA, Series D1 | | | 5.250 | | | | 11/15/2034 | | | | 1,389,628 | |
| | 585,000 | | | NY MTA, Series D | | | 5.250 | | | | 11/15/2027 | | | | 707,113 | |
| | 1,375,000 | | | NY MTA, Series D | | | 5.250 | | | | 11/15/2026 | | | | 1,674,172 | |
| | 690,000 | | | NY MTA, Series D | | | 5.250 | | | | 11/15/2028 | | | | 827,669 | |
| | 1,100,000 | | | NY MTA, Series D | | | 5.250 | | | | 11/15/2030 | | | | 1,310,859 | |
| | 3,500,000 | | | NY MTA, Series D-1 | | | 5.000 | | | | 11/01/2028 | | | | 4,112,045 | |
| | 8,000,000 | | | NY MTA, Series D-1 | | | 5.000 | | | | 11/01/2027 | | | | 9,464,480 | |
| | 61,110,000 | | | NY MTA, Series F1 | | | 5.000 | | | | 11/15/2030 | | | | 71,275,037 | |
| | 3,000,000 | | | NY MTA, Series H1 | | | 5.000 | | | | 11/15/2025 | | | | 3,580,740 | |
| | 2,100,000 | | | NY MTA, Series H1 | | | 5.000 | | | | 11/15/2033 | | | | 2,413,908 | |
| | 2,100,000 | | | NY Triborough Bridge & Tunnel Authority | | | 5.000 | | | | 11/15/2030 | | | | 2,490,306 | |
| | 400,000 | | | NY Triborough Bridge & Tunnel Authority | | | 5.000 | | | | 11/15/2028 | | | | 477,432 | |
| | 3,200,000 | | | NY Triborough Bridge & Tunnel Authority | | | 5.000 | | | | 11/15/2029 | | | | 3,741,600 | |
| | 303,515,000 | | | NY TSASC, Inc. (TFABs)1 | | | 5.125 | | | | 06/01/2042 | | | | 254,293,972 | |
| | 250,510,000 | | | NY TSASC, Inc. (TFABs)1 | | | 5.000 | | | | 06/01/2034 | | | | 208,945,381 | |
| | 3,950,000 | | | NY TSASC, Inc. (TFABs)1 | | | 5.000 | | | | 06/01/2026 | | | | 3,952,765 | |
| | 3,800,000 | | | NYC GO1 | | | 5.000 | | | | 08/01/2035 | | | | 4,335,648 | |
| | 3,000,000 | | | NYC GO1 | | | 5.000 | | | | 08/01/2029 | | | | 3,513,990 | |
| | 5,760,000 | | | NYC GO | | | 5.000 | | | | 08/01/2031 | | | | 6,668,582 | |
| | 5,000,000 | | | NYC GO1 | | | 5.000 | | | | 08/01/2029 | | | | 5,805,000 | |
| | 5,135,000 | | | NYC GO | | | 5.000 | | | | 10/01/2032 | | | | 5,918,858 | |
| | 1,915,000 | | | NYC GO | | | 5.000 | | | | 10/01/2034 | | | | 2,192,962 | |
| | 350,000 | | | NYC GO | | | 5.000 | | | | 10/01/2030 | | | | 409,272 | |
| | 2,500,000 | | | NYC GO1 | | | 5.000 | | | | 10/01/2029 | | | | 2,936,800 | |
| | 1,175,000 | | | NYC GO1 | | | 5.000 | | | | 08/01/2035 | | | | 1,208,358 | |
| | 235,000 | | | NYC GO1 | | | 5.000 | | | | 08/01/2030 | | | | 241,672 | |
| | 4,225,000 | | | NYC GO4 | | | 5.000 | | | | 08/01/2035 | | | | 4,332,635 | |
| | 7,330,000 | | | NYC GO4 | | | 5.000 | | | | 08/01/2030 | | | | 7,523,292 | |
| | 8,750,000 | | | NYC GO | | | 5.000 | | | | 03/01/2033 | | | | 10,073,875 | |
| | 15,000 | | | NYC GO1 | | | 5.000 | | | | 06/01/2020 | | | | 15,305 | |
| | 15,000 | | | NYC GO1 | | | 5.000 | | | | 04/01/2035 | | | | 15,166 | |
| | 60,000 | | | NYC GO1 | | | 5.000 | | | | 04/01/2035 | | | | 60,733 | |
| | 5,000 | | | NYC GO1 | | | 5.320 | | | | 01/15/2028 | | | | 5,021 | |
| | 15,000 | | | NYC GO | | | 5.500 | | | | 11/15/2037 | | | | 15,063 | |
| | 5,000 | | | NYC GO1 | | | 7.750 | | | | 08/15/2028 | | | | 5,046 | |
| | 5,000 | | | NYC GO | | | 7.250 | | | | 08/15/2024 | | | | 5,029 | |
| | 4,750,000 | | | NYC GO4 | | | 5.000 | | | | 03/01/2035 | | | | 4,785,053 | |
| | 10,000,000 | | | NYC GO4 | | | 5.000 | | | | 10/01/2034 | | | | 11,491,300 | |
| | 20,000,000 | | | NYC GO4 | | | 5.250 | | | | 03/01/2021 | | | | 23,167,400 | |
| | 230,000 | | | NYC GO | | | 5.250 | | | | 06/01/2027 | | | | 230,927 | |
| | 1,340,000 | | | NYC GO1 | | | 5.000 | | | | 05/15/2036 | | | | 1,503,869 | |
| | 3,300,000 | | | NYC GO1 | | | 5.000 | | | | 10/01/2033 | | | | 3,791,337 | |
| | 380,000 | | | NYC GO | | | 5.375 | | | | 06/01/2032 | | | | 381,581 | |
| | 2,000,000 | | | NYC GO1 | | | 6.250 | | | | 12/15/2031 | | | | 2,378,100 | |
| | 5,395,000 | | | NYC GO ROLs5 | | | 18.464 | 6 | | | 05/15/2036 | | | | 8,034,018 | |
| | 1,475,000 | | | NYC GO ROLs5 | | | 18.483 | 6 | | | 05/15/2031 | | | | 2,275,866 | |
| | 875,000 | | | NYC GO ROLs5 | | | 18.498 | 6 | | | 05/15/2033 | | | | 1,350,090 | |
| | 7,205,000 | | | NYC HDC (Multifamily Hsg.)1 | | | 5.250 | | | | 11/01/2045 | | | | 7,390,385 | |
23 OPPENHEIMER ROCHESTER FUND MUNICIPALS
STATEMENT OF INVESTMENTS Continued
| | | | | | | | | | | | | | | | |
Principal
Amount | | | | | Coupon | | | Maturity | | | Value | |
| New York (Continued) | | | | | |
| | $5,140,000 | | | NYC HDC (Multifamily Hsg.)1 | | | 5.350 | % | | | 11/01/2037 | | | $ | 5,328,021 | |
| | 3,735,000 | | | NYC HDC (Multifamily Hsg.)1 | | | 5.450 | | | | 11/01/2040 | | | | 3,876,482 | |
| | 25,000 | | | NYC HDC (Multifamily Hsg.)1 | | | 5.550 | | | | 11/01/2039 | | | | 26,887 | |
| | 890,000 | | | NYC HDC (Multifamily Hsg.)1 | | | 4.950 | | | | 11/01/2039 | | | | 937,588 | |
| | 5,100,000 | | | NYC HDC (Multifamily Hsg.)1 | | | 5.150 | | | | 11/01/2037 | | | | 5,160,129 | |
| | 1,215,000 | | | NYC HDC (Multifamily Hsg.)1 | | | 5.350 | | | | 05/01/2041 | | | | 1,263,649 | |
| | 3,000,000 | | | NYC HDC (Multifamily Hsg.)4 | | | 5.125 | | | | 11/01/2032 | | | | 3,088,320 | |
| | 3,500,000 | | | NYC HDC (Multifamily Hsg.)4 | | | 5.000 | | | | 11/01/2037 | | | | 3,529,505 | |
| | 2,670,000 | | | NYC HDC (Multifamily Hsg.)1 | | | 5.450 | | | | 11/01/2046 | | | | 2,733,466 | |
| | 780,000 | | | NYC HDC (Multifamily Hsg.)1 | | | 5.000 | | | | 11/01/2030 | | | | 806,785 | |
| | 1,675,000 | | | NYC HDC (Multifamily Hsg.)1 | | | 5.200 | | | | 11/01/2035 | | | | 1,726,238 | |
| | 3,090,000 | | | NYC HDC (Multifamily Hsg.)4 | | | 5.500 | | | | 11/01/2034 | | | | 3,326,662 | |
| | 4,685,000 | | | NYC HDC (Multifamily Hsg.)4 | | | 5.050 | | | | 11/01/2039 | | | | 4,724,476 | |
| | 2,435,000 | | | NYC HDC (Multifamily Hsg.)4 | | | 5.100 | | | | 11/01/2027 | | | | 2,551,877 | |
| | 8,035,000 | | | NYC HDC (Multifamily Hsg.)4 | | | 5.200 | | | | 11/01/2040 | | | | 8,241,893 | |
| | 10,910,000 | | | NYC HDC (Multifamily Hsg.)4 | | | 5.700 | | | | 11/01/2046 | | | | 11,755,073 | |
| | 2,840,000 | | | NYC HDC (Multifamily Hsg.)4 | | | 5.550 | | | | 11/01/2039 | | | | 3,054,420 | |
| | 70,000 | | | NYC HDC (Multifamily Hsg.), Series A1 | | | 5.500 | | | | 11/01/2034 | | | | 70,230 | |
| | 29,070,000 | | | NYC HDC (Multifamily Hsg.), Series B4 | | | 5.350 | | | | 05/01/2049 | | | | 29,868,093 | |
| | 8,365,000 | | | NYC HDC (Multifamily Hsg.), Series C4 | | | 5.125 | | | | 05/01/2040 | | | | 8,438,526 | |
| | 11,250,000 | | | NYC HDC (Multifamily Hsg.), Series C4 | | | 5.050 | | | | 11/01/2036 | | | | 11,375,119 | |
| | 13,180,000 | | | NYC HDC (Multifamily Hsg.), Series G-14 | | | 4.875 | | | | 11/01/2039 | | | | 13,326,584 | |
| | 2,750,000 | | | NYC HDC, Series C4 | | | 5.000 | | | | 11/01/2026 | | | | 2,786,740 | |
| | 940,000 | | | NYC IDA (Allied Metal)1 | | | 7.125 | | | | 12/01/2027 | | | | 932,113 | |
| | 2,130,000 | | | NYC IDA (Amboy Properties)1 | | | 6.750 | | | | 06/01/2020 | | | | 2,097,581 | |
| | 338,060,000 | | | NYC IDA (American Airlines)1 | | | 8.500 | | | | 08/01/2028 | | | | 352,647,289 | |
| | 59,350,000 | | | NYC IDA (American Airlines)1 | | | 7.750 | | | | 08/01/2031 | | | | 64,964,510 | |
| | 200,000 | | | NYC IDA (American Airlines)1 | | | 7.500 | | | | 08/01/2016 | | | | 211,840 | |
| | 39,860,000 | | | NYC IDA (American Airlines)1 | | | 8.000 | | | | 08/01/2028 | | | | 43,826,469 | |
| | 18,200,000 | | | NYC IDA (American Airlines)1 | | | 7.625 | | | | 08/01/2025 | | | | 19,981,780 | |
| | 365,000 | | | NYC IDA (Atlantic Veal & Lamb) | | | 8.375 | | | | 12/01/2016 | | | | 365,438 | |
| | 22,255,000 | | | NYC IDA (Brooklyn Navy Yard Cogeneration Partners) | | | 6.200 | | | | 10/01/2022 | | | | 21,850,849 | |
| | 97,130,000 | | | NYC IDA (Brooklyn Navy Yard Cogeneration Partners) | | | 5.650 | | | | 10/01/2028 | | | | 83,528,886 | |
| | 153,620,000 | | | NYC IDA (Brooklyn Navy Yard Cogeneration Partners) | | | 5.750 | | | | 10/01/2036 | | | | 131,429,591 | |
| | 2,895,000 | | | NYC IDA (Center for Elimination of Family Violence)1 | | | 7.375 | | | | 11/01/2036 | | | | 3,005,357 | |
| | 3,400,000 | | | NYC IDA (Center for Nursing/Rehabilitation)1 | | | 5.375 | | | | 08/01/2027 | | | | 3,174,104 | |
| | 13,600,000 | | | NYC IDA (Center for Nursing/Rehabilitation)1 | | | 5.375 | | | | 08/01/2027 | | | | 12,696,416 | |
| | 18,000,000 | | | NYC IDA (Chapin School)1 | | | 5.000 | | | | 11/01/2038 | | | | 18,358,020 | |
| | 1,490,000 | | | NYC IDA (Comprehensive Care Management) | | | 6.000 | | | | 05/01/2026 | | | | 1,577,776 | |
| | 3,145,000 | | | NYC IDA (Comprehensive Care Management) | | | 6.125 | | | | 11/01/2035 | | | | 3,148,711 | |
| | 470,000 | | | NYC IDA (Comprehensive Care Management) | | | 7.875 | | | | 12/01/2016 | | | | 471,683 | |
| | 1,285,000 | | | NYC IDA (Comprehensive Care Management)1 | | | 6.375 | | | | 11/01/2028 | | | | 1,287,043 | |
| | 3,245,000 | | | NYC IDA (Comprehensive Care Management)1 | | | 6.375 | | | | 11/01/2028 | | | | 3,250,354 | |
| | 620,000 | | | NYC IDA (Cool Wind Ventilation)1 | | | 5.450 | | | | 11/01/2017 | | | | 617,477 | |
| | 5,685,000 | | | NYC IDA (Cool Wind Ventilation)1 | | | 6.075 | | | | 11/01/2027 | | | | 5,475,223 | |
| | 555,000 | | | NYC IDA (Cool Wind Ventilation)1 | | | 5.450 | | | | 11/01/2017 | | | | 552,741 | |
24 OPPENHEIMER ROCHESTER FUND MUNICIPALS
| | | | | | | | | | | | | | | | |
Principal Amount | | | | | Coupon | | | Maturity | | | Value | |
| New York (Continued) | | | | | |
| | $2,670,000 | | | NYC IDA (Gourmet Boutique)1 | | | 5.750 | % | | | 05/01/2021 | | | $ | 1,963,117 | |
| | 7,290,000 | | | NYC IDA (Guttmacher Institute)1 | | | 5.750 | | | | 12/01/2036 | | | | 7,357,797 | |
| | 600,000 | | | NYC IDA (Independent Living Assoc.)1 | | | 6.200 | | | | 07/01/2020 | | | | 607,770 | |
| | 1,240,000 | | | NYC IDA (Liberty-IAC/Interactive Corp.)1 | | | 5.000 | | | | 09/01/2035 | | | | 1,262,779 | |
| | 3,745,000 | | | NYC IDA (Manhattan Community Access Corp.)1 | | | 6.000 | | | | 12/01/2036 | | | | 3,818,627 | |
| | 1,895,000 | | | NYC IDA (Margaret Tietz Nursing & Rehabilitation Center)1 | | | 6.375 | | | | 11/01/2038 | | | | 1,953,764 | |
| | 9,175,000 | | | NYC IDA (Margaret Tietz Nursing & Rehabilitation Center)1 | | | 6.375 | | | | 11/01/2038 | | | | 9,459,517 | |
| | 14,745,000 | | | NYC IDA (MediSys Health Network)1 | | | 6.250 | | | | 03/15/2024 | | | | 14,090,764 | |
| | 1,945,000 | | | NYC IDA (Metropolitan College of New York)1 | | | 5.750 | | | | 03/01/2020 | | | | 1,970,052 | |
| | 1,750,000 | | | NYC IDA (PSCH)1 | | | 6.375 | | | | 07/01/2033 | | | | 1,750,717 | |
| | 6,800,000 | | | NYC IDA (Reece School)1 | | | 7.500 | | | | 12/01/2037 | | | | 7,149,928 | |
| | 1,000,000 | | | NYC IDA (Roundabout Theatre)1 | | | 5.000 | | | | 10/01/2023 | | | | 990,150 | |
| | 2,370,000 | | | NYC IDA (Sahadi Fine Foods)1 | | | 6.750 | | | | 11/01/2019 | | | | 2,373,697 | |
| | 200,000 | | | NYC IDA (Samaritan Aids Services)1 | | | 5.000 | | | | 11/01/2024 | | | | 200,422 | |
| | 875,000 | | | NYC IDA (SFTU/YAI/CRV Obligated Group)1 | | | 5.000 | | | | 07/01/2026 | | | | 871,141 | |
| | 1,625,000 | | | NYC IDA (Special Needs Facilities Pooled Program)1 | | | 4.750 | | | | 07/01/2020 | | | | 1,584,424 | |
| | 995,000 | | | NYC IDA (Special Needs Facilities Pooled Program)1 | | | 5.250 | | | | 07/01/2022 | | | | 950,633 | |
| | 145,000 | | | NYC IDA (Special Needs Facilities Pooled Program)1 | | | 7.875 | | | | 08/01/2025 | | | | 145,088 | |
| | 500,000 | | | NYC IDA (Special Needs Facilities Pooled Program)1 | | | 6.650 | | | | 07/01/2023 | | | | 501,485 | |
| | 955,000 | | | NYC IDA (Stallion)1 | | | 6.000 | | | | 11/01/2027 | | | | 953,701 | |
| | 5,760,000 | | | NYC IDA (Stallion)1 | | | 5.500 | | | | 11/01/2031 | | | | 5,579,366 | |
| | 1,275,000 | | | NYC IDA (Streamline Plastics) | | | 8.125 | | | | 12/01/2025 | | | | 1,275,319 | |
| | 155,000 | | | NYC IDA (Streamline Plastics) | | | 7.750 | | | | 12/01/2015 | | | | 155,076 | |
| | 6,808,500 | | | NYC IDA (Studio School)2 | | | 7.000 | | | | 11/01/2038 | | | | 5,460,417 | |
| | 1,500,000 | | | NYC IDA (Terminal One Group Assoc.)1 | | | 5.500 | 7 | | | 01/01/2021 | | | | 1,572,015 | |
| | 1,000,000 | | | NYC IDA (The Bank Street College)1 | | | 5.250 | | | | 12/01/2030 | | | | 1,001,330 | |
| | 380,000 | | | NYC IDA (The Bank Street College)1 | | | 5.250 | | | | 12/01/2021 | | | | 380,771 | |
| | 8,600,000 | | | NYC IDA (The Child School)1 | | | 7.550 | | | | 06/01/2033 | | | | 8,638,012 | |
| | 3,475,000 | | | NYC IDA (Therapy & Learning Center)1 | | | 8.250 | | | | 09/01/2031 | | | | 3,477,815 | |
| | 32,040,000 | | | NYC IDA (UNICEF)1 | | | 5.300 | | | | 11/01/2038 | | | | 32,240,250 | |
| | 5,000,000 | | | NYC IDA (United Jewish Appeal-Federal Jewish Philanthropies) | | | 5.000 | | | | 07/01/2034 | | | | 5,652,450 | |
| | 3,525,000 | | | NYC IDA (Urban Resource Institute)1 | | | 7.375 | | | | 11/01/2033 | | | | 3,537,584 | |
| | 70,500,000 | | | NYC IDA (Visy Paper)1 | | | 7.950 | | | | 01/01/2028 | | | | 70,779,180 | |
| | 4,200,000 | | | NYC IDA (Visy Paper)1 | | | 7.800 | | | | 01/01/2016 | | | | 4,216,338 | |
| | 1,930,000 | | | NYC IDA (Vocational Instruction)2 | | | 7.750 | | | | 02/01/2033 | | | | 1,331,314 | |
| | 1,210,000 | | | NYC IDA (W & W Jewelers)1 | | | 8.250 | | | | 02/01/2021 | | | | 1,210,472 | |
| | 2,900,000 | | | NYC IDA (Weizmann Institute)1 | | | 5.900 | | | | 11/01/2034 | | | | 2,905,394 | |
| | 5,930,000 | | | NYC IDA (Weizmann Institute)1 | | | 5.900 | | | | 11/01/2034 | | | | 5,941,030 | |
| | 855,000 | | | NYC IDA (World Casing Corp.)1 | | | 6.700 | | | | 11/01/2019 | | | | 847,998 | |
| | 100,000 | | | NYC IDA (Yankee Stadium)1,8 | | | 5.000 | | | | 03/01/2031 | | | | 103,463 | |
| | 16,500,000 | | | NYC IDA (Yankee Stadium)1,8 | | | 7.000 | | | | 03/01/2049 | | | | 19,951,470 | |
| | 6,800,000 | | | NYC IDA (Yankee Stadium)1,8 | | | 2.504 | | | | 03/01/2022 | | | | 6,572,336 | |
| | 18,110,000 | | | NYC IDA (Yankee Stadium)1,8 | | | 5.000 | | | | 03/01/2046 | | | | 18,647,505 | |
25 OPPENHEIMER ROCHESTER FUND MUNICIPALS
STATEMENT OF INVESTMENTS Continued
| | | | | | | | | | | | | | | | |
Principal
Amount | | | | | Coupon | | | Maturity | | | Value | |
| New York (Continued) | | | | | |
| | $70,000 | | | NYC IDA (Yankee Stadium)1,8 | | | 5.000 | % | | | 03/01/2036 | | | $ | 73,592 | |
| | 24,270,000 | | | NYC IDA (Yeled Yalda Early Childhood)1 | | | 5.725 | | | | 11/01/2037 | | | | 24,542,795 | |
| | 31,750,000 | | | NYC Municipal Water Finance Authority4 | | | 5.500 | | | | 06/15/2043 | | | | 37,342,112 | |
| | 21,570,000 | | | NYC Municipal Water Finance Authority4 | | | 5.375 | | | | 06/15/2043 | | | | 25,219,825 | |
| | 7,595,000 | | | NYC Municipal Water Finance Authority1 | | | 0.030 | 7 | | | 06/15/2039 | | | | 7,595,000 | |
| | 1,900,000 | | | NYC Municipal Water Finance Authority1 | | | 5.625 | | | | 06/15/2027 | | | | 2,204,133 | |
| | 7,350,000 | | | NYC Municipal Water Finance Authority1 | | | 5.250 | | | | 06/15/2040 | | | | 8,345,557 | |
| | 7,405,000 | | | NYC Municipal Water Finance Authority1 | | | 5.250 | | | | 06/15/2044 | | | | 8,466,359 | |
| | 2,650,000 | | | NYC Municipal Water Finance Authority1 | | | 5.750 | | | | 06/15/2040 | | | | 3,034,859 | |
| | 8,950,000 | | | NYC Municipal Water Finance Authority1 | | | 5.000 | | | | 06/15/2031 | | | | 10,185,100 | |
| | 700,000 | | | NYC Transitional Finance Authority1 | | | 5.125 | | | | 01/15/2034 | | | | 779,548 | |
| | 50,000 | | | NYC Transitional Finance Authority | | | 5.000 | | | | 02/01/2033 | | | | 50,190 | |
| | 15,000,000 | | | NYC Transitional Finance Authority (Building Aid)4 | | | 5.250 | | | | 07/15/2037 | | | | 17,332,050 | |
| | 25,000,000 | | | NYC Transitional Finance Authority (Building Aid)4 | | | 5.000 | | | | 07/15/2037 | | | | 28,378,000 | |
| | 5,410,000 | | | NYC Transitional Finance Authority (Building Aid)1 | | | 5.000 | | | | 07/15/2040 | | | | 6,104,536 | |
| | 1,700,000 | | | NYC Transitional Finance Authority (Building Aid)1 | | | 5.500 | | | | 01/15/2039 | | | | 1,940,346 | |
| | 8,465,000 | | | NYC Transitional Finance Authority (Building Aid) SPEARS | | | 0.140 | 7 | | | 01/15/2039 | | | | 8,465,000 | |
| | 8,190,000 | | | NYC Transitional Finance Authority (Future Tax)1 | | | 5.000 | | | | 02/01/2035 | | | | 9,479,761 | |
| | 20,335,000 | | | NYC Transitional Finance Authority (Future Tax)4 | | | 5.000 | | | | 02/01/2030 | | | | 23,799,207 | |
| | 15,000,000 | | | NYC Transitional Finance Authority (Future Tax)4 | | | 5.000 | | | | 05/01/2034 | | | | 17,470,650 | |
| | 2,400,000 | | | NYC Transitional Finance Authority (Future Tax)1 | | | 5.250 | | | | 02/01/2030 | | | | 2,809,392 | |
| | 1,845,000 | | | NYS Convention Center Devel. Corp. (Hotel Unit)1 | | | 5.000 | | | | 11/15/2035 | | | | 1,905,664 | |
| | 850,000 | | | NYS DA (Brooklyn Law School) | | | 5.000 | | | | 07/01/2027 | | | | 950,105 | |
| | 430,000 | | | NYS DA (Brooklyn Law School) | | | 5.000 | | | | 07/01/2030 | | | | 475,958 | |
| | 430,000 | | | NYS DA (Brooklyn Law School) | | | 5.000 | | | | 07/01/2029 | | | | 477,463 | |
| | 850,000 | | | NYS DA (Brooklyn Law School) | | | 5.000 | | | | 07/01/2028 | | | | 946,807 | |
| | 260,000 | | | NYS DA (Catholic Health System) | | | 5.000 | | | | 07/01/2032 | | | | 288,790 | |
| | 500,000 | | | NYS DA (Catholic Health System) | | | 5.000 | | | | 07/01/2032 | | | | 555,365 | |
| | 300,000 | | | NYS DA (Culinary Institute of America) | | | 5.000 | | | | 07/01/2034 | | | | 329,355 | |
| | 285,000 | | | NYS DA (Fordham University)1 | | | 5.000 | | | | 07/01/2038 | | | | 314,734 | |
| | 200,000 | | | NYS DA (Fordham University)1 | | | 5.000 | | | | 07/01/2030 | | | | 231,866 | |
| | 5,300,000 | | | NYS DA (Interagency Council Pooled Loan Program)1 | | | 7.000 | | | | 07/01/2031 | | | | 5,561,502 | |
| | 5,700,000 | | | NYS DA (Interagency Council)1 | | | 7.000 | | | | 07/01/2035 | | | | 7,089,375 | |
| | 3,000,000 | | | NYS DA (Iona College) | | | 5.000 | | | | 07/01/2032 | | | | 3,272,880 | |
| | 3,490,000 | | | NYS DA (Manhattan College)1 | | | 5.300 | | | | 07/01/2037 | | | | 3,619,235 | |
| | 18,230,000 | | | NYS DA (Memorial Sloan-Kettering)4 | | | 5.000 | | | | 07/01/2035 | | | | 19,191,052 | |
| | 16,250,000 | | | NYS DA (Mental Health Services Facilities)1 | | | 0.030 | 7 | | | 02/15/2031 | | | | 16,250,000 | |
| | 150,000 | | | NYS DA (Mental Health Services Facilities)1 | | | 5.000 | | | | 02/15/2037 | | | | 157,113 | |
| | 860,000 | | | NYS DA (Miriam Osborn Memorial Home Assoc.) | | | 5.000 | | | | 07/01/2029 | | | | 927,020 | |
| | 1,000,000 | | | NYS DA (New School University)1 | | | 5.750 | | | | 07/01/2050 | | | | 1,142,570 | |
| | 135,000 | | | NYS DA (New School University)1 | | | 5.000 | | | | 07/01/2033 | | | | 135,194 | |
| | 5,150,000 | | | NYS DA (New School University)1 | | | 5.000 | | | | 07/01/2041 | | | | 5,155,922 | |
| | 40,000,000 | | | NYS DA (New York University)1 | | | 5.250 | | | | 07/01/2048 | | | | 44,395,600 | |
26 OPPENHEIMER ROCHESTER FUND MUNICIPALS
| | | | | | | | | | | | | | | | |
Principal
Amount | | | | | Coupon | | | Maturity | | | Value | |
| New York (Continued) | | | | | |
| | $11,500,000 | | | NYS DA (North Shore L.I. Jewish Obligated Group)1 | | | 5.250 | % | | | 05/01/2034 | | | $ | 12,939,570 | |
| | 2,000,000 | | | NYS DA (NYU Hospitals Center)1 | | | 5.625 | | | | 07/01/2037 | | | | 2,250,860 | |
| | 8,575,000 | | | NYS DA (NYU Hospitals Center)1 | | | 5.000 | | | | 07/01/2036 | | | | 9,026,388 | |
| | 1,000,000 | | | NYS DA (Pratt Institute)1,9 | | | 5.000 | | | | 07/01/2034 | | | | 1,153,980 | |
| | 6,035,000 | | | NYS DA (Providence Rest)1 | | | 5.000 | | | | 07/01/2035 | | | | 6,058,657 | |
| | 2,700,000 | | | NYS DA (Providence Rest)1 | | | 5.125 | | | | 07/01/2030 | | | | 2,714,877 | |
| | 3,100,000 | | | NYS DA (Providence Rest)1 | | | 5.250 | | | | 07/01/2025 | | | | 3,123,591 | |
| | 1,750,000 | | | NYS DA (School District Bond Financing Program), Series C1 | | | 7.250 | | | | 10/01/2028 | | | | 2,106,475 | |
| | 1,525,000 | | | NYS DA (School District Bond Financing Program), Series C1 | | | 7.500 | | | | 04/01/2039 | | | | 1,839,089 | |
| | 2,645,000 | | | NYS DA (School District Bond Financing Program), Series C1 | | | 7.375 | | | | 10/01/2033 | | | | 3,177,835 | |
| | 5,770,000 | | | NYS DA (Smithtown Special Library District)1 | | | 6.000 | | | | 07/01/2028 | | | | 6,700,701 | |
| | 2,480,000 | | | NYS DA (Special Surgery Hospital)1 | | | 6.000 | | | | 08/15/2038 | | | | 2,926,871 | |
| | 270,000 | | | NYS DA (St. John’s University) | | | 5.000 | | | | 07/01/2028 | | | | 309,245 | |
| | 10,750,000 | | | NYS DA (St. John’s University) | | | 5.000 | | | | 07/01/2030 | | | | 12,226,943 | |
| | 3,500,000 | | | NYS DA (St. Joseph’s College)1 | | | 5.250 | | | | 07/01/2035 | | | | 3,797,640 | |
| | 46,700,000 | | | NYS DA (St. Mary’s Hospital for Children) | | | 7.875 | | | | 11/15/2041 | | | | 50,827,813 | |
| | 5,620,000 | | | NYS DA (State Personal Income Tax Authority)1 | | | 5.000 | | | | 02/15/2034 | | | | 6,454,233 | |
| | 15,915,000 | | | NYS DA (State Personal Income Tax Authority)4 | | | 5.000 | | | | 03/15/2034 | | | | 18,336,432 | |
| | 3,000,000 | | | NYS DA (State University of New York)1 | | | 5.000 | | | | 07/01/2040 | | | | 3,422,100 | |
| | 5,240,000 | | | NYS DA (The Bronx-Lebanon Hospital Center)1 | | | 6.250 | | | | 02/15/2035 | | | | 6,057,230 | |
| | 4,395,000 | | | NYS DA (The New School)1 | | | 5.000 | | | | 07/01/2031 | | | | 4,900,996 | |
| | 60,000 | | | NYS DA (University of Rochester)1 | | | 5.000 | | | | 07/01/2034 | | | | 61,240 | |
| | 1,000,000 | | | NYS DA (University of Rochester)1 | | | 5.750 | | | | 07/01/2039 | | | | 1,152,720 | |
| | 11,695,000 | | | NYS DA (Vassar College)4 | | | 5.000 | | | | 07/01/2046 | | | | 12,719,938 | |
| | 6,565,000 | | | NYS DA (Yeshiva University)1 | | | 5.000 | | | | 09/01/2038 | | | | 6,614,631 | |
| | 3,105,000 | | | NYS DA (Yeshiva University)1 | | | 5.000 | | | | 11/01/2031 | | | | 3,175,018 | |
| | 3,500,000 | | | NYS DA (Yeshiva University)1 | | | 5.000 | | | | 09/01/2034 | | | | 3,539,585 | |
| | 1,405,000 | | | NYS EFC (Clean Water & Drinking Revolving Funds)1 | | | 5.000 | | | | 06/15/2037 | | | | 1,565,086 | |
| | 215,000 | | | NYS EFC (NYC Municipal Water Finance Authority) | | | 5.000 | | | | 06/15/2034 | | | | 219,100 | |
| | 250,000 | | | NYS EFC (United Waterworks)1 | | | 5.150 | | | | 03/01/2034 | | | | 250,317 | |
| | 15,000 | | | NYS ERDA (Brooklyn Union Gas Company) | | | 5.500 | | | | 01/01/2021 | | | | 15,063 | |
| | 25,000 | | | NYS ERDA (Brooklyn Union Gas Company)1 | | | 4.700 | | | | 02/01/2024 | | | | 25,976 | |
| | 7,000,000 | | | NYS ERDA (Brooklyn Union Gas Company) RIBS | | | 12.313 | 6 | | | 04/01/2020 | | | | 7,017,500 | |
| | 16,300,000 | | | NYS ERDA (Brooklyn Union Gas Company) RIBS | | | 13.481 | 6 | | | 07/01/2026 | | | | 16,466,260 | |
| | 150,000 | | | NYS HFA (Affordable Hsg.)1 | | | 6.750 | | | | 11/01/2038 | | | | 173,177 | |
| | 1,080,000 | | | NYS HFA (Affordable Hsg.)1 | | | 6.450 | | | | 11/01/2029 | | | | 1,197,839 | |
| | 2,000,000 | | | NYS HFA (Affordable Hsg.)1 | | | 5.000 | | | | 11/01/2042 | | | | 2,129,180 | |
| | 2,365,000 | | | NYS HFA (Affordable Hsg.)1 | | | 5.250 | | | | 11/01/2038 | | | | 2,438,197 | |
| | 10,220,000 | | | NYS HFA (Affordable Hsg.)4 | | | 5.450 | | | | 11/01/2045 | | | | 10,553,191 | |
| | 600,000 | | | NYS HFA (Affordable Hsg.)1 | | | 5.200 | | | | 11/01/2030 | | | | 634,530 | |
| | 1,060,000 | | | NYS HFA (Children’s Rescue)1 | | | 7.625 | | | | 05/01/2018 | | | | 1,060,318 | |
| | 920,000 | | | NYS HFA (Friendship)1 | | | 5.100 | | | | 08/15/2041 | | | | 925,805 | |
| | 1,125,000 | | | NYS HFA (Golden Age Apartments)1 | | | 5.000 | | | | 02/15/2037 | | | | 1,137,791 | |
| | 150,000 | | | NYS HFA (Highland Avenue Senior Apartments)1 | | | 5.000 | | | | 02/15/2039 | | | | 152,832 | |
27 OPPENHEIMER ROCHESTER FUND MUNICIPALS
STATEMENT OF INVESTMENTS Continued
| | | | | | | | | | | | | | | | |
Principal
Amount | | | | | Coupon | | | Maturity | | | Value | |
| New York (Continued) | | | | | |
| | $120,000 | | | NYS HFA (Horizons at Wawayanda)1 | | | 5.150 | % | | | 11/01/2040 | | | $ | 124,078 | |
| | 2,080,000 | | | NYS HFA (Multifamily Hsg.)1 | | | 5.375 | | | | 02/15/2035 | | | | 2,082,309 | |
| | 1,255,000 | | | NYS HFA (Multifamily Hsg.)1 | | | 6.400 | | | | 11/15/2027 | | | | 1,257,887 | |
| | 1,710,000 | | | NYS HFA (Multifamily Hsg.)1 | | | 5.650 | | | | 02/15/2034 | | | | 1,712,360 | |
| | 105,000 | | | NYS HFA (State Personal Income Tax Authority)1 | | | 5.000 | | | | 03/15/2036 | | | | 108,607 | |
| | 1,145,000 | | | NYS HFA (State Personal Income Tax Authority)1 | | | 5.000 | | | | 03/15/2036 | | | | 1,184,331 | |
| | 835,000 | | | NYS LGSC (SCSB) | | | 7.750 | | | | 12/15/2021 | | | | 836,286 | |
| | 270,000 | | | NYS LGSC (SCSB) | | | 7.375 | | | | 12/15/2016 | | | | 272,452 | |
| | 20,000,000 | | | NYS Liberty Devel. Corp. (4 World Trade Center)1 | | | 5.750 | | | | 11/15/2051 | | | | 23,439,200 | |
| | 1,000,000 | | | NYS Liberty Devel. Corp. (4 World Trade Center)1 | | | 5.000 | | | | 11/15/2031 | | | | 1,132,960 | |
| | 7,650,000 | | | NYS Thruway Authority | | | 5.000 | | | | 01/01/2032 | | | | 8,715,722 | |
| | 5,015,000 | | | NYS UDC (State Personal Income Tax Authority)1 | | | 5.000 | | | | 03/15/2043 | | | | 5,706,318 | |
| | 50,000 | | | Oneida County, NY IDA (Civic Facilities-Mohawk Valley)1 | | | 4.625 | | | | 09/15/2030 | | | | 50,045 | |
| | 830,000 | | | Oneida County, NY IDA (Civic Facilities-Mohawk Valley)1 | | | 5.000 | | | | 09/15/2035 | | | | 831,560 | |
| | 1,115,000 | | | Onondaga County, NY IDA (Free Library)1 | | | 5.125 | | | | 03/01/2037 | | | | 1,169,323 | |
| | 1,185,000 | | | Onondaga County, NY IDA (Free Library)1 | | | 5.125 | | | | 03/01/2030 | | | | 1,249,831 | |
| | 4,635,000 | | | Onondaga County, NY Res Rec | | | 5.000 | | | | 05/01/2015 | | | | 4,638,245 | |
| | 42,834,598 | | | Onondaga County, NY Res Rec | | | 0.000 | 10 | | | 05/01/2022 | | | | 38,459,044 | |
| | 1,000,000 | | | Onondaga, NY Civic Devel Corp. (Le Moyne College) | | | 5.000 | | | | 07/01/2032 | | | | 1,087,540 | |
| | 3,465,000 | | | Onondaga, NY Civic Devel Corp. (Upstate Properties)1 | | | 5.250 | | | | 12/01/2041 | | | | 3,815,554 | |
| | 2,000,000 | | | Onondaga, NY Civic Devel. Corp. (Le Moyne College)1 | | | 5.375 | | | | 07/01/2040 | | | | 2,172,080 | |
| | 1,435,000 | | | Orange County, NY Funding Corp. (Mount St. Mary College)1 | | | 5.000 | | | | 07/01/2042 | | | | 1,522,894 | |
| | 1,715,000 | | | Orange County, NY IDA (St. Luke’s Cornwall Hospital Obligated Group)1 | | | 5.375 | | | | 12/01/2021 | | | | 1,717,350 | |
| | 6,330,000 | | | Orange County, NY IDA (St. Luke’s Cornwall Hospital Obligated Group) | | | 5.375 | | | | 12/01/2026 | | | | 6,352,915 | |
| | 2,235,000 | | | Orange County, NY IDA (St. Luke’s Cornwall Hospital Obligated Group)1 | | | 5.375 | | | | 12/01/2026 | | | | 2,237,235 | |
| | 10,065,000 | | | Port Authority NY/NJ (Continental Airlines)1 | | | 9.125 | | | | 12/01/2015 | | | | 10,225,537 | |
| | 345,000 | | | Port Authority NY/NJ (JFK International Air Terminal)1 | | | 6.500 | | | | 12/01/2028 | | | | 361,998 | |
| | 32,140,000 | | | Port Authority NY/NJ (JFK International Air Terminal)1 | | | 5.750 | | | | 12/01/2025 | | | | 32,236,099 | |
| | 16,565,000 | | | Port Authority NY/NJ (JFK International Air Terminal)1 | | | 5.750 | | | | 12/01/2022 | | | | 16,659,421 | |
| | 34,400,000 | | | Port Authority NY/NJ (KIAC)1 | | | 6.750 | | | | 10/01/2019 | | | | 34,396,216 | |
| | 27,255,000 | | | Port Authority NY/NJ, 141st Series4 | | | 4.500 | | | | 09/01/2029 | | | | 27,636,780 | |
| | 35,000 | | | Port Authority NY/NJ, 143rd Series1 | | | 5.000 | | | | 04/01/2036 | | | | 35,953 | |
| | 47,910,000 | | | Port Authority NY/NJ, 143rd Series4 | | | 5.000 | | | | 10/01/2030 | | | | 49,376,046 | |
| | 10,000 | | | Port Authority NY/NJ, 146th Series1 | | | 4.750 | | | | 12/01/2027 | | | | 10,646 | |
| | 10,000 | | | Port Authority NY/NJ, 146th Series1 | | | 4.500 | | | | 12/01/2034 | | | | 10,227 | |
| | 26,100,000 | | | Port Authority NY/NJ, 146th Series4 | | | 4.750 | | | | 12/01/2027 | | | | 27,769,199 | |
| | 13,005,000 | | | Port Authority NY/NJ, 147th Series4 | | | 4.750 | | | | 10/15/2028 | | | | 13,859,152 | |
| | 20,000,000 | | | Port Authority NY/NJ, 147th Series4 | | | 5.000 | | | | 10/15/2032 | | | | 20,879,780 | |
| | 17,790,000 | | | Port Authority NY/NJ, 147th Series4 | | | 5.000 | | | | 10/15/2027 | | | | 19,100,587 | |
28 OPPENHEIMER ROCHESTER FUND MUNICIPALS
| | | | | | | | | | | | | | | | |
Principal
Amount | | | | | Coupon | | | Maturity | | | Value | |
| New York (Continued) | | | | | |
| | $15,000,000 | | | Port Authority NY/NJ, 151st Series4 | | | 6.000 | % | | | 09/15/2028 | | | $ | 16,939,800 | |
| | 82,000,000 | | | Port Authority NY/NJ, 151st Series4 | | | 5.750 | | | | 03/15/2035 | | | | 91,560,783 | |
| | 22,500,000 | | | Port Authority NY/NJ, 152nd Series4 | | | 5.750 | | | | 11/01/2030 | | | | 25,322,400 | |
| | 101,940,000 | | | Port Authority NY/NJ, 152nd Series4 | | | 5.250 | | | | 11/01/2035 | | | | 112,022,874 | |
| | 15,300,000 | | | Port Authority NY/NJ, 161st Series4 | | | 5.000 | | | | 10/15/2031 | | | | 17,579,394 | |
| | 20,250,000 | | | Port Authority NY/NJ, 163rd Series4 | | | 5.000 | | | | 07/15/2039 | | | | 22,893,597 | |
| | 15,000,000 | | | Port Authority NY/NJ, 166th Series4 | | | 5.250 | | | | 07/15/2036 | | | | 17,257,800 | |
| | 21,515,000 | | | Port Authority NY/NJ, 166th Series4 | | | 5.000 | | | | 01/15/2041 | | | | 24,274,195 | |
| | 2,720,000 | | | Port Authority NY/NJ, 169th Series1 | | | 5.000 | | | | 10/15/2036 | | | | 2,996,434 | |
| | 400,000 | | | Port Authority NY/NJ, 172nd Series1 | | | 5.000 | | | | 10/01/2034 | | | | 446,376 | |
| | 13,715,000 | | | Port Authority NY/NJ, Series 2014-XF00014 | | | 5.250 | | | | 05/01/2038 | | | | 15,071,496 | |
| | 2,755,000 | | | Poughkeepsie, NY IDA (Eastman & Bixby Redevel. Corp.)1 | | | 6.000 | | | | 08/01/2032 | | | | 2,760,648 | |
| | 2,525,000 | | | Ramapo, NY Local Devel. Corp.1 | | | 5.000 | | | | 03/15/2033 | | | | 2,801,538 | |
| | 1,500,000 | | | Rensselaer County, NY IDA (Franciscan Heights)1 | | | 5.375 | | | | 12/01/2036 | | | | 1,502,220 | |
| | 7,300,000 | | | Rensselaer County, NY Tobacco Asset Securitization Corp.1 | | | 5.750 | | | | 06/01/2043 | | | | 7,299,927 | |
| | 6,385,000 | | | Rensselaer County, NY Tobacco Asset Securitization Corp.1 | | | 5.625 | | | | 06/01/2035 | | | | 6,384,553 | |
| | 4,820,000 | | | Rensselaer, NY City School District COP1 | | | 5.000 | | | | 06/01/2036 | | | | 4,893,891 | |
| | 1,195,000 | | | Rockland County, NY IDA (CRV/Rockland County Assoc. for the Learning Disabled Obligated Group)1 | | | 4.900 | | | | 07/01/2021 | | | | 1,200,760 | |
| | 13,095,000 | | | Rockland County, NY Tobacco Asset Securitization Corp. | | | 5.750 | | | | 08/15/2043 | | | | 13,094,476 | |
| | 30,000,000 | | | Rockland County, NY Tobacco Asset Securitization Corp. | | | 5.875 | 3 | | | 08/15/2045 | | | | 1,182,000 | |
| | 9,225,000 | | | Rockland County, NY Tobacco Asset Securitization Corp. | | | 5.625 | | | | 08/15/2035 | | | | 9,224,908 | |
| | 486,000,000 | | | Rockland County, NY Tobacco Asset Securitization Corp. | | | 6.596 | 3 | | | 08/15/2060 | | | | 2,021,760 | |
| | 30,000 | | | Sanford Town, NY GO1 | | | 5.250 | | | | 04/15/2022 | | | | 30,877 | |
| | 30,000 | | | Sanford Town, NY GO1 | | | 5.250 | | | | 04/15/2021 | | | | 30,934 | |
| | 20,000 | | | Sanford Town, NY GO1 | | | 5.250 | | | | 04/15/2015 | | | | 20,237 | |
| | 30,000 | | | Sanford Town, NY GO1 | | | 5.250 | | | | 04/15/2024 | | | | 30,813 | |
| | 30,000 | | | Sanford Town, NY GO1 | | | 5.250 | | | | 04/15/2023 | | | | 30,841 | |
| | 20,000 | | | Sanford Town, NY GO1 | | | 5.250 | | | | 04/15/2016 | | | | 20,953 | |
| | 25,000 | | | Sanford Town, NY GO1 | | | 5.250 | | | | 04/15/2017 | | | | 26,092 | |
| | 25,000 | | | Sanford Town, NY GO1 | | | 5.250 | | | | 04/15/2018 | | | | 25,975 | |
| | 25,000 | | | Sanford Town, NY GO1 | | | 5.250 | | | | 04/15/2020 | | | | 25,837 | |
| | 25,000 | | | Sanford Town, NY GO1 | | | 5.250 | | | | 04/15/2019 | | | | 25,888 | |
| | 35,000 | | | Sanford Town, NY GO1 | | | 5.250 | | | | 04/15/2025 | | | | 35,903 | |
| | 50,000 | | | Sanford Town, NY GO1 | | | 5.250 | | | | 04/15/2032 | | | | 51,113 | |
| | 45,000 | | | Sanford Town, NY GO1 | | | 5.250 | | | | 04/15/2031 | | | | 46,007 | |
| | 50,000 | | | Sanford Town, NY GO1 | | | 5.250 | | | | 04/15/2033 | | | | 51,094 | |
| | 60,000 | | | Sanford Town, NY GO1 | | | 5.250 | | | | 04/15/2035 | | | | 61,297 | |
| | 55,000 | | | Sanford Town, NY GO1 | | | 5.250 | | | | 04/15/2034 | | | | 56,210 | |
| | 40,000 | | | Sanford Town, NY GO1 | | | 5.250 | | | | 04/15/2027 | | | | 40,986 | |
| | 35,000 | | | Sanford Town, NY GO1 | | | 5.250 | | | | 04/15/2026 | | | | 35,876 | |
| | 40,000 | | | Sanford Town, NY GO1 | | | 5.250 | | | | 04/15/2028 | | | | 40,956 | |
29 OPPENHEIMER ROCHESTER FUND MUNICIPALS
STATEMENT OF INVESTMENTS Continued
| | | | | | | | | | | | | | | | |
Principal
Amount | | | | | Coupon | | | Maturity | | | Value | |
| New York (Continued) | | | | | |
| | $45,000 | | | Sanford Town, NY GO1 | | | 5.250 | % | | | 04/15/2030 | | | $ | 46,030 | |
| | 40,000 | | | Sanford Town, NY GO1 | | | 5.250 | | | | 04/15/2029 | | | | 40,941 | |
| | 60,000 | | | Sanford Town, NY GO1 | | | 5.250 | | | | 04/15/2036 | | | | 61,305 | |
| | 22,160,000 | | | SONYMA, Series 1374 | | | 4.700 | | | | 10/01/2031 | | | | 22,320,583 | |
| | 10,065,000 | | | SONYMA, Series 1404 | | | 4.750 | | | | 10/01/2037 | | | | 10,132,636 | |
| | 7,135,000 | | | SONYMA, Series 1434 | | | 4.900 | | | | 10/01/2037 | | | | 7,393,404 | |
| | 4,775,000 | | | St. Lawrence County, NY IDA (Clarkson University)1 | | | 5.375 | | | | 09/01/2041 | | | | 5,396,896 | |
| | 520,000 | | | St. Lawrence County, NY IDA (Clarkson University)1 | | | 6.000 | | | | 09/01/2034 | | | | 621,930 | |
| | 1,510,000 | | | St. Lawrence County, NY IDA (Clarkson University) | | | 5.000 | | | | 09/01/2041 | | | | 1,674,107 | |
| | 4,360,000 | | | St. Lawrence County, NY IDA (Curran Renewable Energy)1 | | | 7.250 | | | | 12/01/2029 | | | | 3,790,061 | |
| | 1,355,000 | | | St. Lawrence County, NY IDA (St. Lawrence University) | | | 5.000 | | | | 07/01/2031 | | | | 1,532,586 | |
| | 1,280,000 | | | St. Lawrence County, NY IDA (St. Lawrence University) | | | 5.000 | | | | 07/01/2030 | | | | 1,453,568 | |
| | 25,075,000 | | | Suffolk County, NY Economic Devel. Corp. (Catholic Health Services)1 | | | 5.000 | | | | 07/01/2028 | | | | 27,735,959 | |
| | 1,005,000 | | | Suffolk County, NY Economic Devel. Corp. (Family Residences Essential Enterprises)1 | | | 6.750 | | | | 06/01/2027 | | | | 1,029,874 | |
| | 810,000 | | | Suffolk County, NY Economic Devel. Corp. (Family Residences Essential Enterprises)1 | | | 6.000 | | | | 12/01/2019 | | | | 818,602 | |
| | 4,215,000 | | | Suffolk County, NY Economic Devel. Corp., Series A1 | | | 7.375 | | | | 12/01/2040 | | | | 4,460,144 | |
| | 450,000 | | | Suffolk County, NY IDA (ACLD)1 | | | 6.000 | | | | 12/01/2019 | | | | 454,779 | |
| | 1,425,000 | | | Suffolk County, NY IDA (ALIA-ACLD)1 | | | 5.950 | | | | 10/01/2021 | | | | 1,453,386 | |
| | 165,000 | | | Suffolk County, NY IDA (ALIA-ADD)1 | | | 7.125 | | | | 06/01/2017 | | | | 165,185 | |
| | 845,000 | | | Suffolk County, NY IDA (ALIA-Adelante)1 | | | 6.500 | | | | 11/01/2037 | | | | 859,390 | |
| | 1,955,000 | | | Suffolk County, NY IDA (ALIA-DDI)1 | | | 5.950 | | | | 10/01/2021 | | | | 1,993,944 | |
| | 555,000 | | | Suffolk County, NY IDA (ALIA-FREE)1 | | | 5.950 | | | | 10/01/2021 | | | | 566,056 | |
| | 555,000 | | | Suffolk County, NY IDA (ALIA-IGHL)1 | | | 5.950 | | | | 11/01/2022 | | | | 567,870 | |
| | 340,000 | | | Suffolk County, NY IDA (ALIA-IGHL)1 | | | 6.000 | | | | 10/01/2031 | | | | 340,112 | |
| | 395,000 | | | Suffolk County, NY IDA (ALIA-IGHL)1 | | | 5.950 | | | | 10/01/2021 | | | | 402,868 | |
| | 35,000 | | | Suffolk County, NY IDA (ALIA-NYS ARC) | | | 7.500 | | | | 09/01/2015 | | | | 35,196 | |
| | 505,000 | | | Suffolk County, NY IDA (ALIA-NYS ARC)1 | | | 5.950 | | | | 11/01/2022 | | | | 516,711 | |
| | 80,000 | | | Suffolk County, NY IDA (ALIA-Pederson-Krag Center)1 | | | 8.375 | | | | 06/01/2016 | | | | 80,944 | |
| | 45,000 | | | Suffolk County, NY IDA (ALIA-SMCFS) | | | 7.500 | | | | 09/01/2015 | | | | 45,252 | |
| | 1,325,000 | | | Suffolk County, NY IDA (ALIA-UCPAGS)1 | | | 5.950 | | | | 10/01/2021 | | | | 1,351,394 | |
| | 200,000 | | | Suffolk County, NY IDA (ALIA-UCPAGS)1 | | | 7.000 | | | | 06/01/2016 | | | | 201,198 | |
| | 3,530,000 | | | Suffolk County, NY IDA (ALIA-UVBH)1 | | | 6.500 | | | | 11/01/2037 | | | | 3,590,116 | |
| | 490,000 | | | Suffolk County, NY IDA (ALIA-WORCA)1 | | | 5.950 | | | | 11/01/2022 | | | | 501,363 | |
| | 285,000 | | | Suffolk County, NY IDA (Catholic Charities)1 | | | 6.000 | | | | 10/01/2020 | | | | 289,372 | |
| | 245,000 | | | Suffolk County, NY IDA (DDI)1 | | | 6.000 | | | | 10/01/2020 | | | | 248,758 | |
| | 230,000 | | | Suffolk County, NY IDA (DDI)1 | | | 6.000 | | | | 10/01/2020 | | | | 233,528 | |
| | 75,000 | | | Suffolk County, NY IDA (DDI)1 | | | 6.000 | | | | 12/01/2019 | | | | 75,797 | |
| | 130,000 | | | Suffolk County, NY IDA (Dowling College)1 | | | 5.000 | | | | 06/01/2036 | | | | 118,073 | |
| | 1,980,000 | | | Suffolk County, NY IDA (Federation of Organizations)1 | | | 8.125 | | | | 04/01/2030 | | | | 1,983,307 | |
30 OPPENHEIMER ROCHESTER FUND MUNICIPALS
| | | | | | | | | | | | | | | | |
Principal
Amount | | | | | Coupon | | | Maturity | | | Value | |
| New York (Continued) | | | | | |
| | $1,545,000 | | | Suffolk County, NY IDA (Huntington First Aid Squad) | | | 6.650 | % | | | 11/01/2017 | | | $ | 1,549,867 | |
| | 130,000 | | | Suffolk County, NY IDA (Independent Group Home Living)1 | | | 6.000 | | | | 12/01/2019 | | | | 131,381 | |
| | 600,000 | | | Suffolk County, NY IDA (Independent Group Home Living)1 | | | 6.000 | | | | 10/01/2020 | | | | 609,204 | |
| | 7,555,000 | | | Suffolk County, NY IDA (Medford Hamlet Assisted Living)1 | | | 6.375 | | | | 01/01/2039 | | | | 7,656,464 | |
| | 1,865,000 | | | Suffolk County, NY IDA (Nassau-Suffolk Services for Autism)1 | | | 6.750 | | | | 11/01/2036 | | | | 1,919,700 | |
| | 24,580,000 | | | Suffolk County, NY IDA (Nissequogue Cogeneration Partners)1 | | | 5.500 | | | | 01/01/2023 | | | | 24,583,195 | |
| | 2,295,000 | | | Suffolk County, NY IDA (Pederson-Krager Center)1 | | | 8.125 | | | | 04/01/2030 | | | | 2,295,367 | |
| | 4,800,000 | | | Suffolk County, NY IDA (Pederson-Krager Center)1 | | | 7.200 | | | | 02/01/2035 | | | | 4,408,656 | |
| | 660,000 | | | Suffolk County, NY IDA (Special Needs Facilities Pooled Program)1 | | | 5.250 | | | | 07/01/2022 | | | | 654,364 | |
| | 250,000 | | | Suffolk County, NY IDA (Suffolk Hotels)1 | | | 6.000 | | | | 10/01/2020 | | | | 254,370 | |
| | 910,000 | | | Suffolk County, NY IDA (United Cerebral Palsy Assoc.)1 | | | 6.000 | | | | 12/01/2019 | | | | 919,664 | |
| | 3,130,000 | | | Suffolk County, NY IDA (United Cerebral Palsy Assoc.) | | | 7.875 | | | | 09/01/2041 | | | | 3,226,811 | |
| | 530,000 | | | Suffolk County, NY IDA (WORCA)1 | | | 6.000 | | | | 10/01/2020 | | | | 538,130 | |
| | 29,915,000 | | | Suffolk, NY Tobacco Asset Securitization Corp.1 | | | 6.000 | | | | 06/01/2048 | | | | 26,499,904 | |
| | 287,265,000 | | | Suffolk, NY Tobacco Asset Securitization Corp. | | | 8.000 | 3 | | | 06/01/2048 | | | | 8,253,123 | |
| | 119,295,000 | | | Suffolk, NY Tobacco Asset Securitization Corp.1 | | | 6.625 | | | | 06/01/2044 | | | | 118,036,438 | |
| | 10,080,000 | | | Suffolk, NY Tobacco Asset Securitization Corp.1 | | | 5.375 | | | | 06/01/2028 | | | | 9,802,699 | |
| | 203,935,000 | | | Syracuse, NY IDA (Carousel Center)1 | | | 5.000 | | | | 01/01/2036 | | | | 206,857,389 | |
| | 1,000,000 | | | Syracuse, NY IDA (Crouse Irving Health Hospital)1 | | | 5.375 | | | | 01/01/2023 | | | | 1,000,920 | |
| | 3,830,000 | | | Syracuse, NY IDA (James Square) | | | 2.552 | 3 | | | 08/01/2025 | | | | 1,916,532 | |
| | 2,425,000 | | | Tompkins County, NY Devel. Corp. (Tompkins Cortland Community College Foundation) | | | 5.000 | | | | 07/01/2032 | | | | 2,591,986 | |
| | 1,700,000 | | | Tompkins County, NY Devel. Corp. (Tompkins Cortland Community College Foundation) | | | 5.000 | | | | 07/01/2038 | | | | 1,797,002 | |
| | 22,465,000 | | | Troy, NY Capital Resource Corp. (Rensselaer Polytechnic Institute)1 | | | 5.000 | | | | 09/01/2030 | | | | 25,008,712 | |
| | 185,000 | | | Ulster County, NY Res Rec1 | | | 5.000 | | | | 03/01/2020 | | | | 191,830 | |
| | 3,180,000 | | | Ulster County, NY Tobacco Asset Securitization Corp.1 | | | 6.000 | | | | 06/01/2040 | | | | 3,155,228 | |
| | 3,005,000 | | | Ulster County, NY Tobacco Asset Securitization Corp.1 | | | 6.450 | | | | 06/01/2040 | | | | 3,029,551 | |
| | 1,730,000 | | | Ulster County, NY Tobacco Asset Securitization Corp.1 | | | 6.250 | | | | 06/01/2025 | | | | 1,729,896 | |
| | 1,280,000 | | | Warren & Washington Counties, NY IDA (GFH/GFHF Obligated Group)1 | | | 5.000 | | | | 12/01/2035 | | | | 1,282,214 | |
| | 6,245,000 | | | Westchester County, NY Healthcare Corp., Series A1 | | | 5.000 | | | | 11/01/2030 | | | | 6,917,649 | |
| | 687,344 | | | Westchester County, NY Healthcare Corp., Series A1 | | | 5.000 | | | | 11/01/2044 | | | | 772,018 | |
31 OPPENHEIMER ROCHESTER FUND MUNICIPALS
STATEMENT OF INVESTMENTS Continued
| | | | | | | | | | | | | | | | |
Principal Amount | | | | | Coupon | | | Maturity | | | Value | |
| New York (Continued) | | | | | |
| | $1,700,000 | | | Westchester County, NY Healthcare Corp., Series B1 | | | 5.125 | % | | | 11/01/2041 | | | $ | 1,867,603 | |
| | 1,190,000 | | | Westchester County, NY IDA (Clearview School)1 | | | 7.250 | | | | 01/01/2035 | | | | 1,208,493 | |
| | 1,145,000 | | | Westchester County, NY IDA (Guiding Eyes for the Blind)1 | | | 5.375 | | | | 08/01/2024 | | | | 1,170,018 | |
| | 520,000 | | | Westchester County, NY IDA (JDAM)1 | | | 6.750 | | | | 04/01/2016 | | | | 523,349 | |
| | 3,400,000 | | | Westchester County, NY IDA (Lawrence Hospital)1 | | | 5.000 | | | | 01/01/2028 | | | | 3,408,840 | |
| | 300,000 | | | Westchester County, NY IDA (Lawrence Hospital)1 | | | 5.125 | | | | 01/01/2018 | | | | 301,140 | |
| | 1,425,000 | | | Westchester County, NY IDA (Schnurmacher Center)1 | | | 6.500 | | | | 11/01/2033 | | | | 1,477,640 | |
| | 4,500,000 | | | Westchester County, NY Tobacco Asset Securitization Corp.1 | | | 5.000 | | | | 06/01/2026 | | | | 4,425,300 | |
| | 59,400,000 | | | Westchester County, NY Tobacco Asset Securitization Corp.1 | | | 5.125 | | | | 06/01/2038 | | | | 55,697,004 | |
| | 52,815,000 | | | Westchester County, NY Tobacco Asset Securitization Corp.1 | | | 5.125 | | | | 06/01/2045 | | | | 43,626,246 | |
| | 2,390,000 | | | Yonkers, NY IDA (Hudson Scenic Studio)1 | | | 6.625 | | | | 11/01/2019 | | | | 2,378,671 | |
| | 1,370,000 | | | Yonkers, NY IDA (Philipsburgh Hall Associates)1 | | | 7.500 | | | | 11/01/2030 | | | | 1,235,877 | |
| | 1,050,000 | | | Yonkers, NY IDA (Sarah Lawrence College)1 | | | 6.000 | | | | 06/01/2041 | | | | 1,163,096 | |
| | 600,000 | | | Yonkers, NY IDA (St. Joseph’s Hospital) | | | 6.150 | | | | 03/01/2015 | | | | 600,474 | |
| | 1,000,000 | | | Yonkers, NY IDA (St. Joseph’s Hospital), Series 98-A | | | 6.150 | | | | 03/01/2015 | | | | 1,000,790 | |
| | 200,000 | | | Yonkers, NY IDA (St. Joseph’s Hospital), Series 98-B | | | 6.150 | | | | 03/01/2015 | | | | 200,158 | |
| | 565,000 | | | Yonkers, NY Parking Authority1 | | | 6.000 | | | | 06/15/2018 | | | | 565,740 | |
| | 1,215,000 | | | Yonkers, NY Parking Authority1 | | | 6.000 | | | | 06/15/2024 | | | | 1,139,512 | |
| | | | | | | | | | | | | | | | 4,975,853,528 | |
| U.S. Possessions—28.0% | | | | | | | | | | | | |
| | 825,000 | | | Guam Education Financing Foundation COP1 | | | 5.000 | | | | 10/01/2023 | | | | 853,314 | |
| | 3,600,000 | | | Guam Government Business Privilege1 | | | 5.000 | | | | 01/01/2031 | | | | 4,035,888 | |
| | 6,000,000 | | | Guam Government Business Privilege | | | 5.000 | | | | 01/01/2032 | | | | 6,706,440 | |
| | 345,000 | | | Guam Hsg. Corp. (Single Family Mtg.)1 | | | 5.750 | | | | 09/01/2031 | | | | 378,527 | |
| | 1,560,000 | | | Guam Power Authority, Series A | | | 5.000 | | | | 10/01/2024 | | | | 1,854,013 | |
| | 1,230,000 | | | Guam Power Authority, Series A | | | 5.000 | | | | 10/01/2023 | | | | 1,458,952 | |
| | 2,790,000 | | | Guam Power Authority, Series A | | | 5.000 | | | | 10/01/2030 | | | | 3,232,745 | |
| | 1,700,000 | | | Northern Mariana Islands Commonwealth, Series A1 | | | 5.000 | | | | 10/01/2022 | | | | 1,647,113 | |
| | 29,920,000 | | | Northern Mariana Islands Commonwealth, Series A1 | | | 5.000 | | | | 06/01/2030 | | | | 26,359,520 | |
| | 7,465,000 | | | Northern Mariana Islands Ports Authority, Series A1 | | | 6.250 | | | | 03/15/2028 | | | | 6,647,359 | |
| | 14,500,000 | | | Northern Mariana Islands Ports Authority, Series A1 | | | 6.600 | | | | 03/15/2028 | | | | 14,510,730 | |
| | 52,635,000 | | | Puerto Rico Aqueduct & Sewer Authority | | | 6.000 | | | | 07/01/2044 | | | | 37,481,910 | |
| | 49,000,000 | | | Puerto Rico Aqueduct & Sewer Authority1 | | | 5.125 | | | | 07/01/2047 | | | | 49,015,680 | |
| | 55,825,000 | | | Puerto Rico Aqueduct & Sewer Authority | | | 6.125 | | | | 07/01/2024 | | | | 43,552,432 | |
| | 1,580,000 | | | Puerto Rico Aqueduct & Sewer Authority | | | 5.250 | | | | 07/01/2029 | | | | 1,128,009 | |
| | 1,950,000 | | | Puerto Rico Aqueduct & Sewer Authority | | | 5.000 | | | | 07/01/2033 | | | | 1,340,742 | |
32 OPPENHEIMER ROCHESTER FUND MUNICIPALS
| | | | | | | | | | | | | | | | |
Principal
Amount | | | | | Coupon | | | Maturity | | | Value | |
| U.S. Possessions (Continued) | | | | | |
| | $15,350,000 | | | Puerto Rico Aqueduct & Sewer Authority | | | 6.000 | % | | | 07/01/2047 | | | $ | 10,916,306 | |
| | 80,800,000 | | | Puerto Rico Aqueduct & Sewer Authority | | | 6.000 | | | | 07/01/2038 | | | | 58,137,216 | |
| | 10,000,000 | | | Puerto Rico Aqueduct & Sewer Authority | | | 5.250 | | | | 07/01/2024 | | | | 7,530,800 | |
| | 56,685,000 | | | Puerto Rico Children’s Trust Fund (TASC)1 | | | 5.625 | | | | 05/15/2043 | | | | 52,888,806 | |
| | 3,519,880,000 | | | Puerto Rico Children’s Trust Fund (TASC) | | | 7.625 | 3 | | | 05/15/2057 | | | | 54,558,140 | |
| | 3,179,200,000 | | | Puerto Rico Children’s Trust Fund (TASC) | | | 8.375 | 3 | | | 05/15/2057 | | | | 33,095,472 | |
| | 168,500,000 | | | Puerto Rico Children’s Trust Fund (TASC) | | | 6.627 | 3 | | | 05/15/2050 | | | | 12,244,895 | |
| | 745,000,000 | | | Puerto Rico Children’s Trust Fund (TASC) | | | 6.324 | 3 | | | 05/15/2055 | | | | 22,409,600 | |
| | 2,700,000 | | | Puerto Rico Commonwealth GO1 | | | 6.000 | | | | 07/01/2035 | | | | 2,001,942 | |
| | 30,000,000 | | | Puerto Rico Commonwealth GO1 | | | 5.750 | | | | 07/01/2036 | | | | 22,034,100 | |
| | 5,675,000 | | | Puerto Rico Commonwealth GO1 | | | 6.500 | | | | 07/01/2040 | | | | 4,274,580 | |
| | 1,000,000 | | | Puerto Rico Commonwealth GO1 | | | 6.000 | | | | 07/01/2028 | | �� | | 757,670 | |
| | 3,670,000 | | | Puerto Rico Commonwealth GO1 | | | 6.000 | | | | 07/01/2040 | | | | 2,691,835 | |
| | 1,000,000 | | | Puerto Rico Commonwealth GO1 | | | 5.500 | | | | 07/01/2026 | | | | 751,470 | |
| | 7,850,000 | | | Puerto Rico Commonwealth GO1 | | | 5.500 | | | | 07/01/2029 | | | | 5,934,286 | |
| | 5,000,000 | | | Puerto Rico Commonwealth GO | | | 5.750 | | | | 07/01/2028 | | | | 3,758,300 | |
| | 3,205,000 | | | Puerto Rico Commonwealth GO1 | | | 5.625 | | | | 07/01/2033 | | | | 2,361,668 | |
| | 13,300,000 | | | Puerto Rico Commonwealth GO1 | | | 5.125 | | | | 07/01/2031 | | | | 9,566,557 | |
| | 2,000,000 | | | Puerto Rico Commonwealth GO1 | | | 5.000 | | | | 07/01/2033 | | | | 1,408,820 | |
| | 2,920,000 | | | Puerto Rico Commonwealth GO1 | | | 5.250 | | | | 07/01/2030 | | | | 2,136,739 | |
| | 2,500,000 | | | Puerto Rico Commonwealth GO1 | | | 5.250 | | | | 07/01/2032 | | | | 1,817,125 | |
| | 4,965,000 | | | Puerto Rico Commonwealth GO1 | | | 5.250 | | | | 07/01/2037 | | | | 3,535,279 | |
| | 3,315,000 | | | Puerto Rico Commonwealth GO1 | | | 5.125 | | | | 07/01/2031 | | | | 2,396,049 | |
| | 14,500,000 | | | Puerto Rico Commonwealth GO1 | | | 5.250 | | | | 07/01/2031 | | | | 10,574,705 | |
| | 10,230,000 | | | Puerto Rico Commonwealth GO1 | | | 5.250 | | | | 07/01/2034 | | | | 7,359,667 | |
| | 770,000 | | | Puerto Rico Commonwealth GO1 | | | 5.875 | | | | 07/01/2036 | | | | 567,482 | |
| | 5,050,000 | | | Puerto Rico Commonwealth GO1 | | | 6.500 | | | | 07/01/2037 | | | | 3,822,446 | |
| | 390,000 | | | Puerto Rico Commonwealth GO1 | | | 6.000 | | | | 07/01/2039 | | | | 287,044 | |
| | 5,000,000 | | | Puerto Rico Commonwealth GO1 | | | 5.375 | | | | 07/01/2033 | | | | 3,646,950 | |
| | 2,200,000 | | | Puerto Rico Commonwealth GO1 | | | 5.250 | | | | 07/01/2026 | | | | 1,631,278 | |
| | 76,300,000 | | | Puerto Rico Commonwealth GO1 | | | 5.500 | | | | 07/01/2032 | | | | 56,221,655 | |
| | 1,270,000 | | | Puerto Rico Commonwealth GO1 | | | 6.000 | | | | 07/01/2028 | | | | 1,295,057 | |
| | 3,620,000 | | | Puerto Rico Electric Power Authority, Series A11 | | | 7.000 | | | | 07/01/2033 | | | | 1,813,729 | |
| | 2,000,000 | | | Puerto Rico Electric Power Authority, Series A11 | | | 5.000 | | | | 07/01/2029 | | | | 1,002,640 | |
| | 23,480,000 | | | Puerto Rico Electric Power Authority, Series A11 | | | 7.000 | | | | 07/01/2043 | | | | 11,704,780 | |
| | 18,990,000 | | | Puerto Rico Electric Power Authority, Series A11 | | | 6.750 | | | | 07/01/2036 | | | | 9,491,012 | |
| | 1,095,000 | | | Puerto Rico Electric Power Authority, Series A11 | | | 5.000 | | | | 07/01/2042 | | | | 546,219 | |
| | 10,105,000 | | | Puerto Rico Electric Power Authority, Series AAA11 | | | 5.250 | | | | 07/01/2029 | | | | 5,065,535 | |
| | 9,625,000 | | | Puerto Rico Electric Power Authority, Series AAA11 | | | 5.250 | | | | 07/01/2031 | | | | 4,825,012 | |
| | 9,000,000 | | | Puerto Rico Electric Power Authority, Series AAA11 | | | 5.250 | | | | 07/01/2022 | | | | 4,535,370 | |
| | 1,430,000 | | | Puerto Rico Electric Power Authority, Series AAA11 | | | 5.250 | | | | 07/01/2027 | | | | 716,873 | |
| | 20,170,000 | | | Puerto Rico Electric Power Authority, Series CCC11 | | | 5.250 | | | | 07/01/2027 | | | | 10,111,423 | |
| | 13,295,000 | | | Puerto Rico Electric Power Authority, Series CCC11 | | | 5.250 | | | | 07/01/2028 | | | | 6,664,784 | |
| | 510,000 | | | Puerto Rico Electric Power Authority, Series RR | | | 5.000 | | | | 07/01/2024 | | | | 507,144 | |
33 OPPENHEIMER ROCHESTER FUND MUNICIPALS
STATEMENT OF INVESTMENTS Continued
| | | | | | | | | | | | | | | | |
Principal Amount | | | | | Coupon | | | Maturity | | | Value | |
| U.S. Possessions (Continued) | | | | | |
| | $6,885,000 | | | Puerto Rico Electric Power Authority, Series TT11 | | | 5.000 | % | | | 07/01/2037 | | | $ | 3,443,051 | |
| | 6,320,000 | | | Puerto Rico Electric Power Authority, Series TT11 | | | 5.000 | | | | 07/01/2032 | | | | 3,168,279 | |
| | 33,350,000 | | | Puerto Rico Electric Power Authority, Series WW11 | | | 5.500 | | | | 07/01/2038 | | | | 16,675,000 | |
| | 3,700,000 | | | Puerto Rico Electric Power Authority, Series WW11 | | | 5.000 | | | | 07/01/2028 | | | | 1,854,921 | |
| | 7,000,000 | | | Puerto Rico Electric Power Authority, Series XX11 | | | 5.250 | | | | 07/01/2040 | | | | 3,500,350 | |
| | 7,590,000 | | | Puerto Rico Electric Power Authority, Series ZZ11 | | | 5.250 | | | | 07/01/2025 | | | | 3,805,019 | |
| | 10,000,000 | | | Puerto Rico Electric Power Authority, Series ZZ11 | | | 5.250 | | | | 07/01/2024 | | | | 5,013,300 | |
| | 270,000 | | | Puerto Rico Highway & Transportation Authority1 | | | 5.750 | | | | 07/01/2020 | | | | 173,891 | |
| | 4,000,000 | | | Puerto Rico Highway & Transportation Authority | | | 5.500 | | | | 07/01/2029 | | | | 3,950,880 | |
| | 4,945,000 | | | Puerto Rico Highway & Transportation Authority1 | | | 5.300 | | | | 07/01/2035 | | | | 3,600,504 | |
| | 4,845,000 | | | Puerto Rico Highway & Transportation Authority1 | | | 5.250 | | | | 07/01/2030 | | | | 4,639,378 | |
| | 9,515,000 | | | Puerto Rico Highway & Transportation Authority1 | | | 5.000 | | | | 07/01/2028 | | | | 5,376,070 | |
| | 8,980,000 | | | Puerto Rico Highway & Transportation Authority, Series G1 | | | 5.000 | | | | 07/01/2033 | | | | 4,958,307 | |
| | 1,840,000 | | | Puerto Rico Highway & Transportation Authority, Series G1 | | | 5.000 | | | | 07/01/2042 | | | | 1,003,665 | |
| | 1,120,000 | | | Puerto Rico Highway & Transportation Authority, Series H1 | | | 5.450 | | | | 07/01/2035 | | | | 610,870 | |
| | 1,145,000 | | | Puerto Rico Highway & Transportation Authority, Series K1 | | | 5.000 | | | | 07/01/2030 | | | | 634,799 | |
| | 6,500,000 | | | Puerto Rico Highway & Transportation Authority, Series K1 | | | 5.000 | | | | 07/01/2027 | | | | 3,687,775 | |
| | 915,000 | | | Puerto Rico Highway & Transportation Authority, Series L1 | | | 5.250 | | | | 07/01/2030 | | | | 670,384 | |
| | 2,600,000 | | | Puerto Rico Highway & Transportation Authority, Series L1 | | | 5.250 | | | | 07/01/2023 | | | | 2,731,794 | |
| | 10,000 | | | Puerto Rico Highway & Transportation Authority, Series M1 | | | 5.000 | | | | 07/01/2046 | | | | 11,084 | |
| | 78,610,000 | | | Puerto Rico Highway & Transportation Authority, Series M1 | | | 5.000 | | | | 07/01/2046 | | | | 42,874,680 | |
| | 57,615,000 | | | Puerto Rico Highway & Transportation Authority, Series N1 | | | 5.250 | | | | 07/01/2039 | | | | 39,895,507 | |
| | 3,190,000 | | | Puerto Rico Highway & Transportation Authority, Series N1 | | | 5.250 | | | | 07/01/2032 | | | | 3,280,022 | |
| | 5,000,000 | | | Puerto Rico Infrastructure1 | | | 6.000 | | | | 12/15/2026 | | | | 3,621,150 | |
| | 142,985,000 | | | Puerto Rico Infrastructure1 | | | 5.000 | | | | 07/01/2041 | | | | 88,945,249 | |
| | 675,000 | | | Puerto Rico Infrastructure1 | | | 5.000 | | | | 07/01/2037 | | | | 427,599 | |
| | 65,725,000 | | | Puerto Rico Infrastructure | | | 5.730 | 3 | | | 07/01/2045 | | | | 5,852,811 | |
| | 1,295,000 | | | Puerto Rico Infrastructure1 | | | 5.500 | | | | 07/01/2026 | | | | 1,278,191 | |
| | 17,490,000 | | | Puerto Rico Infrastructure1 | | | 5.000 | | | | 07/01/2037 | | | | 11,079,565 | |
| | 25,255,000 | | | Puerto Rico Infrastructure1 | | | 5.000 | | | | 07/01/2031 | | | | 15,992,224 | |
| | 15,000,000 | | | Puerto Rico Infrastructure1 | | | 5.500 | | | | 07/01/2027 | | | | 14,701,650 | |
| | 41,740,000 | | | Puerto Rico Infrastructure1 | | | 5.000 | | | | 07/01/2046 | | | | 25,877,965 | |
| | 16,955,000 | | | Puerto Rico Infrastructure | | | 5.650 | 3 | | | 07/01/2029 | | | | 5,897,627 | |
| | 25,000,000 | | | Puerto Rico Infrastructure | | | 5.800 | 3 | | | 07/01/2032 | | | | 5,534,250 | |
34 OPPENHEIMER ROCHESTER FUND MUNICIPALS
| | | | | | | | | | | | | | | | |
Principal
Amount | | | | | Coupon | | | Maturity | | | Value | |
| U.S. Possessions (Continued) | | | | | |
| | $1,680,000 | | | Puerto Rico Infrastructure (Mepsi Campus)1 | | | 6.500 | % | | | 10/01/2037 | | | $ | 1,009,226 | |
| | 6,315,000 | | | Puerto Rico ITEMECF (Ana G. Mendez University)1 | | | 5.500 | | | | 12/01/2031 | | | | 5,485,398 | |
| | 1,105,000 | | | Puerto Rico ITEMECF (Ana G. Mendez University)1 | | | 5.375 | | | | 12/01/2021 | | | | 1,066,259 | |
| | 6,285,000 | | | Puerto Rico ITEMECF (Ana G. Mendez University)1 | | | 5.000 | | | | 03/01/2036 | | | | 4,901,483 | |
| | 1,350,000 | | | Puerto Rico ITEMECF (Ana G. Mendez University) | | | 5.000 | | | | 04/01/2027 | | | | 1,168,263 | |
| | 1,200,000 | | | Puerto Rico ITEMECF (Ana G. Mendez University) | | | 5.375 | | | | 04/01/2042 | | | | 956,700 | |
| | 875,000 | | | Puerto Rico ITEMECF (Ana G. Mendez University) | | | 5.125 | | | | 04/01/2032 | | | | 721,963 | |
| | 3,280,000 | | | Puerto Rico ITEMECF (Cogeneration Facilities)1 | | | 6.625 | | | | 06/01/2026 | | | | 3,153,294 | |
| | 5,000,000 | | | Puerto Rico ITEMECF (Hospital Auxilio Mutuo)1 | | | 6.250 | | | | 07/01/2026 | | | | 5,142,750 | |
| | 650,000 | | | Puerto Rico ITEMECF (International American University) | | | 5.000 | | | | 10/01/2031 | | | | 654,810 | |
| | 5,250,000 | | | Puerto Rico ITEMECF (Ryder Memorial Hospital)1 | | | 6.700 | | | | 05/01/2024 | | | | 5,132,190 | |
| | 7,000,000 | | | Puerto Rico ITEMECF (San Lucas & Cristo Redentor Hospitals) | | | 5.750 | | | | 06/01/2029 | | | | 2,765,000 | |
| | 200,000 | | | Puerto Rico ITEMECF (University of the Sacred Heart) | | | 5.000 | | | | 10/01/2042 | | | | 156,654 | |
| | 5,490,000 | | | Puerto Rico ITEMECF (University Plaza)1 | | | 5.000 | | | | 07/01/2033 | | | | 5,376,467 | |
| | 4,990,000 | | | Puerto Rico Municipal Finance Agency, Series A1 | | | 5.250 | | | | 08/01/2025 | | | | 3,101,684 | |
| | 9,450,000 | | | Puerto Rico Public Buildings Authority1 | | | 5.375 | | | | 07/01/2033 | | | | 6,513,129 | |
| | 31,050,000 | | | Puerto Rico Public Buildings Authority1 | | | 6.000 | | | | 07/01/2041 | | | | 21,521,065 | |
| | 2,110,000 | | | Puerto Rico Public Buildings Authority1 | | | 5.625 | | | | 07/01/2039 | | | | 1,436,340 | |
| | 90,355,000 | | | Puerto Rico Public Buildings Authority1 | | | 5.000 | | | | 07/01/2036 | | | | 60,817,047 | |
| | 1,500,000 | | | Puerto Rico Public Buildings Authority1 | | | 6.250 | | | | 07/01/2021 | | | | 1,141,215 | |
| | 7,500,000 | | | Puerto Rico Public Buildings Authority1 | | | 6.250 | | | | 07/01/2031 | | | | 5,496,900 | |
| | 850,000 | | | Puerto Rico Public Buildings Authority1 | | | 5.500 | | | | 07/01/2037 | | | | 579,691 | |
| | 18,585,000 | | | Puerto Rico Public Buildings Authority1 | | | 5.250 | | | | 07/01/2029 | | | | 12,922,708 | |
| | 7,500,000 | | | Puerto Rico Public Buildings Authority1 | | | 5.000 | | | | 07/01/2037 | | | | 5,029,725 | |
| | 121,570,000 | | | Puerto Rico Public Buildings Authority1 | | | 5.250 | | | | 07/01/2033 | | | | 83,488,197 | |
| | 7,500,000 | | | Puerto Rico Public Buildings Authority1 | | | 6.750 | | | | 07/01/2036 | | | | 5,536,875 | |
| | 8,000,000 | | | Puerto Rico Public Buildings Authority1 | | | 6.500 | | | | 07/01/2030 | | | | 5,892,640 | |
| | 11,810,000 | | | Puerto Rico Public Finance Corp., Series B1 | | | 5.500 | | | | 08/01/2031 | | | | 6,213,241 | |
| | 15,265,000 | | | Puerto Rico Sales Tax Financing Corp., Series A | | | 7.890 | 3 | | | 08/01/2034 | | | | 2,689,540 | |
| | 8,205,000 | | | Puerto Rico Sales Tax Financing Corp., Series A1 | | | 6.500 | | | | 08/01/2044 | | | | 6,492,699 | |
| | 75,000 | | | Puerto Rico Sales Tax Financing Corp., Series A1 | | | 5.500 | | | | 08/01/2037 | | | | 55,001 | |
| | 296,445,000 | | | Puerto Rico Sales Tax Financing Corp., Series A4 | | | 5.250 | | | | 08/01/2057 | | | | 222,063,806 | |
| | 1,490,000 | | | Puerto Rico Sales Tax Financing Corp., Series A1 | | | 5.000 | | | | 08/01/2043 | | | | 986,544 | |
| | 409,990,000 | | | Puerto Rico Sales Tax Financing Corp., Series A | | | 5.606 | 3 | | | 08/01/2054 | | | | 31,429,833 | |
| | 30,000,000 | | | Puerto Rico Sales Tax Financing Corp., Series A | | | 6.504 | 3 | | | 08/01/2042 | | | | 5,104,500 | |
| | 80,000,000 | | | Puerto Rico Sales Tax Financing Corp., Series A | | | 6.504 | 3 | | | 08/01/2043 | | | | 12,765,600 | |
| | 3,130,000 | | | Puerto Rico Sales Tax Financing Corp., Series A1 | | | 5.000 | | | | 08/01/2024 | | | | 2,565,254 | |
| | 10,000,000 | | | Puerto Rico Sales Tax Financing Corp., Series A-11 | | | 5.250 | | | | 08/01/2043 | | | | 6,947,900 | |
| | 250,000 | | | Puerto Rico Sales Tax Financing Corp., Series C1 | | | 6.000 | | | | 08/01/2042 | | | | 190,718 | |
| | 39,470,000 | | | Puerto Rico Sales Tax Financing Corp., Series C1 | | | 0.000 | 10 | | | 08/01/2032 | | | | 30,116,005 | |
| | 9,985,000 | | | Puerto Rico Sales Tax Financing Corp., Series C1 | | | 5.250 | | | | 08/01/2041 | | | | 6,999,185 | |
35 OPPENHEIMER ROCHESTER FUND MUNICIPALS
STATEMENT OF INVESTMENTS Continued
| | | | | | | | | | | | | | | | |
Principal Amount | | | | | Coupon | | | Maturity | | | Value | |
| U.S. Possessions (Continued) | | | | | |
| | $95,245,000 | | | Puerto Rico Sales Tax Financing Corp., Series C1 | | | 5.750 | % | | | 08/01/2057 | | | $ | 77,157,022 | |
| | 4,000,000 | | | Puerto Rico Sales Tax Financing Corp., Series C1 | | | 5.375 | | | | 08/01/2036 | | | | 2,914,120 | |
| | 1,450,000 | | | Puerto Rico Sales Tax Financing Corp., Series C1 | | | 6.000 | | | | 08/01/2039 | | | | 1,124,301 | |
| | 4,525,000 | | | University of Puerto Rico1 | | | 5.000 | | | | 06/01/2026 | | | | 2,786,857 | |
| | 7,280,000 | | | University of Puerto Rico, Series P1 | | | 5.000 | | | | 06/01/2030 | | | | 4,461,330 | |
| | 67,190,000 | | | University of Puerto Rico, Series Q1 | | | 5.000 | | | | 06/01/2036 | | | | 40,807,847 | |
| | 24,375,000 | | | University of Puerto Rico, Series Q1 | | | 5.000 | | | | 06/01/2030 | | | | 14,937,488 | |
| | 590,000 | | | V.I. Public Finance Authority (Matching Fund Loan Note)1 | | | 6.000 | | | | 10/01/2039 | | | | 654,133 | |
| | 1,425,000 | | | V.I. Public Finance Authority, Series A1 | | | 5.000 | | | | 10/01/2032 | | | | 1,601,315 | |
| | 11,100,000 | | | V.I. Tobacco Settlement Financing Corp. | | | 7.300 | 3 | | | 05/15/2035 | | | | 1,526,361 | |
| | | | | | | | | | | | | | | 1,728,327,918 | |
| Total Municipal Bonds and Notes (Cost $7,710,291,534) | | | | | | | | 6,704,181,446 | |
| | | | |
| | Shares | | | | | | | | | | | | | | | |
| Common Stocks—0.0% | | | | | | | | | | | | |
| | 1,401 | | | CMS Liquidating Trust12,13 (Cost $4,483,200) | | | | | | | | | | | 4,048,890 | |
| Total Investments, at Value (Cost $7,714,774,734)—108.8% | | | | | | | | 6,708,230,336 | |
| Net Other Assets (Liabilities)—(8.8) | | | | | | | | | | | (540,098,020 | ) |
| Net Assets—100.0% | | | | | | | | | | $ | 6,168,132,316 | |
| | | | | | | | | | | | | |
Footnotes to Statement of Investments
|
| 1. All or a portion of the security position has been segregated for collateral to cover borrowings. See Note 8 of the accompanying Notes. |
| 2. This security is not accruing income because the issuer has missed an interest payment on it and/or is not anticipated to make future interest and or principal payments. The rate shown is the original contractual interest rate. See Note 4 of the accompanying Notes. |
| 3. Zero coupon bond reflects effective yield on the date of purchase. |
| 4. Security represents the underlying municipal bond with respect to an inverse floating rate security held by the Fund. The bond was purchased by the Fund and subsequently transferred to a trust, which issued the related inverse floating rate security. See Note 4 of the accompanying Notes. |
| 5. Represents an inverse floating rate security that is subject to a shortfall/reimbursement agreement. See Note 4 of the accompanying Notes. |
| 6. Represents the current interest rate for the inverse floating rate security. See Note 4 of the accompanying Notes. |
| 7. Represents the current interest rate for a variable or increasing rate security. |
| 8. Denotes an inflation-indexed security: coupon or principal are indexed to a consumer price index |
9. All or a portion of the security position is when-issued or delayed delivery to be delivered and settled after December 31, 2014. See Note 4 of the accompanying Notes. 10. Denotes a step bond: a zero coupon bond that converts to a fixed or variable interest rate at a designated future date. |
| 11. Subject to a forbearance agreement. Rate shown is the original contractual interest rate. See Note 4 of the accompanying Notes. |
| 12. Non-income producing security. |
| 13. Received as a result of a corporate action. |
To simplify the listings of securities, abbreviations are used per the table below:
| | |
| ACDS | | Assoc. for Children with Down Syndrome |
| ACLD | | Adults and Children with Learning and Developmental Disabilities |
| ADD | | Aid to the Developmentally Disabled |
| ALIA | | Alliance of Long Island Agencies |
36 OPPENHEIMER ROCHESTER FUND MUNICIPALS
Abbreviations (Continued)
| | |
| ARC | | Assoc. of Retarded Citizens |
| CFGA | | Child and Family Guidance Assoc. |
| COP | | Certificates of Participation |
| CRV | | Crystal Run Village |
| CSMR | | Community Services for the Mentally Retarded |
| DA | | Dormitory Authority |
| DDI | | Developmental Disabilities Institute |
| DRIVERS | | Derivative Inverse Tax Exempt Receipts |
| EFC | | Environmental Facilities Corp. |
| ERDA | | Energy Research and Devel. Authority |
| FREE | | Family Residences and Essential Enterprises |
| GFH | | Glens Falls Hospital |
| GFHF | | Glens Falls Hospital Foundation |
| GO | | General Obligation |
| HDC | | Housing Devel. Corp. |
| HFA | | Housing Finance Agency |
| HH | | Harmony Heights, Inc. |
| HHS | | Harmony Heights School |
| IDA | | Industrial Devel. Agency |
| IGHL | | Independent Group Home for Living |
| ITEMECF | | Industrial, Tourist, Educational, Medical and Environmental Community Facilities |
| JDAM | | Julia Dyckman Andrus Memorial |
| JFK | | John Fitzgerald Kennedy |
| L.I. | | Long Island |
| LGSC | | Local Government Services Corp. |
| LIFERS | | Long Inverse Floating Exempt Receipts |
| LVH | | Little Village House |
| MTA | | Metropolitan Transportation Authority |
| NY/NJ | | New York/New Jersey |
| NYC | | New York City |
| NYS | | New York State |
| NYU | | New York University |
| PSCH | | Professional Service Centers for the Handicapped, Inc. |
| Res Rec | | Resource Recovery Facility |
| RIBS | | Residual Interest Bonds |
| ROLs | | Reset Option Longs |
| SCSB | | Schuyler Community Services Board |
| SFTU | | Services for the Underserved |
| SMCFS | | St. Mary’s Children and Family Services |
| SONYMA | | State of New York Mortgage Agency |
| SPEARS | | Short Puttable Exempt Adjustable Receipts |
| SUNY | | State University of New York |
| TASC | | Tobacco Settlement Asset-Backed Bonds |
| TFABs | | Tobacco Flexible Amortization Bonds |
| UCPAGS | | United Cerebral Palsy Assoc. of Greater Suffolk |
| UDC | | Urban Development Corporation |
| UNICEF | | United Nations Children’s Fund |
| UVBH | | United Veteran’s Beacon House |
| V.I. | | United States Virgin Islands |
| WORCA | | Working Organization for Retarded Children and Adults |
| YAI | | Young Adult Institute |
| YMCA | | Young Men’s Christian Assoc. |
See accompanying Notes to Financial Statements.
37 OPPENHEIMER ROCHESTER FUND MUNICIPALS
STATEMENT OF ASSETS AND LIABILITIES December 31, 2014
| | | | |
Assets | | | | |
Investments, at value (cost $7,714,774,734)—see accompanying statement of investments | | $ | 6,708,230,336 | |
| |
Cash | | | 537,567 | |
| |
Receivables and other assets: | | | | |
Interest | | | 115,967,080 | |
Investments sold | | | 2,625,000 | |
Other | | | 1,055,405 | |
| | | | |
Total assets | | | 6,828,415,388 | |
Liabilities | | | | |
Payables and other liabilities: | | | | |
Payable for short-term floating rate notes issued (See Note 4) | | | 581,425,000 | |
Payable for borrowings (See Note 8) | | | 44,400,000 | |
Shares of beneficial interest redeemed | | | 18,131,318 | |
Investments purchased (including $1,145,340 purchased on a when-issued or delayed delivery basis) | | | 7,835,839 | |
Dividends | | | 5,873,180 | |
Trustees’ compensation | | | 1,596,652 | |
Distribution and service plan fees | | | 839,472 | |
Shareholder communications | | | 17,453 | |
Interest expense on borrowings | | | 1,080 | |
Other | | | 163,078 | |
| | | | |
Total liabilities | | | 660,283,072 | |
Net Assets | | $ | 6,168,132,316 | |
| | | | |
| | | | |
Composition of Net Assets | | | | |
Paid-in capital | | $ | 8,090,103,564 | |
Accumulated net investment income | | | 105,674,479 | |
Accumulated net realized loss on investments | | | (1,021,101,329) | |
Net unrealized depreciation on investments | | | (1,006,544,398) | |
| | | | |
Net Assets | | $ | 6,168,132,316 | |
| | | | |
38 OPPENHEIMER ROCHESTER FUND MUNICIPALS
| | | | |
| |
Net Asset Value Per Share | | | | |
Class A Shares: | | | | |
Net asset value and redemption price per share (based on net assets of $4,996,222,623 and 325,470,968 shares of beneficial interest outstanding) | | $ | 15.35 | |
| Maximum offering price per share (net asset value plus sales charge of 4.75% of offering price) | | $ | 16.12 | |
| |
Class B Shares: | | | | |
| Net asset value, redemption price (excludes applicable contingent deferred sales charge) and offering price per share (based on net assets of $32,028,805 and 2,089,057 shares of beneficial interest outstanding) | | $ | 15.33 | |
| |
Class C Shares: | | | | |
| Net asset value, redemption price (excludes applicable contingent deferred sales charge) and offering price per share (based on net assets of $908,755,777 and 59,327,593 shares of beneficial interest outstanding) | | $ | 15.32 | |
| |
Class Y Shares: | | | | |
| Net asset value, redemption price and offering price per share (based on net assets of $231,125,111 and 15,054,856 shares of beneficial interest outstanding) | | $ | 15.35 | |
See accompanying Notes to Financial Statements.
39 OPPENHEIMER ROCHESTER FUND MUNICIPALS
STATEMENT OF OPERATIONS For the Year Ended December 31, 2014
| | | | | | |
| |
Investment Income | | | | | | |
Interest | | | | $ | 478,361,146 | |
|
| |
Expenses | | | | | | |
Management fees | | | | | 28,720,179 | |
| |
Distribution and service plan fees: | | | | | | |
Class A | | | | | 7,430,065 | |
Class B | | | | | 380,101 | |
Class C | | | | | 8,995,725 | |
| |
Transfer and shareholder servicing agent fees: | | | | | | |
Class A | | | | | 5,045,912 | |
Class B | | | | | 37,751 | |
Class C | | | | | 898,266 | |
Class Y | | | | | 203,705 | |
| |
Shareholder communications: | | | | | | |
Class A | | | | | 123,086 | |
Class B | | | | | 3,884 | |
Class C | | | | | 33,383 | |
Class Y | | | | | 5,739 | |
| |
Interest expense and fees on short-term floating rate notes issued (See Note 4) | | | | | 12,349,167 | |
| |
Borrowing fees | | | | | 2,971,539 | |
| |
Trustees’ compensation | | | | | 134,356 | |
| |
Custodian fees and expenses | | | | | 64,051 | |
| |
Interest expense on borrowings | | | | | 17,115 | |
| |
Other | | | | | 478,420 | |
| | | | | | |
Total expenses | | | | | 67,892,444 | |
|
| |
Net Investment Income | | | | | 410,468,702 | |
|
| |
Realized and Unrealized Gain (Loss) | | | | | | |
Net realized loss on investments | | | | | (32,379,779) | |
| |
Net change in unrealized appreciation/depreciation on investments | | | | | 446,899,381 | |
| | | | | | |
Net Increase in Net Assets Resulting from Operations | | | | $ | 824,988,304 | |
| | | | | | |
See accompanying Notes to Financial Statements.
40 OPPENHEIMER ROCHESTER FUND MUNICIPALS
STATEMENTS OF CHANGES IN NET ASSETS
| | | | | | | | |
| | | Year Ended December 31, 2014 | | | Year Ended
December 31, 2013 | |
| Operations | | | | | | | | |
Net investment income | | $ | 410,468,702 | | | $ | 444,837,050 | |
| |
Net realized loss | | | (32,379,779) | | | | (73,872,629) | |
| |
Net change in unrealized appreciation/depreciation | | | 446,899,381 | | | | (1,215,152,121) | |
| | | | | | | | |
Net increase (decrease) in net assets resulting from operations | | | 824,988,304 | | | | (844,187,700) | |
|
| |
| Dividends and/or Distributions to Shareholders | | | | | | | | |
| Dividends from net investment income: | | | | | | | | |
| Class A | | | (321,907,703) | | | | (366,957,815) | |
Class B | | | (2,116,059) | | | | (3,458,983) | |
Class C | | | (49,763,482) | | | | (55,983,729) | |
| Class Y | | | (13,226,546) | | | | (12,077,031) | |
| | | | |
| | | (387,013,790) | | | | (438,477,558) | |
|
| |
| Beneficial Interest Transactions | | | | | | | | |
Net increase (decrease) in net assets resulting from beneficial interest transactions: | | | | | | | | |
Class A | | | (310,227,667) | | | | (727,116,140) | |
Class B | | | (17,035,449) | | | | (37,794,713) | |
Class C | | | (22,474,060) | | | | (167,788,631) | |
Class Y | | | 49,842,451 | | | | 3,288,005 | |
| | | | | | | | |
| | | (299,894,725) | | | | (929,411,479) | |
|
| |
| Net Assets | | | | | | | | |
| Total increase (decrease) | | | 138,079,789 | | | | (2,212,076,737) | |
| |
Beginning of period | | | 6,030,052,527 | | | | 8,242,129,264 | |
| | | | | | | | |
| End of period (including accumulated net investment income of $105,674,479 and $71,502,802, respectively) | | $ | 6,168,132,316 | | | $ | 6,030,052,527 | |
| | | | |
| | | | | | | | |
See accompanying Notes to Financial Statements.
41 OPPENHEIMER ROCHESTER FUND MUNICIPALS
STATEMENT OF CASH FLOWS For the Year Ended December 31, 2014
| | | | |
| |
Cash Flows from Operating Activities | | | | |
Net increase in net assets from operations | | $ | 824,988,304 | |
| |
Adjustments to reconcile net increase in net assets from operations to net cash provided by operating activities: | | | | |
Purchase of investment securities | | | (550,745,475) | |
Proceeds from disposition of investment securities | | | 1,173,096,275 | |
Short-term investment securities, net | | | 17,970,249 | |
Premium amortization | | | 13,330,700 | |
Discount accretion | | | (74,631,073) | |
Net realized loss on investments | | | 32,379,779 | |
Net change in unrealized appreciation/depreciation on investments | | | (446,899,381) | |
Change in assets: | | | | |
Increase in other assets | | | (77,431) | |
Decrease in interest receivable | | | 8,508,839 | |
Decrease in receivable for securities sold | | | 1,293,659 | |
Change in liabilities: | | | | |
Decrease in other liabilities | | | (1,252,622) | |
Increase in payable for securities purchased | | | 5,535,839 | |
| | | | |
Net cash provided by operating activities | | | 1,003,497,662 | |
|
| |
Cash Flows from Financing Activities | | | | |
Proceeds from borrowings | | | 352,300,000 | |
Payments on borrowings | | | (409,000,000) | |
Payments on short-term floating rate notes issued | | | (251,355,000) | |
Payment on bank overdraft | | | (7,037,043) | |
Proceeds from shares sold | | | 746,608,895 | |
Payments on shares redeemed | | | (1,352,253,960) | |
Cash distributions paid | | | (82,222,987) | |
| | | | |
Net cash used in financing activities | | | (1,002,960,095) | |
| |
Net increase in cash | | | 537,567 | |
| |
Cash, beginning balance | | | — | |
| | | | |
Cash, ending balance | | $ | 537,567 | |
| | | | |
Supplemental disclosure of cash flow information:
Noncash financing activities not included herein consist of reinvestment of dividends and distributions of $299,859,512.
Cash paid for interest on borrowings—$21,329.
Cash paid for interest on short-term floating rate notes issued—$12,349,167.
See accompanying Notes to Financial Statements.
42 OPPENHEIMER ROCHESTER FUND MUNICIPALS
FINANCIAL HIGHLIGHTS
| | | | | | | | | | | | | | | | | | | | |
| Class A | | Year Ended
December 31,
2014 | | | Year Ended
December 31,
2013 | | | Year Ended
December 31,
2012 | | | Year Ended
December 30,
2011 1 | | | Year Ended
December 31,
2010 | |
| |
Per Share Operating Data | | | | | | | | | | | | | | | | | | | | |
Net asset value, beginning of period | | $ | 14.29 | | | $ | 17.02 | | | $ | 15.98 | | | $ | 15.33 | | | $ | 15.70 | |
| |
Income (loss) from investment operations: | | | | | | | | | | | | | | | | | | | | |
Net investment income2 | | | 1.02 | | | | 0.97 | | | | 0.95 | | | | 1.02 | | | | 0.98 | |
Net realized and unrealized gain (loss) | | | 1.00 | | | | (2.75 | ) | | | 1.08 | | | | 0.66 | | | | (0.38 | ) |
| | | | |
Total from investment operations | | | 2.02 | | | | (1.78 | ) | | | 2.03 | | | | 1.68 | | | | 0.60 | |
| |
Dividends and/or distributions to shareholders: | | | | | | | | | | | | | | | | | | | | |
Dividends from net investment income | | | (0.96 | ) | | | (0.95 | ) | | | (0.99 | ) | | | (1.03 | ) | | | (0.97 | ) |
| |
Net asset value, end of period | | $ | 15.35 | | | $ | 14.29 | | | $ | 17.02 | | | $ | 15.98 | | | $ | 15.33 | |
| | | | |
|
| |
Total Return, at Net Asset Value3 | | | 14.43 | % | | | (10.84 | )% | | | 12.94 | % | | | 11.50 | % | | | 3.63 | % |
| |
Ratios/Supplemental Data | | | | | | | | | | | | | | | | | | | | |
Net assets, end of period (in millions) | | $ | 4,996 | | | $ | 4,948 | | | $ | 6,725 | | | $ | 6,115 | | | $ | 6,295 | |
| |
Average net assets (in millions) | | $ | 5,066 | | | $ | 6,159 | | | $ | 6,537 | | | $ | 5,937 | | | $ | 7,013 | |
| |
Ratios to average net assets:4 | | | | | | | | | | | | | | | | | | | | |
Net investment income | | | 6.73% | | | | 6.05% | | | | 5.67% | | | | 6.65% | | | | 6.01% | |
| Expenses excluding interest and fees on short-term floating rate notes issued and interest and fees from borrowings | | | 0.72% | | | | 0.72% | | | | 0.67% | | | | 0.69% | | | | 0.67% | |
Interest and fees from borrowings | | | 0.05% | | | | 0.04% | | | | 0.05% | | | | 0.06% | | | | 0.08% | |
| Interest and fees on short-term floating rate notes issued5 | | | 0.20% | | | | 0.11% | | | | 0.14% | | | | 0.15% | | | | 0.18% | |
| | | | |
Total expenses | | | 0.97% | | | | 0.87% | | | | 0.86% | | | | 0.90% | | | | 0.93% | |
| Expenses after payments, waivers and/or reimbursements and reduction to custodian expenses | | | 0.97% | | | | 0.87% | | | | 0.86% | | | | 0.90% | | | | 0.93% | |
| |
Portfolio turnover rate | | | 8% | | | | 15% | | | | 10% | | | | 11% | | | | 7% | |
1. December 30, 2011 represents the last business day of the Fund’s reporting period.
2. Per share amounts calculated based on the average shares outstanding during the period.
3. Assumes an initial investment on the business day before the first day of the fiscal period, with all dividends and distributions reinvested in additional shares on the reinvestment date, and redemption at the net asset value calculated on the last business day of the fiscal period. Sales charges are not reflected in the total returns. Total returns are not annualized for periods less than one full year. Returns do not reflect the deduction of taxes that a shareholder would pay on fund distributions or the redemption of fund shares.
4. Annualized for periods less than one full year.
5. Interest and fee expense relates to the Fund’s liability for short-term floating rate notes issued in conjunction with inverse floating rate security transactions.
See accompanying Notes to Financial Statements.
43 OPPENHEIMER ROCHESTER FUND MUNICIPALS
| | |
| FINANCIAL HIGHLIGHTS Continued |
| | | | | | | | | | | | | | | | | | | | |
| Class B | | Year Ended December 31,
2014 | | | Year Ended December 31,
2013 | | | Year Ended December 31,
2012 | | | Year Ended December 30,
2011 1 | | | Year Ended December 31,
2010 | |
| |
Per Share Operating Data | | | | | | | | | | | | | | | | | | | | |
Net asset value, beginning of period | | $ | 14.28 | | | $ | 17.00 | | | $ | 15.96 | | | $ | 15.31 | | | $ | 15.68 | |
| |
Income (loss) from investment operations: | | | | | | | | | | | | | | | | | | | | |
Net investment income2 | | | 0.89 | | | | 0.82 | | | | 0.80 | | | | 0.87 | | | | 0.82 | |
Net realized and unrealized gain (loss) | | | 0.99 | | | | (2.73 | ) | | | 1.07 | | | | 0.67 | | | | (0.37 | ) |
| | | | |
Total from investment operations | | | 1.88 | | | | (1.91 | ) | | | 1.87 | | | | 1.54 | | | | 0.45 | |
| |
Dividends and/or distributions to shareholders: | | | | | | | | | | | | | | | | | | | | |
Dividends from net investment income | | | (0.83 | ) | | | (0.81 | ) | | | (0.83 | ) | | | (0.89 | ) | | | (0.82 | ) |
| |
Net asset value, end of period | | $ | 15.33 | | | $ | 14.28 | | | $ | 17.00 | | | $ | 15.96 | | | $ | 15.31 | |
| | | | |
|
| |
Total Return, at Net Asset Value3 | | | 13.41 | % | | | (11.59 | )% | | | 11.91 | % | | | 10.47 | % | | | 2.67 | % |
| |
Ratios/Supplemental Data | | | | | | | | | | | | | | | | | | | | |
Net assets, end of period (in millions) | | $ | 32 | | | $ | 46 | | | $ | 94 | | | $ | 133 | | | $ | 181 | |
| |
Average net assets (in millions) | | $ | 38 | | | $ | 68 | | | $ | 115 | | | $ | 146 | | | $ | 220 | |
| |
Ratios to average net assets:4 | | | | | | | | | | | | | | | | | | | | |
Net investment income | | | 5.89% | | | | 5.09% | | | | 4.76% | | | | 5.72% | | | | 5.07% | |
| Expenses excluding interest and fees on short-term floating rate notes issued and interest and fees from borrowings | | | 1.58% | | | | 1.62% | | | | 1.61% | | | | 1.65% | | | | 1.62% | |
Interest and fees from borrowings | | | 0.05% | | | | 0.04% | | | | 0.05% | | | | 0.06% | | | | 0.08% | |
| Interest and fees on short-term floating rate notes issued5 | | | 0.20% | | | | 0.11% | | | | 0.14% | | | | 0.15% | | | | 0.18% | |
| | | | |
Total expenses | | | 1.83% | | | | 1.77% | | | | 1.80% | | | | 1.86% | | | | 1.88% | |
| Expenses after payments, waivers and/or reimbursements and reduction to custodian expenses | | | 1.83% | | | | 1.77% | | | | 1.80% | | | | 1.86% | | | | 1.88% | |
| |
Portfolio turnover rate | | | 8% | | | | 15% | | | | 10% | | | | 11% | | | | 7% | |
1. December 30, 2011 represents the last business day of the Fund’s reporting period.
2. Per share amounts calculated based on the average shares outstanding during the period.
3. Assumes an initial investment on the business day before the first day of the fiscal period, with all dividends and distributions reinvested in additional shares on the reinvestment date, and redemption at the net asset value calculated on the last business day of the fiscal period. Sales charges are not reflected in the total returns. Total returns are not annualized for periods less than one full year. Returns do not reflect the deduction of taxes that a shareholder would pay on fund distributions or the redemption of fund shares.
4. Annualized for periods less than one full year.
5. Interest and fee expense relates to the Fund’s liability for short-term floating rate notes issued in conjunction with inverse floating rate security transactions.
See accompanying Notes to Financial Statements.
44 OPPENHEIMER ROCHESTER FUND MUNICIPALS
| | | | | | | | | | | | | | | | | | | | |
| Class C | | Year Ended
December 31,
2014 | | | Year Ended
December 31,
2013 | | | Year Ended
December 31,
2012 | | | Year Ended
December 30,
2011 1 | | | Year Ended
December 31,
2010 | |
| |
| Per Share Operating Data | | | | | | | | | | | | | | | | | | | | |
Net asset value, beginning of period | | $ | 14.26 | | | $ | 16.99 | | | $ | 15.95 | | | $ | 15.30 | | | $ | 15.67 | |
| |
| Income (loss) from investment operations: | | | | | | | | | | | | | | | | | | | | |
| Net investment income2 | | | 0.89 | | | | 0.83 | | | | 0.81 | | | | 0.88 | | | | 0.83 | |
| Net realized and unrealized gain (loss) | | | 1.00 | | | | (2.75 | ) | | | 1.07 | | | | 0.67 | | | | (0.37 | ) |
| | | | |
| Total from investment operations | | | 1.89 | | | | (1.92 | ) | | | 1.88 | | | | 1.55 | | | | 0.46 | |
| |
| Dividends and/or distributions to shareholders: | | | | | | | | | | | | | | | | | | | | |
| Dividends from net investment income | | | (0.83 | ) | | | (0.81 | ) | | | (0.84 | ) | | | (0.90 | ) | | | (0.83 | ) |
| |
Net asset value, end of period | | $ | 15.32 | | | $ | 14.26 | | | $ | 16.99 | | | $ | 15.95 | | | $ | 15.30 | |
| | | | |
|
| |
Total Return, at Net Asset Value3 | | | 13.50 | % | | | (11.63 | )% | | | 12.00 | % | | | 10.56 | % | | | 2.75 | % |
|
| |
| Ratios/Supplemental Data | | | | | | | | | | | | | | | | | | | | |
| Net assets, end of period (in millions) | | $ | 909 | | | $ | 868 | | | $ | 1,223 | | | $ | 1,069 | | | $ | 1,120 | |
| |
| Average net assets (in millions) | | $ | 903 | | | $ | 1,096 | | | $ | 1,167 | | | $ | 1,039 | | | $ | 1,271 | |
| |
| Ratios to average net assets:4 | | | | | | | | | | | | | | | | | | | | |
| Net investment income | | | 5.88% | | | | 5.18% | | | | 4.79% | | | | 5.77% | | | | 5.14% | |
| Expenses excluding interest and fees on short-term floating rate notes issued and interest and fees from borrowings | | | 1.57% | | | | 1.59% | | | | 1.54% | | | | 1.57% | | | | 1.54% | |
| Interest and fees from borrowings | | | 0.05% | | | | 0.04% | | | | 0.05% | | | | 0.06% | | | | 0.08% | |
| Interest and fees on short-term floating rate notes issued5 | | | 0.20% | | | | 0.11% | | | | 0.14% | | | | 0.15% | | | | 0.18% | |
| | | | |
| Total expenses | | | 1.82% | | | | 1.74% | | | | 1.73% | | | | 1.78% | | | | 1.80% | |
| Expenses after payments, waivers and/or reimbursements and reduction to custodian expenses | | | 1.82% | | | | 1.74% | | | | 1.73% | | | | 1.78% | | | | 1.80% | |
| |
| Portfolio turnover rate | | | 8% | | | | 15% | | | | 10% | | | | 11% | | | | 7% | |
1. December 30, 2011 represents the last business day of the Fund’s reporting period.
2. Per share amounts calculated based on the average shares outstanding during the period.
3. Assumes an initial investment on the business day before the first day of the fiscal period, with all dividends and distributions reinvested in additional shares on the reinvestment date, and redemption at the net asset value calculated on the last business day of the fiscal period. Sales charges are not reflected in the total returns. Total returns are not annualized for periods less than one full year. Returns do not reflect the deduction of taxes that a shareholder would pay on fund distributions or the redemption of fund shares.
4. Annualized for periods less than one full year.
5. Interest and fee expense relates to the Fund’s liability for short-term floating rate notes issued in conjunction with inverse floating rate security transactions.
See accompanying Notes to Financial Statements.
45 OPPENHEIMER ROCHESTER FUND MUNICIPALS
| | |
| FINANCIAL HIGHLIGHTS Continued |
| | | | | | | | | | | | | | | | | | | | |
| Class Y | | Year Ended December 31,
2014 | | | Year Ended December 31,
2013 | | | Year Ended December 31,
2012 | | | Year Ended December 30,
2011 1 | | | Year Ended December 31,
2010 | |
| |
Per Share Operating Data | | | | | | | | | | | | | | | | | | | | |
Net asset value, beginning of period | | $ | 14.29 | | | $ | 17.02 | | | $ | 15.98 | | | $ | 15.33 | | | $ | 15.69 | |
| |
| Income (loss) from investment operations: | | | | | | | | | | | | | | | | | | | | |
| Net investment income2 | | | 1.04 | | | | 0.99 | | | | 0.97 | | | | 1.04 | | | | 0.99 | |
| Net realized and unrealized gain (loss) | | | 1.00 | | | | (2.75) | | | | 1.08 | | | | 0.66 | | | | (0.36) | |
| | | | |
| Total from investment operations | | | 2.04 | | | | (1.76) | | | | 2.05 | | | | 1.70 | | | | 0.63 | |
| |
| Dividends and/or distributions to shareholders: | | | | | | | | | | | | | | | | | | | | |
| Dividends from net investment income | | | (0.98) | | | | (0.97) | | | | (1.01) | | | | (1.05) | | | | (0.99) | |
| |
Net asset value, end of period | | $ | 15.35 | | | $ | 14.29 | | | $ | 17.02 | | | $ | 15.98 | | | $ | 15.33 | |
| | | | |
|
| |
Total Return, at Net Asset Value3 | | | 14.60 | % | | | (10.72 | )% | | | 13.10 | % | | | 11.64 | % | | | 3.84 | % |
| |
Ratios/Supplemental Data | | | | | | | | | | | | | | | | | | | | |
| Net assets, end of period (in millions) | | | $ 231 | | | | $ 168 | | | | $ 200 | | | | $ 124 | | | | $ 101 | |
| |
| Average net assets (in millions) | | | $ 205 | | | | $ 198 | | | | $ 179 | | | | $ 109 | | | | $ 100 | |
| |
| Ratios to average net assets:4 | | | | | | | | | | | | | | | | | | | | |
| Net investment income | | | 6.87% | | | | 6.21% | | | | 5.78% | | | | 6.76% | | | | 6.14% | |
| Expenses excluding interest and fees on short-term floating rate notes issued and interest and fees from borrowings | | | 0.57% | | | | 0.59% | | | | 0.54% | | | | 0.56% | | | | 0.54% | |
| Interest and fees from borrowings | | | 0.05% | | | | 0.04% | | | | 0.05% | | | | 0.06% | | | | 0.08% | |
| Interest and fees on short-term floating rate notes issued5 | | | 0.20% | | | | 0.11% | | | | 0.14% | | | | 0.15% | | | | 0.18% | |
| | | | |
| Total expenses | | | 0.82% | | | | 0.74% | | | | 0.73% | | | | 0.77% | | | | 0.80% | |
| Expenses after payments, waivers and/or reimbursements and reduction to custodian expenses | | | 0.82% | | | | 0.74% | | | | 0.73% | | | | 0.77% | | | | 0.80% | |
| |
| Portfolio turnover rate | | | 8% | | | | 15% | | | | 10% | | | | 11% | | | | 7% | |
1. December 30, 2011 represents the last business day of the Fund’s reporting period.
2. Per share amounts calculated based on the average shares outstanding during the period.
3. Assumes an initial investment on the business day before the first day of the fiscal period, with all dividends and distributions reinvested in additional shares on the reinvestment date, and redemption at the net asset value calculated on the last business day of the fiscal period. Sales charges are not reflected in the total returns. Total returns are not annualized for periods less than one full year. Returns do not reflect the deduction of taxes that a shareholder would pay on fund distributions or the redemption of fund shares.
4. Annualized for periods less than one full year.
5. Interest and fee expense relates to the Fund’s liability for short-term floating rate notes issued in conjunction with inverse floating rate security transactions.
See accompanying Notes to Financial Statements.
46 OPPENHEIMER ROCHESTER FUND MUNICIPALS
NOTES TO FINANCIAL STATEMENTS December 31, 2014
1. Organization
Oppenheimer Rochester Fund Municipals (the “Fund”) is a diversified open-end management investment company registered under the Investment Company Act of 1940 (“1940 Act”), as amended. The Fund’s investment objective is to seek tax-free income. The Fund’s investment adviser is OFI Global Asset Management, Inc. (“OFI Global” or the “Manager”), a wholly-owned subsidiary of OppenheimerFunds, Inc. (“OFI” or the “Sub-Adviser”). The Manager has entered into a sub-advisory agreement with OFI.
The Fund offers Class A, Class C and Class Y shares, and previously offered Class B shares for new purchase through June 29, 2012. Subsequent to that date, no new purchases of Class B shares are permitted, however reinvestment of dividend and/or capital gain distributions and exchanges of Class B shares into and from other Oppenheimer funds will be allowed. Class A shares are sold at their offering price, which is normally net asset value plus a front-end sales charge. Class C shares are sold, and Class B shares were sold, without a front-end sales charge but may be subject to a contingent deferred sales charge (“CDSC”). Class Y shares are sold to certain institutional investors or intermediaries without either a front-end sales charge or a CDSC, however, the intermediaries may impose charges on their accountholders who beneficially own Class Y shares. All classes of shares have identical rights and voting privileges with respect to the Fund in general and exclusive voting rights on matters that affect that class alone. Earnings, net assets and net asset value per share may differ due to each class having its own expenses, such as transfer and shareholder servicing agent fees and shareholder communications, directly attributable to that class. Class A, B and C shares have separate distribution and/or service plans under which they pay fees. Class Y shares do not pay such fees. Class B shares will automatically convert to Class A shares 72 months after the date of purchase.
The following is a summary of significant accounting policies consistently followed by the Fund.
2. Significant Accounting Policies
Security Valuation. All investments in securities are recorded at their estimated fair value, as described in Note 3.
Allocation of Income, Expenses, Gains and Losses. Income, expenses (other than those attributable to a specific class), gains and losses are allocated on a daily basis to each class of shares based upon the relative proportion of net assets represented by such class. Operating expenses directly attributable to a specific class are charged against the operations of that class.
Dividends and Distributions to Shareholders. Dividends and distributions to shareholders, which are determined in accordance with income tax regulations and may differ from U.S. generally accepted accounting principles, are recorded on the ex-dividend date. Income distributions, if any, are declared daily and paid monthly. Capital gain distributions, if any, are declared and paid annually.
47 OPPENHEIMER ROCHESTER FUND MUNICIPALS
NOTES TO FINANCIAL STATEMENTS Continued
2. Significant Accounting Policies (Continued)
Investment Income. Interest income is recognized on an accrual basis. Discount and premium, which are included in interest income on the Statement of Operations, are amortized or accreted daily.
Custodian Fees. “Custodian fees and expenses” in the Statement of Operations may include interest expense incurred by the Fund on any cash overdrafts of its custodian account during the period. Such cash overdrafts may result from the effects of failed trades in portfolio securities and from cash outflows resulting from unanticipated shareholder redemption activity. The Fund pays interest to its custodian on such cash overdraft at a rate equal to the 1 Month LIBOR Rate plus 2.00%. The “Reduction to custodian expenses” line item, if applicable, represents earnings on cash balances maintained by the Fund during the period. Such interest expense and other custodian fees may be paid with these earnings.
Security Transactions. Security transactions are recorded on the trade date. Realized gains and losses on securities sold are determined on the basis of identified cost.
Indemnifications. The Fund’s organizational documents provide current and former Trustees and officers with a limited indemnification against liabilities arising in connection with the performance of their duties to the Fund. In the normal course of business, the Fund may also enter into contracts that provide general indemnifications. The Fund’s maximum exposure under these arrangements is unknown as this would be dependent on future claims that may be made against the Fund. The risk of material loss from such claims is considered remote.
Federal Taxes. The Fund intends to comply with provisions of the Internal Revenue Code applicable to regulated investment companies and to distribute substantially all of its investment company taxable income, including any net realized gain on investments not offset by capital loss carryforwards, if any, to shareholders. Therefore, no federal income or excise tax provision is required. The Fund files income tax returns in U.S. federal and applicable state jurisdictions. The statute of limitations on the Fund’s tax return filings generally remain open for the three preceding fiscal reporting period ends.
The tax components of capital shown in the following table represent distribution requirements the Fund must satisfy under the income tax regulations, losses the Fund may be able to offset against income and gains realized in future years and unrealized appreciation or depreciation of securities and other investments for federal income tax purposes.
| | | | | | | | | | | | |
Undistributed Net Investment Income | | Undistributed Long-Term Gain | | | Accumulated Loss Carryforward1,2,3 | | | Net Unrealized Depreciation Based on cost of Securities and Other Investments for Federal Income Tax Purposes | |
| |
$86,739,604 | | | $— | | | | $1,024,322,771 | | | | $1,003,298,571 | |
48 OPPENHEIMER ROCHESTER FUND MUNICIPALS
2. Significant Accounting Policies (Continued)
1. As of December 31, 2014, the Fund had $1,024,322,771 of net capital loss carryforward available to offset future realized capital gains, if any, and thereby reduce future taxable gain distributions. Details of the capital loss carryforwards are included in the table below. Capital loss carryovers with no expiration, if any, must be utilized prior to those with expiration dates.
| | | | |
| Expiring | | | |
2016 | | $ | 443,946,792 | |
2017 | | | 324,022,087 | |
No expiration | | | 256,353,892 | |
| | | | |
Total | | $ | 1,024,322,771 | |
| | | | |
2. During the fiscal year ended December 31, 2014, the Fund did not utilize any capital loss carryforward.
3. During the fiscal year ended December 31, 2013, the Fund did not utilize any capital loss carryforward.
Net investment income (loss) and net realized gain (loss) may differ for financial statement and tax purposes. The character of dividends and distributions made during the fiscal year from net investment income or net realized gains may differ from their ultimate characterization for federal income tax purposes. Also, due to timing of dividends and distributions, the fiscal year in which amounts are distributed may differ from the fiscal year in which the income or net realized gain was recorded by the Fund.
Accordingly, the following amounts have been reclassified for December 31, 2014. Net assets of the Fund were unaffected by the reclassifications.
| | | | | | | | |
Reduction to Paid-in Capital | | Increase
to Accumulated
Net Investment Income | | | Increase to Accumulated Net
Realized Loss on Investments | |
| |
$104,974 | | | $10,716,765 | | | | $10,611,791 | |
The tax character of distributions paid during the years ended December 31, 2014 and December 31, 2013 was as follows:
| | | | | | | | |
| | | Year Ended December 31, 2014 | | | Year Ended
December 31, 2013 | |
| |
Distributions paid from: | | | | | | | | |
Exempt-interest dividends | | | $ 386,531,417 | | | | $ 436,964,547 | |
Ordinary income | | | 482,373 | | | | 1,513,011 | |
| | | | |
Total | | | $ 387,013,790 | | | | $ 438,477,558 | |
| | | | |
The aggregate cost of securities and other investments and the composition of unrealized appreciation and depreciation of securities and other investments for federal income tax purposes as of December 31, 2014 are noted in the following table. The primary difference between book and tax appreciation or depreciation of securities and other investments, if applicable, is attributable to the tax deferral of losses or tax realization of financial statement unrealized gain or loss.
49 OPPENHEIMER ROCHESTER FUND MUNICIPALS
NOTES TO FINANCIAL STATEMENTS Continued
2. Significant Accounting Policies (Continued)
| | | | |
Federal tax cost of securities | | | $ 7,085,594,157 | 1 |
| | | | |
Gross unrealized appreciation | | | $ 275,210,452 | |
Gross unrealized depreciation | | | (1,278,509,023 | ) |
| | | | |
Net unrealized depreciation | | | $ (1,003,298,571) | |
| | | | |
1. The Federal tax cost of securities does not include cost of $625,934,750, which has otherwise been recognized for financial reporting purposes, related to bonds placed into trusts in conjunction with certain investment transactions. See the Inverse Floating Rate Securities note in Note 4.
Use of Estimates. The preparation of financial statements in conformity with accounting principles generally accepted in the United States of America requires management to make estimates and assumptions that affect the reported amounts of assets and liabilities and disclosure of contingent assets and liabilities at the date of the financial statements and the reported amounts of increases and decreases in net assets from operations during the reporting period. Actual results could differ from those estimates.
3. Securities Valuation
The Fund calculates the net asset value of its shares as of the close of the New York Stock Exchange (the “Exchange”), normally 4:00 P.M. Eastern time, on each day the Exchange is open for trading.
The Fund’s Board has adopted procedures for the valuation of the Fund’s securities and has delegated the day-to-day responsibility for valuation determinations under those procedures to the Manager. The Manager has established a Valuation Committee which is responsible for determining a “fair valuation” for any security for which market quotations are not “readily available.” The Valuation Committee’s fair valuation determinations are subject to review, approval and ratification by the Fund’s Board at its next regularly scheduled meeting covering the calendar quarter in which the fair valuation was determined.
Valuation Methods and Inputs
Securities are valued using unadjusted quoted market prices, when available, as supplied primarily by third party pricing services or dealers.
The following methodologies are used to determine the market value or the fair value of the types of securities described below:
Securities traded on a registered U.S. securities exchange (including exchange-traded derivatives other than futures and futures options) are valued based on the last sale price of the security reported on the principal exchange on which it is traded, prior to the time when the Fund’s assets are valued. In the absence of a sale, the security is valued at the last sale price on the prior trading day, if it is within the spread of the current day’s closing “bid” and “asked” prices, and if not, at the current day’s closing bid price. A security of a foreign issuer traded on a foreign exchange, but not listed on a registered U.S. securities exchange, is valued based on the last sale price on the principal exchange on which the security is traded, as identified by the third party pricing service used by the Manager, prior to the time when
50 OPPENHEIMER ROCHESTER FUND MUNICIPALS
3. Securities Valuation (Continued)
the Fund’s assets are valued. If the last sale price is unavailable, the security is valued at the most recent official closing price on the principal exchange on which it is traded. If the last sales price or official closing price for a foreign security is not available, the security is valued at the mean between the bid and asked price per the exchange or, if not available from the exchange, obtained from two dealers. If bid and asked prices are not available from either the exchange or two dealers, the security is valued by using one of the following methodologies (listed in order of priority): (1) using a bid from the exchange, (2) the mean between the bid and asked price as provided by a single dealer, or (3) a bid from a single dealer.
Shares of a registered investment company that are not traded on an exchange are valued at that investment company’s net asset value per share.
Corporate and government debt securities (of U.S. or foreign issuers) and municipal debt securities, event-linked bonds, loans, mortgage-backed securities, collateralized mortgage obligations, and asset-backed securities are valued at the mean between the “bid” and “asked” prices utilizing evaluated prices obtained from third party pricing services or broker-dealers who may use matrix pricing methods to determine the evaluated prices.
Short-term money market type debt securities with a remaining maturity of sixty days or less are valued at cost adjusted by the amortization of discount or premium to maturity (amortized cost), which approximates market value. Short-term debt securities with a remaining maturity in excess of sixty days are valued at the mean between the “bid” and “asked” prices utilizing evaluated prices obtained from third party pricing services or broker-dealers.
A description of the standard inputs that may generally be considered by the third party pricing vendors in determining their evaluated prices is provided below.
| | |
| Security Type | | Standard inputs generally considered by third-party pricing vendors |
| Corporate debt, government debt, municipal, mortgage-backed and asset-backed securities | | Reported trade data, broker-dealer price quotations, benchmark yields, issuer spreads on comparable securities, the credit quality, yield, maturity, and other appropriate factors. |
| Loans | | Information obtained from market participants regarding reported trade data and broker-dealer price quotations. |
| Event-linked bonds | | Information obtained from market participants regarding reported trade data and broker-dealer price quotations. |
If a market value or price cannot be determined for a security using the methodologies described above, or if, in the “good faith” opinion of the Manager, the market value or price obtained does not constitute a “readily available market quotation,” or a significant event has occurred that would materially affect the value of the security the security is fair valued either (i) by a standardized fair valuation methodology applicable to the security type or the significant event as previously approved by the Valuation Committee and the Fund’s Board or (ii) as determined in good faith by the Manager’s Valuation Committee. The Valuation Committee considers all relevant facts that are reasonably available, through either public information or information available to the Manager, when determining the fair value of a
51 OPPENHEIMER ROCHESTER FUND MUNICIPALS
NOTES TO FINANCIAL STATEMENTS Continued
3. Securities Valuation (Continued)
security. Fair value determinations by the Manager are subject to review, approval and ratification by the Fund’s Board at its next regularly scheduled meeting covering the calendar quarter in which the fair valuation was determined. Those fair valuation standardized methodologies include, but are not limited to, valuing securities at the last sale price or initially at cost and subsequently adjusting the value based on: changes in company specific fundamentals, changes in an appropriate securities index, or changes in the value of similar securities which may be further adjusted for any discounts related to security-specific resale restrictions. When possible, such methodologies use observable market inputs such as unadjusted quoted prices of similar securities, observable interest rates, currency rates and yield curves. The methodologies used for valuing securities are not necessarily an indication of the risks associated with investing in those securities nor can it be assured that the Fund can obtain the fair value assigned to a security if it were to sell the security.
To assess the continuing appropriateness of security valuations, the Manager, or its third party service provider who is subject to oversight by the Manager, regularly compares prior day prices, prices on comparable securities, and sale prices to the current day prices and challenges those prices exceeding certain tolerance levels with the third party pricing service or broker source. For those securities valued by fair valuations, whether through a standardized fair valuation methodology or a fair valuation determination, the Valuation Committee reviews and affirms the reasonableness of the valuations based on such methodologies and fair valuation determinations on a regular basis after considering all relevant information that is reasonably available.
Classifications
Each investment asset or liability of the Fund is assigned a level at measurement date based on the significance and source of the inputs to its valuation. Various data inputs are used in determining the value of each of the Fund’s investments as of the reporting period end. These data inputs are categorized in the following hierarchy under applicable financial accounting standards:
1) Level 1-unadjusted quoted prices in active markets for identical assets or liabilities (including securities actively traded on a securities exchange)
2) Level 2-inputs other than unadjusted quoted prices that are observable for the asset or liability (such as unadjusted quoted prices for similar assets and market corroborated inputs such as interest rates, prepayment speeds, credit risks, etc.)
3) Level 3-significant unobservable inputs (including the Manager’s own judgments about assumptions that market participants would use in pricing the asset or liability).
The inputs used for valuing securities are not necessarily an indication of the risks associated with investing in those securities.
The table below categorizes amounts that are included in the Fund’s Statement of Assets and Liabilities as of December 31, 2014 based on valuation input level:
52 OPPENHEIMER ROCHESTER FUND MUNICIPALS
3. Securities Valuation (Continued)
| | | | | | | | | | | | | | | | |
| | |
| Level 1—
Unadjusted Quoted Prices |
| |
| Level 2—
Other Significant Observable Inputs |
| |
| Level 3—
Significant Unobservable Inputs |
| | | Value | |
Assets Table | | | | | | | | | | | | | | | | |
Investments, at Value: | | | | | | | | | | | | | | | | |
Municipal Bonds and Notes | | | | | | | | | | | | | | | | |
New York | | $ | — | | | $ | 4,974,510,980 | | | $ | 1,342,546 | | | $ | 4,975,853,526 | |
U.S. Possessions | | | — | | | | 1,728,327,920 | | | | — | | | | 1,728,327,920 | |
Common Stock | | | — | | | | — | | | | 4,048,890 | | | | 4,048,890 | |
| | | | |
Total Assets | | $ | — | | | $ | 6,702,838,900 | | | $ | 5,391,436 | | | $ | 6,708,230,336 | |
| | | | |
Forward currency exchange contracts and futures contracts, if any, are reported at their unrealized appreciation/depreciation at measurement date, which represents the change in the contract’s value from trade date. All additional assets and liabilities included in the above table are reported at their market value at measurement date.
4. Investments and Risks
Securities on a When-Issued or Delayed Delivery Basis. The Fund may purchase securities on a “when-issued” basis, and may purchase or sell securities on a “delayed delivery” basis. “When-issued” or “delayed delivery” refers to securities whose terms and indenture are available and for which a market exists, but which are not available for immediate delivery. Delivery and payment for securities that have been purchased by the Fund on a when-issued basis normally takes place within six months and possibly as long as two years or more after the trade date. During this period, such securities do not earn interest, are subject to market fluctuation and may increase or decrease in value prior to their delivery. The purchase of securities on a when-issued basis may increase the volatility of the Fund’s net asset value to the extent the Fund executes such transactions while remaining substantially fully invested. When the Fund engages in when-issued or delayed delivery transactions, it relies on the buyer or seller, as the case may be, to complete the transaction. Their failure to do so may cause the Fund to lose the opportunity to obtain or dispose of the security at a price and yield it considers advantageous. The Fund may also sell securities that it purchased on a when-issued basis or forward commitment prior to settlement of the original purchase.
As of December 31, 2014, the Fund had purchased securities issued on a when-issued or delayed delivery basis as follows:
| | | | |
| | | When-Issued or
Delayed Delivery
Basis Transactions | |
Purchased securities | | | $1,145,340 | |
Inverse Floating Rate Securities. The Fund invests in inverse floating rate securities that pay interest at a rate that varies inversely with short-term interest rates. Because inverse floating rate securities are leveraged instruments, the value of an inverse floating rate security will change more significantly in response to changes in interest rates and other market
53 OPPENHEIMER ROCHESTER FUND MUNICIPALS
NOTES TO FINANCIAL STATEMENTS Continued
4. Investments and Risks (Continued)
fluctuations than the market value of a conventional fixed-rate municipal security of similar maturity and credit quality, including the municipal bond underlying an inverse floating rate security.
An inverse floating rate security is created as part of a financial transaction referred to as a “tender option bond” transaction. In most cases, in a tender option bond transaction the Fund sells a fixed-rate municipal bond (the “underlying municipal bond”) to a broker dealer (the “sponsor”). The sponsor creates a trust (the “Trust”) into which it deposits the underlying municipal bond. The Trust then issues and sells short-term floating rate securities with a fixed principal amount representing a senior interest in the underlying municipal bond to third parties and a residual, subordinate interest in the underlying municipal bond (referred to as an “inverse floating rate security”) to the Fund. The interest rate on the short-term floating rate securities resets periodically, usually weekly, to a prevailing market rate and holders of these securities are granted the option to tender their securities back to the Trust for repurchase at their principal amount plus accrued interest thereon (the “purchase price”) periodically, usually daily or weekly. A remarketing agent for the Trust is required to attempt to re-sell any tendered short-term floating rate securities to new investors for the purchase price. If the remarketing agent is unable to successfully re-sell the tendered short-term floating rate securities, a liquidity provider to the Trust (typically an affiliate of the sponsor) must contribute cash to the Trust to ensure that the tendering holders receive the purchase price of their securities on the repurchase date.
Because holders of the short-term floating rate securities are granted the right to tender their securities to the Trust for repurchase at frequent intervals for the purchase price, with such payment effectively guaranteed by the liquidity provider, the securities generally bear short-term rates of interest commensurate with money market instruments. When interest is paid on the underlying municipal bond to the Trust, such proceeds are first used to pay the Trust’s administrative expenses and accrued interest to holders of the short-term floating rate securities, with any remaining amounts being paid to the Fund, as the holder of the inverse floating rate security. Accordingly, the amount of such interest on the underlying municipal bond paid to the Fund is inversely related the rate of interest on the short-term floating rate securities. Additionally, because the principal amount of the short-term floating rate securities is fixed and is not adjusted in response to changes in the market value of the underlying municipal bond, any change in the market value of the underlying municipal bond is reflected entirely in a change to the value of the inverse floating rate security.
Typically, the terms of an inverse floating rate security grant certain rights to the Fund, as holder. For example, the Fund may have the right upon request to require that the Trust compel a tender of the short-term floating rate securities to facilitate the Fund’s acquisition of the underlying municipal bond. Following such a request, the Fund pays the Trust the purchase price of the short-term floating rate securities and a specified portion of any market value gain on the underlying municipal bond since its deposit into the Trust, which the Trust uses to redeem the short-term floating rate securities. The Trust then distributes the underlying municipal bond to the Fund. Similarly, the Fund may have the right to directly purchase the underlying municipal bond from the Trust by paying to the Trust the purchase
54 OPPENHEIMER ROCHESTER FUND MUNICIPALS
4. Investments and Risks (Continued)
price of the short-term floating rate securities and a specified portion of any market value gain on the underlying municipal bond since its deposit into the Trust, which the Trust uses to redeem the short-term floating rate securities. Through the exercise of either of these rights, the Fund can voluntarily terminate or “collapse” the Trust, terminate its investment in the related inverse floating rate security and obtain the underlying municipal bond. Additionally, the Fund also typically has the right to exchange with the Trust (i) a principal amount of short-term floating rate securities held by the Fund for a corresponding additional principal amount of the inverse floating rate security or (ii) a principal amount of the inverse floating rate security held by the Fund for a corresponding additional principal amount of short-term floating rate securities (which are typically then sold to other investors). Through the exercise of this right, the Fund may increase (or decrease) the principal amount of short-term floating rate securities outstanding, thereby increasing (or decreasing) the amount of leverage provided by the short-term floating rate securities to the Fund’s investment exposure to the underlying municipal bond.
The Fund’s investments in inverse floating rate securities involve certain risks. As short-term interest rates rise, an inverse floating rate security produces less current income (and, in extreme cases, may pay no income) and as short-term interest rates fall, an inverse floating rate security produces more current income. Thus, if short-term interest rates rise after the issuance of the inverse floating rate security, any yield advantage is reduced or eliminated. All inverse floating rate securities entail some degree of leverage represented by the outstanding principal amount of the related short-term floating rate securities. The value of, and income earned on, an inverse floating rate security that has a higher degree of leverage will fluctuate more significantly in response to changes in interest rates and to changes in the market value of the related underlying municipal bond than that of an inverse floating rate security with a lower degree of leverage, and is more likely to be eliminated entirely under adverse market conditions. Changes in the value of an inverse floating rate security will also be significant than changes in the market value of the related underlying municipal bond because the leverage provided by the related short-term floating rate securities increases the sensitivity of an inverse floating rate security to changes in interest rates and to the market value of the underlying municipal bond. An inverse floating rate security can be expected to underperform fixed-rate municipal bonds when the difference between long-term and short-term interest rates is decreasing (or is already small) or when long-term interest rates are rising, but can be expected to outperform fixed-rate municipal bonds when the difference between long-term and short-term interest rates is increasing (or is already large) or when long-term interest rates are falling. Additionally, a tender option bond transaction typically provides for the automatic termination or “collapse” of a Trust upon the occurrence of certain adverse events, usually referred to as “mandatory tender events” or “tender option termination events.” These events may include, among others, a credit ratings downgrade of the underlying municipal bond below a specified level, a decrease in the market value of the underlying municipal bond below a specified amount, a bankruptcy of the liquidity provider or the inability of the remarketing agent to re-sell to new investors short-term floating rate securities that have been tendered for repurchase by holders thereof. Following the occurrence of such
55 OPPENHEIMER ROCHESTER FUND MUNICIPALS
NOTES TO FINANCIAL STATEMENTS Continued
4. Investments and Risks (Continued)
an event, the underlying municipal bond is generally sold for current market value and the proceeds distributed to holders of the short-term floating rate securities and inverse floating rate security, with the holder of the inverse floating rate security (the Fund) generally receiving the proceeds of such sale only after the holders of the short-term floating rate securities have received proceeds equal to the purchase price of their securities (and the liquidity provider is generally required to contribute cash to the Trust only in an amount sufficient to ensure that the holders of the short-term floating rate securities receive the purchase price of their securities in connection with such termination of the Trust). Following the occurrence of such events, the Fund could potentially lose the entire amount of its investment in the inverse floating rate security.
Finally, the Fund may enter into shortfall/reimbursement agreements with the liquidity provider of certain tender option bond transactions in connection with certain inverse floating rate securities held by the Fund. These agreements commit the Fund to reimburse the liquidity provider to the extent that the liquidity provider must provide cash to a Trust, including following the termination of a Trust resulting from the occurrence of a “mandatory tender event.” In connection with the occurrence of such an event and the termination of the Trust triggered thereby, the shortfall/reimbursement agreement will make the Fund liable for the amount of the negative difference, if any, between the liquidation value of the underlying municipal bond and the purchase price of the short-term floating rate securities issued by the Trust. Under the standard terms of a tender option bond transaction, absent such a shortfall/reimbursement agreement, the Fund, as holder of the inverse floating rate security, would not be required to make such a reimbursement payment to the liquidity provider. The Manager monitors the Fund’s potential exposure with respect to these agreements on a daily basis and intends to take action to terminate the Fund’s investment in related inverse floating rate securities, if it deems it appropriate to do so. As of December 31, 2014, the Fund’s maximum exposure under such agreements is estimated at $290,175,000.
When the Fund creates an inverse floating rate security in a tender option bond transaction by selling an underlying municipal bond to a sponsor for deposit into a Trust, the transaction is considered a secured borrowing for financial reporting purposes. As a result of such accounting treatment, the Fund includes the underlying municipal bond on its Statement of Investments and as an asset on its Statement of Assets and Liabilities (but does not separately include the related inverse floating rate security on either). The Fund also includes a liability on its Statement of Assets and Liabilities equal to the outstanding principal amount and accrued interest on the related short-term floating rate securities issued by the Trust. Interest on the underlying municipal bond is recorded as investment income on the Fund’s Statement of Operations, while interest payable on the related short-term floating rate securities is recorded as interest expense. At December 31, 2014, municipal bond holdings with a value of $1,219,120,652 shown on the Fund’s Statement of Investments are held by such Trusts and serve as the underlying municipal bonds for the related $581,425,000 in short-term floating rate securities issued and outstanding at that date.
At December 31, 2014, the inverse floating rate securities associated with tender option bond transactions accounted for as secured borrowings were as follows:
56 OPPENHEIMER ROCHESTER FUND MUNICIPALS
4. Investments and Risks (Continued)
| | | | | | | | | | | | | | | | |
Principal
Amount | | | Inverse Floater1 | | Coupon
Rate2 | | | Maturity Date | | | Value | |
| | $ 14,655,000 | | | NY Austin Trust Various States Inverse Certificates | | | 6.472 | % | | | 11/1/39 | | | $ | 14,926,704 | |
| | 15,585,000 | | | NY Liberty Devel. Corp. (Bank of America at One Byrant Park) LIFERS | | | 22.264 | | | | 1/15/46 | | | | 24,452,865 | |
| | 7,500,000 | | | NY Liberty Devel. Corp. ROLs3 | | | 9.772 | | | | 1/15/44 | | | | 9,244,050 | |
| | 15,660,000 | | | NY/NJ Port Authority Austin Trust Inverse Certificates | | | 6.405 | | | | 12/1/27 | | | | 17,329,200 | |
| | 23,955,000 | | | NY/NJ Port Authority Austin Trust Inverse Certificates | | | 7.935 | | | | 10/1/30 | | | | 25,421,046 | |
| | 2,140,000 | | | NYC GO ROLs | | | 8.816 | | | | 3/1/35 | | | | 2,175,053 | |
| | 3,665,000 | | | NYC GO ROLs | | | 8.005 | | | | 8/1/30 | | | | 3,858,292 | |
| | 1,900,000 | | | NYC GO ROLs | | | 8.831 | | | | 8/1/35 | | | | 2,007,635 | |
| | 5,000,000 | | | NYC GO ROLs | | | 19.332 | | | | 3/1/21 | | | | 8,167,400 | |
| | 2,500,000 | | | NYC GO ROLs3 | | | 18.588 | | | | 10/1/34 | | | | 3,991,300 | |
| | 1,500,000 | | | NYC HDC, Series B-1 ROLs | | | 8.182 | | | | 11/1/32 | | | | 1,588,320 | |
| | | | NYC HDC, Series B-1 ROLs | | | 8.093 | | | | 11/1/27 | | | | 1,341,877 | |
| | 4,180,000 | | | NYC HDC, Series C ROLs | | | 8.187 | | | | 5/1/40 | | | | 4,253,526 | |
| | 1,375,000 | | | NYC HDC, Series C ROLs | | | 7.966 | | | | 11/1/26 | | | | 1,411,740 | |
| | 775,000 | | | NYC HDC, Series C-1 ROLs | | | 17.063 | | | | 11/1/34 | | | | 1,011,662 | |
| | 2,730,000 | | | NYC HDC, Series C-1 ROLs | | | 17.794 | | | | 11/1/46 | | | | 3,575,072 | |
| | 710,000 | | | NYC HDC, Series C-1 ROLs | | | 17.289 | | | | 5/1/29 | | | | 924,420 | |
| | 4,015,000 | | | NYC HDC, Series J-2-C ROLs | | | 8.317 | | | | 11/1/40 | | | | 4,221,893 | |
| | 1,750,000 | | | NYC HDC, Series K ROLs | | | 7.965 | | | | 11/1/37 | | | | 1,779,505 | |
| | 2,340,000 | | | NYC HDC, Series L ROLs | | | 8.06 | | | | 11/1/39 | | | | 2,379,476 | |
| | 11,080,000 | | | NYC Hsg. Devel. Corp. (Multifamily Hsg.) ROLs3 | | | 13.069 | | | | 5/1/49 | | | | 11,878,092 | |
| | 5,395,000 | | | NYC Municipal Water Finance Authority3 | | | 20.1 | | | | 6/15/43 | | | | 9,044,825 | |
| | 7,935,000 | | | NYC Municipal Water Finance Authority LIFERS | | | 20.151 | | | | 6/15/43 | | | | 13,527,112 | |
| | 3,750,000 | | | NYC Transitional Finance Authority (Building Aid) ROLs3 | | | 19.602 | | | | 7/15/37 | | | | 6,082,050 | |
| | 6,250,000 | | | NYC Transitional Finance Authority (Building Aid) ROLs3 | | | 18.588 | | | | 7/15/37 | | | | 9,628,000 | |
| | 10,170,000 | | | NYC Transitional Finance Authority (Future Tax) ROLs3 | | | 9.567 | | | | 2/1/30 | | | | 13,634,207 | |
| | 7,500,000 | | | NYC Transitional Finance Authority (Future Tax) ROLs3 | | | 9.569 | | | | 5/1/34 | | | | 9,970,650 | |
| | 8,205,000 | | | NYS DA (Memorial Sloan-Kettering) ROLs | | | 8.824 | | | | 7/1/35 | | | | 9,166,052 | |
| | 5,265,000 | | | NYS DA (Vassar College) ROLs | | | 8.822 | | | | 7/1/46 | | | | 6,289,938 | |
| | 3,980,000 | | | NYS DA ROLs3 | | | 18.582 | | | | 3/15/34 | | | | 6,401,432 | |
| | 3,410,000 | | | NYS HFA ROLs3 | | | 15.153 | | | | 11/1/45 | | | | 3,743,191 | |
| | 3,750,000 | | | Port Authority NY/NJ ROLs3 | | | 22.253 | | | | 9/15/28 | | | | 5,689,800 | |
| | 5,500,000 | | | Port Authority NY/NJ, 11588th Series ROLs3 | | | 17.001 | | | | 10/15/32 | | | | 6,379,780 | |
| | 3,580,000 | | | Port Authority NY/NJ, 11588th Series ROLs3 | | | 16.063 | | | | 10/15/28 | | | | 4,434,152 | |
| | 4,895,000 | | | Port Authority NY/NJ, 11588th Series ROLs3 | | | 16.991 | | | | 10/15/27 | | | | 6,205,587 | |
| | 9,090,000 | | | Port Authority NY/NJ, 11589th Series ROLs3 | | | 12.591 | | | | 9/1/29 | | | | 9,471,780 | |
| | 62,000,000 | | | Port Authority NY/NJ, 151st Series LIFERS | | | 6.728 | | | | 3/15/35 | | | | 70,394,800 | |
| | 3,335,000 | | | Port Authority NY/NJ, 151st Series ROLs | | | 13.597 | | | | 3/15/35 | | | | 4,500,983 | |
| | 38,970,000 | | | Port Authority NY/NJ, 152nd Series LIFERS | | | 10.299 | | | | 11/1/35 | | | | 45,096,474 | |
| | 6,860,000 | | | Port Authority NY/NJ, 152nd Series ROLs | | | 8.394 | | | | 5/1/38 | | | | 8,216,496 | |
| | 20,000,000 | | | Port Authority NY/NJ, 152nd Series ROLs | | | 8.419 | | | | 11/1/35 | | | | 23,956,400 | |
| | 5,060,000 | | | Port Authority NY/NJ, 163rd Series LIFERS | | | 18.278 | | | | 7/15/39 | | | | 7,703,597 | |
| | 10,755,000 | | | Port Authority NY/NJ, 166th Series | | | 9.29 | | | | 1/15/41 | | | | 13,514,195 | |
57 OPPENHEIMER ROCHESTER FUND MUNICIPALS
NOTES TO FINANCIAL STATEMENTS Continued
4. Investments and Risks (Continued)
| | | | | | | | | | | | | | | | |
Principal
Amount | | | Inverse Floater1 | | Coupon
Rate2 | | | Maturity Date | | | Value | |
| | $ 7,500,000 | | | Port Authority NY/NJ, 3114th Series DRIVERS | | | 13.456 | % | | | 11/1/30 | | | $ | 10,322,400 | |
| | 7,500,000 | | | Port Authority NY/NJ, 3249th Series ROLs3 | | | 10.026 | | | | 7/15/36 | | | | 9,757,800 | |
| | 7,650,000 | | | Port Authority NY/NJ, 3264th Series ROLs3 | | | 9.519 | | | | 10/15/31 | | | | 9,929,394 | |
| | 222,865,000 | | | Puerto Rico Sales Tax Financing Corp. LIFERS3 | | | 5.96 | | | | 8/1/57 | | | | 148,483,806 | |
| | 11,090,000 | | | SONYMA ROLs3 | | | 8.803 | | | | 10/1/31 | | | | 11,250,583 | |
| | 5,055,000 | | | SONYMA ROLs3 | | | 8.875 | | | | 10/1/37 | | | | 5,122,636 | |
| | 3,580,000 | | | SONYMA ROLs3 | | | 9.186 | | | | 10/1/37 | | | | 3,838,404 | |
| | | | | | | | | | | | | | | | |
| | | | | | | | | | | | | | $ | 637,695,652 | |
| | | | | | | | | | | | | | | | |
1. For a list of abbreviations used in the Inverse Floater table see the Portfolio Abbreviations table at the end of the Statement of Investments.
2. Represents the current interest rate for the inverse floating rate security.
3. Represents an inverse floating rate security that is subject to a shortfall/reimbursement agreement.
The Fund may also purchase an inverse floating rate security created as part of a tender option bond transaction not initiated by the Fund when a third party, such as a municipal issuer or financial institution, transfers an underlying municipal bond to a Trust. For financial reporting purposes, the Fund includes the inverse floating rate security related to such transaction on its Statement of Investments and as an asset on its Statement of Assets and Liabilities, and interest on the security is recorded as investment income on the Fund’s Statement of Operations.
The Fund may invest in inverse floating rate securities with any degree of leverage (as measured by the outstanding principal amount of related short-term floating rate securities). However, the Fund may only expose up to 20% of its total assets to the effects of leverage from its investments in inverse floating rate securities. This limitation is measured by comparing the aggregate principal amount of the short-term floating rate securities that are related to the inverse floating rate securities held by the Fund to the total assets of the Fund. The Fund’s exposure to the effects of leverage from its investments in inverse floating rate securities amounts to $581,425,000 or 8.51% of its total assets as of December 31, 2014.
Equity Security Risk. Stocks and other equity securities fluctuate in price. The value of the Fund’s portfolio may be affected by changes in the equity markets generally. Equity markets may experience significant short-term volatility and may fall sharply at times. Different markets may behave differently from each other and U.S. equity markets may move in the opposite direction from one or more foreign stock markets.
The prices of individual equity securities generally do not all move in the same direction at the same time and a variety of factors can affect the price of a particular company’s securities. These factors may include, but are not limited to, poor earnings reports, a loss of customers, litigation against the company, general unfavorable performance of the company’s sector or industry, or changes in government regulations affecting the company or its industry.
Credit Risk. The Fund invests in high-yield, non-investment-grade bonds, which may be subject to a greater degree of credit risk. Credit risk relates to the ability of the issuer to meet interest or principal payments or both as they become due. The Fund may acquire securities
58 OPPENHEIMER ROCHESTER FUND MUNICIPALS
4. Investments and Risks (Continued)
that have missed an interest payment, and is not obligated to dispose of securities whose issuers or underlying obligors subsequently miss an interest payment. Information concerning securities not accruing interest as of December 31, 2014 is as follows:
| | | | |
Cost | | $ | 10,057,260 | |
Market Value | | $ | 7,088,006 | |
Market Value as % of Net Assets | | | 0.11% | |
The Fund has entered into forbearance agreements with certain obligors under which the Fund has agreed to temporarily forego receipt of the original principal or coupon interest rates. As of December 31, 2014, securities with an aggregate market value of $93,937,297, representing 1.52% of the Fund’s net assets, were subject to these forbearance agreements.
Concentration Risk. There are certain risks arising from geographic concentration in any state, commonwealth or territory. Certain economic, regulatory or political developments occurring in the state, commonwealth or territory may impair the ability of certain issuers of municipal securities to pay principal and interest on their obligations.
5. Shares of Beneficial Interest
The Fund has authorized an unlimited number of no par value shares of beneficial interest of each class. Transactions in shares of beneficial interest were as follows:
| | | | | | | | | | | | | | | | |
| | | Year Ended December 31, 2014 | | | Year Ended December 31, 2013 | |
| | | Shares | | | Amount | | | Shares | | | Amount | |
| |
Class A | | | | | | | | | | | | | | | | |
Sold | | | 31,683,554 | | | $ | 476,983,511 | | | | 58,182,815 | | | $ | 939,765,979 | |
Dividends and/or distributions reinvested | | | 16,705,729 | | | | 252,679,034 | | | | 19,114,833 | | | | 302,143,673 | |
Redeemed | | | (69,092,179 | ) | | | (1,039,890,212 | ) | | | (126,143,272 | ) | | | (1,969,025,792 | ) |
| | | | |
Net decrease | | | (20,702,896 | ) | | $ | (310,227,667 | ) | | | (48,845,624 | ) | | $ | (727,116,140 | ) |
| | | | |
|
| |
Class B | | | | | | | | | | | | | | | | |
Sold | | | 43,878 | | | $ | 657,773 | | | | 63,517 | | | $ | 982,203 | |
Dividends and/or distributions reinvested | | | 108,724 | | | | 1,640,072 | | | | 183,023 | | | | 2,915,459 | |
Redeemed | | | (1,288,623 | ) | | | (19,333,294 | ) | | | (2,581,925 | ) | | | (41,692,375 | ) |
| | | | |
Net decrease | | | (1,136,021 | ) | | $ | (17,035,449 | ) | | | (2,335,385 | ) | | $ | (37,794,713 | ) |
| | | | |
|
| |
Class C | | | | | | | | | | | | | | | | |
Sold | | | 8,761,290 | | | $ | 132,087,145 | | | | 8,846,064 | | | $ | 140,521,583 | |
Dividends and/or distributions reinvested | | | 2,358,181 | | | | 35,590,667 | | | | 3,072,509 | | | | 48,503,252 | |
Redeemed | | | (12,666,824 | ) | | | (190,151,872 | ) | | | (23,026,222 | ) | | | (356,813,466 | ) |
| | | | |
Net decrease | | | (1,547,353 | ) | | $ | (22,474,060 | ) | | | (11,107,649 | ) | | $ | (167,788,631 | ) |
| | | | |
59 OPPENHEIMER ROCHESTER FUND MUNICIPALS
NOTES TO FINANCIAL STATEMENTS Continued
5. Shares of Beneficial Interest (Continued)
| | | | | | | | | | | | | | | | |
| | | Year Ended December 31, 2014 | | | Year Ended December 31, 2013 | |
| | | Shares | | | Amount | | | Shares | | | Amount | |
| |
Class Y | | | | | | | | | | | | | | | | |
Sold | | | 8,017,322 | | | $ | 121,187,234 | | | | 5,738,468 | | | $ | 91,460,318 | |
Dividends and/or distributions reinvested | | | 657,001 | | | | 9,949,739 | | | | 674,500 | | | | 10,649,066 | |
Redeemed | | | (5,386,374 | ) | | | (81,294,522 | ) | | | (6,386,709 | ) | | | (98,821,379 | ) |
| | | | |
Net increase | | | 3,287,949 | | | $ | 49,842,451 | | | | 26,259 | | | $ | 3,288,005 | |
| | | | |
6. Purchases and Sales of Securities
The aggregate cost of purchases and proceeds from sales of securities, other than short-term obligations, for the year ended December 31, 2014 were as follows:
| | | | | | | | |
| | | Purchases | | | Sales | |
Investment securities | | $ | 550,745,475 | | | $ | 1,173,096,275 | |
7. Fees and Other Transactions with Affiliates
Management Fees. Under the investment advisory agreement, the Fund pays the Manager a management fee based on the daily net assets of the Fund at an annual rate as shown in the following table:
| | | | |
| Fee Schedule | | | |
Up to $100 million | | | 0.54 | % |
Next $150 million | | | 0.52 | |
Next $1.75 billion | | | 0.47 | |
Next $3 billion | | | 0.46 | |
Next $3 billion | | | 0.45 | |
Next $6 billion | | | 0.44 | |
Over $14 billion | | | 0.42 | |
The Fund’s management fee for the fiscal year ended December 31, 2014 was 0.46% of average annual net assets before any applicable waivers.
Sub-Adviser Fees. The Manager has retained the Sub-Adviser to provide the day-to-day portfolio management of the Fund. Under the Sub-Advisory Agreement, the Manager pays the Sub-Adviser an annual fee in monthly installments, equal to a percentage of the investment management fee collected by the Manager from the Fund, which shall be calculated after any investment management fee waivers. The fee paid to the Sub-Adviser is paid by the Manager, not by the Fund.
Transfer Agent Fees. OFI Global (the “Transfer Agent”) serves as the transfer and shareholder servicing agent for the Fund. The Fund pays the Transfer Agent a fee based on annual net assets. Fees incurred and average net assets for each class with respect to these services are detailed in the Statement of Operations and Financial Highlights, respectively.
60 OPPENHEIMER ROCHESTER FUND MUNICIPALS
7. Fees and Other Transactions with Affiliates (Continued)
Sub-Transfer Agent Fees. The Transfer Agent has retained Shareholder Services, Inc., a wholly-owned subsidiary of OFI (the “Sub-Transfer Agent”), to provide the day-to-day transfer agent and shareholder servicing of the Fund. Under the Sub-Transfer Agency Agreement, the Transfer Agent pays the Sub-Transfer Agent an annual fee in monthly installments, equal to a percentage of the transfer agent fee collected by the Transfer Agent from the Fund, which shall be calculated after any applicable fee waivers. The fee paid to the Sub-Transfer Agent is paid by the Transfer Agent, not by the Fund.
Trustees’ Compensation. The Fund has adopted an unfunded retirement plan (the “Plan”) for the Fund’s Independent Trustees. Benefits are based on years of service and fees paid to each Trustee during their period of service. The Plan was frozen with respect to adding new participants effective December 31, 2006 (the “Freeze Date”) and existing Plan Participants as of the Freeze Date will continue to receive accrued benefits under the Plan. Active Independent Trustees as of the Freeze Date have each elected a distribution method with respect to their benefits under the Plan. During the year ended December 31, 2014, the Fund’s projected benefit obligations, payments to retired Trustees and accumulated liability were as follows:
| | | | |
Projected Benefit Obligations Increased | | $ | 41,543 | |
Payments Made to Retired Trustees | | | 171,796 | |
Accumulated Liability as of December 31, 2014 | | | 1,053,407 | |
The Fund’s Board of Trustees (“Board”) has adopted a compensation deferral plan for Independent Trustees that enables Trustees to elect to defer receipt of all or a portion of the annual compensation they are entitled to receive from the Fund. For purposes of determining the amount owed to the Trustee under the plan, deferred amounts are treated as though equal dollar amounts had been invested in shares of the Fund or in other Oppenheimer funds selected by the Trustee. The Fund purchases shares of the funds selected for deferral by the Trustee in amounts equal to his or her deemed investment, resulting in a Fund asset equal to the deferred compensation liability. Such assets are included as a component of “Other” within the asset section of the Statement of Assets and Liabilities. Deferral of Trustees’ fees under the plan will not affect the net assets of the Fund and will not materially affect the Fund’s assets, liabilities or net investment income per share. Amounts will be deferred until distributed in accordance with the compensation deferral plan.
Distribution and Service Plan (12b-1) Fees. Under its General Distributor’s Agreement with the Fund, OppenheimerFunds Distributor, Inc. (the “Distributor”) acts as the Fund’s principal underwriter in the continuous public offering of the Fund’s classes of shares.
Service Plan for Class A Shares. The Fund has adopted a Service Plan (the “Plan”) for Class A shares pursuant to Rule 12b-1 under the 1940 Act. Under the Plan, the Fund reimburses the Distributor for a portion of its costs incurred for services provided to accounts that hold Class A shares. Reimbursement is made periodically at an annual rate of up to 0.15% of the daily net assets of Class A shares of the Fund. The Distributor currently uses all
61 OPPENHEIMER ROCHESTER FUND MUNICIPALS
NOTES TO FINANCIAL STATEMENTS Continued
7. Fees and Other Transactions with Affiliates (Continued)
of those fees to pay dealers, brokers, banks and other financial institutions periodically for providing personal service and maintenance of accounts of their customers that hold Class A shares. Any unreimbursed expenses the Distributor incurs with respect to Class A shares in any fiscal year cannot be recovered in subsequent periods. Fees incurred by the Fund under the Plan are detailed in the Statement of Operations.
Distribution and Service Plans for Class B and Class C Shares. The Fund has adopted Distribution and Service Plans (the “Plans”) for Class B and Class C shares pursuant to Rule 12b-1 under the 1940 Act to compensate the Distributor for distributing those share classes, maintaining accounts and providing shareholder services. Under the Plans, the Fund pays the Distributor an annual asset-based sales charge of 0.75% on Class B and Class C shares daily net assets. The Fund also pays a service fee under the Plans at an annual rate of 0.25% of daily net assets. The Plans continue in effect from year to year only if the Fund’s Board of Trustees vote annually to approve its continuance at an in person meeting called for that purpose. Fees incurred by the Fund under the Plans are detailed in the Statement of Operations.
Sales Charges. Front-end sales charges and CDSC do not represent expenses of the Fund. They are deducted from the proceeds of sales of Fund shares prior to investment or from redemption proceeds prior to remittance, as applicable. The sales charges retained by the Distributor from the sale of shares and the CDSC retained by the Distributor on the redemption of shares is shown in the following table for the period indicated.
| | | | | | | | | | | | | | | | |
| Year Ended | | Class A Front-End
Sales Charges
Retained by
Distributor | | | Class A
Contingent Deferred Sales Charges Retained by Distributor | | | Class B Contingent Deferred Sales Charges Retained by Distributor | | | Class C Contingent Deferred Sales Charges Retained by Distributor | |
December 31, 2014 | | | $686,754 | | | | $133,246 | | | | $75,864 | | | | $59,901 | |
8. Borrowings and Other Financing
Borrowings. The Fund can borrow money from banks in amounts up to one third of its total assets (including the amount borrowed) less all liabilities and indebtedness other than borrowings (meaning that the value of those assets must be at least 300% of the amount borrowed). The Fund can use those borrowings for investment-related purposes such as purchasing portfolio securities. The Fund also may borrow to meet redemption obligations or for temporary and emergency purposes. When the Fund invests borrowed money in portfolio securities, it is using a speculative investment technique known as leverage and changes in the value of the Fund’s investments will have a larger effect on its share price than if it did not borrow because of the effect of leverage.
The Fund can also use the borrowings for other investment-related purposes, including in connection with the Fund’s inverse floater investments as discussed in Note 4. The Fund may use the borrowings to reduce the leverage amount of, or unwind or “collapse” trusts that
62 OPPENHEIMER ROCHESTER FUND MUNICIPALS
8. Borrowings and Other Financing (Continued)
issued “inverse floaters” owned by the Fund, or in circumstances in which the Fund has entered into a shortfall and forbearance agreement with the sponsor of the inverse floater trust to meet the Fund’s obligation to reimburse the sponsor of the inverse floater for the difference between the liquidation value of the underlying bond and the amount due to holders of the short-term floating rate notes issued by the Trust. See the discussion in Note 4 (Inverse Floating Rate Securities) for additional information.
The Fund will pay interest and may pay other fees in connection with loans. If the Fund does borrow, it will be subject to greater expenses than funds that do not borrow. The interest on borrowed money and the other fees incurred in conjunction with loans are an expense that might reduce the Fund’s yield and return. Expenses incurred by the Fund with respect to interest on borrowings and commitment fees are disclosed separately or as other expenses on the Statement of Operations.
The Fund entered into a Revolving Credit and Security Agreement (the “Agreement”) with conduit lenders and Citibank N.A. which enables it to participate with certain other Oppenheimer funds in a committed, secured borrowing facility that permits borrowings of up to $2.5 billion, collectively, by the Oppenheimer Rochester Funds. To secure the loan, the Fund pledges investment securities in accordance with the terms of the Agreement. Securities held in collateralized accounts to cover these borrowings are noted in the Statement of Investments. Interest is charged to the Fund, based on its borrowings, at current commercial paper issuance rates (0.1563% as of December 31, 2014). The Fund pays additional fees annually to its lender on its outstanding borrowings to manage and administer the facility and is allocated its pro-rata share of an annual structuring fee and ongoing commitment fees both of which are based on the total facility size. Total fees and interest that are included in expenses on the Fund’s Statement of Operations related to its participation in the borrowing facility during the year ended December 31, 2014 equal 0.03% of the Fund’s average net assets on an annualized basis. The Fund has the right to prepay such loans and terminate its participation in the conduit loan facility at any time upon prior notice.
As of December 31, 2014, the Fund had borrowings outstanding at an interest rate of 0.1563%. Details of the borrowings for the year ended December 31, 2014 are as follows:
| | | | |
Average Daily Loan Balance | | $ | 11,179,452 | |
Average Daily Interest Rate | | | 0.155 | % |
Fees Paid | | $ | 2,270,489 | |
Interest Paid | | $ | 21,329 | |
Reverse Repurchase Agreements. The Fund may engage in reverse repurchase agreements. A reverse repurchase agreement is the sale of one or more securities to a counterparty at an agreed-upon purchase price with the simultaneous agreement to repurchase those securities on a future date at a higher repurchase price. The repurchase price represents the repayment of the purchase price and interest accrued thereon over the term of the repurchase agreement. The cash received by the Fund in connection with a reverse repurchase agreement may be used for investment-related purposes such as purchasing portfolio securities or for other purposes such as those described in the preceding “Borrowings” note.
63 OPPENHEIMER ROCHESTER FUND MUNICIPALS
NOTES TO FINANCIAL STATEMENTS Continued
8. Borrowings and Other Financing (Continued)
The Fund entered into a Committed Repurchase Transaction Facility (the “Facility”) with J.P. Morgan Securities LLC (the “counterparty’) which enables it to participate with certain other Oppenheimer funds in a committed reverse repurchase agreement facility that permits aggregate outstanding reverse repurchase agreements of up to $750 million, collectively. Interest is charged to the Fund on the purchase price of outstanding reverse repurchase agreements at current LIBOR rates plus an applicable spread. The Fund is also allocated its pro-rata share of an annual structuring fee based on the total Facility size and ongoing commitment fees based on the total unused amount of the Facility. The Fund retains the economic exposure to fluctuations in the value of securities subject to reverse repurchase agreements under the Facility and therefore these transactions are considered secured borrowings for financial reporting purposes. The Fund also continues to receive the economic benefit of interest payments received on securities subject to reverse repurchase agreements, in the form of a direct payment from the counterparty. These payments are included in interest income on the Statement of Operations. Total fees and interest related to the Fund’s participation in the Facility during the year ended December 31, 2014 are included in expenses on the Fund’s Statement of Operations and equal 0.01% of the Fund’s average net assets on an annualized basis.
The securities subject to reverse repurchase agreements under the Facility are valued on a daily basis. To the extent this value, after adjusting for certain margin requirements of the Facility, exceeds the cash proceeds received, the Fund may request the counterparty to return securities equal in margin value to this excess. To the extent that the cash proceeds received exceed the margin value of the securities subject to the transaction, the counterparty may request additional securities from the Fund. The Fund has the right to declare each Wednesday as the repurchase date for any outstanding reverse repurchase agreement upon delivery of advanced notification and may also recall any security subject to such a transaction by substituting eligible securities of equal or greater margin value according to the Facility’s terms.
The Fund executed no transactions under the Facility during the year ended December 31, 2014.
Details of reverse repurchase agreement transactions for the year ended December 31, 2014 are as follows:
9. Pending Litigation
In 2009, seven class action lawsuits were filed in the U.S. District Court for the District of Colorado against OppenheimerFunds, Inc. (“OFI”), OppenheimerFunds Distributor, Inc., the Fund’s principal underwriter and distributor (the “Distributor”), and certain funds – including the Fund – advised by OFI Global Asset Management, Inc. and distributed by the Distributor (the “Defendant Funds”). The lawsuits also named as defendants certain officers and current and former trustees of the respective Defendant Funds. The lawsuits raised claims under federal securities laws and alleged, among other things, that the disclosure documents of the
64 OPPENHEIMER ROCHESTER FUND MUNICIPALS
9. Pending Litigation (Continued)
respective Defendant Funds contained misrepresentations and omissions and that the respective Defendant Funds’ investment policies were not followed. The plaintiffs in these actions sought unspecified damages, equitable relief and awards of attorneys’ fees and litigation expenses. The Defendant Funds’ Boards of Trustees also engaged counsel to represent the Funds and the present and former Independent Trustees named in those suits. In March 2014, the parties – including the Fund – in six of these lawsuits executed stipulations and agreements of settlement resolving those actions. In July 2014, the court entered an order and final judgment approving the settlements as fair, reasonable and adequate. The settlements do not resolve a seventh outstanding lawsuit relating to Oppenheimer Rochester California Municipal Fund (the “California Fund Suit”). OFI believes the California Fund Suit is without legal merit and is defending the suit vigorously. While it is premature to render any opinion as to the outcome in the California Fund Suit, or whether any costs that OFI may bear in defending the California Fund Suit might not be reimbursed by insurance, OFI believes the California Fund Suit should not impair the ability of OFI or the Distributor to perform their respective duties to the Fund, and that the outcome of the California Fund Suit should not have any material effect on the operations of any of the Oppenheimer funds.
65 OPPENHEIMER ROCHESTER FUND MUNICIPALS
REPORT OF INDEPENDENT REGISTERED PUBLIC ACCOUNTING FIRM
The Board of Trustees and Shareholders of Oppenheimer Rochester Fund Municipals:
We have audited the accompanying statement of assets and liabilities of Oppenheimer Rochester Fund Municipals, including the statement of investments, as of December 31, 2014, and the related statement of operations and cash flows for the year then ended, the statements of changes in net assets for each of the years in the two-year period then ended, and the financial highlights for each of the years or periods in the five-year period then ended. These financial statements and financial highlights are the responsibility of the Fund’s management. Our responsibility is to express an opinion on these financial statements and financial highlights based on our audits.
We conducted our audits in accordance with the standards of the Public Company Accounting Oversight Board (United States). Those standards require that we plan and perform the audit to obtain reasonable assurance about whether the financial statements and financial highlights are free of material misstatement. An audit includes examining, on a test basis, evidence supporting the amounts and disclosures in the financial statements. Our procedures included confirmation of securities owned as of December 31, 2014, by correspondence with the custodian, or by other appropriate auditing procedures where replies from brokers were not received. An audit also includes assessing the accounting principles used and significant estimates made by management, as well as evaluating the overall financial statement presentation. We believe that our audits provide a reasonable basis for our opinion.
In our opinion, the financial statements and financial highlights referred to above present fairly, in all material respects, the financial position of Oppenheimer Rochester Fund Municipals as of December 31, 2014, the results of its operations and cash flows for the year then ended, the changes in its net assets for each of the years in the two-year period then ended, and the financial highlights for each of the years or periods in the five-year period then ended, in conformity with U.S. generally accepted accounting principles.
KPMG LLP
Denver, Colorado
February 25, 2015
66 OPPENHEIMER ROCHESTER FUND MUNICIPALS
FEDERAL INCOME TAX INFORMATION Unaudited
In early 2015, if applicable, shareholders of record received information regarding all dividends and distributions paid to them by the Fund during calendar year 2014.
None of the dividends paid by the Fund during the fiscal year ended December 31, 2014 are eligible for the corporate dividend-received deduction. 99.88% of the dividends were derived from interest on municipal bonds and are not subject to federal income taxes; 100% of the dividends are not subject to New York State and New York City income taxes. For the state income tax reporting purposes of non-New York State shareholders, the distribution breaks down as follows: New York State (69.3%), Puerto Rico (29.7%), Guam (0.2%), Virgin Islands (0.1%); Northern Mariana Isles (0.7%).
During 2014, 25.8448% of this tax-exempt income was derived from “private activity bonds”. These are municipal bonds used to finance privately operated facilities. The interest on these bonds is not taxable for most investors. For the few investors subject to the Alternative Minimum Tax, the interest from these bonds is considered a preference item.
The foregoing information is presented to assist shareholders in reporting distributions received from the Fund to the Internal Revenue Service. Because of the complexity of the federal regulations which may affect your individual tax return and the many variations in state and local tax regulations, we recommend that you consult your tax advisor for specific guidance.
67 OPPENHEIMER ROCHESTER FUND MUNICIPALS
BOARD APPROVAL OF THE FUND’S INVESTMENT ADVISORY AND SUB-ADVISORY AGREEMENTS Unaudited
The Fund has entered into an investment advisory agreement with OFI Global Asset Management, Inc. (“OFI Global” or the “Adviser”), a wholly-owned subsidiary of OppenheimerFunds, Inc. (“OFI” or the “Sub-Adviser”) (“OFI Global” and “OFI” together the “Managers”) and OFI Global has entered into a sub-advisory agreement with OFI whereby OFI provides investment sub-advisory services to the Fund (collectively, the “Agreements”). Each year, the Board of Trustees (the “Board”), including a majority of the independent Trustees, is required to determine whether to renew the Agreements. The Investment Company Act of 1940, as amended, requires that the Board request and evaluate, and that the Managers provide, such information as may be reasonably necessary to evaluate the terms of the Agreements. The Board employs an independent consultant to prepare a report that provides information, including comparative information that the Board requests for that purpose. In addition to in-person meetings focused on this evaluation, the Board receives information throughout the year regarding Fund services, fees, expenses and performance.
The Adviser, Sub-Adviser and the independent consultant provided information to the Board on the following factors: (i) the nature, quality and extent of the Managers’ services, (ii) the investment performance of the Fund and the Managers, (iii) the fees and expenses of the Fund, including comparative expense information, (iv) the profitability of the Managers and their affiliates, including an analysis of the cost of providing services, (v) whether economies of scale are realized as the Fund grows and whether fee levels reflect these economies of scale for Fund investors and (vi) other benefits to the Managers from their relationship with the Fund. The Board was aware that there are alternatives to retaining the Managers.
Outlined below is a summary of the principal information considered by the Board as well as the Board’s conclusions.
Nature, Quality and Extent of Services. The Board considered information about the nature, quality and extent of the services provided to the Fund and information regarding the Managers’ key personnel who provide such services. The Sub-Adviser’s duties include providing the Fund with the services of the portfolio managers and the Sub-Adviser’s investment team, who provide research, analysis and other advisory services in regard to the Fund’s investments; securities trading services; oversight of third-party service providers; monitoring compliance with applicable Fund policies and procedures and adherence to the Fund’s investment restrictions; and risk management. The Managers are responsible for providing certain administrative services to the Fund as well. Those services include providing and supervising all administrative and clerical personnel who are necessary in order to provide effective corporate administration for the Fund; compiling and maintaining records with respect to the Fund’s operations; preparing and filing reports required by the Securities and Exchange Commission; preparing periodic reports regarding the operations of the Fund for its shareholders; preparing proxy materials for shareholder meetings; and preparing the registration statements required by Federal and state securities laws for the sale of the Fund’s shares. The Managers also provide the Fund with office space, facilities and equipment.
The Board also considered the quality of the services provided and the quality of the Managers’ resources that are available to the Fund. The Board took account of the fact that the Sub-Adviser has had over fifty years of experience as an investment adviser and that its assets under management rank it among the top mutual fund managers in the United States. The Board evaluated the Sub-Adviser’s advisory, administrative, accounting, legal, compliance
68 OPPENHEIMER ROCHESTER FUND MUNICIPALS
services and risk management, and information the Board has received regarding the experience and professional qualifications of the Managers’ key personnel and the size and functions of its staff. In its evaluation of the quality of the portfolio management services provided, the Board considered the experience of Daniel Loughran, Scott Cottier, Troy Willis, Mark DeMitry, Michael Camarella, Charles Pulire, and Elizabeth Mossow, the portfolio managers for the Fund, and the Sub-Adviser’s investment team and analysts. The Board members also considered the totality of their experiences with the Managers as directors or trustees of the Fund and other funds advised by the Managers. The Board considered information regarding the quality of services provided by affiliates of the Managers, which its members have become knowledgeable about in connection with the renewal of the Fund’s service agreements. The Board concluded, in light of the Managers’ experience, reputation, personnel, operations and resources that the Fund benefits from the services provided under the Agreements.
Investment Performance of the Adviser and the Fund. Throughout the year, the Adviser provided information on the investment performance of the Fund, including comparative performance information. The Board also reviewed information, prepared by the Adviser and by the independent consultant, comparing the Fund’s historical performance to relevant market indices and to the performance of other retail funds in the Muni New York Long category. The Board noted that the Fund’s five-year and ten-year performance was better than its category median although its one-year and three-year performance was below its category median.
Costs of Services by the Adviser. The Board reviewed the fees paid to the Adviser and the other expenses borne by the Fund. The Board also considered the comparability of the fees charged and the services provided to the Fund to the fees and services for other clients or accounts advised by the Adviser. The independent consultant provided comparative data in regard to the fees and expenses of the Fund and other retail front-end load Muni New York Long funds with comparable asset levels and distribution features. The Fund’s contractual management fees and total expenses were lower than its peer group median and category median.
Economies of Scale and Profits Realized by the Managers. The Board considered information regarding OFI Global’s costs in serving as the Fund’s investment adviser, including the costs associated with the personnel and systems necessary to manage the Fund, and information regarding the Managers’ profitability from their relationship with the Fund. The Board reviewed whether the Managers may realize economies of scale in managing and supporting the Fund. The Board noted that the Fund currently has management fee breakpoints, which are intended to share with Fund shareholders economies of scale that may exist as the Fund’s assets grow.
Other Benefits to the Managers. In addition to considering the profits realized by the Managers, the Board considered information that was provided regarding the direct and indirect benefits the Managers receive as a result of their relationship with the Fund, including compensation paid to the Managers’ affiliates. The Board also considered that the Managers must be able to pay and retain experienced professional personnel at competitive rates to provide quality services to the Fund.
69 OPPENHEIMER ROCHESTER FUND MUNICIPALS
BOARD APPROVAL OF THE FUND’S INVESTMENT ADVISORY AND SUB-ADVISORY
AGREEMENTS Unaudited / Continued
Conclusions. These factors were also considered by the independent Trustees meeting separately from the full Board, assisted by experienced counsel to the Fund and to the independent Trustees. Fund counsel and the independent Trustees’ counsel are independent of the Managers within the meaning and intent of the Securities and Exchange Commission Rules.
Based on its review of the information it received and its evaluations described above, the Board, including a majority of the independent Trustees, decided to continue the Agreements through September 30, 2015. In arriving at its decision, the Board did not identify any factor or factors as being more important than others, but considered all of the above information, and considered the terms and conditions of the Agreements, including the management fees, in light of all the surrounding circumstances.
70 OPPENHEIMER ROCHESTER FUND MUNICIPALS
PORTFOLIO PROXY VOTING POLICIES AND PROCEDURES; UPDATES TO STATEMENTS OF
INVESTMENTS Unaudited
The Fund has adopted Portfolio Proxy Voting Policies and Procedures under which the Fund votes proxies relating to securities (“portfolio proxies”) held by the Fund. A description of the Fund’s Portfolio Proxy Voting Policies and Procedures is available (i) without charge, upon request, by calling the Fund toll-free at 1.800.CALL OPP (225.5677), (ii) on the Fund’s website at www.oppenheimerfunds.com, and (iii) on the SEC’s website at www.sec.gov. In addition, the Fund is required to file Form N-PX, with its complete proxy voting record for the 12 months ended June 30th, no later than August 31st of each year. The Fund’s voting record is available (i) without charge, upon request, by calling the Fund toll-free at 1.800.CALL OPP (225.5677), and (ii) in the Form N-PX filing on the SEC’s website at www.sec.gov.
The Fund files its complete schedule of portfolio holdings with the SEC for the first quarter and the third quarter of each fiscal year on Form N-Q. The Fund’s Form N-Q filings are available on the SEC’s website at www.sec.gov. Those forms may be reviewed and copied at the SEC’s Public Reference Room in Washington, D.C. Information on the operation of the Public Reference Room may be obtained by calling 1-800-SEC-0330.
Householding—Delivery of Shareholder Documents
This is to inform you about OppenheimerFunds’ “householding” policy. If more than one member of your household maintains an account in a particular fund, OppenheimerFunds will mail only one copy of the fund’s prospectus (or, if available, the fund’s summary prospectus), annual and semiannual report and privacy policy. The consolidation of these mailings, called householding, benefits your fund through reduced mailing expense, and benefits you by reducing the volume of mail you receive from OppenheimerFunds. Householding does not affect the delivery of your account statements.
Please note that we will continue to household these mailings for as long as you remain an OppenheimerFunds shareholder, unless you request otherwise. If you prefer to receive multiple copies of these materials, please call us at 1.800.CALL-OPP (225-5677). You may also notify us in writing or via email. We will begin sending you individual copies of the prospectus (or, if available, the summary prospectus), reports and privacy policy within 30 days of receiving your request to stop householding.
71 OPPENHEIMER ROCHESTER FUND MUNICIPALS
TRUSTEES AND OFFICERS Unaudited
| | |
| |
Name, Position(s) Held with the Fund, Length of Service, Year of Birth | | Principal Occupation(s) During the Past 5 Years; Other Trusteeships/Directorships Held; Number of Portfolios in the Fund Complex Currently Overseen |
| |
| INDEPENDENT TRUSTEES | | The address of each Trustee in the chart below is 6803 S. Tucson Way, Centennial, Colorado 80112-3924. Each Trustee serves for an indefinite term, or until his or her resignation, retirement, death or removal. |
| |
Brian F. Wruble, Chairman of the Board of Trustees (since 2007), Trustee (since 2001) Year of Birth: 1943 | | Director and Vice Chairman of Community Foundation of the Florida Keys (non-profit) (since July 2012); Trustee of the Board of Trustees, The Jackson Laboratory (non-profit) (1991-2011 and since May 2014); Chairman Emeritus (since August 2011) of The Jackson Laboratory (non-profit); Director of Special Value Opportunities Fund, LLC (registered investment company) (affiliate of the Sub-Adviser’s parent company) (since September 2004); Member of Zurich Insurance Group’s Investment Management Advisory Council (insurance) (since 2004); Treasurer (since 2007) and Trustee of the Institute for Advanced Study (non-profit educational institute) (since May 1992); General Partner of Odyssey Partners, L.P. (hedge fund) (September 1995-December 2007); Special Limited Partner of Odyssey Investment Partners, LLC (private equity investment) (January 1999-September 2004). Oversees 53 portfolios in the OppenheimerFunds complex. Mr. Wruble has served on the Boards of certain Oppenheimer funds since April 2001, during which time he has become familiar with the Fund’s (and other Oppenheimer funds’) financial, accounting, regulatory and investment matters and has contributed to the Boards’ deliberations. |
| |
David K. Downes, Trustee (since 2005) Year of Birth: 1940 | | Director of THL Credit Inc. (since June 2009); Chief Executive Officer and Board Member of Community Capital Management (investment management company) (since January 2004); President of The Community Reinvestment Act Qualified Investment Fund (investment management company) (since 2004); Director of Actua Corporation (information technology company) (since October 2003); formerly, Independent Chairman GSK Employee Benefit Trust (April 2006-June 2013); Director of Correctnet (January 2006-2007); Independent Chairman of the Board of Trustees of Quaker Investment Trust (registered investment company) (2004-2007); Chief Operating Officer and Chief Financial Officer of Lincoln National Investment Companies, Inc. (subsidiary of Lincoln National Corporation, a publicly traded company) and Delaware Investments U.S., Inc. (investment management subsidiary of Lincoln National Corporation) (1993-2003); President, Chief Executive Officer and Trustee of Delaware Investment Family of Funds (1993-2003); President and Board Member of Lincoln National Convertible Securities Funds, Inc. and the Lincoln National Income Funds, TDC (1993-2003); Chairman and Chief Executive Officer of Retirement Financial Services, Inc. (registered transfer agent and investment adviser and subsidiary of Delaware Investments U.S., Inc.) (1993-2003); President and Chief Executive Officer of Delaware Service Company, Inc. (1995-2003); Chief Administrative Officer, Chief Financial Officer, Vice Chairman and Director of Equitable Capital Management Corporation (investment subsidiary of Equitable Life Assurance Society) (1985-1992); Corporate Controller of Merrill Lynch Company (financial services holding company) (1977-1985); held the following positions at the Colonial Penn Group, Inc. (insurance company): Corporate Budget Director (1974-1977), Assistant Treasurer (1972-1974) and Director of Corporate Taxes (1969-1972); held the following positions at Price Waterhouse |
72 OPPENHEIMER ROCHESTER FUND MUNICIPALS
| | |
David K. Downes, Continued | | Company (financial services firm): Tax Manager (1967-1969), Tax Senior (1965-1967) and Staff Accountant (1963-1965); United States Marine Corps (1957-1959). Oversees 53 portfolios in the OppenheimerFunds complex. Mr. Downes has served on the Boards of certain Oppenheimer funds since December 2005, during which time he has become familiar with the Fund’s (and other Oppenheimer funds’) financial, accounting, regulatory and investment matters and has contributed to the Boards’ deliberations. |
| |
Matthew P. Fink, Trustee (since 2009) Year of Birth: 1941 | | Trustee of the Committee for Economic Development (policy research foundation) (2005-2011); Director of ICI Education Foundation (education foundation) (October 1991-August 2006); President of the Investment Company Institute (trade association) (October 1991-June 2004); Director of ICI Mutual Insurance Company (insurance company) (October 1991-June 2004); Author of The Rise of Mutual Funds: An Insider’s View published by Oxford University Press (second edition 2010). Oversees 53 portfolios in the OppenheimerFunds complex. Mr. Fink has served on the Boards of certain Oppenheimer funds since January 2005, during which time he has become familiar with the Fund’s (and other Oppenheimer funds’) financial, accounting, regulatory and investment matters and has contributed to the Boards’ deliberations. |
| |
Edmund P. Giambastiani, Jr., Trustee (since 2013) Year of Birth: 1948 | | Advisory Board Member of the Maxwell School of Citizenship and Public Affairs of Syracuse University (since April 2012); Director of Mercury Defense Systems Inc. (information technology) (August 2011-February 2013); Trustee of the U.S. Naval Academy Foundation (since November 2010); Advisory Board Member of the Massachusetts Institute of Technology Lincoln Laboratory (federally-funded research development center) (since May 2010); Director of The Boeing Company (aerospace and defense) (since October 2009); Trustee of MITRE Corporation (federally-funded research development center) (since September 2008); Independent Director of QinetiQ Group Plc (defense technology and security) (February 2008-August 2011); Director of Monster Worldwide, Inc. (on-line career services) (since January 2008, Lead Director since June 2011); Chairman of Alenia North America, Inc. (military and defense products) (January 2008-October 2009); Director of SRA International, Inc. (information technology and services) (January 2008-July 2011); President of Giambastiani Group LLC (national security and energy consulting) (since October 2007); United States Navy, career nuclear submarine officer (June 1970-October 2007), Vice Chairman of the Joint Chiefs of Staff (2005-October 2007), Supreme Allied Commander of NATO Commander Transformation (2003-2005), Commander, U.S. Joint Forces Command (2002-2005). Since his retirement from the U.S. Navy in October 2007, Admiral Giambastiani has also served on numerous U.S. Government advisory boards, investigations and task forces for the Secretaries of Defense, State and Interior and the Central Intelligence Agency. Oversees 53 portfolios in the OppenheimerFunds complex. Admiral Giambastiani has served on the Boards of certain Oppenheimer funds since February 2013, including as an Advisory Board Member for certain Oppenheimer funds, during which time he has become familiar with the Fund’s (and other Oppenheimer funds’) financial, accounting, regulatory and investment matters and has contributed to the Boards’ deliberations. For purposes of this report, Admiral Giambastiani is identified as a Trustee. |
73 OPPENHEIMER ROCHESTER FUND MUNICIPALS
TRUSTEES AND OFFICERS Unaudited / Continued
| | |
Elizabeth Krentzman, Trustee (since 2014) Year of Birth: 1959 | | Advisory Board Member of the Securities and Exchange Commission Historical Society (since 2007); held the following positions at Deloitte & Touche LLP: Principal and Chief Regulatory Advisor for Asset Management Services (2007 - 2014) and U.S. Mutual Fund Leader (2011 - 2014); General Counsel of the Investment Company Institute (trade association) (June 2004 - April 2007); held the following positions at Deloitte & Touche LLP: National Director of the Investment Management Regulatory Consulting Practice (1997 - 2004), Principal
(2003 - 2004), Director (1998 - 2003) and Senior Manager (1997 - 1998); Assistant Director of the Division of Investment Management – Office of Disclosure and Investment Adviser Regulation (1996 - 1997) and various positions with the Division of Investment Management – Office of Regulatory Policy (1991 - 1996) of the U.S. Securities and Exchange Commission; Associate at Ropes & Gray (1987 - 1991); former Chair of the Investment Management Subcommittee of the Washington, D.C. Bar. Oversees 53 portfolios in the OppenheimerFunds complex. Ms. Krentzman has served on the Boards of certain Oppenheimer funds since August 2014, during which time she has become familiar with the Fund’s (and other Oppenheimer funds’) financial, accounting, regulatory and investment matters and has contributed to the Boards’ deliberations. |
| |
Mary F. Miller, Trustee (since 2009) Year of Birth: 1942 | | Trustee of International House (not-for-profit) (since June 2007); Trustee of the American Symphony Orchestra (not-for-profit) (October 1998-November 2011); and Senior Vice President and General Auditor of American Express Company (financial services company) (July 1998-February 2003). Oversees 53 portfolios in the OppenheimerFunds complex. Ms. Miller has served on the Boards of certain Oppenheimer funds since August 2004, during which time she has become familiar with the Fund’s (and other Oppenheimer funds’) financial, accounting, regulatory and investment matters and has contributed to the Boards’ deliberations. |
| |
Joel W. Motley, Trustee (since 2009) Year of Birth: 1952 | | Director of Greenwall Foundation (since October 2013); Member of the Vestry of Trinity Wall Street (since April 2012); Director of Southern Africa Legal Services Foundation (since March 2012); Board Member of Pulitzer Center for Crisis Reporting (non-profit journalism) (since March 2011); Managing Director of Public Capital Advisors, LLC (privately-held financial advisor) (since January 2006); Managing Director of Carmona Motley, Inc. (privately-held financial advisor) (since January 2002); Director of Columbia Equity Financial Corp. (privately-held financial advisor) (2002-2007); Managing Director of Carmona Motley Hoffman Inc. (privately-held financial advisor) (January 1998-December 2001); Member of the Finance and Budget Committee of the Council on Foreign Relations, Member of the Investment Committee and Board of Human Rights Watch (since July 2000) and Member of the Investment Committee and Board of Historic Hudson Valley (since February 2010). Oversees 53 portfolios in the OppenheimerFunds complex. Mr. Motley has served on the Boards of certain Oppenheimer funds since October 2002, during which time he has become familiar with the Fund’s (and other Oppenheimer funds’) financial, accounting, regulatory and investment matters and has contributed to the Boards’ deliberations. |
| |
Joanne Pace, Trustee/Advisory Board Member (since 2012) Year of Birth: 1958 | | Board Director of Horizon Blue Cross Blue Shield of New Jersey (since November 2012); Advisory Board Director of The Alberleen Group LLC (since March, 2012); Advisory Council Member of 100 Women in Hedge Funds (non-profit) (since December, 2012); Advisory Council Member of Morgan |
74 OPPENHEIMER ROCHESTER FUND MUNICIPALS
| | |
Joanne Pace, Continued | | Stanley Children’s Hospital (non-profit) (since May, 2012); Board Director of The Komera Project (non-profit) (since April, 2012); Advisory Board Director of The Agile Trading Group LLC (2012-2013); New York Advisory Board Director of Peace First (non-profit) (2010-2013); Senior Advisor of SECOR Asset Management, LP (2010-2011); Managing Director and Chief Operating Officer of Morgan Stanley Investment Management (2006-2010); Partner and Chief Operating Officer of FrontPoint Partners, LLC (hedge fund) (2005-2006); held the following positions at Credit Suisse: Managing Director (2003-2005); Global Head of Human Resources and member of Executive Board and Operating Committee (2004-2005), Global Head of Operations and Product Control (2003-2004); held the following positions at Morgan Stanley: Managing Director (1997-2003), Controller and Principal Accounting Officer (1999-2003); Chief Financial Officer (temporary assignment) for the Oversight Committee, Long Term Capital Management (1998-1999). Lead Independent Director and Chair of the Audit and Nominating Committee of The Global Chartist Fund, LLC of Oppenheimer Asset Management (2011-2012); Board Director of Managed Funds Association (2008-2010); Board Director of Morgan Stanley Foundation (2007-2010) and Investment Committee Chair (2008-2010). Oversees 53 portfolios in the OppenheimerFunds complex. Ms. Pace has served on the Boards of certain Oppenheimer funds since November 2012, including as an Advisory Board Member for certain Oppenheimer funds, during which time she has become familiar with the Fund’s (and other Oppenheimer funds’) financial, accounting, regulatory and investment matters and has contributed to the Board’s deliberations. For purposes of this report, Ms. Pace is identified as a Trustee. |
| |
Daniel Vandivort, Trustee (since 2014) Year of Birth: 1954 | | Chairman and Lead Independent Director/Trustee (March 2010-September 2014), Chairman of the Audit Committee (March 2009-September 2014) and Director/Trustee (December 2008-September 2014) of the Board of Directors/Trustees of Value Line Funds; Trustee, Board of Trustees of Huntington Disease Foundation of America (June 2007-December 2013): Trustee, Board of Trustees, RIM Retirement Savings Plan (2005-2007); President and Chief Investment Officer, Robeco Investment Management, formerly known as Weiss Peck and Greer (January 2005-June 2007); Member, Management Committee of Robeco Investment Management (2001-2007); Chairman and Trustee of the Board of Trustees of Weiss, Peck and Greer Funds (2004-2005); Managing Director and Head of Fixed Income, Weiss, Peck and Greer (November 1994-January 2005); Managing Director and Head of Fixed Income, CS First Boston Investment Management (January 1992-November 1994); Director, Global Product Development, First Boston Asset Management (November 1989-January 1992); Vice President, Fixed Income Sales, First Boston Corp. (May 1984-November 1989). Oversees 53 portfolios in the OppenheimerFunds complex. Mr. Vandivort has served on the Boards of certain Oppenheimer funds since 2014, during which time he has become familiar with the Fund’s (and other Oppenheimer funds’) financial, accounting, regulatory and investment matters and has contributed to the Boards’ deliberations. |
| |
Peter I. Wold, Trustee (since 2009) Year of Birth: 1948 | | President of Wold Energy Partners, LLC (oil and gas exploration and production) (since 2013); Director of Arch Coal, Inc. (since 2010); President of Wold Oil Properties, LLC (oil and gas exploration and production company) (since 1994); Vice President of American Talc Company, Inc. (talc mining and |
75 OPPENHEIMER ROCHESTER FUND MUNICIPALS
TRUSTEES AND OFFICERS Unaudited / Continued
| | |
| |
Peter I. Wold, Continued | | milling) (since 1999); Managing Member of Hole-in-the-Wall Ranch (cattle ranching) (since 1979); Director and Chairman of Wyoming Enhanced Oil Recovery Institute Commission (enhanced oil recovery study) (2004-2012); Director and Chairman of the Denver Branch of the Federal Reserve Bank of Kansas City (1993-1999); and Director of PacifiCorp. (electric utility) (1995-1999). Oversees 53 portfolios in the OppenheimerFunds complex. Mr. Wold has served on the Boards of certain Oppenheimer funds since August 2005, during which time he has become familiar with the Fund’s (and other Oppenheimer funds’) financial, accounting, regulatory and investment matters and has contributed to the Boards’ deliberations. |
| | |
| INTERESTED TRUSTEE | | Mr. Glavin is an “Interested Trustee” because he is affiliated with the Manager and the Sub-Adviser by virtue of his positions as director of the Sub-Adviser, and as a shareholder of the Sub-Adviser’s parent company. As a Trustee, he serves for an indefinite term, or until his resignation, retirement, death or removal. Mr. Glavin’s address is 225 Liberty Street, 11th Floor, New York, New York 10281-1008. |
| |
William F. Glavin, Jr., Trustee (since 2009) Year of Birth: 1958 | | Chairman of the Sub-Adviser (July 2014-December 2014 and December 2009-December 2012) and Director of the Sub-Adviser (since January 2009); Chairman, Director and Chief Executive Officer (January 2013-June 2014) of the Manager; President of the Manager (January 2013-May 2013); Chief Executive Officer (January 2009-December 2012); President of the Sub-Adviser (May 2009-December 2012); Management Director (June 2009-June 2014), President (December 2009-June 2014) and Chief Executive Officer (January 2011-June 2014) of Oppenheimer Acquisition Corp. (“OAC”) (the Sub-Adviser’s parent holding company); Director of Oppenheimer Real Asset Management, Inc. (March 2010-June 2014); Executive Vice President (March 2006-February 2009) and Chief Operating Officer (July 2007-February 2009) of Massachusetts Mutual Life Insurance Company (OAC’s parent company); Director (May 2004-March 2006) and Chief Operating Officer and Chief Compliance Officer (May 2004-January 2005), President (January 2005-March 2006) and Chief Executive Officer (June 2005-March 2006) of Babson Capital Management LLC; Director (March 2005-March 2006), President (May 2003-March 2006) and Chief Compliance Officer (July 2005-March 2006) of Babson Capital Securities, Inc. (a broker-dealer); President (May 2003-March 2006) of Babson Investment Company, Inc.; Director (May 2004-August 2006) of Babson Capital Europe Limited; Director (May 2004-October 2006) of Babson Capital Guernsey Limited; Director (May 2004-March 2006) of Babson Capital Management LLC; Non-Executive Director (March 2005-March 2007) of Baring Asset Management Limited; Director (February 2005-June 2006) Baring Pension Trustees Limited; Director and Treasurer (December 2003-November 2006) of Charter Oak Capital Management, Inc.; Director (May 2006-September 2006) of C.M. Benefit Insurance Company; Director (May 2008-June 2009) and Executive Vice President (June 2007-July 2009) of C.M. Life Insurance Company; President (March 2006-May 2007) of MassMutual Assignment Company; Director (January 2005-December 2006), Deputy Chairman (March 2005-December 2006) and President (February 2005-March 2005) of MassMutual Holdings (Bermuda) Limited; Director (May 2008-June 2009) and Executive Vice President (June 2007-July 2009) of MML Bay State Life Insurance Company; Chief Executive Officer and President (April 2007-January 2009) of MML |
76 OPPENHEIMER ROCHESTER FUND MUNICIPALS
| | |
William F. Glavin, Jr., Continued | | Distributors, LLC; and Chairman (March 2006-December 2008) and Chief Executive Officer (May 2007-December 2008) of MML Investors Services, Inc. An officer of 91 portfolios in the OppenheimerFunds complex. Mr. Glavin has served on the Boards of certain Oppenheimer funds since December 2009, during which time he has become familiar with the Fund’s (and other Oppenheimer funds’) financial, accounting, regulatory and investment matters and has contributed to the Boards’ deliberations. |
| | |
| OTHER OFFICERS OF THE FUND | | The addresses of the Officers in the chart below are as follows: for Messrs. Loughran, Cottier, Willis, DeMitry, Camarella, Pulire, Stein, Steinmetz, Gabinet, Mss. Sexton and Picciotto, 225 Liberty Street, New York, New York 10281-1008, for Mr. Wixted, 6803 S. Tucson Way, Centennial, Colorado 80112-3924. Each Officer serves for an indefinite term or until his or her resignation, retirement, death or removal. |
| |
Daniel G. Loughran, Vice President (since 2005) Year of Birth: 1963 | | Senior Vice President of the Sub-Adviser (since July 2007) and a Senior Portfolio Manager (since December 2001); Vice President of the Sub-Adviser (April 2001-June 2007) and a Portfolio Manager with the Sub-Adviser (December 1999- November 2001). Team Leader, a Senior Portfolio Manager, an officer and a trader for the Fund and other Oppenheimer funds. |
| |
Scott S. Cottier, Vice President (since 2005) Year of Birth: 1971 | | Vice President of the Sub-Adviser and a Senior Portfolio Manager (since September 2002). Portfolio Manager and trader at Victory Capital Management (1999-2002). Senior Portfolio Manager, an officer and a trader for the Fund and other Oppenheimer funds. |
| |
Troy E. Willis, Vice President (since 2005) Year of Birth: 1972 | | Vice President of the Sub-Adviser (since July 2009) and a Senior Portfolio Manager (since January 2006); Assistant Vice President of the Sub-Adviser (July 2005-June 2009). Portfolio Manager of the Sub-Adviser (June 2003-December 2005). Corporate Attorney for Southern Resource Group (June 1999-December 2003). Senior Portfolio Manager, an officer and a trader for the Fund and other Oppenheimer funds. |
| |
Mark R. DeMitry Vice President (since 2009) Year of Birth: 1976 | | Vice President of the Sub-Adviser and a Senior Portfolio Manager (since July 2009); Associate Portfolio Manager of the Fund (September 2006- June 2009). Research Analyst of the Sub-Adviser (June 2003-September 2006) and a Credit Analyst of the Sub-Adviser (July 2001-May 2003). Senior Portfolio Manager, an officer and a trader for the Fund and other Oppenheimer funds. |
| |
Michael L. Camarella Vice President (since 2009) Year of Birth: 1976 | | Vice President of the Sub-Adviser and a Senior Portfolio Manager (since January 2011); Assistant Vice President of the Sub-Adviser (July 2009-December 2010); Associate Portfolio Manager of the Sub-Adviser (January 2008-December 2010). Research Analyst of the Sub-Adviser (April 2006-December 2007) and a Credit Analyst of the Sub-Adviser (June 2003-March 2006). Senior Portfolio Manager, an officer and a trader for the Fund and other Oppenheimer funds. |
77 OPPENHEIMER ROCHESTER FUND MUNICIPALS
TRUSTEES AND OFFICERS Unaudited / Continued
| | |
Charles S. Pulire, Vice President (since 2011) Year of Birth: 1977 | | Vice President of the Sub-Adviser and a Senior Portfolio Manager (since February 2013); Assistant Vice President of the Sub-Adviser (December 2010-January 2013); Research Analyst of the Manager (February 2008-November 2010); Credit Analyst of the Sub-Adviser (May 2006-January 2008). Senior Portfolio Manager, an officer and a trader for the Fund and other Oppenheimer funds. |
| |
Richard Stein Vice President (since 2007) Year of Birth: 1957 | | Director of the Rochester Credit Analysis team (since March 2004); Senior Vice President of the Sub-Adviser (since June 2011) and a Vice President of the Sub-Adviser (November 1997-May 2011); heads up the Rochester Credit Analysis team (since May 1993). |
| |
Arthur P. Steinmetz, President and Principal Executive Officer (since 2014) Year of Birth: 1958 | | Chairman of the Sub-Adviser (since January 2015); CEO and Chairman of the Manager (since July 2014), President of the Manager (since May 2013), a Director of the Manager (since January 2013), Director of the Sub-Adviser (since July 2014), President, Management Director and CEO of Oppenheimer Acquisition Corp. (the Sub-Adviser’s parent holding company) (since July 2014), and President and Director of OFI SteelPath, Inc. (since January 2013). Chief Investment Officer of the OppenheimerFunds advisory entities from (January 2013-December 2013); Executive Vice President of the Manager (January 2013-May 2013); Chief Investment Officer of the Sub-Adviser (October 2010-December 2012); Chief Investment Officer, Fixed-Income, of the Sub-Adviser (April 2009-October 2010); Executive Vice President of the Sub-Adviser (October 2009-December 2012); Director of Fixed Income of the Sub-Adviser (January 2009-April 2009); and a Senior Vice President of the Sub-Adviser (March 1993-September 2009). An officer of 91 portfolios in the OppenheimerFunds complex. |
| |
Arthur S. Gabinet, Secretary and Chief Legal Officer (since 2011) Year of Birth: 1958 | | Executive Vice President, Secretary and General Counsel of the Manager (since January 2013); General Counsel OFI SteelPath, Inc. (since January 2013); Executive Vice President (May 2010-December 2012) and General Counsel (since January 2011) of the Sub-Adviser; General Counsel of the Distributor (since January 2011); General Counsel of Centennial Asset Management Corporation (January 2011-December 2012); Executive Vice President (January 2011-December 2012) and General Counsel of HarbourView Asset Management Corporation (since January 2011); Assistant Secretary (since January 2011) and Director (since January 2011) of OppenheimerFunds International Ltd. and OppenheimerFunds plc; Director of Oppenheimer Real Asset Management, Inc. (January 2011-December 2012) and General Counsel (since January 2011); Executive Vice President (January 2011-December 2011) and General Counsel of Shareholder Financial Services, Inc. and Shareholder Services, Inc. (since January 2011); Executive Vice President (January 2011-December 2012) and General Counsel of OFI Private Investments Inc. (since January 2011); Vice President of OppenheimerFunds Legacy Program (January 2011-December 2011); Executive Vice President (January 2011-December 2012) and General Counsel of OFI Institutional Asset Management, Inc. (since January 2011); General Counsel, Asset Management of the Sub-Adviser (May 2010-December 2010); Principal, The Vanguard Group (November 2005-April 2010); District Administrator, U.S. Securities and Exchange Commission (January 2003-October 2005). An officer of 91 portfolios in the OppenheimerFunds complex. |
78 OPPENHEIMER ROCHESTER FUND MUNICIPALS
| | |
Jennifer Sexton, Vice President and Chief Business Officer (since 2014) Year of Birth: 1969 | | Senior Vice President of OppenheimerFunds Distributor, Inc. (since June 2014); Vice President of OppenheimerFunds Distributor, Inc. (April 2006-June 2014); Vice President of the Sub-Adviser (January 1998-March 2006); Assistant Vice President of the Sub-Adviser (October 1991-December 1998). An officer of 91 portfolios in the OppenheimerFunds complex. |
| |
Mary Ann Picciotto, Chief Compliance Officer and Chief Anti-Money Laundering Officer (since 2014) Year of Birth: 1973 | | Senior Vice President and Chief Compliance Officer of the Manager (since March 2014); Chief Compliance Officer of the Sub-Adviser, OFI SteelPath, Inc., OFI Global Trust Company, OFI Global Institutional, Inc., Oppenheimer Real Asset Management, Inc., OFI Private Investments, Inc., Harborview Asset Management Corporation, Trinity Investment Management Corporation, and Shareholder Services, Inc. (since March 2014); Managing Director of Morgan Stanley Investment Management Inc. and certain of its various affiliated entities; Chief Compliance Officer of various Morgan Stanley Funds (May 2010-January 2014); Chief Compliance Officer of Morgan Stanley Investment Management Inc. (April 2007-January 2014). An officer of 91 portfolios in the OppenheimerFunds complex. |
| |
Brian W. Wixted, Treasurer and Principal Financial & Accounting Officer (since 1999) Year of Birth: 1959 | | Senior Vice President of the Manager (since January 2013); Treasurer of the Sub-Adviser, HarbourView Asset Management Corporation, Shareholder Financial Services, Inc., Shareholder Services, Inc., and Oppenheimer Real Asset Management, Inc. (March 1999-June 2008), OFI Private Investments, Inc. (March 2000-June 2008), OppenheimerFunds International Ltd. and OppenheimerFunds plc (since May 2000), OFI Institutional Asset Management, Inc. (November 2000-June 2008), and OppenheimerFunds Legacy Program (charitable trust program established by the Sub-Adviser) (June 2003-December 2011); Treasurer and Chief Financial Officer of OFI Trust Company (since May 2000); Assistant Treasurer of Oppenheimer Acquisition Corporation (March 1999-June 2008). An officer of 91 portfolios in the OppenheimerFunds complex. |
The Fund’s Statement of Additional Information contains additional information about the Fund’s Trustees and Officers and is available without charge upon request, by calling 1.800.CALL OPP (225.5677).
79 OPPENHEIMER ROCHESTER FUND MUNICIPALS
OPPENHEIMER ROCHESTER FUND MUNICIPALS
| | |
Manager | | OFI Global Asset Management, Inc. |
| |
Sub-Adviser | | OppenheimerFunds, Inc. |
| |
Distributor | | OppenheimerFunds Distributor, Inc. |
| |
Transfer and Shareholder | | OFI Global Asset Management, Inc. |
Servicing Agent | | |
| |
Sub-Transfer Agent | | Shareholder Services, Inc. DBA OppenheimerFunds Services |
| |
Independent Registered | | KPMG LLP |
Public Accounting Firm | | |
| |
Legal Counsel | | Kramer Levin Naftalis & Frankel LLP |
© 2015 OppenheimerFunds, Inc. All rights reserved.
80 OPPENHEIMER ROCHESTER FUND MUNICIPALS
As an Oppenheimer fund shareholder, you are entitled to know how we protect your personal information and how we limit its disclosure.
Information Sources
We obtain nonpublic personal information about our shareholders from the following sources:
| • | | Applications or other forms |
| • | | When you create a user ID and password for online account access |
| • | | When you enroll in eDocs Direct, our electronic document delivery service |
| • | | Your transactions with us, our affiliates or others |
| • | | A software program on our website, often referred to as a “cookie,” which indicates which parts of our site you’ve visited |
| • | | When you set up challenge questions to reset your password online |
If you visit oppenheimerfunds.com and do not log on to the secure account information areas, we do not obtain any personal information about you. When you do log on to a secure area, we do obtain your user ID and password to identify you. We also use this information to provide you with products and services you have requested, to inform you about products and services that you may be interested in and assist you in other ways.
We do not collect personal information through our website unless you willingly provide it to us, either directly by email or in those areas of the website that request information. In order to update your personal information (including your mailing address, email address and phone number) you must first log on and visit your user profile.
If you have set your browser to warn you before accepting cookies, you will receive the warning message with each cookie. You can refuse cookies by turning them off in your browser. However, doing so may limit your access to certain sections of our website.
We use cookies to help us improve and manage our website. For example, cookies help us recognize new versus repeat visitors to the site, track the pages visited, and enable some special features on the website. This data helps us provide a better service for our website visitors.
Protection of Information
We do not disclose any non-public personal information (such as names on a customer list) about current or former customers to anyone, except as permitted by law.
Disclosure of Information
Copies of confirmations, account statements and other documents reporting activity in your fund accounts are made available to your financial advisor (as designated by you). We may also use details about you and your investments to help us, our financial service affiliates, or firms that jointly market their financial products and services with ours, to better serve your investment needs or suggest financial services or educational material that may be of interest to you. If this requires us to provide you with an opportunity to “opt in” or “opt out” of such information sharing with a firm not affiliated with us, you will receive notification on how to do so, before any such sharing takes place.
Right of Refusal
We will not disclose your personal information to unaffiliated third parties (except as permitted by law), unless we first offer you a reasonable opportunity to refuse or “opt out” of such disclosure.
81 OPPENHEIMER ROCHESTER FUND MUNICIPALS
| | |
| PRIVACY POLICY NOTICE Continued |
Internet Security and Encryption
In general, the email services provided by our website are encrypted and provide a secure and private means of communication with us. To protect your own privacy, confidential and/or personal information should only be communicated via email when you are advised that you are using a secure website. As a security measure, we do not include personal or account information in non-secure emails, and we advise you not to send such information to us in non-secure emails. Instead, you may take advantage of the secure features of our website to encrypt your email correspondence. To do this, you will need to use a browser that supports Secure Sockets Layer (SSL) protocol.
We do not guarantee or warrant that any part of our website, including files available for download, are free of viruses or other harmful code. It is your responsibility to take appropriate precautions, such as use of an anti-virus software package, to protect your computer hardware and software.
| • | | All transactions, including redemptions, exchanges and purchases, are secured by SSL and 128-bit encryption. SSL is used to establish a secure connection between your PC and OppenheimerFunds’ server. It transmits information in an encrypted and scrambled format. |
| • | | Encryption is achieved through an electronic scrambling technology that uses a “key” to code and then decode the data. Encryption acts like the cable converter box you may have on your television set. It scrambles data with a secret code so that no one can make sense of it while it is being transmitted. When the data reaches its destination, the same software unscrambles the data. |
| • | | You can exit the secure area by either closing your browser, or for added security, you can use the Log Out button before you close your browser. |
Other Security Measures
We maintain physical, electronic and procedural safeguards to protect your personal account information. Our employees and agents have access to that information only so that they may offer you products or provide services, for example, when responding to your account questions.
How You Can Help
You can also do your part to keep your account information private and to prevent unauthorized transactions. If you obtain a user ID and password for your account, do not allow it to be used by anyone else. Also, take special precautions when accessing your account on a computer used by others.
Who We Are
This joint notice describes the privacy policies of the Oppenheimer funds, OppenheimerFunds, Inc., each of its investment adviser subsidiaries, OppenheimerFunds Distributor, Inc. and OFI Global Trust Co. It applies to all Oppenheimer fund accounts you presently have, or may open in the future, using your Social Security number—whether or not you remain a shareholder of our funds. This notice was last updated November 2014. In the event it is updated or changed, we will post an updated notice on our website at oppenheimerfunds.com. If you have any questions about this privacy policy, write to us at P.O. Box 5270, Denver, CO 80217-5270, email us by clicking on the Contact Us section of our website at oppenheimerfunds.com or call us at 1.800.CALL OPP (225.5677).
82 OPPENHEIMER ROCHESTER FUND MUNICIPALS
THIS PAGE INTENTIONALLY LEFT BLANK.
83 OPPENHEIMER ROCHESTER FUND MUNICIPALS
THIS PAGE INTENTIONALLY LEFT BLANK.
84 OPPENHEIMER ROCHESTER FUND MUNICIPALS
THIS PAGE INTENTIONALLY LEFT BLANK.
85 OPPENHEIMER ROCHESTER FUND MUNICIPALS
THIS PAGE INTENTIONALLY LEFT BLANK.
86 OPPENHEIMER ROCHESTER FUND MUNICIPALS
THIS PAGE INTENTIONALLY LEFT BLANK.
87 OPPENHEIMER ROCHESTER FUND MUNICIPALS

The registrant has adopted a code of ethics that applies to the registrant’s principal executive officer, principal financial officer, principal accounting officer or controller or persons performing similar functions.
| Item 3. | Audit Committee Financial Expert. |
The Board of Trustees of the registrant has determined that David Downes, the Board’s Audit Committee Chairman, is an audit committee financial expert and that Mr. Downes is “independent” for purposes of this Item 3.
| Item 4. | Principal Accountant Fees and Services. |
The principal accountant for the audit of the registrant’s annual financial statements billed $54,800 in fiscal 2014 and $53,700 in fiscal 2013.
The principal accountant for the audit of the registrant’s annual financial statements billed no such fees in fiscal 2014 and no such fees in fiscal 2013.
The principal accountant for the audit of the registrant’s annual financial statements billed $1,012,359 in fiscal 2014 and $697,965 in fiscal 2013 to the registrant’s investment adviser or any entity controlling, controlled by, or under common control with the adviser that provides ongoing services to the registrant.
Such services include: Internal control reviews, GIPS attestation procedures, reorganization, and system conversion testing
The principal accountant for the audit of the registrant’s annual financial statements billed no such fees in fiscal 2014 and no such fees in fiscal 2013.
The principal accountant for the audit of the registrant’s annual financial statements billed $477,069 in fiscal 2014 and $581,620 in fiscal 2013 to the registrant’s investment adviser or any entity controlling, controlled by, or under common control with the adviser that provides ongoing services to the registrant.
Such services include: tax compliance, tax planning and tax advice. Tax compliance generally involves preparation of original and amended tax returns, claims for a refund and tax payment-planning services. Tax planning and tax advice includes assistance with tax audits and appeals, tax advice related to mergers and acquisitions and requests for rulings or technical advice from taxing authorities.
The principal accountant for the audit of the registrant’s annual financial statements billed no such fees in fiscal 2014 and no such fees in fiscal 2013.
The principal accountant for the audit of the registrant’s annual financial statements billed no such fees in fiscal 2014 and no such fees in fiscal 2013 to the registrant’s investment adviser or any entity controlling, controlled by, or under common control with the adviser that provides ongoing services to the registrant.
Such fees would include the cost to the principal accountant of attending audit committee meetings and consultations regarding the registrant’s retirement plan with respect to its Trustees.
| (e) | (1) During its regularly scheduled periodic meetings, the registrant’s audit committee will pre-approve all audit, audit-related, tax and other services to be provided by the principal accountants of the registrant. |
The audit committee has delegated pre-approval authority to its Chairman for any subsequent new engagements that arise between regularly scheduled meeting dates provided that any fees such pre-approved are presented to the audit committee at its next regularly scheduled meeting.
Under applicable laws, pre-approval of non-audit services may be waived provided that: 1) the aggregate amount of all such services provided constitutes no more than five percent of the total amount of fees paid by the registrant to its principal accountant during the fiscal year in which services are provided 2) such services were not recognized by the registrant at the time of engagement as non-audit services and 3) such services are promptly brought to the attention of the audit committee of the registrant and approved prior to the completion of the audit.
(2) 0%
| (f) | Not applicable as less than 50%. |
| (g) | The principal accountant for the audit of the registrant’s annual financial statements billed $1,489,428 in fiscal 2014 and $1,279,585 in fiscal 2013 to the registrant and the registrant’s investment adviser or any entity controlling, controlled by, or under common control with the adviser that provides ongoing services to the registrant related to non-audit fees. Those billings did not include any prohibited non-audit services as defined by the Securities Exchange Act of 1934. |
| (h) | The registrant’s audit committee of the board of Trustees has considered whether the provision of non-audit services that were rendered to the registrant’s investment adviser, and any entity controlling, controlled by, or under common control with the investment adviser that provides ongoing services to the registrant that were not pre-approved pursuant to paragraph (c)(7)(ii) of Rule 2-01 of Regulation S-X is compatible with maintaining the principal accountant’s independence. No such services were rendered. |
| Item 5. | Audit Committee of Listed Registrants |
Not applicable.
| Item 6. | Schedule of Investments. |
a) Not applicable. The complete schedule of investments is included in Item 1 of this Form N-CSR.
b) Not applicable.
| Item 7. | Disclosure of Proxy Voting Policies and Procedures for Closed-End Management Investment Companies. |
Not applicable.
| Item 8. | Portfolio Managers of Closed-End Management Investment Companies. |
Not applicable.
| Item 9. | Purchases of Equity Securities by Closed-End Management Investment Company and Affiliated Purchasers. |
Not applicable.
| Item 10. | Submission of Matters to a Vote of Security Holders. |
The Fund’s Governance Committee Provisions with Respect to Nominations of Directors/Trustees to the Respective Boards
None
| Item 11. | Controls and Procedures. |
Based on their evaluation of the registrant’s disclosure controls and procedures (as defined in rule 30a-3(c) under the Investment Company Act of 1940 (17 CFR 270.30a-3(c)) as of 12/31/2014, the registrant’s principal executive officer and principal financial officer found the registrant’s disclosure controls and procedures to provide reasonable assurances that information required to be disclosed by the registrant in the reports that it files under the Securities Exchange Act of 1934 (a) is accumulated and communicated to registrant’s management, including its principal executive officer and principal financial officer, to allow timely decisions regarding required disclosure, and (b) is recorded, processed, summarized and reported, within the time periods specified in the rules and forms adopted by the U.S. Securities and Exchange Commission.
There have been no changes in the registrant’s internal controls over financial reporting that occurred during the registrant’s second fiscal quarter of the period covered by this report that
have materially affected, or are reasonably likely to materially affect, the registrant’s internal control over financial reporting.
| (a) | (1) Exhibit attached hereto. |
(2) Exhibits attached hereto.
(3) Not applicable.
| (b) | Exhibit attached hereto. |
SIGNATURES
Pursuant to the requirements of the Securities Exchange Act of 1934 and the Investment Company Act of 1940, the registrant has duly caused this report to be signed on its behalf by the undersigned, thereunto duly authorized.
| | |
| Oppenheimer Rochester Fund Municipals |
| |
| By: | | /s/ Arthur P. Steinmetz |
| | Arthur P. Steinmetz |
| | Principal Executive Officer |
| |
| Date: | | 2/11/2015 |
Pursuant to the requirements of the Securities Exchange Act of 1934 and the Investment Company Act of 1940, this report has been signed below by the following persons on behalf of the registrant and in the capacities and on the dates indicated.
| | |
| By: | | /s/ Arthur P. Steinmetz |
| | Arthur P. Steinmetz |
| | Principal Executive Officer |
| |
| Date: | | 2/11/2015 |
| | |
| By: | | /s/ Brian W. Wixted |
| | Brian W. Wixted |
| | Principal Financial Officer |
| |
| Date: | | 2/11/2015 |