
AGA Financial Forum Business Update May 18 – 20, 2014 Exhibit 99.1

Safe Harbor Statement 2 The information contained herein is as of the date of this presentation. Many factors may impact forward-looking statements including, but not limited to, the following: impact of regulation by the FERC, MPSC, NRC and other applicable governmental proceedings and regulations, including any associated impact on rate structures; the amount and timing of cost recovery allowed as a result of regulatory proceedings, related appeals or new legislation; impact of electric and natural gas utility restructuring in Michigan, including legislative amendments and Customer Choice programs; economic conditions and population changes in our geographic area resulting in changes in demand, customer conservation and thefts of electricity and natural gas and high levels of uncollectible accounts receivable; environmental issues, laws, regulations, and the increasing costs of remediation and compliance, including actual and potential new federal and state requirements; health, safety, financial, environmental and regulatory risks associated with ownership and operation of nuclear facilities; changes in the cost and availability of coal and other raw materials, purchased power and natural gas; the potential for losses on investments, including nuclear decommissioning and benefit plan assets and the related increases in future expense and contributions; volatility in the short-term natural gas storage markets impacting third- party storage revenues; volatility in commodity markets impacting the results of our energy trading operations; access to capital markets and the results of other financing efforts which can be affected by credit agency ratings; instability in capital markets which could impact availability of short and long-term financing; the timing and extent of changes in interest rates; the level of borrowings; the potential for increased costs or delays in completion of significant construction projects; changes in and application of federal, state and local tax laws and their interpretations, including the Internal Revenue Code, regulations, rulings, court proceedings and audits; the effects of weather and other natural phenomena on operations and sales to customers, and purchases from suppliers; unplanned outages; the cost of protecting assets against, or damage due to, terrorism or cyber attacks; employee relations and the impact of collective bargaining agreements; the availability, cost, coverage and terms of insurance and stability of insurance providers; cost reduction efforts and the maximization of plant and distribution system performance; the effects of competition; changes in and application of accounting standards and financial reporting regulations; changes in federal or state laws and their interpretation with respect to regulation, energy policy and other business issues; binding arbitration, litigation and related appeals; and the risks discussed in our public filings with the Securities and Exchange Commission. New factors emerge from time to time. We cannot predict what factors may arise or how such factors may cause our results to differ materially from those contained in any forward-looking statement. Any forward-looking statements speak only as of the date on which such statements are made. We undertake no obligation to update any forward- looking statement to reflect events or circumstances after the date on which such statement is made or to reflect the occurrence of unanticipated events. This presentation should also be read in conjunction with the “Forward-Looking Statements” sections in each of DTE Energy’s and DTE Electric’s 2013 Forms 10-K and 2014 Forms 10Q (which sections are incorporated herein by reference), and in conjunction with other SEC reports filed by DTE Energy and DTE Electric.
• Overview • Long-Term Growth Update • Summary 3
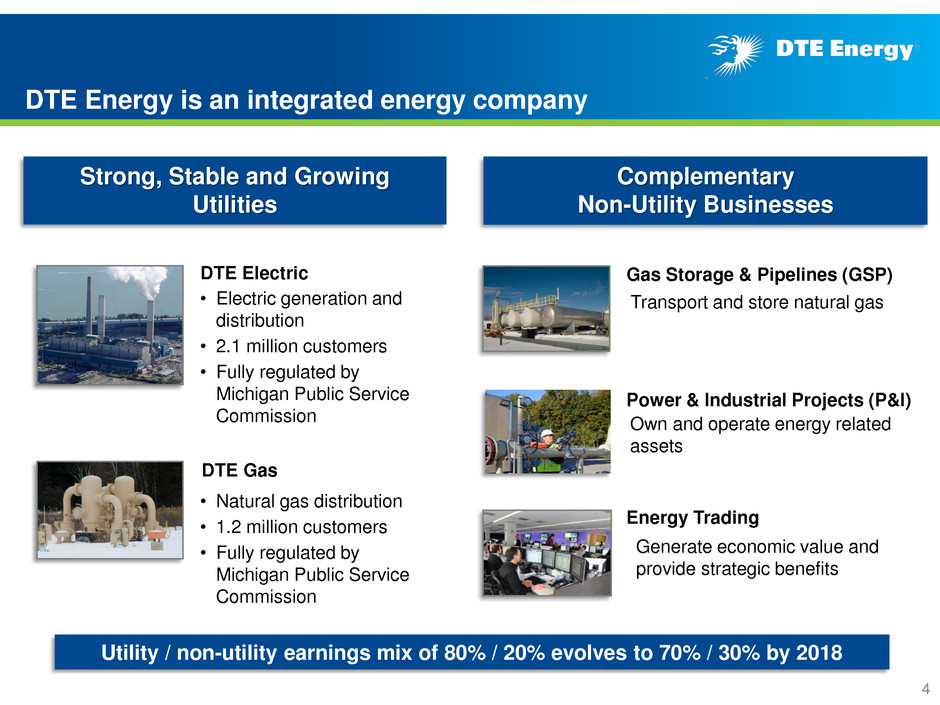
DTE Electric DTE Gas DTE Energy is an integrated energy company 4 Complementary Non-Utility Businesses Strong, Stable and Growing Utilities • Electric generation and distribution • 2.1 million customers • Fully regulated by Michigan Public Service Commission • Natural gas distribution • 1.2 million customers • Fully regulated by Michigan Public Service Commission Gas Storage & Pipelines (GSP) Power & Industrial Projects (P&I) Energy Trading Transport and store natural gas Generate economic value and provide strategic benefits Own and operate energy related assets Utility / non-utility earnings mix of 80% / 20% evolves to 70% / 30% by 2018
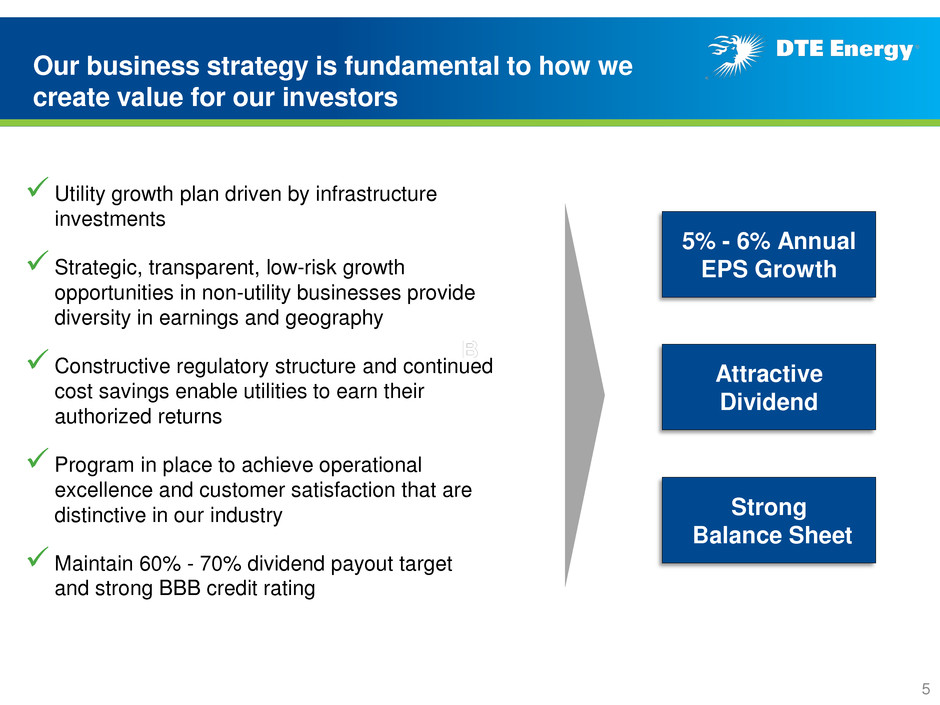
Our business strategy is fundamental to how we create value for our investors Utility growth plan driven by infrastructure investments Strategic, transparent, low-risk growth opportunities in non-utility businesses provide diversity in earnings and geography Constructive regulatory structure and continued cost savings enable utilities to earn their authorized returns Program in place to achieve operational excellence and customer satisfaction that are distinctive in our industry Maintain 60% - 70% dividend payout target and strong BBB credit rating 5% - 6% Annual EPS Growth Attractive Dividend Strong Balance Sheet 5
• Overview • Long-Term Growth Update • Summary 6
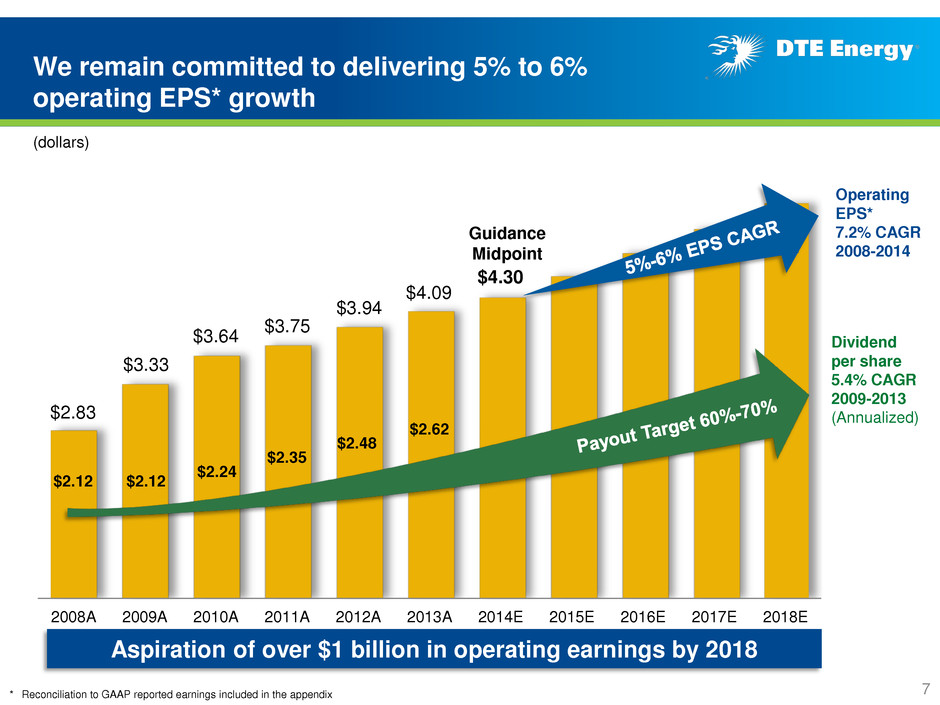
2008A 2009A 2010A 2011A 2012A 2013A 2014E 2015E 2016E 2017E 2018E $3.33 $4.09 $3.75 $3.64 $2.12 $2.24 $2.35 $2.48 $2.12 * Reconciliation to GAAP reported earnings included in the appendix We remain committed to delivering 5% to 6% operating EPS* growth (dollars) Operating EPS* 7.2% CAGR 2008-2014 Dividend per share 5.4% CAGR 2009-2013 (Annualized) $2.83 $3.94 $4.30 Guidance Midpoint Aspiration of over $1 billion in operating earnings by 2018 $2.62 7
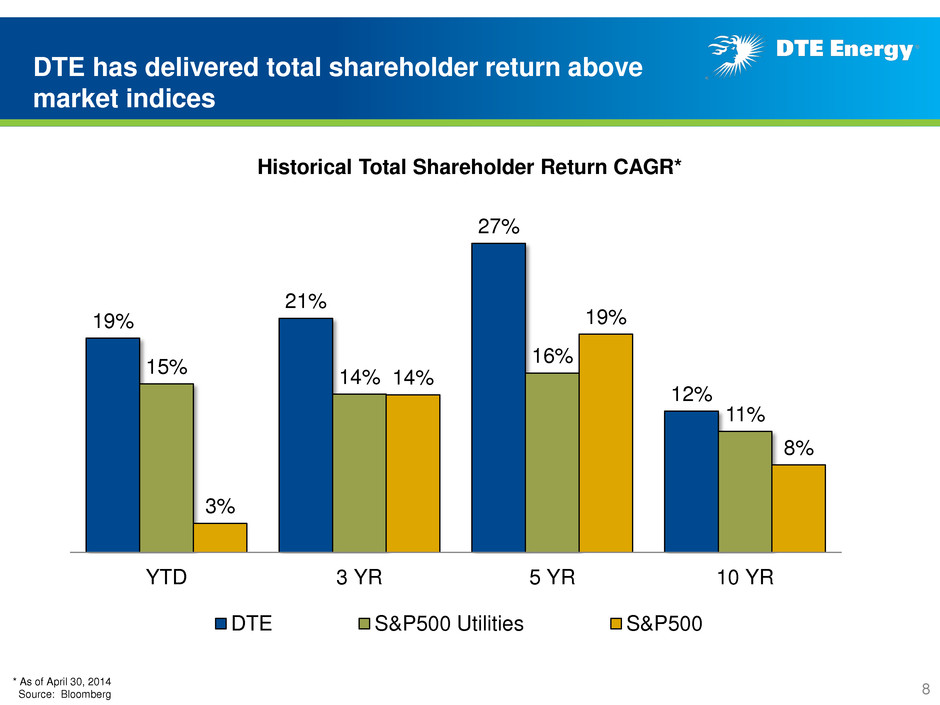
DTE has delivered total shareholder return above market indices 8 19% 21% 27% 12% 15% 14% 16% 11% 3% 14% 19% 8% YTD 3 YR 5 YR 10 YR DTE S&P500 Utilities S&P500 Historical Total Shareholder Return CAGR* * As of April 30, 2014 Source: Bloomberg
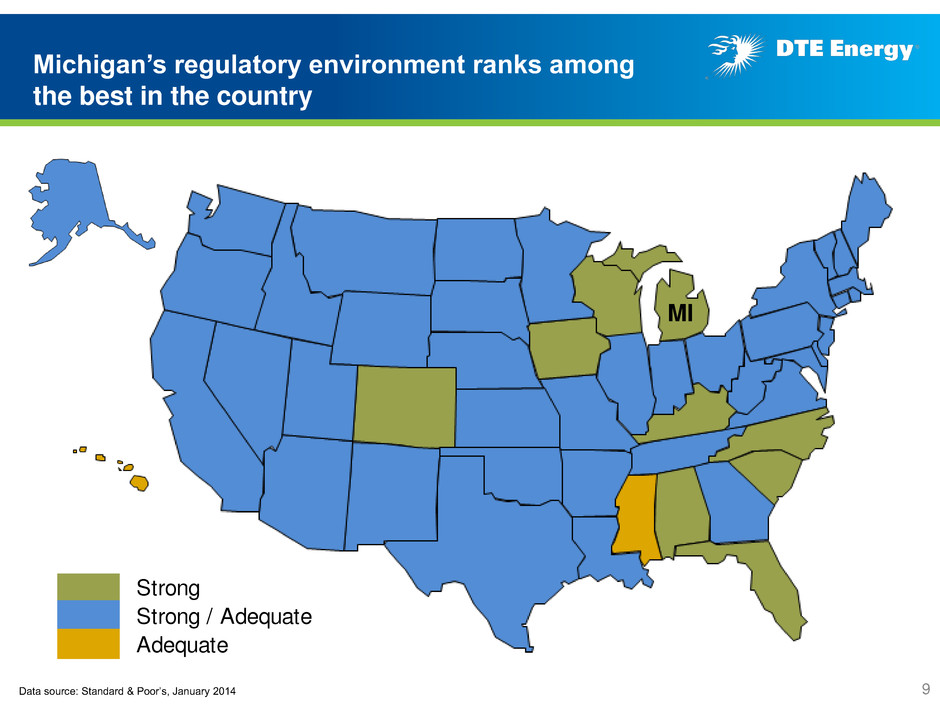
Michigan’s regulatory environment ranks among the best in the country Data source: Standard & Poor’s, January 2014 9 MI Strong Strong / Adequate Adequate
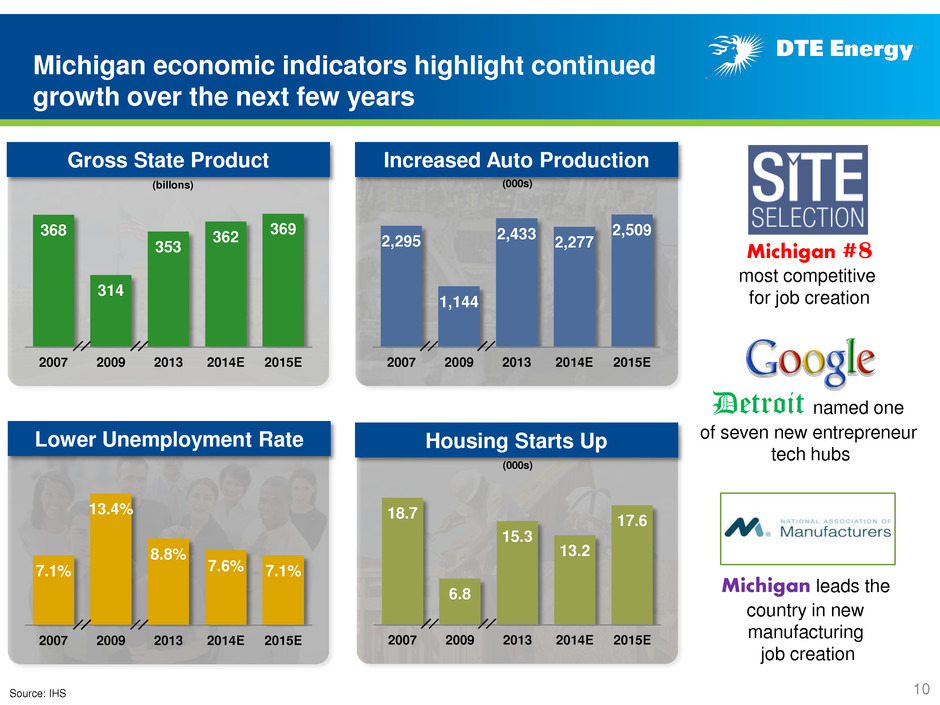
Michigan economic indicators highlight continued growth over the next few years 10 Michigan leads the country in new manufacturing job creation 7.1% 13.4% 8.8% 7.6% 7.1% 2007 2009 2013 2014E 2015E Source: IHS Detroit named one of seven new entrepreneur tech hubs 368 314 353 362 369 2007 2009 2013 2014E 2015E (billons) Michigan #8 most competitive for job creation 2,295 1,144 2,433 2,277 2,509 2007 2009 2013 2014E 2015E (000s) 18.7 6.8 15.3 13.2 17.6 2007 2009 2013 2014E 2015E (000s) Gross State Product Increased Auto Production Lower Unemployment Rate Housing Starts Up
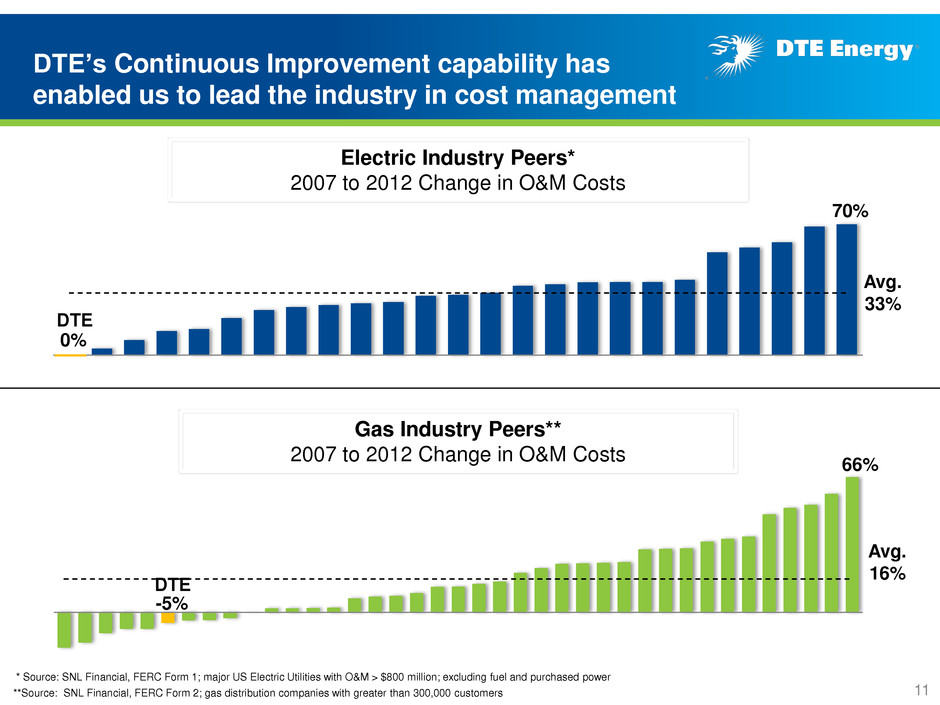
DTE’s Continuous Improvement capability has enabled us to lead the industry in cost management * Source: SNL Financial, FERC Form 1; major US Electric Utilities with O&M > $800 million; excluding fuel and purchased power **Source: SNL Financial, FERC Form 2; gas distribution companies with greater than 300,000 customers 11 Electric Industry Peers* 2007 to 2012 Change in O&M Costs 70% DTE 0% Avg. 33% 66% DTE -5% Gas Industry Peers** 2007 to 2012 Change in O&M Costs Avg. 16%
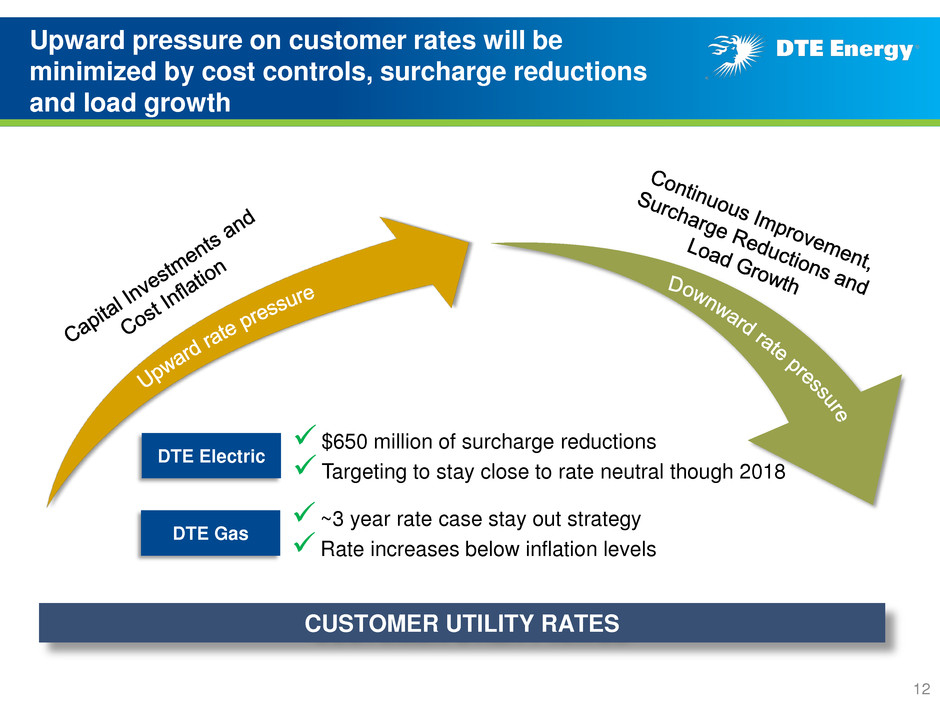
Upward pressure on customer rates will be minimized by cost controls, surcharge reductions and load growth $650 million of surcharge reductions Targeting to stay close to rate neutral though 2018 DTE Electric ~3 year rate case stay out strategy Rate increases below inflation levels DTE Gas 12 CUSTOMER UTILITY RATES
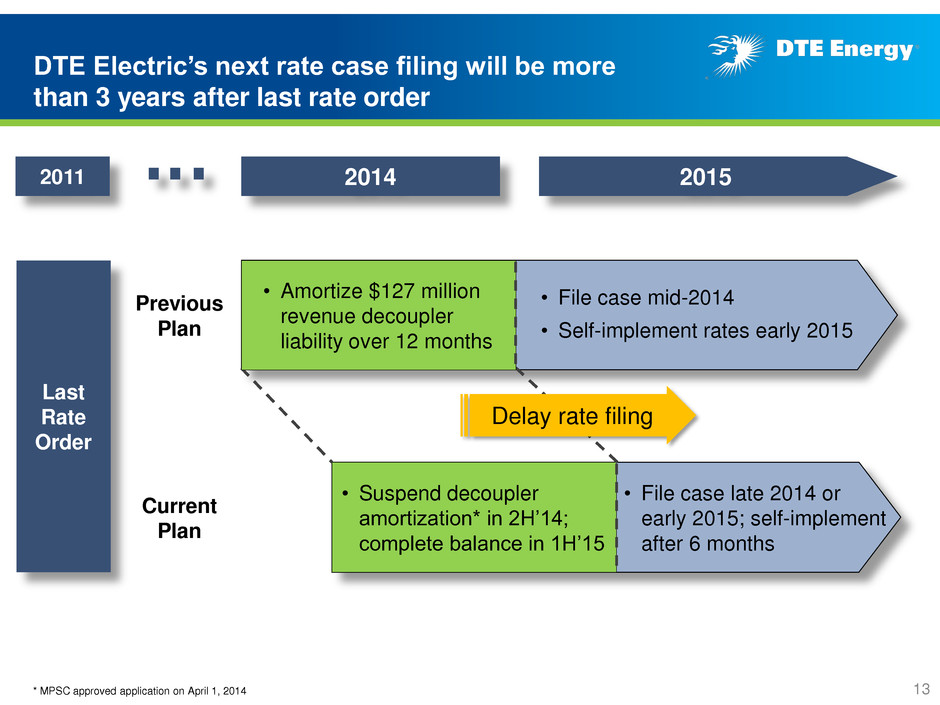
DTE Electric’s next rate case filing will be more than 3 years after last rate order 13 2011 • Amortize revenue decoupler liability over 12 months • File case mid-2014 • Self-implement rates early 2015 2014 2015 • Suspend decoupler amortization* in 2H’14; complete balance in 1H’15 • File case late 2014 or early 2015; self-implement after 6 months Delay rate filing • Amortize $127 million revenue decoupler liability over 12 months * MPSC approved application on April 1, 2014 Last Rate Order Previous Plan Current Plan
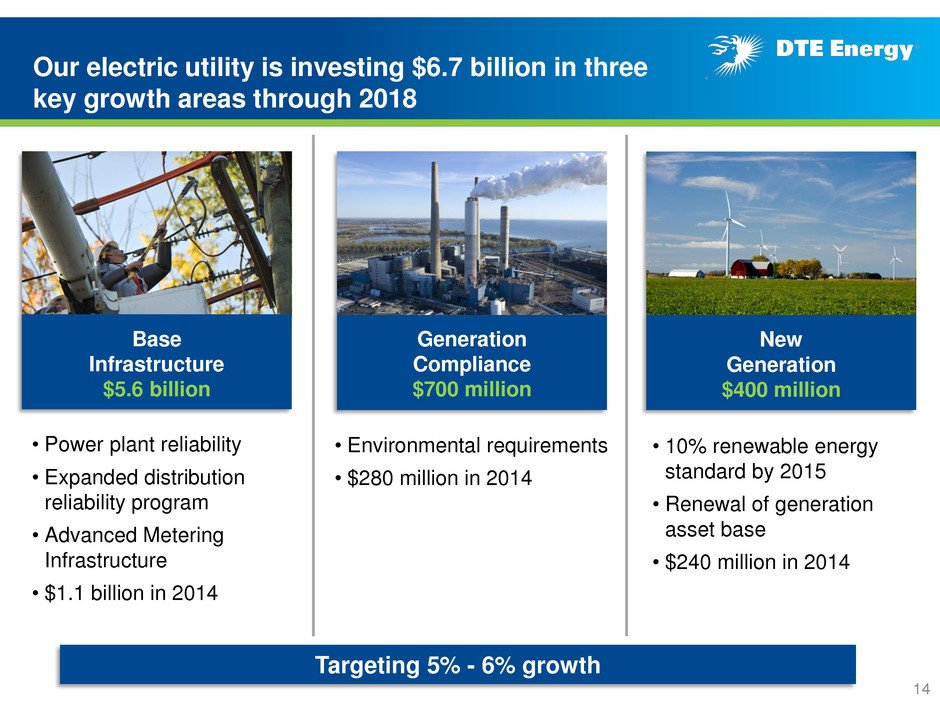
Our electric utility is investing $6.7 billion in three key growth areas through 2018 • Environmental requirements • $280 million in 2014 • Power plant reliability • Expanded distribution reliability program • Advanced Metering Infrastructure • $1.1 billion in 2014 • 10% renewable energy standard by 2015 • Renewal of generation asset base • $240 million in 2014 Base Infrastructure $5.6 billion Generation Compliance $700 million New Generation $400 million Targeting 5% - 6% growth 14
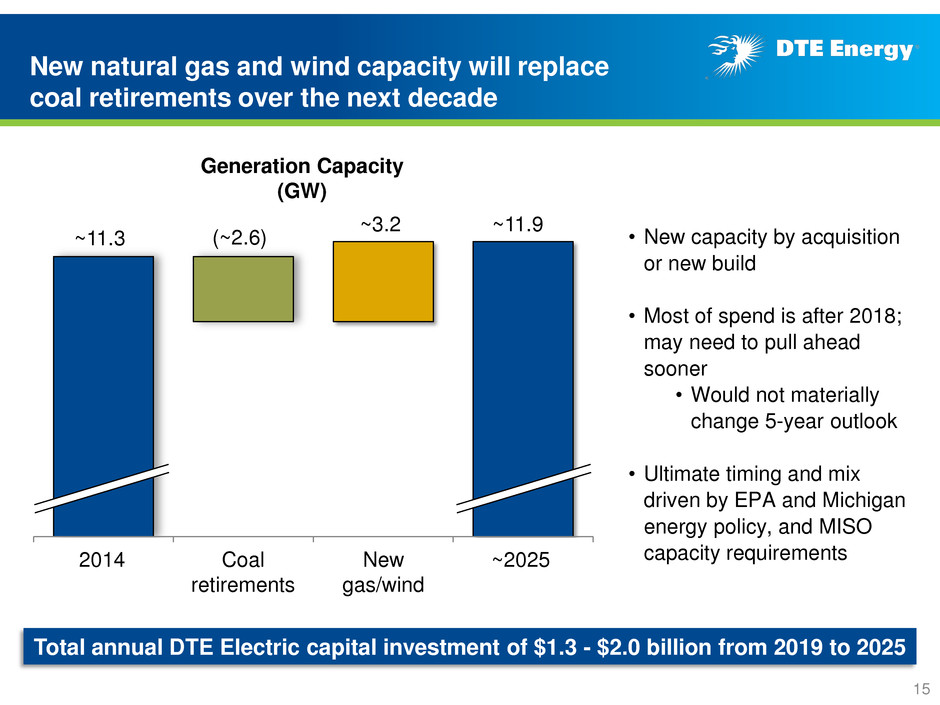
New natural gas and wind capacity will replace coal retirements over the next decade 15 2014 Coal retirements New gas/wind ~2025 Generation Capacity (GW) ~11.3 (~2.6) ~3.2 ~11.9 • New capacity by acquisition or new build • Most of spend is after 2018; may need to pull ahead sooner • Would not materially change 5-year outlook • Ultimate timing and mix driven by EPA and Michigan energy policy, and MISO capacity requirements Total annual DTE Electric capital investment of $1.3 - $2.0 billion from 2019 to 2025
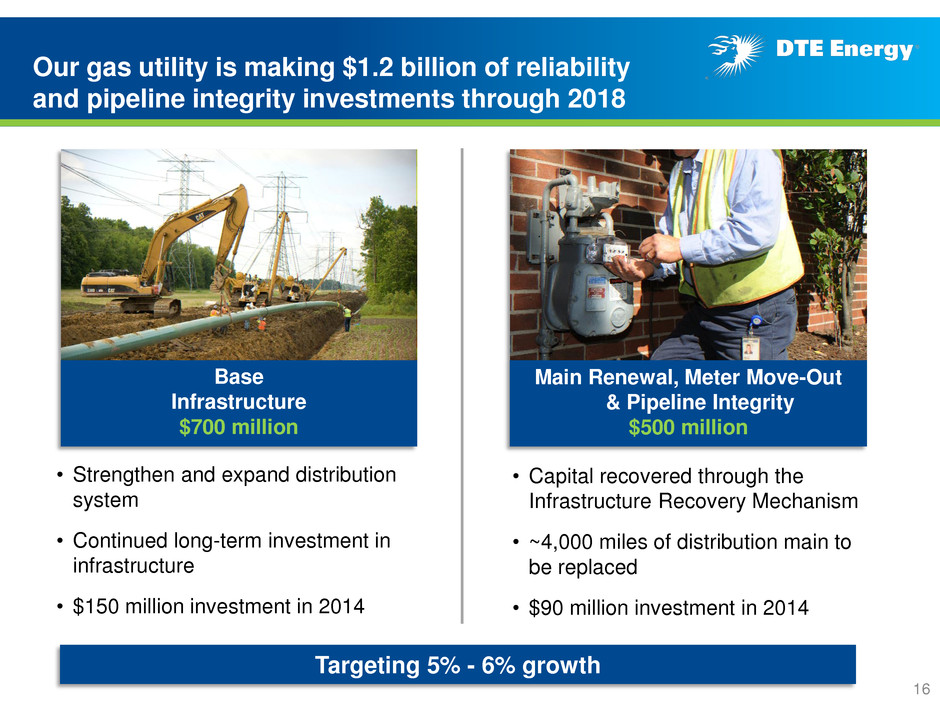
Our gas utility is making $1.2 billion of reliability and pipeline integrity investments through 2018 • Capital recovered through the Infrastructure Recovery Mechanism • ~4,000 miles of distribution main to be replaced • $90 million investment in 2014 • Strengthen and expand distribution system • Continued long-term investment in infrastructure • $150 million investment in 2014 Targeting 5% - 6% growth Main Renewal, Meter Move-Out & Pipeline Integrity $500 million Base Infrastructure $700 million 16
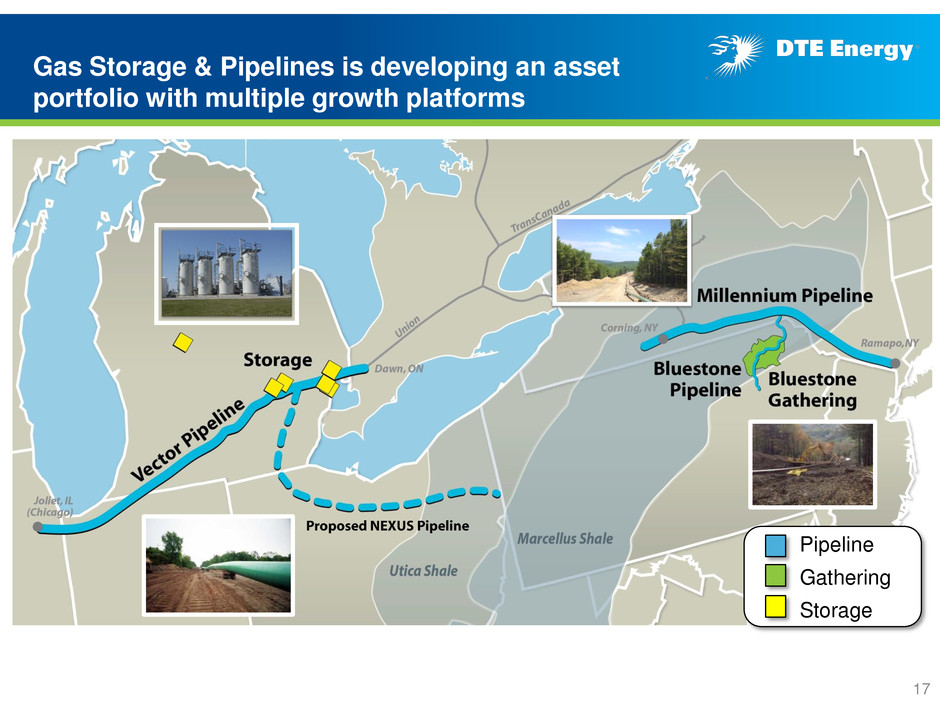
Gas Storage & Pipelines is developing an asset portfolio with multiple growth platforms 17 Pipeline Gathering Storage
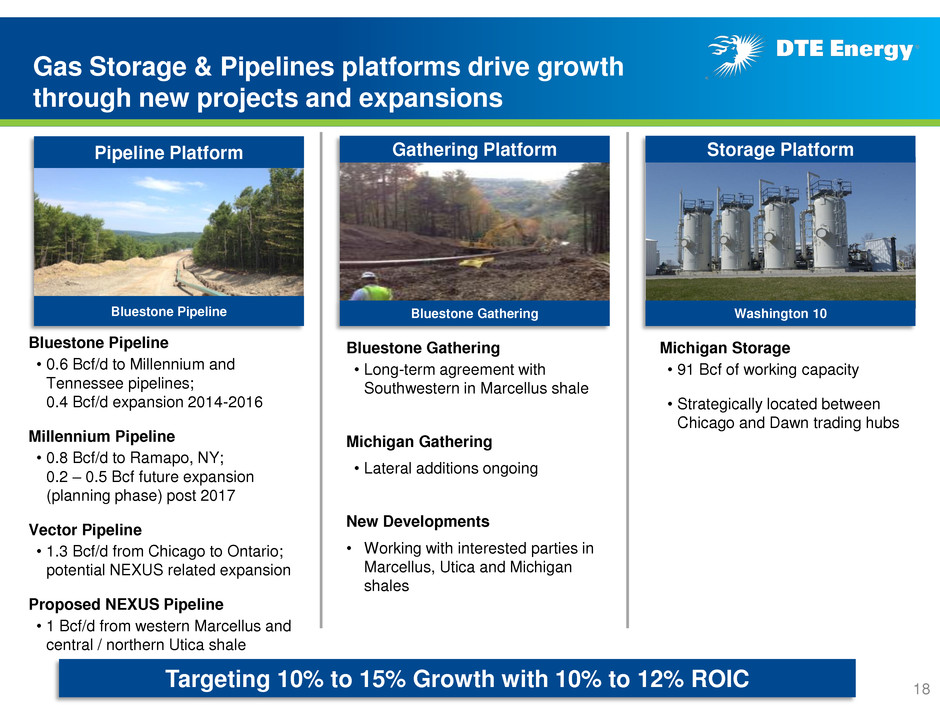
Bluestone Gathering • Long-term agreement with Southwestern in Marcellus shale Michigan Gathering • Lateral additions ongoing New Developments • Working with interested parties in Marcellus, Utica and Michigan shales Gas Storage & Pipelines platforms drive growth through new projects and expansions Pipeline Platform Bluestone Pipeline Targeting 10% to 15% Growth with 10% to 12% ROIC Michigan Storage • 91 Bcf of working capacity • Strategically located between Chicago and Dawn trading hubs Bluestone Gathering Gathering Platform Washington 10 Storage Platform 18 Bluestone Pipeline • 0.6 Bcf/d to Millennium and Tennessee pipelines; 0.4 Bcf/d expansion 2014-2016 Millennium Pipeline • 0.8 Bcf/d to Ramapo, NY; 0.2 – 0.5 Bcf future expansion (planning phase) post 2017 Vector Pipeline • 1.3 Bcf/d from Chicago to Ontario; potential NEXUS related expansion Proposed NEXUS Pipeline • 1 Bcf/d from western Marcellus and central / northern Utica shale
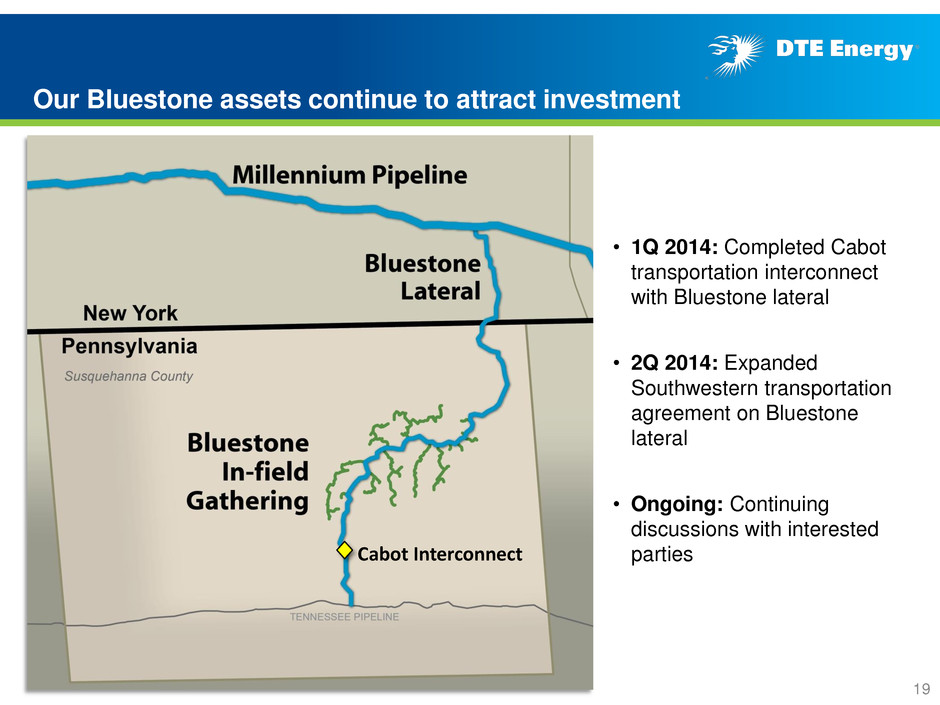
Our Bluestone assets continue to attract investment • 1Q 2014: Completed Cabot transportation interconnect with Bluestone lateral • 2Q 2014: Expanded Southwestern transportation agreement on Bluestone lateral • Ongoing: Continuing discussions with interested parties Cabot Interconnect 19
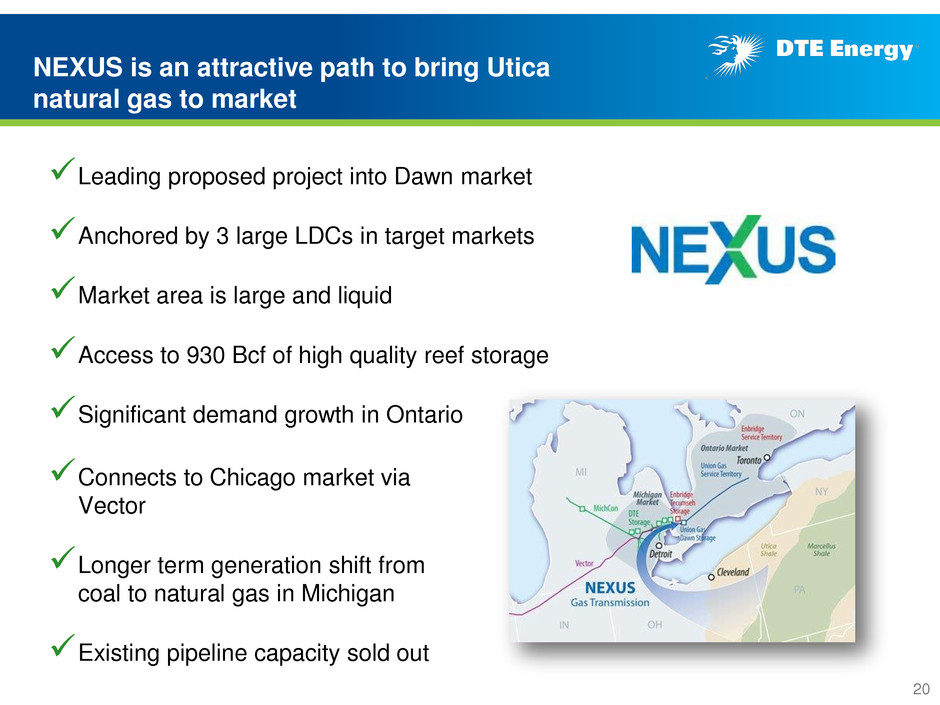
NEXUS is an attractive path to bring Utica natural gas to market Leading proposed project into Dawn market Anchored by 3 large LDCs in target markets Market area is large and liquid Access to 930 Bcf of high quality reef storage Significant demand growth in Ontario Connects to Chicago market via Vector Longer term generation shift from coal to natural gas in Michigan Existing pipeline capacity sold out 20
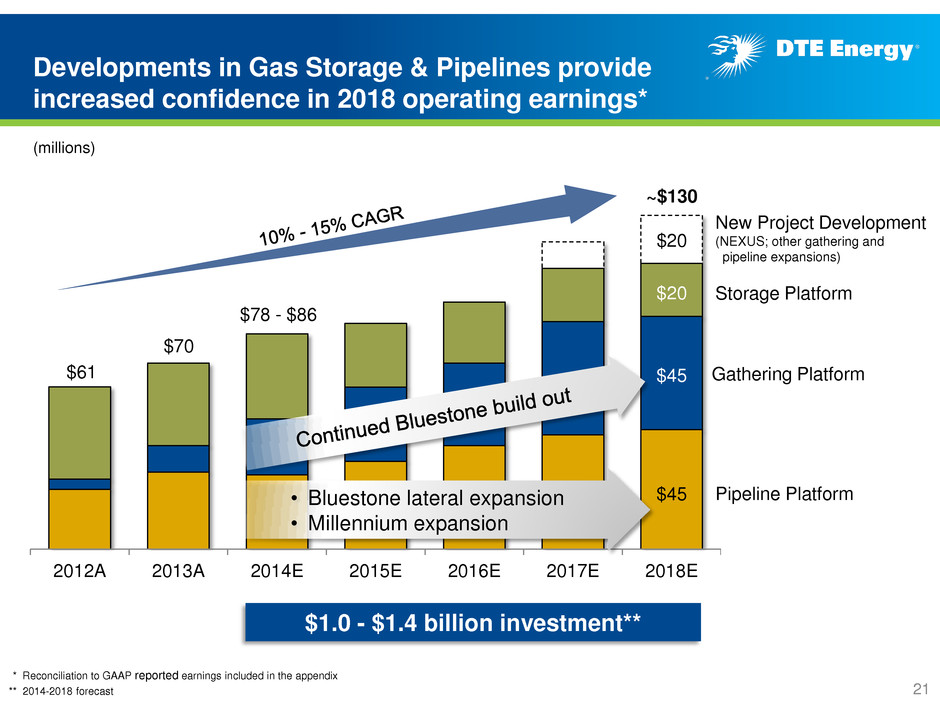
2012A 2013A 2014E 2015E 2016E 2017E 2018E $78 - $86 Developments in Gas Storage & Pipelines provide increased confidence in 2018 operating earnings* * Reconciliation to GAAP reported earnings included in the appendix (millions) Pipeline Platform Gathering Platform Storage Platform New Project Development (NEXUS; other gathering and pipeline expansions) $1.0 - $1.3 billion investment $70 ~$130 $45 $45 $20 $20 $1.0 - $1.4 billion investment** 21 $61 ** 2014-2018 forecast • Bluestone lateral expansion • Millennium expansion
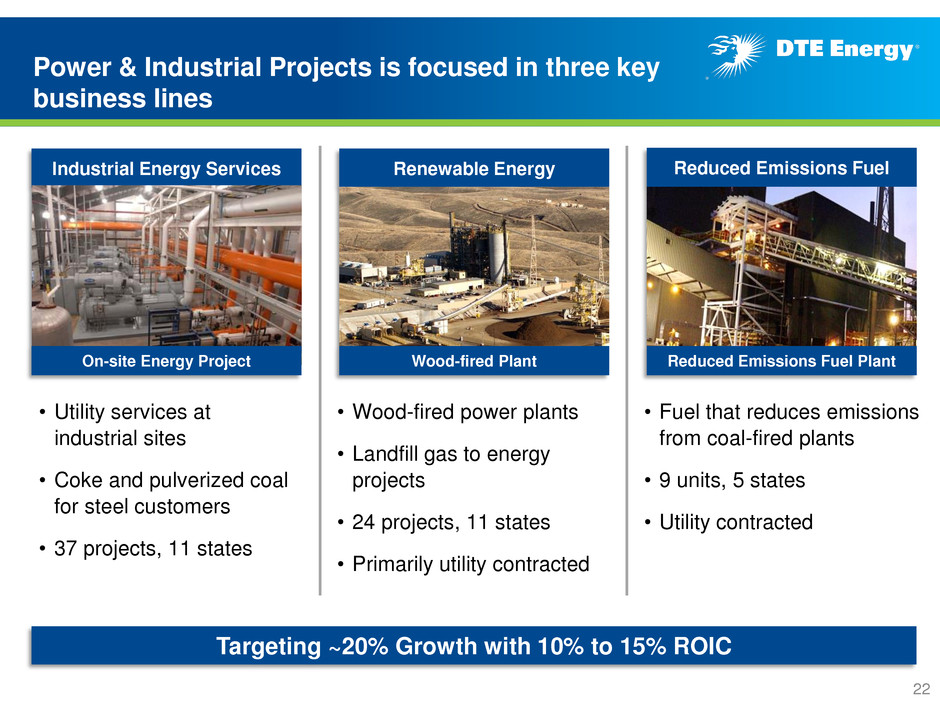
Power & Industrial Projects is focused in three key business lines Wood-fired Plant Cassville, WI • Fuel that reduces emissions from coal-fired plants • 9 units, 5 states • Utility contracted • Utility services at industrial sites • Coke and pulverized coal for steel customers • 37 projects, 11 states • Wood-fired power plants • Landfill gas to energy projects • 24 projects, 11 states • Primarily utility contracted Targeting ~20% Growth with 10% to 15% ROIC Industrial Energy Services On-site Energy Project Renewable Energy Wood-fired Plant Reduced Emissions Fuel Reduced Emissions Fuel Plant 22

Power & Industrial Projects is executing on its growth plans Industrial Energy Services • Cogen project being constructed to serve Ohio manufacturer expected to commence operations in 3Q • Organic growth generated from 2012 acquisition of on-site energy portfolio Renewables • 45MW waste wood project near Stockton, CA began commercial operations • 10MW Landfill gas projects in North Carolina and Los Angeles expected to commence operations Reduced Emissions Fuel • Relocation of 8th unit expected to be completed this summer • Test burn scheduled in May to support relocation of 9th unit 2014 Progress 23
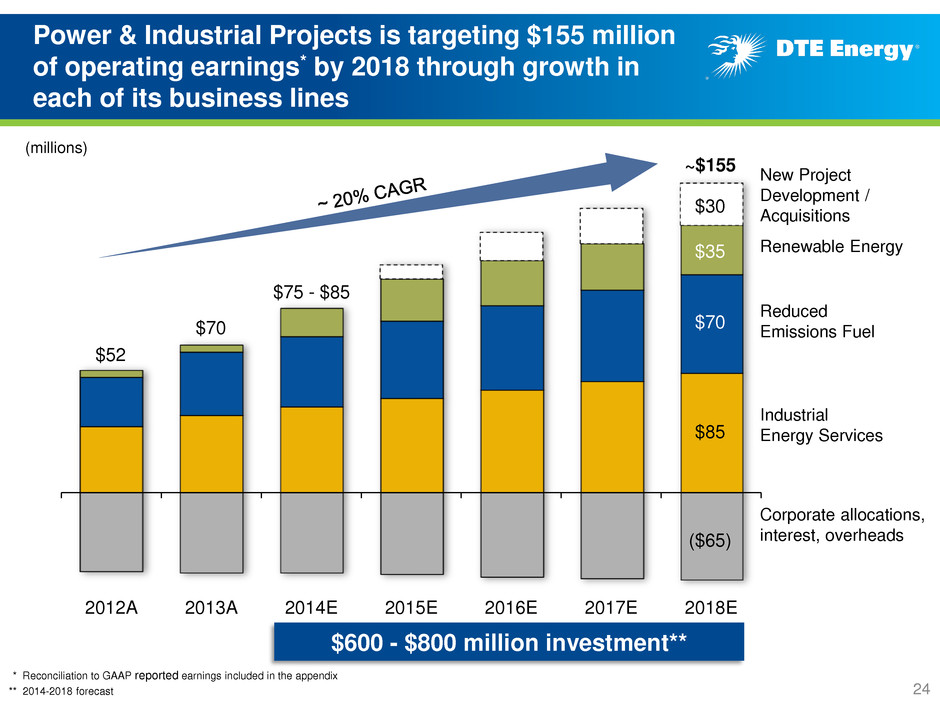
2012A 2013A 2014E 2015E 2016E 2017E 2018E Power & Industrial Projects is targeting $155 million of operating earnings* by 2018 through growth in each of its business lines ~$155 (millions) $35 $70 $85 ($65) $30 $70 New Project Development / Acquisitions Renewable Energy Reduced Emissions Fuel Industrial Energy Services Corporate allocations, interest, overheads $75 - $85 $600 - $800 million investment** 24 $52 * Reconciliation to GAAP reported earnings included in the appendix ** 2014-2018 forecast
• Overview • Long-Term Growth Update • Summary 25

Summary • Long-term plan supports continued 5% - 6% operating EPS growth • On track to achieve 2014 operating earnings guidance; strong first quarter earnings provides contingency • Constructive regulation, coupled with a focus on operational excellence and strong customer satisfaction, supports meaningful growth at the utilities • Solid earnings growth at non-utility businesses • Gas Storage & Pipelines developing growth platforms • Power & Industrial growth through acquisitions and expansion of existing portfolio 26

Contact Us DTE Energy Investor Relations www.dteenergy.com/investors (313) 235-8030 27
Appendix
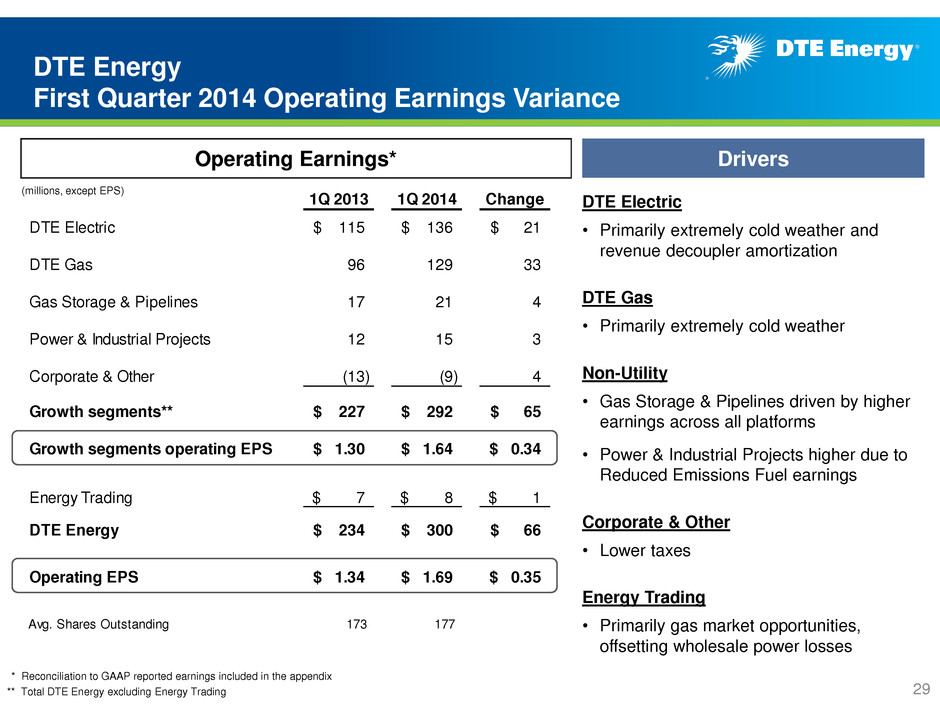
1Q 2013 1Q 2014 Change DTE Electric 115$ 136$ 21$ DTE Gas 96 129 33 Gas Storage & Pipelines 17 21 4 Power & Industrial Projects 12 15 3 Corporate & Other (13) (9) 4 Growth segments** 227$ 292$ 65$ Growth segments operating EPS 1.30$ 1.64$ 0.34$ Energy Trading 7$ 8$ 1$ DTE Energy 234$ 300$ 66$ Operating EPS 1.34$ 1.69$ 0.35$ Avg. Shares Outstanding 173 177 DTE Energy First Quarter 2014 Operating Earnings Variance Operating Earnings* (millions, except EPS) DTE Electric • Primarily extremely cold weather and revenue decoupler amortization DTE Gas • Primarily extremely cold weather Non-Utility • Gas Storage & Pipelines driven by higher earnings across all platforms • Power & Industrial Projects higher due to Reduced Emissions Fuel earnings Corporate & Other • Lower taxes Energy Trading • Primarily gas market opportunities, offsetting wholesale power losses Drivers 29 * Reconciliation to GAAP reported earnings included in the appendix ** Total DTE Energy excluding Energy Trading

We remain confident in our 2014 operating earnings* guidance (millions, except EPS) 1Q 2014 Actuals 2014 Guidance DTE Electric $136 $520 - $530 DTE Gas 129 120 - 126 Gas Storage & Pipelines 21 78 - 86 Power & Industrial Projects 15 75 - 85 Energy Trading $8 $0 Corporate & Other (9) (49) - (45) DTE Energy Operating EPS $300 $1.69 $744 - $782 $4.20 - $4.40 Growth segments** Growth segments operating EPS $292 $1.64 $744 - $782 $4.20 - $4.40 * Reconciliation to GAAP reported earnings included in the appendix ** Total DTE Energy excluding Energy Trading Avg. Shares Outstanding 177 177 • DTE Gas is above current guidance range due to favorable 1Q weather • This creates contingency for potential unfavorable summer weather 30
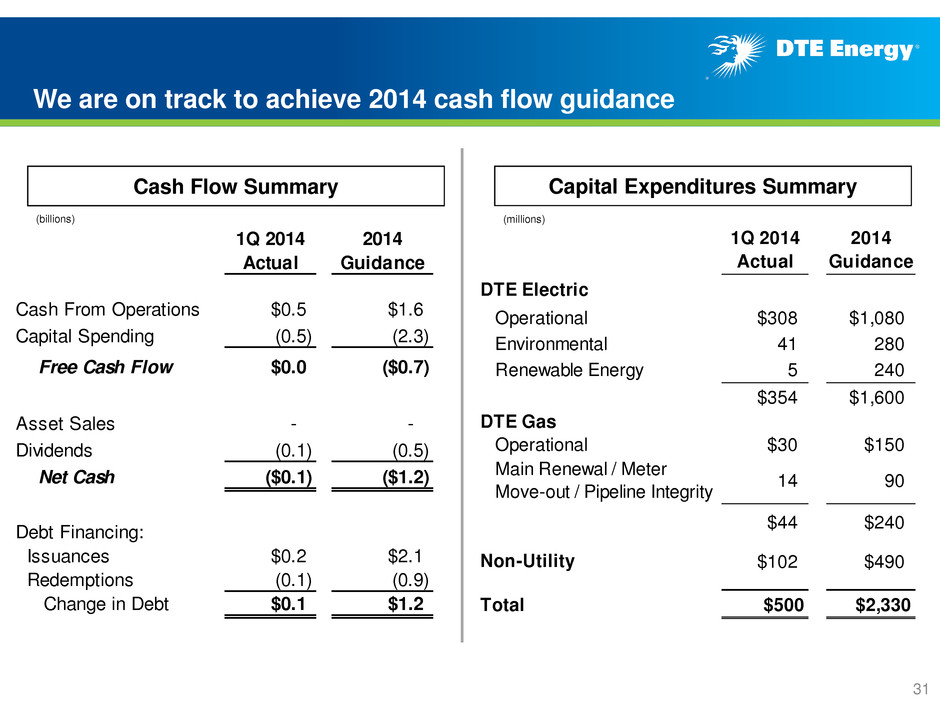
1Q 2014 2014 Actual Guidance Cash From Operations $0.5 $1.6 Capital Spending (0.5) (2.3) Free Cash Flow $0.0 ($0.7) Asset Sales - - Dividends (0.1) (0.5) Net Cash ($0.1) ($1.2) Debt Financing: Issuances $0.2 $2.1 Redemptions (0.1) (0.9) Change in Debt $0.1 $1.2 We are on track to achieve 2014 cash flow guidance Cash Flow Summary (billions) 31 1Q 2014 2014 Actual Guidance DTE Electric Operational $308 $1,080 Environmental 41 280 Renewable Energy 5 240 $354 $1,600 DTE Gas Operational $30 $150 Main Renewal / Meter Move-out / Pipeline Integrity 14 90 $44 $240 $102 $490 Total $500 $2,330 Non-Utility Capital Expenditures Summary (millions)
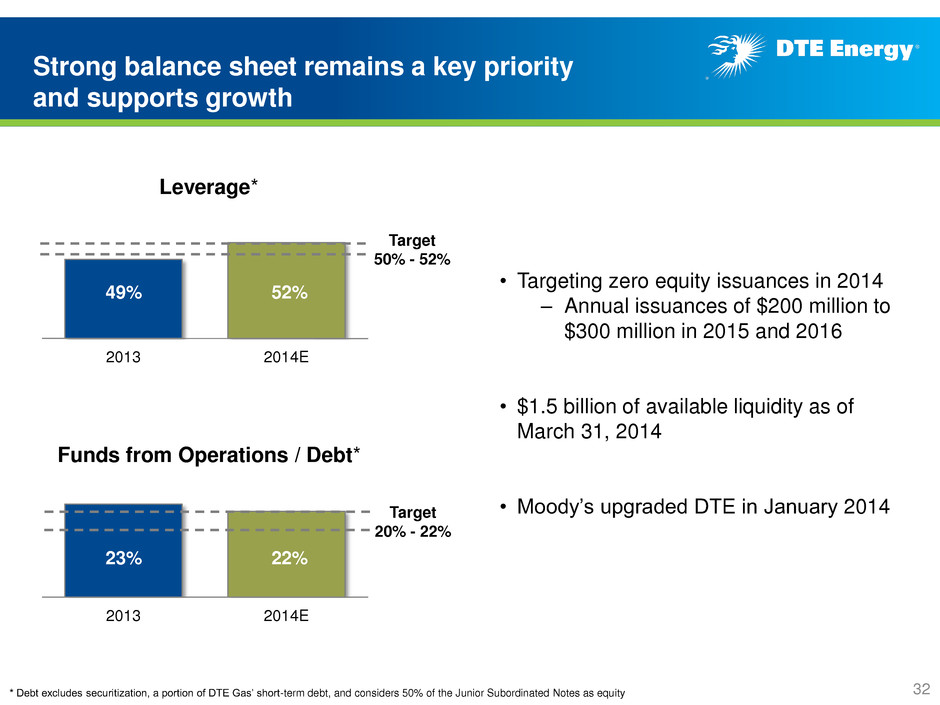
2013 2014E * Debt excludes securitization, a portion of DTE Gas’ short-term debt, and considers 50% of the Junior Subordinated Notes as equity Leverage* Funds from Operations / Debt* 2013 2014E 49% 52% Target 50% - 52% 23% 22% Target 20% - 22% Strong balance sheet remains a key priority and supports growth • Targeting zero equity issuances in 2014 – Annual issuances of $200 million to $300 million in 2015 and 2016 • $1.5 billion of available liquidity as of March 31, 2014 • Moody’s upgraded DTE in January 2014 32
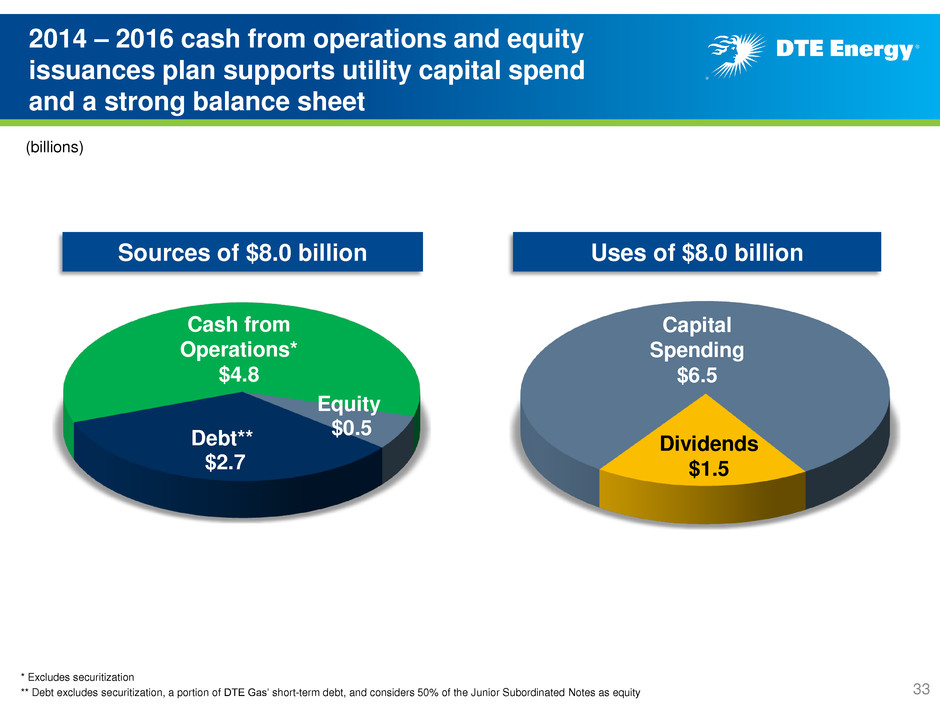
33 2014 – 2016 cash from operations and equity issuances plan supports utility capital spend and a strong balance sheet (billions) * Excludes securitization ** Debt excludes securitization, a portion of DTE Gas’ short-term debt, and considers 50% of the Junior Subordinated Notes as equity Equity $0.5 Debt** $2.7 Sources of $8.0 billion Uses of $8.0 billion Cash from Operations* $4.8 Capital Spending $6.5 Dividends $1.5
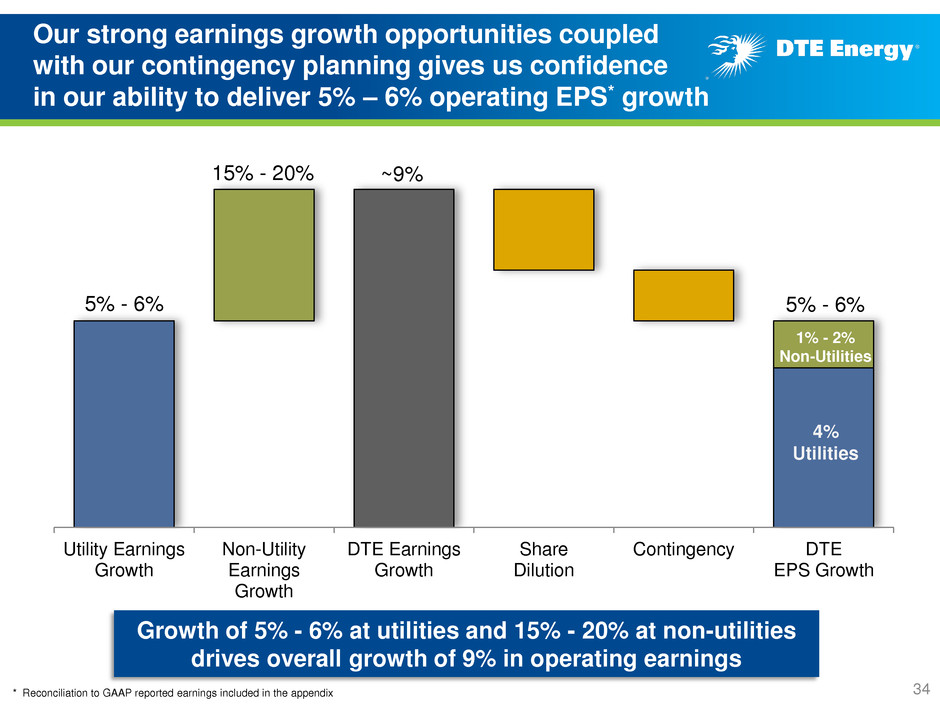
Our strong earnings growth opportunities coupled with our contingency planning gives us confidence in our ability to deliver 5% – 6% operating EPS* growth 34 * Reconciliation to GAAP reported earnings included in the appendix Growth of 5% - 6% at utilities and 15% - 20% at non-utilities drives overall growth of 9% in operating earnings Utility Earnings Growth Non-Utility Earnings Growth DTE Earnings Growth Share Dilution Contingency DTE EPS Growth 1% - 2% Non-Utilities 5% - 6% 15% - 20% ~9% 5% - 6% 4% Utilities
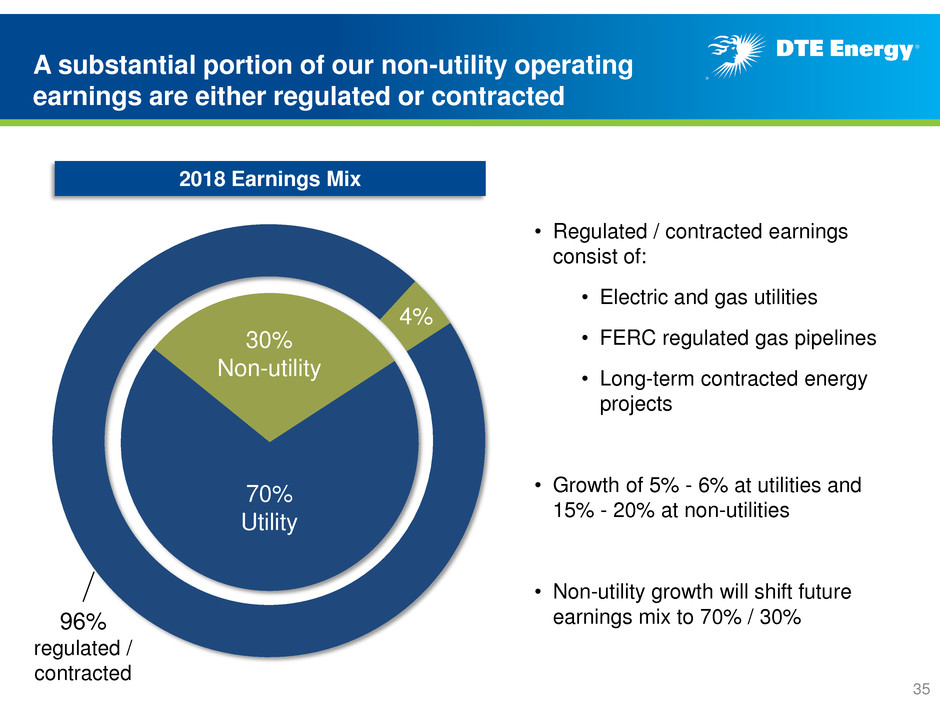
A substantial portion of our non-utility operating earnings are either regulated or contracted 2018 Earnings Mix • Regulated / contracted earnings consist of: • Electric and gas utilities • FERC regulated gas pipelines • Long-term contracted energy projects • Growth of 5% - 6% at utilities and 15% - 20% at non-utilities • Non-utility growth will shift future earnings mix to 70% / 30% 70% Utility 30% Non-utility 4% 96% regulated / contracted 35
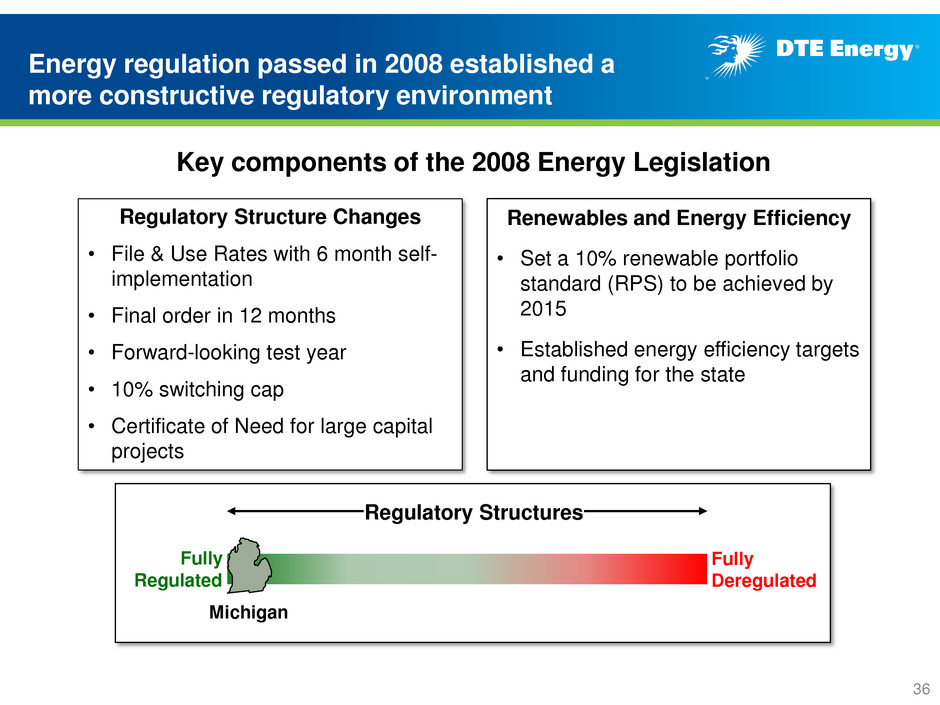
Energy regulation passed in 2008 established a more constructive regulatory environment Key components of the 2008 Energy Legislation Regulatory Structures Fully Regulated Fully Deregulated Michigan 36 Regulatory Structure Changes • File & Use Rates with 6 month self- implementation • Final order in 12 months • Forward-looking test year • 10% switching cap • Certificate of Need for large capital projects Renewables and Energy Efficiency • Set a 10% renewable portfolio standard (RPS) to be achieved by 2015 • Established energy efficiency targets and funding for the state
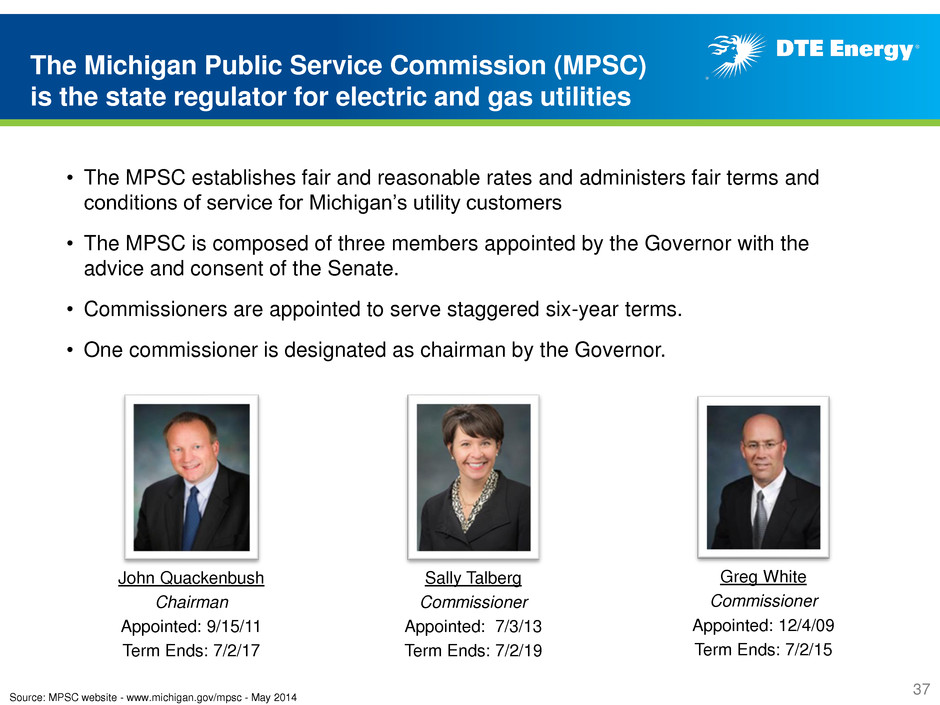
Sally Talberg Commissioner Appointed: 7/3/13 Term Ends: 7/2/19 Greg White Commissioner Appointed: 12/4/09 Term Ends: 7/2/15 Source: MPSC website - www.michigan.gov/mpsc - May 2014 • The MPSC establishes fair and reasonable rates and administers fair terms and conditions of service for Michigan’s utility customers • The MPSC is composed of three members appointed by the Governor with the advice and consent of the Senate. • Commissioners are appointed to serve staggered six-year terms. • One commissioner is designated as chairman by the Governor. The Michigan Public Service Commission (MPSC) is the state regulator for electric and gas utilities John Quackenbush Chairman Appointed: 9/15/11 Term Ends: 7/2/17 37
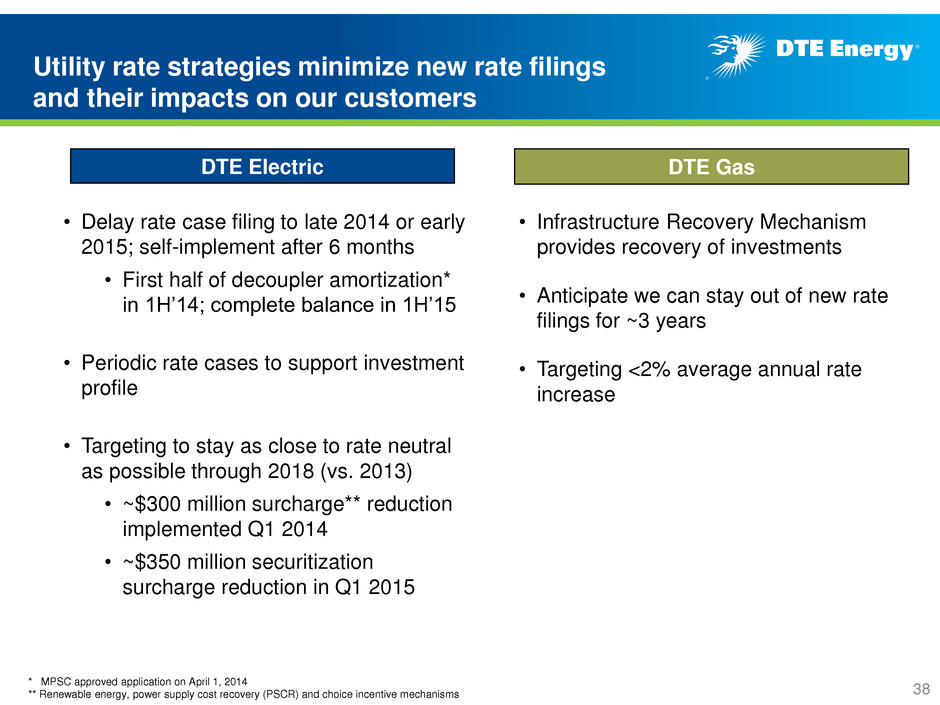
Utility rate strategies minimize new rate filings and their impacts on our customers DTE Electric DTE Gas • Delay rate case filing to late 2014 or early 2015; self-implement after 6 months • First half of decoupler amortization* in 1H’14; complete balance in 1H’15 • Periodic rate cases to support investment profile • Targeting to stay as close to rate neutral as possible through 2018 (vs. 2013) • ~$300 million surcharge** reduction implemented Q1 2014 • ~$350 million securitization surcharge reduction in Q1 2015 • Infrastructure Recovery Mechanism provides recovery of investments • Anticipate we can stay out of new rate filings for ~3 years • Targeting <2% average annual rate increase * MPSC approved application on April 1, 2014 ** Renewable energy, power supply cost recovery (PSCR) and choice incentive mechanisms 38
• Detroit Public Lighting Department (PLD) announced it was exiting the distribution business and its existing customers will be transitioned to DTE electric system • In May 2014, the MPSC approved DTE’s request for a transitional tariff and a reconciliation mechanism to recover costs related to the transition • First filing of annual reconciliation is March 31, 2015 • PLD will transfer 115 customers to DTE; PLD will continue to deliver power to some customer locations as DTE builds out of its distribution system • New distribution system build out by DTE will occur over 5 – 7 years with an expected capital investment of ~$275 million • DTE will not take over any assets or liabilities from PLD 39 City of Detroit to exit electricity distribution business
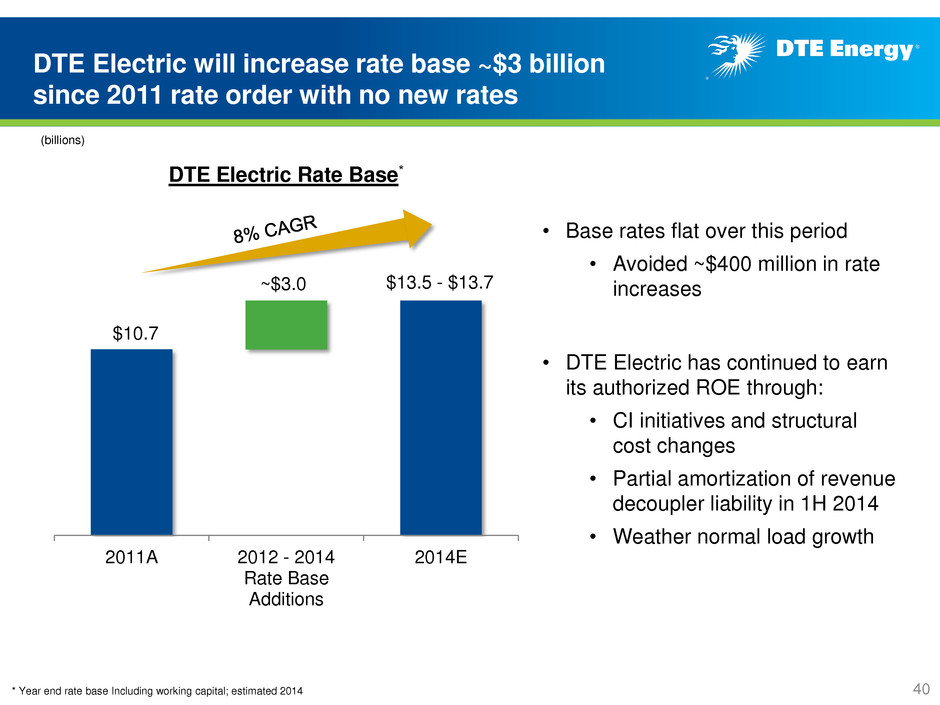
$10.7 2011A 2012 - 2014 Rate Base Additions 2014E DTE Electric will increase rate base ~$3 billion since 2011 rate order with no new rates DTE Electric Rate Base* (billions) • Base rates flat over this period • Avoided ~$400 million in rate increases • DTE Electric has continued to earn its authorized ROE through: • CI initiatives and structural cost changes • Partial amortization of revenue decoupler liability in 1H 2014 • Weather normal load growth $13.5 - $13.7 * Year end rate base Including working capital; estimated 2014 ~$3.0 40
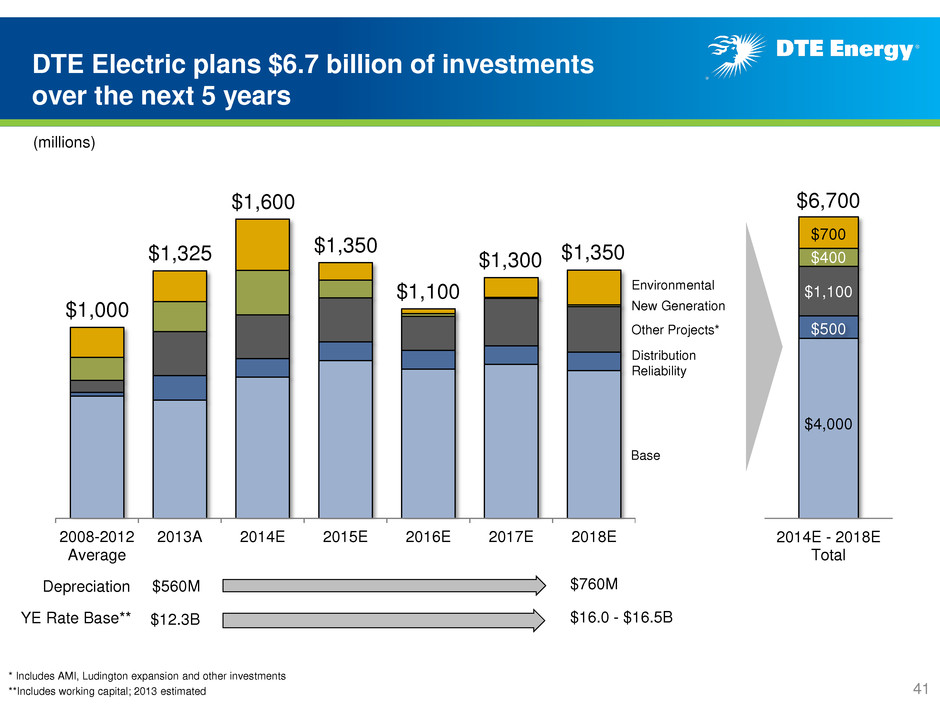
2014E - 2018E Total 2008-2012 Average 2013A 2014E 2015E 2016E 2017E 2018E DTE Electric plans $6.7 billion of investments over the next 5 years $1,325 $1,600 $1,300 $1,100 $1,350 $1,000 * Includes AMI, Ludington expansion and other investments **Includes working capital; 2013 estimated Base New Generation Other Projects* Environmental Distribution Reliability $700 $500 $400 $4,000 $6,700 $1,100 (millions) 41 $12.3B $16.0 - $16.5B YE Rate Base** $560M $760M Depreciation $1,350
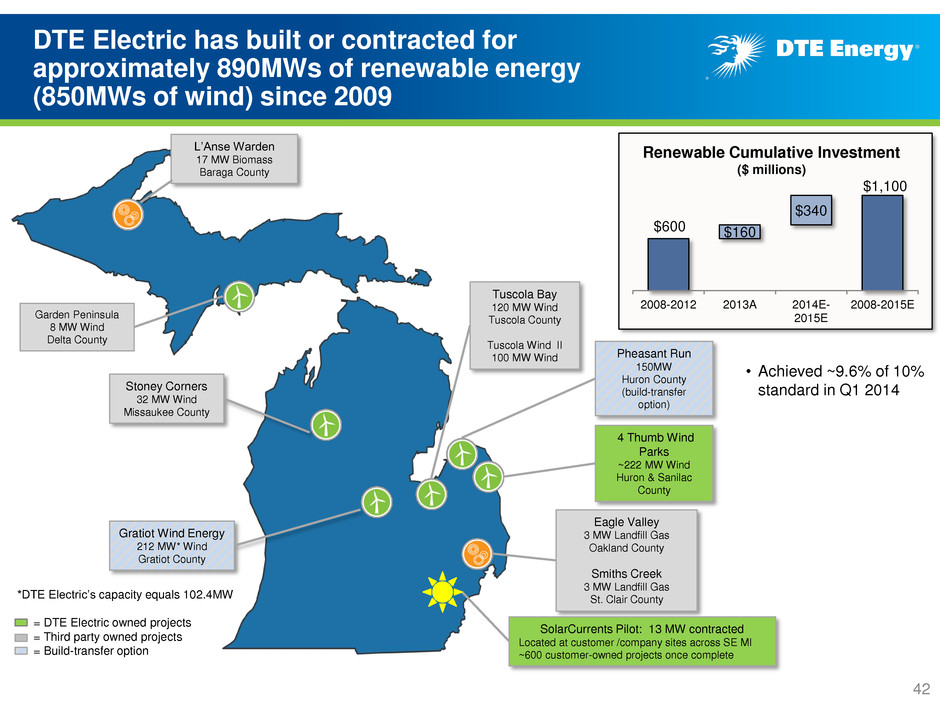
DTE Electric has built or contracted for approximately 890MWs of renewable energy (850MWs of wind) since 2009 42 L’Anse Warden 17 MW Biomass Baraga County Eagle Valley 3 MW Landfill Gas Oakland County Smiths Creek 3 MW Landfill Gas St. Clair County Stoney Corners 32 MW Wind Missaukee County Gratiot Wind Energy 212 MW* Wind Gratiot County SolarCurrents Pilot: 13 MW contracted Located at customer /company sites across SE MI ~600 customer-owned projects once complete *DTE Electric’s capacity equals 102.4MW = DTE Electric owned projects = Third party owned projects = Build-transfer option Tuscola Bay 120 MW Wind Tuscola County Tuscola Wind II 100 MW Wind 4 Thumb Wind Parks ~222 MW Wind Huron & Sanilac County Pheasant Run 150MW Huron County (build-transfer option) $600 $1,100 $160 $340 2008-2012 2013A 2014E- 2015E 2008-2015E Renewable Cumulative Investment ($ millions) • Achieved ~9.6% of 10% standard in Q1 2014 Garden Peninsula 8 MW Wind Delta County
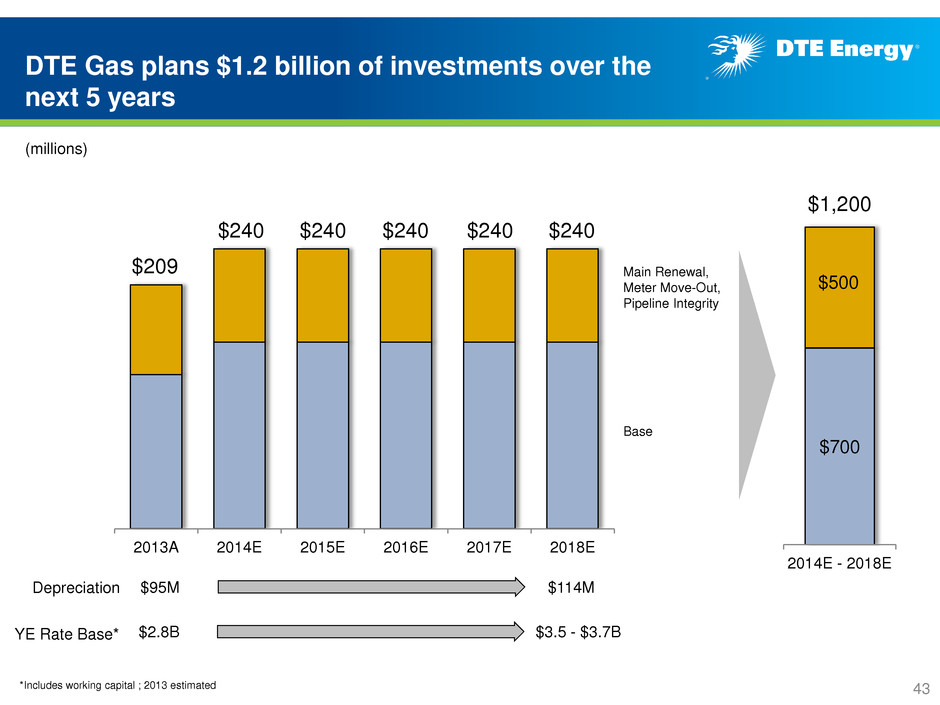
DTE Gas plans $1.2 billion of investments over the next 5 years 2013A 2014E 2015E 2016E 2017E 2018E $240 $240 $240 $240 $240 2014E - 2018E $500 $700 $1,200 Base Main Renewal, Meter Move-Out, Pipeline Integrity (millions) 43 $2.8B $3.5 - $3.7B YE Rate Base* $95M $114M Depreciation *Includes working capital ; 2013 estimated $209
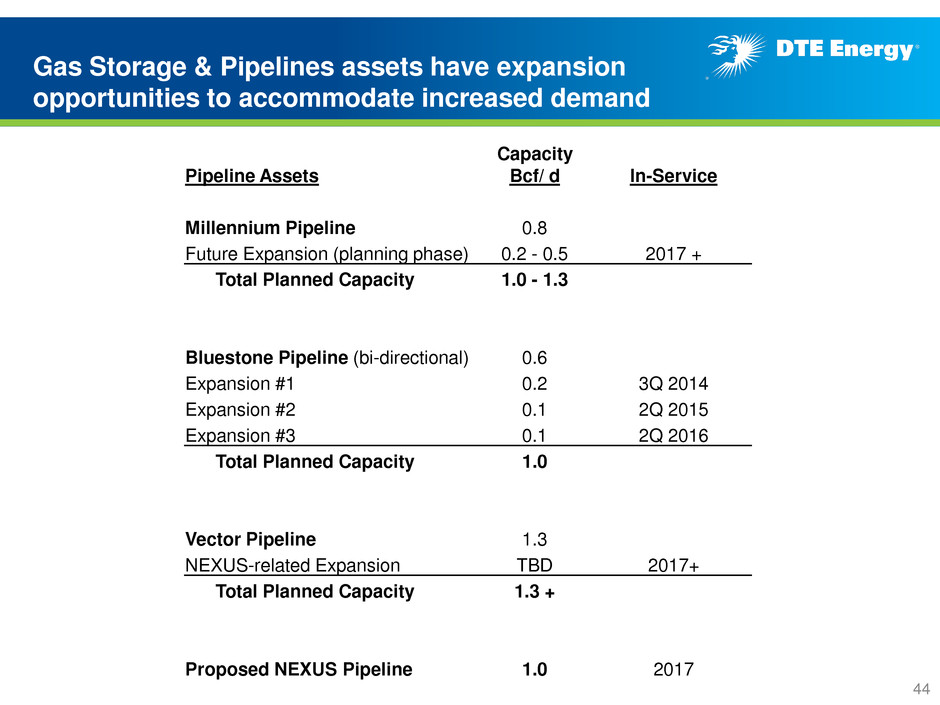
Pipeline Assets Capacity Bcf/ d In-Service Millennium Pipeline 0.8 Future Expansion (planning phase) 0.2 - 0.5 2017 + Total Planned Capacity 1.0 - 1.3 Bluestone Pipeline (bi-directional) 0.6 Expansion #1 0.2 3Q 2014 Expansion #2 0.1 2Q 2015 Expansion #3 0.1 2Q 2016 Total Planned Capacity 1.0 Vector Pipeline 1.3 NEXUS-related Expansion TBD 2017+ Total Planned Capacity 1.3 + Proposed NEXUS Pipeline 1.0 2017 Gas Storage & Pipelines assets have expansion opportunities to accommodate increased demand 44
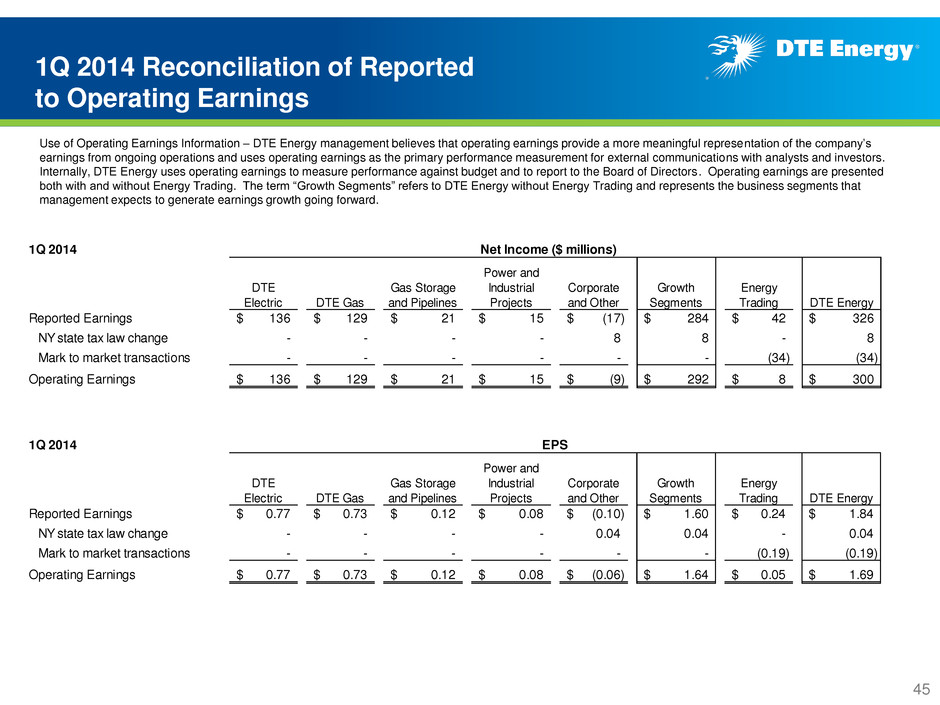
1Q 2014 DTE Electric DTE Gas Gas Storage and Pipelines Power and Industrial Projects Corporate and Other Growth Segments Energy Trading DTE Energy Reported Earnings 136$ 129$ 21$ 15$ (17)$ 284$ 42$ 326$ NY state tax law change - - - - 8 8 - 8 Mark to market transactions - - - - - - (34) (34) Operating Earnings 136$ 129$ 21$ 15$ (9)$ 292$ 8$ 300$ Net Income ($ millions)1Q 2014 Reconciliation of Reported to Operating Earnings 1Q 2014 DTE Electric DTE Gas Gas Storage and Pipelines Power and Industrial Projects Corporate and Other Growth Segments Energy Trading DTE Energy Reported Earnings 0.77$ 0.73$ 0.12$ 0.08$ (0.10)$ 1.60$ 0.24$ 1.84$ NY state tax law change - - - - 0.04 0.04 - 0.04 Mark to market transactions - - - - - - (0.19) (0.19) Operating Earnings 0.77$ 0.73$ 0.12$ 0.08$ (0.06)$ 1.64$ 0.05$ 1.69$ EPS Use of Operating Earnings Information – DTE Energy management believes that operating earnings provide a more meaningful representation of the company’s earnings from ongoing operations and uses operating earnings as the primary performance measurement for external communications with analysts and investors. Internally, DTE Energy uses operating earnings to measure performance against budget and to report to the Board of Directors. Operating earnings are presented both with and without Energy Trading. The term “Growth Segments” refers to DTE Energy without Energy Trading and represents the business segments that management expects to generate earnings growth going forward. 45
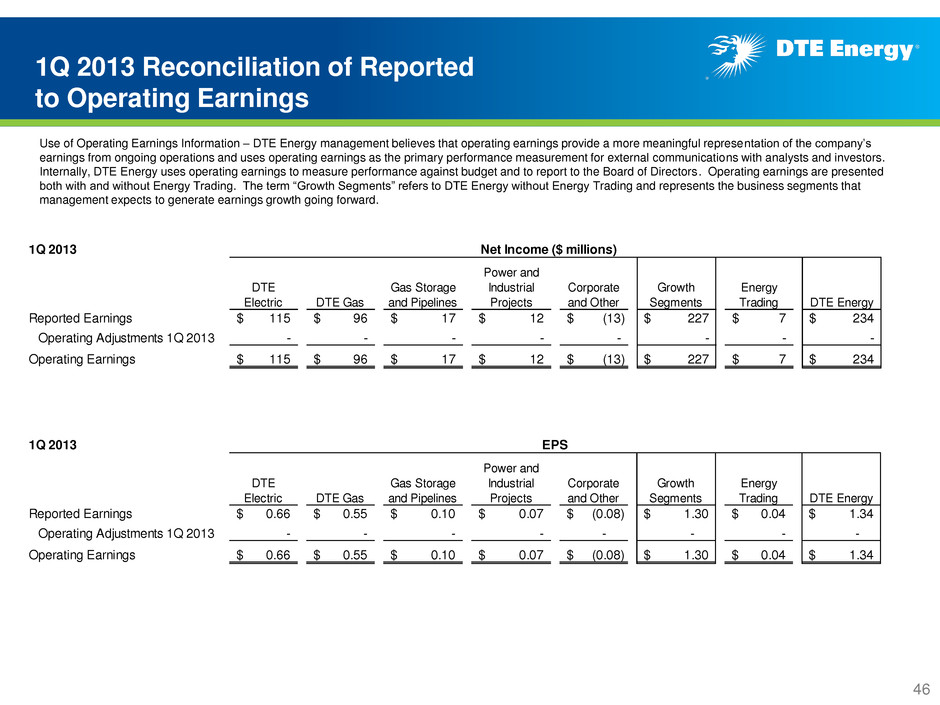
1Q 2013 DTE Electric DTE Gas Gas Storage and Pipelines Power and Industrial Projects Corporate and Other Growth Segments Energy Trading DTE Energy Reported Earnings 115$ 96$ 17$ 12$ (13)$ 227$ 7$ 234$ Operating Adjustments 1Q 2013 - - - - - - - - Operating Earnings 115$ 96$ 17$ 12$ (13)$ 227$ 7$ 234$ Net Income ($ millions) 1Q 2013 Reconciliation of Reported to Operating Earnings 1Q 2013 DTE Electric DTE Gas Gas Storage and Pipelines Power and Industrial Projects Corporate and Other Growth Segments Energy Trading DTE Energy Reported Earnings 0.66$ 0.55$ 0.10$ 0.07$ (0.08)$ 1.30$ 0.04$ 1.34$ Operating Adjustments 1Q 2013 - - - - - - - - Operating Earnings 0.66$ 0.55$ 0.10$ 0.07$ (0.08)$ 1.30$ 0.04$ 1.34$ EPS Use of Operating Earnings Information – DTE Energy management believes that operating earnings provide a more meaningful representation of the company’s earnings from ongoing operations and uses operating earnings as the primary performance measurement for external communications with analysts and investors. Internally, DTE Energy uses operating earnings to measure performance against budget and to report to the Board of Directors. Operating earnings are presented both with and without Energy Trading. The term “Growth Segments” refers to DTE Energy without Energy Trading and represents the business segments that management expects to generate earnings growth going forward. 46
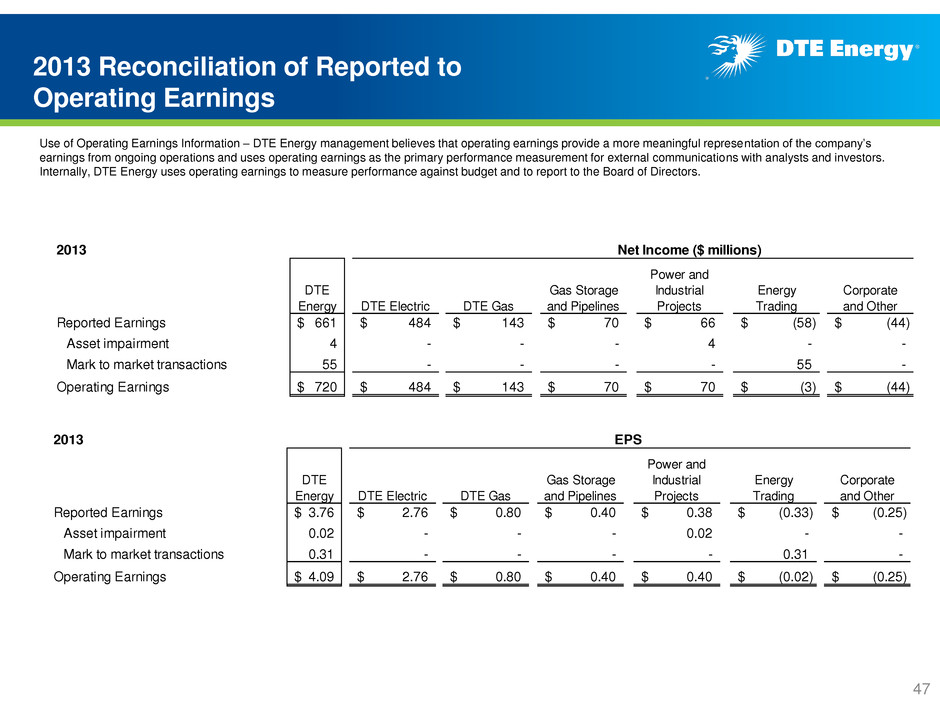
2013 Reconciliation of Reported to Operating Earnings Use of Operating Earnings Information – DTE Energy management believes that operating earnings provide a more meaningful representation of the company’s earnings from ongoing operations and uses operating earnings as the primary performance measurement for external communications with analysts and investors. Internally, DTE Energy uses operating earnings to measure performance against budget and to report to the Board of Directors. 2013 DTE Energy DTE Electric DTE Gas Gas Storage and Pipelines Power and Industrial Projects Energy Trading Corporate and Other Reported Earnings 3.76$ 2.76$ 0.80$ 0.40$ 0.38$ (0.33)$ (0.25)$ Asset impairment 0.02 - - - 0.02 - - Mark to market transactions 0.31 - - - - 0.31 - Operating Earnings 4.09$ 2.76$ 0.80$ 0.40$ 0.40$ (0.02)$ (0.25)$ EPS 2013 DTE Energy DTE Electric DTE Gas Gas Storage and Pipelines Power and Industrial Projects Energy Trading Corporate and Other Reported Earnings 661$ 484$ 143$ 70$ 66$ (58)$ (44)$ Asset impairment 4 - - - 4 - - Mark to market transactions 55 - - - - 55 - Operating Earnings 720$ 484$ 143$ 70$ 70$ (3)$ (44)$ Net Income ($ millions) 47
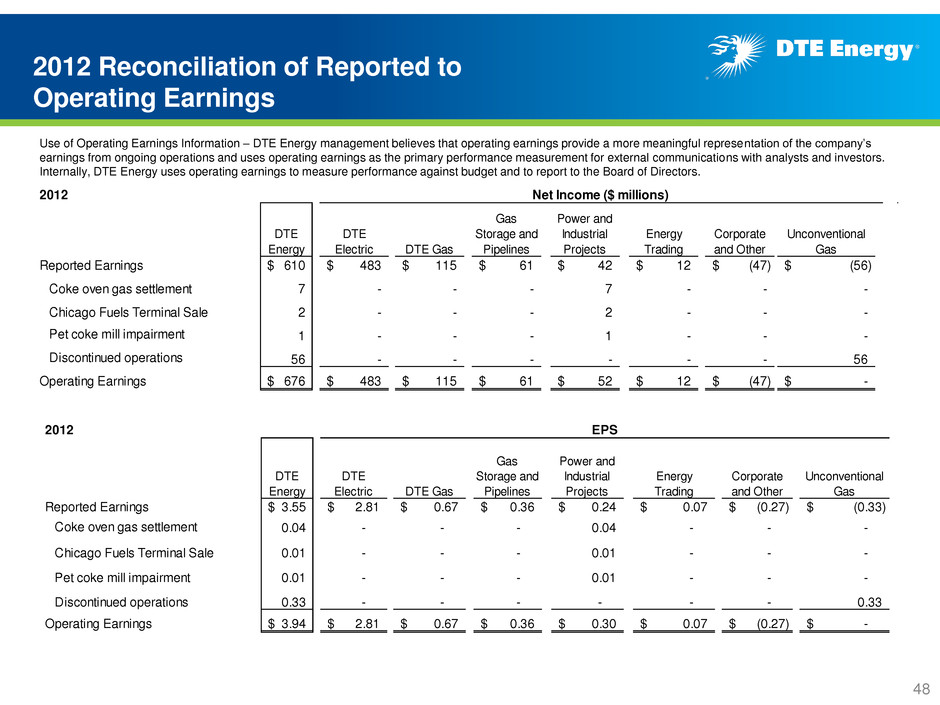
2012 Reconciliation of Reported to Operating Earnings 2012 DTE Energy DTE Electric DTE Gas Gas Storage and Pipelines Power and Industrial Projects Energy Trading Corporate and Other Unconventional Gas Reported Earnings 610$ 483$ 115$ 61$ 42$ 12$ (47)$ (56)$ Coke oven gas settlement 7 - - - 7 - - - Chicago Fuels Terminal Sale 2 - - - 2 - - - Pet coke mill impairment 1 - - - 1 - - - Discontinued operations 56 - - - - - - 56 Operating Earnings 676$ 483$ 115$ 61$ 52$ 12$ (47)$ -$ Net Income ($ millions) 2012 DTE Energy DTE Electric DTE Gas Gas Storage and Pipelines Power and Industrial Projects Energy Trading Corporate and Other Unconventional Gas Reported Earnings 3.55$ 2.81$ 0.67$ 0.36$ 0.24$ 0.07$ (0.27)$ (0.33)$ Coke oven gas settlement 0.04 - - - 0.04 - - - Chicago Fuels Terminal Sale 0.01 - - - 0.01 - - - Pet coke mill impairment 0.01 - - - 0.01 - - - Discontinued operations 0.33 - - - - - - 0.33 Operating Earnings 3.94$ 2.81$ 0.67$ 0.36$ 0.30$ 0.07$ (0.27)$ -$ EPS Use of Operating Earnings Information – DTE Energy management believes that operating earnings provide a more meaningful representation of the company’s earnings from ongoing operations and uses operating earnings as the primary performance measurement for external communications with analysts and investors. Internally, DTE Energy uses operating earnings to measure performance against budget and to report to the Board of Directors. 48
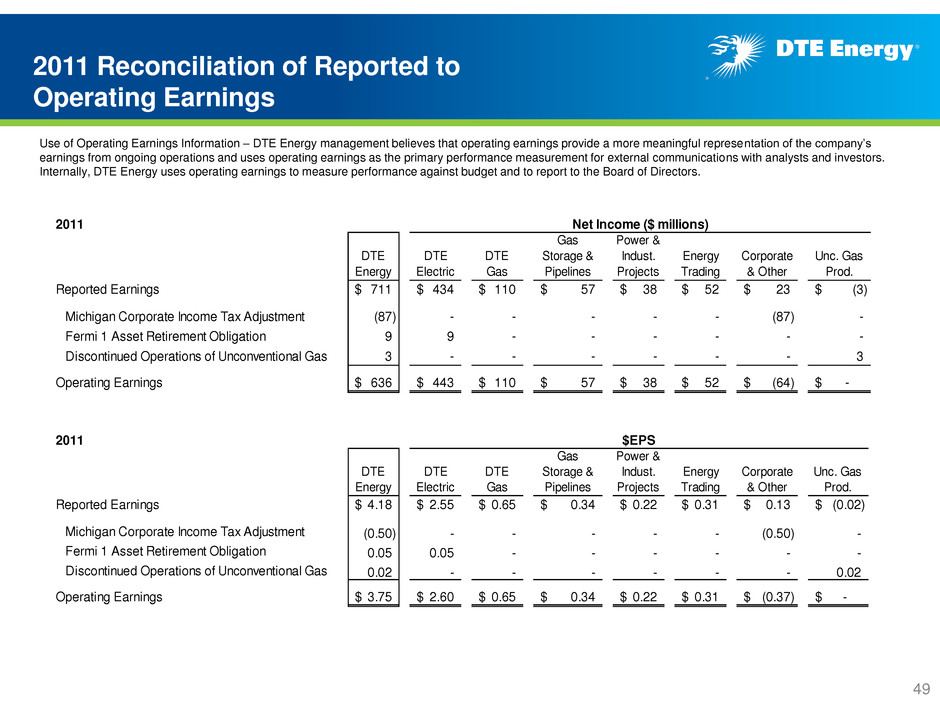
2011 Reconciliation of Reported to Operating Earnings 2011 DTE Energy DTE Electric DTE Gas Gas Storage & Pipelines Power & Indust. Projects Energy Trading Corporate & Other Unc. Gas Prod. Reported Earnings 711$ 434$ 110$ 57$ 38$ 52$ 23$ (3)$ Michigan Corporate Income Tax Adjustment (87) - - - - - (87) - Fermi 1 Asset Retirement Obligation 9 9 - - - - - - Discontinued Operations of Unconventional Gas 3 - - - - - - 3 Operating Earnings 636$ 443$ 110$ 57$ 38$ 52$ (64)$ -$ Net Income ($ millions) 2011 DTE Energy DTE Electric DTE Gas Gas Storage & Pipelines Power & Indust. Projects Energy Trading Corporate & Other Unc. Gas Prod. Repor ed Earnings 4.18 2.55 0.65 0.34 0.22 0.31 0.13 (0.02) Michigan Corporate Income Tax Adjustment (0.50) - - - - - (0.50) - Fermi 1 Asset Retirement Obligation 0.05 0.05 - - - - - - Discontinued Operations of Unconventional Gas 0.02 - - - - - - 0.02 Operating Earnings 3.75$ 2.60$ 0.65$ 0.34$ 0.22$ 0.31$ (0.37)$ -$ $EPS Use of Operating Earnings Information – DTE Energy management believes that operating earnings provide a more meaningful representation of the company’s earnings from ongoing operations and uses operating earnings as the primary performance measurement for external communications with analysts and investors. Internally, DTE Energy uses operating earnings to measure performance against budget and to report to the Board of Directors. 49
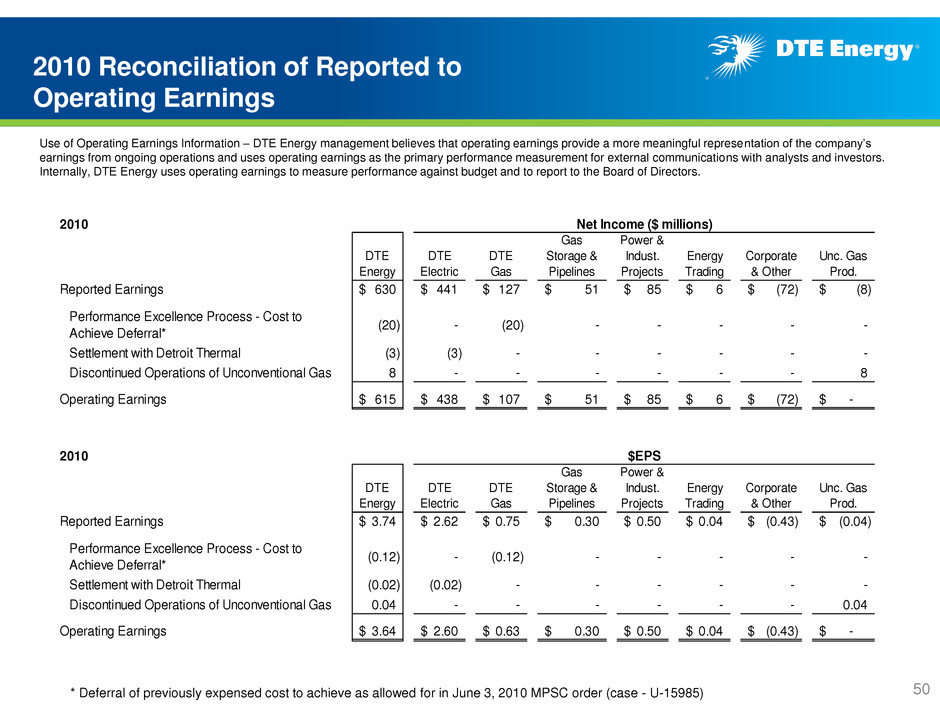
2010 Reconciliation of Reported to Operating Earnings * Deferral of previously expensed cost to achieve as allowed for in June 3, 2010 MPSC order (case - U-15985) 2010 DTE Energy DTE Electric DTE Gas Gas Storage & Pipelines Power & Indust. Projects Energy Trading Corporate & Other Unc. Gas Prod. eported Earnings 630$ 441$ 127$ 51$ 85$ 6$ (72)$ (8)$ Performance Excellence Process - Cost to Achieve Deferral* (20) - (20) - - - - - Settlement with Detroit Thermal (3) (3) - - - - - - Discontinued Operations of Unconventional Gas 8 - - - - - - 8 Operating Earnings 615$ 438$ 107$ 51$ 85$ 6$ (72)$ -$ Net Income ($ millions) 2010 DTE Energy DTE Electric DTE Gas Gas Storage & Pipelines Power & Indust. Projects Energy Trading Corporate & Other Unc. Gas Prod. Reported Earnings 3.74$ 2.62$ 0.75$ 0.30$ 0.50$ 0.04$ (0.43)$ (0.04)$ P rformance Excellence Process - Cost to Achieve Deferral* (0.12) - (0.12) - - - - - Settlement with Detroit Thermal (0.02) (0.02) - - - - - - Discontinued Operations of Unconventional Gas 0.04 - - - - - - 0.04 Operating Earnings 3.64$ 2.60$ 0.63$ 0.30$ 0.50$ 0.04$ (0.43)$ -$ $EPS Use of Operating Earnings Information – DTE Energy management believes that operating earnings provide a more meaningful representation of the company’s earnings from ongoing operations and uses operating earnings as the primary performance measurement for external communications with analysts and investors. Internally, DTE Energy uses operating earnings to measure performance against budget and to report to the Board of Directors. 50
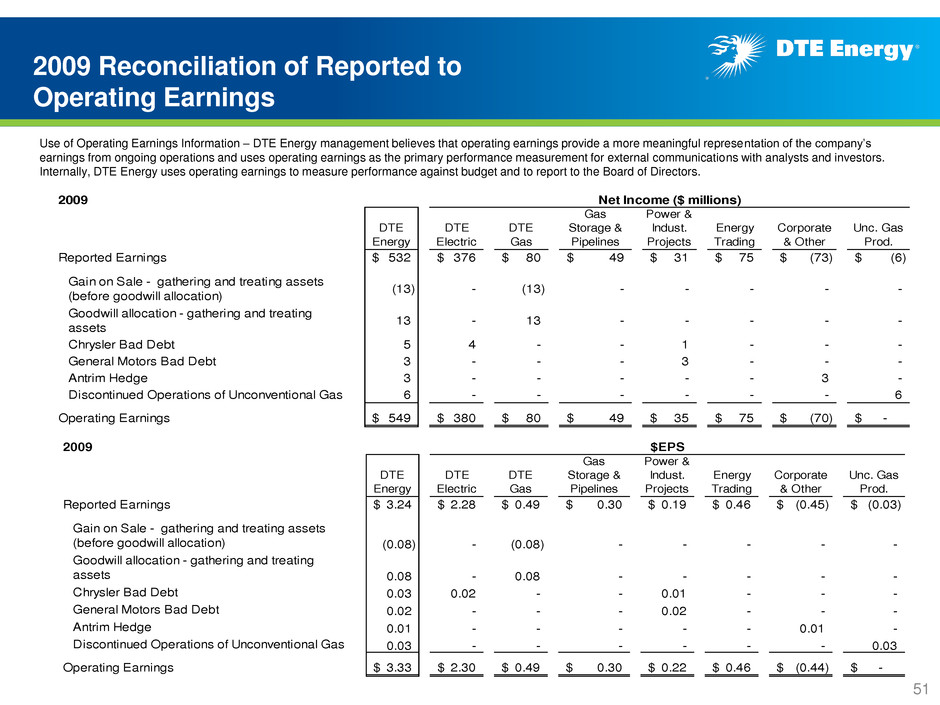
2009 Reconciliation of Reported to Operating Earnings 2009 DTE Energy DTE Electric DTE Gas Gas Storage & Pipelines Power & Indust. Projects Energy Trading Corporate & Other Unc. Gas Prod. Reported Earnings 532$ 376$ 80$ 49$ 31$ 75$ (73)$ (6)$ Gain on Sale - gathering and treating assets (before goodwill allocation) (13) - (13) - - - - - Goodwill allocation - gathering and treating assets 13 - 13 - - - - - Chrysler Bad Debt 5 4 - - 1 - - - General Motors Bad Debt 3 - - - 3 - - - Antrim Hedge 3 - - - - - 3 - Discontinued Operations of Unconventional Gas 6 - - - - - - 6 Operating Earnings 549$ 380$ 80$ 49$ 35$ 75$ (70)$ -$ Net Income ($ millions) 2009 DTE Energy DTE Electric DTE Gas Gas Storage & Pipelines Power & Indust. Projects Energy Trading Corporate & Other Unc. Gas Prod. Reported Earnings 3.24$ 2.28$ 0.49$ 0.30$ 0.19$ 0.46$ (0.45)$ (0.03)$ Gain on Sale - ga hering and treating assets (b fore go dwill allocation) (0.08) - (0.08) - - - - - Goodwill allocation - gathering and treating assets 0.08 - 0.08 - - - - - Chrysler B d Debt 0.03 0.02 - - 0.01 - - - General Motors Bad Debt 0.02 - - - 0.02 - - - Antrim Hedge 0.01 - - - - - 0.01 - Discontinued Operations of Unconventional Gas 0.03 - - - - - - 0.03 Operating Earnings 3.33$ 2.30$ 0.49$ 0.30$ 0.22$ 0.46$ (0.44)$ -$ $EPS Use of Operating Earnings Information – DTE Energy management believes that operating earnings provide a more meaningful representation of the company’s earnings from ongoing operations and uses operating earnings as the primary performance measurement for external communications with analysts and investors. Internally, DTE Energy uses operating earnings to measure performance against budget and to report to the Board of Directors. 51
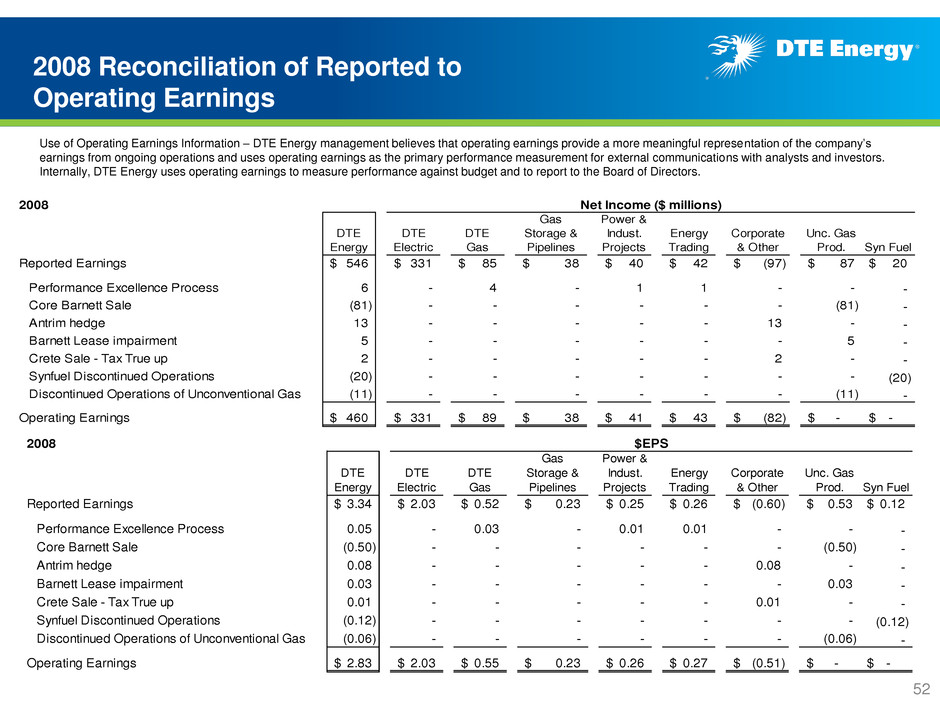
2008 Reconciliation of Reported to Operating Earnings 2008 DTE Energy DTE Electric DTE Gas Gas Storage & Pipelines Power & Indust. Projects Energy Trading Corporate & Other Unc. Gas Prod. Syn Fuel Reported Earnings 546$ 331$ 85$ 38$ 40$ 42$ (97)$ 87$ 20$ Performance Excellence Process 6 - 4 - 1 1 - - - Core Barnett Sale (81) - - - - - - (81) - Antrim hedge 13 - - - - - 13 - - Barnett Lease impairment 5 - - - - - - 5 - Crete Sale - Tax True up 2 - - - - - 2 - - Synfuel Discontinued Operations (20) - - - - - - - (20) Discontinued Operations of Unconventional Gas (11) - - - - - - (11) - Operating Earnings 460$ 331$ 89$ 38$ 41$ 43$ (82)$ -$ -$ Net Income ($ millions) 2008 DTE Energy DTE Electric DTE Gas Gas Storage & Pipelines Power & Indust. Projects Energy Trading Corporate & Other Unc. Gas Prod. Syn Fuel Reported Earnings 3.34$ 2.03$ 0.52$ 0.23$ 0.25$ 0.26$ (0.60)$ 0.53$ 0.12$ Perform nce E cellence Process 0.05 - 0.03 - 0.01 0.01 - - - Core Barnett Sale (0.50) - - - - - - (0.50) - Antrim hedge 0.08 - - - - - 0.08 - - Barnett Lease impairment 0.03 - - - - - - 0.03 - Crete Sale - Tax True up 0.01 - - - - - 0.01 - - Synfuel Discontinued Operations (0.12) - - - - - - - (0.12) Discontinued Operations of Unconventional Gas (0.06) - - - - - - (0.06) - Operating Earnings 2.83$ 2.03$ 0.55$ 0.23$ 0.26$ 0.27$ (0.51)$ -$ -$ $EPS Use of Operating Earnings Information – DTE Energy management believes that operating earnings provide a more meaningful representation of the company’s earnings from ongoing operations and uses operating earnings as the primary performance measurement for external communications with a alysts and investors. Internally, DTE Energy uses operating earnings to measure performance against budget and to report to the Board of Directors. 52
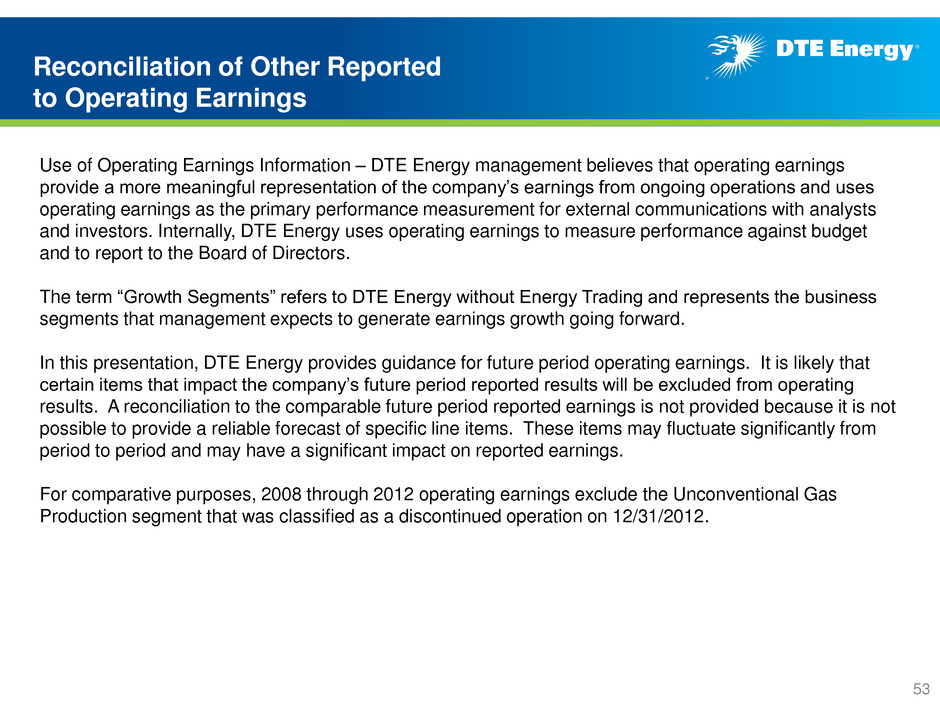
Reconciliation of Other Reported to Operating Earnings Use of Operating Earnings Information – DTE Energy management believes that operating earnings provide a more meaningful representation of the company’s earnings from ongoing operations and uses operating earnings as the primary performance measurement for external communications with analysts and investors. Internally, DTE Energy uses operating earnings to measure performance against budget and to report to the Board of Directors. The term “Growth Segments” refers to DTE Energy without Energy Trading and represents the business segments that management expects to generate earnings growth going forward. In this presentation, DTE Energy provides guidance for future period operating earnings. It is likely that certain items that impact the company’s future period reported results will be excluded from operating results. A reconciliation to the comparable future period reported earnings is not provided because it is not possible to provide a reliable forecast of specific line items. These items may fluctuate significantly from period to period and may have a significant impact on reported earnings. For comparative purposes, 2008 through 2012 operating earnings exclude the Unconventional Gas Production segment that was classified as a discontinued operation on 12/31/2012. 53


