
Year End 2017 Earnings Conference Call February 16, 2018 EXHIBIT 99.2
2 Safe Harbor Statement Many factors impact forward-looking statements including, but not limited to, the following: impact of regulation by the EPA, the FERC, the MPSC, the NRC, and for DTE Energy, the CFTC, as well as other applicable governmental proceedings and regulations, including any associated impact on rate structures; the amount and timing of cost recovery allowed as a result of regulatory proceedings, related appeals, or new legislation, including legislative amendments and retail access programs; economic conditions and population changes in our geographic area resulting in changes in demand, customer conservation, and thefts of electricity and, for DTE Energy, natural gas; environmental issues, laws, regulations, and the increasing costs of remediation and compliance, including actual and potential new federal and state requirements; health, safety, financial, environmental, and regulatory risks associated with ownership and operation of nuclear facilities; the cost of protecting assets against, or damage due to, cyber crime and terrorism; volatility in the short-term natural gas storage markets impacting third-party storage revenues related to DTE Energy; impact of volatility of prices in the oil and gas markets on DTE Energy's gas storage and pipelines operations; impact of volatility in prices in the international steel markets on DTE Energy's power and industrial projects operations; volatility in commodity markets, deviations in weather, and related risks impacting the results of DTE Energy's energy trading operations; changes in the cost and availability of coal and other raw materials, purchased power, and natural gas; advances in technology that produce power or reduce power consumption; changes in the financial condition of DTE Energy's significant customers and strategic partners; the potential for losses on investments, including nuclear decommissioning and benefit plan assets and the related increases in future expense and contributions; access to capital markets and the results of other financing efforts which can be affected by credit agency ratings; instability in capital markets which could impact availability of short and long-term financing; the timing and extent of changes in interest rates; the level of borrowings; the potential for increased costs or delays in completion of significant capital projects; changes in, and application of, federal, state, and local tax laws and their interpretations, including the Internal Revenue Code, regulations, rulings, court proceedings, and audits; the effects of weather and other natural phenomena on operations and sales to customers, and purchases from suppliers; unplanned outages; employee relations and the impact of collective bargaining agreements; the risk of a major safety incident at an electric distribution or generation facility and, for DTE Energy, a gas storage, transmission, or distribution facility; the availability, cost, coverage, and terms of insurance and stability of insurance providers; cost reduction efforts and the maximization of plant and distribution system performance; the effects of competition; changes in and application of accounting standards and financial reporting regulations; changes in federal or state laws and their interpretation with respect to regulation, energy policy, and other business issues; contract disputes, binding arbitration, litigation, and related appeals; and the risks discussed in our public filings with the Securities and Exchange Commission. New factors emerge from time to time. We cannot predict what factors may arise or how such factors may cause results to differ materially from those contained in any forward-looking statement. Any forward- looking statements speak only as of the date on which such statements are made. We undertake no obligation to update any forward-looking statement to reflect events or circumstances after the date on which such statement is made or to reflect the occurrence of unanticipated events. This presentation should also be read in conjunction with the Forward-Looking Statements section of the joint DTE Energy and DTE Electric 2017 Form 10-K (which section is incorporated by reference herein), and in conjunction with other SEC reports filed by DTE Energy and DTE Electric.
3 • Gerry Anderson – Chairman and CEO • Jerry Norcia – President and COO • Peter Oleksiak – Senior Vice President and CFO • Barbara Tuckfield – Director, Investor Relations Participants
4 • Overview • Financial Update • Long-Term Growth Update
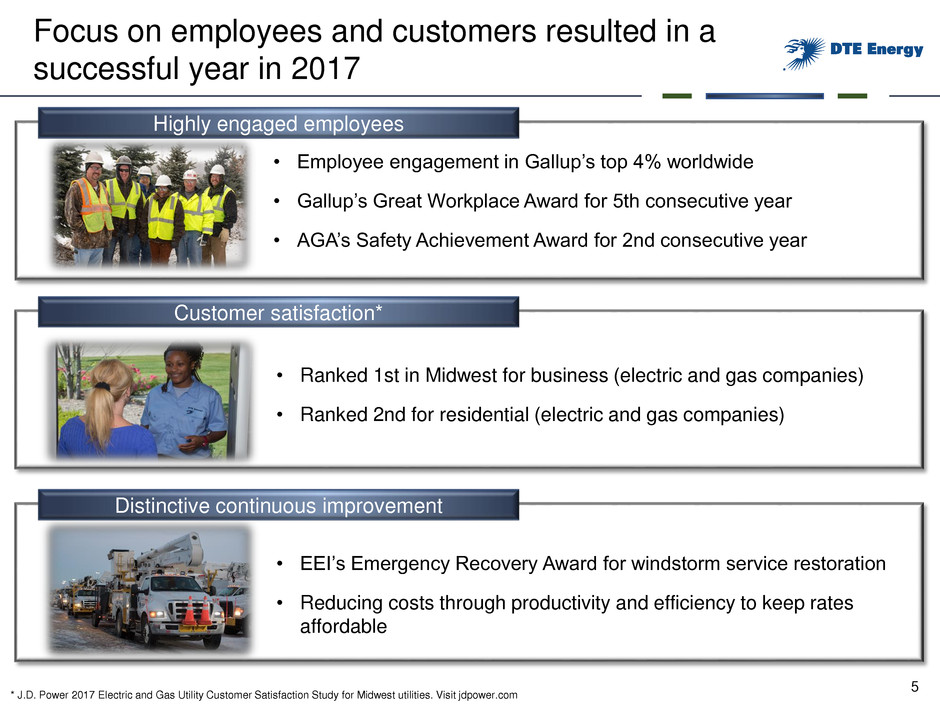
5 Focus on employees and customers resulted in a successful year in 2017 * J.D. Power 2017 Electric and Gas Utility Customer Satisfaction Study for Midwest utilities. Visit jdpower.com • Employee engagement in Gallup’s top 4% worldwide • Gallup’s Great Workplace Award for 5th consecutive year • AGA’s Safety Achievement Award for 2nd consecutive year Highly engaged employees • Ranked 1st in Midwest for business (electric and gas companies) • Ranked 2nd for residential (electric and gas companies) Customer satisfaction* • EEI’s Emergency Recovery Award for windstorm service restoration • Reducing costs through productivity and efficiency to keep rates affordable Distinctive continuous improvement
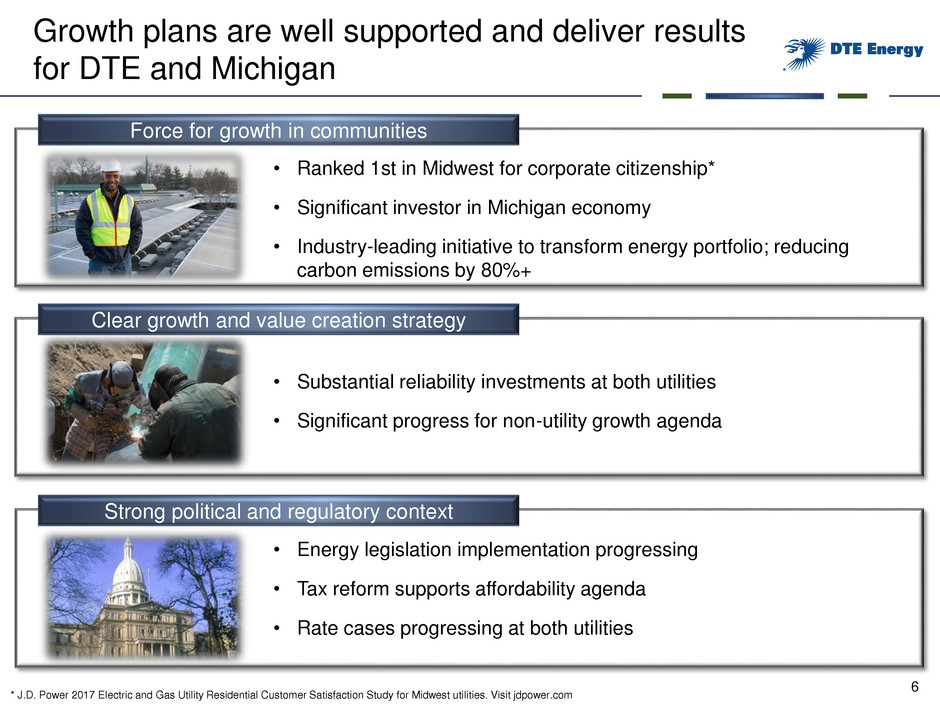
6 Growth plans are well supported and deliver results for DTE and Michigan • Energy legislation implementation progressing • Tax reform supports affordability agenda • Rate cases progressing at both utilities Strong political and regulatory context • Substantial reliability investments at both utilities • Significant progress for non-utility growth agenda Clear growth and value creation strategy • Ranked 1st in Midwest for corporate citizenship* • Significant investor in Michigan economy • Industry-leading initiative to transform energy portfolio; reducing carbon emissions by 80%+ Force for growth in communities * J.D. Power 2017 Electric and Gas Utility Residential Customer Satisfaction Study for Midwest utilities. Visit jdpower.com
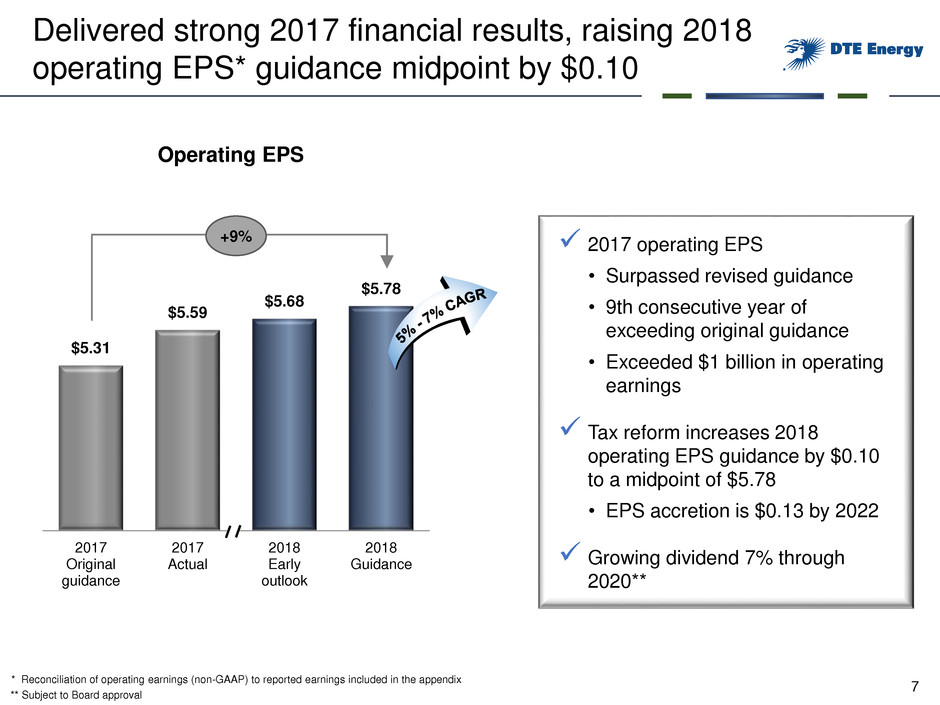
7 Delivered strong 2017 financial results, raising 2018 operating EPS* guidance midpoint by $0.10 $5.31 $5.59 $5.68 $5.78 2017 Original guidance 2017 Actual 2018 Early outlook 2018 Guidance Operating EPS * Reconciliation of operating earnings (non-GAAP) to reported earnings included in the appendix 2017 operating EPS • Surpassed revised guidance • 9th consecutive year of exceeding original guidance • Exceeded $1 billion in operating earnings Tax reform increases 2018 operating EPS guidance by $0.10 to a midpoint of $5.78 • EPS accretion is $0.13 by 2022 Growing dividend 7% through 2020** +9% ** Subject to Board approval
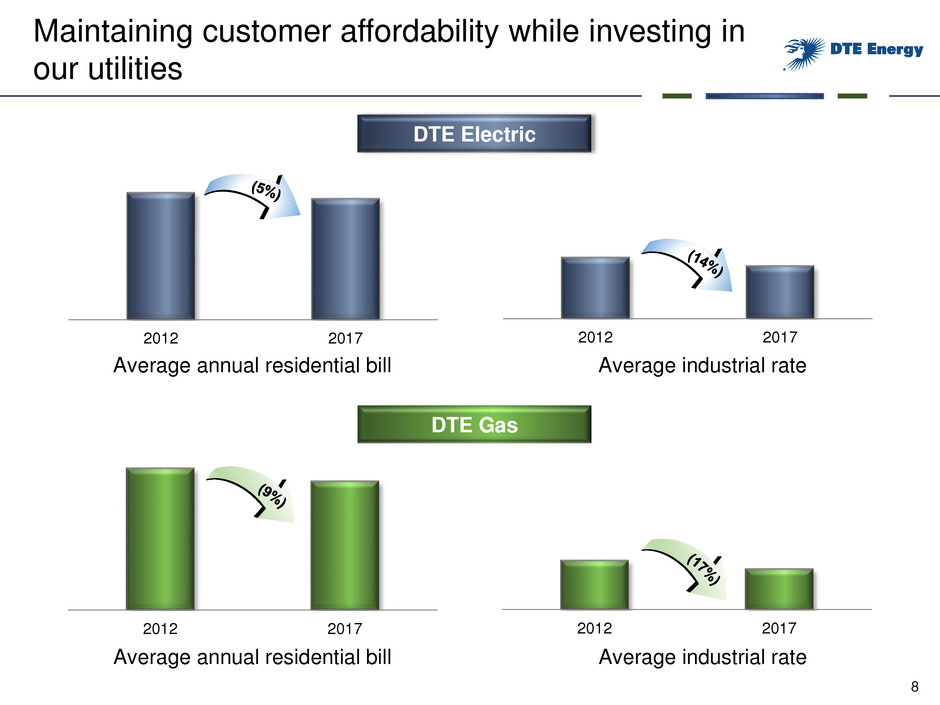
8 Maintaining customer affordability while investing in our utilities 2012 20172012 2017 2012 2017 Average industrial rate 2012 2017 Average annual residential bill Average industrial rate Average annual residential bill DTE Gas DTE Electric
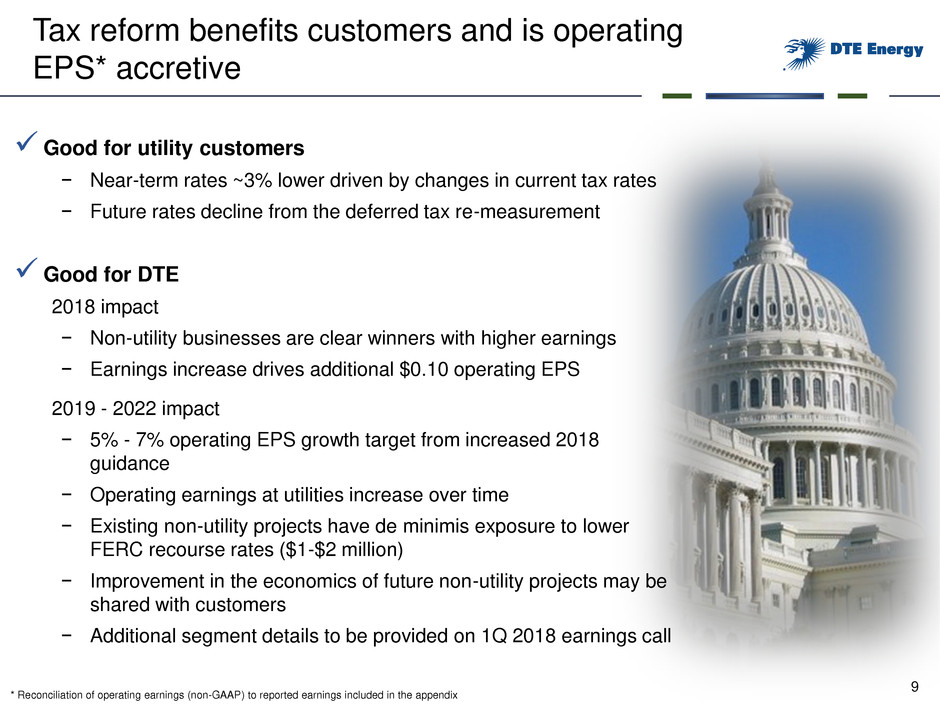
9 Tax reform benefits customers and is operating EPS* accretive Good for DTE 2018 impact − Non-utility businesses are clear winners with higher earnings − Earnings increase drives additional $0.10 operating EPS 2019 - 2022 impact − 5% - 7% operating EPS growth target from increased 2018 guidance − Operating earnings at utilities increase over time − Existing non-utility projects have de minimis exposure to lower FERC recourse rates ($1-$2 million) − Improvement in the economics of future non-utility projects may be shared with customers − Additional segment details to be provided on 1Q 2018 earnings call Good for utility customers − Near-term rates ~3% lower driven by changes in current tax rates − Future rates decline from the deferred tax re-measurement * Reconciliation of operating earnings (non-GAAP) to reported earnings included in the appendix
10 • Overview • Financial Update • Long-Term Growth Update
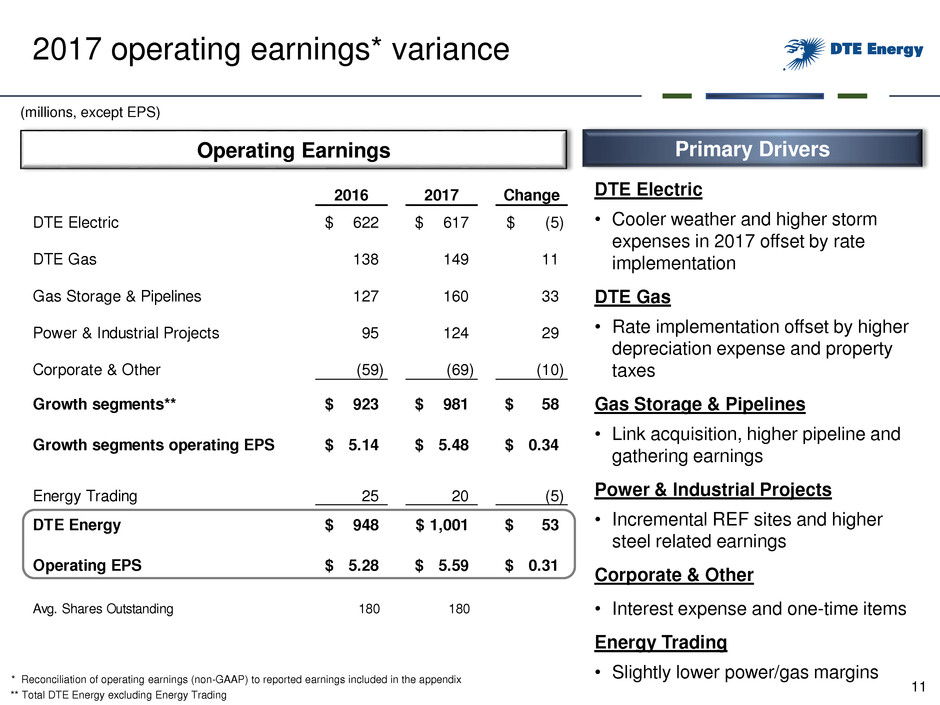
11 2016 2017 Change DTE Electric 622$ 617$ (5)$ DTE Gas 138 149 11 Gas Storage & Pipelines 127 160 33 Power & Industrial Projects 95 124 29 Corporate & Other (59) (69) (10) Growth segments** 923$ 981$ 58$ Growth segments operating EPS 5.14$ 5.48$ 0.34$ Energy Trading 25 20 (5) DTE Energy 948$ 1,001$ 53$ Operating EPS 5.28$ 5.59$ 0.31$ Avg. Shares Outstanding 180 180 DTE Electric • Cooler weather and higher storm expenses in 2017 offset by rate implementation DTE Gas • Rate implementation offset by higher depreciation expense and property taxes Gas Storage & Pipelines • Link acquisition, higher pipeline and gathering earnings Power & Industrial Projects • Incremental REF sites and higher steel related earnings Corporate & Other • Interest expense and one-time items Energy Trading • Slightly lower power/gas margins (millions, except EPS) Primary DriversOperating Earnings 2017 operating earnings* variance * Reconciliation of operating earnings (non-GAAP) to reported earnings included in the appendix ** Total DTE Energy excluding Energy Trading
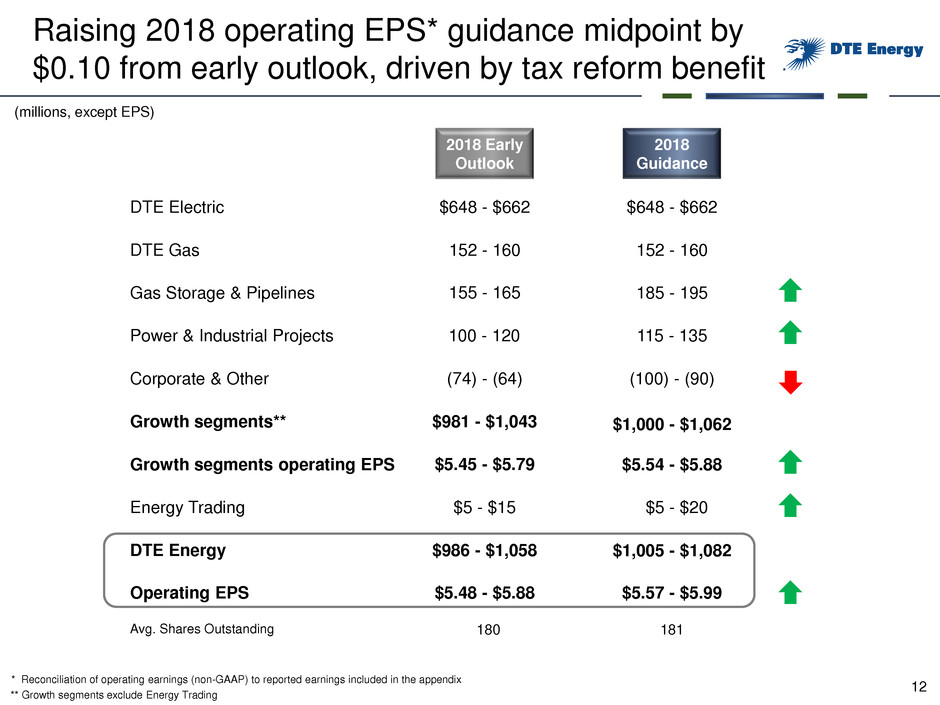
12 2018 Guidance DTE Electric DTE Gas Gas Storage & Pipelines Power & Industrial Projects Corporate & Other Growth segments** Growth segments operating EPS Energy Trading DTE Energy Operating EPS Avg. Shares Outstanding $648 - $662 152 - 160 185 - 195 115 - 135 (100) - (90) $1,000 - $1,062 $5.54 - $5.88 $5 - $20 $1,005 - $1,082 $5.57 - $5.99 (millions, except EPS) 181 $648 - $662 152 - 160 155 - 165 100 - 120 (74) - (64) $981 - $1,043 $5.45 - $5.79 $5 - $15 $986 - $1,058 $5.48 - $5.88 2018 Early Outlook 180 Raising 2018 operating EPS* guidance midpoint by $0.10 from early outlook, driven by tax reform benefit * Reconciliation of operating earnings (non-GAAP) to reported earnings included in the appendix ** Growth segments exclude Energy Trading
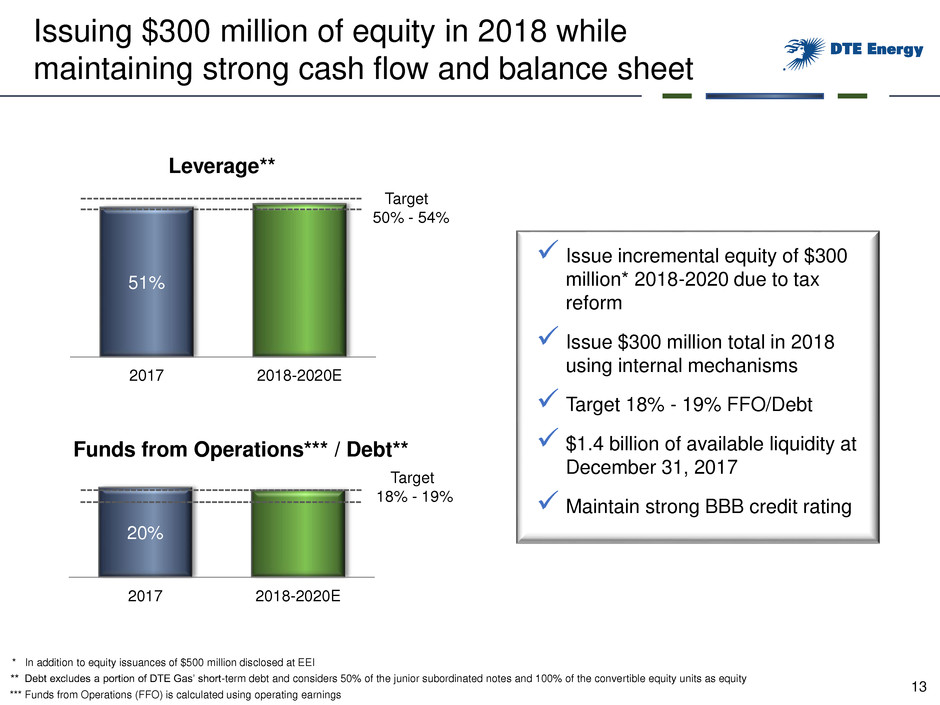
13 Issuing $300 million of equity in 2018 while maintaining strong cash flow and balance sheet 20% 2017 2018-2020E 51% 2017 2018-2020E Leverage** Funds from Operations*** / Debt** Target 50% - 54% Target 18% - 19% Issue incremental equity of $300 million* 2018-2020 due to tax reform Issue $300 million total in 2018 using internal mechanisms Target 18% - 19% FFO/Debt $1.4 billion of available liquidity at December 31, 2017 Maintain strong BBB credit rating *** Funds from Operations (FFO) is calculated using operating earnings ** Debt excludes a portion of DTE Gas’ short-term debt and considers 50% of the junior subordinated notes and 100% of the convertible equity units as equity * In addition to equity issuances of $500 million disclosed at EEI
14 • Overview • Financial Update • Long-Term Growth Update
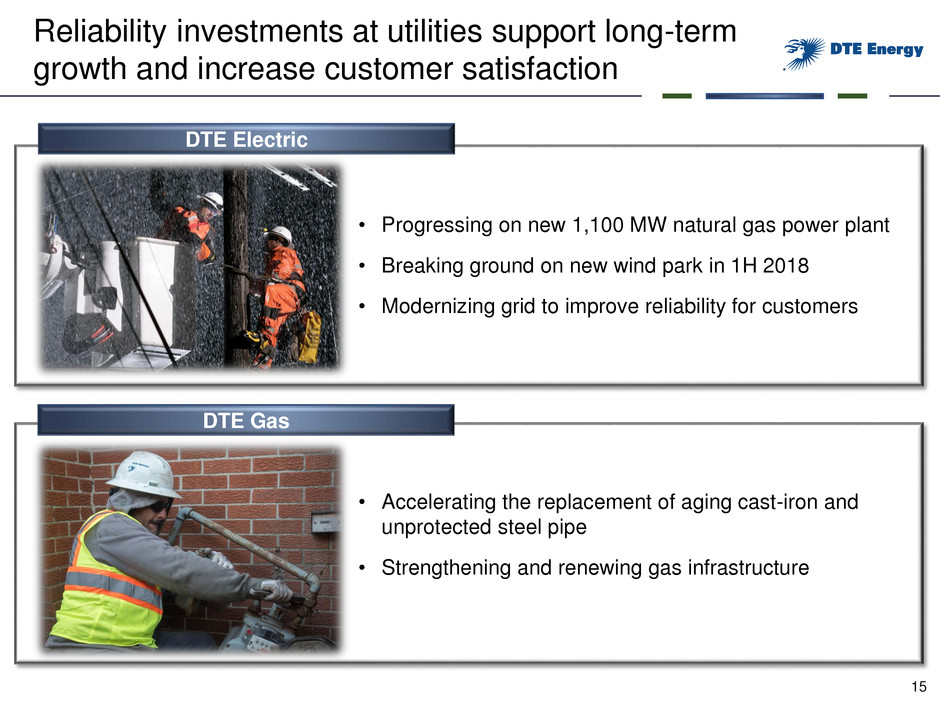
15 Reliability investments at utilities support long-term growth and increase customer satisfaction DTE Electric DTE Gas • Accelerating the replacement of aging cast-iron and unprotected steel pipe • Strengthening and renewing gas infrastructure • Progressing on new 1,100 MW natural gas power plant • Breaking ground on new wind park in 1H 2018 • Modernizing grid to improve reliability for customers
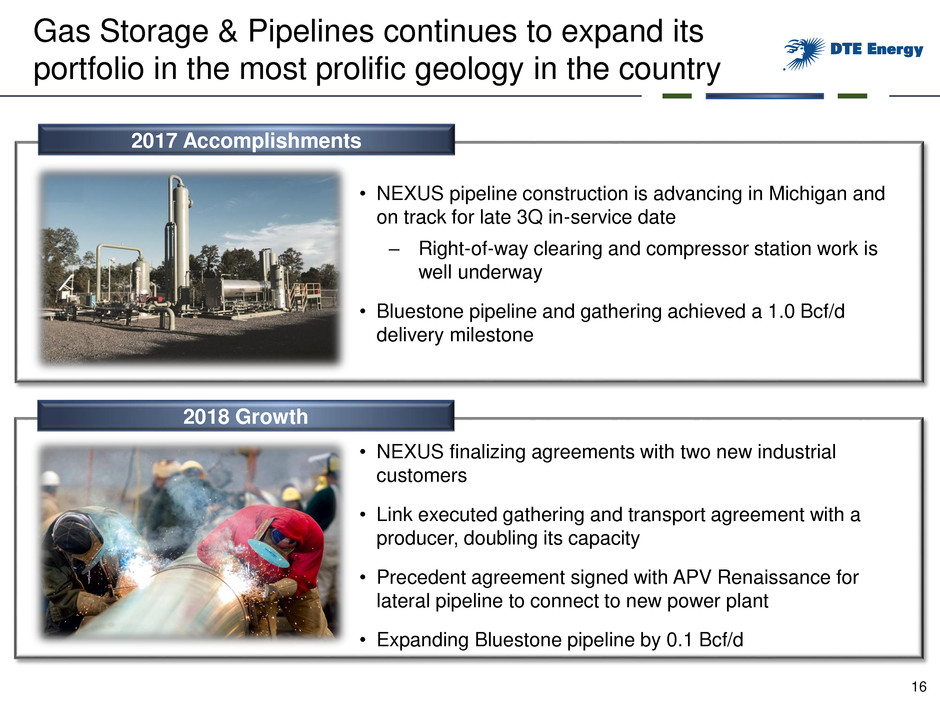
16 Gas Storage & Pipelines continues to expand its portfolio in the most prolific geology in the country 2017 Accomplishments • NEXUS pipeline construction is advancing in Michigan and on track for late 3Q in-service date ‒ Right-of-way clearing and compressor station work is well underway • Bluestone pipeline and gathering achieved a 1.0 Bcf/d delivery milestone 2018 Growth • NEXUS finalizing agreements with two new industrial customers • Link executed gathering and transport agreement with a producer, doubling its capacity • Precedent agreement signed with APV Renaissance for lateral pipeline to connect to new power plant • Expanding Bluestone pipeline by 0.1 Bcf/d
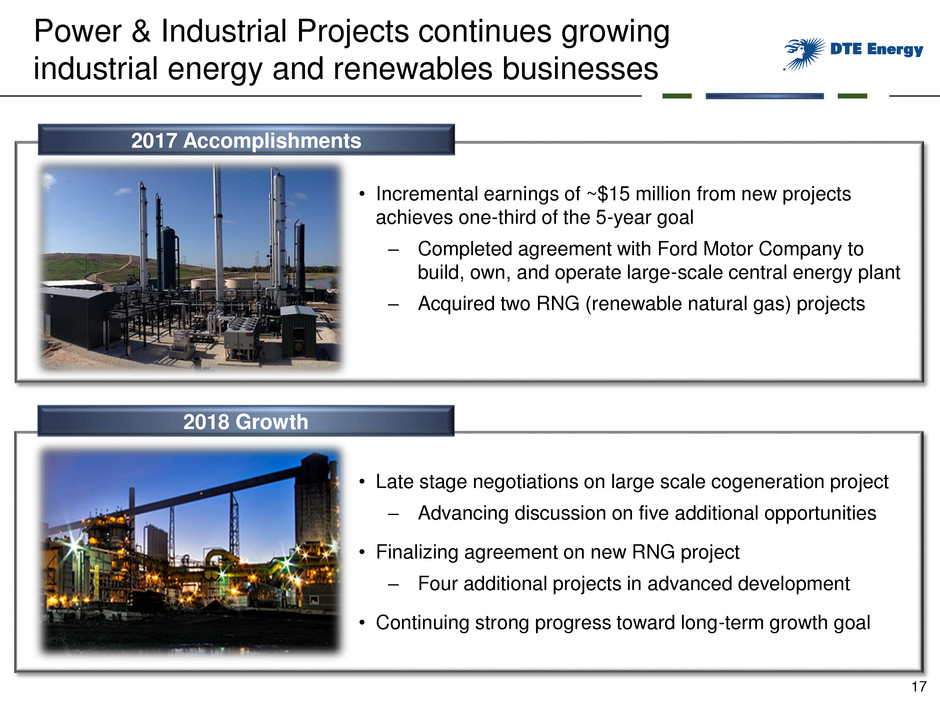
17 Power & Industrial Projects continues growing industrial energy and renewables businesses 2017 Accomplishments 2018 Growth • Incremental earnings of ~$15 million from new projects achieves one-third of the 5-year goal ‒ Completed agreement with Ford Motor Company to build, own, and operate large-scale central energy plant ‒ Acquired two RNG (renewable natural gas) projects • Late stage negotiations on large scale cogeneration project ‒ Advancing discussion on five additional opportunities • Finalizing agreement on new RNG project ‒ Four additional projects in advanced development • Continuing strong progress toward long-term growth goal
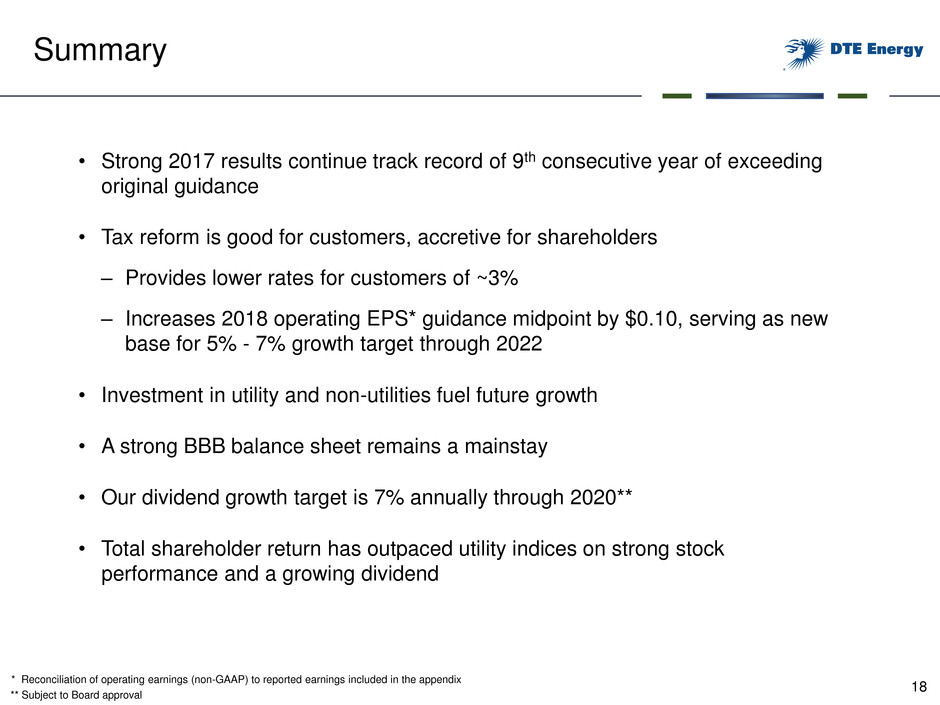
18 • Strong 2017 results continue track record of 9th consecutive year of exceeding original guidance • Tax reform is good for customers, accretive for shareholders ‒ Provides lower rates for customers of ~3% ‒ Increases 2018 operating EPS* guidance midpoint by $0.10, serving as new base for 5% - 7% growth target through 2022 • Investment in utility and non-utilities fuel future growth • A strong BBB balance sheet remains a mainstay • Our dividend growth target is 7% annually through 2020** • Total shareholder return has outpaced utility indices on strong stock performance and a growing dividend Summary * Reconciliation of operating earnings (non-GAAP) to reported earnings included in the appendix ** Subject to Board approval

19 DTE Energy Investor Relations www.dteenergy.com/investors (313) 235-8030 Contact us
20 Appendix
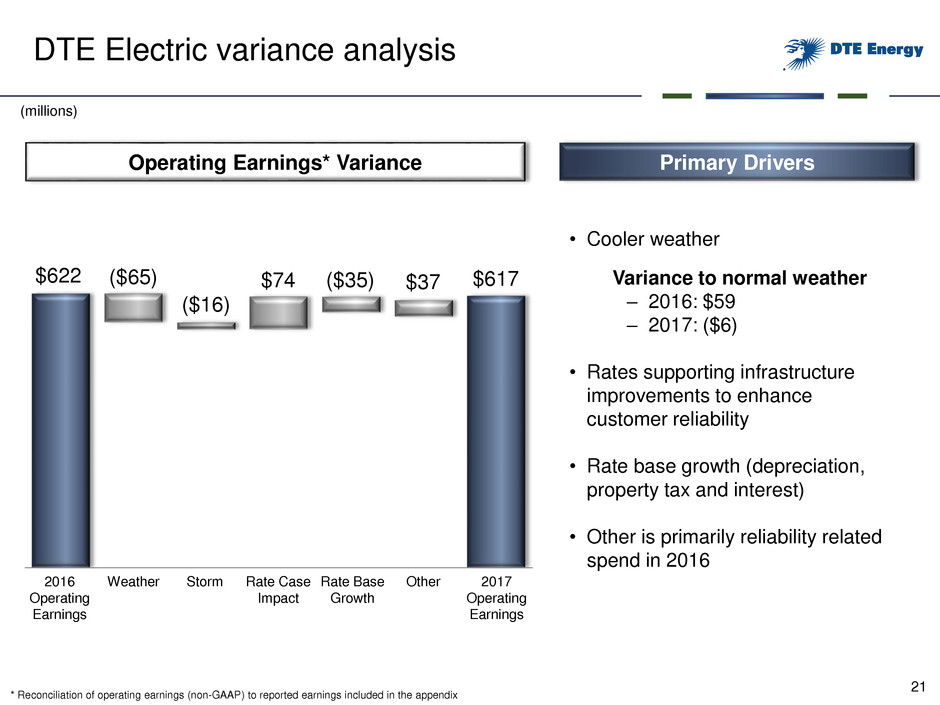
21 • Cooler weather Variance to normal weather – 2016: $59 – 2017: ($6) • Rates supporting infrastructure improvements to enhance customer reliability • Rate base growth (depreciation, property tax and interest) • Other is primarily reliability related spend in 2016 $622 $617($65) ($16) $37 Primary DriversOperating Earnings* Variance (millions) 2016 Operating Earnings 2017 Operating Earnings Weather Rate Case Impact Rate Base Growth DTE Electric variance analysis ($35)$74 Storm Other * Reconciliation of operating earnings (non-GAAP) to reported earnings included in the appendix
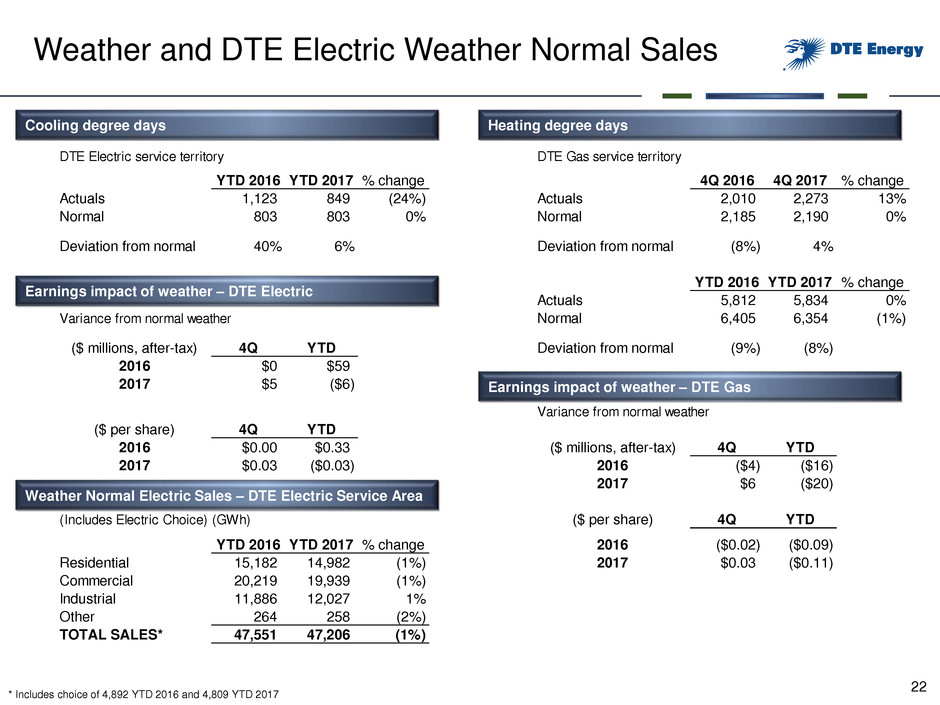
22 Weather and DTE Electric Weather Normal Sales YTD 2016 YTD 2017 % change 4Q 2016 4Q 2017 % change Actuals 1,123 849 (24%) Actuals 2,010 2,273 13% Normal 803 803 0% Normal 2,185 2,190 0% Deviation from normal 40% 6% Deviation from normal (8%) 4% YTD 2016 YTD 2017 % change Actuals 5,812 5,834 0% Normal 6,405 6,354 (1%) 4Q YTD Deviation from normal (9%) (8%) $0 $59 $5 ($6) 4Q YTD $0.00 $0.33 4Q YTD $0.03 ($0.03) ($4) ($16) $6 ($20) (Includes Electric Choice) (GWh) 4Q YTD YTD 2016 YTD 2017 % change ($0.02) ($0.09) Residential 15,182 14,982 (1%) $0.03 ($0.11) Commercial 20,219 19,939 (1%) Industrial 11,886 12,027 1% Other 264 258 (2%) TOTAL SALES* 47,551 47,206 (1%) 2017 ($ per share) 2016 2017 2016 2017 Variance from normal weather ($ per share) 2016 ($ millions, after-tax) DTE Electric service territory DTE Gas service territory Variance from normal weather ($ millions, after-tax) 2016 2017 Cooling degree days * Includes choice of 4,892 YTD 2016 and 4,809 YTD 2017 Heating degree days Earnings impact of weather – DTE Electric Earnings impact of weather – DTE Gas Weather Normal Electric Sales – DTE Electric Service Area
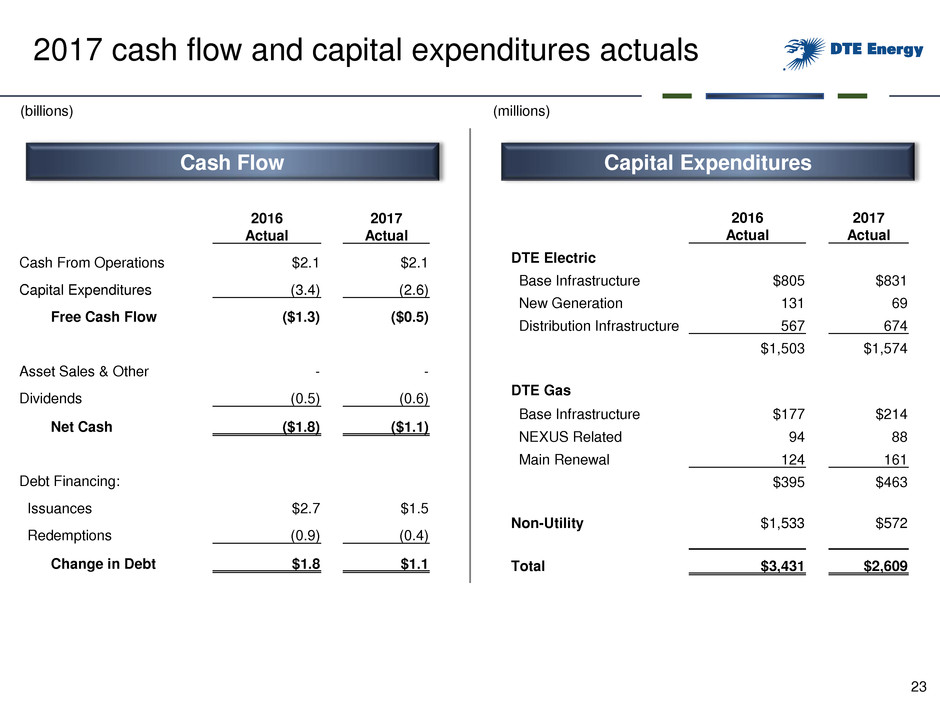
23 2016 Actual 2017 Actual Cash From Operations $2.1 $2.1 Capital Expenditures (3.4) (2.6) Free Cash Flow ($1.3) ($0.5) Asset Sales & Other - - Dividends (0.5) (0.6) Net Cash ($1.8) ($1.1) Debt Financing: Issuances $2.7 $1.5 Redemptions (0.9) (0.4) Change in Debt $1.8 $1.1 Cash Flow (billions) Capital Expenditures 2016 Actual 2017 Actual DTE Electric Base Infrastructure $805 $831 New Generation 131 69 Distribution Infrastructure 567 674 $1,503 $1,574 DTE Gas Base Infrastructure $177 $214 NEXUS Related 94 88 Main Renewal 124 161 $395 $463 Non-Utility $1,533 $572 Total $3,431 $2,609 (millions) 2017 cash flow and capital expenditures actuals
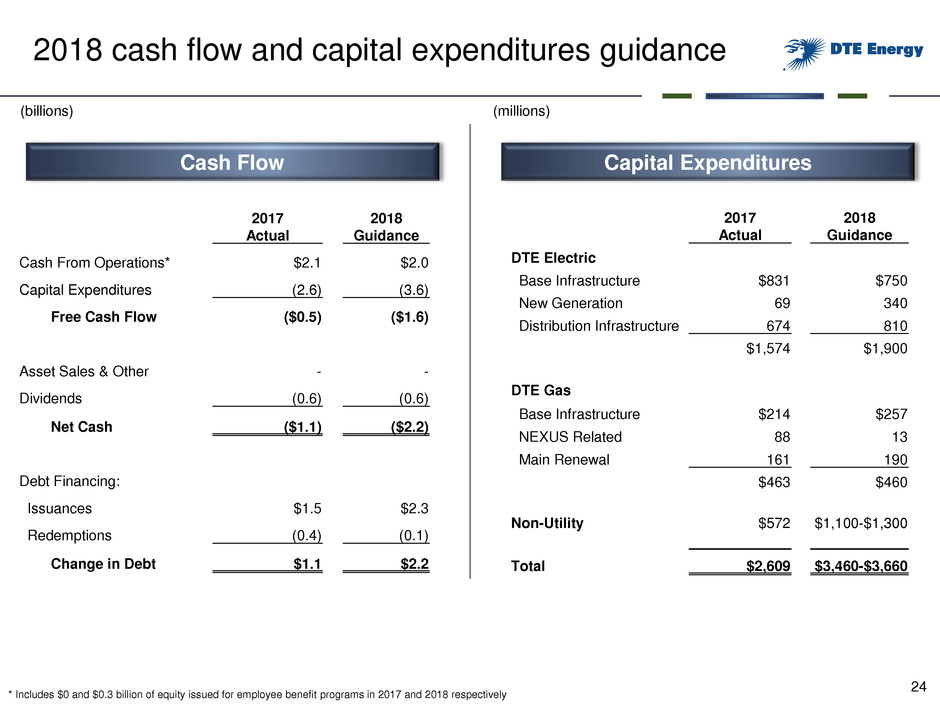
24 2017 Actual 2018 Guidance Cash From Operations* $2.1 $2.0 Capital Expenditures (2.6) (3.6) Free Cash Flow ($0.5) ($1.6) Asset Sales & Other - - Dividends (0.6) (0.6) Net Cash ($1.1) ($2.2) Debt Financing: Issuances $1.5 $2.3 Redemptions (0.4) (0.1) Change in Debt $1.1 $2.2 (billions) (millions) 2018 cash flow and capital expenditures guidance 2017 Actual 2018 Guidance DTE Electric Base Infrastructure $831 $750 New Generation 69 340 Distribution Infrastructure 674 810 $1,574 $1,900 DTE Gas Base Infrastructure $214 $257 NEXUS Related 88 13 Main Renewal 161 190 $463 $460 Non-Utility $572 $1,100-$1,300 Total $2,609 $3,460-$3,660 Cash Flow Capital Expenditures * Includes $0 and $0.3 billion of equity issued for employee benefit programs in 2017 and 2018 respectively
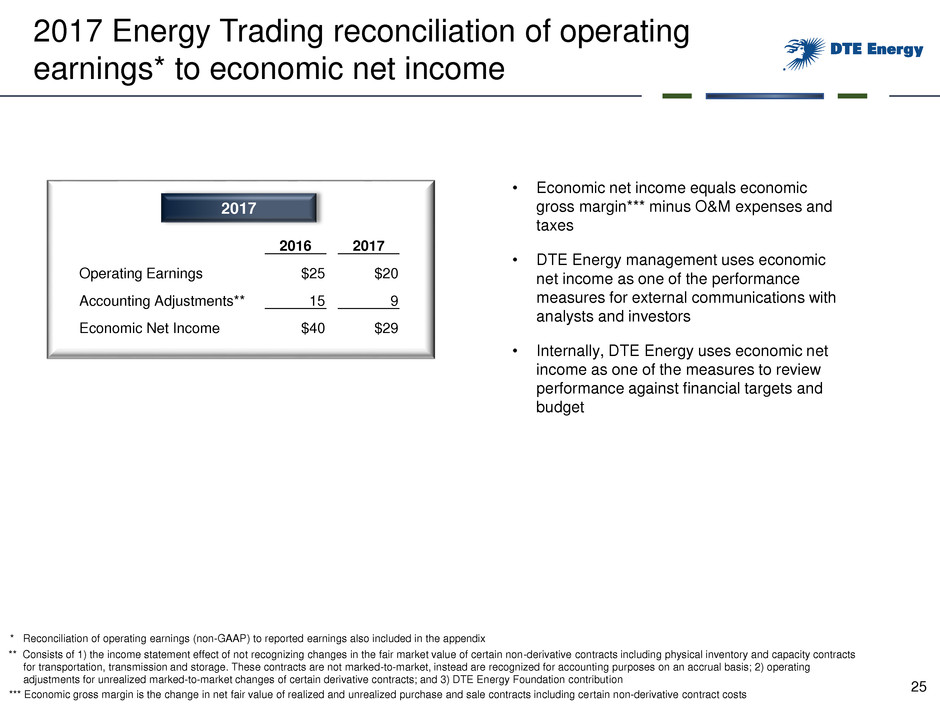
25 2017 Energy Trading reconciliation of operating earnings* to economic net income 2017 2016 2017 Operating Earnings $25 $20 Accounting Adjustments** 15 9 Economic Net Income $40 $29 • Economic net income equals economic gross margin*** minus O&M expenses and taxes • DTE Energy management uses economic net income as one of the performance measures for external communications with analysts and investors • Internally, DTE Energy uses economic net income as one of the measures to review performance against financial targets and budget *** Economic gross margin is the change in net fair value of realized and unrealized purchase and sale contracts including certain non-derivative contract costs ** Consists of 1) the income statement effect of not recognizing changes in the fair market value of certain non-derivative contracts including physical inventory and capacity contracts for transportation, transmission and storage. These contracts are not marked-to-market, instead are recognized for accounting purposes on an accrual basis; 2) operating adjustments for unrealized marked-to-market changes of certain derivative contracts; and 3) DTE Energy Foundation contribution * Reconciliation of operating earnings (non-GAAP) to reported earnings also included in the appendix
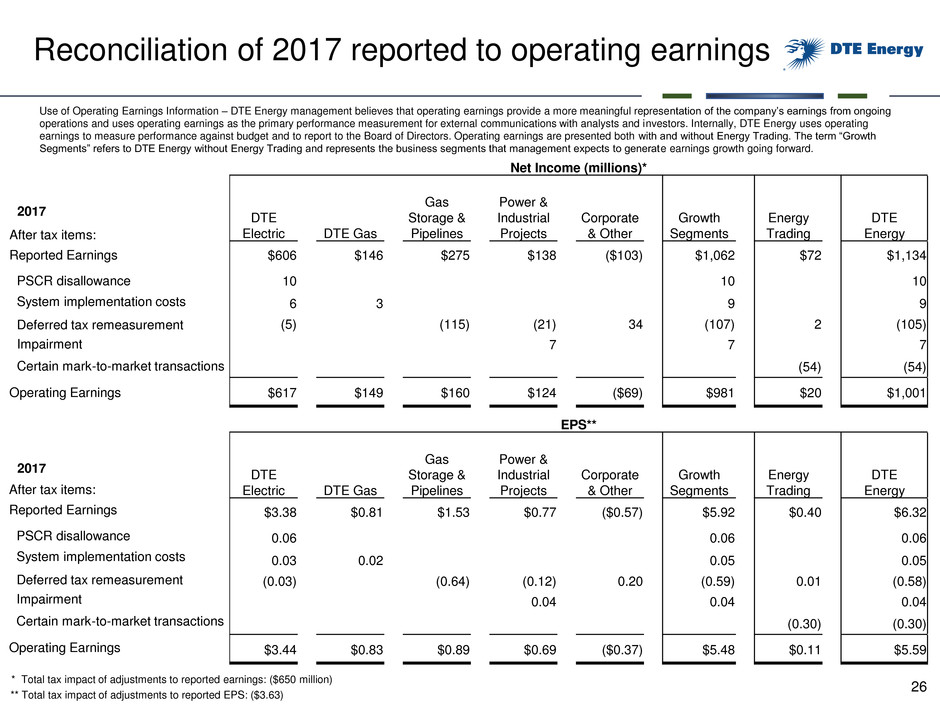
26 Reconciliation of 2017 reported to operating earnings Use of Operating Earnings Information – DTE Energy management believes that operating earnings provide a more meaningful representation of the company’s earnings from ongoing operations and uses operating earnings as the primary performance measurement for external communications with analysts and investors. Internally, DTE Energy uses operating earnings to measure performance against budget and to report to the Board of Directors. Operating earnings are presented both with and without Energy Trading. The term “Growth Segments” refers to DTE Energy without Energy Trading and represents the business segments that management expects to generate earnings growth going forward. Net Income (millions)* DTE Electric DTE Gas Gas Storage & Pipelines Power & Industrial Projects Corporate & Other Growth Segments Energy Trading DTE Energy $606 $146 $275 $138 ($103) $1,062 $72 $1,134 10 10 10 6 3 9 9 (5) (115) (21) 34 (107) 2 (105) 7 7 7 (54) (54) $617 $149 $160 $124 ($69) $981 $20 $1,001 After tax items: PSCR disallowance 2017 Certain mark-to-market transactions Reported Earnings System implementation costs Deferred tax remeasurement Impairment EPS** DTE Electric DTE Gas Gas Storage & Pipelines Power & Industrial Projects Corporate & Other Growth Segments Energy Trading DTE Energy $3.38 $0.81 $1.53 $0.77 ($0.57) $5.92 $0.40 $6.32 0.06 0.06 0.06 0.03 0.02 0.05 0.05 (0.03) (0.64) (0.12) 0.20 (0.59) 0.01 (0.58) 0.04 0.04 0.04 (0.30) (0.30) $3.44 $0.83 $0.89 $0.69 ($0.37) $5.48 $0.11 $5.59 2017 Operating Earnings After tax items: PSCR disallowance Certain mark-to-market transactions Reported Earnings System implementation costs Deferred tax remeasurement Impairment Operating Earnings * Total tax impact of adjustments to reported earnings: ($650 million) ** Total tax impact of adjustments to reported EPS: ($3.63)
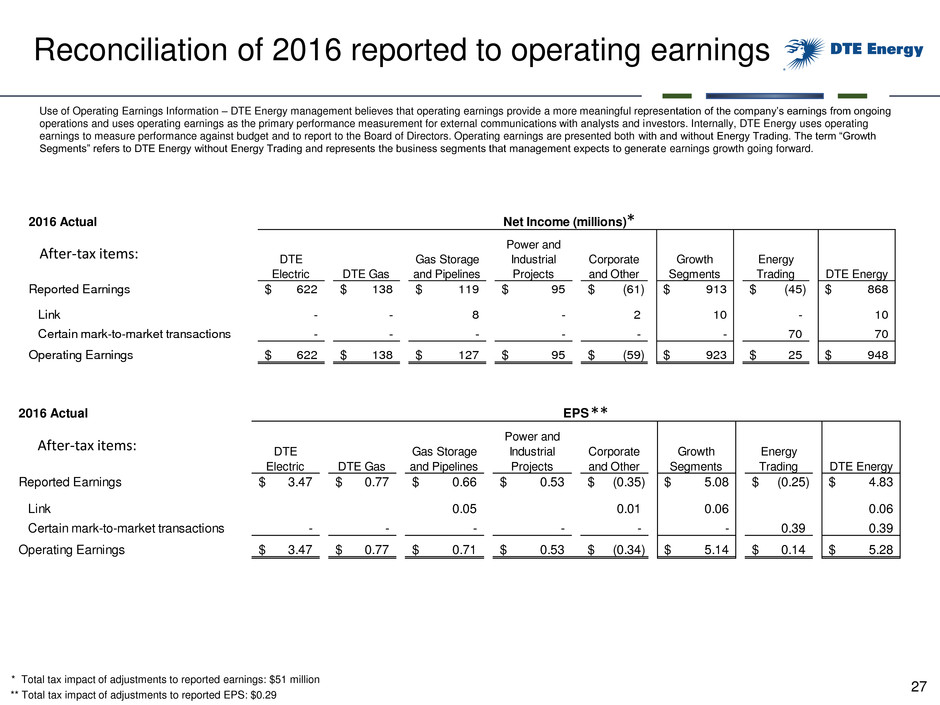
27 Reconciliation of 2016 reported to operating earnings Use of Operating Earnings Information – DTE Energy management believes that operating earnings provide a more meaningful representation of the company’s earnings from ongoing operations and uses operating earnings as the primary performance measurement for external communications with analysts and investors. Internally, DTE Energy uses operating earnings to measure performance against budget and to report to the Board of Directors. Operating earnings are presented both with and without Energy Trading. The term “Growth Segments” refers to DTE Energy without Energy Trading and represents the business segments that management expects to generate earnings growth going forward. 201 Actual DTE Electric DTE Gas Gas Storage and Pipelines Power and Industrial Projects Corporate and Other Growth Segments Energy Trading DTE Energy Reported Earnings 622$ 138$ 119$ 95$ (61)$ 913$ (45)$ 868$ Link - - 8 - 2 10 - 10 Certain mark-to-market transactions - - - - - - 70 70 Operating Earnings 622$ 138$ 127$ 95$ (59)$ 923$ 25$ 948$ Net Income (millions) 2016 Actual DTE Electric DTE Gas Gas Storage and Pipelines Power and Industrial Projects Corporate and Other Growth Segments Energy Trading DTE Energy Reported Earnings 3.47$ 0.77$ 0.66$ 0.53$ (0.35)$ 5.08$ (0.25)$ 4.83$ Link 0.05 0.01 0.06 0.06 Certain mark-to-market transactions - - - - - - 0.39 0.39 Operating Earnings 3.47$ 0.77$ 0.71$ 0.53$ (0.34)$ 5.14$ 0.14$ 5.28$ EPS After-tax items: After-tax items: * ** * Total tax impact of adjustments to reported earnings: $51 million ** Total tax impact of adjustments to reported EPS: $0.29
28 Use of Operating Earnings Information – Operating earnings exclude non-recurring items, certain mark-to- market adjustments and discontinued operations. DTE Energy management believes that operating earnings provide a more meaningful representation of the company’s earnings from ongoing operations and uses operating earnings as the primary performance measurement for external communications with analysts and investors. Internally, DTE Energy uses operating earnings to measure performance against budget and to report to the Board of Directors. In this presentation, DTE Energy provides guidance for future period operating earnings. It is likely that certain items that impact the company’s future period reported results will be excluded from operating results. A reconciliation to the comparable future period reported earnings is not provided because it is not possible to provide a reliable forecast of specific line items (i.e. future non-recurring items, certain mark-to- market adjustments and discontinued operations). These items may fluctuate significantly from period to period and may have a significant impact on reported earnings. Reconciliation of reported to operating earnings (non-GAAP)


