Exhibit 99.1
Business and Financial Update July 31, 2008 |
Safe Harbor Statement The information contained herein is as of the date of this presentation. DTE Energy expressly disclaims any current intention to update any forward-looking statements contained in this document as a result of new information or future events or developments. Words such as "anticipate," "believe," "expect," "projected" and "goals" signify forward-looking statements. Forward-looking statements are not guarantees of future results and conditions but rather are subject to various assumptions, risks and uncertainties. This presentation contains forward-looking statements about DTE Energy's financial results and estimates of future prospects, and actual results may differ materially. Factors that may impact forward-looking statements include, but are not limited to: the uncertainties of successful exploration of gas shale resources and inability to estimate gas reserves with certainty; the effects of weather and other natural phenomena on operations and sales to customers, and purchases from suppliers; economic climate and population growth or decline in the geographic areas where we do business; environmental issues, laws, regulations, and the cost of remediation and compliance, including potential new federal and state requirements that could include carbon and more stringent mercury emission controls, a renewable portfolio standard and energy efficiency mandates; nuclear regulations and operations associated with nuclear facilities; impact of electric and gas utility restructuring in Michigan, including legislative amendments and Customer Choice programs; employee relations and the impact of collective bargaining agreements; unplanned outages; access to capital markets and capital market conditions and the results of other financing efforts which can be affected by credit agency ratings; the timing and extent of changes in interest rates; the level of borrowings; changes in the cost and availability of coal and other raw materials, purchased power and natural gas; effects of competition; impact of regulation by the FERC, MPSC, NRC and other applicable governmental proceedings and regulations, including any associated impact on rate structures; contributions to earnings by non-utility subsidiaries; changes in and application of federal, state and local tax laws and their interpretations, including the Internal Revenue Code, regulations, rulings, court proceedings and audits; the ability to recover costs through rate increases; the availability, cost, coverage and terms of insurance; the cost of protecting assets against, or damage due to, terrorism; changes in and application of accounting standards and financial reporting regulations; changes in federal or state laws and their interpretation with respect to regulation, energy policy and other business issues; amounts of uncollectible accounts receivable; binding arbitration, litigation and related appeals; and changes in the economic and financial viability of our suppliers, customers and trading counterparties, and the continued ability of such parties to perform their obligations to the Company. This presentation should also be read in conjunction with the "Forward-Looking Statements" section in each of DTE Energy's and Detroit Edison's 2007 Form 10-K and 2008 Forms 10-Q (which sections are incorporated herein by reference), and in conjunction with other SEC reports filed by DTE Energy and Detroit Edison. Cautionary Note - The Securities and Exchange Commission permits oil and gas companies, in their filings with the SEC, to disclose only proved reserves that a company has demonstrated by actual production or conclusive formation tests to be economically and legally producible under existing economic and operating conditions. We use certain terms in this presentation such as "probable reserves" that the SEC's guidelines strictly prohibit us from including in filings with the SEC. You are urged to consider closely the disclosure in our Forms 10-K, File No. 1-11607, available from our offices or from our website at www.dteenergy.com. You can also obtain these Forms from the SEC by calling 1-800- SEC-0330. |
Overview 2nd Quarter 2008 Earnings Results Cash Flow and Capital Expenditures |
Participants Dave Meador, Executive Vice President and CFO Peter Oleksiak, VP and Controller Nick Khouri, VP and Treasurer Lisa Muschong, Director of Investor Relations |
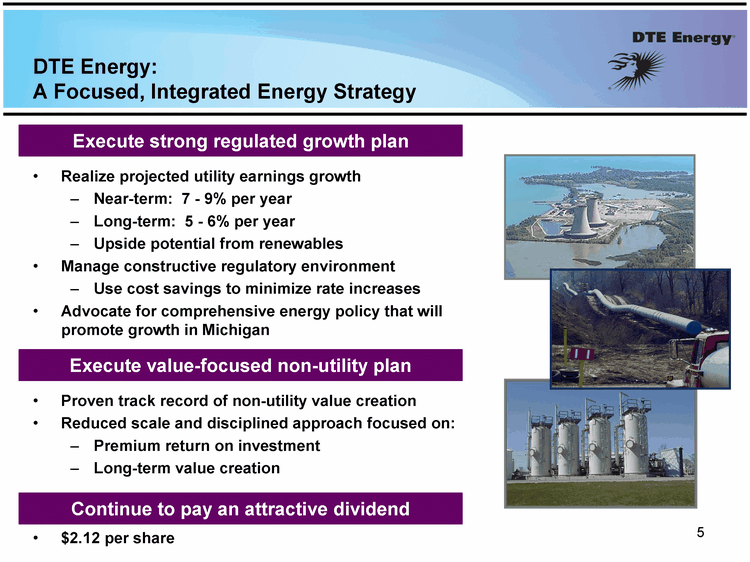
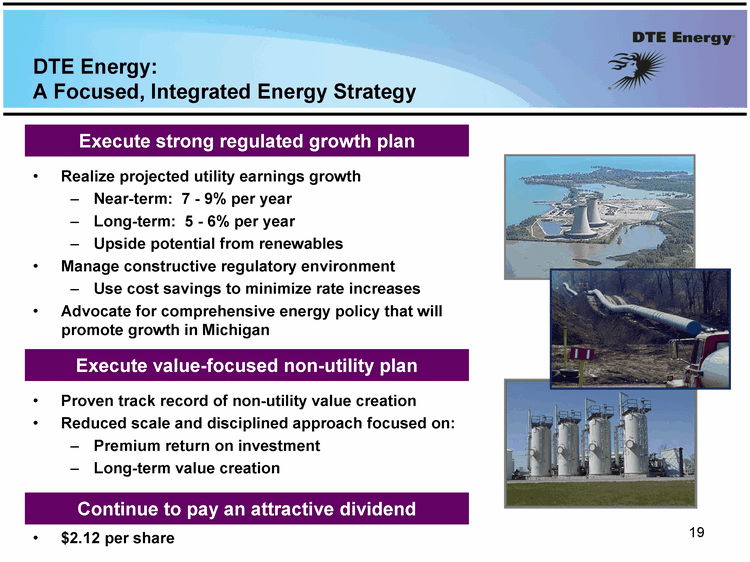
Execute strong regulated growth plan DTE Energy: A Focused, Integrated Energy Strategy Execute value-focused non-utility plan Continue to pay an attractive dividend Realize projected utility earnings growth Near-term: 7 - 9% per year Long-term: 5 - 6% per year Upside potential from renewables Manage constructive regulatory environment Use cost savings to minimize rate increases Advocate for comprehensive energy policy that will promote growth in Michigan Proven track record of non-utility value creation Reduced scale and disciplined approach focused on: Premium return on investment Long-term value creation $2.12 per share |
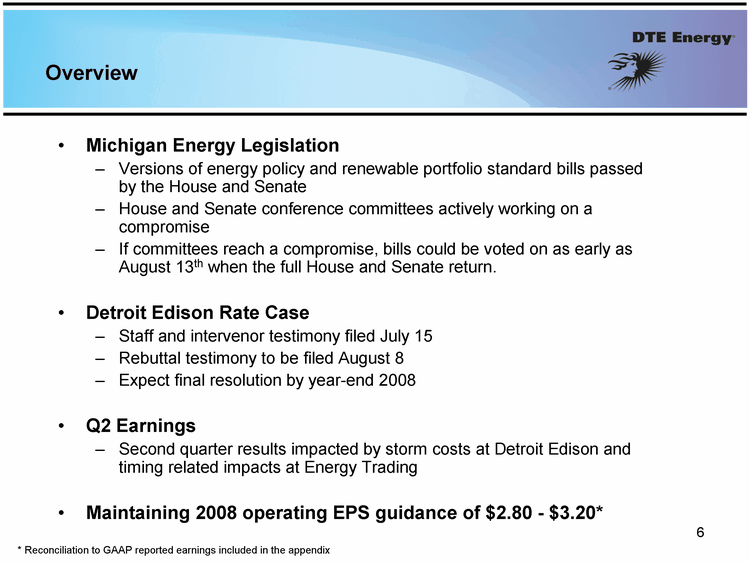
Overview Michigan Energy Legislation Versions of energy policy and renewable portfolio standard bills passed by the House and Senate House and Senate conference committees actively working on a compromise If committees reach a compromise, bills could be voted on as early as August 13th when the full House and Senate return. Detroit Edison Rate Case Staff and intervenor testimony filed July 15 Rebuttal testimony to be filed August 8 Expect final resolution by year-end 2008 Q2 Earnings Second quarter results impacted by storm costs at Detroit Edison and timing related impacts at Energy Trading Maintaining 2008 operating EPS guidance of $2.80 - $3.20* * Reconciliation to GAAP reported earnings included in the appendix |
Overview 2nd Quarter 2008 Earnings Results Cash Flow and Capital Expenditures |
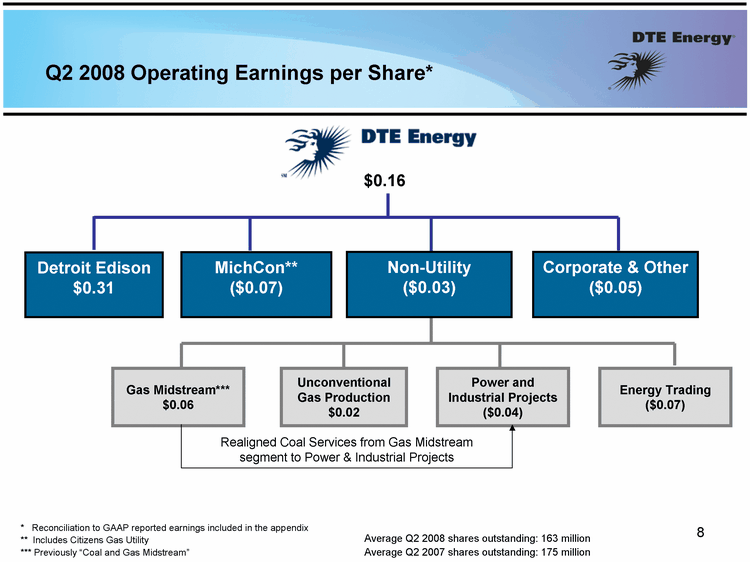
Q2 2008 Operating Earnings per Share* Detroit Edison $0.31 Unconventional Gas Production $0.02 Non-Utility ($0.03) Gas Midstream*** $0.06 Corporate & Other ($0.05) MichCon** ($0.07) $0.16 Power and Industrial Projects ($0.04) * Reconciliation to GAAP reported earnings included in the appendix ** Includes Citizens Gas Utility *** Previously "Coal and Gas Midstream" Energy Trading ($0.07) Average Q2 2008 shares outstanding: 163 million Average Q2 2007 shares outstanding: 175 million Realigned Coal Services from Gas Midstream segment to Power & Industrial Projects |
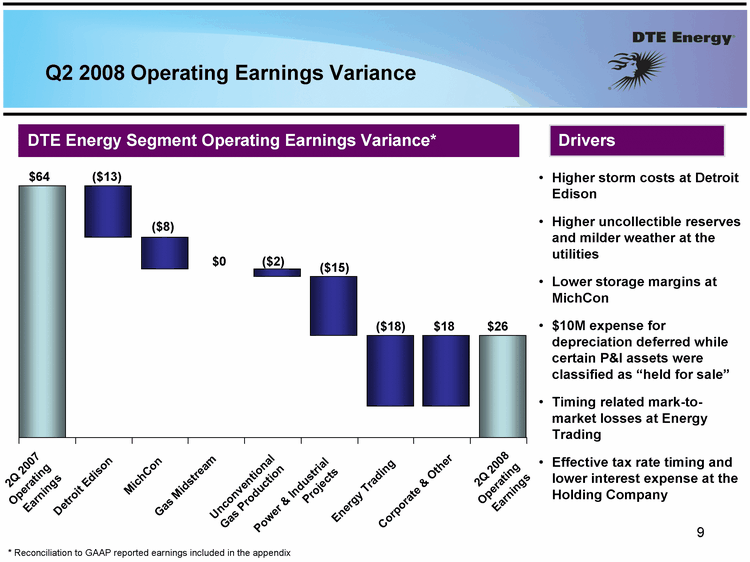
Q2 2008 Operating Earnings Variance 2Q 2007 Operating Earnings Detroit Edison MichCon Power & Industrial Projects Unconventional Gas Production Gas Midstream Energy Trading Corporate & Other 2Q 2008 Operating Earnings $64 ($8) ($15) ($2) $0 ($18) $18 $26 ($13) Higher storm costs at Detroit Edison Higher uncollectible reserves and milder weather at the utilities Lower storage margins at MichCon $10M expense for depreciation deferred while certain P&I assets were classified as "held for sale" Timing related mark-to- market losses at Energy Trading Effective tax rate timing and lower interest expense at the Holding Company DTE Energy Segment Operating Earnings Variance* Drivers * Reconciliation to GAAP reported earnings included in the appendix |
Detroit Edison Variance Analysis * Reconciliation to GAAP reported earnings included in the appendix 2Q 2007 Operating Earnings $18 $6 $64 2Q 2008 Operating Earnings ($12) Margin ($13) ($ millions) Detroit Edison Operating Earnings Variance* Drivers Information System Costs Storm Costs Uncollectible Expense $12 $51 Margin - Expiration of the temporary rate reduction and lower Choice volumes partially offset by milder weather and lower sales volumes Q2 2007 reconciliation of power supply cost recovery (PSCR) factor from 2004 & 2005 Higher storm costs Q2 2008 Elimination of information system startup costs in 2008 Higher uncollectible expense O&M driven by timing of outages, lower benefit expense and continuous improvement initiatives O&M / Other PSCR ($24) |
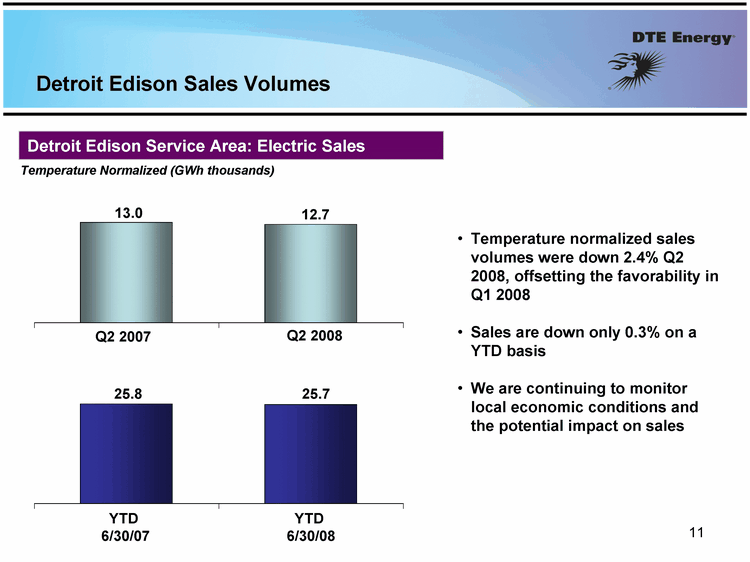
Detroit Edison Sales Volumes Detroit Edison Service Area: Electric Sales Temperature Normalized (GWh thousands) 13.0 Q2 2007 Q2 2008 12.7 25.7 YTD 6/30/07 YTD 6/30/08 25.8 Temperature normalized sales volumes were down 2.4% Q2 2008, offsetting the favorability in Q1 2008 Sales are down only 0.3% on a YTD basis We are continuing to monitor local economic conditions and the potential impact on sales |
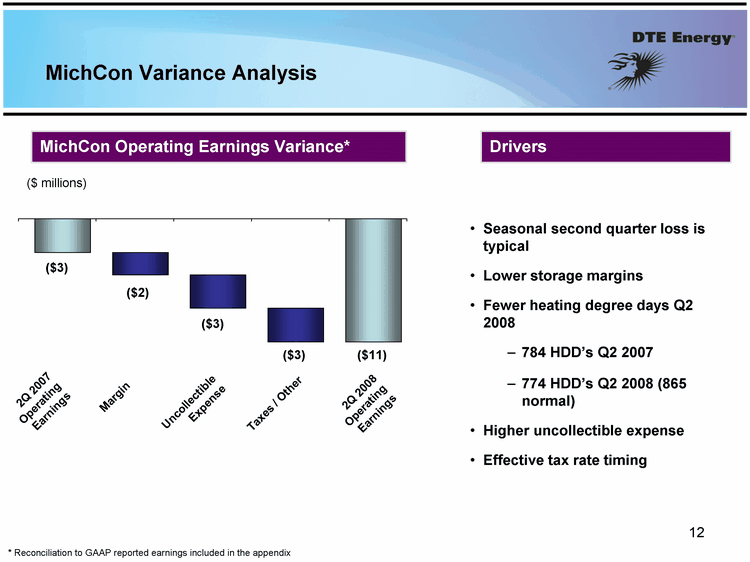
MichCon Variance Analysis ($3) Uncollectible Expense Margin ($2) ($3) ($11) 2Q 2007 Operating Earnings 2Q 2008 Operating Earnings * Reconciliation to GAAP reported earnings included in the appendix Taxes / Other Seasonal second quarter loss is typical Lower storage margins Fewer heating degree days Q2 2008 784 HDD's Q2 2007 774 HDD's Q2 2008 (865 normal) Higher uncollectible expense Effective tax rate timing ($3) ($ millions) MichCon Operating Earnings Variance* Drivers |
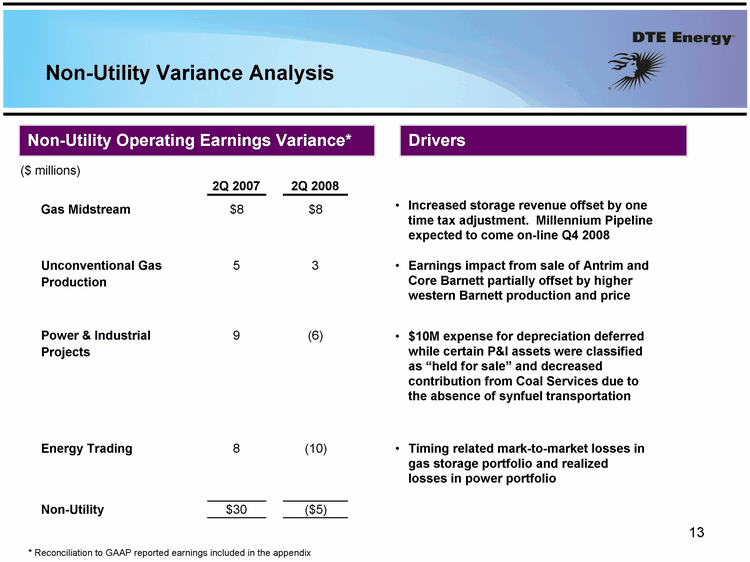
Non-Utility Variance Analysis * Reconciliation to GAAP reported earnings included in the appendix ($ millions) Non-Utility Operating Earnings Variance* Drivers $10M expense for depreciation deferred while certain P&I assets were classified as "held for sale" and decreased contribution from Coal Services due to the absence of synfuel transportation Timing related mark-to-market losses in gas storage portfolio and realized losses in power portfolio Earnings impact from sale of Antrim and Core Barnett partially offset by higher western Barnett production and price Increased storage revenue offset by one time tax adjustment. Millennium Pipeline expected to come on-line Q4 2008 2Q 2007 2Q 2008 Gas Midstream $8 $8 Unconventional Gas Production 5 3 Power & Industrial Projects 9 (6) Energy Trading 8 (10) Non-Utility $30 ($5) |
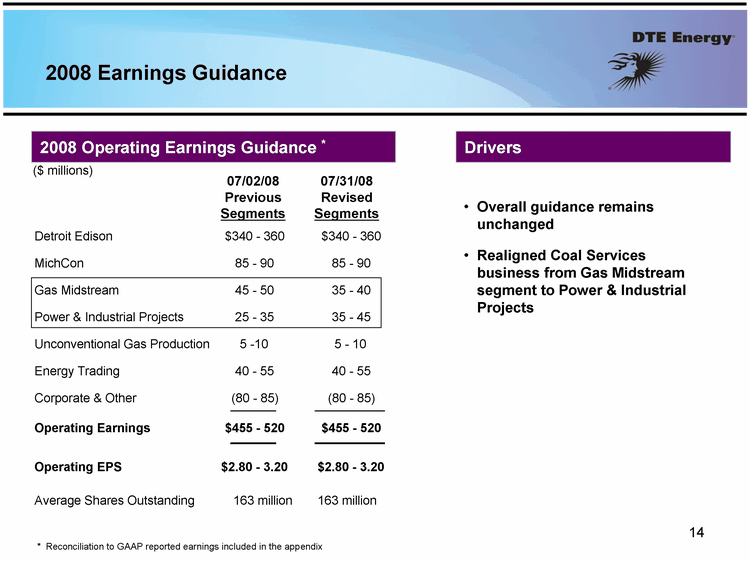
2008 Earnings Guidance * Reconciliation to GAAP reported earnings included in the appendix 2008 Operating Earnings Guidance * Drivers 07/31/08 Revised Segments ($ millions) 07/02/08 Previous Segments Overall guidance remains unchanged Realigned Coal Services business from Gas Midstream segment to Power & Industrial Projects Detroit Edison $340 - 360 $340 - 360 MichCon 85 - 90 85 - 90 Gas Midstream 45 - 50 35 - 40 Power & Industrial Projects 25 - 35 35 - 45 Unconventional Gas Production 5 -10 5 - 10 Energy Trading 40 - 55 40 - 55 Corporate & Other (80 - 85) (80 - 85) Operating Earnings $455 - 520 $455 - 520 Operating EPS $2.80 - 3.20 $2.80 - 3.20 Average Shares Outstanding 163 million 163 million |
Overview 2nd Quarter 2008 Earnings Results Cash Flow and Capital Expenditures |
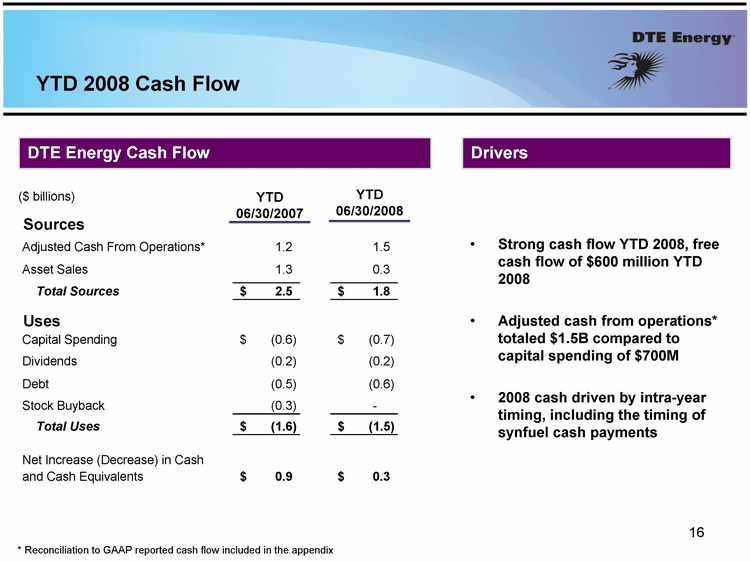
YTD 2008 Cash Flow Strong cash flow YTD 2008, free cash flow of $600 million YTD 2008 Adjusted cash from operations* totaled $1.5B compared to capital spending of $700M 2008 cash driven by intra-year timing, including the timing of synfuel cash payments ($ billions) DTE Energy Cash Flow Drivers YTD 06/30/2007 YTD 06/30/2008 * Reconciliation to GAAP reported cash flow included in the appendix Sources Adjusted Cash From Operations* 1.2 1.5 Asset Sales 1.3 0.3 Total Sources 2.5 $ 1.8 $ Uses Capital Spending (0.6) $ (0.7) $ Dividends (0.2) (0.2) Debt (0.5) (0.6) Stock Buyback (0.3) - - Total Uses (1.6) $ (1.5) $ Net Increase (Decrease) in Cash and Cash Equivalents 0.9 $ 0.3 $ |
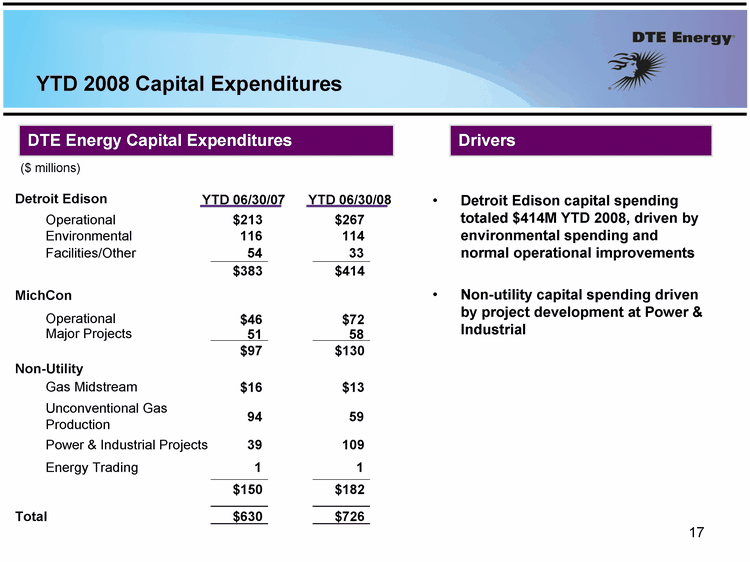
YTD 2008 Capital Expenditures YTD 06/30/07 YTD 06/30/08 Detroit Edison capital spending totaled $414M YTD 2008, driven by environmental spending and normal operational improvements Non-utility capital spending driven by project development at Power & Industrial ($ millions) DTE Energy Capital Expenditures Drivers Detroit Edison Operational $213 $267 Environmental 116 114 Facilities/Other 54 33 $383 $414 MichCon Operational $46 $72 Major Projects 51 58 $97 $130 Non-Utility Gas Midstream $16 $13 Unconventional Gas Production 94 59 Power & Industrial Projects 39 109 Energy Trading 1 1 $150 $182 Total $630 $726 |
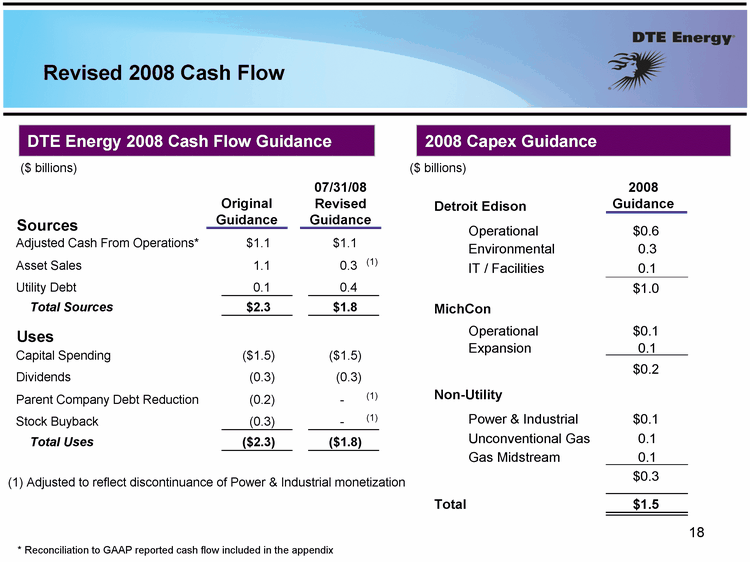
2008 Guidance Revised 2008 Cash Flow Original Guidance DTE Energy 2008 Cash Flow Guidance ($ billions) 2008 Capex Guidance ($ billions) 07/31/08 Revised Guidance (1) Adjusted to reflect discontinuance of Power & Industrial monetization * Reconciliation to GAAP reported cash flow included in the appendix Detroit Edison Operational $0.6 Environmental 0.3 IT / Facilities 0.1 $1.0 MichCon Operational $0.1 Expansion 0.1 $0.2 Non-Utility Power & Industrial $0.1 Unconventional Gas 0.1 Gas Midstream 0.1 $0.3 Total $1.5 Sources Adjusted Cash From Operations* $1.1 $1.1 Asset Sales 1.1 0.3 (1) Utility Debt 0.1 0.4 Total Sources $2.3 $1.8 Uses Capital Spending ($1.5) ($1.5) Dividends (0.3) (0.3) Parent Company Debt Reduction (0.2) - - (1) Stock Buyback (0.3) - - (1) Total Uses ($2.3) ($1.8) |
DTE Energy: A Focused, Integrated Energy Strategy Realize projected utility earnings growth Near-term: 7 - 9% per year Long-term: 5 - 6% per year Upside potential from renewables Manage constructive regulatory environment Use cost savings to minimize rate increases Advocate for comprehensive energy policy that will promote growth in Michigan Proven track record of non-utility value creation Reduced scale and disciplined approach focused on: Premium return on investment Long-term value creation $2.12 per share Execute strong regulated growth plan Execute value-focused non-utility plan Continue to pay an attractive dividend |
Contact Us DTE Energy Investor Relations www.dteenergy.com/investors 313-235-8030 |
Appendix |
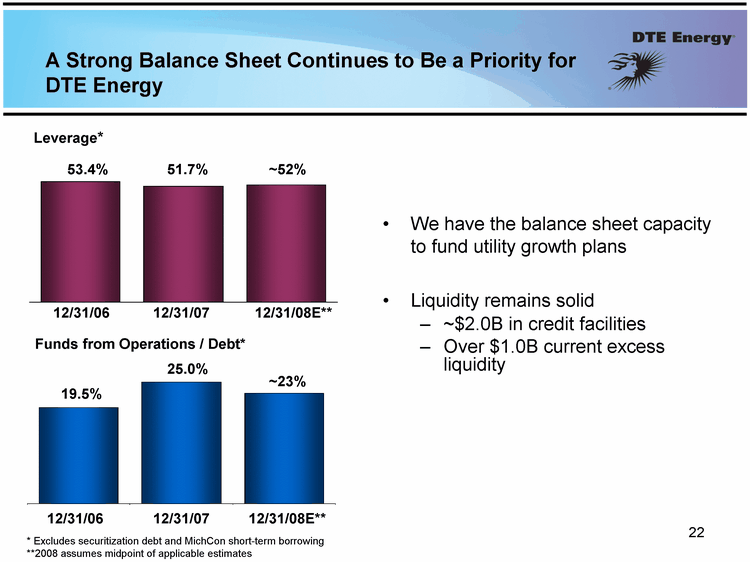
Leverage* * Excludes securitization debt and MichCon short-term borrowing **2008 assumes midpoint of applicable estimates Funds from Operations / Debt* A Strong Balance Sheet Continues to Be a Priority for DTE Energy 12/31/06 12/31/07 12/31/08E** 53.4% 51.7% 12/31/06 12/31/07 12/31/08E** 19.5% ~23% ~52% 25.0% We have the balance sheet capacity to fund utility growth plans Liquidity remains solid ~$2.0B in credit facilities Over $1.0B current excess liquidity |
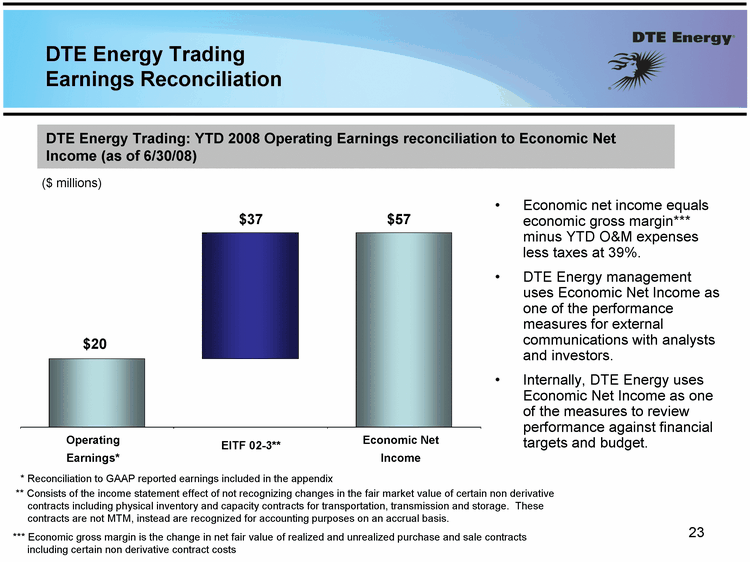
DTE Energy Trading Earnings Reconciliation ** Consists of the income statement effect of not recognizing changes in the fair market value of certain non derivative contracts including physical inventory and capacity contracts for transportation, transmission and storage. These contracts are not MTM, instead are recognized for accounting purposes on an accrual basis. DTE Energy Trading: YTD 2008 Operating Earnings reconciliation to Economic Net Income (as of 6/30/08) ($ millions) Economic Net Income EITF 02-3** Operating Earnings* $20 $37 $57 Economic net income equals economic gross margin*** minus YTD O&M expenses less taxes at 39%. DTE Energy management uses Economic Net Income as one of the performance measures for external communications with analysts and investors. Internally, DTE Energy uses Economic Net Income as one of the measures to review performance against financial targets and budget. * Reconciliation to GAAP reported earnings included in the appendix *** Economic gross margin is the change in net fair value of realized and unrealized purchase and sale contracts including certain non derivative contract costs |
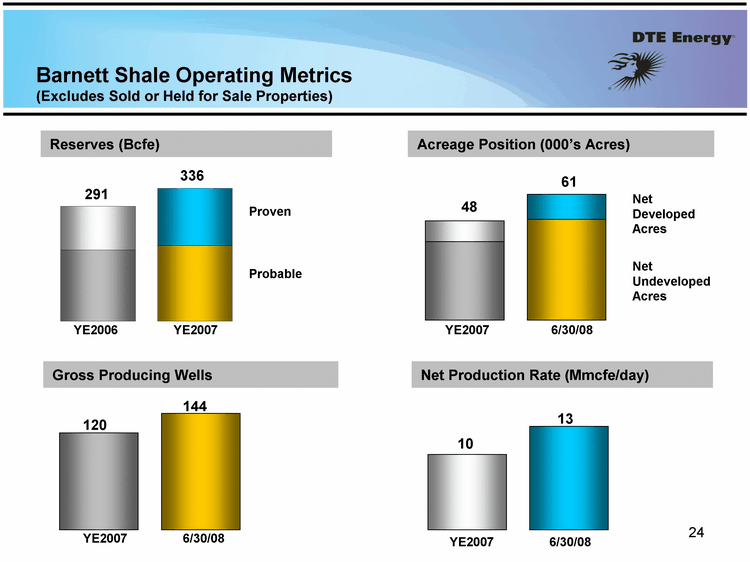
Net Production Rate (Mmcfe/day) Gross Producing Wells 144 Reserves (Bcfe) Probable Proven Acreage Position (000's Acres) Net Undeveloped Acres Net Developed Acres YE2007 192 144 336 Barnett Shale Operating Metrics (Excludes Sold or Held for Sale Properties) 111 180 YE2006 291 12 6/30/08 49 61 10 38 YE2007 48 6/30/08 YE2007 120 13 6/30/08 YE2007 10 |
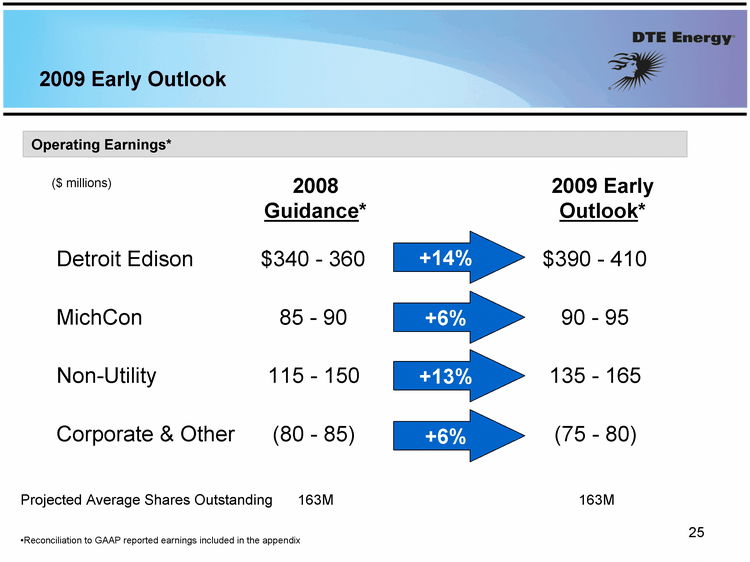
2009 Early Outlook 2008 Guidance* ($ millions) +6% 2009 Early Outlook* +13% +6% +14% Projected Average Shares Outstanding 163M 163M Reconciliation to GAAP reported earnings included in the appendix Operating Earnings* Detroit Edison $340 - 360 $390 - 410 MichCon 85 - 90 90 - 95 Non-Utility 115 - 150 135 - 165 Corporate & Other (80 - 85) (75 - 80) |
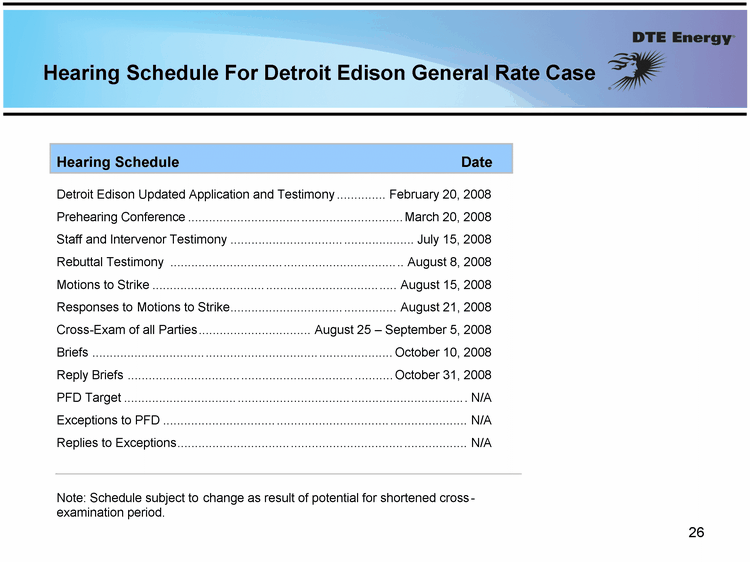
Hearing Schedule For Detroit Edison General Rate Case Hearing Schedule Date Detroit Edison Updated Application and Testimony ............... February 20, 2008 Prehearing Conference ................................. .............................. March 20, 2008 Staff and Intervenor Testimony ................................. ..................... July 15, 2008 Rebuttal Testimony ................................. ................................. ... August 8, 2008 Motions to Strike ................................. ................................. ...... August 15, 2008 Responses to Mot ions to Strike ................................. ................ August 21, 2008 Cross - - Exam of all Parties ................................. August 25 - - September 5, 2008 Briefs ................................. ................................. ...................... October 10, 2008 Reply Briefs ................................. ................................. ............ October 31, 2008 PFD Target ................................. ................................. ................................. .. N/A Exceptions to PFD ................................. ................................. ....................... N/A Replies to Exceptions ................................. ................................. ................... N/A Note: Schedule subject to change as result of potential for shortened cross - - examination period. |
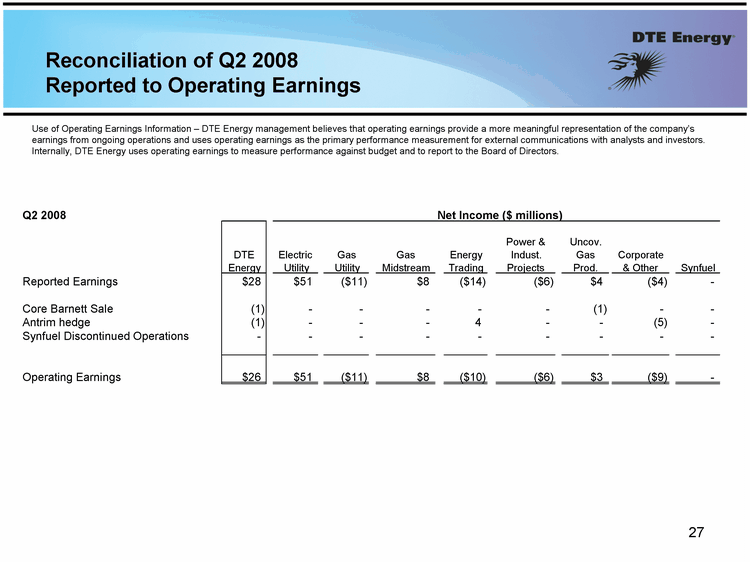
Reconciliation of Q2 2008 Reported to Operating Earnings Use of Operating Earnings Information - DTE Energy management believes that operating earnings provide a more meaningful representation of the company's earnings from ongoing operations and uses operating earnings as the primary performance measurement for external communications with analysts and investors. Internally, DTE Energy uses operating earnings to measure performance against budget and to report to the Board of Directors. Q2 2008 DTE Energy Electric Utility Gas Utility Gas Midstream Energy Trading Power & Indust. Projects Uncov. Gas Prod. Corporate & Other Synfuel Reported Earnings $28 $51 ($11) $8 ($14) ($6) $4 ($4) - - Core Barnett Sale (1) - - - - - - - - - - (1) - - - - Antrim hedge (1) - - - - - - 4 - - - - (5) - - Synfuel Discontinued Operations - - - - - - - - - - - - - - - - - - Operating Earnings $26 $51 ($11) $8 ($10) ($6) $3 ($9) - - Net Income ($ millions) |
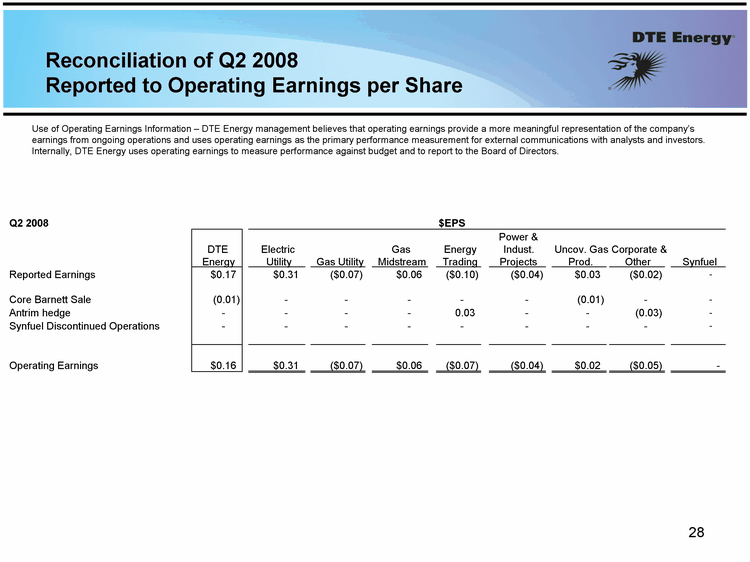
Reconciliation of Q2 2008 Reported to Operating Earnings per Share Use of Operating Earnings Information - DTE Energy management believes that operating earnings provide a more meaningful representation of the company's earnings from ongoing operations and uses operating earnings as the primary performance measurement for external communications with analysts and investors. Internally, DTE Energy uses operating earnings to measure performance against budget and to report to the Board of Directors. Q2 2008 $EPS DTE Energy Electric Utility Gas Utility Gas Midstream Energy Trading Power & Indust. Projects Uncov. Gas Prod. Corporate & Other Synfuel Reported Earnings $0.17 $0.31 ($0.07) $0.06 ($0.10) ($0.04) $0.03 ($0.02) - - Core Barnett Sale (0.01) - - - - - - - - - - (0.01) - - - - Antrim hedge - - - - - - - - 0.03 - - - - (0.03) - - Synfuel Discontinued Operations - - - - - - - - - - - - - - - - - - Operating Earnings $0.16 $0.31 ($0.07) $0.06 ($0.07) ($0.04) $0.02 ($0.05) - - |
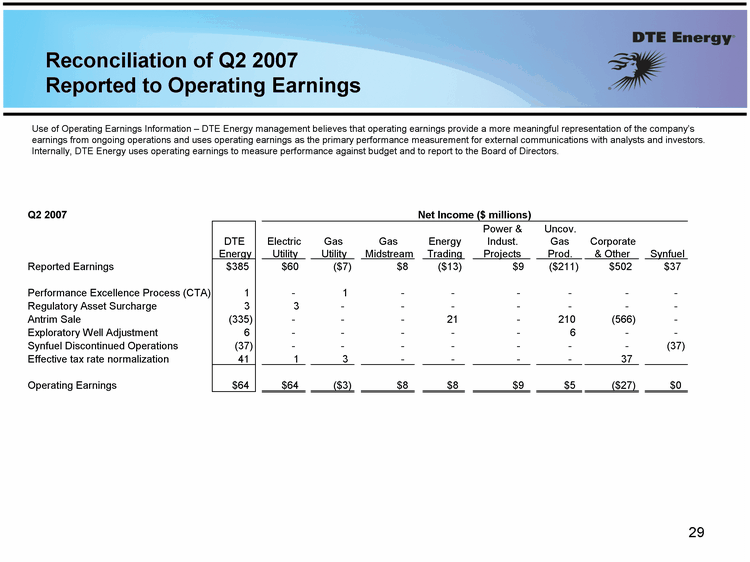
Reconciliation of Q2 2007 Reported to Operating Earnings Use of Operating Earnings Information - DTE Energy management believes that operating earnings provide a more meaningful representation of the company's earnings from ongoing operations and uses operating earnings as the primary performance measurement for external communications with analysts and investors. Internally, DTE Energy uses operating earnings to measure performance against budget and to report to the Board of Directors. Q2 2007 DTE Energy Electric Utility Gas Utility Gas Midstream Energy Trading Power & Indust. Projects Uncov. Gas Prod. Corporate & Other Synfuel Reported Earnings $385 $60 ($7) $8 ($13) $9 ($211) $502 $37 Performance Excellence Process (CTA) 1 - 1 - - - - - - Regulatory Asset Surcharge 3 3 - - - - - - - Antrim Sale (335) - - - 21 - 210 (566) - Exploratory Well Adjustment 6 - - - - - 6 - - Synfuel Discontinued Operations (37) - - - - - - - (37) Effective tax rate normalization 41 1 3 - - - - 37 Operating Earnings $64 $64 ($3) $8 $8 $9 $5 ($27) $0 Net Income ($ millions) |
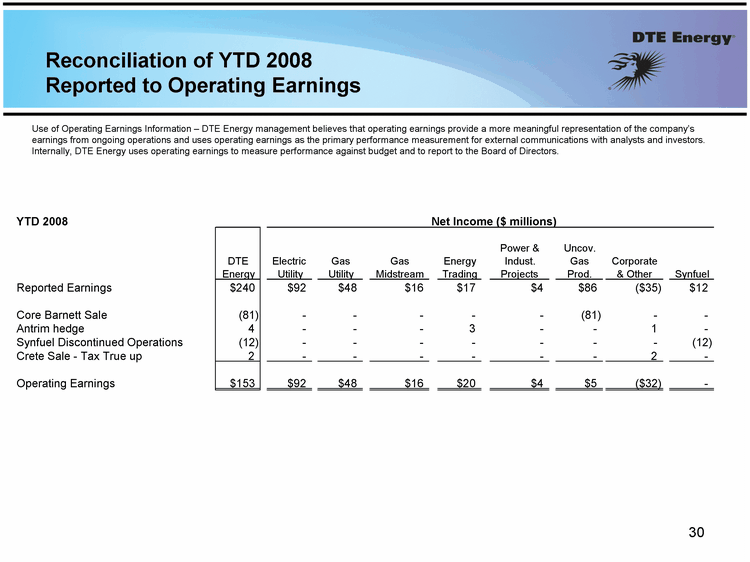
Reconciliation of YTD 2008 Reported to Operating Earnings Use of Operating Earnings Information - DTE Energy management believes that operating earnings provide a more meaningful representation of the company's earnings from ongoing operations and uses operating earnings as the primary performance measurement for external communications with analysts and investors. Internally, DTE Energy uses operating earnings to measure performance against budget and to report to the Board of Directors. YTD 2008 DTE Energy Electric Utility Gas Utility Gas Midstream Energy Trading Power & Indust. Projects Uncov. Gas Prod. Corporate & Other Synfuel Reported Earnings $240 $92 $48 $16 $17 $4 $86 ($35) $12 Core Barnett Sale (81) - - - - - - - - - - (81) - - - - Antrim hedge 4 - - - - - - 3 - - - - 1 - - Synfuel Discontinued Operations (12) - - - - - - - - - - - - - - (12) Crete Sale - Tax True up 2 - - - - - - - - - - - - 2 - - Operating Earnings $153 $92 $48 $16 $20 $4 $5 ($32) - - Net Income ($ millions) |
Reconciliation of 2008 and 2009 Reported to Operating Earnings Use of Operating Earnings Information - DTE Energy management believes that operating earnings provide a more meaningful representation of the company's earnings from ongoing operations and uses operating earnings as the primary performance measurement for external communications with analysts and investors. Internally, DTE Energy uses operating earnings to measure performance against budget and to report to the Board of Directors. In this presentation, DTE Energy provides 2008 guidance and 2009 early outlook for operating earnings. It is likely that certain items that impact the company's 2008 and 2009 reported results will be excluded from operating results. A reconciliation to the comparable 2008 and 2009 reported earnings/net income guidance/early outlook is not provided because it is not possible to provide a reliable forecast of specific line items. These items may fluctuate significantly from period to period and may have a significant impact on reported earnings. |
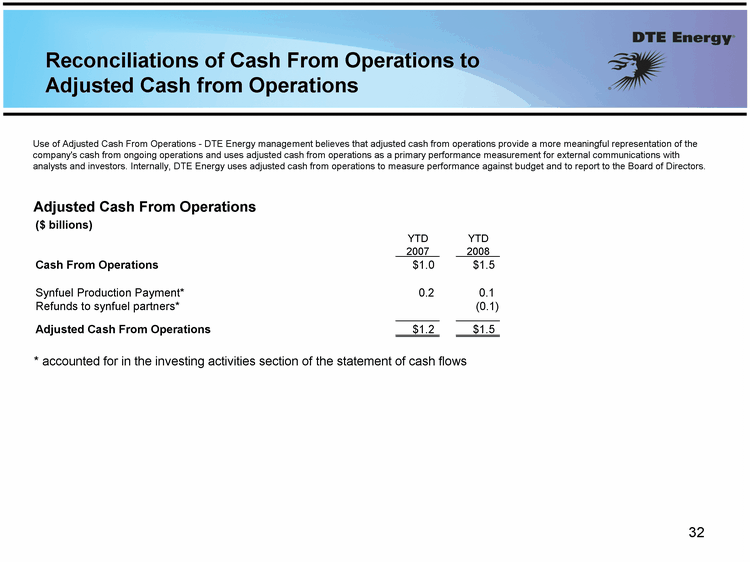
Reconciliations of Cash From Operations to Adjusted Cash from Operations * accounted for in the investing activities section of the statement of cash flows Adjusted Cash From Operations Use of Adjusted Cash From Operations - DTE Energy management believes that adjusted cash from operations provide a more meaningful representation of the company's cash from ongoing operations and uses adjusted cash from operations as a primary performance measurement for external communications with analysts and investors. Internally, DTE Energy uses adjusted cash from operations to measure performance against budget and to report to the Board of Directors. ($ billions) YTD 2007 YTD 2008 Cash From Operations $1.0 $1.5 Synfuel Production Payment* 0.2 0.1 Refunds to synfuel partners* (0.1) Adjusted Cash From Operations $1.2 $1.5 |