Exhibit 99.1
Lehman Brothers 2008 CEO Energy/Power Conference September 3, 2008 David E. Meador Executive Vice President and CFO |
2 Safe Harbor Statement The information contained herein is as of the date of this presentation. DTE Energy expressly disclaims any current intention to update any forward-looking statements contained in this document as a result of new information or future events or developments. Words such as "anticipate," "believe," "expect," "projected" and "goals" signify forward-looking statements. Forward-looking statements are not guarantees of future results and conditions but rather are subject to various assumptions, risks and uncertainties. This presentation contains forward-looking statements about DTE Energy's financial results and estimates of future prospects, and actual results may differ materially. Factors that may impact forward-looking statements include, but are not limited to: the uncertainties of successful exploration of gas shale resources and inability to estimate gas reserves with certainty; the effects of weather and other natural phenomena on operations and sales to customers, and purchases from suppliers; economic climate and population growth or decline in the geographic areas where we do business; environmental issues, laws, regulations, and the cost of remediation and compliance, including potential new federal and state requirements that could include carbon and more stringent mercury emission controls, a renewable portfolio standard and energy efficiency mandates; nuclear regulations and operations associated with nuclear facilities; impact of electric and gas utility restructuring in Michigan, including legislative amendments and Customer Choice programs; employee relations and the impact of collective bargaining agreements; unplanned outages; access to capital markets and capital market conditions and the results of other financing efforts which can be affected by credit agency ratings; the timing and extent of changes in interest rates; the level of borrowings; changes in the cost and availability of coal and other raw materials, purchased power and natural gas; effects of competition; impact of regulation by the FERC, MPSC, NRC and other applicable governmental proceedings and regulations, including any associated impact on rate structures; contributions to earnings by non-utility subsidiaries; changes in and application of federal, state and local tax laws and their interpretations, including the Internal Revenue Code, regulations, rulings, court proceedings and audits; the ability to recover costs through rate increases; the availability, cost, coverage and terms of insurance; the cost of protecting assets against, or damage due to, terrorism; changes in and application of accounting standards and financial reporting regulations; changes in federal or state laws and their interpretation with respect to regulation, energy policy and other business issues; amounts of uncollectible accounts receivable; binding arbitration, litigation and related appeals; and changes in the economic and financial viability of our suppliers, customers and trading counterparties, and the continued ability of such parties to perform their obligations to the Company. This presentation should also be read in conjunction with the "Forward-Looking Statements" section in each of DTE Energy's and Detroit Edison's 2007 Form 10-K and 2008 Forms 10-Q (which sections are incorporated herein by reference), and in conjunction with other SEC reports filed by DTE Energy and Detroit Edison. Cautionary Note - The Securities and Exchange Commission permits oil and gas companies, in their filings with the SEC, to disclose only proved reserves that a company has demonstrated by actual production or conclusive formation tests to be economically and legally producible under existing economic and operating conditions. We use certain terms in this presentation such as "probable reserves" that the SEC's guidelines strictly prohibit us from including in filings with the SEC. You are urged to consider closely the disclosure in our Forms 10-K, File No. 1-11607, available from our offices or from our website at www.dteenergy.com. You can also obtain these Forms from the SEC by calling 1-800- SEC-0330. |
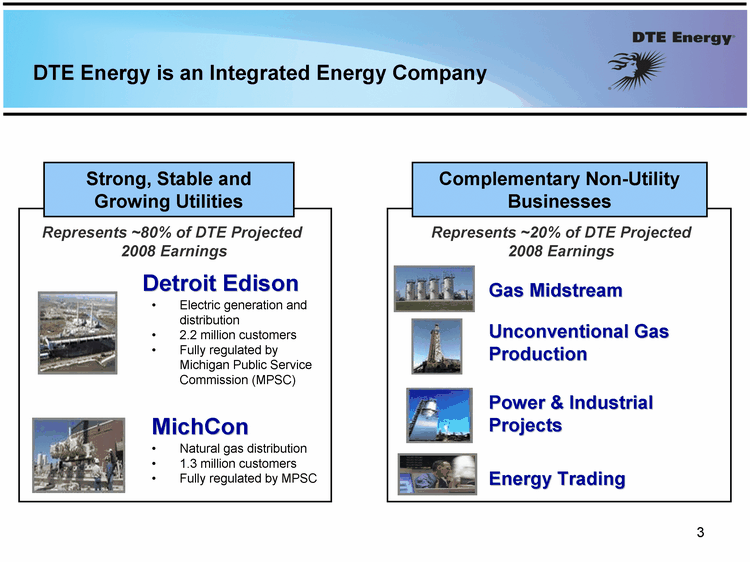
3 Gas Midstream Power & Industrial Projects Unconventional Gas Production Detroit Edison MichCon DTE Energy is an Integrated Energy Company Complementary Non-Utility Businesses Strong, Stable and Growing Utilities Electric generation and distribution 2.2 million customers Fully regulated by Michigan Public Service Commission (MPSC) Natural gas distribution 1.3 million customers Fully regulated by MPSC Energy Trading Represents ~80% of DTE Projected 2008 Earnings Represents ~20% of DTE Projected 2008 Earnings |
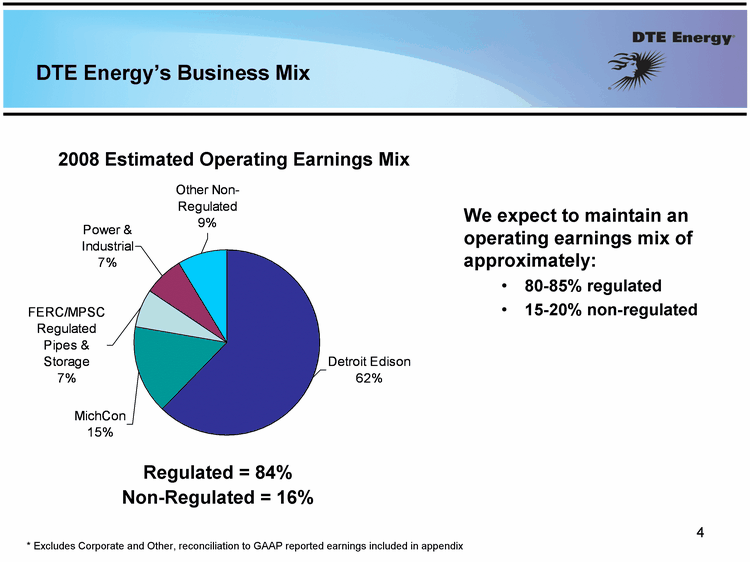
4 Detroit Edison 350 MichCon 87.5 FERC/MPSC Regulated Pipes & Storage 37.5 P&I 40 Other Non-Regulated 48 DTE Energy's Business Mix 1st Qtr 2nd Qtr 3rd Qtr 4th Qtr East 20.4 27.4 90 20.4 West 30.6 38.6 34.6 31.6 North 45.9 46.9 45 43.9 Non-Regulated = 16% Regulated = 84% 2008 Estimated Operating Earnings Mix * Excludes Corporate and Other, reconciliation to GAAP reported earnings included in appendix We expect to maintain an operating earnings mix of approximately: 80-85% regulated 15-20% non-regulated |
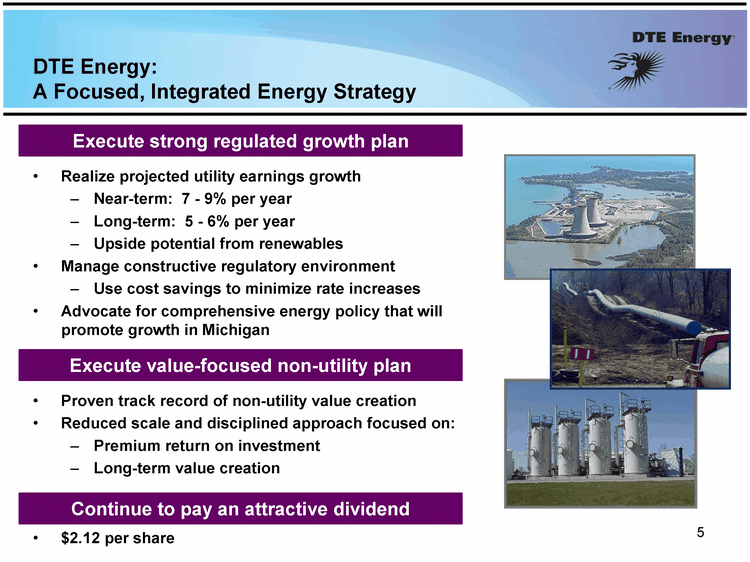
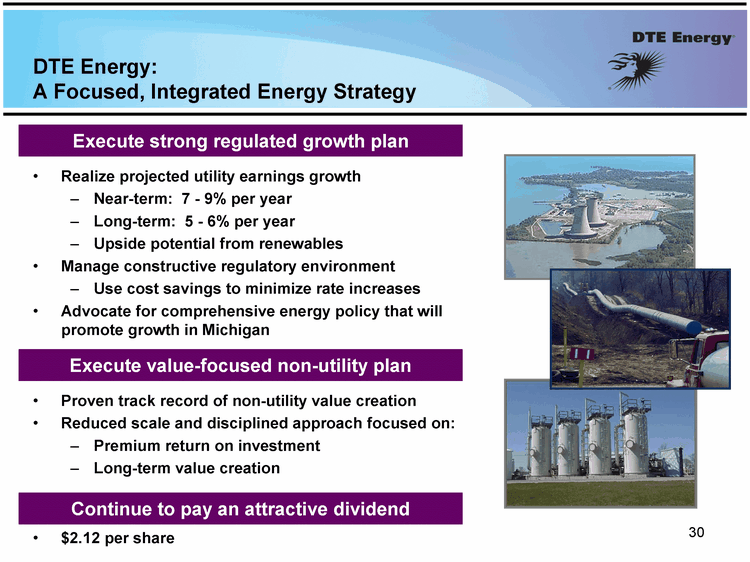
5 Execute strong regulated growth plan DTE Energy: A Focused, Integrated Energy Strategy Execute value-focused non-utility plan Continue to pay an attractive dividend Realize projected utility earnings growth Near-term: 7 - 9% per year Long-term: 5 - 6% per year Upside potential from renewables Manage constructive regulatory environment Use cost savings to minimize rate increases Advocate for comprehensive energy policy that will promote growth in Michigan Proven track record of non-utility value creation Reduced scale and disciplined approach focused on: Premium return on investment Long-term value creation $2.12 per share |
Execute Strong Regulated Growth Plan |
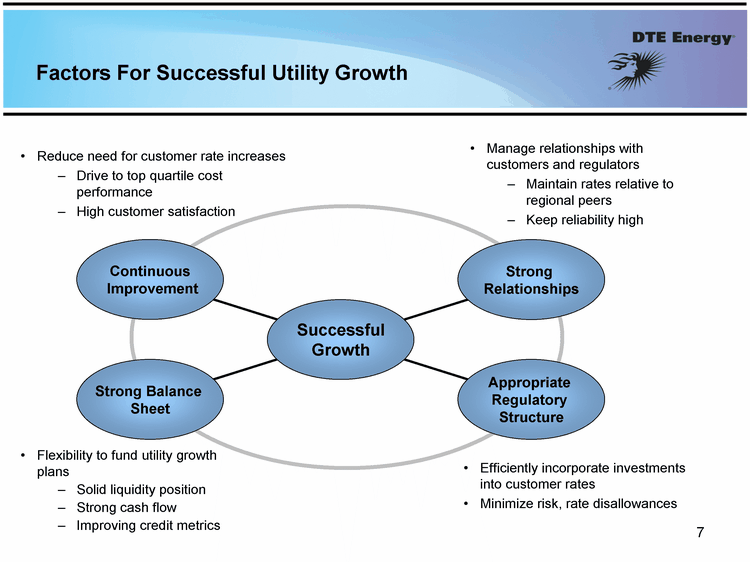
7 Factors For Successful Utility Growth Reduce need for customer rate increases Drive to top quartile cost performance High customer satisfaction Flexibility to fund utility growth plans Solid liquidity position Strong cash flow Improving credit metrics Manage relationships with customers and regulators Maintain rates relative to regional peers Keep reliability high Efficiently incorporate investments into customer rates Minimize risk, rate disallowances |
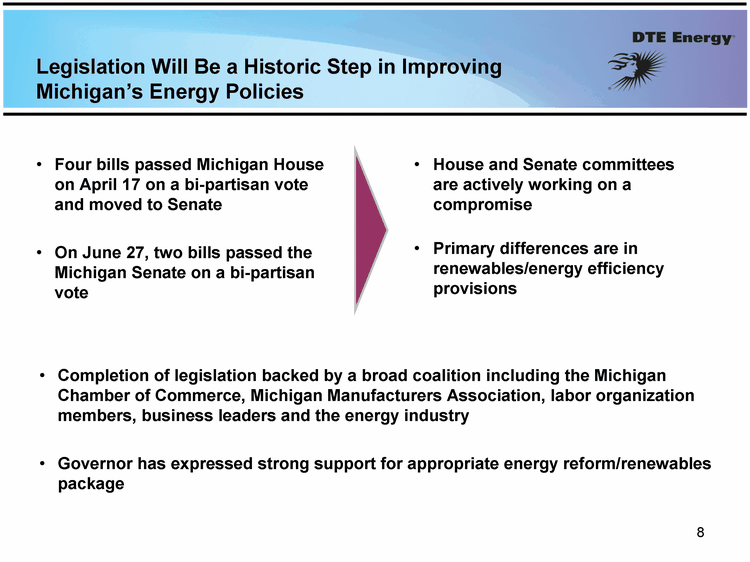
8 Legislation Will Be a Historic Step in Improving Michigan's Energy Policies Four bills passed Michigan House on April 17 on a bi-partisan vote and moved to Senate On June 27, two bills passed the Michigan Senate on a bi-partisan vote Completion of legislation backed by a broad coalition including the Michigan Chamber of Commerce, Michigan Manufacturers Association, labor organization members, business leaders and the energy industry Governor has expressed strong support for appropriate energy reform/renewables package House and Senate committees are actively working on a compromise Primary differences are in renewables/energy efficiency provisions |
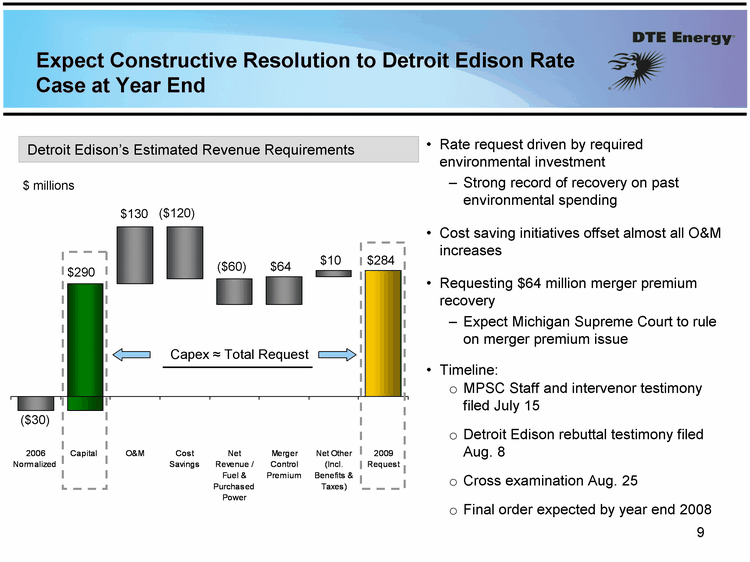
Rate request driven by required environmental investment Strong record of recovery on past environmental spending Cost saving initiatives offset almost all O&M increases Requesting $64 million merger premium recovery Expect Michigan Supreme Court to rule on merger premium issue Timeline: MPSC Staff and intervenor testimony filed July 15 Detroit Edison rebuttal testimony filed Aug. 8 Cross examination Aug. 25 Final order expected by year end 2008 Expect Constructive Resolution to Detroit Edison Rate Case at Year End 2006 Normalized Capital O&M Cost Savings Net Revenue / Fuel & Purchased Power Merger Control Premium Net Other (Incl. Benefits & Taxes) 2009 Request East -32 -32 254 265 208 208 271 284 West 254 129 118 57 63 13 North ($30) $130 $290 ($60) ($120) $64 $10 $284 Detroit Edison's Estimated Revenue Requirements $ millions Capex ^ Total Request 9 |
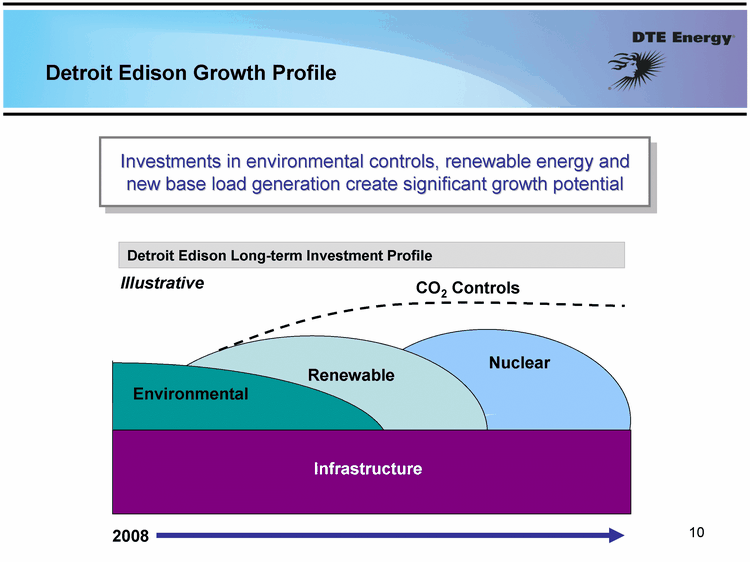
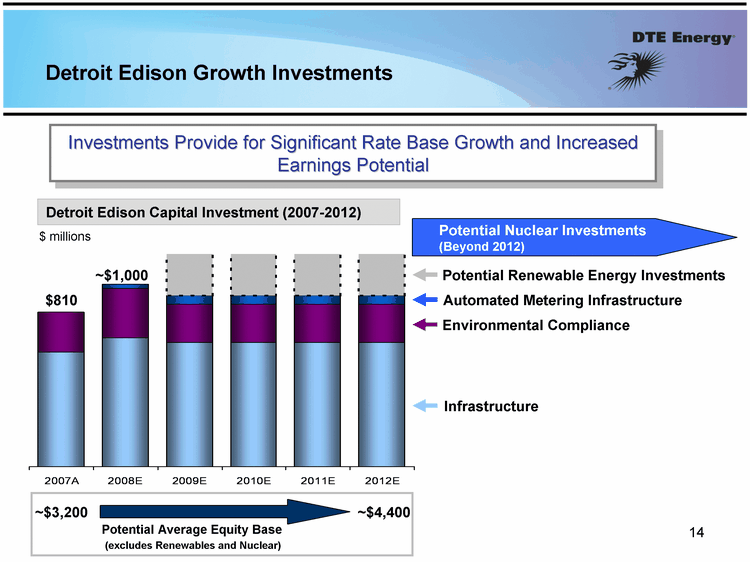
10 Detroit Edison Growth Profile Infrastructure Environmental Renewable Nuclear Detroit Edison Long-term Investment Profile Illustrative Investments in environmental controls, renewable energy and new base load generation create significant growth potential 2008 CO2 Controls |
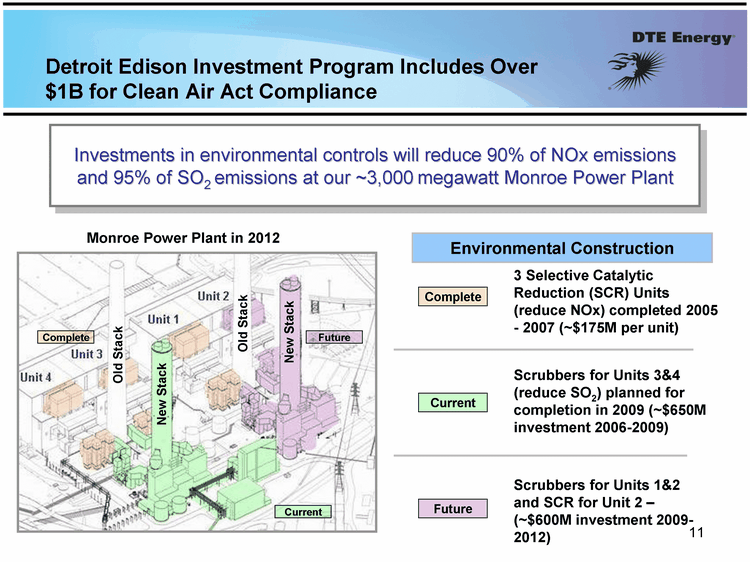
11 Future Current Complete Monroe Power Plant in 2012 Environmental Construction Complete Current Future 3 Selective Catalytic Reduction (SCR) Units (reduce NOx) completed 2005 - - 2007 (~$175M per unit) Scrubbers for Units 3&4 (reduce SO2) planned for completion in 2009 (~$650M investment 2006-2009) Scrubbers for Units 1&2 and SCR for Unit 2 - (~$600M investment 2009- 2012) Detroit Edison Investment Program Includes Over $1B for Clean Air Act Compliance Old Stack Old Stack New Stack New Stack Investments in environmental controls will reduce 90% of NOx emissions and 95% of SO2 emissions at our ~3,000 megawatt Monroe Power Plant |
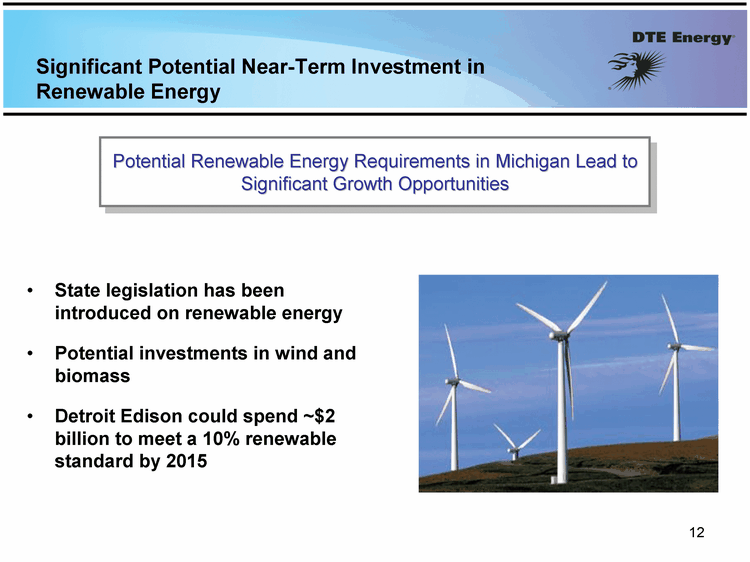
12 Significant Potential Near-Term Investment in Renewable Energy State legislation has been introduced on renewable energy Potential investments in wind and biomass Detroit Edison could spend ~$2 billion to meet a 10% renewable standard by 2015 Potential Renewable Energy Requirements in Michigan Lead to Significant Growth Opportunities |
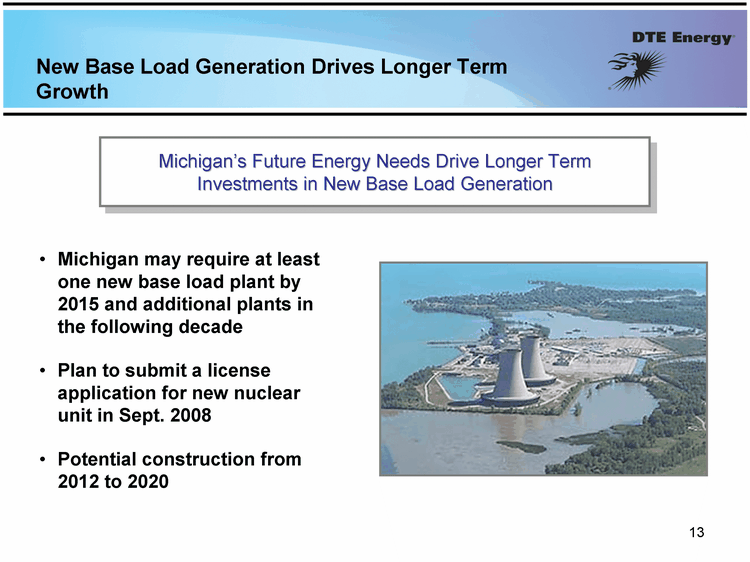
13 New Base Load Generation Drives Longer Term Growth Michigan may require at least one new base load plant by 2015 and additional plants in the following decade Plan to submit a license application for new nuclear unit in Sept. 2008 Potential construction from 2012 to 2020 Michigan's Future Energy Needs Drive Longer Term Investments in New Base Load Generation |
14 2007A 2008E 2009E 2010E 2011E 2012E Base 600 675 650 650 650 650 Environmental 210 260 200 200 200 200 Automated Metering Infrastructure 20 45 45 45 45 Renewable 250 250 250 250 Detroit Edison Growth Investments Detroit Edison Capital Investment (2007-2012) $ millions $810 Potential Average Equity Base (excludes Renewables and Nuclear) ~$3,200 ~$4,400 ~$1,000 Potential Nuclear Investments (Beyond 2012) Infrastructure Environmental Compliance Automated Metering Infrastructure Potential Renewable Energy Investments Investments Provide for Significant Rate Base Growth and Increased Earnings Potential |
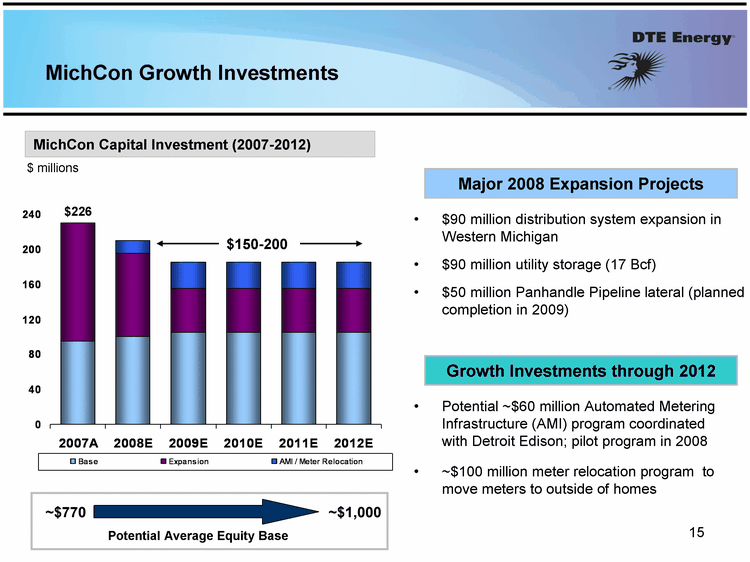
15 MichCon Growth Investments Potential ~$60 million Automated Metering Infrastructure (AMI) program coordinated with Detroit Edison; pilot program in 2008 ~$100 million meter relocation program to move meters to outside of homes $90 million distribution system expansion in Western Michigan $90 million utility storage (17 Bcf) $50 million Panhandle Pipeline lateral (planned completion in 2009) Major 2008 Expansion Projects Growth Investments through 2012 2007A 2008E 2009E 2010E 2011E 2012E Base 95 100 105 105 105 105 MichCon Capital Investment (2007-2012) $ millions $150-200 $226 ~$770 ~$1,000 Potential Average Equity Base |
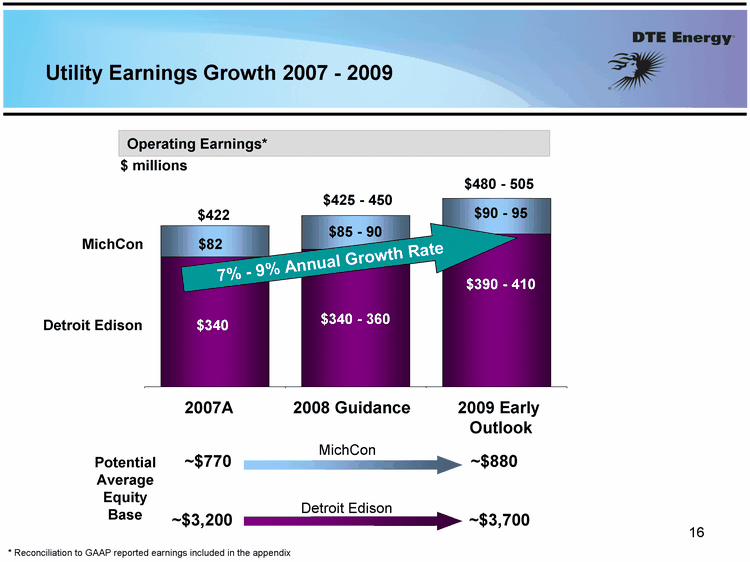
16 Utility Earnings Growth 2007 - 2009 * Reconciliation to GAAP reported earnings included in the appendix Original 2007 Guidance rate red rate case Detroit Edison 340 360 400 82 88 93 2007A 2009 Early Outlook 2008 Guidance $422 $425 - 450 $480 - 505 $340 $82 $85 - 90 $340 - 360 $390 - 410 $90 - 95 Operating Earnings* 7% - 9% Annual Growth Rate Potential Average Equity Base ~$3,200 ~$3,700 ~$770 ~$880 Detroit Edison MichCon $ millions MichCon Detroit Edison |
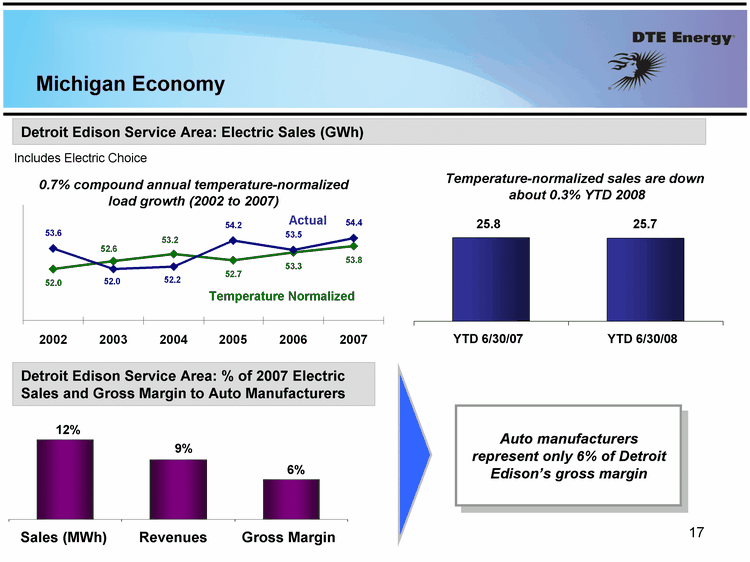
17 Michigan Economy Detroit Edison Service Area: Electric Sales (GWh) Includes Electric Choice Temperature Normalized Actual 0.7% compound annual temperature-normalized load growth (2002 to 2007) 1st Qtr 25.8 25.7 25.8 25.7 YTD 6/30/07 YTD 6/30/08 25.8 Temperature-normalized sales are down about 0.3% YTD 2008 Detroit Edison Service Area: % of 2007 Electric Sales and Gross Margin to Auto Manufacturers Auto manufacturers represent only 6% of Detroit Edison's gross margin Revenues Gross Margin Sales (MWh) 1st Qtr 12 9 6 9% 12% 6% |
Execute Value Focused Non-Utility Growth Plan |
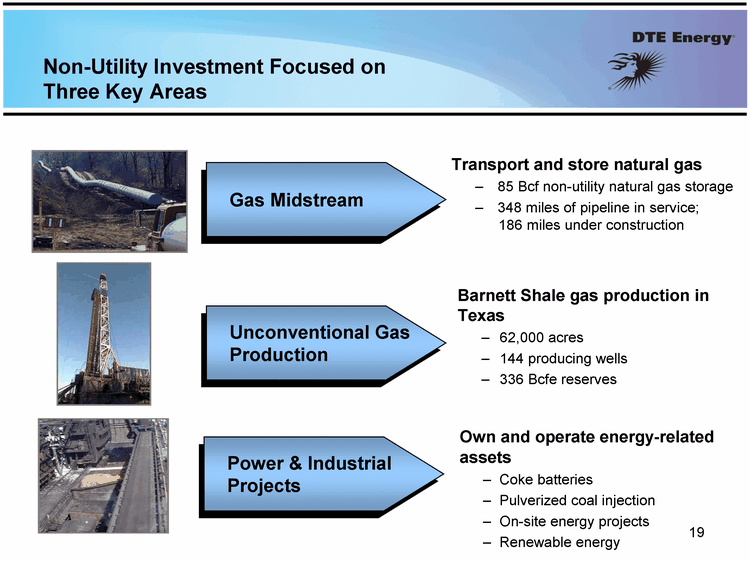
19 Non-Utility Investment Focused on Three Key Areas Transport and store natural gas 85 Bcf non-utility natural gas storage 348 miles of pipeline in service; 186 miles under construction Power & Industrial Projects Gas Midstream Unconventional Gas Production Barnett Shale gas production in Texas 62,000 acres 144 producing wells 336 Bcfe reserves Own and operate energy-related assets Coke batteries Pulverized coal injection On-site energy projects Renewable energy |
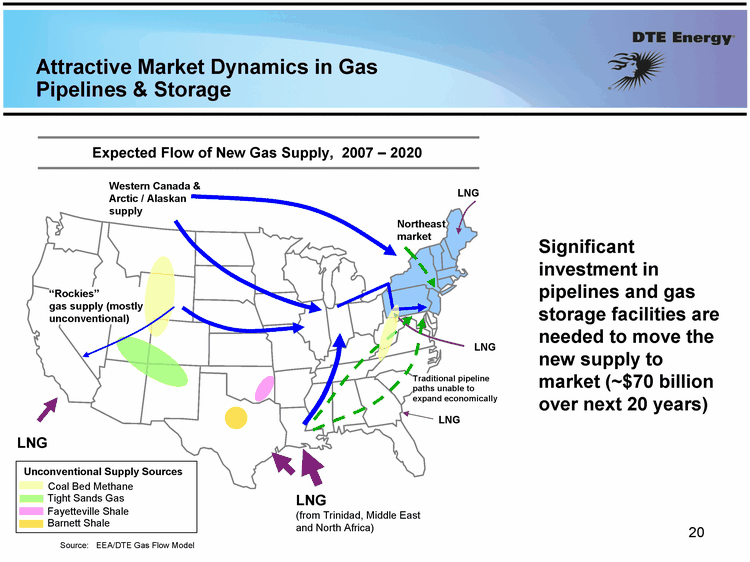
20 Source: EEA/DTE Gas Flow Model LNG (from Trinidad, Middle East and North Africa) LNG LNG LNG Attractive Market Dynamics in Gas Pipelines & Storage Traditional pipeline paths unable to expand economically Expected Flow of New Gas Supply, 2007 - 2020 Western Canada & Arctic / Alaskan supply Northeast market Significant investment in pipelines and gas storage facilities are needed to move the new supply to market (~$70 billion over next 20 years) LNG Coal Bed Methane Tight Sands Gas Fayetteville Shale Barnett Shale Unconventional Supply Sources "Rockies" gas supply (mostly unconventional) |
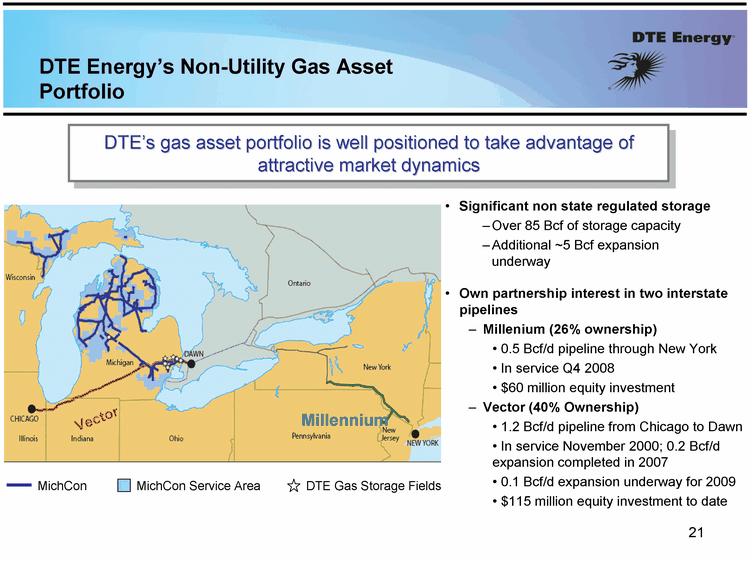
21 DTE Energy's Non-Utility Gas Asset Portfolio DTE's gas asset portfolio is well positioned to take advantage of attractive market dynamics Vector Millennium MichCon MichCon Service Area DTE Gas Storage Fields Significant non state regulated storage Over 85 Bcf of storage capacity Additional ~5 Bcf expansion underway Own partnership interest in two interstate pipelines Millenium (26% ownership) 0.5 Bcf/d pipeline through New York In service Q4 2008 $60 million equity investment Vector (40% Ownership) 1.2 Bcf/d pipeline from Chicago to Dawn In service November 2000; 0.2 Bcf/d expansion completed in 2007 0.1 Bcf/d expansion underway for 2009 $115 million equity investment to date |
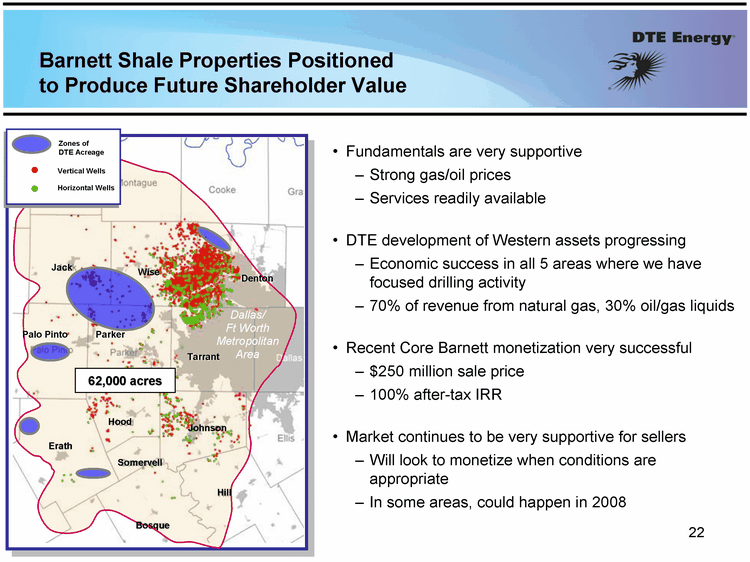
22 Barnett Shale Properties Positioned to Produce Future Shareholder Value Fundamentals are very supportive Strong gas/oil prices Services readily available DTE development of Western assets progressing Economic success in all 5 areas where we have focused drilling activity 70% of revenue from natural gas, 30% oil/gas liquids Recent Core Barnett monetization very successful $250 million sale price 100% after-tax IRR Market continues to be very supportive for sellers Will look to monetize when conditions are appropriate In some areas, could happen in 2008 Clay Zones of DTE Acreage Vertical Wells Horizontal Wells Dallas/ Ft Worth Metropolitan Area 62,000 acres Hood Johnson Erath Jack Somervell Hill Wise Tarrant Bosque Parker Denton Palo Pinto |
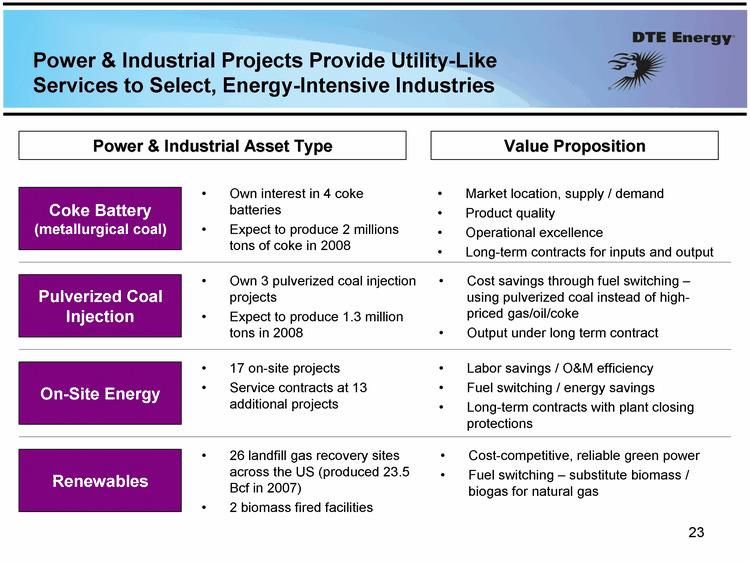
23 Power & Industrial Projects Provide Utility-Like Services to Select, Energy-Intensive Industries Coke Battery (metallurgical coal) Pulverized Coal Injection On-Site Energy Renewables Value Proposition Power & Industrial Asset Type Own interest in 4 coke batteries Expect to produce 2 millions tons of coke in 2008 Own 3 pulverized coal injection projects Expect to produce 1.3 million tons in 2008 17 on-site projects Service contracts at 13 additional projects Market location, supply / demand Product quality Operational excellence Long-term contracts for inputs and output Cost savings through fuel switching - using pulverized coal instead of high- priced gas/oil/coke Output under long term contract Labor savings / O&M efficiency Fuel switching / energy savings Long-term contracts with plant closing protections 26 landfill gas recovery sites across the US (produced 23.5 Bcf in 2007) 2 biomass fired facilities Cost-competitive, reliable green power Fuel switching - substitute biomass / biogas for natural gas |
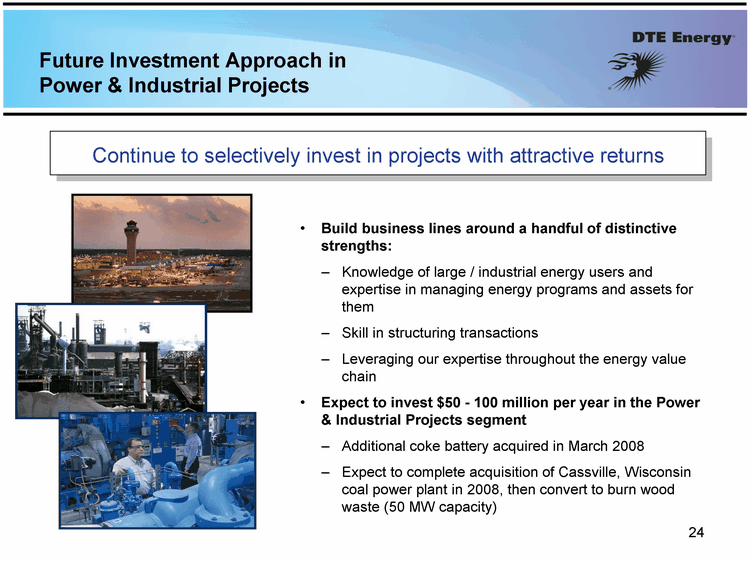
24 Future Investment Approach in Power & Industrial Projects Build business lines around a handful of distinctive strengths: Knowledge of large / industrial energy users and expertise in managing energy programs and assets for them Skill in structuring transactions Leveraging our expertise throughout the energy value chain Expect to invest $50 - 100 million per year in the Power & Industrial Projects segment Additional coke battery acquired in March 2008 Expect to complete acquisition of Cassville, Wisconsin coal power plant in 2008, then convert to burn wood waste (50 MW capacity) Continue to selectively invest in projects with attractive returns |
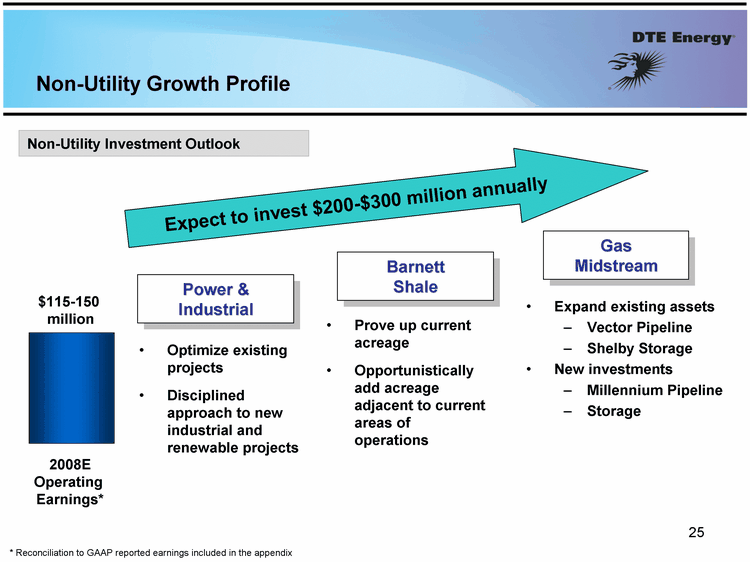
25 2007A MichCon 236 GSPP Non-Utility Growth Profile 2008E Operating Earnings* Expect to invest $200-$300 million annually Expand existing assets Vector Pipeline Shelby Storage New investments Millennium Pipeline Storage Optimize existing projects Disciplined approach to new industrial and renewable projects Gas Midstream Power & Industrial Non-Utility Investment Outlook Barnett Shale * Reconciliation to GAAP reported earnings included in the appendix Prove up current acreage Opportunistically add acreage adjacent to current areas of operations $115-150 million |
Continue To Pay An Attractive Dividend |
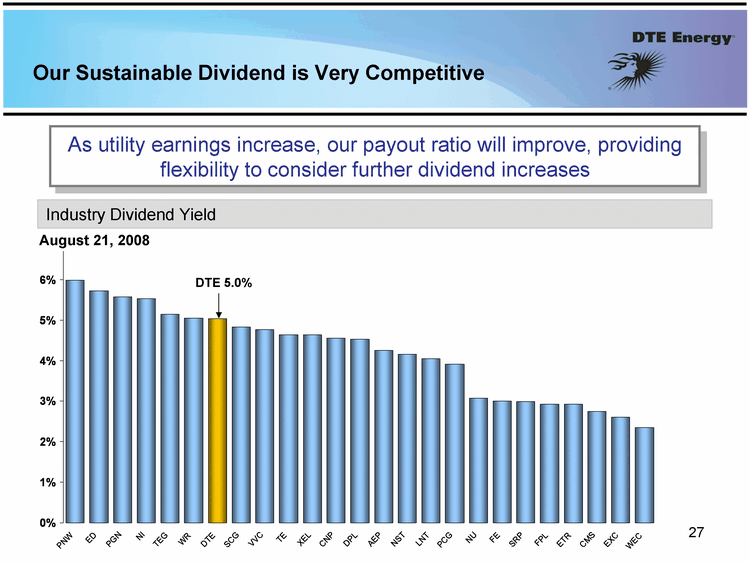
27 Our Sustainable Dividend is Very Competitive As utility earnings increase, our payout ratio will improve, providing flexibility to consider further dividend increases Industry Dividend Yield PNW 0.059897 ED 0.057313 PGN 0.055732 NI 0.055288 TEG 0.051489 WR 0.050567 DTE 0.050356 SCG 0.048294 VVC 0.047619 TE 0.04635 XEL 0.046341 CNP 0.045625 DPL 0.045361 AEP 0.042553 NST 0.041555 LNT 0.040439 PCG 0.039068 NU 0.030753 FE 0.030051 SRP 0.029935 FPL 0.029252 ETR 0.029214 CMS 0.027439 EXC 0.026069 WEC 0.023478 DTE 5.0% August 21, 2008 |
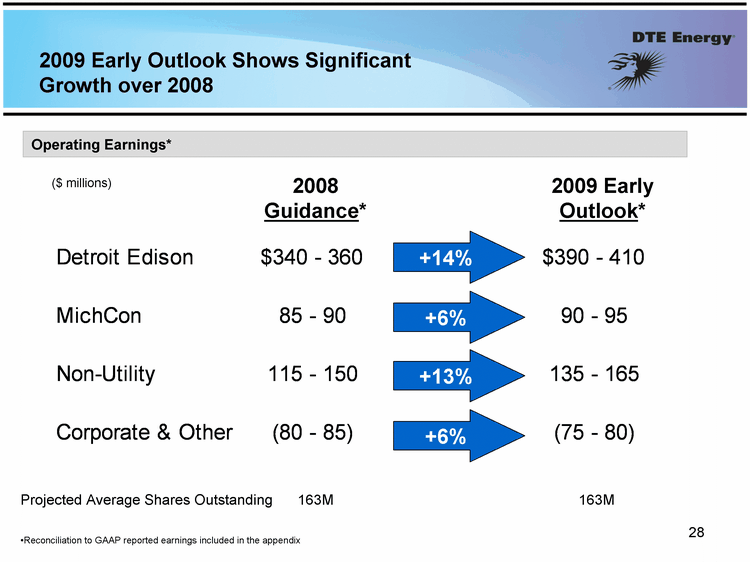
28 2009 Early Outlook Shows Significant Growth over 2008 2008 Guidance* ($ millions) +6% 2009 Early Outlook* +13% +6% +14% Projected Average Shares Outstanding 163M 163M Reconciliation to GAAP reported earnings included in the appendix Operating Earnings* |
Summary |
30 Execute strong regulated growth plan DTE Energy: A Focused, Integrated Energy Strategy Execute value-focused non-utility plan Continue to pay an attractive dividend Realize projected utility earnings growth Near-term: 7 - 9% per year Long-term: 5 - 6% per year Upside potential from renewables Manage constructive regulatory environment Use cost savings to minimize rate increases Advocate for comprehensive energy policy that will promote growth in Michigan Proven track record of non-utility value creation Reduced scale and disciplined approach focused on: Premium return on investment Long-term value creation $2.12 per share |
Appendix |
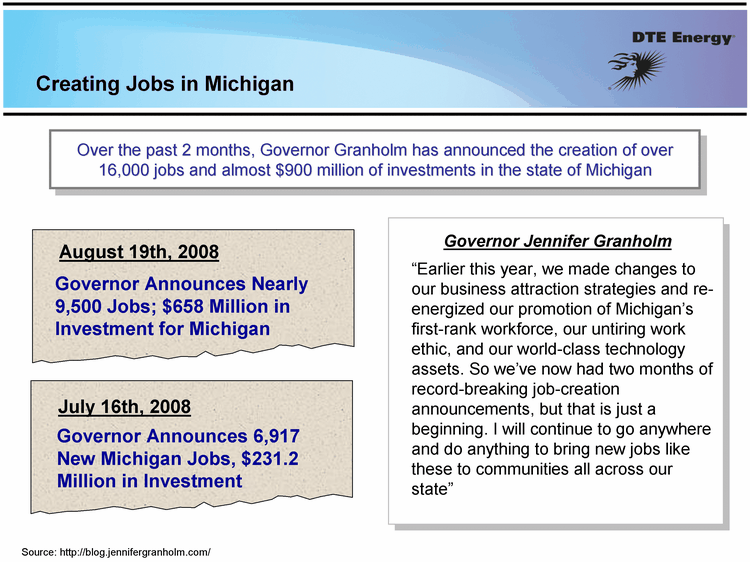
Creating Jobs in Michigan Governor Announces 6,917 New Michigan Jobs, $231.2 Million in Investment July 16th, 2008 Governor Announces Nearly 9,500 Jobs; $658 Million in Investment for Michigan August 19th, 2008 "Earlier this year, we made changes to our business attraction strategies and re- energized our promotion of Michigan's first-rank workforce, our untiring work ethic, and our world-class technology assets. So we've now had two months of record-breaking job-creation announcements, but that is just a beginning. I will continue to go anywhere and do anything to bring new jobs like these to communities all across our state" Source: http://blog.jennifergranholm.com/ Over the past 2 months, Governor Granholm has announced the creation of over 16,000 jobs and almost $900 million of investments in the state of Michigan Governor Jennifer Granholm |
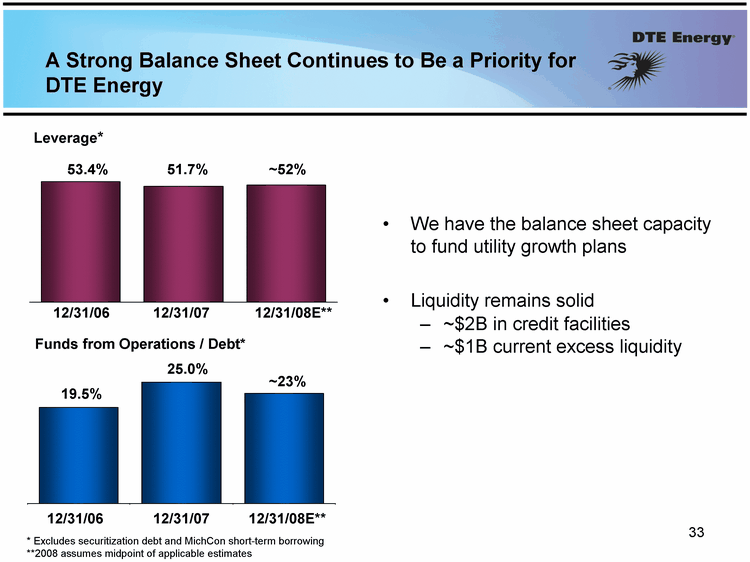
33 Leverage* * Excludes securitization debt and MichCon short-term borrowing **2008 assumes midpoint of applicable estimates Funds from Operations / Debt* A Strong Balance Sheet Continues to Be a Priority for DTE Energy 12/31/2006 12/31/2006 12/31/07E 0.534 0.515 0.52 12/31/2006 12/31/2006 12/31/07E 0.195 0.246 0.223 12/31/06 12/31/07 12/31/08E** 53.4% 51.7% 12/31/06 12/31/07 12/31/08E** 19.5% ~23% ~52% 25.0% We have the balance sheet capacity to fund utility growth plans Liquidity remains solid ~$2B in credit facilities ~$1B current excess liquidity |
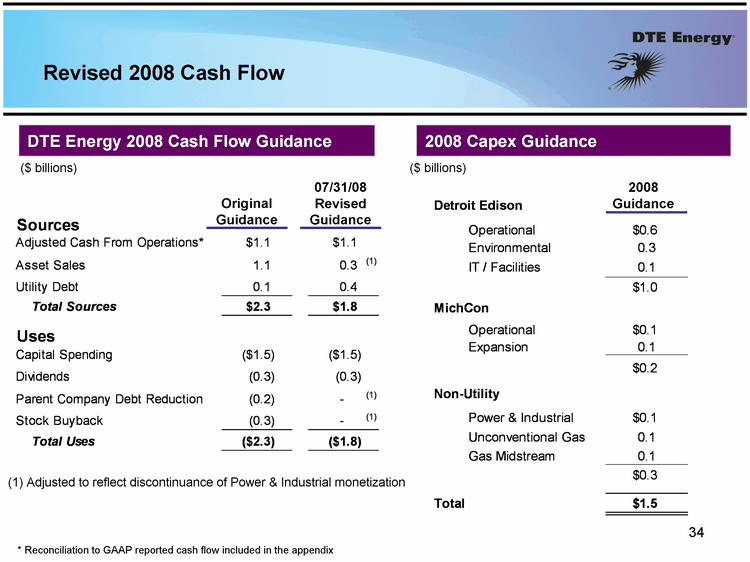
34 2008 Guidance Revised 2008 Cash Flow Original Guidance DTE Energy 2008 Cash Flow Guidance ($ billions) 2008 Capex Guidance ($ billions) 07/31/08 Revised Guidance (1) Adjusted to reflect discontinuance of Power & Industrial monetization * Reconciliation to GAAP reported cash flow included in the appendix |
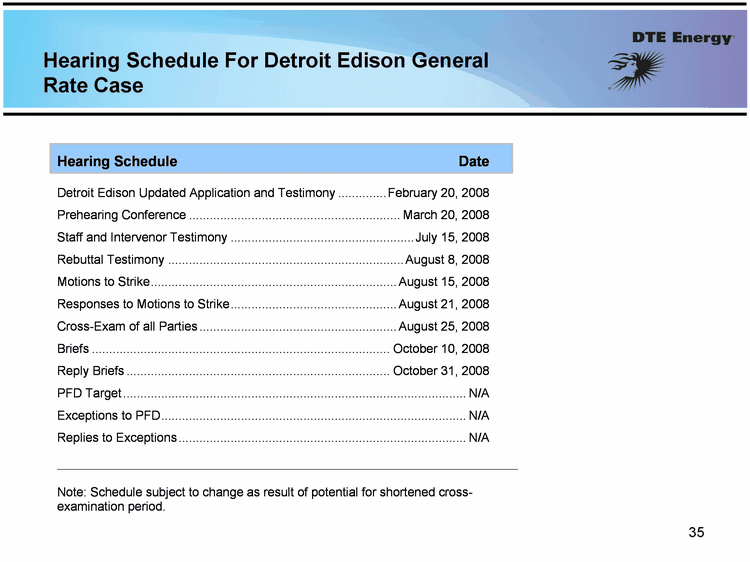
35 Hearing Schedule For Detroit Edison General Rate Case |
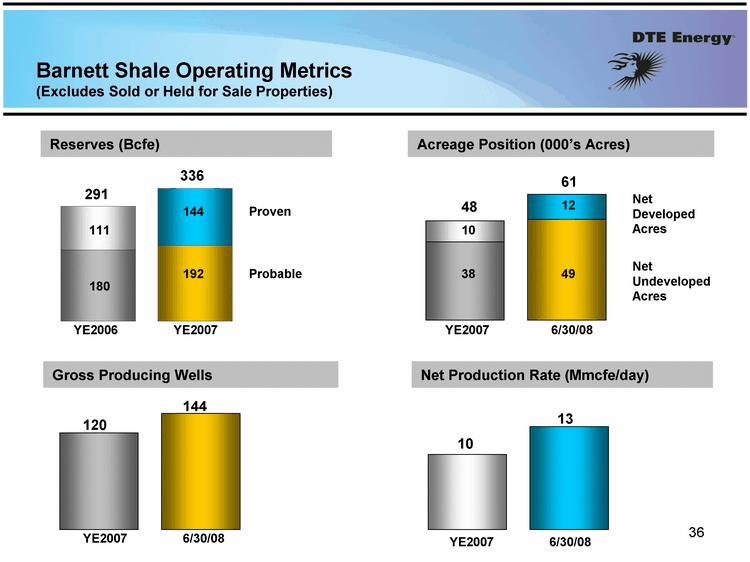
36 Net Production Rate (Mmcfe/day) Gross Producing Wells 144 Reserves (Bcfe) Probable Proven Acreage Position (000's Acres) Net Undeveloped Acres Net Developed Acres YE2007 192 144 336 Barnett Shale Operating Metrics (Excludes Sold or Held for Sale Properties) 111 180 YE2006 291 12 6/30/08 49 61 10 38 YE2007 48 6/30/08 YE2007 120 13 6/30/08 YE2007 10 |
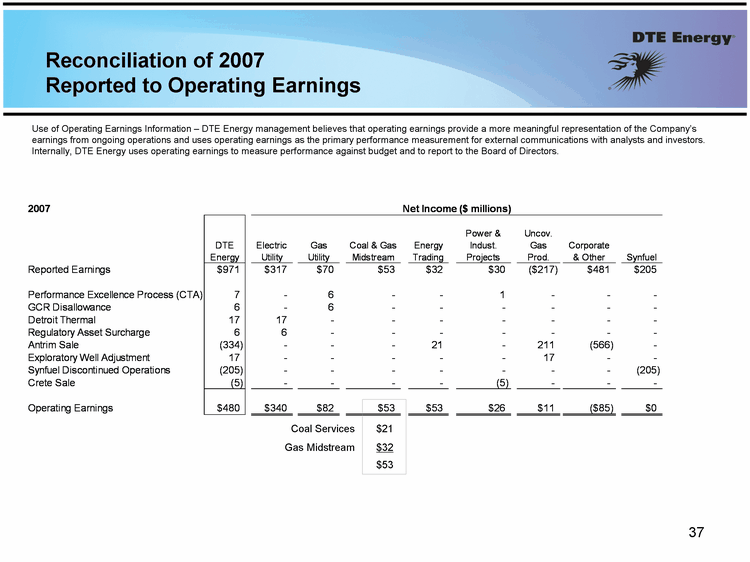
37 Reconciliation of 2007 Reported to Operating Earnings Use of Operating Earnings Information - DTE Energy management believes that operating earnings provide a more meaningful representation of the Company's earnings from ongoing operations and uses operating earnings as the primary performance measurement for external communications with analysts and investors. Internally, DTE Energy uses operating earnings to measure performance against budget and to report to the Board of Directors. Coal Services Gas Midstream $21 $32 $53 |
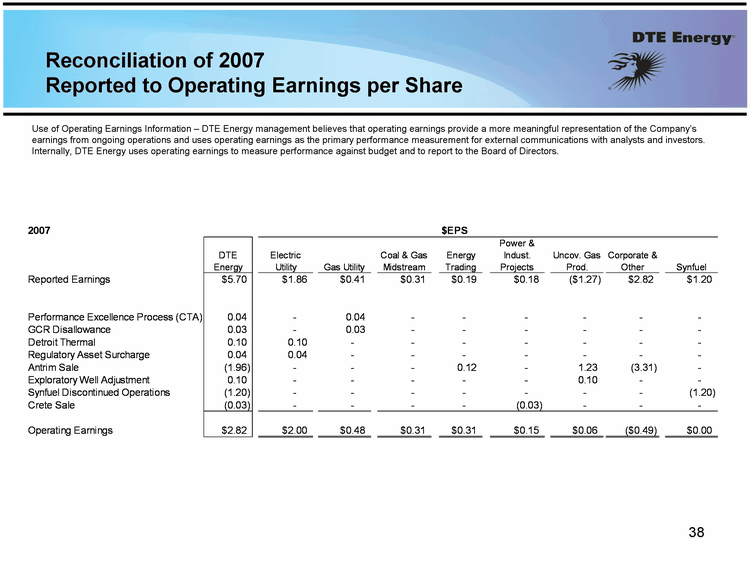
38 Reconciliation of 2007 Reported to Operating Earnings per Share Use of Operating Earnings Information - DTE Energy management believes that operating earnings provide a more meaningful representation of the Company's earnings from ongoing operations and uses operating earnings as the primary performance measurement for external communications with analysts and investors. Internally, DTE Energy uses operating earnings to measure performance against budget and to report to the Board of Directors. |
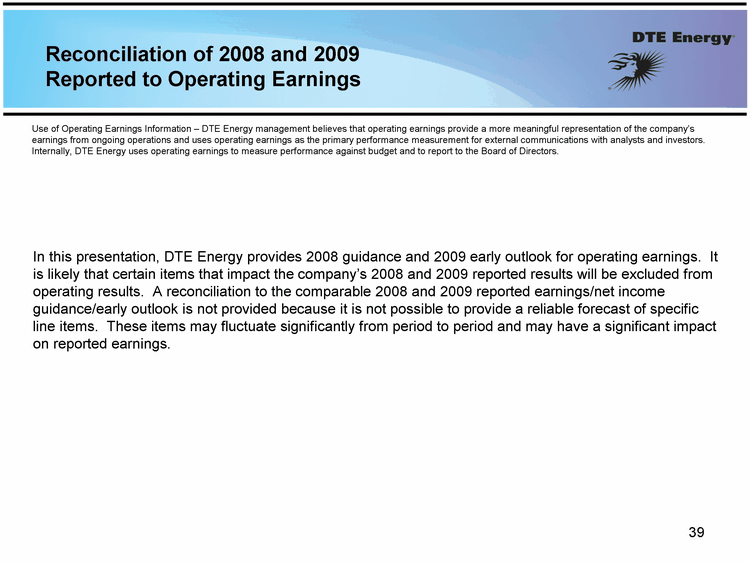
39 Reconciliation of 2008 and 2009 Reported to Operating Earnings Use of Operating Earnings Information - DTE Energy management believes that operating earnings provide a more meaningful representation of the company's earnings from ongoing operations and uses operating earnings as the primary performance measurement for external communications with analysts and investors. Internally, DTE Energy uses operating earnings to measure performance against budget and to report to the Board of Directors. In this presentation, DTE Energy provides 2008 guidance and 2009 early outlook for operating earnings. It is likely that certain items that impact the company's 2008 and 2009 reported results will be excluded from operating results. A reconciliation to the comparable 2008 and 2009 reported earnings/net income guidance/early outlook is not provided because it is not possible to provide a reliable forecast of specific line items. These items may fluctuate significantly from period to period and may have a significant impact on reported earnings. |