Exhibit 99.2

Creating the global leader in Rare Diseases Fourth quarter and full year results to December 31, 2015 4 Flemming Ornskov, M.D. CEO Jeff Poulton CFO Phil Vickers, Ph.D. Head of R&D February 11, 2016
2 “SAFE HARBOR” Statement Under the Private Securities Litigation Reform Act of 1995 Forward - Looking Statements Statements included herein that are not historical facts, including without limitation statements concerning our proposed bus ine ss combination with Baxalta Incorporated (“ Baxalta ”) and the timing and financial and strategic benefits thereof, our 20x20 ambition that targets $20 billion in combined product sales by 2020, as well as other t arg ets for future financial results, capital structure, performance and sustainability of the combined company, the combined company’s future strategy, plans, objectives, expectations and intentions, the anticipated tim ing of clinical trials and approvals for, and the commercial potential of, inline or pipeline products are forward - looking statements. Such forward - looking statements involve a number of risks and uncertainties and are sub ject to change at any time. In the event such risks or uncertainties materialize, Shire’s results could be materially adversely affected. The risks and uncertainties include, but are not limited to, the following: • the proposed combination with Baxalta may not be completed due to a failure to satisfy certain closing conditions, including any shareholder or regulatory approval s or the receipt of applicable tax opinions; • disruption from the proposed transaction with Baxalta may make it more difficult to conduct business as usual or maintain relationships with patients, physicians, employees or sup pl iers; • the combined company may not achieve some or all of the anticipated benefits of Baxalta’s spin - off from Baxter International, Inc. (“Baxter”) and the proposed transaction may have an adverse impact on Baxalta’s existing arrangements with Baxter, including those related to transition, manufacturing and supply services and tax matters; • the failure to achieve the strategic objectives with respect to the proposed combination with Baxalta may adversely affect the combined company’s financial condition and results of operations; • products and product candidates may not achieve commercial success; • product sales from ADDERALL XR and INTUNIV are subject to generic competition; • the failure to obtain and maintain reimbursement, or an adequate level of reimbursement, by third - party payers in a timely manner fo r the combined company’s products may affect future revenues, financial condition and results of operations, particularly if there is pressure on pricing of products to treat rare diseases; • supply chain or manufacturing disruptions may result in declines in revenue for affected products and commercial traction from compe tit ors; regulatory actions associated with product approvals or changes to manufacturing sites, ingredients or manufacturing processes could lead to significant delays, an increase in operating costs, lo st product sales, an interruption of research activities or the delay of new product launches; • the successful development of products in various stages of research and development is highly uncertain and requires significant ex penditures and time, and there is no guarantee that these products will receive regulatory approval; • the actions of certain customers could affect the combined company’s ability to sell or market products profitably, and fluctuati ons in buying or distribution patterns by such customers can adversely affect the combined company’s revenues, financial condition or results of operations; • investigations or enforcement action by regulatory authorities or law enforcement agencies relating to the combined company’s activities in the highly regulated markets in which it operates may result in significant legal costs and the payment of substantial compensation or fines; • adverse outcomes in legal matters and other disputes, including the combined company’s ability to enforce and defend patents and othe r i ntellectual property rights required for its business, could have a material adverse effect on the combined company’s revenues, financial condition or results of operations; • Shire is undergoing a corporate reorganization and was the subject of an unsuccessful acquisition proposal and the consequent uncer tai nty could adversely affect the combined company’s ability to attract and/or retain the highly skilled personnel needed to meet its strategic objectives; • failure to achieve the strategic objectives with respect to Shire’s acquisition of NPS Pharmaceuticals Inc. or Dyax Corp. (“ Dyax ”) may adversely affect the combined company’s financial condition and results of operations; • the combined company will be dependent on information technology and its systems and infrastructure face certain risks, including fr om service disruptions, the loss of sensitive or confidential information, cyber - attacks and other security breaches or data leakages that could have a material adverse effect on the combined company’s revenues, fi nan cial condition or results of operations; • the combined company may be unable to retain and hire key personnel and/or maintain its relationships with customers, suppliers a nd other business partners; • difficulties in integrating Dyax or Baxalta into Shire may lead to the combined company not being able to realize the expected operating efficiencies, cost savings, reve nu e enhancements, synergies or other benefits at the time anticipated or at all; and other risks and uncertainties detailed from time to time in Shire’s, Dyax’s or Baxalta’s filings with the Securities and Exchange Commission (“SEC”), including those risks outlined in Baxalta’s current Registration Statement on Form S - 1, as amended, and in “Item 1A: Risk Factors” in Shire’s Annual Report on Form 10 - K for the year ended Decem ber 31, 2014. All forward - looking statements attributable to us or any person acting on our behalf are expressly qualified in their entirety b y this cautionary statement. Readers are cautioned not to place undue reliance on these forward - looking statements that speak only as of the date hereof. Except to the extent otherwise required by applicable law, we do not undertake any obligation to republish revised forward - looking statements to reflect events or circumstances after the date hereof or to reflect the occurrence of unanticipated events.

3 “SAFE HARBOR” Statement Under the Private Securities Litigation Reform Act of 1995 (continued) Additional Information This communication does not constitute an offer to buy or solicitation of any offer to sell securities or a solicitation of a ny vote or approval. It does not constitute a prospectus or prospectus equivalent document. This communication relates to the proposed business combination between Shire and Baxalta . The proposed combination will be submitted to Shire’s and Baxalta’s shareholders for their consideration and approval. In connection with the proposed combination, Shire and Baxalta will file relevant materials with ( i ) the SEC, including a Shire registration statement on Form S - 4 that will include a proxy statement of Baxalta and a prospectus of Shire, and (ii) the Financial Conduct Authority (FCA) in the UK, including a prospectus relating to Shire ordinary shares to be issued i n c onnection with the proposed combination and a circular to the shareholders of Shire. Baxalta will mail the proxy statement/prospectus to its shareholders and Shire will mail the circular to its shareholders. This communicat ion is not a substitute for the registration statement, proxy statement/prospectus, UK prospectus, circular or other document(s) that Shire and/or Baxalta may file with the SEC or the FCA in connection with the proposed transaction. INVESTORS AND SECURITY HOLDERS OF SHIRE AND BAX AL TA ARE URGED TO READ CAREFULLY THE REGISTRATION STATEMENT,PROXY STATEMENT/PROSPECTUS AND OTHER DOCUMENTS FILED WITH THE SEC AND THE UK PROSPE CTU S AND CIRCULAR WHEN THEY BECOME AVAILABLE BECAUSE THEY WILL CONTAIN IMPORTANT INFORMATION ABOUT SHIRE, BAXALTA AND THE PROPOSED TRANSACTION. Investors and se cur ity holders may obtain free copies of these documents (when they are available) and other related documents filed with the SEC at the SEC’s web site at www.sec.gov. Investors may req uest copies of the documents filed with the SEC by Shire by directing a request to Shire’s Investor Relations department at Shire plc, Attention: Investor Relations, 300 Shire Way, Lexington, MA 02421 or to Shire’s I nve stor Relations department at +1 484 595 2220 in the U.S. and +44 1256 894157 in the UK or by email to investorrelations@shire.com. Investors may request copies of the documents filed with the SEC by Baxalta by directing a request to Mary Kay Ladone at mary.kayklandone@baxalta.com or (224) 948 - 3371. The statements in this presentation are Shire’s statements and not those of Baxalta or any third party. Certain Information Regarding Participants Shire, Baxalta and their respective directors and executive officers may be deemed participants in the solicitation of proxies in connection w ith the proposed transaction. You can find information about Shire’s directors and executive officers in Shire’s Annual Report on Form 10 - K for the year ended December 31, 2014, which was filed with the SEC on F ebruary 24, 2015. You can find information about Baxalta’s directors and executive officers in Baxalta’s registration statement on Form S - 1, which was filed with the SEC on September 1, 2015.Additional information regarding the spec ial interests of these directors and executive officers in the proposed transaction will be included in the registration statement, proxy statement/prospectus or other documents filed with the SEC if any when the y become available. You may obtain these documents (when they become available) free of charge at the SEC’s web site at www.sec.gov and from Investor Relations at Shire or Baxalta as described above. This communication shall not constitute an offer to sell or the solicitation of an offer to buy any securities, nor shall the re be any sale of securities in any jurisdiction in which such offer, solicitation or sale would be unlawful prior to registration or qualification under the securities laws of any such jurisdiction. No offering of securities shall be ma de except by means of a prospectus meeting the requirements of Section 10 of the U.S. Securities Act of 1933, as amended. Trademarks Shire owns or has rights to use the trademarks, service marks and trade names that it uses in conjunction with the operation of its bu siness. Some of the trademarks that Shire owns or has the rights to use that are referenced in this communication include: ADDERALL XR, CINRYZE, ELAPRASE, FIRAZYR, GATTEX/REVESTIVE, INTUNIV, LIALDA, NATPARA , R EPLAGAL, PENTASA, VPRIV, VYVANSE and XAGRID. Baxalta states that it owns or has the right to use certain trademarks referenced in this communication, including: ADVATE, ADYNOVATE, ARALA ST, FEIBA, FLEXBUMIN, GAMMAGARD, GAMMAGARD LIQUID, GLASSIA, HYQVIA, OBIZUR, ONCASPAR, ONIVYDE, RECOMBINATE, RIXUBIS and SUBCUVIA, which may be registered or used in the United States and other jur isdictions. Basis of Forecasts The Shire forecasts included herein are derived from Shire’s Long Range Plan (the "LRP") and Shire papers subsequently produced a s p art of the business planning process. Shire produces a long range plan annually. The LRP was updated in March 2015, as part of Shire’s annual planning cycle, and was reviewed by the Board in April 2015. This L RP was subsequently adjusted to reflect revised expectations for SHP625 following trial results in the second quarter of 2015, the Dyax acquisition and other updates for 2015 actual performance. The forecast product sales in Shire’s January 11, 2016 announcement on the proposed combination with Baxalta are consistent with the LRP, which is at constant exchange rates, and reflects net sales for each product and key line extensions currently identified as in Phase III, Phase II and those in Phase I included in the LRP as launching befo re the end of 2020. The forecast product sales included in the LRP are risk - adjusted to reflect Shire’s assessment of the individual probability of launch of products in development, and the probability of success in further life cycle management trials. Estimates for these probabilities are based on industry wide data for relevant clinical trials in the pharmaceutical in dustry at a similar stage of development. For each pharmaceutical product, there is a range of possible outcomes from clinical development, driven by a number of varia ble s, including safety, efficacy and product labelling. In addition, if a product is approved, the effect of commercial factors including the patient population, the competitive environment, pricing and reimbursement is also un certain. As a result, the actual net sales achieved by a product over its commercial life will be different, perhaps materially so, from the risk adjusted net sales figures in this announcement and should be considered in t his light. The forecast product sales for Baxalta’s included in this communication have been stated on a constant currency and risk adjusted basis . IMS information is an estimate derived from the use of information under license from the following IMS Health information servic e: IMS NPA Weekly for the period Jan 17, 2014 to Jan 22, 2016. IMS expressly reserves all rights, including rights of copying, distribution and republication .
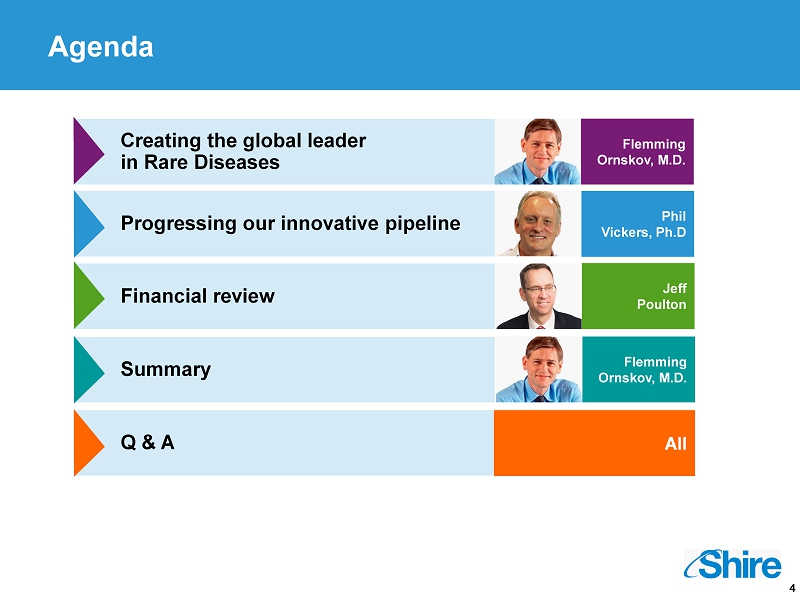
4 Agenda Creating the global leader in Rare Diseases Financial review Summary Q & A Flemming Ornskov , M.D. Progressing our innovative pipeline Phil Vickers, Ph.D Jeff Poulton Flemming Ornskov, M.D. All
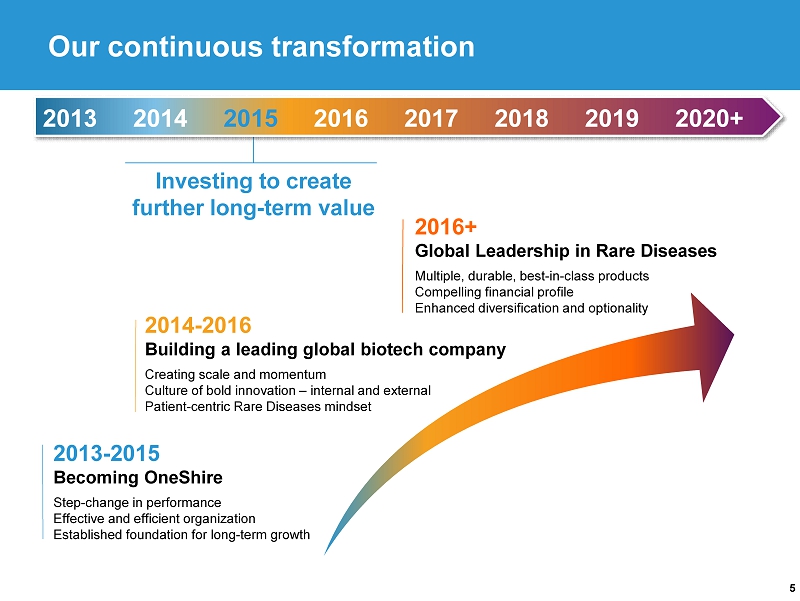
5 2013 - 2015 Becoming OneShire Step - change in performance Effective and efficient organization Established foundation for long - term growth Investing to create further long - term value 2013 2014 2015 2016 2017 2018 2019 2020+ Our continuous transformation 2014 - 2016 Building a leading global biotech company Creating scale and momentum Culture of bold innovation – internal and external Patient - centric Rare Diseases mindset 2016+ Global Leadership in Rare Diseases Multiple, durable, best - in - class products Compelling financial profile Enhanced diversification and optionality
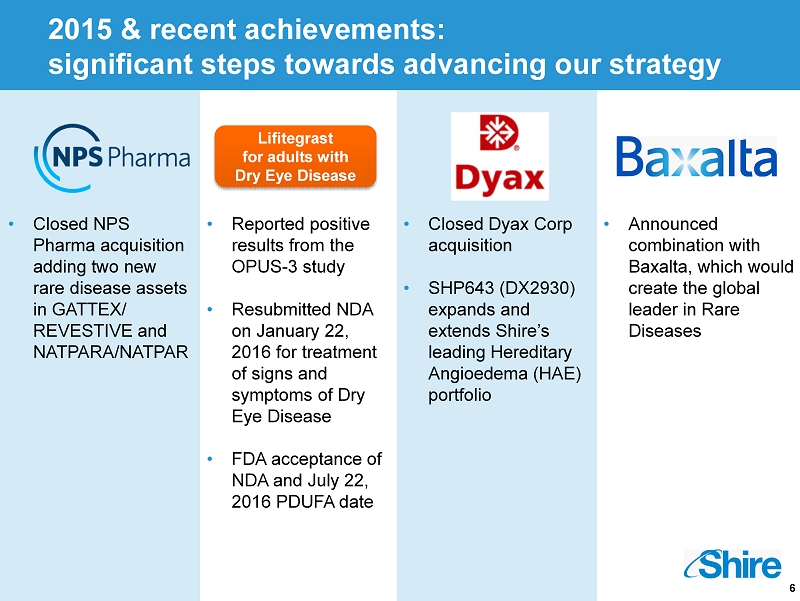
6 2015 & recent achievements: significant steps towards advancing our strategy • Closed NPS Pharma acquisition adding two new rare disease assets in GATTEX/ REVESTIVE and NATPARA/NATPAR • Reported positive results from the OPUS - 3 study • Resubmitted NDA on January 22, 2016 for treatment of signs and symptoms of Dry Eye Disease • FDA acceptance of NDA and July 22, 2016 PDUFA date Lifitegrast for adults with D ry E ye D isease • Announced combination with Baxalta , which would create the global leader in Rare Diseases • Closed Dyax Corp acquisition • SHP643 (DX2930) expands and extends Shire’s leading Hereditary Angioedema (HAE) portfolio
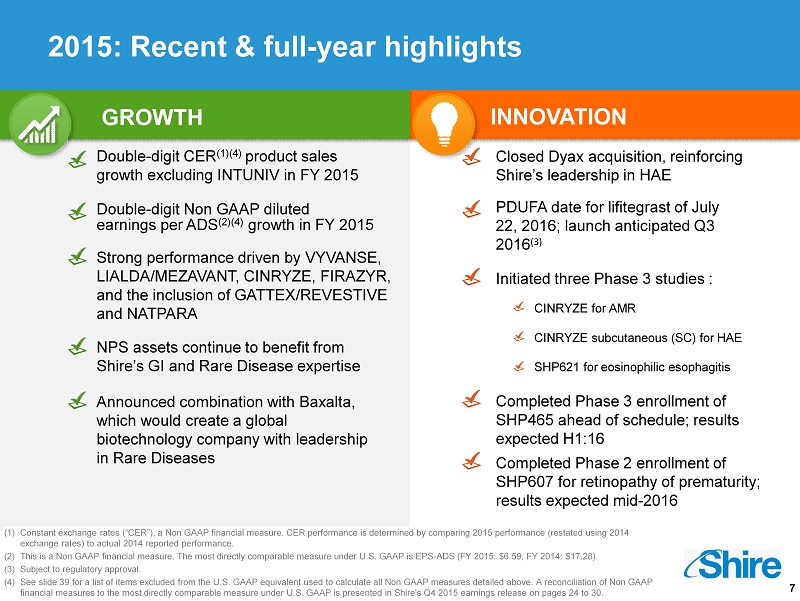
7 Strong performance driven by VYVANSE, LIALDA/MEZAVANT, CINRYZE, FIRAZYR, and the inclusion of GATTEX/REVESTIVE and NATPARA NPS assets continue to benefit from Shire’s GI and Rare Disease expertise GROWTH Double - digit CER (1)(4) product sales growth excluding INTUNIV in FY 2015 INNOVATION Double - digit Non GAAP diluted earnings per ADS (2) (4 ) growth in FY 2015 (1) Constant exchange rates (“CER”), a Non GAAP financial measure. CER performance is determined by comparing 2015 performance (restated using 2014 exchange rates) to actual 2014 reported performance. (2) This is a Non GAAP financial measure. The most directly comparable measure under U.S. GAAP is EPS - ADS (FY 2015: $6.59, FY 2014: $17.2 8). (3) Subject to regulatory approval. (4) See slide 39 for a list of items excluded from the U.S. GAAP equivalent used to calculate all Non GAAP measures detailed abov e. A reconciliation of Non GAAP financial measures to the most directly comparable measure under U.S. GAAP is presented in Shire's Q4 2015 earnings release o n p ages 24 to 30 . SHP621 for eosinophilic esophagitis PDUFA date for lifitegrast of July 22, 2016; launch anticipated Q3 2016 (3) Closed Dyax acquisition, reinforcing Shire’s leadership in HAE Announced combination with Baxalta , which would create a global biotechnology company with leadership in Rare Diseases CINRYZE for AMR CINRYZE subcutaneous (SC) for HAE Completed Phase 3 enrollment of SHP465 ahead of schedule; results expected H1:16 Completed Phase 2 enrollment of SHP607 for retinopathy of prematurity; results expected mid - 2016 I nitiated three Phase 3 studies : 2015: Recent & full - year highlights
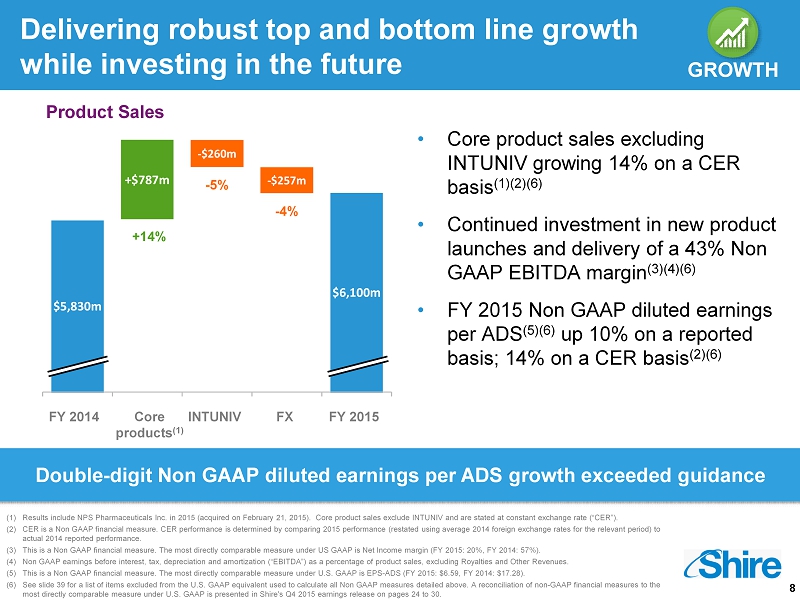
8 Delivering robust top and bottom line growth while investing in the future $5,830m +$787m $6,100m • Core product sales excluding INTUNIV growing 14% on a CER basis (1)(2)(6) • Continued investment in new product launches and delivery of a 43% Non GAAP EBITDA margin (3)(4)(6) • FY 2015 Non GAAP diluted earnings per ADS (5)(6) up 10% on a reported basis; 14% on a CER basis (2)(6) - $260m - $257m FY 2014 Core products (1) INTUNIV FX FY 2015 GROWTH - 5% - 4% Product Sales (1) Results include NPS Pharmaceuticals Inc. in 2015 (acquired on February 21, 2015). Core product sales exclude INTUNIV and are stated at constant exchange rate (“CER”). (2) CER is a Non GAAP financial measure. CER performance is determined by comparing 2015 performance (restated using average 2014 foreign exchange rates for the relevant per iod) to actual 2014 reported performance . (3) This is a Non GAAP financial measure. The most directly comparable measure under US GAAP is Net Income margin (FY 2015: 20%, FY 2014: 57%). (4) Non GAAP earnings before interest, tax, depreciation and amortization (“EBITDA ”) as a percentage of product sales, excluding Royalties and Other Revenues. (5) This is a Non GAAP financial measure. The most directly comparable measure under U.S. GAAP is EPS - ADS (FY 2015 : $6.59, FY 2014: $17.28). (6) See slide 39 for a list of items excluded from the U.S. GAAP equivalent used to calculate all Non GAAP measures detailed above. A reconciliation of non - GAAP financial measures to the most directly comparable measure under U.S. GAAP is presented in Shire's Q4 2015 earnings release on pages 24 to 30. GROWTH +14% Double - digit Non GAAP diluted earnings per ADS growth exceeded guidance
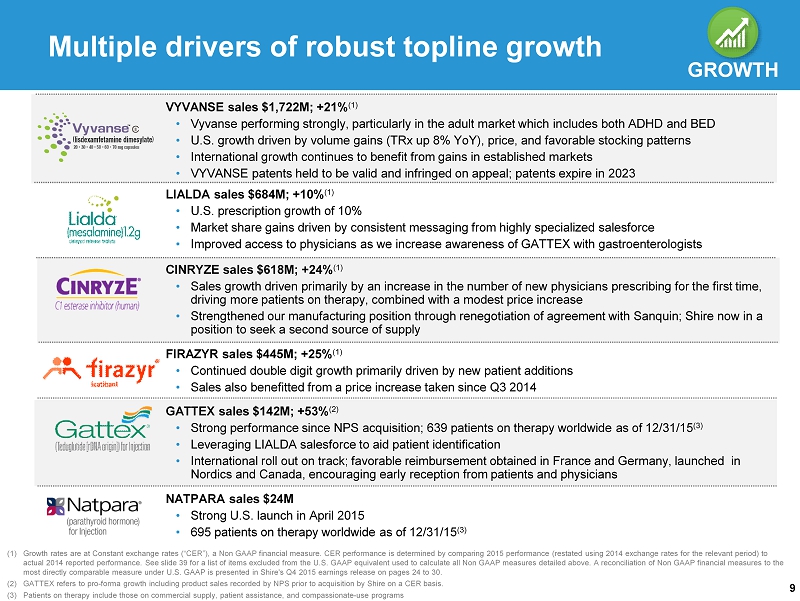
9 Multiple drivers of robust topline growth GROWTH (1) Growth rates are at Constant exchange rates (“CER”), a Non GAAP financial measure. CER performance is determined by comparing 20 15 performance (restated using 2014 exchange rates for the relevant period) to actual 2014 reported performance. See slide 39 for a list of items excluded from the U.S. GAAP equivalent used to calculate all Non GAAP measures detailed above. A reconciliation of Non GAAP financial measures to th e most directly comparable measure under U.S. GAAP is presented in Shire's Q4 2015 earnings release on pages 24 to 30. (2) GATTEX refers to pro - forma growth including product sales recorded by NPS prior to acquisition by Shire on a CER basis . (3) Patients on therapy include those on commercial supply, patient assistance, and compassionate - use programs CINRYZE sales $618M ; +24% ( 1) • Sales growth driven primarily by an increase in the number of new physicians prescribing for the first time, driving more patients on therapy, combined with a modest price increase • Strengthened our manufacturing position through renegotiation of agreement with Sanquin ; Shire now in a position to seek a second source of supply FIRAZYR sales $445M ; + 25% ( 1) • Continued double digit growth primarily driven by new patient additions • Sales also benefitted from a price increase taken since Q3 2014 LIALDA sales $684M; +10% ( 1 ) • U.S. prescription growth of 10% • Market share gains driven by consistent messaging from highly specialized salesforce • Improved access to physicians as we increase awareness of GATTEX with gastroenterologists VYVANSE sales $1,722M ; + 21% ( 1) • Vyvanse performing strongly, particularly in the adult market which includes both ADHD and BED • U.S. growth driven by volume gains ( TRx up 8% YoY ), price, and favorable stocking patterns • International growth continues to benefit from gains in established markets • VYVANSE patents held to be valid and infringed on appeal; patents expire in 2023 GATTEX sales $142M ; + 53% ( 2) • Strong performance since NPS acquisition; 639 patients on therapy worldwide as of 12/31/15 (3) • Leveraging LIALDA salesforce to aid patient identification • International roll out on track; favorable reimbursement obtained in France and Germany, launched in Nordics and Canada, encouraging early reception from patients and physicians NATPARA sales $24M • Strong U.S. launch in April 2015 • 695 patients on therapy worldwide as of 12/31/15 (3)
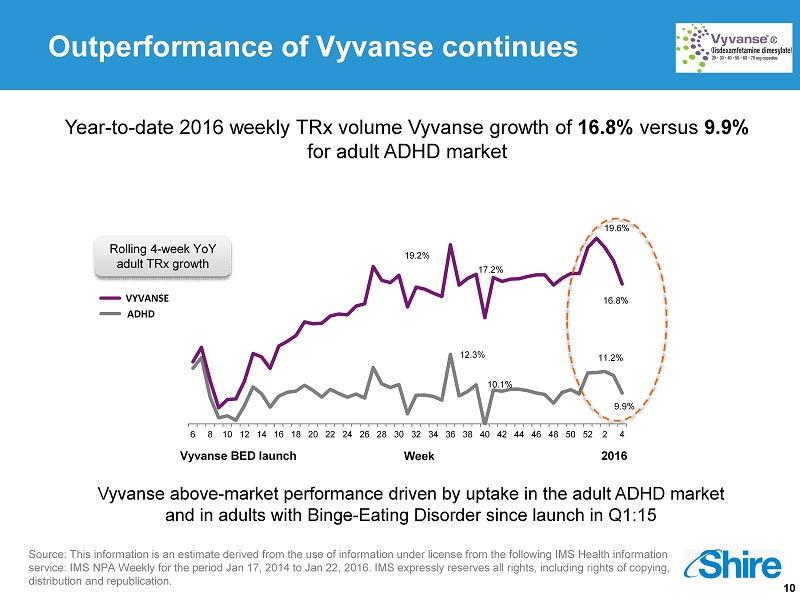
10 Vyvanse above - market performance driven by uptake in the adult ADHD market and in adults with Binge - Eating Disorder since launch in Q1:15 Year - to - date 2016 weekly TRx volume Vyvanse growth of 16.8% versus 9.9% for adult ADHD market Outperformance of Vyvanse continues Rolling 4 - week YoY adult TRx growth 12.3% 10.1% 11.2% 9.9% 19.2% 17.2% 19.6% 16.8% 6 8 10 12 14 16 18 20 22 24 26 28 30 32 34 36 38 40 42 44 46 48 50 52 2 4 ADHD VYVANSE Week Vyvanse BED launch 2016 Source : This information is an estimate derived from the use of information under license from the following IMS Health information service: IMS NPA Weekly for the period Jan 17, 2014 to Jan 22, 2016 . IMS expressly reserves all rights, including rights of copying, distribution and republication .
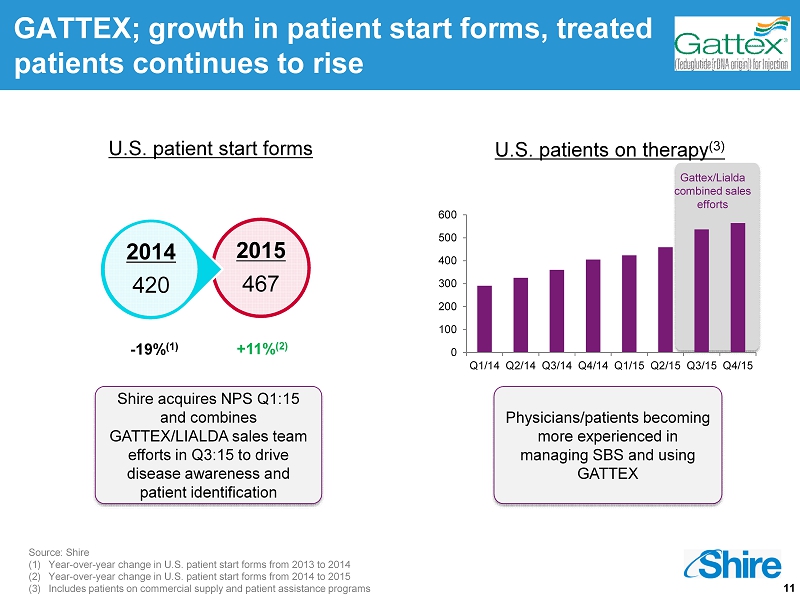
11 Source: Shire (1) Year - over - year change in U.S. patient start forms from 2013 to 2014 (2) Year - over - year change in U.S. patient start forms from 2014 to 2015 (3) Includes patients on commercial supply and patient assistance programs U.S. patient start forms 2015 467 2014 420 GATTEX; growth in patient start forms, treated patients continues to rise Shire acquires NPS Q1:15 and combines GATTEX/LIALDA sales team efforts in Q3:15 to drive disease awareness and patient identification Physicians/patients becoming more experienced in managing SBS and using GATTEX U.S. patients on therapy (3) - 19% (1) +11% (2) Gattex / Lialda combined sales efforts 0 100 200 300 400 500 600 Q1/14 Q2/14 Q3/14 Q4/14 Q1/15 Q2/15 Q3/15 Q4/15
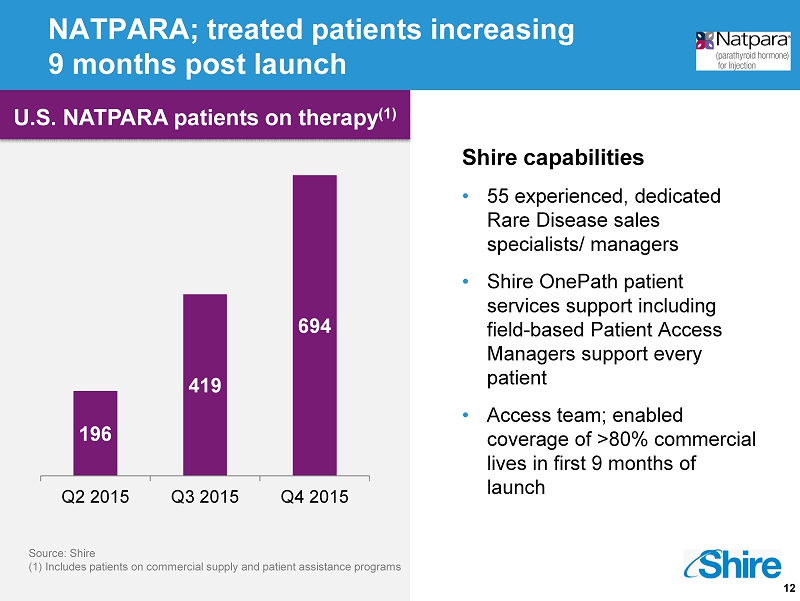
12 NATPARA; treated patients increasing 9 months post launch Shire capabilities • 55 experienced, dedicated Rare Disease sales specialists/ managers • Shire OnePath patient services support including field - based Patient Access Managers support every patient • Access team; enabled coverage of >80% commercial lives in first 9 months of launch 196 419 694 Q2 2015 Q3 2015 Q4 2015 Source: Shire (1 ) Includes patients on commercial supply and patient assistance programs U.S. NATPARA patients on therapy (1)
Our purpose We enable people with life - altering conditions to lead better lives. Phil Vickers, Head of R&D Progressing Shire’s Innovative Pipeline
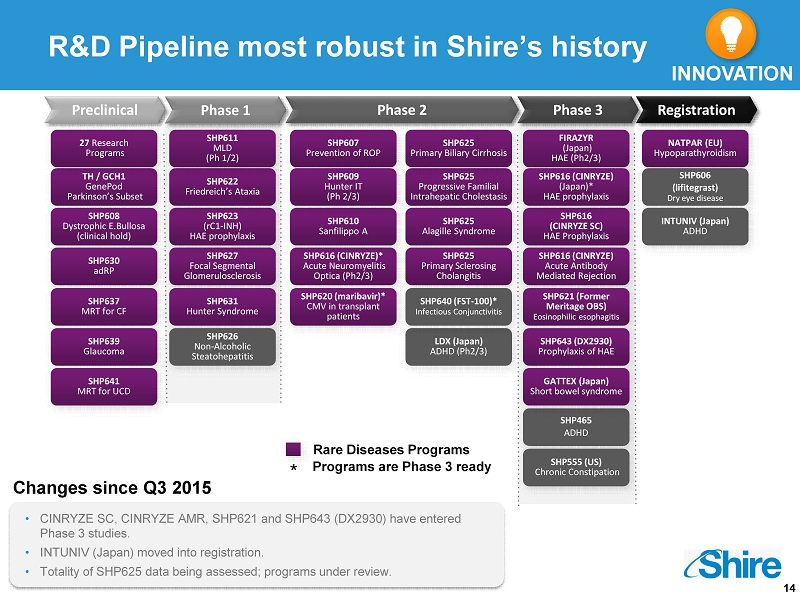
14 R&D Pipeline most robust in Shire’s history Preclinical Phase 1 Phase 2 Phase 3 Registration TH / GCH1 GenePod Parkinson’s Subset 27 Research Programs SHP627 Focal Segmental Glomerulosclerosis SHP608 Dystrophic E.Bullosa (clinical hold ) SHP631 Hunter Syndrome SHP616 (CINRYZE SC) HAE Prophylaxis SHP623 (rC1 - INH) HAE prophylaxis SHP626 Non - Alcoholic Steatohepatitis SHP622 Friedreich’s Ataxia SHP616 ( CINRYZE)* Acute Neuromyelitis Optica (Ph2/3) SHP610 Sanfilippo A LDX (Japan) ADHD (Ph2/3) SHP607 Prevention of ROP SHP625 Progressive Familial Intrahepatic Cholestasis SHP625 Alagille Syndrome SHP616 (CINRYZE) Acute Antibody Mediated Rejection SHP625 Primary Sclerosing Cholangitis SHP625 Primary Biliary Cirrhosis SHP621 (Former Meritage OBS ) Eosinophilic esophagitis FIRAZYR (Japan ) HAE (Ph2/3) SHP616 (CINRYZE) ( Japan )* HAE prophylaxis NATPAR (EU) Hypoparathyroidism SHP606 ( lifitegrast ) Dry eye disease Rare Diseases Programs INNOVATION Changes since Q3 2015 • CINRYZE SC, CINRYZE AMR, SHP621 and SHP643 (DX2930) have entered Phase 3 studies. • INTUNIV (Japan ) moved into registration. • Totality of SHP625 data being assessed; programs under review. SHP630 adRP SHP640 (FST - 100)* Infectious Conjunctivitis SHP620 ( maribavir )* CMV in transplant patients SHP637 MRT for CF SHP639 Glaucoma SHP609 Hunter IT ( Ph 2/3) SHP611 MLD ( Ph 1/2) Programs are Phase 3 ready * SHP643 (DX2930) Prophylaxis of HAE SHP465 ADHD SHP555 (US) Chronic Constipation GATTEX (Japan) Short bowel syndrome SHP641 MRT for UCD INTUNIV (Japan) ADHD
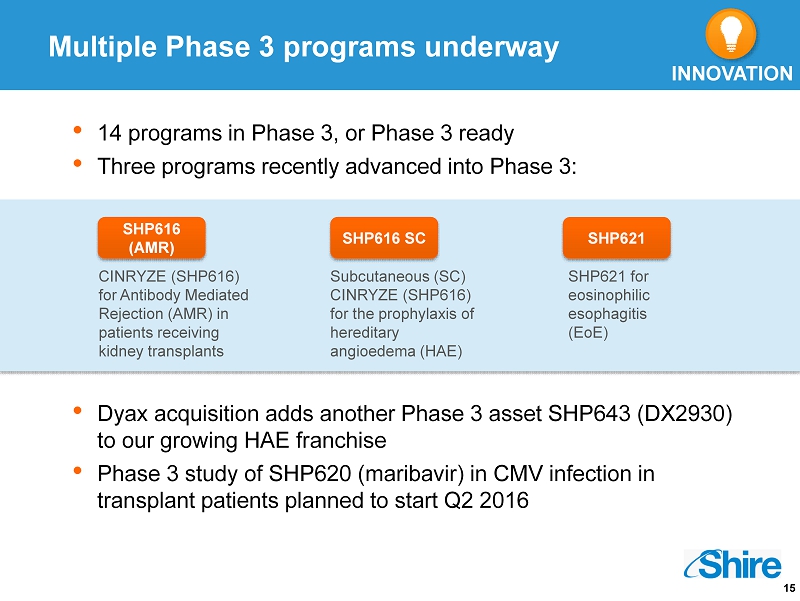
15 • 14 programs in Phase 3, or Phase 3 ready • Three programs recently advanced into Phase 3: • Dyax acquisition adds another Phase 3 asset SHP643 (DX2930) to our growing HAE franchise • Phase 3 study of SHP620 ( maribavir ) in CMV infection in transplant patients planned to start Q2 2016 Subcutaneous (SC) CINRYZE (SHP616) for the prophylaxis of hereditary angioedema (HAE) Multiple Phase 3 programs underway SHP616 (AMR) SHP616 SC SHP621 CINRYZE (SHP616) for Antibody Mediated Rejection (AMR) in patients receiving kidney transplants SHP621 for eosinophilic esophagitis ( EoE ) INNOVATION
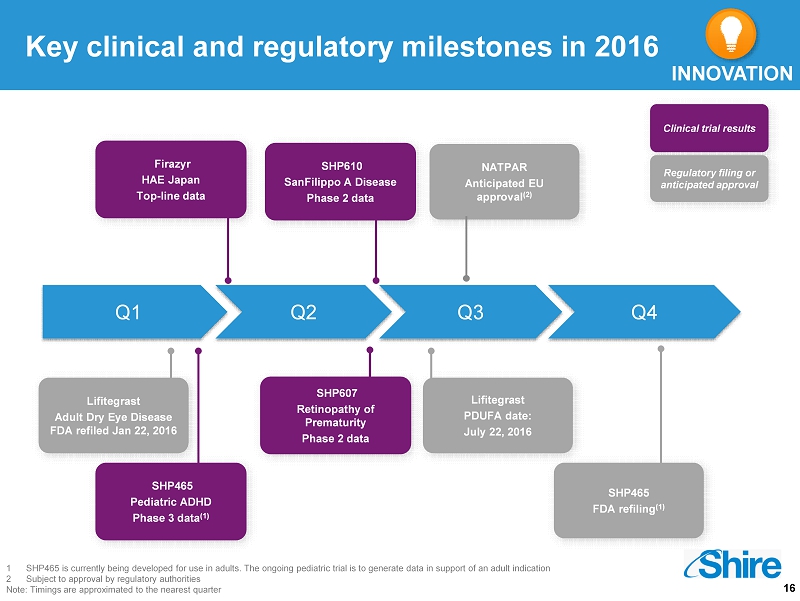
16 Key clinical and regulatory milestones in 2016 Q1 Q2 Q3 Q4 SHP610 SanFilippo A Disease Phase 2 data Firazyr HAE Japan Top - line data SHP465 Pediatric ADHD Phase 3 data (1) C linical trial results Regulatory filing or anticipated approval Lifitegrast Adult Dry Eye Disease FDA refiled Jan 22, 2016 SHP607 Retinopathy of Prematurity Phase 2 data Lifitegrast PDUFA date: July 22, 2016 SHP465 FDA refiling (1) 1 SHP465 is currently being developed for use in adults. The ongoing pediatric trial is to generate data in support of an adult in dication 2 Subject to approval by regulatory authorities Note: Timings are approximated to the nearest quarter NATPAR Anticipated EU approval (2) INNOVATION
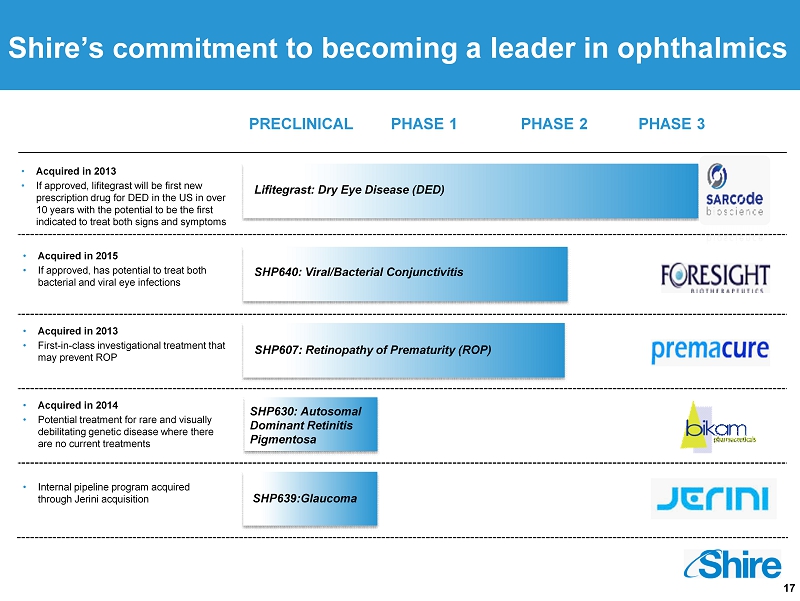
17 PRECLINICAL PHASE 1 PHASE 2 PHASE 3 Lifitegrast : Dry Eye Disease (DED) SHP639:Glaucoma SHP630: Autosomal Dominant Retinitis Pigmentosa • Acquired in 2013 • If approved, lifitegrast will be first new prescription drug for DED in the US in over 10 years with the potential to be the first indicated to treat both signs and symptoms Shire’s commitment to b ecoming a l eader in ophthalmics SHP640: Viral/Bacterial Conjunctivitis SHP607: Retinopathy of Prematurity (ROP) • A cquired in 2013 • First - in - class investigational treatment that may prevent ROP • Acquired in 2015 • If approved, has potential to treat both bacterial and viral eye infections • Acquired in 2014 • Potential treatment for rare and visually debilitating genetic disease where there are no current treatments • Internal pipeline program acquired through Jerini acquisition
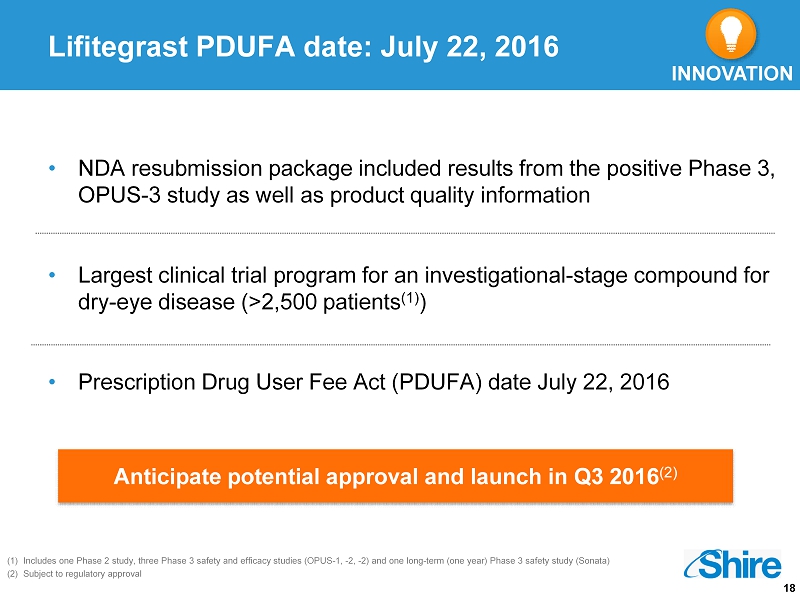
18 Lifitegrast PDUFA date: July 22, 2016 • NDA resubmission package included results from the positive Phase 3, OPUS - 3 study as well as product quality information • Largest clinical trial program for an investigational - stage compound for dry - eye disease (>2,500 patients (1) ) • Prescription Drug User Fee Act (PDUFA) date July 22, 2016 (1) Includes one Phase 2 study, three Phase 3 safety and efficacy studies (OPUS - 1, - 2, - 2) and one long - term (one year) Phase 3 safe ty study (Sonata) (2) Subject to regulatory approval INNOVATION Anticipate potential approval and launch in Q3 2016 (2)
Our purpose We enable people with life - altering conditions to lead better lives. Financial Review Jeff Poulton, Chief Financial Officer

20 (1) Results from continuing operations including NPS Pharmaceuticals Inc. in 2015 (acquired on February 21, 2015) and ViroPharma Inc. in 2014 (acquired on January 24, 2014) and excluding DERMAGRAFT in 2014 (treated as a discontinued operation following divestment on January 17, 2014). (2) This is a Non GAAP financial measure. Constant exchange rates ("CER") performance is determined by comparing 2015 performance (res tat ed using average 2014 foreign exchange rates for the relevant period) to actual 2014 reported performance. (3) This is a Non GAAP financial measure. The most directly comparable measure under US GAAP is Net Income (FY 2015: $1,303m, FY 201 4: $3,406m). (4) This is a Non GAAP financial measure. The most directly comparable measure under US GAAP is Net Income margin (FY 2015: 20%, FY 2014: 57%). (5) Non GAAP EBITDA as a percentage of product sales, excluding royalties and other revenues. (6) This is a Non GAAP financial measure. The most directly comparable measure under US GAAP is EPS - ADS (FY 2015: $6.59, FY 2014: $17.28) . (7) This is a Non GAAP financial measure. The most directly comparable measure under US GAAP is Net Cash provided by operating ac tiv ities (FY 2015: $2,337m, FY 2014: $4,228m). (8) See slide 39 for a list of items excluded from the US GAAP equivalent used to calculate all Non GAAP measures detailed above. A reconcilia tio n of Non GAAP financial measures to the most directly comparable measure under US GAAP is presented in Shire's Q4 2015 earnings release on pages 24 to 30. FY 2015 $m (1) FY 2014 $m (1) Reported Growth CER Growth (2)(8) FY Guidance Actual vs. Guidance Product Sales 6,100 5,830 +5% +9% +4 - 5% Product Sales excluding INTUNIV 6,035 5,503 +10% +14% Low double digit Royalties and Other Revenues 317 192 +65% +70% +45 - 55% Total Revenue 6,417 6,022 +7% +11% Non GAAP EBITDA (3)(8) 2,924 2,756 +6% +10% Non GAAP EBITDA margin (4)(5)(8) 43% 44% - 1% point - 2% points Non GAAP diluted EPS – ADS (6)(8) 11.68 10.60 +10% +14% Mid - to - high single digit Non GAAP Cash Generation (7)(8) 2,422 2,402 +1% ✓ ✓ Strong performance drives delivery of double digit Non GAAP diluted EPS growth
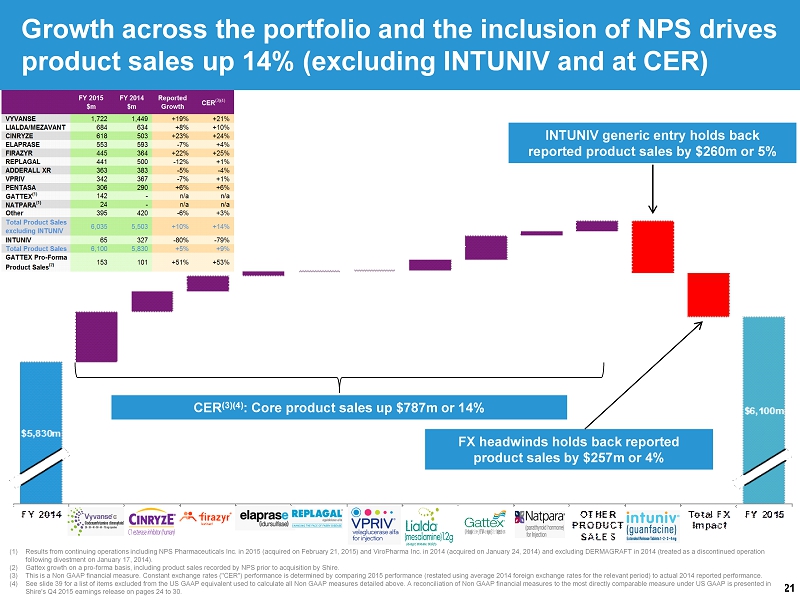
21 (1) Results from continuing operations including NPS Pharmaceuticals Inc. in 2015 (acquired on February 21, 2015) and ViroPharma Inc. in 2014 (acquired on January 24, 2014) and excluding DERMAGRAFT in 2014 (treated as a discontinued operation following divestment on January 17, 2014). (2) Gattex growth on a pro - forma basis, including product sales recorded by NPS prior to acquisition by Shire. (3) This is a Non GAAP financial measure. Constant exchange rates ("CER") performance is determined by comparing 2015 performance (r estated using average 2014 foreign exchange rates for the relevant period) to actual 2014 reported performance. (4) See slide 39 for a list of items excluded from the US GAAP equivalent used to calculate all Non GAAP measures detailed above. A reconcilia tio n of Non GAAP financial measures to the most directly comparable measure under US GAAP is presented in Shire's Q4 2015 earnings release on pages 24 to 30. Growth across the portfolio and the inclusion of NPS drives product sales up 14% (excluding INTUNIV and at CER) CER (3)(4) : Core product sales up $787m or 14% FX headwinds holds back reported product sales by $257m or 4 % INTUNIV generic entry holds back reported product sales by $260m or 5%
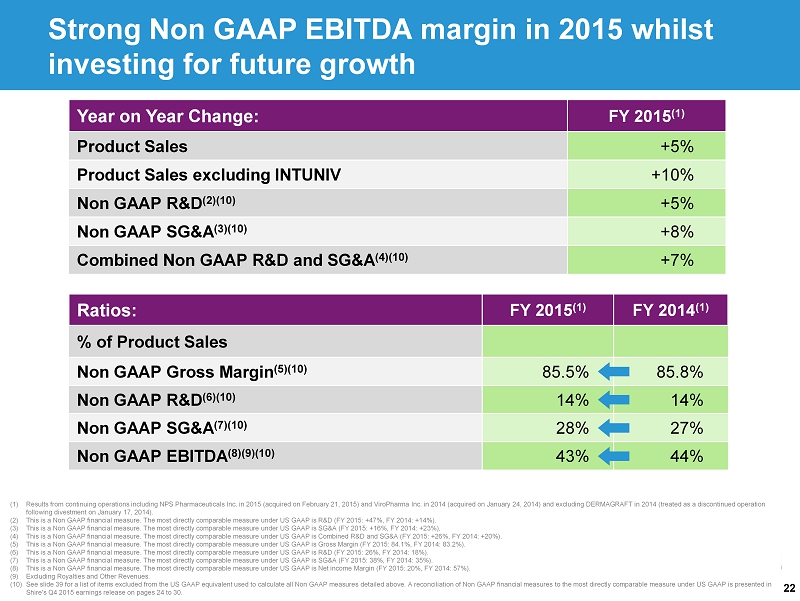
22 (1) Results from continuing operations including NPS Pharmaceuticals Inc. in 2015 (acquired on February 21, 2015) and ViroPharma Inc. in 2014 (acquired on January 24, 2014) and excluding DERMAGRAFT in 2014 (treated as a discontinued operation following divestment on January 17, 2014). (2) This is a Non GAAP financial measure. The most directly comparable measure under US GAAP is R&D (FY 2015: +47%, FY 2014: +14%). (3) This is a Non GAAP financial measure. The most directly comparable measure under US GAAP is SG&A (FY 2015: +16%, FY 2014: +23%) . (4) This is a Non GAAP financial measure. The most directly comparable measure under US GAAP is Combined R&D and SG&A (FY 2015: +26%, FY 2014: +20%). (5) This is a Non GAAP financial measure. The most directly comparable measure under US GAAP is Gross Margin (FY 2015: 84.1%, FY 2014: 83.2%). (6) This is a Non GAAP financial measure. The most directly comparable measure under US GAAP is R&D (FY 2015: 26%, FY 2014: 18%). (7) This is a Non GAAP financial measure. The most directly comparable measure under US GAAP is SG&A (FY 2015: 38%, FY 2014: 35%) . (8) This is a Non GAAP financial measure. The most directly comparable measure under US GAAP is Net income Margin (FY 2015: 20%, FY 2014: 57%). (9) Excluding Royalties and Other Revenues. (10) See slide 39 for a list of items excluded from the US GAAP equivalent used to calculate all Non GAAP measures detailed above. A reconcilia tio n of Non GAAP financial measures to the most directly comparable measure under US GAAP is presented in Shire's Q4 2015 earnings release on pages 24 to 30. Year on Year Change: FY 2015 (1) Product Sales +5% Product Sales excluding INTUNIV +10% Non GAAP R&D (2)(10) +5% Non GAAP SG&A (3)(10) +8% Combined Non GAAP R&D and SG&A (4)(10) +7% Ratios: FY 2015 (1) FY 2014 (1) % of Product Sales Non GAAP Gross Margin (5)(10) 85.5% 85.8% Non GAAP R&D (6)(10) 14% 14% Non GAAP SG&A (7)(10) 28% 27% Non GAAP EBITDA (8)(9)(10) 43% 44% Strong Non GAAP EBITDA margin in 2015 whilst investing for future growth
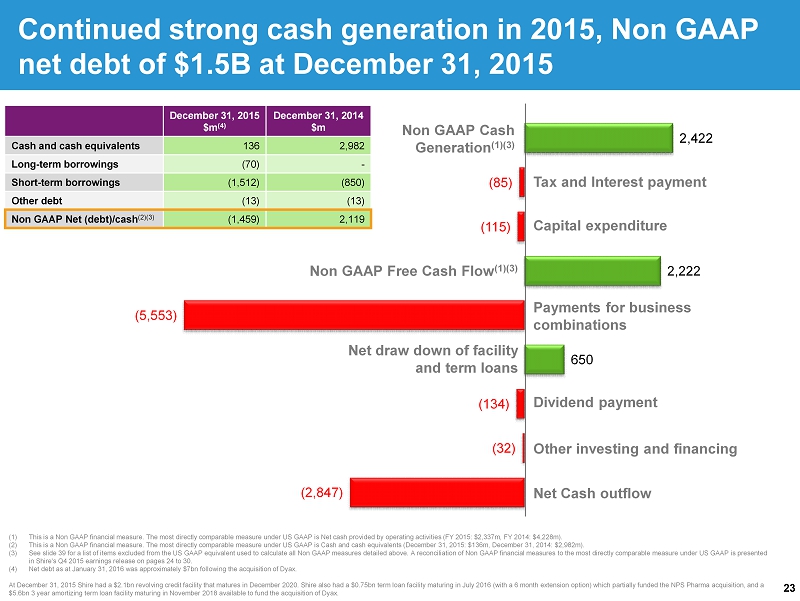
23 (2,847) (32) (134) 650 (5,553) 2,222 (115) (85) 2,422 (1) This is a Non GAAP financial measure. The most directly comparable measure under US GAAP is Net cash provided by operating ac tiv ities (FY 2015: $2,337m, FY 2014: $4,228m). (2) This is a Non GAAP financial measure. The most directly comparable measure under US GAAP is Cash and cash equivalents (Decemb er 31, 2015: $136m, December 31, 2014: $2,982m). (3) See slide 39 for a list of items excluded from the US GAAP equivalent used to calculate all Non GAAP measures detailed above. A reconcilia tio n of Non GAAP financial measures to the most directly comparable measure under US GAAP is presented in Shire's Q4 2015 earnings release on pages 24 to 30 . (4) Net debt as at January 31, 2016 was approximately $7bn following the acquisition of Dyax . At December 31, 2015 Shire had a $2.1bn revolving credit facility that matures in December 2020. Shire also had a $0.75bn term l oan facility maturing in July 2016 (with a 6 month extension option) which partially funded the NPS Pharma acquisition, and a $5.6bn 3 year amortizing term loan facility maturing in November 2018 available to fund the acquisition of Dyax . Continued strong cash generation in 2015, Non GAAP net debt of $1.5B at December 31, 2015 December 31, 2015 $m (4) December 31, 2014 $m Cash and cash equivalents 136 2,982 Long - term borrowings (70) - Short - term borrowings (1,512) (850) Other debt (13) (13) Non GAAP Net (debt)/cash (2)(3) (1,459) 2,119 Non GAAP Cash Generation (1)(3) Non GAAP Free Cash Flow (1)(3) Dividend payment Net Cash outflow Tax and Interest payment Capital expenditure Net draw down of facility and term loans Other investing and financing Payments for business combinations
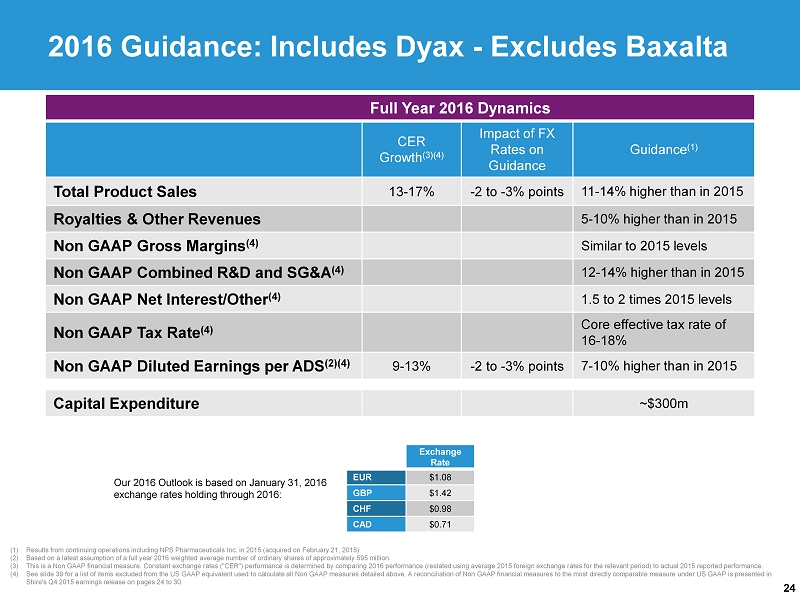
24 (1) Results from continuing operations including NPS Pharmaceuticals Inc. in 2015 (acquired on February 21, 2015 ). (2) Based on a latest assumption of a full year 2016 weighted average number of ordinary shares of approximately 595 million . (3) This is a Non GAAP financial measure. Constant exchange rates ("CER") performance is determined by comparing 2016 performance (restated using average 2015 foreign exchange rates for the relevant period) to actual 2015 reported performance . (4) See slide 39 for a list of items excluded from the US GAAP equivalent used to calculate all Non GAAP measures detailed above. A reconciliation of Non GAAP financial measures to the most directly comparable measure under US GAAP is presented in Shire's Q4 2015 earnings release on pages 24 to 30. 2016 Guidance : Includes Dyax - Excludes Baxalta Full Year 2016 Dynamics CER Growth (3)(4) Impact of FX Rates on Guidance Guidance (1) Total Product Sales 13 - 17% - 2 to - 3% points 11 - 14% higher than in 2015 Royalties & Other Revenues 5 - 10% higher than in 2015 Non GAAP Gross Margins (4) Similar to 2015 levels Non GAAP Combined R&D and SG&A (4) 12 - 14% higher than in 2015 Non GAAP Net Interest/Other (4) 1.5 to 2 times 2015 levels Non GAAP Tax Rate (4) Core effective tax rate of 16 - 18% Non GAAP D iluted Earnings per ADS (2)(4) 9 - 13% - 2 to - 3% points 7 - 10% higher than in 2015 Capital Expenditure ~$300m Our 2016 Outlook is based on January 31, 2016 exchange rates holding through 2016: Exchange Rate EUR $1.08 GBP $1.42 CHF $0.98 CAD $0.71
Our purpose We enable people with life - altering conditions to lead better lives. Summary Flemming Ornskov, M.D., Chief Executive Officer
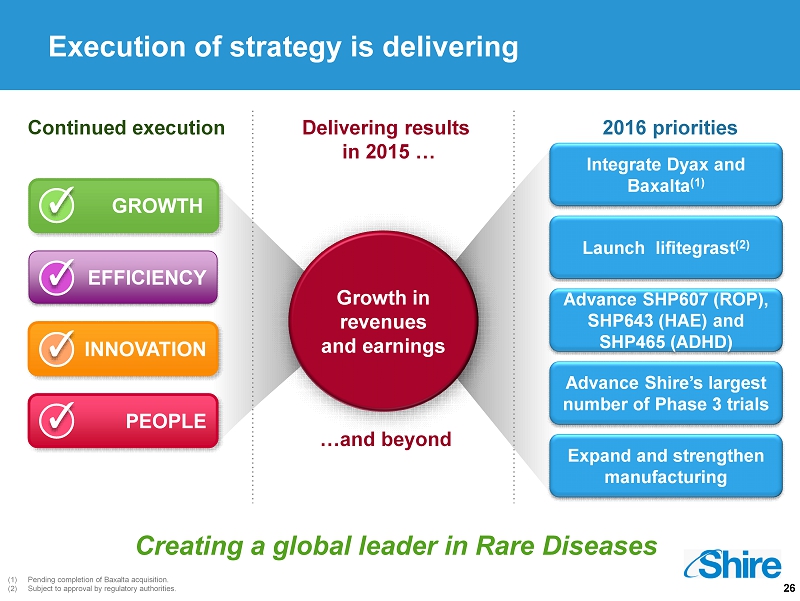
26 Creating a global leader in Rare Diseases Continued execution Delivering results in 2015 … G rowth in revenues and earnings Execution of strategy is delivering 2016 priorities Expand and strengthen manufacturing Launch lifitegrast (2) Advance SHP607 (ROP), SHP643 (HAE) and SHP465 (ADHD) Advance Shire’s largest number of Phase 3 trials ✓ GROWTH EFFICIENCY ✓ INNOVATION ✓ PEOPLE ✓ …and beyond Integrate Dyax and Baxalta (1) (1) Pending completion of Baxalta acquisition. (2) Subject to approval by regulatory authorities.

Questions and Answers

Our purpose We enable people with life - altering conditions to lead better lives. APPENDIX
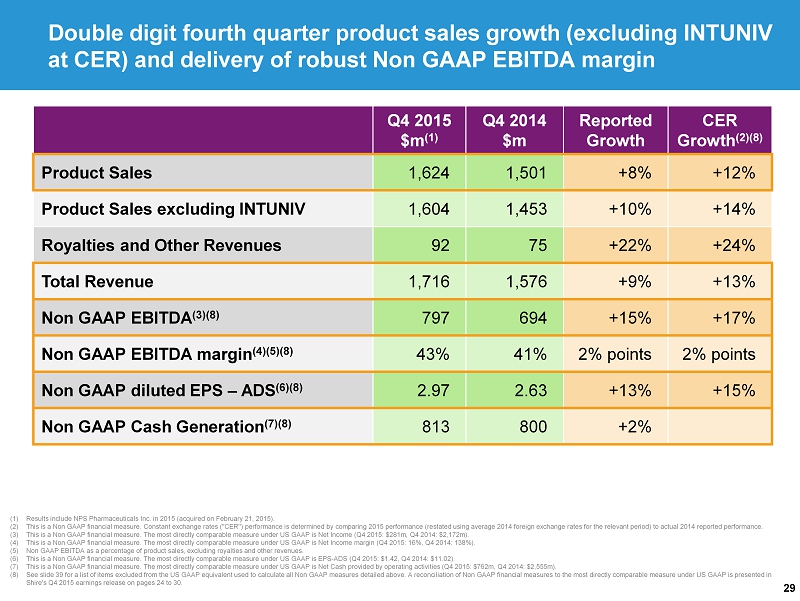
29 Double digit fourth quarter product sales growth (excluding INTUNIV at CER) and delivery of robust Non GAAP EBITDA margin (1) Results include NPS Pharmaceuticals Inc. in 2015 (acquired on February 21, 2015). (2) This is a Non GAAP financial measure. Constant exchange rates ("CER") performance is determined by comparing 2015 performance (r estated using average 2014 foreign exchange rates for the relevant period) to actual 2014 reported performance. (3) This is a Non GAAP financial measure. The most directly comparable measure under US GAAP is Net Income ( Q4 2015: $281m, Q4 2014: $2,172m). (4) This is a Non GAAP financial measure. The most directly comparable measure under US GAAP is Net Income margin (Q4 2015: 16%, Q4 2014: 138%). (5) Non GAAP EBITDA as a percentage of product sales, excluding royalties and other revenues. (6) This is a Non GAAP financial measure. The most directly comparable measure under US GAAP is EPS - ADS (Q4 2015: $1.42, Q4 2014: $11.02). (7) This is a Non GAAP financial measure. The most directly comparable measure under US GAAP is Net Cash provided by operating activities (Q4 2015: $762m, Q4 2014: $2,555m). (8) See slide 39 for a list of items excluded from the US GAAP equivalent used to calculate all Non GAAP measures detailed above. A reconcilia tio n of Non GAAP financial measures to the most directly comparable measure under US GAAP is presented in Shire's Q4 2015 earnings release on pages 24 to 30. Q4 2015 $m (1) Q4 2014 $m Reported Growth CER Growth (2)(8) Product Sales 1,624 1,501 +8% +12% Product Sales excluding INTUNIV 1,604 1,453 +10% +14% Royalties and Other Revenues 92 75 +22% +24% Total Revenue 1,716 1,576 +9% +13% Non GAAP EBITDA (3)(8) 797 694 +15% +17% Non GAAP EBITDA margin (4)(5)(8) 43% 41% 2% points 2% points Non GAAP diluted EPS – ADS (6)(8) 2.97 2.63 +13% +15% Non GAAP Cash Generation (7)(8) 813 800 +2%
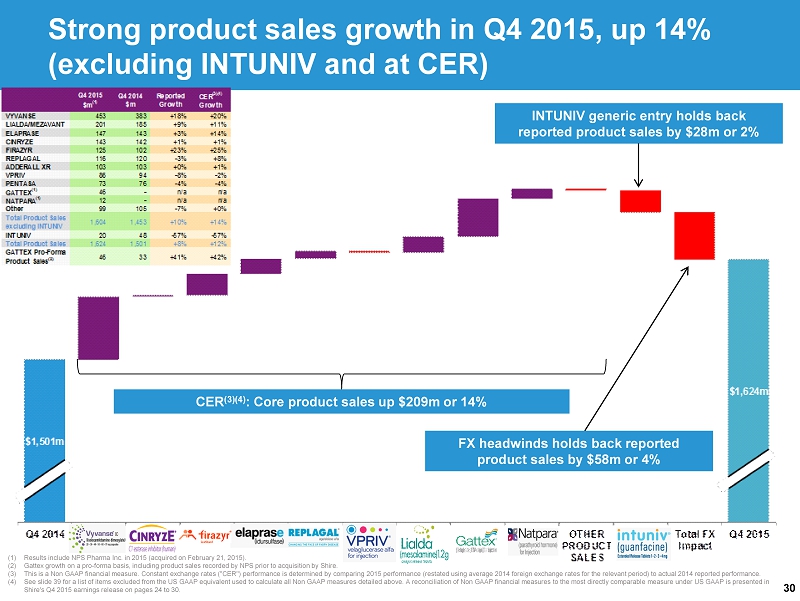
30 (1) Results include NPS Pharma Inc. in 2015 (acquired on February 21, 2015). (2) Gattex growth on a pro - forma basis, including product sales recorded by NPS prior to acquisition by Shire. (3) This is a Non GAAP financial measure. Constant exchange rates ("CER") performance is determined by comparing 2015 performance (r estated using average 2014 foreign exchange rates for the relevant period) to actual 2014 reported performance. (4) See slide 39 for a list of items excluded from the US GAAP equivalent used to calculate all Non GAAP measures detailed above. A reconcilia tio n of Non GAAP financial measures to the most directly comparable measure under US GAAP is presented in Shire's Q4 2015 earnings release on pages 24 to 30. CER (3)(4) : Core product sales up $209m or 14% FX headwinds holds back reported product sales by $58m or 4% INTUNIV generic entry holds back reported product sales by $28m or 2% Strong product sales growth in Q4 2015, up 14% (excluding INTUNIV and at CER)
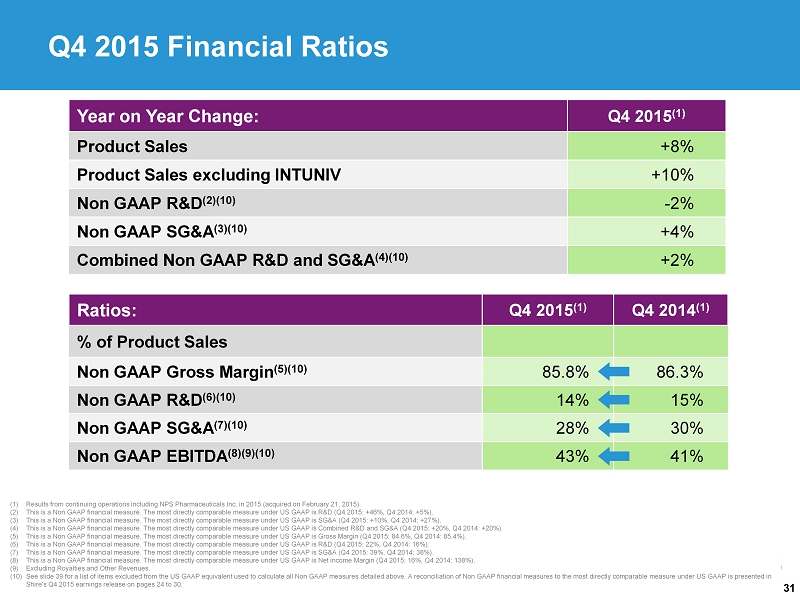
31 (1) Results from continuing operations including NPS Pharmaceuticals Inc. in 2015 (acquired on February 21, 2015). (2) This is a Non GAAP financial measure. The most directly comparable measure under US GAAP is R&D (Q4 2015: +46%, Q4 2014: +5%). (3) This is a Non GAAP financial measure. The most directly comparable measure under US GAAP is SG&A (Q4 2015: +10%, Q4 2014: +27 %). (4) This is a Non GAAP financial measure. The most directly comparable measure under US GAAP is Combined R&D and SG&A (Q4 2015: + 20% , Q4 2014: +20%). (5) This is a Non GAAP financial measure. The most directly comparable measure under US GAAP is Gross Margin (Q4 2015: 84.6%, Q4 2014: 85.4%). (6) This is a Non GAAP financial measure. The most directly comparable measure under US GAAP is R&D (Q4 2015: 22%, Q4 2014: 16%). (7) This is a Non GAAP financial measure. The most directly comparable measure under US GAAP is SG&A (Q4 2015: 39%, Q4 2014: 38%) . (8) This is a Non GAAP financial measure. The most directly comparable measure under US GAAP is Net income Margin (Q4 2015: 16%, Q4 2014: 138%). (9) Excluding Royalties and Other Revenues. (10) See slide 39 for a list of items excluded from the US GAAP equivalent used to calculate all Non GAAP measures detailed above. A reconcilia tio n of Non GAAP financial measures to the most directly comparable measure under US GAAP is presented in Shire's Q4 2015 earnings release on pages 24 to 30. Year on Year Change: Q4 2015 (1) Product Sales +8% Product Sales excluding INTUNIV +10% Non GAAP R&D (2)(10) - 2% Non GAAP SG&A (3)(10) +4% Combined Non GAAP R&D and SG&A (4)(10) +2% Ratios: Q4 2015 (1) Q4 2014 (1) % of Product Sales Non GAAP Gross Margin (5)(10) 85.8% 86.3% Non GAAP R&D (6)(10) 14% 15% Non GAAP SG&A (7)(10) 28% 30% Non GAAP EBITDA (8)(9)(10) 43% 41% Q4 2015 Financial Ratios
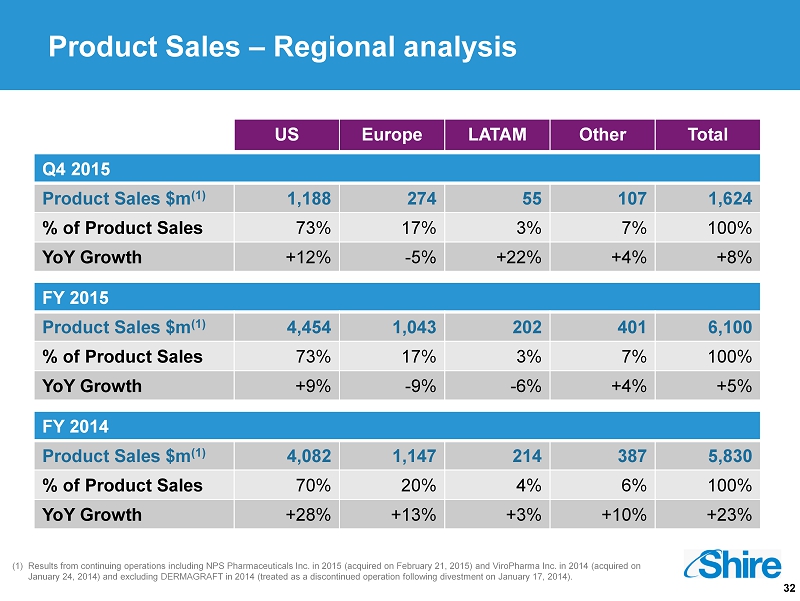
32 (1) Results from continuing operations including NPS Pharmaceuticals Inc. in 2015 (acquired on February 21, 2015) and ViroPharma Inc. in 2014 (acquired on January 24, 2014) and excluding DERMAGRAFT in 2014 (treated as a discontinued operation following divestment on January 17, 2 014 ). US Europe LATAM Other Total Q4 2015 Product Sales $m (1) 1,188 274 55 107 1,624 % of Product Sales 73% 17% 3% 7% 100% YoY Growth +12% - 5% +22% +4% +8% FY 2015 Product Sales $m (1) 4,454 1,043 202 401 6,100 % of Product Sales 73% 17% 3% 7% 100% YoY Growth +9% - 9% - 6% +4% +5% FY 2014 Product Sales $m (1) 4,082 1,147 214 387 5,830 % of Product Sales 70% 20% 4% 6% 100% YoY Growth +28% +13% +3% +10% +23% Product Sales – Regional analysis
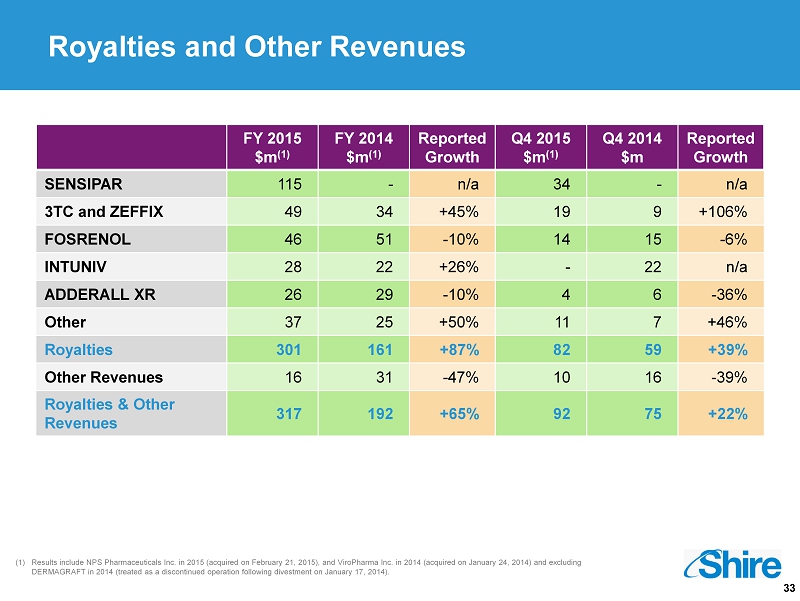
33 (1) Results include NPS Pharmaceuticals Inc. in 2015 (acquired on February 21, 2015), and ViroPharma Inc. in 2014 (acquired on January 24, 2014) and excluding DERMAGRAFT in 2014 (treated as a discontinued operation following divestment on January 17, 2014). Royalties and Other Revenues FY 2015 $m (1) FY 2014 $m (1) Reported Growth Q4 2015 $m (1) Q4 2014 $m Reported Growth SENSIPAR 115 - n/a 34 - n/a 3TC and ZEFFIX 49 34 +45% 19 9 +106% FOSRENOL 46 51 - 10% 14 15 - 6% INTUNIV 28 22 +26% - 22 n/a ADDERALL XR 26 29 - 10% 4 6 - 36% Other 37 25 +50% 11 7 +46% Royalties 301 161 +87% 82 59 +39% Other Revenues 16 31 - 47% 10 16 - 39% Royalties & Other Revenues 317 192 +65% 92 75 +22%

34 (1) Results from continuing operations including NPS Pharmaceuticals Inc. in 2015 (acquired on February 21, 2015) and ViroPharma Inc. in 2014 (acquired on January 24, 2014) and excluding DERMAGRAFT in 2014 (treated as a discontinued operation following divestment on January 17, 2014). (2) This is a Non GAAP financial measure. The most directly comparable measure under US GAAP is Gross Margin (Q4 2015: 84.6%, Q4 2014: 85.4%, FY 2015: 84.1%, FY 2014: 83.2%). (3) This is a Non GAAP financial measure. The most directly comparable measure under US GAAP is Combined R&D and SG&A (Q4 2015: +20%, Q4 2014: +20%, FY 2015: +26%, FY 2014: +20 %). (4) Non GAAP EBITDA as a percentage of product sales, excluding royalties and other revenues. (5) This is a Non GAAP financial measure. The most directly comparable measure under US GAAP is Net income Margin (Q4 2015: 16%, Q4 2014: 138%, FY 2015: 20%, FY 2014: 57%). (6) This is a Non GAAP financial measure. The most directly comparable measure under US GAAP is Tax rate (Q4 2015: 16%, Q4 2014: 6 %, FY 2015: 3%, FY2014: 2%). (7) This is a Non GAAP financial measure. The most directly comparable measure under US GAAP is EPS - ADS (Q4 2015: $1.42, Q4 2014: $ 11.02, FY 2015: $6.59, FY 2014: $17.28 ). (8) FY 2016 guidance includes the effect of Dyax , but excludes the effect of Baxalta . (9) See slide 39 for a list of items excluded from the US GAAP equivalent used to calculate all Non GAAP measures detailed above. A reconcilia tio n of Non GAAP financial measures to the most directly comparable measure under US GAAP is presented in Shire's Q4 2015 earnings release on pages 24 to 30. Shire income statement growth analysis 2014 Q1 (1) 2014 Q2 (1) 2014 Q3 (1) 2014 Q4 (1) 2014 FY (1) 2015 Q1 (1) 2015 Q2 (1) 2015 Q3 (1) 2015 Q4 (1) 2015 FY (1) FY 2016 Dynamics (8) Guidance Total Product Sales $1,307m $1,470m $1,552m $1,501m $5,830m $1,423m $1,476m $1,577m $1,624m $6,100m 11 - 14% higher than in 2015 versus prior year +19% +22% +33% +17% +23% +9% +0% +2% +8% +5% Royalties & Other Revenues $40m $32m $45m $75m $192m $65m $82m $78m $92m $317m 5 - 10% higher than in 2015 versus prior year - 14% - 27% +8% +65% +8% +68% +150% +73% +22% +65% Total Revenue $1,347m $1,502m $1,597m $1,576m $6,022m $1,488m $1,558m $1,655m $1,716m $6,417m versus prior year +18% +20% +32% +19% +22% +11% +4% +4% +9% +7% Non GAAP Gross Margin (2)(8) 86% 85% 86% 86% 86% 86% 86% 84% 86% 86% Similar to 2015 levels Combined Non GAAP R&D and SG&A (3)(8) $539m $602m $618m $677m $2,436m $571m $697m $652m $688m $2,608m 12 - 14% higher than in 2015 versus prior year - 3% +2% +10% +11% +5% +6% +16% +5% +2% +7% Non GAAP EBITDA Margin (4)(5)(9) 45% 44% 46% 41% 44% 46% 39% 43% 43% 43% Non GAAP Tax Rate (6)(9) 20% 16% 18% 19% 18% 17% 13% 10% 21% 16% Core effective tax rate of 16 - 18% Non GAAP diluted Earnings per ADS (7)(9) $2.36 $2.67 $2.93 $2.63 $10.60 $2.84 $2.63 $3.24 $2.97 $11.68 7 - 10% higher than in 2015 versus prior year +38% +42% +60% +17% +38% +20% - 2% +11% +13% +10%
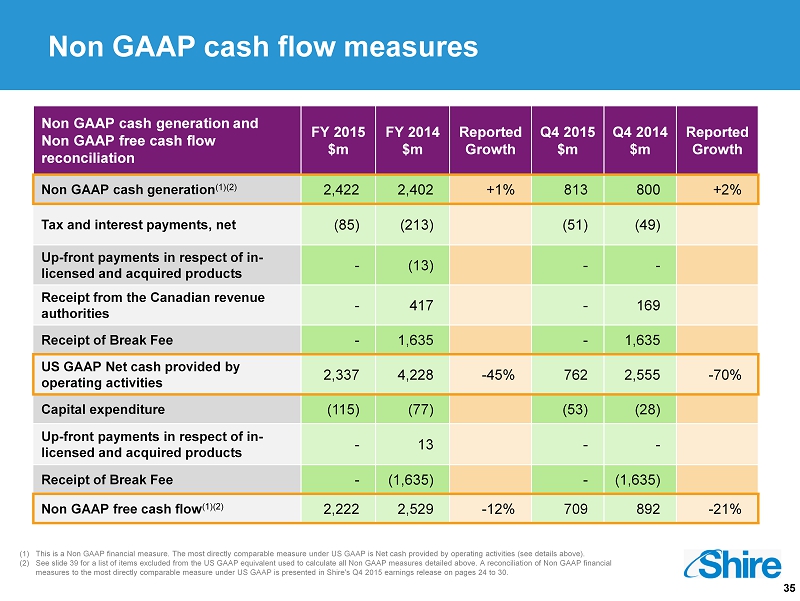
35 Non GAAP cash flow measures Non GAAP cash generation and Non GAAP free cash flow reconciliation FY 2015 $m FY 2014 $m Reported Growth Q4 2015 $m Q4 2014 $m Reported Growth Non GAAP cash generation (1)(2) 2,422 2,402 +1% 813 800 +2% Tax and interest payments, net (85) (213) (51) (49) Up - front payments in respect of in - licensed and acquired products - (13) - - Receipt from the Canadian revenue authorities - 417 - 169 Receipt of Break Fee - 1,635 - 1,635 US GAAP Net cash provided by operating activities 2,337 4,228 - 45% 762 2,555 - 70% Capital expenditure (115) (77) (53) (28) Up - front payments in respect of in - licensed and acquired products - 13 - - Receipt of Break Fee - (1,635) - (1,635) Non GAAP free cash flow (1)(2) 2,222 2,529 - 12% 709 892 - 21% (1) This is a Non GAAP financial measure. The most directly comparable measure under US GAAP is Net cash provided by operating ac tiv ities (see details above). (2) See slide 39 for a list of items excluded from the US GAAP equivalent used to calculate all Non GAAP measures detailed above. A reconcilia tio n of Non GAAP financial measures to the most directly comparable measure under US GAAP is presented in Shire's Q4 2015 earnings release on pages 24 to 30.
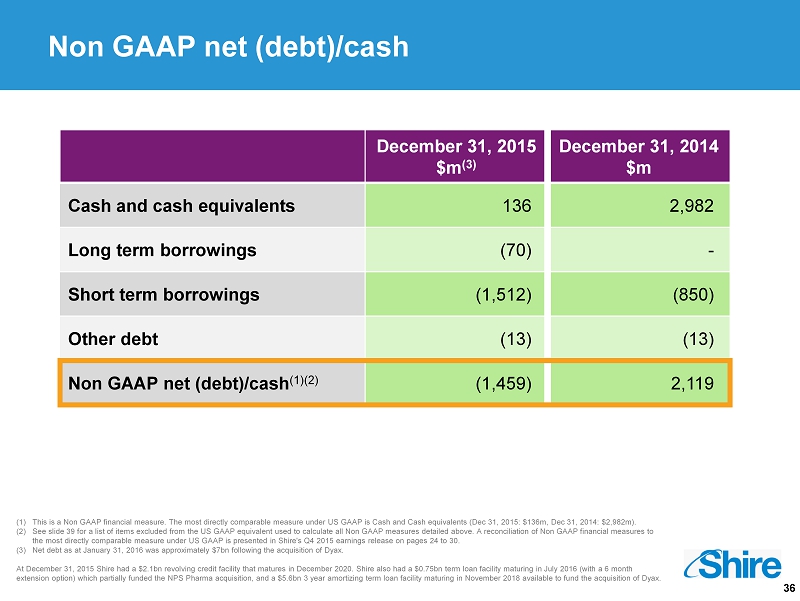
36 (1) This is a Non GAAP financial measure. The most directly comparable measure under US GAAP is Cash and Cash equivalents (Dec 31, 2015: $136m, Dec 31, 2014: $2,982m). (2) See slide 39 for a list of items excluded from the US GAAP equivalent used to calculate all Non GAAP measures detailed above. A reconcilia tio n of Non GAAP financial measures to the most directly comparable measure under US GAAP is presented in Shire's Q4 2015 earnings release on pages 24 to 30 . (3) Net debt as at January 31, 2016 was approximately $7bn following the acquisition of Dyax . At December 31, 2015 Shire had a $2.1bn revolving credit facility that matures in December 2020. Shire also had a $0.75bn ter m l oan facility maturing in July 2016 (with a 6 month extension option) which partially funded the NPS Pharma acquisition, and a $5.6bn 3 year amortizing term loan facility maturi ng in November 2018 available to fund the acquisition of Dyax . Non GAAP net (debt)/ cash December 31, 2015 $m (3) December 31, 2014 $m Cash and cash equivalents 136 2,982 Long term borrowings (70) - Short term borrowings (1,512) (850) Other debt (13) (13) Non GAAP net (debt)/cash (1)(2) (1,459) 2,119
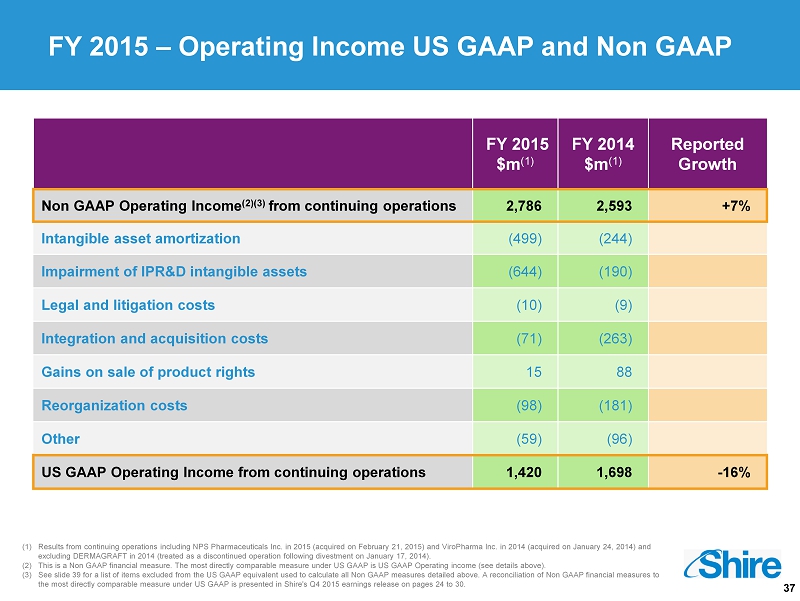
37 (1) Results from continuing operations including NPS Pharmaceuticals Inc. in 2015 (acquired on February 21, 2015) and ViroPharma Inc. in 2014 (acquired on January 24, 2014) and excluding DERMAGRAFT in 2014 (treated as a discontinued operation following divestment on January 17, 2014). (2) This is a Non GAAP financial measure. The most directly comparable measure under US GAAP is US GAAP Operating income (see det ail s above). (3) See slide 39 for a list of items excluded from the US GAAP equivalent used to calculate all Non GAAP measures detailed above. A reconcilia tio n of Non GAAP financial measures to the most directly comparable measure under US GAAP is presented in Shire's Q4 2015 earnings release on pages 24 to 30. FY 2015 – Operating Income US GAAP and Non GAAP FY 2015 $m (1) FY 2014 $m (1) Reported Growth Non GAAP Operating Income (2)(3) from continuing operations 2,786 2,593 +7% Intangible asset amortization (499) (244) Impairment of IPR&D intangible assets (644) (190) Legal and litigation costs (10) (9) Integration and acquisition costs (71) (263) Gains on sale of product rights 15 88 Reorganization costs (98) (181) Other (59) (96) US GAAP Operating Income from continuing operations 1,420 1,698 - 16%
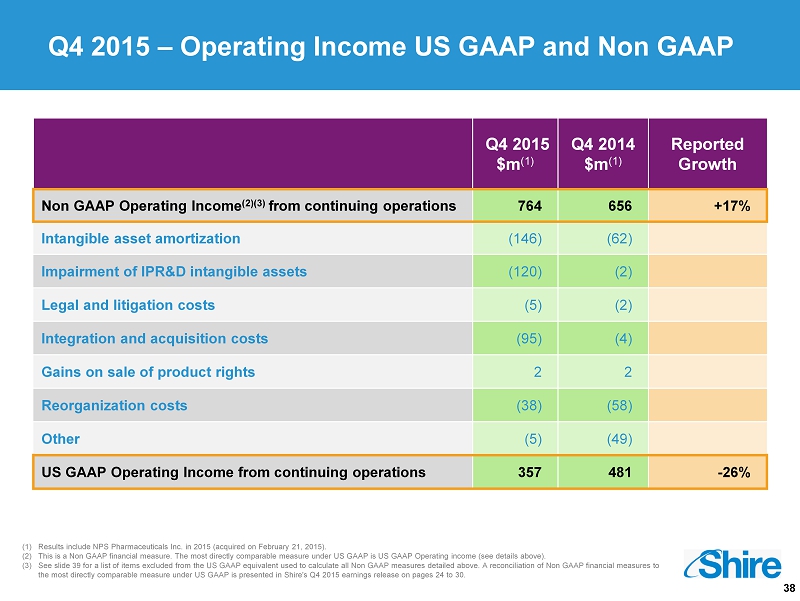
38 (1) Results include NPS Pharmaceuticals Inc. in 2015 (acquired on February 21, 2015). (2) This is a Non GAAP financial measure. The most directly comparable measure under US GAAP is US GAAP Operating income (see det ail s above). (3) See slide 39 for a list of items excluded from the US GAAP equivalent used to calculate all Non GAAP measures detailed above. A reconcilia tio n of Non GAAP financial measures to the most directly comparable measure under US GAAP is presented in Shire's Q4 2015 earnings release on pages 24 to 30. Q4 2015 – Operating Income US GAAP and Non GAAP Q4 2015 $m (1) Q4 2014 $m (1) Reported Growth Non GAAP Operating Income (2)(3) from continuing operations 764 656 +17% Intangible asset amortization (146) (62) Impairment of IPR&D intangible assets (120) (2) Legal and litigation costs (5) (2) Integration and acquisition costs (95) (4) Gains on sale of product rights 2 2 Reorganization costs (38) (58) Other (5) (49) US GAAP Operating Income from continuing operations 357 481 - 26%
39 This presentation contains financial measures not prepared in accordance with US GAAP. These measures are referred to as “Non GA AP” measures and include: Non GAAP operating income; Non GAAP net income; Non GAAP diluted earnings per ADS; effective tax rate on Non GAAP income before income taxes and earnings/(losses) of equity method investees (“effective tax rate on Non GAA P income”); Non GAAP cost of product sales; Non GAAP gross margin; Non GAAP R&D ; Non GAAP SG&A ; Non GAAP other income/(expense); Non GAAP interest income; Non GAAP cash generation; Non GAAP free cash flow, Non GAAP net cas h/(debt), Non GAAP EBITDA and Non GAAP EBITDA Margin (excluding royalties and other revenues). These Non GAAP measures exclude the effect of certain cash and non - cash items, that Sh ire's management believes are not related to the core performance of Shire’s business. These Non GAAP financial measures are used by Shire’s management to make operating decisions because they facilitate internal co mparisons of Shire’s performance to historical results and to competitors’ results. Shire’s Remuneration Committee uses certain key Non GAAP measures when assessing the performance and compensation of employees, inclu din g Shire’s directors. The Non GAAP measures are presented in this presentation as Shire’s management believe that they will provide investors with a m eans of evaluating, and an understanding of how Shire’s management evaluates, Shire’s performance and results on a comparable basis that is not otherwise apparent on a US GAAP basis, since many non - recurring, infre quent or non - cash items that Shire’s management believe are not indicative of the core performance of the business may not be excluded when preparing financial measures under US GAAP. These Non GAAP measures should not be considered in isolation from, as substitutes for, or superior to financial measures pre par ed in accordance with US GAAP. Where applicable the following items, including their tax effect, have been excluded when calculating Non GAAP earnings for b oth 2015 and 2014, and from our Outlook: Amortization and asset impairments: • Intangible asset amortization and impairment charges; and • Other than temporary impairment of investments. Acquisitions and integration activities: • Up - front payments and milestones in respect of in - licensed and acquired products; • Costs associated with acquisitions, including transaction costs, fair value adjustments on contingent consideration and acqui re d inventory; • Costs associated with the integration of companies; and • Noncontrolling interests in consolidated variable interest entities. Divestments, reorganizations and discontinued operations: • Gains and losses on the sale of non - core assets; • Costs associated with restructuring and reorganization activities; • Termination costs; and • Income/(losses) from discontinued operations. Legal and litigation costs: • Net legal costs related to the settlement of litigation, government investigations and other disputes (excluding internal leg al team costs). Other: • Net income tax credit ( being income tax, interest and estimated penalties) related to the settlement of certain tax positions with the Canadian revenue authorities; • Costs associated with AbbVie’s terminated offer for Shire, including costs of employee retention awards; and • Break fee received in relation to AbbVie’s terminated offer for Shire. Depreciation, which is included in Cost of product sales, R&D and SG&A costs in our US GAAP results, has been separately disc los ed for the presentation of 2015 and 2014 Non GAAP earnings. Cash generation represents net cash provided by operating activities, excluding up - front and milestone payments for in - licensed and acquired products, tax and interest payments. Free cash flow represents net cash provided by operating activities, excluding up - front and milestone payments for in - licensed a nd acquired products, but including capital expenditure in the ordinary course of business. Growth at CER, which is a Non GAAP measure, is computed by restating 2015 results using average 2014 foreign exchange rates f or the relevant period. Average exchange rates used by Shire for the year to December 31, 2015 were $1.53:£1.00 and $1.11: € 1.00 (2014: $1.65:£1.00 and $1.33: € 1.00). Average exchange rates used by Shire for Q4 2015 were $1.52:£1.00 and $1.09: € 1.00 (2014: $1.60:£1.00 and $1.25: € 1.00). A reconciliation of Non GAAP financial measures to the most directly comparable measure under US GAAP is presented in Shire’s Q4 2015 earnings release on pages 24 to 30. Non GAAP measures