WASHINGTON FEDERAL, INC. AND SUBSIDIARIES
2012 ANNUAL REPORT
Table of Contents
WASHINGTON FEDERAL, INC. AND SUBSIDIARIES
2012 ANNUAL REPORT
A SHORT HISTORY
Washington Federal, Inc. (Company or Washington Federal) is a unitary thrift holding company headquartered in Seattle, Washington. Its principal subsidiary is Washington Federal (Bank), which operates 190 offices in eight western states.
The Company had its origin on April 24, 1917, as Ballard Savings and Loan Association. In 1935, the state-chartered Company converted to a federal charter, became a member of the Federal Home Loan Bank (FHLB) system and obtained federal deposit insurance. In 1958, Ballard Federal Savings and Loan Association merged with Washington Federal Savings and Loan Association of Bothell, and the latter name was retained for wider geographical acceptance. In 1971, Seattle Federal Savings and Loan Association, with three offices, merged into the Company, and at the end of 1978 was joined by the 10 offices of First Federal Savings and Loan Association of Mount Vernon.
On November 9, 1982, the Company converted from a federal mutual to a federal stock association. In 1987 and 1988, acquisitions of United First Federal, Provident Federal Savings and Loan, and Northwest Federal Savings and Loan, all headquartered in Boise, Idaho, added 28 Idaho offices to the Company. In 1988, the acquisition of Freedom Federal Savings and Loan Association in Corvallis, Oregon, added 13 Oregon offices, followed in 1990 by the eight Oregon offices of Family Federal Savings.
In 1991, the Company added three branches with the acquisition of First Federal Savings and Loan Association of Idaho Falls, Idaho, and acquired the deposits of First Western Savings Association of Las Vegas, Nevada, in Portland and Eugene, Oregon, where it was doing business as Metropolitan Savings Association. In 1993, 10 branches were added with the acquisition of First Federal Savings Bank of Salt Lake City, Utah. In 1994, the Company expanded into Arizona.
In 1995, the stockholders approved a reorganization whereby the Bank became a wholly owned subsidiary of a newly formed holding company, Washington Federal, Inc. That same year, the Company purchased West Coast Mutual Savings Bank with its one branch in Centralia, Washington, and opened six additional branches. In 1996, the Company acquired Metropolitan Bancorp of Seattle, adding eight offices in Washington as well as opening four branches in existing markets. Between 1997 and 1999, the Company continued to develop its branch network, opening a total of seven branches and consolidating three offices into existing locations.
In 2000, the Company expanded into Las Vegas, opening its first branch in Nevada along with two branches in Arizona. In 2001, the Company opened two additional branches in Arizona and its first branch in Texas, with an office in the Park Cities area of Dallas. In 2002, five full-service branches were opened in existing markets. In 2003, the Company purchased United Savings and Loan Bank with its four branches in Seattle, added one new branch in Puyallup, Washington, and consolidated one branch in Nampa, Idaho. In 2005, the Company consolidated two branches in Mount Vernon, Washington, into one and opened branches in Plano, Texas, and West Bend, Oregon. In 2006, the Company opened locations in Klamath Falls, Oregon, and Richardson, Texas, added another location in Las Vegas, Nevada, and opened a branch in Medford, Oregon.
The Company acquired First Federal Banc of the Southwest, Inc., the holding company for First Federal Bank located in Roswell, New Mexico, on February 13, 2007. First Federal Bank had 13 branch locations, 11 in New Mexico and two in El Paso, Texas. The Company acquired First Mutual Bancshares, Inc. (“First Mutual”), the holding company for First Mutual Bank, on February 1, 2008. First Mutual had 12 branches primarily located on the eastside of Seattle. The Company also opened a location in Redmond, Oregon, in 2009. During 2010, the Company opened two new locations, one in Las Vegas, Nevada, and the other in Prescott Valley, Arizona.
On January 8, 2010, the Company acquired certain assets and liabilities, including most of the loans and deposits, of Horizon Bank (Horizon), headquartered in Bellingham, Washington, from the Federal Deposit Insurance Corporation ("FDIC"), as receiver for Horizon. Horizon operated 18 full-service offices, four commercial loan centers and four real estate loan centers in Washington. Through consolidation with existing Washington Federal branches, there was a net increase of 10 branches as a result of the Horizon acquisition.
On October 14, 2011, the Company acquired six branch locations, four in Albuquerque, New Mexico, and two in Santa Fe, New Mexico, from Charter Bank.
WASHINGTON FEDERAL, INC. AND SUBSIDIARIES
2012 ANNUAL REPORT
On December 16, 2011, the Company acquired 3 branches, along with certain assets and liabilities, including most of the loans and deposits, of Western National Bank, headquartered in Phoenix, Arizona (“WNB”) from the FDIC in an FDIC-assisted transaction. Effective October 31, 2012, the Company acquired South Valley Bancorp, Inc. ("South Valley"), the holding company for South Valley Bank & Trust headquartered in Klamath Falls, Oregon. The 24 South Valley branches acquired in the transaction are located in central and southern Oregon.
The Company obtains its funds primarily through deposits from the general public, repayments of loans, borrowings and retained earnings. These funds are used largely to make loans to individuals and businesses, including loans for the purchase of new and existing homes, construction and land loans, commercial real estate loans, commercial and industrial loans and loans for investments.
FINANCIAL HIGHLIGHTS
|
| | | | | | | |
| September 30, | 2012 | 2011 | % Change |
| | (In thousands, except per share data) |
| Assets | $ | 12,472,944 |
| $ | 13,440,749 |
| (7.2%) |
| Cash and cash equivalents | 751,430 |
| 816,002 |
| (7.9) |
| Investment securities | 612,524 |
| 246,004 |
| +149.0 |
| Loans receivable, net | 7,451,998 |
| 7,935,877 |
| (6.1) |
| Covered loans, net | 288,376 |
| 382,183 |
| (24.5) |
| Mortgage-backed securities | 2,360,668 |
| 3,056,176 |
| (22.8) |
| Customer accounts | 8,576,618 |
| 8,665,903 |
| (1.0) |
| FHLB advances and other borrowings | 1,880,000 |
| 2,762,066 |
| (31.9) |
| Stockholders’ equity | 1,899,752 |
| 1,906,533 |
| (0.4) |
| Net income available to common shareholders | 138,183 |
| 111,141 |
| +24.3 |
| Diluted earnings per share | 1.29 |
| 1.00 |
| +29.0 |
| Dividends per share | 0.32 |
| 0.24 |
| +33.3 |
| Stockholders’ equity per share | 17.89 |
| 17.49 |
| +2.3 |
| Shares outstanding | 106,178 |
| 108,976 |
| (2.6) |
| Return on average stockholders’ equity | 7.23 | % | 5.99 | % | NM |
| Return on average assets | 1.03 |
| 0.83 |
| NM |
| Efficiency ratio (1) | 34.54 |
| 31.30 |
| NM |
| |
| (1) | Calculated as total operating costs divided by net interest income, plus other income (excluding investment gains) |
NM – not meaningful
WASHINGTON FEDERAL, INC. AND SUBSIDIARIES
2012 ANNUAL REPORT
TO OUR STOCKHOLDERS
Dear Stockholder,
It is a privilege to advise you that fiscal 2012 was another successful year for Washington Federal. Net income for the Company totaled $138,183,000, an increase of 24% from $111,141,000 in fiscal 2011. Earnings per share increased by 29% to $1.29 in fiscal 2012, and reflected both higher net income and nearly 4% fewer average shares outstanding. Return on assets during the year also improved to 1.03% and return on equity was 7.23%. Both measures are below historical averages for the Company and are attributable to ongoing weakness in the overall economy and historically low interest rates. The really good news though, is that improved operating results translated to a considerably higher share price. From the beginning of the fiscal year to the end, the price per share increased from $12.45 to $16.60, leading to a 35% total shareholder return when cash dividends are included
The most significant contributor to improved earnings was a material decline in costs related to the resolution of problem loans. These costs fell by 59% during the year to $54,776,000, as asset quality measures improved across the board. Total non-performing assets, a measure that combines loans on which payments are no longer being made plus foreclosed real estate, declined by 26% during the year to $273,000,000. This is the lowest level of problem assets reported since 2008. Delinquent loans also declined during the year to 2.57% of the portfolio from 3.43% one year earlier, and real estate acquired through foreclosure declined by 37% to $99,478,000 during the year. Consumer foreclosures continue to be higher than normal, yet properties now sell quickly and at better prices than a year ago. Virtually all large foreclosed properties are under contract at amounts equal to or exceeding current book value. We look for the favorable trend in credit costs to continue, albeit at a slower pace, in 2013.
Along with improved asset quality, the Company's balance sheet maintained a fortress-like condition. Liquidity remained abundant and capital ratios were among the best in the industry at year-end. For example, the Company's year-end ratio of tangible common equity to tangible assets, the purest measure of capital adequacy, was 13.45%, the sixth highest among the 100 largest banks in the United States. A strong capital position not only provides a shock absorber for unexpected losses, but also gives management the flexibility and wherewithal to take advantage of new opportunities as they appear. Capital strength enabled the Company to repurchase 2,895,000 shares at an average price of $14.48 in fiscal 2012. The cash dividend was also increased by 33% over the prior year.
Contributing to the robust capital position was a partial restructuring of the balance sheet that reduced total assets managed by approximately $1 billion. This occurred in the fourth quarter with the sale of a large portion of the Company's mortgage-backed securities portfolio at a net gain of $95 million. The gain was harvested due to concern that changes in interest rates and/or accelerating prepayments would cause it to evaporate. The profits were then used to fund prepay charges and retire high cost long-term debt. The net effects of the restructuring are improved operating margins in the near term and additional protection against higher interest rates in the long term.
In contrast to the fine operating results, quality new loan origination opportunities were limited in 2012. Most were found in the commercial segments of our business, where a great deal of success was experienced, though not enough to offset the runoff in the mortgage portfolio. In 2012, the Federal Reserve induced yet another round of record low mortgage rates, using hyper aggressive monetary policy actions with obscure sounding names such as “Quantitative Easing” and “Operation Twist”. These actions were taken to further stimulate the struggling economy. The resulting low rates enabled outstanding, if temporary, results for mortgage lenders with an “originate and sell” model, while placing portfolio lenders like Washington Federal at a severe competitive disadvantage. Our retail banking group nonetheless originated $539 million of single family mortgage loans in 2012 by focusing on products such as custom construction, jumbo loans and other home loan niches where pricing commensurate with risk can still be obtained. The bottom line for Washington Federal is that current rates on 30 year, fixed rate, secondary market conforming mortgage loans are just too low to justify placing significant amounts on the balance sheet.
We are often asked why Washington Federal sticks to the portfolio lending model as opposed to the “originate and sell” model that is so profitable during times like these. There are several straightforward reasons. Most importantly, in the portfolio lending model, the risk stays with the originator, making for a more honest and, in the long run, a more consumer friendly market. Today, some 96% of all mortgage loans end up in a government financing bucket of one form or another. Private sector originators extract large front-end fees and sell off the risk to the market, generally with an explicit government guarantee. This transfer of risk from the private sector to the taxpayer is a moral hazard we find impossible to support, even though it means that we forgo generous profits during periods of frenzied refinance activity.
WASHINGTON FEDERAL, INC. AND SUBSIDIARIES
2012 ANNUAL REPORT
Sale of the loan also disrupts the mutual sense of responsibility between lender and borrower. For the borrower, default is less morally reprehensible if the party incurring loss is unknown to them. Likewise, loan servicers tend to be less caring and responsive toward the borrower if they have no principal at risk and no other relationship with the borrower. The “originate and sell” model also requires a very aggressive approach to managing variable expenses, meaning staff expansion during times of high volume, followed by layoffs when volumes decline. These short-term staffing increases have historically introduced unqualified lending agents into the market and led to an erosion of integrity, followed by angry consumers. When the boom fades and the downsizing begins, employee loyalty and cultural cohesion suffer, inevitably impacting financial performance. Nary a soul was laid off from Washington Federal during the Great Recession and employee morale is as high as ever. Satisfied employees make for satisfied customers and, in turn we believe, for satisfied shareholders.
Accounting considerations present another problem with the “originate and sell” model. Servicing retained when the loan is sold requires the booking of an intangible asset, the true value of which is known only in hindsight. Mortgage servicing rights are difficult to hedge and can add substantial volatility to earnings. A highly cyclical business model like “originate and sell” would not allow us to produce the long-term consistency that shareholders have come to rely on from the Company. It seems to us that the current mortgage financing structure in the U.S. is fundamentally unsound. We just can't bring ourselves to participate in a system that enriches large institutions at taxpayer risk, distorts markets and depersonalizes financial obligations. Winding down Freddie Mac and Fannie Mae and replacing them with a private market solution would be a great step toward a more rational approach to resource allocation in America and would perhaps help to avert another housing crisis down the road.
Deposit gathering efforts were directed at changing the mix in 2012 toward more checking, savings and money market accounts. Overall deposit growth was not required given weak loan demand and the Company's already healthy liquidity position. Traditional savers, worn down by the cumulative effect of low rates, began to seek higher yields than those offered on certificates of deposit. These are the unsung heroes of the economy who are bearing the brunt of current monetary policy. Many are seniors who live off the income of their life savings along with social security. They have little choice but to take more risk to get a better return, something I'm sure they would prefer not to do at their stage of life. We have kept our rates at the high end of the market to support these core and loyal customers, but even the best rates in the market offer meager income. Management expects that certificates of deposit will continue to runoff in 2013, so to offset the loss of those deposits, the focus will again be on growing checking, savings and money market accounts from businesses and consumers.
Operating expenses increased in 2012 relative to assets managed, revenues, net interest income, or any other measure one might care to use. This is a function of the Company's changing business mix, a higher regulatory burden, a smaller balance sheet, and lower yields on earning assets. Gone are the days when Washington Federal could operate with a 17% efficiency ratio. More likely, it will cost between 35 and 40 cents next year for the Company to produce one dollar of net revenue. Still, the cost control gene is firmly imbedded in our DNA and will always assert itself. Even with higher expenses this year, Washington Federal was once again named by theStreet.com as the Most Efficient Bank in America, a title we hope to retain in years to come.
In a soft economy, acquisitions can be the best source of growth. During the fiscal year, the Company completed two small transactions. In November, five branches of the former Charter Bank were purchased in New Mexico, improving our presence in Albuquerque and adding two branches in Santa Fe. In December, the former Western National Bank was acquired with FDIC assistance and added an additional branch in Scottsdale, Arizona. A third acquisition, South Valley Bank & Trust, closed after the fiscal year end, adding $800 million in assets and 24 branch locations in southern and central Oregon. That transaction is expected to be accretive to shareholders in the coming year. De novo branching is a less attractive option for growth than in the past and only two de novo branches, in Ahwatukee, Arizona and Yakima, Washington, were opened during the year.
The primary reason for the reduced importance of brick and mortar branches in banking is the rapid adoption of new technology. It will come as no surprise that consumers and businesses are opting to bank online and by smart phone for routine transactions and are using branches less frequently. Washington Federal enhanced its electronic delivery systems during the year with the addition of mobile banking, e-statements, and a personal money management tool known as Snap!. As with the online banking product added a few years ago, customers have rapidly signed up for these new products. This is an area where we will invest heavily over the next few years in order to keep pace with changing customer demands and expectations.
The year-end also brings the retirement of two directors with combined experience of 25 years on the board. Derek Chinn joined the board following the acquisition of his family-owned bank, the United Savings & Loan Bank, in 2003. The institution was founded by his father at a time when Chinese immigrants had very restricted access to the banking system. Derek has been an important link to the Asian-American community in Seattle. His knowledge of this market and his expertise in mortgage lending added a great deal to our decision-making during his time on the board. John Clearman became a director in 1996 and has served as Chairman of the Audit Committee and as Lead Independent Director. His experience and knowledge of accounting and business in general make for a deep store of wisdom that was called on often. Mostly though, we'll miss his common sense and calm
WASHINGTON FEDERAL, INC. AND SUBSIDIARIES
2012 ANNUAL REPORT
demeanor in the face of overzealous critics and situations that others attempted to hype out of proportion. John is always the adult in the room. I hope you'll take a moment to thank both of them for their service representing shareholders though some very interesting and challenging times.
This year we also welcomed two new directors. Randy Talbot built a 35 year career in the insurance industry as the owner of a large agency in New Mexico, served as President of Safeco Life and ultimately served as President, CEO and Director of Symetra Financial Corp, a $35 billion publicly traded life insurance and financial services company headquartered in Bellevue, Washington. Randy also serves as the Lead Independent Director of Concur Technologies (NASDAQ:CNQR), and is currently Managing Director of Talbot Financial, a family office and registered investment advisor. David Grant began his professional life as a certified public accountant with Touche Ross but spent most of his career with publicly traded Shurgard Storage Centers, serving ultimately as Chief Executive Officer and a member of the board. After the sale of Shurgard in 2006, David formed Catalyst Storage Partners and serves as its Managing Director. We are thankful that both Randy and David are willing to serve at a time when so much is expected of directors.
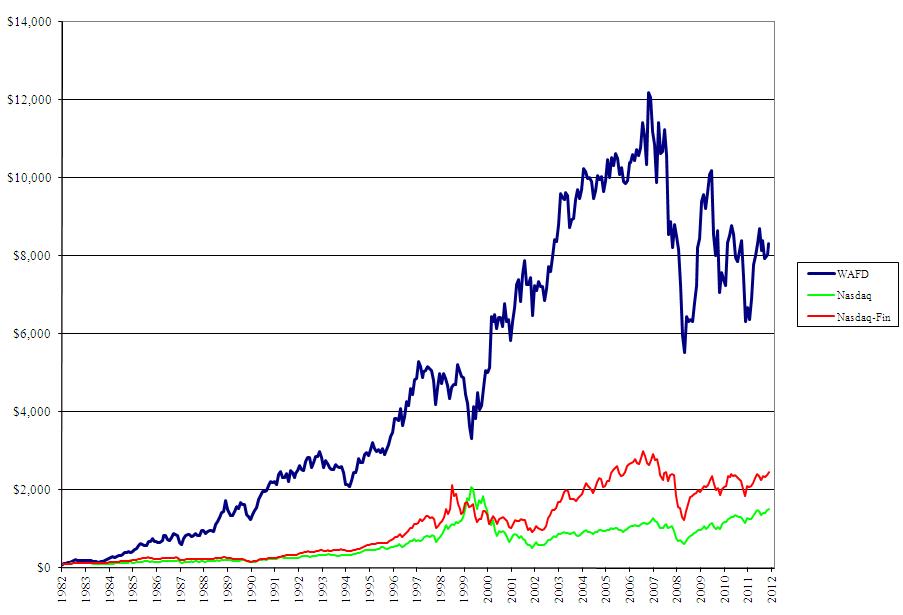
On November 9th, 2012 the Company completed its thirtieth year since the initial public offering in 1982. You might be interested to know that the Company was sold to the public for $32 million that year and since then has reported cumulative net income of nearly $2.7 billion. Shareholders have received 32 times their original investment in cash dividends and the total return on $10,000 invested would be $771,845 today. That's a pretty good return for a company managed to such a low risk profile. Our anniversary gave us a chance to remark upon the contributions of those who came before and to remember their example of stewardship that enabled them to pass the company on to the current board and management team in such great condition. We hope to emulate them for the benefit of the next generation.
Turning to the future, investors in the industry should continue to be realistic in their expectations. Even a great company like Washington Federal is not exempt from the effects of a soft economy and the corresponding low interest rates. The Dodd-Frank Act and heightened regulatory scrutiny will also serve to make the industry less profitable through price controls and new rules that limit our ability to serve certain clients and market segments as we have in the past. The new regulatory climate also requires substantial additional expenses to comply not only with formal regulations, but also with informal regulatory expectations. In this environment it seems unlikely that the industry will experience much overall growth in 2013. Instead, shrinking margins will likely pressure the bottom line of all banks and motivate additional consolidation. Washington Federal is well positioned to be an acquirer, but we intend to be disciplined as we have been in the past. As a way to improve shareholder value, stock repurchases provide a sound alternative to growth from internal or external sources and will be aggressively pursued at prices below or near book value.
In closing, I'd like to express appreciation to the Executive Management Committee, the Company's officers and employees, and the Board of Directors for the combined effort that led to our success during the past year. Each of them will be working on your behalf in the year ahead to safely grow the value of your investment. You can help by sending your friends, relatives, neighbors and business acquaintances to Washington Federal for all their banking needs.
I hope to see you at the 2013 Annual Meeting of Stockholders to be held at 2:00 PM on January 16th at the Red Lion Hotel in downtown Seattle.
Sincerely,
Roy M. Whitehead
Chairman, President and Chief Executive Officer
WASHINGTON FEDERAL, INC. AND SUBSIDIARIES
2012 ANNUAL REPORT
(From left to right) Brent J. Beardall, Executive Vice President, Simon E. Powley, Senior Vice President, Linda S. Brower, Executive Vice President, Mark A. Schoonover, Executive Vice President, Roy M. Whitehead, Chairman, President and CEO, Thomas E. Kasanders, Executive Vice President, Angela D. Veksler, Executive Vice President, Edwin C. Hedlund, Executive Vice President and Secretary, Jack B. Jacobson, Executive Vice President.
MANAGEMENT'S DISCUSSION AND ANALYSIS OF FINANCIAL CONDITION AND RESULTS OF OPERATIONS
We make statements in this Annual Report on Form 10-K that constitute forward-looking statements. Words such as “expects,” “anticipates,” “believes,” “estimates,” “intends,” “forecasts,” “projects” and other similar expressions as well as future or conditional verbs such as “will,” “should,” “would” and “could” are intended to help identify such forward-looking statements. These statements are not historical facts, but instead represent current expectations, plans or forecasts of the Company and are based on the beliefs and assumptions of the management of the Company and the information available to management at the time that these disclosures were prepared. The Company intends for all such forward-looking statements to be covered by the safe harbor provisions for forward-looking statements within the meaning of the Private Securities Litigation Reform Act of 1995 and the provisions of Section 27A of the Securities Act of 1933 and Section 21E of the Securities Exchange Act of 1934. These statements are not guarantees of future results or performance and involve certain risks, uncertainties and assumptions that are difficult to predict and often are beyond the Company's control. Actual outcomes and results may differ materially from those expressed in, or implied by, the Company's forward-looking statements.
You should not place undue reliance on any forward-looking statement and should consider the following uncertainties and risks, as well as the risks and uncertainties discussed elsewhere in this report, including under Item 1A. “Risk Factors,” and in any of the Company's other subsequent Securities and Exchange Commission filings, which could cause our future results to differ materially from the plans, objectives, goals, estimates, intentions, and expectations expressed in forward-looking statements:
| |
| • | a deterioration in economic conditions, including declines in the real estate market and home sale volumes and financial stress on borrowers as a result of the uncertain economic environment; |
| |
| • | the severe effects of the continued economic downturn, including high unemployment rates and declines in housing prices and property values, in our primary market areas; |
| |
| • | the effects of and changes in monetary and fiscal policies of the Board of Governors of the Federal Reserve System and the U.S. Government; |
| |
| • | fluctuations in interest rate risk and changes in market interest rates; |
| |
| • | the Company's ability to make accurate assumptions and judgments about the collectability of its loan portfolio, including the creditworthiness of its borrowers and the value of the assets securing these loans; |
| |
| • | the Company's ability to successfully complete merger and acquisition activities and realize expected strategic and operating efficiencies associated with such activities; |
| |
| • | legislative and regulatory limitations, including those arising under the Dodd-Frank Wall Street Reform Act and potential limitations in the manner in which we conduct our business and undertake new investments and activities; |
| |
| • | the ability of the Company to obtain external financing to fund its operations or obtain this financing on favorable terms; |
| |
| • | changes in other economic, competitive, governmental, regulatory, and technological factors affecting the Company's markets, operations, pricing, products, services and fees; |
| |
| • | the success of the Company at managing the risks involved in the foregoing and managing its business; and |
| |
| • | the timing and occurrence or non-occurrence of events that may be subject to circumstances beyond the Company's control. |
All forward-looking statements speak only as of the date on which such statements are made, and Washington Federal undertakes no obligation to update or revise any forward-looking statements to reflect changed assumptions, the occurrence of unanticipated events, changes to future operating results over time, or the impact of circumstances arising after the date the forward-looking statement was made.
MANAGEMENT'S DISCUSSION AND ANALYSIS OF FINANCIAL CONDITION AND RESULTS OF OPERATIONS
GENERAL
Washington Federal, Inc. (Company or Washington Federal) is a unitary thrift holding company. The Company's primary operating subsidiary is Washington Federal (Bank), a federally chartered savings association.
The Company's fiscal year end is September 30th. All references to 2012, 2011 and 2010 represent balances as of September 30, 2012, September 30, 2011 and September 30, 2010, or activity for the fiscal years then ended. References to net income in this document refer to net income available to common shareholders.
CRITICAL ACCOUNTING POLICIES
Preparation of financial statements in conformity with accounting principles generally accepted in the United States of America requires the use of estimates and assumptions that affect reported amounts of certain assets, liabilities, revenues and expenses in the Company's consolidated financial statements. Accordingly, estimated amounts may fluctuate from one reporting period to another due to changes in assumptions underlying estimated values.
The Company has determined that the only accounting policy critical to an understanding of the consolidated financial statements of Washington Federal relates to the methodology for determining the valuation of the allowance for loan losses, as described below.
The Company maintains an allowance for loan losses to absorb losses inherent in the loan portfolio. The allowance is based on ongoing, quarterly assessments of the probable and estimable losses inherent in the loan portfolio. The Company's methodology for determining the appropriateness of the allowance consists of several key elements, including the general allowance and specific allowances.
The general loan loss allowance is established by applying a loss percentage factor to each of the different loan types. The allowance is provided based on management's continuing evaluation of the pertinent factors underlying the quality of the loan portfolio, including changes in the size and composition of the loan portfolio, actual loan loss experience, current economic conditions, collateral values, geographic concentrations, seasoning of the loan portfolio, specific industry conditions and the duration of the current business cycle. The recovery of the carrying value of loans is susceptible to future market conditions beyond the Company's control, which may result in losses or recoveries differing from those provided.
Specific allowances are established for loans that are individually evaluated, where management has identified significant conditions or circumstances related to a loan indicating the probability that a loss has been incurred.
INTEREST RATE RISK
The primary source of income for the Company is net interest income, which is the difference between the interest income generated by our interest-earning assets and the interest expense generated by our interest-bearing liabilities. The level of net interest income is a function of the average balances of our interest-earnings assets and liabilities and the spread between the yield on such assets and the cost of such liabilities. These factors are influenced by both the pricing and mix of our interest-earning assets and our interest-bearing liabilities. If the interest rates on our interest-bearing liabilities increase at a faster pace than the interest rates on our interest-earning assets, the result could be a reduction in net interest income, and with it, a reduction in our earnings.
The Company accepts a higher level of interest rate volatility as a result of its significant holdings of fixed-rate single-family home loans that are longer-term than the short-term characteristics of its primary liabilities of customer accounts. As a result, assets do not respond as quickly to changes in interest rates as liabilities. Due to this strategy, net interest income typically would decline when interest rates rise and would expand when interest rates fall as compared to a portfolio of matched maturities of assets and liabilities, if the balance sheet did not change in size or composition.
The Company manages its interest rate risk in part by originating more fixed-rate loans when yields are higher and adding loans and investments with shorter term characteristics, such as construction and commercial loans, when loan rates are lower. This balance sheet strategy, in conjunction with a strong capital position and low operating costs has allowed the Company to manage interest rate risk, within guidelines established by the Board of Directors, through all interest rate cycles. Although a
MANAGEMENT'S DISCUSSION AND ANALYSIS OF FINANCIAL CONDITION AND RESULTS OF OPERATIONS
significant increase in market interest rates could adversely affect the net interest income of the Company, the Company's interest rate risk approach has never resulted in the recording of a monthly operating loss.
During the fourth quarter the Company took steps intended to reduce the Company's interest rate risk and improve its future earnings potential. During the quarter, the Company sold $2.3 billion of fixed rate mortgage-backed securities for a pre-tax gain of $95 million. In the same period, the Company pre-paid $876 million of long term debt at a pre-tax loss of $95 million. The weighted average rate on the retired debt was 3.94%. In related transactions, the Company also purchased a mix of short and longer term assets totaling $2.0 billion with an anticipated weighted average yield of 1.83%, and restructured an additional $830 million of long term debt to lengthen maturity and reduce the weighted average rate from 4.48% to 3.43%. These transactions are expected to reduce the volatility of net interest income and stabilize the margin going forward.
The Company's objective in managing its interest rate risk is to grow the amount of net interest income through the rate cycles, acknowledging that there will be some periods of time when that will not be feasible. The chart below shows the volatility of our period end net interest spread (dotted line measured against the right axis) compared to the relatively consistent growth in net interest income (solid line measured against the left axis). This consistency is accomplished by managing the size and composition of the balance sheet through different rate cycles.
The following table shows the estimated repricing periods for earning assets and paying liabilities.
MANAGEMENT'S DISCUSSION AND ANALYSIS OF FINANCIAL CONDITION AND RESULTS OF OPERATIONS
|
| | | | | | | | | | | | | | | |
| | Repricing Period | | |
| | Within One
Year | | After 1 year -
before 6 Years | | Thereafter | | Total |
| | (In thousands) | | |
| As of September 30, 2012 | | | | | | | |
| Earning Assets (1) | $ | 5,125,945 |
| | $ | 4,563,372 |
| | $ | 1,929,366 |
| | $ | 11,618,683 |
|
| Paying Liabilities | (6,380,043 | ) | | (3,012,010 | ) | | (1,177,982 | ) | | (10,570,035 | ) |
| Excess (Liabilities) Assets | $ | (1,254,098 | ) | | $ | 1,551,362 |
| | $ | 751,384 |
| | |
| Excess as % of Total Assets | (10.05 | )% | | | | | | |
| Policy limit for one year excess | (35.00 | )% | | | | | | |
(1) Asset repricing period includes estimated prepayments based on historical activity
At September 30, 2012, the Company had approximately 1.3 billion more liabilities than assets subject to repricing in the next year, which amounted to a negative maturity gap of 10.05% of total assets, approximately the same as the prior year. Having this excess of liabilities, relative to assets, that will be repricing within the next year, the Company is subject to decreasing net interest income should interest rates rise. However, if management were to take steps to change the size and/or mix of the balance sheet, rising rates may not cause a decrease in net interest income.Cash and cash equivalents of $751,430,000 and stockholders' equity of $1,899,752,000 provides management with flexibility in managing interest rate risk going forward.
The interest rate spread decreased to 2.80% at September 30, 2012 from 3.13% at September 30, 2011. Net interest spread represents the difference between the contractual rates of earning assets and the contractual rates of paying liabilities as of a specific date. The spread decreased due to lower asset yields. Rates on customer accounts decreased by 79 basis points over the prior year while rates on earning assets decreased by 24 basis points (see Period End Spread table below).
As of September 30, 2012, total assets decreased by $967,805,000, or 7.20%, from $13,440,749,000 at September 30, 2011. For the year ended September 30, 2012, compared to September 30, 2011, loans (both non-covered and covered) decreased $577,686,000, or 6.94%, while investment securities decreased $328,988,000, or 9.96%.
ASSET QUALITY & ALLOWANCE FOR LOAN LOSSES
The Company maintains an allowance to absorb losses inherent in the loan portfolio. The amount of the allowance is based on ongoing, quarterly assessments of the probable and estimable losses inherent in the loan portfolio. The Company's methodology for determining the appropriateness of the allowance consists of several key elements, including the general allowance and specific allowances.
The general portion of the loan loss allowance is established by applying a loss percentage factor to the different loan types. Management believes loan types are the most relevant factor in the allowance calculation for group of homogeneous loans as the risk characteristics within these groups are similar. The loss percentage factor is made up of two parts - the historical loss factor (“HLF”) and the qualitative loss factor (“QLF”). The HLF takes into account historical charge-offs, while the QLF is determined by loan type and allows management to augment reserve levels to reflect the current environment and portfolio performance trends including recent charge-off trends. Allowances are provided based on management's continuing evaluation of the pertinent factors underlying the quality of the loan portfolio, including changes in the size and composition of the loan portfolio, actual loan loss experience, current economic conditions, collateral values, geographic concentrations, seasoning of the loan portfolio, specific industry conditions, and the duration of the current business cycle. The recovery of the carrying value of loans is susceptible to future market conditions beyond the Company's control, which may result in losses or recoveries differing from those estimated.
Specific allowances are established for loans which are individually evaluated; in cases where management has identified significant conditions or circumstances related to a loan that Management believes indicate the probability that a loss has been incurred.
MANAGEMENT'S DISCUSSION AND ANALYSIS OF FINANCIAL CONDITION AND RESULTS OF OPERATIONS
Loans for commercial purposes, including multi-family loans, builder construction loans and commercial loans are reviewed on an individual basis to assess the ability of the borrowers to continue to service all of their principal and interest obligations. If a loan shows signs of weakness, it is downgraded and, if warranted, placed on non-accrual status. On collateral dependent commercial loans, updated valuations are generally obtained from external sources when a loan exhibits weakness or is modified. The Company also has an asset quality review function that reports the results of its internal reviews to the Board of Directors on a quarterly basis.
Restructured single-family residential loans are reserved for under the Company's general reserve methodology. If any individual loan is significant in balance, the Company may establish a specific reserve as warranted.
Most restructured loans are accruing and performing loans where the borrower has proactively approached the Company about modifications due to temporary financial difficulties. Each request is individually evaluated for merit and likelihood of success. As of September 30, 2012 single-family residential loans comprised 83% of restructured loans. The concession for these loans is typically a payment reduction through a rate reduction of from 100 to 200 bps for a specific term, usually six to twelve months. Interest-only payments may also be approved during the modification period. The subsequent default rate on restructured single- family mortgage loans has been 14.5% for the last two years. Concessions for construction (3.7%), land A&D (3.5%) and multi-family loans (4.0%) are typically an extension of maturity combined with a rate reduction of normally 100 bps. The subsequent default rate on restructured commercial loans has been 5.8% over the last two years.
For commercial loans, six consecutive payments on newly restructured loan terms are required prior to returning the loan to accrual status. In some instances after the required six consecutive payments are made a management assessment will conclude that collection of the entire principal balance is still in doubt. In those instances, the loan will remain on non-accrual. Homogeneous loans may or may not be on accrual status at the time of restructuring, but all are placed on accrual status upon the restructuring of the loan. Homogeneous loans are restructured only if the borrower can demonstrate the ability to meet the restructured payment terms; otherwise, collection is pursued and the loan remains on non-accrual status until liquidated. If the homogeneous restructured loan does not perform it is placed in non-accrual status when it is 90 days delinquent.
A loan that defaults and is subsequently modified would impact the Company's delinquency trend, which is part of the QLF component of the general reserve calculation. Any modified loan that re-defaults and is charged-off would impact the HLF component of our general reserve calculation.
Non-performing assets were $272,905,000, or 2.19%, of total assets, at September 30, 2012, compared to $370,294,000, or 2.76%, of total assets, at September 30, 2011. This continued elevated level of non-performing assets is a result of the significant decline in housing values in the western United States and the national recession over the last three years. This level of non-performing assets remains significantly higher than the 0.91% average over the Company's 30+ year history as a public company.
The following table details non-performing asset by type, comparing 2012 and 2011.
MANAGEMENT'S DISCUSSION AND ANALYSIS OF FINANCIAL CONDITION AND RESULTS OF OPERATIONS
|
| | | | | | | | | | | | | | | |
| | | September 30, | | | | |
| Non-Performing Assets | | 2012 | | 2011 | | $ Change | | % Change |
| | | (In thousands) | | |
| Non-accrual loans: | | | | | | | | |
| Single-family residential | | $ | 131,193 |
| | $ | 126,624 |
| | $ | 4,569 |
| | 3.6 | % |
| Construction – speculative | | 10,634 |
| | 15,383 |
| | (4,749 | ) | | (30.9 | ) |
| Construction – custom | | 539 |
| | 635 |
| | (96 | ) | | (15.1 | ) |
| Land – acquisition & development (A&D) | | 13,477 |
| | 37,339 |
| | (23,862 | ) | | (63.9 | ) |
| Land – consumer lot loans | | 5,149 |
| | 8,843 |
| | (3,694 | ) | | (41.8 | ) |
| Multi-Family | | 4,185 |
| | 7,664 |
| | (3,479 | ) | | (45.4 | ) |
| Commercial real estate | | 7,653 |
| | 11,380 |
| | (3,727 | ) | | (32.8 | ) |
| Commercial & industrial | | 16 |
| | 1,679 |
| | (1,663 | ) | | (99.0 | ) |
| HELOC | | 198 |
| | 481 |
| | (283 | ) | | (58.8 | ) |
| Consumer | | 383 |
| | 437 |
| | (54 | ) | | (12.4 | ) |
| Total non-accrual loans | | 173,427 |
| | 210,465 |
| | (37,038 | ) | | (17.6 | ) |
| Total REO & REHI | | 99,478 |
| | 159,829 |
| | (60,351 | ) | | (37.8 | ) |
| Total non-performing assets | | $ | 272,905 |
| | $ | 370,294 |
| | $ | (97,389 | ) | | (26.3 | )% |
| | | | | | | | | |
In response to the improving overall credit quality of our loan portfolio, the total allowance for loan loss decreased by $24,013,000, or 15.3%, over 2011. $117,164,000 of the allowance is calculated under the formulas contained in our general allowance methodology and the remaining $15,983,000 is made up of specific reserves on loans that were deemed to be impaired at September 30, 2012. The general reserve increased by $1,916,000, or 1.7%, to $117,164,000 while the specific reserve decreased by $25,929,000, or 61.9%. The primary reasons for the shift in total allowance allocation from specific reserves to general reserves is due to the Company having already addressed many of the problem loans focused in the speculative construction and land A&D portfolios, combined with above normal delinquencies and elevated charge-offs in the single-family residential portfolio.
LIQUIDITY AND CAPITAL RESOURCES
The principal sources of funds for the Company's activities are retained earnings, loan repayments (including prepayments), net deposit inflows, repayments and sales of investments and borrowings. Washington Federal's principal sources of revenue are interest on loans and interest and dividends on investments.
The Company's net worth at September 30, 2012, was $1,899,752,000 or 15.2%, of total assets. This is a decrease of $6,781,000 from September 30, 2011, when net worth was $1,906,533,000, or 14.2%, of total assets. The Company's net worth was impacted in the year by net income of $138,183,000, the payment of $34,115,000 in cash dividends, treasury stock purchases that totaled $41,914,000, as well as an decrease in other comprehensive income of $72,483,000. The Company paid out 23.5% of its 2012 earnings in cash dividends to common shareholders, compared with 24.0% last year. Over the long term, the Company would prefer its dividend payout ratio to be less than 50.0%. For the year ended September 30, 2012, $76,029.000, or 55.0%, of net income was returned to shareholders in the form of cash dividends or share repurchases.
Management believes this strong net worth position will help the Company manage its interest rate risk and provide the capital support needed for controlled growth in a regulated environment.
The Company has a credit line with the Federal Home Loan Bank of Seattle (FHLB) equal to 50.0% of total assets, providing a substantial source of liquidity if needed. FHLB advances are collateralized as provided for in the Advances, Pledge and Security Agreement by all FHLB stock owned by the Company, deposits with the FHLB and certain mortgages or deeds of trust securing such properties as provided in the agreements with the FHLB.
The Company's cash and cash equivalents amounted to $751,430,000 at September 30, 2012, a 7.9% decrease from the cash and cash equivalents balance of $816,002,000 one year ago. The Company continues to maintain higher than normal amounts of liquidity due to concern about potentially rising interest rates in the future. Additionally, see “Interest Rate Risk” above and the “Statement of Cash Flows” included in the financial statements.
MANAGEMENT'S DISCUSSION AND ANALYSIS OF FINANCIAL CONDITION AND RESULTS OF OPERATIONS
CHANGES IN FINANCIAL CONDITION
Available-for-sale and held-to-maturity securities. Available for sale securities decreased $1,473,439,000, or 45.3% during the year ended September 30, 2012. This net decrease included the purchase of $2,442,184,000 of available-for-sale investment securities, net sales $2,257,913,000 of available-for-sale securities at a gain of $95,234,000 and principal repayments of $1,608,603,000. Held to maturity securities increased $1,144,451,000 during the year ended September 30, 2012. This increase included the purchase of $1,167,121,000 of held to maturity securities. As of September 30, 2012, the Company had net unrealized gains on available-for-sale securities of $13,306,000, net of tax, which were recorded as part of stockholders' equity. These changes in the available for sale and held to maturity investment portfolios were part of the balance sheet restructuring the Company completed in August 2012 to reduce the Company's interest rate risk, help limit potential margin compression from prepayments on securities, improve its future earnings potential and provide more financial flexibility in the future.
Loans receivable. Loans receivable decreased $483,879,000, or 6.1%, to $7,451,998,000 at September 30, 2012, from $7,935,877,000 one year earlier. This decrease resulted primarily from loan repayments (including prepayments) of $1,855,484,000, which exceeded originations of $1,390,278,000 by $465,206,000. This decrease is consistent with management's strategy to reduce the Company's exposure to land and construction loans and not to aggressively compete for 30 year fixed-rate loans at rates below 4.00%, due to the duration risk associated with such low mortgage rates, which contributed to the net run off of the loan portfolio. Additionally, during the year, $160,971,000 of loans were transferred to REO. If the current low rates on 30 year fixed-rate mortgages persist, management will consider continuing to shrink the Company's loan portfolio. The following table shows the change in the geographic distribution by state of the gross loan portfolio from 2011 to 2012.
|
| | | | | | |
| 2012 | 2011 | Change |
| Washington | 46.1 | % | 46.6 | % | (0.5 | )% |
| Oregon | 16.6 |
| 17.4 |
| (0.8 | )% |
| Other | 5.5 |
| 5.2 |
| 0.3 | % |
| Idaho | 6.0 |
| 6.6 |
| (0.6 | )% |
| Arizona | 11.1 |
| 9.1 |
| 2.0 | % |
| Utah | 7.3 |
| 7.6 |
| (0.3 | )% |
| New Mexico | 3.8 |
| 3.8 |
| — | % |
| Texas | 2.1 |
| 1.9 |
| 0.2 | % |
| Nevada | 1.5 |
| 1.8 |
| (0.3 | )% |
| 100.0 | % | 100.0 | % |
|
Covered loans. As of September 30, 2012, covered loans had decreased 24.5%, or $93,807,000, to $288,376,000, compared to September 30, 2011, due to continued paydowns and transfers of the properties into covered real estate owned. This portfolio of loans is expected to continue to decline over time, absent another FDIC assisted transaction.
Real estate held for sale. Real estate held for sale decreased by $60.4 million or 37.8% to $99,478,000 from $159,829,000 as of September 30, 2011, as the Company has continued to liquidate foreclosed properties. During the year the Company sold 663 properties for net proceeds of $142.8 million and a net loss on sale of $15.9 million. The total net loss on sale of real estate, measured against the original loan balance of $266.5 million, was $123.6 million or 46.4% for properties sold in fiscal 2012. Net loss on real estate acquired through foreclosure, which includes gains and the aforementioned losses on sale, ongoing maintenance expense and periodic write-downs from lower valuations, decreased by 75.5% from the prior year to $9.8 million. This decrease is due to land prices stabilizing in 2012, compared to the significant depreciation of land values in 2010 - 2011. As of September 30, 2012, real estate held for sale consisted of 449 properties totaling $99.5 million. Land represents $47.6 million or 48.0% of total real estate held for sale.
MANAGEMENT'S DISCUSSION AND ANALYSIS OF FINANCIAL CONDITION AND RESULTS OF OPERATIONS
Intangible assets. The Company's intangible assets are made up of $251,653,000 of goodwill, servicing rights intangible of $286,000, as well as the unamortized balances of the core deposit intangible of $4,137,000 at September 30, 2012.
Customer deposits. Customer deposits at September 30, 2012, totaled $8,576,618,000 compared with $8,665,903,000 at September 30, 2011, a 1.0% decrease. However, the Company was able to grow transaction accounts by $284,265,000 or 10.7%, while time deposits decreased by $373,550,000 or 6.2%. The weighted average rate paid on customer deposits during the year was 0.99%, a decrease of 33 basis points from the previous year, as a result of the low interest rate environment.
FHLB advances and other borrowings. Total borrowings decreased $882,066,000 or 31.94%, to $1,880,000,000 at September 30, 2012 as part of the balance sheet restructuring in August 2012. See “Interest Rate Risk” above.
Contractual obligations. The following table presents, as of September 30, 2012, the Company's significant fixed and determinable contractual obligations, within the categories described below, by payment date or contractual maturity.
|
| | | | | | | | | | | | | | | | |
| Contractual Obligations | | Total | | Less than
1 Year | | 1 to 5
Years | | Over 5
Years |
| | | (In thousands) |
| Debt obligations (1) | | $ | 1,880,000 |
| | $ | — |
| | $ | 750,000 |
| | $ | 1,130,000 |
|
| Operating lease obligations | | 11,719 |
| | 3,303 |
| | 6,703 |
| | 1,713 |
|
| | | $ | 1,891,719 |
| | $ | 3,303 |
| | $ | 756,703 |
| | $ | 1,131,713 |
|
(1) Represents final maturities of debt obligations.
These contractual obligations, except for the operating leases, are included in the Consolidated Statements of Financial Condition. The payment amounts represent those amounts contractually due.
RESULTS OF OPERATIONS
GENERAL
See Note P, “Selected Quarterly Financial Data (Unaudited),” which highlights the quarter-by-quarter results for the years ended September 30, 2012 and 2011.
COMPARISON OF 2012 RESULTS WITH 2011
In 2012 net income increased $27,042,000, or 24.3%, to $138,183,000 for the year ended September 30, 2012 as compared to $111,141,000 for the year ended September 30, 2011. The net income for the twelve months ended September 30, 2012 benefited from overall lower credit costs, which included the provision for loan losses and net loss on real estate owned. The provision for loan losses amounted to $44,955,000 for the year ended September 30, 2012, as compared to $93,104,000 for the year ago period. In additions, losses recognized on real estate acquired through foreclosure was $9,819,000 for the year ended September 30, 2012, as compared to $40,050,000 for the fiscal year ended September 30, 2011.
The table below sets forth certain information regarding changes in interest income and interest expense of the Company for the 2012. For each category of interest-earning asset and interest-bearing liability, information is provided on changes
attributable to: (1) changes in volume (changes in volume multiplied by old rate) and (2) changes in rate (changes in rate multiplied by old average volume). The change in interest income and interest expense attributable to changes in both volume and rate has been allocated proportionately to the change due to volume and the change due to rate.
MANAGEMENT'S DISCUSSION AND ANALYSIS OF FINANCIAL CONDITION AND RESULTS OF OPERATIONS
|
| | | | | | | | | |
| | Year Ended
September 30, 2012 |
| | Volume | Rate | Total |
| Interest income: | | | |
| Loans and covered assets | $ | (36,593 | ) | $ | (804 | ) | $ | (37,397 | ) |
| Mortgaged-backed securities | 21,346 |
| (33,411 | ) | (12,065 | ) |
| Investments (1) | 799 |
| (5,701 | ) | (4,902 | ) |
| | | | |
| All interest-earning assets | (14,448 | ) | (39,916 | ) | (54,364 | ) |
| | | | |
| Interest expense: | | | |
| Customer accounts | (795 | ) | (28,101 | ) | (28,896 | ) |
| FHLB advances and other borrowings | (1,741 | ) | (3,810 | ) | (5,551 | ) |
| | | | |
| All interest-bearing liabilities | (2,536 | ) | (31,911 | ) | (34,447 | ) |
| | | | |
| Change in net interest income | $ | (11,912 | ) | $ | (8,005 | ) | $ | (19,917 | ) |
| | | | |
| (1) Includes interest on cash equivalents and dividends on FHLB stock | | | |
The Company recorded a $44,955,000 provision for loan losses in 2012 compared to $93,104,000 in 2011. Non-performing assets (NPA's) decreased by $97,389,000 over 2011. The Company had net charge-offs of $69,721,000 for the twelve months ended September 30, 2012 compared with $98,285,000 of net charge-offs for the same period one year ago. The decrease in the provision for loan losses is in response to four primary factors: first, the amount of NPA's improved year-over-year; second, non-accrual loans as a percentage of total loans decreased from 2.54% at September 30, 2011, to 2.20% at September 30, 2012; third, the percentage of loans 30 days or more delinquent decreased from 3.43% at September 30, 2011, to 2.57% at September 30, 2012; and finally, the Company's exposure in the land A&D and speculative construction portfolios, the source of the majority of losses during this credit cycle, has decreased from a combined 4.10% of the gross loan portfolio at September 30, 2011, to 3.30% at September 30, 2012. Management believes the allowance for loan losses, totaling $133,147,000, or 1.69% of gross loans, is sufficient to absorb estimated losses inherent in the portfolio.
Total other income decreased $9,416,000, or 36.3%, in 2012 from 2011. During the fiscal year ended September 30, 2012, the Company sold $2.4 billion of fixed rate mortgage backed securities, recognizing a $95.2 million gain. In addition, the Company prepaid $876 million in long term debt realizing a loss of $95.5 million. The net effect is a loss of $331,000 for the twelve months ended September 30, 2012 compared to $8.1 million in realized gains on the sale of $131.3 million of available for sale securities during the fiscal year ended September 30, 2011.
Compensation expense increased $5,594,000, or 7.8%, in 2012 primarily due to bonus accruals as the result of increased net income and the addition of the employees from the Charter Bank acquisition October 2011 and the Western National Bank transaction with the FDIC in December 2011. The number of staff, including part-time employees on a full-time equivalent basis, was 1,260 and 1,221 at September 30, 2012 and 2011, respectively.
Occupancy expense increased to $15,971,000 for the twelve months ended September 30, 2012 from $14,480,000 for the fiscal year ended September 30, 2011 as a result of increased branch facilities through both acquisition and de novo growth. The branch network consisted of 166 offices at September 30, 2012 and 160 offices at September 30, 2011. The number of branches has increased subsequent to the fiscal year end to 190, due to the South Valley Acquisition on October 31, 2012.
FDIC insurance expense decreased to $16,093,000 for 2012 from $20,582,000 in 2011. The FDIC instituted a new assessment basis in the fourth quarter of fiscal 2011, which resulted in an overall lower insurance expense for the Company.
Other expenses increased 17.41% to $34,631,000 for the twelve months ended September 30, 2012 from $29,496,000 for the comparable period one year ago. This increase is due in large part to the two acquisitions discussed above and increased information technology and advertising expenses. Operating expense for 2012 and 2011 equaled 1.07% and 1.01% of average
MANAGEMENT'S DISCUSSION AND ANALYSIS OF FINANCIAL CONDITION AND RESULTS OF OPERATIONS
assets, respectively. Despite the increase in operating expenses, the Company continues to operate as one of the most efficient financial institutions in the country.
The loss on real estate acquired through foreclosure decreased 75.5% to $9,819,000 in 2011 from $40,050,000 in 2011, due primarily to the decline in balances of real estate acquired through foreclosure, as the Company continues to liquidate foreclosed properties. The net loss on real estate acquired through foreclosure, includes gains and losses on sale, ongoing maintenance expense and periodic write-downs from lower property valuations.
Income tax expense increased to $77,728,000 in 2012 from $62,518,000 for the fiscal year ended September 30, 2011. The effective tax rate was 36.00% for September 30, 2012 and 2011. The Company expects an effective tax rate of 36.00% going forward.
COMPARISON OF 2011 RESULTS WITH 2010
In 2011 net income decreased $7,512,000, or 6.3%, to $111,141,000 for the year ended September 30, 2011 as compared to $118,653,000 for the year ended September 30, 2010. The net income for the year ended September 30, 2010 included a $54,789,000 after tax gain on the acquisition of Horizon and a $38,865,000 tax benefit related to the settlement of a contingent tax liability. Excluding these two non-recurring items from the prior year, net income increased by $86.1 million, or 345%. The net income for the twelve months ended September 30, 2011 benefited from overall lower credit costs, which included the provision for loan losses and real estate owned expenses. The provision for loan losses amounted to $93,104,000 for the year ended September 30, 2011, as compared to $179,909,000 for the year ago period. In additions, losses recognized on real estate acquired through foreclosure was $40,050,000 for the year ended September 30, 2011, as compared to $80,475,000 for the fiscal year ended September 30, 2010.
The table below sets forth certain information regarding changes in interest income and interest expense of the Company for the 2011. For each category of interest-earning asset and interest-bearing liability, information is provided on changes
attributable to: (1) changes in volume (changes in volume multiplied by old rate) and (2) changes in rate (changes in rate multiplied by old average volume). The change in interest income and interest expense attributable to changes in both volume and rate has been allocated proportionately to the change due to volume and the change due to rate.
|
| | | | | | | | | |
| | Year Ended
September 30, 2011 |
| | Volume | Rate | Total |
| | (In thousands) |
| Interest income: | | | |
| Loans and covered assets | $ | (36,101 | ) | $ | (2,738 | ) | $ | (38,839 | ) |
| Mortgaged-backed securities | 25,601 |
| (9,169 | ) | 16,432 |
|
| Investments (1) | (142 | ) | 3,624 |
| 3,482 |
|
| | | | |
| All interest-earning assets | (10,642 | ) | (8,283 | ) | (18,925 | ) |
| | | | |
| Interest expense: | | | |
| Customer accounts | 2,684 |
| (33,209 | ) | (30,525 | ) |
| FHLB advances and other borrowings | (8,315 | ) | (2,565 | ) | (10,880 | ) |
| | | | |
| All interest-bearing liabilities | (5,631 | ) | (35,774 | ) | (41,405 | ) |
| | | | |
| Change in net interest income | $ | (5,011 | ) | $ | 27,491 |
| $ | 22,480 |
|
The Company recorded a $93,104,000 provision for loan losses in 2011 compared to $179,909,000 in 2010. Non-performing assets (NPA's) decreased by $64,236,000 over 2010. The Company had net charge-offs of $98,284,000 for the twelve months
MANAGEMENT'S DISCUSSION AND ANALYSIS OF FINANCIAL CONDITION AND RESULTS OF OPERATIONS
ended September 30, 2011 compared with $183,651,000 of net charge-offs for the same period one year ago. The decrease in the provision for loan losses is in response to four primary factors: first, the amount of NPA's improved year-over-year; second, non-accrual loans as a percentage of total loans decreased from 2.80% at September 30, 2010, to 2.54% at September 30, 2011; third, the percentage of loans 30 days or more delinquent decreased from 3.53% at September 30, 2010, to 3.43% at September 30, 2011; and finally, the Company's exposure in the land A&D and speculative construction portfolios, the source of the majority of losses during this period of the cycle, has decreased from a combined 5.40% of the gross loan portfolio at September 30, 2010, to 4.10% at September 30, 2011. Management expects the provision to remain elevated until housing values stabilize. Management believes the allowance for loan losses, totaling $157,160,000, is sufficient to absorb estimated losses inherent in the portfolio.
Total other income decreased $94,497,000, or 78.5%, in 2011 from 2010. The year ended September 30, 2010, included an $85,608,000 non-recurring gain on the acquisition of Horizon (see Note A).
Compensation expense increased $2,155,000, or 3.1%, in 2011 primarily due to operating for a full year with the Horizon branches. The number of personnel, including part-time employees considered on a full-time equivalent basis, decreased to 1,221 at September 30, 2011, compared to one year ago.
Occupancy expense increased slightly to $14,480,000 for the twelve months ended September 30, 2011 from $13,933,000 for the fiscal year ended September 30, 2010. The branch network consisted of 160 offices at both September 30, 2011 and 2010.
FDIC insurance expense increased to $20,582,000 for 2011 from $18,626,000 in 2010 as a result of the significant increase in the number of bank failures during the year which has depleted the FDIC fund. The FDIC has undertaken to replenish the FDIC fund through changes to the assessment calculation, special assessments and higher insurance premiums for all insured depository institutions.
Other expenses increased slightly to $29,496,000 for the twelve months ended September 30, 2011 from $28,830,000 for the comparable period one year ago. Operating expense for 2011 and 2010 equaled 1.01% and 0.98% of average assets, respectively. Despite the increase in operating expenses, the Company continues to operate as one of the most efficient financial institutions in the country.
The loss on real estate acquired through foreclosure decreased 50.2% to $40,050,000 in 2011 from $80,475,000 in 2010, due primarily to the decline in balances of real estate acquired through foreclosure, as the Company continues to liquidate foreclosed properties. The net loss on real estate acquired through foreclosure, includes gains and losses on sale, ongoing maintenance expense and periodic write-downs from lower property valuations.
Income tax expense increased to $62,518,000 in 2011 from $4,372,000 for the fiscal year ended September 30, 2010. The fiscal 2010 amount included a $38,865,000 tax benefit related to the settlement of a contingent tax liability (see Note A). The effective tax rate was 36.00% for 2011 versus 3.55% for 2010. The Company expects an effective tax rate of 36.00% going forward.
PERIOD END SPREAD - AS OF THE DATE SHOWN
|
| | | | | | | | | | | | | | | | | | | | | | | |
| DEC 2010 |
| MAR 2011 |
| JUN 2011 |
| SEP 2011 |
| DEC 2011 |
| MAR 2012 |
| JUN 2012 |
| SEP 2012 |
| Interest rate on loans and mortgage-backed securities | 5.66 | % |
| 5.58 | % |
| 5.49 | % |
| 5.43 | % |
| 5.32 | % |
| 5.23 | % |
| 5.15 | % |
| 4.72 | % |
| Interest rate on investment securities | 1.30 |
|
| 1.11 |
|
| 1.26 |
|
| 0.98 |
|
| 0.93 |
|
| 1.84 |
|
| 1.47 |
|
| 1.41 |
|
| Combined | 5.12 |
|
| 5.05 |
|
| 5.07 |
|
| 4.97 |
|
| 4.85 |
|
| 4.72 |
|
| 4.57 |
|
| 4.18 |
|
| Interest rate on customer accounts | 1.40 |
|
| 1.32 |
|
| 1.24 |
|
| 1.14 |
|
| 1.03 |
|
| 0.98 |
|
| 0.95 |
|
| 0.90 |
|
| Interest rate on borrowings | 4.14 |
|
| 4.14 |
|
| 4.14 |
|
| 4.04 |
|
| 4.04 |
|
| 4.04 |
|
| 4.04 |
|
| 3.59 |
|
| Combined | 2.03 |
|
| 1.98 |
|
| 1.92 |
|
| 1.84 |
|
| 1.74 |
|
| 1.71 |
|
| 1.69 |
|
| 1.38 |
|
| Interest rate spread | 3.09 | % |
| 3.07 | % |
| 3.15 | % |
| 3.13 | % |
| 3.11 | % |
| 3.01 | % |
| 2.88 | % |
| 2.80 | % |
WASHINGTON FEDERAL, INC. AND SUBSIDIARIES
2012 ANNUAL REPORT
The interest rate spread decreased during 2012 from 3.13% at September 30, 2011 to 2.80% at September 30, 2012. See “Interest Rate Risk” section above.
SELECTED FINANCIAL DATA
|
| | | | | | | | | | | | | | | |
| Year ended September 30, | 2012 | 2011 | 2010 | 2009 | 2008 |
| | (In thousands, except per share data) |
| Interest income | $ | 590,271 |
| $ | 644,635 |
| $ | 663,560 |
| $ | 691,774 |
| $ | 701,428 |
|
| Interest expense | 193,249 |
| 227,696 |
| 269,101 |
| 318,627 |
| 397,641 |
|
| Net interest income | 397,022 |
| 416,939 |
| 394,459 |
| 373,147 |
| 303,787 |
|
| Provision for loan losses | 44,955 |
| 93,104 |
| 179,909 |
| 193,000 |
| 60,516 |
|
| Other income | 6,698 |
| (14,117 | ) | 39,955 |
| 2,655 |
| (60,212 | ) |
| Other expense | 142,854 |
| 136,059 |
| 131,480 |
| 107,060 |
| 87,220 |
|
| Income before income taxes | 215,911 |
| 173,659 |
| 123,025 |
| 75,742 |
| 95,839 |
|
| Income taxes | 77,728 |
| 62,518 |
| 4,372 |
| 27,570 |
| 33,507 |
|
| Net income | $ | 138,183 |
| $ | 111,141 |
| $ | 118,653 |
| $ | 48,172 |
| $ | 62,332 |
|
| Preferred dividends accrued | — |
| — |
| — |
| 7,488 |
| — |
|
| Net income available to common shareholders | $ | 138,183 |
| $ | 111,141 |
| $ | 118,653 |
| $ | 40,683 |
| $ | 62,332 |
|
| Per share data | | | | | |
| Basic earnings | $ | 1.29 |
| $ | 1.00 |
| $ | 1.06 |
| $ | 0.46 |
| $ | 0.71 |
|
| Diluted earnings | 1.29 |
| 1.00 |
| 1.05 |
| 0.46 |
| 0.71 |
|
| Cash dividends | 0.32 |
| 0.24 |
| 0.20 |
| 0.20 |
| 0.84 |
|
| | | | | | |
| September 30, | 2012 | 2011 | 2010 | 2009 | 2008 |
| Total assets | $ | 12,472,944 |
| $ | 13,440,749 |
| $ | 13,486,379 |
| $ | 12,582,475 |
| $ | 11,830,141 |
|
| Loans and mortgage-backed securities | 9,812,666 |
| 10,992,053 |
| 10,626,842 |
| 11,266,295 |
| 11,053,223 |
|
| Investment securities | 612,524 |
| 246,004 |
| 358,061 |
| 21,259 |
| 49,001 |
|
| Cash and cash equivalents | 751,430 |
| 816,002 |
| 888,622 |
| 498,388 |
| 82,600 |
|
| Customer accounts | 8,576,618 |
| 8,665,903 |
| 8,852,540 |
| 7,842,310 |
| 7,169,539 |
|
| FHLB advances | 1,880,000 |
| 1,962,066 |
| 1,865,548 |
| 2,078,930 |
| 1,998,308 |
|
| Other borrowings | — |
| 800,000 |
| 800,000 |
| 800,600 |
| 1,177,600 |
|
| Stockholders’ equity | 1,899,752 |
| 1,906,533 |
| 1,841,147 |
| 1,745,485 |
| 1,332,674 |
|
| Number of | | | | | |
| Customer accounts | 308,282 |
| 309,532 |
| 327,430 |
| 305,129 |
| 298,926 |
|
| Loans | 37,522 |
| 39,986 |
| 42,540 |
| 44,453 |
| 47,331 |
|
| Offices | 166 |
| 160 |
| 160 |
| 150 |
| 148 |
|
WASHINGTON FEDERAL, INC. AND SUBSIDIARIES
CONSOLIDATED STATEMENTS OF FINANCIAL CONDITION
|
| | | | | | | |
| September 30, | 2012 | | 2011 |
| | (In thousands, except share data) |
| ASSETS | | | |
| Cash and cash equivalents | $ | 751,430 |
| | $ | 816,002 |
|
| Available-for-sale securities, including encumbered securities of $0 and $965,927, at fair value | 1,781,705 |
| | 3,255,144 |
|
| Held-to-maturity securities, including encumbered securities of $0 and $45,086, at amortized cost | 1,191,487 |
| | 47,036 |
|
| Loans receivable, net | 7,451,998 |
| | 7,935,877 |
|
| Covered loans, net | 288,376 |
| | 382,183 |
|
| Interest receivable | 46,857 |
| | 52,332 |
|
| Premises and equipment, net | 178,845 |
| | 166,593 |
|
| Real estate held for sale | 99,478 |
| | 159,829 |
|
| Covered real estate held for sale | 29,549 |
| | 56,383 |
|
| FDIC indemnification asset | 87,571 |
| | 101,634 |
|
| FHLB stock | 149,840 |
| | 151,755 |
|
| Intangible assets, including goodwill of $251,653 | 256,076 |
| | 256,271 |
|
| Federal and state income taxes, net | 22,513 |
| | — |
|
| Other assets | 137,219 |
| | 59,710 |
|
| | $ | 12,472,944 |
| | $ | 13,440,749 |
|
| LIABILITIES AND STOCKHOLDERS’ EQUITY | | | |
| Liabilities | | | |
| Customer accounts | | | |
| Transaction deposit accounts | $ | 2,946,453 |
| | $ | 2,662,188 |
|
| Time deposit accounts | 5,630,165 |
| | 6,003,715 |
|
| | 8,576,618 |
| | 8,665,903 |
|
| FHLB advances | 1,880,000 |
| | 1,962,066 |
|
| Other borrowings | — |
| | 800,000 |
|
| Advance payments by borrowers for taxes and insurance | 40,041 |
| | 39,548 |
|
| Federal and State income taxes, including net deferred assets (liabilities) of $8,449 and $(17,075) | — |
| | 1,535 |
|
| Accrued expenses and other liabilities | 76,533 |
| | 65,164 |
|
| | 10,573,192 |
| | 11,534,216 |
|
| Stockholders’ equity | | | |
Common stock, $1.00 par value, 300,000,000 shares authorized;
129,950,223 and 129,853,534 shares issued; 106,177,615 and 108,976,410 shares outstanding | 129,950 |
| | 129,854 |
|
| Paid-in capital | 1,586,295 |
| | 1,582,843 |
|
| Accumulated other comprehensive income, net of taxes | 13,306 |
| | 85,789 |
|
| Treasury stock, at cost; 23,772,608 and 20,877,124 shares | (310,579 | ) | | (268,665 | ) |
| Retained earnings | 480,780 |
| | 376,712 |
|
| | 1,899,752 |
| | 1,906,533 |
|
| | $ | 12,472,944 |
| | $ | 13,440,749 |
|
SEE NOTES TO CONSOLIDATED FINANCIAL STATEMENTS
WASHINGTON FEDERAL, INC. AND SUBSIDIARIES
CONSOLIDATED STATEMENTS OF OPERATIONS
|
| | | | | | | | | |
| Year ended September 30, | 2012 | 2011 | 2010 |
| | (In thousands, except per share data) |
| INTEREST INCOME | | | |
| Loans | $ | 484,833 |
| $ | 522,230 |
| $ | 561,069 |
|
| Mortgage-backed securities | 96,142 |
| 108,207 |
| 91,775 |
|
| Investment securities and cash equivalents | 9,296 |
| 14,198 |
| 10,716 |
|
| | 590,271 |
| 644,635 |
| 663,560 |
|
| INTEREST EXPENSE | | | |
| Customer accounts | 86,939 |
| 115,835 |
| 146,360 |
|
| FHLB advances and other borrowings | 106,310 |
| 111,861 |
| 122,741 |
|
| | 193,249 |
| 227,696 |
| 269,101 |
|
| Net interest income | 397,022 |
| 416,939 |
| 394,459 |
|
| Provision for loan losses | 44,955 |
| 93,104 |
| 179,909 |
|
| Net interest income after provision for loan losses | 352,067 |
| 323,835 |
| 214,550 |
|
| OTHER INCOME | | | |
| Gain on FDIC-assisted transaction | — |
| — |
| 85,608 |
|
| Prepayment penalty on long-term debt | (95,565 | ) | — |
| (8,150 | ) |
| Gain on sale of investments | 95,234 |
| 8,147 |
| 22,409 |
|
| Other | 16,848 |
| 17,786 |
| 20,563 |
|
| | 16,517 |
| 25,933 |
| 120,430 |
|
| OTHER EXPENSE | | | |
| Compensation and benefits | 77,628 |
| 72,034 |
| 69,879 |
|
| Amortization of intangibles | 1,509 |
| 1,447 |
| 2,140 |
|
| Occupancy | 15,971 |
| 14,480 |
| 13,933 |
|
| FDIC insurance premiums | 16,093 |
| 20,582 |
| 18,626 |
|
| Other | 34,631 |
| 29,496 |
| 28,830 |
|
| Deferred loan origination costs | (2,978 | ) | (1,980 | ) | (1,928 | ) |
| | 142,854 |
| 136,059 |
| 131,480 |
|
| Loss on real estate acquired through foreclosure, net | (9,819 | ) | (40,050 | ) | (80,475 | ) |
| Income before income taxes | 215,911 |
| 173,659 |
| 123,025 |
|
| Income taxes | | | |
| Current | 61,138 |
| 88,373 |
| (19,890 | ) |
| Deferred | 16,590 |
| (25,855 | ) | 24,262 |
|
| | 77,728 |
| 62,518 |
| 4,372 |
|
| NET INCOME | 138,183 |
| 111,141 |
| 118,653 |
|
| Preferred dividends accrued | — |
| — |
| — |
|
| Net income available to common shareholders | $ | 138,183 |
| $ | 111,141 |
| $ | 118,653 |
|
| | | | |
| PER SHARE DATA | | | |
| Basic earnings | $ | 1.29 |
| $ | 1.00 |
| $ | 1.06 |
|
| Diluted earnings | 1.29 |
| 1.00 |
| 1.05 |
|
| Cash dividends per share | 0.32 |
| 0.24 |
| 0.20 |
|
| Basic weighted average number of shares outstanding | 107,108,703 |
| 111,383,877 |
| 112,438,059 |
|
| Diluted weighted average number of shares outstanding, including dilutive stock options | 107,149,240 |
| 111,460,106 |
| 112,745,261 |
|
SEE NOTES TO CONSOLIDATED FINANCIAL STATEMENTS
WASHINGTON FEDERAL, INC. AND SUBSIDIARIES
CONSOLIDATED STATEMENTS OF COMPREHENSIVE INCOME
|
| | | | | | | | | | | |
| | 2012 | | 2011 | | 2010 |
| | (In thousands) |
| | | | | | |
| Net income | $ | 138,183 |
| | $ | 111,141 |
| | $ | 118,653 |
|
| Other comprehensive income (loss) net of tax: | | | | | |
| Net unrealized gains (losses) on available-for-sale securities | (209,832 | ) | | 48,939 |
| | (29,918 | ) |
| Related tax benefit (expense) | 77,113 |
| | (17,985 | ) | | 10,995 |
|
| Reclassification adjustment of net gains from sale | | | | | |
| of available-for-sale securities included in net income | 95,234 |
| | 8,147 |
| | 17,009 |
|
| Related tax benefit (expense) | (34,998 | ) | | (2,994 | ) | | (2,835 | ) |
| Other comprehensive income (loss) | (72,483 | ) | | 36,107 |
| | (4,749 | ) |
| Comprehensive income | $ | 65,700 |
| | $ | 147,248 |
| | $ | 113,904 |
|
SEE NOTES TO CONSOLIDATED FINANCIAL STATEMENTS
WASHINGTON FEDERAL, INC. AND SUBSIDIARIES
CONSOLIDATED STATEMENTS OF STOCKHOLDERS' EQUITY
|
| | | | | | | | | | | | | | | | | | |
| | Common
Stock | Paid-in
Capital | Retained
Earnings | Accumulated
Other
Comprehensive
Income (loss) | Treasury
Stock | Total |
| | (In thousands) |
| Balance at September 30, 2009 | $ | 129,320 |
| $ | 1,574,555 |
| $ | 196,164 |
| $ | 54,431 |
| $ | (208,985 | ) | $ | 1,745,485 |
|
| | | | | | | |
| Net income | | | 118,653 |
| | | 118,653 |
|
| Other comprehensive income adjustment | | | | (4,749 | ) | | (4,749 | ) |
| Dividends paid on common stock | | | (22,450 | ) | | | (22,450 | ) |
| Compensation expense related to common stock options | | 1,213 |
| | | | 1,213 |
|
| Proceeds from exercise of common stock options | 145 |
| 1,614 |
| | | | 1,759 |
|
| Tax benefit related to exercise of stock options | | 181 |
| | | | 181 |
|
| Restricted stock | 91 |
| 964 |
| | | | 1,055 |
|
| Treasury stock | | | | | | — |
|
| Balance at September 30, 2010 | $ | 129,556 |
| $ | 1,578,527 |
| $ | 292,367 |
| $ | 49,682 |
| $ | (208,985 | ) | $ | 1,841,147 |
|
| | | | | | | |
| Net income | | | 111,141 |
| | | 111,141 |
|
| Other comprehensive income adjustment | | | | 36,107 |
| | 36,107 |
|
| Dividends paid on common stock | | | (26,796 | ) | | | (26,796 | ) |
| Compensation expense related to common stock options | | 1,087 |
| | | | 1,087 |
|
| Proceeds from exercise of common stock options | 104 |
| 1,527 |
| | | | 1,631 |
|
| Tax benefit related to exercise of stock options | | 55 |
| | | | 55 |
|
| Restricted stock | 194 |
| 1,647 |
| | | | 1,841 |
|
| Treasury stock | | | | | (59,680 | ) | (59,680 | ) |
| Balance at September 30, 2011 | $ | 129,854 |
| $ | 1,582,843 |
| $ | 376,712 |
| $ | 85,789 |
| $ | (268,665 | ) | $ | 1,906,533 |
|
| | | | | | | |
| Net income | | | 138,183 |
| | | 138,183 |
|
| Other comprehensive income adjustment | | | | (72,483 | ) | | (72,483 | ) |
| Dividends paid on common stock | | | (34,115 | ) | | | (34,115 | ) |
| Compensation expense related to common stock options | | 848 |
| | | | 848 |
|
| Proceeds from exercise of common stock options | 29 |
| 328 |
| | | | 357 |
|
| Tax benefit related to exercise of stock options | | — |
| | | | — |
|
| Restricted stock | 67 |
| 2,276 |
| | | | 2,343 |
|
| Treasury stock | | | | | (41,914 | ) | (41,914 | ) |
| Balance at September 30, 2012 | $ | 129,950 |
| $ | 1,586,295 |
| $ | 480,780 |
| $ | 13,306 |
| $ | (310,579 | ) | $ | 1,899,752 |
|
SEE NOTES TO CONSOLIDATED FINANCIAL STATEMENTS
WASHINGTON FEDERAL, INC. AND SUBSIDIARIES
CONSOLIDATED STATEMENTS OF CASH FLOWS
|
| | | | | | | | | | | |
| Year ended September 30, | 2012 | | 2011 | | 2010 |
| | (In thousands) |
| CASH FLOWS FROM OPERATING ACTIVITIES | | | |
| Net income | $ | 138,183 |
| | $ | 111,141 |
| | $ | 118,653 |
|
| Adjustments to reconcile net income to net cash provided by operating activities: | | | | | |
| Amortization (accretion) of fees, discounts, premiums and intangible assets, net | 31,046 |
| | 20,663 |
| | 21,624 |
|
| Cash received from FDIC under loss share | 3,456 |
| | 32,828 |
| | 92,551 |
|
| Depreciation | 7,587 |
| | 6,667 |
| | 5,766 |
|
| Stock option compensation expense | 848 |
| | 1,087 |
| | 1,213 |
|
| Provision for loan losses | 44,955 |
| | 93,104 |
| | 179,909 |
|
| (Gain) loss on investment securities and real estate held for sale, net | (100,952 | ) | | 23,315 |
| | 58,066 |
|
| Loss on extinguishment of debt | 95,565 |
| | — |
| | — |
|
| Gain on FDIC-assisted transaction | — |
| | — |
| | (85,608 | ) |
| Decrease (increase) in accrued interest receivable | 5,726 |
| | (3,312 | ) | | 7,999 |
|
| Increase in FDIC loss share receivable | (3,284 | ) | | (10,470 | ) | | — |
|
| Increase (decrease) in income taxes payable | 18,066 |
| | (11,351 | ) | | (23,408 | ) |
| Decrease (increase) in other assets | (74,889 | ) | | 21,600 |
| | (51,641 | ) |
| Increase (decrease) in accrued expenses and other liabilities | 8,649 |
| | (23,575 | ) | | (74,243 | ) |
| Net cash provided by operating activities | 174,956 |
| | 261,697 |
| | 250,881 |
|
| CASH FLOWS FROM INVESTING ACTIVITIES | | | | | |
| Net principal collections (loan originations) | 544,240 |
| | 400,054 |
| | 281,826 |
|
| FHLB stock redeemed | 1,830 |
| | — |
| | — |
|
| Available-for-sale securities purchased | (2,442,184 | ) | | (1,585,945 | ) | | (1,774,343 | ) |
| Principal payments and maturities of available-for-sale securities | 1,608,603 |
| | 727,379 |
| | 1,052,545 |
|
| Available-for-sale securities sold | 2,257,913 |
| | 131,361 |
| | 496,024 |
|
| Held-to-maturity securities purchased | (1,167,121 | ) | | — |
| | — |
|
| Principal payments and maturities of held-to-maturity securities | 23,082 |
| | 33,874 |
| | 23,128 |
|
| Net cash received from acquisition | 50,576 |
| | — |
| | 111,684 |
|
| Proceeds from sales of real estate held for sale | 175,832 |
| | 110,400 |
| | 129,447 |
|
| Covered REO purchased | 33,579 |
| | 29,383 |
| | — |
|
| Increase in intangible assets | (1,061 | ) | | — |
| | — |
|
| Premises and equipment purchased and REO improvements | (30,949 | ) | | (10,539 | ) | | (13,027 | ) |
| Net cash provided (used) by investing activities | 1,054,340 |
| | (164,033 | ) | | 307,284 |
|
| CASH FLOWS FROM FINANCING ACTIVITIES | | | | | |
| Net increase (decrease) in customer accounts | (225,068 | ) | | (186,637 | ) | | 190,702 |
|
| Proceeds from long-term borrowings | — |
| | 200,000 |
| | 200,000 |
|
| Repayments of long-term borrowings | (995,306 | ) | | (100,000 | ) | | (539,034 | ) |
| Proceeds from exercise of common stock options and related tax benefit | 357 |
| | 1,686 |
| | 1,940 |
|
| Dividends paid on common stock | (32,430 | ) | | (25,697 | ) | | (22,450 | ) |
| Treasury stock purchased, net | (41,914 | ) | | (59,680 | ) | | — |
|
| Decrease in advance payments by borrowers for taxes and insurance | 493 |
| | 44 |
| | 911 |
|
| Net cash used by financing activities | (1,293,868 | ) | | (170,284 | ) | | (167,931 | ) |
| Increase (decrease) in cash and cash equivalents | (64,572 | ) | | (72,620 | ) | | 390,234 |
|
| Cash and cash equivalents at beginning of period | 816,002 |
| | 888,622 |
| | 498,388 |
|
| Cash and cash equivalents at end of period | $ | 751,430 |
| | $ | 816,002 |
| | $ | 888,622 |
|
SEE NOTES TO CONSOLIDATED FINANCIAL STATEMENTS
WASHINGTON FEDERAL, INC. AND SUBSIDIARIES
CONSOLIDATED STATEMENTS OF CASH FLOWS (CONTINUED)
|
| | | | | | | | | | | |
| Year ended September 30, | 2012 | | 2011 | | 2010 |
| | (In thousands) |
| SUPPLEMENTAL DISCLOSURES OF CASH FLOW INFORMATION | | | | | |
| Non-cash investing activities | | | | | |
| Non-covered real estate acquired through foreclosure | $ | 160,971 |
| | $ | 112,693 |
| | $ | 222,057 |
|
| Covered real estate acquired through foreclosure | 15,905 |
| | 54,638 |
| | 34,536 |
|
| Cash paid during the period for | | | | | |
| Interest | 199,735 |
| | 228,444 |
| | 269,478 |
|
| Income taxes | 59,596 |
| | 73,798 |
| | 27,503 |
|
| The following summarizes the non-cash activities related to acquisitions | | | | | |
| Fair value of assets and intangibles acquired, including goodwill | 124,594 |
| | — |
| | 1,091,629 |
|
| Fair value of liabilities assumed | (154,493 | ) | | — |
| | (1,047,981 | ) |
| Net fair value of assets (liabilities) | $ | (29,899 | ) | | $ | — |
| | $ | 43,648 |
|
SEE NOTES TO CONSOLIDATED FINANCIAL STATEMENTS
WASHINGTON FEDERAL, INC. AND SUBSIDIARIES
NOTES TO THE CONSOLIDATED FINANCIAL STATEMENTS
YEARS ENDED SEPTEMBER 30, 2012, 2011 AND 2010
NOTE A Summary of Significant Accounting Policies
SUMMARY OF SIGNIFICANT ACCOUNTING POLICIES
Principles of consolidation. The consolidated financial statements include the accounts of Washington Federal, Inc. (Company or Washington Federal) and its wholly owned subsidiaries. Intercompany transactions and balances have been eliminated.
Description of business. Washington Federal is a unitary thrift holding company. The Company's principal operating subsidiary is Washington Federal (Bank). The Bank is principally engaged in the business of attracting deposits from the general public and investing these funds, together with borrowings and other funds, in one-to-four family residential real estate loans, multi-family real estate loans and commercial loans. The Bank conducts its activities through a network of 166 offices located in Washington, Oregon, Idaho, Utah, Arizona, Nevada, New Mexico, and Texas.
The Company's fiscal year end is September 30th. All references to 2012, 2011 and 2010 represent balances as of September 30, 2012, September 30, 2011 and September 30, 2010, or activity for the fiscal years then ended. References to net income in this document refer to net income available to common shareholders.
Acquisitions. Western National Bank. Effective December 16, 2011, Washington Federal, acquired certain assets and liabilities, including most of the loans and deposits, of Western National Bank, headquartered in Phoenix, Arizona (“WNB”) from the Federal Deposit Insurance Corporation (“FDIC”) in an FDIC-assisted transaction. Under the terms of the Purchase and Assumption Agreement, the Company and the FDIC agreed to a discount of $53 million on net assets and no loss sharing provision or premium on deposits. WNB operated three full-service offices in Arizona. The Company acquired certain assets with a book value of $177 million, including $143 million in loans and $7 million in foreclosed real estate, and selected liabilities with a book value of $153 million, including $136 million in deposits. Pursuant to the purchase and assumption agreement with the FDIC, the Company received a cash payment from the FDIC for $30 million. The operating results of the Company include the operating results produced by the acquired assets and assumed liabilities for the period December 16, 2011 to September 30, 2012.
Charter Bank. Effective October 14, 2011, the Company acquired six branch locations, four in Albuquerque, New Mexico, and two in Santa Fe, New Mexico, from Charter Bank. $254,821,000 of deposits were acquired for a premium of $1,061,000.
Horizon Bank. Effective January 8, 2010, the Bank acquired certain assets and liabilities, including most of the loans and deposits, of Horizon Bank, headquartered in Bellingham, Washington (“Horizon”) from the Federal Deposit Insurance Corporation (“FDIC”), as receiver for Horizon. The Bank acquired certain assets with a book value of $1.19 billion, including $968 million in loans and $32 million in foreclosed real estate, and selected liabilities with a book value of one billion thirty million, including $820 million in deposits. The loans and foreclosed real estate purchased are covered by two loss share agreements between the FDIC and the Bank (one for single family loans and the other for all other loans and foreclosed real estate), which affords the Bank significant loss protection. Under the loss share agreements, the FDIC will cover 80% of covered loan and foreclosed real estate losses up to $536 million and 95% of losses in excess of that amount. The term for loss sharing on residential real estate loans is 10 years, while the term for loss sharing on non-residential real estate loans is 5 years with respect to losses and 8 years with respect to loss recoveries. The losses reimbursable by the FDIC are based on the book value of the relevant loan as determined by the FDIC at the date of the transaction. New loans made after that date are not covered by the loss share agreements. Loans that were classified as non-performing loans by Horizon are no longer classified as non-performing because, at acquisition, the carrying value of these loans was adjusted to reflect fair value and are covered under the FDIC loss sharing agreements. Management believes that the new book value reflects an amount that will ultimately be collected.
Cash and cash equivalents. Cash and cash equivalents include cash on hand, amounts due from banks, overnight investments and repurchase agreements with an initial maturity of three months or less.
Investments and mortgage-backed securities. The Company accounts for investments and mortgage-backed securities in two categories: held-to-maturity and available-for-sale.
Held-to-maturity securities - Securities classified as held-to-maturity are accounted for at amortized cost, but the Company must have both the positive intent and the ability to hold those securities to maturity. There are very limited circumstances
WASHINGTON FEDERAL, INC. AND SUBSIDIARIES
NOTES TO THE CONSOLIDATED FINANCIAL STATEMENTS
YEARS ENDED SEPTEMBER 30, 2012, 2011 AND 2010
under which securities in the held-to-maturity category can be sold without jeopardizing the cost basis of accounting for the remainder of the securities in this category.
Available-for-sale securities - Securities not classified as held-to-maturity are considered to be available-for-sale. Gains and losses realized on the sale of these securities are accounted for based on the specific identification method. Unrealized gains and losses for available-for-sale securities are excluded from earnings and reported as a net amount in the accumulated other comprehensive income component of stockholders' equity.
Management evaluates debt and equity securities for other than temporary impairment on a quarterly basis based on the securities' current credit quality, interest rates, term to maturity and management's intent and ability to hold the securities until the net book value is recovered. Any other than temporary declines in fair value are recognized in the statements of operations.
Premiums and discounts on investments are deferred and recognized over the life of the asset, using the effective interest method.
Realized gains and losses on securities sold as well as other than temporary impairment charges, are shown on the Consolidated Statements of Operations under the Other Income (Loss) heading.
Loans receivable - When a borrower fails to make a required payment on a loan, the Company attempts to cure the deficiency by contacting the borrower. Contact is made after a payment is 30 days past its grace period. In most cases, deficiencies are cured promptly. If the delinquency is not cured within 90 days, the Company may institute appropriate action to foreclose on the property. If foreclosed, the property is sold at a public sale and may be purchased by the Company.
The Company will consider modifying the interest rates and terms of a loan if it determines that a modification is a better alternative to foreclosure.
Loans are placed on nonaccrual status when, in the judgment of management, the probability of collection of interest is deemed to be insufficient to warrant further accrual. When a loan is placed on nonaccrual status, previously accrued but unpaid interest is deducted from interest income. The Company does not accrue interest on loans 90 days or more past due. If payment is made on a loan so that the loan becomes less than 90 days past due, and the Company expects full collection of principal and interest, the loan is returned to full accrual status. Any interest ultimately collected is credited to income in the period of recovery. A loan is charged-off when the loss is estimable and it is confirmed that the borrower will not be able to meet contractual obligations.
The Company maintains an allowance for loan losses to absorb losses inherent in the loan portfolio. The allowance is based on ongoing, quarterly assessments of the probable and estimable losses inherent in the loan portfolio. The Company's methodology for assessing the appropriateness of the allowance consists of two components, which include the general allowance and specific allowances.
The general loan loss allowance is established by applying a loss percentage factor to the different loan types. Management believes loan types are the most relevant factor to group loans for the allowance calculation as the risk characteristics in these groups are similar. The loss percentage factor is made up of two parts - the historical loss factor (“HLF”) and the qualitative loss factor (“QLF”). The HLF takes into account historical charge-offs, while the QLF is determined by loan type and allows management to augment reserve levels to reflect the current environment and portfolio performance trends including recent charge-off trends. Allowances are provided based on management's continuing evaluation of the pertinent factors underlying the quality of the loan portfolio, including changes in the size and composition of the loan portfolio, actual loan loss experience, current economic conditions, collateral values, geographic concentrations, seasoning of the loan portfolio, specific industry conditions, and the duration of the current business cycle. The recovery of the carrying value of loans is susceptible to future market conditions beyond the Company's control, which may result in losses or recoveries differing from those provided.
Specific allowances are established for loans which are individually evaluated, in cases where management has identified significant conditions or circumstances related to a loan that management believes indicate the probability that a loss has been incurred.
WASHINGTON FEDERAL, INC. AND SUBSIDIARIES
NOTES TO THE CONSOLIDATED FINANCIAL STATEMENTS
YEARS ENDED SEPTEMBER 30, 2012, 2011 AND 2010
Impaired loans consist of loans receivable that are not expected to have their principal and interest repaid in accordance with their contractual terms. Collateral dependent impaired loans are measured using the fair value of the collateral, less selling costs. Non-collateral dependent loans are measured at the present value of expected future cash flows.
The Company receives fees for originating loans in addition to various fees and charges related to existing loans, which may include prepayment charges, late charges and assumption fees. Deferred loan fees and costs are recognized over the life of the loans using the effective interest method.
Covered loans. Covered loans are the loans acquired from Horizon in 2010 and recorded at their estimated fair market value. Loans that were classified as non-performing loans by Horizon are no longer classified as non-performing because, at acquisition, the carrying value of these loans was adjusted to reflect fair value and are covered under the FDIC loss sharing agreements. Management believes that the new book value reflects an amount that will ultimately be collected.
Acquired credit impaired loans. Loans are accounted for under ASC 310-30 when there is evidence of credit deterioration since origination and for which it is probable, at acquisition, that the Company would be unable to collect all contractually required payments. Interest income, through accretion of the difference between the carrying amount of the loans and the expected cash flows, was recognized on all acquired loans.
Covered real estate held for sale. Covered real estate held for sale represents the foreclosed properties that were originally Horizon loans. Covered real estate held for sale is carried at the estimated fair market value of the repossessed real estate. The covered loans and covered real estate held for sale are collectively referred to as “covered assets”.
FDIC indemnification asset. FDIC indemnification asset is the receivable recorded from due to guarantee provided by the FDIC on the covered assets.
Premises and equipment. Premises and equipment are stated at cost, less accumulated depreciation. Depreciation is computed on the straight-line method over the estimated useful lives of the respective assets. Expenditures are capitalized for betterments and major renewals. Charges for ordinary maintenance and repairs are expensed to operations as incurred.
Real estate held for sale. Properties acquired in settlement of loans or acquired for development are recorded at the lower of cost or fair value less selling costs. Subsequent declines in valuation are recorded as additional expense in gain (loss) on real estate acquired through foreclosure line item.
Intangible assets. Goodwill represents the excess of the cost of businesses acquired over the fair value of the net assets acquired. The core deposit intangibles and non-compete agreement intangible are acquired assets that lack physical substance but can be distinguished from goodwill. Goodwill is evaluated for impairment on an annual basis. Other intangible assets are amortized over their estimated lives and are subject to impairment testing when events or circumstances change. If circumstances indicate that the carrying value of the assets may not be recoverable, an impairment charge could be recorded. No impairment of intangible assets has ever been identified. The Company amortizes the core deposit intangibles on a straight line basis over their estimated lives of between 5 and 8 years.
The balance of the Company's intangible assets was as follows, which includes the additional goodwill discussed above:
WASHINGTON FEDERAL, INC. AND SUBSIDIARIES
NOTES TO THE CONSOLIDATED FINANCIAL STATEMENTS
YEARS ENDED SEPTEMBER 30, 2012, 2011 AND 2010
|
| | | | | | | | | | | | | | | |
| | Goodwill | | Servicing Rights Intangible | | Core Deposit Intangible | | Total |
| | (In thousands) |
| | | | | | | | |
| Balance at September 30, 2010 | $ | 251,653 |
| | $ | 1,775 |
| | $ | 4,290 |
| | $ | 257,718 |
|
| Additions | — |
| | — |
| | — |
| | — |
|
| Amortization | — |
| | (529 | ) | | (918 | ) | | (1,447 | ) |
| Balance at September 30, 2011 | 251,653 |
| | 1,246 |
| | 3,372 |
| | 256,271 |
|
| Additions | — |
| | — |
| | 2,022 |
| | 2,022 |
|
| Amortization | — |
| | (960 | ) | | (1,257 | ) | | (2,217 | ) |
| Balance at September 30, 2012 | $ | 251,653 |
| | $ | 286 |
| | $ | 4,137 |
| | $ | 256,076 |
|
The table below presents the estimated core deposit intangible asset amortization expense for the next five years:
|
| | | | |
| Year End | | Expense |
| | | (In thousands) |
| 2013 | | $ | 1,314 |
|
| 2014 | | 1,314 |
|
| 2015 | | 1,014 |
|
| 2016 | | 396 |
|
| 2017 | | 99 |
|
Deferred fees and discounts on loans. Loan discounts and loan fees are deferred and recognized over the life of the loans using the effective interest method.
Accounting for stock-based compensation. The Company records an expense for the estimated fair value of equity awards over the vesting period. See Note L for additional information. Stock options that were not dilutive but were outstanding as of September 30, 2012, 2011 and 2010 were 934,880, 2,190,123 and 1,941,633, respectively.
Use of estimates. The preparation of financial statements in conformity with accounting principles generally accepted in the United States of America requires management to make estimates and assumptions that affect the reported amounts of assets and liabilities and disclosure of contingent assets and liabilities at the date of the financial statements and the reported amounts of revenues and expenses during the reporting period. Significant estimates reported in the financial statements include the allowance for loan losses, intangible assets, deferred taxes and contingent liabilities. Actual results could differ from these estimates.
New accounting pronouncements. In December 2011, the Financial Accounting Standards Board (“FASB”) issued Accounting Standards Update ("ASU") 2011-11, Balance Sheet (Topic 210) – Disclosures about Offsetting Assets and Liabilities. The amendments in this ASU will enhance disclosures required by U.S. GAAP by requiring improved information about financial instruments and derivative instruments that are either (1) offset in accordance with current U.S. GAAP or (2) subject to an enforceable master netting arrangement or similar agreement, irrespective of whether they are offset in accordance with current U.S. GAAP. The guidance in this ASU is effective for the first interim or annual period beginning on or after January 1, 2013 and should be applied retrospectively. This new guidance is not expected to have a material impact on the Company's consolidated financial statements.
In December 2011, the FASB issued ASU 2011-12, Comprehensive Income (Topic 220) – Deferral of the Effective Date for Amendments to the Presentation of Reclassifications of Items Out of Accumulated Other Comprehensive Income in Accounting Standards Update No. 2011-05. Under the amendments in ASU 2011-05, entities are required to present reclassification adjustments and the effect of those reclassification adjustments on the face of the financial statements where net income is presented, by component of net income, and on the face of the financial statements where other comprehensive
WASHINGTON FEDERAL, INC. AND SUBSIDIARIES
NOTES TO THE CONSOLIDATED FINANCIAL STATEMENTS
YEARS ENDED SEPTEMBER 30, 2012, 2011 AND 2010
income is presented, by component of other comprehensive income. In addition, the amendments in ASU 2011-05 require that reclassification adjustments be presented in interim financial periods. The amendments in ASU 2011-12 supersede and defer changes to those paragraphs in ASU 2011-05 that pertain to how, when and where reclassification adjustments are presented while the FASB redeliberates the presentation of reclassification adjustments. All other requirements of ASU 2011-05 are not affected by ASU 2011-12. The Company adopted this ASU and the guidance had no impact on the Company's financial condition and results of operations.
In July 2012, the FASB issued ASU 2012-02, Intangibles - Goodwill and Other (Topic 350) – Testing Indefinite-Lived Intangible Assets for Impairment. The objective of this ASU is to reduce the cost and complexity of performing an impairment test for indefinite-lived intangible assets by simplifying how an entity tests those assets for impairment and to improve consistency in impairment testing guidance among long-lived asset categories. This ASU permits an entity first to assess qualitative factors to determine whether it is more likely than not that an indefinite-lived intangible asset is impaired as a basis for determining whether it is necessary to perform the quantitative impairment test in accordance with Subtopic 350-30, Intangibles - Goodwill and Other - General Intangibles Other than Goodwill. The more-likely-than-not threshold is defined as having a likelihood of more than 50 percent. Previous guidance in Subtopic 350-30 required an entity to test indefinite-lived intangible assets for impairment, on at least an annual basis, by comparing the fair value of the asset with its carrying amount. If the fair value of the asset is less than its carrying amount, an entity should recognize an impairment loss in the amount of the difference. In accordance with the amendments in this ASU, an entity will have an option not to calculate annually the fair value of an indefinite-lived intangible asset if the entity determines that it is not more likely than not that the asset is impaired. Permitting an entity to assess qualitative factors when testing indefinite-lived intangible assets for impairment results in guidance that is similar to the goodwill impairment testing guidance in Update 2011-08. The Company early adopted this ASU and the guidance had no impact on the Company's financial condition and results of operations.
In October 2012, the FASB issued ASU 2012-06, Business Combinations. This ASU addresses the diversity in practice about how to interpret the terms on the same basis and contractual limitations when subsequently measuring an indemnification asset recognized in a government-assisted (Federal Deposit Insurance Corporation or National Credit Union Administration) acquisition of a financial institution that includes a loss-sharing agreement. The guidance in this ASU is effective for the first interim or annual period beginning on or after December 15, 2012 and should be applied prospectively. The Company is evaluating the impact this ASU will have on its consolidated financial condition and results of operations.
Business segments. As the Company manages its business and operations on a consolidated basis, management has determined that there is one reportable business segment.
Reclassifications. Certain reclassifications have been made to the financial statements for years prior to September 30, 2012 to conform to current year classifications.
WASHINGTON FEDERAL, INC. AND SUBSIDIARIES
NOTES TO THE CONSOLIDATED FINANCIAL STATEMENTS
YEARS ENDED SEPTEMBER 30, 2012, 2011 AND 2010
NOTE B INVESTMENT SECURITIES
|
| | | | | | | | | | | | | | | | | | |
| September 30, | 2012 |
| | Amortized Cost | | Gross Unrealized | | Fair Value | | Yield |
| Gains | | Losses | |
| | (In thousands) |
| Available-for-sale securities | | | | | | | | | |
| U.S. government and agency securities due | | | | | | | | | |
| Within 1 year | $ | 19,999 |
| | $ | 42 |
| | $ | (6 | ) | | $ | 20,035 |
| | 0.57 | % |
| 1 to 5 years | — |
| | — |
| | — |
| | — |
| | — |
|
| 5 to 10 years | 59,300 |
| | 4,225 |
| | — |
| | 63,525 |
| | 2.21 | % |
| Over 10 years | 100,000 |
| | — |
| | — |
| | 100,000 |
| | 1.05 | % |
| Corporate bonds due |
| |
| |
| |
| |
|
| 1 to 5 years | 336,340 |
| | 2,810 |
| | (61 | ) | | 339,089 |
| | 0.91 | % |
| 5 to 10 years | 62,919 |
| | 1,324 |
| | (7 | ) | | 64,236 |
| | 2.73 | % |
| Municipal bonds due |
| |
| |
| |
| |
|
| Over 10 years | 20,442 |
| | 4,402 |
| | — |
| | 24,844 |
| | 6.45 | % |
| Mortgage-backed securities |
| |
| |
| |
| |
|
| Agency pass-through certificates | 1,161,668 |
| | 9,358 |
| | (1,050 | ) | | 1,169,976 |
| | 2.28 | % |
| | 1,760,668 |
| | 22,161 |
| | (1,124 | ) | | 1,781,705 |
| | 1.99 | % |
| Held-to-maturity securities | | | | | | | | | |
| Tax-exempt municipal bonds due | | | | | | | | | |
| Within 1 year | 795 |
| | 7 |
| | — |
| | 802 |
| | 5.80 | % |
| 1 to 5 years | — |
| | — |
| | — |
| | — |
| | — | % |
| 5 to 10 years | — |
| | — |
| | — |
| | — |
| | — | % |
| Over 10 years | — |
| | — |
| | — |
| | — |
| | — | % |
| U.S. government and agency securities due |
| |
| |
| |
| |
|
| 1 to 5 years | — |
| | — |
| | — |
| | — |
| | — | % |
| Mortgage-backed securities |
| |
| |
| |
| |
|
| Agency pass-through certificates | 1,190,692 |
| | 25,729 |
| | — |
| | 1,216,421 |
| | 3.10 | % |
| | 1,191,487 |
| | 25,736 |
| | — |
| | 1,217,223 |
| | 3.10 | % |
| | $ | 2,952,155 |
| | $ | 47,897 |
| | $ | (1,124 | ) | | $ | 2,998,928 |
| | 2.44 | % |
| | | | | | | | | | |
WASHINGTON FEDERAL, INC. AND SUBSIDIARIES
NOTES TO THE CONSOLIDATED FINANCIAL STATEMENTS
YEARS ENDED SEPTEMBER 30, 2012, 2011 AND 2010
|
| | | | | | | | | | | | | | | | | | |
| September 30, | 2011 |
| | Amortized Cost | | Gross Unrealized | | Fair Value | | Yield |
| | Gains | | Losses | |
| | (In thousands) |
| Available-for-sale securities | | | | | | | | | |
| U.S. government and agency securities due | | | | | | | | | |
| Within 1 year | $ | 500 |
| | $ | 34 |
| | $ | — |
| | $ | 534 |
| | 4.00 | % |
| 1 to 5 years | — |
| | — |
| | — |
| | — |
| | — | % |
| 5 to 10 years | 9,300 |
| | 4,547 |
| | — |
| | 13,847 |
| | 10.38 | % |
| Over 10 years | 175,515 |
| | 631 |
| | — |
| | 176,146 |
| | 2.57 | % |
| Corporate bonds due |
| |
| |
| |
| |
|
| 1 to 5 years |
|
| |
|
| |
|
| |
|
| |
|
|
| 5 to 10 years | 30,000 |
| | 284 |
| | (325 | ) | | 29,959 |
| | 4.00 | % |
| Municipal bonds due |
| |
| |
| |
| |
|
| Over 10 years | 20,461 |
| | 3,107 |
| | — |
| | 23,568 |
| | 6.45 | % |
| Mortgage-backed securities |
| |
| |
| |
| |
|
| Agency pass-through certificates | 2,883,734 |
| | 127,356 |
| | — |
| | 3,011,090 |
| | 4.72 | % |
| | 3,119,510 |
| | 135,959 |
| | (325 | ) | | 3,255,144 |
| | 4.62 | % |
| Held-to-maturity securities | | | | | | | | | |
| Tax-exempt municipal bonds due | | | | | | | | | |
| Within 1 year |
|
| |
|
| |
|
| |
|
| | — | % |
| 1 to 5 years | 405 |
| | 5 |
| | — |
| | 410 |
| | 6.52 | % |
| 5 to 10 years | 1,545 |
| | 68 |
| | — |
| | 1,613 |
| | 5.60 | % |
| Over 10 years | — |
| | — |
| | — |
| | — |
| | — | % |
| U.S. government and agency securities due |
| |
| |
| |
| |
|
| 1 to 5 years | — |
| | — |
| | — |
| | — |
| | — | % |
| Mortgage-backed securities |
| |
| |
| |
| |
|
| Agency pass-through certificates | 45,086 |
| | 3,507 |
| | — |
| | 48,593 |
| | 5.31 | % |
| | 47,036 |
| | 3,580 |
| | — |
| | 50,616 |
| | 5.33 | % |
| | $ | 3,166,546 |
| | $ | 139,539 |
| | $ | (325 | ) | | $ | 3,305,760 |
| | 4.63 | % |
$2,257,913,000 of available-for-sale securities were sold in 2012, resulting in a gain of $95,234,000. $131,361,000 of available-for-sale securities were sold in 2011, resulting in a net gain of $8,147,000. $496,024,000 of available-for-sale securities were sold in 2010, resulting in a net gain of $22,409,000.
Substantially all mortgage-backed securities have contractual due dates that exceed twenty-five years.
The following table shows the unrealized gross losses and fair value of securities at September 30, 2012, by length of time that individual securities in each category have been in a continuous loss position. The Company had $10.0 million securities in a continuous loss position for 12 or more months at September 30, 2012, which consisted of mortgage-backed securities. Management believes that the declines in fair value of these investments are not an other than temporary impairment.
WASHINGTON FEDERAL, INC. AND SUBSIDIARIES
NOTES TO THE CONSOLIDATED FINANCIAL STATEMENTS
YEARS ENDED SEPTEMBER 30, 2012, 2011 AND 2010
|
| | | | | | | | | | | | | | | | | | |
| As of September 30, | 2012 |
| Less than 12 months | 12 months or more | Total |
| Unrealized Gross Losses | Fair Value | Unrealized Gross Losses | Fair Value | Unrealized Gross Losses | Fair Value |
| | (In thousands) |
| Corporate Bonds | $ | (61 | ) | $ | 14,939 |
| $ | (7 | ) | $ | 9,994 |
| $ | (68 | ) | $ | 24,933 |
|
| U.S. agency securities | (6 | ) | 19,493 |
| — |
| — |
| (6 | ) | 19,493 |
|
| Agency pass-through certificates | (1,050 | ) | 201,749 |
| — |
| — |
| (1,050 | ) | 201,749 |
|
| | $ | (1,117 | ) | $ | 236,181 |
| $ | (7 | ) | $ | 9,994 |
| $ | (1,124 | ) | $ | 246,175 |
|
NOTE C Loans Receivable (excluding Covered Loans)
WASHINGTON FEDERAL, INC. AND SUBSIDIARIES
NOTES TO THE CONSOLIDATED FINANCIAL STATEMENTS
YEARS ENDED SEPTEMBER 30, 2012, 2011 AND 2010
|
| | | | | | | | | | | | | |
| | September 30, 2012 | | September 30, 2011 |
| | (In thousands) | | | | (In thousands) | | |
| Non-acquired loans | | | | | | | |
| Single-family residential | $ | 5,778,922 |
| | 73.5 | % | | $ | 6,218,878 |
| | 74.9 | % |
| Construction - speculative | 129,637 |
| | 1.6 |
| | 140,459 |
| | 1.7 |
|
| Construction - custom | 211,690 |
| | 2.7 |
| | 279,851 |
| | 3.4 |
|
| Land - acquisition & development | 124,677 |
| | 1.6 |
| | 200,692 |
| | 2.4 |
|
| Land - consumer lot loans | 141,844 |
| | 1.8 |
| | 163,146 |
| | 2.0 |
|
| Multi-family | 710,140 |
| | 9.0 |
| | 700,673 |
| | 8.4 |
|
| Commercial real estate | 319,210 |
| | 4.1 |
| | 303,442 |
| | 3.7 |
|
| Commercial & industrial | 162,823 |
| | 2.1 |
| | 109,332 |
| | 1.3 |
|
| HELOC | 112,902 |
| | 1.4 |
| | 115,092 |
| | 1.4 |
|
| Consumer | 63,374 |
| | 0.8 |
| | 67,509 |
| | 0.8 |
|
| Total non-acquired loans | 7,755,219 |
| | 98.6 |
| | 8,299,074 |
| | 100 |
|
| Credit-impaired acquired loans | | | | | | | |
| Single-family residential | 342 |
| | — |
| | — |
| | — |
|
| Construction - speculative | 1,889 |
| | — |
| | — |
| | — |
|
| Construction - custom | — |
| | — |
| | — |
| | — |
|
| Land - acquisition & development | 3,702 |
| | 0.1 |
| | — |
| | — |
|
| Land - consumer lot loans | — |
| | — |
| | — |
| | — |
|
| Multi-family | 601 |
| | — |
| | — |
| | — |
|
| Commercial real estate | 87,154 |
| | 1.1 |
| | — |
| | — |
|
| Commercial & industrial | 3,292 |
| | — |
| | — |
| | — |
|
| HELOC | 14,040 |
| | 0.2 |
| | — |
| | — |
|
| Consumer | 97 |
| | — |
| | — |
| | — |
|
| Total credit-impaired acquired loans | 111,117 |
| | 1.4 |
| | — |
| | — |
|
| Total loans | | | | | | | |
| Single-family residential | 5,779,264 |
| | 73.5 |
| | 6,218,878 |
| | 74.9 |
|
| Construction - speculative | 131,526 |
| | 1.6 |
| | 140,459 |
| | 1.7 |
|
| Construction - custom | 211,690 |
| | 2.7 |
| | 279,851 |
| | 3.4 |
|
| Land - acquisition & development | 128,379 |
| | 1.7 |
| | 200,692 |
| | 2.4 |
|
| Land - consumer lot loans | 141,844 |
| | 1.8 |
| | 163,146 |
| | 2 |
|
| Multi-family | 710,741 |
| | 9.0 |
| | 700,673 |
| | 8.4 |
|
| Commercial real estate | 406,364 |
| | 5.2 |
| | 303,442 |
| | 3.7 |
|
| Commercial & industrial | 166,115 |
| | 2.1 |
| | 109,332 |
| | 1.3 |
|
| HELOC | 126,942 |
| | 1.6 |
| | 115,092 |
| | 1.4 |
|
| Consumer | 63,471 |
| | 0.8 |
| | 67,509 |
| | 0.8 |
|
| Total loans | 7,866,336 |
| | 100 | % | | 8,299,074 |
| | 100 | % |
| Less: | | | | | | | |
| Allowance for probable losses | 133,147 |
| | | | 157,160 |
| | |
| Loans in process | 213,286 |
| | | | 170,229 |
| | |
| Discount on acquired loans | 33,484 |
| | | | — |
| | |
| Deferred net origination fees | 34,421 |
| | | | 35,808 |
| | |
| | 414,338 |
| | | | 363,197 |
| | |
| | $ | 7,451,998 |
| | | | $ | 7,935,877 |
| | |
WASHINGTON FEDERAL, INC. AND SUBSIDIARIES
NOTES TO THE CONSOLIDATED FINANCIAL STATEMENTS
YEARS ENDED SEPTEMBER 30, 2012, 2011 AND 2010
The Company originates fixed and adjustable interest rate loans, which at September 30, 2012 consisted of the following:
|
| | | | | | | | |
| Fixed-Rate | | Adjustable-Rate |
| Term To Maturity | Book Value | | Term To Rate Adjustment | Book Value |
| | (In thousands) | | | (In thousands) |
| Within 1 year | $ | 259,208 |
| | Less than 1 year | $ | 164,682 |
|
| 1 to 3 years | 151,418 |
| | 1 to 3 years | 237,263 |
|
| 3 to 5 years | 197,642 |
| | 3 to 5 years | 155,987 |
|
| 5 to 10 years | 337,819 |
| | 5 to 10 years | 444,389 |
|
| 10 to 20 years | 943,963 |
| | 10 to 20 years | 54,017 |
|
| Over 20 years | 4,603,237 |
| | Over 20 years | 316,711 |
|
| | $ | 6,493,287 |
| | | $ | 1,373,049 |
|
Gross loans by geographic concentration were as follows:
|
| | | | | | | | | | | | | | | | | | | | | | | | | | | | | | | | | |
| September 30, 2012 | Single -
family
residential | Multi-
family | Land -
A & D | Land -
lot loans | Construction - custom | Construction - speculative | Commercial
real estate | Commercial
and industrial | Consumer | HELOC | Total |
| | (In thousands) |
| Washington | $ | 2,604,501 |
| $ | 237,687 |
| $ | 62,052 |
| $ | 71,576 |
| $ | 127,669 |
| $ | 78,446 |
| $ | 232,756 |
| $ | 78,026 |
| $ | 60,226 |
| $ | 71,271 |
| $ | 3,624,210 |
|
| Oregon | 907,462 |
| 289,289 |
| 12,401 |
| 28,023 |
| 34,983 |
| 19,014 |
| 5,849 |
| 10 |
| — |
| 7,555 |
| 1,304,586 |
|
| Other | 339,226 |
| 4,464 |
| — |
| 105 |
| — |
| — |
| 4,014 |
| 79,344 |
| 3,209 |
| 476 |
| 430,838 |
|
| Idaho | 401,987 |
| 24,517 |
| 4,982 |
| 13,800 |
| 4,975 |
| 11,242 |
| 610 |
| 86 |
| — |
| 4,748 |
| 466,947 |
|
| Arizona | 619,503 |
| 66,257 |
| 15,605 |
| 12,065 |
| 21,051 |
| 9,597 |
| 93,654 |
| 5,240 |
| — |
| 21,672 |
| 864,644 |
|
| Utah | 469,741 |
| 53,707 |
| 12,411 |
| 9,643 |
| 16,103 |
| 3,177 |
| 482 |
| 37 |
| — |
| 6,528 |
| 571,829 |
|
| New Mexico | 179,252 |
| 19,211 |
| 17,682 |
| 3,966 |
| 3,105 |
| 8,804 |
| 56,672 |
| 3,372 |
| 36 |
| 14,398 |
| 306,498 |
|
| Texas | 145,304 |
| 11,236 |
| 3,246 |
| 1,306 |
| 1,804 |
| 1,246 |
| 12,327 |
| — |
| — |
| — |
| 176,469 |
|
| Nevada | 112,288 |
| 4,373 |
| — |
| 1,360 |
| 2,000 |
| — |
| — |
| — |
| — |
| 294 |
| 120,315 |
|
| | $ | 5,779,264 |
| $ | 710,741 |
| $ | 128,379 |
| $ | 141,844 |
| $ | 211,690 |
| $ | 131,526 |
| $ | 406,364 |
| $ | 166,115 |
| $ | 63,471 |
| $ | 126,942 |
| $ | 7,866,336 |
|
|
| | | | | | | | | | | | | | | | | | | | | | |
PERCENTAGE BY GEOGRAPHIC AREA |
| September 30, 2012 | Single -
family
residential | Multi-
family | Land -
A & D | Land -
lot loans | Construction - custom | Construction - speculative | Commercial
real estate | Commercial
and industrial | Consumer | HELOC | Total |
| | As % of total gross loans |
| Washington | 33.2 | % | 3.0 | % | 0.7 | % | 0.8 | % | 1.7 | % | 1.2 | % | 2.9 | % | 1.0 | % | 0.8 | % | 0.8 | % | 46.1 | % |
| Oregon | 11.5 |
| 3.7 |
| 0.2 |
| 0.4 |
| 0.4 |
| 0.2 |
| 0.1 |
| — |
| — |
| 0.1 |
| 16.6 |
|
| Other | 4.3 |
| 0.1 |
| — |
| — |
| — |
| — |
| 0.1 |
| 1.0 |
| — |
| — |
| 5.5 |
|
| Idaho | 5.1 |
| 0.3 |
| 0.1 |
| 0.2 |
| 0.1 |
| 0.1 |
| — |
| — |
| — |
| 0.1 |
| 6.0 |
|
| Arizona | 7.9 |
| 0.8 |
| 0.2 |
| 0.2 |
| 0.3 |
| 0.1 |
| 1.2 |
| 0.1 |
| — |
| 0.3 |
| 11.1 |
|
| Utah | 6.0 |
| 0.7 |
| 0.2 |
| 0.1 |
| 0.2 |
| — |
| — |
| — |
| — |
| 0.1 |
| 7.3 |
|
| New Mexico | 2.3 |
| 0.2 |
| 0.2 |
| 0.1 |
| — |
| 0.1 |
| 0.7 |
| — |
| — |
| 0.2 |
| 3.8 |
|
| Texas | 1.8 |
| 0.1 |
| — |
| — |
| — |
| — |
| 0.2 |
| — |
| — |
| — |
| 2.1 |
|
| Nevada | 1.4 |
| 0.1 |
| — |
| — |
| — |
| — |
| — |
| — |
| — |
| — |
| 1.5 |
|
| | 73.5 | % | 9.0 | % | 1.6 | % | 1.8 | % | 2.7 | % | 1.7 | % | 5.2 | % | 2.1 | % | 0.8 | % | 1.6 | % | 100.0 | % |
WASHINGTON FEDERAL, INC. AND SUBSIDIARIES
NOTES TO THE CONSOLIDATED FINANCIAL STATEMENTS
YEARS ENDED SEPTEMBER 30, 2012, 2011 AND 2010
|
| | | | | | | | | | | | | | | | | | | | |
PERCENTAGE BY GEOGRAPHIC AREA AS A % OF EACH LOAN TYPE |
| September 30, 2012 | Single -
family
residential | Multi-
family | Land -
A & D | Land -
lot loans | Construction - custom | Construction - speculative | Commercial
real estate | Commercial
and industrial | Consumer | HELOC |
| As % of total gross loans |
| Washington | 45.1 | % | 33.5 | % | 48.2 | % | 50.4 | % | 60.3 | % | 59.7 | % | 57.4 | % | 46.9 | % | 94.8 | % | 56.2 | % |
| Oregon | 15.7 |
| 40.7 |
| 9.7 |
| 19.8 |
| 16.5 |
| 14.5 |
| 1.4 |
| — |
| — |
| 6.0 |
|
| Other | 5.9 |
| 0.6 |
| — |
| 0.1 |
| — |
| — |
| 1.0 |
| 47.8 |
| 5.1 |
| 0.4 |
|
| Idaho | 7.0 |
| 3.4 |
| 3.9 |
| 9.7 |
| 2.4 |
| 8.5 |
| 0.2 |
| 0.1 |
| — |
| 3.7 |
|
| Arizona | 10.7 |
| 9.3 |
| 12.2 |
| 8.5 |
| 9.9 |
| 7.3 |
| 23.0 |
| 3.2 |
| — |
| 17.1 |
|
| Utah | 8.1 |
| 7.6 |
| 9.7 |
| 6.8 |
| 7.6 |
| 2.4 |
| 0.1 |
| — |
| — |
| 5.1 |
|
| New Mexico | 3.1 |
| 2.7 |
| 13.8 |
| 2.8 |
| 1.5 |
| 6.7 |
| 13.9 |
| 2.0 |
| 0.1 |
| 11.3 |
|
| Texas | 2.5 |
| 1.6 |
| 2.5 |
| 0.9 |
| 0.9 |
| 0.9 |
| 3.0 |
| — |
| — |
| — |
|
| Nevada | 1.9 |
| 0.6 |
| — |
| 1.0 |
| 0.9 |
| — |
| — |
| — |
| — |
| 0.2 |
|
| | 100.0 | % | 100.0 | % | 100.0 | % | 100.0 | % | 100.0 | % | 100.0 | % | 100.0 | % | 100.0 | % | 100.0 | % | 100.0 | % |
The following table provides additional information on impaired loans, loan commitments and loans serviced for others:
|
| | | | | | | |
| | September 30, 2012 | | September 30, 2011 |
| | (In thousands) |
| Recorded investment in impaired loans | $ | 565,553 |
| | $ | 476,822 |
|
| Impaired loans with allocated reserves | 44,167 |
| | 123,862 |
|
| Reserves on impaired loans | 15,983 |
| | 41,912 |
|
| Average balance of impaired loans | 523,363 |
| | 486,665 |
|
| Interest income from impaired loans | 28,366 |
| | 28,081 |
|
| Outstanding fixed-rate origination commitments | 151,990 |
| | 67,542 |
|
| Loans serviced for others | 58,673 |
| | 102,775 |
|
The following table sets forth information regarding non-accrual loans held by the Company:
|
| | | | | | | | | | | | | |
| | September 30, 2012 | | September 30, 2011 |
| | (In thousands) | | | | (In thousands) | | |
| Non-accrual loans: | | | | | | | |
| Single-family residential | $ | 131,193 |
| | 75.7 | % | | $ | 126,624 |
| | 60.3 | % |
| Construction - speculative | 10,634 |
| | 6.1 |
| | 15,383 |
| | 7.3 |
|
| Construction - custom | 539 |
| | 0.3 |
| | 635 |
| | 0.3 |
|
| Land - acquisition & development | 13,477 |
| | 7.8 |
| | 37,339 |
| | 17.7 |
|
| Land - consumer lot loans | 5,149 |
| | 3.0 |
| | 8,843 |
| | 4.2 |
|
| Multi-family | 4,185 |
| | 2.4 |
| | 7,664 |
| | 3.6 |
|
| Commercial real estate | 7,653 |
| | 4.4 |
| | 11,380 |
| | 5.4 |
|
| Commercial & industrial | 16 |
| | — |
| | 1,679 |
| | 0.8 |
|
| HELOC | 198 |
| | 0.1 |
| | 481 |
| | 0.2 |
|
| Consumer | 383 |
| | 0.2 |
| | 437 |
| | 0.2 |
|
| Total non-accrual loans | $ | 173,427 |
| | 100 | % | | $ | 210,465 |
| | 100 | % |
WASHINGTON FEDERAL, INC. AND SUBSIDIARIES
NOTES TO THE CONSOLIDATED FINANCIAL STATEMENTS
YEARS ENDED SEPTEMBER 30, 2012, 2011 AND 2010
The following tables provide an analysis of the age of loans in past due status :
|
| | | | | | | | | | | | | | | | | | | | | | | | | | |
| September 30, 2012 | Amount of Loans | | Days Delinquent Based on $ Amount of Loans | | % based on $ |
| Type of Loan | Net of LIP & Chg.-Offs | | Current | | 30 | | 60 | | 90 | | Total | |
| | (In thousands) | | |
| Non-acquired loans | | | | | | | | | | | | | |
| Single-Family Residential | $ | 5,776,002 |
| | $ | 5,618,261 |
| | $ | 34,035 |
| | $ | 16,276 |
| | $ | 107,430 |
| | $ | 157,741 |
| | 2.73 | % |
| Construction - Speculative | 88,849 |
| | 85,785 |
| | 142 |
| | 190 |
| | 2,732 |
| | 3,064 |
| | 3.45 |
|
| Construction - Custom | 107,882 |
| | 107,215 |
| | 128 |
| | — |
| | 539 |
| | 667 |
| | 0.62 |
|
| Land - Acquisition & Development | 119,192 |
| | 106,321 |
| | 853 |
| | 1,004 |
| | 11,014 |
| | 12,871 |
| | 10.80 |
|
| Land - Consumer Lot Loans | 141,772 |
| | 134,560 |
| | 1,688 |
| | 375 |
| | 5,149 |
| | 7,212 |
| | 5.09 |
|
| Multi-Family | 676,917 |
| | 672,263 |
| | 718 |
| | 67 |
| | 3,869 |
| | 4,654 |
| | 0.69 |
|
| Commercial Real Estate | 292,261 |
| | 284,427 |
| | 699 |
| | 3,153 |
| | 3,982 |
| | 7,834 |
| | 2.68 |
|
| Commercial & Industrial | 162,802 |
| | 162,778 |
| | 8 |
| | — |
| | 16 |
| | 24 |
| | 0.01 |
|
| HELOC | 112,902 |
| | 112,482 |
| | 158 |
| | 64 |
| | 198 |
| | 420 |
| | 0.37 |
|
| Consumer | 63,374 |
| | 61,405 |
| | 1,155 |
| | 431 |
| | 383 |
| | 1,969 |
| | 3.11 |
|
| Total non-acquired loans | 7,541,953 |
| | 7,345,497 |
| | 39,584 |
| | 21,560 |
| | 135,312 |
| | 196,456 |
| | 2.60 | % |
| | | | | | | | | | | | | | |
| Credit-impaired acquired loans | | | | | | | | | | | | | |
| Single-Family Residential | 342 |
| | 342 |
| | — |
| | — |
| | — |
| | — |
| | — | % |
| Construction - Speculative | 1,889 |
| | 1,889 |
| | — |
| | — |
| | — |
| | — |
| | — |
|
| Construction - Custom | — |
| | — |
| | — |
| | — |
| | — |
| | — |
| | — |
|
| Land - Acquisition & Development | 3,702 |
| | 3,219 |
| | 365 |
| | — |
| | 118 |
| | 483 |
| | 13.05 |
|
| Land - Consumer Lot Loans | — |
| | — |
| | — |
| | — |
| | — |
| | — |
| | — |
|
| Multi-Family | 601 |
| | — |
| | 601 |
| | — |
| | — |
| | 601 |
| | 100.00 |
|
| Commercial Real Estate | 87,134 |
| | 78,959 |
| | 412 |
| | 2,549 |
| | 5,214 |
| | 8,175 |
| | 9.38 |
|
| Commercial & Industrial | 3,292 |
| | 3,054 |
| | 238 |
| | — |
| | — |
| | 238 |
| | 7.23 |
|
| HELOC | 14,040 |
| | 13,950 |
| | — |
| | 90 |
| | — |
| | 90 |
| | 0.64 |
|
| Consumer | 97 |
| | 95 |
| | 2 |
| | — |
| | — |
| | 2 |
| | 2.06 |
|
| Total credit-impaired acquired loans | 111,097 |
| | 101,508 |
| | 1,618 |
| | 2,639 |
| | 5,332 |
| | 9,589 |
| | 8.63 | % |
| | | | | | | | | | | | | | |
| Total loans | $ | 7,653,050 |
| | $ | 7,447,005 |
| | $ | 41,202 |
| | $ | 24,199 |
| | $ | 140,644 |
| | $ | 206,045 |
| | 2.69 | % |
Most loans restructured in troubled debt restructurings ("TDRs") are accruing and performing loans where the borrower has proactively approached the Company about modifications due to temporary financial difficulties. Each request is individually evaluated for merit and likelihood of success. The concession for these loans is typically a payment reduction through a rate reduction of from 100 to 200 bps for a specific term, usually six to twelve months. Interest-only payments may also be approved during the modification period. Principal forgiveness is not an available option for restructured loans. As of September 30, 2012 single-family residential loans comprised 83% of restructured loans.
The Bank reserves for restructured loans within its allowance for loan loss methodology by taking into account the following performance indicators: 1) time since modification, 2) current payment status and 3) geographic area.
WASHINGTON FEDERAL, INC. AND SUBSIDIARIES
NOTES TO THE CONSOLIDATED FINANCIAL STATEMENTS
YEARS ENDED SEPTEMBER 30, 2012, 2011 AND 2010
The following tables provides information related to loans that were restructured:
|
| | | | | | | | | | | | | | | | | | | | | |
| | September 30, 2012 | | September 30, 2011 |
| | | | Pre-Modification | | Post-Modification | | | | Pre-Modification | | Post-Modification |
| | | | Outstanding | | Outstanding | | | | Outstanding | | Outstanding |
| | Number of | | Recorded | | Recorded | | Number of | | Recorded | | Recorded |
| | Contracts | | Investment | | Investment | | Contracts | | Investment | | Investment |
| | | | (In thousands) | | | | (In thousands) |
| Troubled Debt Restructurings: | | | | | | | | | | | |
| Single-Family Residential | 787 |
| | $ | 183,548 |
| | $ | 183,548 |
| | 681 |
| | $ | 177,216 |
| | $ | 177,216 |
|
| Construction - Speculative | 24 |
| | 6,703 |
| | 6,703 |
| | 12 |
| | 2,499 |
| | 2,499 |
|
| Construction - Custom | 1 |
| | 1,196 |
| | 1,196 |
| | — |
| | — |
| | — |
|
| Land - Acquisition & Development | 26 |
| | 5,489 |
| | 5,489 |
| | 3 |
| | 3,909 |
| | 3,909 |
|
| Land - Consumer Lot Loans | 38 |
| | 5,237 |
| | 5,237 |
| | 62 |
| | 8,745 |
| | 8,745 |
|
| Multi-Family | 4 |
| | 3,104 |
| | 3,104 |
| | 9 |
| | 10,360 |
| | 10,360 |
|
| Commercial Real Estate | 4 |
| | 6,224 |
| | 6,224 |
| | — |
| | — |
| | — |
|
| Commercial & Industrial | — |
| | — |
| | — |
| | — |
| | — |
| | — |
|
| HELOC | 5 |
| | 707 |
| | 707 |
| | 1 |
| | 99 |
| | 99 |
|
| Consumer | — |
| | — |
| | — |
| | — |
| | — |
| | — |
|
| | 889 |
| | $ | 212,208 |
| | $ | 212,208 |
| | 768 |
| | $ | 202,828 |
| | $ | 202,828 |
|
|
| | | | | | | | | | | | | |
| | September 30, 2012 | | September 30, 2011 |
| | Number of | | Recorded | | Number of | | Recorded |
| | Contracts | | Investment | | Contracts | | Investment |
| | | | (In thousands) | | | | (In thousands) |
| Troubled Debt Restructurings That Subsequently Defaulted: | | | | | | | |
| Single-Family Residential | 123 |
| | $ | 24,431 |
| | 103 |
| | $ | 27,878 |
|
| Construction - Speculative | — |
| | — |
| | — |
| | — |
|
| Construction - Custom | — |
| | — |
| | — |
| | — |
|
| Land - Acquisition & Development | — |
| | — |
| | 5 |
| | 779 |
|
| Land - Consumer Lot Loans | 12 |
| | 1,402 |
| | — |
| | — |
|
| Multi-Family | — |
| | — |
| | 1 |
| | 983 |
|
| Commercial Real Estate | — |
| | — |
| | — |
| | — |
|
| Commercial & Industrial | — |
| | — |
| | — |
| | — |
|
| HELOC | — |
| | — |
| | — |
| | — |
|
| Consumer | — |
| | — |
| | — |
| | — |
|
| | 135 |
| | $ | 25,833 |
| | 109 |
| | $ | 29,640 |
|
WASHINGTON FEDERAL, INC. AND SUBSIDIARIES
NOTES TO THE CONSOLIDATED FINANCIAL STATEMENTS
YEARS ENDED SEPTEMBER 30, 2012, 2011 AND 2010
The excess of cash flows expected to be collected over the initial fair value of acquired impaired loans is referred to as the accretable yield and is accreted into interest income over the estimated life of the acquired loans using the effective yield method. Other adjustments to the accretable yield include changes in the estimated remaining life of the acquired loans, changes in expected cash flows and changes of indices for acquired loans with variable interest rates.
The following table shows the changes in accretable yield for acquired impaired loans for the years ended September 30, 2012 and 2011:
|
| | | | | | | | | | | | | | | |
| | September 30, 2012 | | September 30, 2011 |
| | Accretable Yield | | Carrying Amount of Loans | | Accretable Yield | | Carrying Amount of Loans |
| | (In thousands) |
| Balance at beginning of period | $ | — |
| | $ | — |
| | $ | — |
| | $ | — |
|
| Additions | 21,384 |
| | 93,691 |
| | — |
| | — |
|
| Reclassification from nonaccretable balance, net | — |
| | — |
| | — |
| | — |
|
| Accretion | (4,456 | ) | | 4,456 |
| | — |
| | — |
|
| Transfers to REO | — |
| | (2,616 | ) | | — |
| | — |
|
| Payments received, net | — |
| | (17,918 | ) | | — |
| | — |
|
| Balance at end of period | $ | 16,928 |
| | $ | 77,613 |
| | $ | — |
| | $ | — |
|
The following table shows loans acquired during 2012 and 2011 for which it was probable at acquisition that all contractually required payments would not be collected:
|
| | | |
| | Western National Bank |
| | December 16, 2011 |
| Contractually required payments of interest and principal | $ | 171,515 |
|
| Nonaccretable difference | (56,440 | ) |
| Cash flows expected to be collected (1) | 115,075 |
|
| Accretable yield | (21,384 | ) |
| Carrying value of acquired loans | $ | 93,691 |
|
| (1) Represents undiscounted expected principal and interest cash flows |
NOTE D Allowance for Losses on Loans
WASHINGTON FEDERAL, INC. AND SUBSIDIARIES
NOTES TO THE CONSOLIDATED FINANCIAL STATEMENTS
YEARS ENDED SEPTEMBER 30, 2012, 2011 AND 2010
The following table summarizes the activity in the allowance for loan losses for the twelve months ended September 30, 2012 and 2011:
|
| | | | | | | | | | | | | | | | | | | |
| September 30, 2012 | Beginning Allowance | | Charge-offs | | Recoveries | | Provision & Transfers | | Ending Allowance |
| | (In thousands) |
| Single-family residential | $ | 83,307 |
| | $ | (53,789 | ) | | $ | 8,164 |
| | $ | 44,133 |
| | $ | 81,815 |
|
| Construction - speculative | 13,828 |
| | (4,916 | ) | | 711 |
| | 2,437 |
| | 12,060 |
|
| Construction - custom | 623 |
| | — |
| | — |
| | (276 | ) | | 347 |
|
| Land - acquisition & development | 32,719 |
| | (16,978 | ) | | 1,341 |
| | (1,484 | ) | | 15,598 |
|
| Land - consumer lot loans | 5,520 |
| | (2,670 | ) | | — |
| | 2,087 |
| | 4,937 |
|
| Multi-family | 7,623 |
| | (1,393 | ) | | 504 |
| | (1,454 | ) | | 5,280 |
|
| Commercial real estate | 4,331 |
| | (814 | ) | | 225 |
| | (1,786 | ) | | 1,956 |
|
| Commercial & industrial | 5,099 |
| | (249 | ) | | 2,366 |
| | 410 |
| | 7,626 |
|
| HELOC | 1,139 |
| | (232 | ) | | 66 |
| | (8 | ) | | 965 |
|
| Consumer | 2,971 |
| | (3,538 | ) | | 1,480 |
| | 1,650 |
| | 2,563 |
|
| | $ | 157,160 |
| | $ | (84,579 | ) | | $ | 14,857 |
| | $ | 45,709 |
| | $ | 133,147 |
|
|
| | | | | | | | | | | | | | | | | | | |
| September 30, 2011 | Beginning Allowance | | Charge-offs | | Recoveries | | Provision & Transfers | | Ending Allowance |
| | (In thousands) |
| Single-family residential | $ | 47,160 |
| | $ | (38,465 | ) | | $ | 3,072 |
| | $ | 71,540 |
| | $ | 83,307 |
|
| Construction - speculative | 26,346 |
| | (13,197 | ) | | 2,143 |
| | (1,464 | ) | | 13,828 |
|
| Construction - custom | 770 |
| | (237 | ) | | — |
| | 90 |
| | 623 |
|
| Land - acquisition & development | 61,637 |
| | (39,797 | ) | | 2,271 |
| | 8,608 |
| | 32,719 |
|
| Land - consumer lot loans | 4,793 |
| | (4,196 | ) | | — |
| | 4,923 |
| | 5,520 |
|
| Multi-family | 5,050 |
| | (1,950 | ) | | 71 |
| | 4,452 |
| | 7,623 |
|
| Commercial real estate | 3,165 |
| | (1,593 | ) | | 328 |
| | 2,431 |
| | 4,331 |
|
| Commercial & industrial | 6,193 |
| | (4,733 | ) | | 1,925 |
| | 1,714 |
| | 5,099 |
|
| HELOC | 586 |
| | (939 | ) | | 185 |
| | 1,307 |
| | 1,139 |
|
| Consumer | 7,394 |
| | (4,602 | ) | | 1,429 |
| | (1,250 | ) | | 2,971 |
|
| | $ | 163,094 |
| | $ | (109,709 | ) | | $ | 11,424 |
| | $ | 92,351 |
| | $ | 157,160 |
|
The Company recorded a $44,955,000 provision for loan losses during the fiscal year ended September 30, 2012, while a $93,104,000 provision was recorded for the year ended September 30, 2011. The provision for loan losses for 2012 was $44,955,000, which was made up of the $45,709,000 shown above less $754,000 in provision reversal related to covered loans. Non-performing assets (“NPAs”) amounted to $272,905,000, or 2.19%, of total assets at September 30, 2012, compared to $370,294,000, or 2.76%, of total assets one year ago. Covered loans are not classified as non-performing loans because, at acquisition, the carrying value of these loans was adjusted to reflect fair value and are covered under FDIC loss sharing agreements. The reversal of allowance for credit losses related to the acquired loans resulted from increased expectations of future cash flows due to decreased credit losses for certain acquired loan pools. Non-accrual loans decreased from $210,465,000 at September 30, 2011, to $173,427,000 at September 30, 2012, a 17.6% decrease. The Company had net charge-offs of $69,721,000 for the twelve months ended September 30, 2012, compared with $98,285,000 of net charge-offs for the same period one year ago. A loan is charged-off when the loss is estimable and it is confirmed that the borrower will not be able to meet its contractual obligations. $117,164,000 of the allowance was calculated under the formulas contained in our general allowance methodology and the remaining $15,983,000 was made up of specific reserves on loans that were deemed to be impaired at September 30, 2012. For the period ending September 30, 2011, $115,248,000 of the allowance was calculated under the formulas contained in our general allowance methodology and the remaining $41,912,000 was made up of specific reserves on loans that were deemed to be impaired. The primary reasons for the shift in total allowance allocation from specific
WASHINGTON FEDERAL, INC. AND SUBSIDIARIES
NOTES TO THE CONSOLIDATED FINANCIAL STATEMENTS
YEARS ENDED SEPTEMBER 30, 2012, 2011 AND 2010
reserves to general reserves is due to the Company having already addressed many of the problem loans focused in the speculative construction and land A&D portfolios, combined with an increase in delinquencies and elevated charge-offs in the single-family residential portfolio.
The following tables show a summary of loans collectively and individually evaluated for impairment and the related allocation of general and specific reserves as of September 30, 2012 and 2011:
|
| | | | | | | | | | | | | | | | | | | | | |
| September 30, 2012 | Loans Collectively Evaluated for Impairment | | Loans Individually Evaluated for Impairment |
| | General Reserve Allocation | | Gross Loans Subject to General Reserve (1) | | Ratio | | Specific Reserve Allocation | | Gross Loans Subject to Specific Reserve (1) | | Ratio |
| | (In thousands) | | | | (In thousands) |
| Single-family residential | $ | 81,737 |
| | $ | 5,694,337 |
| | 1.4 | % | | $ | 78 |
| | $ | 84,584 |
| | 0.1 | % |
| Construction - speculative | 9,079 |
| | 104,312 |
| | 8.7 |
| | 2,981 |
| | 25,325 |
| | 11.8 |
|
| Construction - custom | 347 |
| | 211,690 |
| | 0.2 |
| | — |
| | — |
| | — |
|
| Land - acquisition & development | 6,697 |
| | 47,294 |
| | 14.2 |
| | 8,901 |
| | 77,383 |
| | 11.5 |
|
| Land - consumer lot loans | 4,176 |
| | 138,666 |
| | 3.0 |
| | 761 |
| | 3,178 |
| | 23.9 |
|
| Multi-family | 2,818 |
| | 694,140 |
| | 0.4 |
| | 2,462 |
| | 16,000 |
| | 15.4 |
|
| Commercial real estate | 1,158 |
| | 292,550 |
| | 0.4 |
| | 798 |
| | 26,660 |
| | 3.0 |
|
| Commercial & industrial | 7,624 |
| | 161,689 |
| | 4.7 |
| | 2 |
| | 1,134 |
| | 0.2 |
|
| HELOC | 965 |
| | 112,812 |
| | 0.9 |
| | — |
| | 90 |
| | — |
|
| Consumer | 2,563 |
| | 63,374 |
| | 4.0 |
| | — |
| | — |
| | — |
|
| | $ | 117,164 |
| | $ | 7,520,864 |
| | 1.6 | % | | $ | 15,983 |
| | $ | 234,354 |
| | 6.8 | % |
___________________
| |
| (1) | Excludes covered loans & credit impaired acquired loans |
|
| | | | | | | | | | | | | | | | | | | | | |
| September 30, 2011 | Loans Collectively Evaluated for Impairment | | Loans Individually Evaluated for Impairment |
| | General Reserve Allocation | | Gross Loans Subject to General Reserve (1) | | Ratio | | Specific Reserve Allocation | | Gross Loans Subject to Specific Reserve (1) | | Ratio |
| | (In thousands) | | | | (In thousands) |
| Single-family residential | $ | 77,441 |
| | $ | 6,186,322 |
| | 1.3 | % | | $ | 5,866 |
| | $ | 32,556 |
| | 18.0 | % |
| Construction - speculative | 6,969 |
| | 89,986 |
| | 7.7 |
| | 6,859 |
| | 50,473 |
| | 13.6 |
|
| Construction - custom | 623 |
| | 279,851 |
| | 0.2 |
| | — |
| | — |
| | — |
|
| Land - acquisition & development | 10,489 |
| | 61,277 |
| | 17.1 |
| | 22,230 |
| | 139,415 |
| | 15.9 |
|
| Land - consumer lot loans | 4,385 |
| | 160,906 |
| | 2.7 |
| | 1,135 |
| | 2,240 |
| | 50.7 |
|
| Multi-family | 3,443 |
| | 679,823 |
| | 0.5 |
| | 4,180 |
| | 20,850 |
| | 20.0 |
|
| Commercial real estate | 2,730 |
| | 268,906 |
| | 1.0 |
| | 1,601 |
| | 34,536 |
| | 4.6 |
|
| Commercial & industrial | 5,058 |
| �� | 106,406 |
| | 4.8 |
| | 41 |
| | 2,926 |
| | 1.4 |
|
| HELOC | 1,139 |
| | 115,092 |
| | 1.0 |
| | — |
| | — |
| | — |
|
| Consumer | 2,971 |
| | 67,509 |
| | 4.4 |
| | — |
| | — |
| | — |
|
| | $ | 115,248 |
| | $ | 8,016,078 |
| | 1.4 | % | | $ | 41,912 |
| | $ | 282,996 |
| | 14.8 | % |
___________________
| |
| (1) | Excludes covered loans |
WASHINGTON FEDERAL, INC. AND SUBSIDIARIES
NOTES TO THE CONSOLIDATED FINANCIAL STATEMENTS
YEARS ENDED SEPTEMBER 30, 2012, 2011 AND 2010
The Company has an asset quality review function that analyzes its loan portfolios and reports the results of the review to the Board of Directors on a quarterly basis. The single-family residential, HELOC and consumer portfolios are evaluated based on their performance as a pool of loans, since no single loan is individually significant or judged by its risk rating, size or potential risk of loss. The construction, land, multi-family, commercial real estate and commercial and industrial loans are risk rated on a loan by loan basis to determine the relative risk inherent in specific borrowers or loans. Based on that risk rating, the loans are assigned a grade and classified as follows:
| |
| • | Pass – the credit does not meet one of the definitions defined below. |
| |
| • | Special mention – A special mention credit is considered to be currently protected from loss but is potentially weak. No loss of principal or interest is foreseen; however, proper supervision and Management attention is required to deter further deterioration in the credit. Assets in this category constitute some undue and unwarranted credit risk but not to the point of justifying a risk rating of substandard. The credit risk may be relatively minor yet constitutes an unwarranted risk in light of the circumstances surrounding a specific asset. |
| |
| • | Substandard – A substandard credit is an unacceptable credit. Additionally, repayment in the normal course is in jeopardy due to the existence of one or more well defined weaknesses. In these situations, loss of principal is likely if the weakness is not corrected. A substandard asset is inadequately protected by the current sound worth and paying capacity of the borrower or of the collateral pledged, if any. Assets so classified will have a well defined weakness or weaknesses that jeopardize the liquidation of the debt. Loss potential, while existing in the aggregate amount of substandard assets, does not have to exist in individual assets risk rated substandard. |
| |
| • | Doubtful – A credit classified doubtful has all the weaknesses inherent in one classified substandard with the added characteristic that the weakness makes collection or liquidation in full, on the basis of currently existing facts, conditions and values, highly questionable and improbable. The probability of loss is high, but because of certain important and reasonably specific pending factors that may work to the advantage and strengthening of the asset, its classification as an estimated loss is deferred until its more exact status may be determined. Pending factors include proposed merger, acquisition, or liquidation procedures, capital injection, perfecting liens on additional collateral, and refinancing plans. |
| |
| • | Loss – Credits classified loss are considered uncollectible and of such little value that their continuance as a bankable asset is not warranted. This classification does not mean that the asset has absolutely no recovery or salvage value, but rather it is not practical or desirable to defer writing off this asset even though partial recovery may be affected in the future. Losses should be taken in the period in which they are identified as uncollectible. Partial charge-off versus full charge-off may be taken if the collateral offers some identifiable protection. |
The following tables provide information on loans based on credit quality indicators (defined above) as of September 30, 2012 and 2011:
Credit Risk Profile by Internally Assigned Grade:
WASHINGTON FEDERAL, INC. AND SUBSIDIARIES
NOTES TO THE CONSOLIDATED FINANCIAL STATEMENTS
YEARS ENDED SEPTEMBER 30, 2012, 2011 AND 2010
|
| | | | | | | | | | | | | | | | | | | | | | | |
| September 30, 2012 | Internally Assigned Grade | | Total |
| | Pass | | Special mention | | Substandard | | Doubtful | | Loss | | Gross Loans |
| | (In thousands) |
| Non-acquired loans | | | | | | | | | | | |
| Single-family residential | $ | 5,588,252 |
| | $ | 844 |
| | $ | 189,826 |
| | $ | — |
| | $ | — |
| | 5,778,922 |
|
| Construction - speculative | 86,126 |
| | 10,113 |
| | 33,398 |
| | — |
| | — |
| | 129,637 |
|
| Construction - custom | 211,690 |
| | — |
| | — |
| | — |
| | — |
| | 211,690 |
|
| Land - acquisition & development | 73,661 |
| | 4,637 |
| | 46,379 |
| | — |
| | — |
| | 124,677 |
|
| Land - consumer lot loans | 140,006 |
| | 223 |
| | 1,615 |
| | — |
| | — |
| | 141,844 |
|
| Multi-family | 684,649 |
| | 5,098 |
| | 20,393 |
| | — |
| | — |
| | 710,140 |
|
| Commercial real estate | 278,022 |
| | 16,282 |
| | 24,906 |
| | — |
| | — |
| | 319,210 |
|
| Commercial & industrial | 158,421 |
| | 1,071 |
| | 3,331 |
| | — |
| | — |
| | 162,823 |
|
| HELOC | 112,902 |
| | — |
| | — |
| | — |
| | — |
| | 112,902 |
|
| Consumer | 62,611 |
| | 354 |
| | 409 |
| | — |
| | — |
| | 63,374 |
|
| | $ | 7,396,340 |
| | $ | 38,622 |
| | $ | 320,257 |
| | $ | — |
| | $ | — |
| | $ | 7,755,219 |
|
| | | | | | | | | | | | |
| Credit impaired acquired loans | | | | | | | | | | | |
| Pool 1 - Construction and land A&D | $ | 2,466 |
| | $ | — |
| | $ | 3,125 |
| | $ | — |
| | $ | — |
| | $ | 5,591 |
|
| Pool 2 - Single-family residential | 342 |
| | — |
| | — |
| | — |
| | — |
| | 342 |
|
| Pool 3 - Multi-family | — |
| | — |
| | 601 |
| | — |
| | — |
| | 601 |
|
| Pool 4 - HELOC & other consumer | 14,137 |
| | — |
| | — |
| | — |
| | — |
| | 14,137 |
|
| Pool 5 - Commercial real estate | 53,683 |
| | 4,308 |
| | 28,200 |
| | 963 |
| | — |
| | 87,154 |
|
| Pool 6 - Commercial & industrial | 1,566 |
| | 58 |
| | 733 |
| | 935 |
| | — |
| | 3,292 |
|
| Total credit impaired acquired loans | $ | 72,194 |
| | $ | 4,366 |
| | $ | 32,659 |
| | $ | 1,898 |
| | $ | — |
| | $ | 111,117 |
|
| Total gross loans | $ | 7,468,534 |
| | $ | 42,988 |
| | $ | 352,916 |
| | $ | 1,898 |
| | $ | — |
| | $ | 7,866,336 |
|
| | | | | | | | | | | | |
| Total grade as a % of total gross loans | 94.9 | % | | 0.6 | % | | 4.5 | % | | — | % | | — | % | | |
|
| | | | | | | | | | | | | | | | | | | | | | | |
| September 30, 2011 | Internally Assigned Grade | | Total |
| | Pass | | Special mention | | Substandard | | Doubtful | | Loss | | Gross Loans |
| | (In thousands) |
| Single-family residential | $ | 6,047,279 |
| | $ | — |
| | $ | 171,599 |
| | $ | — |
| | $ | — |
| | $ | 6,218,878 |
|
| Construction - speculative | 56,485 |
| | 21,035 |
| | 62,939 |
| | — |
| | — |
| | 140,459 |
|
| Construction - custom | 279,851 |
| | — |
| | — |
| | — |
| | — |
| | 279,851 |
|
| Land - acquisition & development | 44,888 |
| | 44,840 |
| | 110,964 |
| | — |
| | — |
| | 200,692 |
|
| Land - consumer lot loans | 162,670 |
| | — |
| | 476 |
| | — |
| | — |
| | 163,146 |
|
| Multi-family | 663,582 |
| | 4,629 |
| | 32,462 |
| | — |
| | — |
| | 700,673 |
|
| Commercial real estate | 264,083 |
| | 4,125 |
| | 35,234 |
| | — |
| | — |
| | 303,442 |
|
| Commercial & industrial | 104,171 |
| | 1,128 |
| | 1,407 |
| | 2,245 |
| | 381 |
| | 109,332 |
|
| HELOC | 115,092 |
| | — |
| | — |
| | — |
| | — |
| | 115,092 |
|
| Consumer | 66,512 |
| | 528 |
| | 469 |
| | — |
| | — |
| | 67,509 |
|
| | $ | 7,804,613 |
| | $ | 76,285 |
| | $ | 415,550 |
| | $ | 2,245 |
| | $ | 381 |
| | $ | 8,299,074 |
|
| Total grade as a % of total gross loans | 94.1 | % | | 0.9 | % | | 5.0 | % | | — | % | | — | % | | |
WASHINGTON FEDERAL, INC. AND SUBSIDIARIES
NOTES TO THE CONSOLIDATED FINANCIAL STATEMENTS
YEARS ENDED SEPTEMBER 30, 2012, 2011 AND 2010
Credit Risk Profile Based on Payment Activity:
|
| | | | | | | | | | | | | |
| September 30, 2012 | Performing Loans | | Non-Performing Loans |
| | Amount | | % of Total Gross Loans | | Amount | | % of Total Gross Loans |
| | (In thousands) | | | | (In thousands) | | |
| Single-family residential | $ | 5,647,729 |
| | 97.7 | % | | $ | 131,193 |
| | 2.3 | % |
| Construction - speculative | 119,003 |
| | 91.8 |
| | 10,634 |
| | 8.2 |
|
| Construction - custom | 211,151 |
| | 99.7 |
| | 539 |
| | 0.3 |
|
| Land - acquisition & development | 111,200 |
| | 89.2 |
| | 13,477 |
| | 10.8 |
|
| Land - consumer lot loans | 136,695 |
| | 96.4 |
| | 5,149 |
| | 3.6 |
|
| Multi-family | 705,955 |
| | 99.4 |
| | 4,185 |
| | 0.6 |
|
| Commercial real estate | 311,557 |
| | 97.6 |
| | 7,653 |
| | 2.4 |
|
| Commercial & industrial | 162,807 |
| | 100.0 |
| | 16 |
| | — |
|
| HELOC | 112,704 |
| | 99.8 |
| | 198 |
| | 0.2 |
|
| Consumer | 62,991 |
| | 99.4 |
| | 383 |
| | 0.6 |
|
| | $ | 7,581,792 |
| | 97.8 | % | | $ | 173,427 |
| | 2.2 | % |
|
| | | | | | | | | | | | | |
| September 30, 2011 | Performing Loans | | Non-Performing Loans |
| | Amount | | % of Total Gross Loans | | Amount | | % of Total Gross Loans |
| | (In thousands) | | | | (In thousands) | | |
| Single-family residential | $ | 6,092,254 |
| | 98.0 | % | | $ | 126,624 |
| | 2.0 | % |
| Construction - speculative | 125,076 |
| | 89.0 |
| | 15,383 |
| | 11.0 |
|
| Construction - custom | 279,216 |
| | 99.8 |
| | 635 |
| | 0.2 |
|
| Land - acquisition & development | 163,353 |
| | 81.4 |
| | 37,339 |
| | 18.6 |
|
| Land - consumer lot loans | 154,303 |
| | 94.6 |
| | 8,843 |
| | 5.4 |
|
| Multi-family | 693,009 |
| | 98.9 |
| | 7,664 |
| | 1.1 |
|
| Commercial real estate | 292,062 |
| | 96.2 |
| | 11,380 |
| | 3.8 |
|
| Commercial & industrial | 107,653 |
| | 98.5 |
| | 1,679 |
| | 1.5 |
|
| HELOC | 114,611 |
| | 99.6 |
| | 481 |
| | 0.4 |
|
| Consumer | 67,072 |
| | 99.4 |
| | 437 |
| | 0.6 |
|
| | $ | 8,088,609 |
| | 97.5 | % | | $ | 210,465 |
| | 2.5 | % |
WASHINGTON FEDERAL, INC. AND SUBSIDIARIES
NOTES TO THE CONSOLIDATED FINANCIAL STATEMENTS
YEARS ENDED SEPTEMBER 30, 2012, 2011 AND 2010
The following tables provide information on impaired loans based on loan types as of September 30, 2012 and 2011:
|
| | | | | | | | | | | | | | | |
| September 30, 2012 | Recorded Investment | | Unpaid Principal Balance | | Related Allowance | | Average Recorded Investment |
| | (In thousands) |
| With no related allowance recorded: | | | | | | | |
| Single-family residential | $ | 106,955 |
| | $ | 124,342 |
| | $ | — |
| | $ | 49,524 |
|
| Construction - speculative | 13,726 |
| | 16,568 |
| | — |
| | 13,581 |
|
| Construction - custom | — |
| | — |
| | — |
| | — |
|
| Land - acquisition & development | 18,000 |
| | 30,209 |
| | — |
| | 16,417 |
|
| Land - consumer lot loans | 1,677 |
| | 2,185 |
| | — |
| | 487 |
|
| Multi-family | 8,792 |
| | 8,991 |
| | — |
| | 6,935 |
|
| Commercial real estate | 31,190 |
| | 42,656 |
| | — |
| | 12,946 |
|
| Commercial & industrial | 1,146 |
| | 7,363 |
| | — |
| | 581 |
|
| HELOC | 90 |
| | 1,066 |
| | — |
| | 36 |
|
| Consumer | — |
| | 4 |
| | — |
| | — |
|
| | 181,576 |
| | 233,384 |
| | — |
| | 100,507 |
|
| With an allowance recorded: | | | | | | | |
| Single-family residential | 317,901 |
| | 317,901 |
| | 25,723 |
| | 305,350 |
|
| Construction - speculative | 12,836 |
| | 12,836 |
| | 2,981 |
| | 12,822 |
|
| Construction - custom | — |
| | — |
| | — |
| | — |
|
| Land - acquisition & development | 20,750 |
| | 20,750 |
| | 8,901 |
| | 21,650 |
|
| Land - consumer lot loans | 13,881 |
| | 13,881 |
| | 761 |
| | 13,126 |
|
| Multi-family | 14,153 |
| | 14,555 |
| | 2,462 |
| | 14,279 |
|
| Commercial real estate | 3,722 |
| | 3,722 |
| | 798 |
| | 2,897 |
|
| Commercial & industrial | — |
| | 2 |
| | 2 |
| | 22 |
|
| HELOC | 734 |
| | 734 |
| | — |
| | 743 |
|
| Consumer | — |
| | — |
| | — |
| | — |
|
| | 383,977 |
| | 384,381 |
| | 41,628 |
| (1) | 370,889 |
|
| Total: | | | | | | | |
| Single-family residential | 424,856 |
| | 442,243 |
| | 25,723 |
| | 354,874 |
|
| Construction - speculative | 26,562 |
| | 29,404 |
| | 2,981 |
| | 26,403 |
|
| Construction - custom | — |
| | — |
| | — |
| | — |
|
| Land - acquisition & development | 38,750 |
| | 50,959 |
| | 8,901 |
| | 38,067 |
|
| Land - consumer lot loans | 15,558 |
| | 16,066 |
| | 761 |
| | 13,613 |
|
| Multi-family | 22,945 |
| | 23,546 |
| | 2,462 |
| | 21,214 |
|
| Commercial real estate | 34,912 |
| | 46,378 |
| | 798 |
| | 15,843 |
|
| Commercial & industrial | 1,146 |
| | 7,365 |
| | 2 |
| | 603 |
|
| HELOC | 824 |
| | 1,800 |
| | — |
| | 779 |
|
| Consumer | — |
| | 4 |
| | — |
| | — |
|
| | $ | 565,553 |
| | $ | 617,765 |
| | $ | 41,628 |
| (1) | $ | 471,396 |
|
____________________
| |
| (1) | Includes $15,983,000 of specific reserves and $25,645,000 included in the general reserves. |
WASHINGTON FEDERAL, INC. AND SUBSIDIARIES
NOTES TO THE CONSOLIDATED FINANCIAL STATEMENTS
YEARS ENDED SEPTEMBER 30, 2012, 2011 AND 2010
|
| | | | | | | | | | | | | | | |
| September 30, 2011 | Recorded Investment | | Unpaid Principal Balance | | Related Allowance | | Average Recorded Investment |
| | (In thousands) |
| With no related allowance recorded: | | | | | | | |
| Single-family residential | $ | 5,597 |
| | $ | 9,575 |
| | $ | — |
| | $ | 5,935 |
|
| Construction - speculative | 8,286 |
| | 11,026 |
| | — |
| | 7,374 |
|
| Construction - custom | — |
| | — |
| | — |
| | — |
|
| Land - acquisition & development | 22,436 |
| | 50,970 |
| | — |
| | 28,168 |
|
| Land - consumer lot loans | — |
| | — |
| | — |
| | — |
|
| Multi-family | 3,233 |
| | 4,508 |
| | — |
| | 4,058 |
|
| Commercial real estate | 3,462 |
| | 3,963 |
| | — |
| | 2,141 |
|
| Commercial & industrial | — |
| | — |
| | — |
| | — |
|
| HELOC | — |
| | — |
| | — |
| | — |
|
| Consumer | — |
| | — |
| | — |
| | — |
|
| | 43,014 |
| | 80,042 |
| | — |
| | 47,676 |
|
| With an allowance recorded: | | | | | | | |
| Single-family residential | 331,546 |
| | 331,546 |
| | 29,378 |
| | 261,736 |
|
| Construction - speculative | 29,255 |
| | 29,255 |
| | 6,859 |
| | 26,385 |
|
| Construction - custom | — |
| | — |
| | — |
| | — |
|
| Land - acquisition & development | 49,036 |
| | 49,912 |
| | 22,230 |
| | 41,006 |
|
| Land - consumer lot loans | 352 |
| | 352 |
| | 1,135 |
| | 110 |
|
| Multi-family | 17,149 |
| | 17,149 |
| | 4,180 |
| | 12,380 |
|
| Commercial real estate | 6,429 |
| | 6,429 |
| | 1,601 |
| | 3,351 |
|
| Commercial & industrial | 41 |
| | 41 |
| | 41 |
| | 31 |
|
| HELOC | — |
| | — |
| | — |
| | — |
|
| Consumer | — |
| | — |
| | — |
| | — |
|
| | 433,808 |
| | 434,684 |
| | 65,424 |
| (1) | 344,999 |
|
| Total: | | | | | | | |
| Single-family residential | 337,143 |
| | 341,121 |
| | 29,378 |
| | 267,671 |
|
| Construction - speculative | 37,541 |
| | 40,281 |
| | 6,859 |
| | 33,759 |
|
| Construction - custom | — |
| | — |
| | — |
| | — |
|
| Land - acquisition & development | 71,472 |
| | 100,882 |
| | 22,230 |
| | 69,174 |
|
| Land - consumer lot loans | 352 |
| | 352 |
| | 1,135 |
| | 110 |
|
| Multi-family | 20,382 |
| | 21,657 |
| | 4,180 |
| | 16,438 |
|
| Commercial real estate | 9,891 |
| | 10,392 |
| | 1,601 |
| | 5,492 |
|
| Commercial & industrial | 41 |
| | 41 |
| | 41 |
| | 31 |
|
| HELOC | — |
| | — |
| | — |
| | — |
|
| Consumer | — |
| | — |
| | — |
| | — |
|
| | $ | 476,822 |
| | $ | 514,726 |
| | $ | 65,424 |
| (1) | $ | 392,675 |
|
____________________
| |
| (1) | Includes $41,912,000 of specific reserves and $23,512,000 included in the general reserves. |
WASHINGTON FEDERAL, INC. AND SUBSIDIARIES
NOTES TO THE CONSOLIDATED FINANCIAL STATEMENTS
YEARS ENDED SEPTEMBER 30, 2012, 2011 AND 2010
NOTE E INTEREST RECEIVABLE
|
| | | | | | |
| September 30, | 2012 | 2011 |
| | (In thousands) |
| Loans receivable | $ | 40,600 |
| $ | 38,997 |
|
| Mortgage-backed securities | 5,187 |
| 11,293 |
|
| Investment securities | 1,070 |
| 2,042 |
|
| | $ | 46,857 |
| $ | 52,332 |
|
NOTE F PREMISES AND EQUIPMENT
|
| | | | | | | | |
| September 30, | |
| 2012 | 2011 |
| | | (In thousands) |
| | Estimated Useful Life | | |
| Land | — |
| $ | 82,426 |
| $ | 78,282 |
|
| Buildings | 25 - 40 |
| 114,106 |
| 102,403 |
|
| Leasehold improvements | 7 - 15 |
| 7,530 |
| 6,919 |
|
| Furniture, fixtures and equipment | 2 - 10 |
| 33,522 |
| 31,036 |
|
| | | 237,584 |
| 218,640 |
|
| Less accumulated depreciation and amortization | | (58,739 | ) | (52,047 | ) |
| | | $ | 178,845 |
| $ | 166,593 |
|
The Company has non-cancelable operating leases for branch offices. Future minimum net rental commitments for all non-cancelable leases, including maintenance and associated costs, were as follows: $3.3 million for 2013, $2.6 million for 2014, $2.0 million for 2015, $1.1 million for 2016 and $2.6 million thereafter. Rental expense, including amounts paid under month-to-month cancelable leases, amounted to $3,825,000, $3,083,000 and $3,170,000 in 2012, 2011 and 2010, respectively.
WASHINGTON FEDERAL, INC. AND SUBSIDIARIES
NOTES TO THE CONSOLIDATED FINANCIAL STATEMENTS
YEARS ENDED SEPTEMBER 30, 2012, 2011 AND 2010
NOTE G CUSTOMER ACCOUNTS
|
| | | | | | |
| September 30, | 2012 | 2011 |
| | (In thousands) |
| Checking accounts, .50% and under | $ | 894,639 |
| $ | 779,053 |
|
| Passbook and statement accounts, .50% and under | 314,634 |
| 255,396 |
|
| Insured money market accounts, .01% to .75% | 1,737,180 |
| 1,627,739 |
|
| Certificate accounts |
|
|
| Less than 2.00% | 4,308,341 |
| 4,170,232 |
|
| 2.00% to 2.99% | 841,520 |
| 1,229,918 |
|
| 3.00% to 3.99% | 381,324 |
| 418,720 |
|
| 4.00% to 4.99% | 98,119 |
| 174,854 |
|
| 5.00% to 5.99% | 861 |
| 9,991 |
|
| Total certificates | 5,630,165 |
| 6,003,715 |
|
| | $ | 8,576,618 |
| $ | 8,665,903 |
|
| Certificate maturities are as follows: | | |
| September 30, | 2012 | 2011 |
| | (In thousands) |
| Within 1 year | $ | 3,556,701 |
| $ | 3,973,028 |
|
| 1 to 2 years | 1,013,450 |
| 1,388,885 |
|
| 2 to 3 years | 425,559 |
| 274,704 |
|
| Over 3 years | 634,455 |
| 367,098 |
|
| | $ | 5,630,165 |
| $ | 6,003,715 |
|
Customer accounts over $250,000 totaled $1,036,388,000 as of September 30, 2012 and $921,462,000 as of September 30, 2011.
Interest expense on customer accounts consisted of the following:
|
| | | | | | | | | |
| Year ended September 30, | 2012 | 2011 | 2010 |
| | (in thousands) |
| Checking accounts | $ | 857 |
| $ | 1,908 |
| $ | 2,299 |
|
| Passbook and statement accounts | 574 |
| 682 |
| 1,100 |
|
| Insured money market accounts | 4,609 |
| 7,148 |
| 12,121 |
|
| Certificate accounts | 81,506 |
| 106,878 |
| 131,567 |
|
| | 87,546 |
| 116,616 |
| 147,087 |
|
| Less early withdrawal penalties | (607 | ) | (781 | ) | (727 | ) |
| | $ | 86,939 |
| $ | 115,835 |
| $ | 146,360 |
|
| Weighted average interest rate at end of year | 0.90 | % | 1.14 | % | 1.51 | % |
| Weighted daily average interest rate during the year | 0.99 | % | 1.32 | % | 1.69 | % |
WASHINGTON FEDERAL, INC. AND SUBSIDIARIES
NOTES TO THE CONSOLIDATED FINANCIAL STATEMENTS
YEARS ENDED SEPTEMBER 30, 2012, 2011 AND 2010
NOTE H FHLB ADVANCES
Maturity dates of FHLB advances were as follows:
|
| | | | | | |
| September 30, | 2012 | 2011 |
| | (In thousands) |
| FHLB advances | | |
| Within 1 year | — |
| — |
|
| 1 to 3 years | 100,000 |
| — |
|
| 4 to 5 years | 500,000 |
| 1,212,066 |
|
| More than 5 years | 1,280,000 |
| 750,000 |
|
| | $ | 1,880,000 |
| $ | 1,962,066 |
|
$450,000,000 of the 2012 advances and $1,150,000,000 of the 2011 advances included in the above table are callable by the FHLB. If these callable advances were to be called at the earliest call dates, the maturities of all FHLB advances would be as follows:
|
| | | | | | |
| September 30, | 2012 | 2011 |
| | (In thousands) |
| FHLB advances | | |
| Within 1 year | $ | 275,000 |
| $ | 1,100,000 |
|
| 1 to 3 years | 275,000 |
| 450,000 |
|
| 4 to 5 years | 500,000 |
| 412,066 |
|
| More than 5 years | 830,000 |
| — |
|
| | $ | 1,880,000 |
| $ | 1,962,066 |
|
Financial data pertaining to the weighted-average cost and the amount of FHLB advances were as follows:
|
| | | | | | | | | |
| September 30, | 2012 | 2011 | 2010 |
| | (In thousands) |
| Weighted average interest rate at end of year | 3.60 | % | 4.10 | % | 4.24 | % |
| Weighted daily average interest rate during the year | 4.14 | % | 4.35 | % | 4.46 | % |
| Daily average of FHLB advances | $ | 1,949,019 |
| $ | 1,883,135 |
| $ | 2,070,843 |
|
| Maximum amount of FHLB advances at any month end | 1,961,895 |
| 1,962,616 |
| 2,078,695 |
|
| Interest expense during the year | 80,617 |
| 81,994 |
| 92,402 |
|
FHLB advances are collateralized as provided for in the Advances, Pledge and Security Agreement by all FHLB stock owned by the Company, deposits with the FHLB and certain mortgages or deeds of trust securing such properties as provided in the agreements with the FHLB. As a member of the FHLB of Seattle, the Company currently has a credit line of 50% of the total assets of the Bank, subject to collateralization requirements.
WASHINGTON FEDERAL, INC. AND SUBSIDIARIES
NOTES TO THE CONSOLIDATED FINANCIAL STATEMENTS
YEARS ENDED SEPTEMBER 30, 2012, 2011 AND 2010
NOTE I OTHER BORROWINGS
Maturity dates of securities sold under agreements to repurchase (reverse repurchase agreements) and other borrowings were as follows:
|
| | | | | | |
| September 30, | 2012 | 2011 |
| | (In thousands) |
| Reverse repurchase agreements and other borrowings: | | |
| Within 1 year | $ | — |
| $ | — |
|
| 1 to 3 years | — |
| 300,000 |
|
| 4 to 5 years | — |
| 300,000 |
|
| More than 5 years | — |
| 200,000 |
|
| | $ | — |
| $ | 800,000 |
|
$0 of the 2012 and $500,000,000 of the 2011 reverse repurchase agreements and other borrowings included in the above table are callable by the counterparty. If these were to be called at the earliest call dates, the maturities of the reverse repurchase agreements and other borrowings would be as follows:
|
| | | | | | |
| September 30, | 2012 | 2011 |
| | (In thousands) |
| Reverse repurchase agreements and other borrowings: | | |
| Within 1 year | $ | — |
| $ | 200,000 |
|
| 1 to 3 years | — |
| 300,000 |
|
| 4 to 5 years | — |
| 300,000 |
|
| More than 5 years | — |
| — |
|
| | $ | — |
| $ | 800,000 |
|
Other borrowings on the Consolidated Statements of Financial Condition at September 30, 2012 and 2011 included $0 and $800,000,000, respectively, of reverse repurchase agreements presented in the table above.
The Bank has historically entered into sales of reverse repurchase agreements. Fixed-coupon reverse repurchase agreements are treated as financings, and the obligations to repurchase securities sold are reflected as a liability in the consolidated statements of financial condition. During the three years ended September 30, 2012, all of the Company’s transactions were fixed-coupon reverse repurchase agreements. The dollar amount of securities underlying the agreements remain in the asset accounts. The securities pledged are registered in the Company’s name, and principal and interest payments are received by the Company; however, the securities are held by the designated trustee of the broker. Upon maturity of the agreements, the identical securities pledged as collateral will be returned to the Company.
WASHINGTON FEDERAL, INC. AND SUBSIDIARIES
NOTES TO THE CONSOLIDATED FINANCIAL STATEMENTS
YEARS ENDED SEPTEMBER 30, 2012, 2011 AND 2010
Financial data pertaining to the weighted-average cost and the amount of securities sold under agreements to repurchase were as follows:
|
| | | | | | | | | |
| September 30, | 2012 | 2011 | 2010 |
| | (Dollars in thousands) | | |
| Weighted average interest rate at end of year | — | % | 3.90 | % | 3.90 | % |
| Weighted daily average interest rate during the year | 3.71 | % | 3.73 | % | 3.90 | % |
| Daily average of securities sold under agreements to repurchase | $ | 692,896 |
| $ | 800,000 |
| $ | 800,000 |
|
| Maximum securities sold under agreements to repurchase at any month end | 800,000 |
| 800,000 |
| 800,000 |
|
| Interest expense during the year | 25,693 |
| 29,867 |
| 29,867 |
|
Financial data pertaining to the weighted average cost and the amount of other borrowings were as follows:
|
| | | | | | | | |
| September 30, | 2012 | 2011 | 2010 |
| | (Dollars in thousands) | | |
| Weighted average interest rate at end of year | — | % | — | % | — | % |
| Weighted daily average interest rate during the year | — | % | — | % | 4.98 | % |
| Daily average of other borrowings | — |
| $ | — |
| $ | 9,479 |
|
| Maximum other borrowings at any month end | — |
| — |
| 14,310 |
|
| Interest expense during the year | — |
| — |
| 22 |
|
NOTE J INCOME TAXES
The Consolidated Statements of Financial Condition at September 30, 2012 and 2011 include net deferred tax assets (liabilities) of $8,449,000 and $(17,075,000), respectively, that have been provided for the temporary differences between the tax basis and the financial statement carrying amounts of liabilities and assets. The major sources of these temporary differences and their deferred tax effects were as follows:
WASHINGTON FEDERAL, INC. AND SUBSIDIARIES
NOTES TO THE CONSOLIDATED FINANCIAL STATEMENTS
YEARS ENDED SEPTEMBER 30, 2012, 2011 AND 2010
|
| | | | | | |
| September 30, | 2012 | 2011 |
| | (In thousands) |
| Deferred tax assets | | |
| Loan loss reserves | $ | 48,932 |
| $ | 56,930 |
|
| REO reserves | 24,003 |
| 41,268 |
|
| Asset Purchase Tax Basis Difference (net) | 29,165 |
| 27,068 |
|
| Delinquent accrued interest | 5,932 |
| 7,380 |
|
| Other, net | 958 |
| 1,236 |
|
| Total deferred tax assets | 108,990 |
| 133,882 |
|
| Deferred tax liabilities | | |
| FDIC indemnification asset | 21,050 |
| 24,973 |
|
| Federal Home Loan Bank stock dividends | 35,557 |
| 36,161 |
|
| Valuation adjustment on available-for-sale securities | 7,731 |
| 49,845 |
|
| Loan origination costs | 12,670 |
| 13,098 |
|
| Depreciation | 22,313 |
| 24,751 |
|
| Deferred gain on forward commitments | — |
| 890 |
|
| Core deposit intangible | 1,220 |
| 1,239 |
|
| Total deferred tax liabilities | 100,541 |
| 150,957 |
|
| Net deferred tax asset (liability) | 8,449 |
| (17,075 | ) |
| Current tax asset (liability) | 14,064 |
| 15,540 |
|
| Net tax asset (liability) | $ | 22,513 |
| $ | (1,535 | ) |
A reconciliation of the statutory federal income tax rate to the effective income tax rate follows:
|
| | | | | | |
| Year ended September 30, | 2012 | 2011 | 2010 |
| Statutory income tax rate | 35 | % | 35 | % | 35 | % |
| IRS tax settlement | — |
| — |
| (32 | ) |
| State income tax | 2 |
| 2 |
| 2 |
|
| Other differences | (1 | ) | (1 | ) | (1 | ) |
| Effective income tax rate | 36 | % | 36 | % | 4 | % |
WASHINGTON FEDERAL, INC. AND SUBSIDIARIES
NOTES TO THE CONSOLIDATED FINANCIAL STATEMENTS
YEARS ENDED SEPTEMBER 30, 2012, 2011 AND 2010
A reconciliation of the beginning and ending amount of unrecognized tax benefits is as follows:
|
| | | | | | |
| | 2012 | 2011 |
| | (In thousands) |
| Balance at October 1, | $ | 4,191 |
| $ | 3,893 |
|
| Tax positions related to current year: | | |
| Additions | — |
| — |
|
| Reductions | — |
| — |
|
| Tax positions related to prior years: | | |
| Additions | 506 |
| 520 |
|
| Reductions | — |
| — |
|
| Settlements with taxing authorities | — |
| — |
|
| Lapses in statues of limitations | (188 | ) | (222 | ) |
| Balance at September 30, | $ | 4,509 |
| $ | 4,191 |
|
As of 2012 and 2011, the Company's liability for uncertain tax positions was $3.2 million and $3.0 million, respectively. Included in the balance of unrecognized tax benefits at 2012, are $1.1 million of tax benefits that, if recognized, would affect the effective tax rate. The Company records interest and penalties related to uncertain tax positions in income tax expense. As of 2012 and 2011, there were approximately $2.0 million and $1.6 million, respectively, of accrued interest and $0.3 million and $0.3 million, respectively, of accrued penalties.
Based on current information the Company does not expect that changes in the amount of unrecognized tax benefits over the next twelve months will have a significant impact on the results of operations or the financial position of the Company.
The Company's federal income tax returns are open for the tax years 2009 through 2012. State income tax returns are generally subject to examination for a period of three to five years after filing of the respective return. The state impact of any federal changes remains subject to examination by various states for a period of up to two years after formal notification to the states. The Company has various state income tax returns in the process of examination, administrative appeals or litigation. The Company's unrecognized tax benefits are related to state returns open from 1999 through 2011.
The Company has been examined by the Internal Revenue Service through the year ended September 30, 1990. There were no material changes made to the Company's originally reported taxable income as a result of this examination.
NOTE K 401(k) AND EMPLOYEE STOCK OWNERSHIP PLAN
The Company maintains a 401(k) and Employee Stock Ownership Plan (Plan) for the benefit of its employees. Company contributions are made semi-annually as approved by the Board of Directors. Such amounts are not in excess of amounts permitted by the Employee Retirement Income Security Act of 1974.
Plan participants may make voluntary after-tax contributions of their considered earnings as defined by the Plan. In addition, participants may make pre-tax contributions up to the statutory limits through the 401(k) provisions of the Plan. The annual addition from contributions to an individual participant's account in this Plan cannot exceed the lesser of 100% of base salary or $49 thousand. Under provisions of the Plan, employees are eligible to participate on the date of hire and become fully vested in the Company's contributions following six years of service. In August 1995 the Company received a favorable determination from the Internal Revenue Service to include an Employee Stock Ownership feature as part of the Plan. This feature allows employees to direct a portion of their vested account balance toward the purchase of Company stock. Company contributions to the Plan amounted to $5,400,000, $5,400,000 and $4,800,000 for the years ended 2012, 2011 and 2010, respectively.
WASHINGTON FEDERAL, INC. AND SUBSIDIARIES
NOTES TO THE CONSOLIDATED FINANCIAL STATEMENTS
YEARS ENDED SEPTEMBER 30, 2012, 2011 AND 2010
NOTE L STOCK OPTION PLANS
The Company has one equity-based compensation plan which was approved by stockholders and provides for a combination of stock options and stock grants. Option awards are granted with an exercise price equal to the market price of the Company's stock at the date of grant; those option awards generally vest based on 5 years of continuous service and have 10-year contractual terms. The Company's policy is to issue new shares upon option exercises. Stockholders authorized 5,000,000 shares of common stock to be reserved pursuant to the 2011 Incentive Plan. Of the 5,000,000 total shares authorized by stockholders under the Plan, 4,626,350 shares remain available for issuance.
The fair value of options granted is estimated on the date of grant using the Black-Scholes option-pricing model. This model requires input of highly subjective assumptions, changes to which can materially affect the fair value estimate. Additionally, there may be other factors that would otherwise have a significant effect on the value of employee stock options granted but are not considered by the model. Expected volatility is based on the historical volatility of the Company's stock. The risk-free interest rate is based on the U.S. Treasury yield curve that is in effect at the time of grant with a remaining term equal to the options' expected life. The expected term represents the period of time that options granted are expected to be outstanding. The following weighted-average assumptions were used to estimate the fair value of options granted during the periods indicated:
|
| | | | | | |
| Year ended September 30, | 2012 | 2011 | 2010 |
| Annual dividend yield | 2.34 | % | 1.89 | % | 1.20 | % |
| Expected volatility | 31 | % | 30 | % | 26 | % |
| Risk-free interest rate | 0.77 | % | 2.00 | % | 2.20 | % |
| Expected life | 4.5 years |
| 4.5 years |
| 4.5 years |
|
A summary of option activity under the Plans as of 2012, and changes during the year then ended is as follows:
|
| | | | | | | | | |
| Options | Shares | Weighted
Average
Exercise
Price | Weighted
Average
Remaining
Contractual
Term | Aggregate
Intrinsic
Value
(In thousands) |
| Outstanding at September 30, 2011 | 2,741,240 |
| $ | 19.97 |
| | |
| Granted | 3,000 |
| 17.07 |
| | |
| Exercised | (28,389 | ) | 12.57 |
| | |
| Forfeited | (415,745 | ) | 16.92 |
| | |
| Outstanding at September 30, 2012 | 2,300,106 |
| $ | 20.60 |
| 4 | $ | 1,269 |
|
| Exercisable at September 30, 2012 | 1,685,834 |
| $ | 21.69 |
| 3 | $ | 602 |
|
Miscellaneous information related to stock options is presented below:
|
| | | | | | | | | |
| | 2012 | 2011 | 2010 |
| | (Dollars in thousands) |
| Compensation cost for stock options | $ | 848 |
| $ | 1,087 |
| $ | 1,213 |
|
| Weighted avg. grant date FV | 3.53 |
| 3.89 |
| 4.43 |
|
| Total intrinsic value of options exercised | 125 |
| 259 |
| 975 |
|
| Grant date FV of options exercised | 54 |
| 312 |
| 482 |
|
| Cash received from option exercises | — |
| 1,630 |
| 1,760 |
|
| Tax benefit realized for option exercises | — |
| 37 |
| 227 |
|
WASHINGTON FEDERAL, INC. AND SUBSIDIARIES
NOTES TO THE CONSOLIDATED FINANCIAL STATEMENTS
YEARS ENDED SEPTEMBER 30, 2012, 2011 AND 2010
A summary of the status of the Company's nonvested options as of 2012, and changes during the year then ended is as follows:
|
| | | | | |
| Nonvested Options | Shares | Weighted
Average
Grant Date
Fair Value |
| Outstanding at September 30, 2011 | 1,008,858 |
| $ | 3.02 |
|
| Granted | 3,000 |
| 3.53 |
|
| Vested | (310,591 | ) | 2.59 |
|
| Forfeited | (86,995 | ) | 3.28 |
|
| Outstanding at September 30, 2012 | 614,272 |
| $ | 3.20 |
|
As of September 30, 2012, unrecognized compensation cost for stock options, net of forfeitures, totaled $1,352,000, which is expected to be recognized over a weighted average remaining period of 1.7 years.
The Company also grants shares of restricted stock pursuant to its plans. These shares of restricted stock vest over a period of one to seven years. The Company has issued a total of 630,735 shares of restricted stock, with a fair market value at the date of grant of $10.7 million As of 2012, 189,609 shares remained restricted. The Company accounts for restricted stock grants by recording the fair value of the grant to compensation expense over the vesting period. Compensation expense related to restricted stock was $1,992,000, $1,537,000 and $1,055,000 for the years ended 2012, 2011 and 2010, respectively.
WASHINGTON FEDERAL, INC. AND SUBSIDIARIES
NOTES TO THE CONSOLIDATED FINANCIAL STATEMENTS
YEARS ENDED SEPTEMBER 30, 2012, 2011 AND 2010
NOTE M STOCKHOLDERS' EQUITY
The Bank is subject to various regulatory capital requirements administered by the Office of the Comptroller of the Currency (OCC). Failure to meet minimum capital requirements can initiate certain mandatory and possibly additional discretionary action by regulators that, if undertaken, could have a direct material effect on the Company's financial statements. Under capital adequacy guidelines and the regulatory framework for prompt corrective action, the Bank must meet specific capital guidelines that involve quantitative measures of the Bank's assets, liabilities and certain off-balance sheet items as calculated under regulatory accounting practices. Capital amounts and classification are also subject to qualitative judgments by the regulators about capital components, risk-weightings and other factors. The Company and the Bank are subject to certain restrictions on the amount of dividends that they may declare without prior regulatory approval.
As of September 30, 2012 and 2011 , the OCC categorized the Bank as well capitalized under the regulatory framework for prompt corrective action. To be categorized as well capitalized, the Bank must maintain minimum total risk-based, Tier 1 risk-based and Tier 1 leverage ratios as set forth in the following table. There are no conditions or events since that notification that management believes have changed the Bank's categorization.
|
| | | | | | | | | | | | | |
| | Actual | Capital Adequacy
Guidelines | Categorized as Well Capitalized Under Prompt Corrective Action Provisions |
| Capital | Ratio | Capital | Ratio | Capital | Ratio |
| September 30, 2012 | (In thousands) |
| Total capital to risk-weighted assets | $ | 1,653,760 |
| 27.29 | % | $ | 484,822 |
| 8.00% | $ | 606,028 |
| 10.00% |
| Tier I capital to risk-weighted assets | 1,577,280 |
| 26.03 |
| NA |
| NA | 363,617 |
| 6.00 |
| Core capital to adjusted tangible assets | 1,577,280 |
| 12.92 |
| NA |
| NA | 610,556 |
| 5.00 |
| Core capital to total assets | 1,577,280 |
| 12.92 |
| 366,334 |
| 3.00 | NA |
| NA |
| Tangible capital to tangible assets | 1,577,280 |
| 12.92 |
| 183,167 |
| 1.50 | NA |
| NA |
| September 30, 2011 | | | | | | |
| Total capital to risk-weighted assets | $ | 1,624,817 |
| 24.68 | % | $ | 526,765 |
| 8.00% | $ | 658,456 |
| 10.00% |
| Tier I capital to risk-weighted assets | 1,543,438 |
| 23.44 |
| NA |
| NA | 395,074 |
| 6.00 |
| Core capital to adjusted tangible assets | 1,543,438 |
| 11.82 |
| NA |
| NA | 652,672 |
| 5.00 |
| Core capital to total assets | 1,543,438 |
| 11.82 |
| 391,603 |
| 3.00 | NA |
| NA |
| Tangible capital to tangible assets | 1,543,438 |
| 11.82 |
| 195,802 |
| 1.50 | NA |
| NA |
At periodic intervals, the OCC, the Federal Reserve and the Federal Deposit Insurance Corporation (FDIC) routinely examine the Company's and the Bank's financial statements as part of their oversight. Based on their examinations, these regulators can direct that the Company's or Bank's financial statements be adjusted in accordance with their findings. The extent to which forthcoming regulatory examinations may result in adjustments to the financial statements cannot be determined; however, no adjustments were proposed as a result of the most recent examination which concluded in June, 2012.
The Company has an ongoing stock repurchase program. 2,895,484 shares were repurchased during 2012 at a weighted average cost of $14.48. In 2011, 3,804,800 shares were repurchased during the year at a weighted average price of $15.68. As of September 30, 2012, management had authorization from the Board of Directors to repurchase up to 6,188,030 additional shares.
NOTE N FAIR VALUES OF FINANCIAL INSTRUMENTS
U.S. GAAP requires disclosure of fair value information about financial instruments, whether or not recognized on the statement of financial condition, for which it is practicable to estimate those values. Certain financial instruments and all non-financial instruments are excluded from the disclosure requirements. Accordingly, the aggregate fair value estimates presented do not reflect the underlying fair value of the Company. Although Management is not aware of any factors that would
WASHINGTON FEDERAL, INC. AND SUBSIDIARIES
NOTES TO THE CONSOLIDATED FINANCIAL STATEMENTS
YEARS ENDED SEPTEMBER 30, 2012, 2011 AND 2010
materially affect the estimated fair value amounts presented, such amounts have not been comprehensively revalued for purposes of these financial statements since that date, and therefore, estimates of fair value subsequent to that date may differ significantly from the amounts presented below.
|
| | | | | | | | | | | | | |
| | | 2012 | 2011 |
| Level in Fair Value Hierarchy | Carrying Amount | Estimated Fair Value | Carrying Amount | Estimated Fair Value |
| | | (In thousands) |
| Financial assets | | | | | |
| Cash and cash equivalents | 1 | $ | 751,430 |
| $ | 751,430 |
| $ | 816,002 |
| $ | 816,002 |
|
| Available-for-sale securities: | 2 |
|
| | |
| Equity securities | |
|
| — |
| — |
| — |
|
| Obligations of U.S. government | | 183,560 |
| 183,560 |
| 190,527 |
| 190,527 |
|
| Obligations of states and political subdivisions | | 24,844 |
| 24,844 |
| 23,568 |
| 23,568 |
|
| Obligations of foreign governments | | — |
| — |
| — |
| — |
|
| Corporate debt securities | | 403,325 |
| 403,325 |
| 29,959 |
| 29,959 |
|
| Mortgage-backed securities | |
|
| | |
| Agency pass-through certificates | | 1,169,976 |
| 1,169,976 |
| 3,011,090 |
| 3,011,090 |
|
| Other debt securities | | — |
| — |
| — |
| — |
|
| Total available-for-sale securities | | 1,781,705 |
| 1,781,705 |
| 3,255,144 |
| 3,255,144 |
|
| Held-to-maturity securities: | 2 | | | | |
| Equity securities | | — |
| — |
| — |
| — |
|
| Obligations of U.S. government | | — |
| — |
| — |
| — |
|
| Obligations of states and political subdivisions | | 795 |
| 802 |
| 1,950 |
| 2,023 |
|
| Obligations of foreign governments | | — |
| — |
| — |
| — |
|
| Corporate debt securities | | — |
| — |
| — |
| — |
|
| Mortgage-backed securities | |
|
| | |
| Agency pass-through certificates | | 1,190,692 |
| 1,216,421 |
| 45,086 |
| 48,593 |
|
| Other debt securities | | — |
| — |
| — |
| — |
|
| Total held-to-maturity securities | | 1,191,487 |
| 1,217,223 |
| 47,036 |
| 50,616 |
|
| Loans receivable | 3 | 7,451,998 |
| 7,949,892 |
| 7,935,877 |
| 8,479,307 |
|
| Covered loans | 3 | 288,376 |
| 289,754 |
| 382,183 |
| 375,027 |
|
| FDIC indemnification asset | 3 | 87,571 |
| 85,846 |
| 98,871 |
| 101,751 |
|
| FHLB stock | 2 | 149,840 |
| 149,840 |
| 151,755 |
| 151,755 |
|
| Financial liabilities | |
|
| | |
| Customer accounts | 2 | 8,576,618 |
| 8,406,432 |
| 8,665,903 |
| 8,557,357 |
|
| FHLB advances and other borrowings | 2 | 1,880,000 |
| 2,110,223 |
| 2,762,066 |
| 3,038,127 |
|
The following methods and assumptions were used to estimate the fair value of financial instruments:
Cash and cash equivalents – The carrying amount of these items is a reasonable estimate of their fair value.
Available-for-sale securities and held-to-maturity securities – Securities at fair value are priced using model pricing based on the securities' relationship to other benchmark quoted prices as provided by an independent third party, and under the
WASHINGTON FEDERAL, INC. AND SUBSIDIARIES
NOTES TO THE CONSOLIDATED FINANCIAL STATEMENTS
YEARS ENDED SEPTEMBER 30, 2012, 2011 AND 2010
provisions of the Fair Value Measurements and Disclosures topic of the FASB Accounting Standards Codification are considered a Level 2 input method.
Loans receivable and covered loans – For certain homogeneous categories of loans, such as fixed- and variable-rate residential mortgages, fair value is estimated for securities backed by similar loans, adjusted for differences in loan characteristics, using the same methodology described above for AFS and HTM securities. The fair value of other loan types is estimated by discounting the future cash flows and estimated prepayments using the current rates at which similar loans would be made to borrowers with similar credit ratings and for the same remaining term. Some loan types were valued at carrying value because their floating rate or expected maturity characteristics. Net deferred loan fees are not included in the fair value calculation but are included in the carrying amount.
FDIC indemnification asset – The fair value of the indemnification asset is estimated by discounting the expected future cash flows using the current rates .
FHLB stock – The fair value is based upon the redemption value of the stock which equates to its carrying value.
Customer accounts – The fair value of demand deposits, savings accounts, and money market accounts is the amount payable on demand at the reporting date. The fair value of fixed-maturity certificates of deposit is estimated by discounting the estimated future cash flows using the rates currently offered for deposits with similar remaining maturities.
FHLB advances and other borrowings – The fair value of FHLB advances and other borrowings is estimated by discounting the estimated future cash flows using rates currently available to the Company for debt with similar remaining maturities.
NOTE O FINANCIAL INFORMATION – WASHINGTON FEDERAL, INC.
The following Washington Federal, Inc. (parent company only) financial information should be read in conjunction with the other notes to the Consolidated Financial Statements.
WASHINGTON FEDERAL, INC. AND SUBSIDIARIES
NOTES TO THE CONSOLIDATED FINANCIAL STATEMENTS
YEARS ENDED SEPTEMBER 30, 2012, 2011 AND 2010
|
| | | | | | |
| Statements of Financial Condition | | |
| September 30, | 2012 | 2011 |
| | (In thousands) |
| Assets | | |
| Cash | $ | 61,926 |
| $ | 27,699 |
|
| Investment in subsidiary | 1,846,375 |
| 1,885,498 |
|
| Other Assets | 1 |
| 37 |
|
| Dividend receivable | — |
| — |
|
| Total assets | $ | 1,908,302 |
| $ | 1,913,234 |
|
| Liabilities | | |
| Borrowed money | $ | — |
| $ | — |
|
| Dividend payable and other liabilities | 8,550 |
| 6,700 |
|
| Other liabilities | — |
| 1 |
|
| Total liabilities | 8,550 |
| 6,701 |
|
| Stockholders’ equity | | |
Common stock, $1.00 par value, 300,000,000 shares authorized;
129,950,223 and 129,853,534 shares issued; 106,177,615 and 108,976,410 shares outstanding | $ | 129,950 |
| $ | 129,854 |
|
| Paid-in capital | 1,586,295 |
| 1,582,843 |
|
| Accumulated other comprehensive income (loss), net of tax | 13,306 |
| 85,789 |
|
| Treasury stock, at cost; 23,772,608 and 20,877,124 shares | (310,579 | ) | (268,665 | ) |
| Retained earnings | 480,780 |
| 376,712 |
|
| Total stockholders’ equity | 1,899,752 |
| 1,906,533 |
|
| Total liabilities and stockholders’ equity | $ | 1,908,302 |
| $ | 1,913,234 |
|
WASHINGTON FEDERAL, INC. AND SUBSIDIARIES
NOTES TO THE CONSOLIDATED FINANCIAL STATEMENTS
YEARS ENDED SEPTEMBER 30, 2012, 2011 AND 2010
|
| | | | | | | | | |
| Statements of Operations | | | |
| Year ended September 30, | 2012 | 2011 | 2010 |
| | (In thousands) |
| Income | | | |
| Dividends from subsidiary | $ | 106,234 |
| $ | 100,600 |
| $ | — |
|
| Other | — |
| — |
| 14 |
|
| Total Income | 106,234 |
| 100,600 |
| 14 |
|
| Expense |
|
|
|
| Miscellaneous | 564 |
| 626 |
| 1,046 |
| Total expense | 564 |
| 626 |
| 1,046 |
| |
|
|
|
| Net income before equity in undistributed net income of subsidiary | 105,670 |
| 99,974 |
| (1,032 | ) |
| Equity in undistributed net income of subsidiary | 32,513 |
| 11,167 |
| 119,324 |
|
| Income before income taxes | 138,183 |
| 111,141 |
| 118,292 |
|
| Income tax benefit | — |
| — |
| 361 |
|
| Net income | $ | 138,183 |
| $ | 111,141 |
| $ | 118,653 |
|
| | | | |
| Statements of Cash Flows | 2012 | 2011 | 2010 |
| | (In thousands) |
| Cash Flows From Operating Activities | | | |
| Net income | $ | 138,183 |
| $ | 111,141 |
| $ | 118,653 |
|
| Adjustments to reconcile net income to net cash provided by operating activities | | | |
| Equity in undistributed net income of subsidiaries | (32,513 | ) | (4,382 | ) | (119,324 | ) |
| Decrease (increase) in dividend receivable | — |
| — |
| — |
|
| Decrease (increase) in other assets | 36 |
| (37 | ) | 1,309 |
|
| Increase (decrease) in other liabilities | 2,508 |
| 1,121 |
| (421 | ) |
| Net cash provided by (used in) operating activities | 108,214 |
| 107,843 |
| 217 |
|
| Cash Flows From Financing Activities | | | |
| Proceeds from exercise of common stock options and related tax benefit | 357 |
| 1,686 |
| 1,940 |
|
| Proceeds from Employee Stock Ownership Plan | — |
| — |
| — |
|
| Net proceeds from follow on stock offering |
|
|
|
| — |
|
| Downstream stock offering proceeds to the Bank | — |
| — |
| — |
|
| Proceeds from issuance of preferred stock and warrants |
|
|
|
|
|
|
| Preferred stock redeemed |
|
|
|
|
|
|
| Increase (decrease) in borrowings | — |
| — |
| (14,310 | ) |
| Treasury stock purchased | (41,914 | ) | (59,680 | ) | — |
|
| Dividends paid on preferred stock |
|
|
|
|
|
|
| Dividends paid on common stock | (32,430 | ) | (26,796 | ) | (22,450 | ) |
| Net cash used by financing activities | (73,987 | ) | (84,790 | ) | (34,820 | ) |
| Increase (decrease) in cash | 34,227 |
| 23,053 |
| (34,603 | ) |
| Cash at beginning of year | 27,699 |
| 4,646 |
| 39,249 |
|
| Cash at end of year | $ | 61,926 |
| $ | 27,699 |
| $ | 4,646 |
|
WASHINGTON FEDERAL, INC. AND SUBSIDIARIES
NOTES TO THE CONSOLIDATED FINANCIAL STATEMENTS
YEARS ENDED SEPTEMBER 30, 2012, 2011 AND 2010
NOTE P SELECTED QUARTERLY FINANCIAL DATA (UNAUDITED)
The following is a summary of the unaudited interim results of operations by quarter for the years ended September 30, 2012 and 2011:
|
| | | | | | | | | | | | |
| Year Ended September 30, 2012 | First Quarter | Second Quarter | Third Quarter | Fourth Quarter |
| | (In thousands, except per share data) |
| Interest income | $ | 155,926 |
| $ | 154,581 |
| $ | 145,384 |
| $ | 134,380 |
|
| Interest expense | 52,212 |
| 49,979 |
| 48,849 |
| 42,209 |
|
| Net interest income | 103,714 |
| 104,602 |
| 96,535 |
| 92,171 |
|
| Provision for loan losses | 11,210 |
| 18,000 |
| 10,366 |
| 5,379 |
|
| Other operating income (REO expense) | (5,923 | ) | 3,446 |
| 4,736 |
| 4,439 |
|
| Other operating expense | 34,365 |
| 36,812 |
| 35,964 |
| 35,713 |
|
| Income before income taxes | 52,216 |
| 53,236 |
| 54,941 |
| 55,518 |
|
| Income taxes | 18,798 |
| 19,165 |
| 19,778 |
| 19,987 |
|
| Net income | $ | 33,418 |
| $ | 34,071 |
| $ | 35,163 |
| $ | 35,531 |
|
| Basic earnings per share | $ | 0.31 |
| $ | 0.32 |
| $ | 0.33 |
| $ | 0.33 |
|
| Diluted earnings per share | 0.31 |
| 0.32 |
| 0.33 |
| 0.33 |
|
| Cash dividends per share | 0.08 |
| 0.08 |
| 0.08 |
| 0.08 |
|
| Return of average assets | 0.98 | % | 1.00 | % | 1.04 | % | 1.10 | % |
|
| | | | | | | | | | | | |
| Year Ended September 30, 2011 | First Quarter | Second Quarter | Third Quarter | Fourth Quarter |
| | (In thousands, except per share data) |
| Interest income | $ | 165,590 |
| $ | 158,539 |
| $ | 161,531 |
| $ | 158,975 |
|
| Interest expense | 60,856 |
| 56,984 |
| 55,399 |
| 54,457 |
|
| Net interest income | 104,734 |
| 101,555 |
| 106,132 |
| 104,518 |
|
| Provision for loan losses | 26,000 |
| 30,750 |
| 21,000 |
| 15,354 |
|
| Other operating income (REO expense) | (6,127 | ) | 2,866 |
| (3,894 | ) | (6,962 | ) |
| Other operating expense | 34,279 |
| 33,321 |
| 34,174 |
| 34,285 |
|
| Income before income taxes | 38,328 |
| 40,350 |
| 47,064 |
| 47,917 |
|
| Income taxes | 13,798 |
| 14,526 |
| 16,943 |
| 17,251 |
|
| Net income | $ | 24,530 |
| $ | 25,824 |
| $ | 30,121 |
| $ | 30,666 |
|
| Basic earnings per share | $ | 0.22 |
| $ | 0.23 |
| $ | 0.27 |
| $ | 0.28 |
|
| Diluted earnings per share | 0.22 |
| 0.23 |
| 0.27 |
| 0.28 |
|
| Cash dividends per share | 0.06 |
| 0.06 |
| 0.06 |
| 0.06 |
|
| Return of average assets | 0.73 | % | 0.77 | % | 0.90 | % | 0.91 | % |
NOTE Q Fair Value Measurements
U.S. GAAP defines fair value as the exchange price that would be received for an asset or paid to transfer a liability (an exit price) in the principal or most advantageous market for the asset or liability in an orderly transaction between market participants on the measurement date. U.S. GAAP also establishes a fair value hierarchy which requires an entity to maximize the use of observable inputs and minimize the use of unobservable inputs when measuring fair value. The standard describes three levels of inputs that may be used to measure fair value:
WASHINGTON FEDERAL, INC. AND SUBSIDIARIES
NOTES TO THE CONSOLIDATED FINANCIAL STATEMENTS
YEARS ENDED SEPTEMBER 30, 2012, 2011 AND 2010
Level 1: Quoted prices (unadjusted) for identical assets or liabilities in active exchange markets that the entity has the ability to access as of the measurement date.
Level 2: Significant other observable inputs other than Level 1 prices, such as quoted prices for similar assets or liabilities, quoted prices in markets that are not active and other inputs that are observable or can be corroborated by observable market data.
Level 3: Significant unobservable inputs that reflect a company’s own assumptions about the assumptions that market participants would use in pricing an asset or liability.
We have established and documented the Company's process for determining the fair values of our assets and liabilities, where applicable. Fair value is based on quoted market prices, when available, for identical or similar assets or liabilities. In the absence of quoted market prices, fair value is determined using valuation models or third-party appraisals. The following is a description of the valuation methodologies used to measure and report the fair value of financial assets and liabilities on a recurring or nonrecurring basis:
Measured on a Recurring Basis
Securities
Securities available for sale are recorded at fair value on a recurring basis. Securities at fair value are priced using model pricing based on the securities' relationship to other benchmark quoted prices as provided by an independent third party, and under the provisions of the Fair Value Measurements and Disclosures topic of the FASB Accounting Standards Codification are considered a Level 2 input method.
The following table presents the balance of assets measured at fair value on a recurring basis at September 30, 2012:
|
| | | | | | | | | | | | | | | |
| | Fair Value at September 30, 2012 |
| | Level 1 | | Level 2 | | Level 3 | | Total |
| | (In thousands) |
| Available-for-sale securities | | | | | | | |
| Equity securities | $ | — |
| | $ | 541 |
| | $ | — |
| | $ | 541 |
|
| Obligations of U.S. government | — |
| | 183,018 |
| | — |
| | 183,018 |
|
| Obligations of states and political subdivisions | — |
| | 24,844 |
| | — |
| | 24,844 |
|
| Obligations of foreign governments | — |
| | — |
| | — |
| | — |
|
| Corporate debt securities | — |
| | 403,326 |
| | — |
| | 403,326 |
|
| Agency pass through mortgage-backed securities | — |
| | 1,169,976 |
| | — |
| | 1,169,976 |
|
| Other debt securities | — |
| | — |
| | — |
| | — |
|
| Balance at end of period | $ | — |
| | $ | 1,781,705 |
| | $ | — |
| | $ | 1,781,705 |
|
There were no transfers between, into and/or out of Levels 1, 2 or 3 during the year ended September 30, 2012.
Measured on a Nonrecurring Basis
Impaired Loans & Real Estate Held for Sale
From time to time, and on a nonrecurring basis, fair value adjustments to collateral-dependent loans and real estate held for sale are recorded to reflect write-downs of principal balances based on the current appraised or estimated value of the collateral. When management determines that the fair value of the collateral or the real estate held for sale requires additional adjustments, either as a result of a non-current appraisal value or when there is no observable market price, the Company classifies the impaired loan or real estate held for sale as Level 3. Level 3 assets recorded at fair value on a nonrecurring basis at September 30, 2012, included loans for which a specific reserve allowance was established or a partial charge-off was recorded based on the fair value of collateral, as well as covered REO and real estate held for sale for which fair value of the properties was less than the cost basis.
Real estate held for sale consists principally of properties acquired through foreclosure.
WASHINGTON FEDERAL, INC. AND SUBSIDIARIES
NOTES TO THE CONSOLIDATED FINANCIAL STATEMENTS
YEARS ENDED SEPTEMBER 30, 2012, 2011 AND 2010
The following table presents the aggregated balance of assets measured at estimated fair value on a nonrecurring basis for the year ended September 30, 2012, and the total losses resulting from those fair value adjustments for the quarter and year ended September 30, 2012. The following estimated fair values are shown gross of estimated selling costs:
|
| | | | | | | | | | | | | | | | | | | | | | | |
| | Through September 30, 2012 | | Quarter
Ended
September 30, 2012 | | Year Ended September 30, 2012 |
| | Level 1 | | Level 2 | | Level 3 | | Total | | Total Losses |
| | (In thousands) | | |
| Impaired loans (1) | $ | — |
| | $ | — |
| | $ | 179,626 |
| | $ | 179,626 |
| | $ | 6,259 |
| | $ | 42,550 |
|
| Covered REO (2) | — |
|
| — |
|
| 39,540 |
| | 39,540 |
| | 295 |
| | 2,419 |
|
| Real estate held for sale (2) | — |
| | — |
| | 195,930 |
| | 195,930 |
| | 17,876 |
| | 78,976 |
|
| Balance at end of period | $ | — |
| | $ | — |
| | $ | 415,096 |
| | $ | 415,096 |
| | $ | 24,430 |
| | $ | 123,945 |
|
___________________
| |
| (1) | The losses represents remeasurements of collateral-dependent loans. |
| |
| (2) | The losses represents aggregate writedowns and charge-offs on real estate held for sale. |
There were no liabilities carried at fair value, measured on a recurring or nonrecurring basis, at September 30, 2012.
The following describes the process used to value Level 3 assets measured on a nonrecurring basis:
Impaired loans - The Company adjusts the carrying amount of impaired loans when there is evidence of probable loss and the expected fair value of the loan is less than its contractual amount. The amount of the impairment may be determined based on the estimated present value of future cash flows or the fair value of the underlying collateral. Impaired loans with a specific reserve allowance based on cash flow analysis or the value of the underlying collateral are classified as Level 3 assets.
The evaluations for impairment are prepared by the Problem Loan Review Committee, which is chaired by the Chief Credit Officer and includes the Loan Review manager and Special Credits manager, as well as senior credit officers, division managers and group executives, as applicable. These evaluations are performed in conjunction with the quarterly allowance for loan loss ("ALLL") process.
Applicable loans are evaluated for impairment on a quarterly basis. Loans included in the previous quarter's review are reevaluated and if their values are materially different from the prior quarter evaluation, the underlying information (loan balance and collateral value) are compared. Material differences are evaluated for reasonableness and discussions are held between the relationship manager and their division manager to understand the difference and determine if any adjustment is necessary. The inputs are developed and substantiated on a quarterly basis, based on current borrower developments, market conditions and collateral values. The following method is used to value impaired loans:
| |
| • | The fair value of the collateral, which may take the form of real estate or personal property, is based on internal estimates, field observations, assessments provided by third-party appraisers and other valuation models. The Company performs or reaffirms valuations of collateral-dependent impaired loans at least annually. Adjustments are made if management believes that more recent information is available and relevant with respect to the fair value of the collateral. |
Real estate held for sale ("REO") - These assets are valued based on inputs such as appraisals and third-party price opinions, less estimated selling costs. Assets that are acquired through foreclosure are recorded initially at the lower of the loan balance or fair value at the date of foreclosure. After foreclosure, valuations are updated periodically, and current market conditions my require the assets to be written down further to a new cost basis. The following method is used to value real estate held for sale:
| |
| • | When a loan is reclassified from loan status to real estate held for sale due to the Company taking possession of the collateral, a Special Credits officer, along with the Special Credits manager, obtains a valuation, which may include a third-party appraisal, which is used to establish the fair value of the underlying collateral. The determined fair value, to the extent it does not exceed the carrying value of the loan, becomes the carrying value of the REO asset. In addition to the valuations from independent third-party sources, the carrying balance of REO assets are written down once a bona fide offer is contractually accepted, through execution of a Purchase and Sale Agreement, where the |
WASHINGTON FEDERAL, INC. AND SUBSIDIARIES
NOTES TO THE CONSOLIDATED FINANCIAL STATEMENTS
YEARS ENDED SEPTEMBER 30, 2012, 2011 AND 2010
accepted price is lower than the current balance of the particular REO asset. The fair value of REO assets is re-evaluated quarterly and the REO asset is adjusted to reflect the lower of cost or fair value as necessary.
WASHINGTON FEDERAL, INC. AND SUBSIDIARIES
NOTES TO THE CONSOLIDATED FINANCIAL STATEMENTS
YEARS ENDED SEPTEMBER 30, 2012, 2011 AND 2010
NOTE R Covered Assets
Covered assets represent loans and real estate held for sale acquired from the FDIC that are subject to loss sharing agreements and were $317,925,000 as of September 30, 2012, versus $438,566,000 as of September 30, 2011.
The Company evaluated the acquired loans for impairment. Loans are accounted for under ASC 310-30 when there is evidence of credit deterioration since origination and for which it is probable, at acquisition, that the Company would be unable to collect all contractually required payments. The following table reflects the carrying value of all acquired impaired and non-impaired loans as of September 30, 2012 and 2011:
|
| | | | | | | | | | | | | | | | | | | |
| | September 30, 2012 | | September 30, 2011 |
| | Acquired Impaired Loans | Acquired Non-impaired Loans | Total | | Acquired Impaired Loans | Acquired Non-impaired Loans | Total |
| | (In thousands) |
| Single-family residential | $ | 7,699 |
| $ | 35,676 |
| $ | 43,375 |
| | $ | 9,235 |
| $ | 46,214 |
| $ | 55,449 |
|
| Construction – speculative | 4,519 |
| 90 |
| 4,609 |
| | 8,006 |
| 1,315 |
| 9,321 |
|
| Construction – custom | 1,196 |
| — |
| 1,196 |
| | 2,799 |
| — |
| 2,799 |
|
| Land – acquisition & development | 22,747 |
| 11,430 |
| 34,177 |
| | 32,159 |
| 15,058 |
| 47,217 |
|
| Land – consumer lot loans | 497 |
| 498 |
| 995 |
| | 499 |
| 654 |
| 1,153 |
|
| Multi-family | 4,698 |
| 27,645 |
| 32,343 |
| | 9,333 |
| 34,906 |
| 44,239 |
|
| Commercial real estate | 83,784 |
| 121,592 |
| 205,376 |
| | 101,599 |
| 148,464 |
| 250,063 |
|
| Commercial & industrial | 18,504 |
| 13,023 |
| 31,527 |
| | 35,993 |
| 22,881 |
| 58,874 |
|
| HELOC | 309 |
| 17,971 |
| 18,280 |
| | 1,829 |
| 21,730 |
| 23,559 |
|
| Consumer | 659 |
| 918 |
| 1,577 |
| | 1,485 |
| 1,199 | 2,684 |
|
| Total covered loans | $ | 144,612 |
| $ | 228,843 |
| $ | 373,455 |
| | $ | 202,937 |
| $ | 292,421 |
| $ | 495,358 |
|
| Allowance for losses | — |
| — |
| — |
| | (3,766 | ) | — |
| (3,766 | ) |
| | $ | 144,612 |
| $ | 228,843 |
| $ | 373,455 |
| | $ | 199,171 |
| $ | 292,421 |
| $ | 491,592 |
|
| Discount | | | (85,079 | ) | | | | (109,409 | ) |
| Covered loans, net | | | $ | 288,376 |
| | | | $ | 382,183 |
|
WASHINGTON FEDERAL, INC. AND SUBSIDIARIES
NOTES TO THE CONSOLIDATED FINANCIAL STATEMENTS
YEARS ENDED SEPTEMBER 30, 2012, 2011 AND 2010
Changes in the carrying amount and accretable yield for acquired impaired and non-impaired loans were as follows for the fiscal years ended September 30, 2012 and 2011:
|
| | | | | | | | | | | | | | | | | | | | | | | | | | | | | | | |
| | September 30, 2012 | | September 30, 2011 |
| | Acquired Impaired | | Acquired Non-impaired | | Acquired Impaired | | Acquired Non-impaired |
| | Accretable Yield | | Carrying Amount of Loans | | Accretable Yield | | Carrying Amount of Loans | | Accretable Yield | | Carrying Amount of Loans | | Accretable Yield | | Carrying Amount of Loans |
| | (In thousands) | | (In thousands) |
| Balance at beginning of period | $ | 37,072 |
| | $ | 116,061 |
| | $ | 30,370 |
| | $ | 269,888 |
| | $ | 27,019 |
| | $ | 190,530 |
| | $ | 39,813 |
| | $ | 343,944 |
|
| Additions | — |
| | — |
| | — |
| | — |
| | — |
| | — |
| | — |
| | — |
|
| Reclassification from nonaccretable balance, net | 34,690 |
| | — |
| | — |
| | — |
| | 24,025 |
| | — |
| | — |
| | — |
|
| Accretion | (20,860 | ) | | 20,860 |
| | (6,581 | ) | | 6,581 |
| | (13,972 | ) | | 13,972 |
| | (9,443 | ) | | 9,443 |
|
| Transfers to REO | — |
| | (15,905 | ) | | — |
| | — |
| | — |
| | (54,638 | ) | | — |
| | — |
|
| Payments received, net | — |
| | (46,063 | ) | | — |
| | (63,046 | ) | | — |
| | (33,803 | ) | | — |
| | (83,499 | ) |
| Balance at end of period | $ | 50,902 |
| | $ | 74,953 |
| | $ | 23,789 |
| | $ | 213,423 |
| | $ | 37,072 |
| | $ | 116,061 |
| | $ | 30,370 |
| | $ | 269,888 |
|
At September 30, 2012, none of the acquired impaired or non-impaired loans were classified as non-performing assets. Therefore, interest income, through accretion of the difference between the carrying amount of the loans and the expected cash flows, was recognized on all acquired loans. The allowance for credit losses related to the acquired loans results from decreased expectations of future cash flows due to increased credit losses for certain acquired loan pools.
The outstanding principal balance of acquired loans was $373,455,000 and $491,592,000 as of September 30, 2012 and September 30, 2011, respectively. The discount balance related to the acquired loans was $85,079,000 and $109,409,000 as of September 30, 2012 and September 30, 2011, respectively.
The following table shows the year to date activity for the FDIC indemnification asset:
|
| | | | | | | |
| | September 30,
2012 | | September 30,
2011 |
| | (In thousands) |
| Balance at beginning of period | $ | 101,634 |
| | $ | 131,128 |
|
| Additions | 3,284 |
| | 10,470 |
|
| Payments received | (3,456 | ) | | (32,828 | ) |
| Amortization | (15,510 | ) | | (10,239 | ) |
| Accretion | 1,619 |
| | 3,103 |
|
| Balance at end of period | $ | 87,571 |
| | $ | 101,634 |
|
WASHINGTON FEDERAL, INC. AND SUBSIDIARIES
NOTES TO THE CONSOLIDATED FINANCIAL STATEMENTS
YEARS ENDED SEPTEMBER 30, 2012, 2011 AND 2010
The following tables provide information on covered loans based on credit quality indicators (defined in Note A) as of September 30, 2012:
Credit Risk Profile by Internally Assigned Grade:
|
| | | | | | | | | | | | | | | | | | | | | | | |
| | Internally Assigned Grade | | Total Net Loans |
| | Pass | | Special mention | | Substandard | | Doubtful | | Loss | |
| | (In thousands) |
| Purchased non-credit impaired loans: | | | | | | | | | | | |
| Single-family residential | $ | 32,272 |
| | $ | — |
| | $ | 3,404 |
| | $ | — |
| | $ | — |
| | $ | 35,676 |
|
| Construction - speculative | 90 |
| | — |
| | — |
| | — |
| | — |
| | 90 |
|
| Construction - custom | — |
| | — |
| | — |
| | — |
| | — |
| | — |
|
| Land - acquisition & development | 3,440 |
| | 1,970 |
| | 6,020 |
| | — |
| | — |
| | 11,430 |
|
| Land - consumer lot loans | 498 |
| | — |
| | — |
| | — |
| | — |
| | 498 |
|
| Multi-family | 24,898 |
| | — |
| | 2,747 |
| | — |
| | — |
| | 27,645 |
|
| Commercial real estate | 89,530 |
| | 298 |
| | 31,764 |
| | — |
| | — |
| | 121,592 |
|
| Commercial & industrial | 7,146 |
| | 510 |
| | 5,367 |
| | — |
| | — |
| | 13,023 |
|
| HELOC | 17,971 |
| | — |
| | — |
| | — |
| | — |
| | 17,971 |
|
| Consumer | 918 |
| | — |
| | — |
| | — |
| | — |
| | 918 |
|
| | 176,763 |
| | 2,778 |
| | 49,302 |
| | — |
| | — |
| | 228,843 |
|
| Total grade as a % of total net loans | 77.3 | % | | 1.2 | % | | 21.5 | % | | — | % | | — | % | | |
| | | | | | | | | | | | |
| Purchased credit impaired loans: | | | | | | | | |
| Pool 1 - Construction and land A&D | 9,795 |
| | 5,301 |
| | 35,857 |
| | — |
| | — |
| | 50,953 |
|
| Pool 2 - Single-family residential | 669 |
| | — |
| | 2,953 |
| | — |
| | — |
| | 3,622 |
|
| Pool 3 - Multi-family | — |
| | — |
| | 2,996 |
| | — |
| | — |
| | 2,996 |
|
| Pool 4 - HELOC & other consumer | 1,094 |
| | — |
| | 3,096 |
| | — |
| | — |
| | 4,190 |
|
| Pool 5 - Commercial real estate | 404 |
| | 25,785 |
| | 41,403 |
| | — |
| | — |
| | 67,592 |
|
| Pool 6 - Commercial & industrial | 3,787 |
| | 1,006 |
| | 10,466 |
| | — |
| | — |
| | 15,259 |
|
| | $ | 15,749 |
| | $ | 32,092 |
| | $ | 96,771 |
| | $ | — |
| | $ | — |
| | $ | 144,612 |
|
| | | | | | | | | | Total covered loans | | 373,455 |
|
| | | | | | | | | | Discount | | (85,079 | ) |
| | | | | | | | | | Allowance | | $ | — |
|
| | | | | | | | | | Covered loans, net | | $ | 288,376 |
|
WASHINGTON FEDERAL, INC. AND SUBSIDIARIES
NOTES TO THE CONSOLIDATED FINANCIAL STATEMENTS
YEARS ENDED SEPTEMBER 30, 2012, 2011 AND 2010
The following table provides an analysis of the age of purchased non-credit impaired loans in past due status for the period ended September 30, 2012.
|
| | | | | | | | | | | | | | | | | | | | | | | | | | |
| | Amount of Loans Net of LIP & Chg.-Offs | | Days Delinquent Based on $ Amount of Loans | | % based on $ |
| Type of Loans | Current | | 30 | | 60 | | 90 | | Total | |
| | (In thousands) | | |
| Single-family residential | $ | 35,676 |
| | $ | 32,601 |
| | $ | 2,075 |
| | $ | — |
| | $ | 1,000 |
| | $ | 3,075 |
| | 8.62 | % |
| Construction - speculative | 90 |
| | 90 |
| | — |
| | — |
| | — |
| | — |
| | NM |
|
| Construction - custom | — |
| | — |
| | — |
| | — |
| | — |
| | — |
| | NM |
|
| Land - acquisition & development | 11,430 |
| | 9,922 |
| | — |
| | — |
| | 1,508 |
| | 1,508 |
| | 13.19 | % |
| Land - consumer lot loans | 498 |
| | 385 |
| | — |
| | — |
| | 113 |
| | 113 |
| | 22.69 | % |
| Multi-family | 27,645 |
| | 26,137 |
| | — |
| | — |
| | 1,508 |
| | 1,508 |
| | 5.45 | % |
| Commercial real estate | 121,592 |
| | 115,206 |
| | 17 |
| | 4,447 |
| | 1,922 |
| | 6,386 |
| | 5.25 | % |
| Commercial & industrial | 13,023 |
| | 9,513 |
| | — |
| | 69 |
| | 3,441 |
| | 3,510 |
| | 26.95 | % |
| HELOC | 17,971 |
| | 17,440 |
| | 97 |
| | 50 |
| | 384 |
| | 531 |
| | 2.95 | % |
| Consumer | 918 |
| | 916 |
| | — |
| | 1 |
| | 1 |
| | 2 |
| | 0.22 | % |
| | $ | 228,843 |
| | $ | 212,210 |
| | $ | 2,189 |
| | $ | 4,567 |
| | $ | 9,877 |
| | $ | 16,633 |
| | 7.27 | % |
WASHINGTON FEDERAL, INC. AND SUBSIDIARIES
2012 ANNUAL REPORT
NOTE S Subsequent Event
South Valley Bancorp, Inc. On April 4, 2012, the Company and South Valley Bancorp, Inc. (“South Valley”) announced the signing of a definitive merger agreement. The merger agreement calls for the merger of South Valley with and into the Company, followed by the merger of South Valley's wholly owned subsidiary, South Valley Bank & Trust, into the Company's wholly owned subsidiary, Washington Federal. Under the terms of the definitive merger agreement, Washington Federal issued 1,995,936 shares and paid $10.4 million in cash consideration. Aggregate consideration, cash and stock combined, totaled $44 million. The transaction closed on October 31, 2012. The combined company has 190 offices in eight western states with total assets of approximately $13.3 billion and total deposits of approximately $9.3 billion.
MANAGEMENT'S REPORT ON INTERNAL CONTROL OVER FINANCIAL REPORTING
The management of Washington Federal, Inc. (the “Company”) is responsible for establishing and maintaining adequate internal control over financial reporting. The Company's internal control system was designed to provide reasonable assurance to the Company's management and Board of Directors regarding the preparation and fair presentation of published financial statements.
The Company's management assessed the effectiveness of the Company's internal control over financial reporting as of September 30, 2012. In making this assessment, the Company's management used the criteria set forth by the Committee of Sponsoring Organizations of the Treadway Commission (COSO) in Internal Control-Integrated Framework. Based on its assessment, the Company's management believes that as of September 30, 2012, the Company's internal control over financial reporting was effective based on those criteria.
The Company's independent auditors, Deloitte & Touche LLP, an independent registered public accounting firm, have issued an audit report on the Company's internal control over financial reporting and their report follows.
November 19, 2012
Roy M. Whitehead
Chairman, President and
Chief Executive Officer
Brent J. Beardall
Executive Vice President and
Chief Financial Officer
REPORT OF INDEPENDENT REGISTERED PUBLIC ACCOUNTING FIRM
To the Board of Directors and Stockholders of
Washington Federal, Inc.
Seattle, Washington
We have audited the accompanying consolidated statements of financial condition of Washington Federal, Inc. and subsidiaries (the “Company”) as of September 30, 2012 and 2011, and the related consolidated statements of operations, stockholders' equity, and cash flows for each of the three years in the period ended September 30, 2012. These consolidated financial statements are the responsibility of the Company's management. Our responsibility is to express an opinion on these consolidated financial statements based on our audits.
We conducted our audits in accordance with the standards of the Public Company Accounting Oversight Board (United States). Those standards require that we plan and perform the audit to obtain reasonable assurance about whether the financial statements are free of material misstatement. An audit includes examining, on a test basis, evidence supporting the amounts and disclosures in the financial statements. An audit also includes assessing the accounting principles used and significant estimates made by management, as well as evaluating the overall financial statement presentation. We believe that our audits provide a reasonable basis for our opinion.
In our opinion, such consolidated financial statements present fairly, in all material respects, the consolidated financial position of Washington Federal, Inc. and subsidiaries as of September 30, 2012 and 2011, and the results of their operations and their cash flows for each of the three years in the period ended September 30, 2012, in conformity with accounting principles generally accepted in the United States of America.
As discussed in Note A to the financial statements, the Company has presented a new statement of comprehensive income for each of the three years in the period ended September 30, 2012, due to the adoption of Accounting Standards Update 2011-05, Comprehensive Income (Topic 220) - Presentation of Comprehensive Income.
We have also audited, in accordance with the standards of the Public Company Accounting Oversight Board (United States), the Company's internal control over financial reporting as of September 30, 2012, based on the criteria established in Internal Control - Integrated Framework issued by the Committee of Sponsoring Organizations of the Treadway Commission and our report dated November 19, 2012 expressed an unqualified opinion on the Company's internal control over financial reporting.
Seattle, Washington
November 19, 2012
REPORT OF INDEPENDENT REGISTERED PUBLIC ACCOUNTING FIRM ON INTERNAL CONTROLS
To the Board of Directors and Stockholders of
Washington Federal, Inc.
Seattle, Washington
We have audited the internal control over financial reporting of Washington Federal, Inc. and subsidiaries (the “Company”) as of September 30, 2012, based on criteria established in Internal Control - Integrated Framework issued by the Committee of Sponsoring Organizations of the Treadway Commission. Because management's assessment and our audit were conducted to meet the reporting requirements of Section 112 of the Federal Deposit Insurance Corporation Improvement Act (FDICIA), management's assertion and our audit of the Company's internal control over financial reporting included controls over the preparation of the schedules equivalent to the basic financial statements in accordance with the instructions for the Office of the Comptroller of the Currency Instructions for Call Reports for Balance Sheet on schedule RC, Income Statement on schedule RI, and Changes in Bank Equity Capital on schedule RI-A. The Company's management is responsible for maintaining effective internal control over financial reporting and for its assessment of the effectiveness of internal control over financial reporting, included in the accompanying Management Report's on Internal Control Over Financial Reporting. Our responsibility is to express an opinion on the Company's internal control over financial reporting based on our audit.
We conducted our audit in accordance with the standards of the Public Company Accounting Oversight Board (United States). Those standards require that we plan and perform the audit to obtain reasonable assurance about whether effective internal control over financial reporting was maintained in all material respects. Our audit included obtaining an understanding of internal control over financial reporting, assessing the risk that a material weakness exists, testing and evaluating the design and operating effectiveness of internal control over financial reporting based on the assessed risk, and performing such other procedures as we considered necessary in the circumstances. We believe that our audit provides a reasonable basis for our opinion.
A company's internal control over financial reporting is a process designed by, or under the supervision of, the company's principal executive and principal financial officers, or persons performing similar functions, and effected by the company's board of directors, management, and other personnel to provide reasonable assurance regarding the reliability of financial reporting and the preparation of financial statements for external purposes in accordance with generally accepted accounting principles. A company's internal control over financial reporting includes those policies and procedures that (1) pertain to the maintenance of records that, in reasonable detail, accurately and fairly reflect the transactions and dispositions of the assets of the company; (2) provide reasonable assurance that transactions are recorded as necessary to permit preparation of financial statements in accordance with generally accepted accounting principles, and that receipts and expenditures of the company are being made only in accordance with authorizations of management and directors of the company; and (3) provide reasonable assurance regarding prevention or timely detection of unauthorized acquisition, use, or disposition of the company's assets that could have a material effect on the financial statements.
Because of the inherent limitations of internal control over financial reporting, including the possibility of collusion or improper management override of controls, material misstatements due to error or fraud may not be prevented or detected on a timely basis. Also, projections of any evaluation of the effectiveness of the internal control over financial reporting to future periods are subject to the risk that the controls may become inadequate because of changes in conditions, or that the degree of compliance with the policies or procedures may deteriorate.
In our opinion, the Company maintained, in all material respects, effective internal control over financial reporting as of September 30, 2012, based on the criteria established in Internal Control - Integrated Framework issued by the Committee of Sponsoring Organizations of the Treadway Commission.
We have not examined and, accordingly, we do not express an opinion or any other form of assurance on management's statement referring to compliance with laws and regulations.
We have also audited, in accordance with the standards of the Public Company Accounting Oversight Board (United States), the consolidated financial statements as of and for the year ended September 30, 2012, of the Company and our report dated November 19, 2012, expressed an unqualified opinion on those consolidated financial statements (which report expresses an unqualified opinion and includes an explanatory paragraph relating to the presentation of a new statement of comprehensive income for each of the three years in the period ended September 30, 2012, due to the adoption of Accounting Standards Update 2011-05, Comprehensive Income (Topic 220) - Presentation of Comprehensive Income).
Seattle, Washington
November 19, 2012
Performance Graphs
The following graphs compare the cumulative total return to Washington Federal stockholders (stock price appreciation plus reinvested dividends) to the cumulative total return of the Nasdaq Stock Market Index (U.S. Companies) and the Nasdaq Financial Stocks Index for the five year period ended September 30, 2012 and since Washington Federal first became a publicly traded company on November 9, 1982, respectively. The graphs assume that $100 was invested on September 30, 2007 and November 9, 1982, respectively, in Washington Federal Common Stock, the Nasdaq Stock Market Index and the Nasdaq Financial Stocks Index, and that all dividends were reinvested. Management of Washington Federal cautions that the stock price performance shown in the graphs below should not be considered indicative of potential future stock price performance.
GENERAL CORPORATE AND
STOCKHOLDERS' INFORMATION
| |
| Headquarters | Seattle, Washington 98101 |
(206) 624-7930
| |
| Independent | Deloitte & Touche LLP |
| |
| Auditors | Seattle, Washington |
| |
| Transfer Agent, | Stockholder inquiries regarding transfer |
| |
| Registrar and | requirements, cash or stock dividends, lost |
| |
| Dividend | certificates, consolidating records, correcting |
| |
| Disbursing | a name or changing an address should be |
| |
| Agent | directed to the transfer agent: |
American Stock Transfer & Trust Company
59 Maiden Lane
Plaza Level
New York, NY 10038
Telephone: 1-888-888-0315
www.amstock.com
| |
| Annual Meeting | The annual meeting of stockholders will be |
held on January 16, 2013, at 2 p.m., Pacific Time at
Red Lion Hotel, 1415 5th Avenue,
Seattle, Washington
| |
| Form 10-K | To find out more about the Company, please visit our website. The Company uses its website to distribute financial and other material information about the Company. This report and all SEC filings of the Company are available through the Company's website: |
www.washingtonfederal.com
Stock
| |
| Information | Washington Federal, Inc. is traded on the NASDAQ Global Select Market. The common stock symbol is WAFD. At September 30, 2012, there were approximately 1,691 stockholders of record. |
|
| | | | | | | | | |
| | Stock Prices | |
| Quarter Ended | High | Low | Dividends |
| December 31, 2010 | $ | 17.00 |
| $ | 14.63 |
| $ | 0.06 |
|
| March 31, 2011 | 18.52 |
| 16.69 |
| 0.06 |
|
| June 30, 2011 | 17.40 |
| 14.98 |
| 0.06 |
|
| September 30, 2011 | 17.43 |
| 12.74 |
| 0.06 |
|
| December 31, 2011 | 14.10 |
| 12.39 |
| 0.08 |
|
| March 31, 2012 | 17.18 |
| 14.31 |
| 0.08 |
|
| June 30, 2012 | 18.25 |
| 15.40 |
| 0.08 |
|
| September 30, 2012 | 17.14 |
| 15.53 |
| 0.08 |
|
Our Board of Directors' dividend policy is to review our financial performance, capital adequacy, regulatory compliance and cash resources on a quarterly basis, and, if such review is favorable, to declare and pay a cash dividend to shareholders.
DIRECTORS AND EXECUTIVE OFFICERS
|
| | | |
| BOARD OF DIRECTORS | | EXECUTIVE MANAGEMENT COMMITTEE | |
| | | | |
ROY M. WHITEHEAD Chairman, President and Chief Executive Officer | | ROY M. WHITEHEAD Chairman, President and Chief Executive Officer | |
DEREK L. CHINN Former President and Chief Executive Officer, United Savings and Loan Bank | | BRENT J. BEARDALL Executive Vice President and Chief Financial Officer | |
JOHN F. CLEARMAN Former Chief Financial Officer, Milliman USA, Inc. | | LINDA S. BROWER Executive Vice President Human Resources, Deposit Operations and Marketing | |
DAVID K. GRANT Managing Partner of Catalyst Storage Partners. Former Chief Executive Officer of Shurgard Storage Centers, Inc. | | EDWIN C. HEDLUND Executive Vice President Mortgage & Consumer Lending and Corporate Secretary | |
ANNA C. JOHNSON Senior Partner Scan East West Travel | | JACK B. JACOBSON Executive Vice President Commercial Real Estate | |
THOMAS J. KELLEY Retired Partner, Arthur Andersen LLP | | THOMAS E. KASANDERS Executive Vice President Business Banking | |
LIANE J. PELLETIER Former Chief Executive Officer, President and Chairman of Alaska Communications
| | SIMON E. POWLEY Senior Vice President Retail Banking | |
CHARLES R. RICHMOND Former Executive Vice President, Washington Federal | | MARK A. SCHOONOVER Executive Vice President Chief Credit Officer | |
BARBARA L. SMITH, PhD. Owner, B. Smith Consulting Group | | ANGELA D. VEKSLER Executive Vice President Chief Information Officer | |
MARK N. TABBUTT Chairman of Saltchuk Resources
| | | |
RANDALL H. TALBOT Managing Director of Talbot Financial, LLC. Former President, Chief Executive Officer and Director of Symetra Financial Corporation, Inc. | | | |
| | | | |
| DIRECTOR EMERITUS | | | |
| W. ALDEN HARRIS | | | |