WASHINGTON FEDERAL, INC. AND SUBSIDIARIES
2014 ANNUAL REPORT
Table of Contents
1
WASHINGTON FEDERAL, INC. AND SUBSIDIARIES
2014 ANNUAL REPORT
A SHORT HISTORY
Washington Federal, Inc. ("Company" or "Washington Federal") is a bank holding company headquartered in Seattle, Washington that conducts its operations through a federally-insured national bank subsidiary. Its subsidiary is Washington Federal, National Association ("Bank"), which operates 251 offices in eight western states.
The Company had its origin on April 24, 1917, as Ballard Savings and Loan Association. In 1935, the state-chartered Company converted to a federal charter, became a member of the Federal Home Loan Bank system and obtained federal deposit insurance. In 1958, Ballard Federal Savings and Loan Association merged with Washington Federal Savings and Loan Association of Bothell, and the latter name was retained for wider geographical acceptance. In 1971, Seattle Federal Savings and Loan Association, with three offices, merged into the Company, and at the end of 1978 was joined by the 10 offices of First Federal Savings and Loan Association of Mount Vernon.
On November 9, 1982, the Company converted from a federal mutual to a federal stock association. In 1987 and 1988, acquisitions of United First Federal, Provident Federal Savings and Loan, and Northwest Federal Savings and Loan, all headquartered in Boise, Idaho, added 28 Idaho offices to the Company. In 1988, the acquisition of Freedom Federal Savings and Loan Association in Corvallis, Oregon, added 13 Oregon offices, followed in 1990 by the eight Oregon offices of Family Federal Savings.
In 1991, the Company added three branches with the acquisition of First Federal Savings and Loan Association of Idaho Falls, Idaho, and acquired the deposits of First Western Savings Association of Las Vegas, Nevada, in Portland and Eugene, Oregon, where it was doing business as Metropolitan Savings Association. In 1993, 10 branches were added with the acquisition of First Federal Savings Bank of Salt Lake City, Utah. In 1994, the Company expanded into Arizona.
In 1995, the stockholders approved a reorganization whereby the Bank became a wholly owned subsidiary of a newly formed holding company, Washington Federal, Inc. That same year, the Bank purchased West Coast Mutual Savings Bank with its one branch in Centralia, Washington, and opened six additional branches. In 1996, the Bank acquired Metropolitan Bancorp of Seattle, adding eight offices in Washington as well as opening four branches in existing markets. Between 1997 and 1999, the Bank continued to develop its branch network, opening a total of seven branches and consolidating three offices into existing locations.
In 2000, the Bank expanded into Las Vegas, opening its first branch in Nevada along with two branches in Arizona. In 2001, the Bank opened two additional branches in Arizona and its first branch in Texas, with an office in the Park Cities area of Dallas. In 2002, five branches were opened in existing markets. In 2003, the Bank purchased United Savings and Loan Bank with its four branches in Seattle, added one new branch in Puyallup, Washington, and consolidated one branch in Nampa, Idaho. In 2005, the Bank consolidated two branches in Mount Vernon, Washington, into one and opened branches in Plano, Texas, and West Bend, Oregon. In 2006, the Bank opened locations in Klamath Falls and Medford, Oregon, and Richardson, Texas and added another location in Las Vegas, Nevada.
The Bank acquired First Federal Banc of the Southwest, Inc., the holding company for First Federal Bank located in Roswell, New Mexico, on February 13, 2007. First Federal Bank had 13 branch locations, 11 in New Mexico and two in El Paso, Texas. The Bank acquired First Mutual Bancshares, Inc., the holding company for First Mutual Bank, on February 1, 2008. First Mutual Bank had 12 branches primarily located on the eastside of the Seattle area.
On January 8, 2010, the Bank acquired certain assets and liabilities, including most of the loans and deposits, of Horizon Bank, headquartered in Bellingham, Washington, from the Federal Deposit Insurance Corporation ("FDIC"), as receiver for Horizon Bank. Horizon Bank operated 18 full-service offices, four commercial loan centers and four real estate loan centers in Washington. Through consolidation with existing Bank branches, there was a net increase of 10 branches as a result of the Horizon Bank acquisition.
On October 14, 2011, the Bank acquired six branch locations, four in Albuquerque, New Mexico, and two in Santa Fe, New Mexico, from Charter Bank. On December 16, 2011, the Bank acquired one branch, along with certain assets and liabilities, including most of the loans and deposits, of Western National Bank, headquartered in Phoenix, Arizona from the FDIC in an FDIC-assisted transaction.
2
WASHINGTON FEDERAL, INC. AND SUBSIDIARIES
2014 ANNUAL REPORT
On October 31, 2012, the Bank acquired South Valley Bancorp, Inc., the holding company for South Valley Bank & Trust ("SVBT") headquartered in Klamath Falls, Oregon. The 24 SVBT branches acquired in the transaction are located in central and southern Oregon.
During the fiscal year 2014, the Bank acquired 74 branches from Bank of America, National Association. This included: effective as of the close of business on October 31, 2013, 11 branches located in New Mexico; effective as of the close of business on December 6, 2013, 40 branches located in Eastern Washington, Oregon, and Idaho; and effective as of the close of business on May 2, 2014, 23 branches located in Arizona and Nevada. During 2014, the Bank closed seven branches and opened two new locations, one in Hobbs, New Mexico and one in Dallas, Texas.
The Bank obtains its funds primarily through deposits from the general public, repayments of loans, borrowings and retained earnings. These funds are used largely to make loans to individuals and businesses, including loans for the purchase of new and existing homes, construction and land loans, commercial real estate loans, commercial and industrial loans.
FINANCIAL HIGHLIGHTS
| September 30, | 2014 | 2013 | % Change | ||||
| (In thousands, except per share data) | |||||||
| Assets | $ | 14,756,041 | $ | 13,082,859 | +12.8% | ||
| Cash and cash equivalents | 781,843 | 203,563 | +284.1 | ||||
| Investment securities | 1,366,018 | 1,109,772 | +23.1 | ||||
| Loans receivable, net | 8,148,322 | 7,528,030 | +8.2 | ||||
| Covered loans, net | 176,476 | 295,947 | (40.4) | ||||
| Mortgage-backed securities | 3,231,689 | 2,905,842 | +11.2 | ||||
| Customer accounts | 10,716,928 | 9,090,271 | +17.9 | ||||
| FHLB advances and other borrowings | 1,930,000 | 1,930,000 | — | ||||
| Stockholders’ equity | 1,973,283 | 1,937,635 | +1.8 | ||||
| Net income available to common shareholders | 157,364 | 151,505 | +3.9 | ||||
| Diluted earnings per share | 1.55 | 1.45 | +6.9 | ||||
| Dividends per share | 0.41 | 0.36 | +13.9 | ||||
| Stockholders’ equity per share | 20.05 | 18.91 | +6.0 | ||||
| Shares outstanding | 98,405 | 102,485 | (4.0) | ||||
| Return on average stockholders’ equity | 7.99 | % | 7.88 | % | NM | ||
| Return on average assets | 1.10 | 1.17 | NM | ||||
| Efficiency ratio (1) | 46.76 | 40.90 | NM | ||||
| (1) | Calculated as total operating costs divided by net interest income, plus other income (excluding investment gains) |
NM – not meaningful
3
WASHINGTON FEDERAL, INC. AND SUBSIDIARIES
2014 ANNUAL REPORT
TO OUR STOCKHOLDERS
Fellow Stockholder,
It is my privilege to report that in 2014 your company completed its ninety-seventh year in business with record results. Net income for the year totaled $157,364,000, which represents a 3.9% increase over prior year earnings of $151,505,000. Earnings per share also improved, to $1.55 from $1.45, an increase of 6.9%.
The favorable results can be attributed in large part to improved business conditions throughout our eight state territory. Loan growth accelerated during the year as the portfolio increased by $500 million or 6.4%, and deposits increased by $1.6 billion, or 18%, primarily due to the acquisition of 74 branches from Bank of America. The purchase of deposits housed in those branches, acquired at an attractive price, also produced material progress toward our long-term goal of shifting the deposit mix in favor of low-cost transaction accounts and reduced reliance upon certificates of deposit. During the past year, transaction accounts increased from 39% of total deposits to 51% and should serve to improve the stability and cost of our funding base if and when interest rates rise.
Significant additional lending capacity remains, as the Company ended the fiscal year in a very liquid position. Along with $782 million in cash, another $4.5 billion in high quality, readily marketable securities and sizable borrowing lines are available to meet the credit needs of our current and prospective clients. As always, shareholders’ equity in the business remained strong and as of June 30, ranked Washington Federal as the 5th best capitalized bank among the 100 largest in the U.S., based on the ratio of tangible common equity to tangible assets.
We are also pleased to report that by every measure common to the industry, the quality of our assets improved again this year. Reduced unemployment and the appreciation of important asset classes during the year, such as real estate and securities, seem to be the key reasons that many formerly troubled borrowers were able to stabilize their finances and bring loans current. We are especially proud that during the Recession, we temporarily modified mortgage loans to allow some 1,300 families to stay in their homes while they regained their financial footing. It seems to have paid off for us and them, as 94% are now current on their loans and perhaps we’ve earned their business for life.
The real challenge in 2014 proved to be generating income from the assets and funding sources described above. The spread earned between the yield on earning assets and the cost of funds declined again during the past year as a result of stubbornly low interest rates and stiff price competition. As in the prior few years, cash received from the repayment of older loans and securities could be reinvested only in lower yielding assets, thus reducing profit margin. Interest rates are unpredictable, and of course beyond our control, so prudence dictated conservative investing, primarily in short maturity, low yielding assets that provide good defense against higher rates, yet come at the cost of current earnings. Despite a 13% increase in assets managed, the net between interest income and interest expense increased by only 6.5%.
Profit was also pressured by higher expenses year over year, largely due to personnel, occupancy and merger costs related to the branch acquisition. Because the branch purchase transaction was limited to deposits and included virtually no earning assets, it will take some time to generate the loans and investments needed to cover the added costs and generate returns consistent with the rest of the bank.
Information technology expense also climbed, as we advanced the transition to new systems that I wrote of last year in this letter. As clients of a certain age know, businesses and consumers don’t frequent bank branches as they once did, and now prefer to transact business electronically. As recently as two years ago, we experienced an average of 520,000 electronic transactions per month using online, mobile, debit card and automated payments. Now we sometimes approach that number in a single day. Technology must keep up and spending in that area, both to serve and protect our clients, will continue to grow in the future. On the other hand, brick and mortar will be downsized to meet changing consumer and business banking preferences and automated with the self-service equipment that’s preferred by younger generations.
In spite of higher expenses, the Company’s efficiency ratio, which is a measure of pennies spent to produce a dollar of net revenue, remained nearly the best in the industry among large and regional banks at 46.76%. And despite margin pressure, higher operating costs, and merger related expenses, return on assets amounted to a healthy 1.10%, while return on equity was 7.99%.
A primary reason for increased earnings derived from further improvement in asset quality as previously mentioned. Last year, $15.4 million in funds previously set aside for loan losses were recovered, representing an improvement of $17 million in pre-tax income from the prior year provision of $1.4 million. Even though the allowance for loan losses remains quite healthy, it is not likely that future recoveries of the same magnitude will occur.
4
WASHINGTON FEDERAL, INC. AND SUBSIDIARIES
2014 ANNUAL REPORT
All things considered, the Company had a very good year financially and ended the fiscal year in the same solid financial position that shareholders have come to expect. With healthy earnings and a strong capital position, the Company was able to increase its regular quarterly cash dividend by 10% during the year and also repurchased 4.8 million shares. Over the past two years, the Company has effectively returned 95% of net income to shareholders through cash dividends and share repurchases.
Turning to non-financial events and accomplishments of last year, I’ll begin by reporting that the growth of the Company necessitated an overhaul of our management structure. In 2014, the Bank was divided into eight geographic regions, each with its own Regional President assigned to bring together the various business groups in his/her jurisdiction and to provide a market “face” for Washington Federal. The Regional Presidents, and therefore all client facing employees, now report to the newly created position of Chief Banking Officer. Employees and clients seem to have taken naturally to the new structure and we regard the implementation a big success.
The Equipment Finance group formed in 2012 has originated nearly $200 million in leases, continues to grow, and is contributing to the bottom line with nary a single past due payment. In 2014, we introduced a new Government Banking Group with experienced leadership in lending and providing treasury management services for that unique segment of the economy. For consumers, we launched a new Person-to-Person payment mechanism using online/mobile banking that enables the secure transfer of funds when only the receiving party’s e-mail address is known.
The Company’s “invested here” tagline conveys the message that we are deeply embedded in the communities we serve. In addition to giving generously during our annual United Way campaign, employees contributed over 8,000 hours of volunteer time to community organizations. The Company supported their involvement with financial contributions to 183 different not-for-profits last year. You may also recall that in conjunction with the acquisition of the former South Valley Bank & Trust in 2012, Washington Federal pledged $250 million in community development funding in the state of Oregon within five years. The pledge included loans for the benefit of low-moderate income residents of the state, credit for small farms, ranches and businesses, employee volunteer hours, and contributions. I am pleased to report that we fulfilled that pledge during the year, with over $350 million funded within a mere two years.
With all that is at stake, this letter to shareholders should contain mention of fraud and cybersecurity. We want you to know that we recognize the magnitude of the financial and reputational risks and regard the protection of our customers’ personal information to be a sacrosanct responsibility. While not immune to such occurrences, Washington Federal has never suffered a breach of its firewall or the loss of information. The threat, though, continues to evolve and it’s our job to stay one step ahead. We regularly layer in the latest automated controls and work steadily to improve our manual safeguards, including substantially more employee testing and client training. We also learned a great deal from the high profile breaches suffered by some of the country’s largest retailers and have a response team that is experienced and able to efficiently handle similar situations.
Identity theft and traditional forms of financial fraud perpetrated on individual consumers and businesses are also on the rise and today are far more common than large scale breaches. In response, Washington Federal recently entered into an agreement with LifeLock to offer their identity theft protection services to our depository clients as an added benefit. This is the first such arrangement with a western regional bank that we hope will not only reduce the anxiety level of clients regarding the security of their information, but also differentiate us from the competition and enable us to gain market share. In late 2015, we will also plan to replace all current plastic cards with the so-called “chip and PIN” technology used extensively around the world. While not a cure all, the technology is more secure than the current magnetic strip plastic cards that are used almost exclusively at point of sale in the United States.
In the year to come, a large portion of Company resources will be devoted to internal systems development. Project Catalyst was launched over three years ago with the objective of converting the Company to state of the art operating systems with efficient business processes to match. The upcoming year will be the most critical in the project lifecycle, as several major conversions and thousands of hours of employee training will occur. The process will be tremendously challenging; however, in the end the Company will have systems in place that are not only scalable and secure, but will offer competitive advantages in customer experience, speed to market and improved management reporting.
Project Catalyst will unfortunately make the integration of acquisitions imprudent during the next twelve months due to resource limitations, so revenue growth will be focused on developing the balance sheet one good customer at a time. This is higher quality growth than that which comes by acquisition, is much more easily assimilated, and is custom fit to our standards from the outset. Thankfully we enter the new fiscal year with a great deal of marketing momentum and stronger demand for loans than we have seen in years. After conversion, the scalability of the new and more flexible system will make future mergers a comfortable experience, so we expect to be back in the market once again to participate in the ongoing industry consolidation.
5
WASHINGTON FEDERAL, INC. AND SUBSIDIARIES
2014 ANNUAL REPORT
We also have a plan to improve returns to shareholders next year. There are tools at our disposal to accomplish that objective and believe that there are reasons to be optimistic. With current earnings and dividends, the payout ratio stands at only 27% and provides the Board with flexibility to increase the cash dividend, as it has done three times over the last two years. Stock repurchases are also likely to be used aggressively again this year. In September 2013, the Board authorized the repurchase of ten million shares and five million shares of that authorization remain unused.
We thank you for entrusting part of your wealth to our enterprise and for believing as we do that there’s still a place in the world for a good, solid regional bank. As always, you can help further by referring your friends, neighbors and business associates to Washington Federal for all their banking needs.
I hope to see you at the 2015 Annual Meeting of Stockholders to be held on January 21st at 2:00 p.m., Pacific Time, at the Benaroya Hall in downtown Seattle.
Sincerely,

Roy M. Whitehead
Chairman, President and Chief Executive Officer

(From left to right) Jack B. Jacobson, Executive Vice President - Commercial Real Estate, Edwin C. Hedlund, Executive Vice President - Mortgage and Consumer Lending and Corporate Secretary, Diane L. Kelleher, Senior Vice President - Chief Financial Officer, Brent J. Beardall, Executive Vice President - Chief Banking Officer, Roy M. Whitehead, Chairman, President and CEO, Thomas E. Kasanders, Executive Vice President - Business Banking, Linda S. Brower, Executive Vice President - Administration, Mark A. Schoonover, Executive Vice President - Chief Credit Officer, and Angela D. Veksler, Executive Vice President - Chief Information Officer.
6
MANAGEMENT'S DISCUSSION AND ANALYSIS OF FINANCIAL CONDITION AND RESULTS OF OPERATIONS
We make statements in this Annual Report on Form 10-K that constitute forward-looking statements. Words such as “expects,” “anticipates,” “believes,” “estimates,” “intends,” “forecasts,” “projects” and other similar expressions as well as future or conditional verbs such as “will,” “should,” “would” and “could” are intended to help identify such forward-looking statements. These statements are not historical facts, but instead represent current expectations, plans or forecasts of the Company and are based on the beliefs and assumptions of the management of the Company and the information available to management at the time that these disclosures were prepared. The Company intends for all such forward-looking statements to be covered by the safe harbor provisions for forward-looking statements within the meaning of the Private Securities Litigation Reform Act of 1995 and the provisions of Section 27A of the Securities Act of 1933 and Section 21E of the Securities Exchange Act of 1934. These statements are not guarantees of future results or performance and involve certain risks, uncertainties and assumptions that are difficult to predict and often are beyond the Company's control. Actual outcomes and results may differ materially from those expressed in, or implied by, the Company's forward-looking statements.
You should not place undue reliance on any forward-looking statement and should consider the following uncertainties and risks, as well as the risks and uncertainties discussed elsewhere in this report, including under Item 1A. “Risk Factors,” and in any of the Company's other subsequent Securities and Exchange Commission filings, which could cause our future results to differ materially from the plans, objectives, goals, estimates, intentions, and expectations expressed in forward-looking statements:
| • | a deterioration in economic conditions, including declines in the real estate market and home sale volumes and financial stress on borrowers as a result of the uncertain economic environment; |
| • | economic downturn, including high unemployment rates and declines in housing prices and property values; |
| • | the effects of and changes in monetary and fiscal policies of the Board of Governors of the Federal Reserve System and the U.S. Government; |
| • | fluctuations in interest rate risk and changes in market interest rates; |
| • | the Company's ability to make accurate assumptions and judgments about the collectability of its loan portfolio, including the creditworthiness of its borrowers and the value of the assets securing these loans; |
| • | the Company's ability to successfully complete merger and acquisition activities and realize expected strategic and operating efficiencies associated with such activities; |
| • | the Company's ability to manage its expenses to remain at levels that are appropriate for its business activities and their level of complexity; |
| • | legislative and regulatory limitations, including those arising under the Dodd-Frank Wall Street Reform Act and potential limitations in the manner in which we conduct our business and undertake new investments and activities; |
| • | the ability of the Company to obtain external financing, including client deposits and wholesale borrowing sources, to fund its operations or obtain this financing on favorable terms; |
| • | changes in other economic, competitive, governmental, regulatory, and technological factors affecting the Company's markets, operations, pricing, products, services and fees; |
| • | the ability of the Company to successfully implement new core operating systems during calendar year 2015; |
| • | the ability of the Company to identify and mitigate information security risks; |
| • | the success of the Company at managing the risks involved in the foregoing and managing its business; and |
| • | the timing and occurrence or non-occurrence of events that may be subject to circumstances beyond the Company's control. |
All forward-looking statements speak only as of the date on which such statements are made, and Washington Federal undertakes no obligation to update or revise any forward-looking statements to reflect changed assumptions, the occurrence of unanticipated events, changes to future operating results over time, or the impact of circumstances arising after the date the forward-looking statement was made.
7
MANAGEMENT'S DISCUSSION AND ANALYSIS OF FINANCIAL CONDITION AND RESULTS OF OPERATIONS
GENERAL
Washington Federal, Inc. ("Company" or "Washington Federal") is a bank holding company. The Company's primary operating subsidiary is Washington Federal, National Association ("Bank"), a national bank.
The Company's fiscal year end is September 30th. All references to 2014, 2013 and 2012 represent balances as of September 30, 2014, September 30, 2013 and September 30, 2012, or activity for the fiscal years then ended. References to net income in this document refer to net income available to common shareholders.
CRITICAL ACCOUNTING POLICIES
Preparation of financial statements in conformity with accounting principles generally accepted in the United States of America requires the use of estimates and assumptions that affect reported amounts of certain assets, liabilities, revenues and expenses in the Company's consolidated financial statements. Accordingly, estimated amounts may fluctuate from one reporting period to another due to changes in assumptions underlying estimated values.
The Company has determined that the only accounting policy critical to an understanding of the consolidated financial statements of Washington Federal relates to the methodology for determining the valuation of the allowance for loan losses. The Company maintains an allowance for loan losses to absorb losses inherent in the loan portfolio. The allowance is based on ongoing, quarterly assessments of the probable and estimable losses inherent in the loan portfolio.
The general loan loss allowance is established by applying a loss percentage factor to the different loan types. For example, residential real estate loans are not individually analyzed for impairment and loss exposure because of the significant number of loans, their relatively small balances and their historically low level of losses. See the "Asset Quality and Allowance for Loan Losses" section below for additional information about establishing the loss factors. Specific allowances may be established for loans that are individually evaluated.
INTEREST RATE RISK
The primary source of income for the Company is net interest income, which is the difference between the income generated by our interest-earning assets and the expense incurred for our interest-bearing liabilities. The level of net interest income is a function of the average balances of our interest-bearing assets and liabilities and the spread between the yield on such assets and the cost of such liabilities. These factors are influenced by both the pricing and mix of our interest-bearing assets and liabilities. If the interest rates on our interest-bearing liabilities increase at a faster pace than the interest rates on our interest-earning assets, the result could be a reduction in net interest income, and with it, a reduction in our earnings.
Based on Management's assessment of the current interest rate environment, the Company has taken steps, including growing shorter-term business loans and transaction deposit accounts, investing in variable rate securities and extending the maturity on borrowings, to reduce its interest rate risk profile compared to its historical norms. Historically, the Company had accepted a higher level of interest rate risk as a result of its significant holdings of fixed-rate single-family home loans that are longer-term than the short-term characteristics of its primary liabilities of customer certificate of deposit accounts.
During 2014, the acquisition of $1.9 billion in deposits from Bank of America, N.A. enabled a 55% increase in transaction deposit accounts. Transaction account balances now represent 51% of total customer deposits as of September 30, 2014 compared to 39% as of the prior year end. Transaction account balances have historically been less sensitive to changes in interest rates. Additionally, business loans have grown by $85 million or 23% to $461 million and the adjustable rate portion of the overall loan portfolio has grown from 24% to 28%. Management has also been purchasing more variable rate investments since 2012, and the composition of the investment portfolio is now 46% variable and 54% fixed rate. During 2014, Management also executed $200 million in notional value of forward starting interest rate swaps to lock-in long term borrowing rates.
Management relies on various measures of interest rate risk, including an asset/liability maturity gap analysis, modeling of changes in forecasted net interest income under various rate change scenarios, and the impact of interest rate changes on the net portfolio value (“NPV”) of the Company.
8
MANAGEMENT'S DISCUSSION AND ANALYSIS OF FINANCIAL CONDITION AND RESULTS OF OPERATIONS
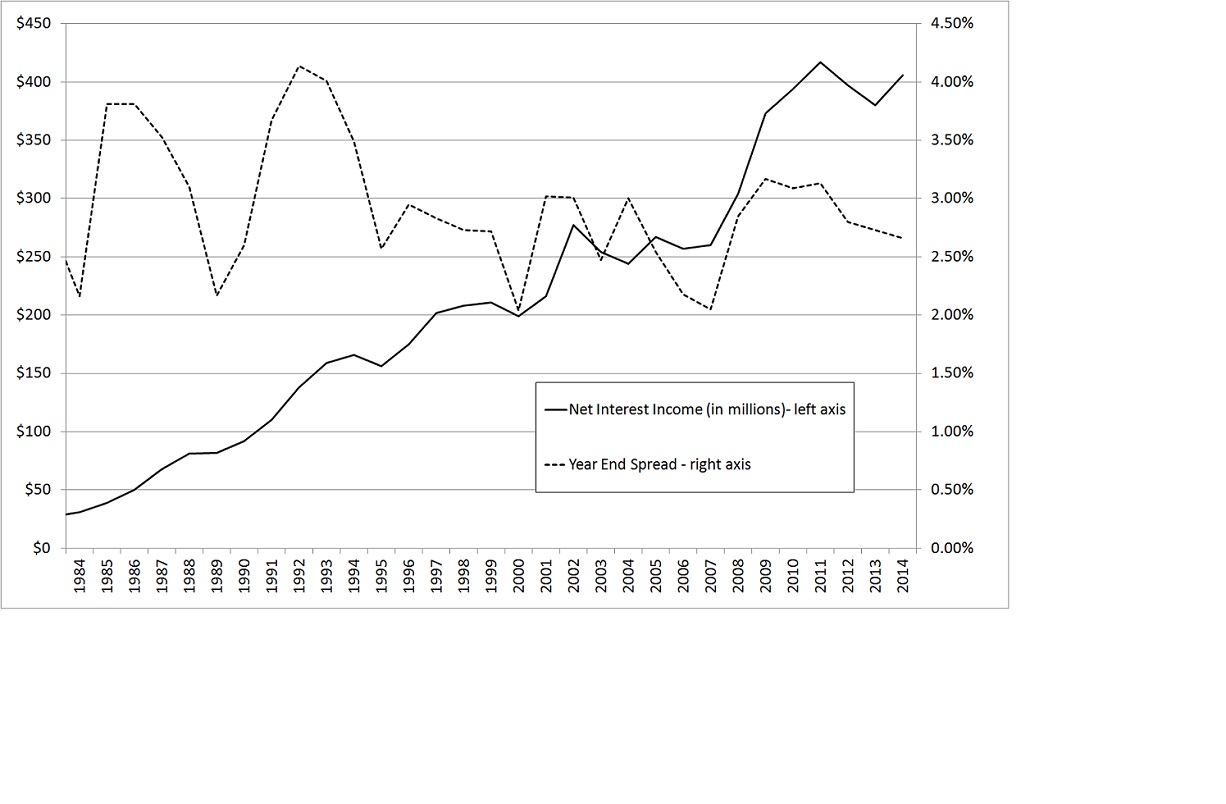
The Company manages its interest rate risk through the interest rate cycles by originating more fixed-rate loans when yields are higher and adding loans and investments with shorter term characteristics, such as construction and commercial loans, when loan rates are lower. During low rate environments, the Company endeavors to grow longer duration transaction deposit accounts which will not be as sensitive to rising rates as term deposits. This balance sheet strategy, in conjunction with a strong capital position and low operating costs has allowed the Company to manage interest rate risk within guidelines established by the Board of Directors through all interest rate cycles. Although a significant increase in market interest rates could adversely affect net interest income, this interest rate risk approach has never resulted in a monthly operating loss. The Company's objective is to grow the amount of net interest income through the rate cycles, acknowledging that there will be some periods of time when that will not be feasible.
The chart below shows the volatility of our period end net interest spread (dashed line measured against the right axis) compared to the relatively consistent growth in net interest income (solid line measured against the left axis). As noted above, this consistency is accomplished by managing the size and composition of the balance sheet through different rate cycles.
9
MANAGEMENT'S DISCUSSION AND ANALYSIS OF FINANCIAL CONDITION AND RESULTS OF OPERATIONS
The following table shows the estimated repricing periods for earning assets and paying liabilities:
| Repricing Period | |||||||||||||||
| As of September 30, 2014 | Within One Year | After 1 year - before 6 Years | Thereafter | Total | |||||||||||
| (In thousands) | |||||||||||||||
| Earning Assets (1) | $ | 5,165,292 | $ | 4,443,041 | $ | 4,190,404 | $ | 13,798,737 | |||||||
| Paying Liabilities | (6,826,260 | ) | (3,932,083 | ) | (1,898,057 | ) | (12,656,400 | ) | |||||||
| Excess (Liabilities) Assets | $ | (1,660,968 | ) | $ | 510,958 | $ | 2,292,347 | ||||||||
| Excess as % of Total Assets | (11.00 | )% | |||||||||||||
| Policy limit for one year excess | (20.00 | )% | |||||||||||||
(1) Asset repricing period includes estimated prepayments based on historical activity
At September 30, 2014, the Company had approximately $1.7 billion more liabilities than assets subject to repricing in the next year, which amounted to a negative maturity gap of 11.0% of total assets. This is a decrease from the 12.9% negative gap as of the prior year end. Having this excess of liabilities, relative to assets, that will be repricing within the next year, the Company is subject to decreasing net interest income should interest rates rise. However, if management were to take steps to change the size and/or mix of the balance sheet, rising rates may not cause a decrease in net interest income. Cash and cash equivalents of $781,843,000 and stockholders' equity of $1,973,283,000 provide management with additional flexibility in managing interest rate risk going forward.
The interest rate spread decreased to 2.66% at September 30, 2014 from 2.73% at September 30, 2013. Net interest spread represents the difference between the contractual rates of earning assets and the contractual rates of paying liabilities as of a specific date. The spread decreased due to lower asset yields. Rates on customer accounts decreased by 18 basis points from the prior year while rates on earning assets decreased by 29 basis points.
| SEP 2014 | JUN 2014 | MAR 2014 | DEC 2013 | SEP 2013 | JUN 2013 | MAR 2013 | DEC 2012 | ||||||||||||||||
| Interest rate on loans and mortgage-backed securities | 4.17 | % | 4.18 | % | 4.22 | % | 4.26 | % | 4.34 | % | 4.44 | % | 4.54 | % | 4.63 | % | |||||||
| Interest rate on investment securities | 0.96 | 1.00 | 1.08 | 0.84 | 1.06 | 0.83 | 0.77 | 0.76 | |||||||||||||||
| Combined | 3.63 | 3.63 | 3.70 | 3.65 | 3.92 | 3.87 | 3.94 | 4.09 | |||||||||||||||
| Interest rate on customer accounts | 0.51 | 0.53 | 0.56 | 0.61 | 0.69 | 0.73 | 0.73 | 0.79 | |||||||||||||||
| Interest rate on borrowings | 3.52 | 3.52 | 3.52 | 3.52 | 3.52 | 3.52 | 3.52 | 3.59 | |||||||||||||||
| Combined | 0.97 | 0.98 | 1.03 | 1.07 | 1.19 | 1.22 | 1.22 | 1.26 | |||||||||||||||
| Interest rate spread | 2.66 | % | 2.65 | % | 2.67 | % | 2.58 | % | 2.73 | % | 2.65 | % | 2.72 | % | 2.83 | % | |||||||
As of September 30, 2014, total assets increased by $1,673,182,000, or 12.8%, from $13,082,859,000 at September 30, 2013.
During 2014, net loans receivable (both non-covered and covered) increased $500,821,000, or 6.4%, while investment securities increased $582,093,000, or 14.5%, and cash increased $578,280,000.
10
MANAGEMENT'S DISCUSSION AND ANALYSIS OF FINANCIAL CONDITION AND RESULTS OF OPERATIONS
ASSET QUALITY & ALLOWANCE FOR LOAN LOSSES
The Company maintains an allowance to absorb losses inherent in the loan portfolio. The amount of the allowance is based on ongoing, quarterly assessments of the probable and estimable losses inherent in the loan portfolio. The Company's methodology for determining the appropriateness of the allowance is primarily based on a general allowance methodology. Other elements include specific allowances and a reserve for unfunded commitments.
The loan loss allowance is primarily established by applying a loss percentage factor to the different loan types. Management believes loan types are the most relevant factor in the allowance calculation for groups of homogeneous loans as the risk characteristics within these groups are similar. The loss percentage factor is made up of two parts - the historical loss factor (“HLF”) and the qualitative loss factor (“QLF”).
The HLF takes into account historical charge-offs by loan type. For the fiscal year 2014, the Company is using the 10 year average of historical loss rates for each loan category multiplied by 2 to reflect a two year loss emergence period. This is the likely period of time during which a residential or commercial loan borrower experiencing financial difficulties might be utilizing their cash reserves prior to becoming delinquent on their loan, plus the period of time that it takes the bank to work out the loans. The Company uses a 10 year average to reflect a complete credit cycle.
The QLF are based on management's continuing evaluation of the pertinent factors underlying the quality of the loan portfolio, including changes in the size and composition of the loan portfolio, actual loan loss experience, delinquency trends, current economic conditions, collateral values, geographic concentrations, seasoning of the loan portfolio, specific industry conditions, and the duration of the current business cycle. These factors are considered by loan type. Single family residential loan sub-types are considered by loan to value, non owner or owner occupied, and modified loans. Credit quality has been improving in most loan categories during the year, but at different paces. In addition, loan growth in some portfolios has been a consideration.
As of September 30, 2014, the general allowance was $112,347,000 and it was comprised of $85,525,000 due to HLF, $26,822,000 due to qualitative factors. For the quarter ended September 30, 2014, the Company had $60,000 allocated to specific allowances for individually evaluated loans. During 2014, there was a transfer of $2,910,000 to establish a reserve for unfunded commitments. The Company reversed $15,401,000 of loan loss provision in 2014 due in large part to net recoveries of previously charged off loans of $14,365,000. This was comprised of $29,464,000 in recoveries and $15,099,000 in charge offs.
The recovery of the carrying value of loans is susceptible to future market conditions beyond the Company's control, which may result in losses or recoveries differing from those estimated.
Restructured loans. Restructured single-family residential loans are reserved for under the Company's loan loss reserve methodology. Most troubled debt restructured ("TDR") loans are accruing and performing loans where the borrower has proactively approached the Company about modifications due to temporary financial difficulties. Each request is individually evaluated for merit and likelihood of success. As of September 30, 2014 single-family residential loans comprised 86.3% of restructured loans. The concession for these loans is typically a payment reduction through a rate reduction of from 100 to 200 bps for a specific term, usually six to twelve months. Interest-only payments may also be approved during the modification period.
Outstanding TDRs decreased to $374,743,000 as of September 30, 2014 from $415,696,000 as of the prior year end. During 2014, there were additions of $59,803,000 and reductions of $100,756,000 due to prepayments and transfers to REO.
The subsequent default rate on restructured single- family mortgage loans has been 15.5% over the last two years. Concessions for construction (2.0%), land A&D (1.3%) and multi-family loans (1.4%) are typically an extension of maturity combined with a rate reduction of normally 100 bps. Before granting approval to modify a loan in a TDR, a borrower’s ability to repay is considered by evaluating: current income levels and debt to income ratio, borrower’s credit score, payment history of the loan, and updated valuation of the secondary repayment source. The subsequent default rate on restructured commercial loans has been 16.1% over the last two years.
If a loan is on non-accrual status before becoming a TDR it will stay on non-accrual status following restructuring until it has been performing for at least six months, at which point it may be moved to accrual status. If a loan is on accrual status before it becomes a TDR, and it is concluded that a full repayment is highly probable, it will remain on accrual status following restructuring. If the homogeneous restructured loan does not perform, it is placed in non-accrual status when it is 90 days delinquent. For commercial
11
MANAGEMENT'S DISCUSSION AND ANALYSIS OF FINANCIAL CONDITION AND RESULTS OF OPERATIONS
loans, six consecutive payments on newly restructured loan terms are required prior to returning the loan to accrual status. After the required six consecutive payments are made, a management assessment may conclude that collection of the entire principal balance is still in doubt. In those instances, the loan will remain on non-accrual. A loan that defaults and is subsequently modified would impact the Company's delinquency trend, which is part of the QLF component of the general reserve calculation. Any modified loan that re-defaults and is charged-off would impact the HLF component of our general reserve calculation.
Non-performing assets. Non-performing assets were $147,311,000, or 1.00%, of total assets at September 30, 2014 compared to $213,616,000, or 1.63%, of total assets at September 30, 2013. This elevated level of non-performing assets over the most recent years is a result of the significant decline in housing values in the western United States and the national recession. This level of non-performing assets remains slightly higher than the 0.97% average over the Company's 30+ year history as a public company.
The following table details non-performing assets by type comparing 2014 and 2013:
| September 30, | |||||||||||||||
| Non-Performing Assets | 2014 | 2013 | $ Change | % Change | |||||||||||
| (In thousands) | |||||||||||||||
| Non-accrual loans: | |||||||||||||||
| Single-family residential | $ | 74,067 | $ | 100,460 | $ | (26,393 | ) | (26.3 | )% | ||||||
| Construction – speculative | 1,477 | 4,560 | (3,083 | ) | (67.6 | )% | |||||||||
| Construction – custom | — | — | — | — | % | ||||||||||
| Land – acquisition & development (A&D) | 811 | 2,903 | (2,092 | ) | (72.1 | )% | |||||||||
| Land – consumer lot loans | 2,637 | 3,337 | (700 | ) | (21.0 | )% | |||||||||
| Multi-Family | 1,742 | 6,573 | (4,831 | ) | (73.5 | )% | |||||||||
| Commercial real estate | 5,106 | 11,736 | (6,630 | ) | (56.5 | )% | |||||||||
| Commercial & industrial | 7 | 477 | (470 | ) | (98.5 | )% | |||||||||
| HELOC | 795 | 263 | 532 | 202.3 | % | ||||||||||
| Consumer | 789 | 990 | (201 | ) | (20.3 | )% | |||||||||
| Total non-accrual loans | 87,431 | 131,299 | (43,868 | ) | (33.4 | )% | |||||||||
| Total REO & REHI | 59,880 | 82,317 | (22,437 | ) | (27.3 | )% | |||||||||
| Total non-performing assets | $ | 147,311 | $ | 213,616 | $ | (66,305 | ) | (31.0 | )% | ||||||
In response to the improving overall credit quality of our loan portfolio, the total allowance for loan loss decreased by $4,394,000, or 3.8%, from 2013. $112,287,000 of the allowance is calculated under the formulas contained in our general allowance methodology and the remaining $60,000 is made up of specific reserves on loans that were deemed to be impaired at September 30, 2014. The general reserve decreased by $981,000, or 0.9%, to $112,287,000 while the specific reserve decreased by $3,413,000, or 98.3%, to $60,000. The primary reasons for the decrease in total allowance is due to the improving asset quality metrics, combined with improving macroeconomic factors including improving employment and higher real estate values.
The ratio of the allowance for loan losses and reserves for unfunded commitments to total gross loans decreased to 1.33% as of September 30, 2014 from 1.46% as of September 30, 2013 due to the combination of improving credit quality and loan growth.
The ratio of the allowance for loan losses and reserves for unfunded commitments to non performing loans increased to 128.5% as of September 30, 2014 from 88.9% as of September 30, 2013. This is primarily due to the reduction in non-performing loans.
12
LIQUIDITY AND CAPITAL RESOURCES
The principal sources of funds for the Company's activities are loan repayments (including prepayments), net deposit inflows, repayments and sales of investments and borrowings and retained earnings, if applicable. Washington Federal's principal sources of revenue are interest on loans and interest and dividends on investments.
The Company's net worth at September 30, 2014, was $1,973,283,000 or 13.4%, of total assets. This is an increase of $35,648,000 from September 30, 2013, when net worth was $1,937,635,000, or 14.8%, of total assets. The Company's net worth was impacted in the year by net income of $157,364,000, the payment and accrual of $45,665,000 in cash dividends, treasury stock purchases that totaled $104,291,000, as well as other comprehensive income of $14,330,000. The Company paid out 26.7% of its 2014 earnings in cash dividends to common shareholders, compared with 25.0% last year. For the year ended September 30, 2014, $149,956,000, or 95.3%, of net income was returned to shareholders in the form of cash dividends or share repurchases.
Management believes this strong net worth position will help the Company manage its interest rate risk and provide the capital support needed for controlled growth in a regulated environment.
The Bank has a credit line with the Federal Home Loan Bank of Seattle ("FHLB") equal to 50.0% of total assets, providing a substantial source of liquidity if needed. FHLB advances are collateralized as provided for in the Advances, Security and Deposit Agreement by all FHLB stock owned by the Bank, deposits with the FHLB and certain mortgages or deeds of trust securing such properties as provided in the agreements with the FHLB.
The Company's cash and cash equivalents amounted to $781,843,000 at September 30, 2014, a 284.1% increase from the cash and cash equivalents balance of $203,563,000 as of the prior year end. The Company is holding a higher than normal amount of liquidity, primarily due to the $1,776,660 received from branch acquisitions during the year. Most of the acquired cash was deployed into available for sale securities and net loan growth. Investment activity has slowed recently due to lackluster returns on purchase opportunities. This higher than normal amount of liquidity has also been maintained due to concern about potentially rising interest rates in the future. Additionally, see “Interest Rate Risk” above and the “Statement of Cash Flows” included in the financial statements.
13
MANAGEMENT'S DISCUSSION AND ANALYSIS OF FINANCIAL CONDITION AND RESULTS OF OPERATIONS
CHANGES IN FINANCIAL CONDITION
Available-for-sale and held-to-maturity securities. Available-for-sale securities increased $688,494,000, or 29.2% during the year ended September 30, 2014 to $3,049,442,000 as some of the proceeds from the branch acquisitions were deployed into securities. This net increase included the purchase of $1,280,477,000 of available-for-sale investment securities and principal repayments of $609,395,000. As of September 30, 2014, the Company had net unrealized gains on available-for-sale securities of $20,708,000, net of tax, which were recorded as part of stockholders' equity.
Held-to-maturity securities decreased $106,401,000 or 6.4% during the year ended September 30, 2014 to $1,548,265,000 due to repayments. These securities were purchased in 2012. With rising interest rates, these securities may be subject to unrealized losses. As of September 30, 2014, the net unrealized losses on these securities was $49,000,000.
Loans receivable. Loans receivable increased $620,292,000, or 8.2%, to $8,148,322,000 at September 30, 2014, from $7,528,030,000 one year earlier. This increase resulted primarily from originations of $2,172,015,000, which represented a 10.5% increase over the prior year. There were also loan purchases of $218,544,000. Loan repayments (including prepayments) for the year totaled $1,827,315,000, a $525,746,000 or 22.3% decrease over 2013. The net increase in the loan portfolio is consistent with management's strategy to produce more multifamily, commercial real estate, and commercial and industrial loans which are more often adjustable rate or have a shorter final maturity. When long term interest rates are low, the Company's appetite for mortgage originations is limited. There was modest growth in the consumer loan portfolio during 2014, including robust production of custom construction loans and purchases of student loans. The Company reduced its exposure to land and commercial construction loans. Overall, $37,721,000 of loans were transferred to REO during the year, including those from real estate held for investment.
The following table shows the change in the geographic distribution by state of the gross loan portfolio from 2013 to 2014:
| 2014 | 2013 | Change | ||||
| Washington | 45.8 | % | 48.5 | % | (2.7 | )% |
| Oregon | 16.1 | 18.5 | (2.4 | )% | ||
| Arizona | 11.0 | 11.0 | — | % | ||
| Other (1) | 7.8 | 3.1 | 4.7 | % | ||
| Utah | 6.7 | 6.8 | (0.1 | )% | ||
| Idaho | 4.5 | 4.8 | (0.3 | )% | ||
| New Mexico | 4.2 | 4.1 | 0.1 | % | ||
| Texas | 2.4 | 2.0 | 0.4 | % | ||
| Nevada | 1.5 | 1.2 | 0.3 | % | ||
| 100.0 | % | 100.0 | % | |||
(1) Includes loans in other states and purchased loan pools and other loans without state property information.
Covered loans. As of September 30, 2014, covered loans had a net decrease of 40.4%, or $119,471,000 from the prior year end to $176,476,000 due to continued paydowns and transfers of the properties into covered real estate owned. There were $8,748,000 of covered loans transferred to REO during the year. This portfolio of loans is expected to continue to decline over time, absent another FDIC assisted transaction. It is comprised of loans that were acquired from Horizon Bank in 2010 and certain loans that were acquired from SVBT in 2012. The FDIC loss share agreement for commercial loans acquired from Horizon Bank are expiring after 5 years in the quarter ending March 31, 2015. The FDIC loss share agreement for certain commercial loans previously acquired by SVBT is expiring in the quarter ending September 30, 2015. The FDIC loss share agreements for the residential loans in these portfolios are 10 year agreements, so they will continue. When FDIC loss share agreements expire, any remaining loans will be transferred to the non covered portfolio.
Real estate held for sale and real estate held for investment. Real estate held for sale combined with real estate held for investment decreased by $22,437,000 or 27.3% to $59,880,000 from $82,317,000 as of September 30, 2013, as the Bank has continued to liquidate foreclosed properties. During the year, the Bank sold 233 foreclosed properties for net proceeds of
14
MANAGEMENT'S DISCUSSION AND ANALYSIS OF FINANCIAL CONDITION AND RESULTS OF OPERATIONS
$55,711,000 and a net gain on sale of $6,666,000. The Bank also sold $18,184,000 of real estate held for investment for a gain of $4,172,000. The total net loss on sale of real estate, measured against the original loan balance of $83,913,000, was $35,900,000 or 42.8% for properties sold in fiscal 2014. Net loss on real estate acquired through foreclosure, which includes gains on sale, ongoing maintenance expense and periodic write-downs from lower valuations, increased by 47.6% from the prior year to $2,743,000.
As of September 30, 2014, real estate held for sale and real estate held for investment consisted of 318 properties totaling $59,880,000. Covered real estate held for sale decreased to $24,082,000 as of September 30, 2014 from $30,980,000 as of September 30, 2013. Land represents $23,369,000 or 27.8% of total non covered and covered real estate held for sale.
Intangible assets. The Company's intangible assets are made up of $291,503,000 of goodwill and the unamortized balances of the core deposit intangible of $11,406,000 at September 30, 2014. During 2014, $31,226,000 was added to goodwill and $11,040,000 to core deposit intangibles as a result of the branch acquisitions.
Customer deposits. Customer deposits at September 30, 2014, totaled $10,716,928,000 compared with $9,090,271,000 at September 30, 2013, a $1,626,657,000 or 17.9% increase due primarily to the $1,856,902,000 of deposits acquired from Bank of America. Consistent with its interest rate risk management strategy, the Company was able to increase transaction accounts by $1,949,845,000 or 55.1%, while time deposits decreased by $323,188,000 or 5.8%. The weighted average rate paid on customer deposits during the year was 0.57%, a decrease of 18 basis points from the previous year, as a result of the low interest rate environment.
FHLB advances and other borrowings. Total FHLB advances were $1,930,000,000 at September 30, 2014. There were no other borrowings outstanding.
Contractual obligations. The following table presents, as of September 30, 2014, the Company's significant fixed and determinable contractual obligations, within the categories described below, by contractual maturity or payment amount.
| Contractual Obligations | Total | Less than 1 Year | 1 to 5 Years | Over 5 Years | ||||||||||||
| (In thousands) | ||||||||||||||||
| Customer accounts | $ | 10,716,928 | $ | 8,637,860 | $ | 2,079,068 | $ | — | ||||||||
| Debt obligations (1) | 1,930,000 | 100,000 | 1,430,000 | 400,000 | ||||||||||||
| Operating lease obligations | 28,427 | 6,221 | 13,184 | 9,022 | ||||||||||||
| $ | 12,675,355 | $ | 8,744,081 | $ | 3,522,252 | $ | 409,022 | |||||||||
(1) Represents final maturities of debt obligations.
These obligations, except for the operating leases, are included in the Consolidated Statements of Financial Condition. The payment amounts of the operating lease obligations represent those amounts contractually due.
15
MANAGEMENT'S DISCUSSION AND ANALYSIS OF FINANCIAL CONDITION AND RESULTS OF OPERATIONS
RESULTS OF OPERATIONS
For highlights of the quarter-by-quarter results for the years ended September 30, 2014 and 2013, see Note P, “Selected Quarterly Financial Data (Unaudited)”.
COMPARISON OF 2014 RESULTS WITH 2013
Net income increased $5,859,000, or 3.87%, to $157,364,000 for the year ended September 30, 2014 as compared to $151,505,000 for the year ended September 30, 2013. Net interest income was higher in 2014 by $25,488,000 primarily due to the investment of funds provided by the acquisition of 74 branches during the fiscal year. Increases in compensation, occupancy, information technology and product delivery expenses were also attributable to this increase in branches and the related customer transactions. Additionally, other income is higher. Net income for the twelve months ended September 30, 2014 also benefited from lower credit costs. The reversal of the provision for loan losses amounted to $15,401,000 for the year ended September 30, 2014 as compared to $1,350,000 in provision for the year ago period.
The table below sets forth certain information regarding changes in interest income and interest expense of the Company for 2014. For each category of interest-earning asset and interest-bearing liability, information is provided on changes attributable to: (1) changes in volume (changes in volume multiplied by old rate) and (2) changes in rate (changes in rate multiplied by old average volume). The change in interest income and interest expense attributable to changes in both volume and rate has been allocated proportionately to the change due to volume and the change due to rate.
| Year Ended September 30, 2014 | |||||||||
| ($ in thousands) | Volume | Rate | Total | ||||||
| Interest income: | |||||||||
| Loans and covered assets | $ | 10,399 | $ | (34,464 | ) | $ | (24,065 | ) | |
| Mortgaged-backed securities | 15,032 | 16,708 | 31,740 | ||||||
| Investments (1) | 4,291 | 5,440 | 9,731 | ||||||
| All interest-earning assets | 29,722 | (12,316 | ) | 17,406 | |||||
| Interest expense: | |||||||||
| Customer accounts | 8,670 | (18,049 | ) | (9,379 | ) | ||||
| FHLB advances and other borrowings | 2,340 | (1,043 | ) | 1,297 | |||||
| All interest-bearing liabilities | 11,010 | (19,092 | ) | (8,082 | ) | ||||
| Change in net interest income | $ | 18,712 | $ | 6,776 | $ | 25,488 | |||
| (1) Includes interest on cash equivalents and dividends on FHLB & FRB stock | |||||||||
Non-performing assets (NPA's) decreased by $66,305,000 from 2013 to $147,311,000 as of September 30, 2014. There were $24,090,000 of restructured loans in this total that were not performing. The Company had net recoveries of $14,365,000 for the twelve months ended September 30, 2014 compared with $17,756,000 of net charge-offs for the same period one year ago.
The decrease in the provision for loan losses is in response to three primary factors: first, the amount of NPA's improved materially year-over-year; second, non-accrual loans as a percentage of total loans decreased from 1.64% at September 30, 2013, to 1.01% at September 30, 2014; third, the percentage of loans 30 days or more delinquent decreased from 1.97% at September 30, 2013, to 1.44% at September 30, 2014. Management believes the allowance for loan losses plus the reserve for unfunded commitments, totaling $115,257,000, or 1.33% of gross loans, is sufficient to absorb estimated losses inherent in the portfolio.
16
MANAGEMENT'S DISCUSSION AND ANALYSIS OF FINANCIAL CONDITION AND RESULTS OF OPERATIONS
Total other income increased $8,726,000, or 39.78%, to $30,659,000 in 2014 from 2013. The increase in fee income resulted from an increased number of transaction accounts. Net gains on sale of investments was $0 in the fiscal years 2014 and 2013.
Compensation expense increased $18,915,000, or 20.83%, to $109,730,000 in 2014 primarily due to the addition of the employees from the branches that were acquired during 2014 and growing our commercial banking units. The number of staff, including part-time employees on a full-time equivalent basis, was 1,909 and 1,457 at September 30, 2014 and 2013, respectively.
Occupancy expense increased to $30,452,000 , or 29.05%, for the twelve months ended September 30, 2014 from $23,597,000 for the fiscal year ended September 30, 2013 as a result of increased branch facilities from acquisitions. The branch network consisted of 251 offices at September 30, 2014 and 182 offices at September 30, 2013.
Information technology expense was $14,303,000 in 2014 compared to $10,999,000 in 2013. This 30.04% increase was mostly due to the increase in branches. It also includes expense related to the planning for the upgrade in our core systems in 2015. The license and implementation costs associated with the systems upgrade are being capitalized.
Product delivery expense, including printing, postage, delivery, branch security, and ATM and debit card expenses, were $14,973,000 in 2014 compared to $4,414,000 in 2013. The ATM and debit card expenses were higher this year due to higher client adoption rates, changing client usage patterns, and the branch acquisitions. There is a much greater proportion of transaction accounts in the acquired branches.
FDIC insurance expense decreased by 9.87% to $11,009,000 for 2014 from $12,214,000 in 2013. The FDIC insurance rate is based on risk factors as established by the FDIC which have been improving for the Company, and this has resulted in an overall lower insurance expense.
Other miscellaneous expenses decreased 6.04% to $23,542,000 for the twelve months ended September 30, 2014 from $22,201,000 for the comparable period one year ago.
Total operating expense for 2014 and 2013 equaled 1.43% and 1.27% of average assets, respectively. Despite the increase in operating expenses as a percent of average assets, the Company continues to operate as one of the most efficient banks in the country.
The loss on real estate acquired through foreclosure increased 47.55% to $2,743,000 in 2014 from $1,859,000 in 2013, due to the increased volume of dispositions of real estate acquired through foreclosure as the Bank continues to liquidate foreclosed properties. The net loss on real estate acquired through foreclosure, includes gains and losses on sale, ongoing maintenance expense and periodic write-downs from lower property valuations.
Income tax expense increased to $87,564,000 in 2014 from $83,111,000 for the fiscal year ended September 30, 2013. The effective tax rate was 35.75% for 2014 and 35.42% for 2013. The Company expects an effective tax rate of 35.75% going forward.
COMPARISON OF 2013 RESULTS WITH 2012
Net income increased $13,322,000, or 9.64%, to $151,505,000 for the year ended September 30, 2013 as compared to $138,183,000 for the year ended September 30, 2012. The net income for the twelve months ended September 30, 2013 benefited from overall lower credit costs, which included the provision for loan losses and net loss on real estate owned. The provision for loan losses amounted to $1,350,000 for the year ended September 30, 2013, as compared to $44,955,000 for the year ago period. In additions, losses recognized on real estate acquired through foreclosure were $1,859,000 for the year ended September 30, 2013, as compared to $9,819,000 for the fiscal year ended September 30, 2012.
17
MANAGEMENT'S DISCUSSION AND ANALYSIS OF FINANCIAL CONDITION AND RESULTS OF OPERATIONS
The table below sets forth certain information regarding changes in interest income and interest expense of the Company for 2013.
| Year Ended September 30, 2013 | |||||||||
| ($ in thousands) | Volume | Rate | Total | ||||||
| Interest income: | |||||||||
| Loans and covered assets | $ | (11,925 | ) | $ | (17,993 | ) | $ | (29,918 | ) |
| Mortgaged-backed securities | (15,610 | ) | (32,012 | ) | $ | (47,622 | ) | ||
| Investments (1) | 2,370 | 1,190 | 3,560 | ||||||
| All interest-earning assets | (25,165 | ) | (48,815 | ) | (73,980 | ) | |||
| Interest expense: | |||||||||
| Customer accounts | 2,673 | (21,709 | ) | (19,036 | ) | ||||
| FHLB advances and other borrowings | (26,997 | ) | (11,057 | ) | (38,054 | ) | |||
| All interest-bearing liabilities | (24,324 | ) | (32,766 | ) | (57,090 | ) | |||
| Change in net interest income | $ | (841 | ) | $ | (16,049 | ) | $ | (16,890 | ) |
| (1) Includes interest on cash equivalents and dividends on FHLB and FRB stock | |||||||||
NPA's decreased by $59,289,000 from 2012 to $213,616,000. There were $24,281,000 of restructured loans in this total that were not performing. The Company had net charge-offs of $17,756,000 for the twelve months ended September 30, 2013 compared with $69,721,000 of net charge-offs for the same period one year ago. The decrease in the provision for loan losses is in response to four primary factors: first, the amount of NPA's improved year-over-year; second, non-accrual loans as a percentage of total loans decreased from 2.20% at September 30, 2012, to 1.64% at September 30, 2013; third, the percentage of loans 30 days or more delinquent decreased from 3.43% at September 30, 2012, to 1.97% at September 30, 2013; and finally, the Company's exposure in the land A&D and speculative construction portfolios, the source of the majority of losses during this credit cycle, has decreased from a combined 3.30% of the gross loan portfolio at September 30, 2012, to 2.60% at September 30, 2013. Management believes the allowance for loan losses, totaling $116,741,000, or 1.46% of gross loans, is sufficient to absorb estimated losses inherent in the portfolio.
Total other income increased $5,416,000, or 32.79%, in 2013 from 2012. The increase in fee income resulted from an increased number of transaction accounts. In addition, net gains on sale of investments is $0 in the fiscal year 2013 compared to a net loss of $331,000 in 2012. During the fiscal year ended September 30, 2012, the Company sold $2.4 billion of fixed rate mortgage backed securities, recognizing a $95.2 million gain. In addition, the Company prepaid $876 million in long term debt realizing a loss of $95.5 million.
Compensation expense increased $13,187,000, or 16.99%, in 2013 primarily due to the addition of the employees from the SVBT acquisition October 2012 and growing our commercial banking units. The number of staff, including part-time employees on a full-time equivalent basis, was 1,457 and 1,260 at September 30, 2013 and 2012, respectively.
Occupancy expense increased to $23,597,000 for the twelve months ended September 30, 2013 from $20,257,000 for the fiscal year ended September 30, 2012 as a result of increased branch facilities from acquisitions. The branch network consisted of 182 offices at September 30, 2013 and 166 offices at September 30, 2012.
FDIC insurance expense decreased to $12,214,000 for 2013 from $16,093,000 in 2012. Other expenses increased 38.91% to $22,201,000 for the twelve months ended September 30, 2013 from $15,982,000 for the comparable period one year ago. This increase is due in large part to the two acquisitions discussed above and increased information technology and advertising expenses.
18
MANAGEMENT'S DISCUSSION AND ANALYSIS OF FINANCIAL CONDITION AND RESULTS OF OPERATIONS
Operating expense for 2013 and 2012 equaled 1.27% and 1.07% of average assets, respectively. Despite the increase in operating expenses, the Company continues to operate as one of the most efficient banks in the country.
The loss on real estate acquired through foreclosure decreased 81.07% to $1,859,000 in 2013 from $9,819,000 in 2012 due to improving property values and the decline in balances of real estate acquired through foreclosure, as the Bank continues to liquidate foreclosed properties. The net loss on real estate acquired through foreclosure, includes gains and losses on sale, ongoing maintenance expense and periodic write-downs from lower property valuations.
Income tax expense increased to $83,111,000 in 2013 from $77,728,000 for the fiscal year ended September 30, 2012. The effective tax rate was 35.42% for 2013 and 36.00% for 2012.
19
SELECTED FINANCIAL DATA
| Year ended September 30, | 2014 | 2013 | 2012 | 2011 | 2010 | ||||||||||
| (In thousands, except per share data) | |||||||||||||||
| Interest income | $ | 533,697 | $ | 516,291 | $ | 590,271 | $ | 644,635 | $ | 663,560 | |||||
| Interest expense | 128,077 | 136,159 | 193,249 | 227,696 | 269,101 | ||||||||||
| Net interest income | 405,620 | 380,132 | 397,022 | 416,939 | 394,459 | ||||||||||
| Provision for loan losses | (15,401 | ) | 1,350 | 44,955 | 93,104 | 179,909 | |||||||||
| Other income | 27,916 | 20,074 | 6,698 | (14,117 | ) | 39,995 | |||||||||
| Other expense | 204,009 | 164,240 | 142,854 | 136,059 | 131,480 | ||||||||||
| Income before income taxes | 244,928 | 234,616 | 215,911 | 173,659 | 123,065 | ||||||||||
| Income taxes | 87,564 | 83,111 | 77,728 | 62,518 | 4,372 | ||||||||||
| Net income available to common shareholders | $ | 157,364 | $ | 151,505 | $ | 138,183 | $ | 111,141 | $ | 118,693 | |||||
| Per share data | |||||||||||||||
| Basic earnings | $ | 1.56 | $ | 1.45 | $ | 1.29 | $ | 1.00 | $ | 1.06 | |||||
| Diluted earnings | 1.55 | 1.45 | 1.29 | 1.00 | 1.05 | ||||||||||
| Cash dividends | 0.41 | 0.36 | 0.32 | 0.24 | 0.20 | ||||||||||
| September 30, | 2014 | 2013 | 2012 | 2011 | 2010 | ||||||||||
| Total assets | $ | 14,756,041 | $ | 13,082,859 | $ | 12,472,944 | $ | 13,440,749 | $ | 13,486,379 | |||||
| Loans and mortgage-backed securities | 11,380,011 | 10,433,872 | 9,812,666 | 10,992,053 | 10,626,842 | ||||||||||
| Investment securities | 1,366,018 | 1,109,772 | 612,524 | 246,004 | 358,061 | ||||||||||
| Cash and cash equivalents | 781,843 | 203,563 | 751,430 | 816,002 | 888,622 | ||||||||||
| Customer accounts | 10,716,928 | 9,090,271 | 8,576,618 | 8,665,903 | 8,852,540 | ||||||||||
| FHLB advances | 1,930,000 | 1,930,000 | 1,880,000 | 1,962,066 | 1,865,548 | ||||||||||
| Other borrowings | — | — | — | 800,000 | 800,000 | ||||||||||
| Stockholders’ equity | 1,973,283 | 1,937,635 | 1,899,752 | 1,906,533 | 1,841,147 | ||||||||||
| Number of | |||||||||||||||
| Customer accounts | 548,872 | 332,177 | 308,282 | 309,532 | 327,430 | ||||||||||
| Loans | 35,550 | 35,934 | 37,522 | 39,986 | 42,540 | ||||||||||
| Offices | 251 | 182 | 166 | 160 | 160 | ||||||||||
20
WASHINGTON FEDERAL, INC. AND SUBSIDIARIES
CONSOLIDATED STATEMENTS OF FINANCIAL CONDITION
| September 30, | 2014 | 2013 | |||||
| (In thousands, except share data) | |||||||
| ASSETS | |||||||
| Cash and cash equivalents | $ | 781,843 | $ | 203,563 | |||
| Available-for-sale securities | 3,049,442 | 2,360,948 | |||||
| Held-to-maturity securities | 1,548,265 | 1,654,666 | |||||
| Loans receivable, net | 8,148,322 | 7,528,030 | |||||
| Covered loans, net | 176,476 | 295,947 | |||||
| Interest receivable | 52,037 | 49,218 | |||||
| Premises and equipment, net | 257,543 | 206,172 | |||||
| Real estate held for sale | 55,072 | 72,925 | |||||
| Real estate held for investment | 4,808 | 9,392 | |||||
| Covered real estate held for sale | 24,082 | 30,980 | |||||
| FDIC indemnification asset | 36,860 | 64,615 | |||||
| FHLB & FRB stock | 158,839 | 173,009 | |||||
| Intangible assets, including goodwill of $291,503 and $260,277 | 302,909 | 264,318 | |||||
| Federal and state income taxes, net | 16,515 | 44,000 | |||||
| Other assets | 143,028 | 125,076 | |||||
| $ | 14,756,041 | $ | 13,082,859 | ||||
| LIABILITIES AND STOCKHOLDERS’ EQUITY | |||||||
| Liabilities | |||||||
| Customer accounts | |||||||
| Transaction deposit accounts | $ | 5,490,687 | $ | 3,540,842 | |||
| Time deposit accounts | 5,226,241 | 5,549,429 | |||||
| 10,716,928 | 9,090,271 | ||||||
| FHLB advances | 1,930,000 | 1,930,000 | |||||
| Advance payments by borrowers for taxes and insurance | 29,004 | 42,443 | |||||
| Accrued expenses and other liabilities | 106,826 | 82,510 | |||||
| 12,782,758 | 11,145,224 | ||||||
| Stockholders’ equity | |||||||
| Common stock, $1.00 par value, 300,000,000 shares authorized; 133,322,909 and 132,572,475 shares issued; 98,404,705 and 102,484,671 shares outstanding | 133,323 | 132,573 | |||||
| Paid-in capital | 1,638,211 | 1,625,051 | |||||
| Accumulated other comprehensive income, net of taxes | 20,708 | 6,378 | |||||
| Treasury stock, at cost; 34,918,204 and 30,087,804 shares | (525,108 | ) | (420,817 | ) | |||
| Retained earnings | 706,149 | 594,450 | |||||
| 1,973,283 | 1,937,635 | ||||||
| $ | 14,756,041 | $ | 13,082,859 | ||||
SEE NOTES TO CONSOLIDATED FINANCIAL STATEMENTS
21
WASHINGTON FEDERAL, INC. AND SUBSIDIARIES
CONSOLIDATED STATEMENTS OF OPERATIONS
| Year ended September 30, | 2014 | 2013 | 2012 | ||||||
| (In thousands, except per share data) | |||||||||
| INTEREST INCOME | |||||||||
| Loans | $ | 430,850 | $ | 454,915 | $ | 484,833 | |||
| Mortgage-backed securities | 80,260 | 48,520 | 96,142 | ||||||
| Investment securities and cash equivalents | 22,587 | 12,856 | 9,296 | ||||||
| 533,697 | 516,291 | 590,271 | |||||||
| INTEREST EXPENSE | |||||||||
| Customer accounts | 58,524 | 67,903 | 86,939 | ||||||
| FHLB advances and other borrowings | 69,553 | 68,256 | 106,310 | ||||||
| 128,077 | 136,159 | 193,249 | |||||||
| Net interest income | 405,620 | 380,132 | 397,022 | ||||||
| Provision (reversal) for loan losses | (15,401 | ) | 1,350 | 44,955 | |||||
| Net interest income after provision for loan losses | 421,021 | 378,782 | 352,067 | ||||||
| OTHER INCOME | |||||||||
| Gain on sale of investments | — | — | 95,234 | ||||||
| Prepayment penalty on long-term debt | — | — | (95,565 | ) | |||||
| Loan fee income | 7,706 | 8,585 | 7,221 | ||||||
| Deposit fee income | 14,306 | 5,015 | 3,043 | ||||||
| Other income | 8,647 | 8,333 | 6,584 | ||||||
| 30,659 | 21,933 | 16,517 | |||||||
| OTHER EXPENSE | |||||||||
| Compensation and benefits | 109,730 | 90,815 | 77,628 | ||||||
| Occupancy | 30,452 | 23,597 | 20,257 | ||||||
| FDIC insurance premiums | 11,009 | 12,214 | 16,093 | ||||||
| Product delivery | 14,973 | 4,414 | 3,518 | ||||||
| Information technology | 14,303 | 10,999 | 9,376 | ||||||
| Other expense | 23,542 | 22,201 | 15,982 | ||||||
| 204,009 | 164,240 | 142,854 | |||||||
| Loss on real estate acquired through foreclosure, net | (2,743 | ) | (1,859 | ) | (9,819 | ) | |||
| Income before income taxes | 244,928 | 234,616 | 215,911 | ||||||
| Income taxes | |||||||||
| Current | 75,784 | 71,969 | 61,138 | ||||||
| Deferred | 11,780 | 11,142 | 16,590 | ||||||
| 87,564 | 83,111 | 77,728 | |||||||
| NET INCOME | $ | 157,364 | $ | 151,505 | $ | 138,183 | |||
| PER SHARE DATA | |||||||||
| Basic earnings | $ | 1.56 | $ | 1.45 | $ | 1.29 | |||
| Diluted earnings | 1.55 | 1.45 | 1.29 | ||||||
| Basic weighted average number of shares outstanding | 101,154,030 | 104,684,812 | 107,108,703 | ||||||
| Diluted weighted average number of shares outstanding, including dilutive stock options | 101,590,351 | 104,837,470 | 107,149,240 | ||||||
22
WASHINGTON FEDERAL, INC. AND SUBSIDIARIES
CONSOLIDATED STATEMENTS OF COMPREHENSIVE INCOME
| Year ended September 30, | 2014 | 2013 | 2012 | ||||||||
| (In thousands) | |||||||||||
| Net income | $ | 157,364 | $ | 151,505 | $ | 138,183 | |||||
| Other comprehensive income (loss) net of tax: | |||||||||||
| Net unrealized gains (losses) on available-for-sale securities | 22,656 | (10,953 | ) | (209,832 | ) | ||||||
| Related tax benefit (expense) | (8,326 | ) | 4,025 | 77,113 | |||||||
| Reclassification adjustment of net gains from sale | |||||||||||
| of available-for-sale securities included in net income | — | — | 95,234 | ||||||||
| Related tax benefit (expense) | — | — | (34,998 | ) | |||||||
| Other comprehensive income (loss) | 14,330 | (6,928 | ) | (72,483 | ) | ||||||
| Comprehensive income | $ | 171,694 | $ | 144,577 | $ | 65,700 | |||||
SEE NOTES TO CONSOLIDATED FINANCIAL STATEMENTS
23
WASHINGTON FEDERAL, INC. AND SUBSIDIARIES
CONSOLIDATED STATEMENTS OF STOCKHOLDERS' EQUITY
| Common Stock | Paid-in Capital | Retained Earnings | Accumulated Other Comprehensive Income (loss) | Treasury Stock | Total | |||||||||||||
| (In thousands) | ||||||||||||||||||
| Balance at September 30, 2011 | $ | 129,854 | $ | 1,582,843 | $ | 376,712 | $ | 85,789 | $ | (268,665 | ) | $ | 1,906,533 | |||||
| Net income | 138,183 | 138,183 | ||||||||||||||||
| Other comprehensive income adjustment | (72,483 | ) | (72,483 | ) | ||||||||||||||
| Dividends on common stock ($0.32 per share) | (34,115 | ) | (34,115 | ) | ||||||||||||||
| Compensation expense related to common stock options | 848 | 848 | ||||||||||||||||
| Proceeds from exercise of common stock options | 29 | 328 | 357 | |||||||||||||||
| Restricted stock | 67 | 2,276 | 2,343 | |||||||||||||||
| Treasury stock | (41,914 | ) | (41,914 | ) | ||||||||||||||
| Balance at September 30, 2012 | $ | 129,950 | $ | 1,586,295 | $ | 480,780 | $ | 13,306 | $ | (310,579 | ) | $ | 1,899,752 | |||||
| Net income | 151,505 | 151,505 | ||||||||||||||||
| Other comprehensive income adjustment | (6,928 | ) | (6,928 | ) | ||||||||||||||
| Dividends on common stock ($0.36 per share) | (37,835 | ) | (37,835 | ) | ||||||||||||||
| Compensation expense related to common stock options | 473 | 473 | ||||||||||||||||
| Proceeds from exercise of common stock options | 208 | 4,052 | 4,260 | |||||||||||||||
| Proceeds from issuance of common stock | 1,997 | 31,496 | 33,493 | |||||||||||||||
| Tax benefit related to exercise of stock options | 1 | 1 | ||||||||||||||||
| Restricted stock | 418 | 2,734 | 3,152 | |||||||||||||||
| Treasury stock | (110,238 | ) | (110,238 | ) | ||||||||||||||
| Balance at September 30, 2013 | $ | 132,573 | $ | 1,625,051 | $ | 594,450 | $ | 6,378 | $ | (420,817 | ) | $ | 1,937,635 | |||||
| Net income | 157,364 | 157,364 | ||||||||||||||||
| Other comprehensive income adjustment | 14,330 | 14,330 | ||||||||||||||||
| Dividends on common stock ($0.46 per share) | (45,665 | ) | (45,665 | ) | ||||||||||||||
| Compensation expense related to common stock options | 324 | 324 | ||||||||||||||||
| Proceeds from exercise of common stock options | 501 | 9,641 | 10,142 | |||||||||||||||
| Restricted stock | 249 | 3,195 | 3,444 | |||||||||||||||
| Treasury stock | (104,291 | ) | (104,291 | ) | ||||||||||||||
| Balance at September 30, 2014 | $ | 133,323 | $ | 1,638,211 | $ | 706,149 | $ | 20,708 | $ | (525,108 | ) | $ | 1,973,283 | |||||
SEE NOTES TO CONSOLIDATED FINANCIAL STATEMENTS
24
WASHINGTON FEDERAL, INC. AND SUBSIDIARIES
CONSOLIDATED STATEMENTS OF CASH FLOWS
| Year ended September 30, | 2014 | 2013 | 2012 | ||||||||
| (In thousands) | |||||||||||
| CASH FLOWS FROM OPERATING ACTIVITIES | |||||||||||
| Net income | $ | 157,364 | $ | 151,505 | $ | 138,183 | |||||
| Adjustments to reconcile net income to net cash provided by operating activities: | |||||||||||
| Depreciation and Amortization | 17,347 | 15,774 | 34,502 | ||||||||
| Cash received from FDIC under loss share | 2,502 | 13,421 | 7,587 | ||||||||
| Stock option compensation expense | 324 | 473 | 848 | ||||||||
| Provision for (reversal of) loan losses | (15,401 | ) | 1,350 | 44,955 | |||||||
| (Gain) loss on investment securities and real estate held for sale, net | (2,510 | ) | (8,011 | ) | (100,952 | ) | |||||
| Loss on extinguishment of debt | — | — | 95,565 | ||||||||
| (Increase) decrease in accrued interest receivable | (2,819 | ) | (330 | ) | 5,726 | ||||||
| Increase in FDIC loss share receivable | (1,795 | ) | (1,482 | ) | (3,284 | ) | |||||
| Decrease (increase) in income taxes receivable | 18,890 | (17,462 | ) | 18,066 | |||||||
| (Increase) decrease in other assets | (17,799 | ) | 36,350 | (74,889 | ) | ||||||
| Increase (decrease) in accrued expenses and other liabilities | 17,612 | (10,166 | ) | 8,649 | |||||||
| Net cash provided by operating activities | 173,715 | 181,422 | 174,956 | ||||||||
| CASH FLOWS FROM INVESTING ACTIVITIES | |||||||||||
| Net (loan originations) principal collections | (261,401 | ) | 343,771 | 544,240 | |||||||
| Loans purchased | (218,544 | ) | — | — | |||||||
| FHLB & FRB stock purchase | — | (23,981 | ) | — | |||||||
| FHLB & FRB stock redeemed | 14,017 | 5,894 | 1,830 | ||||||||
| Available-for-sale securities purchased | (1,280,477 | ) | (889,595 | ) | (2,442,184 | ) | |||||
| Principal payments and maturities of available-for-sale securities | 609,395 | 275,726 | 1,608,603 | ||||||||
| Available-for-sale securities sold | — | 43,198 | 2,257,913 | ||||||||
| Held-to-maturity securities purchased | — | (787,449 | ) | (1,167,121 | ) | ||||||
| Principal payments and maturities of held-to-maturity securities | 103,617 | 331,022 | 23,082 | ||||||||
| Net cash received from acquisition | 1,776,660 | 202,308 | 50,576 | ||||||||
| Proceeds from sales of real estate held for sale and investment | 73,895 | 115,615 | 175,832 | ||||||||
| Proceeds from sales of covered REO | 15,654 | 20,843 | 33,579 | ||||||||
| Premises and equipment purchased and REO improvements | (51,794 | ) | (29,246 | ) | (32,010 | ) | |||||
| Net cash provided (used) by investing activities | 781,022 | (391,894 | ) | 1,054,340 | |||||||
| CASH FLOWS FROM FINANCING ACTIVITIES | |||||||||||
| Net (decrease) in customer accounts | (226,914 | ) | (223,515 | ) | (225,068 | ) | |||||
| Proceeds from long-term borrowings | — | 50,000 | — | ||||||||
| Repayments of long-term borrowings | — | (22,470 | ) | (995,306 | ) | ||||||
| Proceeds from exercise of common stock options and related tax benefit | 10,252 | 4,261 | 357 | ||||||||
| Dividends paid on common stock | (42,065 | ) | (37,835 | ) | (32,430 | ) | |||||
| Treasury stock purchased, net | (104,291 | ) | (110,238 | ) | (41,914 | ) | |||||
| (Decrease) increase in advance payments by borrowers for taxes and insurance | (13,439 | ) | 2,402 | 493 | |||||||
| Net cash (used) by financing activities | (376,457 | ) | (337,395 | ) | (1,293,868 | ) | |||||
| Increase (decrease) in cash and cash equivalents | 578,280 | (547,867 | ) | (64,572 | ) | ||||||
| Cash and cash equivalents at beginning of period | 203,563 | 751,430 | 816,002 | ||||||||
| Cash and cash equivalents at end of period | $ | 781,843 | $ | 203,563 | $ | 751,430 | |||||
SEE NOTES TO CONSOLIDATED FINANCIAL STATEMENTS
25
WASHINGTON FEDERAL, INC. AND SUBSIDIARIES
CONSOLIDATED STATEMENTS OF CASH FLOWS (CONTINUED)
| Year ended September 30, | 2014 | 2013 | 2012 | ||||||||
| (In thousands) | |||||||||||
| SUPPLEMENTAL DISCLOSURES OF CASH FLOW INFORMATION | |||||||||||
| Non-cash investing activities | |||||||||||
| Non-covered real estate acquired through foreclosure | $ | 37,721 | $ | 91,352 | $ | 160,971 | |||||
| Covered real estate acquired through foreclosure | 8,748 | 11,196 | 15,905 | ||||||||
| Cash paid during the period for | |||||||||||
| Interest | 128,733 | 140,409 | 199,735 | ||||||||
| Income taxes | 64,372 | 80,417 | 59,596 | ||||||||
| The following summarizes the non-cash activities related to acquisitions | |||||||||||
| Fair value of assets and intangibles acquired, including goodwill | 80,242 | 607,193 | 124,594 | ||||||||
| Fair value of liabilities assumed | (1,856,902 | ) | (776,009 | ) | (154,493 | ) | |||||
| Net fair value of acquired assets (liabilities) | $ | (1,776,660 | ) | $ | (168,816 | ) | $ | (29,899 | ) | ||
SEE NOTES TO CONSOLIDATED FINANCIAL STATEMENTS
26
WASHINGTON FEDERAL, INC. AND SUBSIDIARIES
NOTES TO THE CONSOLIDATED FINANCIAL STATEMENTS
YEARS ENDED SEPTEMBER 30, 2014, 2013 AND 2012
NOTE A Summary of Significant Accounting Policies
Principles of consolidation. The consolidated financial statements include the accounts of the Company, the Bank and its wholly owned subsidiaries. Intercompany transactions and balances have been eliminated.
Description of business. The Company is a bank holding company that conducts its operations through a federally-insured national bank subsidiary. The Bank is principally engaged in the business of attracting deposits from the general public and investing these funds, together with borrowings and other funds, in one-to-four family residential real estate loans, multi-family real estate loans and commercial loans. The Bank conducts its activities through a network of 251 offices located in Washington, Oregon, Idaho, Utah, Arizona, Nevada, New Mexico, and Texas.
The Company's fiscal year end is September 30th. All references to 2014, 2013 and 2012 represent balances as of September 30, 2014, September 30, 2013 and September 30, 2012, or activity for the fiscal years then ended. References to net income in this document refer to net income available to common shareholders.
Acquisitions. Certain Branches of Bank of America, National Association. During this fiscal year, the Bank has acquired 74 branches from Bank of America, National Association. This included: effective as of the close of business on October 31, 2013, 11 branches located in New Mexico; effective as of the close of business on December 6, 2013, 40 branches located in Washington, Oregon, and Idaho; and effective as of the close of business on May 2, 2014, 23 branches located in Arizona and Nevada. The combined acquisitions provided $1.9 billion in deposit accounts, $13 million of loans, and $25 million in branch properties. The Bank paid a 1.99% premium on the total deposits and received $1.8 billion in cash from the transactions. The acquisition method of accounting was used to account for the acquisitions. The purchased assets and assumed liabilities are recorded at their respective acquisition date estimated fair values. The Bank recorded $11 million in core deposit intangible and $31 million in goodwill related to these transactions. The operating results of the Company include the operating results produced by the first 11 branches for the period from November 1, 2013 to September 30, 2014, for the additional 40 branches from December 7, 2013 to September 30, 2014, and for the most recent 23 branches from May 3, 2014 to September 30, 2014.
South Valley Bancorp, Inc. Effective November 1, 2012, the Bank acquired South Valley Bancorp, Inc. and South Valley's wholly owned subsidiary, South Valley Bank & Trust ("SVBT"), was merged into the Bank. The acquisition provided $361 million of net loans, $108 million of net covered loans, $736 million of deposit accounts, including $533 million in transaction deposit accounts and 24 branch locations in Central and Southern Oregon. Total consideration paid at closing was $44 million, including $34 million of the Company's stock and $10 million of cash resulting from the collection of certain earn-out assets. The operating results of the Company include the operating results produced by the acquired assets and assumed liabilities for the period November 1, 2012 to September 30, 2014.
Western National Bank. Effective December 16, 2011, the Bank acquired certain assets and liabilities, including most of the loans and deposits, of Western National Bank, headquartered in Phoenix, Arizona (“WNB”) from the Federal Deposit Insurance Corporation (“FDIC”) in an FDIC-assisted transaction. Under the terms of the Purchase and Assumption Agreement, the Bank and the FDIC agreed to a discount of $53 million on net assets and no loss sharing provision or premium on deposits. WNB operated three full-service offices in Arizona. The Bank acquired certain assets with a book value of $177 million, including $143 million in loans and $7 million in foreclosed real estate, and selected liabilities with a book value of $153 million, including $136 million in deposits. Pursuant to the purchase and assumption agreement with the FDIC, the Bank received a cash payment from the FDIC for $30 million. The operating results of the Company include the operating results produced by the acquired assets and assumed liabilities for the period December 16, 2011 to September 30, 2014.
Charter Bank. Effective October 14, 2011, the Bank acquired six branch locations, four in Albuquerque, New Mexico, and two in Santa Fe, New Mexico, from Charter Bank. $255 million of deposits were acquired for a premium of $1 million. The operating results of the Company include the operating results produced by the assumed liabilities for the period October 14, 2011 to September 30, 2014.
Cash and cash equivalents. Cash and cash equivalents include cash on hand, amounts due from banks, overnight investments and repurchase agreements with an initial maturity of three months or less.
27
WASHINGTON FEDERAL, INC. AND SUBSIDIARIES
NOTES TO THE CONSOLIDATED FINANCIAL STATEMENTS
YEARS ENDED SEPTEMBER 30, 2014, 2013 AND 2012
Investments and mortgage-backed securities. The Company accounts for investments and mortgage-backed securities in two categories: held-to-maturity and available-for-sale. Premiums and discounts on investments are deferred and recognized over the life of the asset using the effective interest method.
Held-to-maturity securities are accounted for at amortized cost, but the Company must have both the positive intent and the ability to hold those securities to maturity. There are very limited circumstances under which securities in the held-to-maturity category can be sold without jeopardizing the cost basis of accounting for the remainder of the securities in this category.
Available-for-sale securities are accounted for at fair value. Gains and losses realized on the sale of these securities are accounted for based on the specific identification method. Unrealized gains and losses for available-for-sale securities are excluded from earnings and reported as a net amount in the accumulated other comprehensive income component of stockholders' equity.
Realized gains and losses on securities sold as well as other than temporary impairment charges, are shown on the Consolidated Statements of Operations under the Other Income heading. Management evaluates debt and equity securities for other than temporary impairment on a quarterly basis based on the securities' current credit quality, interest rates, term to maturity and management's intent and ability to hold the securities until the net book value is recovered.
Loans receivable. Loans that are performing in accordance with their contractual terms are held at their carrying amount and expected interest is accrued. The Bank also receives fees for originating loans in addition to various fees and charges related to existing loans, which may include prepayment charges, late charges and assumption fees.
When a borrower fails to make a required payment on a loan, the Bank attempts to cure the deficiency by contacting the borrower. Contact is made after a payment is 30 days past its grace period. In most cases, deficiencies are cured promptly. If the delinquency is not cured within 90 days, the Bank may institute appropriate action to foreclose on the property. If foreclosed, the property is sold at a public sale and may be purchased by the Bank.
The Bank will consider modifying the interest rates and terms of a loan if it determines that a modification is a better alternative to foreclosure. Most troubled debt restructured ("TDR") loans are accruing and performing loans where the borrower has proactively approached the Bank about modifications due to temporary financial difficulties. Each request is individually evaluated for merit and likelihood of success. The concession for these loans is typically a payment reduction through a rate reduction of from 100 to 200 bps for a specific term, usually six to twelve months. Interest-only payments may also be approved during the modification period. Principal forgiveness is generally not an available option for restructured loans. Before granting approval to modify a loan in a TDR, we consider a borrower’s ability to repay by evaluating: current income levels and debt to income ratio, borrower’s credit score, payment history of the loan, and updated valuation of the secondary repayment source. The Bank also modifies some loans that are not classified as TDRs as the modification is due to a restructuring where the effective interest rate on the debt is reduced to reflect a decrease in market interest rates.
Loans are placed on nonaccrual status when, in the judgment of management, the probability of collection of interest is deemed to be insufficient to warrant further accrual. When a loan is placed on nonaccrual status, previously accrued but unpaid interest is deducted from interest income. The Bank does not accrue interest on loans 90 days or more past due. If payment is made on a loan so that the loan becomes less than 90 days past due, and the Bank expects full collection of principal and interest, the loan is returned to full accrual status. Any interest ultimately collected is credited to income in the period of recovery. A loan is charged-off when the loss is estimable and it is confirmed that the borrower will not be able to meet contractual obligations.
If a consumer loan is on non-accrual status before becoming a TDR it will stay on non-accrual status following restructuring until it has been performing for at least six months, at which point it may be moved to accrual status. If a loan is on accrual status before it becomes a TDR, and management concludes that full repayment is highly probable based on internal evaluation, it will remain on accrual status following restructuring. If the consumer restructured loan does not perform, it is placed in non-accrual status when it is 90 days delinquent. For commercial loans, six consecutive payments on newly restructured loan terms are required prior to returning the loan to accrual status. In some instances after the required six consecutive payments are made management will conclude that collection of the entire principal balance is still in doubt. In those instances, the loan will remain on non-accrual.
Impaired loans consist of loans receivable that are not expected to have their principal and interest repaid in accordance with their contractual terms. This includes TDRs that are on non-accrual status. Collateral dependent impaired loans are measured using
28
WASHINGTON FEDERAL, INC. AND SUBSIDIARIES
NOTES TO THE CONSOLIDATED FINANCIAL STATEMENTS
YEARS ENDED SEPTEMBER 30, 2014, 2013 AND 2012
the fair value of the collateral, less selling costs. Non-collateral dependent loans are measured at the present value of expected future cash flows.
Deferred fees and discounts on loans. Loan discounts and loan fees are deferred and recognized over the life of the loans using the effective interest method.
Allowance for Loan Losses. The Bank maintains an allowance for loan losses to absorb losses inherent in the loan portfolio. The allowance is based on ongoing, quarterly assessments of the probable and estimable losses inherent in the loan portfolio. The Bank's general methodology for assessing the appropriateness of the allowance is to apply a loss percentage factor to the different loan types. The loss percentage factor is made up of two parts - the historical loss factor (“HLF”) and the qualitative loss factor (“QLF”).
The HLF takes into account historical charge-offs by loan type. The Bank uses an average of historical loss rates for each loan category multiplied by a loss emergence period. This is the likely period of time during which a residential or commercial loan borrower experiencing financial difficulties might deplete their cash prior to becoming delinquent on their loan, plus the period of time that it takes the bank to work out the loans.
The QLF are based on management's continuing evaluation of the pertinent factors underlying the quality of the loan portfolio, including changes in the size and composition of the loan portfolio, actual loan loss experience, current economic conditions, collateral values, geographic concentrations, seasoning of the loan portfolio, specific industry conditions, and the duration of the current business cycle. These factors are considered by loan type.
Specific allowances are established for loans which are individually evaluated, in cases where management has identified significant conditions or circumstances related to a loan that management believes indicate the probability that a loss has been incurred. The Bank has also established a reserve for unfunded commitments.
The recovery of the carrying value of loans is susceptible to future market conditions beyond the Bank's control, which may result in losses or recoveries differing from those provided. In those cases, a portion of the allowance is then allocated to reflect the estimated loss exposure.
Covered assets. Covered loans are the loans acquired from Horizon Bank in 2010 and certain loans acquired from SVBT in fiscal 2013 that are recorded at their estimated fair market value. Loans that were classified as non-performing loans by Horizon Bank and SVBT are no longer classified as non-performing because, at acquisition, the carrying value of these loans was adjusted to reflect fair value and are covered under the FDIC loss sharing agreements. Management believes that the new book value reflects an amount that will ultimately be collected. Acquired credit impaired loans are accounted for under Financial Accounting Standards Board ("FASB") Accounting Standards Codification ("ASC") 310-30 when there is evidence of credit deterioration since origination and for which it is probable, at acquisition, that the Company would be unable to collect all contractually required payments. Interest income, through accretion of the difference between the carrying amount of the loans and the expected cash flows, are recognized on all acquired loans. Covered real estate held for sale represents the foreclosed properties that were originally Horizon Bank loans or certain SVBT loans. Covered real estate held for sale is carried at the estimated fair market value of the repossessed real estate. The covered loans and covered real estate held for sale are collectively referred to as “covered assets”. When FDIC loss share agreements expire, any remaining loans will be transferred to the non covered portfolio.
FDIC indemnification asset. FDIC indemnification asset is the receivable recorded due to the guarantee provided by the FDIC on the covered assets. This asset declines due to collections from the FDIC on claims or the eventual expiration of the FDIC loss share agreements.
Client Derivatives. Interest rate swap agreements are provided to certain clients who desire to convert their obligations from variable to fixed interest rates. Under these agreements, the Bank enters into a variable-rate loan agreement with a customer in addition to a swap agreement, and then enters into a corresponding swap agreement with a third party in order to offset its exposure on the customer swap agreement. As the interest rate swap agreements with the customers and third parties are not designated as hedges under FASB ASC 815, Derivatives and Hedging, the instruments are marked to market in earnings. The change in fair value of the offsetting swaps are included in interest income and interest expense and there is no impact on net income. There is fee income earned on the swaps that is included in miscellaneous loan income.
29
WASHINGTON FEDERAL, INC. AND SUBSIDIARIES
NOTES TO THE CONSOLIDATED FINANCIAL STATEMENTS
YEARS ENDED SEPTEMBER 30, 2014, 2013 AND 2012
Long Term Borrowing Hedges. The Bank has entered into forward-starting interest rate swaps to convert a series of future short-term borrowings to fixed rate payments. These interest rate swaps qualify as cash flow hedging instruments under ASC 815 which provides for matching of the recognition of gains and losses of the interest rate swaps and the hedged items. Prior to the starting date, the change in the fair value of the interest rate swap will be recorded in Other Comprehensive Income.
Premises and equipment. Premises and equipment are stated at cost, less accumulated depreciation. Depreciation is computed on the straight-line method over the estimated useful lives of the respective assets. Expenditures are capitalized for betterments and major renewals. Charges for ordinary maintenance and repairs are expensed to operations as incurred.
Real estate held for sale. Properties acquired in settlement of loans or acquired for development are recorded at fair value less selling costs. Subsequent accounting is recorded at lower of cost or market. These gains (losses) are shown on the real estate acquired through foreclosure line item.
Real estate held for investment. Properties acquired in settlement of loans or acquired for development are recorded at fair value less selling costs where management has the intent to hold the properties until the housing market recovers. Subsequent accounting is recorded at lower of cost or market. These gains (losses) are shown on the real estate acquired through foreclosure line item.
Intangible assets. Goodwill represents the excess of the cost of businesses acquired over the fair value of the net assets acquired. The core deposit intangibles and non-compete agreement intangible are acquired assets that lack physical substance but can be distinguished from goodwill. Goodwill is evaluated for impairment on an annual basis. Other intangible assets are amortized over their estimated lives and are subject to impairment testing when events or circumstances change. If circumstances indicate that the carrying value of the assets may not be recoverable, an impairment charge could be recorded. No impairment of intangible assets has ever been identified. The Bank amortizes the core deposit intangibles over their estimated lives generally on an accelerated method.
The balance of the Company's intangible assets was as follows, which includes the additional goodwill discussed above:
| Goodwill | Servicing Rights Intangible | Core Deposit Intangible | Total | ||||||||||||
| (In thousands) | |||||||||||||||
| Balance at September 30, 2012 | $ | 251,653 | $ | 286 | $ | 4,137 | $ | 256,076 | |||||||
| Additions | 8,624 | — | 1,433 | 10,057 | |||||||||||
| Amortization | — | (286 | ) | (1,529 | ) | (1,815 | ) | ||||||||
| Balance at September 30, 2013 | 260,277 | — | 4,041 | 264,318 | |||||||||||
| Additions | 31,226 | — | 11,040 | 42,266 | |||||||||||
| Amortization | — | — | (3,675 | ) | (3,675 | ) | |||||||||
| Balance at September 30, 2014 | $ | 291,503 | $ | — | $ | 11,406 | $ | 302,909 | |||||||
The table below presents the estimated core deposit intangible asset amortization expense for the next five years:
| Year End | Expense | |||
| (In thousands) | ||||
| 2015 | $ | 3,479 | ||
| 2016 | 2,314 | |||
| 2017 | 1,607 | |||
| 2018 | 1,208 | |||
| 2019 | 1,254 | |||
Income taxes. Income taxes are accounted for using the asset and liability method, which requires the recognition of deferred tax assets and liabilities for the expected future tax consequences of events that have been included in the financial statements. Under this method, a deferred tax asset or liability is determined based on the differences between the financial statements and
30
WASHINGTON FEDERAL, INC. AND SUBSIDIARIES
NOTES TO THE CONSOLIDATED FINANCIAL STATEMENTS
YEARS ENDED SEPTEMBER 30, 2014, 2013 AND 2012
tax basis of assets and liabilities using enacted tax rates in effect for the year in which the differences are expected to reverse. The provision for income taxes includes current and deferred income tax expense based on net income adjusted for temporary and permanent differences such as depreciation, interest on state and municipal securities, and affordable housing tax credits. Income tax related interest and penalties, if applicable, and amortization of affordable housing tax credit investments are recorded within income tax expense.
Accounting for stock-based compensation. The Company records an expense for the estimated fair value of equity awards over the vesting period. See Note L for additional information. Stock options that were not dilutive but were outstanding as of September 30, 2014, 2013 and 2012 were 90,846, 435,825 and 934,880, respectively.
Use of estimates. The preparation of financial statements in conformity with accounting principles generally accepted in the United States of America requires management to make estimates and assumptions that affect the reported amounts of assets and liabilities and disclosure of contingent assets and liabilities at the date of the financial statements and the reported amounts of revenues and expenses during the reporting period. Significant estimates reported in the financial statements include the allowance for loan losses, intangible assets, deferred taxes and contingent liabilities. Actual results could differ from these estimates.
New accounting pronouncements. In December 2012, FASB issued Accounting Standards Update ("ASU") 2012-06, Subsequent Accounting for an Indemnification Asset Recognized at the Acquisition Date as a Result of a Government-Assisted Acquisition of a Financial Institution. ASU 2012-06 clarifies that when a reporting entity recognizes an indemnification asset as the result of a government-assisted acquisition of a financial institution and there is a change in the amount of cash flows expected to be collected on the indemnification asset, the reporting entity should subsequently measure the indemnification asset on the same basis as the underlying loans by taking into account the contractual limitations of the Loss-Sharing Agreement ("LSA"). For amortization of changes in value, the reporting entity should use the term of LSA if it is shorter than the term of the acquired loans. This new guidance did not have a material impact on the Company's consolidated financial statements.
In January 2013, the FASB issued ASU 2013-01, Balance Sheet (Topic 210): Clarifying the Scope of Disclosures about Offsetting Assets and Liabilities. The main objective was to address implementation issues about the scope of ASU No. 2011-11, Balance Sheet (Topic 210): Disclosures about Offsetting Assets and Liabilities. The guidance in this ASU was effective beginning on or after January 1, 2013. This new guidance did not have a material impact on the Company's consolidated financial statements.
In February 2013, the FASB issued ASU 2013-02, Comprehensive Income (Topic 220): Reporting of Amounts Reclassified Out of Accumulated Other Comprehensive Income. The objective was to improve the reporting of reclassifications out of accumulated other comprehensive income. The amendments do not change the current requirements for reporting net income or other comprehensive income in financial statements; rather, they require the entity to provide information about the amounts reclassified out of accumulated other comprehensive income by component. The guidance in this ASU was effective for fiscal years beginning after December 15, 2012. This new guidance did not have a material impact on the Company's consolidated financial statements.
In July 2013, the FASB issued ASU 2013-10, Derivatives and Hedging (Topic 815): Inclusion of the Fed Funds Effective Swap Rate (or Overnight Index Swap Rate) as a Benchmark Interest Rate for Hedge Accounting Purposes. Topic 815, Derivatives and Hedging, provides guidance on the risks that are permitted to be hedged in a fair value or cash flow hedge. The objective of this update is to provide for the inclusion of the Fed Funds Effective Swap Rate as a U.S. benchmark interest rate for hedge accounting purposes, in addition to UST and LIBOR rates. The guidance in this ASU is effective prospectively for qualifying new or redesignated hedging relationships entered into on or after July 17, 2013. The adoption of this ASU did not have a material impact on the Company's consolidated financial statements.
In July 2013, the FASB issued ASU 2013-11, Income Taxes (Topic 740): Presentation of an Unrecognized Tax Benefit When a Net Operating Loss Carryforward, A Similar Tax Loss, or a Tax Credit Carryforward Exists. Some entities present unrecognized tax benefits as a liability unless the unrecognized tax benefit is directly associated with a tax position taken in a tax year that results in, or that resulted in, the recognition of a net operating loss or tax credit carryforward for that year and the net operating loss or tax credit carryforward has not been utilized. Other entities present unrecognized tax benefits as a reduction of a deferred tax asset for a net operating loss or tax credit carryforward in certain circumstances. The objective of these is to eliminate that diversity in practice. The guidance in this ASU is effective for fiscal years beginning after December 15, 2013. This new guidance did not have a material impact on the Company's consolidated financial statements.
31
WASHINGTON FEDERAL, INC. AND SUBSIDIARIES
NOTES TO THE CONSOLIDATED FINANCIAL STATEMENTS
YEARS ENDED SEPTEMBER 30, 2014, 2013 AND 2012
In January 2014, the FASB issued ASU 2014-04, Receivables - Troubled Debt Restructurings by Creditors (Subtopic 310-40) - Reclassification of Residential Real Estate Collateralized Consumer Mortgage Loans upon Foreclosure. The new guidance clarifies that an in substance repossession or foreclosure occurs, and a creditor is considered to have received physical possession of residential real estate property collateralizing a consumer mortgage loan, upon either: (a) the creditor obtaining legal title to the residential real estate property upon completion of a foreclosure; or (b) the borrower conveying all interest in the residential real estate property to the creditor to satisfy that loan through completion of a deed in lieu of foreclosure or through a similar legal agreement. Additional disclosures are required. The amendments are effective beginning after December 15, 2014. This ASU is not expected to have a material impact on the Company's consolidated financial statements.
In January 2014, the FASB issued ASU 2014-01, Investments - Equity Method and Joint Ventures (Topic 323): Accounting for Investments in Qualified Affordable Housing Projects. This new guidance permits reporting entities to make an accounting policy election to account for their investments in qualified affordable housing projects using the proportional amortization method if certain conditions are met. Under the proportional amortization method, an entity amortizes the initial cost of the investment in proportion to the tax credits and other tax benefits received and recognizes the net investment performance in the income statement as a component of income tax expense (benefit). Those not electing the proportional amortization method would account for the investment using the equity method or cost method. This new guidance is effective on a retrospective basis beginning after December 15, 2014 with early adoption permitted. The Company adopted this ASU prospectively as of December 31, 2013 as the retrospective adjustments were not material. The amount of affordable housing tax credits that were recognized during the 2014 fiscal year is $3 million. The net investment balance recognized as of September 30, 2014 is $42 million. Using the proportional amortization method, the amount recognized as a component of income tax expense for the 2014 fiscal year is $4 million. Contingent commitments for equity contributions during the 2014 calendar year are $35 million. Overall, this adoption did not have a material impact on the Company's consolidated financial statements.
In May 2014, the FASB issued ASU 2014-09, Revenue from Contracts with Customers (Topic 606). This new accounting guidance clarifies the principles for recognizing revenue from contracts with customers. The new accounting guidance, which does not apply to financial instruments, is effective on a retrospective basis beginning on January 1, 2017. The Company does not expect the new guidance to have a material impact on its consolidated financial position or results of operation.
In June 2014, the FASB issued ASU 2014-11, Transfers and Servicing (Topic 860) - Repurchase to Maturity Transactions, Repurchase Financings, and Disclosures. Under this new accounting guidance, repurchase-to-maturity transactions will be accounted for as secured borrowings rather than sales of an asset, and transfers of financial assets with contemporaneous repurchase financings will no longer be evaluated to determine whether they should be accounted for on a combined basis as forward contracts. The new guidance also prescribes additional disclosures particularly on the nature of collateral pledged in repurchase financings accounted for as secured borrowings. The new guidance is effective beginning on January 1, 2015. The Company does not expect this guidance to have a material impact on its consolidated financial position or results of operation.
Business segments. As the Company manages its business and operations on a consolidated basis, management has determined that there is one reportable business segment.
Reclassifications. Reclassification of Other Expenses into Product delivery and Information technology line items have been made to the financial statements for years prior to September 30, 2014 to conform to current year classifications.
Reclassification of Real Estate Held for Investment into its own line item and out of Real Estate Held for Sale have been made to the financial statements for years prior to September 30, 2014 to conform to current year classifications.
32
WASHINGTON FEDERAL, INC. AND SUBSIDIARIES
NOTES TO THE CONSOLIDATED FINANCIAL STATEMENTS
YEARS ENDED SEPTEMBER 30, 2014, 2013 AND 2012
NOTE B INVESTMENT SECURITIES
| September 30, | 2014 | |||||||||||||||||
Amortized Cost | Gross Unrealized | Fair Value | Yield | |||||||||||||||
| Gains | Losses | |||||||||||||||||
| (In thousands) | ||||||||||||||||||
| Available-for-sale securities | ||||||||||||||||||
| U.S. government and agency securities due | ||||||||||||||||||
| 1 to 5 years | $ | 171,154 | $ | 2,585 | $ | (748 | ) | $ | 172,991 | 1.26 | % | |||||||
| 5 to 10 years | 203,317 | 300 | (102 | ) | 203,515 | 1.45 | % | |||||||||||
| Over 10 years | 354,828 | 1,028 | (419 | ) | 355,437 | 1.25 | % | |||||||||||
| Equity Securities | ||||||||||||||||||
| 1 to 5 years | 100,500 | 887 | — | 101,387 | 1.90 | % | ||||||||||||
| 5 to 10 years | — | — | — | — | — | % | ||||||||||||
| Corporate bonds due | ||||||||||||||||||
| Within 1 year | 15,000 | 75 | — | 15,075 | 1.00 | % | ||||||||||||
| 1 to 5 years | 302,540 | 2,372 | — | 304,912 | 0.71 | % | ||||||||||||
| 5 to 10 years | 138,201 | 1,789 | (970 | ) | 139,020 | 1.43 | % | |||||||||||
| Over 10 years | 50,000 | — | — | 50,000 | 3.00 | % | ||||||||||||
| Municipal bonds due | ||||||||||||||||||
| Over 10 years | 20,402 | 3,279 | — | 23,681 | 6.45 | % | ||||||||||||
| Mortgage-backed securities | ||||||||||||||||||
| Agency pass-through certificates | 1,561,639 | 24,893 | (2,024 | ) | 1,584,508 | 2.57 | % | |||||||||||
| Other commercial MBS | 98,851 | 65 | 98,916 | 1.49 | % | |||||||||||||
| 3,016,432 | 37,273 | (4,263 | ) | 3,049,442 | 1.99 | % | ||||||||||||
| Held-to-maturity securities | ||||||||||||||||||
| Mortgage-backed securities | ||||||||||||||||||
| Agency pass-through certificates | 1,548,265 | 4,855 | (53,902 | ) | 1,499,218 | 3.13 | % | |||||||||||
| 1,548,265 | 4,855 | (53,902 | ) | 1,499,218 | 3.13 | % | ||||||||||||
| $ | 4,564,697 | $ | 42,128 | $ | (58,165 | ) | $ | 4,548,660 | 2.38 | % | ||||||||
33
WASHINGTON FEDERAL, INC. AND SUBSIDIARIES
NOTES TO THE CONSOLIDATED FINANCIAL STATEMENTS
YEARS ENDED SEPTEMBER 30, 2014, 2013 AND 2012
| September 30, | 2013 | |||||||||||||||||
Amortized Cost | Gross Unrealized | Fair Value | Yield | |||||||||||||||
| Gains | Losses | |||||||||||||||||
| (In thousands) | ||||||||||||||||||
| Available-for-sale securities | ||||||||||||||||||
| U.S. government and agency securities due | ||||||||||||||||||
| 1 to 5 years | $ | 61,002 | $ | 3,393 | $ | (252 | ) | $ | 64,143 | 1.98 | % | |||||||
| 5 to 10 years | 129,219 | — | (1,547 | ) | 127,672 | 0.86 | % | |||||||||||
| Over 10 years | 344,571 | — | (2,411 | ) | 342,160 | 0.93 | % | |||||||||||
| Equity Securities | ||||||||||||||||||
| 1 to 5 years | 500 | 11 | — | 511 | 2.17 | % | ||||||||||||
| 5 to 10 years | 100,000 | 726 | — | 100,726 | 1.80 | % | ||||||||||||
| Corporate bonds due | ||||||||||||||||||
| Within 1 year | 19,500 | 3 | — | 19,503 | 0.49 | % | ||||||||||||
| 1 to 5 years | 317,190 | 1,980 | (130 | ) | 319,040 | 0.75 | % | |||||||||||
| 5 to 10 years | 113,060 | 1,180 | (768 | ) | 113,472 | 1.53 | % | |||||||||||
| Municipal bonds due | ||||||||||||||||||
| Over 10 years | 20,422 | 2,123 | — | 22,545 | 6.45 | % | ||||||||||||
| Mortgage-backed securities | ||||||||||||||||||
| Agency pass-through certificates | 1,245,400 | 10,270 | (4,494 | ) | 1,251,176 | 2.18 | % | |||||||||||
| 2,350,864 | 19,686 | (9,602 | ) | 2,360,948 | 1.70 | % | ||||||||||||
| Held-to-maturity securities | ||||||||||||||||||
| Mortgage-backed securities | ||||||||||||||||||
| Agency pass-through certificates | 1,654,666 | 3,387 | (75,204 | ) | 1,582,849 | 3.14 | % | |||||||||||
| 1,654,666 | 3,387 | (75,204 | ) | 1,582,849 | 3.14 | % | ||||||||||||
| $ | 4,005,530 | $ | 23,073 | $ | (84,806 | ) | $ | 3,943,797 | 2.30 | % | ||||||||
There were no available-for-sale securities that were sold in 2014. There were $43,198,000 of available-for-sale securities that were sold in 2013, resulting in a net gain of $0 as these securities were acquired from SVBT and sold on the same day. There were $2,257,913,000 of available-for-sale securities that were sold in 2012, resulting in a net gain of $95,234,000. Substantially all mortgage-backed securities have contractual due dates that exceed twenty-five years.
The following table shows the unrealized gross losses and fair value of securities at September 30, 2014 and September 30, 2013, by length of time that individual securities in each category have been in a continuous loss position. The Bank had $1,642,718,000 securities in a continuous loss position for 12 or more months at September 30, 2014, and $190,357,000 securities in a continuous loss position for 12 months at September 30, 2013, which consisted of corporate bonds, U.S. government and agency securities, and mortgage-backed securities. Management believes that the declines in fair value of these investments are not an other than temporary impairment as these losses are due to a change in interest rates rather than any credit deterioration. The impairment is also deemed to be temporary because: 1) the Bank does not intend to sell the security, and 2) It is not more likely than not that it will be required to sell the security before recovery of the entire amortized cost basis of the security.
34
WASHINGTON FEDERAL, INC. AND SUBSIDIARIES
NOTES TO THE CONSOLIDATED FINANCIAL STATEMENTS
YEARS ENDED SEPTEMBER 30, 2014, 2013 AND 2012
| As of September 30, | 2014 | |||||||||||||||||
| Less than 12 months | 12 months or more | Total | ||||||||||||||||
Unrealized Gross Losses | Fair Value | Unrealized Gross Losses | Fair Value | Unrealized Gross Losses | Fair Value | |||||||||||||
| (In thousands) | ||||||||||||||||||
| Corporate Bonds | $ | (125 | ) | $ | 24,875 | $ | (845 | ) | $ | 24,155 | $ | (970 | ) | $ | 49,030 | |||
| U.S. agency securities | (472 | ) | 316,578 | (797 | ) | 109,354 | (1,269 | ) | 425,932 | |||||||||
| Agency pass-through certificates | (215 | ) | 19,212 | (55,711 | ) | 1,509,209 | (55,926 | ) | 1,528,421 | |||||||||
| $ | (812 | ) | $ | 360,665 | $ | (57,353 | ) | $ | 1,642,718 | $ | (58,165 | ) | $ | 2,003,383 | ||||
| As of September 30, | 2013 | |||||||||||||||||
| Less than 12 months | 12 months or more | Total | ||||||||||||||||
Unrealized Gross Losses | Fair Value | Unrealized Gross Losses | Fair Value | Unrealized Gross Losses | Fair Value | |||||||||||||
| (In thousands) | ||||||||||||||||||
| Corporate Bonds | $ | (660 | ) | $ | 52,434 | $ | (238 | ) | $ | 9,763 | $ | (898 | ) | $ | 62,197 | |||
| U.S. agency securities | (4,144 | ) | 309,109 | (66 | ) | 14,091 | (4,210 | ) | 323,200 | |||||||||
| Agency pass-through certificates | (78,291 | ) | 1,703,948 | (1,407 | ) | 166,503 | (79,698 | ) | 1,870,451 | |||||||||
| $ | (83,095 | ) | $ | 2,065,491 | $ | (1,711 | ) | $ | 190,357 | $ | (84,806 | ) | $ | 2,255,848 | ||||
35
WASHINGTON FEDERAL, INC. AND SUBSIDIARIES
NOTES TO THE CONSOLIDATED FINANCIAL STATEMENTS
YEARS ENDED SEPTEMBER 30, 2014, 2013 AND 2012
NOTE C Loans Receivable (excluding Covered Loans)
| September 30, 2014 | September 30, 2013 | ||||||||||||
| (In thousands) | (In thousands) | ||||||||||||
| Non-acquired loans | |||||||||||||
| Single-family residential | $ | 5,560,203 | 64.1 | % | $ | 5,359,149 | 67.1 | % | |||||
| Construction - speculative | 140,060 | 1.6 | 130,778 | 1.6 | |||||||||
| Construction - custom | 385,824 | 4.5 | 302,722 | 3.8 | |||||||||
| Land - acquisition & development | 77,832 | 0.9 | 77,775 | 1.1 | |||||||||
| Land - consumer lot loans | 108,623 | 1.3 | 121,671 | 1.5 | |||||||||
| Multi-family | 917,286 | 10.6 | 831,684 | 10.4 | |||||||||
| Commercial real estate | 591,336 | 6.9 | 414,961 | 5.1 | |||||||||
| Commercial & industrial | 379,226 | 4.4 | 243,199 | 3.0 | |||||||||
| HELOC | 116,042 | 1.4 | 112,186 | 1.4 | |||||||||
| Consumer | 132,590 | 1.5 | 47,141 | 0.6 | |||||||||
| Total non-acquired loans | 8,409,022 | 97.2 | 7,641,266 | 95.6 | |||||||||
| Acquired loans | |||||||||||||
| Single-family residential | 11,716 | 0.1 | % | 14,468 | 0.2 | % | |||||||
| Construction - speculative | — | — | — | — | |||||||||
| Construction - custom | — | — | — | — | |||||||||
| Land - acquisition & development | 905 | — | 1,489 | — | |||||||||
| Land - consumer lot loans | 2,507 | — | 3,313 | — | |||||||||
| Multi-family | 2,999 | — | 3,914 | 0.1 | |||||||||
| Commercial real estate | 97,898 | 1.1 | 133,423 | 1.7 | |||||||||
| Commercial & industrial | 54,219 | 0.6 | 75,326 | 0.9 | |||||||||
| HELOC | 8,274 | 0.1 | 10,179 | 0.1 | |||||||||
| Consumer | 5,670 | 0.1 | 8,267 | 0.1 | |||||||||
| Total acquired loans | 184,188 | 2.0 | 250,379 | 3.1 | |||||||||
| Credit-impaired acquired loans | |||||||||||||
| Single-family residential | 325 | — | 333 | — | |||||||||
| Construction - speculative | — | — | — | — | |||||||||
| Construction - custom | — | — | — | — | |||||||||
| Land - acquisition & development | 1,622 | — | 2,396 | — | |||||||||
| Land - consumer lot loans | — | — | — | — | |||||||||
| Multi-family | — | — | — | — | |||||||||
| Commercial real estate | 63,723 | 0.7 | 76,909 | 1.1 | |||||||||
| Commercial & industrial | 643 | — | 7,925 | 0.1 | |||||||||
| HELOC | 10,139 | 0.1 | 11,266 | 0.1 | |||||||||
| Consumer | 55 | — | 71 | — | |||||||||
| Total credit-impaired acquired loans | 76,507 | 0.8 | 98,900 | 1.3 | |||||||||
36
WASHINGTON FEDERAL, INC. AND SUBSIDIARIES
NOTES TO THE CONSOLIDATED FINANCIAL STATEMENTS
YEARS ENDED SEPTEMBER 30, 2014, 2013 AND 2012
| Total loans | |||||||||||||
| Single-family residential | 5,572,244 | 64.2 | 5,373,950 | 67.3 | |||||||||
| Construction - speculative | 140,060 | 1.6 | 130,778 | 1.6 | |||||||||
| Construction - custom | 385,824 | 4.5 | 302,722 | 3.8 | |||||||||
| Land - acquisition & development | 80,359 | 0.9 | 81,660 | 1.1 | |||||||||
| Land - consumer lot loans | 111,130 | 1.3 | 124,984 | 1.5 | |||||||||
| Multi-family | 920,285 | 10.6 | 835,598 | 10.5 | |||||||||
| Commercial real estate | 752,957 | 8.7 | 625,293 | 7.9 | |||||||||
| Commercial & industrial | 434,088 | 5.0 | 326,450 | 4.0 | |||||||||
| HELOC | 134,455 | 1.6 | 133,631 | 1.6 | |||||||||
| Consumer | 138,315 | 1.6 | 55,479 | 0.7 | |||||||||
| Total loans | 8,669,717 | 100 | % | 7,990,545 | 100 | % | |||||||
| Less: | |||||||||||||
| Allowance for probable losses | 112,347 | 116,741 | |||||||||||
| Loans in process | 346,172 | 275,577 | |||||||||||
| Discount on acquired loans | 25,391 | 34,143 | |||||||||||
| Deferred net origination fees | 37,485 | 36,054 | |||||||||||
| 521,395 | 462,515 | ||||||||||||
| $ | 8,148,322 | $ | 7,528,030 | ||||||||||
37
WASHINGTON FEDERAL, INC. AND SUBSIDIARIES
NOTES TO THE CONSOLIDATED FINANCIAL STATEMENTS
YEARS ENDED SEPTEMBER 30, 2014, 2013 AND 2012
The Company originates fixed and adjustable interest rate loans, which at September 30, 2014 consisted of the following:
| Fixed-Rate | Adjustable-Rate | |||||||
| Term To Maturity | Book Value | Term To Rate Adjustment | Book Value | |||||
| (In thousands) | (In thousands) | |||||||
| Within 1 year | $ | 366,988 | Less than 1 year | $ | 1,167,059 | |||
| 1 to 3 years | 189,917 | 1 to 3 years | 562,839 | |||||
| 3 to 5 years | 100,854 | 3 to 5 years | 713,975 | |||||
| 5 to 10 years | 127,292 | 5 to 10 years | 12,884 | |||||
| 10 to 20 years | 819,570 | 10 to 20 years | — | |||||
| Over 20 years | 4,605,687 | Over 20 years | 2,652 | |||||
| $ | 6,210,308 | $ | 2,459,409 | |||||
Gross loans by geographic concentration were as follows:
| September 30, 2014 | Single - family residential | Multi- family | Land - A & D | Land - lot loans | Construction - custom | Construction - speculative | Commercial real estate | Commercial and industrial | Consumer | HELOC | Total | ||||||||||||||||||||||
| (In thousands) | |||||||||||||||||||||||||||||||||
| Washington | $ | 2,711,711 | $ | 315,584 | $ | 46,091 | $ | 61,525 | $ | 211,474 | $ | 68,668 | $ | 372,239 | $ | 87,312 | $ | 16 | $ | 73,721 | $ | 3,948,341 | |||||||||||
| Oregon | 784,794 | 278,112 | 5,655 | 19,738 | 53,218 | 31,210 | 161,401 | 31,547 | — | 15,501 | 1,381,176 | ||||||||||||||||||||||
| Arizona | 600,306 | 182,645 | 3,201 | 10,040 | 42,326 | 9,393 | 92,817 | 1,078 | — | 19,580 | 961,386 | ||||||||||||||||||||||
| Other | 206,586 | 688 | — | — | — | — | 19,160 | 309,855 | 138,299 | 30 | 674,618 | ||||||||||||||||||||||
| Utah | 471,248 | 49,755 | 5,430 | 5,293 | 28,107 | 5,640 | 3,319 | 297 | — | 7,657 | 576,746 | ||||||||||||||||||||||
| Idaho | 323,320 | 25,294 | 2,277 | 9,479 | 16,008 | 12,195 | 3,656 | 769 | — | 5,008 | 398,006 | ||||||||||||||||||||||
| New Mexico | 174,102 | 53,002 | 14,923 | 2,946 | 21,024 | 9,893 | 90,288 | 3,230 | — | 12,587 | 381,995 | ||||||||||||||||||||||
| Texas | 180,950 | 12,852 | 2,782 | 629 | 7,941 | 3,061 | 7,722 | — | — | — | 215,937 | ||||||||||||||||||||||
| Nevada | 119,227 | 2,353 | — | 1,480 | 5,726 | — | 2,355 | — | — | 371 | 131,512 | ||||||||||||||||||||||
| $ | 5,572,244 | $ | 920,285 | $ | 80,359 | $ | 111,130 | $ | 385,824 | $ | 140,060 | $ | 752,957 | $ | 434,088 | $ | 138,315 | $ | 134,455 | $ | 8,669,717 | ||||||||||||
| Percentage by geographic area | ||||||||||||||||||||||
| September 30, 2014 | Single - family residential | Multi- family | Land - A & D | Land - lot loans | Construction - custom | Construction - speculative | Commercial real estate | Commercial and industrial | Consumer | HELOC | Total | |||||||||||
| As % of total gross loans | ||||||||||||||||||||||
| Washington | 31.6 | % | 3.6 | % | 0.5 | % | 0.7 | % | 2.4 | % | 0.8 | % | 4.3 | % | 1.0 | % | — | % | 0.9 | % | 45.8 | % |
| Oregon | 9.1 | 3.2 | 0.1 | 0.2 | 0.6 | 0.4 | 1.9 | 0.4 | — | 0.2 | 16.1 | |||||||||||
| Arizona | 6.9 | 2.1 | — | 0.1 | 0.5 | 0.1 | 1.1 | — | — | 0.2 | 11.0 | |||||||||||
| Other | 2.4 | — | — | — | — | — | 0.2 | 3.6 | 1.6 | — | 7.8 | |||||||||||
| Utah | 5.4 | 0.6 | 0.1 | 0.1 | 0.3 | 0.1 | — | — | — | 0.1 | 6.7 | |||||||||||
| Idaho | 3.7 | 0.3 | — | 0.1 | 0.2 | 0.1 | — | — | — | 0.1 | 4.5 | |||||||||||
| New Mexico | 2.0 | 0.6 | 0.2 | — | 0.2 | 0.1 | 1.0 | — | — | 0.1 | 4.2 | |||||||||||
| Texas | 2.1 | 0.1 | — | — | 0.1 | — | 0.1 | — | — | — | 2.4 | |||||||||||
| Nevada | 1.4 | — | — | — | 0.1 | — | — | — | — | — | 1.5 | |||||||||||
| 64.6 | % | 10.5 | % | 0.9 | % | 1.2 | % | 4.4 | % | 1.6 | % | 8.6 | % | 5.0 | % | 1.6 | % | 1.6 | % | 100.0 | % | |
38
WASHINGTON FEDERAL, INC. AND SUBSIDIARIES
NOTES TO THE CONSOLIDATED FINANCIAL STATEMENTS
YEARS ENDED SEPTEMBER 30, 2014, 2013 AND 2012
Percentage by geographic area as a % of each loan type | ||||||||||||||||||||
| September 30, 2014 | Single - family residential | Multi- family | Land - A & D | Land - lot loans | Construction - custom | Construction - speculative | Commercial real estate | Commercial and industrial | Consumer | HELOC | ||||||||||
| As % of total gross loans | ||||||||||||||||||||
| Washington | 48.7 | % | 34.3 | % | 57.3 | % | 55.3 | % | 54.8 | % | 49.0 | % | 49.6 | % | 20.1 | % | — | % | 54.8 | % |
| Oregon | 14.1 | 30.2 | 7.0 | 17.8 | 13.8 | 22.3 | 21.4 | 7.3 | — | 11.5 | ||||||||||
| Arizona | 10.8 | 19.8 | 4.0 | 9.0 | 11.0 | 6.7 | 12.3 | 0.2 | — | 14.6 | ||||||||||
| Other | 3.7 | 0.1 | — | — | — | — | 2.5 | 71.4 | 100.0 | — | ||||||||||
| Utah | 8.5 | 5.4 | 6.8 | 4.8 | 7.3 | 4.0 | 0.4 | 0.1 | — | 5.7 | ||||||||||
| Idaho | 5.8 | 2.7 | 2.8 | 8.5 | 4.1 | 8.7 | 0.5 | 0.2 | — | 3.7 | ||||||||||
| New Mexico | 3.1 | 5.8 | 18.6 | 2.7 | 5.4 | 7.1 | 12.0 | 0.7 | — | 9.4 | ||||||||||
| Texas | 3.2 | 1.4 | 3.5 | 0.6 | 2.1 | 2.2 | 1.0 | — | — | — | ||||||||||
| Nevada | 2.1 | 0.3 | — | 1.3 | 1.5 | — | 0.3 | — | — | 0.3 | ||||||||||
| 100.0 | % | 100.0 | % | 100.0 | % | 100.0 | % | 100.0 | % | 100.0 | % | 100.0 | % | 100.0 | % | 100.0 | % | 100.0 | % | |
The following table provides additional information on impaired loans, loan commitments and loans serviced for others:
| September 30, 2014 | September 30, 2013 | ||||||
| (In thousands) | |||||||
| Recorded investment in impaired loans | $ | 435,185 | $ | 454,557 | |||
| Trouble Debt Restructuring included in impaired loans | 374,743 | 415,696 | |||||
| Impaired loans with allocated reserves | 196 | 6,035 | |||||
| Reserves on impaired loans | 60 | 3,473 | |||||
| Average balance of impaired loans | 403,138 | 495,472 | |||||
| Interest income from impaired loans | 21,674 | 24,798 | |||||
| Outstanding fixed-rate origination commitments | 198,504 | 190,363 | |||||
| Loans serviced for others | 86,745 | 55,589 | |||||
The following table sets forth information regarding non-accrual loans held by the Company:
| September 30, 2014 | September 30, 2013 | ||||||||||||
| (In thousands) | (In thousands) | ||||||||||||
| Non-accrual loans: | |||||||||||||
| Single-family residential | $ | 74,067 | 84.8 | % | $ | 100,460 | 76.5 | % | |||||
| Construction - speculative | 1,477 | 1.7 | 4,560 | 3.5 | |||||||||
| Construction - custom | — | — | — | — | |||||||||
| Land - acquisition & development | 811 | 0.9 | 2,903 | 2.2 | |||||||||
| Land - consumer lot loans | 2,637 | 3.0 | 3,337 | 2.5 | |||||||||
| Multi-family | 1,742 | 2.0 | 6,573 | 5.0 | |||||||||
| Commercial real estate | 5,106 | 5.8 | 11,736 | 8.9 | |||||||||
| Commercial & industrial | 7 | — | 477 | 0.4 | |||||||||
| HELOC | 795 | 0.9 | 263 | 0.2 | |||||||||
| Consumer | 789 | 0.9 | 990 | 0.8 | |||||||||
| Total non-accrual loans | $ | 87,431 | 100 | % | $ | 131,299 | 100 | % | |||||
39
WASHINGTON FEDERAL, INC. AND SUBSIDIARIES
NOTES TO THE CONSOLIDATED FINANCIAL STATEMENTS
YEARS ENDED SEPTEMBER 30, 2014, 2013 AND 2012
The following tables provide an analysis of the age of loans in past due status:
| September 30, 2014 | Amount of Loans | Days Delinquent Based on $ Amount of Loans | % based on $ | |||||||||||||||||||||||
| Type of Loan | Net of LIP & Chg.-Offs | Current | 30 | 60 | 90 | Total | ||||||||||||||||||||
| (In thousands) | ||||||||||||||||||||||||||
| Non-acquired loans | ||||||||||||||||||||||||||
| Single-Family Residential | $ | 5,557,753 | $ | 5,467,239 | $ | 15,926 | $ | 9,139 | $ | 65,449 | $ | 90,514 | 1.63 | % | ||||||||||||
| Construction - Speculative | 87,035 | 87,035 | — | — | — | — | — | |||||||||||||||||||
| Construction - Custom | 192,098 | 191,262 | 836 | — | — | 836 | 0.44 | |||||||||||||||||||
| Land - Acquisition & Development | 68,066 | 67,911 | 155 | — | — | 155 | 0.23 | |||||||||||||||||||
| Land - Consumer Lot Loans | 108,589 | 104,571 | 1,246 | 304 | 2,468 | 4,018 | 3.70 | |||||||||||||||||||
| Multi-Family | 892,196 | 891,372 | 205 | 16 | 603 | 824 | 0.09 | |||||||||||||||||||
| Commercial Real Estate | 529,453 | 513,409 | 67 | 15,118 | 859 | 16,044 | 3.03 | |||||||||||||||||||
| Commercial & Industrial | 379,226 | 377,848 | 53 | 1,318 | 7 | 1,378 | 0.36 | |||||||||||||||||||
| HELOC | 116,262 | 115,262 | 335 | 292 | 373 | 1,000 | 0.86 | |||||||||||||||||||
| Consumer | 132,686 | 131,642 | 654 | 262 | 128 | 1,044 | 0.79 | |||||||||||||||||||
| Total non-acquired loans | 8,063,364 | 7,947,551 | 19,477 | 26,449 | 69,887 | 115,813 | 1.44 | % | ||||||||||||||||||
| Acquired loans | ||||||||||||||||||||||||||
| Single-Family Residential | 11,716 | 11,693 | — | — | 23 | 23 | 0.20 | % | ||||||||||||||||||
| Construction - Speculative | — | — | — | — | — | — | — | |||||||||||||||||||
| Construction - Custom | — | — | — | — | — | — | — | |||||||||||||||||||
| Land - Acquisition & Development | 905 | 905 | — | — | — | — | — | |||||||||||||||||||
| Land - Consumer Lot Loans | 2,502 | 2,132 | — | 370 | — | 370 | 14.79 | |||||||||||||||||||
| Multi-Family | 2,999 | 2,999 | — | — | — | — | — | |||||||||||||||||||
| Commercial Real Estate | 97,715 | 96,948 | 104 | — | 663 | 767 | 0.78 | |||||||||||||||||||
| Commercial & Industrial | 51,329 | 51,229 | — | 100 | — | 100 | 0.19 | |||||||||||||||||||
| HELOC | 8,056 | 8,056 | — | — | — | — | — | |||||||||||||||||||
| Consumer | 5,670 | 4,983 | 22 | 4 | 661 | 687 | 12.12 | |||||||||||||||||||
| Total acquired loans | 180,892 | 178,945 | 126 | 474 | 1,347 | 1,947 | 1.08 | % | ||||||||||||||||||
| Credit-impaired acquired loans | ||||||||||||||||||||||||||
| Single-Family Residential | 325 | 325 | — | — | — | — | — | % | ||||||||||||||||||
| Construction - Speculative | — | — | — | — | — | — | — | |||||||||||||||||||
| Construction - Custom | — | — | — | — | — | — | — | |||||||||||||||||||
| Land - Acquisition & Development | 1,581 | 1,581 | — | — | — | — | — | |||||||||||||||||||
| Land - Consumer Lot Loans | — | — | — | — | — | — | — | |||||||||||||||||||
| Multi-Family | — | — | — | — | — | — | — | |||||||||||||||||||
| Commercial Real Estate | 63,713 | 61,713 | 152 | 909 | 939 | 2,000 | 3.14 | |||||||||||||||||||
| Commercial & Industrial | 3,477 | 3,470 | 7 | — | — | 7 | 0.20 | |||||||||||||||||||
| HELOC | 10,138 | 9,641 | — | 75 | 422 | 497 | 4.90 | |||||||||||||||||||
| Consumer | 54 | 54 | — | — | — | — | — | |||||||||||||||||||
| Total credit-impaired acquired loans | 79,288 | 76,784 | 159 | 984 | 1,361 | 2,504 | 3.16 | % | ||||||||||||||||||
| Total loans | $ | 8,323,544 | $ | 8,203,280 | $ | 19,762 | $ | 27,907 | $ | 72,595 | $ | 120,264 | 1.44 | % | ||||||||||||
40
WASHINGTON FEDERAL, INC. AND SUBSIDIARIES
NOTES TO THE CONSOLIDATED FINANCIAL STATEMENTS
YEARS ENDED SEPTEMBER 30, 2014, 2013 AND 2012
Most loans restructured in troubled debt restructurings ("TDRs") are accruing and performing loans where the borrower has proactively approached the Bank about modifications due to temporary financial difficulties. Each request is individually evaluated for merit and likelihood of success. The concession for these loans is typically a payment reduction through a rate reduction of from 100 to 200 bps for a specific term, usually six to twelve months. Interest-only payments may also be approved during the modification period. Principal forgiveness is not an available option for restructured loans. As of September 30, 2014, the outstanding balance of TDR's was $374,743,000. Single-family residential loans comprised 86% of restructured loans which is the same as 86% at the prior year end. The Bank reserves for restructured loans within its allowance for loan loss methodology by taking into account the following performance indicators: 1) time since modification, 2) current payment status and 3) geographic area.
The following tables provides information related to loans that were restructured during the period ending:
| September 30, 2014 | September 30, 2013 | ||||||||||||||||||||
| Pre-Modification | Post-Modification | Pre-Modification | Post-Modification | ||||||||||||||||||
| Outstanding | Outstanding | Outstanding | Outstanding | ||||||||||||||||||
| Number of | Recorded | Recorded | Number of | Recorded | Recorded | ||||||||||||||||
| Troubled Debt Restructurings: | Contracts | Investment | Investment | Contracts | Investment | Investment | |||||||||||||||
| (In thousands) | (In thousands) | ||||||||||||||||||||
| Single-Family Residential | 241 | $ | 52,900 | $ | 52,900 | 406 | $ | 105,551 | $ | 105,551 | |||||||||||
| Construction - Speculative | — | — | — | 1 | 2,470 | 2,470 | |||||||||||||||
| Construction - Custom | — | — | — | — | — | — | |||||||||||||||
| Land - Acquisition & Development | 3 | 631 | 631 | 1 | 461 | 461 | |||||||||||||||
| Land - Consumer Lot Loans | 13 | 2,315 | 2,315 | 25 | 3,134 | 3,134 | |||||||||||||||
| Multi-Family | 2 | 1,196 | 1,196 | 1 | 36 | 36 | |||||||||||||||
| Commercial Real Estate | 3 | 2,177 | 2,177 | 15 | 11,523 | 11,523 | |||||||||||||||
| Commercial & Industrial | — | — | — | 1 | 56 | 56 | |||||||||||||||
| HELOC | 2 | 549 | 549 | 1 | 199 | 199 | |||||||||||||||
| Consumer | 3 | 35 | 35 | 2 | 33 | 33 | |||||||||||||||
| 267 | $ | 59,803 | $ | 59,803 | 453 | $ | 123,463 | $ | 123,463 | ||||||||||||
| September 30, 2014 | September 30, 2013 | ||||||||||||
| Number of | Recorded | Number of | Recorded | ||||||||||
| Troubled Debt Restructurings That Subsequently Defaulted: | Contracts | Investment | Contracts | Investment | |||||||||
| (In thousands) | (In thousands) | ||||||||||||
| Single-Family Residential | 38 | $ | 7,427 | 78 | $ | 17,120 | |||||||
| Construction - Speculative | — | — | — | — | |||||||||
| Construction - Custom | — | — | — | — | |||||||||
| Land - Acquisition & Development | — | — | — | — | |||||||||
| Land - Consumer Lot Loans | 8 | 969 | 2 | 237 | |||||||||
| Multi-Family | — | — | — | — | |||||||||
| Commercial Real Estate | — | — | 2 | 2,703 | |||||||||
| Commercial & Industrial | — | — | — | — | |||||||||
| HELOC | — | — | 1 | 79 | |||||||||
| Consumer | — | — | — | — | |||||||||
| 46 | $ | 8,396 | 83 | $ | 20,139 | ||||||||
41
WASHINGTON FEDERAL, INC. AND SUBSIDIARIES
NOTES TO THE CONSOLIDATED FINANCIAL STATEMENTS
YEARS ENDED SEPTEMBER 30, 2014, 2013 AND 2012
The excess of cash flows expected to be collected over the initial fair value of acquired impaired loans is referred to as the accretable yield and is accreted into interest income over the estimated life of the acquired loans using the effective yield method. Other adjustments to the accretable yield include changes in the estimated remaining life of the acquired loans, changes in expected cash flows and changes of indices for acquired loans with variable interest rates.
The following table shows the changes in accretable yield for acquired impaired loans and acquired non-impaired loans for the years ended September 30, 2014 and 2013:
| September 30, 2014 | September 30, 2013 | ||||||||||||||||||||||||||||||
| Acquired Impaired | Acquired Non-impaired | Acquired Impaired | Acquired Non-impaired | ||||||||||||||||||||||||||||
Accretable Yield | Carrying Amount of Loans | Accretable Yield | Carrying Amount of Loans | Accretable Yield | Carrying Amount of Loans | Accretable Yield | Carrying Amount of Loans | ||||||||||||||||||||||||
| (In thousands) | (In thousands) | ||||||||||||||||||||||||||||||
| Beginning balance | $ | 37,236 | $ | 69,718 | $ | 4,977 | $ | 245,373 | $ | 16,928 | $ | 77,613 | $ | — | $ | — | |||||||||||||||
| Additions | 7,300 | — | — | — | — | 9,865 | 10,804 | 351,335 | |||||||||||||||||||||||
| Net reclassification from nonaccretable | — | — | — | — | 30,026 | — | — | — | |||||||||||||||||||||||
| Accretion | (11,945 | ) | 11,945 | (723 | ) | 723 | (9,718 | ) | 9,718 | (5,827 | ) | 5,827 | |||||||||||||||||||
| Transfers to REO | — | (1,188 | ) | — | (4,710 | ) | — | (3,975 | ) | — | (7,755 | ) | |||||||||||||||||||
| Payments received, net | — | (22,704 | ) | — | (63,946 | ) | — | (23,503 | ) | — | (104,034 | ) | |||||||||||||||||||
| Ending Balance | $ | 32,591 | $ | 57,771 | $ | 4,254 | $ | 177,440 | $ | 37,236 | $ | 69,718 | $ | 4,977 | $ | 245,373 | |||||||||||||||
Additionally, there were $9.9 million in loans acquired during fiscal 2013 as part of the South Valley Bank acquisition for which it was probable at acquisition that all contractually required payments would not be collected. The timing and amount of future cash flows cannot be reasonably estimated; therefore, these loan are accounted for on a cash basis.
The following table shows loans that were acquired during fiscal 2012 as part of the Western National Bank acquisition and are accounted for under FASB ASC 310-30:
| Western National Bank | |||
| (In thousands) | December 16, 2011 | ||
| Contractually required payments of interest and principal | $ | 171,515 | |
| Nonaccretable difference | (56,440 | ) | |
| Cash flows expected to be collected (1) | 115,075 | ||
| Accretable yield | (21,384 | ) | |
| Carrying value of acquired loans | $ | 93,691 | |
| (1) Represents undiscounted expected principal and interest cash flows | |||
42
WASHINGTON FEDERAL, INC. AND SUBSIDIARIES
NOTES TO THE CONSOLIDATED FINANCIAL STATEMENTS
YEARS ENDED SEPTEMBER 30, 2014, 2013 AND 2012
NOTE D Allowance for Losses on Loans
The following table summarizes the activity in the allowance for loan losses for the twelve months ended September 30, 2014 and 2013:
| September 30, 2014 | Beginning Allowance | Charge-offs | Recoveries | Provision & Transfers | Ending Allowance | ||||||||||||||
| (In thousands) | |||||||||||||||||||
| Single-family residential | $ | 64,184 | $ | (8,529 | ) | $ | 17,684 | $ | (10,576 | ) | $ | 62,763 | |||||||
| Construction - speculative | 8,407 | (949 | ) | 97 | (813 | ) | 6,742 | ||||||||||||
| Construction - custom | 882 | — | — | 813 | 1,695 | ||||||||||||||
| Land - acquisition & development | 9,165 | (541 | ) | 3,071 | (6,103 | ) | 5,592 | ||||||||||||
| Land - consumer lot loans | 3,552 | (658 | ) | 22 | 161 | 3,077 | |||||||||||||
| Multi-family | 3,816 | — | — | 432 | 4,248 | ||||||||||||||
| Commercial real estate | 5,595 | (105 | ) | 33 | 2,025 | 7,548 | |||||||||||||
| Commercial & industrial | 16,614 | (826 | ) | 5,043 | (4,304 | ) | 16,527 | ||||||||||||
| HELOC | 1,002 | (48 | ) | — | (26 | ) | 928 | ||||||||||||
| Consumer | 3,524 | (3,443 | ) | 3,513 | (367 | ) | 3,227 | ||||||||||||
| $ | 116,741 | $ | (15,099 | ) | $ | 29,463 | $ | (18,758 | ) | $ | 112,347 | ||||||||
| September 30, 2013 | Beginning Allowance | Charge-offs | Recoveries | Provision & Transfers | Ending Allowance | ||||||||||||||
| (In thousands) | |||||||||||||||||||
| Single-family residential | $ | 81,815 | $ | (20,947 | ) | $ | 9,416 | $ | (6,100 | ) | $ | 64,184 | |||||||
| Construction - speculative | 12,060 | (1,446 | ) | 501 | (2,708 | ) | 8,407 | ||||||||||||
| Construction - custom | 347 | (481 | ) | — | 1,016 | 882 | |||||||||||||
| Land - acquisition & development | 15,598 | (3,983 | ) | 4,105 | (6,555 | ) | 9,165 | ||||||||||||
| Land - consumer lot loans | 4,937 | (1,363 | ) | 40 | (62 | ) | 3,552 | ||||||||||||
| Multi-family | 5,280 | (1,043 | ) | 171 | (592 | ) | 3,816 | ||||||||||||
| Commercial real estate | 1,956 | (747 | ) | 17 | 4,369 | 5,595 | |||||||||||||
| Commercial & industrial | 7,626 | (1,145 | ) | 95 | 10,038 | 16,614 | |||||||||||||
| HELOC | 965 | (163 | ) | — | 200 | 1,002 | |||||||||||||
| Consumer | 2,563 | (2,783 | ) | 2,000 | 1,744 | 3,524 | |||||||||||||
| $ | 133,147 | $ | (34,101 | ) | $ | 16,345 | $ | 1,350 | $ | 116,741 | |||||||||
The Company recorded a reversal of $15,401,000 of provision for loan losses during the fiscal year ended September 30, 2014, while a $1,350,000 provision was recorded for the year ended September 30, 2013. The credit quality of the portfolio has been improving significantly and economic conditions are more stable.
Non-performing assets (“NPAs”) amounted to $147,311,000, or 1.00%, of total assets at September 30, 2014, compared to $213,616,000, or 1.63%, of total assets one year ago. Acquired loans, including covered loans are not classified as non-performing loans because, at acquisition, the carrying value of these loans was adjusted to reflect fair value. For the year ended September 30, 2014, $42,590,000 in acquired loans were subject to the general allowance as the discount related to these balances is not sufficient to absorb potential losses. There was no additional provision for loan losses recorded on acquired or covered loans during the years ended September 30, 2014 and 2013. Non-accrual loans decreased from $131,299,000 at September 30, 2013, to $87,431,000 at September 30, 2014, a 33.4% decrease.
The Company had net recoveries of $14,365,000 for the twelve months ended September 30, 2014, compared with $17,756,000 of net charge-offs for the same period one year ago. A loan is charged-off when the loss is estimable and it is confirmed that the borrower will not be able to meet its contractual obligations.
43
WASHINGTON FEDERAL, INC. AND SUBSIDIARIES
NOTES TO THE CONSOLIDATED FINANCIAL STATEMENTS
YEARS ENDED SEPTEMBER 30, 2014, 2013 AND 2012
At September 30, 2014, $112,287,000 of the allowance was calculated under the formulas contained in our general allowance methodology and the remaining $60,000 was made up of specific reserves on loans that were deemed to be impaired. For the year ending September 30, 2013, $113,268,000 of the allowance was calculated under the formulas contained in our general allowance methodology and the remaining $3,473,000 was made up of specific reserves on loans that were deemed to be impaired. The primary reasons for the shift in total allowance allocation from specific reserves to general reserves is due to the Bank having already addressed many of the problem loans focused in the speculative construction and land A&D portfolios, combined with an increase in delinquencies and elevated charge-offs in the single-family residential portfolio.
The following tables show a summary of loans collectively and individually evaluated for impairment and the related allocation of general and specific reserves as of September 30, 2014 and 2013:
| September 30, 2014 | Loans Collectively Evaluated for Impairment | Loans Individually Evaluated for Impairment | |||||||||||||||||||
General Reserve Allocation | Gross Loans Subject to General Reserve (1) | Ratio | Specific Reserve Allocation | Gross Loans Subject to Specific Reserve (1) | Ratio | ||||||||||||||||
| (In thousands) | (In thousands) | ||||||||||||||||||||
| Single-family residential | $ | 62,067 | $ | 5,487,331 | 1.1 | % | $ | — | $ | 72,869 | — | % | |||||||||
| Construction - speculative | 6,682 | 130,901 | 5.5 | 60 | 9,159 | 0.7 | |||||||||||||||
| Construction - custom | 1,695 | 385,464 | 0.5 | — | 360 | — | |||||||||||||||
| Land - acquisition & development | 5,592 | 73,999 | 7.6 | — | 3,833 | — | |||||||||||||||
| Land - consumer lot loans | 3,077 | 95,684 | 3.2 | — | 12,939 | — | |||||||||||||||
| Multi-family | 4,248 | 911,162 | 0.5 | — | 6,124 | — | |||||||||||||||
| Commercial real estate | 7,548 | 563,534 | 1.4 | — | 27,802 | — | |||||||||||||||
| Commercial & industrial | 17,223 | 421,816 | 4.6 | — | — | — | |||||||||||||||
| HELOC | 928 | 114,393 | 0.9 | — | 1,650 | — | |||||||||||||||
| Consumer | 3,227 | 132,590 | 2.4 | — | — | — | |||||||||||||||
| $ | 112,287 | $ | 8,316,874 | 1.4 | % | $ | 60 | $ | 134,736 | — | % | ||||||||||
___________________
| (1) | Excludes acquired loans with discounts sufficient to absorb potential losses and covered loans |
| September 30, 2013 | Loans Collectively Evaluated for Impairment | Loans Individually Evaluated for Impairment | |||||||||||||||||||
General Reserve Allocation | Gross Loans Subject to General Reserve (1) | Ratio | Specific Reserve Allocation | Gross Loans Subject to Specific Reserve (1) | Ratio | ||||||||||||||||
| (In thousands) | (In thousands) | ||||||||||||||||||||
| Single-family residential | $ | 64,184 | $ | 5,262,159 | 1.2 | % | $ | — | $ | 96,989 | — | % | |||||||||
| Construction - speculative | 7,307 | 115,554 | 6.3 | 1,100 | 15,224 | 7.2 | |||||||||||||||
| Construction - custom | 882 | 302,722 | 0.3 | — | — | — | |||||||||||||||
| Land - acquisition & development | 6,943 | 67,521 | 10.3 | 2,222 | 10,254 | 21.7 | |||||||||||||||
| Land - consumer lot loans | 3,506 | 107,216 | 3.3 | 46 | 14,455 | 0.3 | |||||||||||||||
| Multi-family | 3,711 | 824,279 | 0.5 | 105 | 7,405 | 1.4 | |||||||||||||||
| Commercial real estate | 5,595 | 400,789 | 1.4 | — | 14,172 | — | |||||||||||||||
| Commercial & industrial | 16,614 | 256,954 | 6.5 | — | 48 | — | |||||||||||||||
| HELOC | 1,002 | 111,169 | 0.9 | — | 1,017 | — | |||||||||||||||
| Consumer | 3,524 | 47,141 | 7.5 | — | — | — | |||||||||||||||
| $ | 113,268 | $ | 7,495,504 | 1.5 | % | $ | 3,473 | $ | 159,564 | 2.2 | % | ||||||||||
___________________
| (1) | Excludes acquired loans with discounts sufficient to absorb potential losses and covered loans |
44
WASHINGTON FEDERAL, INC. AND SUBSIDIARIES
NOTES TO THE CONSOLIDATED FINANCIAL STATEMENTS
YEARS ENDED SEPTEMBER 30, 2014, 2013 AND 2012
The Company has an asset quality review function that analyzes the Bank's loan portfolios and reports the results of the review to the Board of Directors on a quarterly basis. The single-family residential, HELOC and consumer portfolios are evaluated based on their performance as a pool of loans, since no single loan is individually significant or judged by its risk rating, size or potential risk of loss. The construction, land, multi-family, commercial real estate and commercial and industrial loans are risk rated on a loan by loan basis to determine the relative risk inherent in specific borrowers or loans. Based on that risk rating, the loans are assigned a grade and classified as follows:
| • | Pass – the credit does not meet one of the definitions defined below. |
| • | Special mention – A special mention credit is considered to be currently protected from loss but is potentially weak. No loss of principal or interest is foreseen; however, proper supervision and Management attention is required to deter further deterioration in the credit. Assets in this category constitute some undue and unwarranted credit risk but not to the point of justifying a risk rating of substandard. The credit risk may be relatively minor yet constitutes an unwarranted risk in light of the circumstances surrounding a specific asset. |
| • | Substandard – A substandard credit is an unacceptable credit. Additionally, repayment in the normal course is in jeopardy due to the existence of one or more well defined weaknesses. In these situations, loss of principal is likely if the weakness is not corrected. A substandard asset is inadequately protected by the current sound worth and paying capacity of the borrower or of the collateral pledged, if any. Assets so classified will have a well defined weakness or weaknesses that jeopardize the liquidation of the debt. Loss potential, while existing in the aggregate amount of substandard assets, does not have to exist in individual assets risk rated substandard. |
| • | Doubtful – A credit classified doubtful has all the weaknesses inherent in one classified substandard with the added characteristic that the weakness makes collection or liquidation in full, on the basis of currently existing facts, conditions and values, highly questionable and improbable. The probability of loss is high, but because of certain important and reasonably specific pending factors that may work to the advantage and strengthening of the asset, its classification as an estimated loss is deferred until its more exact status may be determined. Pending factors include proposed merger, acquisition, or liquidation procedures, capital injection, perfecting liens on additional collateral, and refinancing plans. |
| • | Loss – Credits classified loss are considered uncollectible and of such little value that their continuance as a bankable asset is not warranted. This classification does not mean that the asset has absolutely no recovery or salvage value, but rather it is not practical or desirable to defer writing off this asset even though partial recovery may be affected in the future. Losses should be taken in the period in which they are identified as uncollectible. Partial charge-off versus full charge-off may be taken if the collateral offers some identifiable protection. |
45
WASHINGTON FEDERAL, INC. AND SUBSIDIARIES
NOTES TO THE CONSOLIDATED FINANCIAL STATEMENTS
YEARS ENDED SEPTEMBER 30, 2014, 2013 AND 2012
The following tables provide information on loans based on credit quality indicators (defined above) as of September 30, 2014 and 2013:
| September 30, 2014 | Internally Assigned Grade | Total | |||||||||||||||||||||
| Pass | Special mention | Substandard | Doubtful | Loss | Gross Loans | ||||||||||||||||||
| (In thousands) | |||||||||||||||||||||||
| Non-acquired loans | |||||||||||||||||||||||
| Single-family residential | $ | 5,426,895 | $ | 2,793 | $ | 130,515 | $ | — | $ | — | $ | 5,560,203 | |||||||||||
| Construction - speculative | 134,950 | — | 5,110 | — | — | 140,060 | |||||||||||||||||
| Construction - custom | 385,824 | — | — | — | — | 385,824 | |||||||||||||||||
| Land - acquisition & development | 71,692 | — | 6,140 | — | — | 77,832 | |||||||||||||||||
| Land - consumer lot loans | 108,013 | — | 610 | — | — | 108,623 | |||||||||||||||||
| Multi-family | 912,728 | — | 4,558 | — | — | 917,286 | |||||||||||||||||
| Commercial real estate | 557,914 | 1,971 | 31,451 | — | — | 591,336 | |||||||||||||||||
| Commercial & industrial | 359,221 | 14,740 | 5,265 | — | — | 379,226 | |||||||||||||||||
| HELOC | 115,794 | — | 248 | — | — | 116,042 | |||||||||||||||||
| Consumer | 132,349 | — | 241 | — | — | 132,590 | |||||||||||||||||
| 8,205,380 | 19,504 | 184,138 | — | — | 8,409,022 | ||||||||||||||||||
| Acquired loans | |||||||||||||||||||||||
| Single-family residential | 11,716 | — | — | — | — | 11,716 | |||||||||||||||||
| Construction - speculative | — | — | — | — | — | — | |||||||||||||||||
| Construction - custom | — | — | — | — | — | — | |||||||||||||||||
| Land - acquisition & development | 503 | — | 402 | — | — | 905 | |||||||||||||||||
| Land - consumer lot loans | 2,507 | — | — | — | — | 2,507 | |||||||||||||||||
| Multi-family | 2,999 | — | — | — | — | 2,999 | |||||||||||||||||
| Commercial real estate | 88,974 | 2,571 | 6,353 | — | — | 97,898 | |||||||||||||||||
| Commercial & industrial | 36,311 | 13,642 | 4,208 | 58 | — | 54,219 | |||||||||||||||||
| HELOC | 8,274 | — | — | — | — | 8,274 | |||||||||||||||||
| Consumer | 5,670 | — | — | — | — | 5,670 | |||||||||||||||||
| 156,954 | 16,213 | 10,963 | 58 | — | 184,188 | ||||||||||||||||||
| Credit impaired acquired loans | |||||||||||||||||||||||
| Pool 1 - Construction and land A&D | 1,292 | — | 330 | — | — | 1,622 | |||||||||||||||||
| Pool 2 - Single-family residential | 325 | — | — | — | — | 325 | |||||||||||||||||
| Pool 3 - Multi-family | — | — | — | — | — | — | |||||||||||||||||
| Pool 4 - HELOC & other consumer | 10,194 | — | — | — | — | 10,194 | |||||||||||||||||
| Pool 5 - Commercial real estate | 48,878 | 2,143 | 12,702 | — | — | 63,723 | |||||||||||||||||
| Pool 6 - Commercial & industrial | 643 | — | — | — | — | 643 | |||||||||||||||||
| Total credit impaired acquired loans | 61,332 | 2,143 | 13,032 | — | — | 76,507 | |||||||||||||||||
| Total gross loans | $ | 8,423,666 | $ | 37,860 | $ | 208,133 | $ | 58 | $ | — | $ | 8,669,717 | |||||||||||
| Total grade as a % of total gross loans | 97.2 | % | 0.4 | % | 2.4 | % | — | % | — | % | |||||||||||||
46
WASHINGTON FEDERAL, INC. AND SUBSIDIARIES
NOTES TO THE CONSOLIDATED FINANCIAL STATEMENTS
YEARS ENDED SEPTEMBER 30, 2014, 2013 AND 2012
| September 30, 2013 | Internally Assigned Grade | Total | |||||||||||||||||||||
| Pass | Special mention | Substandard | Doubtful | Loss | Gross Loans | ||||||||||||||||||
| (In thousands) | |||||||||||||||||||||||
| Non-acquired loans | |||||||||||||||||||||||
| Single-family residential | $ | 5,184,101 | $ | 4,595 | $ | 170,453 | $ | — | $ | — | $ | 5,359,149 | |||||||||||
| Construction - speculative | 99,436 | 3,199 | 28,143 | — | — | 130,778 | |||||||||||||||||
| Construction - custom | 302,722 | — | — | — | — | 302,722 | |||||||||||||||||
| Land - acquisition & development | 64,355 | 775 | 12,645 | — | — | 77,775 | |||||||||||||||||
| Land - consumer lot loans | 121,039 | — | 632 | — | — | 121,671 | |||||||||||||||||
| Multi-family | 819,911 | 2,114 | 9,659 | — | — | 831,684 | |||||||||||||||||
| Commercial real estate | 373,012 | 21,652 | 20,297 | — | — | 414,961 | |||||||||||||||||
| Commercial & industrial | 240,441 | 1,049 | 1,709 | — | — | 243,199 | |||||||||||||||||
| HELOC | 112,186 | — | — | — | — | 112,186 | |||||||||||||||||
| Consumer | 46,720 | — | 421 | — | — | 47,141 | |||||||||||||||||
| 7,363,923 | 33,384 | 243,959 | — | — | 7,641,266 | ||||||||||||||||||
| Acquired loans | |||||||||||||||||||||||
| Single-family residential | 14,468 | — | — | — | — | 14,468 | |||||||||||||||||
| Construction - speculative | — | — | — | — | — | — | |||||||||||||||||
| Construction - custom | — | — | — | — | — | — | |||||||||||||||||
| Land - acquisition & development | 312 | — | 1,177 | — | — | 1,489 | |||||||||||||||||
| Land - consumer lot loans | 3,313 | — | — | — | — | 3,313 | |||||||||||||||||
| Multi-family | 3,227 | — | 687 | — | — | 3,914 | |||||||||||||||||
| Commercial real estate | 105,055 | 4,190 | 24,178 | — | — | 133,423 | |||||||||||||||||
| Commercial & industrial | 64,933 | 1,309 | 9,084 | — | — | 75,326 | |||||||||||||||||
| HELOC | 10,179 | — | — | — | — | 10,179 | |||||||||||||||||
| Consumer | 8,267 | — | — | — | — | 8,267 | |||||||||||||||||
| 209,754 | 5,499 | 35,126 | — | — | 250,379 | ||||||||||||||||||
| Credit impaired acquired loans | |||||||||||||||||||||||
| Pool 1 - Construction and land A&D | 980 | 461 | 955 | — | — | 2,396 | |||||||||||||||||
| Pool 2 - Single-family residential | 333 | — | — | — | — | 333 | |||||||||||||||||
| Pool 3 - Multi-family | — | — | — | — | — | — | |||||||||||||||||
| Pool 4 - HELOC & other consumer | 11,337 | — | — | — | — | 11,337 | |||||||||||||||||
| Pool 5 - Commercial real estate | 52,509 | 3,155 | 21,245 | — | — | 76,909 | |||||||||||||||||
| Pool 6 - Commercial & industrial | 881 | — | 7,044 | — | — | 7,925 | |||||||||||||||||
| Total credit impaired acquired loans | 66,040 | 3,616 | 29,244 | — | — | 98,900 | |||||||||||||||||
| Total gross loans | $ | 7,639,717 | $ | 42,499 | $ | 308,329 | $ | — | $ | — | $ | 7,990,545 | |||||||||||
| Total grade as a % of total gross loans | 95.6 | % | 0.5 | % | 3.9 | % | — | % | — | % | |||||||||||||
47
WASHINGTON FEDERAL, INC. AND SUBSIDIARIES
NOTES TO THE CONSOLIDATED FINANCIAL STATEMENTS
YEARS ENDED SEPTEMBER 30, 2014, 2013 AND 2012
The following tables provide information on non-acquired loans based on payment activity as of September 30, 2014 and 2013:
| September 30, 2014 | Performing Loans | Non-Performing Loans | |||||||||||
| Amount | % of Total Gross Loans | Amount | % of Total Gross Loans | ||||||||||
| (In thousands) | (In thousands) | ||||||||||||
| Single-family residential | $ | 5,486,136 | 98.7 | % | $ | 74,067 | 1.3 | % | |||||
| Construction - speculative | 138,583 | 98.9 | 1,477 | 1.1 | |||||||||
| Construction - custom | 385,824 | 100.0 | — | — | |||||||||
| Land - acquisition & development | 77,021 | 99.0 | 811 | 1.0 | |||||||||
| Land - consumer lot loans | 105,986 | 97.6 | 2,637 | 2.4 | |||||||||
| Multi-family | 915,544 | 99.8 | 1,742 | 0.2 | |||||||||
| Commercial real estate | 586,230 | 99.1 | 5,106 | 0.9 | |||||||||
| Commercial & industrial | 379,219 | 100.0 | 7 | — | |||||||||
| HELOC | 115,247 | 99.3 | 795 | 0.7 | |||||||||
| Consumer | 131,801 | 99.4 | 789 | 0.6 | |||||||||
| $ | 8,321,591 | 99.0 | % | $ | 87,431 | 1.0 | % | ||||||
| September 30, 2013 | Performing Loans | Non-Performing Loans | |||||||||||
| Amount | % of Total Gross Loans | Amount | % of Total Gross Loans | ||||||||||
| (In thousands) | (In thousands) | ||||||||||||
| Single-family residential | $ | 5,258,688 | 98.1 | % | $ | 100,460 | 1.9 | % | |||||
| Construction - speculative | 126,218 | 96.5 | 4,560 | 3.5 | |||||||||
| Construction - custom | 302,722 | 100.0 | — | — | |||||||||
| Land - acquisition & development | 74,872 | 96.3 | 2,903 | 3.7 | |||||||||
| Land - consumer lot loans | 118,334 | 97.3 | 3,337 | 2.7 | |||||||||
| Multi-family | 825,111 | 99.2 | 6,573 | 0.8 | |||||||||
| Commercial real estate | 389,423 | 97.1 | 11,736 | 2.9 | |||||||||
| Commercial & industrial | 256,525 | 99.8 | 477 | 0.2 | |||||||||
| HELOC | 111,923 | 99.8 | 263 | 0.2 | |||||||||
| Consumer | 46,151 | 97.9 | 990 | 2.1 | |||||||||
| $ | 7,509,967 | 98.3 | % | $ | 131,299 | 1.7 | % | ||||||
48
WASHINGTON FEDERAL, INC. AND SUBSIDIARIES
NOTES TO THE CONSOLIDATED FINANCIAL STATEMENTS
YEARS ENDED SEPTEMBER 30, 2014, 2013 AND 2012
The following tables provide information on impaired loans based on loan types as of September 30, 2014 and 2013:
| September 30, 2014 | Recorded Investment | Unpaid Principal Balance | Related Allowance | Average Recorded Investment | |||||||||||
| (In thousands) | |||||||||||||||
| With no related allowance recorded: | |||||||||||||||
| Single-family residential | $ | 24,044 | $ | 26,628 | $ | — | $ | 16,843 | |||||||
| Construction - speculative | 1,603 | 2,173 | — | 1,804 | |||||||||||
| Construction - custom | — | — | — | — | |||||||||||
| Land - acquisition & development | 837 | 2,325 | — | 1,038 | |||||||||||
| Land - consumer lot loans | 974 | 1,072 | — | 713 | |||||||||||
| Multi-family | 1,111 | 1,111 | — | 327 | |||||||||||
| Commercial real estate | 13,234 | 20,085 | — | 11,720 | |||||||||||
| Commercial & industrial | 3,195 | 17,166 | — | 3,900 | |||||||||||
| HELOC | 1,019 | 1,730 | — | 612 | |||||||||||
| Consumer | 663 | 833 | — | 517 | |||||||||||
| 46,680 | 73,123 | — | 37,474 | ||||||||||||
| With an allowance recorded: | |||||||||||||||
| Single-family residential | 322,320 | 327,869 | 10,527 | 316,348 | |||||||||||
| Construction - speculative | 7,556 | 7,986 | 60 | 7,532 | |||||||||||
| Construction - custom | — | — | — | — | |||||||||||
| Land - acquisition & development | 4,696 | 5,636 | — | 4,114 | |||||||||||
| Land - consumer lot loans | 13,002 | 13,385 | — | 12,858 | |||||||||||
| Multi-family | 5,243 | 5,463 | — | 4,957 | |||||||||||
| Commercial real estate | 34,159 | 35,028 | — | 18,572 | |||||||||||
| Commercial & industrial | — | — | — | — | |||||||||||
| HELOC | 1,486 | 1,486 | — | 1,204 | |||||||||||
| Consumer | 43 | 214 | — | 79 | |||||||||||
| 388,505 | 397,067 | 10,587 | 365,664 | ||||||||||||
| Total: | |||||||||||||||
| Single-family residential | 346,364 | 354,497 | 10,527 | 333,191 | |||||||||||
| Construction - speculative | 9,159 | 10,159 | 60 | 9,336 | |||||||||||
| Construction - custom | — | — | — | — | |||||||||||
| Land - acquisition & development | 5,533 | 7,961 | — | 5,152 | |||||||||||
| Land - consumer lot loans | 13,976 | 14,457 | — | 13,571 | |||||||||||
| Multi-family | 6,354 | 6,574 | — | 5,284 | |||||||||||
| Commercial real estate | 47,393 | 55,113 | — | 30,292 | |||||||||||
| Commercial & industrial | 3,195 | 17,166 | — | 3,900 | |||||||||||
| HELOC | 2,505 | 3,216 | — | 1,816 | |||||||||||
| Consumer | 706 | 1,047 | — | 596 | |||||||||||
| $ | 435,185 | $ | 470,190 | $ | 10,587 | $ | 403,138 | ||||||||
____________________
| (1) | Includes $60,000 of specific reserves and $10,527,000 included in the general reserves. |
49
WASHINGTON FEDERAL, INC. AND SUBSIDIARIES
NOTES TO THE CONSOLIDATED FINANCIAL STATEMENTS
YEARS ENDED SEPTEMBER 30, 2014, 2013 AND 2012
| September 30, 2013 | Recorded Investment | Unpaid Principal Balance | Related Allowance | Average Recorded Investment | |||||||||||
| (In thousands) | |||||||||||||||
| With no related allowance recorded: | |||||||||||||||
| Single-family residential | $ | 33,883 | $ | 38,928 | $ | — | $ | 21,458 | |||||||
| Construction - speculative | 3,891 | 4,099 | — | 3,339 | |||||||||||
| Construction - custom | — | — | — | — | |||||||||||
| Land - acquisition & development | 3,020 | 10,705 | — | 2,548 | |||||||||||
| Land - consumer lot loans | 3,186 | 3,376 | — | 1,839 | |||||||||||
| Multi-family | 4,929 | 4,929 | — | 1,734 | |||||||||||
| Commercial real estate | 23,537 | 31,876 | — | 9,651 | |||||||||||
| Commercial & industrial | 7,279 | 31,197 | — | 3,123 | |||||||||||
| HELOC | 446 | 946 | — | 133 | |||||||||||
| Consumer | 601 | 618 | — | 127 | |||||||||||
| 80,772 | 126,674 | — | 43,952 | ||||||||||||
| With an allowance recorded: | |||||||||||||||
| Single-family residential | 335,140 | 341,910 | 15,137 | 330,407 | |||||||||||
| Construction - speculative | 8,892 | 9,342 | 1,100 | 12,362 | |||||||||||
| Construction - custom | — | — | — | — | |||||||||||
| Land - acquisition & development | 2,598 | 4,002 | — | 8,315 | |||||||||||
| Land - consumer lot loans | 12,631 | 13,014 | 2,222 | 12,301 | |||||||||||
| Multi-family | 5,958 | 6,178 | 46 | 7,731 | |||||||||||
| Commercial real estate | 7,539 | 8,476 | 105 | 9,321 | |||||||||||
| Commercial & industrial | 56 | 56 | — | 11 | |||||||||||
| HELOC | 938 | 938 | — | 858 | |||||||||||
| Consumer | 33 | 33 | — | 9 | |||||||||||
| 373,785 | 383,949 | 18,610 | (1) | 381,315 | |||||||||||
| Total: | |||||||||||||||
| Single-family residential | 369,023 | 380,838 | 15,137 | 351,865 | |||||||||||
| Construction - speculative | 12,783 | 13,441 | 1,100 | 15,701 | |||||||||||
| Construction - custom | — | — | — | — | |||||||||||
| Land - acquisition & development | 5,618 | 14,707 | — | 10,863 | |||||||||||
| Land - consumer lot loans | 15,817 | 16,390 | 2,222 | 14,140 | |||||||||||
| Multi-family | 10,887 | 11,107 | 46 | 9,465 | |||||||||||
| Commercial real estate | 31,076 | 40,352 | 105 | 18,972 | |||||||||||
| Commercial & industrial | 7,335 | 31,253 | — | 3,134 | |||||||||||
| HELOC | 1,384 | 1,884 | — | 991 | |||||||||||
| Consumer | 634 | 651 | — | 136 | |||||||||||
| $ | 454,557 | $ | 510,623 | $ | 18,610 | (1) | $ | 425,267 | |||||||
____________________
| (1) | Includes $3,473,000 of specific reserves and $15,137,000 included in the general reserves. |
50
WASHINGTON FEDERAL, INC. AND SUBSIDIARIES
NOTES TO THE CONSOLIDATED FINANCIAL STATEMENTS
YEARS ENDED SEPTEMBER 30, 2014, 2013 AND 2012
NOTE E INTEREST RECEIVABLE
| September 30, | 2014 | 2013 | ||||
| (In thousands) | ||||||
| Loans receivable | $ | 40,986 | $ | 41,043 | ||
| Mortgage-backed securities | 7,427 | 6,428 | ||||
| Investment securities | 3,624 | 1,747 | ||||
| $ | 52,037 | $ | 49,218 | |||
NOTE F PREMISES AND EQUIPMENT
| September 30, | 2014 | 2013 | ||||||
Estimated Useful Life | (In thousands) | |||||||
| Land | — | $ | 113,353 | $ | 92,560 | |||
| Buildings | 25 - 40 | 143,627 | 132,822 | |||||
| Leasehold improvements | 7 - 15 | 8,547 | 8,411 | |||||
| Capitalized software | 5 | 11,557 | — | |||||
| Furniture, fixtures and equipment | 2 - 10 | 53,597 | 36,798 | |||||
| 330,681 | 270,591 | |||||||
| Less accumulated depreciation and amortization | (73,138 | ) | (64,419 | ) | ||||
| $ | 257,543 | $ | 206,172 | |||||
The Bank has non-cancelable operating leases for branch offices. Future minimum net rental commitments for all non-cancelable leases, including maintenance and associated costs, were as follows: $6,221,000 for 2015, $4,179,000 for 2016, $3,154,000 for 2017, $2,593,000 for 2018 and $12,281,000 thereafter.
Rental expense, including amounts paid under month-to-month cancelable leases, amounted to $6,600,000, $4,680,000 and $3,825,000 in 2014, 2013 and 2012, respectively.
51
WASHINGTON FEDERAL, INC. AND SUBSIDIARIES
NOTES TO THE CONSOLIDATED FINANCIAL STATEMENTS
YEARS ENDED SEPTEMBER 30, 2014, 2013 AND 2012
NOTE G CUSTOMER ACCOUNTS
| September 30, | 2014 | 2013 | ||||
| (In thousands) | ||||||
| Checking accounts, .15% and under | $ | 2,331,170 | $ | 1,247,885 | ||
| Passbook and statement accounts, .20% and under | 622,546 | 404,937 | ||||
| Insured money market accounts, .01% to .30% | 2,536,971 | 1,888,020 | ||||
| Certificate accounts | ||||||
| Less than 2.00% | 4,524,158 | 4,716,427 | ||||
| 2.00% to 2.99% | 602,683 | 631,256 | ||||
| 3.00% to 3.99% | 98,610 | 175,549 | ||||
| 4.00% to 4.99% | 146 | 25,335 | ||||
| 5.00% to 5.99% | 644 | 862 | ||||
| Total certificates | 5,226,241 | 5,549,429 | ||||
| $ | 10,716,928 | $ | 9,090,271 | |||
| Certificate maturities are as follows: | ||||||
| September 30, | 2014 | 2013 | ||||
| (In thousands) | ||||||
| Within 1 year | $ | 3,147,172 | $ | 3,642,142 | ||
| 1 to 2 years | 999,090 | 789,037 | ||||
| 2 to 3 years | 659,867 | 406,960 | ||||
| Over 3 years | 420,112 | 711,290 | ||||
| $ | 5,226,241 | $ | 5,549,429 | |||
Customer accounts over $250,000 totaled $1,887,216,000 as of September 30, 2014 and $1,336,054,000 as of September 30, 2013.
Interest expense on customer accounts consisted of the following:
| Year ended September 30, | 2014 | 2013 | 2012 | ||||||
| (In thousands) | |||||||||
| Checking accounts | $ | 1,259 | $ | 936 | $ | 857 | |||
| Passbook and statement accounts | 607 | 566 | 574 | ||||||
| Insured money market accounts | 4,574 | 4,280 | 4,609 | ||||||
| Certificate accounts | 52,636 | 62,669 | 81,506 | ||||||
| 59,076 | 68,451 | 87,546 | |||||||
| Less early withdrawal penalties | (552 | ) | (548 | ) | (607 | ) | |||
| $ | 58,524 | $ | 67,903 | $ | 86,939 | ||||
| Weighted average interest rate at end of year | 0.51 | % | 0.69 | % | 0.90 | % | |||
| Weighted daily average interest rate during the year | 0.57 | % | 0.75 | % | 0.99 | % | |||
52
WASHINGTON FEDERAL, INC. AND SUBSIDIARIES
NOTES TO THE CONSOLIDATED FINANCIAL STATEMENTS
YEARS ENDED SEPTEMBER 30, 2014, 2013 AND 2012
NOTE H FHLB ADVANCES AND OTHER BORROWINGS
Maturity dates of FHLB advances were as follows:
| September 30, | 2014 | 2013 | ||||
| (In thousands) | ||||||
| FHLB advances | ||||||
| Within 1 year | 100,000 | — | ||||
| 1 to 3 years | 700,000 | 350,000 | ||||
| 4 to 5 years | 730,000 | 850,000 | ||||
| More than 5 years | 400,000 | 730,000 | ||||
| $ | 1,930,000 | $ | 1,930,000 | |||
$0 of the 2014 advances and $175,000,000 of the 2013 advances included in the above table are callable by the FHLB. If these callable advances were to be called at the earliest call dates, the maturities of all FHLB advances would be as follows:
| September 30, | 2014 | 2013 | ||||
| (In thousands) | ||||||
| FHLB advances | ||||||
| Within 1 year | $ | 100,000 | $ | 175,000 | ||
| 1 to 3 years | 700,000 | 350,000 | ||||
| 4 to 5 years | 730,000 | 775,000 | ||||
| More than 5 years | 400,000 | 630,000 | ||||
| $ | 1,930,000 | $ | 1,930,000 | |||
Financial data pertaining to the weighted-average cost and the amount of FHLB advances were as follows:
| September 30, | 2014 | 2013 | 2012 | ||||||
| (In thousands) | |||||||||
| Weighted average interest rate at end of year | 3.52 | % | 3.52 | % | 3.60 | % | |||
| Weighted daily average interest rate during the year | 3.49 | % | 3.57 | % | 4.14 | % | |||
| Daily average of FHLB advances | $ | 1,955,205 | $ | 1,905,479 | $ | 1,949,019 | |||
| Maximum amount of FHLB advances at any month end | 2,205,000 | 1,930,000 | 1,961,895 | ||||||
| Interest expense during the year (excludes interest rate swap expense) | 68,307 | 68,075 | 80,617 | ||||||
FHLB advances are collateralized as provided for in the Advances, Security and Deposit Agreement by all FHLB stock owned by the Bank, deposits with the FHLB and certain mortgages or deeds of trust securing such properties as provided in the agreements with the FHLB. As a member of the FHLB of Seattle, the Bank currently has a credit line of 50% of the total assets of the Bank, subject to collateralization requirements.
As of September 30, 2014 and 2013, respectively, there were no reverse repurchase agreements or other borrowings.
The Bank has historically entered into sales of reverse repurchase agreements. Fixed-coupon reverse repurchase agreements have been treated as financings, and the obligations to repurchase securities sold have been reflected as a liability in the consolidated statements of financial condition.
53
WASHINGTON FEDERAL, INC. AND SUBSIDIARIES
NOTES TO THE CONSOLIDATED FINANCIAL STATEMENTS
YEARS ENDED SEPTEMBER 30, 2014, 2013 AND 2012
Financial data pertaining to the weighted-average cost and the amount of securities sold under agreements to repurchase in 2012 were as follows:
| September 30, | 2014 | 2013 | 2012 | ||||||
| ($ in thousands) | |||||||||
| Weighted average interest rate at end of year | — | % | — | % | — | % | |||
| Weighted daily average interest rate during the year | — | % | — | % | 3.71 | % | |||
| Daily average of securities sold under agreements to repurchase | $ | — | $ | — | $ | 692,896 | |||
| Maximum securities sold under agreements to repurchase at any month end | $ | — | $ | — | $ | 800,000 | |||
| Interest expense during the year | $ | — | $ | — | $ | 25,693 | |||
54
WASHINGTON FEDERAL, INC. AND SUBSIDIARIES
NOTES TO THE CONSOLIDATED FINANCIAL STATEMENTS
YEARS ENDED SEPTEMBER 30, 2014, 2013 AND 2012
NOTE I DERIVATIVES AND HEDGING ACTIVITIES
The Bank periodically enters into certain interest rate swap agreements in order to provide commercial loan customers the ability to convert their obligations from variable to fixed interest rates. Under these agreements, the Bank enters into a variable-rate loan agreement with a customer in addition to a swap agreement, and then enters into a corresponding swap agreement with a third party in order to offset its exposure on the customer swap agreement. As the interest rate swap agreements with the customers and third parties are not designated as hedges under FASB ASC 815, Derivatives and Hedging, the instruments are marked to market in earnings.
The Bank has also entered into forward-starting interest rate swaps to convert future short-term borrowings to fixed rate payments. The primary purpose of this hedge is to avoid interest rate risk. More specifically, to avoid the interest rate risk of rising LIBOR rates which are a benchmark for the short term borrowings. These interest rate swaps qualify as hedging instruments under FASB ASC 815 which provides for matching of the recognition of gains and losses of the interest rate swaps and the hedged items. The hedged item is the LIBOR portion of the series of future short-term fixed rate borrowings over the term of the interest rate swap. Prior to the starting date, the change in the fair value of the interest rate swap will be recorded in Other Comprehensive Income.
The notional amount of open interest rate swap agreements at September 30, 2014 was $464,169,000. This included $264,169,000 in interest rate swaps in the customer derivatives program. There was no net impact on income due to changes in fair value for the 12 months ended September 30, 2014 for these interest rate swaps as the changes in value for the asset swap and the liability swap offset each other. The fee income related to these swaps was $920,705 for 2014 and $552,609 for 2013. This amount is included in miscellaneous loan fees.
Additionally, the Bank had $200,000,000 in forward starting interest rate swaps to hedge future borrowing rates. Their impact on other comprehensive income as of September 30, 2014 was a loss of $170,000.
The Bank periodically enters into forward contracts to purchase mortgage-backed securities as part of its interest rate risk management program. The notional amount of commitments to purchase mortgage-backed securities was $0 as of September 30, 2014 and it was $200,000,000 at September 30, 2013. The fair value of these contracts is included with the available-for-sale securities on the statement of financial condition.
The following table presents the fair value and balance sheet classification of derivatives at September 30, 2014 and September 30, 2013:
| Asset Derivatives | Liability Derivatives | |||||||||||||||||||||||
| September 30, 2014 | September 30, 2013 | September 30, 2014 | September 30, 2013 | |||||||||||||||||||||
| (In thousands) | Balance Sheet | Fair Value | Balance Sheet | Fair Value | Balance Sheet | Fair Value | Balance Sheet | Fair Value | ||||||||||||||||
| Interest rate contracts | Other assets | $ | 2,879 | Other assets | $ | 7 | Other liabilities | $ | 2,879 | Other liabilities | $ | 7 | ||||||||||||
| Commitments to purchase MBS | AFS securities | — | AFS securities | 3,188 | N/A | — | N/A | N/A | ||||||||||||||||
Derivatives at fair value are priced using model pricing based on their relationship to other benchmark quoted prices as provided by an independent third party and under the provisions of FASB ASC 820, Fair Value Measurement, are considered a Level 2 input method.
55
WASHINGTON FEDERAL, INC. AND SUBSIDIARIES
NOTES TO THE CONSOLIDATED FINANCIAL STATEMENTS
YEARS ENDED SEPTEMBER 30, 2014, 2013 AND 2012
NOTE J INCOME TAXES
The Consolidated Statements of Financial Condition at September 30, 2014 and 2013 includes net deferred tax assets (liabilities) of $2,448,000 and $22,554,000, respectively, that have been provided for the temporary differences between the tax basis and the financial statement carrying amounts of liabilities and assets. The major sources of these temporary differences and their deferred tax effects were as follows:
| September 30, | 2014 | 2013 | ||||
| (In thousands) | ||||||
| Deferred tax assets | ||||||
| Loan loss reserves | $ | 48,505 | $ | 52,182 | ||
| REO reserves | 13,680 | 18,018 | ||||
| Asset Purchase Tax Basis Difference (net) | 8,812 | 20,008 | ||||
| Delinquent accrued interest | 4,767 | 6,536 | ||||
| Other, net | 6,549 | 3,810 | ||||
| Total deferred tax assets | 82,313 | 100,554 | ||||
| Deferred tax liabilities | ||||||
| FDIC indemnification asset | — | 8,033 | ||||
| Federal Home Loan Bank stock dividends | 32,810 | 34,367 | ||||
| Valuation adjustment on available-for-sale securities | 12,032 | 3,706 | ||||
| Loan origination costs | 13,002 | 11,980 | ||||
| Depreciation | 22,021 | 19,722 | ||||
| Core deposit intangible | — | 192 | ||||
| Total deferred tax liabilities | 79,865 | 78,000 | ||||
| Net deferred tax asset | 2,448 | 22,554 | ||||
| Current tax asset | 14,067 | 21,446 | ||||
| Net tax asset | $ | 16,515 | $ | 44,000 | ||
A reconciliation of the statutory federal income tax rate to the effective income tax rate follows:
| Year ended September 30, | 2014 | 2013 | 2012 | |||
| Statutory income tax rate | 35 | % | 35 | % | 35 | % |
| State income tax | 2 | 2 | 2 | |||
| Other differences | (1 | ) | (2 | ) | (1 | ) |
| Effective income tax rate | 36 | % | 35 | % | 36 | % |
56
WASHINGTON FEDERAL, INC. AND SUBSIDIARIES
NOTES TO THE CONSOLIDATED FINANCIAL STATEMENTS
YEARS ENDED SEPTEMBER 30, 2014, 2013 AND 2012
Income taxes (benefit) are summarized as follows:
| 2014 | 2013 | 2012 | |||||||
| (In thousands) | |||||||||
| Federal: | |||||||||
| Current | $ | 70,797 | $ | 66,756 | $ | 57,047 | |||
| Deferred | 10,591 | 10,355 | 15,589 | ||||||
| 81,388 | 77,111 | 72,636 | |||||||
| State: | |||||||||
| Current | $ | 4,987 | $ | 5,213 | $ | 4,091 | |||
| Deferred | 1,189 | 787 | 1,001 | ||||||
| 6,176 | 6,000 | 5,092 | |||||||
| Total | |||||||||
| Current | 75,784 | 71,969 | 61,138 | ||||||
| Deferred | 11,780 | 11,142 | 16,590 | ||||||
| $ | 87,564 | $ | 83,111 | $ | 77,728 | ||||
A reconciliation of the beginning and ending amount of unrecognized tax benefits is as follows:
| 2014 | 2013 | |||||
| (In thousands) | ||||||
| Balance at October 1, | $ | 115 | $ | 4,509 | ||
| Tax positions related to current year: | ||||||
| Additions | — | — | ||||
| Reductions | — | — | ||||
| Tax positions related to prior years: | ||||||
| Additions | 32 | 234 | ||||
| Reductions | — | (1,293 | ) | |||
| Settlements with taxing authorities | — | (302 | ) | |||
| Lapses in statues of limitations | (35 | ) | (3,033 | ) | ||
| Balance at September 30, | $ | 112 | $ | 115 | ||
Based on current information the Company does not expect that changes in the amount of unrecognized tax benefits over the next twelve months will have a significant impact on the results of operations or the financial position of the Company. As of 2014 and 2013, the Company's liability for uncertain tax positions was $100,000 and $103,000, respectively. Included in the balance of unrecognized tax benefits at 2014, are $100,000 of tax benefits that, if recognized, would affect the effective tax rate. The Company records interest and penalties related to uncertain tax positions in income tax expense. As of 2014 and 2013, there were approximately $12,000 and $12,000, respectively, of accrued interest and no accrued penalties.
The Company's federal income tax returns are open for the tax years 2011 through 2014. The Internal Revenue Service is in the process of conducting an examination of the Company through the year ended September 30, 2012. Management does not expect the results of this examination to have a material impact on the Company's consolidated financial statements. The Company has been examined by the Internal Revenue Service through the year ended September 30, 1990. There were no material changes made to the Company's originally reported taxable income as a result of this examination.
State income tax returns are generally subject to examination for a period of three to five years after filing of the respective return. The state impact of any federal changes remains subject to examination by various states for a period of up to two years after formal notification to the states. The Company's unrecognized tax benefits are related to state tax returns open from 2011 through 2014.
57
WASHINGTON FEDERAL, INC. AND SUBSIDIARIES
NOTES TO THE CONSOLIDATED FINANCIAL STATEMENTS
YEARS ENDED SEPTEMBER 30, 2014, 2013 AND 2012
NOTE K 401(k) AND EMPLOYEE STOCK OWNERSHIP PLAN
The Company maintains a 401(k) and Employee Stock Ownership Plan (the "Plan") for the benefit of its employees. Company contributions are made semi-annually as approved by the Board of Directors. Such amounts are not in excess of amounts permitted by the Employee Retirement Income Security Act of 1974.
Plan participants may make voluntary after-tax contributions of their considered earnings as defined by the Plan. In addition, participants may make pre-tax contributions up to the statutory limits through the 401(k) provisions of the Plan. The annual addition from contributions to an individual participant's account in this Plan cannot exceed the lesser of 100% of base salary or $52,000. Under provisions of the Plan, employees are eligible to participate on the date of hire and become fully vested in the Company's contributions following six years of service.
Effective January 1, 2014, the Company added a guaranteed safe harbor matching contribution component to the plan equal to 100% of the first 4% of compensation that employee's contribute to their account. In addition to the new match being guaranteed, all safe harbor matching contributions are immediately vested. The new match is not subject to the 6 year vesting schedule of the current profit sharing contribution. This provides plan participants more investment flexibility. The Company anticipates that all eligible employees, regardless of personal plan participation, will continue to receive an annual profit sharing contribution from the Company, now capped at 7% of eligible compensation with this change.
Company contributions to the Plan amounted to $7,314,000, $5,870,000 and $5,400,000 for the years ended 2014, 2013 and 2012, respectively.
58
WASHINGTON FEDERAL, INC. AND SUBSIDIARIES
NOTES TO THE CONSOLIDATED FINANCIAL STATEMENTS
YEARS ENDED SEPTEMBER 30, 2014, 2013 AND 2012
NOTE L STOCK AWARD PLANS
The Company has one equity-based compensation plan which was approved by stockholders and provides for a combination of stock options and stock grants. Stockholders authorized 5,000,000 shares of common stock to be reserved pursuant to the 2011 Incentive Plan. Under the Plan, 4,125,600 shares remain available for issuance.
During 2014 and 2013, there were no stock options granted. Stock grants were made instead. When applicable, stock options are granted with an exercise price equal to the market price of the Company's stock at the date of grant; those option awards generally vest based on 5 years of continuous service and have 10-year contractual terms. The Company's policy is to issue new shares upon option exercises. The fair value of options granted is estimated on the date of grant using the Black-Scholes option-pricing model. This model requires input of highly subjective assumptions, changes to which can materially affect the fair value estimate. Additionally, there may be other factors that would otherwise have a significant effect on the value of employee stock options granted but are not considered by the model. Expected volatility is based on the historical volatility of the Company's stock. The risk-free interest rate is based on the U.S. Treasury yield curve that is in effect at the time of grant with a remaining term equal to the options' expected life. The expected term represents the period of time that options granted are expected to be outstanding.
Stock Option Awards:
The following weighted-average assumptions were used to estimate the fair value of stock options granted during the periods indicated:
| Year ended September 30, | 2014 | 2013 | 2012 | |||
| Annual dividend yield | — | % | — | % | 2.34 | % |
| Expected volatility | — | % | — | % | 31 | % |
| Risk-free interest rate | — | % | — | % | 0.77 | % |
| Expected life | 0.0 years | 0.0 years | 4.5 years | |||
A summary of stock option activity under the Plan as of 2014 and changes during the year is as follows:
| Options | Shares | Weighted Average Exercise Price | Weighted Average Remaining Contractual Term | Aggregate Intrinsic Value (In thousands) | |||||
| Outstanding at September 30, 2013 | 1,903,578 | $ | 20.93 | 4 | $2,563 | ||||
| Granted | — | — | |||||||
| Exercised | (500,504 | ) | 20.30 | ||||||
| Forfeited | (154,065 | ) | 21.43 | ||||||
| Outstanding at September 30, 2014 | 1,249,009 | $ | 21.11 | 4 | $ | 1,859 | |||
| Exercisable at September 30, 2014 | 1,103,214 | $ | 21.66 | 3 | $ | 1,363 | |||
Miscellaneous information related to stock options is presented below:
| 2014 | 2013 | 2012 | |||||||
| (Dollars in thousands) | |||||||||
| Compensation cost for stock options | $ | 324 | $ | 473 | $ | 848 | |||
| Weighted avg. grant date FV | 2.95 | 3.24 | 3.53 | ||||||
| Total intrinsic value of options exercised | 1,136 | 781 | 125 | ||||||
| Grant date FV of options exercised | 1,962 | 791 | 54 | ||||||
| Cash received from option exercises | 10,142 | 4,261 | 357 | ||||||
| Tax benefit realized for option exercises | 159 | 53 | — | ||||||
59
WASHINGTON FEDERAL, INC. AND SUBSIDIARIES
NOTES TO THE CONSOLIDATED FINANCIAL STATEMENTS
YEARS ENDED SEPTEMBER 30, 2014, 2013 AND 2012
A summary of the Company's non-vested stock options as of 2014 and changes during the year is as follows:
| Non-vested Options | Shares | Weighted Average Grant Date Fair Value | |||
| Outstanding at September 30, 2013 | 287,750 | $ | 3.44 | ||
| Granted | — | — | |||
| Vested | (119,520 | ) | 2.88 | ||
| Forfeited | (22,435 | ) | 3.63 | ||
| Outstanding at September 30, 2014 | 145,795 | $ | 3.87 | ||
As of September 30, 2014, unrecognized compensation cost for stock options, net of forfeitures, totaled $357,218, which is expected to be recognized over a weighted average remaining period of 1.4 years.
Stock Grant Awards:
The Company also grants shares of restricted stock pursuant to its 2011 Incentive Plan. These shares of restricted stock vest over a period of one to seven years. The Company had a total of 1,061,435 shares of restricted stock issued as of September 30, 2014, with a fair market value at the date of grant of $20.1 million. At the prior year end, the Company had a total of 834,935 shares issued with a fair market value at the date of grant of $14.2 million.
A summary of the Company's non-vested share awards as of 2014 and changes during the year is as follows:
| Non-vested Stock Grant Awards | Shares | Weighted Average Grant Date Fair Value | |||
| Outstanding at September 30, 2013 | 209,667 | ||||
| Granted | 232,000 | ||||
| Vested | (162,717 | ) | |||
| Forfeited | (39,883 | ) | |||
| Outstanding at September 30, 2014 | 239,067 | $ | 20.37 | ||
The Company accounts for restricted stock grants by recording the fair value of the grant to compensation expense over the vesting period. Compensation expense related to restricted stock was $3,085,081, $2,815,049 and $1,992,000 for the years ended 2014, 2013 and 2012, respectively.
60
WASHINGTON FEDERAL, INC. AND SUBSIDIARIES
NOTES TO THE CONSOLIDATED FINANCIAL STATEMENTS
YEARS ENDED SEPTEMBER 30, 2014, 2013 AND 2012
NOTE M STOCKHOLDERS' EQUITY
The Company and the Bank are subject to various regulatory capital requirements. Quantitative measures established by regulation to ensure capital adequacy require the Company and the Bank to maintain minimum amounts and ratios (set forth in the following table) of total and Tier 1 capital to risk weighted assets (as defined in the regulations) and Tier 1 capital to average assets (as defined in the regulations). Failure to meet minimum capital requirements can initiate certain mandatory and possibly additional discretionary action by regulators that, if undertaken, could have a direct material effect on the Company's financial statements. The Company and the Bank are also subject to certain restrictions on the amount of dividends that they may declare without prior regulatory approval.
As of September 30, 2014 and 2013, the Company and the Bank met all capital adequacy requirements to which they are subject, and the OCC categorized the Bank as well capitalized under the regulatory framework for prompt corrective action. To be categorized as well capitalized, the Bank must maintain minimum total risk-based, Tier 1 risk-based and Tier 1 leverage ratios as set forth in the following table. The Bank's actual capital amounts and ratios as of these dates are also presented. There are no conditions or events since that management believes have changed the Bank's categorization.
| Actual | Capital Adequacy Guidelines | Categorized as Well Capitalized Under Prompt Corrective Action Provisions | |||||||||
| Capital | Ratio | Capital | Ratio | Capital | Ratio | ||||||
| As of September 30, 2014 | (In thousands) | ||||||||||
| Total Capital (to risk-weighted assets) | |||||||||||
| The Company | $ | 1,739,658 | 23.97 | % | $580,671 | 8.00 | % | NA | NA | ||
| The Bank | $ | 1,750,179 | 24.11 | % | $580,772 | 8.00 | % | $725,965 | 10.00 | % | |
| Tier I Capital (to risk-weighted assets) | |||||||||||
| The Company | $ | 1,648,199 | 22.71 | % | $290,335 | 4.00 | % | NA | NA | ||
| The Bank | $ | 1,658,704 | 22.85 | % | $290,386 | 4.00 | % | $435,579 | 6.00 | % | |
| Tier 1 Capital (to average assets) | |||||||||||
| The Company | $ | 1,648,199 | 11.39 | % | $578,804 | 4.00 | % | NA | NA | ||
| The Bank | $ | 1,658,704 | 11.46 | % | $578,816 | 4.00 | % | $723,520 | 5.00 | % | |
| As of September 30, 2013 | |||||||||||
| Total Capital (to risk-weighted assets) | |||||||||||
| The Company | $ | 1,749,383 | 26.49 | % | $528,243 | 8.00 | % | NA | NA | ||
| The Bank | $ | 1,693,227 | 25.64 | % | $528,380 | 8.00 | % | $660,475 | 10.00 | % | |
| Tier I Capital (to risk-weighted assets) | |||||||||||
| The Company | $ | 1,666,091 | 25.23 | % | $264,121 | 4.00 | % | NA | NA | ||
| The Bank | $ | 1,609,914 | 24.38 | % | $264,190 | 4.00 | % | $396,285 | 6.00 | % | |
| Tier 1 Capital (to average assets) | |||||||||||
| The Company | $ | 1,666,091 | 13.03 | % | $511,334 | 4.00 | % | NA | NA | ||
| The Bank | $ | 1,609,914 | 12.59 | % | $511,358 | 4.00 | % | $639,197 | 5.00 | % | |
At periodic intervals, the Federal Reserve, the OCC and the FDIC routinely examine the Company's and the Bank's financial statements as part of their oversight. Based on their examinations, these regulators can direct that the Company's or Bank's financial statements be adjusted in accordance with their findings. The extent to which forthcoming regulatory examinations may result in adjustments to the financial statements cannot be determined; however, no adjustments were proposed as a result of the most recent examination which concluded in July, 2014.
61
WASHINGTON FEDERAL, INC. AND SUBSIDIARIES
NOTES TO THE CONSOLIDATED FINANCIAL STATEMENTS
YEARS ENDED SEPTEMBER 30, 2014, 2013 AND 2012
The Federal Reserve and the OCC approved final capital rules in July 2013 that substantially amend the existing capital rules for bank holding companies and banks. These new rules reflect, in part, certain standards initially adopted by the Basel Committee on Banking Supervision in December 2010 (which standards are commonly referred to as “Basel III”) as well as requirements contemplated by the Dodd-Frank Act. The Company and the Bank are generally required to begin compliance with the new capital rules on January 1, 2015.
Under the new capital rules, both the Company and the Bank are ultimately required to meet certain minimum capital requirements. The rules implement a new capital ratio of common equity Tier 1 capital to risk based assets. Both the Company and the Bank are required to have a common equity Tier 1 capital ratio of 4.5%. In addition, both the Company and the Bank are required to have a Tier 1 leverage ratio of 4.0%, a Tier 1 risk-based ratio of 6.0% and a total risk-based ratio of 8.0%. Both the Company and the Bank are required to establish a “conservation buffer”, consisting of common equity Tier 1 capital, equal to 2.5%. An institution that does not meet the conservation buffer will be subject to restrictions on certain activities including payment of dividends, stock repurchases and discretionary bonuses to executive officers. The prompt corrective action rules, which apply to the Bank but not the Company, are modified to include a common equity Tier 1 risk-based ratio and to increase certain other capital requirements for the various thresholds. For example, the requirements for the Bank to be considered well-capitalized under the rules are a 5.0% Tier 1 leverage ratio, a 6.5% common equity Tier 1 risk-based ratio, an 8.0% Tier 1 risk-based capital ratio and a 10.0% total risk-based capital ratio.
These rules are further described in the 10-K report under "Washington Federal, National Association (Bank) - Regulatory Capital Requirements". Both the Company and the Bank have more than enough capital to readily meet these new guidelines.
The Company paid its 127th consecutive quarterly cash dividend on October 17, 2014 to common stockholders of record on October 3, 2014. The Company and the Bank are subject to restrictions on paying dividends that are further described in the 10-K report under "The Company - Restrictions on Company Dividends" and "Washington Federal, National Association (Bank) - Restrictions on Dividends".
The Company has an ongoing stock repurchase program. 4,830,400 shares were repurchased during 2014 at a weighted average cost of $21.59. In 2013, 6,315,196 shares were repurchased during the year at a weighted average price of $17.46. As of September 30, 2014, Management had authorization from the Board of Directors to repurchase up to 5,035,834 additional shares.
In connection with the 2008 Troubled Asset Relief Program ("TARP") the Company issued 1,707,456 warrants to purchase common stock at an exercise price of $17.57. As of September 30, 2014, 1,700,856 warrants remained outstanding with an expiration date of November 14, 2018. The warrants have been included in the calculation of diluted shares outstanding using the treasury stock method.
The following table sets forth information regarding earnings per share calculations:
| Year ended September 30, | 2014 | 2013 | 2012 | ||||||||
| Average shares outstanding | 101,154,030 | 104,684,812 | 107,108,703 | ||||||||
| Average dilutive warrants | 352,171 | 100,211 | — | ||||||||
| Average dilutive options | 84,150 | 52,447 | 40,537 | ||||||||
| Average diluted shares | 101,590,351 | 104,837,470 | 107,149,240 | ||||||||
| Net income (In thousands) | $ | 157,364 | $ | 151,505 | $ | 138,183 | |||||
| Basic EPS | $ | 1.56 | $ | 1.45 | $ | 1.29 | |||||
| Diluted EPS | 1.55 | 1.45 | 1.29 | ||||||||
62
WASHINGTON FEDERAL, INC. AND SUBSIDIARIES
NOTES TO THE CONSOLIDATED FINANCIAL STATEMENTS
YEARS ENDED SEPTEMBER 30, 2014, 2013 AND 2012
NOTE N FAIR VALUES OF FINANCIAL INSTRUMENTS
U.S. GAAP requires disclosure of fair value information about financial instruments, whether or not recognized on the statement of financial condition, for which it is practicable to estimate those values. Certain financial instruments and all non-financial instruments are excluded from the disclosure requirements. Accordingly, the aggregate fair value estimates presented do not reflect the underlying fair value of the Company. Although management is not aware of any factors that would materially affect the estimated fair value amounts presented, such amounts have not been comprehensively revalued for purposes of these financial statements since that date, and therefore, estimates of fair value subsequent to that date may differ significantly from the amounts presented below.
| 2014 | 2013 | |||||||||||||
| Level | Carrying Amount | Estimated Fair Value | Carrying Amount | Estimated Fair Value | ||||||||||
| (In thousands) | ||||||||||||||
| Financial assets | ||||||||||||||
| Cash and cash equivalents | 1 | $ | 781,843 | $ | 781,843 | $ | 203,563 | $ | 203,563 | |||||
| Available-for-sale securities: | ||||||||||||||
| Equity securities | 1 | 101,387 | 101,387 | 101,237 | 101,237 | |||||||||
| Obligations of U.S. government | 2 | 731,943 | 731,943 | 533,975 | 533,975 | |||||||||
| Obligations of states and political subdivisions | 2 | 23,681 | 23,681 | 22,545 | 22,545 | |||||||||
| Obligations of foreign governments | — | — | — | — | ||||||||||
| Corporate debt securities | 2 | 509,007 | 509,007 | 452,015 | 452,015 | |||||||||
| Mortgage-backed securities | ||||||||||||||
| Agency pass-through certificates | 2 | 1,584,508 | 1,584,508 | 1,251,176 | 1,251,176 | |||||||||
| Other commercial MBS | 2 | 98,916 | 98,916 | — | — | |||||||||
| Total available-for-sale securities | 3,049,442 | 3,049,442 | 2,360,948 | 2,360,948 | ||||||||||
| Held-to-maturity securities: | ||||||||||||||
| Mortgage-backed securities | ||||||||||||||
| Agency pass-through certificates | 2 | 1,548,265 | 1,499,218 | 1,654,666 | 1,582,849 | |||||||||
| Total held-to-maturity securities | 1,548,265 | 1,499,218 | 1,654,666 | 1,582,849 | ||||||||||
| Loans receivable | 3 | 8,148,322 | 8,667,771 | 7,528,030 | 8,070,279 | |||||||||
| Covered loans | 3 | 176,476 | 176,761 | 295,947 | 300,610 | |||||||||
| FDIC indemnification asset | 3 | 36,860 | 35,976 | 64,615 | 62,300 | |||||||||
| FHLB stock | 2 | 158,839 | 158,839 | 173,009 | 173,009 | |||||||||
| Financial liabilities | ||||||||||||||
| Customer accounts | 2 | 10,716,928 | 9,946,586 | 9,090,271 | 8,585,068 | |||||||||
| FHLB advances and other borrowings | 2 | 1,930,000 | 2,054,437 | 1,930,000 | 2,064,248 | |||||||||
For a description of the level in fair value hierarchy under the provisions of the Fair Value Measurements and Disclosures topic of the FASB Accounting Standards Codification please see note Q.
The following methods and assumptions were used to estimate the fair value of financial instruments:
Cash and cash equivalents – The carrying amount of these items is a reasonable estimate of their fair value.
63
WASHINGTON FEDERAL, INC. AND SUBSIDIARIES
NOTES TO THE CONSOLIDATED FINANCIAL STATEMENTS
YEARS ENDED SEPTEMBER 30, 2014, 2013 AND 2012
Available-for-sale securities and held-to-maturity securities – Securities at fair value are priced using model pricing based on the securities' relationship to other benchmark quoted prices as provided by an independent third party and under the provisions of the Fair Value Measurements and Disclosures topic of the FASB Accounting Standards Codification are considered a Level 2 input method except for equity securities which are considered a Level 1 input method.
Loans receivable and covered loans – For certain homogeneous categories of loans, such as fixed- and variable-rate residential mortgages, fair value is estimated for securities backed by similar loans, adjusted for differences in loan characteristics, using the same methodology described above for AFS and HTM securities.
The fair value of other loan types is estimated by discounting the future cash flows and estimated prepayments using the current rates at which similar loans would be made to borrowers with similar credit ratings and for the same remaining term. Some loan types were valued at carrying value because of their floating rate or expected maturity characteristics. Net deferred loan fees are not included in the fair value calculation but are included in the carrying amount.
FDIC indemnification asset – The fair value of the indemnification asset is estimated by discounting the expected future cash flows using the current rates.
FHLB stock – The fair value is based upon the redemption value of the stock which equates to its carrying value.
Customer accounts – The fair value of demand deposits, savings accounts, and money market accounts is the amount payable on demand at the reporting date. The fair value of fixed-maturity certificates of deposit is estimated by discounting the estimated future cash flows using the rates currently offered for deposits with similar remaining maturities.
FHLB advances and other borrowings – The fair value of FHLB advances and other borrowings is estimated by discounting the estimated future cash flows using rates currently available to the Company for debt with similar remaining maturities.
64
WASHINGTON FEDERAL, INC. AND SUBSIDIARIES
NOTES TO THE CONSOLIDATED FINANCIAL STATEMENTS
YEARS ENDED SEPTEMBER 30, 2014, 2013 AND 2012
NOTE O FINANCIAL INFORMATION – WASHINGTON FEDERAL, INC.
The following Washington Federal, Inc. (parent company only) financial information should be read in conjunction with the other notes to the Consolidated Financial Statements.
| Condensed Statements of Financial Condition | |||||||
| September 30, | 2014 | 2013 | |||||
| (In thousands) | |||||||
| Assets | |||||||
| Cash | $ | 3,895 | $ | 66,425 | |||
| Investment in subsidiary | 1,983,788 | 1,881,458 | |||||
| Other assets | — | — | |||||
| Total assets | $ | 1,987,683 | $ | 1,947,883 | |||
| Liabilities | |||||||
| Dividend payable and other liabilities | $ | 14,400 | $ | 10,248 | |||
| Total liabilities | 14,400 | 10,248 | |||||
| Stockholders’ equity | |||||||
| Total stockholders’ equity | 1,973,283 | 1,937,635 | |||||
| Total liabilities and stockholders’ equity | $ | 1,987,683 | $ | 1,947,883 | |||
| Condensed Statements of Operations | |||||||||
| Year ended September 30, | 2014 | 2013 | 2012 | ||||||
| (In thousands) | |||||||||
| Income | |||||||||
| Dividends from subsidiary | $ | 70,000 | $ | 143,799 | $ | 106,234 | |||
| Total Income | 70,000 | 143,799 | 106,234 | ||||||
| Expense | |||||||||
| Miscellaneous | 485 | 530 | 564 | ||||||
| Total expense | 485 | 530 | 564 | ||||||
| Net income before equity in undistributed net income of subsidiary | 69,515 | 143,269 | 105,670 | ||||||
| Equity in undistributed net income of subsidiary | 87,675 | 8,045 | 32,513 | ||||||
| Income before income taxes | 157,190 | 151,314 | 138,183 | ||||||
| Income tax benefit | 174 | 191 | — | ||||||
| Net income | $ | 157,364 | $ | 151,505 | $ | 138,183 | |||
65
WASHINGTON FEDERAL, INC. AND SUBSIDIARIES
NOTES TO THE CONSOLIDATED FINANCIAL STATEMENTS
YEARS ENDED SEPTEMBER 30, 2014, 2013 AND 2012
| Condensed Statements of Cash Flows | |||||||||
| Year ended September 30, | 2014 | 2013 | 2012 | ||||||
| (In thousands) | |||||||||
| Cash Flows From Operating Activities | |||||||||
| Net income | $ | 157,364 | $ | 151,505 | $ | 138,183 | |||
| Adjustments to reconcile net income to net cash provided by operating activities: | |||||||||
| Equity in undistributed net income of subsidiaries | (87,943 | ) | (4,893 | ) | (32,513 | ) | |||
| Decrease (increase) in other assets | 1 | 1 | 36 | ||||||
| Increase in other liabilities | 4,152 | 1,698 | 2,508 | ||||||
| Net cash provided by operating activities | 73,574 | 148,311 | 108,214 | ||||||
| Cash Flows From Financing Activities | |||||||||
| Proceeds from exercise of common stock options and related tax benefit | 10,252 | 4,261 | 357 | ||||||
| Treasury stock purchased | (104,291 | ) | (110,238 | ) | (41,914 | ) | |||
| Dividends paid on common stock | (42,065 | ) | (37,835 | ) | (32,430 | ) | |||
| Net cash used in financing activities | (136,104 | ) | (143,812 | ) | (73,987 | ) | |||
| Increase (decrease) in cash | (62,530 | ) | 4,499 | 34,227 | |||||
| Cash at beginning of year | 66,425 | 61,926 | 27,699 | ||||||
| Cash at end of year | $ | 3,895 | $ | 66,425 | $ | 61,926 | |||
66
WASHINGTON FEDERAL, INC. AND SUBSIDIARIES
NOTES TO THE CONSOLIDATED FINANCIAL STATEMENTS
YEARS ENDED SEPTEMBER 30, 2014, 2013 AND 2012
NOTE P SELECTED QUARTERLY FINANCIAL DATA (UNAUDITED)
The following is a summary of the unaudited interim results of operations by quarter for the years ended September 30, 2014 and 2013:
| Year Ended September 30, 2014 | First Quarter | Second Quarter | Third Quarter | Fourth Quarter | ||||||||
| (In thousands, except per share data) | ||||||||||||
| Interest income | $ | 131,258 | $ | 132,351 | $ | 135,011 | $ | 135,077 | ||||
| Interest expense | 32,946 | 31,715 | 31,732 | 31,684 | ||||||||
| Net interest income | 98,312 | 100,636 | 103,279 | 103,393 | ||||||||
| Provision for loan losses | (4,600 | ) | (4,336 | ) | (3,000 | ) | (3,465 | ) | ||||
| Other operating income (REO expense) | 3,837 | 7,255 | 6,016 | 10,808 | ||||||||
| Other operating expense | 44,120 | 52,059 | 53,293 | 54,537 | ||||||||
| Income before income taxes | 62,629 | 60,168 | 59,002 | 63,129 | ||||||||
| Income taxes | 22,393 | 21,511 | 21,092 | 22,568 | ||||||||
| Net income | $ | 40,236 | $ | 38,657 | $ | 37,910 | $ | 40,561 | ||||
| Basic earnings per share | $ | 0.39 | $ | 0.38 | $ | 0.38 | $ | 0.41 | ||||
| Diluted earnings per share | 0.39 | 0.38 | 0.37 | 0.41 | ||||||||
| Cash dividends per share | 0.10 | 0.10 | 0.10 | 0.11 | ||||||||
| Return of average assets | 1.19 | % | 1.07 | % | 1.04 | % | 1.10 | % | ||||
| Year Ended September 30, 2013 | First Quarter | Second Quarter | Third Quarter | Fourth Quarter | ||||||||
| (In thousands, except per share data) | ||||||||||||
| Interest income | $ | 131,309 | $ | 126,505 | $ | 128,176 | $ | 130,302 | ||||
| Interest expense | 35,875 | 33,482 | 33,461 | 33,343 | ||||||||
| Net interest income | 95,434 | 93,023 | 94,715 | 96,959 | ||||||||
| Provision for loan losses | 3,600 | — | — | (2,250 | ) | |||||||
| Other operating income (REO expense) | 1,638 | 2,043 | 5,236 | 11,157 | ||||||||
| Other operating expense | 38,298 | 41,164 | 41,610 | 43,167 | ||||||||
| Income before income taxes | 55,174 | 53,902 | 58,341 | 67,199 | ||||||||
| Income taxes | 19,891 | 17,924 | 21,003 | 24,293 | ||||||||
| Net income | $ | 35,283 | $ | 35,978 | $ | 37,338 | $ | 42,906 | ||||
| Basic earnings per share | $ | 0.33 | $ | 0.34 | $ | 0.36 | $ | 0.42 | ||||
| Diluted earnings per share | 0.33 | 0.34 | 0.36 | 0.41 | ||||||||
| Cash dividends per share | 0.08 | 0.09 | 0.09 | 0.10 | ||||||||
| Return of average assets | 1.11 | % | 1.10 | % | 1.15 | % | 1.32 | % | ||||
67
WASHINGTON FEDERAL, INC. AND SUBSIDIARIES
NOTES TO THE CONSOLIDATED FINANCIAL STATEMENTS
YEARS ENDED SEPTEMBER 30, 2014, 2013 AND 2012
NOTE Q Fair Value Measurements
U.S. GAAP defines fair value as the exchange price that would be received for an asset or paid to transfer a liability (an exit price) in the principal or most advantageous market for the asset or liability in an orderly transaction between market participants on the measurement date. U.S. GAAP also establishes a fair value hierarchy which requires an entity to maximize the use of observable inputs and minimize the use of unobservable inputs when measuring fair value. The standard describes three levels of inputs that may be used to measure fair value:
Level 1: Quoted prices (unadjusted) for identical assets or liabilities in active exchange markets that the entity has the ability to access as of the measurement date.
Level 2: Significant other observable inputs other than Level 1 prices, such as quoted prices for similar assets or liabilities, quoted prices in markets that are not active and other inputs that are observable or can be corroborated by observable market data.
Level 3: Significant unobservable inputs that reflect a company’s own assumptions about the assumptions that market participants would use in pricing an asset or liability.
We have established and documented the Company's process for determining the fair values of our assets and liabilities, where applicable. Fair value is based on quoted market prices, when available, for identical or similar assets or liabilities. In the absence of quoted market prices, fair value is determined using valuation models or third-party appraisals. The following is a description of the valuation methodologies used to measure and report the fair value of financial assets and liabilities on a recurring or nonrecurring basis:
Measured on a Recurring Basis
Securities
Securities available for sale are recorded at fair value on a recurring basis. Securities at fair value are priced using model pricing based on the securities' relationship to other benchmark quoted prices as provided by an independent third party (primarily Bloomberg), and under the provisions of FASB ASC 820, Fair Value Measurement, are considered a Level 2 input method.
The following table presents the balance of assets measured at fair value on a recurring basis at September 30, 2014 and September 30, 2013:
| Fair Value at September 30, 2014 | |||||||||||||||
| Level 1 | Level 2 | Level 3 | Total | ||||||||||||
| (In thousands) | |||||||||||||||
| Available-for-sale securities | |||||||||||||||
| Equity securities | $ | 101,387 | $ | — | $ | — | $ | 101,387 | |||||||
| Obligations of U.S. government | — | 731,943 | — | 731,943 | |||||||||||
| Obligations of states and political subdivisions | — | 23,681 | — | 23,681 | |||||||||||
| Obligations of foreign governments | — | — | — | — | |||||||||||
| Corporate debt securities | — | 509,007 | — | 509,007 | |||||||||||
| Agency pass through mortgage-backed securities | — | 1,584,508 | — | 1,584,508 | |||||||||||
| Other commercial MBS | — | 98,916 | — | 98,916 | |||||||||||
| Other debt securities | — | — | — | — | |||||||||||
| Balance at end of period | $ | 101,387 | $ | 2,948,055 | $ | — | $ | 3,049,442 | |||||||
There were no transfers between, into and/or out of Levels 1, 2 or 3 during the year ended September 30, 2014.
68
WASHINGTON FEDERAL, INC. AND SUBSIDIARIES
NOTES TO THE CONSOLIDATED FINANCIAL STATEMENTS
YEARS ENDED SEPTEMBER 30, 2014, 2013 AND 2012
| Fair Value at September 30, 2013 | |||||||||||||||
| Level 1 | Level 2 | Level 3 | Total | ||||||||||||
| (In thousands) | |||||||||||||||
| Available-for-sale securities | |||||||||||||||
| Equity securities | $ | 101,237 | $ | — | $ | — | $ | 101,237 | |||||||
| Obligations of U.S. government | — | 533,975 | — | 533,975 | |||||||||||
| Obligations of states and political subdivisions | — | 22,545 | — | 22,545 | |||||||||||
| Obligations of foreign governments | — | — | — | — | |||||||||||
| Corporate debt securities | — | 452,015 | — | 452,015 | |||||||||||
| Agency pass through mortgage-backed securities | — | 1,251,176 | — | 1,251,176 | |||||||||||
| Other commercial MBS | — | — | — | — | |||||||||||
| Other debt securities | — | — | — | — | |||||||||||
| Balance at end of period | $ | 101,237 | $ | 2,259,711 | $ | — | $ | 2,360,948 | |||||||
There were no transfers between, into and/or out of Level 1, 2 or 3 during the year ended September 30, 2013 other than a transfer from Level 2 to Level 1 of $511,000 in Equity Securities.
Measured on a Nonrecurring Basis
Impaired Loans & Real Estate Held for Sale
From time to time, and on a nonrecurring basis, fair value adjustments to collateral-dependent loans and real estate held for sale are recorded to reflect write-downs of principal balances based on the current appraised or estimated value of the collateral. When management determines that the fair value of the collateral or the real estate held for sale requires additional adjustments, either as a result of a non-current appraisal value or when there is no observable market price, the Company classifies the impaired loan or real estate held for sale as Level 3. Level 3 assets recorded at fair value on a nonrecurring basis at September 30, 2014, included loans for which a specific reserve allowance was established or a partial charge-off was recorded based on the fair value of collateral, as well as covered real estate owned and real estate held for sale for which fair value of the properties was less than the cost basis. Real estate held for sale consists principally of properties acquired through foreclosure.
The following table presents the aggregated balance of assets measured at estimated fair value on a nonrecurring basis for the year ended September 30, 2014, and the total losses resulting from those fair value adjustments for the quarter and year ended September 30, 2014. These estimated fair values are shown gross of estimated selling costs:
| As of September 30, 2014 | Quarter Ended September 30, 2014 | Year Ended September 30, 2014 | |||||||||||||||||||||
| Level 1 | Level 2 | Level 3 | Total | Total Losses | |||||||||||||||||||
| (In thousands) | |||||||||||||||||||||||
| Impaired loans (1) | $ | — | $ | — | $ | 10,156 | $ | 10,156 | $ | — | $ | (1,311 | ) | ||||||||||
| Covered REO (2) | — | — | 10,520 | 10,520 | 113 | 616 | |||||||||||||||||
| Real estate held for sale (2) | — | — | 51,624 | 51,624 | 1,878 | 18,660 | |||||||||||||||||
| Balance at end of period | $ | — | $ | — | $ | 72,300 | $ | 72,300 | $ | 1,991 | $ | 17,965 | |||||||||||
___________________
| (1) | The losses represent remeasurements of collateral-dependent loans. |
| (2) | The losses represent aggregate writedowns and charge-offs on real estate held for sale. |
69
WASHINGTON FEDERAL, INC. AND SUBSIDIARIES
NOTES TO THE CONSOLIDATED FINANCIAL STATEMENTS
YEARS ENDED SEPTEMBER 30, 2014, 2013 AND 2012
| As of September 30, 2013 | Quarter Ended September 30, 2013 | Year Ended September 30, 2013 | |||||||||||||||||||||
| Level 1 | Level 2 | Level 3 | Total | Total Losses | |||||||||||||||||||
| (In thousands) | |||||||||||||||||||||||
| Impaired loans (1) | $ | — | $ | — | 87,170 | $ | 87,170 | 366 | 13,371 | ||||||||||||||
| Covered REO (2) | — | — | 20,308 | 20,308 | 208 | 811 | |||||||||||||||||
| Real estate held for sale (2) | — | — | 82,840 | 82,840 | 4,618 | 24,268 | |||||||||||||||||
| Balance at end of period | $ | — | $ | — | $ | 190,318 | $ | 190,318 | $ | 5,192 | $ | 38,450 | |||||||||||
___________________
| (1) | The losses represent remeasurements of collateral-dependent loans. |
| (2) | The losses represent aggregate writedowns and charge-offs on real estate held for sale. |
There were no liabilities carried at fair value, measured on a recurring or nonrecurring basis, at September 30, 2014 or September 30, 2013.
The following describes the process used to value Level 3 assets measured on a nonrecurring basis:
Impaired loans - The Company adjusts the carrying amount of impaired loans when there is evidence of probable loss and the expected fair value of the loan is less than its contractual amount. The amount of the impairment may be determined based on the estimated present value of future cash flows or the fair value of the underlying collateral. Impaired loans with a specific reserve allowance based on cash flow analysis or the value of the underlying collateral are classified as Level 3 assets.
The evaluations for impairment are prepared by the Problem Loan Review Committee, which is chaired by the Chief Credit Officer and includes the Loan Review manager and Special Credits manager, as well as senior credit officers, division managers and group executives, as applicable. These evaluations are performed in conjunction with the quarterly allowance for loan loss process.
Applicable loans are evaluated for impairment on a quarterly basis. Loans included in the previous quarter's review are reevaluated and if their values are materially different from the prior quarter evaluation, the underlying information (loan balance and collateral value) are compared. Material differences are evaluated for reasonableness and discussions are held between the relationship manager and their division manager to understand the difference and determine if any adjustment is necessary. The inputs are developed and substantiated on a quarterly basis, based on current borrower developments, market conditions and collateral values.
The following method is used to value impaired loans:
The fair value of the collateral, which may take the form of real estate or personal property, is based on internal estimates, field observations, assessments provided by third-party appraisers and other valuation models. The Company performs or reaffirms valuations of collateral-dependent impaired loans at least annually. Adjustments are made if management believes that more recent information is available and relevant with respect to the fair value of the collateral.
Real estate held for sale ("REO") - These assets are valued based on inputs such as appraisals and third-party price opinions, less estimated selling costs. Assets that are acquired through foreclosure are recorded initially at the lower of the loan balance or fair value at the date of foreclosure. After foreclosure, valuations are updated periodically, and current market conditions my require the assets to be written down further to a new cost basis.
The following method is used to value real estate held for sale:
When a loan is reclassified from loan status to real estate held for sale due to the Company taking possession of the collateral, a Special Credits officer, along with the Special Credits manager, obtains a valuation, which may include a third-party appraisal, which is used to establish the fair value of the underlying collateral. The REO is carried at the estimated fair value of the repossessed real estate once a bona fide offer is contractually accepted, through execution of a Purchase and Sale Agreement. The fair value of REO assets is re-evaluated quarterly and the REO asset is adjusted to reflect the lower of cost or fair value as necessary.
70
WASHINGTON FEDERAL, INC. AND SUBSIDIARIES
NOTES TO THE CONSOLIDATED FINANCIAL STATEMENTS
YEARS ENDED SEPTEMBER 30, 2014, 2013 AND 2012
NOTE R Covered Assets
Covered assets represent loans and real estate held for sale acquired from the FDIC that are subject to loss sharing agreements and were $200,558,000 as of September 30, 2014, compared to $326,927,000 as of September 30, 2013. As of the close of business October 31, 2012, the Company acquired covered assets as part of the SVBT acquisition as described in Note A.
The carrying balance of acquired covered loans have been included in the following tables. The Company evaluated the acquired loans for impairment. Loans are accounted for under FASB ASC 310-30 when there is evidence of credit deterioration since origination and for which it is probable, at acquisition, that the Company would be unable to collect all contractually required payments.
The following table reflects the carrying value of all acquired impaired and non-impaired loans as of September 30, 2014 and 2013:
| September 30, 2014 | September 30, 2013 | ||||||||||||||||||
Acquired Impaired Loans | Acquired Non-impaired Loans | Total | Acquired Impaired Loans | Acquired Non-impaired Loans | Total | ||||||||||||||
| (In thousands) | |||||||||||||||||||
| Single-family residential | $ | 22,400 | $ | 23,067 | $ | 45,467 | $ | 28,428 | $ | 28,460 | $ | 56,888 | |||||||
| Construction – speculative | 181 | — | 181 | 440 | — | 440 | |||||||||||||
| Construction – custom | — | — | — | 1,197 | — | 1,197 | |||||||||||||
| Land – acquisition & development | 5,589 | 1,364 | 6,953 | 17,953 | 4,810 | 22,763 | |||||||||||||
| Land – consumer lot loans | 496 | 73 | 569 | 496 | 245 | 741 | |||||||||||||
| Multi-family | 2,225 | 6,598 | 8,823 | 6,933 | 18,852 | 25,785 | |||||||||||||
| Commercial real estate | 69,873 | 51,336 | 121,209 | 121,105 | 89,499 | 210,604 | |||||||||||||
| Commercial & industrial | 8,894 | 5,492 | 14,386 | 14,949 | 9,416 | 24,365 | |||||||||||||
| HELOC | 3,285 | 11,777 | 15,062 | 3,869 | 14,750 | 18,619 | |||||||||||||
| Consumer | 99 | 454 | 553 | 242 | 604 | 846 | |||||||||||||
| Total covered loans | 113,042 | 100,161 | 213,203 | 195,612 | 166,636 | 362,248 | |||||||||||||
| Allowance for losses | (2,244 | ) | — | (2,244 | ) | — | — | — | |||||||||||
| $ | 110,798 | $ | 100,161 | $ | 210,959 | $ | 195,612 | $ | 166,636 | $ | 362,248 | ||||||||
| Discount | (34,483 | ) | (66,301 | ) | |||||||||||||||
| Covered loans, net | $ | 176,476 | $ | 295,947 | |||||||||||||||
71
WASHINGTON FEDERAL, INC. AND SUBSIDIARIES
NOTES TO THE CONSOLIDATED FINANCIAL STATEMENTS
YEARS ENDED SEPTEMBER 30, 2014, 2013 AND 2012
Changes in the carrying amount and accretable yield for acquired impaired and non-impaired loans were as follows for the fiscal years ended September 30, 2014 and 2013:
| September 30, 2014 | September 30, 2013 | ||||||||||||||||||||||||||||||
| Acquired Impaired | Acquired Non-impaired | Acquired Impaired | Acquired Non-impaired | ||||||||||||||||||||||||||||
Accretable Yield | Carrying Amount of Loans | Accretable Yield | Carrying Amount of Loans | Accretable Yield | Carrying Amount of Loans | Accretable Yield | Carrying Amount of Loans | ||||||||||||||||||||||||
| (In thousands) | (In thousands) | ||||||||||||||||||||||||||||||
| Balance at beginning of period | $ | 78,277 | $ | 138,091 | $ | 17,263 | $ | 157,856 | $ | 50,902 | $ | 74,953 | $ | 23,789 | $ | 213,423 | |||||||||||||||
| Additions | — | — | — | — | 43,299 | 107,946 | — | — | |||||||||||||||||||||||
| Reclassification from nonaccretable balance, net | 10,186 | (2,069 | ) | — | — | 17,850 | — | — | — | ||||||||||||||||||||||
| Accretion | (23,929 | ) | 23,929 | (7,004 | ) | 7,004 | (33,774 | ) | 33,774 | (6,526 | ) | 6,526 | |||||||||||||||||||
| Transfers to REO | — | (8,943 | ) | — | — | — | (11,196 | ) | — | — | |||||||||||||||||||||
| Payments received, net | — | (72,953 | ) | — | (66,438 | ) | — | (67,386 | ) | — | (62,093 | ) | |||||||||||||||||||
| Balance at end of period | $ | 64,534 | $ | 78,055 | $ | 10,259 | $ | 98,422 | $ | 78,277 | $ | 138,091 | $ | 17,263 | $ | 157,856 | |||||||||||||||
At September 30, 2014 and September 30, 2013, none of the acquired impaired or non-impaired loans were classified as non-performing assets. Therefore, interest income, through accretion of the difference between the carrying amount of the loans and the expected cash flows, was recognized on all acquired loans. The allowance for credit losses related to the acquired loans results from decreased expectations of future cash flows due to increased credit losses for certain acquired pools.
The outstanding principal balance of acquired loans was $213,203,000 and $362,248,000 as of September 30, 2014 and September 30, 2013, respectively. The discount balance related to the acquired loans was $34,483,000 and $66,301,000 as of September 30, 2014 and September 30, 2013, respectively.
The FDIC loss share agreement for the commercial loans acquired from Horizon Bank are expiring after 5 years in the quarter ending March 31, 2015. The FDIC loss share agreement for the commercial loans that SVBT had previously acquired will expire in the quarter ending September 30, 2015. The FDIC loss share agreements for the residential loans in these portfolios are 10 year agreements, so they will continue. When FDIC loss share agreements expire, any remaining loans will be transferred to the non covered portfolio.
The following table shows the year to date activity for the FDIC indemnification asset:
| September 30, 2014 | September 30, 2013 | ||||||
| (In thousands) | |||||||
| Balance at beginning of period | $ | 64,615 | $ | 87,571 | |||
| Additions | 1,795 | 18,101 | |||||
| Payments received | (2,502 | ) | (13,421 | ) | |||
| Amortization | (27,850 | ) | (28,722 | ) | |||
| Accretion | 802 | 1,086 | |||||
| Balance at end of period | $ | 36,860 | $ | 64,615 | |||
72
WASHINGTON FEDERAL, INC. AND SUBSIDIARIES
NOTES TO THE CONSOLIDATED FINANCIAL STATEMENTS
YEARS ENDED SEPTEMBER 30, 2014, 2013 AND 2012
The following tables provide information on covered loans based on credit quality indicators (defined in Note A) as of September 30, 2014:
| Internally Assigned Grade | Total Net Loans | ||||||||||||||||||||||
| Pass | Special mention | Substandard | Doubtful | Loss | |||||||||||||||||||
| (In thousands) | |||||||||||||||||||||||
| Purchased non-credit impaired loans: | |||||||||||||||||||||||
| Single-family residential | $ | 21,311 | $ | — | $ | 1,756 | $ | — | $ | — | $ | 23,067 | |||||||||||
| Construction - speculative | — | — | — | — | — | — | |||||||||||||||||
| Construction - custom | — | — | — | — | — | — | |||||||||||||||||
| Land - acquisition & development | 972 | — | 392 | — | — | 1,364 | |||||||||||||||||
| Land - consumer lot loans | 73 | — | — | — | — | 73 | |||||||||||||||||
| Multi-family | 6,598 | — | — | — | — | 6,598 | |||||||||||||||||
| Commercial real estate | 26,940 | 115 | 24,281 | — | — | 51,336 | |||||||||||||||||
| Commercial & industrial | 2,801 | — | 2,691 | — | — | 5,492 | |||||||||||||||||
| HELOC | 11,777 | — | — | — | — | 11,777 | |||||||||||||||||
| Consumer | 454 | — | — | — | — | 454 | |||||||||||||||||
| 70,926 | 115 | 29,120 | — | — | 100,161 | ||||||||||||||||||
| Total grade as a % of total net loans | 70.8 | % | 0.1 | % | 29.1 | % | — | % | — | % | |||||||||||||
| Purchased credit impaired loans: | |||||||||||||||||||||||
| Pool 1 - Construction and land A&D | 8,349 | — | 11,912 | — | — | 20,261 | |||||||||||||||||
| Pool 2 - Single-family residential | 15,585 | — | 379 | — | — | 15,964 | |||||||||||||||||
| Pool 3 - Multi-family | 52 | — | 471 | — | — | 523 | |||||||||||||||||
| Pool 4 - HELOC & other consumer | 2,804 | — | 1,173 | — | — | 3,977 | |||||||||||||||||
| Pool 5 - Commercial real estate | 33,909 | 700 | 29,782 | — | — | 64,391 | |||||||||||||||||
| Pool 6 - Commercial & industrial | 3,509 | — | 3,892 | 525 | — | 7,926 | |||||||||||||||||
| $ | 64,208 | $ | 700 | $ | 47,609 | $ | 525 | $ | — | $ | 113,042 | ||||||||||||
| Total covered loans | 213,203 | ||||||||||||||||||||||
| Discount | (34,483 | ) | |||||||||||||||||||||
| Allowance | $ | (2,244 | ) | ||||||||||||||||||||
| Covered loans, net | $ | 176,476 | |||||||||||||||||||||
73
WASHINGTON FEDERAL, INC. AND SUBSIDIARIES
NOTES TO THE CONSOLIDATED FINANCIAL STATEMENTS
YEARS ENDED SEPTEMBER 30, 2014, 2013 AND 2012
The following table provides an analysis of the payment status of purchased non-credit impaired loans in past due status for the period ended September 30, 2014.
Amount of Loans Net of LIP & Chg.-Offs | Days Delinquent Based on $ Amount of Loans | % based on $ | ||||||||||||||||||||||||
| Type of Loans | Current | 30 | 60 | 90 | Total | |||||||||||||||||||||
| (In thousands) | ||||||||||||||||||||||||||
| Single-family residential | $ | 23,067 | $ | 22,391 | $ | 230 | $ | 40 | $ | 406 | $ | 676 | 2.93 | % | ||||||||||||
| Construction - speculative | — | — | — | — | — | — | NM | |||||||||||||||||||
| Construction - custom | — | — | — | — | — | — | NM | |||||||||||||||||||
| Land - acquisition & development | 1,364 | 1,328 | — | — | 36 | 36 | 2.64 | % | ||||||||||||||||||
| Land - consumer lot loans | 73 | 73 | — | — | — | — | — | % | ||||||||||||||||||
| Multi-family | 6,598 | 5,502 | — | — | 1,096 | 1,096 | 16.61 | % | ||||||||||||||||||
| Commercial real estate | 51,336 | 51,336 | — | — | — | — | — | % | ||||||||||||||||||
| Commercial & industrial | 5,492 | 5,492 | — | — | — | — | — | % | ||||||||||||||||||
| HELOC | 11,777 | 11,777 | — | — | — | — | — | % | ||||||||||||||||||
| Consumer | 454 | 443 | 11 | — | — | 11 | 2.42 | % | ||||||||||||||||||
| $ | 100,161 | $ | 98,342 | $ | 241 | $ | 40 | $ | 1,538 | $ | 1,819 | 1.82 | % | |||||||||||||
74
MANAGEMENT'S REPORT ON INTERNAL CONTROL OVER FINANCIAL REPORTING
The management of Washington Federal, Inc. ("the Company") is responsible for establishing and maintaining adequate internal control over financial reporting. The Company's internal control system was designed to provide reasonable assurance to the Company's management and Board of Directors regarding the preparation and fair presentation of published financial statements.
The Company's management assessed the effectiveness of the Company's internal control over financial reporting as of September 30, 2014. In making this assessment, the Company's management used the criteria set forth by the Committee of Sponsoring Organizations of the Treadway Commission (COSO) in the 1992 version of its Internal Control-Integrated Framework. Based on its assessment, the Company's management believes that as of September 30, 2014, the Company's internal control over financial reporting was effective based on those criteria.
The Company's independent auditors, Deloitte & Touche LLP, an independent registered public accounting firm, have issued an audit report on the Company's internal control over financial reporting and their report follows.
November 25, 2014
Roy M. Whitehead
Chairman, President and
Chief Executive Officer

Diane L. Kelleher
Senior Vice President and
Chief Financial Officer
75
REPORT OF INDEPENDENT REGISTERED PUBLIC ACCOUNTING FIRM
To the Board of Directors and Stockholders of
Washington Federal, Inc.
Seattle, Washington
We have audited the accompanying consolidated statements of financial condition of Washington Federal, Inc. and subsidiaries (the “Company”) as of September 30, 2014 and 2013, and the related consolidated statements of operations, comprehensive income, stockholders' equity, and cash flows for each of the three years in the period ended September 30, 2014. These consolidated financial statements are the responsibility of the Company's management. Our responsibility is to express an opinion on these consolidated financial statements based on our audits.
We conducted our audits in accordance with the standards of the Public Company Accounting Oversight Board (United States). Those standards require that we plan and perform the audit to obtain reasonable assurance about whether the financial statements are free of material misstatement. An audit includes examining, on a test basis, evidence supporting the amounts and disclosures in the financial statements. An audit also includes assessing the accounting principles used and significant estimates made by management, as well as evaluating the overall financial statement presentation. We believe that our audits provide a reasonable basis for our opinion.
In our opinion, such consolidated financial statements present fairly, in all material respects, the consolidated financial position of Washington Federal, Inc. and subsidiaries as of September 30, 2014 and 2013, and the results of their operations and their cash flows for each of the three years in the period ended September 30, 2014, in conformity with accounting principles generally accepted in the United States of America.
We have also audited, in accordance with the standards of the Public Company Accounting Oversight Board (United States), the Company's internal control over financial reporting as of September 30, 2014, based on the criteria established in Internal Control - Integrated Framework (1992) issued by the Committee of Sponsoring Organizations of the Treadway Commission and our report dated November 25, 2014 expressed an unqualified opinion on the Company's internal control over financial reporting.

Seattle, Washington
November 25, 2014
76
REPORT OF INDEPENDENT REGISTERED PUBLIC ACCOUNTING FIRM ON INTERNAL CONTROLS
To the Board of Directors and Stockholders of
Washington Federal, Inc.
Seattle, Washington
We have audited the internal control over financial reporting of Washington Federal, Inc. and subsidiaries (the “Company”) as of September 30, 2014, based on criteria established in Internal Control - Integrated Framework (1992) issued by the Committee of Sponsoring Organizations of the Treadway Commission. Because management’s assessment and our audit were conducted to meet the reporting requirements of Section 112 of the Federal Deposit Insurance Corporation Improvement Act (FDICIA), management’s assertion and our audit of the Company’s internal control over financial reporting included controls over the preparation of the schedules equivalent to the basic financial statements in accordance with the instructions for the Office of the Comptroller of the Currency Instructions for Call Reports for Balance Sheet on schedule RC, Income Statement on schedule RI, and Changes in Bank Equity Capital on schedule RI-A. The Company's management is responsible for maintaining effective internal control over financial reporting and for its assessment of the effectiveness of internal control over financial reporting, included in the accompanying Management Report’s on Internal Control Over Financial Reporting. Our responsibility is to express an opinion on the Company's internal control over financial reporting based on our audit.
We conducted our audit in accordance with the standards of the Public Company Accounting Oversight Board (United States). Those standards require that we plan and perform the audit to obtain reasonable assurance about whether effective internal control over financial reporting was maintained in all material respects. Our audit included obtaining an understanding of internal control over financial reporting, assessing the risk that a material weakness exists, testing and evaluating the design and operating effectiveness of internal control based on the assessed risk, and performing such other procedures as we considered necessary in the circumstances. We believe that our audit provides a reasonable basis for our opinion.
A company's internal control over financial reporting is a process designed by, or under the supervision of, the company's principal executive and principal financial officers, or persons performing similar functions, and effected by the company's board of directors, management, and other personnel to provide reasonable assurance regarding the reliability of financial reporting and the preparation of financial statements for external purposes in accordance with generally accepted accounting principles. A company's internal control over financial reporting includes those policies and procedures that (1) pertain to the maintenance of records that, in reasonable detail, accurately and fairly reflect the transactions and dispositions of the assets of the company; (2) provide reasonable assurance that transactions are recorded as necessary to permit preparation of financial statements in accordance with generally accepted accounting principles, and that receipts and expenditures of the company are being made only in accordance with authorizations of management and directors of the company; and (3) provide reasonable assurance regarding prevention or timely detection of unauthorized acquisition, use, or disposition of the company's assets that could have a material effect on the financial statements.
Because of the inherent limitations of internal control over financial reporting, including the possibility of collusion or improper management override of controls, material misstatements due to error or fraud may not be prevented or detected on a timely basis. Also, projections of any evaluation of the effectiveness of the internal control over financial reporting to future periods are subject to the risk that the controls may become inadequate because of changes in conditions, or that the degree of compliance with the policies or procedures may deteriorate.
In our opinion, the Company maintained, in all material respects, effective internal control over financial reporting as of September 30, 2014, based on the criteria established in Internal Control - Integrated Framework (1992) issued by the Committee of Sponsoring Organizations of the Treadway Commission.
We have not examined and, accordingly, we do not express an opinion or any other form of assurance on management's statement referring to compliance with laws and regulations.
We have also audited, in accordance with the standards of the Public Company Accounting Oversight Board (United States), the consolidated financial statements as of and for the year ended September 30, 2014, of the Company and our report dated November 25, 2014, expressed an unqualified opinion on those consolidated financial statements.
Seattle, Washington
November 25, 2014
77
Performance Graphs
The following graphs compare the cumulative total return to Washington Federal stockholders (stock price appreciation plus reinvested dividends) to the cumulative total return of the Nasdaq Stock Market Index (U.S. Companies) and the Nasdaq Financial Stocks Index for the five year period ended September 30, 2014 and since Washington Federal first became a publicly traded company on November 9, 1982, respectively. The graphs assume that $100 was invested on September 30, 2008 and November 9, 1982, respectively, in Washington Federal Common Stock, the Nasdaq Stock Market Index and the Nasdaq Financial Stocks Index, and that all dividends were reinvested. Management of Washington Federal cautions that the stock price performance shown in the graphs below should not be considered indicative of potential future stock price performance.
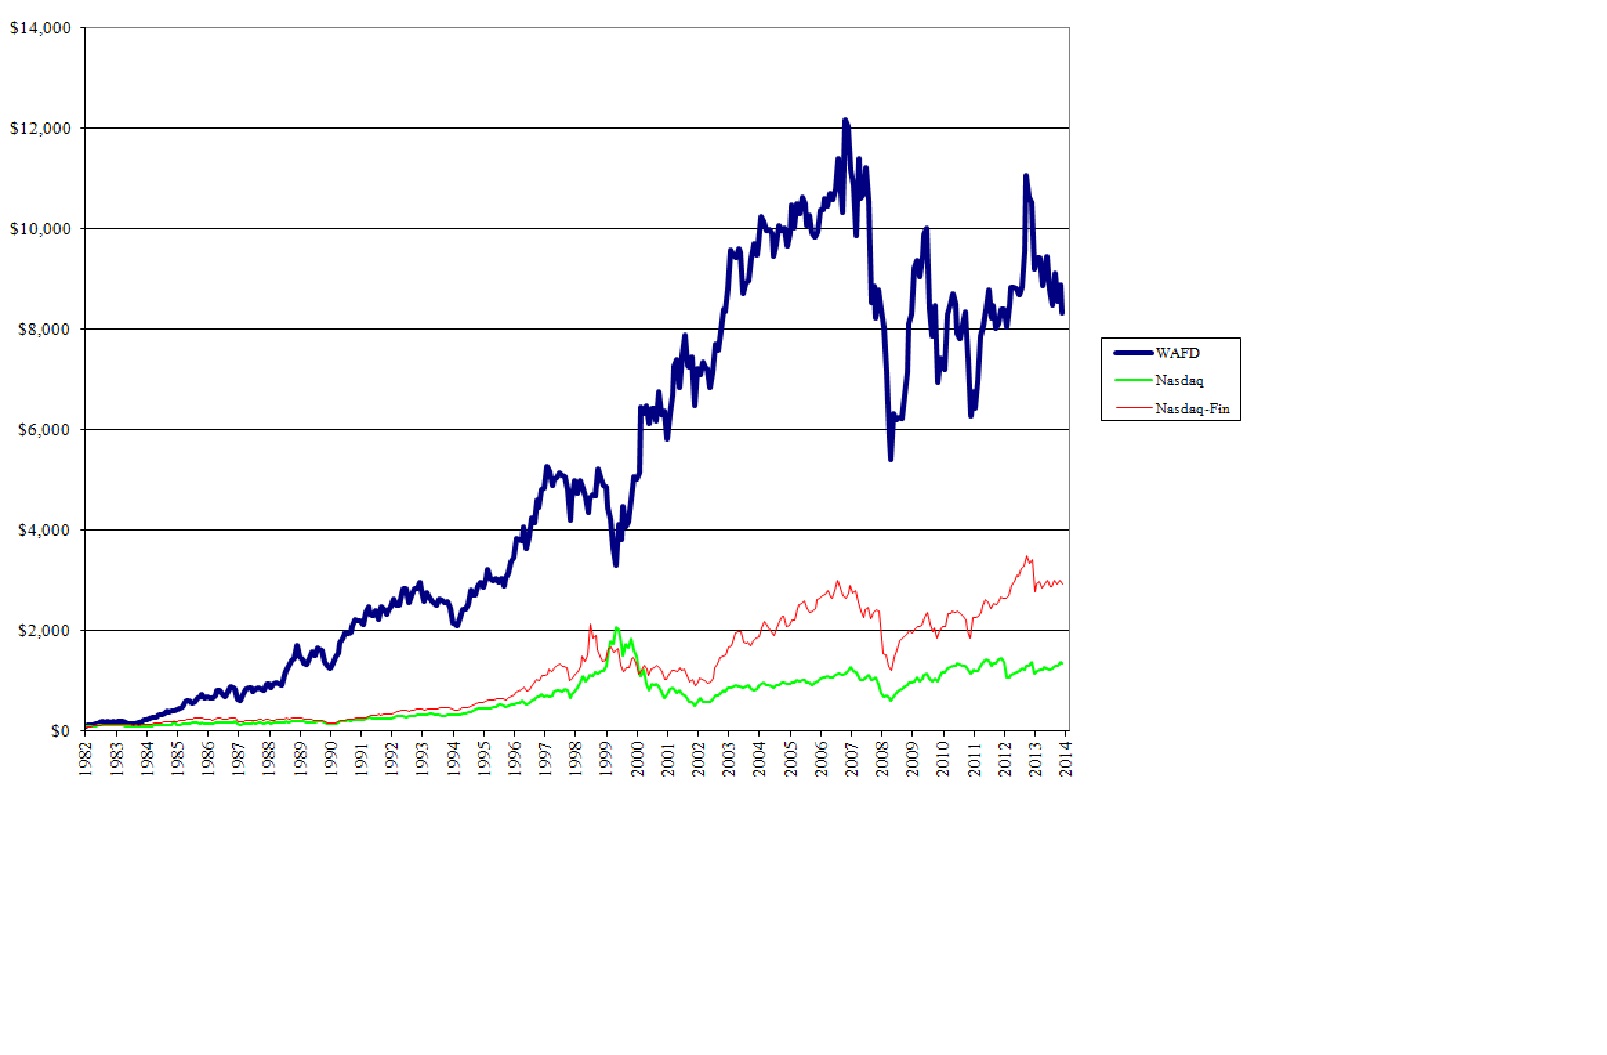
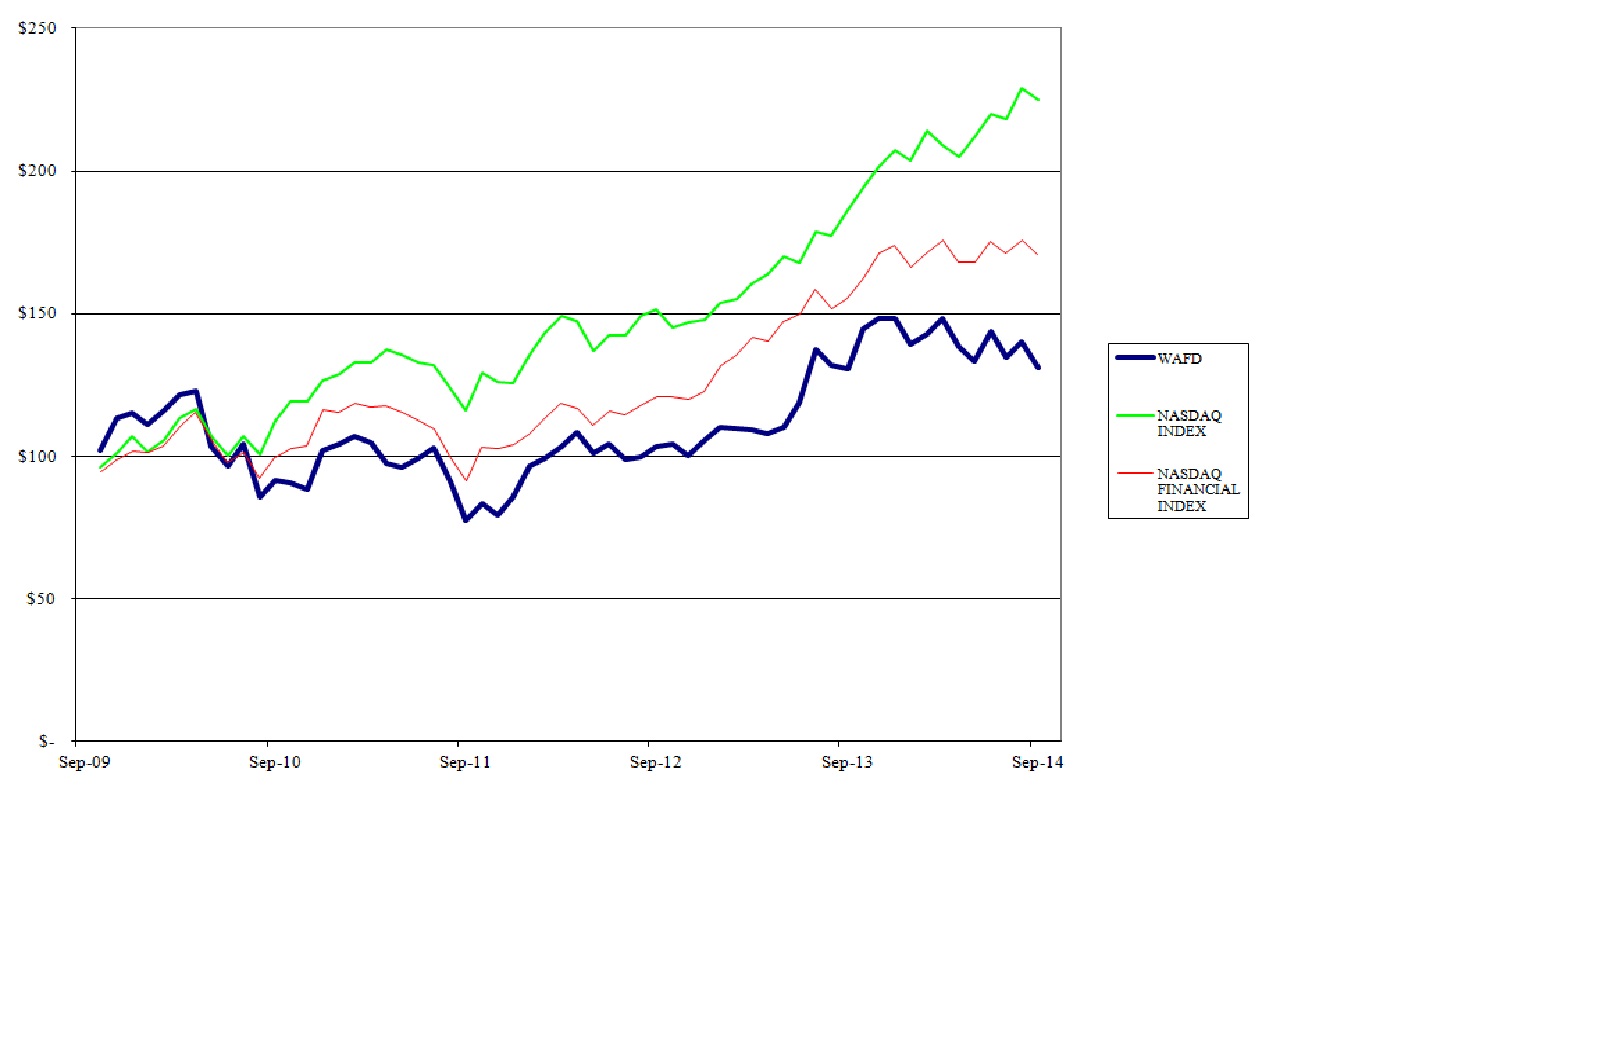
78
GENERAL CORPORATE AND
STOCKHOLDERS' INFORMATION
| Corporate | 425 Pike Street |
| Headquarters | Seattle, Washington 98101 |
(206) 624-7930
| Independent | Deloitte & Touche LLP |
| Auditors | Seattle, Washington |
| Transfer Agent, | Stockholder inquiries regarding transfer |
| Registrar and | requirements, cash or stock dividends, lost |
| Dividend | certificates, consolidating records, correcting |
| Disbursing | a name or changing an address should be |
| Agent | directed to the transfer agent: |
American Stock Transfer & Trust Company
59 Maiden Lane
Plaza Level
New York, NY 10038
Telephone: 1-888-888-0315
www.amstock.com
| Annual Meeting | The annual meeting of stockholders will be |
held on January 21, 2015, at 2 p.m., Pacific Time at
Benaroya Hall, 200 University Street,
Seattle, Washington 98101
| Form 10-K | To find out more about the Company, please visit our website. The Company uses its website to distribute financial and other material information about the Company. This report and all SEC filings of the Company are available through the Company's website: |
www.washingtonfederal.com
Stock
| Information | Washington Federal, Inc. is traded on the NASDAQ Global Select Market. The common stock symbol is WAFD. At September 30, 2014, there were approximately 1,740 stockholders of record. |
| Stock Prices | |||||||||
| Quarter Ended | High | Low | Dividends | ||||||
| December 31, 2012 | $ | 17.35 | $ | 15.77 | $ | 0.08 | |||
| March 31, 2013 | 18.20 | 16.96 | 0.09 | ||||||
| June 30, 2013 | 18.88 | 16.04 | 0.09 | ||||||
| September 30, 2013 | 22.58 | 19.52 | 0.10 | ||||||
| December 31, 2013 | 23.93 | 22.96 | 0.10 | ||||||
| March 31, 2014 | 24.12 | 22.13 | 0.10 | ||||||
| June 30, 2014 | 22.89 | 20.83 | 0.10 | ||||||
| September 30, 2014 | 22.51 | 20.36 | 0.11 | ||||||
Our Board of Directors' dividend policy is to review our financial performance, capital adequacy, regulatory compliance and cash resources on a quarterly basis, and, if such review is favorable, to declare and pay a cash dividend to shareholders.
79
DIRECTORS AND EXECUTIVE OFFICERS
| BOARD OF DIRECTORS | EXECUTIVE MANAGEMENT COMMITTEE | ||
ROY M. WHITEHEAD Chairman, President and Chief Executive Officer | ROY M. WHITEHEAD Chairman, President and Chief Executive Officer | ||
DAVID K. GRANT Managing Partner of Catalyst Storage Partners. Former Chief Executive Officer of Shurgard Storage Centers, Inc. | BRENT J. BEARDALL Executive Vice President and Chief Banking Officer | ||
ANNA C. JOHNSON Senior Partner Scan East West Travel | LINDA S. BROWER Executive Vice President Administration | ||
THOMAS J. KELLEY Retired Partner, Arthur Andersen LLP | EDWIN C. HEDLUND Executive Vice President Mortgage & Consumer Lending and Corporate Secretary | ||
LIANE J. PELLETIER Former Chief Executive Officer, President and Chairman of Alaska Communications | JACK B. JACOBSON Executive Vice President Commercial Real Estate | ||
BARBARA L. SMITH, PhD. Owner, B. Smith Consulting Group | THOMAS E. KASANDERS Executive Vice President Business Banking | ||
MARK N. TABBUTT Chairman of Saltchuk Resources | MARK A. SCHOONOVER Executive Vice President Chief Credit Officer | ||
RANDALL H. TALBOT Managing Director of Talbot Financial, LLC. Former President, Chief Executive Officer and Director of Symetra Financial Corporation, Inc. | ANGELA D. VEKSLER Executive Vice President Chief Information Officer | ||
DIANE L. KELLEHER Senior Vice President Chief Financial Officer | |||
| DIRECTOR EMERITUS | |||
| W. ALDEN HARRIS | |||
80