
Annual Shareholder Meeting February 14, 2023

Executive Management Committee 2 Kelli Holz EVP, Chief Financial Officer Brent Beardall President and Chief Executive Officer Ryan Mauer EVP, Chief Credit Officer Cathy Cooper EVP, Chief Consumer Banker Kim Robison EVP, Chief Operating Officer James Endrizzi EVP, Chief Commercial Banker
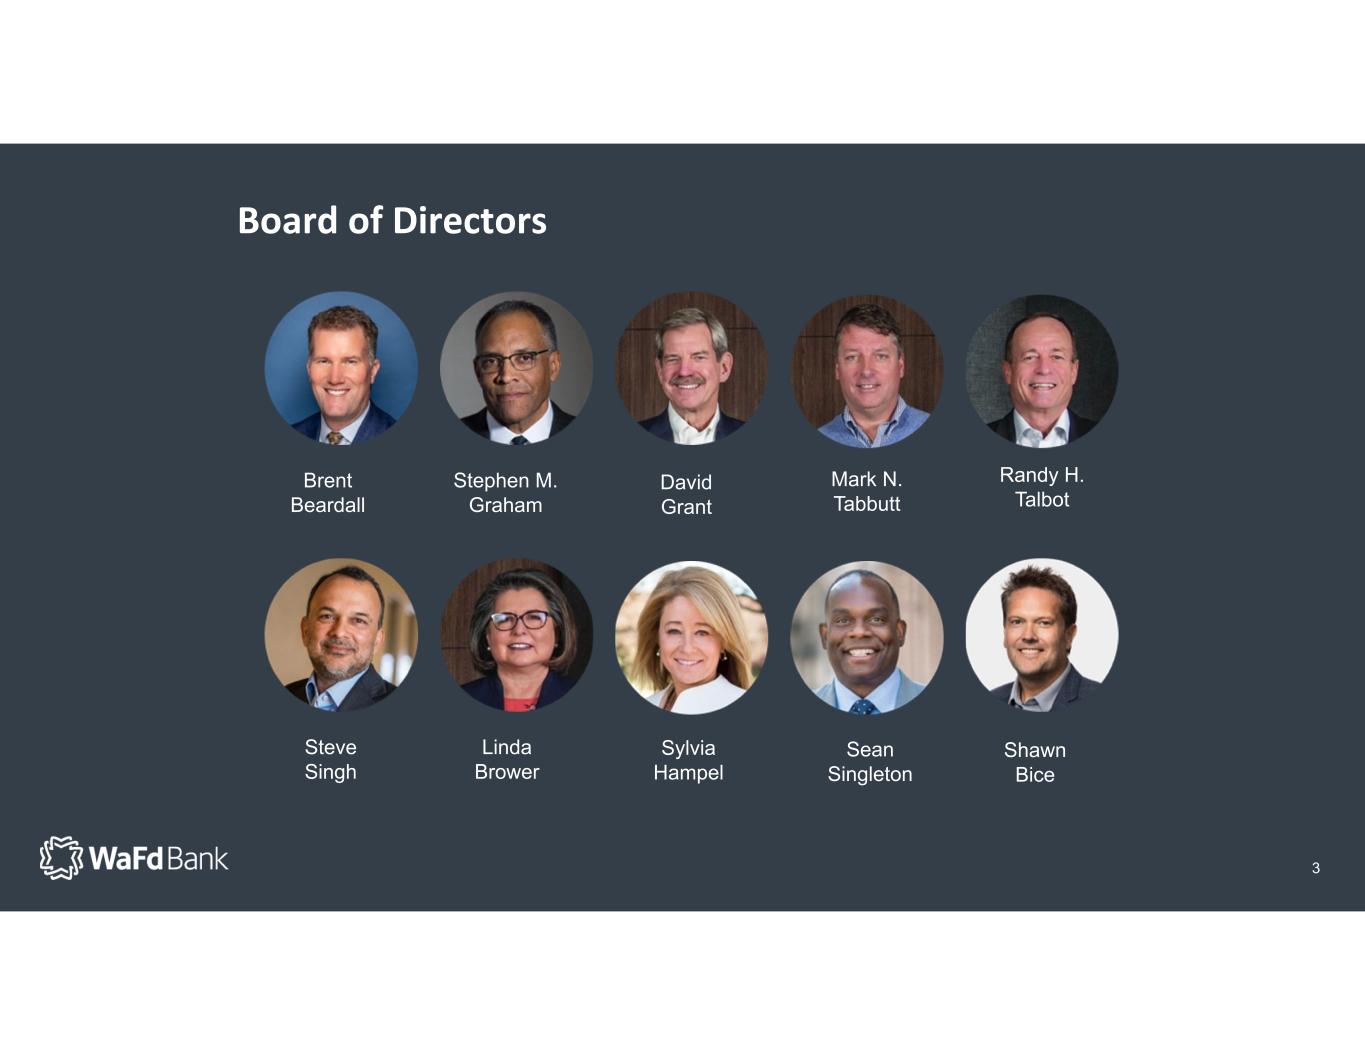
Board of Directors Brent Beardall Stephen M. Graham David Grant Mark N. Tabbutt Randy H. Talbot Steve Singh Linda Brower Sylvia Hampel Sean Singleton Shawn Bice 3
4 The annual report and proxy are at www.wafdbank.com or request a physical copy by emailing info@wafd.com . Anyone who wishes to revoke their proxy or who hasn’t voted must click on the “Vote Now” screen during this meeting prior to closing of the polls. Have your 16‐digit control number handy. If you have already voted, you do not need to vote again. There are approximately 65.4 million shares entitled to vote at this meeting. Notice was mailed to each stockholder of record as of December 12, 2022; this meeting is therefore lawfully convened. 2023 Annual Meeting Business 4
5 1. To elect three directors for a three‐year term ending in 2026, or until their successors are elected and qualified; 2. To consider and approve the Non‐Qualified Employee Stock Purchase Plan and to authorize for issuance under the plan a total of 500,000 shares of WaFd common stock; 3. To consider and approve Amendment No. 1 to the WaFd Bank Deferred Compensation Plan 4. To approve, by a non‐binding advisory vote, the compensation of the Named Executive Officers of the Company; 5. To ratify the appointment of Deloitte & Touche LLP as the Company's independent registered public accountants for fiscal year 2023. 2023 Annual Meeting Business 5
Highlights for Fiscal 2022 Record loan production of over $8.7 billion Superb asset quality – highlighted by nine consecutive years of net recoveries Total deposits of $16.0 billion – weighted average rate of 0.51% 9.5% Growth in tangible book value per share Record Earnings to common shareholders of $222 million Earnings per share growth of 41.8% 6

Asset Mix 7
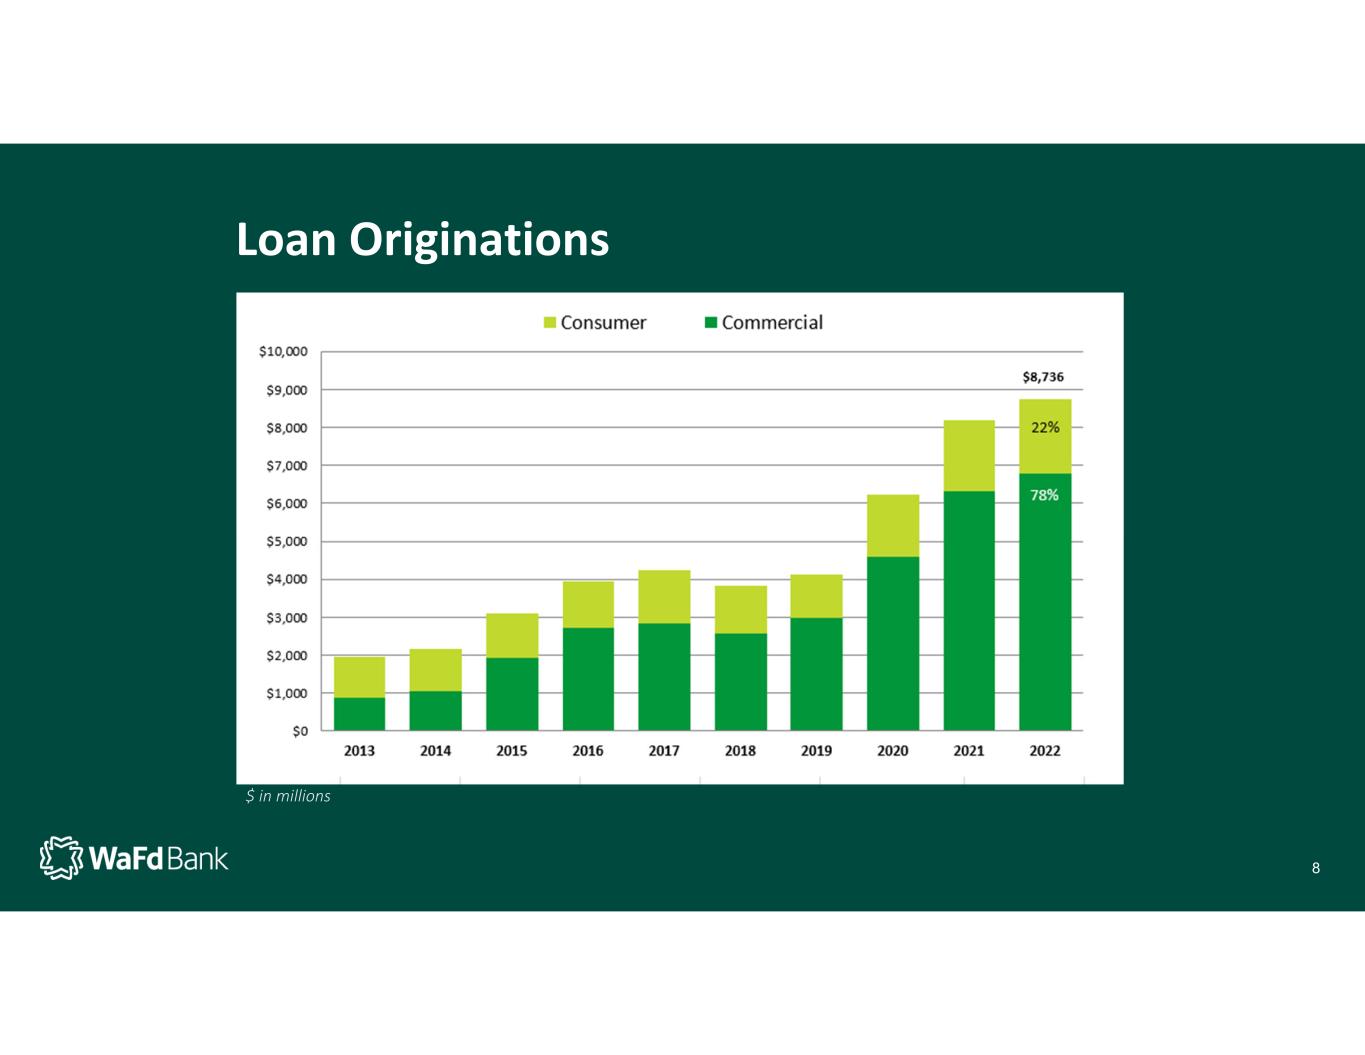
Loan Originations $ in millions 8
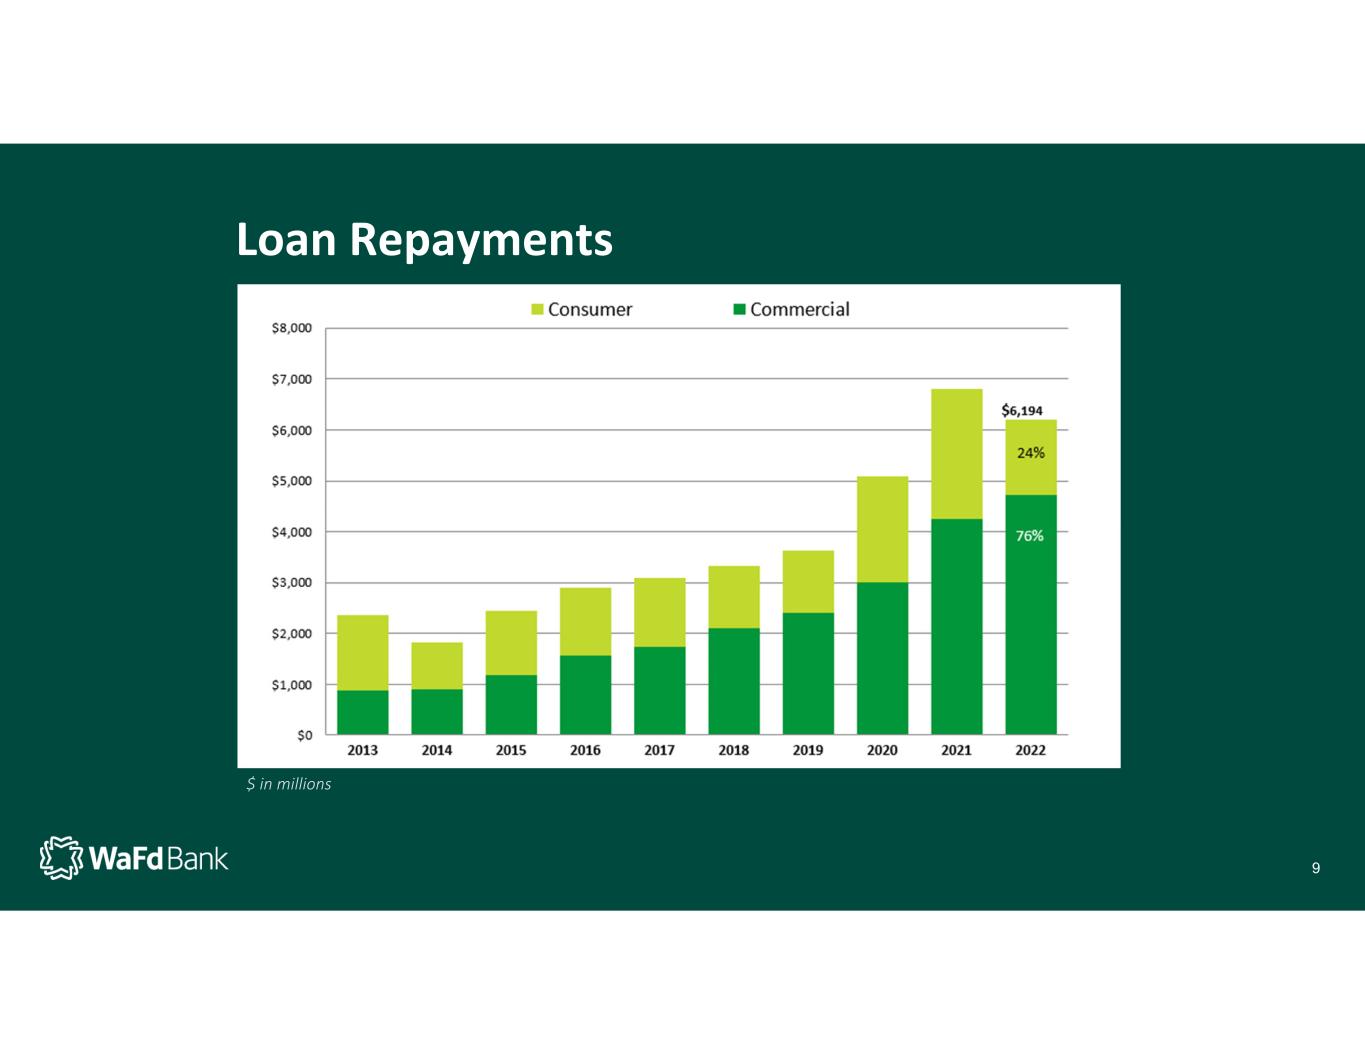
Loan Repayments $ in millions 9
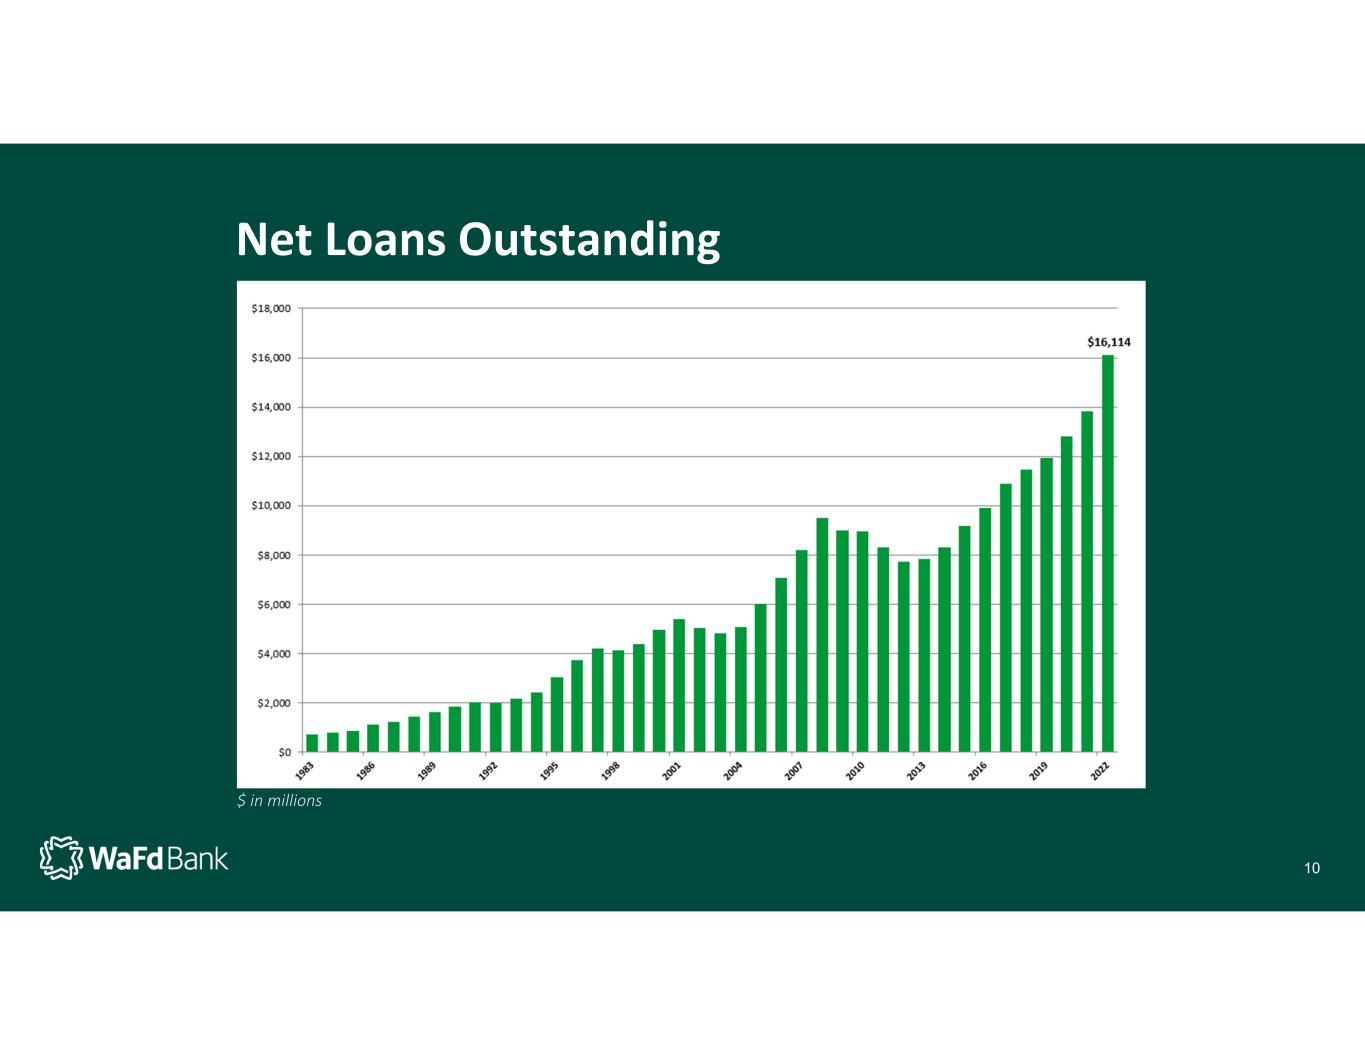
Net Loans Outstanding $ in millions 10

Net Loan Charge‐Offs (Recoveries) ($ in millions) $ in millions 11

Non‐Performing Assets Near Record Lows We have retained a strong ACL while NPAs have declined since 2010 • ACL at 9/30/2022 amounted to $172.8 million, representing 388% of total NPAs 1 • Non‐performing assets $44.5 million as of 9/30/2022 • Delinquent Loans $27 million or 0.17% of Net Loans as of 9/30/2022 Non‐Performing Assets to Total Assets and ACL to Total Loans 1 3.22% 2.76% 2.18% 1.63% 1.00% 0.88% 0.48% 0.46% 0.44% 0.27% 0.20% 0.22% 0.21% 1.79% 1.85% 1.69% 1.47% 1.36% 1.15% 1.13% 1.12% 1.11% 1.09% 1.29% 1.22% 1.06% FY 2010 FY 2011 FY 2012 FY 2013 FY 2014 FY 2015 FY 2016 FY 2017 FY 2018 FY 2019 FY 2020 FY 2021 FY 2022 Non‐Performing Assets to Total Assets ACL to Total Loans For Fiscal Year End 9/30 1 ACL to Total Loans does not include ACL related to unfunded commitments of $32.5 million. 2 Effective October 1, 2020, the Company implemented FASB’s Current Expected Credit Loss (CECL) Standard 12
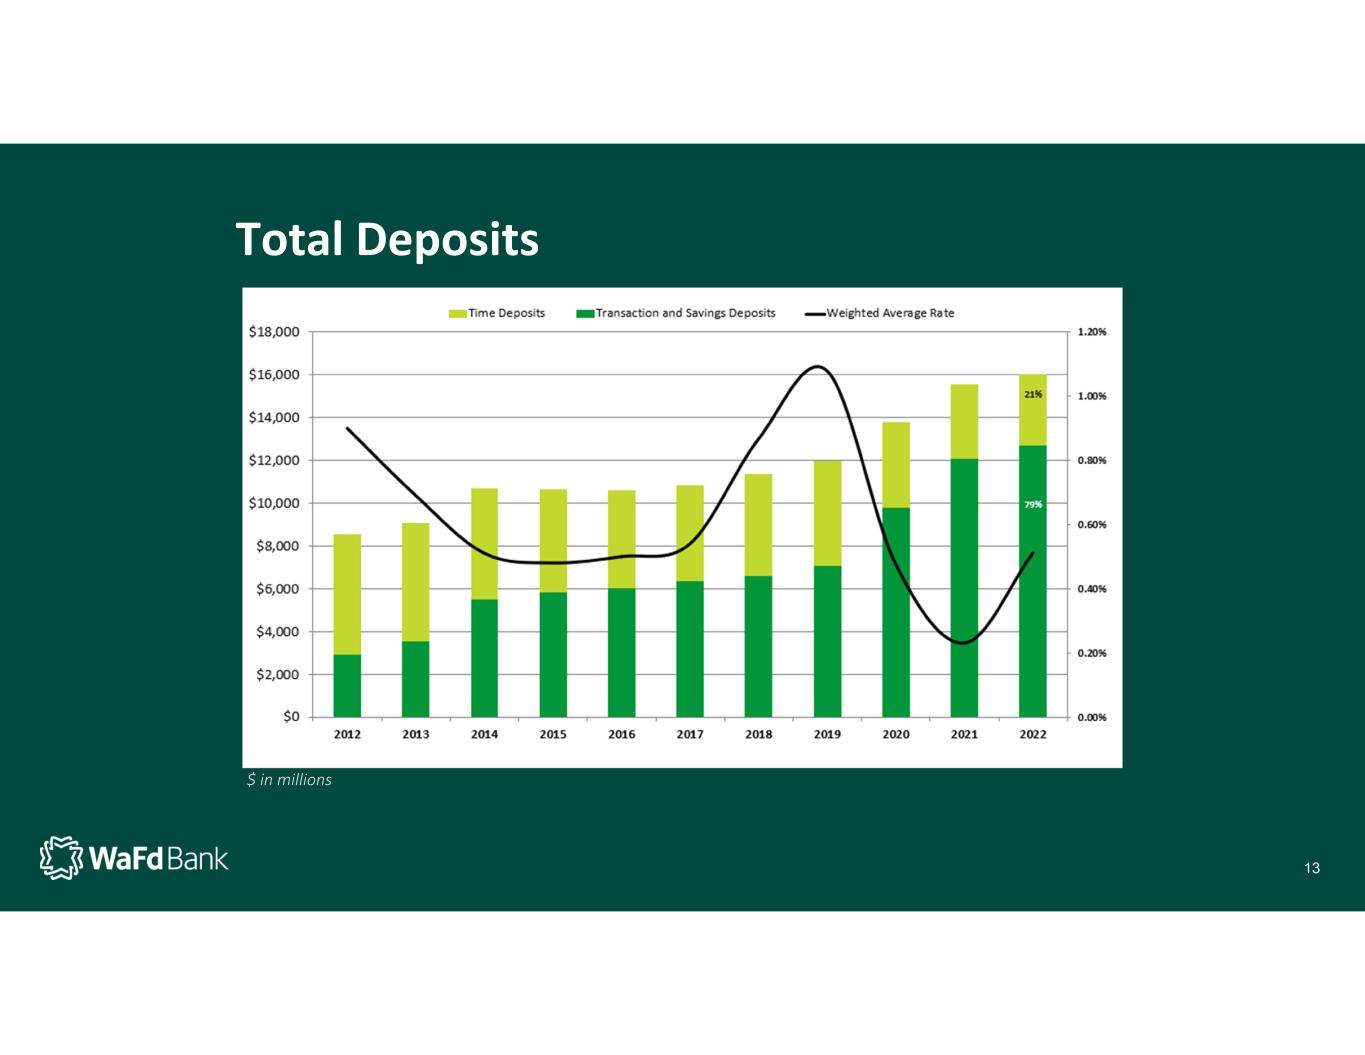
Total Deposits $ in millions 13
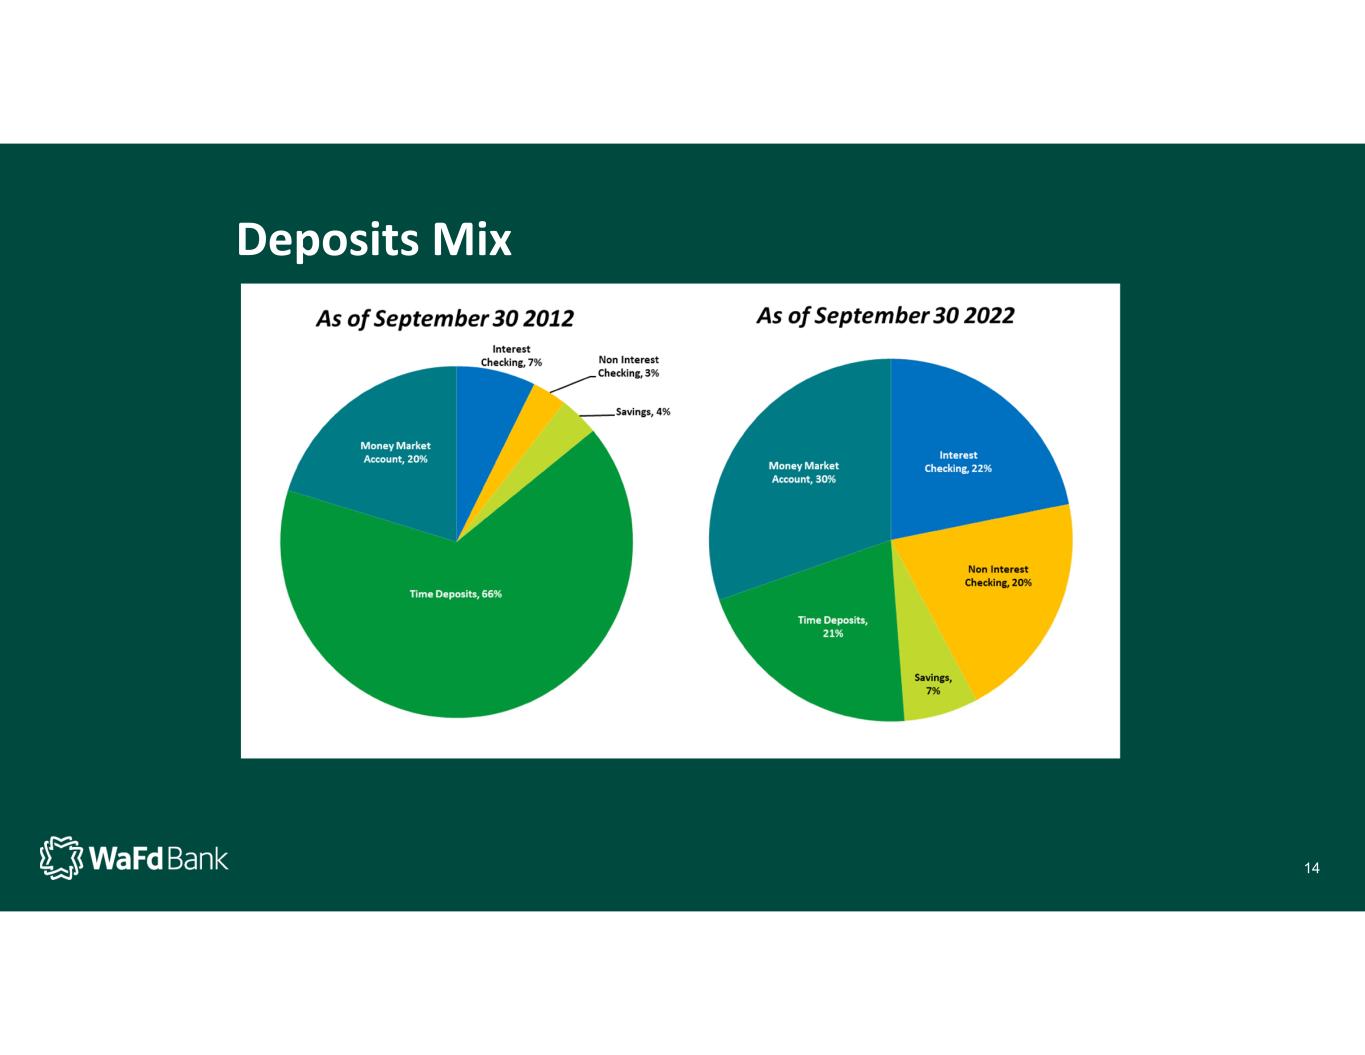
Deposits Mix 14
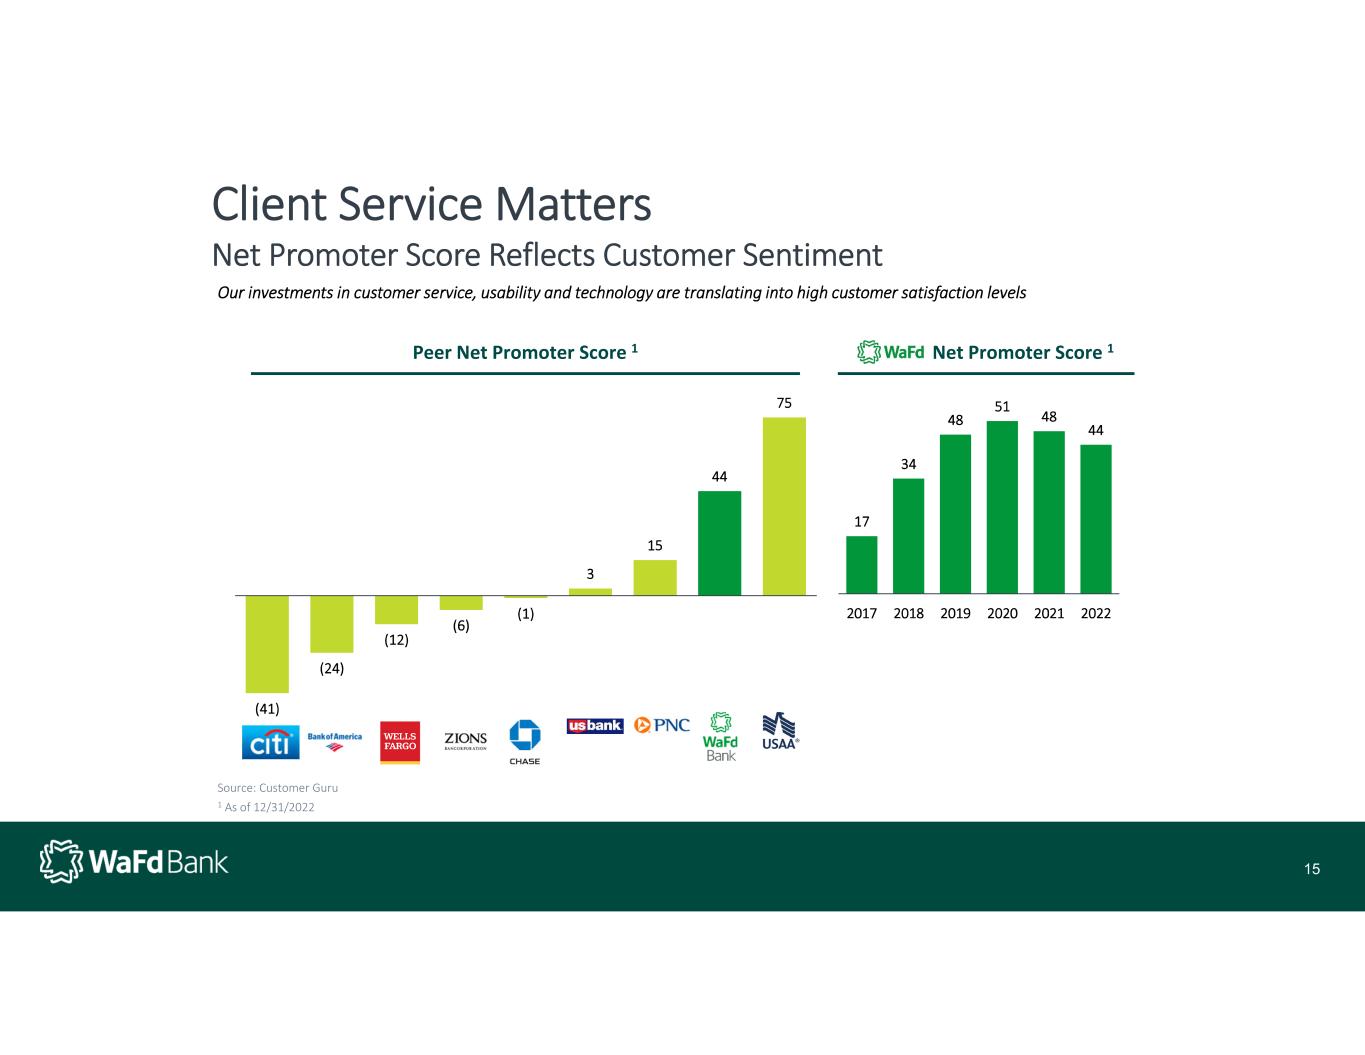
(41) (24) (12) (6) (1) 3 15 44 75 Client Service Matters Net Promoter Score Reflects Customer Sentiment 15 Our investments in customer service, usability and technology are translating into high customer satisfaction levels Source: Customer Guru WaFdaa Net Promoter Score 1 17 34 48 51 48 44 2017 2018 2019 2020 2021 2022 Peer Net Promoter Score 1 1 As of 12/31/2022 15

Capital Ratios WaFd Bank does not seek to maximize leverage. Rather, we aspire to be a bank that can weather the storm that will inevitably come. Consistency, in good times and bad, is a differentiator. Tier 1 (Core) Leverage Common Equity Tier 1 Risk Based Tier 1 Risk Based Total Risk‐Based Wafd Bank at 9/30/22 8.86% 10.89% 10.89% 12.14% Well Capitalized Requirement 5.00% 6.50% 8.00% 10.00% Excess (Shortfall) 3.86% 4.39% 2.89% 2.14% Current Capital levels exceed the regulatory capital requirements s of 9/30/2022 16
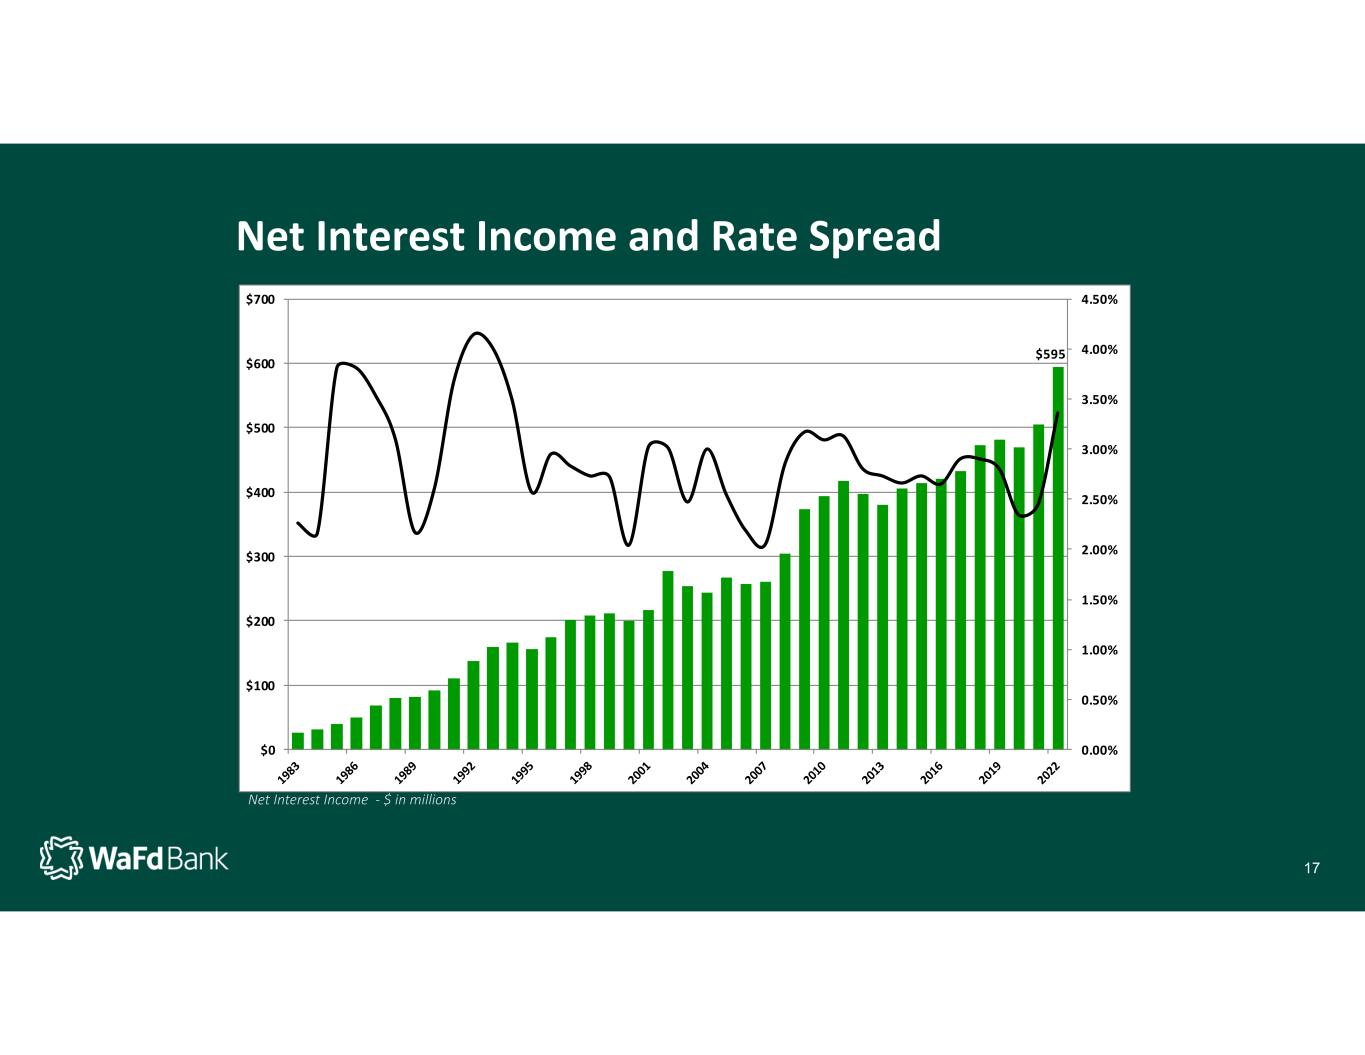
Net Interest Income and Rate Spread Net Interest Income ‐ $ in millions $595 0.00% 0.50% 1.00% 1.50% 2.00% 2.50% 3.00% 3.50% 4.00% 4.50% $0 $100 $200 $300 $400 $500 $600 $700 17

Operating Expenses 18

Earnings Per Common Share $0.46 $2.61 $3.39 $0.00 $0.50 $1.00 $1.50 $2.00 $2.50 $3.00 $3.50 $4.00 19
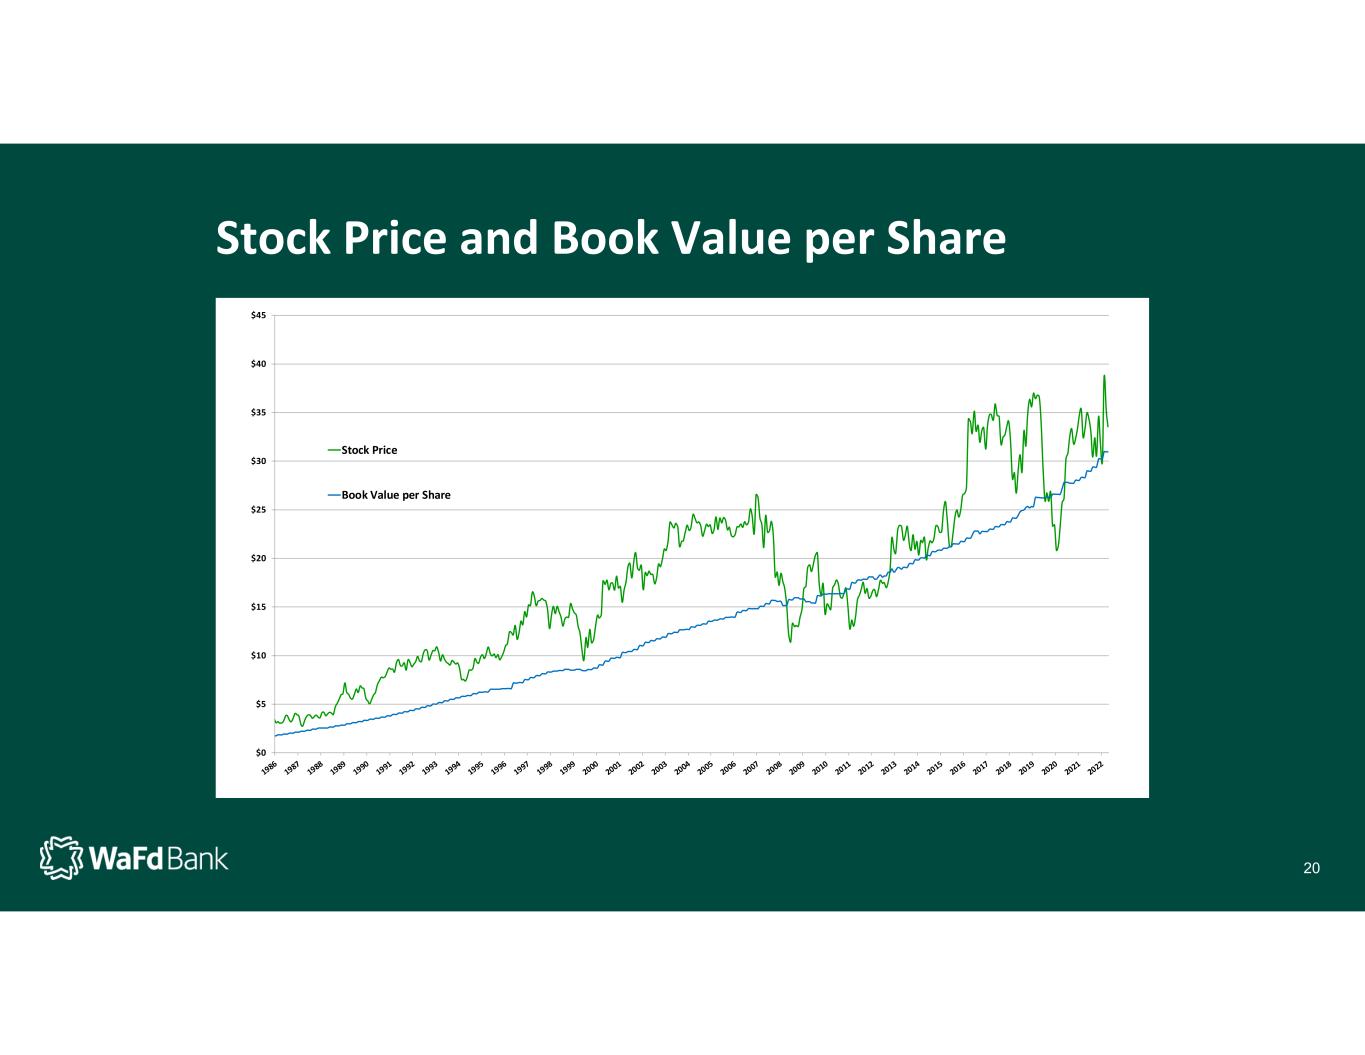
Stock Price and Book Value per Share $0 $5 $10 $15 $20 $25 $30 $35 $40 $45 Stock Price Book Value per Share 20

40 Years Since IPO in 1982 Total Shareholder Return > 33,000%, as of 10/31/2022 21
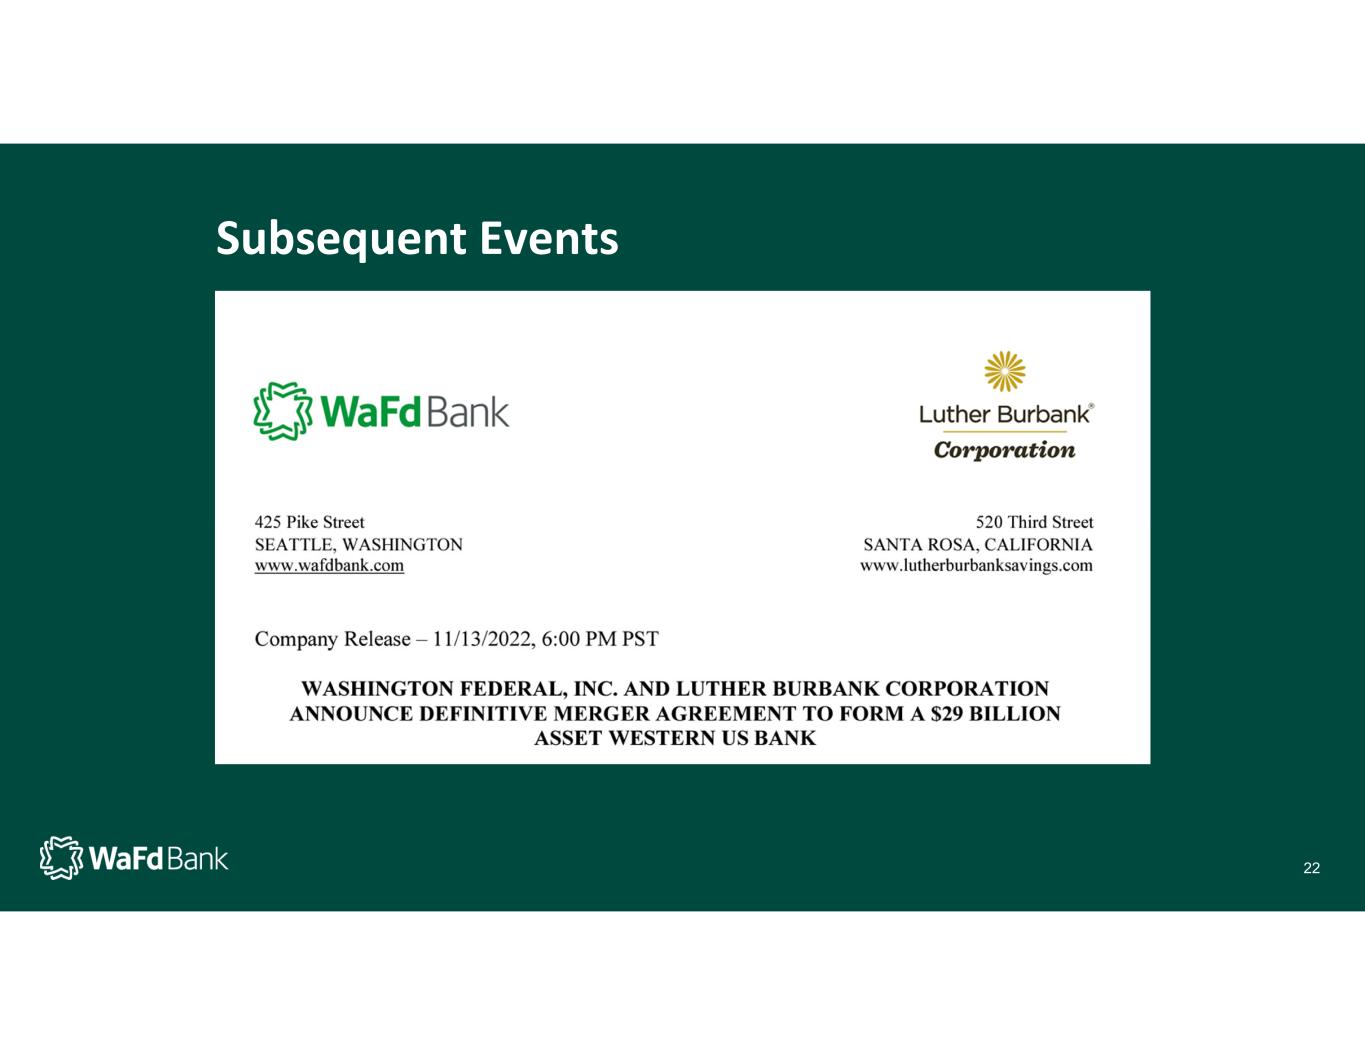
Subsequent Events 22
What To Expect in 2023? Challenging environment given the rapid increase in rates and current inverted yield curve Intentionally slowing growth Build on our momentum… “culture of regulatory compliance” Do the little things the big banks are not doing to serve clients Launch Voice authentication of consumer wire transfers Back‐office automation initiative Branch optimization continues Integrate and leverage the Luther Burbank franchise 23

Thank you to both our clients and the 2,100 bankers that made these results possible. We believe our future is as bright today as it has ever been. 24

Q&A Please type your questions in the chat window.

Thank you. Enjoy 2023.


