Exhibit 13

TABLE OF CONTENTS
A SHORT HISTORY
Washington Federal, Inc. (Company or Washington Federal) is a savings and loan holding company headquartered in Seattle, Washington. Its principal subsidiary is Washington Federal Savings, which operates 122 offices in seven western states.
The Company had its origin on April 24, 1917 as Ballard Savings and Loan Association. In 1935, the state-chartered Company converted to a federal charter, became a member of the Federal Home Loan Bank (FHLB) system and obtained federal insurance. In 1958, Ballard Federal Savings and Loan Association merged with Washington Federal Savings and Loan Association of Bothell, and the latter name was retained for wider geographical acceptance. In 1971, Seattle Federal Savings and Loan Association, with three offices, merged into the Company, and at the end of 1978, was joined by the 10 offices of First Federal Savings and Loan Association of Mount Vernon.
On November 9, 1982, the Company converted from a federal mutual to a federal stock association. In 1987 and 1988, acquisitions of United First Federal, Provident Federal Savings and Loan, and Northwest Federal Savings and Loan, all headquartered in Boise, Idaho, added 28 Idaho offices to the Company. In 1988, the acquisition of Freedom Federal Savings and Loan Association in Corvallis, Oregon added 13 Oregon offices, followed in 1990 by the eight Oregon offices of Family Federal Savings.
In 1991, the Company added three branches with the acquisition of First Federal Savings and Loan Association of Idaho Falls, Idaho, and acquired the deposits of First Western Savings Association of Las Vegas, Nevada, in Portland and Eugene, Oregon, where they were doing business as Metropolitan Savings Association. In 1993, 10 branches were added with the acquisition of First Federal Savings Bank of Salt Lake City, Utah. In 1994, the Company expanded into Arizona.
In 1995, the stockholders approved a reorganization whereby Washington Federal Savings became a wholly owned subsidiary of a newly formed holding company, Washington Federal, Inc. That same year, the Company purchased West Coast Mutual Savings Bank with its one branch in Centralia, Washington, and opened six additional branches. In 1996, the Company acquired Metropolitan Bancorp of Seattle, adding eight offices in Washington in addition to opening four branches in existing markets. Between 1997 and 1999, Washington Federal Savings continued to develop its branch network, opening a total of seven branches and consolidating three offices into existing locations.
In 2000, the Company expanded into Las Vegas, opening its first branch in Nevada along with two branches in Arizona. In 2001, the Company opened two additional branches in Arizona and its first branch in Texas with an office in the Park Cities area of Dallas. In 2002, Washington Federal Savings opened five full-service branches in existing markets. In 2003, the Company purchased United Savings and Loan Bank with its four branches in the Seattle metropolitan area, added one new branch in Puyallup, Washington and consolidated one branch in Nampa, Idaho. In 2004, the Company consolidated two branches in Mount Vernon, Washington into one and opened branches in Plano, Texas and West Bend, Oregon. In 2005, the Company opened locations in Klamath Falls, Oregon, Richardson, Texas and another in Las Vegas, Nevada.
The Company obtains its funds primarily through savings deposits from the general public, from repayments of loans, borrowings and retained earnings. These funds are used largely to make first lien loans to borrowers for the purchase of new and existing homes, the acquisition and development of land for residential lots, the construction of homes, the financing of small multi-family housing units, and for investment in obligations of the U.S. government, its agencies and municipalities.

FINANCIAL HIGHLIGHTS
| | | | | | | | | | | |
| September 30, | | 2005 | | | 2004 | | | % Change | |
| | | (In thousands, except per share data) | |
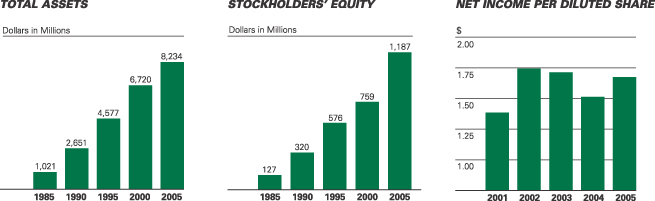
Assets | | $ | 8,234,450 | | | $ | 7,169,205 | | | +15 | % |
Cash and cash equivalents | | | 637,791 | | | | 508,361 | | | +25 | |
Investment securities | | | 214,993 | | | | 414,683 | | | –48 | |
Loans receivable and securitized assets subject to repurchase, net | | | 6,008,932 | | | | 5,093,443 | | | +18 | |
Mortgage-backed securities | | | 1,075,342 | | | | 641,215 | | | +68 | |
Customer accounts | | | 5,031,505 | | | | 4,610,358 | | | +9 | |
FHLB advances and other borrowings | | | 1,885,000 | | | | 1,300,000 | | | +45 | |
Stockholders’ equity | | | 1,187,308 | | | | 1,120,188 | | | +6 | |
Net income | | | 145,889 | | | | 131,868 | | | +11 | |
Diluted earnings per share | | | 1.67 | | | | 1.51 | | | +11 | |
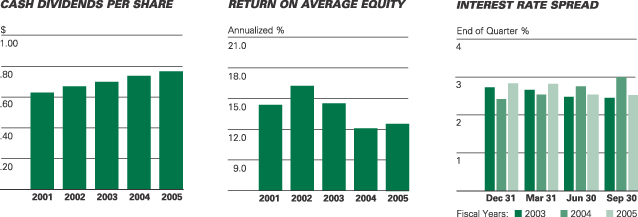
Dividends per share | | | 0.78 | | | | 0.75 | | | +4 | |
Stockholders’ equity per share | | | 13.66 | | | | 12.94 | | | +6 | |
Shares outstanding | | | 86,933 | | | | 86,548 | | | | |
Return on average stockholders’ equity | | | 12.63 | % | | | 12.12 | % | | | |
Return on average assets | | | 1.90 | | | | 1.78 | | | | |
Efficiency ratio | | | 19.16 | | | | 18.57 | | | | |

TO OUR STOCKHOLDERS
Dear Stockholder:
The financial performance of a traditional thrift institution like Washington Federal depends primarily on the health of the housing market and the spread between short and long-term interest rates. During the fiscal year just completed, the residential real estate market continued to sizzle within our lending territory; likewise, for much of the year the interest rate spread on which we rely was somewhat higher than average. As a result, I am privileged to report that your Company enjoyed very strong financial performance during the past year. Net income amounted to $145,889,000, which was an 11% increase over the $131,868,000 recorded during the prior fiscal year. Earnings per share of $1.67 also represented an increase of 11% from $1.51 recorded in the previous year. Return on average assets of 1.90% was at or near the top of the range for industry peers of similar size, while return on equity improved to 12.63%, which we believe was respectable given your Company’s conservative capital position and the historically low interest rate environment in which it was operating.
The past year also saw some interesting and important milestones achieved. For example, total assets grew by nearly 15% and at year-end exceeded $8 billion for the first time. Most of that growth came as a result of record loan originations of $2.44 billion, which enabled the loan portfolio to top $6 billion for the first time in your Company’s history. Total deposit growth was also very encouraging during the year as customer accounts grew by 9% and totaled over $5 billion at year-end, also a new high mark.
Asset quality was superb. Non-performing assets (foreclosed real estate plus loans on which we are no longer receiving payments) amounted to only $7.3 million, or less than one-tenth of 1% of total assets at year-end. This is the lowest level of problem assets reported by your Company since going public in 1982. Net loan charge-offs recorded during the year were also astoundingly low at only $250,000. We are proud to report such positive results, although management believes that these numbers represent peak performance and do not necessarily reflect the actual credit risk embedded in the loan portfolio. As the housing market inevitably cools, we expect problem assets and charge-offs to increase and have taken the precaution of establishing appropriate reserves. Yet for now, we celebrate the relative absence of credit related difficulties.
Net interest income, which is the difference between interest income and interest expense, is the primary driver of earnings at Washington Federal and increased by $22.6 million over the prior year. This critical measure came under increasing pressure during the year due to a steady upward trend in deposit costs as the Federal Reserve tightened the supply of money and raised short-term rates from 1.5% to 3.75%. The resulting higher deposit costs were offset by an increase in floating rate construction loans, by redeploying cash into higher yielding, longer-term assets and by growth of the balance sheet using additional leverage. Your Company’s ability to offset anticipated future increases in funding costs is extensive, yet ultimately limited and will depend on many factors including the speed and extent to which short-term rates increase and the degree to which long-term rates move commensurately. As always, this is the major risk managed by your Company, yet it is one which management has prepared for by building capital and maintaining excess liquidity, by extending the maturity of borrowed funds, by taking a conservative posture on credit risk and by managing to the lowest cost structure in the industry. It’s also worth a reminder that we have been through this before, although no two rate cycles are alike.
Results this year were also dampened a bit by our investment exposure to U.S. government sponsored enterprises. Historically, investments in Fannie Mae, Freddie Mac and the Federal Home Loan Bank System were considered to be of the very highest quality due to their conservative operating models and the implied guarantee of the federal government. More recently though, as their business models became more complex, investments in these institutions have been shown to entail a higher degree of risk than was previously thought. Two years ago, our investment in the Federal Home Loan Bank of Seattle produced a tax-deferred dividend yield of 6.0%. Today, due to what appear to be temporary financial difficulties, they are currently unable to support a dividend. During the year, management also recognized a $4 million write down in the carrying values of investments in preferred stock issues of Fannie Mae and Freddie Mac. The reduction in the carrying values reflects the reduced market value of these securities as a result of their well-publicized accounting and financial difficulties. We have chosen to maintain these investments on our books because we believe them to be “money-good” assets at the end of the day; however, we continue to monitor them closely. Such investments, excluding mortgage-backed securities, represented approximately 4% of assets at fiscal year-end.
For the 40th time since going public in 1982, the Board of Directors of your Company declared a cash dividend increase during the year. The new annualized dividend rate of $.80 per share represents a payout ratio of 48% of last year’s earnings and a dividend yield of approximately 3.5% based on recent prices of your Company’s stock. In February, stockholders were again delivered a 10% stock dividend. This was the 20th time since 1982 that your Company has declared additional stock distributions to owners in the form of a stock split or stock dividend. After cash dividends, retained earnings allowed your Company to increase its capital account by $67 million. The ratio of capital to total assets stood at 14.42 % at year-end, which is considerably higher than the industry average and gives management great flexibility to take advantage of opportunities that may present themselves in the future.
The filing of our annual report this year also brought with it the requirement for compliance with Section 404 of the Sarbanes-Oxley Act, which mandates the step-by-step documentation and testing of all key internal controls. The completion of this task came at great expense and much hard work by a group of key employees and I am pleased to report that your Company was not found to have any material weaknesses in its internal controls over financial reporting. On a related note, this year we
2

also welcomed a new member to the Board of Directors. Thomas J. Kelley is a Certified Public Accountant, currently instructing at Seattle University, who spent much of his career auditing financial institutions as a partner with the former Arthur Andersen firm. With his addition to the Audit Committee, we believe that all three of its members meet the definition of “Audit Committee Financial Expert” and that this represents a significant strengthening of the Board’s ability to meet its financial oversight responsibilities.
Lately, we have received a number of questions from investors regarding your Company’s exposure to the so-called “exotic” mortgages such as the Interest-Only and Option-ARM products that have become so popular of late. We have none. Our view is that the repayment characteristics and credit risks associated with these products are untested through the credit and interest rate cycles; therefore, management has elected to stay on the sidelines until these products are indeed proven to be profitable to lenders without toxic side effects for borrowers.
Looking ahead, the strength of our balance sheet and the earnings momentum from last year give reasons for optimism about your Company’s future prospects, particularly in the long-term. On the other hand, the near-term risks of a break in the housing market and/or a spike in inflation that would necessitate more aggressive tightening by the Fed seem more likely than they did one year ago. Yet regardless of the various environmental possibilities, in the year to come we plan to stick with the simple, comfortable and familiar operating model that has served us so well over the years. We plan to open 2-4 new branches and gather sufficient new loans and deposits to adequately leverage the new capital we acquire through earnings. We will continue to operate as a high-touch, low-tech provider of residential real estate loans, and we will continue to provide a very safe place for thrift-minded people to keep their hard-earned savings. With a healthy underpinning of capital and a frugal management style, your Company should continue to prosper.
To our loyal customers goes a special note of appreciation. We thank you for entrusting us with your business and recognize that we have to earn your business every day. I would also like to thank the Executive Management Committee and all of our hard working employees for their dedicated efforts during the past year. Each year they somehow deliver just a little more and are the indispensable ingredient in the Washington Federal recipe for success. I would also like to thank the Board of Directors for their unwavering support and wise counsel to management and also for their commitment to protecting the interests of all stockholders.
Finally, I wish to thank our many stockholders for their continued support. For the benefit of your investment, please remember to send your friends and neighbors to Washington Federal for all their savings and home finance requirements. I hope to see you at the Annual Meeting of Stockholders to be held at 2:00 PM, on January 18, 2006 at Benaroya Hall in downtown Seattle, Washington.
Sincerely,

Roy M. Whitehead
Vice Chairman, President and Chief Executive Officer

(Standing - left to right) Edwin C. Hedlund, Executive Vice President and Secretary, Roy M. Whitehead, Vice Chairman, President and Chief Executive Officer, Linda S. Brower, Executive Vice President, (Seated - left to right) Jack B. Jacobson, Executive Vice President and Chief Lending Officer, Brent J. Beardall, Senior Vice President and Chief Financial Officer.
3

MANAGEMENT’S DISCUSSION AND ANALYSIS OF
FINANCIAL CONDITION AND RESULTS OF OPERATIONS
GENERAL | Washington Federal, Inc. (Company or Washington Federal) is a savings and loan holding company. The Company’s primary operating subsidiary is Washington Federal Savings. |
The Company’s fiscal year end is September 30th. All references to 2005 represent balances as of September 30, 2005 or activity for the fiscal year then ended. All references to 2004 represent balances as of September 30, 2004 or activity for the fiscal year then ended.
CRITICAL ACCOUNTING POLICIES | Preparation of financial statements in conformity with accounting principles generally accepted in the United States of America requires the use of estimates and assumptions that affect reported amounts of certain assets, liabilities, revenues and expenses in the Company’s consolidated financial statements. Accordingly, estimated amounts may fluctuate from one reporting period to another due to changes in assumptions underlying estimated values. |
The Company has determined that the only accounting policy deemed critical to an understanding of the consolidated financial statements of Washington Federal, Inc. relates to the methodology for determining the valuation of the allowance for loan losses, as described below.
The Company maintains an allowance for loan losses to absorb losses inherent in the loan portfolio. The allowance is based on ongoing, quarterly assessments of the probable and estimable losses inherent in the loan portfolio. The Company’s methodology for assessing the appropriateness of the allowance consists of several key elements, which include the formula allowance and specific allowances.
The formula portion of the general loan loss allowance is established by applying a loss percentage factor to the different loan types. The allowance is provided based on Management’s continuing evaluation of the pertinent factors underlying the quality of the loan portfolio, including changes in the size and composition of the loan portfolio, actual loan loss experience, current economic conditions, geographic concentrations, seasoning of the loan portfolio, specific industry conditions and the duration of the current business cycle. The recovery of the carrying value of loans is susceptible to future market conditions beyond the Company’s control, which may result in losses or recoveries differing from those provided.
Specific allowances are established in cases where Management has identified significant conditions or circumstances related to a loan that Management believes indicate the probability that a loss has been incurred.
INTEREST RATE RISK | The Company accepts a high level of interest rate volatility as a result of its policy to originate fixed-rate single-family home loans that are longer-term than the short-term characteristics of its liabilities of customer accounts and borrowed money. The following table shows the estimated repricing periods for earning assets and paying liabilities. |
| | | | | | | | | | | | | | | | |
| | | Repricing Period
| |
| | | Within One Year | | | After 1 year -
before 4 Years | | | Thereafter | | | Total | |
| | | (In thousands) | |
As of September 30, 2005 | | | | | | | | | | | | | | | | |
Earning Assets * | | $ | 2,547,230 | | | $ | 2,224,709 | | | $ | 3,294,572 | | | $ | 8,066,511 | |
Paying Liabilities | | | (4,673,467 | ) | | | (1,480,044 | ) | | | (762,994 | ) | | | (6,916,505 | ) |
| | |
|
|
| | | | |
Excess (Liabilities) Assets | | $ | (2,126,237 | ) | | $ | 744,665 | | | $ | 2,531,578 | | | | | |
| | |
|
|
| | | | |
Excess as % of Total Assets | | | –25.82 | % | | | | | | | | | | | | |
Policy limit for one year excess | | | –60.00 | % | | | | | | | | | | | | |
| | * | Asset repricing period includes estimated prepayments based on historical activity |
At September 30, 2005, the Company had approximately $2,126,237,000 more liabilities subject to repricing in the next year than assets, which amounted to a negative maturity gap of 26% of total assets. As of September 30, 2004, the amount of excess liabilities subject to repricing within one year was $1,761,103,000 or 25% of total assets. The increase of $365,134,000 of liabilities in excess of assets repricing within one year was due to deposit growth and a shift in deposit maturities towards shorter-term maturities. The negative one year maturity gap as a percentage of total assets increased only one percent due to the growth of total assets by 15% to $8,234,450,000. By having an excess of liabilities repricing within one year over assets, the Company is subject to decreasing net interest income should rates rise. However, if the size and/or mix of the balance sheet changes, rising rates may not cause a decrease in net interest income. The Company’s interest rate risk approach has never resulted in the recording of a monthly operating loss.
The Company’s net interest spread decreased from 3.00% at September 30, 2004 to 2.54% at September 30, 2005. Net interest spread represents the difference between the contractual rates of earning assets less the contractual rates of paying liabilities as of a specific date. The spread decreased primarily because rates on customer
4
| | accounts increased by 98 basis points over the prior year while rates on earning assets increased by only 29 basis points (see Period End Spread table on page 8). |
During 2005 the Company chose to grow earning assets by increasing the net amount of loans and investments (a net increase of $1,150,000,000 ). This growth was funded by a net increase in borrowings of $585,000,000. During the year the Company borrowed $700,000,000 in long-term funding with a weighted average contractual maturity of 7.8 years at a weighted average rate of 3.94%, combined with deposit growth of $421,000,000. As of September 30, 2005, the Company had $638,000,000 in cash and cash equivalents, which can be invested long-term in the future to generate additional revenues.
ASSET QUALITY | The Company maintains an allowance to absorb losses inherent in the loan portfolio. The allowance is based on ongoing, quarterly assessments of the probable and estimable losses inherent in the loan portfolio. In analyzing the existing loan portfolio, the Company applies specific loss percentage factors to the different loan types. The loss percentages are based on Management’s continuing evaluation of the pertinent factors underlying the quality of the loan portfolio, including changes in the size and composition of the loan portfolio, actual loan loss experience and current economic conditions. |
Multi-family loans, builder construction loans and certain other loans are reviewed on an individual basis to assess the ability of the borrowers to continue to service all of their principal and interest obligations. If the loans show signs of weakness, they are downgraded and, if warranted, placed on non-accrual status. The Company has an Asset Quality Review Committee that reports the results of its internal reviews to the Board of Directors on a quarterly basis.
Non-performing assets were $7,344,000, or .09% of total assets at September 30, 2005 compared to $14,945,000, or .21% of total assets at September 30, 2004. Total delinquencies over 30 days were $16,723,000, or .20% of total assets at September 30, 2005 compared to $21,419,000, or .30% of total assets at September 30, 2004. The aforementioned asset quality indicators demonstrate the continued excellent quality of the loan portfolio.
LIQUIDITY AND CAPITAL RESOURCES | The principal sources of funds for the Company’s activities are retained earnings, loan repayments (including prepayments), net savings inflows, sales of loans, sales of investments, loan participations, deposits and borrowings. Washington Federal’s principal sources of revenue are interest on loans, interest and dividends on investments and gains on sale of investments and real estate. |
The Company’s net worth at September 30, 2005 was $1,187,308,000, or 14.4% of total assets. This is an increase of $67,120,000 from September 30, 2004 when net worth was $1,120,188,000, or 15.6% of total assets. The Company’s net worth increased due in part to net income of $145,889,000, proceeds received from the exercise of common stock options of $4,006,000 and purchases by the Employee Stock Ownership Plan of $1,526,000. Net worth was reduced by $67,719,000 as a result of cash dividends paid and a decrease in accumulated other comprehensive income of $17,811,000. The Company paid out 46.4% of its 2005 earnings in the form of cash dividends, compared with 49.1% last year.
Washington Federal’s percentage of net worth to total assets is among the highest in the nation and is over three times the minimum required under Office of Thrift Supervision (OTS) regulations (see Note M). Management believes this strong net worth position will help protect the Company against interest rate risk and will enable it to compete more effectively.
Customer accounts increased $421,147,000, or 9.1% from one year ago. Management’s strategy during this phase of the interest rate cycle has been to remain competitive in its deposit pricing to attract the new deposit relationships necessary to help fund asset growth.
The Company’s cash and cash equivalents amounted to $637,791,000 at September 30, 2005, a 10% decrease from the cash, cash equivalents and repurchase agreements balance of $708,361,000 one year ago. The decrease resulted primarily from using the funds to help grow net loans and investments over the prior year. See “Interest Rate Risk” on page 4 and the “Statement of Cash Flows” included in the financial statements.
CHANGES IN FINANCIAL POSITION | Available-for-sale and held-to-maturity securities. The Company purchased $827,178,000 of securities during 2005, $747,178,000 of which have been classified as available-for-sale and $80,000,000 of which have been classified as held-to-maturity. |
The Company had $127,544,000 in sales of available-for-sale securities, resulting in a net realized loss of $3,534,000. Included in the 2005 net loss amount is a loss on impairment of Government Sponsored Entities (GSE) preferred stock of $4,100,000. As of September 30, 2005, the Company had net unrealized losses in its available-for-sale portfolio of $1,113,000.
Loans receivable and securitized assets subject to repurchase. Loans receivable and securitized assets subject to repurchase increased 18.0% to $6,008,932,000 at September 30, 2005 from $5,093,443,000 one year earlier. The increase resulted primarily from record loan production of $2,436,826,000 combined with whole loan purchases of $331,456,000. Loan repayments (including prepayments) during the year were $1,769,058,000, an increase of $75,916,000 or 4.5% from 2004. The allowance for losses on loans and securitized assets subject to repurchase
5

MANAGEMENT’S DISCUSSION AND ANALYSIS OF
FINANCIAL CONDITION AND RESULTS OF OPERATIONS (CONTINUED)
| | decreased $384,000 during the year due to a $134,000 reversal of the reserve combined with net charge-offs of $250,000. In analyzing the allowance for loan losses, Management believes the 18.0% growth in the loan portfolio was principally offset by the Company’s nonperforming loan balances decreasing during the year from $10,884,000 to $6,588,000 or 39%, combined with improving economic conditions throughout the Company’s primary markets. The percentage of loans outside of Washington, Idaho, Oregon, Utah and Arizona increased to 12.1% of loans outstanding at September 30, 2005 from 7.3% one year earlier, resulting from the purchase of whole loans and increased loan production by the branches located in Nevada and Texas. Gross construction and land loans increased to 22.1% of the portfolio at September 30, 2005 from 20.4% at September 30, 2004. The amount of reserves allocated to impaired loans decreased to $300,000 at September 30, 2005 from an allocation of $700,000 in the prior year based on the estimated value of the underlying collateral of the impaired loans. |
Real estate held for sale. The balance of real estate held for sale at September 30, 2005 was $5,631,000, a decrease from $8,630,000 reported one year ago. The decrease was primarily due to strong demand for housing in the Company’s primary markets.
FHLB stock. FHLB stock amounted to $129,453,000 at September 30, 2005 compared with $137,274,000 one year ago. The Company had a net redemption of $8,208,000 in FHLB stock during the year. No gain or loss was recognized on the redemption.
Intangible assets. The Company’s intangible assets are made up of $54,484,000 of goodwill, as well as the unamortized balances of the core deposit intangible and the non-compete agreement intangible of $2,440,000 and $335,000, respectively, at September 30, 2005.
Other assets. Other assets decreased $6,065,000 to $7,714,000 at September 30, 2005 primarily due to the correction of an error related to hedge accounting for certain derivative instruments in the current year (see Note A).
Customer accounts. Customer accounts at September 30, 2005 totaled $5,031,505,000 compared with $4,610,358,000 at September 30, 2004, a 9.1% increase. See “Liquidity and Capital Resources” on page 5.
FHLB advances and other borrowings. Total borrowings increased $585,000,000, or 45.0%, to $1,855,000,000 at September 30, 2005 as the Company chose to fund asset growth with a mix of customer accounts and borrowed money. See “Interest Rate Risk” on page 4.
Contractual obligations. The following table presents, as of September 30, 2005, the Company’s significant fixed and determinable contractual obligations, within the categories described below, by payment date or contractual maturity. These contractual obligations, except for the operating lease, are included in the Consolidated Statements of Financial Condition. The payment amounts represent those amounts contractually due.
| | | | | | | | | | | | | |
| Contractual Obligations | | Total | | Less than
1 Year | | 1 to 5
Years | | Over 5
Years | |
| | | (In thousands) | |
Debt obligations* | | $ | 1,885,000 | | $ | 55,000 | | $ | 630,000 | | $ | 1,200,000 | |
Operating lease obligations | | | 6,500 | | | 1,928 | | | 4,050 | | | 522 | |
| | |
|
|
|
| | | $ | 1,891,500 | | $ | 56,928 | | $ | 634,050 | | $ | 1,200,522 | |
| | |
|
|
|
| | * | Represents final maturities of debt obligations. See a description in Notes H and I. |
RESULTS OF OPERATIONS | GENERAL |
See Note P, “Selected Quarterly Financial Data (Unaudited),” which highlights the quarter-by-quarter results for the years ended September 30, 2005 and 2004.
COMPARISON OF 2005 RESULTS WITH 2004
In 2005 net income increased 11% from 2004.
Interest income on loans, securitized assets subject to repurchase and mortgage-backed securities increased $50,961,000 (13.4%) in 2005 from 2004 due to a 15.4% increase in the average outstanding balance of loans, securitized assets subject to repurchase and mortgage-backed securities, offset partially by a 12 basis point decrease in the weighted average yield from 6.85% in 2004 to 6.73% in 2005. Additionally, the correction of the error in hedge accounting recorded by the Company in 2005, as described in Note A, increased interest income on mortgage-backed securities by $11.1 million.
Interest and dividend income on investment securities and cash equivalents decreased $2,832,000 (8.3%) in 2005 from 2004. This decrease was due to a decrease in the average combined balance. The average combined balance of investment securities, cash equivalents and FHLB stock decreased 33.6% to $1,074,169,000 for the year ended September 30, 2005 versus $1,618,783,000 for the year ended September 30, 2004. Partially offsetting this decrease, the weighted average yield on investment securities, cash equivalents and FHLB stock increased from 2.12% in 2004 to 2.92% in 2005 primarily as a result of the Federal Reserve increasing short-term interest rates during the year.
6
Interest expense on customer accounts increased 34.5% to $115,826,000 for 2005 from $86,099,000 for 2004. The increase primarily related to a 58 basis point increase in the average cost of customer accounts to 2.47% during the year compared to 1.89% one year ago combined with the 9.1% increase in the balance of customer accounts over the prior year. Interest expense on FHLB advances and other borrowings decreased to $79,434,000 in 2005 from $83,654,000 in 2004 due to a decrease in the average cost of borrowings for the year ended September 30, 2005 to 4.77% from 5.10% for the same period one year ago. This decrease was accomplished by replacing higher cost borrowings with lower rate borrowings available during the year due to the relatively low level of long-term interest rates.
The Company recorded a $134,000 reversal of the provision for loan losses in 2005 compared to a $231,000 reversal of the provision in 2004. The current year reversal is due to a reduction in the Company’s nonperforming loan balances as well as an improvement in the number of delinquent loans, which was offset by the 18.0% growth in loans receivable and securitized assets subject to repurchase over the prior year. Non-performing assets decreased to $7,344,000, or .09% of total assets at September 30, 2005 compared with $14,945,000, or .21% of total assets at September 30, 2004. Total delinquencies over 30 days were $16,723,000, or .20% of total assets at September 30, 2005 compared to $21,419,000, or .30% of total assets at September 30, 2004. Management believes the allowance for loan losses, totaling $24,756,000, is sufficient to absorb estimated losses inherent in the portfolio.
Total other income increased $1,266,000 (24.6%) in 2005 from 2004. The increase is primarily the result of recognizing $990,000 of income as a result of the favorable settlement of a loan obligation. In addition, there was a reduction in the amount of loss on the extinguishment of debt of $2,194,000 in 2005 versus $5,191,000 in the prior year. Net losses on the sale of securities totaled $3,534,000 in 2005 compared to net losses of $890,000 in 2004.
Compensation expense increased $2,786,000 or 8.9% in 2005 due to the combination of a $1,914,000 bonus expense resulting from increased earnings per share as well as annual cost of living and merit increases. There was no bonus expense in 2004. Personnel, including part-time employees considered on a full-time equivalent basis, decreased to 749 at September 30, 2005 compared to 754 one year ago.
Occupancy expense increased $975,000 or 12.5% during the year resulting from an expense of $1,225,000 related to the amortization of leasehold improvements that brings the Company into conformity with a recent clarification of the accounting standard for leases. The Company now amortizes leasehold improvements over the shorter of the original lease term, excluding option periods, or the expected useful life of the improvements. Partially offsetting this additional amortization expense was a reduction in the amount of maintenance expense. The branch network increased to 122 offices at September 30, 2005 versus 120 offices one year ago.
Other expenses increased $2,892,000 during the year due mainly to a $1,500,000 expense for a state business tax assessment as well as an increase in accounting and other professional fees of $615,000. Other expense for 2005 and 2004 equaled .68% and .62% of average assets, respectively.
Income tax expense increased $4,575,000 (6.4%) in 2005 due to a higher taxable income base. The effective tax rate was 34.38% for 2005 versus 35.27% for 2004. The effective income tax rate for 2005 decreased as a result of a $2,500,000 reversal of a contingent tax liability that was resolved in the fourth quarter.
COMPARISON OF 2004 RESULTS WITH 2003
Interest income on loans, securitized assets subject to repurchase and mortgage-backed securities decreased $35,786,000 (8.6%) in 2004 from 2003 as interest rates declined to 6.17% from 6.40% one year prior. The Company originated $2,070,984,000 in loans, which was offset by loan repayments and payoffs of $1,693,142,000 in 2004.
Interest and dividend income on investment securities and cash equivalents increased $263,000 (0.8%) in 2004 from 2003. Rates increased to 3.01% at September 30, 2004 compared with 1.98% at September 30, 2003, primarily as a result of the increase in short term interest rates during 2004. The combined investment securities, cash equivalents and FHLB stock portfolio decreased 34.1% to $1,211,957,000 at September 30, 2004 versus $1,839,847,000 one year prior.
Interest expense on customer accounts decreased 18.7% to $86,099,000 for 2004 from $105,919,000 for 2003. The decrease related to a small increase in customer accounts to $4,610,358,000 from $4,577,598,000 the prior year, coupled with a significant decrease in the average cost of customer accounts to 1.89% at year end compared to 2.38% one year ago. This decrease was primarily the result of higher rate CD’s repricing throughout the year to lower market rates.
Interest expense on FHLB advances and other borrowings decreased to $83,654,000 in 2004 from $88,965,000 in 2003 primarily due to the repayment of $450,000,000 in FHLB advances during the year. The average cost of borrowings as of September 30, 2004 decreased to 4.96% from 5.03% from one year ago.
The Company recorded a $231,000 reversal of the provision for loan losses in 2004 compared to a $1,500,000 increase in the provision in 2003. This decrease reflects a reduction in the Company’s nonperforming loan
7
MANAGEMENT’S DISCUSSION AND ANALYSIS OF
FINANCIAL CONDITION AND RESULTS OF OPERATIONS (CONTINUED)
| | balances as well as an improvement in the number of delinquent loans. Non-performing assets decreased to $14,945,000, or .21% of total assets at September 30, 2004 compared with $27,434,000, or .36% of total assets at September 30, 2003. Management believed the allowance for loan losses, totaling $25,140,000, was sufficient to absorb estimated losses inherent in the portfolio. |
Total other income decreased $11,622,000 (69.3%) in 2004 from 2003. This decrease was primarily the result of a pre-tax charge of $5,191,000 related to the extinguishment of debt in 2004 compared to a $3,382,000 gain on the sale of real estate in 2003. Net losses on the sale of securities totaled $890,000 in 2004 compared to net gains of $1,040,000 in 2003.
Total other expense increased $505,000 (1.1%) in 2004 over 2003. Compensation expense remained relatively consistent by increasing only $565,000 in 2004. Personnel, including part-time employees considered on a full- time equivalent basis, remained the same at 754 at September 30, 2004 compared to one year ago. Routine operating expenses decreased $2,346,000 in 2004 due to an increase of deferred loan origination costs associated with record production (per SFAS No. 91) and general cost containment measures. The branch network increased to 120 offices at September 30, 2004 versus 119 offices one year ago. Other expense for both 2004 and 2003 equaled .62% of average assets.
Income tax expense decreased $2,836,000 (3.5%) in 2004. The effective tax rate was 35.27% for 2004 versus 35.19% for 2003.
PERIOD END SPREAD – AS OF THE DATE SHOWN
| | | | | | | | | | | | | | | | | | | | | | | | |
| | | Dec 31
2003 | | | Mar 31
2004 | | | Jun 30
2004 | | | Sep 30
2004 | | | Dec 31
2004 | | | Mar 31
2005 | | | Jun 30
2005 | | | Sep 30
2005 | |
Interest rate on loans and mortgage-backed securities* | | 6.31 | % | | 6.23 | % | | 6.16 | % | | 6.17 | % | | 6.16 | % | | 6.16 | % | | 6.14 | % | | 6.19 | % |
Interest rate on investment securities** | | 1.75 | | | 2.26 | | | 2.61 | | | 3.01 | | | 2.86 | | | 3.46 | | | 3.22 | | | 3.74 | |
| | |
|
|
Combined | | 5.21 | | | 5.30 | | | 5.44 | | | 5.62 | | | 5.63 | | | 5.80 | | | 5.78 | | | 5.91 | |
| | |
|
|
Interest rate on customer accounts | | 1.92 | | | 1.87 | | | 1.90 | | | 1.96 | | | 2.11 | | | 2.37 | | | 2.70 | | | 2.94 | |
Interest rate on borrowings | | 5.03 | | | 5.03 | | | 5.03 | | | 4.96 | | | 4.74 | | | 4.74 | | | 4.66 | | | 4.51 | |
| | |
|
|
Combined | | 2.78 | | | 2.75 | | | 2.67 | | | 2.62 | | | 2.78 | | | 2.97 | | | 3.23 | | | 3.37 | |
| | |
|
|
Interest rate spread | | 2.43 | % | | 2.55 | % | | 2.77 | % | | 3.00 | % | | 2.85 | % | | 2.83 | % | | 2.55 | % | | 2.54 | % |
| | |
|
|
| | * | Includes securitized assets subject to repurchase |
| | ** | Includes municipal bonds at tax-equivalent rates and cash equivalents |
The interest rate spread decreased during 2005 from 3.00% at September 30, 2004 to 2.54% at September 30, 2005. See “Interest Rate Risk” on pages 4 and 5.
8

SELECTED FINANCIAL DATA
| | | | | | | | | | | | | |
| Year ended September 30, | | 2005 | | | 2004 | | | 2003 | | 2002 | | 2001 | |
| | | (In thousands, except per share data) | |
Interest income | | $461,901 | | | $413,772 | | | $449,295 | | $511,802 | | $540,064 | |
Interest expense | | 195,260 | | | 169,753 | | | 194,884 | | 234,941 | | 320,120 | |
| | |
|
|
Net interest income | | 266,641 | | | 244,019 | | | 254,411 | | 276,861 | | 219,944 | |
Provision for (reversal of) loan losses | | (134 | ) | | (231 | ) | | 1,500 | | 7,000 | | 1,850 | |
Other income | | 7,852 | | | 5,726 | | | 16,571 | | 10,163 | | 12,013 | |
Other expense | | 52,319 | | | 46,264 | | | 45,759 | | 50,828 | | 48,697 | |
| | |
|
|
Income before income taxes | | 222,308 | | | 203,712 | | | 223,723 | | 229,196 | | 181,410 | |
Income taxes | | 76,419 | | | 71,844 | | | 78,724 | | 80,812 | | 63,946 | |
| | |
|
|
Net income | | $145,889 | | | $131,868 | | | $144,999 | | $148,384 | | $117,464 | |
| | |
|
|
Per share data | | | | | | | | | | | | | |
Basic earnings | | $1.68 | | | $1.53 | | | $1.72 | | $1.75 | | $1.39 | |
Diluted earnings | | 1.67 | | | 1.51 | | | 1.71 | | 1.74 | | 1.38 | |
Cash dividends | | 0.78 | | | 0.75 | | | 0.71 | | 0.68 | | 0.64 | |
| | | | | |
| September 30, | | 2005 | | | 2004 | | | 2003 | | 2002 | | 2001 | |
| | | (In thousands) | |
Total assets | | $8,234,450 | | | $7,169,205 | | | $7,535,975 | | $7,392,441 | | $7,026,743 | |
Loans and mortgage-backed securities* | | 7,084,274 | | | 5,734,658 | | | 5,443,266 | | 5,990,223 | | 6,537,010 | |
Investment securities | | 214,993 | | | 414,683 | | | 310,218 | | 117,417 | | 145,724 | |
Cash and cash equivalents | | 637,791 | | | 708,361 | | | 1,437,208 | | 975,153 | | 30,331 | |
Customer accounts | | 5,031,505 | | | 4,610,358 | | | 4,577,598 | | 4,521,922 | | 4,316,692 | |
FHLB advances | | 1,230,000 | | | 1,200,000 | | | 1,650,000 | | 1,650,000 | | 1,637,500 | |
Other borrowings | | 655,000 | | | 100,000 | | | 100,000 | | 100,000 | | 30,000 | |
| | | | | |
Stockholders’ equity | | 1,187,308 | | | 1,120,188 | | | 1,055,596 | | 960,718 | | 874,009 | |
| | | | | |
Number of | | | | | | | | | | | | | |
Customer accounts | | 232,707 | | | 216,405 | | | 217,785 | | 213,404 | | 211,570 | |
Mortgage loans | | 36,272 | | | 34,873 | | | 33,975 | | 38,096 | | 42,032 | |
Offices | | 122 | | | 120 | | | 119 | | 115 | | 111 | |
| * | Includes securitized assets subject to repurchase |

CONSOLIDATED STATEMENTS OF FINANCIAL CONDITION
| | | | | | | | |
| September 30, | | 2005 | | | 2004 | |
| | | (In thousands, except per
share data) | |
| ASSETS | | | | | | | | |
Cash and cash equivalents, including repurchase agreements of$575,000 and $460,000 | | $ | 637,791 | | | $ | 508,361 | |
Repurchase agreements | | | — | | | | 200,000 | |
Available-for-sale securities, including encumbered securities of$571,462 and $64,587 | | | 1,077,856 | | | | 899,525 | |
Held-to-maturity securities, including encumbered securities of$68,759 and $54,811 | | | 212,479 | | | | 156,373 | |
Securitized asset subject to repurchase, net | | | 71,257 | | | | 110,607 | |
Loans receivable, net | | | 5,937,675 | | | | 4,982,836 | |
Interest receivable | | | 34,048 | | | | 29,832 | |
Premises and equipment, net | | | 63,287 | | | | 63,049 | |
Real estate held for sale | | | 5,631 | | | | 8,630 | |
FHLB stock | | | 129,453 | | | | 137,274 | |
Intangible assets | | | 57,259 | | | | 58,939 | |
Other assets | | | 7,714 | | | | 13,779 | |
| | |
|
|
|
| | | $ | 8,234,450 | | | $ | 7,169,205 | |
| | |
|
|
|
| | |
| LIABILITIES AND STOCKHOLDERS’ EQUITY | | | | | | | | |
Liabilities | | | | | | | | |
Customer accounts | | | | | | | | |
Savings and demand accounts | | $ | 5,002,172 | | | $ | 4,569,245 | |
Repurchase agreements with customers | | | 29,333 | | | | 41,113 | |
| | |
|
|
|
| | | | 5,031,505 | | | | 4,610,358 | |
FHLB advances | | | 1,230,000 | | | | 1,200,000 | |
Other borrowings | | | 655,000 | | | | 100,000 | |
Advance payments by borrowers for taxes and insurance | | | 27,533 | | | | 25,226 | |
Federal and state income taxes, including net deferred liabilities of$43,491 and $55,522 | | | 44,617 | | | | 62,081 | |
Accrued expenses and other liabilities | | | 58,487 | | | | 51,352 | |
| | |
|
|
|
| | | | 7,047,142 | | | | 6,049,017 | |
Stockholders’ equity | | | | | | | | |
Common stock, $1.00 par value, 300,000,000 shares authorized,104,140,966 and 103,821,846 shares issued;86,933,294 and 86,547,557 shares outstanding | | | 104,141 | | | | 94,383 | |
Paid-in capital | | | 1,240,310 | | | | 1,161,627 | |
Accumulated other comprehensive income (loss), net of tax | | | (704 | ) | | | 17,107 | |
Treasury stock, at cost;17,207,672 and 17,274,289 shares | | | (205,874 | ) | | | (206,666 | ) |
Retained earnings | | | 49,435 | | | | 53,737 | |
| | |
|
|
|
| | | | 1,187,308 | | | | 1,120,188 | |
| | |
|
|
|
| | | $ | 8,234,450 | | | $ | 7,169,205 | |
| | |
|
|
|
| | |
10 | | SEE NOTES TO CONSOLIDATED FINANCIAL STATEMENTS |

CONSOLIDATED STATEMENTS OF OPERATIONS
| | | | | | | | | |
| Year ended September 30, | | 2005 | | | 2004 | | | 2003 | |
| | | (In thousands, except per share data) | |
| INTEREST INCOME | | | | | | | | | |
Loans | | $369,023 | | | $330,967 | | | $353,286 | |
Mortgage-backed securities | | 61,459 | | | 48,554 | | | 62,021 | |
Investment securities | | 31,419 | | | 34,251 | | | 33,988 | |
| | |
|
|
| | | 461,901 | | | 413,772 | | | 449,295 | |
| INTEREST EXPENSE | | | | | | | | | |
Customer accounts | | 115,826 | | | 86,099 | | | 105,919 | |
FHLB advances and other borrowings | | 79,434 | | | 83,654 | | | 88,965 | |
| | |
|
|
| | | 195,260 | | | 169,753 | | | 194,884 | |
| | |
|
|
Net interest income | | 266,641 | | | 244,019 | | | 254,411 | |
Provision for (reversal of) loan losses | | (134 | ) | | (231 | ) | | 1,500 | |
| | |
|
|
Net interest income after provision for loan losses | | 266,775 | | | 244,250 | | | 252,911 | |
| | | |
| OTHER INCOME | | | | | | | | | |
Gain (loss) on sale of investments, net | | (3,534 | ) | | (890 | ) | | 1,040 | |
Gain on sale of real estate | | — | | | — | | | 3,382 | |
Loss on extinguishment of debt | | (2,194 | ) | | (5,191 | ) | | — | |
Other | | 12,137 | | | 11,224 | | | 12,343 | |
| | |
|
|
| | | 6,409 | | | 5,143 | | | 16,765 | |
| | | |
| OTHER EXPENSE | | | | | | | | | |
Compensation and fringe benefits | | 34,197 | | | 31,411 | | | 30,846 | |
Amortization of intangibles | | 1,198 | | | 1,397 | | | 126 | |
Occupancy expense | | 8,788 | | | 7,813 | | | 6,798 | |
Other | | 13,700 | | | 10,808 | | | 11,043 | |
Deferred loan origination costs | | (5,564 | ) | | (5,165 | ) | | (3,054 | ) |
| | |
|
|
| | | 52,319 | | | 46,264 | | | 45,759 | |
Gain (loss) on real estate acquired through foreclosure, net | | 1,443 | | | 583 | | | (194 | ) |
| | |
|
|
Income before income taxes | | 222,308 | | | 203,712 | | | 223,723 | |
Income taxes | | | | | | | | | |
Current | | 78,024 | | | 77,270 | | | 80,106 | |
Deferred | | (1,605 | ) | | (5,426 | ) | | (1,382 | ) |
| | |
|
|
| | | 76,419 | | | 71,844 | | | 78,724 | |
| | |
|
|
NET INCOME | | $145,889 | | | $131,868 | | | $144,999 | |
| | |
|
|
| | | |
| PER SHARE DATA | | | | | | | | | |
Basic earnings | | $ 1.68 | | | $ 1.53 | | | $ 1.72 | |
Diluted earnings | | 1.67 | | | 1.51 | | | 1.71 | |
Cash dividends | | 0.78 | | | 0.75 | | | 0.71 | |
Weighted average number of shares outstanding,
including dilutive stock options | | 87,478,708 | | | 87,130,787 | | | 84,981,560 | |
| | |
| SEE NOTES TO CONSOLIDATED FINANCIAL STATEMENTS | |
11 |

CONSOLIDATED STATEMENTS OF STOCKHOLDERS’ EQUITY
| | | | | | | | | | | | | | | | | | | | | | |
| | | Common
Stock | | Paid-in
Capital | | Retained
Earnings | | | Accumulated
Other
Comprehensive
Income (loss) | | | Treasury
Stock | | | Total | |
| | | (In thousands) | |
Balance at September 30, 2002 | | $ | 76,212 | | $ | 968,858 | | $ | 66,207 | | | $ | 47,720 | | | $ | (198,279 | ) | | $ | 960,718 | |
Eleven-for-ten stock split
distributed February 21, 2003 | | | 7,622 | | | 79,612 | | | (87,369 | ) | | | | | | | | | | | (135 | ) |
Comprehensive income: | | | | | | | | | | | | | | | | | | | | | | |
Net income | | | | | | | | | 144,999 | | | | | | | | | | | | 144,999 | |
Other comprehensive income,
net of tax of $11,340: | | | | | | | | | | | | | | | | | | | | | | |
Unrealized losses on securities | | | | | | | | | | | | | (20,157 | ) | | | | | | | (20,157 | ) |
Reclassification adjustment | | | | | | | | | | | | | (673 | ) | | | | | | | (673 | ) |
| | | | | | | | | | | | | | | | | | | | |
|
|
|
Total comprehensive income | | | | | | | | | | | | | | | | | | | | | 124,169 | |
Dividends | | | | | | | | | (60,004 | ) | | | | | | | | | | | (60,004 | ) |
Proceeds from exercise of
common stock options | | | 357 | | | 4,369 | | | | | | | | | | | | | | | 4,726 | |
Tax benefit related to
exercise of stock options | | | | | | | | | 1,218 | | | | | | | | | | | | 1,218 | |
Restricted stock | | | 14 | | | 332 | | | (212 | ) | | | | | | | | | | | 134 | |
Proceeds from Employee
Stock Ownership Plan | | | | | | 546 | | | | | | | | | | | 976 | | | | 1,522 | |
Acquisition-related stock issuance | | | 1,349 | | | 31,933 | | | | | | | | | | | | | | | 33,282 | |
Treasury stock | | | | | | | | | | | | | | | | | (10,034 | ) | | | (10,034 | ) |
| | |
|
|
|
Balance at September 30, 2003 | | $ | 85,554 | | $ | 1,085,650 | | $ | 64,839 | | | $ | 26,890 | | | $ | (207,337 | ) | | $ | 1,055,596 | |
| | |
|
|
|
Eleven-for-ten stock split
distributed February 20, 2004 | | | 8,558 | | | 70,066 | | | (78,624 | ) | | | | | | | | | | | | |
Comprehensive income: | | | | | | | | | | | | | | | | | | | | | | |
Net income | | | | | | | | | 131,868 | | | | | | | | | | | | 131,868 | |
Other comprehensive income,
net of tax of $5,326: | | | | | | | | | | | | | | | | | | | | | | |
Unrealized losses on securities | | | | | | | | | | | | | (10,359 | ) | | | | | | | (10,359 | ) |
Reclassification adjustment | | | | | | | | | | | | | 576 | | | | | | | | 576 | |
| | | | | | | | | | | | | | | | | | | | |
|
|
|
Total comprehensive income | | | | | | | | | | | | | | | | | | | | | 122,085 | |
Dividends | | | | | | | | | (64,696 | ) | | | | | | | | | | | (64,696 | ) |
Proceeds from exercise of
common stock options | | | 250 | | | 3,267 | | | | | | | | | | | | | | | 3,517 | |
Tax benefit related to
exercise of stock options | | | | | | | | | 748 | | | | | | | | | | | | 748 | |
Restricted stock | | | 21 | | | 559 | | | (398 | ) | | | | | | | | | | | 182 | |
Proceeds from Employee
Stock Ownership Plan | | | | | | 2,085 | | | | | | | | | | | 2,610 | | | | 4,695 | |
Treasury stock | | | | | | | | | | | | | | | | | (1,939 | ) | | | (1,939 | ) |
| | |
|
|
|
Balance at September 30, 2004 | | $ | 94,383 | | $ | 1,161,627 | | $ | 53,737 | | | $ | 17,107 | | | $ | (206,666 | ) | | $ | 1,120,188 | |
| | |
|
|
|
Eleven-for-ten stock split
distributed February 18, 2005 | | | 9,446 | | | 73,988 | | | (83,434 | ) | | | | | | | | | | | | |
Comprehensive income: | | | | | | | | | | | | | | | | | | | | | | |
Net income | | | | | | | | | 145,889 | | | | | | | | | | | | 145,889 | |
Other comprehensive income,
net of tax of $9,803: | | | | | | | | | | | | | | | | | | | | | | |
Unrealized losses on securities | | | | | | | | | | | | | (20,090 | ) | | | | | | | (20,090 | ) |
Reclassification adjustment | | | | | | | | | | | | | 2,279 | | | | | | | | 2,279 | |
| | | | | | | | | | | | | | | | | | | | |
|
|
|
Total comprehensive income | | | | | | | | | | | | | | | | | | | | | 128,078 | |
Dividends | | | | | | | | | (67,719 | ) | | | | | | | | | | | (67,719 | ) |
Proceeds from exercise of
common stock options | | | 302 | | | 3,704 | | | | | | | | | | | | | | | 4,006 | |
Tax benefit related to exercise
of stock options | | | | | | | | | 954 | | | | | | | | | | | | 954 | |
Restricted stock | | | 10 | | | 257 | | | 8 | | | | | | | | | | | | 275 | |
Proceeds from Employee
Stock Ownership Plan | | | | | | 734 | | | | | | | | | | | 792 | | | | 1,526 | |
Treasury stock | | | | | | | | | | | | | | | | | | | | | | |
| | |
|
|
|
Balance at September 30, 2005 | | $ | 104,141 | | $ | 1,240,310 | | $ | 49,435 | | | $ | (704 | ) | | $ | (205,874 | ) | | $ | 1,187,308 | |
| | |
|
|
|
| | |
12 | | SEE NOTES TO CONSOLIDATED FINANCIAL STATEMENTS |

CONSOLIDATED STATEMENTS OF CASH FLOWS
| | | | | | | | | | | | |
| Year ended September 30, | | 2005 | | | 2004 | | | 2003 | |
| | | (In thousands) | |
| CASH FLOWS FROM OPERATING ACTIVITIES | | | | | | | | | | | | |
Net income | | $ | 145,889 | | | $ | 131,868 | | | $ | 144,999 | |
Adjustments to reconcile net income to net cash provided by operating activities | | | | | | | | | | | | |
Amortization of fees, discounts, and premiums, net | | | (9,959 | ) | | | (12,792 | ) | | | (12,206 | ) |
Amortization of intangible assets | | | 1,198 | | | | 1,397 | | | | 126 | |
Depreciation | | | 3,847 | | | | 2,624 | | | | 3,099 | |
Provision for (reversal of) loan losses | | | (134 | ) | | | (231 | ) | | | 1,500 | |
Loss (gain) on investment securities and real estate held for sale, net | | | 2,091 | | | | 306 | | | | (4,228 | ) |
Loss on extinguishment of debt | | | 2,194 | | | | 5,191 | | | | — | |
Decrease (increase) in accrued interest receivable | | | (4,216 | ) | | | (343 | ) | | | 9,126 | |
Increase (decrease) in income taxes payable | | | (6,307 | ) | | | 1,607 | | | | (5,308 | ) |
FHLB stock dividends | | | (387 | ) | | | (5,912 | ) | | | (8,155 | ) |
Decrease (increase) in other assets | | | 1,898 | | | | 10,195 | | | | (11,202 | ) |
Increase (decrease) in accrued expenses and other liabilities | | | 7,134 | | | | (8,137 | ) | | | 3,226 | |
| | |
|
|
|
Net cash provided by operating activities | | | 143,248 | | | | 125,773 | | | | 120,977 | |
| | |
|
|
|
| | | |
| CASH FLOWS FROM INVESTING ACTIVITIES | | | | | | | | | | | | |
Loans originated | | | | | | | | | | | | |
Single-family residential loans | | | (1,209,555 | ) | | | (1,108,216 | ) | | | (1,059,450 | ) |
Construction loans | | | (716,569 | ) | | | (580,882 | ) | | | (487,692 | ) |
Land loans | | | (358,863 | ) | | | (244,048 | ) | | | (163,533 | ) |
Multi-family loans | | | (151,839 | ) | | | (137,838 | ) | | | (156,437 | ) |
| | |
|
|
|
| | | | (2,436,826 | ) | | | (2,070,984 | ) | | | (1,867,112 | ) |
| | | |
Savings account loans originated | | | (2,282 | ) | | | (1,779 | ) | | | (1,866 | ) |
Loan principal repayments | | | 1,769,058 | | | | 1,693,142 | | | | 2,604,297 | |
Increase in undisbursed loans in process | | | 84,162 | | | | 127,591 | | | | 71,804 | |
Loans purchased | | | (331,456 | ) | | | (31,911 | ) | | | (417,669 | ) |
Repurchase agreements matured (purchased) | | | 200,000 | | | | (200,000 | ) | | | — | |
FHLB stock redeemed | | | 56,208 | | | | 12,489 | | | | — | |
FHLB stock repurchased | | | (48,000 | ) | | | — | | | | — | |
Available-for-sale securities purchased | | | (747,178 | ) | | | (666,990 | ) | | | (459,895 | ) |
Principal payments and maturities of available-for-sale securities | | | 424,476 | | | | 250,431 | | | | 487,438 | |
Available-for-sale securities sold | | | 127,544 | | | | 303,171 | | | | 80,000 | |
Held-to-maturity securities purchased | | | (80,000 | ) | | | (56,900 | ) | | | (100,100 | ) |
Principal payments and maturities of held-to-maturity securities | | | 24,207 | | | | 55,196 | | | | 115,812 | |
Cash provided by acquisition | | | — | | | | — | | | | 94,314 | |
Proceeds from sales of real estate held for sale | | | 6,281 | | | | 14,816 | | | | 16,342 | |
Premises and equipment purchased, net | | | (4,085 | ) | | | (4,731 | ) | | | (4,730 | ) |
| | |
|
|
|
Net cash provided (used) by investing activities | | | (957,891 | ) | | | (576,459 | ) | | | 618,635 | |
| | |
|
|
|
| | | |
| CASH FLOWS FROM FINANCING ACTIVITIES | | | | | | | | | | | | |
Net increase (decrease) in customer accounts | | | 421,147 | | | | 32,760 | | | | (214,248 | ) |
Net increase (decrease) in short-term borrowings | | | 52,806 | | | | (255,191 | ) | | | — | |
Net proceeds from (repayments of) long-term borrowings | | | 530,000 | | | | (200,000 | ) | | | — | |
Proceeds from exercise of common stock options | | | 4,006 | | | | 4,265 | | | | 5,944 | |
Dividends paid | | | (67,719 | ) | | | (64,696 | ) | | | (60,004 | ) |
Proceeds from Employee Stock Ownership Plan | | | 1,526 | | | | 4,695 | | | | 1,522 | |
Treasury stock purchased, net | | | — | | | | (1,939 | ) | | | (10,034 | ) |
Increase (decrease) in advance payments by borrowers for taxes and insurance | | | 2,307 | | | | 1,945 | | | | (737 | ) |
| | |
|
|
|
Net cash provided (used) by financing activities | | | 944,073 | | | | (478,161 | ) | | | (277,557 | ) |
| | |
|
|
|
Increase (decrease) in cash and cash equivalents | | | 129,430 | | | | (928,847 | ) | | | 462,055 | |
Cash and cash equivalents at beginning of year | | | 508,361 | | | | 1,437,208 | | | | 975,153 | |
| | |
|
|
|
Cash and cash equivalents at end of year | | $ | 637,791 | | | $ | 508,361 | | | $ | 1,437,208 | |
| | |
|
|
|
| | |
| SEE NOTES TO CONSOLIDATED FINANCIAL STATEMENTS | |
13 |

CONSOLIDATED STATEMENTS OF CASH FLOWS(CONTINUED)
| | | | | | | | | | |
| Year ended September 30, | | 2005 | | 2004 | | 2003 | |
| | | (In thousands) | |
| SUPPLEMENTAL DISCLOSURES OF CASH FLOW INFORMATION | | | | | | | | | | |
Noncash investing activities | | | | | | | | | | |
Real estate acquired through foreclosure | | $ | 1,839 | | $ | 6,659 | | $ | 11,771 | |
Cash paid during the year for | | | | | | | | | | |
Interest | | | 191,398 | | | 172,195 | | | 195,360 | |
Income taxes | | | 81,553 | | | 75,004 | | | 83,878 | |
| | | |
The following summarizes the non-cash activities related to the United Savings and Loan acquisition | | | | | | | | | | |
Fair value of assets and intangibles acquired, including goodwill | | $ | — | | $ | — | | $ | (343,626 | ) |
Fair value of liabilities assumed | | | — | | | — | | | 276,872 | |
Fair value of stock issued | | | — | | | — | | | 33,282 | |
| | |
|
|
|
Cash paid out in acquisition | | | — | | | — | | | (33,472 | ) |
Plus cash acquired | | | — | | | — | | | 127,786 | |
| | |
|
|
|
Net cash provided by acquisition | | $ | — | | $ | — | | $ | 94,314 | |
| | |
|
|
|
| | |
14 | | SEE NOTES TO CONSOLIDATED FINANCIAL STATEMENTS |

NOTES TO CONSOLIDATED FINANCIAL STATEMENTS
YEARS ENDED SEPTEMBER 30, 2005, 2004 AND 2003
NOTE A | SUMMARY OF SIGNIFICANT ACCOUNTING POLICIES |
Principles of consolidation. The consolidated financial statements include the accounts of Washington Federal, Inc. (Company or Washington Federal) and its wholly owned subsidiaries. Intercompany transactions and balances have been eliminated.
Description of business. Washington Federal, Inc. is a savings and loan holding company. The Company’s principal operating subsidiary is Washington Federal Savings. The Company is principally engaged in the business of attracting savings deposits from the general public and investing these funds, together with borrowings and other funds, in one-to-four family residential real estate loans and multi-family real estate loans. The Company conducts its activities through a network of 122 offices located in Washington, Oregon, Idaho, Utah, Arizona, Nevada, and Texas.
The Company’s fiscal year end is September 30th. All references to 2005 represent balances as of September 30, 2005 or activity for the fiscal year then ended. All references to 2004 represent balances as of September 30, 2004 or activity for the fiscal year then ended.
Cash and cash equivalents. Cash and cash equivalents include cash on hand, amounts due from banks, overnight investments and repurchase agreements with an initial maturity of three months or less.
Repurchase Agreements. Repurchase agreements are fully collateralized investments with an initial maturity exceeding three months.
Investments and mortgage-backed securities. The Company accounts for investments and mortgage-backed securities in two categories: held-to-maturity and available-for-sale.
Held-to-maturity securities– Securities classified as held-to-maturity are accounted for at amortized cost, but the Company must have both the positive intent and the ability to hold those securities to maturity. There are very limited circumstances under which securities in the held-to-maturity category can be sold without jeopardizing the cost basis of accounting for the remainder of the securities in this category.
Available-for-sale securities – Securities not classified as held-to-maturity are considered to be available-for-sale. Gains and losses realized on the sale of these securities are based on the specific identification method. Unrealized gains and losses for available-for-sale securities are excluded from earnings and reported as a net amount in the accumulated other comprehensive income component of stockholders’ equity.
Management evaluates debt and equity securities for other than temporary impairment on a quarterly basis based on the securities’ current credit quality, interest rates, term to maturity and management’s intent and ability to hold the securities until the net book value is recovered. Any other than temporary declines in fair value are recognized in the statement of operations as loss on sale of investments.
Premiums and discounts on investments are deferred and recognized over the life of the asset using the effective interest method.
Securitized assets subject to repurchase. In March 2001, the Company transferred some of its permanent single-family residential loans into a Real Estate Mortgage Investment Conduit (REMIC). The REMIC then issued securities backed by such loans, all of which were retained by the Company. The terms of the transfer of the loans to the REMIC contain a call provision whereby the Company can repurchase the loans when the outstanding balance of the pool declines to 15% or less of the original amount; therefore, the transfer did not qualify as a sale under generally accepted accounting principles. Accordingly, the retained interests continue to be accounted for in a manner similar to loans and are included in the accompanying statement of financial condition as securitized assets subject to repurchase.
Loans receivable. Loans receivable more than 90 days past due are placed on non-accrual status and an allowance for accrued interest is established. Any interest ultimately collected is credited to income in the period of recovery.
The Company maintains an allowance for loan losses to absorb losses inherent in the loan portfolio. The allowance is based on ongoing, quarterly assessments of the probable and estimable losses inherent in the loan portfolio. The Company’s methodology for assessing the appropriateness of the allowance consists of several key elements, which include the formula allowance and specific allowances.
15
NOTES TO CONSOLIDATED FINANCIAL STATEMENTS(CONTINUED)
The formula portion of the general loan loss allowance is established by applying a loss percentage factor to the different loan types. The allowances are provided based on Management’s continuing evaluation of the pertinent factors underlying the quality of the loan portfolio, including changes in the size and composition of the loan portfolio, actual loan loss experience, current economic conditions, geographic concentrations, seasoning of the loan portfolio, specific industry conditions, and the duration of the current business cycle. The recovery of the carrying value of loans is susceptible to future market conditions beyond the Company’s control, which may result in losses or recoveries differing from those provided.
Specific allowances are established in cases where Management has identified significant conditions or circumstances related to a loan that Management believes indicate the probability that a loss has been incurred.
Impaired loans consist of loans receivable that are not expected to be repaid in accordance with their contractual terms and are measured using the fair value of the collateral. Smaller balance loans are excluded from this analysis.
Premises and equipment. Premises and equipment are stated at cost, less accumulated depreciation. Depreciation is computed on the straight-line method over the estimated useful lives of the respective assets. Expenditures are capitalized for betterments and major renewals. Charges for ordinary maintenance and repairs are expensed to operations as incurred.
Real estate held for sale. Properties acquired in settlement of loans or acquired for development are recorded at the lower of cost or fair value.
Derivatives. The Company accepts a high level of interest rate risk as a result of its policy to originate fixed-rate single-family home loans that are longer-term than the short-term characteristics of its liabilities of customer accounts and borrowed money. The Company enters into forward contracts (derivative contract) to purchase mortgage-backed securities as part of its interest rate risk management program. The forward contracts allow the Company to hedge the risk of varying mortgage-backed securities spot prices in the future as the result of changes in interest rates. The purchase contracts are generally for periods of 30 to 90 days.
On the date the Company enters into a derivative contract, the derivative instrument is designated as a hedge of the variability in expected future cash flows associated with a probable future transaction. Under cash flow hedge accounting, if specific criteria are met, the effective portion of the derivative instrument is recognized as a component of stockholders’ equity through comprehensive income until the related forecasted transaction affects earnings, either through the recognition of interest income or through the sale of the security. To the extent that forward contracts to purchase securities are not designated as cash flow hedges or fail to meet hedging criteria, including purchasing the mortgage-backed securities within a specific time frame, the fair value of the contracts will be included in earnings. As of September 30, 2005 and 2004, the Company had outstanding forward purchase commitments of $20,000,000 and $315,000,000 with an estimated fair value of $0 and $10,259,000, respectively.
During 2005, the Company reviewed its accounting for derivatives and concluded that it had not met the criteria established by Statement of Financial Accounting Standards No. 133 as amended to account for such instruments as cash flow hedges. The cumulative effect of the correction of the error, as of January 1, 2005 was $7.9 million, net of tax. The amount was recorded as additional interest income on mortgage-backed securities and loss on sale of securities, in March 2005. The effect of the error was not material to any prior quarter in 2005 or 2004, nor was it material to any prior year.
Intangible assets. Goodwill represents the excess of the cost of businesses acquired over the fair value of the net assets acquired. The core deposit intangible and non-compete agreement intangible are acquired assets that lack physical substance but can be distinguished from goodwill. Goodwill is evaluated for impairment on an annual basis. Other intangible assets are amortized over their estimated lives and are subject to impairment testing when events or circumstances change. If circumstances indicate that the carrying value of the assets may not be recoverable, an impairment charge could be recorded. No impairment of intangible assets has ever been identified. The Company amortizes the core deposit intangible on an accelerated basis over its estimated life of seven years; the non-compete agreement intangible is amortized on a straight-line basis over its life of five years.
16
The table below presents the estimated intangible asset amortization expense for the next five years:
| | | |
| Year ended September 30, | | Amortization expense |
| | | (In thousands) |
| 2006 | | $ | 1,000 |
| 2007 | | | 801 |
| 2008 | | | 593 |
| 2009 | | | 289 |
| 2010 | | | 91 |
Deferred fees and discounts on loans. Loan discounts and loan fees are deferred and recognized over the life of the loans using the effective interest method based on actual loan payments. Deferred loan origination costs are deducted from other expenses.
Accounting for stock-based compensation. In October 1995, the Financial Accounting Standards Board (FASB) issued Statement of Financial Accounting Standards (SFAS) No. 123, “Accounting for Stock-Based Compensation”. SFAS No. 123 requires expanded disclosures of stock-based compensation arrangements with employees and encourages application of the fair value recognition provisions in the statement. Companies may continue following rules to recognize and measure compensation as outlined in Accounting Principles Board (APB) Opinion No. 25, “Accounting for Stock Issued to Employees”, but are now required to disclose the pro forma amounts of net income and earnings per share that would have been reported had the Company elected to follow the fair value recognition provisions of SFAS No. 123. The Company adopted the disclosure requirements of SFAS No. 123, but continues to measure its stock-based employee compensation arrangements under the provisions of APB Opinion No. 25 and related Interpretations. In December 2002, the FASB issued SFAS No. 148, “Accounting for Stock-Based Compensation – Transition and Disclosure” which provides guidance on the transition from the intrinsic value method of accounting for stock-based employee compensation under APB Opinion No. 25 to the fair value method described in SFAS No. 123, if a company elects to do so. The Company has elected to continue to follow the intrinsic value method in accounting for stock options as provided in APB Opinion No. 25.
The Company has three stock-option employee compensation plans, which are described more fully in Note L. The fair value of options granted under the Company’s stock option plans is estimated on the date of grant using the Black-Scholes option-pricing model which utilizes the weighted-average assumptions in the following table:
| | | | | | |
| Year ended September 30, | | 2004 | | | 2003 | |
Annual dividend yield | | 3.42 | % | | 4.19 | % |
Expected volatility | | 27 | % | | 28 | % |
Risk-free interest rate | | 3.14 | % | | 2.63 | % |
Expected life | | 5 years | | | 5 years | |
17
NOTES TO CONSOLIDATED FINANCIAL STATEMENTS(CONTINUED)
No options were granted in 2005; as a result no assumptions for 2005 are presented in the table on page 17. No stock-option employee compensation cost is reflected in net income, as all options granted had an exercise price equal to the market value of the underlying common stock on the date of grant, and the number of shares of each grant is fixed at the grant date. The following table illustrates the effect on net income and earnings per share if the Company had applied the fair value recognition provisions of SFAS No. 123:
| | | | | | | | | | | | |
| Year ended September 30, | | 2005 | | | 2004 | | | 2003 | |
| | | (In thousands, except per share data) | |
Net income, as reported | | $ | 145,889 | | | $ | 131,868 | | | $ | 144,999 | |
Deduct: Total stock-based employee compensation expense determined under fair value based method for all awards, net of related tax effects | | | (1,717 | ) | | | (1,824 | ) | | | (1,111 | ) |
| | |
|
|
|
Pro forma net income | | $ | 144,172 | | | $ | 130,044 | | | $ | 143,888 | |
| | |
|
|
|
Earnings per share: | | | | | | | | | | | | |
Basic – as reported | | $ | 1.68 | | | $ | 1.53 | | | $ | 1.72 | |
Basic – pro forma | | | 1.66 | | | | 1.51 | | | | 1.71 | |
Diluted – as reported | | | 1.67 | | | | 1.51 | | | | 1.71 | |
Diluted – pro forma | | | 1.65 | | | | 1.49 | | | | 1.69 | |
Use of estimates. The preparation of financial statements in conformity with accounting principles generally accepted in the United States of America requires Management to make estimates and assumptions that affect the reported amounts of assets and liabilities and disclosure of contingent assets and liabilities at the date of the financial statements and the reported amounts of revenues and expenses during the reporting period. Significant estimates reported in the financial statements include the allowance for loan losses, intangible assets, deferred taxes and contingent liabilities. Actual results could differ from these estimates.
In the second quarters of 2005, 2004 and 2003, the Company declared an eleven-for-ten stock split in the form of a 10% stock dividend. All share and per share amounts have been adjusted to reflect these stock dividends.
Business segments. The Company has determined that its current business and operations consist of one business segment.
Accounting changes. In December 2004, the FASB issued SFAS No. 123R, “Share-Based Payment” (“SFAS 123R”), a revision of SFAS No. 123. SFAS 123R will require the Company to, among other things, measure all employee stock-based compensation awards using a fair value method and record such expense in the Company’s consolidated financial statements. The provisions of SFAS 123R, as amended by SEC Staff Accounting Bulletin No. 107, “Share-Based Payment,” are effective no later than the beginning of the next fiscal year that begins after June 15, 2005; the Company will adopt the new requirements in its first quarter of fiscal 2006 using the modified prospective transition method. The adoption of SFAS 123R will increase the Company’s future compensation expense for unvested awards outstanding as of September 30, 2005 by the following estimated amounts:
| | | |
| Year ended September 30, | | Estimated Additional
Compensation Expense |
| | | (In thousands) |
2006 | | $ | 1,552 |
2007 | | | 1,150 |
2008 | | | 1,101 |
2009 | | | 723 |
2010 | | | 685 |
Reclassifications. Certain reclassifications have been made to the financial statements for years prior to September 30, 2005 to conform to current year classifications.
18
NOTE B | INVESTMENT SECURITIES |
| | | | | | | | | | | | | | | | |
| September 30, | | 2005 | |
| | | (In thousands) | |
| | | Amortized
Cost | | Gross Unrealized
| | | Fair
Value | | | |
| | | | Gains | | Losses | | | | Yield | |
Available-for-sale securities | | | | | | | | | | | | | | | | |
U.S. government and agency securities due | | | | | | | | | | | | | | | | |
Within 1 year | | $ | 72,290 | | $ | 1,477 | | $ | (288 | ) | | | 73,479 | | 7.52 | % |
1 to 5 years | | | 15,094 | | | — | | | (245 | ) | | | 14,849 | | 4.29 | |
5 to 10 years | | | 1,000 | | | — | | | (20 | ) | | | 980 | | 3.50 | |
Over 10 years | | | 84,692 | | | 4,695 | | | (760 | ) | | | 88,627 | | 8.00 | |
Mortgage-backed Securities | | | | | | | | | | | | | | | | |
Agency pass-through certificates | | | 905,893 | | | 3,436 | | | (9,408 | ) | | | 899,921 | | 5.58 | |
| | |
|
|
|
| | | | 1,078,969 | | | 9,608 | | | (10,721 | ) | | | 1,077,856 | | 5.88 | |
| | |
|
|
|
Held-to-maturity securities | | | | | | | | | | | | | | | | |
Tax-exempt municipal bonds due | | | | | | | | | | | | | | | | |
5 to 10 years | | | 1,800 | | | 211 | | | — | | | | 2,011 | | 9.06 | |
Over 10 years | | | 8,358 | | | 734 | | | — | | | | 9,092 | | 8.61 | |
U.S. government and agency securities due | | | | | | | | | | | | | | | | |
1 to 5 years | | | 26,900 | | | — | | | (424 | ) | | | 26,476 | | 2.95 | |
Mortgage-backed Securities | | | | | | | | | | | | | | | | |
Agency pass-through certificates | | | 175,421 | | | 1,408 | | | (2,812 | ) | | | 174,017 | | 5.60 | |
| | |
|
|
|
| | | | 212,479 | | | 2,353 | | | (3,236 | ) | | | 211,596 | | 5.41 | |
| | |
|
|
|
| | | $ | 1,291,448 | | $ | 11,961 | | $ | (13,957 | ) | | $ | 1,289,452 | | 5.80 | % |
| | |
|
|
|
| | | | | | | | | | | | | | | | |
| September 30, | | 2004 | |
| | | (In thousands) | |
| | | Amortized
Cost | | Gross Unrealized
| | | Fair
Value | | | |
| | | | Gains | | Losses | | | | Yield | |
Available-for-sale securities | | | | | | | | | | | | | | | | |
U.S. government and agency securities due | | | | | | | | | | | | | | | | |
Within 1 year | | $ | 328,503 | | $ | 379 | | $ | (4,546 | ) | | | 324,336 | | 4.47 | % |
5 to 10 years | | | 36,537 | | | 970 | | | (610 | ) | | | 36,897 | | 5.90 | |
Over 10 years | | | 11,372 | | | 5,078 | | | (61 | ) | | | 16,389 | | 9.79 | |
Mortgage-backed Securities | | | | | | | | | | | | | | | | |
Agency pass-through certificates | | | 501,102 | | | 21,222 | | | (421 | ) | | | 521,903 | | 6.16 | |
| | |
|
|
|
| | | | 877,514 | | | 27,649 | | | (5,638 | ) | | | 899,525 | | 5.56 | |
| | |
|
|
|
Held-to-maturity securities | | | | | | | | | | | | | | | | |
Tax-exempt municipal bonds due | | | | | | | | | | | | | | | | |
5 to 10 years | | | 1,804 | | | 309 | | | — | | | | 2,113 | | 9.06 | |
Over 10 years | | | 8,357 | | | 1,052 | | | — | | | | 9,409 | | 8.61 | |
U.S. government and agency securities due | | | | | | | | | | | | | | | | |
1 to 5 years | | | 26,900 | | | — | | | — | | | | 26,900 | | 2.95 | |
Mortgage-backed Securities | | | | | | | | | | | | | | | | |
Agency pass-through certificates | | | 119,312 | | | 2,705 | | | (1,647 | ) | | | 120,370 | | 5.76 | |
| | |
|
|
|
| | | | 156,373 | | | 4,066 | | | (1,647 | ) | | | 158,792 | | 5.47 | |
| | |
|
|
|
| | | $ | 1,033,887 | | $ | 31,715 | | $ | (7,285 | ) | | $ | 1,058,317 | | 5.55 | % |
| | |
|
|
|
19
NOTES TO CONSOLIDATED FINANCIAL STATEMENTS(CONTINUED)
Yields shown in the tables on page 19 represent tax-equivalent yields for 2005 and 2004, calculated as 1.48 and 1.49 times the tax-free municipal yield, for the respective years.
$127.5 million in available-for-sale investment securities were sold in 2005, resulting in a net loss of $3,534,000. This net loss for 2005 consisted of $1,793,000 in realized gains and $5,327,000 in realized losses. In 2004, $303.2 million in available-for-sale investment securities and a $1.8 million held-to-maturity (HTM) security were sold, resulting in a net loss of $890,000. The net loss for 2004 consisted of $2,422,000 in realized gains and $3,312,000 in realized losses. The $1.8 million HTM security sale did not taint the remaining HTM securities in the Company’s portfolio because over 87% of the related principal had been collected. $80.0 million in available-for-sale securities were sold in 2003, resulting in a net gain of $1,040,000.
Substantially all mortgage-backed securities have contractual due dates that exceed 10 years.
The following table shows the unrealized gross losses and fair value of securities at September 30, 2005, by length of time that individual securities in each category have been in a continuous loss position. The Company had investments in mortgage-backed securities, bonds and GSE preferred stock that were in a continuous loss position for 12 or more months at September 30, 2005. During the year the Company recorded a $4.1 million other than temporary impairment on GSE preferred stock, included in loss on sale of investments. Management believes that the declines in fair value of the mortgage-backed securities, bonds and GSE preferred stock were due to changes in market interest rates, not in estimated cash flows, and no other than temporary impairment was recorded at September 30, 2005 for these investments.
| | | | | | | | | | | | | | | | | | | | | | | | | | |
| As of September 30, | | 2005 | |
| | | (In thousands) | |
| | | Less than 12 months
| | | | 12 months or more
| | | | Total
| |
| | | Unrealized | | | Fair | | | | Unrealized | | | Fair | | | | Unrealized | | | Fair | |
| | | Gross Losses
| | | Value
| | | | Gross Losses
| | | Value
| | | | Gross Losses
| | | Value
| |
U.S. agency securities | | $ | (1,061 | ) | | $ | 112,637 | | | | $ | (676 | ) | | $ | 31,318 | | | | $ | (1,737 | ) | | $ | 143,955 | |
Agency pass-through certificates | | | (8,320 | ) | | | 770,188 | | | | | (3,900 | ) | | | 158,898 | | | | | (12,220 | ) | | | 929,086 | |
| | |
|
|
|
| | | $ | (9,381 | ) | | $ | 882,825 | | | | $ | (4,576 | ) | | $ | 190,216 | | | | $ | (13,957 | ) | | $ | 1,073,041 | |
NOTE C | LOANS RECEIVABLE AND SECURITIZED ASSETS SUBJECT TO REPURCHASE |
| | | | | | | |
| September 30, | | 2005 | | 2004 | |
| | | (In thousands) | |
Conventional real estate | | | | | | | |
Single-family residential | | $ | 4,630,411 | | $ | 3,982,632 | |
Multi-family | | | 501,824 | | | 467,354 | |
Land | | | 438,621 | | | 297,350 | |
Construction | | | 1,021,419 | | | 845,260 | |
| | |
|
|
|
| | | | 6,592,275 | | | 5,592,596 | |
| | |
|
|
|
Less | | | | | | | |
Allowance for probable losses | | | 24,756 | | | 25,140 | |
Loans in process | | | 519,290 | | | 435,128 | |
Deferred net loan origination fees | | | 39,297 | | | 38,885 | |
| | |
|
|
|
| | | | 583,343 | | | 499,153 | |
| | |
|
|
|
| | | $ | 6,008,932 | | $ | 5,093,443 | |
| | |
|
|
|
20
The Company originates adjustable and fixed interest rate loans, which at September 30, 2005 consisted of the following:
| | | | | | | | | | |
| Fixed-Rate | | | | Adjustable-Rate |
| Term to Maturity | | Book Value | | | | Term to Rate Adjustment | | Book Value |
| | | (In thousands) | | | | | | (In thousands) |
Within 1 year | | $ | 49,259 | | | | Less than 1 year | | $ | 976,907 |
1 to 3 years | | | 103,122 | | | | 1 to 3 years | | | 246,653 |
3 to 5 years | | | 35,766 | | | | 3 to 5 years | | | 102,301 |
5 to 10 years | | | 221,593 | | | | 5 to 10 years | | | 5,317 |
10 to 20 years | | | 509,041 | | | | 10 to 20 years | | | 8,462 |
Over 20 years | | | 4,333,854 | | | | Over 20 years | | | — |
| | |
|
| | | | | |
|
|
| | | $ | 5,252,635 | | | | | | $ | 1,339,640 |
| | |
|
| | | | | |
|
|
At September 30, 2005 and 2004, approximately $47,537,000 and $36,214,000 of fixed-rate loan origination commitments were outstanding, respectively. Loans serviced for others at September 30, 2005 and 2004 were approximately $14,857,000 and $22,368,000, respectively.
Permanent single-family residential loans receivable included adjustable-rate loans of $82,968,000 and $66,431,000 at September 30, 2005 and 2004, respectively. These loans have interest rate adjustment limitations and are generally indexed to the 1-year Treasury Bill rate or the monthly weighted-average cost of funds for Eleventh District savings institutions as published by the FHLB.
Loans by geographic concentration were as follows:
| | | | | | | | | | | | | | | | | | | | | | |
| September 30, 2005 | | Washington | | Idaho | | Oregon | | Utah | | Arizona | | Other | | Total | |
| | | (In thousands) | |
Conventional real estate | | | | | | | | | | | | | | | | | | | | | | |
Single-family
residential | | $ | 1,804,054 | | $ | 497,489 | | $ | 765,195 | | $ | 441,532 | | $ | 448,529 | | $ | 673,612 | | $ | 4,630,411 | |
Multi-family | | | 99,428 | | | 37,473 | | | 216,596 | | | 32,468 | | | 88,393 | | | 27,466 | | | 501,824 | |
Land | | | 221,002 | | | 47,357 | | | 46,906 | | | 33,621 | | | 58,103 | | | 31,632 | | | 438,621 | |
Construction | | | 446,287 | | | 127,655 | | | 184,968 | | | 99,452 | | | 99,089 | | | 63,968 | | | 1,021,419 | |
| | |
|
|
|
| | | $ | 2,570,771 | | $ | 709,974 | | $ | 1,213,665 | | $ | 607,073 | | $ | 694,114 | | $ | 796,678 | | $ | 6,592,275 | |
| | |
|
|
|
At September 30, 2005, the Company’s recorded investment in impaired loans was $0.9 million with allocated reserves of $0.3 million. At September 30, 2004 the Company’s recorded investment in impaired loans was $2.2 million with allocated reserves of $0.7 million. The average balance of impaired loans during 2005, 2004 and 2003 was $1.1 million, $4.6 million and $13.3 million and interest income from impaired loans was $71,000, $283,000 and $851,000, respectively.
NOTE D | ALLOWANCE FOR LOSSES ON LOANS AND SECURITIZED ASSETS SUBJECT TO REPURCHASE |
| | | | | | | | | | | | |
| Year ended September 30, | | 2005 | | | 2004 | | | 2003 | |
| | | (In thousands) | |
Balance at beginning of year | | $ | 25,140 | | | $ | 25,806 | | | $ | 23,912 | |
Provision for (reversal of) loan losses | | | (134 | ) | | | (231 | ) | | | 1,500 | |
Charge-offs | | | (258 | ) | | | (528 | ) | | | (1,310 | ) |
Recoveries | | | 8 | | | | 93 | | | | 107 | |
Acquired reserves | | | — | | | | — | | | | 1,597 | |
| | |
|
|
|
Balance at end of year | | $ | 24,756 | | | $ | 25,140 | | | $ | 25,806 | |
| | |
|
|
|
21
NOTES TO CONSOLIDATED FINANCIAL STATEMENTS(CONTINUED)
NOTE E | INTEREST RECEIVABLE |
| | | | | | | | |
| September 30, | | 2005 | | | 2004 | |
| | | (In thousands) | |
Loans receivable | | $ | 27,262 | | | $ | 24,094 | |
Allowance for uncollected interest on loans receivable | | | (235 | ) | | | (464 | ) |
Mortgage-backed securities | | | 4,989 | | | | 3,159 | |
Investment securities | | | 2,032 | | | | 3,043 | |
| | |
|
|
|
| | | $ | 34,048 | | | $ | 29,832 | |
| | |
|
|
|
NOTE F | PREMISES AND EQUIPMENT |
| | | | | | | | | | |
| September 30, | | | | 2005 | | | 2004 | |
| | | | | (In thousands) | |
| | | Estimated | | | | | | |
| | | Useful Life
| | | | | | |
Land | | — | | $ | 22,985 | | | $ | 22,808 | |
Buildings | | 25 - 40 | | | 59,204 | | | | 55,777 | |
Leasehold improvements | | 5 - 15 | | | 3,563 | | | | 5,564 | |
Furniture, fixtures and equipment | | 2 - 10 | | | 14,324 | | | | 14,484 | |
| | | | |
|
|
|
| | | | | | 100,076 | | | | 98,633 | |
Less accumulated depreciation and amortization | | | (36,789 | ) | | | (35,584 | ) |
| | | | |
|
|
|
| | | | | $ | 63,287 | | | $ | 63,049 | |
| | | | |
|
|
|
The Company has non-cancelable operating leases for branch offices. Future minimum net rental commitments for all non-cancelable leases, including maintenance and associated costs, are immaterial. Rental expense, including amounts paid under month-to-month cancelable leases, amounted to $2,033,000, $1,949,000 and $1,862,000 in 2005, 2004 and 2003, respectively.
22
| | | | | | | |
| September 30, | | 2005 | | 2004 | |
| | | (In thousands) | |
Checking accounts, 1.00% and under | | $ | 205,482 | | $ | 196,155 | |
Passbook and statement accounts, 1.25% | | | 191,919 | | | 224,989 | |
Insured money market accounts, .50% to 3.25% | | | 871,945 | | | 929,952 | |
Certificate accounts | | | | | | | |
Less than 3.00% | | | 1,110,932 | | | 2,590,304 | |
3.00% to 3.99% | | | 2,187,450 | | | 229,606 | |
4.00% to 4.99% | | | 343,029 | | | 280,166 | |
5.00% to 5.99% | | | 88,847 | | | 101,973 | |
6.00% to 6.99% | | | 2,568 | | | 16,100 | |
| | |
|
|
|
Total certificates | | | 3,732,826 | | | 3,218,149 | |
| | |
|
|
|
Repurchase agreements with customers, .75% to 2.20% | | | 29,333 | | | 41,113 | |
| | |
|
|
|
| | | $ | 5,031,505 | | $ | 4,610,358 | |
| | |
|
|
|
Certificate maturities were as follows: | | | | | | | |
| | |
| September 30, | | 2005 | | 2004 | |
| | | (In thousands) | |
Within 1 year | | $ | 3,019,716 | | $ | 2,355,240 | |
1 to 2 years | | | 485,259 | | | 445,037 | |
3 to 4 years | | | 93,849 | | | 282,248 | |
Over 4 years | | | 134,002 | | | 135,624 | |
| | |
|
|
|
| | | $ | 3,732,826 | | $ | 3,218,149 | |
| | |
|
|
|
Customer accounts over $100,000 totaled $1,365,000,000 as of September 30, 2005 and $1,199,000,000 as of September 30, 2004.
Interest expense on customer accounts consisted of the following:
| | | | | | | | | | | | |
| Year ended September 30, | | 2005 | | | 2004 | | | 2003 | |
| | | (In thousands) | |
Checking accounts | | $ | 1,342 | | | $ | 1,199 | | | $ | 1,655 | |
Passbook and statement accounts | | | 1,985 | | | | 1,703 | | | | 2,114 | |
Insured money market accounts | | | 15,154 | | | | 8,185 | | | | 14,947 | |
Certificate accounts | | | 97,247 | | | | 74,559 | | | | 85,931 | |
| | |
|
|
|
| | | | 115,728 | | | | 85,646 | | | | 104,647 | |
Repurchase agreements with customers | | | 668 | | | | 858 | | | | 1,651 | |
| | |
|
|
|
| | | | 116,396 | | | | 86,504 | | | | 106,298 | |
Less early withdrawal penalties | | | (570 | ) | | | (405 | ) | | | (379 | ) |
| | |
|
|
|
| | | $ | 115,826 | | | $ | 86,099 | | | $ | 105,919 | |
| | |
|
|
|
Weighted average interest rate at end of year | | | 2.99 | % | | | 2.00 | % | | | 1.94 | % |
Weighted daily average interest rate during the year | | | 2.47 | % | | | 1.89 | % | | | 2.38 | % |
23
NOTES TO CONSOLIDATED FINANCIAL STATEMENTS(CONTINUED)
Maturity dates of FHLB advances were as follows:
| | | | | | | |
| September 30, | | 2005 | | 2004 | |
| | | (In thousands) | |
FHLB advances due | | | | | | | |
Within 1 year | | $ | — | | $ | — | |
1 to 3 years | | | 330,000 | | | 100,000 | |
4 to 5 years | | | — | | | 400,000 | |
More than 5 years | | | 900,000 | | | 700,000 | |
| | |
|
|
|
| | | $ | 1,230,000 | | $ | 1,200,000 | |
| | |
|
|
|
All of the 2005 advances and $1,100,000,000 of the 2004 advances included in the above table are callable by the FHLB. If these callable advances were to be called at the earliest call dates, the maturities of all FHLB advances would be as follows:
| | | | | | | |
| September 30, | | 2005 | | 2004 | |
| | | (In thousands) | |
FHLB advances callable | | | | | | | |
Within 1 year | | $ | 530,000 | | $ | 800,000 | |
1 to 3 years | | | 100,000 | | | 400,000 | |
4 to 5 years | | | — | | | — | |
More than 5 years | | | 600,000 | | | — | |
| | |
|
|
|
| | | $ | 1,230,000 | | $ | 1,200,000 | |
| | |
|
|
|
Financial data pertaining to the weighted-average cost and the amount of FHLB advances were as follows:
| | | | | | | | | | | | |
| September 30, | | 2005 | | | 2004 | | | 2003 | |
| | | (In thousands) | |
Weighted average interest rate at end of year | | | 4.88 | % | | | 5.09 | % | | | 5.13 | % |
Weighted daily average interest rate during the year | | | 5.18 | % | | | 5.21 | % | | | 5.19 | % |
Daily average of FHLB advances | | $ | 1,206,267 | | | $ | 1,539,594 | | | $ | 1,650,023 | |
Maximum amount of FHLB advances at any month end | | | 1,230,000 | | | | 1,651,000 | | | | 1,654,000 | |
Interest expense during the year | | | 62,050 | | | | 80,225 | | | | 85,564 | |
FHLB advances are collateralized as provided for in the Advances, Pledge and Security Agreement by all FHLB stock owned by the Company, deposits with the FHLB and certain mortgages or deeds of trust securing such properties as provided in the agreements with the FHLB. As a member of the FHLB of Seattle, the Company currently has a credit line of 35% of the total assets of the Company, subject to collateralization requirements.
24
Maturity dates of securities sold under agreements to repurchase (reverse repurchase agreements) were as follows:
| | | | | | | |
| September 30, | | 2005 | | 2004 | |
| | | (In thousands) | |
Reverse repurchase agreements due | | | | | | | |
Within 1 year | | $ | — | | $ | — | |
1 to 3 years | | | — | | | — | |
4 to 5 years | | | 300,000 | | | — | |
More than 5 years | | | 300,000 | | | 100,000 | |
| | |
|
|
|
| | | $ | 600,000 | | $ | 100,000 | |
| | |
|
|
|
All of the reverse repurchase agreements included in the above table are callable by the counterparty. If these were to be called at the earliest call dates, the maturities of the reverse repurchase agreements would be as follows:
| | | | | | | |
| September 30, | | 2005 | | 2004 | |
| | | (In thousands) | |
Reverse repurchase agreements callable | | | | | | | |
Within 1 year | | $ | — | | $ | — | |
1 to 3 years | | | 100,000 | | | — | |
4 to 5 years | | | 500,000 | | | 100,000 | |
More than 5 years | | | — | | | — | |
| | |
|
|
|
| | | $ | 600,000 | | $ | 100,000 | |
| | |
|
|
|
Other borrowings on the Statement of Financial Condition included the $600,000,000 of reverse repurchase agreements presented in the table above as well as $55,000,000 of short-term borrowings due October 3, 2005 bearing an interest rate of 3.94%.
The Company enters into sales of reverse repurchase agreements. Fixed-coupon reverse repurchase agreements are treated as financings, and the obligations to repurchase securities sold are reflected as a liability in the consolidated statements of financial condition. During the three years ended September 30, 2005 all of the Company’s transactions were fixed-coupon reverse repurchase agreements. The dollar amount of securities underlying the agreements remain in the asset accounts. The securities pledged are registered in the Company’s name, and principal and interest payments are received by the Company; however, the securities are held by the designated trustee of the broker. Upon maturity of the agreements, the identical securities pledged as collateral will be returned to the Company.
Financial data pertaining to the weighted-average cost and the amount of securities sold under agreements to repurchase were as follows:
| | | | | | | | | | | | |
| September 30, | | 2005 | | | 2004 | | | 2003 | |
| | | (In thousands) | |
Weighted average interest rate at end of year | | | 3.80 | % | | | 3.44 | % | | | 3.44 | % |
Weighted daily average interest rate during the year | | | 3.79 | % | | | 3.40 | % | | | 3.39 | % |
Daily average of securities sold under agreements to repurchase | | $ | 458,082 | | | $ | 100,000 | | | $ | 100,000 | |
Maximum securities sold under agreements to repurchase at any month end | | | 600,000 | | | | 100,000 | | | | 100,000 | |
Interest expense during the year | | | 17,384 | | | | 3,397 | | | | 3,388 | |
25
NOTES TO CONSOLIDATED FINANCIAL STATEMENTS(CONTINUED)
The consolidated statements of financial condition at September 30, 2005 and 2004 include deferred tax liabilities of $43,491,000 and $55,522,000, respectively, that have been provided for the temporary differences between the tax basis and the financial statement carrying amounts of assets and liabilities. The major sources of these temporary differences and their deferred tax effects were as follows:
| | | | | | | |
| September 30, | | 2005 | | 2004 | |
| | | (In thousands) | |
Deferred tax assets | | | | | | | |
Valuation adjustment on available-for-sale securities | | $ | 409 | | $ | — | |
Deferred compensation | | | 156 | | | 176 | |
Loan loss reserves | | | 9,145 | | | 9,176 | |
| | |
|
|
|
Total deferred tax assets | | | 9,710 | | | 9,352 | |
| | |
|
|
|
Deferred tax liabilities | | | | | | | |
Federal Home Loan Bank stock dividends | | | 31,256 | | | 32,838 | |
Core deposit intangible | | | 909 | | | 1,300 | |
Deferred gain on forward commitments | | | 3,633 | | | 4,360 | |
Valuation adjustment on available-for-sale securities | | | — | | | 9,313 | |
Depreciation | | | 6,211 | | | 6,139 | |
Loan origination costs | | | 10,808 | | | 9,926 | |
Securitized asset subject to repurchase valuation adjustment | | | 237 | | | 365 | |
Other, net | | | 147 | | | 633 | |
| | |
|
|
|
Total deferred tax liabilities | | | 53,201 | | | 64,874 | |
| | |
|
|
|
Net deferred tax liability | | $ | 43,491 | | $ | 55,522 | |
| | |
|
|
|
A reconciliation of the statutory federal income tax rate to the effective income tax rate follows:
| | | | | | | | | |
| Year ended September 30, | | 2005 | | | 2004 | | | 2003 | |
Statutory income tax rate | | 35 | % | | 35 | % | | 35 | % |
Dividend received deduction | | (2 | ) | | (1 | ) | | (1 | ) |
Other timing difference | | (1 | ) | | (1 | ) | | (1 | ) |
State income tax | | 3 | | | 2 | | | 2 | |
| | |
|
|
Effective income tax rate | | 35 | % | | 35 | % | | 35 | % |
| | |
|
|
The Small Business Job Protection Act of 1996 (the Act) required qualified thrift institutions, such as the Company, to recapture the portion of their tax bad debt reserves that exceeded the September 30, 1988 balance. Such recaptured amounts are to be taken into taxable income ratably over a six-year period beginning in 1999. Accordingly, the Company was required to pay approximately $25,406,000 in additional federal income taxes, all of which had been previously provided, through 2004.
The Company has been examined by the Internal Revenue Service through the year ended September 30, 1990. There were no material changes made to the Company’s originally reported taxable income as a result of this examination.
NOTE K | PROFIT SHARING RETIREMENT PLAN AND EMPLOYEE STOCK OWNERSHIP PLAN |
The Company maintains a Profit Sharing Retirement Plan and Employee Stock Ownership Plan (Plan) for the benefit of its employees. Company contributions are made semi-annually as approved by the Board of Directors. Such amounts are not in excess of amounts permitted by the Employee Retirement Income Security Act of 1974.
Plan participants may make voluntary after-tax contributions of their considered earnings as defined by the Plan. In addition, participants may make pre-tax contributions up to the statutory limits
26
| | through the 401(k) provisions of the Plan. The annual addition from contributions to an individual participant’s account in this Plan cannot exceed the lesser of 100% of base salary or $41,000. Under provisions of the Plan, employees are eligible to participate on the date of hire and become fully vested in the Company’s contributions following seven years of service. In August 1995 the Company received a favorable determination from the Internal Revenue Service to include an Employee Stock Ownership feature as part of the Plan. This feature allows employees to direct a portion of their vested account balance toward the purchase of Company stock. Company contributions to the Plan amounted to $2,306,000, $2,101,000 and $2,001,000 for the years ended September 30, 2005, 2004 and 2003, respectively. |
The Company has three employee stock option plans which provide a combination of stock options and stock grants. Stockholders authorized 2,718,660 shares, 4,480,101 shares and 4,099,480 shares of common stock, as adjusted for stock splits and stock dividends, to be reserved pursuant to the 1987 Stock Option and Stock Appreciation Rights Plan (the 1987 Plan), the 1994 Stock Option and Stock Appreciation Rights Plan (the 1994 Plan) and the 2001 Long-Term Incentive Plan (the 2001 Plan), respectively. The three plans are substantially similar. Of the 11,298,241 total shares authorized by stockholders under the three plans, 4,099,480 shares remain available for issuance. All equity compensation plans have been approved by stockholders.
Options granted under each plan vest at varying percentages commencing as early as one year after the date of grant with expiration dates 10 years after the date of grant.
| | | | | | | | |
| | | Average Price(1) | | Number(1) | | | Weighted Average
Fair Value of Option
Shares Granted |
Outstanding, September 30, 2002 | | $ | 13.07 | | 2,912,773 | | | |
Granted in 2003 | | | 16.80 | | 99,426 | | | 2.93 |
Exercised in 2003 | | | 10.83 | | (473,323 | ) | | |
Forfeited in 2003 | | | 13.74 | | (192,322 | ) | | |
| | |
|
|
| | |
Outstanding, September 30, 2003 | | | 13.63 | | 2,346,554 | | | |
Granted in 2004 | | | 21.23 | | 1,255,771 | | | 4.15 |
Exercised in 2004 | | | 12.16 | | (265,629 | ) | | |
Forfeited in 2004 | | | 16.18 | | (254,249 | ) | | |
| | |
|
|
| | |
Outstanding, September 30, 2004 | | | 16.65 | | 3,082,447 | | | |
Granted in 2005 | | | — | | — | | | — |
Exercised in 2005 | | | 13.09 | | (310,453 | ) | | |
Forfeited in 2005 | | | 18.18 | | (205,026 | ) | | |
| | |
|
|
| | |
Outstanding, September 30, 2005 | | $ | 16.95 | | 2,566,968 | | | |
| | |
|
|
| | |
(1)Average price and number of stock options granted, exercised and forfeited have been adjusted for the 10% stock dividends.
Financial data pertaining to outstanding stock options was as follows:
| | | | | | | | | | |
| September 30, 2005 |
Ranges of Exercise Prices | | Number of
Option Shares | | Weighted
Average
Remaining
Contractual Life | | Weighted
Average
Exercise Price of
Option Shares | | Number of
Exercisable
Option Shares | | Weighted
Average
Exercisable Price
of Exercisable
Option Shares |
$ 9.44 -13.02 | | 560,067 | | 3.9 years | | $11.78 | | 279,448 | | $11.69 |
13.55 -16.57 | | 926,261 | | 5.3 | | 15.15 | | 367,223 | | 15.07 |
16.69 -21.28 | | 1,080,640 | | 8.1 | | 21.17 | | 10,193 | | 19.82 |
| | |
|
| | | 2,566,968 | | 6.2 years | | $16.95 | | 656,864 | | $13.71 |
| | |
|
27
NOTES TO CONSOLIDATED FINANCIAL STATEMENTS(CONTINUED)
The Company also grants shares of restricted stock pursuant to its equity compensation plans. These shares of restricted stock vest over a period of five to seven years. The Company has issued a total of 80,000 shares of restricted stock, with a fair market value at the date of grant of $2.0 million. As of September 30, 2005, 49,778 shares remained restricted. The Company accounts for restricted stock grants by recording the fair value of the grant to compensation expense over the vesting period. At September 30, 2005, $1.3 million of unearned compensation was recorded as a reduction to retained earnings.
NOTE M | STOCKHOLDERS’ EQUITY |
In the second quarter of fiscal 2005, 2004 and 2003, the Company declared an eleven-for-ten stock split in the form of a 10% stock dividend in addition to the regular quarterly cash dividends on its shares of common stock.
Washington Federal Savings is subject to various regulatory capital requirements administered by the Office of Thrift Supervision (OTS). Failure to meet minimum capital requirements can initiate certain mandatory and possibly additional discretionary action by regulators that, if undertaken, could have a direct material effect on the Company’s financial statements. Under capital adequacy guidelines and the regulatory framework for prompt corrective action, Washington Federal Savings must meet specific capital guidelines that involve quantitative measures of Washington Federal Savings’ assets, liabilities and certain off-balance sheet items as calculated under regulatory accounting practices. Washington Federal Savings’ capital amounts and classification are also subject to qualitative judgments by the regulators about capital components, risk-weightings and other factors.
As of September 30, 2005 and 2004, the OTS categorized Washington Federal Savings as well capitalized under the regulatory framework for prompt corrective action. To be categorized as well capitalized, Washington Federal Savings must maintain minimum total risk-based, Tier 1 risk-based and Tier 1 leverage ratios as set forth in the following table. There are no conditions or events since that notification that Management believes have changed Washington Federal Savings’ categorization.
| | | | | | | | | | | | | | | | | | |
| | | Actual | | | Capital
Adequacy
Guidelines | | | Well Capitalized Under Prompt Corrective Action Provisions | |
| | | Capital | | Ratio | | | Capital | | Ratio | | | Capital | | Ratio | |
September 30, 2005 | | | (Dollars in thousands) | |
Total capital to risk-weighted assets | | $ | 1,140,877 | | 26.15 | % | | $ | 348,992 | | 8.00 | % | | $ | 436,241 | | 10.00 | % |
Tier I capital to risk-weighted assets | | | 1,123,485 | | 25.75 | | | | NA | | NA | | | | 261,744 | | 6.00 | |
Core capital to adjusted tangible assets | | | 1,123,485 | | 13.75 | | | | NA | | NA | | | | 408,673 | | 5.00 | |
Core capital to total assets | | | 1,123,485 | | 13.75 | | | | 245,204 | | 3.00 | | | | NA | | NA | |
Tangible capital to tangible assets | | | 1,123,485 | | 13.75 | | | | 122,602 | | 1.50 | | | | NA | | NA | |
September 30, 2004 | | | | | | | | | | | | | | | | | | |
Total capital to risk-weighted assets | | $ | 1,054,160 | | 27.30 | % | | $ | 308,886 | | 8.00 | % | | $ | 386,107 | | 10.00 | % |
Tier I capital to risk-weighted assets | | | 1,036,851 | | 26.85 | | | | NA | | NA | | | | 231,664 | | 6.00 | |
Core capital to adjusted tangible assets | | | 1,036,851 | | 14.65 | | | | NA | | NA | | | | 353,814 | | 5.00 | |
Core capital to total assets | | | 1,036,851 | | 14.65 | | | | 212,289 | | 3.00 | | | | NA | | NA | |
Tangible capital to tangible assets | | | 1,036,851 | | 14.65 | | | | 106,144 | | 1.50 | | | | NA | | NA | |
At periodic intervals, the OTS and the Federal Deposit Insurance Corporation (FDIC) routinely examine the Company’s financial statements as part of their oversight of the savings and loan industry. Based on their examinations, these regulators can direct that the Company’s financial statements be adjusted in accordance with their findings. The extent to which forthcoming regulatory examinations may result in adjustments to the financial statements cannot be determined; however, no adjustments were proposed as a result of the most recent OTS examination which concluded in August 2005.
28
The Company has an ongoing stock repurchase program. The Company did not repurchase any shares during 2005. In 2004, the Company repurchased 93,500 shares at a weighted-average price of $20.74. As of September 30, 2005, Management had authorization from the Board of Directors to repurchase up to 3.3 million additional shares. Information used to calculate earnings per share follows:
| | | | | | | | | | | |
| September 30, | | 2005 | | 2004 | | | 2003 | |
| | | (In thousands, except per share data) | |
Net income | | $ | 145,889 | | $ | 131,868 | | | $ | 144,999 | |
Weighted average shares | | | | | | | | | | | |
Basic weighted average number of
common shares outstanding | | | 86,711,608 | | | 86,302,945 | | | | 84,289,899 | |
Dilutive effect of outstanding
common stock equivalents | | | 767,100 | | | 827,842 | | | | 691,661 | |
| | |
|
|
|
Diluted weighted average number of
common shares outstanding | | | 87,478,708 | | | 87,130,787 | | | | 84,981,560 | |
| | |
|
|
|
Net income per share | | | | | | | | | | | |
Basic | | $ | 1.68 | | $ | 1.53 | | | $ | 1.72 | |
Diluted | | | 1.67 | | | 1.51 | | | | 1.71 | |
NOTE N | FAIR VALUES OF FINANCIAL INSTRUMENTS |
SFAS No. 107, “Disclosures about Fair Value of Financial Instruments,” requires disclosure of fair value information about financial instruments, whether or not recognized on the statement of financial condition, for which it is practicable to estimate those values. SFAS No. 107 excludes certain financial instruments and all non-financial instruments from its disclosure requirements. Accordingly, the aggregate fair value estimates presented do not reflect the underlying fair value of the Company. Although Management is not aware of any factors that would materially affect the estimated fair value amounts presented, such amounts have not been comprehensively revalued for purposes of these financial statements since that date, and therefore, estimates of fair value subsequent to that date may differ significantly from the amounts presented below.
| | | | | | | | | | | | |
| September 30, | | 2005 | | 2004 |
| | | | (In thousands) |
| | | Carrying
Amount | | Estimated
Fair Value | | Carrying
Amount | | Estimated
Fair Value |
Financial assets | | | | | | | | | | | | |
Cash and cash equivalents | | $ | 637,791 | | $ | 637,791 | | $ | 508,361 | | $ | 508,361 |
Repurchase agreements | | | — | | | — | | | 200,000 | | | 200,000 |
Available-for-sale securities | | | 1,077,856 | | | 1,077,856 | | | 899,525 | | | 899,525 |
Held-to-maturity securities | | | 212,479 | | | 211,596 | | | 156,373 | | | 158,792 |
Loans receivable & securitized assets | | | 6,008,932 | | | 6,086,613 | | | 5,093,443 | | | 5,203,650 |
FHLB stock | | | 129,453 | | | 129,453 | | | 137,274 | | | 137,274 |
| | | | |
Financial liabilities | | | | | | | | | | | | |
Customer accounts | | | 5,031,505 | | | 5,037,419 | | | 4,610,358 | | | 4,615,616 |
FHLB advances and other borrowings | | | 1,885,000 | | | 1,871,474 | | | 1,300,000 | | | 1,357,405 |
The following methods and assumptions were used to estimate the fair value of financial instruments:
Cash and cash equivalents – The carrying amount of these items is a reasonable estimate of their fair value.
Repurchase agreements – The carrying amount of these items is a reasonable estimate of their fair value.
29
NOTES TO CONSOLIDATED FINANCIAL STATEMENTS(CONTINUED)
Loans receivable and securitized assets subject to repurchase – For certain homogeneous categories of loans, such as fixed- and variable-rate residential mortgages, fair value is estimated using quoted market prices for securities backed by similar loans, adjusted for differences in loan characteristics. The fair value of other loan types is estimated by discounting the future cash flows and estimated prepayments using the current rates at which similar loans would be made to borrowers with similar credit ratings and for the same remaining term. Some loan types were valued at carrying value because of their floating rate or expected maturity characteristics. Net deferred loan fees is not included in the fair value calculation but is included in the carrying amount.
Available-for-sale securities and held-to-maturity securities – Estimated fair value for investment securities is based on quoted market prices.
FHLB stock – The fair value is based upon the redemption value of the stock which equates to its carrying value.
Customer accounts – The fair value of demand deposits, savings accounts, and money market accounts is the amount payable on demand at the reporting date. The fair value of fixed-maturity certificates of deposit is estimated by discounting the estimated future cash flows using the rates currently offered for deposits with similar remaining maturities.
FHLB advances and other borrowings – The fair value of FHLB advances and other borrowings is estimated by discounting the estimated future cash flows using rates currently available to the Company for debt with similar remaining maturities.
NOTE O | FINANCIAL INFORMATION – WASHINGTON FEDERAL, INC. |
The following Washington Federal, Inc. (parent company only) financial information should be read in conjunction with the other notes to the Consolidated Financial Statements.
| | | | | | | | |
| Statements of Financial Condition | | | | | | | | |
| | |
| September 30, | | 2005 | | | 2004 | |
| | | (In thousands) | |
Assets | | | | | | | | |
Cash | | $ | 4,509 | | | $ | 4,895 | |
Investment in subsidiary | | | 1,185,099 | | | | 1,117,827 | |
Dividend receivable | | | 15,000 | | | | 12,000 | |
| | |
|
|
|
Total assets | | $ | 1,204,608 | | | $ | 1,134,722 | |
| | |
|
|
|
Liabilities | | | | | | | | |
Borrowed money | | $ | — | | | $ | — | |
Dividend payable and other liabilities | | | 17,300 | | | | 14,534 | |
| | |
|
|
|
Total liabilities | | | 17,300 | | | | 14,534 | |
| | |
|
|
|
Stockholders’ equity | | | | | | | | |
Common stock, $1.00 par value, 300,000,000 shares authorized, 104,140,966 and 103,821,846 shares issued; 86,933,294 and 86,547,557 shares outstanding | | $ | 104,141 | | | $ | 94,383 | |
Paid-in capital | | | 1,240,310 | | | | 1,161,627 | |
Accumulated other comprehensive income (loss), net of tax | | | (704 | ) | | | 17,107 | |
Treasury stock, at cost; 17,207,672 and 17,274,289 shares | | | (205,874 | ) | | | (206,666 | ) |
Retained earnings | | | 49,435 | | | | 53,737 | |
| | |
|
|
|
Total stockholders’ equity | | | 1,187,308 | | | | 1,120,188 | |
| | |
|
|
|
Total liabilities and stockholders’ equity | | $ | 1,204,608 | | | $ | 1,134,722 | |
| | |
|
|
|
30
| | | | | | | | | | |
Statements of Operations | | | | | | | | | | |
| | | |
| Year ended September 30, | | 2005 | | 2004 | | 2003 | |
| | | (In thousands) | |
Income | | | | | | | | | | |
Dividends from subsidiary | | $ | 64,000 | | $ | 58,000 | | $ | 63,500 | |
| | |
|
|
|
Expense | | | | | | | | | | |
Miscellaneous | | | 426 | | | 447 | | | 389 | |
| | |
|
|
|
Net income before equity in undistributed net income of subsidiary | | | 63,574 | | | 57,553 | | | 63,111 | |
Equity in undistributed net income of subsidiary | | | 82,164 | | | 74,158 | | | 81,751 | |
| | |
|
|
|
Income before income taxes | | | 145,738 | | | 131,711 | | | 144,862 | |
Income tax benefit | | | 151 | | | 157 | | | 137 | |
| | |
|
|
|
Net income | | $ | 145,889 | | $ | 131,868 | | $ | 144,999 | |
| | |
|
|
|
Statements of Cash Flows
| | | | | | | | | | | | |
| Year ended September 30, | | 2005 | | | 2004 | | | 2003 | |
| | | (In thousands) | |
Cash Flows From Operating Activities | | | | | | | | | | | | |
Net income | | $ | 145,889 | | | $ | 131,868 | | | $ | 144,999 | |
Adjustments to reconcile net income to net cash provided by operating activities | | | | | | | | | | | | |
Equity in undistributed net income of subsidiaries | | | (82,164 | ) | | | (74,158 | ) | | | (81,751 | ) |
Decrease (increase) in dividend receivable | | | (3,000 | ) | | | — | | | | 2,000 | |
Increase (decrease) in other liabilities | | | 1,076 | | | | 333 | | | | (417 | ) |
| | |
|
|
|
Net cash provided by operating activities | | | 61,801 | | | | 58,043 | | | | 64,831 | |
| | | |
Cash Flows From Financing Activities | | | | | | | | | | | | |
Issuance of common stock through stock option plan | | | 4,006 | | | | 4,265 | | | | 5,944 | |
Proceeds from Employee Stock Ownership Plan | | | 1,526 | | | | 4,695 | | | | 1,522 | |
Treasury stock purchased | | | — | | | | (1,939 | ) | | | (10,034 | ) |
Dividends | | | (67,719 | ) | | | (64,696 | ) | | | (60,004 | ) |
| | |
|
|
|
Net cash used by financing activities | | | (62,187 | ) | | | (57,675 | ) | | | (62,572 | ) |
Increase (decrease) in cash | | | (386 | ) | | | 368 | | | | 2,259 | |
Cash at beginning of year | | | 4,895 | | | | 4,527 | | | | 2,268 | |
| | |
|
|
|
Cash at end of year | | $ | 4,509 | | | $ | 4,895 | | | $ | 4,527 | |
| | |
|
|
|
31
NOTES TO CONSOLIDATED FINANCIAL STATEMENTS(CONTINUED)
NOTE P | SELECTED QUARTERLY FINANCIAL DATA (UNAUDITED) |
The following is a summary of the unaudited interim results of operations by quarter:
| | | | | | | | | | | | | | | | |
| Year ended September 30, 2005 | | First
Quarter | | | Second
Quarter | | | Third
Quarter | | | Fourth
Quarter | |
| | | (In thousands, except per share data) | |
Interest income | | $ | 107,543 | | | $ | 122,180 | | | $ | 114,002 | | | $ | 118,176 | |
Interest expense | | | 42,146 | | | | 45,563 | | | | 51,248 | | | | 56,303 | |
| | |
|
|
|
Net interest income | | | 65,397 | | | | 76,617 | | | | 62,754 | | | | 61,873 | |
Provision for (reversal of) loan losses | | | — | | | | — | | | | (134 | ) | | | — | |
Other operating income | | | 2,796 | | | | 851 | | | | 3,030 | | | | 1,175 | |
Other operating expense | | | 11,978 | | | | 13,963 | | | | 12,769 | | | | 13,609 | |
| | |
|
|
|
Income before income taxes | | | 56,215 | | | | 63,505 | | | | 53,149 | | | | 49,439 | |
Income taxes | | | 19,957 | | | | 22,544 | | | | 18,868 | | | | 15,050 | |
| | |
|
|
|
Net income | | $ | 36,258 | | | $ | 40,961 | | | $ | 34,281 | | | $ | 34,389 | |
| | |
|
|
|
Basic earnings per share | | $ | .42 | | | $ | .47 | | | $ | .40 | | | $ | .40 | |
Diluted earnings per share | | | .42 | | | | .47 | | | | .39 | | | | .39 | |
Cash dividends per share | | | .19 | | | | .19 | | | | .20 | | | | .20 | |
Return on average assets | | | 1.96 | % | | | 2.16 | % | | | 1.76 | % | | | 1.71 | % |
| | | | |
| Year ended September 30, 2004 | | First
Quarter | | | Second
Quarter | | | Third
Quarter | | | Fourth
Quarter | |
| | | (In thousands, except per share data) | |
Interest income | | $ | 102,682 | | | $ | 102,682 | | | $ | 103,210 | | | $ | 105,198 | |
Interest expense | | | 44,056 | | | | 43,406 | | | | 41,040 | | | | 41,251 | |
| | |
|
|
|
Net interest income | | | 58,626 | | | | 59,276 | | | | 62,170 | | | | 63,947 | |
Provision for (reversal of) loan losses | | | — | | | | — | | | | (231 | ) | | | — | |
Other operating income | | | 3,230 | | | | 2,449 | | | | 2,728 | | | | (2,681 | ) |
Other operating expense | | | 11,160 | | | | 11,482 | | | | 11,027 | | | | 12,595 | |
| | |
|
|
|
Income before income taxes | | | 50,696 | | | | 50,243 | | | | 54,102 | | | | 48,671 | |
Income taxes | | | 17,873 | | | | 17,723 | | | | 19,070 | | | | 17,178 | |
| | |
|
|
|
Net income | | $ | 32,823 | | | $ | 32,520 | | | $ | 35,032 | | | $ | 31,493 | |
| | |
|
|
|
Basic earnings per share | | $ | .38 | | | $ | .38 | | | $ | .41 | | | $ | .36 | |
Diluted earnings per share | | | .38 | | | | .37 | | | | .40 | | | | .36 | |
Cash dividends per share | | | .18 | | | | .18 | | | | .19 | | | | .19 | |
Return on average assets | | | 1.74 | % | | | 1.73 | % | | | 1.91 | % | | | 1.73 | % |
32

MANAGEMENT’S REPORT ON INTERNAL CONTROL OVER FINANCIAL REPORTING
The management of Washington Federal, Inc. (the “Company”) is responsible for establishing and maintaining adequate internal control over financial reporting. The Company’s internal control system was designed to provide reasonable assurance to the Company’s management and Board of Directors regarding the preparation and fair presentation of published financial statements.
The Company’s management assessed the effectiveness of the Company’s internal control over financial reporting as of September 30, 2005. In making this assessment, we used the criteria set forth by the Committee of Sponsoring Organizations of the Treadway Commission (COSO) in Internal Control-Integrated Framework. Based on our assessment, we believe that as of September 30, 2005, the Company’s internal control over financial reporting was effective based on those criteria.
The Company’s independent auditors, Deloitte & Touche LLP, an independent registered public accounting firm, have issued an audit report on our assessment of the Company’s internal control over financial reporting and their report follows.
November 4, 2005

Roy M. Whitehead
Vice Chairman, President and
Chief Executive Officer

Brent J. Beardall
Senior Vice President and
Chief Financial Officer
REPORT OF INDEPENDENT REGISTERED PUBLIC ACCOUNTING FIRM
To the Board of Directors and Stockholders of
Washington Federal, Inc.
Seattle, Washington
We have audited the accompanying consolidated statements of financial condition of Washington Federal, Inc. and subsidiaries (the “Company”) as of September 30, 2005 and 2004, and the related consolidated statements of operations, stockholders’ equity, and cash flows for each of the three years in the period ended September 30, 2005. These financial statements are the responsibility of the Company’s management. Our responsibility is to express an opinion on these financial statements based on our audits.
We conducted our audits in accordance with the standards of the Public Company Accounting Oversight Board (United States). Those standards require that we plan and perform the audit to obtain reasonable assurance about whether the financial statements are free of material misstatement. An audit includes examining, on a test basis, evidence supporting the amounts and disclosures in the financial statements. An audit also includes assessing the accounting principles used and significant estimates made by management, as well as evaluating the overall financial statement presentation. We believe that our audits provide a reasonable basis for our opinion.
In our opinion, such consolidated financial statements present fairly, in all material respects, the financial position of Washington Federal, Inc. and subsidiaries as of September 30, 2005 and 2004, and the results of their operations and their cash flows for each of the three years in the period ended September 30, 2005, in conformity with accounting principles generally accepted in the United States of America.
We have also audited, in accordance with the standards of the Public Company Accounting Oversight Board (United States), the effectiveness of the Company’s internal control over financial reporting as of September 30, 2005, based on the criteria established in Internal Control—Integrated Framework issued by the Committee of Sponsoring Organizations of the Treadway Commission and our report (not presented herein) dated November 4, 2005, expressed an unqualified opinion on management’s assessment of the effectiveness of the Company’s internal control over financial reporting and an unqualified opinion on the effectiveness of the Company’s internal control over financial reporting.

DELOITTE & TOUCHE LLP
Seattle, Washington
November 4, 2005
33

GENERAL CORPORATE AND STOCKHOLDERS’ INFORMATION
Headquarters | Seattle, Washington 98101 |
(206) 624-7930
Independent | Deloitte & Touche LLP |
Auditors | Seattle, Washington |
Transfer Agent,
Registrar and
Dividend
Disbursing Agent | Stockholder inquiries regarding transfer requirements, cash or stock
dividends, lost certificates, consolidating records, correcting a
name or changing an address should be directed to the
transfer agent: |
American Stock Transfer & Trust Company
59 Maiden Lane
Plaza Level
New York, NY 10038
Telephone: 1-888-888-0315
www.amstock.com
Annual Meeting | The annual meeting of stockholders will be held on January 18, 2006, at 2 p.m. at Benaroya Hall, 200 University Street, Seattle, Washington |
Form 10-K | This report and all SEC filings are available through the Company’s web site: www.washingtonfederal.com |
Stock Information | Washington Federal, Inc. is traded on the NASDAQ Stock Market. The common stock symbol is WFSL. At September 30, 2005, there were approximately 2,523 stockholders of record. |
| | | | | | | | | |
| | | Stock Prices | | |
| Quarter Ended | | High | | Low | | Dividends |
December 31, 2003 | | $ | 23.90 | | $ | 21.14 | | $ | 0.18 |
March 31, 2004 | | | 23.96 | | | 22.04 | | | 0.18 |
June 30, 2004 | | | 23.14 | | | 20.24 | | | 0.19 |
September 30, 2004 | | | 23.63 | | | 21.28 | | | 0.19 |
December 31, 2004 | | | 25.08 | | | 22.18 | | | 0.19 |
March 31, 2005 | | | 24.15 | | | 22.73 | | | 0.19 |
June 30, 2005 | | | 23.69 | | | 22.03 | | | 0.20 |
September 30, 2005 | | | 24.31 | | | 22.09 | | | 0.20 |
|
All prices shown have been adjusted for stock splits. |
Largest Market Makers:
McAdams Wright Ragen, Inc.
National Stock Exchange
Archipelago Stock Exchange
NASDAQ/Brut Market Center
Keefe, Bruyette & Woods, Inc.
Goldman, Sachs & Co.
Knight Equity Markets, L.P.
Morgan Stanley & Co., Inc.
Citigroup Global Markets, Inc.
UBS Capital Markets L.P.
Lehman Brothers, Inc.
Merrill Lynch, Pierce, Fenner & Smith, Inc.
B-Trade Services, L.L.C.
National Financial Services
Prudential Equity Group, Inc.
34

DIRECTORS, OFFICERS AND OFFICES
CORPORATE HEADQUARTERS
425 Pike Street
Seattle, WA 98101
(206) 624-7930
BOARD OF DIRECTORS
GUY C. PINKERTON
Chairman
ROY M. WHITEHEAD
Vice Chairman, President and Chief Executive Officer
DEREK L. CHINN
Former President and Chief Executive Officer, United Savings and Loan Bank
JOHN F. CLEARMAN
Former Chief Financial Officer,
Milliman USA, Inc.
H. DENNIS HALVORSON
Former Chief Executive Officer, United Bank
W. ALDEN HARRIS
Former Executive
Vice President
ANNA C. JOHNSON
Senior Partner
Scan East West Travel
THOMAS J. KELLEY
Faculty member, Albers
School of Business, Seattle
University and retired
partner, Arthur Andersen LLP
THOMAS F. KENNEY
Vice President Finance
Haggen, Inc.
CHARLES R. RICHMOND
Former Executive
Vice President
DIRECTORS EMERITI
E.W. MERSEREAU, JR.
RICHARD C. REED
KERMIT O. HANSON
EXECUTIVE MANAGEMENT COMMITTEE
BRENT J. BEARDALL
Senior Vice President
and Chief Financial Officer
LINDA S. BROWER
Executive Vice President
EDWIN C. HEDLUND
Executive Vice President and Secretary
JACK B. JACOBSON
Executive Vice President
and Chief Lending Officer
ROY M. WHITEHEAD
Vice Chairman, President and Chief Executive Officer
DEPARTMENT MANAGERS
Accounting
CHAD J. LEONARD
Controller
ROBERT C. ZIRK
Internal Controls and Taxes
Appraisal
HEATHER J. ST. CLAIR
Retail Underwriter
MICHAEL R. BUSH
Senior Vice President
Credit Administration
JAMES E. CADY
Senior Vice President
DALE R. SULLIVAN
Senior Vice President
Corporate Real Estate
KEITH D. TAYLOR
Senior Vice President
and Treasurer
Data Processing
TERRY O. PERMENTER
Senior Vice President
Deposit Operations
BEN A. WHITMARSH
Senior Vice President
Internal Audit
BARBARA A. MURPHY
Senior Vice President
Legal/Special Credits
PAUL I. TYLER
Vice President and General Counsel
Loan Operations
LEANN H. BURKE
Assistant Vice President
Loan Servicing
VIVIAN L. YORITA
Vice President
Marketing and
Investor Relations
CATHY E. COOPER
Vice President
Multi-Family Lending
J. TIMOTHY GRANT
Senior Vice President
Permanent Loan Production
JOHN L. WUNDERLICH
Vice President
Wholesale Underwriter
COLLEEN E. WELLS
Vice President
SUBSIDIARIES
First Insurance Agency, Inc.
1501 Riverside Drive
Mount Vernon, WA 98273
1-800-562-2555
DUANE E. HENSON
DIVISIONS
SOUTH SOUND
WASHINGTON
18 Office Locations
Division Manager
RONDA F. TOMLINSON
Senior Vice President
9919 Bridgeport Way S.W.
Lakewood, WA 98499
MIDSOUND
WASHINGTON
16 Office Locations
Division Manager
E. CRAIG WILSON
Senior Vice President
5809 196th S.W.
Lynnwood, WA 98036
NORTHERN WASHINGTON
9 Office Locations
Division Manager
DOUGLAS A. ROWELL
Senior Vice President
1501 Riverside Drive
Mount Vernon, WA 98273
WESTERN IDAHO
10 Office Locations
Division Manager
ROBERT P. LINK
Senior Vice President
1001 W. Idaho St.
Boise, ID 83701
EASTERN IDAHO
6 Office Locations
Division Manager
LARRY L. WADSWORTH
Senior Vice President
500 North Capital
Idaho Falls, ID 83402
OREGON
27 Office Locations
Division Manager
PEGGY L. HOBIN
Senior Vice President
14990 SW Bangy Rd.
Lake Oswego, OR 97035
UTAH
10 Office Locations
Division Manager
MARLISE G. FISHER
Vice President
505 East 200 South
Salt Lake City, UT 84102
PHOENIX, ARIZONA
12 Office Locations
Division Manager
JOHN J. PIRTLE
Vice President
2196 E. Camelback Road, Suite 100
Phoenix, AZ 85016
TUCSON, ARIZONA
8 Office Locations
Division Manager
GEORGIA E. VELARDE
Vice President
5151 E. Broadway Blvd., Suite 105
Tucson, AZ 85711
NEVADA
3 Office Locations
Division Manager
PAMELA K. CALLAHAN
Vice President
9340 Sun City Blvd. #103
Las Vegas, NV 89134
TEXAS
3 Office Locations
Division Manager
VAUGHN C. PEARSON
Senior Vice President
5900 Chapel Hill Blvd.
Plano, TX 75093
A complete listing of our branch locations can be found at www.washingtonfederal.com
35