Exhibit 13
WASHINGTON FEDERAL, INC.
ANNUAL REPORT 2006
425 Pike Street, Seattle, WA 98101

TABLE OF CONTENTS
A SHORT HISTORY
Washington Federal, Inc. (Company or Washington Federal) is a savings and loan holding company headquartered in Seattle, Washington. Its principal subsidiary is Washington Federal Savings, which operates 123 offices in seven western states.
The Company had its origin on April 24, 1917 as Ballard Savings and Loan Association. In 1935, the state-chartered Company converted to a federal charter, became a member of the Federal Home Loan Bank (FHLB) system and obtained federal deposit insurance. In 1958, Ballard Federal Savings and Loan Association merged with Washington Federal Savings and Loan Association of Bothell, and the latter name was retained for wider geographical acceptance. In 1971, Seattle Federal Savings and Loan Association, with three offices, merged into the Company, and at the end of 1978, was joined by the 10 offices of First Federal Savings and Loan Association of Mount Vernon.
On November 9, 1982, the Company converted from a federal mutual to a federal stock association. In 1987 and 1988, acquisitions of United First Federal, Provident Federal Savings and Loan, and Northwest Federal Savings and Loan, all headquartered in Boise, Idaho, added 28 Idaho offices to the Company. In 1988, the acquisition of Freedom Federal Savings and Loan Association in Corvallis, Oregon added 13 Oregon offices, followed in 1990 by the eight Oregon offices of Family Federal Savings.
In 1991, the Company added three branches with the acquisition of First Federal Savings and Loan Association of Idaho Falls, Idaho, and acquired the deposits of First Western Savings Association of Las Vegas, Nevada, in Portland and Eugene, Oregon, where they were doing business as Metropolitan Savings Association. In 1993, 10 branches were added with the acquisition of First Federal Savings Bank of Salt Lake City, Utah. In 1994, the Company expanded into Arizona.
In 1995, the stockholders approved a reorganization whereby Washington Federal Savings became a wholly owned subsidiary of a newly formed holding company, Washington Federal, Inc. That same year, the Company purchased West Coast Mutual Savings Bank with its one branch in Centralia, Washington, and opened six additional branches. In 1996, the Company acquired Metropolitan Bancorp of Seattle, adding eight offices in Washington in addition to opening four branches in existing markets. Between 1997 and 1999, Washington Federal Savings continued to develop its branch network, opening a total of seven branches and consolidating three offices into existing locations.
In 2000, the Company expanded into Las Vegas, opening its first branch in Nevada along with two branches in Arizona. In 2001, the Company opened two additional branches in Arizona and its first branch in Texas with an office in the Park Cities area of Dallas. In 2002, Washington Federal Savings opened five full-service branches in existing markets. In 2003, the Company purchased United Savings and Loan Bank with its four branches in the Seattle metropolitan area, added one new branch in Puyallup, Washington and consolidated one branch in Nampa, Idaho. In 2004, the Company consolidated two branches in Mount Vernon, Washington into one and opened branches in Plano, Texas and West Bend, Oregon. In 2005, the Company opened locations in Klamath Falls, Oregon, Richardson, Texas and another in Las Vegas, Nevada.
In 2006, the Company opened a branch in Medford, Oregon. In October 2006, the Company signed a merger agreement to acquire First Federal Banc of the Southwest, Inc., which is the holding company for First Federal Bank located in Roswell, New Mexico. First Federal Bank has 15 branch locations, 13 in New Mexico and two in El Paso, Texas. The merger is expected to close in the first calendar quarter of 2007, subject to regulatory and shareholder approvals.
The Company obtains its funds primarily through deposits from the general public, from repayments of loans, borrowings and retained earnings. These funds are used largely to make first lien loans to borrowers for the purchase of new and existing homes, the acquisition and development of land for residential lots, the construction of homes, the financing of small multi-family housing units, and for investment in obligations of the U.S. government, its agencies and municipalities.

FINANCIAL HIGHLIGHTS
| | | | | | | | | | | |
| September 30, | | 2006 | | | 2005 | | | % Change | |
| | | (In thousands, except per share data) | |
Assets | | $ | 9,069,020 | | | $ | 8,234,450 | | | 10 | % |
Cash and cash equivalents | | | 45,722 | | | | 637,791 | | | -93 | |
Investment securities | | | 256,650 | | | | 214,993 | | | 19 | |
Loans receivable, net | | | 7,078,443 | | | | 6,008,932 | | | 18 | |
Mortgage-backed securities | | | 1,379,316 | | | | 1,075,342 | | | 28 | |
Customer accounts | | | 5,311,726 | | | | 5,031,505 | | | 6 | |
FHLB advances and other borrowings | | | 2,370,000 | | | | 1,885,000 | | | 26 | |
Stockholders’ equity | | | 1,262,720 | | | | 1,187,308 | | | 6 | |
Net income | | | 143,102 | | | | 145,889 | | | -2 | |
Diluted earnings per share | | | 1.64 | | | | 1.67 | | | -2 | |
Dividends per share | | | 0.81 | | | | 0.78 | | | 4 | |
Stockholders’ equity per share | | | 14.46 | | | | 13.66 | | | 6 | |
Shares outstanding | | | 87,339 | | | | 86,933 | | | — | |
Return on average stockholders’ equity | | | 11.77 | % | | | 12.63 | % | | — | |
Return on average assets | | | 1.67 | | | | 1.90 | | | — | |
Efficiency ratio | | | 19.66 | | | | 19.16 | | | — | |

TO OUR STOCKHOLDERS
Dear Stockholder:
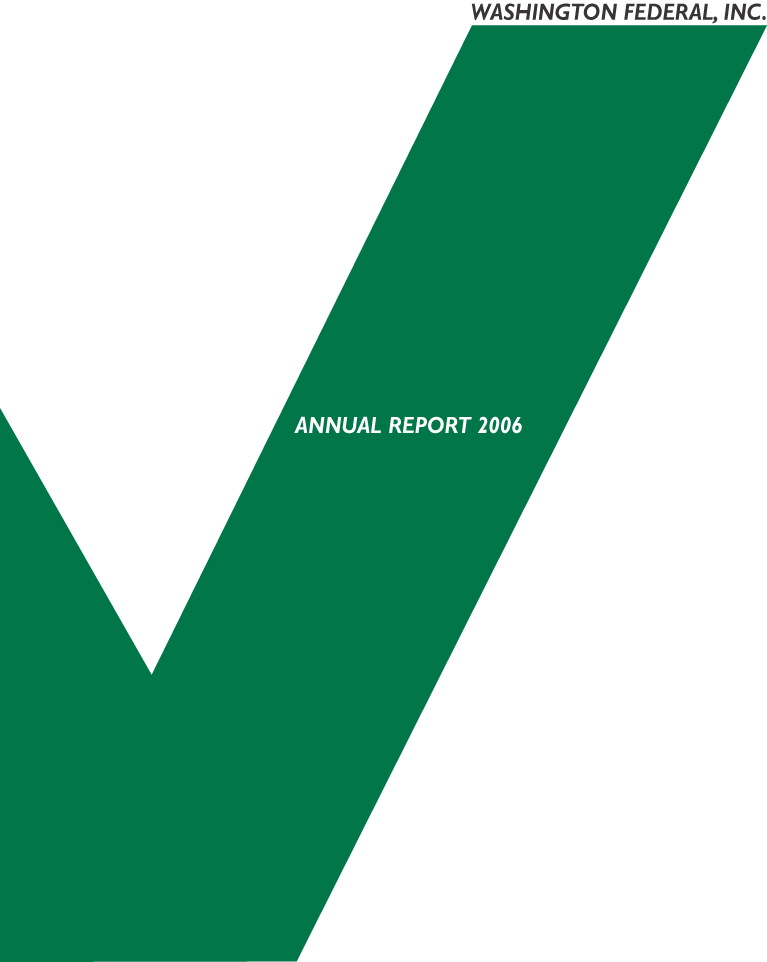
It is my privilege to report another year of solid financial performance for your company, in which net income totaled $143,102,000, or $1.64 on a per share basis. Although both numbers represent a slight decline from the previous year’s results of $145,889,000, or $1.67 per share, we view the results positively due to the steady financial headwinds beyond our control that prevailed during the fiscal year.
Last year’s report began by stating that the two primary determinants of success for the business of Washington Federal are the condition of the housing market and the spread between short and long-term interest rates. After several years of extraordinarily robust demand for housing and better than average spreads between short and long-term interest rates, conditions on both fronts changed adversely last year. An oversupply of housing became apparent early in the year and as conditions shifted to favor buyers, the market transitioned to a correction phase. Then, as the Federal Reserve apparently neared an end to an unprecedented run of seventeen consecutive increases in the federal funds rate, from 1% to 5.25% over the past two years, a negative spread between short and long-term rates developed that existed for much of the fiscal year and persists through the writing of this letter. This is the longest period of rising short-term interest rates that your company has experienced since going public in 1982.
The slowdown in the housing market raises concerns, of course, regarding future loan demand and potential loan losses; however, it was rising deposit costs that became the primary obstacle to earnings growth during the past year. Higher rates instigated a 41% increase in the weighted average cost of deposits from 2.47% to 3.49% during the year. This provided welcome relief for our long-suffering depositors, but created a major challenge for management to offset the additional $64,000,000 in interest expense. It is a testament to the financial strength of your company that its management possessed the flexibility to accomplish this by investing cash that had been previously stockpiled, by increasing earning assets in the loan and securities portfolios and by harvesting a few gains on the sale of real estate.
As we report each year, tight control over non-interest expenses also played an important role in maintaining earnings at a high level. Your company’s efficiency ratio of 19.66% was less than half of the industry average and means simply that 19.66 cents were spent to produce one dollar of net revenue. That ratio places Washington Federal at or near the top of the industry. A special compliment should be paid to your company’s employees in this regard. In a recent ranking by the American Banker, Washington Federal ranked #2 among all U.S financial institutions for the productivity of its employees as measured by net income produced.
Your company also ended the last fiscal year with a very solid balance sheet and an overall financial position that bodes well for the future. At year-end, total assets exceeded $9 billion for the first time. Loans outstanding now account for over $7 billion and deposits grew by 6.0% to $5.3 billion. Stockholder’s equity also grew by 6.4% to $1.3 billion. Asset quality continues to be very strong. For example, at fiscal year-end, out of a total 39,749 loans in the portfolio, only 149 were delinquent more than 30 days. Non-performing assets were also at a record low of only .08% of total assets at year-end, while net charge-offs during the year amounted to a mere $298,000. We are extremely pleased with the resilience of the loan portfolio in light of the deteriorating housing market, although we continue to believe that losses will increase before the housing downturn is ended.
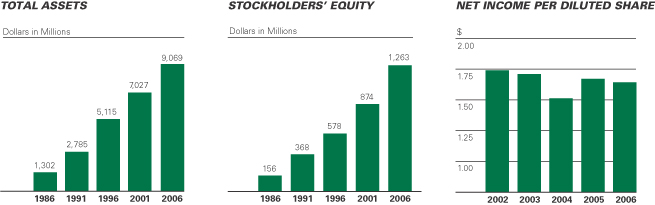
Regrettably, the stock price languished during the year, due primarily to the lack of earnings growth and the market’s downbeat assessment of housing-related stocks. On a positive note, the ongoing success of your company did enable the board of directors to declare an increase in the cash dividend for the 41st time in the past 24 years. The new annualized dividend of 82 cents per share represents a payout ratio equal to 50% of earnings and a dividend yield of 3.5% based on recent prices of your company’s stock.
In early October, your company also announced a definitive agreement to acquire First Federal Banc of the Southwest, an institution with $562 million in assets and thirteen branch locations in New Mexico along with two in El Paso, Texas. We have been most impressed with the quality of their employees and wish to warmly welcome them to Washington Federal. The transaction will likely be completed in the first calendar quarter of 2007 and be additive to earnings in subsequent quarters.
Two long-standing members of the board will retire at the end of this year and I would like to give special recognition to both of them. Alden Harris joined the board of directors in 1971 when Washington Federal acquired his former company, Seattle Federal Savings & Loan. He also served as Executive Vice President of Washington Federal from the date of the merger through his retirement from that post in 1992. In addition to chairing the Personnel and Stock Compensation
2

Committee through a difficult corporate governance environment the past few years, he has been a trusted advisor to management and a great ambassador to the public. His cumulative 35 years of board service to Washington Federal qualifies Alden for Director Emeritus status and we are very pleased that he will continue in this honorary capacity.
After serving the company for forty-one years as Chief Financial Officer, then President & CEO, and finally Chairman of the Board, Guy Pinkerton will also retire at the end of this year. In recognition of his unique contribution to the success of your company, he was recently honored with the inaugural Summit Award for Lifetime Achievement at Washington Federal. Everyone connected with the company will miss his experience and wisdom, which has been at our ready disposal
for so long. It is a great honor for me to have been chosen by the Board to succeed Guy as Chairman and I will strive to live up to his example.
Perhaps Guy’s most important contribution to the company has been his oversight of the smooth transition of management and the Board that has occurred over the past few years. To complete the process, Barbara L. Smith, Ph.D. was added to the Board in April, 2006. She is President of B. Smith Consulting Group, a firm she founded in 1994 that practices in the area of organizational development for regional and national firms. Ms. Smith will serve on the Personnel and Stock Compensation Committee of the board and we believe that her background and experience help to round out the skill set of your company’s directors and add strength to an already solid board of directors.
In closing, I wish to thank our directors, employees, customers and stockholders for their continued support. Let me also remind you to send your friends and neighbors to Washington Federal for their home loan and savings needs. Our Annual Meeting of Stockholders will be held at the Westin Hotel in downtown Seattle, Washington on January 25, 2007 at 2:00 PM. While there, please take a moment to thank Guy Pinkerton and Alden Harris for their years of service and to welcome Barbara Smith to the board. I hope to see you there.
Sincerely

Roy M. Whitehead
Chairman, President and Chief Executive Officer

(Back row - from left to right) Linda S. Brower, Executive Vice President, Roy M. Whitehead, Chairman, President and Chief Executive Officer, Brent J. Beardall, Senior Vice President and Chief Financial Officer, (From row - from left to right) Edwin C. Hedlund, Executive Vice President and Secretary, Jack B. Jacobson, Executive Vice President & Chief Lending Officer.
3

MANAGEMENT’S DISCUSSION AND ANALYSIS OF
FINANCIAL CONDITION AND RESULTS OF OPERATIONS
GENERAL | Washington Federal, Inc. (Company or Washington Federal) is a savings and loan holding company. The Company’s primary operating subsidiary is Washington Federal Savings, a federally-chartered savings and loan association. |
| | The Company’s fiscal year end is September 30th. All references to 2006, 2005 and 2004 represent balances as of September 30, 2006, September 30, 2005 and September 30, 2004, or activity for the fiscal years then ended, respectively. |
CRITICAL ACCOUNTING POLICIES | Preparation of financial statements in conformity with accounting principles generally accepted in the United States of America requires the use of estimates and assumptions that affect reported amounts of certain assets, liabilities, revenues and expenses in the Company’s consolidated financial statements. Accordingly, estimated amounts may fluctuate from one reporting period to another due to changes in assumptions underlying estimated values. |
| | The Company has determined that the only accounting policy deemed critical to an understanding of the consolidated financial statements of Washington Federal relates to the methodology for determining the valuation of the allowance for loan losses, as described below. |
| | The Company maintains an allowance for loan losses to absorb losses inherent in the loan portfolio. The allowance is based on ongoing, quarterly assessments of the probable and estimable losses inherent in the loan portfolio. The Company’s methodology for assessing the appropriateness of the allowance consists of several key elements, which include the formula allowance and specific allowances. |
| | The formula portion of the general loan loss allowance is established by applying a loss percentage factor to the different loan types. The allowance is provided based on Management’s continuing evaluation of the pertinent factors underlying the quality of the loan portfolio, including changes in the size and composition of the loan portfolio, actual loan loss experience, current economic conditions, geographic concentrations, seasoning of the loan portfolio, specific industry conditions and the duration of the current business cycle. The recovery of the carrying value of loans is susceptible to future market conditions beyond the Company’s control, which may result in losses or recoveries differing from those provided. |
| | Specific allowances are established in cases where Management has identified significant conditions or circumstances related to a loan that Management believes indicate the probability that a loss has been incurred. |
INTEREST RATE RISK | The Company accepts a high level of interest rate volatility as a result of its policy to originate fixed-rate single-family home loans that are longer-term than the short-term characteristics of its liabilities of customer accounts and borrowed money. The following table shows the estimated repricing periods for earning assets and paying liabilities. |
| | | | | | | | | | | | | | | | |
| | | Repricing Period
| |
| | | Within One Year
| | | After 1 year -
before 4 Years
| | | Thereafter
| | | Total
| |
| | | (In thousands) | |
As of September 30, 2006 | | | | | | | | | | | | | | | | |
Earning Assets * | | $ | 2,299,552 | | | $ | 2,249,649 | | | $ | 4,340,385 | | | $ | 8,889,586 | |
Paying Liabilities | | | (5,355,593 | ) | | | (771,820 | ) | | | (1,554,313 | ) | | | (7,681,726 | ) |
| | |
|
|
| | | | |
Excess (Liabilities) Assets | | $ | (3,056,041 | ) | | $ | 1,477,829 | | | $ | 2,786,072 | | | | | |
| | |
|
|
| | | | |
Excess as % of Total Assets | | | –33.7 | % | | | | | | | | | | | | |
Policy limit for one year excess | | | –60.0 | % | | | | | | | | | | | | |
| | * | Asset repricing period includes estimated prepayments based on historical activity |
At September 30, 2006, the Company had approximately $3.1 billion more liabilities subject to repricing in the next year than assets, which amounted to a negative maturity gap of 34% of total assets. As of September 30, 2005, the amount of excess liabilities subject to repricing within one year was approximately $2.1 billion, or 26%, of total assets. The increase of approximately $930 million of liabilities in excess of assets repricing within one year was due to the investment of cash and cash equivalents into long-term assets and growth in deposits. By having an excess of liabilities repricing within one year over assets, the Company is subject to decreasing net interest income should interest rates rise. However, if the size and/or mix of the balance sheet changes, rising rates may not cause a decrease in net interest income. The Company’s interest rate risk approach has never resulted in the recording of a monthly operating loss.
The Company’s net interest spread decreased from 2.54% at September 30, 2005 to 2.18% at September 30, 2006. Net interest spread represents the difference between the contractual rates of earning assets and the con - -
4
| | tractual rates of paying liabilities as of a specific date. The spread decreased primarily because rates on customer accounts increased by 111 basis points over the prior year while rates on earning assets increased by only 47 basis points (see Period End Spread table on page 8). |
During 2006 the Company chose to grow earning assets by increasing the net amount of loans and investments by $1,415,142,000. This growth was primarily funded by a net decrease in cash and cash equivalents of $592,069,000 in conjunction with a net increase in borrowings of $485,000,000. During the year the Company borrowed $700,000,000 in long-term funding with a weighted average contractual maturity of 9.4 years at a weighted average rate of 4.74%. Additionally, net deposits grew by $280,221,000. Stockholders’ equity of $1,262,720,000 at September 30, 2006 provides management with flexibility in managing interest rate risk.
ASSET QUALITY | The Company maintains an allowance to absorb losses inherent in the loan portfolio. The allowance is based on ongoing, quarterly assessments of the probable and estimable losses inherent in the loan portfolio. In analyzing the existing loan portfolio, the Company applies specific loss percentage factors to the different loan types. The loss percentages are based on Management’s continuing evaluation of the pertinent factors underlying the quality of the loan portfolio, including changes in the size and composition of the loan portfolio, actual loan loss experience and current economic conditions. |
Multi-family loans, builder construction loans and certain other loans are reviewed on an individual basis to assess the ability of the borrowers to continue to service all of their principal and interest obligations. If a loan shows signs of weakness, it is downgraded and, if warranted, placed on non-accrual status. The Company has an asset quality review function that reports the results of its internal reviews to the Board of Directors on a quarterly basis.
Non-performing assets were $7,660,000, or ..08%, of total assets at September 30, 2006, compared to $7,344,000, or .09%, of total assets at September 30, 2005. Total delinquencies over 30 days were $17,797,000, or .20%, of total assets at September 30, 2006, compared to $16,723,000, or .20%, of total assets at September 30, 2005. The aforementioned asset quality indicators demonstrate the continued high quality of the loan portfolio.
LIQUIDITY AND CAPITAL RESOURCES | The principal sources of funds for the Company’s activities are retained earnings, loan repayments (including prepayments), net deposit inflows, repayments and sales of investments and borrowings. Washington Federal’s principal sources of revenue are interest on loans, interest and dividends on investments and gains on sale of investments and real estate. |
The Company’s net worth at September 30, 2006 was $1,262,720,000, or 13.9%, of total assets. This is an increase of $75,412,000 from September 30, 2005 when net worth was $1,187,308,000, or 14.4%, of total assets. The Company’s net worth increased due in part to net income of $143,102,000, proceeds received from the exercise of common stock options of $4,141,000 and purchases by the Employee Stock Ownership Plan of $1,821,000. Net worth was reduced by $70,708,000 as a result of cash dividends paid and an increase in accumulated other comprehensive loss of $5,271,000. The Company paid out 49.4% of its 2006 earnings in the form of cash dividends, compared with 46.4% last year.
Washington Federal’s percentage of net worth to total assets is among the highest in the nation and is over three times the minimum required under Office of Thrift Supervision (OTS) regulations (see Note M). Management believes this strong net worth position will help the Company manage its interest rate risk and will enable it to compete more effectively.
Customer accounts increased $280,221,000, or 5.6%, from one year ago. Management’s strategy during this phase of the interest rate cycle has been to remain competitive in its deposit pricing to attract the new deposit relationships necessary to help fund asset growth.
The Company’s cash and cash equivalents amounted to $45,722,000 at September 30, 2006, a 92.8% decrease from the cash and cash equivalents balance of $637,791,000 one year ago. The decrease resulted primarily from using the funds to grow net loans and investments over the prior year. See “Interest Rate Risk” above and the “Statement of Cash Flows” included in the financial statements.
CHANGES IN FINANCIAL POSITION | Available-for-sale and held-to-maturity securities.The Company purchased $573,386,000 of securities during 2006, all of which have been classified as available-for-sale. |
The Company did not sell any available-for-sale securities in the current year. As of September 30, 2006, the Company had net unrealized losses in its available-for-sale portfolio of $9,447,000, as compared to net unrealized losses of $1,113,000 as of September 30, 2005. The increase in net unrealized losses was primarily due to long-term interest rates increasing during 2006.
Loans receivable.Loans receivable increased 17.8% to $7,078,443,000 at September 30, 2006 from $6,008,932,000 one year earlier. The increase resulted primarily from loan production of $2,402,347,000 combined with whole loan purchases of $399,766,000. Loan repayments (including prepayments) during the year were $1,694,530,000, a decrease of $74,528,000, or 4.2%, from 2005. The percentage of loans outside of Wash - -
5

MANAGEMENT’S DISCUSSION AND ANALYSIS OF
FINANCIAL CONDITION AND RESULTS OF OPERATIONS (CONTINUED)
| | ington, Idaho, Oregon, Utah and Arizona increased to 15.5% of loans outstanding at September 30, 2006 from 12.1% one year earlier, resulting from the purchase of whole loans and increased loan production by the branches located in Nevada and Texas. Gross construction and land loans increased to 22.8% of the portfolio at September 30, 2006 from 22.1% at September 30, 2005. |
Real estate held for sale. The balance of real estate held for sale at September 30, 2006 was $3,903,000, a decrease from $5,631,000 reported one year ago.
Intangible assets. The Company’s intangible assets are made up of $54,484,000 of goodwill, as well as the unamortized balances of the core deposit intangible and the non-compete agreement intangible of $1,555,000 and $220,000, respectively, at September 30, 2006.
Other assets. Other assets increased $7,097,000 to $14,811,000 at September 30, 2006 primarily due to a $3,155,000 capitalized fee on the prepayment of a FHLB borrowing during the year.
Customer accounts. Customer accounts at September 30, 2006 totaled $5,311,726,000 compared with $5,031,505,000 at September 30, 2005, a 5.6% increase. See “Liquidity and Capital Resources” above.
FHLB advances and other borrowings. Total borrowings increased $485,000,000, or 25.7%, to $2,370,000,000 at September 30, 2006 as the Company chose to fund asset growth with a mix of customer accounts and borrowed money. See “Interest Rate Risk” above.
Contractual obligations. The following table presents, as of September 30, 2006, the Company’s significant fixed and determinable contractual obligations, within the categories described below, by payment date or contractual maturity. These contractual obligations, except for the operating leases, are included in the Consolidated Statements of Financial Condition. The payment amounts represent those amounts contractually due.
| | | | | | | | | | | | | |
| Contractual Obligations | | Total | | Less than
1 Year | | 1 to 5
Years | | Over 5
Years | |
| | | (In thousands) | |
Debt obligations* | | $ | 2,370,000 | | $ | 170,000 | | $ | 900,000 | | $ | 1,300,000 | |
Operating lease obligations | | | 9,586 | | | 2,400 | | | 6,819 | | | 367 | |
| | |
|
|
|
| | | $ | 2,379,586 | | $ | 172,400 | | $ | 906,819 | | $ | 1,300,367 | |
| | |
|
|
|
| | * | Represents final maturities of debt obligations. See a description in Notes H and I. |
RESULTS OF OPERATIONS | GENERAL |
See Note P, “Selected Quarterly Financial Data (Unaudited),” which highlights the quarter-by-quarter results for the years ended September 30, 2006 and 2005.
COMPARISON OF 2006 RESULTS WITH 2005
In 2006 net income decreased 2% from 2005.
Interest income on loans and mortgage-backed securities increased $75,794,000, or 17.6%, in 2006 from 2005 due to a 21.1% increase in the average outstanding balance of loans and mortgage-backed securities, offset partially by a 20 basis point decrease in the weighted average yield from 6.73% in 2005 to 6.53% in 2006. Interest income on mortgage-backed securities in 2005 included $11.1 million related to the correction of an error as discussed in Note A.
Interest and dividend income on investment securities and cash equivalents decreased $7,812,000, or 24.9%, in 2006 from 2005. This decrease was due to a decrease in the average combined balance of investment securities, cash equivalents and FHLB stock, which decreased 41.7% to $625,814,000 for the year ended September 30, 2006 versus $1,074,169,000 for the year ended September 30, 2005. Partially offsetting this decrease, the weighted average yield on investment securities, cash equivalents and FHLB stock increased from 2.92% in 2005 to 3.77% in 2006 primarily as a result of the Federal Reserve Board increasing short-term interest rates during the year.
Interest expense on customer accounts increased 55.1% to $179,605,000 for 2006 from $115,826,000 for 2005. The increase primarily related to a 102 basis point increase in the average cost of customer accounts to 3.49% during the year compared to 2.47% one year ago combined with the 9.8% increase in the average balance of customer accounts over the prior year. Interest expense on FHLB advances and other borrowings increased to $93,756,000 in 2006 from $79,434,000 in 2005 due to an increase in the average balance of borrowings to $1,431,032,000 at September 30, 2006 from $1,206,155,000 at September 30, 2005. Partially offsetting this increase in average balance, the average cost of borrowings for the year ended September 30, 2006 decreased to 4.55% from 4.77% for the same period one year ago.
The Company recorded a $535,000 provision for loan losses in 2006 compared to a $134,000 reversal of the provision in 2005. The current year provision is due to the 17.8% growth in loans receivable over the prior year and a slight increase in the Company’s non-performing loan balances. Non-performing assets increased by $316,000 over 2005, however, non-performing loans as a percentage of total loans decreased from .09% in 2005 to .08% in
6
| | 2006. Economic conditions in the primary markets served by the Company generally improved during the year, somewhat offsetting the growth in the loan portfolio. Total delinquencies over 30 days were $17,797,000, or .20% of total assets at September 30, 2006 compared to $16,723,000, or .20% of total assets at September 30, 2005. Management believes the allowance for loan losses, totaling $24,993,000, is sufficient to absorb estimated losses inherent in the portfolio. |
Total other income increased $9,655,000, or 150.6%, in 2006 from 2005. The 2006 balance included approximately $4,073,000 of gain on the sale of real estate. 2005 included a loss on the extinguishment of debt of $2,194,000 as well as net losses on the sale of securities that totaled $3,534,000 that were included in other income.
Compensation expense increased $2,377,000, or 7.0%, in 2006 primarily due to three factors: 1) effective October 1, 2005, the Company adopted Statement of Financial Accounting Standards No. 123 (revised 2004), Share-Based Payment (see related discussions under Note A and Note L), resulting in the recognition of approximately $1,119,000 in total compensation cost for stock options; 2) health care costs related to the Company’s self funded medical plan increased $710,000 over the same period one year ago; and 3) effective April 1, 2006, the Company adopted a new bonus plan for all employees that resulted in an increase in bonus compensation expense of $254,000. Personnel, including part-time employees considered on a full-time equivalent basis, increased to 765 at September 30, 2006 compared to 749 one year ago.
Occupancy expense decreased $895,000, or 10.2%, during the year primarily due to a $1,225,000 expense in 2005 related to the amortization of leasehold improvements that brought the Company into conformity with a clarification of the accounting standard for leases. The Company now amortizes leasehold improvements over the shorter of the original lease term, excluding option periods, or the expected useful life of the improvements. Partially offsetting the reduction in amortization expense was an increase of $197,000 in the amount of general maintenance expense. The branch network increased to 123 offices at September 30, 2006 versus 122 offices one year ago.
Other expenses decreased $1,017,000 during the year primarily because the prior year included a $1,500,000 expense for a state business tax assessment. Offsetting that reduction was an increase in general business operating expenses. Other expense for 2006 and 2005 equaled .63% and .68% of average assets, respectively.
Income tax expense decreased $861,000, or 1.1%, in 2006 due to a lower taxable income base. The effective tax rate was 34.56% for 2006 versus 34.38% for 2005.
COMPARISON OF 2005 RESULTS WITH 2004
In 2005 net income increased 11% from 2004.
Interest income on loans, securitized assets subject to repurchase and mortgage-backed securities increased $50,961,000, or 13.4%, in 2005 from 2004 due to a 15.4% increase in the average outstanding balance of loans, securitized assets subject to repurchase and mortgage-backed securities, offset partially by a 12 basis point decrease in the weighted average yield from 6.85% in 2004 to 6.73% in 2005. Additionally, the correction of the error in hedge accounting recorded by the Company in 2005, as described in Note A, increased interest income on mortgage-backed securities by $11.1 million.
Interest and dividend income on investment securities and cash equivalents decreased $2,832,000, or 8.3%, in 2005 from 2004. This decrease was due to a decrease in the average combined balance of investment securities, cash equivalents and FHLB stock which decreased 33.6% to $1,074,169,000 for the year ended September 30, 2005 versus $1,618,783,000 for the year ended September 30, 2004. Partially offsetting this decrease, the weighted average yield on investment securities, cash equivalents and FHLB stock increased from 2.12% in 2004 to 2.92% in 2005 primarily as a result of the Federal Reserve Board increasing short-term interest rates during the year.
Interest expense on customer accounts increased 34.5% to $115,826,000 for 2005 from $86,099,000 for 2004. The increase primarily related to a 58 basis point increase in the average cost of customer accounts to 2.47% during the year compared to 1.89% one year ago combined with the 9.1% increase in the balance of customer accounts over the prior year. Interest expense on FHLB advances and other borrowings decreased to $79,434,000 in 2005 from $83,654,000 in 2004 due to a decrease in the average cost of borrowings for the year ended September 30, 2005 to 4.77% from 5.10% for the same period one year ago. This decrease was accomplished by replacing higher cost borrowings with lower rate borrowings available during the year due to the relatively low level of long-term interest rates.
The Company recorded a $134,000 reversal of the provision for loan losses in 2005 compared to a $231,000 reversal of the provision in 2004. The 2005 reversal is due to a reduction in the Company’s nonperforming loan balances as well as an improvement in the number of delinquent loans, which was offset by the 18.0% growth in loans receivable and securitized assets subject to repurchase over the prior year. Non-performing assets decreased to $7,344,000, or .09% of total assets at September 30, 2005 compared with $14,945,000, or .21% of total assets
7
MANAGEMENT’S DISCUSSION AND ANALYSIS OF
FINANCIAL CONDITION AND RESULTS OF OPERATIONS (CONTINUED)
| | at September 30, 2004. Total delinquencies over 30 days were $16,723,000, or .20% of total assets at September 30, 2005 compared to $21,419,000, or ..30% of total assets at September 30, 2004. Management believes the allowance for loan losses, totaling $24,756,000, is sufficient to absorb estimated losses inherent in the portfolio. |
Total other income increased $1,266,000, or 24.6%, in 2005 from 2004. The increase is primarily the result of recognizing $990,000 of income as a result of the favorable settlement of a loan obligation. In addition, there was a reduction in the amount of loss on the extinguishment of debt to $2,194,000 in 2005 versus $5,191,000 in the prior year. Net losses on the sale of securities totaled $3,534,000 in 2005 compared to net losses of $890,000 in 2004.
Compensation expense increased $2,786,000, or 8.9%, in 2005 due to the combination of a $1,914,000 bonus expense resulting from increased earnings per share as well as annual cost of living and merit increases. There was no bonus expense in 2004. Personnel, including part-time employees considered on a full-time equivalent basis, decreased to 749 at September 30, 2005 compared to 754 one year ago.
Occupancy expense increased $975,000, or 12.5%, during the year resulting from an expense of $1,225,000 related to the amortization of leasehold improvements that brings the Company into conformity with a recent clarification of the accounting standard for leases. The Company now amortizes leasehold improvements over the shorter of the original lease term, excluding option periods, or the expected useful life of the improvements. Partially offsetting this additional amortization expense was a reduction in the amount of maintenance expense. The branch network increased to 122 offices at September 30, 2005 versus 120 offices one year ago.
Other expenses increased $2,892,000 during the year due mainly to a $1,500,000 expense for a state business tax assessment as well as an increase in accounting and other professional fees of $615,000. Other expense for 2005 and 2004 equaled .68% and .62% of average assets, respectively.
Income tax expense increased $4,575,000, or 6.4%, in 2005 due to a higher taxable income base. The effective tax rate was 34.38% for 2005 versus 35.27% for 2004. The effective income tax rate for 2005 decreased as a result of a $2,500,000 reversal of a contingent tax liability that was resolved in the fourth quarter.
PERIOD END SPREAD – AS OF THE DATE SHOWN
| | | | | | | | | | | | | | | | | | | | | | | | |
| | | Dec 31
2004
| | | Mar 31
2005
| | | Jun 30
2005
| | | Sep 30
2005
| | | Dec 31
2005
| | | Mar 31
2006
| | | Jun 30
2006
| | | Sep 30
2006
| |
Interest rate on loans and mortgage-backed securities | | 6.16 | % | | 6.16 | % | | 6.14 | % | | 6.19 | % | | 6.24 | % | | 6.32 | % | | 6.41 | % | | 6.48 | % |
Interest rate on investment securities* | | 2.86 | | | 3.46 | | | 3.22 | | | 3.74 | | | 4.04 | | | 4.28 | | | 4.17 | | | 4.10 | |
| | |
|
|
Combined | | 5.63 | | | 5.80 | | | 5.78 | | | 5.91 | | | 6.04 | | | 6.15 | | | 6.30 | | | 6.38 | |
| | |
|
|
Interest rate on customer accounts | | 2.11 | | | 2.37 | | | 2.70 | | | 2.94 | | | 3.16 | | | 3.38 | | | 3.78 | | | 4.05 | |
Interest rate on borrowings | | 4.74 | | | 4.74 | | | 4.66 | | | 4.51 | | | 4.46 | | | 4.48 | | | 4.50 | | | 4.55 | |
| | |
|
|
Combined | | 2.78 | | | 2.97 | | | 3.23 | | | 3.37 | | | 3.51 | | | 3.70 | | | 3.99 | | | 4.20 | |
| | |
|
|
Interest rate spread | | 2.85 | % | | 2.83 | % | | 2.55 | % | | 2.54 | % | | 2.53 | % | | 2.45 | % | | 2.31 | % | | 2.18 | % |
| | |
|
|
| | * | Includes municipal bonds at tax-equivalent rates and cash equivalents. |
The interest rate spread decreased during 2006 from 2.54% at September 30, 2005 to 2.18% at September 30, 2006. See “Interest Rate Risk” on pages 4 and 5.
8

SELECTED FINANCIAL DATA
| | | | | | | | | | | | | | | | | |
| Year ended September 30, | | 2006 | | 2005 | | | 2004 | | | 2003 | | 2002 |
| | | (In thousands, except per share data) |
Interest income | | $ | 529,883 | | $ | 461,901 | | | $ | 413,772 | | | $ | 449,295 | | $ | 511,802 |
Interest expense | | | 273,361 | | | 195,260 | | | | 169,753 | | | | 194,884 | | | 234,941 |
| | |
|
|
Net interest income | | | 256,522 | | | 266,641 | | | | 244,019 | | | | 254,411 | | | 276,861 |
Provision for (reversal of) loan losses | | | 535 | | | (134 | ) | | | (231 | ) | | | 1,500 | | | 7,000 |
Other income | | | 16,252 | | | 7,852 | | | | 5,726 | | | | 16,571 | | | 10,163 |
Other expense | | | 53,579 | | | 52,319 | | | | 46,264 | | | | 45,759 | | | 50,828 |
| | |
|
|
Income before income taxes | | | 218,660 | | | 222,308 | | | | 203,712 | | | | 223,723 | | | 229,196 |
Income taxes | | | 75,558 | | | 76,419 | | | | 71,844 | | | | 78,724 | | | 80,812 |
| | |
|
|
Net income | | $ | 143,102 | | $ | 145,889 | | | $ | 131,868 | | | $ | 144,999 | | $ | 148,384 |
| | |
|
|
Per share data | | | | | | | | | | | | | | | | | |
Basic earnings | | $ | 1.64 | | $ | 1.68 | | | $ | 1.53 | | | $ | 1.72 | | $ | 1.75 |
Diluted earnings | | | 1.64 | | | 1.67 | | | | 1.51 | | | | 1.71 | | | 1.74 |
Cash dividends | | | 0.81 | | | 0.78 | | | | 0.75 | | | | 0.71 | | | 0.68 |
| | | | | |
| September 30, | | 2006 | | 2005 | | | 2004 | | | 2003 | | 2002 |
| | | (In thousands) |
Total assets | | $ | 9,069,020 | | $ | 8,234,450 | | | $ | 7,169,205 | | | $ | 7,535,975 | | $ | 7,392,441 |
Loans and mortgage-backed securities | | | 8,457,759 | | | 7,084,274 | | | | 5,734,658 | | | | 5,443,266 | | | 5,990,223 |
Investment securities | | | 256,650 | | | 214,993 | | | | 414,683 | | | | 310,218 | | | 117,417 |
Cash and cash equivelants | | | 45,722 | | | 637,791 | | | | 708,361 | | | | 1,437,208 | | | 975,153 |
Customer accounts | | | 5,311,726 | | | 5,031,505 | | | | 4,610,358 | | | | 4,577,598 | | | 4,521,922 |
FHLB advances | | | 1,500,000 | | | 1,230,000 | | | | 1,200,000 | | | | 1,650,000 | | | 1,650,000 |
Other borrowings | | | 870,000 | | | 655,000 | | | | 100,000 | | | | 100,000 | | | 100,000 |
| | | | | |
Stockholders’ equity | | | 1,262,720 | | | 1,187,308 | | | | 1,120,188 | | | | 1,055,596 | | | 960,718 |
| | | | | |
Number of | | | | | | | | | | | | | | | | | |
Customer accounts | | | 249,533 | | | 232,707 | | | | 216,405 | | | | 217,785 | | | 213,404 |
Mortgage loans | | | 39,749 | | | 38,014 | | | | 36,202 | | | | 35,309 | | | 38,551 |
Offices | | | 123 | | | 122 | | | | 120 | | | | 119 | | | 115 |
9

CONSOLIDATED STATEMENTS OF FINANCIAL CONDITION
| | | | | | | | |
| September 30, | | 2006 | | | 2005 | |
| | | (In thousands, except
share data) | |
ASSETS | | | | | | | | |
Cash and cash equivalents, including repurchase agreements of$0 and $575,000 | | $ | 45,722 | | | $ | 637,791 | |
Available-for-sale securities, including encumbered securities of$637,855 and $571,462 | | | 1,451,038 | | | | 1,077,856 | |
Held-to-maturity securities, including encumbered securities of$129,893 and $68,759 | | | 184,928 | | | | 212,479 | |
Loans receivable, net | | | 7,078,443 | | | | 6,008,932 | |
Interest receivable | | | 42,304 | | | | 34,048 | |
Premises and equipment, net | | | 62,159 | | | | 63,287 | |
Real estate held for sale | | | 3,903 | | | | 5,631 | |
FHLB stock | | | 129,453 | | | | 129,453 | |
Intangible assets | | | 56,259 | | | | 57,259 | |
Other assets | | | 14,811 | | | | 7,714 | |
| | |
|
|
|
| | | $ | 9,069,020 | | | $ | 8,234,450 | |
| | |
|
|
|
| | |
LIABILITIES AND STOCKHOLDERS’ EQUITY | | | | | | | | |
Liabilities | | | | | | | | |
Customer accounts | | | | | | | | |
Savings and demand accounts | | $ | 5,285,708 | | | $ | 5,002,172 | |
Repurchase agreements with customers | | | 26,018 | | | | 29,333 | |
| | |
|
|
|
| | | | 5,311,726 | | | | 5,031,505 | |
FHLB advances | | | 1,500,000 | | | | 1,230,000 | |
Other borrowings | | | 870,000 | | | | 655,000 | |
Advance payments by borrowers for taxes and insurance | | | 29,505 | | | | 27,533 | |
Federal and state income taxes, including net deferred liabilities of$41,676 and $43,491 | | | 39,667 | | | | 44,617 | |
Accrued expenses and other liabilities | | | 55,402 | | | | 58,487 | |
| | |
|
|
|
| | | | 7,806,300 | | | | 7,047,142 | |
Stockholders’ equity | | | | | | | | |
Common stock, $1.00 par value, 300,000,000 shares authorized,104,467,245 and 104,140,966 shares issued;87,338,824and 86,933,294 shares outstanding | | | 104,467 | | | | 104,141 | |
Paid-in capital | | | 1,246,025 | | | | 1,240,310 | |
Accumulated other comprehensive loss, net of tax | | | (5,975 | ) | | | (704 | ) |
Treasury stock, at cost;17,128,421 and 17,207,672 shares | | | (204,930 | ) | | | (205,874 | ) |
Retained earnings | | | 123,133 | | | | 49,435 | |
| | |
|
|
|
| | | | 1,262,720 | | | | 1,187,308 | |
| | |
|
|
|
| | | $ | 9,069,020 | | | $ | 8,234,450 | |
| | |
|
|
|
| | |
10 | | SEE NOTES TO CONSOLIDATED FINANCIAL STATEMENTS |

CONSOLIDATED STATEMENTS OF OPERATIONS
| | | | | | | | | | | | |
| Year ended September 30, | | 2006 | | | 2005 | | | 2004 | |
| | | (In thousands, except per share
data) | |
INTEREST INCOME | | | | | | | | | | | | |
Loans | | $ | 439,338 | | | $ | 369,023 | | | $ | 330,967 | |
Mortgage-backed securities | | | 66,938 | | | | 61,459 | | | | 48,554 | |
Investment securities | | | 23,607 | | | | 31,419 | | | | 34,251 | |
| | |
|
|
|
| | | | 529,883 | | | | 461,901 | | | | 413,772 | |
| | | |
INTEREST EXPENSE | | | | | | | | | | | | |
Customer accounts | | | 179,605 | | | | 115,826 | | | | 86,099 | |
FHLB advances and other borrowings | | | 93,756 | | | | 79,434 | | | | 83,654 | |
| | |
|
|
|
| | | | 273,361 | | | | 195,260 | | | | 169,753 | |
| | |
|
|
|
Net interest income | | | 256,522 | | | | 266,641 | | | | 244,019 | |
Provision for (reversal of) loan losses | | | 535 | | | | (134 | ) | | | (231 | ) |
| | |
|
|
|
Net interest income after provision for loan losses | | | 255,987 | | | | 266,775 | | | | 244,250 | |
| | | |
OTHER INCOME | | | | | | | | | | | | |
Loss on sale of investments, net | | | — | | | | (3,534 | ) | | | (890 | ) |
Loss on extinguishment of debt | | | — | | | | (2,194 | ) | | | (5,191 | ) |
Other | | | 16,064 | | | | 12,137 | | | | 11,224 | |
| | |
|
|
|
| | | | 16,064 | | | | 6,409 | | | | 5,143 | |
| | | |
OTHER EXPENSE | | | | | | | | | | | | |
Compensation and fringe benefits | | | 36,574 | | | | 34,197 | | | | 31,411 | |
Amortization of intangibles | | | 1,000 | | | | 1,198 | | | | 1,397 | |
Occupancy expense | | | 7,893 | | | | 8,788 | | | | 7,813 | |
Other | | | 12,683 | | | | 13,700 | | | | 10,808 | |
Deferred loan origination costs | | | (4,571 | ) | | | (5,564 | ) | | | (5,165 | ) |
| | |
|
|
|
| | | | 53,579 | | | | 52,319 | | | | 46,264 | |
Gain on real estate acquired through foreclosure, net | | | 188 | | | | 1,443 | | | | 583 | |
| | |
|
|
|
Income before income taxes | | | 218,660 | | | | 222,308 | | | | 203,712 | |
Income taxes | | | | | | | | | | | | |
Current | | | 74,310 | | | | 78,024 | | | | 77,270 | |
Deferred | | | 1,248 | | | | (1,605 | ) | | | (5,426 | ) |
| | |
|
|
|
| | | | 75,558 | | | | 76,419 | | | | 71,844 | |
| | |
|
|
|
NET INCOME | | $ | 143,102 | | | $ | 145,889 | | | $ | 131,868 | |
| | |
|
|
|
| | | |
PER SHARE DATA | | | | | | | | | | | | |
Basic earnings | | $ | 1.64 | | | $ | 1.68 | | | $ | 1.53 | |
Diluted earnings | | | 1.64 | | | | 1.67 | | | | 1.51 | |
Cash dividends | | | 0.81 | | | | 0.78 | | | | 0.75 | |
Weighted average number of shares outstanding,
including dilutive stock options | | | 87,471,474 | | | | 87,478,708 | | | | 87,130,787 | |
| | |
| SEE NOTES TO CONSOLIDATED FINANCIAL STATEMENTS | |
11 |

CONSOLIDATED STATEMENTS OF STOCKHOLDERS’ EQUITY
| | | | | | | | | | | | | | | | | | | | | | | |
| | | Common
Stock | | Paid-in
Capital | | | Retained
Earnings | | | Accumulated
Other
Comprehensive
Income (loss) | | | Treasury
Stock | | | Total | |
| | | (In thousands) | |
Balance at September 30, 2003 | | $ | 85,554 | | $ | 1,085,650 | | | $ | 64,839 | | | $ | 26,890 | | | $ | (207,337 | ) | | $ | 1,055,596 | |
| | |
|
|
|
Eleven-for-ten stock split distributed February 20, 2004 | | | 8,558 | | | 70,066 | | | | (78,624 | ) | | | | | | | | | | | — | |
Comprehensive income: | | | | | | | | | | | | | | | | | | | | | | | |
Net income | | | | | | | | | | 131,868 | | | | | | | | | | | | 131,868 | |
Other comprehensive income,
net of tax of $5,326: | | | | | | | | | | | | | | | | | | | | | | | |
Unrealized losses on securities | | | | | | | | | | | | | | (10,359 | ) | | | | | | | (10,359 | ) |
Reclassification adjustment | | | | | | | | | | | | | | 576 | | | | | | | | 576 | |
| | | | | | | | | | | | | | | | | | |
|
|
|
Total comprehensive income | | | | | | | | | | | | | | | | | | | | | | 122,085 | |
Dividends | | | | | | | | | | (64,696 | ) | | | | | | | | | | | (64,696 | ) |
Proceeds from exercise of
common stock options | | | 250 | | | 3,267 | | | | | | | | | | | | | | | | 3,517 | |
Tax benefit related to
exercise of stock options | | | | | | | | | | 748 | | | | | | | | | | | | 748 | |
Restricted stock | | | 21 | | | 559 | | | | (398 | ) | | | | | | | | | | | 182 | |
Proceeds from Employee
Stock Ownership Plan | | | | | | 2,085 | | | | | | | | | | | | 2,610 | | | | 4,695 | |
Treasury stock | | | | | | | | | | | | | | | | | | (1,939 | ) | | | (1,939 | ) |
| | |
|
|
|
Balance at September 30, 2004 | | $ | 94,383 | | $ | 1,161,627 | | | $ | 53,737 | | | $ | 17,107 | | | $ | (206,666 | ) | | $ | 1,120,188 | |
| | |
|
|
|
Eleven-for-ten stock split
distributed February 18, 2005 | | | 9,446 | | | 73,988 | | | | (83,434 | ) | | | | | | | | | | | — | |
Comprehensive income: | | | | | | | | | | | | | | | | | | | | | | | |
Net income | | | | | | | | | | 145,889 | | | | | | | | | | | | 145,889 | |
Other comprehensive income,
net of tax of $9,803: | | | | | | | | | | | | | | | | | | | | | | | |
Unrealized losses on securities | | | | | | | | | | | | | | (20,090 | ) | | | | | | | (20,090 | ) |
Reclassification adjustment | | | | | | | | | | | | | | 2,279 | | | | | | | | 2,279 | |
| | | | | | | | | | | | | | | | | | |
|
|
|
Total comprehensive income | | | | | | | | | | | | | | | | | | | | | | 128,078 | |
Dividends | | | | | | | | | | (67,719 | ) | | | | | | | | | | | (67,719 | ) |
Proceeds from exercise of
common stock options | | | 302 | | | 3,704 | | | | | | | | | | | | | | | | 4,006 | |
Tax benefit related to
exercise of stock options | | | | | | | | | | 954 | | | | | | | | | | | | 954 | |
Restricted stock | | | 10 | | | 257 | | | | 8 | | | | | | | | | | | | 275 | |
Proceeds from Employee
Stock Ownership Plan | | | | | | 734 | | | | | | | | | | | | 792 | | | | 1,526 | |
Treasury stock | | | | | | | | | | | | | | | | | | — | | | | — | |
| | |
|
|
|
Balance at September 30, 2005 | | $ | 104,141 | | $ | 1,240,310 | | | $ | 49,435 | | | $ | (704 | ) | | $ | (205,874 | ) | | $ | 1,187,308 | |
| | |
|
|
|
Comprehensive income: | | | | | | | | | | | | | | | | | | | | | | | |
Net income | | | | | | | | | | 143,102 | | | | | | | | | | | | 143,102 | |
Other comprehensive income,
net of tax of $2,901: | | | | | | | | | | | | | | | | | | | | | | | |
Unrealized losses on securities | | | | | | | | | | | | | | (5,271 | ) | | | | | | | (5,271 | ) |
Reclassification adjustment | | | | | | | | | | | | | | — | | | | | | | | — | |
| | | | | | | | | | | | | | | | | | |
|
|
|
Total comprehensive income | | | | | | | | | | | | | | | | | | | | | | 137,831 | |
Dividends | | | | | | | | | | (70,708 | ) | | | | | | | | | | | (70,708 | ) |
Compensation expense related to
common stock options | | | | | | 1,119 | | | | | | | | | | | | | | | | 1,119 | |
Proceeds from exercise of
common stock options | | | 314 | | | 3,827 | | | | | | | | | | | | | | | | 4,141 | |
Tax benefit related to
exercise of stock options | | | | | | 936 | | | | | | | | | | | | | | | | 936 | |
Restricted stock | | | 12 | | | (1,044 | ) | | | 1,304 | | | | | | | | | | | | 272 | |
Proceeds from Employee
Stock Ownership Plan | | | | | | 877 | | | | | | | | | | | | 944 | | | | 1,821 | |
Treasury stock | | | | | | | | | | | | | | | | | | — | | | | — | |
| | |
|
|
|
Balance at September 30, 2006 | | $ | 104,467 | | $ | 1,246,025 | | | $ | 123,133 | | | $ | (5,975 | ) | | $ | (204,930 | ) | | $ | 1,262,720 | |
| | |
|
|
|
| | |
12 | | SEE NOTES TO CONSOLIDATED FINANCIAL STATEMENTS |

CONSOLIDATED STATEMENTS OF CASH FLOWS
| | | | | | | | | | | | |
| Year ended September 30, | | 2006 | | | 2005 | | | 2004 | |
| | | (In thousands) | |
CASH FLOWS FROM OPERATING ACTIVITIES | | | | | | | | | | | | |
Net income | | $ | 143,102 | | | $ | 145,889 | | | $ | 131,868 | |
Adjustments to reconcile net income to net cash provided by operating activities | | | | | | | | | | | | |
Accretion (amortization) of fees, discounts, premiums and intangible assets, net | | | 4,899 | | | | (8,761 | ) | | | (11,395 | ) |
Depreciation | | | 2,811 | | | | 3,847 | | | | 2,624 | |
Stock option compensation expense | | | 1,119 | | | | — | | | | — | |
Provision for (reversal of) loan losses | | | 535 | | | | (134 | ) | | | (231 | ) |
Loss (gain) on investment securities and real estate held for sale, net | | | (188 | ) | | | 2,091 | | | | 306 | |
Loss on extinguishment of debt | | | — | | | | 2,194 | | | | 5,191 | |
Increase in accrued interest receivable | | | (8,256 | ) | | | (4,216 | ) | | | (343 | ) |
Increase (decrease) in income taxes payable | | | (1,887 | ) | | | (6,307 | ) | | | 1,607 | |
FHLB stock dividends | | | — | | | | (387 | ) | | | (5,912 | ) |
Decrease (increase) in other assets | | | (7,097 | ) | | | 1,898 | | | | 10,195 | |
Increase (decrease) in accrued expenses and other liabilities | | | (3,085 | ) | | | 7,134 | | | | (8,137 | ) |
| | |
|
|
|
Net cash provided by operating activities | | | 131,953 | | | | 143,248 | | | | 125,773 | |
| | |
|
|
|
| | | |
CASH FLOWS FROM INVESTING ACTIVITIES | | | | | | | | | | | | |
Loans and contracts originated | | | | | | | | | | | | |
Single-family residential loans | | | (1,103,999 | ) | | | (1,209,555 | ) | | | (1,108,216 | ) |
Construction loans | | | (704,314 | ) | | | (716,569 | ) | | | (580,882 | ) |
Land loans | | | (458,538 | ) | | | (358,863 | ) | | | (244,048 | ) |
Multi-family loans | | | (135,496 | ) | | | (151,839 | ) | | | (137,838 | ) |
| | |
|
|
|
| | | | (2,402,347 | ) | | | (2,436,826 | ) | | | (2,070,984 | ) |
| | | |
Savings account loans originated | | | (2,578 | ) | | | (2,282 | ) | | | (1,779 | ) |
Loan principal repayments | | | 1,694,530 | | | | 1,769,058 | | | | 1,693,142 | |
Increase in undisbursed loans in process | | | 37,305 | | | | 84,162 | | | | 127,591 | |
Loans purchased | | | (399,766 | ) | | | (331,456 | ) | | | (31,911 | ) |
Repurchase agreements matured (purchased) | | | — | | | | 200,000 | | | | (200,000 | ) |
FHLB stock redeemed | | | — | | | | 56,208 | | | | 12,489 | |
FHLB stock repurchased | | | — | | | | (48,000 | ) | | | — | |
Available-for-sale securities purchased | | | (573,386 | ) | | | (747,178 | ) | | | (666,990 | ) |
Principal payments and maturities of available-for-sale securities | | | 189,940 | | | | 424,476 | | | | 250,431 | |
Available-for-sale securities sold | | | — | | | | 127,544 | | | | 303,171 | |
Held-to-maturity securities purchased | | | — | | | | (80,000 | ) | | | (56,900 | ) |
Principal payments and maturities of held-to-maturity securities | | | 27,766 | | | | 24,207 | | | | 55,196 | |
Proceeds from sales of real estate held for sale | | | 2,814 | | | | 6,281 | | | | 14,816 | |
Premises and equipment purchased, net | | | (1,683 | ) | | | (4,085 | ) | | | (4,731 | ) |
| | |
|
|
|
Net cash used by investing activities | | | (1,427,405 | ) | | | (957,891 | ) | | | (576,459 | ) |
| | |
|
|
|
| | | |
CASH FLOWS FROM FINANCING ACTIVITIES | | | | | | | | | | | | |
Net increase in customer accounts | | | 280,221 | | | | 421,147 | | | | 32,760 | |
Net increase (decrease) in short-term borrowings | | | 115,000 | | | | 52,806 | | | | (255,191 | ) |
Proceeds from long-term borrowings | | | 700,000 | | | | 700,000 | | | | 250,000 | |
Repayments of long-term borrowings | | | (330,000 | ) | | | (170,000 | ) | | | (450,000 | ) |
Proceeds from exercise of common stock options and related tax benefit | | | 5,077 | | | | 4,006 | | | | 4,265 | |
Dividends paid | | | (70,708 | ) | | | (67,719 | ) | | | (64,696 | ) |
Proceeds from Employee Stock Ownership Plan | | | 1,821 | | | | 1,526 | | | | 4,695 | |
Treasury stock purchased, net | | | — | | | | — | | | | (1,939 | ) |
Increase in advance payments by borrowers for taxes and insurance | | | 1,972 | | | | 2,307 | | | | 1,945 | |
| | |
|
|
|
Net cash provided (used) by financing activities | | | 703,383 | | | | 944,073 | | | | (478,161 | ) |
| | |
|
|
|
Increase (decrease) in cash and cash equivalents | | | (592,069 | ) | | | 129,430 | | | | (928,847 | ) |
Cash and cash equivalents at beginning of year | | | 637,791 | | | | 508,361 | | | | 1,437,208 | |
| | |
|
|
|
Cash and cash equivalents at end of year | | $ | 45,722 | | | $ | 637,791 | | | $ | 508,361 | |
| | |
|
|
|
| | |
| SEE NOTES TO CONSOLIDATED FINANCIAL STATEMENTS | |
13 |
CONSOLIDATED STATEMENTS OF CASH FLOWS(CONTINUED)
| | | | | | | | | |
| Year ended September 30, | | 2006 | | 2005 | | 2004 |
| | | (In thousands) |
SUPPLEMENTAL DISCLOSURES OF CASH FLOW INFORMATION | | | | | | | | | |
Noncash investing activities | | | | | | | | | |
Real estate acquired through foreclosure | | $ | 898 | | $ | 1,839 | | $ | 6,659 |
Cash paid during the year for | | | | | | | | | |
Interest | | | 272,195 | | | 191,398 | | | 172,195 |
Income taxes | | | 78,784 | | | 81,553 | | | 75,004 |
| | |
14 | | SEE NOTES TO CONSOLIDATED FINANCIAL STATEMENTS |

NOTES TO CONSOLIDATED FINANCIAL STATEMENTS
YEARS ENDED SEPTEMBER 30, 2006, 2005 AND 2004
NOTE A | SUMMARY OF SIGNIFICANT ACCOUNTING POLICIES |
Principles of consolidation. The consolidated financial statements include the accounts of Washington Federal, Inc. (Company or Washington Federal) and its wholly owned subsidiaries. Intercompany transactions and balances have been eliminated.
Description of business. Washington Federal, Inc. is a savings and loan holding company. The Company’s principal operating subsidiary is Washington Federal Savings. The Company is principally engaged in the business of attracting savings deposits from the general public and investing these funds, together with borrowings and other funds, in one-to-four family residential real estate loans and multi-family real estate loans. The Company conducts its activities through a network of 123 offices located in Washington, Oregon, Idaho, Utah, Arizona, Nevada, and Texas.
On October 10, 2006, Washington Federal announced the signing of a definitive merger agreement to acquire First Federal Banc of the Southwest, Inc. (“First Federal”) for a purchase price of $99 million in cash. First Federal is the holding company of First Federal Bank, a federal savings bank headquartered in Roswell, New Mexico with 13 branches in New Mexico and 2 branches in El Paso, Texas. First Federal reported total assets of $562 million, total deposits of $392 million and total stockholders’ equity of $53 million as of June 30, 2006. The transaction is expected to close in the first calendar quarter of 2007, pending regulatory and shareholder approvals.
The Company’s fiscal year end is September 30th. All references to 2006, 2005 and 2004 represent balances as of September 30, 2006, September 30, 2005 and September 30, 2004, or activity for the fiscal years then ended, respectively.
Cash and cash equivalents. Cash and cash equivalents include cash on hand, amounts due from banks, overnight investments and repurchase agreements with an initial maturity of three months or less.
Repurchase agreements. Repurchase agreements are fully collateralized investments with an initial maturity exceeding three months.
Investments and mortgage-backed securities. The Company accounts for investments and mortgage-backed securities in two categories: held-to-maturity and available-for-sale.
Held-to-maturity securities – Securities classified as held-to-maturity are accounted for at amortized cost, but the Company must have both the positive intent and the ability to hold those securities to maturity. There are very limited circumstances under which securities in the held-to-maturity category can be sold without jeopardizing the cost basis of accounting for the remainder of the securities in this category.
Available-for-sale securities – Securities not classified as held-to-maturity are considered to be available-for-sale. Gains and losses realized on the sale of these securities are based on the specific identification method. Unrealized gains and losses for available-for-sale securities are excluded from earnings and reported as a net amount in the accumulated other comprehensive income component of stockholders’ equity.
Management evaluates debt and equity securities for other than temporary impairment on a quarterly basis based on the securities’ current credit quality, interest rates, term to maturity and management’s intent and ability to hold the securities until the net book value is recovered. Any other than temporary declines in fair value are recognized in the statements of operations as loss on sale of investments.
Premiums and discounts on investments are deferred and recognized over the life of the asset using the effective interest method.
Loans receivable. Loans receivable more than 90 days past due are placed on non-accrual status and an allowance for accrued interest is established. Any interest ultimately collected is credited to income in the period of recovery.
The Company maintains an allowance for loan losses to absorb losses inherent in the loan portfolio. The allowance is based on ongoing, quarterly assessments of the probable and estimable losses inherent in the loan portfolio. The Company’s methodology for assessing the appropriateness of the allowance consists of several key elements, which include the formula allowance and specific allowances.
The formula portion of the general loan loss allowance is established by applying a loss percentage factor to the different loan types. The allowances are provided based on Management’s continuing
15
NOTES TO CONSOLIDATED FINANCIAL STATEMENTS(CONTINUED)
| | evaluation of the pertinent factors underlying the quality of the loan portfolio, including changes in the size and composition of the loan portfolio, actual loan loss experience, current economic conditions, geographic concentrations, seasoning of the loan portfolio, specific industry conditions, and the duration of the current business cycle. The recovery of the carrying value of loans is susceptible to future market conditions beyond the Company’s control, which may result in losses or recoveries differing from those provided. |
Specific allowances are established in cases where Management has identified significant conditions or circumstances related to a loan that Management believes indicate the probability that a loss has been incurred.
Impaired loans consist of loans receivable that are not expected to be repaid in accordance with their contractual terms and are measured using the fair value of the collateral. Smaller balance loans are excluded from this analysis.
Premises and equipment. Premises and equipment are stated at cost, less accumulated depreciation. Depreciation is computed on the straight-line method over the estimated useful lives of the respective assets. Expenditures are capitalized for betterments and major renewals. Charges for ordinary maintenance and repairs are expensed to operations as incurred.
Real estate held for sale. Properties acquired in settlement of loans or acquired for development are recorded at the lower of cost or fair value.
Derivatives. The Company accepts a high level of interest rate risk as a result of its policy to originate fixed-rate single-family home loans that are longer-term than the short-term characteristics of its liabilities of customer accounts and borrowed money. The Company enters into forward contracts (derivative contract) to purchase mortgage-backed securities as part of its interest rate risk management program. The forward contracts allow the Company to hedge the risk of varying mortgage-backed securities spot prices in the future as the result of changes in interest rates. The purchase contracts are generally for periods of 30 to 90 days.
During 2005, the Company reviewed its accounting for derivatives and concluded that it had not met the criteria established by Statement of Financial Accounting Standards No. 133, as amended, to account for such instruments as cash flow hedges. The cumulative effect of the correction of the error, as of January 1, 2005 was $7.9 million, net of tax. The amount was recorded as additional interest income on mortgage-backed securities and loss on sale of securities, in March 2005.
On the date the Company enters into a derivative contract, the derivative instrument is designated as a hedge of the variability in expected future cash flows associated with a probable future transaction. Under cash flow hedge accounting, if specific criteria are met, the effective portion of the derivative instrument is recognized as a component of stockholders’ equity through comprehensive income until the related forecasted transaction affects earnings, either through the recognition of interest income or through the sale of the security. To the extent that forward contracts to purchase securities are not designated as cash flow hedges or fail to meet hedging criteria, including purchasing the mortgage-backed securities within a specific time frame, the fair value of the contracts will be included in earnings. As of September 30, 2006 and 2005, the Company had outstanding forward purchase commitments of $0 and $20,000,000, respectively, with estimated fair values of $0.
Intangible assets. Goodwill represents the excess of the cost of businesses acquired over the fair value of the net assets acquired. The core deposit intangible and non-compete agreement intangible are acquired assets that lack physical substance but can be distinguished from goodwill. Goodwill is evaluated for impairment on an annual basis. Other intangible assets are amortized over their estimated lives and are subject to impairment testing when events or circumstances change. If circumstances indicate that the carrying value of the assets may not be recoverable, an impairment charge could be recorded. No impairment of intangible assets has ever been identified. The Company amortizes the core deposit intangible on an accelerated basis over its estimated life of seven years; the non-compete agreement intangible is amortized on a straight-line basis over its life of five years.
16
The table below presents the estimated intangible asset amortization expense for the next four years (after which time the assets will be fully amortized):
| | |
| Year ended September 30, | | Amortization expense |
| | | (In thousands) |
2007 | | $801 |
2008 | | 593 |
2009 | | 289 |
2010 | | 91 |
Deferred fees and discounts on loans. Loan discounts and loan fees are deferred and recognized over the life of the loans using the effective interest method. Deferred loan origination costs are deducted from other expenses.
Accounting for stock-based compensation. On October 1, 2005, the Company changed its accounting policy related to stock-based compensation in connection with the adoption of Statement of Financial Accounting Standards No. 123 (revised 2004), Share-Based Payment (SFAS 123R). As a result of this change, the Company now records an expense for the estimated fair value of equity awards over the vesting period. See Note L for additional information.
Use of estimates. The preparation of financial statements in conformity with accounting principles generally accepted in the United States of America requires Management to make estimates and assumptions that affect the reported amounts of assets and liabilities and disclosure of contingent assets and liabilities at the date of the financial statements and the reported amounts of revenues and expenses during the reporting period. Significant estimates reported in the financial statements include the allowance for loan losses, intangible assets, deferred taxes and contingent liabilities. Actual results could differ from these estimates.
In the second quarters of 2005 and 2004, the Company declared an eleven-for-ten stock split in the form of a 10% stock dividend. All share and per share amounts have been adjusted to reflect these stock dividends.
Business segments. As the Company manages its business and operations on a consolidated basis, management has determined that there is one reportable business segment.
Reclassifications. Certain reclassifications have been made to the financial statements for years prior to September 30, 2006 to conform to current year classifications. Specifically, securitized assets subject to repurchase have been included with loans receivable.
17
NOTES TO CONSOLIDATED FINANCIAL STATEMENTS(CONTINUED)
NOTE B | INVESTMENT SECURITIES |
| | | | | | | | | | | | | | | | |
| September 30, | | 2006 | |
| | | (In thousands) | |
| | | Amortized Cost
| | Gross Unrealized
| | | Fair Value
| | | |
| | | | Gains
| | Losses
| | | | Yield
| |
Available-for-sale securities | | | | | | | | | | | | | | | | |
U.S. government and agency securities due | | | | | | | | | | | | | | | | |
Within 1 year | | $ | 85,291 | | $ | 533 | | $ | (948 | ) | | $ | 84,876 | | 7.08 | % |
1 to 5 years | | | 2,562 | | | — | | | (100 | ) | | | 2,462 | | 6.26 | |
5 to 10 years | | | 6,000 | | | 126 | | | (22 | ) | | | 6,104 | | 5.59 | |
Over 10 years | | | 124,606 | | | 4,248 | | | (667 | ) | | | 128,187 | | 8.58 | |
Mortgage-Backed Securities | | | | | | | | | | | | | | | | |
Agency pass-through certificates | | | 1,242,026 | | | 5,466 | | | (18,083 | ) | | | 1,229,409 | | 5.71 | |
| | |
|
|
|
| | | | 1,460,485 | | | 10,373 | | | (19,820 | ) | | | 1,451,038 | | 6.04 | |
| | |
|
|
|
Held-to-maturity securities | | | | | | | | | | | | | | | | |
Tax-exempt municipal bonds due | | | | | | | | | | | | | | | | |
5 to 10 years | | | 1,796 | | | 152 | | | — | | | | 1,948 | | 9.06 | |
Over 10 years | | | 6,325 | | | 560 | | | — | | | | 6,885 | | 8.35 | |
U.S. government and agency securities due | | | | | | | | | | | | | | | | |
within 1 year | | | 26,900 | | | — | | | (103 | ) | | | 26,797 | | 2.95 | |
Mortgage-Backed Securities | | | | | | | | | | | | | | | | |
Agency pass-through certificates | | | 149,907 | | | 754 | | | (4,380 | ) | | | 146,281 | | 5.58 | |
| | |
|
|
|
| | | | 184,928 | | | 1,466 | | | (4,483 | ) | | | 181,911 | | 5.33 | |
| | |
|
|
|
| | | $ | 1,645,413 | | $ | 11,839 | | $ | (24,303 | ) | | $ | 1,632,949 | | 5.96 | % |
| | |
|
|
|
| | | | | | | | | | | | | | | | |
| |
| September 30, | | 2005 | |
| | | (In thousands) | |
| | | Amortized Cost
| | Gross Unrealized
| | | Fair Value
| | | |
| | | | Gains
| | Losses
| | | | Yield
| |
Available-for-sale securities | | | | | | | | | | | | | | | | |
U.S. government and agency securities due | | | | | | | | | | | | | | | | |
Within 1 year | | $ | 72,290 | | $ | 1,477 | | $ | (288 | ) | | $ | 73,479 | | 7.52 | % |
1 to 5 years | | | 15,094 | | | — | | | (245 | ) | | | 14,849 | | 4.29 | |
5 to 10 years | | | 1,000 | | | — | | | (20 | ) | | | 980 | | 3.50 | |
Over 10 years | | | 84,692 | | | 4,695 | | | (760 | ) | | | 88,627 | | 8.00 | |
Mortgage-Backed Securities | | | | | | | | | | | | | | | | |
Agency pass-through certificates | | | 905,893 | | | 3,436 | | | (9,408 | ) | | | 899,921 | | 5.58 | |
| | |
|
|
|
| | | | 1,078,969 | | | 9,608 | | | (10,721 | ) | | | 1,077,856 | | 5.88 | |
| | |
|
|
|
Held-to-maturity securities | | | | | | | | | | | | | | | | |
Tax-exempt municipal bonds due | | | | | | | | | | | | | | | | |
5 to 10 years | | | 1,800 | | | 211 | | | — | | | | 2,011 | | 9.06 | |
Over 10 years | | | 8,358 | | | 734 | | | — | | | | 9,092 | | 8.61 | |
U.S. government and agency securities due | | | | | | | | | | | | | | | | |
1 to 5 years | | | 26,900 | | | — | | | (424 | ) | | | 26,476 | | 2.95 | |
Mortgage-Backed Securities | | | | | | | | | | | | | | | | |
Agency pass-through certificates | | | 175,421 | | | 1,408 | | | (2,812 | ) | | | 174,017 | | 5.60 | |
| | |
|
|
|
| | | | 212,479 | | | 2,353 | | | (3,236 | ) | | | 211,596 | | 5.41 | |
| | |
|
|
|
| | | $ | 1,291,448 | | $ | 11,961 | | $ | (13,957 | ) | | $ | 1,289,452 | | 5.80 | % |
| | |
|
|
|
18
Yields shown in the tables above represent tax-equivalent yields for 2006 and 2005, calculated as 1.45 and 1.48 times the tax-free municipal yield, for the respective years.
There were no sales of available-for-sale securities in 2006. $127.5 million in available-for-sale investment securities were sold in 2005, resulting in a net loss of $3,534,000. This net loss for 2005 consisted of $1,793,000 in realized gains and $5,327,000 in realized losses, including a $4.1 million other than temporary impairment on GSE preferred stock. In 2004, $303.2 million in available-for-sale investment securities and a $1.8 million held-to-maturity (HTM) security were sold, resulting in a net loss of $890,000. The net loss for 2004 consisted of $2,422,000 in realized gains and $3,312,000 in realized losses. The $1.8 million HTM security sale did not taint the remaining HTM securities in the Company’s portfolio because over 87% of the related principal had been collected.
Substantially all mortgage-backed securities have contractual due dates that exceed 10 years.
The following table shows the unrealized gross losses and fair value of securities at September 30, 2006, by length of time that individual securities in each category have been in a continuous loss position. The Company had $978,035,000 in fair value of securities in a continuous loss position for 12 or more months at September 30, 2006, which consisted of mortgage-backed securities, bonds and GSE preferred stock. Management believes that the declines in fair value of these investments were due to changes in market interest rates, not in estimated cash flows. No other than temporary impairment was recorded in 2006.
| | | | | | | | | | | | | | | | | | | | | | |
| As of September 30, | | 2006 | |
| | | (In thousands) | |
| | | Less than 12 months
| | 12 months or more
| | Total
| |
| | | Unrealized
Gross Losses
| | | Fair
Value
| | Unrealized
Gross Losses
| | | Fair
Value
| | Unrealized
Gross Losses
| | | Fair
Value
| |
U.S. agency securities | | $ | (131 | ) | | $ | 4,432 | | $ | (1,709 | ) | | $ | 139,403 | | $ | (1,840 | ) | | $ | 143,835 | |
Agency pass-through certificates | | | (300 | ) | | | 29,139 | | | (22,163 | ) | | | 805,061 | | | (22,463 | ) | | | 834,200 | |
| | |
|
|
|
| | | $ | (431 | ) | | $ | 33,571 | | $ | (23,872 | ) | | $ | 944,464 | | $ | (24,303 | ) | | $ | 978,035 | |
| | | | | | | |
| September 30, | | 2006 | | 2005 | |
| | | (In thousands) | |
Conventional real estate | | | | | | | |
Single-family residential | | $ | 5,416,501 | | $ | 4,630,411 | |
Multi-family | | | 527,719 | | | 501,824 | |
Land | | | 616,798 | | | 438,621 | |
Construction | | | 1,140,375 | | | 1,021,419 | |
| | |
|
|
|
| | | | 7,701,393 | | | 6,592,275 | |
| | |
|
|
|
Less | | | | | | | |
Allowance for probable losses | | | 24,993 | | | 24,756 | |
Loans in process | | | 556,595 | | | 519,290 | |
Deferred net loan origination fees | | | 41,362 | | | 39,297 | |
| | |
|
|
|
| | | | 622,950 | | | 583,343 | |
| | |
|
|
|
| | | $ | 7,078,443 | | $ | 6,008,932 | |
| | |
|
|
|
19
NOTES TO CONSOLIDATED FINANCIAL STATEMENTS(CONTINUED)
The Company originates adjustable and fixed interest rate loans, which at September 30, 2006 consisted of the following:
| | | | | | | | | | |
| Fixed-Rate | | | | Adjustable-Rate |
| Term to Maturity | | Book Value | | | | Term to Rate Adjustment | | Book Value |
| | | (In thousands) | | | | | | (In thousands) |
Within 1 year | | $ | 49,143 | | | | Less than 1 year | | $ | 1,259,817 |
1 to 3 years | | | 83,945 | | | | 1 to 3 years | | | 286,745 |
3 to 5 years | | | 34,148 | | | | 3 to 5 years | | | 85,168 |
5 to 10 years | | | 199,086 | | | | 5 to 10 years | | | 3,089 |
10 to 20 years | | | 555,245 | | | | 10 to 20 years | | | 13,627 |
Over 20 years | | | 5,131,139 | | | | Over 20 years | | | 241 |
| | |
|
| | | | | |
|
|
| | | $ | 6,052,706 | | | | | | $ | 1,648,687 |
| | |
|
| | | | | |
|
|
At September 30, 2006 and 2005, approximately $48,293,000 and $47,537,000 of fixed-rate loan origination commitments were outstanding, respectively. Loans serviced for others at September 30, 2006 and 2005 were approximately $11,124,000 and $14,857,000, respectively.
Permanent single-family residential loans receivable included adjustable-rate loans of $98,388,000 and $92,067,000 at September 30, 2006 and 2005, respectively. These loans have interest rate adjustment limitations and are generally indexed to the 1-year Treasury Bill rate or the Fannie Mae 30 year/30 day commit rate published each Wednesday in the Wall Street Journal.
Loans by geographic concentration were as follows:
| | | | | | | | | | | | | | | | | | | | | | |
| September 30, 2006 | | Washington | | Idaho | | Oregon | | Utah | | Arizona | | Other | | Total | |
| | | (In thousands) | |
Conventional real estate | | | | | | | | | | | | | | | | | | | | | | |
Single-family residential | | $ | 1,991,934 | | $ | 543,942 | | $ | 862,832 | | $ | 487,874 | | $ | 487,640 | | $ | 1,042,279 | | $ | 5,416,501 | |
Multi-family | | | 108,046 | | | 29,327 | | | 245,127 | | | 35,389 | | | 81,243 | | | 28,587 | | | 527,719 | |
Land | | | 313,502 | | | 66,771 | | | 61,165 | | | 43,446 | | | 74,301 | | | 57,613 | | | 616,798 | |
Construction | | | 480,923 | | | 162,221 | | | 197,097 | | | 117,509 | | | 115,155 | | | 67,470 | | | 1,140,375 | |
| | |
|
|
|
| | | $ | 2,894,405 | | $ | 802,261 | | $ | 1,366,221 | | $ | 684,218 | | $ | 758,339 | | $ | 1,195,949 | | $ | 7,701,393 | |
| | |
|
|
|
At September 30, 2006, the Company’s recorded investment in impaired loans was $94,000 with allocated reserves of $94,000 . At September 30, 2005 the Company’s recorded investment in impaired loans was $0.9 million with allocated reserves of $0.3 million. The average balance of impaired loans during 2006, 2005 and 2004 was $0.4 million, $1.1 million and $4.6 million and interest income from impaired loans was $28,000, $71,000 and $283,000, respectively.
NOTE D | ALLOWANCE FOR LOSSES ON LOANS |
| | | | | | | | | | | | |
| Year ended September 30, | | 2006 | | | 2005 | | | 2004 | |
| | | (In thousands) | |
Balance at beginning of year | | $ | 24,756 | | | $ | 25,140 | | | $ | 25,806 | |
Provision for (reversal of) loan losses | | | 535 | | | | (134 | ) | | | (231 | ) |
Charge-offs | | | (298 | ) | | | (258 | ) | | | (528 | ) |
Recoveries | | | — | | | | 8 | | | | 93 | |
Acquired reserves | | | — | | | | — | | | | — | |
| | |
|
|
|
Balance at end of year | | $ | 24,993 | | | $ | 24,756 | | | $ | 25,140 | |
| | |
|
|
|
20
NOTE E | INTEREST RECEIVABLE |
| | | | | | | | |
| September 30, | | 2006 | | | 2005 | |
| | | (In thousands) | |
Loans receivable | | $ | 33,208 | | | $ | 27,262 | |
Allowance for uncollected interest on loans receivable | | | (169 | ) | | | (235 | ) |
Mortgage-backed securities | | | 6,585 | | | | 4,989 | |
Investment securities | | | 2,680 | | | | 2,032 | |
| | |
|
|
|
| | | $ | 42,304 | | | $ | 34,048 | |
| | |
|
|
|
NOTE F | PREMISES AND EQUIPMENT |
| | | | | | | | | | |
| September 30, | | | | 2006 | | | 2005 | |
| | | | | (In thousands) | |
| | | Estimated
Useful Life
| | | | | | |
Land | | — | | $ | 22,407 | | | $ | 22,985 | |
Buildings | | 25- 40 | | | 56,408 | | | | 59,204 | |
Leasehold improvements | | 5 - 15 | | | 3,981 | | | | 3,563 | |
Furniture, fixtures and equipment | | 2 - 10 | | | 13,694 | | | | 14,324 | |
| | | | |
|
|
|
| | | | | | 96,490 | | | | 100,076 | |
Less accumulated depreciation and amortization | | | (34,331 | ) | | | (36,789 | ) |
| | | | |
|
|
|
| | | | | $ | 62,159 | | | $ | 63,287 | |
| | | | |
|
|
|
The Company has non-cancelable operating leases for branch offices. Future minimum net rental commitments for all non-cancelable leases, including maintenance and associated costs, are immaterial. Rental expense, including amounts paid under month-to-month cancelable leases, amounted to $2,219,000, $2,033,000 and $1,949,000 in 2006, 2005 and 2004, respectively.
21
NOTES TO CONSOLIDATED FINANCIAL STATEMENTS(CONTINUED)
| | | | | | | |
| September 30, | | 2006 | | 2005 | |
| | | (In thousands) | |
Checking accounts, 4.50% and under | | $ | 235,714 | | $ | 205,482 | |
Passbook and statement accounts, 1.25% | | | 161,098 | | | 191,919 | |
Insured money market accounts, .50% to 3.30% | | | 743,317 | | | 871,945 | |
Certificate accounts | | | | | | | |
Less than 3.00% | | | 37,188 | | | 1,110,932 | |
3.00% to 3.99% | | | 833,968 | | | 2,187,450 | |
4.00% to 4.99% | | | 2,132,966 | | | 343,029 | |
5.00% to 5.99% | | | 1,140,957 | | | 88,847 | |
6.00% to 6.99% | | | 500 | | | 2,568 | |
| | |
|
|
|
Total certificates | | | 4,145,579 | | | 3,732,826 | |
| | |
|
|
|
Repurchase agreements with customers, 1.00% to 4.15% | | | 26,018 | | | 29,333 | |
| | |
|
|
|
| | | $ | 5,311,726 | | $ | 5,031,505 | |
| | |
|
|
|
Certificate maturities were as follows: | | | | | | | |
| | |
| September 30, | | 2006 | | 2005 | |
| | | (In thousands) | |
Within 1 year | | $ | 3,567,427 | | $ | 3,019,716 | |
1 to 2 years | | | 373,469 | | | 485,259 | |
3 to 4 years | | | 97,925 | | | 93,849 | |
Over 4 years | | | 106,758 | | | 134,002 | |
| | |
|
|
|
| | | $ | 4,145,579 | | $ | 3,732,826 | |
| | |
|
|
|
Customer accounts over $100,000 totaled $1,449,000,000 as of September 30, 2006 and $1,365,000,000 as of September 30, 2005.
Interest expense on customer accounts consisted of the following:
| | | | | | | | | | | | |
| Year ended September 30, | | 2006 | | | 2005 | | | 2004 | |
| | | | (In thousands) | |
Checking accounts | | $ | 2,498 | | | $ | 1,342 | | | $ | 1,199 | |
Passbook and statement accounts | | | 2,187 | | | | 1,985 | | | | 1,703 | |
Insured money market accounts | | | 21,789 | | | | 15,154 | | | | 8,185 | |
Certificate accounts | | | 153,266 | | | | 97,247 | | | | 74,559 | |
| | |
|
|
|
| | | | 179,740 | | | | 115,728 | | | | 85,646 | |
Repurchase agreements with customers | | | 856 | | | | 668 | | | | 858 | |
| | |
|
|
|
| | | | 180,596 | | | | 116,396 | | | | 86,504 | |
Less early withdrawal penalties | | | (991 | ) | | | (570 | ) | | | (405 | ) |
| | |
|
|
|
| | | $ | 179,605 | | | $ | 115,826 | | | $ | 86,099 | |
| | |
|
|
|
Weighted average interest rate at end of year | | | 4.05 | % | | | 2.94 | % | | | 2.00 | % |
Weighted daily average interest rate during the year | | | 3.49 | % | | | 2.47 | % | | | 1.89 | % |
22
Maturity dates of FHLB advances were as follows:
| | | | | | | |
| September 30, | | 2006 | | 2005 | |
| | | | (In thousands) | |
FHLB advances due | | | | | | | |
Within 1 year | | $ | — | | $ | — | |
1 to 3 years | | | 200,000 | | | 330,000 | |
4 to 5 years | | | 400,000 | | | — | |
More than 5 years | | | 900,000 | | | 900,000 | |
| | |
|
|
|
| | | $ | 1,500,000 | | $ | 1,230,000 | |
| | |
|
|
|
$1,100,000,000 of the 2006 advances and all of the 2005 advances included in the above table are callable by the FHLB. If these callable advances were to be called at the earliest call dates, the maturities of all FHLB advances would be as follows:
| | | | | | | |
| September 30, | | 2006 | | 2005 | |
| | | | (In thousands) | |
FHLB advances callable | | | | | | | |
Within 1 year | | $ | 500,000 | | $ | 530,000 | |
1 to 3 years | | | — | | | 100,000 | |
4 to 5 years | | | 800,000 | | | — | |
More than 5 years | | | 200,000 | | | 600,000 | |
| | |
|
|
|
| | | $ | 1,500,000 | | $ | 1,230,000 | |
| | |
|
|
|
Financial data pertaining to the weighted-average cost and the amount of FHLB advances were as follows:
| | | | | | | | | | | | |
| September 30, | | 2006 | | | 2005 | | | 2004 | |
| | | | (In thousands) | |
| | | |
Weighted average interest rate at end of year | | | 4.74 | % | | | 4.88 | % | | | 5.09 | % |
Weighted daily average interest rate during the year | | | 4.83 | % | | | 5.18 | % | | | 5.21 | % |
Daily average of FHLB advances | | $ | 1,410,169 | | | $ | 1,206,267 | | | $ | 1,539,594 | |
Maximum amount of FHLB advances at any month end | | | 1,500,000 | | | | 1,230,000 | | | | 1,651,000 | |
Interest expense during the year | | | 68,119 | | | | 62,050 | | | | 80,225 | |
FHLB advances are collateralized as provided for in the Advances, Pledge and Security Agreement by all FHLB stock owned by the Company, deposits with the FHLB and certain mortgages or deeds of trust securing such properties as provided in the agreements with the FHLB. As a member of the FHLB of Seattle, the Company currently has a credit line of 50% of the total assets of the Company, subject to collateralization requirements.
23
NOTES TO CONSOLIDATED FINANCIAL STATEMENTS(CONTINUED)
Maturity dates of securities sold under agreements to repurchase (reverse repurchase agreements) were as follows:
| | | | | | | |
| September 30, | | 2006 | | 2005 | |
| | | (In thousands) | |
Reverse repurchase agreements due | | | | | | | |
Within 1 year | | $ | — | | $ | — | |
1 to 3 years | | | — | | | — | |
4 to 5 years | | | 300,000 | | | 300,000 | |
More than 5 years | | | 400,000 | | | 300,000 | |
| | |
|
|
|
| | | $ | 700,000 | | $ | 600,000 | |
| | |
|
|
|
$500,000,000 of the 2006 reverse repurchase agreements and all of the 2005 reverse repurchase agreements included in the above table are callable by the counterparty. If these were to be called at the earliest call dates, the maturities of the reverse repurchase agreements would be as follows:
| | | | | | | |
| September 30, | | 2006 | | 2005 | |
| | | (In thousands) | |
Reverse repurchase agreements callable | | | | | | | |
Within 1 year | | $ | 100,000 | | $ | — | |
1 to 3 years | | | — | | | 100,000 | |
4 to 5 years | | | 600,000 | | | 500,000 | |
More than 5 years | | | — | | | — | |
| | |
|
|
|
| | | $ | 700,000 | | $ | 600,000 | |
| | |
|
|
|
Other borrowings on the Consolidated Statements of Financial Condition at September 30, 2006 and 2005 included the $700,000,000 and $600,000,000 of reverse repurchase agreements presented in the table above as well as $170,000,000 and $55,000,000 of short-term Fed funds borrowings due October 2, 2006 and October 3, 2005, bearing weighted average interest rates of 5.39% and 3.94%, respectively.
The Company enters into sales of reverse repurchase agreements. Fixed-coupon reverse repurchase agreements are treated as financings, and the obligations to repurchase securities sold are reflected as a liability in the consolidated statements of financial condition. During the three years ended September 30, 2006 all of the Company’s transactions were fixed-coupon reverse repurchase agreements. The dollar amount of securities underlying the agreements remain in the asset accounts. The securities pledged are registered in the Company’s name, and principal and interest payments are received by the Company; however, the securities are held by the designated trustee of the broker. Upon maturity of the agreements, the identical securities pledged as collateral will be returned to the Company.
Financial data pertaining to the weighted-average cost and the amount of securities sold under agreements to repurchase were as follows:
| | | | | | | | | | | | |
| September 30, | | 2006 | | | 2005 | | | 2004 | |
| | | (In thousands) | |
Weighted average interest rate at end of year | | | 3.93 | % | | | 3.80 | % | | | 3.44 | % |
Weighted daily average interest rate during the year | | | 3.89 | % | | | 3.79 | % | | | 3.40 | % |
Daily average of securities sold under agreements to repurchase | | $ | 630,411 | | | $ | 458,082 | | | $ | 100,000 | |
Maximum securities sold under agreements to repurchase at any month end | | | 700,000 | | | | 600,000 | | | | 100,000 | |
Interest expense during the year | | | 25,637 | | | | 17,384 | | | | 3,397 | |
24
The Consolidated Statements of Financial Condition at September 30, 2006 and 2005 include deferred tax liabilities of $41,676,000 and $43,491,000, respectively, that have been provided for the temporary differences between the tax basis and the financial statement carrying amounts of assets and liabilities. The major sources of these temporary differences and their deferred tax effects were as follows:
| | | | | | | |
| September 30, | | 2006 | | 2005 | |
| | | (In thousands) | |
Deferred tax assets | | | | | | | |
Valuation adjustment on available-for-sale securities | | $ | 3,472 | | $ | 409 | |
Deferred compensation | | | 131 | | | 156 | |
Loan loss reserves | | | 9,264 | | | 9,145 | |
| | |
|
|
|
Total deferred tax assets | | | 12,867 | | | 9,710 | |
| | |
|
|
|
Deferred tax liabilities | | | | | | | |
Federal Home Loan Bank stock dividends | | | 31,228 | | | 31,256 | |
Core deposit intangible | | | 562 | | | 909 | |
Deferred gain on forward commitments | | | 2,812 | | | 3,633 | |
Depreciation | | | 7,565 | | | 6,211 | |
Loan origination costs | | | 12,249 | | | 10,808 | |
Other, net | | | 127 | | | 384 | |
| | |
|
|
|
Total deferred tax liabilities | | | 54,543 | | | 53,201 | |
| | |
|
|
|
Net deferred tax liability | | $ | 41,676 | | $ | 43,491 | |
| | |
|
|
|
A reconciliation of the statutory federal income tax rate to the effective income tax rate follows:
| | | | | | | | | |
| Year ended September 30, | | 2006 | | | 2005 | | | 2004 | |
Statutory income tax rate | | 35 | % | | 35 | % | | 35 | % |
Dividend received deduction | | -1 | | | -2 | | | -1 | |
Other timing differences | | -1 | | | -1 | | | -1 | |
State income tax | | 2 | | | 2 | | | 2 | |
| | |
|
|
Effective income tax rate | | 35 | % | | 34 | % | | 35 | % |
| | |
|
|
The Company has been examined by the Internal Revenue Service through the year ended September 30, 1990. There were no material changes made to the Company’s originally reported taxable income as a result of this examination.
NOTE K | PROFIT SHARING RETIREMENT PLAN AND EMPLOYEE STOCK OWNERSHIP PLAN |
The Company maintains a Profit Sharing Retirement Plan and Employee Stock Ownership Plan (Plan) for the benefit of its employees. Company contributions are made semi-annually as approved by the Board of Directors. Such amounts are not in excess of amounts permitted by the Employee Retirement Income Security Act of 1974.
Plan participants may make voluntary after-tax contributions of their considered earnings as defined by the Plan. In addition, participants may make pre-tax contributions up to the statutory limits through the 401(k) provisions of the Plan. The annual addition from contributions to an individual participant’s account in this Plan cannot exceed the lesser of 100% of base salary or $44,000. Under provisions of the Plan, employees are eligible to participate on the date of hire and become fully vested in the Company’s contributions following seven years of service. In August 1995 the Company received a favorable determination from the Internal Revenue Service to include an Employee Stock Ownership feature as part of the Plan. This feature allows employees to direct a portion of their vested account balance toward the purchase of Company stock. Company contributions to the Plan amounted to $2,335,000, $2,306,000 and $2,101,000 for the years ended September 30, 2006, 2005 and 2004, respectively.
25
NOTES TO CONSOLIDATED FINANCIAL STATEMENTS(CONTINUED)
Prior to October 1, 2005, employee compensation expense under stock option plans was reported only if options were granted below market price at grant date in accordance with the intrinsic value method of Accounting Principles Board (APB) Opinion No. 25, “Accounting for Stock Issued to Employees,” and related interpretations. Because the exercise price of the Company’s employee stock options always equaled the market price of the underlying stock on the date of grant, no compensation expense was recognized on options granted. As stated in Note A, the Company adopted the provisions of SFAS 123R on October 1, 2005. SFAS 123R eliminates the alternative of applying the intrinsic value measurement provisions of APB Opinion No. 25 to stock compensation awards issued to employees. SFAS 123R now requires companies to measure the cost of employee services received in exchange for an award of equity instruments based on the estimated fair value of the award on the measurement date, which, for the Company, is the date of the grant. That estimated cost is recognized over the period during which an employee is required to provide services in exchange for the award, known as the requisite service period (usually the vesting period).
The Company adopted SFAS 123R using the modified prospective application method. Under this method SFAS 123R is applied to new awards and to awards modified, repurchased or cancelled after October 1, 2005. Additionally, compensation cost for the portion of awards for which the requisite service has not been rendered (such as unvested options) that were outstanding as of October 1, 2005 is being recognized as the remaining requisite services are rendered. The compensation cost relating to unvested awards at October 1, 2005 was based on the grant-date estimated fair value of those awards as calculated under the pro forma disclosure provisions of SFAS 123.
The Company has three equity-based compensation plans (Plans) which provide for a combination of stock options and stock grants. Option awards are granted with an exercise price equal to the market price of the Company’s stock at the date of grant; those option awards generally vest based on 7 years of continuous service and have 10-year contractual terms. The Company’s policy is to issue new shares upon option exercises. Stockholders authorized 2,718,660 shares, 4,480,101 shares and 4,099,480 shares of common stock, as adjusted for stock splits and stock dividends, to be reserved pursuant to the 1987 Stock Option and Stock Appreciation Rights Plan (the 1987 Plan), the 1994 Stock Option and Stock Appreciation Rights Plan (the 1994 Plan) and the 2001 Long-Term Incentive Plan (the 2001 Plan), respectively. The three Plans are substantially similar. Of the 11,298,241 total shares authorized by stockholders under the three Plans, 3,773,780 shares remain available for issuance. Each of the Plans has been approved by the Company’s stockholders.
The fair value of options granted under the Company’s stock option Plans is estimated on the date of grant using the Black-Scholes option-pricing model. This model requires input of highly subjective assumptions, changes to which can materially affect the fair value estimate. Additionally, there may be other factors that would otherwise have a significant effect on the value of employee stock options granted but are not considered by the model. Expected volatility is based on the historical volatility of the Company’s stock. The risk-free interest rate is based on the U.S. Treasury yield curve that is in effect at the time of grant with a remaining term equal to the options’ expected life. The expected term represents the period of time that options granted are expected to be outstanding. The following weighted-average assumptions were used to estimate the fair value of options granted during the periods indicated:
| | | | | | |
| Year ended September 30, | | 2006 | | | 2004 | |
Annual dividend yield | | 4.02 | % | | 3.42 | % |
Expected volatility | | 23 | % | | 27 | % |
Risk-free interest rate | | 4.62 | % | | 3.14 | % |
Expected life | | 5 years | | | 5 years | |
No options were granted in 2005; as a result no assumptions for 2005 are presented in the preceding table.
As a result of applying the provisions of SFAS 123R during the year ended September 30, 2006, the Company recognized $1,119,000 of compensation cost for stock options, net of forfeitures.
26
A summary of option activity under the Plans as of September 30, 2006, and changes during the year then ended is as follows:
| | | | | | | | | | |
| Options | | Shares | | Weighted Average Exercise Price | | Weighted Average Remaining Contractual Term | | Aggregate Intrinsic Value (In thousands) |
Outstanding at September 30, 2005 | | 2,566,968 | | $ | 16.95 | | | | | |
Granted | | 350,875 | | | 22.90 | | | | | |
Exercised | | -319,732 | | | 13.26 | | | | | |
Forfeited | | -210,734 | | | 18.98 | | | | | |
| | |
| | | | | | | | |
Outstanding at September 30, 2006 | | 2,387,377 | | $ | 18.14 | | 6.0 years | | $ | 10,259 |
| | |
|
Exercisable at September 30, 2006 | | 644,904 | | $ | 14.32 | | 1.0 year | | $ | 5,236 |
| | |
|
The weighted average grant date fair value of options granted during the years 2006 and 2004 was $4.27 and $4.15, respectively. Note that no options were granted in 2005; as a result there was no related grant date fair value. The total intrinsic value of options exercised during the years ended September 30, 2006, 2005 and 2004 was $3,276,000, $3,178,000 and $2,758,000, respectively. Likewise, the total grant date fair value of options exercised during the years ended September 30, 2006, 2005 and 2004 was $775,000, $711,000 and $548,000, respectively.
A summary of the status of the Company’s nonvested shares as of September 30, 2006, and changes during the year then ended is as follows:
| | | | | |
| Nonvested Shares | | Shares | | Weighted
Average Grant Date Fair Value |
Outstanding at September 30, 2005 | | 1,910,104 | | $ | 3.30 |
Granted | | 350,875 | | | 4.27 |
Vested | | -324,387 | | | 1.18 |
Forfeited | | -194,119 | | | 3.84 |
| | |
| | | |
Outstanding at September 30, 2006 | | 1,742,473 | | $ | 3.83 |
| | |
| | | |
As of September 30, 2006, unrecognized compensation cost for stock options, net of forfeitures, totaled $4,153,000, which is expected to be recognized over a weighted average remaining period of 2.72 years.
Cash received from option exercises for the years ended September 30, 2006, 2005 and 2004 was $4,141,000, $4,006,000 and $4,265,000, respectively. The actual tax benefit realized for the tax deductions from option exercises totaled $891,000, $908,000 and $742,000, respectively, for the years ended September 30, 2006, 2005 and 2004.
The Company also grants shares of restricted stock pursuant to its equity compensation plans. These shares of restricted stock vest over a period of five to seven years. The Company has issued a total of 92,000 shares of restricted stock, with a fair market value at the date of grant of $2.3 million. As of September 30, 2006, 51,343 shares remained restricted. The Company accounts for restricted stock grants by recording the fair value of the grant to compensation expense over the vesting period. Compensation expense related to restricted stock was $273,000, $277,000 and $183,000 for the years ended September 30, 2006, 2005 and 2004, respectively.
27
NOTES TO CONSOLIDATED FINANCIAL STATEMENTS(CONTINUED)
As stated above, prior to the adoption of SFAS 123R, the Company had previously adopted the disclosure requirements of SFAS 123, however, it continued to measure stock-based employee compensation under the provisions of APB Opinion No. 25 and related interpretations. As a result, the following table illustrates the effect on net income and earnings per share if the Company had applied the fair value recognition provisions of SFAS 123 in the years indicated:
| | | | | | | | |
| Year ended September 30, | | 2005 | | | 2004 | |
| | | (In thousands, except per
share data) | |
Net income, as reported | | $ | 145,889 | | | $ | 131,868 | |
Deduct: Total stock-based employee compensation expense determined under fair value based method for all awards, net of related tax effects | | | (1,717 | ) | | | (1,824 | ) |
| | |
|
|
|
Pro forma net income | | $ | 144,172 | | | $ | 130,044 | |
| | |
|
|
|
Earnings per share: | | | | | | | | |
Basic—as reported | | $ | 1.68 | | | $ | 1.53 | |
Basic—pro forma | | | 1.66 | | | | 1.51 | |
Diluted—as reported | | | 1.67 | | | | 1.51 | |
Diluted—pro forma | | | 1.65 | | | | 1.49 | |
NOTE M | STOCKHOLDERS’ EQUITY |
In the second quarter of fiscal 2005 and 2004, the Company declared an eleven-for-ten stock split in the form of a 10% stock dividend in addition to the regular quarterly cash dividends on its shares of common stock.
Washington Federal Savings is subject to various regulatory capital requirements administered by the Office of Thrift Supervision (OTS). Failure to meet minimum capital requirements can initiate certain mandatory and possibly additional discretionary action by regulators that, if undertaken, could have a direct material effect on the Company’s financial statements. Under capital adequacy guidelines and the regulatory framework for prompt corrective action, Washington Federal Savings must meet specific capital guidelines that involve quantitative measures of Washington Federal Savings’ assets, liabilities and certain off-balance sheet items as calculated under regulatory accounting practices. Washington Federal Savings’ capital amounts and classification are also subject to qualitative judgments by the regulators about capital components, risk-weightings and other factors.
As of September 30, 2006 and 2005, the OTS categorized Washington Federal Savings as well capitalized under the regulatory framework for prompt corrective action. To be categorized as well capitalized, Washington Federal Savings must maintain minimum total risk-based, Tier 1 risk-based and Tier 1 leverage ratios as set forth in the following table. There are no conditions or events since that notification that Management believes have changed Washington Federal Savings’ categorization.
| | | | | | | | | | | | | | | | | | |
| | | Actual | | | Capital Adequacy
Guidelines | | | Well Capitalized Under Prompt Corrective Action Provisions | |
| | | Capital | | Ratio | | | Capital | | Ratio | | | Capital | | Ratio | |
| September 30, 2006 | | (Dollars in thousands) | |
Total capital to risk-weighted assets | | $ | 1,229,055 | | 24.81 | % | | $ | 396,283 | | 8.00 | % | | $ | 495,354 | | 10.00 | % |
Tier I capital to risk-weighted assets | | | 1,208,363 | | 24.39 | % | | | NA | | NA | | | | 297,212 | | 6.00 | % |
Core capital to adjusted tangible assets | | | 1,208,363 | | 13.40 | % | | | NA | | NA | | | | 450,946 | | 5.00 | % |
Core capital to total assets | | | 1,208,363 | | 13.40 | % | | | 270,568 | | 3.00 | % | | | NA | | NA | |
Tangible capital to tangible assets | | | 1,208,363 | | 13.40 | % | | | 135,284 | | 1.50 | % | | | NA | | NA | |
September 30, 2005 | | | | | | | | | | | | | | | | | | |
Total capital to risk-weighted assets | | $ | 1,140,877 | | 26.15 | % | | $ | 348,992 | | 8.00 | % | | $ | 436,241 | | 10.00 | % |
Tier I capital to risk-weighted assets | | | 1,123,485 | | 25.75 | % | | | NA | | NA | | | | 261,744 | | 6.00 | % |
Core capital to adjusted tangible assets | | | 1,123,485 | | 13.75 | % | | | NA | | NA | | | | 408,673 | | 5.00 | % |
Core capital to total assets | | | 1,123,485 | | 13.75 | % | | | 245,204 | | 3.00 | % | | | NA | | NA | |
Tangible capital to tangible assets | | | 1,123,485 | | 13.75 | % | | | 122,602 | | 1.50 | % | | | NA | | NA | |
28
At periodic intervals, the OTS and the Federal Deposit Insurance Corporation (FDIC) routinely examine the Company’s financial statements as part of their oversight of the savings and loan industry. Based on their examinations, these regulators can direct that the Company’s financial statements be adjusted in accordance with their findings. The extent to which forthcoming regulatory examinations may result in adjustments to the financial statements cannot be determined; however, no adjustments were proposed as a result of the most recent OTS examination which concluded in October 2006.
The Company has an ongoing stock repurchase program. The Company did not repurchase any shares during 2006 or 2005. As of September 30, 2006, Management had authorization from the Board of Directors to repurchase up to 3.3 million additional shares. Information used to calculate earnings per share follows:
| | | | | | | | | | |
| September 30, | | 2006 | | 2005 | | 2004 | |
| | | (In thousands, except per share data) | |
Net income | | $ | 143,102 | | $ | 145,889 | | $ | 131,868 | |
Weighted average shares | | | | | | | | | | |
Basic weighted average number of common shares outstanding | | | 87,149,033 | | | 86,711,608 | | | 86,302,945 | |
Dilutive effect of outstanding common stock equivalents | | | 322,441 | | | 767,100 | | | 827,842 | |
| | |
|
|
|
Diluted weighted average number of common shares outstanding | | | 87,471,474 | | | 87,478,708 | | | 87,130,787 | |
| | |
|
|
|
Net income per share | | | | | | | | | | |
Basic | | $ | 1.64 | | $ | 1.68 | | $ | 1.53 | |
Diluted | | | 1.64 | | | 1.67 | | | 1.51 | |
NOTE N | FAIR VALUES OF FINANCIAL INSTRUMENTS |
SFAS No. 107, “Disclosures about Fair Value of Financial Instruments,” requires disclosure of fair value information about financial instruments, whether or not recognized on the statement of financial condition, for which it is practicable to estimate those values. SFAS No. 107 excludes certain financial instruments and all non-financial instruments from its disclosure requirements. Accordingly, the aggregate fair value estimates presented do not reflect the underlying fair value of the Company. Although Management is not aware of any factors that would materially affect the estimated fair value amounts presented, such amounts have not been comprehensively revalued for purposes of these financial statements since that date, and therefore, estimates of fair value subsequent to that date may differ significantly from the amounts presented below.
| | | | | | | | | | | | |
| September 30, | | 2006 | | 2005 |
| | | (In thousands) |
| | | Carrying
Amount | | Estimated
Fair Value | | Carrying
Amount | | Estimated
Fair Value |
Financial assets | | | | | | | | | | | | |
Cash and cash equivalents | | $ | 45,722 | | $ | 45,722 | | $ | 637,791 | | $ | 637,791 |
Available-for-sale securities | | | 1,451,038 | | | 1,451,038 | | | 1,077,856 | | | 1,077,856 |
Held-to-maturity securities | | | 184,928 | | | 181,911 | | | 212,479 | | | 211,596 |
Loans receivable | | | 7,078,443 | | | 7,109,010 | | | 6,008,932 | | | 6,086,613 |
FHLB stock | | | 129,453 | | | 129,453 | | | 129,453 | | | 129,453 |
| | | | |
Financial liabilities | | | | | | | | | | | | |
Customer accounts | | | 5,311,726 | | | 5,325,877 | | | 5,031,505 | | | 5,037,419 |
FHLB advances and other borrowings | | | 2,370,000 | | | 2,331,644 | | | 1,885,000 | | | 1,871,474 |
29
NOTES TO CONSOLIDATED FINANCIAL STATEMENTS(CONTINUED)
The following methods and assumptions were used to estimate the fair value of financial instruments:
Cash and cash equivalents – The carrying amount of these items is a reasonable estimate of their fair value.
Investment securities –The fair value is based on quoted market prices or dealer estimates.
Loans receivable – For certain homogeneous categories of loans, such as fixed- and variable-rate residential mortgages, fair value is estimated using quoted market prices for securities backed by similar loans, adjusted for differences in loan characteristics. The fair value of other loan types is estimated by discounting the future cash flows and estimated prepayments using the current rates at which similar loans would be made to borrowers with similar credit ratings and for the same remaining term. Some loan types were valued at carrying value because of their floating rate or expected maturity characteristics. Net deferred loan fees is not included in the fair value calculation but is included in the carrying amount.
Available-for-sale securities and held-to-maturity securities – Estimated fair value for investment securities is based on quoted market prices.
FHLB stock – The fair value is based upon the redemption value of the stock which equates to its carrying value.
Customer accounts – The fair value of demand deposits, savings accounts, and money market accounts is the amount payable on demand at the reporting date. The fair value of fixed-maturity certificates of deposit is estimated by discounting the estimated future cash flows using the rates currently offered for deposits with similar remaining maturities.
FHLB advances and other borrowings – The fair value of FHLB advances and other borrowings is estimated by discounting the estimated future cash flows using rates currently available to the Company for debt with similar remaining maturities.
NOTE O | FINANCIAL INFORMATION – WASHINGTON FEDERAL, INC. |
The following Washington Federal, Inc. (parent company only) financial information should be read in conjunction with the other notes to the Consolidated Financial Statements.
| | | | | | | | |
| Statements of Financial Condition | | | | | | | | |
| | |
| September 30, | | 2006 | | | 2005 | |
| | | (In thousands) | |
Assets | | | | | | | | |
Cash | | $ | 2,410 | | | $ | 4,509 | |
Investment in subsidiary | | | 1,262,210 | | | | 1,185,099 | |
Dividend receivable | | | 16,000 | | | | 15,000 | |
| | |
|
|
|
Total assets | | $ | 1,280,620 | | | $ | 1,204,608 | |
| | |
|
|
|
Liabilities | | | | | | | | |
Borrowed money | | $ | — | | | $ | — | |
Dividend payable and other liabilities | | | 17,900 | | | | 17,300 | |
| | |
|
|
|
Total liabilities | | | 17,900 | | | | 17,300 | |
| | |
|
|
|
Stockholders’ equity | | | | | | | | |
Common stock, $1.00 par value, 300,000,000 shares authorized,104,467,245 and 104,140,966 shares issued;87,338,824 and 86,933,294 shares outstanding | | | 104,467 | | | | 104,141 | |
Paid-in capital | | | 1,246,025 | | | | 1,240,310 | |
Accumulated other comprehensive income (loss), net of tax | | | (5,975 | ) | | | (704 | ) |
Treasury stock, at cost;17,128,421 and 17,207,672 shares | | | (204,930 | ) | | | (205,874 | ) |
Retained earnings | | | 123,133 | | | | 49,435 | |
| | |
|
|
|
Total stockholders’ equity | | | 1,262,720 | | | | 1,187,308 | |
| | |
|
|
|
Total liabilities and stockholders’ equity | | $ | 1,280,620 | | | $ | 1,204,608 | |
| | |
|
|
|
30
| | | | | | | | | | |
Statements of Operations | | | | | | | | | | |
| | | |
| Year ended September 30, | | 2006 | | 2005 | | 2004 | |
| | | (In thousands) | |
Income | | | | | | | | | | |
Dividends from subsidiary | | $ | 63,000 | | $ | 64,000 | | $ | 58,000 | |
| | |
|
|
|
Expense | | | | | | | | | | |
Miscellaneous | | | 348 | | | 426 | | | 447 | |
| | |
|
|
|
Net income before equity in undistributed net income of subsidiary | | | 62,652 | | | 63,574 | | | 57,553 | |
Equity in undistributed net income of subsidiary | | | 80,327 | | | 82,164 | | | 74,158 | |
| | |
|
|
|
Income before income taxes | | | 142,979 | | | 145,738 | | | 131,711 | |
Income tax benefit | | | 123 | | | 151 | | | 157 | |
| | |
|
|
|
Net income | | $ | 143,102 | | $ | 145,889 | | $ | 131,868 | |
| | |
|
|
|
Statements of Cash Flows
| | | | | | | | | | | | |
| Year ended September 30, | | 2006 | | | 2005 | | | 2004 | |
| | | (In thousands) | |
Cash Flows From Operating Activities | | | | | | | | | | | | |
Net income | | $ | 143,102 | | | $ | 145,889 | | | $ | 131,868 | |
Adjustments to reconcile net income to net cash provided by operating activities | | | | | | | | | | | | |
Equity in undistributed net income of subsidiaries | | | (80,327 | ) | | | (82,164 | ) | | | (74,158 | ) |
Increase in dividend receivable | | | (1,000 | ) | | | (3,000 | ) | | | — | |
Increase (decrease) in other liabilities | | | (64 | ) | | | 1,076 | | | | 333 | |
| | |
|
|
|
Net cash provided by operating activities | | | 61,711 | | | | 61,801 | | | | 58,043 | |
| | | |
Cash Flows From Financing Activities | | | | | | | | | | | | |
Issuance of common stock through stock option plan | | | 5,077 | | | | 4,006 | | | | 4,265 | |
Proceeds from Employee Stock Ownership Plan | | | 1,821 | | | | 1,526 | | | | 4,695 | |
Treasury stock purchased | | | — | | | | — | | | | (1,939 | ) |
Dividends | | | (70,708 | ) | | | (67,719 | ) | | | (64,696 | ) |
| | |
|
|
|
Net cash used by financing activities | | | (63,810 | ) | | | (62,187 | ) | | | (57,675 | ) |
Increase (decrease) in cash | | | (2,099 | ) | | | (386 | ) | | | 368 | |
Cash at beginning of year | | | 4,509 | | | | 4,895 | | | | 4,527 | |
| | |
|
|
|
Cash at end of year | | $ | 2,410 | | | $ | 4,509 | | | $ | 4,895 | |
| | |
|
|
|
31
NOTES TO CONSOLIDATED FINANCIAL STATEMENTS(CONTINUED)
NOTE P | SELECTED QUARTERLY FINANCIAL DATA (UNAUDITED) |
The following is a summary of the unaudited interim results of operations by quarter:
| | | | | | | | | | | | | | | | |
| Year ended September 30, 2006 | | First Quarter | | | Second
Quarter | | | Third
Quarter | | | Fourth
Quarter | |
| | | (In thousands, except per share data) | |
| | | | |
Interest income | | $ | 124,562 | | | $ | 128,659 | | | $ | 134,882 | | | $ | 141,780 | |
Interest expense | | | 60,500 | | | | 63,183 | | | | 71,276 | | | | 78,402 | |
| | |
|
|
|
Net interest income | | | 64,062 | | | | 65,476 | | | | 63,606 | | | | 63,378 | |
Provision for (reversal of) loan losses | | | — | | | | 85 | | | | 100 | | | | 350 | |
Other operating income | | | 3,530 | | | | 3,409 | | | | 4,041 | | | | 5,272 | |
Other operating expense | | | 12,669 | | | | 13,515 | | | | 13,796 | | | | 13,599 | |
| | |
|
|
|
Income before income taxes | | | 54,923 | | | | 55,285 | | | | 53,751 | | | | 54,701 | |
Income taxes | | | 18,777 | | | | 18,945 | | | | 18,414 | | | | 19,422 | |
| | |
|
|
|
Net income | | $ | 36,146 | | | $ | 36,340 | | | $ | 35,337 | | | $ | 35,279 | |
| | |
|
|
|
Basic earnings per share | | $ | .42 | | | $ | .42 | | | $ | .41 | | | $ | .40 | |
Diluted earnings per share | | | .42 | | | | .42 | | | | .40 | | | | .40 | |
Cash dividends per share | | | 0.200 | | | | 0.200 | | | | 0.205 | | | | 0.205 | |
Return on average assets | | | 1.75 | % | | | 1.73 | % | | | 1.63 | % | | | 1.58 | % |
| | | | |
| Year ended September 30, 2005 | | First
Quarter | | | Second
Quarter | | | Third
Quarter | | | Fourth
Quarter | |
| | | (In thousands, except per share data) | |
| | | | |
Interest income | | $ | 107,543 | | | $ | 122,180 | | | $ | 114,002 | | | $ | 118,176 | |
Interest expense | | | 42,146 | | | | 45,563 | | | | 51,248 | | | | 56,303 | |
| | |
|
|
|
Net interest income | | | 65,397 | | | | 76,617 | | | | 62,754 | | | | 61,873 | |
Provision for (reversal of) loan losses | | | — | | | | — | | | | (134 | ) | | | — | |
Other operating income | | | 2,796 | | | | 851 | | | | 3,030 | | | | 1,175 | |
Other operating expense | | | 11,978 | | | | 13,963 | | | | 12,769 | | | | 13,609 | |
| | |
|
|
|
Income before income taxes | | | 56,215 | | | | 63,505 | | | | 53,149 | | | | 49,439 | |
Income taxes | | | 19,957 | | | | 22,544 | | | | 18,868 | | | | 15,050 | |
| | |
|
|
|
Net income | | $ | 36,258 | | | $ | 40,961 | | | $ | 34,281 | | | $ | 34,389 | |
| | |
|
|
|
Basic earnings per share | | $ | .42 | | | $ | .47 | | | $ | .40 | | | $ | .40 | |
Diluted earnings per share | | | .42 | | | | .47 | | | | .39 | | | | .39 | |
Cash dividends per share | | | .19 | | | | .19 | | | | .20 | | | | .20 | |
Return on average assets | | | 1.96 | % | | | 2.16 | % | | | 1.76 | % | | | 1.71 | % |
32

MANAGEMENT’S REPORT ON INTERNAL CONTROL OVER FINANCIAL REPORTING
The management of Washington Federal, Inc. (the “Company”) is responsible for establishing and maintaining adequate internal control over financial reporting. The Company’s internal control system was designed to provide reasonable assurance to the Company’s management and Board of Directors regarding the preparation and fair presentation of published financial statements.
The Company’s management assessed the effectiveness of the Company’s internal control over financial reporting as of September 30, 2006. In making this assessment, the Company’s management used the criteria set forth by the Committee of Sponsoring Organizations of the Treadway Commission (COSO) in Internal Control-Integrated Framework. Based on its assessment, the Company’s management believes that as of September 30, 2006, the Company’s internal control over financial reporting was effective based on those criteria.
The Company’s independent auditors, Deloitte & Touche LLP, an independent registered public accounting firm, have issued an audit report on management’s assessment of the Company’s internal control over financial reporting and their report follows.
November 21, 2006

Roy M. Whitehead
Chairman, President and
Chief Executive Officer

Brent J. Beardall
Senior Vice President and
Chief Financial Officer
REPORT OF INDEPENDENT REGISTERED PUBLIC ACCOUNTING FIRM
To the Board of Directors and Stockholders of
Washington Federal, Inc.
Seattle, Washington
We have audited the accompanying consolidated statements of financial condition of Washington Federal, Inc. and subsidiaries (the “Company”) as of September 30, 2006 and 2005, and the related consolidated statements of operations, stockholders’ equity, and cash flows for each of the three years in the period ended September 30, 2006. These financial statements are the responsibility of the Company’s management. Our responsibility is to express an opinion on these financial statements based on our audits.
We conducted our audits in accordance with the standards of the Public Company Accounting Oversight Board (United States). Those standards require that we plan and perform the audit to obtain reasonable assurance about whether the financial statements are free of material misstatement. An audit includes examining, on a test basis, evidence supporting the amounts and disclosures in the financial statements. An audit also includes assessing the accounting principles used and significant estimates made by management, as well as evaluating the overall financial statement presentation. We believe that our audits provide a reasonable basis for our opinion.
In our opinion, such consolidated financial statements present fairly, in all material respects, the financial position of Washington Federal, Inc. and subsidiaries as of September 30, 2006 and 2005, and the results of their operations and their cash flows for each of the three years in the period ended September 30, 2006, in conformity with accounting principles generally accepted in the United States of America.
We have also audited, in accordance with the standards of the Public Company Accounting Oversight Board (United States), the effectiveness of the Company’s internal control over financial reporting as of September 30, 2006, based on the criteria established in Internal Control—Integrated Framework issued by the Committee of Sponsoring Organizations of the Treadway Commission and our report dated November 21, 2006, expressed an unqualified opinion on management’s assessment of the effectiveness of the Company’s internal control over financial reporting and an unqualified opinion on the effectiveness of the Company’s internal control over financial reporting.

DELOITTE & TOUCHE LLP
Seattle, Washington
November 21, 2006
33
REPORT OF INDEPENDENT REGISTERED PUBLIC ACCOUNTING FIRM
To the Board of Directors and Stockholders of
Washington Federal, Inc.
Seattle, Washington
We have audited management’s assessment, included in the accompanying Management’s Report on Internal Control over Financial Reporting, that Washington Federal, Inc. and subsidiaries (the “Company”) maintained effective internal control over financial reporting as of September 30, 2006, based on criteria established in Internal Control—Integrated Framework issued by the Committee of Sponsoring Organizations of the Treadway Commission. The Company’s management is responsible for maintaining effective internal control over financial reporting and for its assessment of the effectiveness of internal control over financial reporting. Our responsibility is to express an opinion on management’s assessment and an opinion on the effectiveness of the Company’s internal control over financial reporting based on our audit.
We conducted our audit in accordance with the standards of the Public Company Accounting Oversight Board (United States). Those standards require that we plan and perform the audit to obtain reasonable assurance about whether effective internal control over financial reporting was maintained in all material respects. Our audit included obtaining an understanding of internal control over financial reporting, evaluating management’s assessment, testing and evaluating the design and operating effectiveness of internal control, and performing such other procedures as we considered necessary in the circumstances. We believe that our audit provides a reasonable basis for our opinions.
A company’s internal control over financial reporting is a process designed by, or under the supervision of, the company’s principal executive and principal financial officers, or persons performing similar functions, and effected by the company’s board of directors, management, and other personnel to provide reasonable assurance regarding the reliability of financial reporting and the preparation of financial statements for external purposes in accordance with generally accepted accounting principles. A company’s internal control over financial reporting includes those policies and procedures that (1) pertain to the maintenance of records that, in reasonable detail, accurately and fairly reflect the transactions and dispositions of the
assets of the company; (2) provide reasonable assurance that transactions are recorded as necessary to permit preparation of financial statements in accordance with generally accepted accounting principles, and that receipts and expenditures of the company are being made only in accordance with authorizations of management and directors of the company; and (3) provide reasonable assurance regarding prevention or timely detection of unauthorized acquisition, use, or disposition of the company’s assets that could have a material effect on the financial statements.
Because of the inherent limitations of internal control over financial reporting, including the possibility of collusion or improper management override of controls, material misstatements due to error or fraud may not be prevented or detected on a timely basis. Also, projections of any evaluation of the effectiveness of the internal control over financial reporting to future periods are subject to the risk that the controls may become inadequate because of changes in conditions, or that the degree of compliance with the policies or procedures may deteriorate.
In our opinion, management’s assessment that the Company maintained effective internal control over financial reporting as of September 30, 2006, is fairly stated, in all material respects, based on the criteria established in Internal Control—Integrated Framework issued by the Committee of Sponsoring Organizations of the Treadway Commission. Also in our opinion, the Company maintained, in all material respects, effective internal control over financial reporting as of September 30, 2006, based on the criteria established in Internal Control—Integrated Framework issued by the Committee of Sponsoring Organizations of the Treadway Commission.
We have also audited, in accordance with the standards of the Public Company Accounting Oversight Board (United States), the consolidated financial statements as of and for the year ended September 30, 2006, of the Company, and our report dated November 21, 2006, expressed an unqualified opinion on those financial statements.
DELOITTE & TOUCHE LLP
Seattle, Washington
November 21, 2006
34
GENERAL CORPORATE AND STOCKHOLDERS’ INFORMATION
Headquarters | Seattle, Washington 98101 |
Independent | Deloitte & Touche LLP |
Auditors | Seattle, Washington |
Transfer Agent, Registrar and Dividend Disbursing Agent | Stockholder inquiries regarding transfer requirements, cash or stock dividends, lost certificates, consolidating records, correcting a name or changing an address should be directed to the transfer agent: |
American Stock Transfer & Trust Company
59 Maiden Lane
Plaza Level
New York, NY 10038
Telephone: 1-888-888-0315
www.amstock.com
Annual Meeting | The annual meeting of stockholders will be held on January 25, 2007, at 2 p.m. at the Westin Hotel, 1900 Fifth Avenue, Seattle, Washington |
Form 10-K | This report and all SEC filings are available through the Company’s web site: www.washingtonfederal.com |
Stock Information | Washington Federal, Inc. is traded on the NASDAQ Stock Market. The common stock symbol is WFSL. At September 30, 2006, there were approximately 2,395 stockholders of record. |
| | | | | | | | | |
| | | Stock Prices
| | |
| Quarter Ended | | High | | Low | | Dividends |
December 31, 2004 | | $ | 25.08 | | $ | 22.18 | | $ | 0.191 |
March 31, 2005 | | | 24.15 | | | 22.73 | | | 0.190 |
June 30, 2005 | | | 23.69 | | | 22.03 | | | 0.200 |
September 30, 2005 | | | 24.31 | | | 22.09 | | | 0.200 |
December 31, 2005 | | | 24.72 | | | 21.31 | | | 0.200 |
March 31, 2006 | | | 24.88 | | | 23.10 | | | 0.200 |
June 30, 2006 | | | 24.41 | | | 22.39 | | | 0.205 |
September 30, 2006 | | | 23.29 | | | 21.73 | | | 0.205 |
All prices shown have been adjusted for stock splits.
Largest Market Makers:
Keefe, Bruyette & Woods, Inc.
Goldman, Sachs & Co.
Morgan Stanley & Co., Inc.
Bear, Stearns & Co., Inc.
UBS Securities, L.L.C.
Knight Equity Markets, L.P.
Citigroup Global Markets, Inc.
Automated Trading Desk
Lehman Brothers, Inc.
B-Trade Services, L.L.C.
Merrill Lynch, Pierce, Fenner & Smith, Inc.
Banc of America Securities
National Financial Services
Deutsche Banc Alex Brown
Jefferies & Company, Inc.
35

DIRECTORS, OFFICERS AND OFFICES
| | | | | | | | | | |
CORPORATE HEADQUARTERS 425 Pike Street Seattle, WA 98101 (206) 624-7930 BOARD OF DIRECTORS ROY M. WHITEHEAD Chairman, President and Chief Executive Officer DEREK L. CHINN Former President and Chief Executive Officer, United Savings and Loan Bank JOHN F. CLEARMAN Former Chief Financial Officer, Milliman USA, Inc. H. DENNIS HALVORSON Former Chief Executive Officer, United Bank W. ALDEN HARRIS Former Executive Vice President ANNA C. JOHNSON Senior Partner Scan East West Travel THOMAS J. KELLEY Faculty member, Albers School of Business, Seattle University and retired partner, Arthur Andersen LLP THOMAS F. KENNEY Vice President Finance Haggen, Inc. GUY C. PINKERTON Former Chairman CHARLES R. RICHMOND Former Executive Vice President BARBARA L. SMITH Owner, B. Smith Consulting Group DIRECTORS EMERITI E.W. MERSEREAU, JR. RICHARD C. REED KERMIT O. HANSON | | EXECUTIVE MANAGEMENT COMMITTEE BRENT J. BEARDALL Senior Vice President and Chief Financial Officer LINDA S. BROWER Executive Vice President EDWIN C. HEDLUND Executive Vice President and Secretary JACK B. JACOBSON Executive Vice President and Chief Lending Officer ROY M. WHITEHEAD Chairman, President and Chief Executive Officer | | DEPARTMENT MANAGERS Accounting CHAD J. LEONARD Controller ROBERT C. ZIRK Internal Controls and Taxes Vice President Appraisal HEATHER J. ST. CLAIR Retail Underwriting MICHAEL R. BUSH Senior Vice President Credit Administration JAMES E. CADY Senior Vice President DALE R. SULLIVAN Senior Vice President Corporate Real Estate KEITH D. TAYLOR Senior Vice President and Treasurer Data Processing TERRY O. PERMENTER Senior Vice President Deposit Operations BEN A. WHITMARSH Senior Vice President Internal Audit BARBARA A. MURPHY Senior Vice President Legal/Special Credits PAUL I. TYLER Vice President and General Counsel Loan Operations LEANN H. BURKE Vice President Loan Servicing VIVIAN L. YORITA Vice President Marketing and Investor Relations CATHY E. COOPER Vice President Permanent Loan Production JOHN L. WUNDERLICH Vice President Wholesale Underwriting COLLEEN E. WELLS Vice President | | SUBSIDIARIES First Insurance
Agency, Inc. 1501 Riverside Drive Mount Vernon, WA 98273 1-800-562-2555 DUANE E. HENSON | | DIVISIONS SOUTH SOUND WASHINGTON 18 Office Locations Division Manager RONDA F. TOMLINSON Senior Vice President 9919 Bridgeport Way S.W. Lakewood, WA 98499 MIDSOUND WASHINGTON 16 Office Locations Division Manager E. CRAIG WILSON Senior Vice President 5809 196th S.W. Lynnwood, WA 98036 NORTHERN WASHINGTON 9 Office Locations Division Manager GREGORY A. PECK Vice President 1501 Riverside Drive Mount Vernon, WA 98273 WESTERN IDAHO 10 Office Locations Division Manager ROBERT P. LINK Senior Vice President 1001 W. Idaho St. Boise, ID 83701 EASTERN IDAHO 6 Office Locations Region Manager JEFFREY B. HARRIS Vice President 500 North Capital Idaho Falls, ID 83402 OREGON 28 Office Locations Division Manager PEGGY L. HOBIN Senior Vice President 14990 SW Bangy Rd. Lake Oswego, OR 97035 | | UTAH 10 Office Locations Division Manager MARLISE G. FISHER Senior Vice President 505 East 200 South Salt Lake City, UT 84102 PHOENIX ARIZONA 12 Office Locations Division Manager JOHN J. PIRTLE Vice President 2196 E. Camelback Road, Suite 100 Phoenix, AZ 85016 TUCSON ARIZONA 8 Office Locations Division Manager GEORGIA E. VELARDE Vice President 5151 E. Broadway Blvd., Suite 105 Tucson, AZ 85711 NEVADA 3 Office Locations Division Manager PAMELA K. CALLAHAN Vice President 9340 Sun City Blvd. #103 Las Vegas, NV 89134 TEXAS 3 Office Locations 5900 Chapel Hill Blvd. Plano, TX 75093 |
A complete listing of our branch locations can be found at www.washingtonfederal.com
36