Washington Federal, Inc. Washington Federal, Washington Federal, Inc. Inc. Cautionary statement This presentation contains forward-looking statements, which are not historical facts and pertain to future operating results. These forward-looking statements are within the meaning of the Private Securities Litigation Reform Act of 1995. These forward-looking statements include, but are not limited to, statements about our plans, objectives, expectations and intentions and other statements contained in this document that are not historical facts. When used in this presentation, the words “expects,” “anticipates,” “intends,” “plans,” “believes,” “seeks,” “estimates,” or words of similar meaning, or future or conditional verbs, such as “will,” “would,” “should,” “could,” or “may” are generally intended to identify forward-looking statements. These forward-looking statements are inherently subject to significant business, economic and competitive uncertainties and contingencies, many of which are beyond our control. In addition, these forward-looking statements are subject to assumptions with respect to future business strategies and decisions that are subject to change. Actual results may differ materially from the results discussed in these forward-looking statements for the reasons, among others, discussed under the heading “Certain Business Risks” in Washington Federal’s 2007 Annual Report on Form 10-K which include: Volatile interest rates and their impact on the mortgage banking business; Credit risk; Operational risk; Changes in the regulation of financial services companies, housing government-sponsored enterprises; Competition from banking and nonbanking companies; General business, economic and market conditions; Reputational risk; Liquidity risk; and Valuation risk. There are other factors not described in our 2007 Form 10-K, which are beyond the Company’s ability to anticipate or control that could cause results to differ. |
Washington Federal, Inc. Washington Federal, Washington Federal, Inc. Inc. WASHINGTON WASHINGTON FEDERAL FEDERAL BRANCHES BRANCHES 1 1 |
Slide #1 – Washington Federal Branches
We’ll begin with an overview of the company’s branch network. As you can see, Washington Federal operates offices in eight western states as shown. We began the past fiscal year with 123 locations and, after acquiring First Federal Bank of the Southwest, closing two offices during the year and adding one new branch located in Denton, Texas, we ended the fiscal year with a total of 135 branches.
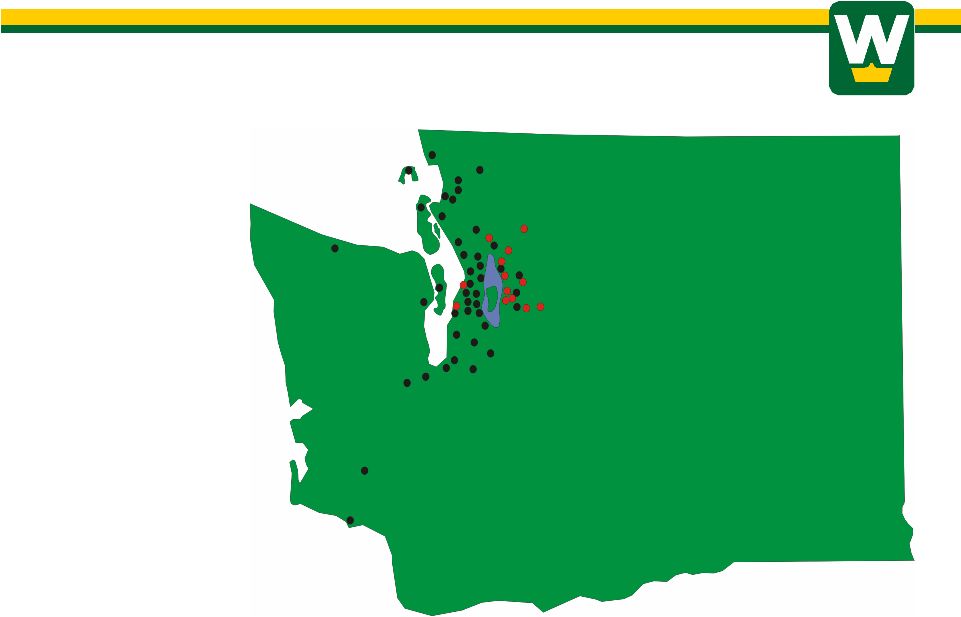
Washington Federal, Inc. Washington Federal, Washington Federal, Inc. Inc. WASHINGTON WASHINGTON STATE BRANCHES STATE BRANCHES After First Mutual transaction 2 2 |
Slide # 2 – Adding First Mutual
In July, we signed an agreement to acquire First Mutual Bancshares, headquartered in Bellevue, Washington and operating as a state charted savings bank. With closing planned for February 1, just 10 days from today, First Mutual will initially add 12 new locations and $1 billion in assets to the franchise. The purchase will significantly enhance our presence on the Eastside, one of the fastest growing and most economically solid markets in the United States, with new branches gained in important areas such as Woodinville, Monroe, Sammamish, Issaquah, Juanita, and downtown Bellevue. We will also gain from greater efficiency in other markets, such as Kirkland and Redmond, where we are planning to consolidate our branch with theirs.
The total purchase price of $190 Million amounts to 2.45 X book value and approximately 18 times earnings. These are the highest multiples that your company has ever paid for an acquisition, but we nonetheless feel that this will be a good long-term investment and perhaps a unique opportunity to solidify our place on the Eastside.
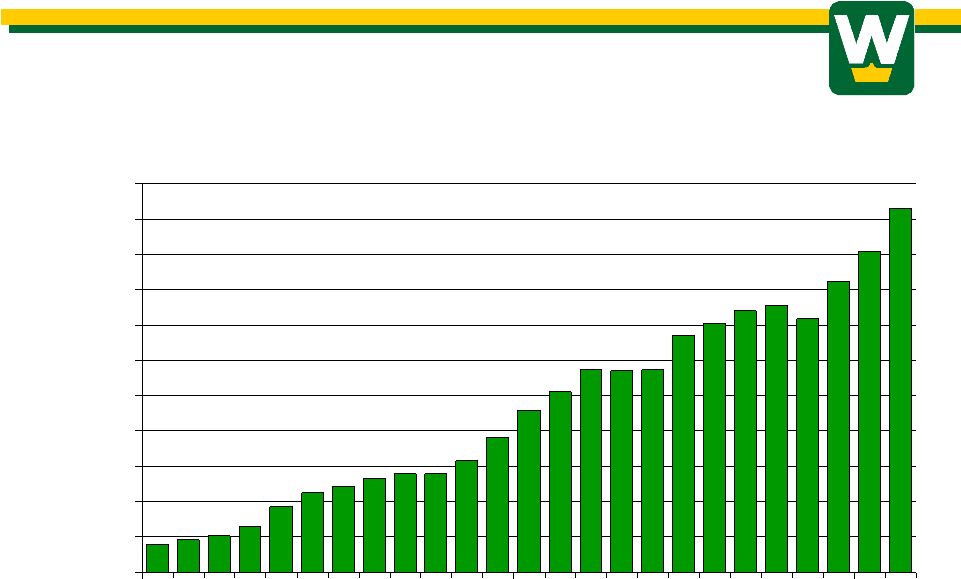
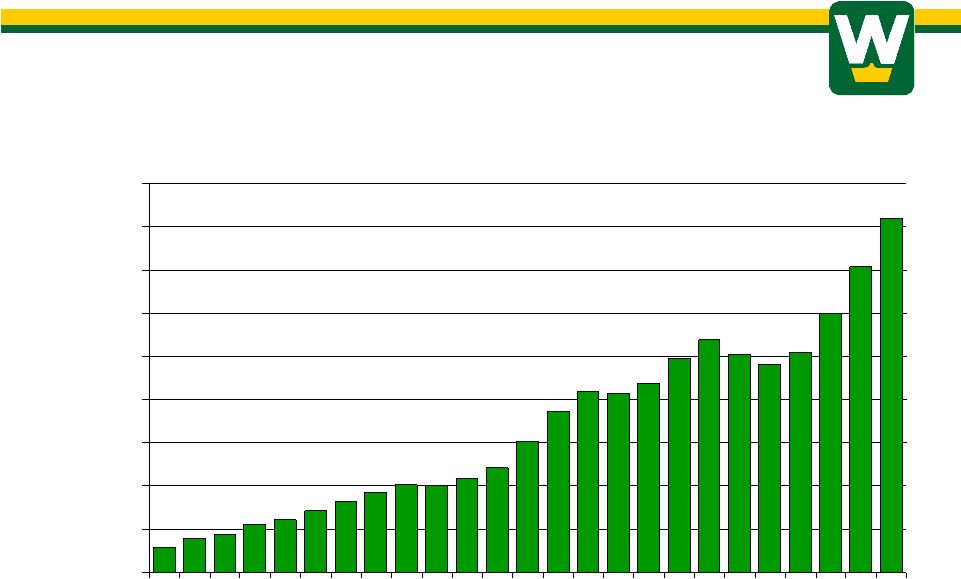
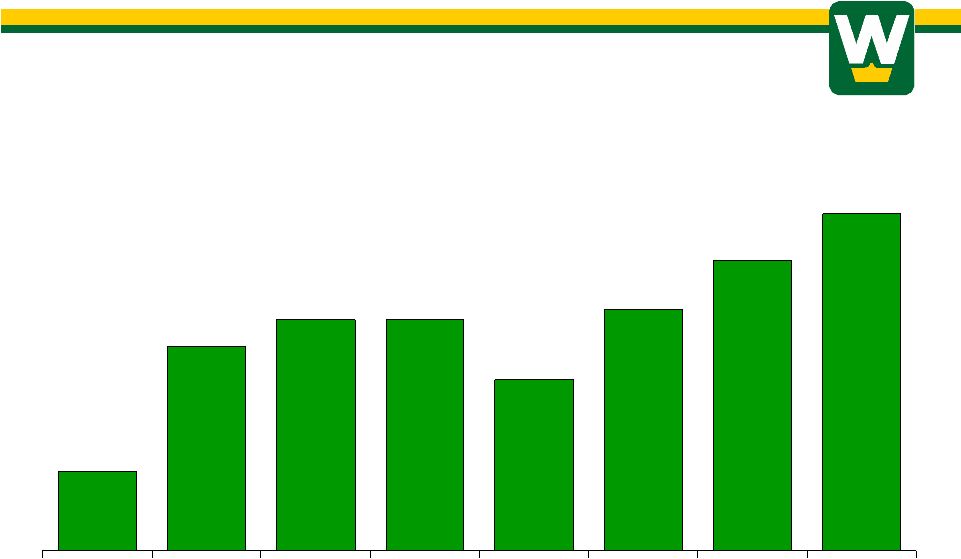
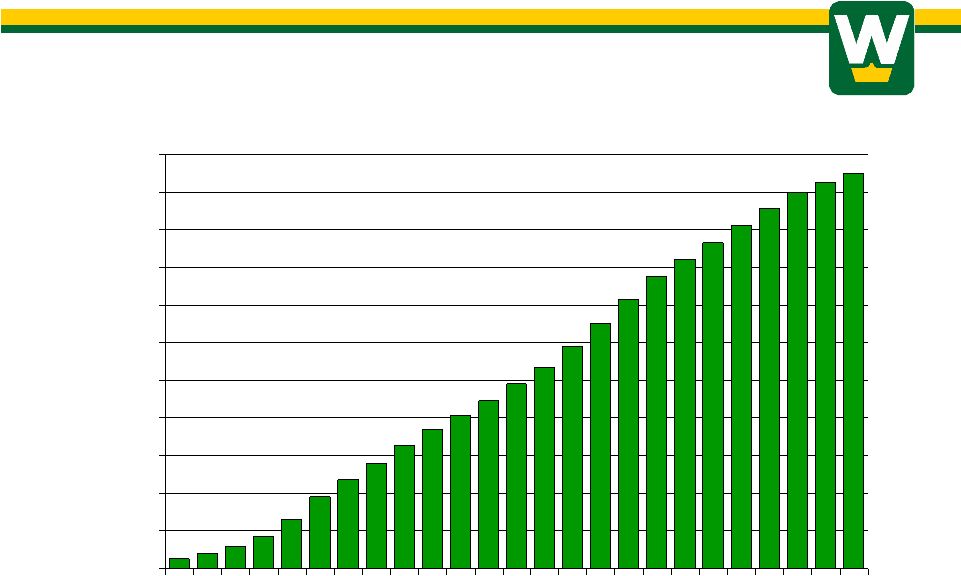
Washington Federal, Inc. Washington Federal, Washington Federal, Inc. Inc. TOTAL ASSETS TOTAL ASSETS September 30 (In Millions) 3 3 $0 $1,000 $2,000 $3,000 $4,000 $5,000 $6,000 $7,000 $8,000 $9,000 $10,000 $11,000 83 84 85 86 87 88 89 90 91 92 93 94 95 96 97 98 99 00 01 02 03 04 05 06 07 |
Slide # 3 – Total Assets
Turning to the balance sheet, this chart illustrates the Company’s steady asset growth over the years, which increased at a faster pace than usual last fiscal year. In 2007, Total Assets increased by $1.2 Billion, or 13.4% to $10.3 Billion. Approximately 50% of the growth resulted from the purchase of First Federal Bank of the Southwest, headquartered in New Mexico, which means that organic growth attributable to the legacy Washington Federal balance sheet amounted to $640 Million or almost 7%.
Asset growth is always secondary to profitability at Washington Federal; however, in general we believe that growth is a good thing, so long as profits also increase and so long as our equity to assets ratio remains around 10% or above.
When interest rates were moving up during the first half of the year, management focused on growing the balance sheet to offset the decline in spread. Since September rates have been falling and the economy has slowed, so as we always do when rates are declining, the emphasis shifted away from growth to focus on scrubbing the balance sheet to get ready for the next period of increasing rates.
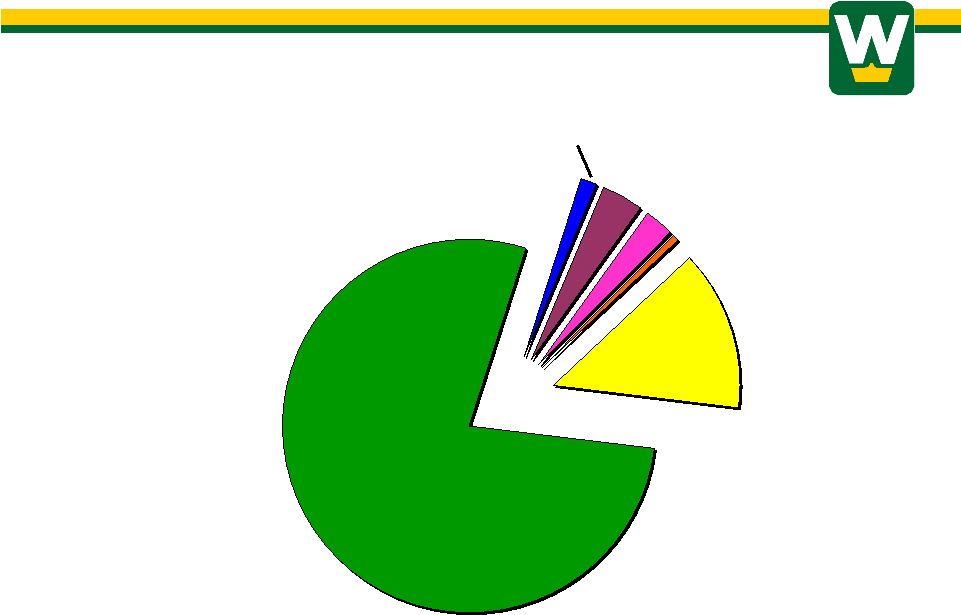
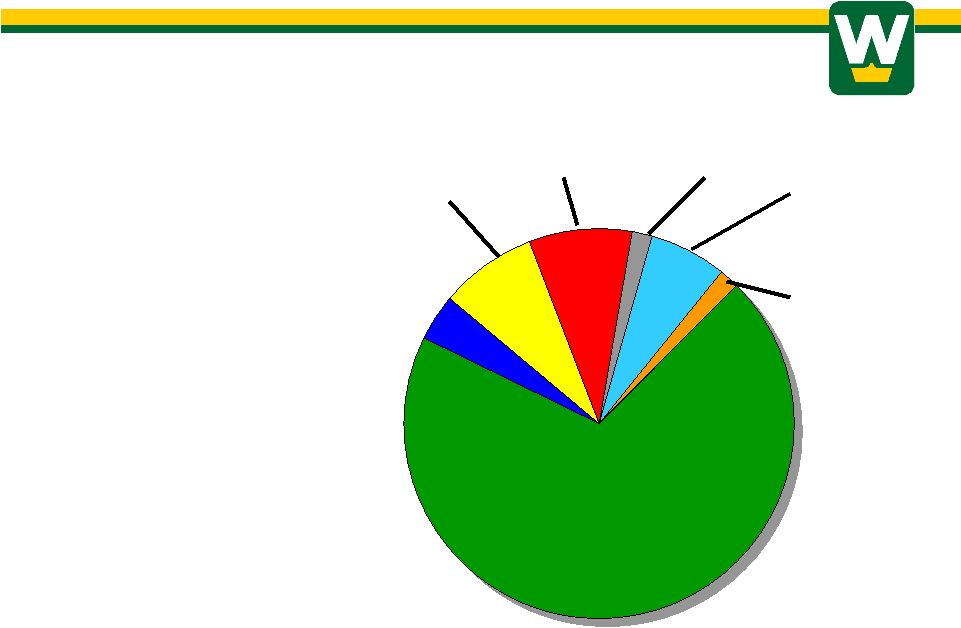
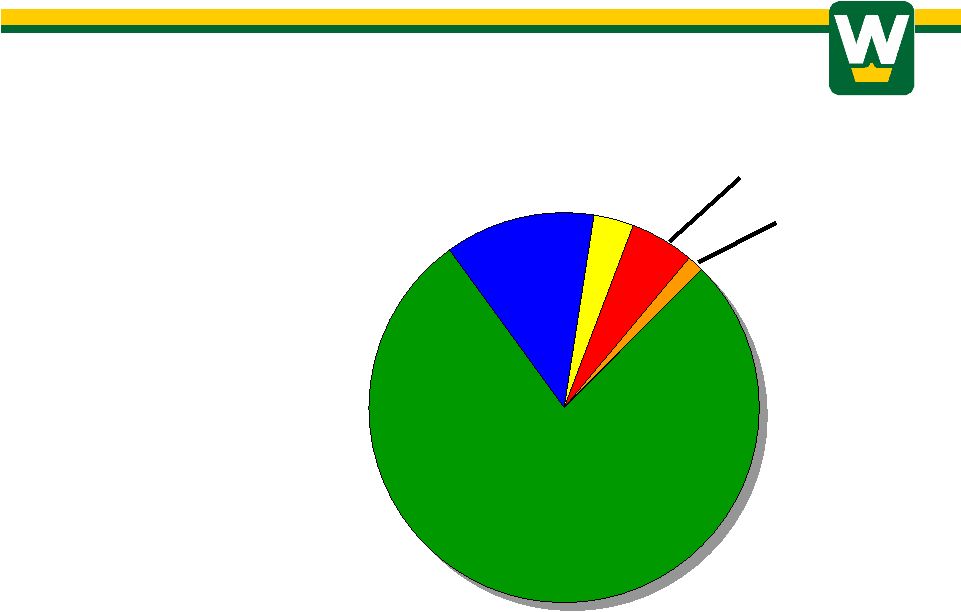
Washington Federal, Inc. Washington Federal, Washington Federal, Inc. Inc. ASSET MIX ASSET MIX September 30, 2007 (Percent of Total Assets) 4 4 Investments 3.6% Other 2.4% Residential Real Estate Loans 78.3% MBS 13.8% Cash 0.6% Commercial Loans 1.3% |
Slide # 4 – Asset Mix
Washington Federal strives to invest in relatively conservative assets. We have always been more concerned with the return of our principal than the return on our principal. Approximately 80% of assets are invested in loans, 99% of which are secured by well-margined real estate collateral.
Equally safe AAA- rated mortgage-backed securities accounted for 13.8% of total assets at year-end. These securities are issued by
U. S. Government sponsored enterprises and are therefore backed not only by secured 1st lien mortgage loans, but also by the capital of the issuers and the implied guaranty of the federal government.
One sliver of the asset portfolio that generally didn’t get much attention in past meetings is the non-MBS portfolio, which accounts for 3.6% of total assets. This portfolio is centered in what historically have been very high quality investments, such as US Government Agency securities and municipal bonds.
It’s been interesting (and not in a good way) to observe the volatility that has been seen in the trading of some of these normally sleepy securities during the recent disruptions in the financial markets. For example, we own $90 million in preferred stock issued by the government-sponsored enterprises of Freddie Mac and Fannie Mae. During the past nine months, prices for these thinly traded securities have varied from a premium to book value, to prices that in some cases were only 80% of book. While we believe these securities to be money-good assets in the long-term, in the interest of transparency, investors should know that if the recent price volatility settles into a lower market value that can’t be characterized as temporary, then a write down in carrying value will be required.
This grouping also holds a $132 million investment in Federal Home Loan Bank stock. Between 1999 and 2004, annual dividends received on that investment averaged $7.8 million, but went to zero for most of the past three years. At last, though, there is the glimmer of better news. Last year we began receiving a small but increasing dividend and because their financial condition is improving, there appears to be reason for optimism that the FHLB Seattle might soon be in a position to at least partially return the roughly $50 million that we hold in excess capital stock. We could then reinvest the money at market rates and regain some of the earnings power lost during the three-year dormant period for those funds.
One should also bear in mind that the balance sheet also includes assets whose market value is much greater than what we reflect on the books. A good example would be the Company’s real estate holdings hidden in the Other Assets grouping, which in the current market are worth significantly more than their carrying value.
Washington Federal, Inc. Washington Federal, Washington Federal, Inc. Inc. $0 $1,000 $2,000 $3,000 $4,000 $5,000 $6,000 $7,000 $8,000 $9,000 82 84 85 86 87 88 89 90 91 92 93 94 95 96 97 98 99 00 01 02 03 04 05 06 07 TOTAL NET LOANS TOTAL NET LOANS Years Ended September 30 (In Millions) 5 5 |
Slide #5 – Total Loans
Due to the declining real estate market, loan production slowed in Fiscal 2007, and was down from $2.4 billion in ‘06 to $2.3 billion last year. Nonetheless, the addition of the New Mexico loans, coupled with slower prepayments on existing credits, enabled the portfolio in total to grow by over $1 billion for the second year in a row. Growth in the loan portfolio was important to maintaining earnings as spreads declined during the year; however, it also served to increase the amount of interest rate and credit risks on the books during the year.
Of course we have to take some risk to generate profit and in the past these are risks that we have managed well.
Washington Federal, Inc. Washington Federal, Washington Federal, Inc. Inc. LOANS BY TYPE LOANS BY TYPE September 30, 2007 (In Millions) Land A&D $755 or 8.7% WTD RATE 8.95% Spec. Construction $708 or 8.1% WTD RATE 9.28% Single-Family Residential $6,091 or 69.5% WTD RATE 6.15% Multi-Family $559 or 6.5% WTD RATE 6.54% 6 6 Amounts above are gross amounts. Loans in process has not been deducted from balances. Consumer Land $159 or 1.8% WTD RATE 7.25% Custom Construction $329 or 3.8% WTD RATE 6.42% Commercial $136 or 1.6% WTD RATE 8.67% |
Slide # 6 – Washington Federal Loans (by type)
By type, 73% of the company’s loans are single-family mortgage loans – including custom construction loans that convert automatically to a mortgage amortization when the house is complete. Until recently anyway, these have been the safest loans that we, or any other financial institution, could place on the books. During the past fiscal year, mortgage loans increased by $630 million, which after adjusting for acquired New Mexico loans, amounted to 7.5% growth over last year. Washington Federal never got into the business of originating subprime loans or any of the exotic mortgages that are the source of so many problems elsewhere. Our mortgage loans are plain vanilla, primarily 30 year fixed rate loans.
Loans to homebuilders for speculative construction were flat during the year. Adjusting again for the acquired New Mexico loans, spec construction loans actually declined by $54 million or 7.5%. Commercial loans for land acquisition and development, which we consider to be our riskiest assets, increased due to higher land prices in the Seattle area, where the portfolio is concentrated, a slowdown in lot takedowns by builders, and the addition of such loans in New Mexico.
Because of the higher risk inherent to spec construction and land loans, we limit them to 20% of the portfolio and at year-end they totaled 16.8%
Multi-Family Lending continues to be a very important part of the business model. We posted a 6% increase in that portfolio to $559 Million in 2007 and once again this year I can say that at fiscal year-end we had zero delinquencies, we’ve never had a charge-off and the quality continues to be pristine.
Other loans include consumer real estate loans such as long-term fully amortizing lot loans in the amount of $159 million, home equity loans and commercial loans housed in New Mexico.
Washington Federal, Inc. Washington Federal, Washington Federal, Inc. Inc. LOAN QUALITY LOAN QUALITY September 30, 2007 Delinquencies (% Past Due) Non Performing Assets / Total Assets Net Charge-Offs / Loans Peer Group AVERAGE * Washington Federal 1.29% 1.26 .36 .58% .15 .01 * 15 Largest Public Thrifts - Source: FDIC 7 7 |
Slide # 7– Loan Quality
The housing market slowed last year and along with it, the quality of the loan portfolio weakened a bit; however, relative to historical and industry averages quality indicators were still quite good.
This slide shows three measures of loan quality relative to a peer group of the fifteen largest thrifts in the US and your Company’s ratios were superior at the end of the year in all three categories.
Delinquencies of 58 basis points were less than one-half the industry average.
Non-performing assets of 15 basis points at year-end were just slightly more than 10% of the industry average – and included only seven houses on which we had foreclosed.
Lastly, net charge-offs, which are the actual losses taken after collateral is liquidated, was also substantially lower than the industry as a whole.
Washington Federal, Inc. Washington Federal, Washington Federal, Inc. Inc. 0.00% 0.20% 0.40% 0.60% 0.80% 1.00% 1.20% 1.40% Historical Non-Performing Historical Non-Performing Assets to Total Assets Ratio Assets to Total Assets Ratio Quarterly – last 20 years 8 8 20 year average of 49 bps 10 year average of 35 bps 0.15% |
Slide #8 – Non-Performing Trend
Perhaps a better comparison than the industry averages would be the Company’s own performance over time. This slide shows the 20 year trend in non-performing assets, which are defined as loans on which the borrower can no longer make payments plus real estate acquired in foreclosure.
At fiscal year end, total non-performing assets remained well below both the 20 year average of 49 basis points and the 10 year average of 35 basis points, although as we reported recently, the December 31st total nonperforming assets had risen to roughly equal the 10 year average.
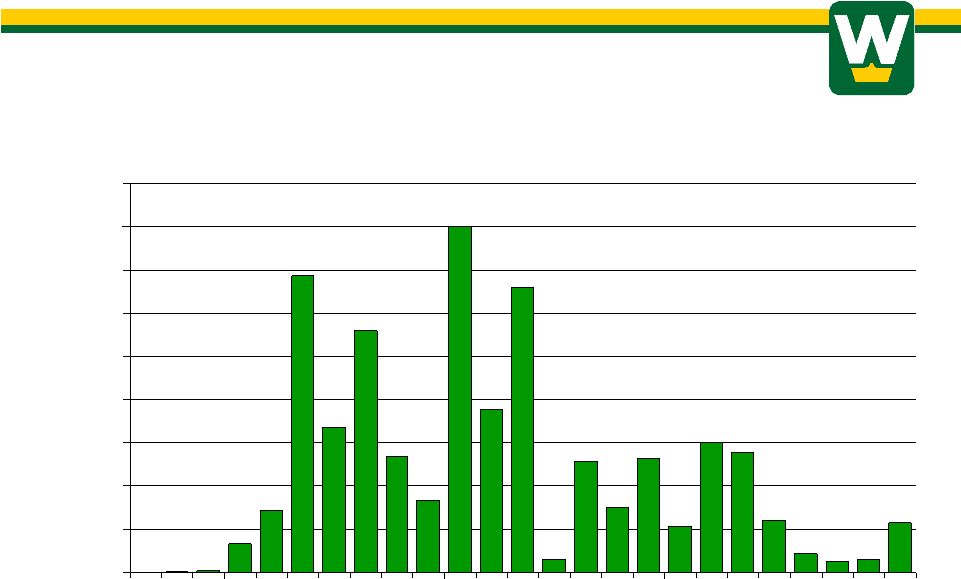
Washington Federal, Inc. Washington Federal, Washington Federal, Inc. Inc. $0 $1,000 $2,000 $3,000 $4,000 $5,000 $6,000 $7,000 $8,000 $9,000 83 84 85 86 87 88 89 90 91 92 93 94 95 96 97 98 99 00 01 02 03 04 05 06 07 NET CHARGE OFFs Years Ended September 30 (In thousands) 9 9 |
Slide #9 – Net Charge-offs
Actual loan losses incurred during the year amounted to $1,156,000. Again, this number is not only quite low relative to the industry, but also by our own historical standards.
Bear in mind in viewing this chart that in prior years when charge-offs were much higher, the Company also had a much smaller loan portfolio. For example, if you go back to the highest charge-off year of 1993, which by the way was also one of our most profitable years ever, loan losses totaled $8 million on a portfolio that was approximately one-quarter the size of the current portfolio. That means that on a proportionate basis, charge-offs would have had to total $29 million in 2007 to equal the loss level of 1993.
The absence of problem loans has been a real highlight of the company’s performance for the past several years, but a word of caution: As the CEO of one of the country’s largest financial institutions stated recently: “this is the toughest housing correction in our lifetimes”, while at the same time, many leading economists think that we are already in a recession. So if they are correct, a prudent expectation would be for loan quality measures, including charge-offs, to deteriorate further before the market finally regains some strength.
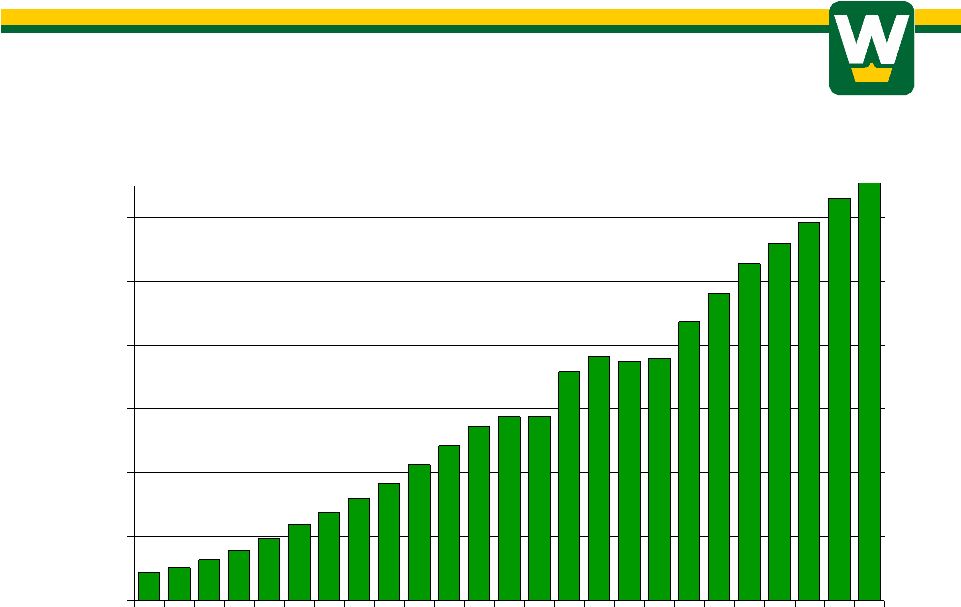
Washington Federal, Inc. Washington Federal, Washington Federal, Inc. Inc. $0 $1,000 $2,000 $3,000 $4,000 $5,000 $6,000 $7,000 83 84 85 86 87 88 89 90 91 92 93 94 95 96 97 98 99 00 01 02 03 04 05 06 07 TOTAL DEPOSITS TOTAL DEPOSITS Years Ended September 30 (In Millions) 10 10 |
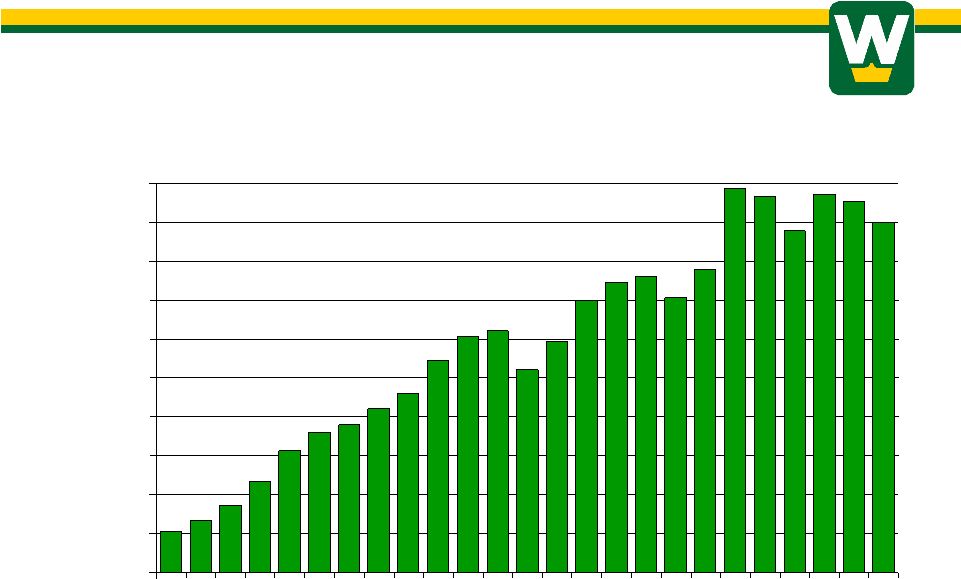
Slide #10– Deposit Trend by Year
Moving to the funding side of the balance sheet, deposit growth last year amounted to $685 million, or 13% over the prior year-end. Remove the acquired New Mexico deposits from the total and deposit growth was still a healthy 5.8%, consistent with the prior year.
Many observers express concern about new competitive threats to our traditional savings customer base, yet we continue to demonstrate the ability to grow deposits year in and year out.
Washington Federal, Inc. Washington Federal, Washington Federal, Inc. Inc. # of 9/30/07 % Branches Deposits Washington 42 2,555 $ 42.5% Oregon 27 1,132 18.9% Arizona 20 809 13.5% Idaho 16 562 9.4% New Mexico 11 414 6.9% Utah 10 322 5.4% Nevada 3 118 2.0% Texas 6 85 1.4% 135 5,997 $ 100.0% DEPOSITS DEPOSITS BY STATE BY STATE (In Millions) 11 11 |
Slide # 11 – Deposits by State
By state, deposits housed in our home state of Washington now represent just 43% of the total. Oregon is the second largest source of deposits and has seen the fastest growth for the last few years, including a 10.7% increase last year, even with one fewer branch. Deposits increased in all states but Nevada in fiscal 2007.
Washington Federal, Inc. Washington Federal, Washington Federal, Inc. Inc. DEPOSITS BY TYPE DEPOSITS BY TYPE September 30, 2007 (In Millions) Savings $199 or 3.3% Interest Checking $320 or 5.3% Certificates of Deposit $4,650 or 77.6% Money Market $739 or 12.3% 12 12 Non-Interest Checking $89 or 1.5% |
Slide #12 – Deposit Mix
Because we primarily target low transaction, high balance accounts, the mix of our deposits is naturally skewed to money market accounts and certificates of deposit. We are always mindful of the higher rate of interest paid on these accounts, but we favor them because they cost far less to service than mass-market checking accounts, they result in lower losses due to fraud, and they simplify the compliance management function.
During the year though, we did enjoy a significant increase in new checking accounts, which increased by 74%. The increase is attributed to the addition of the acquired accounts in New Mexico and continuing success of a high-yield checking product introduced in 2006 that requires a minimum balance of $10,000 and a direct deposit.
Total checking deposits have doubled in the past two years and we expect them to continue to grow in the future right along with our traditional savings products.
Washington Federal, Inc. Washington Federal, Washington Federal, Inc. Inc. LONG-TERM LONG-TERM BORROWINGS BORROWINGS Years Ended September 30 (In Millions) $600 $1,550 $1,750 $1,750 $1,300 $1,830 $2,200 $2,560 00 01 02 03 04 05 06 07 13 13 4.48% 4.52% 4.96% 5.03% 5.03% 5.40% 5.55% % represent the weighted average interest rate 4.60% |
Slide # 13 – Long-term Borrowings
To supplement deposit funding, and to finance the asset growth necessary to offset declining margins, long-term borrowings were increased by $360 million during the past fiscal year.
The weighted average cost of borrowings also increased during the year from 4.48% to 4.60%. The higher cost resulted from the maturity of lower rate borrowings taken down in previous years that were then refinanced at higher current rates. On a positive note, it appears that during the current fiscal year, declining rates will give us another opportunity to lock in some very attractive, long-term borrowings. In fact, just a few days ago, we took down $100 Million for five years at 3.66%
Washington Federal, Inc. Washington Federal, Washington Federal, Inc. Inc. 14 14 $0 $200 $400 $600 $800 $1,000 $1,200 83 84 85 86 87 88 89 90 91 92 93 94 95 96 97 98 99 00 01 02 03 04 05 06 07 STOCKHOLDERS’ STOCKHOLDERS’ EQUITY EQUITY Years Ended September 30 (In Millions) |
Slide #14 – Stockholder’s Equity
Along with deposits and borrowings, we fund the asset side of the balance sheet with stockholders equity, which increased by $56 million last year. Historically, and may it always be so, the company’s profitability has produced substantial excess capital, so we spend a lot of management time thinking about what to do with all this capital. Generally, we view funding internal, or “organic” growth as the highest and best use of excess capital. However, there are times when market conditions don’t allow us to attract loans and deposits as quickly as we would like, so in those circumstances we look to acquisitions for growth. If viable acquisitions aren’t available, we might return capital to stockholders in the form of stock repurchases or by increasing the already generous cash dividend.
As you’ve heard us say before, a strong capital position is the single most important ingredient in the formula for financial success at Washington Federal. A strong capital position creates earnings power and the flexibility to take advantage of investment opportunities, while also providing a cushion for unexpected losses.
Washington Federal, Inc. Washington Federal, Washington Federal, Inc. Inc. CAPITAL RATIOS CAPITAL RATIOS Regulatory Capital Ratios Core Risk Based Capital / Assets Peer Group Average* Q 09-30-07 Washington Federal Q 09-30-07 Regulatory Required Minimum 7.33% 10.54 10.60 12.06% 21.44 12.82 3.0% 8.0 *15 Largest Public Thrifts - Source: FDIC 15 15 |
Slide #15 – Peer Group Capital Comparison
It’s therefore comforting to note that our capital ratios continue to be among the highest in the nation. Core capital is four times the minimum regulatory requirement and our ratio of Capital to Total Assets was 12.82% at September 30th. That was a ratio that was 21% higher than the peer group.
Primarily because of our strong capital position, Washington Federal was the only thrift covered by Value Line that was awarded an A+ rating for financial strength last year.
Washington Federal, Inc. Washington Federal, Washington Federal, Inc. Inc. INTEREST RATE INTEREST RATE SPREAD SPREAD Quarterly 4.14% 2.00% 2.05% 2.26% 3.20% 16 16 3.00% |
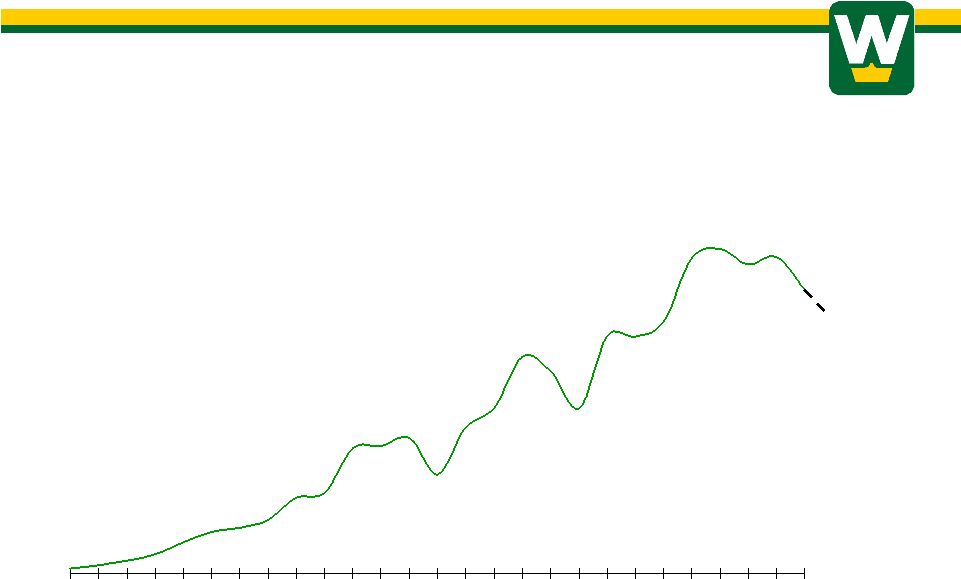
Slide #16– Primary Interest Spread
Now, how do we make money? It’s the difference between what we earn on assets and what we pay for funding that drives profitability. Expressed as a percentage, that difference is known as net interest spread and you can see that it has been very cyclical. When I spoke to you this time last year, the company’s net interest spread stood at 2.18%; however, due to a continued increase in deposit and borrowing costs last year, the spread narrowed and ended the September quarter at 2.05%. In the 1st quarter results just announced, the spread declined further, albeit at a slower pace, to 2.04% and stands near the all-time low of 2% experienced in the year 2000.
This obviously makes for a challenging earnings environment, but as yet another measure of your Company’s financial strength, we always like to point out that because of our strong capital position and world-class operating efficiency, Washington Federal would be profitable even at a 0% spread - a statement I don’t think many other financial institutions can make.
Washington Federal, Inc. Washington Federal, Washington Federal, Inc. Inc. $0 $25 $50 $75 $100 $125 $150 $175 $200 $225 $250 83 84 85 86 87 88 89 90 91 92 93 94 95 96 97 98 99 00 01 02 03 04 05 06 07 NET INTEREST NET INTEREST INCOME INCOME Years Ended September 30 (In Millions) 17 17 |
Slide # 17– Net Interest Income
Net interest income is the spread expressed as dollars. Generally over the years, we have been able to overcome the volatility of net interest spread through careful management of the growth and composition of the balance sheet.
The past few years, however, have left us challenged simply to hold steady due to the rapid increase in the cost of funds coming off the post 9/11 low point of 1% for short-term rates. Last year it cost $108 million more in interest expense to maintain the same $4.6 billion held in deposits accounts in September three years ago. That represents a 125% increase in costs for those same deposits, a rate of increase that is unprecedented in our 25 years as a public company.
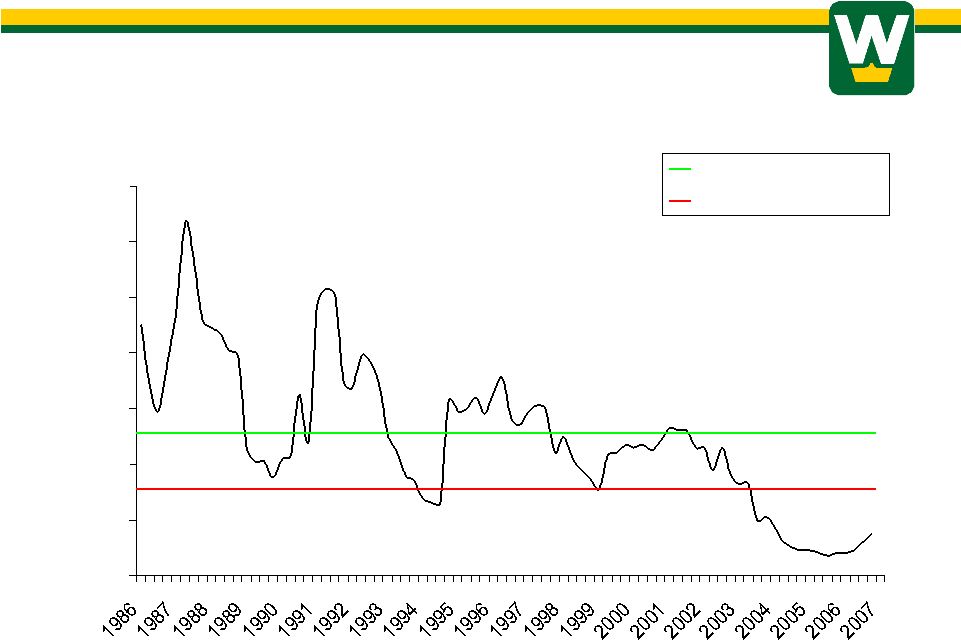
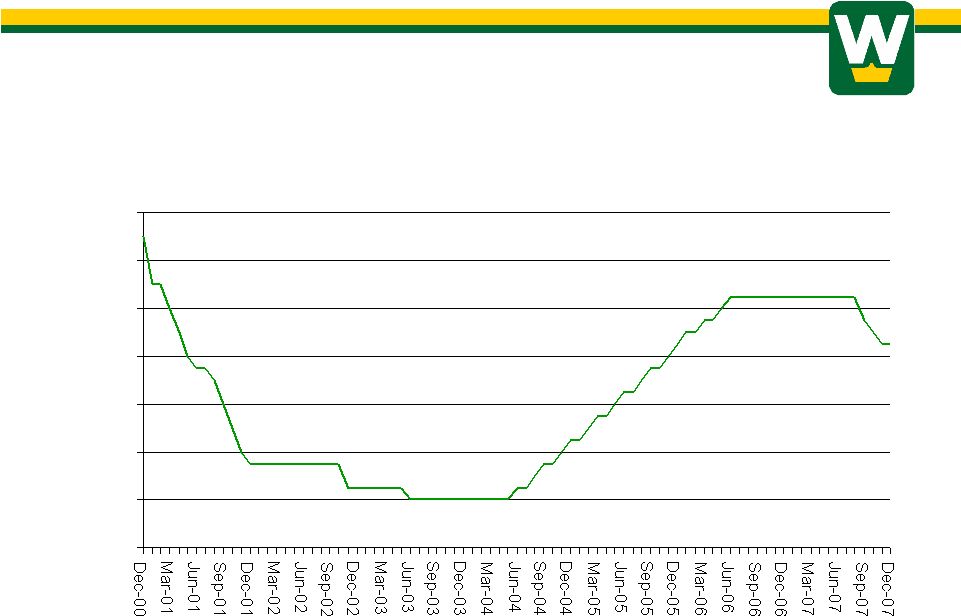
Washington Federal, Inc. Washington Federal, Washington Federal, Inc. Inc. SHORT TERM SHORT TERM INTEREST RATES INTEREST RATES (Fed Funds Rate) 18 18 0.00% 1.00% 2.00% 3.00% 4.00% 5.00% 6.00% 7.00% |
Slide #18– Short Term Rate Trends
The good news is that nothing lasts forever. This slide illustrates the trend in the overnight borrowing rate since 2001. With the reversal of trend in September, we now have reason to be optimistic that as the year unfolds, lower short-term rates will at some point result in a lower cost of funds that will increase our operating profitability
Washington Federal, Inc. Washington Federal, Washington Federal, Inc. Inc. Peer Group Average* Q 09-30-07 57.48% 1.63% Washington Federal 09-30-07 Efficiency Ratio G & A Exp. / Average Assets 23.56% .67% *15 Largest Public Thrifts - Source: FDIC EFFICIENCY 19 19 |
Slide #19 – Efficiency
Out of net interest income we pay the company’s operating expenses. In a mature industry like ours, managing such expenses to the lowest level possible is critical to success in the short run, and survival in the long haul.
Comparing us to the largest 15 public thrift institutions in the U.S., you can see that we continue to run the company in a very frugal manner.
This slide shows the most common measures of cost-effectiveness applied to our industry, and we have strong numbers in both categories. Focusing on theEfficiency Ratio,which is simply a measure of how many pennies a company spends to produce $1 in net revenue, you can see that the industry spent over 57 cents - compared to our 23.56 cents last year.
Another way to look at it is by comparing operating expenses to total assets managed. Based upon last year’s numbers Washington Federal originates and manages its assets for less than one-half of the cost structure of our competitor.
Low operating expenses have always been a hallmark of Washington Federal and always will be; however, investors should expect that operating expenses will be modestly elevated in the near-term due to additional management and systems needed to manage the growing scale of the business and because it takes time to eliminate redundant expenses after acquisitions. Both First Federal Bank of the Southwest and First Mutual owned efficiency ratios above the peer group averages, which is of course, an opportunity for savings.
Washington Federal, Inc. Washington Federal, Washington Federal, Inc. Inc. $0 $15 $30 $45 $60 $75 $90 $105 $120 $135 $150 83 84 85 86 87 88 89 90 91 92 93 94 95 96 97 98 99 00 01 02 03 04 05 06 07 NET INCOME Years Ended September 30 (In Millions) 20 20 |
Slide # 20– Net Income
The bottom line was that your company produced net income last year totaling $135,017,000. This represented a 5.7% decline from last year’s earnings of $143,102,000, which can be attributed to the reduced net interest spread caused by the cost of deposits and borrowings I spoke to earlier.
Still, in light of the housing market and the overall environment, we are reasonably satisfied with these results.
Also in light of current industry conditions, this is a good time to remind stockholders and potential investors that Washington Federal has produced an operating profit every year, every quarter, and every month since at least 1965, which is the extent of our institutional memory.
Washington Federal, Inc. Washington Federal, Washington Federal, Inc. Inc. Peer Group Average* Q 09-30-07 0.74% 6.81% Washington Federal 09-30-07 Return on Average Assets Return on Stockholders’ Equity 1.40% 10.46% *15 Largest Public Thrifts - Source: FDIC. PERFORMANCE PERFORMANCE RATIOS RATIOS 21 21 |
Slide #21 – Performance Ratios
This is a profitability comparison to a peer group of like institutions. In the last quarter for which we have peer group numbers (which we used as a proxy for their annual numbers which aren’t yet available), we exceeded the performance of similar institutions by a comfortable margin in Return on Assets and Return on Equity. The Return on Equity is actually better than it appears given our much larger capital base than the Peer Group.
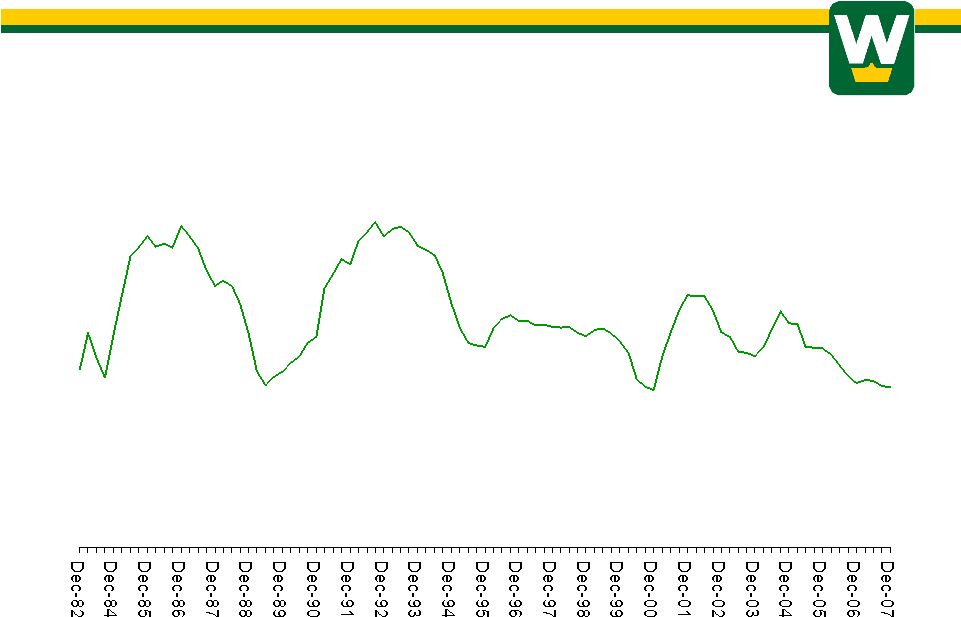
Washington Federal, Inc. Washington Federal, Washington Federal, Inc. Inc. MARKET PRICE MARKET PRICE PER SHARE PER SHARE Last Trade Price, Adjusted for Splits As of December 31 Nov-82 Dec-84 Dec-87 Dec-90 Dec-93 Dec-96 Dec-99 Dec-02 Dec-05 $.37 $.37 $12.26 $12.26 $7.37 $7.37 $16.13 $16.13 $21.11 $21.11 22 22 $19.05* $19.05* *As of January 21, 2008 $24.13 $24.13 |
Slide # 22 – Market price per Share
In spite of the company’s reasonably good financial performance last year, it was not a very good year for the stock. After reaching an all-time high of $27.09 per share in October, the relentless headlines regarding subprime loan losses and the housing slump caused the market to sell off all related stocks primarily because of the opaque nature of financial institution balance sheets. And unfortunately, in the extremely bearish market we’ve recently experienced, track records don’t count for much either.
Washington Federal, Inc. Washington Federal, Washington Federal, Inc. Inc. $0.00 $0.02 $0.04 $0.06 $0.08 $0.10 $0.12 $0.14 $0.16 $0.18 $0.20 $0.22 83 84 85 86 87 88 89 90 91 92 93 94 95 96 97 98 99 00 01 02 03 04 05 06 07 Quarterly Cash Quarterly Cash Dividends Dividends 23 23 |
Slide #23– Cash Dividends
For long-term owners though, which we hope you are and will continue to be, pauses in the market value growth of the stock take on less importance because of the company’s excellent dividend history. You get paid to be patient. Last year, the board of directors approved an increase in the cash dividend by 2.5% to $.21 cents per quarter or $.84 annually. This was the 42nd time in the last 25 years that the company delivered an increase in the cash dividend.
To illustrate just how much the dividend has grown, many of you will remember that in 1982, the company was essentially sold to stockholders in the IPO for a total of $32 million. The cash dividend this year alone will amount to $73 million.
It’s also interesting to note that if you purchased one share at the IPO, you paid $11.75. Through today, if you still own that one share, you have received $321 in dividends alone, a return of cash more than 27 times your original investment! And that one share of stock, by the way, is worth approximately 55 times your original investment.
Our current rate of payout equals 54% of 2007 earnings and delivers a dividend yield of 4.3% on recent prices and, of course, the cash dividend is currently taxed at a 15% maximum federal tax rate.
Washington Federal, Inc. Washington Federal, Washington Federal, Inc. Inc. 2007 Summary 2007 Summary 24 24 • Net Income down, but strong by comparison • One of the best years in WFSL history • Good loan and deposit growth • Increased capital from retained earnings • Problem loans manageable • New Mexico acquisition accretive in 2007 • Agreement to acquire First Mutual |
Slide #24– 2007 Summary
I’ll finish by saying that it was a good year for your Company. The acid test is always the bottom line, and while this management team finds reporting a decline in earnings to be very distasteful, Net Income was still strong by comparison to the industry and it was one of the best years in the company’s history. We enjoyed good loan and deposit growth, a sizable increase in capital due to retained earnings, and problems in the loan portfolio remained manageable despite a substantially weaker housing market and a slowing general economy. We expanded into New Mexico with an acquisition that was additive to earnings in year one and we entered into a transaction that will close shortly and add significant bulk and earnings power to our Seattle-area franchise.
Washington Federal, Inc. Washington Federal, Washington Federal, Inc. Inc. Looking to 2008 Looking to 2008 25 25 Question for 2008: Will increased credit costs outweigh the benefits of increased net interest spread? |
Slide #25– Looking to 2008
Now we move on to a new fiscal year that is clearly shaping up to be one of the most challenging that we’ve experienced. Without question, we will experience higher non-performing assets and loan losses during the year. The housing market and the general economy are falling tides that lower all ships and we are not exempt from the effects. Yet at the same time, we have very good reason to expect an improvement in the spread between earning asset yields and the cost of funds, which could prove to be substantial.
How those two factors play out – higher credit costs versus improved net interest spread - - will determine whether or not earnings grow or decline this year. As always, if we are privileged to do so, it will be interesting to come back next year and report the outcome to you. Thank you.
Slide #24 – Washington Federal Logo
Now I would like to ask the Corporate Secretary to report the results of the voting and then we will answer any questions.