Table of Contents

Table of Contents
WASHINGTON FEDERAL, INC.
ANNUAL REPORT 2010
425 Pike Street, Seattle, WA 98101

| 1 | ||||
| 2 | ||||
Management’s Discussion and Analysis of Financial | 5 | |||
| 14 | ||||
| 15 | ||||
| 20 | ||||
Management’s Report on | 44 | |||
| 44 | ||||
| 46 | ||||
| 47 | ||||
| 48 |
A SHORT HISTORY
Washington Federal, Inc. (Company or Washington Federal) is a unitary thrift holding company headquartered in Seattle, Washington. Its principal subsidiary is Washington Federal Savings, which operates 160 offices in eight western states.
The Company had its origin on April 24, 1917, as Ballard Savings and Loan Association. In 1935, the state-chartered Company converted to a federal charter, became a member of the Federal Home Loan Bank (FHLB) system and obtained federal deposit insurance. In 1958, Ballard Federal Savings and Loan Association merged with Washington Federal Savings and Loan Association of Bothell, and the latter name was retained for wider geographical acceptance. In 1971, Seattle Federal Savings and Loan Association, with three offices, merged into the Company, and at the end of 1978, was joined by the 10 offices of First Federal Savings and Loan Association of Mount Vernon.
On November 9, 1982, the Company converted from a federal mutual to a federal stock association. In 1987 and 1988, acquisitions of United First Federal, Provident Federal Savings and Loan, and Northwest Federal Savings and Loan, all headquartered in Boise, Idaho, added 28 Idaho offices to the Company. In 1988, the acquisition of Freedom Federal Savings and Loan Association in Corvallis, Oregon, added 13 Oregon offices, followed in 1990 by the eight Oregon offices of Family Federal Savings.
In 1991, the Company added three branches with the acquisition of First Federal Savings and Loan Association of Idaho Falls, Idaho, and acquired the deposits of First Western Savings Association of Las Vegas, Nevada, in Portland and Eugene, Oregon, where they were doing business as Metropolitan Savings Association. In 1993, 10 branches were added with the acquisition of First Federal Savings Bank of Salt Lake City, Utah. In 1994, the Company expanded into Arizona.
In 1995, the stockholders approved a reorganization whereby Washington Federal Savings became a wholly owned subsidiary of a newly formed holding company, Washington Federal, Inc. That same year, the Company purchased West Coast Mutual Savings Bank with its one branch in Centralia, Washington, and opened six additional branches. In 1996, the Company acquired Metropolitan Bancorp of Seattle, adding eight offices in Washington in addition to opening four branches in existing markets. Between 1997 and 1999, Washington Federal Savings continued to develop its branch network, opening a total of seven branches and consolidating three offices into existing locations.
In 2000, the Company expanded into Las Vegas, opening its first branch in Nevada along with two branches in Arizona. In 2001, the Company opened two additional branches in Arizona and its first branch in Texas with an office in the Park Cities area of Dallas. In 2002, Washington Federal Savings opened five full-service branches in existing markets. In 2003, the Company purchased United Savings and Loan Bank with its four branches in the Seattle metropolitan area, added one new branch in Puyallup, Washington, and consolidated one branch in Nampa, Idaho. In 2005, the Company consolidated two branches in Mount Vernon, Washington, into one and opened branches in Plano, Texas, and West Bend, Oregon. In 2006, the Company opened locations in Klamath Falls, Oregon, Richardson, Texas and another in Las Vegas, Nevada. During 2006, a branch in Medford, Oregon, was opened.
The Company acquired First Federal Banc of the Southwest, Inc., the holding company for First Federal Bank located in Roswell, New Mexico, on February 13, 2007. First Federal Bank had 13 branch locations, 11 in New Mexico and two in El Paso, Texas. The Company acquired First Mutual Bancshares, Inc. (“First Mutual”), the holding company for First Mutual Bank, on February 1, 2008. First Mutual had 12 branches primarily located in the eastside of Seattle. The Company also opened a location in Redmond, Oregon in 2008. During 2009, the Company opened two new locations, one in Las Vegas, Nevada and the other in Prescott Valley, Arizona.
On January 8, 2010, the Company acquired certain assets and liabilities, including most of the loans and deposits, of Horizon Bank, headquartered in Bellingham, Washington (“Horizon”) from the Federal Deposit Insurance Corporation (“FDIC”), as receiver for Horizon. Horizon operated eighteen full-service offices, four commercial loan centers and four real estate loan centers in Washington. Through consolidation with existing Washington Federal branches, there was a net increase of 10 branches as a result of the Horizon acquisition.
The Company obtains its funds primarily through deposits from the general public, from repayments of loans, borrowings and retained earnings. These funds are used largely to make loans to individuals and business for the purchase of new and existing homes, construction and land loans, commercial real estate, commercial and industrial loans, and for investments.
Table of Contents

| September 30, | 2010 | 2009 | % Change | |||||||||
| (In thousands, except per share data) |
| ||||||||||
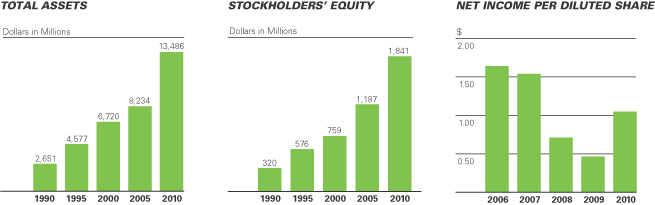
Assets | $ | 13,486,379 | $ | 12,582,475 | 7 | % | ||||||
Cash and cash equivalents | 888,622 | 498,388 | 78 | |||||||||
Investment securities | 358,061 | 21,259 | 1,584 | |||||||||
Loans receivable, net | 8,423,703 | 8,983,430 | -6 | |||||||||
Covered loans, net | 534,474 | 0 | — | |||||||||
Mortgage-backed securities | 2,203,139 | 2,282,865 | -3 | |||||||||
Customer accounts | 8,852,540 | 7,842,310 | 13 | |||||||||
FHLB advances and other borrowings | 2,665,548 | 2,879,530 | -7 | |||||||||
Stockholders’ equity | 1,841,147 | 1,745,485 | 5 | |||||||||
Net income available to common shareholders | 118,653 | 40,684 | 192 | |||||||||
Diluted earnings per share | 1.05 | 0.46 | 128 | |||||||||
Dividends per share | 0.20 | 0.20 | — | |||||||||
Stockholders’ equity per share | 16.37 | 15.55 | 5 | |||||||||
Shares outstanding | 112,484 | 112,248 | NM | |||||||||
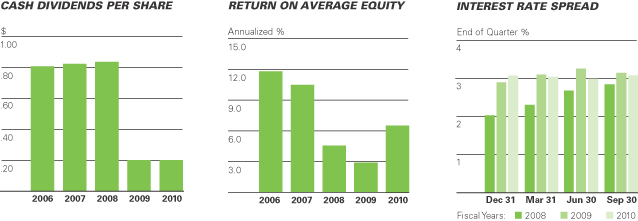
Return on average stockholders’ equity | 6.55 | % | 2.87 | % | NM | |||||||
Return on average assets | 0.89 | 0.33 | NM | |||||||||
Efficiency ratio (1) | 26.26 | 27.30 | NM | |||||||||
| (1) | Calculated as total operating costs divided by net interest income, plus other income (excluding Investment gains and FHLB prepayment fee) |
NM – not meaningful
| 1 |
Table of Contents

Fellow Stockholder:
It is my privilege to advise you that last fiscal year was a successful one. Net income for our company amounted to $118,653,000, an increase of 192% over the $40,684,000 recorded in the prior year. Two extraordinary items, a $54.8 million after tax gain on the acquisition of certain assets and liabilities of the former Horizon Bank, and the recapture of $39 million related to a contingent federal tax liability, delivered a welcome boost to earnings from normal operations that were weakened by the high cost of resolving problem loans. In a year that saw the highest number of bank failures in nearly 20 years, we are delighted and somewhat relieved to close the books on fiscal 2010 and report such positive results.
For generations the management of Washington Federal has worked to develop a reputation as a business built upon integrity, with a fortress financial condition and a culture of treating clients fairly. This substantial effort brought real rewards during the year as business gravitated to us because we were viewed as a safe harbor and a good place to do business. Our strong financial position also enabled the company to gain market share at a very reasonable price through the FDIC-assisted acquisition of the aforementioned Horizon Bank, a $1.1 billion institution with 18 branches that was headquartered in Bellingham, Washington. The integration of a failed institution is not without trauma for their employees and clients and we lost a few good ones in each category along the way. For those who remained loyal and worked with us through a challenging time, we cannot thank you enough. We are intensely committed to proving that you made a good decision.
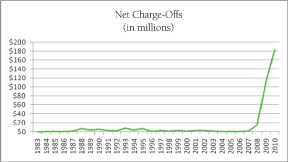
On the financial management front, the company’s capital and liquidity positions were already world-class, so the focus last year was on the disposition of problem assets and positioning the balance sheet for changing interest rates. Regarding problem assets, we center attention on what are known in the industry as Non-Performing Assets (“NPA’s”), comprised of loans on which interest is no longer being accrued plus assets acquired through foreclosure. Such assets peaked in June 2009 at $606 million and have declined each quarter since, ending September 2010 at $435 million, representing a decline of 28%. This is good news and we expect the trend to continue. The adjacent chart, though, shows in a dramatic way that much of the reduction in NPA’s came as a result of write-offs, which have skyrocketed since the begin ning of the so-called Great Recession, brought on by the bursting of the housing bubble. The combination of a concentration in residential real estate, declining home values and high unemployment, meant that there was simply no way for the company to avoid losses. Yet the overall performance of the company under such dire circumstances is a real testament to the strength of the institution and should give investors confidence that it can survive just about any economic calamity. As with NPA’s, management believes that the worst is behind us and that we have experienced the peak in asset writedowns for this credit cycle. Fiscal 2011 should see considerable improvement in that area.
Interest rate risk, defined as the impact on earnings of a change in interest rates, is an area where management is less confident in its ability to forecast events. In fact, there may never have been a time at which it’s been so easy to make the convincing case for both inflationary and deflationary scenarios. In the end though, because the company is heavily invested in 30 year fixed rate mortgages, the deeper concern is with rising interest rates brought on by inflationary expectations, so it is against that greater risk that we are fortifying the company. We do so primarily by shortening the maturities of assets – allowing mortgage loans to refinance elsewhere, for example, increasing investment in short-term or floating rate assets, increasing cash which can be invested at higher rates in the future, and maintaining high levels of capital that can be leveraged in the future to offset any decline in margin. Management has also locked in long-term financing to the maximum extent that it deems prudent, given that there remains a strong case for low rates to continue for a considerable period of time. The result of these moves collectively has been to reduce the interest rate risk posture of the company. Earnings in the near-term will be lower as a result, because we make money by taking risk and we are consciously avoiding interest rate risk today. We view this as an investment in the future, similar to the premiums paid on an insurance policy. As always, we’re willing to leave a little on the table today to make certain that we prosper in the future.
| 2 | . |
Table of Contents

The Company completed its rebranding during the year, and for the first time in years, the same sign now hangs over all of our offices. The name was shortened to that which we are known by anyway and to reflect the slightly broader product line. The “invested here” tagline bubbled up from within the soul of the company and conveys the notion that we are absolutely committed to the long-term best interests of our clients, owners, employees and the neighborhoods and businesses we serve. Although we still believe that this is a business built upon relationships developed one at a time, we spent a bit of money on advertising during the year to reinforce the new brand and increase name recognition; hopefully, you noticed. |  | |
| (Back row - from left to right) Thomas E. Kasanders, Executive Vice President, Linda S. Brower, Executive Vice President, Mark A. Schoonover, Executive Vice President and Chief Credit Officer, Angela D. Veksler, Senior Vice President and Chief Information Officer (Front row - from left to right) Jack B. Jacobson, Executive Vice President, Roy M. Whitehead, Chairman, President and Chief Executive Officer, Edwin C. Hedlund, Executive Vice President and Secretary, Brent J. Beardall, Executive Vice President and Chief Financial Officer. |
Each passing year brings more dependence on information technology. In recognition of that reality, we advised you two years ago that the company had embarked upon a major upgrade to its systems. At this writing, I am pleased to report that Project Tritan, the rewrite of our in-house core operating system, is complete and that after converting three acquired companies to the system in the past seven months, the entire company is once again operating on a single system. Hardware throughout the company has also been upgraded to a single standard, while IT governance practices, information security and business continuity plans have also been enhanced. In August, we added the Chief Information Officer position to the executive management team in recognition of the growing importance of this part of the business.
Other than loan-related losses, the most consequential setback during the year was a management failure to meet the expectations of the company’s primary regulator regarding certain business processes. What management regarded as elegantly simple and pragmatic, the regulators regarded as uncommonly sparse. We bowed to their requirements and the resulting memorandum of understanding was detailed in a voluntary public disclosure at the time it was signed. Over the past ninety days the company has, or shortly will have, completed all agreed upon tasks. Higher costs and increased operational complexity will be traded off for the benefit of more detailed management of certain risks. The company will also be easier to examine in the future because its processes will align more closely with regulator expectations and be more fully documented.
Looking to the new fiscal year, we are optimistic that better times lie ahead, yet continue to advise investors to be realistic in their expectations. This is not due to concerns about our own company, but to fundamental changes in the business environment which affect our cost structure, profit margins, and attitude toward risk that will take some time to correct. Chief concerns include an economy that is likely to be slow-growth at best with ongoing high unemployment, the enormously imbalanced financial condition of government at all levels, ultralow interest rates that reduce earnings on capital and limit our appetite for investing, continued softness in the housing market, the increase in regulatory burden and change in primary regulators required by the populist Dodd-Frank bill, and continued overcapacity in financial services despite the ongoing industry shakeout. We also continue to be concerned about changing social attitudes toward personal responsibility for credit; namely, the so-called “strategic defaults” that see those able to pay simply decide not to. It’s always surprising to hear financial planners, economists or government officials speak of it so casually as being rational or to be expected, because like insurance fraud or shoplifting, in our view it is unethical and irresponsible behavior that in the end will raise costs for everyone and devalue us as a society. At the same time, investors and the public should know that Washington Federal has voluntarily modified 1,274 mortgage loans, or 3% of our total mortgage loans, for families
| 3 |
Table of Contents
TO OUR STOCKHOLDERS(CONTINUED)
that have fallen on hard times and simply need a temporary hand-up. Each of those borrowers remains in good standing with us and we’re very pleased to be able to help because it’s the right thing to do and because it’s good business.
The economic dark clouds overhead don’t fully obscure the sun though, and we see many opportunities. Washington Federal is currently the largest financial institution headquartered in the Pacific Northwest. With one of the strongest capital positions in the industry, solid earnings prospects, an updated operating structure and a solid reputation, we are well positioned to take advantage of opportunities that come our way. In 2011, management intends to refocus the company on external opportunities. While we prefer to grow the company one good client at a time, the company is also postured to acquire if that opportunity presents. As always, you can help by referring your friends, neighbors and business acquaintances to Washington Federal for their banking needs.
In closing, I’d like to thank the Board of Directors, the Executive Management Committee and all of our hard-working and loyal employees for their contributions during the year. The IT staff and those involved in the disposition of problem assets deserve special recognition. Most importantly, I’d like to end this letter by advising you as a stockholder that we never forget that we work for you and by thanking you for entrusting us with your investment.
I look forward to seeing you at the Annual Meeting of Stockholders to be held at 2:00 pm, on January 19, 2011 at Benaroya Hall in downtown Seattle.
Sincerely,

Roy M. Whitehead
Chairman, President and Chief Executive Officer
| 4 | . |
Table of Contents

MANAGEMENT’S DISCUSSION AND ANALYSIS OF
FINANCIAL CONDITION AND RESULTS OF OPERATIONS
This Annual Report on Form 10-K and the documents into which it may be incorporated by reference may contain, and from time to time our management may make, certain statements that constitute forward-looking statements. Words such as “expects,” “anticipates,” “believes,” “estimates” and other similar expressions or future or conditional verbs such as “will,” “should,” “would” and “could” are intended to identify such forward-looking statements. These statements are not historical facts, but instead represent the current expectations, plans or forecasts of the Company and are based on the beliefs and assumptions of the management of the Company and the information available to management at the time that these disclosures were prepared. The Company intends for all such forward-looking statements to be covered by the safe harbor provisions for forward-looking statements within the meaning of the Private Securities Litigation Reform Act of 1995 and the provisions of Section 27A of the Securities Act of 1933 and Section 21E of the Securities Exchange Act of 1934. These statements are not guarantees of future results or performance and involve certain risks, uncertainties and assumptions that are difficult to predict and often are beyond the Company’s control. Actual outcomes and results may differ materially from those expressed in, or implied by, the Company’s forward-looking statements.
You should not place undue reliance on any forward-looking statement and should consider the following uncertainties and risks, as well as the risks and uncertainties discussed elsewhere in this report, including under Item 1A. “Risk Factors,” and in any of the Company’s other subsequent Securities and Exchange Commission filings:
| • | the Bank’s ability to comply with the terms of its memorandum of understanding with the OTS |
| • | negative economic conditions, including sharp declines in the real estate market, home sale volumes and financial stress on borrowers as a result of the uncertain economic environment, that adversely affect our borrowers and their customers, and may adversely affect our financial condition and results of operations; |
| • | the severe effects of the continued economic downturn, including high unemployment rates and severe declines in housing prices and property values, in our primary market areas; |
| • | fluctuations in interest rate risk and changes in market interest rates, which may negatively affect the Company’s results of operations and financial conditions; |
| • | the Company’s ability to make accurate assumptions and judgments about the collectability of its loan portfolio, including the creditworthiness of its borrowers and the value of the assets securing these loans; |
| • | legislative and regulatory limitations, including those arising under the Dodd-Frank Wall Street Reform Act and potential limitations in the manner in which we conduct our business and undertake new investments and activities; |
| • | changes in other economic, competitive, governmental, regulatory, and technological factors affecting the Company’s markets, operations, pricing, products, services and fees; and |
| • | the timing and occurrence or non-occurrence of events that may be subject to circumstances beyond the Company’s control. |
All forward-looking statements speak only as of the date on which such statements are made, and Washington Federal undertakes no obligation to update or revise any forward-looking statements to reflect changed assumptions, the occurrence of unanticipated events, changes to future operating results over time, or the impact of circumstances that arise after the date the forward-looking statement was made.
GENERAL | Washington Federal, Inc. (Company or Washington Federal) is a unitary thrift holding company. The Company’s primary operating subsidiary is Washington Federal Savings (Bank), a federally-chartered savings and loan association. |
The Company’s fiscal year end is September 30th. All references to 2010, 2009 and 2008 represent balances as of September 30, 2010, September 30, 2009, and September 30, 2008, or activity for the fiscal years then ended.
CRITICAL ACCOUNTING POLICIES | Preparation of financial statements in conformity with accounting principles generally accepted in the United States of America requires the use of estimates and assumptions that affect reported amounts of certain assets, liabilities, revenues and expenses in the Company’s consolidated financial statements. Accordingly, estimated amounts may fluctuate from one reporting period to another due to changes in assumptions underlying estimated values. |
| 5 |
Table of Contents

MANAGEMENT’S DISCUSSION AND ANALYSIS OF
FINANCIAL CONDITION AND RESULTS OF OPERATIONS(CONTINUED)
The Company has determined that the only accounting policy deemed critical to an understanding of the consolidated financial statements of Washington Federal relates to the methodology for determining the valuation of the allowance for loan losses, as described below.
The Company maintains an allowance for loan losses to absorb losses inherent in the loan portfolio. The allowance is based on ongoing, quarterly assessments of the probable and estimable losses inherent in the loan portfolio. The Company’s methodology for assessing the appropriateness of the allowance consists of several key elements, which include the general allowance and specific allowances.
The general loan loss allowance is established by applying a loss percentage factor to the different loan types. The allowance is provided based on Management’s continuing evaluation of the pertinent factors underlying the quality of the loan portfolio, including changes in the size and composition of the loan portfolio, actual loan loss experience, current economic conditions, collateral values, geographic concentrations, seasoning of the loan portfolio, specific industry conditions and the duration of the current business cycle. The recovery of the carrying value of loans is susceptible to future market conditions beyond the Company’s control, which may result in losses or recoveries differing from those provided.
Specific allowances are established for loans which are individually evaluated, in cases where Management has identified significant conditions or circumstances related to a loan that Management believes indicate the probability that a loss has been incurred.
INTEREST RATE RISK | The primary source of income for the Company is net interest income, which is the difference between the interest income generated by our interest-earning assets and the interest expense generated by our interest-bearing liabilities. The level of net interest income is a function of the average balances of our interest-earnings assets and liabilities, and the spread between the yield on such assets and the cost of such liabilities. These factors are influenced by both the pricing and mix of our interest-earning assets and our interest-bearing liabilities. If the interest rates on our interest-bearing liabilities increase at a faster pace than the interest rates on our interest-earning assets, the result could be a reduction in net interest income and with it, a reduction in our earnings. |
The Company accepts a higher level of interest rate volatility as a result of its significant holdings of fixed-rate single-family home loans that are longer-term than the short-term characteristics of its primary liabilities of customer accounts. As a result, assets do not respond as quickly to changes in interest rates as liabilities. As a result, Net interest income typically would decline when interest rates rise and would expand when interest rates fall as compared to a portfolio of matched maturities of assets and liabilities.
The Company manages its interest rate risk in part by originating more fixed-rate loans when yields are higher and adding loans and investments with shorter term characteristics, such as construction or commercial loans, when loan rates are lower. This balance sheet strategy, in conjunction with a strong capital position and low operating costs have allowed the Company to manage interest rate risk, within guidelines established by the Board of Directors, through all interest rate cycles. Although a significant increase in market interest rates could adversely affect net interest income of the Company, the Company’s interest rate risk approach has never resulted in the recording of a monthly operating loss.
The following table shows the estimated repricing periods for earning assets and paying liabilities.
| Repricing Period | ||||||||||||||||
| Within One Year | After 1 year - before 6 Years | Thereafter | Total | |||||||||||||
| (In thousands) | ||||||||||||||||
As of September 30, 2010 | ||||||||||||||||
Earning Assets * | $ | 3,270,289 | $ | 4,424,269 | $ | 4,865,189 | $ | 12,559,747 | ||||||||
Paying Liabilities | (7,075,460 | ) | (4,441,030 | ) | (1,597 | ) | (11,518,087 | ) | ||||||||
Excess (Liabilities) Assets | $ | (3,805,171 | ) | $ | (16,761 | ) | $ | 4,863,592 | ||||||||
Excess as % of Total Assets | -28.2 | % | ||||||||||||||
Policy limit for one year excess | -60.0 | % | ||||||||||||||
| * | Asset repricing period includes estimated prepayments based on historical activity |
At September 30, 2010, the Company had approximately $3.8 billion more liabilities subject to repricing in the next year than assets, which amounted to a negative maturity gap of 28% of total assets. As of September 30, 2009, the amount of excess liabilities subject to repricing within one year was approximately $4.1 billion, or 33%, of total assets. The decrease of approximately $333 million of liabilities in excess of assets repricing within one year was due to the increasing cash balances and deposit accounts moving into maturities beyond one year. By having an excess of liabilities repricing within one year over assets, the Company is subject to decreasing net interest income should interest rates rise. However, if the size and or mix of the balance sheet changes, rising rates may not cause a decrease in net interest income.
| 6 | . |
Table of Contents
The Company’s net interest spread decreased from 3.17% at September 30, 2009 to 3.09% at September 30, 2010. Net interest spread represents the difference between the contractual rates of earning assets and the contractual rates of paying liabilities as of a specific date. The spread decreased due to a higher proportion of lower yielding investment balances compared to total earning assets as deposit growth has exceeded loan growth. In addition, loan yields are lower as a result of refinancing of fixed-rate mortgages into historically low long-term interest rates. Rates on customer accounts decreased by 45 basis points over the prior year while rates on earning assets decreased by 54 basis points (see Period End Spread table below).
As of September 30, 2010, the Company had grown total assets by $903,904,000, or 7.2%, from $12,582,475,000 at September 30, 2009, including $1,133,589,000 in assets acquired on January 8, 2010 from the Horizon transaction described in Note A. For the year ended September 30, 2010, compared to September 30, 2009, loans (both non-covered and covered) decreased $25,253,000, or 0.3%, and investment securities increased $257,075,000, or 11.2%. Cash and cash equivalents of $888,622,000 and stockholders’ equity of $1,841,147,000 provides management with flexibility in managing interest rate risk going forward.
ASSET QUALITY & ALLOWANCE FOR LOAN LOSSES | The Company maintains an allowance to absorb losses inherent in the loan portfolio. The allowance is based on ongoing, quarterly assessments of the probable and estimable losses inherent in the loan portfolio. The Company’s methodology for assessing the appropriateness of the allowance consists of several key elements, which include the general allowance and specific allowances. |
The general portion of the loan loss allowance is established by applying a loss percentage factor to the different loan types. Management believes loan types are the most relevant factor to group loans for the allowance calculation as the risk characteristics in these groups are similar. The allowances are provided based on Management’s continuing evaluation of the pertinent factors underlying the quality of the loan portfolio, including changes in the size and composition of the loan portfolio, actual loan loss experience, current economic conditions, geographic concentrations, seasoning of the loan portfolio, specific industry conditions, and the duration of the current business cycle. The recovery of the carrying value of loans is susceptible to future market conditions beyond the Company’s control, which may result in losses or recoveries differing from those provided.
During 2009, the Company enhanced its general reserve allowance calculation to be reflective of the current economic environment. Changes included shortening the look-back period for determining historical loss factors “HLF” and modifying the methodology to give more weighting to risks by asset type rather than geographic exposure. In addition to utilizing the HLF to calculate the general reserve, we utilize a qualitative risk factor “QRF” which is determined by loan type and allows management to augment reserve levels to reflect the current environment and portfolio performance trends including recent charge off trends.
By shortening the look-back period the Company has taken into account the current housing environment where home values have declined substantially from the housing peak of 2007. We monitor delinquency trends as well as regional economic conditions including employment and housing values when determining the QRF. Washington Federal did not originate many of the “high risk” loan types, such as Option ARM or interest only long term loans, which have caused significant losses throughout the industry.
Specific allowances are established for loans which are individually evaluated; in cases where Management has identified significant conditions or circumstances related to a loan that Management believes indicate the probability that a loss has been incurred.
Loans for commercial purposes, including multi-family loans, builder construction loans and commercial loans are reviewed on an individual basis to assess the ability of the borrowers to continue to service all of their principal and interest obligations. If a loan shows signs of weakness, it is downgraded and, if warranted, placed on non-accrual status. Updated valuations are generally obtained from external sources on collateral dependent commercial loans when a loan exhibits weakness or is modified. The Company has an asset quality review function that reports the results of its internal reviews to the Board of Directors on a quarterly basis.
Restructured single-family residential loans are reserved for under the Company’s general reserve methodology. If any individual loan is significant in balance, the Company may establish a specific reserve as warranted.
Most restructured loans are accruing and performing loans where the borrower has proactively approached the Company about modifications due to temporary financial difficulties. Each request is individually evaluated for merit and likelihood of success. Single-family residential loans comprised 75.9% of restructured loans as of September 30, 2010. The concession for these loans is typically a payment reduction through a rate reduction of from 100 to 200 bps for a specific term, usually six to twelve months. Interest-only payments may also be approved during the modification period. The subsequent default rate on restructured single- family mortgage loans has been approximately 15% since inception of the program in November 2008. Concessions for construction (3.6%), land A&D (12.3%) and multi-family loans (4.7%) are typically an extension of maturity combined with a rate reduction of normally 100 bps. The subsequent default rate on restructured commercial loans has been less than 10% since December 2009.
| 7 |
Table of Contents
MANAGEMENT’S DISCUSSION AND ANALYSIS OF
FINANCIAL CONDITION AND RESULTS OF OPERATIONS(CONTINUED)
For commercial loans, six consecutive payments on newly restructured loan terms are required prior to returning the loan to accrual status. In some instances after the required six consecutive payments are made, a management assessment will conclude that collection of the entire principal balance is still in doubt. In those instances, the loan will remain on non-accrual. Homogeneous loans may or may not be on accrual status at the time of restructuring, but all are placed on accrual status upon the restructuring of the loan. Homogenous loans are restructured only if the borrower can demonstrate the ability to meet the restructured payment terms; otherwise, collection is pursued and the loan remains on non-accrual status until liquidated. If the homogenous restructured loan does not perform it will be placed in non-accrual status when it is 90 days delinquent.
A loan that defaults and is subsequently modified would impact the Company’s delinquency trend, which is part of the QRF component of the general reserve calculation. Any modified loan that re-defaults and is charged-off would impact the HLF component of our general reserve calculation.
Non-performing assets were $434,530,000, or 3.22%, of total assets, at September 30, 2010, compared to $557,120,000, or 4.43%, of total assets, at September 30, 2009. This elevated level of non-performing assets is a result of the significant decline in housing values in the western United States and the national recession over the last three years. Total delinquencies over 30 days were $304,665,000, or 3.53%, of net loans at September 30, 2010, compared to $456,318,000, or 5.08%, of net loans at September 30, 2009.
The loans and foreclosed real estate purchased in the Horizon transaction (see Note A) are covered by two loss share agreements between the FDIC and the Bank (one for single family loans and the other for all other loans and foreclosed real estate), which affords the Bank significant loss protection. Under the loss share agreements, the FDIC will cover 80% of covered loan and foreclosed real estate losses up to $536 million and 95% of losses in excess of that amount. The term for loss sharing on residential real estate loans is ten years, while the term for loss sharing on non-residential real estate loans is five years with respect to losses and eight years with respect to loss recoveries. The losses reimbursable by the FDIC are based on the book value of the relevant loan as determined by the FDIC at the date of the transaction. New loans made after that date are not covered by the loss share agreements. As a result of the loss sharing agreements with the FDIC, the Bank recorded a receivable of $228 million at the time of acquisition. To account for the transaction, the balance sheet now has three new line items, as follows:
“Covered loans” represent the loans acquired from Horizon recorded at their estimated fair market value;
“Covered real estate held for sale” represents the estimated fair market value of the repossessed real estate acquired in the transaction. The covered loans and covered real estate held for sale are collectively referred to as “covered assets”;
“FDIC indemnification asset” represents the estimated fair value of the guarantee provided by the FDIC on the covered assets.
Loans that were classified as non-performing loans by Horizon are no longer classified as non-performing because, at acquisition, the carrying value of these loans was adjusted to reflect fair value and are covered under the FDIC loss sharing agreements. Management believes that the new book value reflects an amount that will ultimately be collected.
The following table details non-performing asset by type, comparing 2010 and 2009.
| September 30, | ||||||||||||||||
| Non-Performing Assets | 2010 | 2009 | $ Change | % Change | ||||||||||||
| (In thousands) | ||||||||||||||||
Non-accrual loans: | ||||||||||||||||
Single-family residential | $ | 123,624 | $ | 116,268 | $ | 7,356 | 6 | % | ||||||||
Construction – speculative | 39,915 | 50,348 | (10,433 | ) | -21 | % | ||||||||||
Construction – custom | — | — | — | — | ||||||||||||
Land – acquisition & development | 64,883 | 187,061 | (122,178 | ) | -65 | % | ||||||||||
Land – consumer lot loans | — | — | — | — | ||||||||||||
Multi-Family | 4,931 | 4,368 | 563 | 13 | % | |||||||||||
Commercial real estate | 10,831 | 2,733 | 8,098 | 296 | % | |||||||||||
Commercial & industrial | 371 | 18,823 | (18,452 | ) | NM | |||||||||||
HELOC | — | — | — | — | ||||||||||||
Consumer | 977 | 656 | 321 | 49 | % | |||||||||||
Total non-accrual loans | 245,532 | 380,257 | (134,725 | ) | -35 | % | ||||||||||
Total REO & REHI | 188,998 | 176,863 | 12,135 | 7 | % | |||||||||||
Total non-performing assets | $ | 434,530 | $ | 557,120 | $ | (122,590 | ) | -22 | % | |||||||
| 8 | . |
Table of Contents
A disproportionate share of the Company’s non-performing assets (“NPAs”) and charge-offs come from the land A&D and speculative construction portfolios. These assets have seen the largest declines in value in the loan portfolio. The continued elevated level of non-performing assets is attributable to lower home values, high unemployment and weak economic conditions in the Company’s eight state market territory.
In response to the improving overall credit quality of our loan portfolio, the allowance for loan loss decreased by $3,742,000, or 2.2%, over 2009. $98,092,000 of the allowance is calculated under the formulas (general reserve) contained in our methodology and the remaining $65,002,000 is made up of specific reserves on loans that were deemed to be impaired at September 30, 2010. The general reserve increased by $38,631,000, or 61.6%, to $98,092,000, while the specific reserve decreased by $42,373,000, or 39.5%. The shift in the allowance, increasing the general reserve and decreasing the specific reserve is due to 1) the continued economic uncertainty driven primarily by high unemployment rates which had the effect of increasing the general reserve and 2) the declining balances of land acquisition and development and speculative construction loans, and related specific reserves.
Recently, legal issues involving documentation flaws in the mortgage foreclosure process used by large servicing organizations have gained a very high profile in the national media. For example, attention has been brought to so-called “Robo-signers”, which is a description given to a servicing employee involved in signing hundreds of documents, allegedly without a complete review of their contents. Questions have also been raised by borrowers regarding the legality of the Mortgage Electronic Registration System (“MERS”), which was created to transfer ownership of mortgage loans electronically and improve the efficiency of the secondary markets, to affect foreclosure. The Company has proactively reviewed its practices in this area and believes that its foreclosure activities are not affected. Washington Federal is a portfolio lender and does not sell loans in the secondary market and therefore is not a participant in MERS. Likewise, the Company is not a large servicing organization and thus is able to handle all foreclosures using a limited number of staff members and attorneys. The review discovered no systemic issues involving foreclosure documentation of the types being alleged by borrowers and it is believed that any documentation weaknesses that would prevent foreclosure will be isolated and not material to the overall financial results. The absence of secondary market sales by the Company also eliminates the risk of “putbacks”, or repurchase requests from loan purchasers, which is a significant potential source of litigation and economic loss for large mortgage originators and servicers in the currently distressed market.
LIQUIDITY AND CAPITAL RESOURCES | The principal sources of funds for the Company’s activities are retained earnings, loan repayments (including prepayments), net deposit inflows, repayments and sales of investments and borrowings. Washington Federal’s principal sources of revenue are interest on loans and interest and dividends on investments. |
The Company’s net worth at September 30, 2010, was $1,841,147,000, or 13.7%, of total assets. This is an increase of $95,662,000 from September 30, 2009, when net worth was $1,745,485,000, or 13.9%, of total assets. The Company’s net worth increased due in part to net income of $118,653,000, less cash dividends paid of $22,450,000 on common stock. The Company paid out 19% of its 2010 earnings in cash dividends to common shareholders, compared with 43% last year. Over the long term, the Company would prefer its dividend payout ratio to be less than 50%.
Washington Federal Saving’s percentage of net worth to total assets is over three times the minimum required under Office of Thrift Supervision (OTS) regulations (see Note M). Management believes this strong net worth position will help the Company manage its interest rate risk and will enable it to compete more effectively.
During the last quarter, the Basel Committee on Banking Supervision, a consortium of international financial regulators, published proposed capital standards to be implemented in the future. The following table shows the proposed standards and the Company’s current capital position.
| Washington Federal as of 9/30/10 | Proposed Basel Requirements (2019) | Excess | ||||||||||
Tier 1 common to risk weighted assets: | 22.17 | % | 7.00 | % | 15.17 | % | ||||||
Tier 1 capital to risk weighted assets: | 22.17 | % | 8.50 | % | 13.67 | % | ||||||
Leverage ratio: | 11.67 | % | 3.00 | % | 8.67 | % | ||||||
Customer accounts increased $1,010,230,000, or 12.9%, from one year ago. As described in Note A, the Company acquired $819,528,000 of deposits from the Horizon transaction. As of September 30, 2010, the balance of these accounts had decreased by $294,059,000, or 35.9%, to $525,469,000, which was included in the $8,852,540,000 period end balance. The decrease in Horizon balances, which was anticipated by the Company, is due to the nature of the transaction and the repricing of deposits to current market rates. Excluding the $525,469,000 of Horizon accounts at September 30, 2010, balances at legacy branches increased by $484,761,000, or 6.2%, which reflects the opportunity created in the marketplace by the failure and/or merger of several large institutions throughout the Company’s footprint.
| 9 |
Table of Contents
MANAGEMENT’S DISCUSSION AND ANALYSIS OF
FINANCIAL CONDITION AND RESULTS OF OPERATIONS(CONTINUED)
The Company has a credit line with the FHLB Seattle equal to 50% of total assets, providing a substantial source of liquidity if needed. FHLB advances are collateralized as provided for in the Advances, Pledge and Security Agreement by all FHLB stock owned by the Company, deposits with the FHLB and certain mortgages or deeds of trust securing such properties as provided in the agreements with the FHLB.
The Company’s cash and cash equivalents amounted to $888,622,000 at September 30, 2010, a 78.3% increase from the cash and cash equivalents balance of $498,388,000 one year ago. This increase is primarily the result of diminished loan demand and strong deposit growth. Additionally, see “Interest Rate Risk” above and the “Statement of Cash Flows” included in the financial statements.
CHANGES IN FINANCIAL POSITION | Available-for-sale and held-to-maturity securities. The Company purchased $1,774,343,000 of securities during 2010, all of which have been classified as available-for-sale. |
The Company sold $496,024,000 of available-for-sale securities in the current year. As of September 30, 2010, the Company had net unrealized gains in its available-for-sale portfolio of $78,548,000, as compared to net unrealized gains of $86,057,000 as of September 30, 2009. The decrease in net unrealized gains was primarily a result of the repayment and sale of securities that were in gain positions during the year.
Loans receivable. Loans receivable decreased $559,727,000, or 6.2%, to $8,423,703,000 at September 30, 2010, from $8,983,430,000 one year earlier. The decrease resulted primarily from loan repayments (including prepayments) of $1,855,560,000 , which exceeded originations of $1,481,124,000 by $374,436,000. The Company’s current decision not to originate and hold in its loan portfolio 30 year fixed-rate loans at rates below 4.50%, due to the duration risk associated with such low mortgage rates, contributed to the net run off of the loan portfolio. Additionally, during the year, $222,057,000 of loans were transferred to REO. The following table shows the change in the geographic distribution by state of the gross loan portfolio from 2009 to 2010.
| 2010 | 2009 | Change | ||||||||||
Washington | 43.8 | % | 43.9 | % | -0.1 | % | ||||||
Oregon | 17.6 | 17.0 | 0.6 | % | ||||||||
Idaho | 7.0 | 7.3 | -0.3 | % | ||||||||
Arizona | 8.8 | 8.5 | 0.3 | % | ||||||||
Utah | 7.6 | 7.8 | -0.2 | % | ||||||||
New Mexico | 3.9 | 4.1 | -0.2 | % | ||||||||
Texas | 2.2 | 1.7 | 0.5 | % | ||||||||
Nevada | 1.9 | 1.7 | 0.2 | % | ||||||||
Other | 7.2 | 8.0 | -0.8 | % | ||||||||
| 100.0 | % | 100.0 | % | |||||||||
Real estate held for sale. The balance of real estate held for sale at September 30, 2010 was $188,998,000, an increase of $12,135,000 from one year ago. This increase is a result of the foreclosure of non-performing loans as discussed in the “Asset Quality” section above. The migration of problem assets from loans, to REO is to be expected and we believe is a positive sign that the Company is dealing with problem loans. At year end, the Company owned 635 properties in its REO. During 2010, the company sold 518 properties for net proceeds of $113,600,000.
Intangible assets. The Company’s intangible assets are made up of $251,653,000 of goodwill, servicing rights intangible of $1,775,000, as well as the unamortized balances of the core deposit intangible of $4,290,000 at September 30, 2010.
Customer accounts. Customer accounts at September 30, 2010 totaled $8,852,540,000 compared with $7,842,310,000 at September 30, 2009, a 12.9% increase. See “Liquidity and Capital Resources” above.
FHLB advances and other borrowings. Total borrowings decreased $213,982,000, or 7.4%, to $2,665,548,000 at September 30, 2010 as the Company chose to prepay $200 million of FHLB advances that were maturing in August 2011, that had a rate of 4.80%. This prepayment resulted in a prepayment fee of $8,150,000 and will enhance net interest income over the next three quarters. The Company chose to fund asset growth with a mix of customer accounts and stockholders’ equity. See “Interest Rate Risk” above.
| 10 | . |
Table of Contents
Contractual obligations. The following table presents, as of September 30, 2010, the Company’s significant fixed and determinable contractual obligations, within the categories described below, by payment date or contractual maturity.
| Contractual Obligations | Total | Less than 1 Year | 1 to 5 Years | Over 5 Years | ||||||||||||
| (In thousands) | ||||||||||||||||
Debt obligations (1) | $ | 2,665,548 | $ | — | $ | 1,015,548 | $ | 1,650,000 | ||||||||
Operating lease obligations | 8,397 | 2,573 | 4,938 | 886 | ||||||||||||
| $ | 2,673,945 | $ | 2,573 | $ | 1,020,486 | $ | 1,650,886 | |||||||||
| (1) | Represents final maturities of debt obligations. |
These contractual obligations, except for the operating leases, are included in the Consolidated Statements of Financial Condition. The payment amounts represent those amounts contractually due.
RESULTS OF OPERATIONS | GENERAL |
See Note P, “Selected Quarterly Financial Data (Unaudited),” which highlights the quarter-by-quarter results for the years ended September 30, 2010 and 2009.
Net income mentioned below refers to net income available to common shareholders’, which consists of net income less dividends accrued on the preferred stock that was repaid in full in May 2009.
COMPARISON OF 2010 RESULTS WITH 2009
In 2010 net income increased $77,969,000, or 191.6%, from 2009, primarily as a result of the $54,789,000 after tax gain on the acquisition of Horizon and a $38,865,000 tax benefit related to the settlement of a contingent tax liability. In addition, during the twelve months ended September 30, 2010, the Company recognized a gain on sale of available-for-sale securities of $22,409,000. Losses recognized on real estate acquired through foreclosure was $80,475,000 for the twelve months ended September 30, 2010 as compared to $16,354,000 for the fiscal year ended September 30, 2009.
Interest income on loans, covered loans and mortgage-backed securities decreased $35,886,000, or 5.2%, in 2010 due to a 1.7% decrease in the average outstanding balance, as well as a 21 basis point decrease in the weighted average yield during the year from 6.04% in 2009 to 5.83% in 2010.
Interest and dividend income on investment securities and cash equivalents increased $7,672,000, or 252.0%, in 2010 from 2009. This increase was primarily due to an increase in the average outstanding balance of investment securities, cash equivalents and FHLB stock, which increased 251.0% to $1,252,991,000.
Interest expense on customer accounts decreased 23.5% to $146,360,000 for 2010 from $191,435,000 for 2009. The decrease primarily related to a 87 basis point decrease in the average cost of customer accounts to 1.69% during the year compared to 2.56% one year ago, offset by a 15.4% increase in the average balance of customer accounts over the prior year. Interest expense on FHLB advances and other borrowings decreased to $122,741,000 in 2010 from $127,192,000 in 2009 due to a decrease in the average balance of borrowings to $2,880,322,000 during 2010 from $3,235,231,000 during 2009. Partially offsetting the decrease in the average balance of borrowings was the increase in the average cost of borrowings for the year ended September 30, 2010 to 4.26% from 3.93% for the same period one year ago
The Company recorded a $179,909,000 provision for loan losses in 2010 compared to $193,000,000 in 2009. Non-performing assets decreased by $122,590,000 over 2009. The Company had net charge-offs of $183,651,000 for the twelve months ended September 30, 2010 compared with $111,222,000 of net charge-offs for the same period one year ago. The decrease in the provision for loan losses is in response to four primary factors: first, the improvement in the amount of NPAs year-over-year; second, non-accrual loans as a percentage of total loans decreased from 4.23% at September 30, 2009, to 2.91% at September 30, 2010; third, the percentage of loans 30 days or more delinquent decreased from 4.86% at September 30, 2009, to 3.53% at September 30, 2010; and finally, the Company’s exposure in the land A&D and speculative construction portfolios, where the majority of losses have come from during this period of the cycle, has decreased from a combined 8.4% of the gross loan portfolio at September 30, 2009, to 5.4% at September 30, 2010. Management expects the provision to remain at elevated levels until NPAs and charge-offs improve measurably. Management believes the allowance for loan losses, totaling $163,094,000, is sufficient to absorb estimated losses inherent in the portfolio.
Total other income increased $101,421,000, or 533.5%, in 2010 from 2009. The year ended September 30, 2010, included an $85,608,000 gain on the acquisition of Horizon (see Note A).
Compensation expense increased $12,782,000, or 22.4%, in 2010 primarily due to the addition of Horizon employees and incentive compensation paid related to the increase in net income. Personnel, including part-time employees considered on a full-time equivalent basis, increased to 1,223 at September 30, 2010 compared to 1,105 one year ago.
| 11 |
Table of Contents
MANAGEMENT’S DISCUSSION AND ANALYSIS OF
FINANCIAL CONDITION AND RESULTS OF OPERATIONS(CONTINUED)
Occupancy expense increased $884,000, or 6.77%, during the year primarily due to the additional branches acquired in the Horizon transaction. The branch network increased to 160 offices at September 30, 2010 versus 150 offices one year ago.
FDIC insurance expense increased to $18,626,000 for 2010 from $10,688,000 in 2009 as a result of the significant increase in bank failures during the year which has depleted the FDIC fund. The FDIC has undertaken to replenish the FDIC fund through special assessments and higher insurance premiums for all insured depository institutions. Other expenses increased $3,725,000 during the year primarily related to the operating costs added from the Horizon acquisition and increased information technology spending. Operating expense for 2010 and 2009 equaled 0.98% and .87% of average assets, respectively. Despite the increase in operating expenses, the Company continues to operate as one of the most efficient financial institutions in the country.
The loss on real estate acquired through foreclosure increased from $16,354,000 in 2009 to $80,475,000 in 2010 due to the growth in balances of real estate acquired through foreclosure, combined with the resulting net loss on sale and any additional valuation adjustments of properties stemming from continued declines in real estate values.
Income tax expense decreased $23,198,000 or 84.1%, in 2010 as a result of a $38,865,000 tax benefit related to the settlement of a contingent tax liability (see Note A). The effective tax rate was 3.55% for 2010 versus 36.40% for 2009. The Company expects an effective tax rate of 36.00% going forward.
COMPARISON OF 2009 RESULTS WITH 2008
In 2009 net income decreased $21,648,000, or 34.7%, from 2008, primarily as a result of an $193,000,000 provision for loan losses which resulted from the significant decline in asset quality and higher net charge offs. In addition, the other expenses increased $19,840,000 in 2009 over the prior year, due primarily to increased FDIC insurance costs of $9,896,000, which resulted from the significant increase in bank failures during the year that necessitated replenishment of the deposit insurance fund.
In comparing operating results of 2009 versus 2008 it is important to understand that 2009 had 12 months of operating results, both income and expense, from the First Mutual acquisition; 2008 had only 8 months of operating results from the First Mutual acquisition.
Interest income on loans and mortgage-backed securities increased only $427,000, or 0.1%, in 2009 due to a 7.7% increase in the average outstanding balance of loans and mortgage-backed securities, offset by a 46 basis point decrease in the weighted average yield during the year from 6.51% in 2008 to 6.04% in 2009.
Interest and dividend income on investment securities and cash equivalents decreased $10,081,000, or 76.8%, in 2009 from 2008. This decrease was primarily due to a decrease in the weighted average rate earned on investment securities, cash equivalents and FHLB stock, which decreased 284 basis points to 0.85%. The Company’s required investment in FHLB stock, which amounted to $144,495,000 as of 2009, produced a yield of only 0.28% during the year.
Interest expense on customer accounts decreased 26.3% to $191,435,000 for 2009 from $259,769,000 for 2008. The decrease primarily related to a 131 basis point decrease in the average cost of customer accounts to 2.56% during the year compared to 3.87% one year ago, offset by a 11.5% increase in the average balance of customer accounts over the prior year. Interest expense on FHLB advances and other borrowings decreased to $127,192,000 in 2009 from $137,872,000 in 2008 due to a decrease in the average cost of borrowings for the year ended September 30, 2009 to 3.93% from 4.41% for the same period one year ago. Partially offsetting the decrease in average cost of borrowings was an increase in the average balance of borrowings to $3,235,231,000 during 2009 from $3,122,950,000 during 2008.
The Company recorded a $193,000,000 provision for loan losses in 2009 compared to $60,516,000 in 2008. The current year provision is due to the significant increase in the Company’s non-performing asset balances. Non-performing assets increased by $392,929,000 over 2008. Non-accrual loans as a percentage of total loans increased from 1.34% in 2008 to 4.23% in 2009. Economic conditions deteriorated in the primary markets served by the Company, as evidenced by an increase in unemployment, a reduction in the number of home sales and weak consumer confidence. Total delinquencies over 30 days were $456,318,000, or 4.97% of net loans at September 30, 2009 compared to $236,848,000, or 2.49% of net loans at September 30, 2008. Actual net charge-offs during 2009 were $111,222,000. Management believes the allowance for loan losses, totaling $166,836,000, is sufficient to absorb estimated losses inherent in the portfolio.
Total other income increased $78,200,000, or 132.1%, in 2009 from 2008. The increase in 2009 was driven primarily by the other than temporary impairment (“OTTI”) charge of $87,747,000 in the prior year. Additionally in 2008, the Company reported $13,123,000 of gain on the sale of real estate.
Compensation expense increased $4,265,000, or 8.1%, in 2009 primarily due to full year of operations combined with First Mutual. Personnel, including part-time employees considered on a full-time equivalent basis, increased to 1,105 at September 30, 2009 compared to 1,095 one year ago.
| 12 | . |
Table of Contents
Occupancy expense increased $1,836,000, or 16.4%, during the year primarily due to the 12 additional branches acquired in the First Mutual transaction. The branch network increased to 150 offices at September 30, 2009 versus 148 offices one year ago.
FDIC insurance expense increased to $9,896,000 for 2009 from $792,000 in 2008 as a result of the significant increase in bank failures during the year which has depleted the FDIC fund. The FDIC has undertaken to replenish the FDIC fund through special assessments and higher insurance premiums for all insured depository institutions. Other expenses increased $2,160,000 during the year primarily related to the operating costs added from First Mutual and increased information technology spending. Operating expense for 2009 and 2008 equaled .87% and .77% of average assets, respectively. Despite the increase in operating expenses, the Company continues to operate as one of the most efficient financial institutions in the country.
The loss on real estate acquired through foreclosure increased from $1,021,000 in 2008 to $16,354,000 in 2009 due to the growth in balances of real estate acquired through foreclosure and the resulting loss on sale of some of those properties stemming from continued declines in real estate values in the western United States.
Income tax expense decreased $5,937,000 or 17.7%, in 2009 due to a lower taxable income base. Additionally, 2009 included $1,500,000 of additional tax related to a tax liability arising from the First Mutual acquisition (see Note A). The effective tax rate was 36.40% for 2009 versus 34.96% for 2008.
PERIOD END SPREAD – AS OF THE DATE SHOWN
| Dec 31 2008 | Mar 31 2009 | Jun 30 2009 | Sep 30 2009 | Dec 31 2009 | Mar 31 2010 | Jun 30 2010 | Sep 30 2010 | |||||||||||||||||||||||||
Interest rate on loans and mortgage-backed securities | 6.22 | % | 6.17 | % | 6.12 | % | 6.04 | % | 6.00 | % | 5.97 | % | 5.89 | % | 5.75 | % | ||||||||||||||||
Interest rate on investment securities | 1.22 | 1.68 | 0.69 | 0.45 | 0.56 | 1.21 | 1.21 | 1.26 | ||||||||||||||||||||||||
Combined | 6.11 | 6.09 | 5.99 | 5.75 | 5.49 | 5.37 | 5.21 | 5.21 | ||||||||||||||||||||||||
Interest rate on customer accounts | 2.99 | 2.54 | 2.14 | 1.96 | 1.75 | 1.70 | 1.63 | 1.51 | ||||||||||||||||||||||||
Interest rate on borrowings | 3.64 | 4.08 | 4.25 | 4.25 | 4.25 | 4.19 | 4.19 | 4.14 | ||||||||||||||||||||||||
Combined | 3.20 | 2.98 | 2.72 | 2.58 | 2.41 | 2.30 | 2.25 | 2.12 | ||||||||||||||||||||||||
Interest rate spread | 2.91 | % | 3.11 | % | 3.27 | % | 3.17 | % | 3.08 | % | 3.07 | % | 2.96 | % | 3.09 | % | ||||||||||||||||
The interest rate spread decreased during 2010 from 3.17% at September 30, 2009 to 3.09% at September 30, 2010. See “Interest Rate Risk” section above.
| 13 |
Table of Contents

| Year ended September 30, | 2010 | 2009 | 2008 | 2007 | 2006 | |||||||||||||||
| (In thousands, except per share data) | ||||||||||||||||||||
Interest income | $ | 663,560 | $ | 691,774 | $ | 701,428 | $ | 618,682 | $ | 529,883 | ||||||||||
Interest expense | 269,101 | 318,627 | 397,641 | 358,501 | 273,361 | |||||||||||||||
Net interest income | 394,459 | 373,147 | 303,787 | 260,181 | 256,522 | |||||||||||||||
Provision for loan losses | 179,909 | 193,000 | 60,516 | 1,550 | 535 | |||||||||||||||
Other income | 39,955 | 2,655 | (60,212 | ) | 15,569 | 16,252 | ||||||||||||||
Other expense | 131,480 | 107,060 | 87,220 | 64,888 | 53,579 | |||||||||||||||
Income before income taxes | 123,025 | 75,742 | 95,839 | 209,312 | 218,660 | |||||||||||||||
Income taxes | 4,372 | 27,570 | 33,507 | 74,295 | 75,558 | |||||||||||||||
Net income | $ | 118,653 | $ | 48,172 | $ | 62,332 | $ | 135,017 | $ | 143,102 | ||||||||||
Preferred dividends accrued | — | 7,488 | — | — | — | |||||||||||||||
Net income available to common shareholders | $ | 118,653 | $ | 40,683 | $ | 62,332 | $ | 135,017 | $ | 143,102 | ||||||||||
Per share data | ||||||||||||||||||||
Basic earnings | $ | 1.06 | $ | 0.46 | $ | 0.71 | $ | 1.55 | $ | 1.64 | ||||||||||
Diluted earnings | 1.05 | 0.46 | 0.71 | �� | 1.54 | 1.64 | ||||||||||||||
Cash dividends | 0.20 | 0.20 | 0.84 | 0.83 | 0.81 | |||||||||||||||
| September 30, | 2010 | 2009 | 2008 | 2007 | 2006 | |||||||||||||||
Total assets | $ | 13,486,379 | $ | 12,582,475 | $ | 11,830,141 | $ | 10,285,417 | $ | 9,069,020 | ||||||||||
Loans and mortgage-backed securities | 10,626,842 | 11,266,295 | 11,053,223 | 9,601,947 | 8,457,759 | |||||||||||||||
Investment securities | 358,061 | 21,259 | 49,001 | 240,391 | 256,650 | |||||||||||||||
Cash and cash equivalents | 888,622 | 498,388 | 82,600 | 61,378 | 45,722 | |||||||||||||||
Customer accounts | 8,852,540 | 7,842,310 | 7,169,539 | 5,996,785 | 5,311,726 | |||||||||||||||
FHLB advances | 1,865,548 | 2,078,930 | 1,998,308 | 1,760,979 | 1,500,000 | |||||||||||||||
Other borrowings | 800,000 | 800,600 | 1,177,600 | 1,075,000 | 870,000 | |||||||||||||||
Stockholders’ equity | 1,841,147 | 1,745,485 | 1,332,674 | 1,318,127 | 1,262,720 | |||||||||||||||
Number of | ||||||||||||||||||||
Customer accounts | 327,430 | 305,129 | 298,926 | 281,778 | 249,533 | |||||||||||||||
Loans | 42,540 | 44,453 | 47,331 | 44,713 | 36,955 | |||||||||||||||
Offices | 160 | 150 | 148 | 135 | 123 | |||||||||||||||
| 14 | . |
Table of Contents

CONSOLIDATED STATEMENTS OF FINANCIAL CONDITION
| September 30, | 2010 | 2009 | ||||||
(In thousands, except share data) | ||||||||
ASSETS | ||||||||
Cash and cash equivalents | $ | 888,622 | $ | 498,388 | ||||
Available-for-sale securities, including encumbered securities of $933,315 and $860,655 | 2,481,093 | 2,201,083 | ||||||
Held-to-maturity securities, including encumbered securities of $60,970 and $80,717 | 80,107 | 103,042 | ||||||
Loans receivable, net | 8,423,703 | 8,983,430 | ||||||
Covered loans, net | 534,474 | — | ||||||
Interest receivable | 49,020 | 53,288 | ||||||
Premises and equipment, net | 162,721 | 133,477 | ||||||
Real estate held for sale | 188,998 | 176,863 | ||||||
Covered real estate held for sale | 44,155 | — | ||||||
FDIC indemnification asset | 131,128 | — | ||||||
FHLB stock | 151,748 | 144,495 | ||||||
Intangible assets, including goodwill of $251,653 | 257,718 | 256,797 | ||||||
Federal and state income taxes | 8,093 | — | ||||||
Other assets | 84,799 | 31,612 | ||||||
| $ | 13,486,379 | $ | 12,582,475 | |||||
LIABILITIES AND STOCKHOLDERS’ EQUITY | ||||||||
Liabilities | ||||||||
Customer accounts | ||||||||
Savings and demand accounts | $ | 8,825,918 | $ | 7,786,467 | ||||
Repurchase agreements with customers | 26,622 | 55,843 | ||||||
| 8,852,540 | 7,842,310 | |||||||
FHLB advances | 1,865,548 | 2,078,930 | ||||||
Other borrowings, primarily securities sold under agreements to repurchase | 800,000 | 800,600 | ||||||
Advance payments by borrowers for taxes and insurance | 39,504 | 38,376 | ||||||
Federal and state income taxes, including net deferred liabilities of $21,951 and $449 | — | 18,075 | ||||||
Accrued expenses and other liabilities | 87,640 | 58,699 | ||||||
| 11,645,232 | 10,836,990 | |||||||
Stockholders’ equity | ||||||||
Common stock, $1.00 par value, 300,000,000 shares authorized;129,555,956 and 129,320,072 shares issued;112,483,632 and 112,247,748 shares outstanding | 129,556 | 129,320 | ||||||
Paid-in capital | 1,578,527 | 1,574,555 | ||||||
Accumulated other comprehensive income (loss), net of tax | 49,682 | 54,431 | ||||||
Treasury stock, at cost;17,072,324 shares | (208,985 | ) | (208,985 | ) | ||||
Retained earnings | 292,367 | 196,164 | ||||||
| 1,841,147 | 1,745,485 | |||||||
| $ | 13,486,379 | $ | 12,582,475 | |||||
| SEE NOTES TO CONSOLIDATED FINANCIAL STATEMENTS | 15 |
Table of Contents

CONSOLIDATED STATEMENTS OF OPERATIONS
| Year ended September 30, | 2010 | 2009 | 2008 | |||||||||
| (In thousands, except per share data) | ||||||||||||
INTEREST INCOME | ||||||||||||
Loans | $ | 561,069 | $ | 579,244 | $ | 599,878 | ||||||
Mortgage-backed securities | 91,775 | 109,486 | 88,425 | |||||||||
Investment securities | 10,716 | 3,044 | 13,125 | |||||||||
| 663,560 | 691,774 | 701,428 | ||||||||||
INTEREST EXPENSE | ||||||||||||
Customer accounts | 146,360 | 191,435 | 259,769 | |||||||||
FHLB advances and other borrowings | 122,741 | 127,192 | 137,872 | |||||||||
| 269,101 | 318,627 | 397,641 | ||||||||||
Net interest income | 394,459 | 373,147 | 303,787 | |||||||||
Provision for loan losses | 179,909 | 193,000 | 60,516 | |||||||||
Net interest income after provision for loan losses | 214,550 | 180,147 | 243,271 | |||||||||
OTHER INCOME (LOSS) | ||||||||||||
Other than temporary impairment charge | — | — | (87,747 | ) | ||||||||
Gain on FDIC-assisted transaction | 85,608 | — | — | |||||||||
Gain on sale of investments | 22,409 | — | — | |||||||||
Gain on sale of real estate | — | — | 13,123 | |||||||||
Prepayment penalty on FHLB advance | (8,150 | ) | — | — | ||||||||
Other | 20,563 | 19,009 | 15,433 | |||||||||
| 120,430 | 19,009 | (59,191 | ) | |||||||||
OTHER EXPENSE | ||||||||||||
Compensation and fringe benefits | 69,879 | 57,097 | 52,832 | |||||||||
Amortization of intangibles | 2,140 | 3,331 | 2,441 | |||||||||
Occupancy expense | 13,933 | 13,049 | 11,213 | |||||||||
FDIC Insurance | 18,626 | 10,688 | 792 | |||||||||
Other | 28,830 | 25,105 | 22,945 | |||||||||
Deferred loan origination costs | (1,928 | ) | (2,210 | ) | (3,003 | ) | ||||||
| 131,480 | 107,060 | 87,220 | ||||||||||
Gain (loss) on real estate acquired through foreclosure, net | (80,475 | ) | (16,354 | ) | (1,021 | ) | ||||||
Income before income taxes | 123,025 | 75,742 | 95,839 | |||||||||
Income taxes | ||||||||||||
Current | (19,890 | ) | 56,075 | 81,158 | ||||||||
Deferred | 24,262 | (28,505 | ) | (47,651 | ) | |||||||
| 4,372 | 27,570 | 33,507 | ||||||||||
NET INCOME | $ | 118,653 | $ | 48,172 | $ | 62,332 | ||||||
Preferred dividends accrued | — | 7,488 | — | |||||||||
Net income available to common shareholders | $ | 118,653 | $ | 40,684 | $ | 62,332 | ||||||
PER SHARE DATA | ||||||||||||
Basic earnings per share | $ | 1.06 | $ | 0.46 | $ | 0.71 | ||||||
Diluted earnings per share | 1.05 | 0.46 | 0.71 | |||||||||
Cash dividends | 0.20 | 0.20 | 0.84 | |||||||||
Basic weighted average number of shares outstanding | 112,438,059 | 88,689,553 | 87,675,978 | |||||||||
Diluted weighted average number of shares outstanding, including dilutive stock options | 112,745,261 | 88,711,694 | 87,818,580 | |||||||||
| 16 | SEE NOTES TO CONSOLIDATED FINANCIAL STATEMENTS . |
Table of Contents

CONSOLIDATED STATEMENTS OF STOCKHOLDERS’ EQUITY
| Common Stock | Preferred Stock | Paid-in Capital | Retained Earnings | Accumulated Other Comprehensive Income (loss) | Treasury Stock | Total | ||||||||||||||||||||||
| (In thousands) | ||||||||||||||||||||||||||||
Balance at September 30, 2007 | $ | 104,921 | $ | — | $ | 1,254,490 | $ | 185,683 | $ | (13,033 | ) | $ | (213,934 | ) | $ | 1,318,127 | ||||||||||||
Comprehensive income: | ||||||||||||||||||||||||||||
Net income | 62,332 | 62,332 | ||||||||||||||||||||||||||
Other comprehensive income, | ||||||||||||||||||||||||||||
Unrealized gains on securities | 72,540 | 72,540 | ||||||||||||||||||||||||||
Reclassification adjustment | (57,035 | ) | (57,035 | ) | ||||||||||||||||||||||||
Total comprehensive income | 77,837 | |||||||||||||||||||||||||||
Dividends | (73,688 | ) | (73,688 | ) | ||||||||||||||||||||||||
Compensation expense related to common stock options | 1,286 | 1,286 | ||||||||||||||||||||||||||
Proceeds from exercise of common stock options | 146 | 2,052 | 2,198 | |||||||||||||||||||||||||
Tax benefit related to exercise of stock options | 348 | 348 | ||||||||||||||||||||||||||
Restricted stock | 26 | 769 | 795 | |||||||||||||||||||||||||
Proceeds from Employee Stock Ownership Plan | 2,087 | 3,684 | 5,771 | |||||||||||||||||||||||||
Treasury stock | — | |||||||||||||||||||||||||||
Balance at September 30, 2008 | $ | 105,093 | $ | — | $ | 1,261,032 | $ | 174,327 | $ | 2,472 | $ | (210,250 | ) | $ | 1,332,674 | |||||||||||||
Comprehensive income: | ||||||||||||||||||||||||||||
Net income | 48,172 | 48,172 | ||||||||||||||||||||||||||
Other comprehensive income, net of tax of $28,598: | ||||||||||||||||||||||||||||
Unrealized gains on securities | 51,273 | 51,273 | ||||||||||||||||||||||||||
Reclassification adjustment | 686 | 686 | ||||||||||||||||||||||||||
Total comprehensive income | 100,131 | |||||||||||||||||||||||||||
Preferred stock issuance | 197,873 | 197,873 | ||||||||||||||||||||||||||
Preferred stock discount and accretion | 2,127 | (2,127 | ) | — | ||||||||||||||||||||||||
Dividends paid on common stock | (18,847 | ) | (18,847 | ) | ||||||||||||||||||||||||
Dividends paid on preferred stock | (5,361 | ) | (5,361 | ) | ||||||||||||||||||||||||
Preferred stock redemption | (200,000 | ) | (200,000 | ) | ||||||||||||||||||||||||
Compensation expense related to common stock options | 1,327 | 1,327 | ||||||||||||||||||||||||||
Proceeds from exercise of common stock options | 13 | 145 | 158 | |||||||||||||||||||||||||
Proceeds from issuance of common stock | 24,150 | 309,027 | 333,177 | |||||||||||||||||||||||||
Tax benefit related to exercise of stock options | 22 | 22 | ||||||||||||||||||||||||||
Restricted stock | 64 | 799 | 863 | |||||||||||||||||||||||||
Issuance of Warrants | 2,127 | 2,127 | ||||||||||||||||||||||||||
Proceeds from Employee Stock Ownership Plan | 76 | 1,265 | 1,341 | |||||||||||||||||||||||||
Treasury stock | — | |||||||||||||||||||||||||||
Balance at September 30, 2009 | $ | 129,320 | $ | — | $ | 1,574,555 | $ | 196,164 | $ | 54,431 | $ | (208,985 | ) | $ | 1,745,485 | |||||||||||||
Comprehensive income: | ||||||||||||||||||||||||||||
Net income | 118,653 | 118,653 | ||||||||||||||||||||||||||
Other comprehensive income, | ||||||||||||||||||||||||||||
Unrealized losses on securities | (19,203 | ) | (19,203 | ) | ||||||||||||||||||||||||
Reclassification adjustment | 14,454 | 14,454 | ||||||||||||||||||||||||||
Total comprehensive income | 113,904 | |||||||||||||||||||||||||||
Dividends paid on common stock | (22,450 | ) | (22,450 | ) | ||||||||||||||||||||||||
Compensation expense related to common stock options | 1,213 | 1,213 | ||||||||||||||||||||||||||
Proceeds from exercise of common stock options | 145 | 1,614 | 1,759 | |||||||||||||||||||||||||
Tax benefit related to exercise of stock options | 181 | 181 | ||||||||||||||||||||||||||
Restricted stock | 91 | 964 | 1,055 | |||||||||||||||||||||||||
Treasury stock | — | |||||||||||||||||||||||||||
Balance at September 30, 2010 | $ | 129,556 | $ | — | $ | 1,578,527 | $ | 292,367 | $ | 49,682 | $ | (208,985 | ) | $ | 1,841,147 | |||||||||||||
| SEE NOTES TO CONSOLIDATED FINANCIAL STATEMENTS | 17 |
Table of Contents

CONSOLIDATED STATEMENTS OF CASH FLOWS
| Year ended September 30, | 2010 | 2009 | 2008 | |||||||||
| (In thousands) | ||||||||||||
CASH FLOWS FROM OPERATING ACTIVITIES | ||||||||||||
Net income | $ | 118,653 | $ | 48,172 | $ | 62,332 | ||||||
Adjustments to reconcile net income to net cash provided by operating activities | ||||||||||||
Amortization (accretion) of fees, discounts, premiums and intangible assets, net | 21,624 | 4,813 | 2,951 | |||||||||
Decrease in FDIC indemnification asset | 92,551 | — | — | |||||||||
Depreciation | 5,766 | 5,153 | 4,281 | |||||||||
Stock option compensation expense | 1,213 | 1,327 | 1,286 | |||||||||
Provision for (reversal of) loan losses | 179,909 | 193,000 | 60,516 | |||||||||
Loss (gain) on investment securities and real estate held for sale, net | 58,066 | 15,101 | (12,655 | ) | ||||||||
Gain on FDIC-assisted transaction | (85,608 | ) | — | — | ||||||||
Other than temporary impairment | — | — | 87,747 | |||||||||
Decrease in accrued interest receivable | 7,999 | 1,077 | 185 | |||||||||
Decrease in income taxes payable | (23,408 | ) | (45,831 | ) | (48,910 | ) | ||||||
FHLB stock dividends | (6 | ) | (15 | ) | (103 | ) | ||||||
Decrease in other assets | (51,635 | ) | (16,156 | ) | (586 | ) | ||||||
Increase (decrease) in accrued expenses and other liabilities | (74,243 | ) | (22,399 | ) | 5,186 | |||||||
Net cash provided by operating activities | 250,881 | 184,242 | 162,230 | |||||||||
CASH FLOWS FROM INVESTING ACTIVITIES | ||||||||||||
Loans originations, net of principal collections | 281,826 | 71,509 | (497,939 | ) | ||||||||
FHLB stock redeemed | — | 394 | 748 | |||||||||
Available-for-sale securities purchased | (1,774,343 | ) | (1,175,321 | ) | (313,950 | ) | ||||||
Principal payments and maturities of available-for-sale securities | 1,052,545 | 513,218 | 240,368 | |||||||||
Available-for-sale securities sold | 496,024 | 18,453 | 72,030 | |||||||||
Principal payments and maturities of held-to-maturity securities | 23,128 | 21,691 | 13,983 | |||||||||
Net cash received from (paid for) acquisition | 111,684 | — | (166,859 | ) | ||||||||
Proceeds from sales of real estate held for sale | 129,447 | 98,822 | 39,193 | |||||||||
Premises and equipment purchased, net | (13,027 | ) | (5,273 | ) | (22,334 | ) | ||||||
Net cash provided (used) by investing activities | 307,284 | (456,507 | ) | (634,760 | ) | |||||||
CASH FLOWS FROM FINANCING ACTIVITIES | ||||||||||||
Net increase in customer accounts | 190,702 | 672,771 | 426,000 | |||||||||
Net increase (decrease) in short term borrowings | — | (377,000 | ) | 102,000 | ||||||||
Proceeds from long-term borrowings | 200,000 | 100,000 | 436,313 | |||||||||
Repayments of long-term borrowings | (539,034 | ) | (19,378 | ) | (408,821 | ) | ||||||
Proceeds from exercise of common stock options and related tax benefit | 1,940 | 180 | 2,546 | |||||||||
Dividends paid on common stock | (22,450 | ) | (18,847 | ) | (73,688 | ) | ||||||
Dividends paid on preferred stock | — | (5,361 | ) | — | ||||||||
Net proceeds from follow on stock offering | — | 333,177 | — | |||||||||
Proceeds from issuance of preferred stock and warrants | — | 200,000 | — | |||||||||
Redemption of preferred stock | — | (200,000 | ) | — | ||||||||
Proceeds from Employee Stock Ownership Plan | — | 1,341 | 5,771 | |||||||||
Treasury stock purchased, net | — | — | — | |||||||||
Increase in advance payments by borrowers for taxes and insurance | 911 | 1,170 | 3,631 | |||||||||
Net cash provided (used) by financing activities | (167,931 | ) | 688,053 | 493,752 | ||||||||
Increase in cash and cash equivalents | 390,234 | 415,788 | 21,222 | |||||||||
Cash and cash equivalents at beginning of year | 498,388 | 82,600 | 61,378 | |||||||||
Cash and cash equivalents at end of year | $ | 888,622 | $ | 498,388 | $ | 82,600 | ||||||
| 18 | SEE NOTES TO CONSOLIDATED FINANCIAL STATEMENTS . |
Table of Contents
| Year ended September 30, | 2010 | 2009 | 2008 | |||||||||
| (In thousands) | ||||||||||||
SUPPLEMENTAL DISCLOSURES OF CASH FLOW INFORMATION | ||||||||||||
Noncash investing activities | ||||||||||||
Non-covered real estate acquired through foreclosure | $ | 222,057 | $ | 254,742 | $ | 58,509 | ||||||
Covered real estate acquired through foreclosure | 34,536 | — | — | |||||||||
Cash paid during the year for | ||||||||||||
Interest | 269,478 | 325,157 | 391,209 | |||||||||
Income taxes | 27,503 | 77,761 | 83,239 | |||||||||
The following summarizes the non-cash activities related to acquisitions | ||||||||||||
Fair value of assets and intangibles acquired, including goodwill | 1,091,629 | — | (1,186,754 | ) | ||||||||
Fair value of liabilities assumed | (1,047,981 | ) | — | 1,005,769 | ||||||||
Net fair value of assets (liabilities) | $ | 43,648 | $ | — | $ | (180,985 | ) | |||||
| SEE NOTES TO CONSOLIDATED FINANCIAL STATEMENTS | 19 |
Table of Contents

NOTES TO CONSOLIDATED FINANCIAL STATEMENTS
YEARS ENDED SEPTEMBER 30, 2010, 2009 AND 2008
NOTE A | SUMMARY OF SIGNIFICANT ACCOUNTING POLICIES |
Principles of consolidation. The consolidated financial statements include the accounts of Washington Federal, Inc. (Company or Washington Federal) and its wholly owned subsidiaries. Intercompany transactions and balances have been eliminated.
Description of business. Washington Federal is a unitary thrift holding company. The Company’s principal operating subsidiary is Washington Federal Savings (“Bank”). The Company is principally engaged in the business of attracting savings deposits from the general public and investing these funds, together with borrowings and other funds, in one-to-four family residential real estate loans, multi-family real estate and commercial loans. The Company conducts its activities through a network of 160 offices located in Washington, Oregon, Idaho, Utah, Arizona, Nevada, New Mexico, and Texas.
Effective January 8, 2010, the Company acquired certain assets and liabilities, including most of the loans and deposits, of Horizon Bank, headquartered in Bellingham, Washington (“Horizon”) from the Federal Deposit Insurance Corporation (“FDIC”), as receiver for Horizon (the “Acquisition”).
Horizon operated through eighteen full-service offices, four commercial loan centers and four real estate loan centers in Washington with approximately 225 employees. The Bank acquired certain assets with a book value of $1.16 billion, including $968 million in loans and $32 million in foreclosed real estate, and selected liabilities with a book value of $1.03 billion, including $820 million in deposits. Pursuant to the purchase and assumption agreement with the FDIC, the Bank received a cash payment from the FDIC for $41 million, with an additional receivable due for $1 million. No cash, deposit premium or other consideration was paid by the Bank. The fair value of the assets received, including the FDIC indemnification asset described below, was $1.13 billion and the fair value of liabilities assumed was $1.05 billion.
The loans and foreclosed real estate purchased are covered by two loss share agreements between the FDIC and the Bank (one for single family loans and the other for all other loans and foreclosed real estate), which affords the Bank significant loss protection. Under the loss share agreements, the FDIC will cover 80% of covered loan and foreclosed real estate losses up to $536 million and 95% of losses in excess of that amount. The term for loss sharing on residential real estate loans is ten years, while the term for loss sharing on non-residential real estate loans is five years with respect to losses and eight years with respect to loss recoveries. The losses reimbursable by the FDIC are based on the book value of the relevant loan as determined by the FDIC at the date of the transaction. New loans made after that date are not covered by the loss share agreements. As a result of the loss sharing agreements with the FDIC, the Bank recorded a receivable of $228 million at the time of acquisition. To account for the transaction, the balance sheet now has three new line items, as follows:
“Covered loans” represents the loans acquired from Horizon recorded at their estimated fair market value.
“Covered real estate held for sale” represents the estimated fair market value of the repossessed real estate acquired in the transaction. The covered loans and covered real estate held for sale are collectively referred to as “covered assets”.
The “FDIC indemnification asset” represents the estimated fair value of the guarantee provided by the FDIC on the covered assets.
Loans that were classified as non-performing loans by Horizon are no longer classified as non-performing because, at acquisition, the carrying value of these loans was adjusted to reflect fair value and are covered under the FDIC loss sharing agreements. Management believes that the new book value reflects an amount that will ultimately be collected.
The loss sharing agreements with the FDIC requires the Bank to pay the FDIC a calculated “true-up” amount after ten years if cumulative losses in the portfolio of acquired loans total less than $536 million. Based on an analysis of the loan portfolio, the Company currently believes cumulative losses will be less than this threshold; therefore, a liability of $21 million has been established that represents the present value of the estimated true-up payment. Going forward, the Company will be required to estimate the present value of the true-up payment on a quarterly basis and record any adjustments through the income statement.
| 20 | . |
Table of Contents
Based on the initial purchase accounting adjustments described above, the Company recorded a pre-tax gain of $86 million related to the FDIC-assisted transaction during the 2nd quarter. The amount of the gain is equal to the excess of the fair value of the recorded assets over the fair value of liabilities assumed.
The acquisition was accounted for under the acquisition method of accounting. The purchased assets, assumed liabilities and identifiable intangible asset were recorded at their respective acquisition date fair values. In many cases the determination of these fair values required management to make estimates about discount rates, future expected cash flows, market conditions and other future events that are highly subjective in nature and subject to change. These fair value estimates are preliminary and subject to refinement for up to one year after the closing date of the acquisition as additional information regarding the closing date fair value becomes available.
The operating results for the period ended September 30, 2010 include the results of the acquired assets and liabilities for the period from January 8, 2010 through September 30, 2010. Accretion and amortization of various purchase accounting discounts and premiums were recorded in the period ending September 30, 2010 and are included in other income and other expense.
In determining the acquisition date fair value of acquired loans, and in subsequent accounting, the Company generally aggregates acquired loans into pools of loans with common risk characteristics. Expected cash flows at the acquisition date in excess of the fair value of loans are recorded as interest income over the life of the loans using a level yield method if the timing and amount of the future cash flows of the pool is reasonably estimable. Subsequent to the acquisition date, increases in cash flows over those expected at the acquisition date are recognized as interest income prospectively. Decreases in expected cash flows after the acquisition date are recognized by recording an allowance for loan losses. For loans without evidence of prior credit deterioration, revenue is recognized based on contractual cash flows using the level yield method.
The net assets acquired and the resulting bargain purchase gain is presented in the following table:
| Received from FDIC | Fair Value Adjustments | Recorded by WFSL (1) | ||||||||||
| (In thousands) | ||||||||||||
Assets: | ||||||||||||
Cash and cash equivalents | $ | 70,870 | $ | — | $ | 70,870 | ||||||
Available-for-sale securities | 62,341 | 4 | 62,345 | |||||||||
Loans receivable, net | 968,434 | (297,051 | ) | 671,383 | ||||||||
Interest receivable | 3,731 | — | 3,731 | |||||||||
Premises and equipment, net | 21,983 | — | 21,983 | |||||||||
Real estate held for sale | 32,150 | (2,949 | ) | 29,201 | ||||||||
FDIC indemnification asset, net | — | 227,500 | 227,500 | |||||||||
Intangible assets, net | — | 3,064 | 3,064 | |||||||||
Other assets | 1,552 | 0 | 1,552 | |||||||||
Total assets | 1,161,061 | (69,432 | ) | 1,091,629 | ||||||||
Liabilities: | ||||||||||||
Customer accounts | 819,528 | — | 819,528 | |||||||||
FHLB advances | 124,546 | 506 | 125,052 | |||||||||
Advances by borrowers | 217 | — | 217 | |||||||||
Other liabilities | 81,737 | 21,447 | 103,184 | |||||||||
Total liabilities | 1,026,028 | 21,953 | 1,047,981 | |||||||||
Net assets acquired | $ | 135,033 | $ | (91,385 | ) | $ | 43,648 | |||||
Aggregate fair value adjustments | $ | (91,385 | ) | |||||||||
Net assets acquired | $ | 43,648 | ||||||||||
Cash received from FDIC | 40,814 | |||||||||||
Receivable due from FDIC | 1,146 | |||||||||||
Pre-tax gain on Horizon acquistion | $ | 85,608 | ||||||||||
| (1) | As of January 8, 2010 |
| 21 |
Table of Contents
NOTES TO CONSOLIDATED FINANCIAL STATEMENTS(CONTINUED)
The following methods and assumptions were used to estimate the fair value of significant assets and liabilities presented above:
Cash and cash equivalents – Due to the short term nature of these instruments, the carrying amount is estimated to approximate fair value.
Available for sale securities – Fair values for securities are based on quoted market prices.
Loans – Fair values for loans were based on a discounted cash flow methodology that considered factors including the type of loan and related collateral, classification status, fixed or variable interest rate, term of loan and whether or not the loan was amortizing, and current discount rates. Loans were grouped together according to similar characteristics and were aggregated when applying various valuation techniques. The discount rates used for loans are based on current market rates for new originations as well as an add-on uncertainty premium due to the nature of the loans (i.e. failed bank loans and illiquidity of certain loans).
Real estate held for sale – Real estate held for sale is presented at the estimated present value that management expects to receive upon sale, net of the related costs to sell.
FDIC indemnification asset and related clawback – Fair value was estimated using projected cash flows related to the loss sharing agreements based on the expected reimbursements for losses and the applicable loss sharing percentages. The clawback is recorded on the Consolidated Statements of Financial Condition in other liabilities.
Core deposit intangible – Fair value was estimated based on a discounted cash flow methodology that gave consideration to expected customer attrition rates, cost of the deposit base and the net servicing costs attributable to the customer deposits.
On February 1, 2008, the Company acquired 100% of the outstanding shares of First Mutual. The merger agreement provided for the merger of First Mutual with and into the Company, followed by the merger of First Mutual Bank, a state savings bank and wholly owned subsidiary of First Mutual, into the Company’s wholly owned subsidiary, Washington Federal. As a result of the acquisition, Washington Federal added 169 employees and 12 branches primarily located on the rapidly growing eastside of Seattle. The acquisition was accounted for as a purchase transaction with the total cash consideration funded through internal sources. As of February 1, 2008, the fair value of First Mutual’s assets and liabilities prior to the acquisition were: loans $933 million, investments $24 million, cash $14 million, property $35 million, other assets $29 million, deposits $744 million, borrowings $209 million and other liabilities $14 million. The purchase price was $219,849,000, which included $180,985,000 paid in cash as well as $38,864,000 of assumed liabilities (see related discussion in the following paragraph). The purchase price has been allocated to the underlying assets and liabilities based on estimated fair values at the date of acquisition. Results of operations are included from the date of acquisition. The Company acquired assets with an estimated fair value of $1,186,754,000 and assumed liabilities with an estimated fair value of $1,005,769,000. The acquisition produced goodwill of $149,246,000 and a core deposit intangible of $2,523,000.
During the quarter ended June 30, 2009, the Company became aware of a tax liability of $39 million resulting from the acquisition of First Mutual, Inc. in February 2008. Although substantial uncertainty existed as to the ultimate outcome of this matter, U.S. accounting rules required the Company to record an income tax liability, with a corresponding increase to goodwill, in purchase accounting. During the quarter ended March 31, 2010, the Company resolved the matter with the IRS, resulting in the $38,865,000 being recognized as a tax benefit in the consolidated statement of operations in the current year.
| 22 | . |
Table of Contents
The balance of the Company’s intangible assets was as follows, which includes the additional goodwill discussed above:
| Goodwill | Servicing Rights Intangible | Core Deposit Intangible | Total | |||||||||||||
| (In thousands) | ||||||||||||||||
Balance at September 30, 2008 | $ | 251,653 | $ | 3,584 | $ | 4,921 | $ | 260,158 | ||||||||
Additions | — | — | — | — | ||||||||||||
Accumulated amortization | — | (1,115 | ) | (2,246 | ) | (3,361 | ) | |||||||||
Balance at September 30, 2009 | 251,653 | 2,469 | 2,675 | 256,797 | ||||||||||||
Horizon acquisition | — | — | 3,064 | 3,064 | ||||||||||||
Additions | — | — | — | — | ||||||||||||
Accumulated amortization | — | (694 | ) | (1,449 | ) | (2,143 | ) | |||||||||
Balance at September 30, 2010 | $ | 251,653 | $ | 1,775 | $ | 4,290 | $ | 257,718 | ||||||||
The Company’s fiscal year end is September 30th. All references to 2010, 2009 and 2008 represent balances as of September 30, 2010, September 30, 2009 and September 30, 2008, or activity for the fiscal years then ended. References to net income in this document refer to net income available to common shareholders.
Cash and cash equivalents. Cash and cash equivalents include cash on hand, amounts due from banks, overnight investments and repurchase agreements with an initial maturity of three months or less.
Investments and mortgage-backed securities. The Company accounts for investments and mortgage-backed securities in two categories: held-to-maturity and available-for-sale.
Held-to-maturity securities – Securities classified as held-to-maturity are accounted for at amortized cost, but the Company must have both the positive intent and the ability to hold those securities to maturity. There are very limited circumstances under which securities in the held-to-maturity category can be sold without jeopardizing the cost basis of accounting for the remainder of the securities in this category.
Available-for-sale securities – Securities not classified as held-to-maturity are considered to be available-for-sale. Gains and losses realized on the sale of these securities are based on the specific identification method. Unrealized gains and losses for available-for-sale securities are excluded from earnings and reported as a net amount in the accumulated other comprehensive income component of stockholders’ equity.
Management evaluates debt and equity securities for other than temporary impairment on a quarterly basis based on the securities’ current credit quality, interest rates, term to maturity and management’s intent and ability to hold the securities until the net book value is recovered. Any other than temporary declines in fair value are recognized in the statements of operations.
Premiums and discounts on investments are deferred and recognized over the life of the asset using the effective interest method.
Realized gains and losses on securities sold as well as other than temporary impairment charges are shown on the Consolidated Statements of Operations under the Other Income (Loss) heading.
Loans receivable. Loans receivable more than 90 days past due are placed on non-accrual status and an allowance for accrued interest is established. Any interest ultimately collected is credited to income in the period of recovery.
The Company maintains an allowance for loan losses to absorb losses inherent in the loan portfolio. The allowance is based on ongoing, quarterly assessments of the probable and estimable losses inherent in the loan portfolio. The Company’s methodology for assessing the appropriateness of the allowance consists of two components, which include the general allowance and specific allowances.
The general loan loss allowance is established by applying a loss percentage factor to the different loan types. The allowances are provided based on Management’s continuing evaluation of the pertinent factors underlying the quality of the loan portfolio, including changes in the size and composition of the loan portfolio, actual loan loss experience, current economic conditions, collateral values, geo-
| 23 |
Table of Contents
NOTES TO CONSOLIDATED FINANCIAL STATEMENTS(CONTINUED)
graphic concentrations, seasoning of the loan portfolio, specific industry conditions, and the duration of the current business cycle. The recovery of the carrying value of loans is susceptible to future market conditions beyond the Company’s control, which may result in losses or recoveries differing from those provided. |
Specific allowances are established for loans which are individually evaluated, in cases where Management has identified significant conditions or circumstances related to a loan that Management believes indicate the probability that a loss has been incurred.
Loans for commercial purposes, including multi-family loans, builder construction loans and commercial loans are reviewed on an individual basis to assess the ability of the borrowers to continue to service all of their principal and interest obligations. If a loan shows signs of weakness, it is downgraded and, if warranted, placed on non-accrual status. The Company has an asset quality review function that reports the results of its internal reviews to the Board of Directors on a quarterly basis.
Impaired loans consist of loans receivable that are not expected to be repaid in accordance with their contractual terms and are measured using the fair value of the collateral. Smaller balance loans are excluded from this analysis.
Premises and equipment. Premises and equipment are stated at cost, less accumulated depreciation. Depreciation is computed on the straight-line method over the estimated useful lives of the respective assets. Expenditures are capitalized for betterments and major renewals. Charges for ordinary maintenance and repairs are expensed to operations as incurred.
Real estate held for sale. Properties acquired in settlement of loans or acquired for development are recorded at the lower of cost or fair value less selling costs. Subsequent declines in valuation are recorded as additional expense in gain (loss) on real estate acquired through foreclosure line item.
Intangible assets. Goodwill represents the excess of the cost of businesses acquired over the fair value of the net assets acquired. The core deposit intangibles and non-compete agreement intangible are acquired assets that lack physical substance but can be distinguished from goodwill. Goodwill is evaluated for impairment on an annual basis. Other intangible assets are amortized over their estimated lives and are subject to impairment testing when events or circumstances change. If circumstances indicate that the carrying value of the assets may not be recoverable, an impairment charge could be recorded. No impairment of intangible assets has ever been identified. The Company amortizes the two core deposit intangibles on a straight line basis over their estimated lives of 7 and 8 years; the non-compete agreement intangible, which was fully amortized as of September 30, 2009, was amortized on a straight-line basis over its life of five years.
The table below presents the estimated core deposit intangible asset amortization expense for the next five years:
| Year ended September 30, | Amortization expense | |||
| (In thousands) | ||||
2011 | $ | 918 | ||
2012 | 918 | |||
2013 | 918 | |||
2014 | 918 | |||
2015 | 618 | |||
Deferred fees and discounts on loans. Loan discounts and loan fees are deferred and recognized over the life of the loans using the effective interest method.
Accounting for stock-based compensation. The Company records an expense for the estimated fair value of equity awards over the vesting period. See Note L for additional information. Stock options that were not dilutive but were outstanding as of September 30, 2010, 2009 and 2008 were 1,941,633, 2,401,764 and 2,091,440, respectively.
Use of estimates. The preparation of financial statements in conformity with accounting principles generally accepted in the United States of America requires Management to make estimates and assumptions that affect the reported amounts of assets and liabilities and disclosure of contingent assets and liabilities at the date of the financial statements and the reported amounts of revenues and expenses during the reporting period. Significant estimates reported in the financial statements include the allowance for loan losses, intangible assets, deferred taxes and contingent liabilities. Actual results could differ from these estimates.
| 24 | . |
Table of Contents
New accounting pronouncements. In June 2009, the Financial Accounting Standards Board (“FASB”) issued Accounting Standards Codification (“ASC”) 860-10, Transfers and Servicing. The objective of this guidance is to improve the relevance and comparability of the information that a reporting entity provides in its financial statements about a transfer of financial assets; the effects of a transfer on its financial position, financial performance, and cash flows; and the transferor’s continuing involvement, if any, in transferred financial assets. This guidance was effective for financial asset transfers occurring after December 31, 2009. The adoption of this guidance was not material to the Company’s consolidated financial statements.
In June 2009, the FASB issued ASC 810-10, Consolidation. The objective of this guidance is to improve financial reporting by entities involved with variable interest entities and to provide more relevant and reliable information to users of financial statements. This guidance was effective as of January 1, 2010. The adoption of this guidance was not material to the Company’s consolidated financial statements.
In January 2010, the FASB issued Accounting Standards Update 2010-06, Improving Disclosures about Fair Value Measurements. For assets and liabilities measured at fair value on a recurring basis in periods after initial recognition, the new guidance requires an entity to disclose the amounts of significant transfers between Levels 1 and 2, and transfers into and out of Level 3, of the fair value hierarchy, and the reasons for those transfers. The new guidance requires a gross presentation of purchases and sales of Level 3 activities, and also clarifies existing fair value disclosures about the level of disaggregation and about inputs and valuation techniques used to measure fair value. The guidance was effective for the Company as of January 1, 2010, with the exception of the requirement for increased disaggregation of Level 3 activities, which, if applicable, is effective on January 1, 2011. See Note Q for new disclosures.
In April 2010, the FASB issued Accounting Standards Update 2010-18, Effect of a Loan Modification When the Loan is Part of a Pool that is Accounted for as a Single Asset – a consensus of the FASB Emerging Issues Task Force. Diversity in practice has developed on whether a loan that is part of a pool of loans accounted for as a single asset should be removed from that pool upon a modification that would constitute a troubled debt restructuring. The objective of this guidance is to address the diversity in practice regarding such modifications. This guidance will be effective for modifications of loans accounted for within a pool that occur during the period ending September 30, 2010 and thereafter. The adoption of this guidance was not expected to be material to the Company’s consolidated financial statements.
Business segments. As the Company manages its business and operations on a consolidated basis, management has determined that there is one reportable business segment.
Reclassifications. Certain reclassifications have been made to the financial statements for years prior to September 30, 2010 to conform to current year classifications.
| 25 |
Table of Contents
NOTES TO CONSOLIDATED FINANCIAL STATEMENTS(CONTINUED)
NOTE B | INVESTMENT SECURITIES |
| September 30, | 2010 | |||||||||||||||||||
| Amortized Cost | Gross Unrealized | Fair Value | Yield | |||||||||||||||||
| Gains | Losses | |||||||||||||||||||
| (In thousands) | ||||||||||||||||||||
Available-for-sale securities | ||||||||||||||||||||
U.S. government and agency securities due | ||||||||||||||||||||
Within 1 year | $ | 500 | $ | 26 | $ | — | $ | 526 | 4.00 | % | ||||||||||
1 to 5 years | 25,000 | 180 | — | 25,180 | 3.25 | % | ||||||||||||||
5 to 10 years | 158,915 | 5,344 | (105 | ) | 164,154 | 3.59 | % | |||||||||||||
Over 10 years | 150,000 | 1,161 | (15 | ) | 151,146 | 3.50 | % | |||||||||||||
Corporate Bonds due | ||||||||||||||||||||
5 to 10 years | 10,000 | — | — | 10,000 | 6.00 | % | ||||||||||||||
Mortgage-Backed Securities | ||||||||||||||||||||
Agency pass-through certificates | 2,058,130 | 72,853 | (896 | ) | 2,130,087 | 5.26 | % | |||||||||||||
| 2,402,545 | 79,564 | (1,016 | ) | 2,481,093 | 5.02 | % | ||||||||||||||
Held-to-maturity securities | ||||||||||||||||||||
Tax-exempt municipal bonds due | ||||||||||||||||||||
1 to 5 years | 1,105 | 65 | — | 1,170 | 6.11 | % | ||||||||||||||
5 to 10 years | 1,940 | 115 | — | 2,055 | 5.67 | % | ||||||||||||||
Over 10 years | 4,010 | 34 | — | 4,044 | 5.60 | % | ||||||||||||||
U.S. government and agency securities due | ||||||||||||||||||||
1 to 5 years | — | — | — | — | 0.00 | % | ||||||||||||||
Mortgage-Backed Securities | ||||||||||||||||||||
Agency pass-through certificates | 73,052 | 4,579 | — | 77,631 | 5.59 | % | ||||||||||||||
| 80,107 | 4,793 | — | 84,900 | 5.60 | % | |||||||||||||||
| $ | 2,482,652 | $ | 84,357 | $ | (1,016 | ) | $ | 2,565,993 | 5.04 | % | ||||||||||
| September 30, | 2009 | |||||||||||||||||||
| Amortized Cost | Gross Unrealized | Fair Value | Yield | |||||||||||||||||
| Gains | Losses | |||||||||||||||||||
| (In thousands) | ||||||||||||||||||||
Available-for-sale securities | ||||||||||||||||||||
U.S. government and agency securities due | ||||||||||||||||||||
Within 1 year | $ | 500 | $ | 15 | $ | — | $ | 515 | 4.00 | % | ||||||||||
1 to 5 years | — | — | — | — | 0.00 | % | ||||||||||||||
5 to 10 years | 9,300 | 4,009 | — | 13,309 | 10.38 | % | ||||||||||||||
Over 10 years | — | — | — | — | 0.00 | % | ||||||||||||||
Mortgage-Backed Securities | ||||||||||||||||||||
Agency pass-through certificates | 2,105,227 | 82,041 | (9 | ) | 2,187,259 | 5.77 | % | |||||||||||||
| 2,115,027 | 86,065 | (9 | ) | 2,201,083 | 5.79 | % | ||||||||||||||
Held-to-maturity securities | ||||||||||||||||||||
Tax-exempt municipal bonds due | ||||||||||||||||||||
1 to 5 years | 1,140 | 100 | — | 1,240 | 6.60 | % | ||||||||||||||
5 to 10 years | — | — | — | — | 0.00 | % | ||||||||||||||
Over 10 years | 6,295 | 445 | — | 6,740 | 5.72 | % | ||||||||||||||
U.S. government and agency securities due | ||||||||||||||||||||
1 to 5 years | — | — | — | — | 0.00 | % | ||||||||||||||
Mortgage-Backed Securities | ||||||||||||||||||||
Agency pass-through certificates | 95,607 | 3,676 | — | 99,283 | 5.57 | % | ||||||||||||||
| 103,042 | 4,221 | — | 107,263 | 5.59 | % | |||||||||||||||
| $ | 2,218,069 | $ | 90,286 | $ | (9 | ) | $ | 2,308,346 | 5.78 | % | ||||||||||
| 26 | . |
Table of Contents
$496,024,000 of available-for-sale securities were sold in 2010, resulting in a gain of $22,409,000. $18,453,000 of available-for-sale securities were sold in 2009, resulting in a net gain of $1,063,000. $72,030,000 of available-for-sale securities were sold in 2008, resulting in no gain.
Substantially all mortgage-backed securities have contractual due dates that exceed 10 years.
The following table shows the unrealized gross losses and fair value of securities at September 30, 2010, by length of time that individual securities in each category have been in a continuous loss position. The Company had $718,000 in fair value of securities in a continuous loss position for 12 or more months at September 30, 2010, which consisted of mortgage-backed securities. Management believes that the declines in fair value of these investments are not an other than temporary impairment.
| As of September 30, | 2010 | |||||||||||||||||||||||
| Less than 12 months | 12 months or more | Total | ||||||||||||||||||||||
| Unrealized Gross Losses | Fair Value | Unrealized Gross Losses | Fair Value | Unrealized Gross Losses | Fair Value | |||||||||||||||||||
| (In thousands) | ||||||||||||||||||||||||
U.S. agency securities | $ | (120 | ) | $ | 149,496 | $ | — | $ | — | $ | (120 | ) | $ | 149,496 | ||||||||||
Agency pass-through certificates | (881 | ) | 241,927 | (15 | ) | 718 | (896 | ) | 242,645 | |||||||||||||||
| $ | (1,001 | ) | $ | 391,423 | $ | (15 | ) | $ | 718 | $ | (1,016 | ) | $ | 392,141 | ||||||||||
NOTE C | LOANS RECEIVABLE (EXCLUDING COVERED LOANS) |
| September 30, | 2010 | 2009 | ||||||
| (In thousands) | ||||||||
Conventional real estate | ||||||||
Single-family residential | $ | 6,551,837 | $ | 6,785,723 | ||||
Construction – speculative | 169,712 | 267,430 | ||||||
Construction – custom | 256,384 | 258,839 | ||||||
Land – acquisition & development | 307,230 | 519,130 | ||||||
Land – lot loans | 186,840 | 195,812 | ||||||
Multi-family | 697,351 | 705,212 | ||||||
Commercial Real Estate | 315,915 | 294,109 | ||||||
Commercial and Industrial | 83,070 | 119,019 | ||||||
HELOC | 116,143 | 122,184 | ||||||
Consumer | 92,624 | 120,081 | ||||||
| 8,777,106 | 9,387,539 | |||||||
Less | ||||||||
Allowance for possible losses | 163,094 | 166,836 | ||||||
Loans in process | 154,171 | 200,919 | ||||||
Deferred loan origination fees, net | 36,138 | 36,354 | ||||||
| 353,403 | 404,109 | |||||||
| $ | 8,423,703 | $ | 8,983,430 | |||||
The Company originates fixed and adjustable interest rate loans, which at September 30, 2010 consisted of the following:
| Fixed-Rate | Adjustable-Rate | |||||||||||||
| Term To Maturity | Book Value | Term To Rate Adjustment | Book Value | |||||||||||
| (In thousands) | (In thousands) | |||||||||||||
Within 1 year | $ | 312,736 | Less than 1 year | $ | 365,854 | |||||||||
1 to 3 years | 177,921 | 1 to 3 years | 264,475 | |||||||||||
3 to 5 years | 170,010 | 3 to 5 years | 62,010 | |||||||||||
5 to 10 years | 666,420 | 5 to 10 years | 172,229 | |||||||||||
10 to 20 years | 1,189,291 | 10 to 20 years | 22,872 | |||||||||||
Over 20 years | 5,186,131 | Over 20 years | 187,157 | |||||||||||
| $ | 7,702,509 | $ | 1,074,597 | |||||||||||
| 27 |
Table of Contents
NOTES TO CONSOLIDATED FINANCIAL STATEMENTS(CONTINUED)
At September 30, 2010 and 2009, approximately $79,871,000 and $57,124,000 of fixed-rate loan origination commitments were outstanding, respectively. Loans serviced for others at September 30, 2010 and 2009 were approximately $130,874,000 and $132,751,000, respectively.
Gross loans by geographic concentration were as follows:
| September 30, 2010 | Single Family Residential | Multi- family | Land - A & D | Land - Lot Loans | Construction - custom | Construction - Speculative | Commercial Real Estate | Commercial and Industrial | Consumer | HELOC | Total | |||||||||||||||||||||||||||||||||
| (In thousands) | ||||||||||||||||||||||||||||||||||||||||||||
Washington | $ | 2,784,261 | $ | 211,311 | $ | 165,358 | $ | 90,165 | $ | 159,249 | $ | 98,560 | $ | 214,117 | $ | 69,555 | $ | 9,824 | $ | 74,788 | $ | 3,877,188 | ||||||||||||||||||||||
Oregon | 1,063,789 | 305,250 | 32,008 | 38,057 | 39,305 | 32,158 | 13,998 | — | 4,612 | 7,565 | 1,536,742 | |||||||||||||||||||||||||||||||||
Other | 549,652 | 9,792 | 36 | 2,934 | — | — | 2,891 | 649 | 72,421 | 174 | 638,549 | |||||||||||||||||||||||||||||||||
Idaho | 515,603 | 31,261 | 17,852 | 16,807 | 9,907 | 9,850 | — | — | — | 5,064 | 606,344 | |||||||||||||||||||||||||||||||||
Arizona | 634,262 | 67,779 | 29,633 | 16,500 | 11,650 | 11,254 | — | — | — | 5,210 | 776,288 | |||||||||||||||||||||||||||||||||
Utah | 534,604 | 53,810 | 19,309 | 13,839 | 26,481 | 4,870 | — | — | — | 6,683 | 659,596 | |||||||||||||||||||||||||||||||||
New Mexico | 177,556 | 6,002 | 30,864 | 5,355 | 2,450 | 11,468 | 67,870 | 11,127 | 5,612 | 16,174 | 334,478 | |||||||||||||||||||||||||||||||||
Texas | 146,103 | 6,389 | 7,170 | 1,304 | 6,229 | 412 | 16,934 | 1,739 | 133 | 128 | 186,541 | |||||||||||||||||||||||||||||||||
Nevada | 146,007 | 5,757 | 5,000 | 1,879 | 1,113 | 1,140 | 105 | — | 22 | 357 | 161,380 | |||||||||||||||||||||||||||||||||
| $ | 6,551,837 | $ | 697,351 | $ | 307,230 | $ | 186,840 | $ | 256,384 | $ | 169,712 | $ | 315,915 | $ | 83,070 | $ | 92,624 | $ | 116,143 | $ | 8,777,106 | |||||||||||||||||||||||
PERCENTAGE BY GEOGRAPHIC AREA
|
| |||||||||||||||||||||||||||||||||||||||||||
| September 30, 2010 | Single Family Residential | Multi- family | Land - A & D | Land - Lot Loans | Construction - custom | Construction - Speculative | Commercial Real Estate | Commercial and Industrial | Consumer | HELOC | Total | |||||||||||||||||||||||||||||||||
| As % of total gross loans | ||||||||||||||||||||||||||||||||||||||||||||
Washington | 31.4% | 2.4% | 1.9% | 1.0% | 1.8% | 1.1% | 2.4% | 0.8% | 0.1% | 0.9% | 43.8% | |||||||||||||||||||||||||||||||||
Oregon | 12.1% | 3.5% | 0.4% | 0.4% | 0.4% | 0.4% | 0.2% | 0.0% | 0.1% | 0.1% | 17.6% | |||||||||||||||||||||||||||||||||
Other | 6.3% | 0.1% | 0.0% | 0.0% | 0.0% | 0.0% | 0.0% | 0.0% | 0.8% | 0.0% | 7.2% | |||||||||||||||||||||||||||||||||
Idaho | 5.9% | 0.4% | 0.2% | 0.2% | 0.1% | 0.1% | 0.0% | 0.0% | 0.0% | 0.1% | 7.0% | |||||||||||||||||||||||||||||||||
Arizona | 7.2% | 0.8% | 0.3% | 0.2% | 0.1% | 0.1% | 0.0% | 0.0% | 0.0% | 0.1% | 8.8% | |||||||||||||||||||||||||||||||||
Utah | 6.1% | 0.6% | 0.2% | 0.2% | 0.3% | 0.1% | 0.0% | 0.0% | 0.0% | 0.1% | 7.6% | |||||||||||||||||||||||||||||||||
New Mexico | 2.0% | 0.1% | 0.4% | 0.1% | 0.0% | 0.1% | 0.8% | 0.1% | 0.1% | 0.2% | 3.9% | |||||||||||||||||||||||||||||||||
Texas | 1.7% | 0.1% | 0.1% | 0.0% | 0.1% | 0.0% | 0.2% | 0.0% | 0.0% | 0.0% | 2.2% | |||||||||||||||||||||||||||||||||
Nevada | 1.7% | 0.1% | 0.1% | 0.0% | 0.0% | 0.0% | 0.0% | 0.0% | 0.0% | 0.0% | 1.9% | |||||||||||||||||||||||||||||||||
| 74.40% | 8.10% | 3.60% | 2.10% | 2.80% | 1.90% | 3.60% | 0.90% | 1.10% | 1.50% | 100.00% | ||||||||||||||||||||||||||||||||||
PERCENTAGE BY GEOGRAPHIC AREA AS A % OF EACH LOAN TYPE
|
| |||||||||||||||||||||||||||||||||||||||||||
| September 30, 2010 | Single Family Residential | Multi- family | Land - A & D | Land - Lot Loans | Construction - custom | Construction - Speculative | Commercial Real Estate | Commercial and Industrial | Consumer | HELOC | ||||||||||||||||||||||||||||||||||
| As % of total gross loans | ||||||||||||||||||||||||||||||||||||||||||||
Washington | 42.5% | 30.3% | 54.0% | 48.2% | 62.2% | 58.1% | 67.8% | 83.7% | 10.6% | 64.4% | ||||||||||||||||||||||||||||||||||
Oregon | 16.2% | 43.8% | 10.4% | 20.4% | 15.3% | 18.9% | 4.4% | 0.0% | 5.0% | 6.5% | ||||||||||||||||||||||||||||||||||
Other | 8.4% | 1.4% | 0.0% | 1.6% | 0.0% | 0.0% | 0.9% | 0.8% | 78.2% | 0.1% | ||||||||||||||||||||||||||||||||||
Idaho | 7.9% | 4.5% | 5.8% | 9.0% | 3.9% | 5.8% | 0.0% | 0.0% | 0.0% | 4.4% | ||||||||||||||||||||||||||||||||||
Arizona | 9.7% | 9.7% | 9.6% | 8.8% | 4.5% | 6.6% | 0.0% | 0.0% | 0.0% | 4.5% | ||||||||||||||||||||||||||||||||||
Utah | 8.2% | 7.7% | 6.3% | 7.4% | 10.3% | 2.9% | 0.0% | 0.0% | 0.0% | 5.8% | ||||||||||||||||||||||||||||||||||
New Mexico | 2.7% | 0.9% | 10.0% | 2.9% | 1.0% | 6.8% | 21.5% | 13.4% | 6.1% | 13.9% | ||||||||||||||||||||||||||||||||||
Texas | 2.2% | 0.9% | 2.3% | 0.7% | 2.4% | 0.2% | 5.4% | 2.1% | 0.1% | 0.1% | ||||||||||||||||||||||||||||||||||
Nevada | 2.2% | 0.8% | 1.6% | 1.0% | 0.4% | 0.7% | 0.0% | 0.0% | 0.0% | 0.3% | ||||||||||||||||||||||||||||||||||
| 100.00% | 100.00% | 100.00% | 100.00% | 100.00% | 100.00% | 100.00% | 100.00% | 100.00% | 100.00% | |||||||||||||||||||||||||||||||||||
| 28 | . |
Table of Contents
At September 30, 2010, the Company’s recorded investment in impaired loans was $489,825,000, of which $202,120,000 have allocated reserves of $65,002,000. At September 30, 2009, the Company’s recorded investment in impaired loans was $531,817,000, of which $318,543,000 had allocated reserves of $107,375,000. The average balance of impaired loans during 2010, 2009 and 2008 was $528,371,000, $442,321,000 and $82,176,000, and interest income from impaired loans was $31,279,000, $27,158,000 and $5,284,000, respectively.
The following table shows a summary of impaired loans and the allowance for loan losses:
| 9/30/2010 | 9/30/2009 | 9/30/2008 | ||||||||||
| (In thousands) | ||||||||||||
General allowance | $ | 98,092 | $ | 59,461 | $ | 56,162 | ||||||
Specific allowance | 65,002 | 107,375 | 28,896 | |||||||||
| 163,094 | 166,836 | 85,058 | ||||||||||
Total impaired loans | 489,825 | 531,817 | 134,438 | |||||||||
Impaired loans with specific reserve | (202,120 | ) | (318,543 | ) | (98,654 | ) | ||||||
Restructured loans subject to the general reserve | (215,575 | ) | (112,089 | ) | 0 | |||||||
Impaired loans without a specific reserve or general reserve | 72,130 | 101,185 | 35,784 | |||||||||
Gross non-covered loans | 8,777,106 | 9,387,539 | 9,912,672 | |||||||||
Total impaired loans | (489,825 | ) | (531,817 | ) | (134,438 | ) | ||||||
Restructured loans subject to the general reserve | 215,575 | 112,089 | 0 | |||||||||
Non-covered loans subject to general reserve (non-impaired loans and restructured loans subject to the general reserve) | $ | 8,502,856 | $ | 8,967,811 | $ | 9,778,234 | ||||||
General reserve as % of non-covered loans not evaluated individually for impairment | 1.15 | % | 0.66 | % | 0.57 | % | ||||||
The Company has increased the % of general reserves to non-covered loans in response to the deteriorating economic conditions and the elevated levels of losses that have been experienced over the last two years.
NOTE D | ALLOWANCE FOR LOSSES ON LOANS |
| Year ended September 30, | 2010 | 2009 | ||||||
| (In thousands) | ||||||||
Balance at beginning of year | $ | 166,836 | $ | 85,058 | ||||
Provision for loan losses | 179,909 | 193,000 | ||||||
Charge-offs | (187,387 | ) | (112,873 | ) | ||||
Recoveries | 3,736 | 1,651 | ||||||
Balance at end of year | $ | 163,094 | $ | 166,836 | ||||
NOTE E | INTEREST RECEIVABLE |
| September 30, | 2010 | 2009 | ||||||
| (In thousands) | ||||||||
Loans receivable | $ | 49,538 | $ | 54,908 | ||||
Allowance for uncollected interest on loans receivable | (12,189 | ) | (12,773 | ) | ||||
Mortgage-backed securities | 9,159 | 10,543 | ||||||
Investment securities | 2,512 | 610 | ||||||
| $ | 49,020 | $ | 53,288 | |||||
| 29 |
Table of Contents
NOTES TO CONSOLIDATED FINANCIAL STATEMENTS(CONTINUED)
NOTE F | PREMISES AND EQUIPMENT |
| September 30, | 2010 | 2009 | ||||||||||
| (In thousands) | ||||||||||||
| Estimated Useful Life | ||||||||||||
Land | — | $ | 76,786 | $ | 60,060 | |||||||
Buildings | 25 - 40 | 103,817 | 92,499 | |||||||||
Leasehold improvements | 7 - 15 | 5,512 | 5,512 | |||||||||
Furniture, fixtures and equipment | 2 - 10 | 26,769 | 19,863 | |||||||||
| 212,884 | 177,934 | |||||||||||
Less accumulated depreciation and amortization |
| (50,163 | ) | (44,457 | ) | |||||||
| $ | 162,721 | $ | 133,477 | |||||||||
The Company has non-cancelable operating leases for branch offices. Future minimum net rental commitments for all non-cancelable leases, including maintenance and associated costs, were as follows: $2 million for 2011, $1 million for 2012, $1 million for 2013, $2 million for 2014 and $2 million thereafter. Rental expense, including amounts paid under month-to-month cancelable leases, amounted to $3,170,000, $2,710,000 and $2,613,000 in 2010, 2009 and 2008, respectively.
NOTE G | CUSTOMER ACCOUNTS |
| September 30, | 2010 | 2009 | ||||||
| (In thousands) | ||||||||
Checking accounts, .50% and under | $ | 666,372 | $ | 526,321 | ||||
Passbook and statement accounts, .50% and under | 234,673 | 197,025 | ||||||
Insured money market accounts, .01% to .75% | 1,653,718 | 1,214,812 | ||||||
Certificate accounts | ||||||||
Less than 2.00% | 3,596,651 | 1,765,881 | ||||||
2.00% to 2.99% | 1,918,591 | 3,220,833 | ||||||
3.00% to 3.99% | 495,138 | 457,425 | ||||||
4.00% to 4.99% | 237,852 | 370,967 | ||||||
5.00% to 5.99% | 22,923 | 33,203 | ||||||
Total certificates | 6,271,155 | 5,848,309 | ||||||
Repurchase agreements with customers, .01% to 3.78% | 26,622 | 55,843 | ||||||
| $ | 8,852,540 | $ | 7,842,310 | |||||
Certificate maturities are as follows: | ||||||||
| September 30, | 2010 | 2009 | ||||||
| (In thousands) | ||||||||
Within 1 year | $ | 4,288,072 | $ | 4,732,493 | ||||
1 to 2 years | 1,168,280 | 747,839 | ||||||
2 to 3 years | 533,017 | 156,402 | ||||||
Over 3 years | 281,786 | 211,575 | ||||||
| $ | 6,271,155 | $ | 5,848,309 | |||||
| 30 | . |
Table of Contents
Customer accounts over $250,000 totaled $893,338,000 as of September 30, 2010 and $692,264,000 as of September 30, 2009.
Interest expense on customer accounts consisted of the following:
| Year ended September 30, | 2010 | 2009 | 2008 | |||||||||
Checking accounts | $ | 2,299 | $ | 3,144 | $ | 6,813 | ||||||
Passbook and statement accounts | 1,100 | 1,441 | 2,724 | |||||||||
Insured money market accounts | 12,121 | 16,488 | 25,571 | |||||||||
Certificate accounts | 130,552 | 170,001 | 224,973 | |||||||||
| 146,072 | 191,074 | 260,081 | ||||||||||
Repurchase agreements with customers | 1,015 | 1,061 | 547 | |||||||||
| 147,087 | 192,135 | 260,628 | ||||||||||
Less early withdrawal penalties | (727 | ) | (700 | ) | (859 | ) | ||||||
| $ | 146,360 | $ | 191,435 | $ | 259,769 | |||||||
Weighted average interest rate at end of year | 1.51 | % | 1.96 | % | 3.25 | % | ||||||
Weighted daily average interest rate during the year | 1.69 | % | 2.56 | % | 3.87 | % | ||||||
NOTE H | FHLB ADVANCES |
Maturity dates of FHLB advances were as follows:
| September 30, | 2010 | 2009 | ||||||
| (In thousands) | ||||||||
FHLB advances | ||||||||
Within 1 year | $ | — | $ | — | ||||
1 to 3 years | 100,000 | 428,930 | ||||||
4 to 5 years | 415,548 | 100,000 | ||||||
More than 5 years | 1,350,000 | 1,550,000 | ||||||
| $ | 1,865,548 | $ | 2,078,930 | |||||
$1,350,000,000 of the 2010 advances and $1,750,000,000 of the 2009 advances included in the above table are callable by the FHLB. If these callable advances were to be called at the earliest call dates, the maturities of all FHLB advances would be as follows:
| September 30, | 2010 | 2009 | ||||||
| (In thousands) | ||||||||
FHLB advances | ||||||||
Within 1 year | $ | 400,000 | $ | 400,000 | ||||
1 to 3 years | 875,000 | 1,028,930 | ||||||
4 to 5 years | 390,548 | 650,000 | ||||||
More than 5 years | 200,000 | — | ||||||
| $ | 1,865,548 | $ | 2,078,930 | |||||
Financial data pertaining to the weighted-average cost and the amount of FHLB advances were as follows:
| September 30, | 2010 | 2009 | 2008 | |||||||||
| (In thousands) | ||||||||||||
Weighted average interest rate at end of year | 4.24 | % | 4.39 | % | 4.45 | % | ||||||
Weighted daily average interest rate during the year | 4.46 | % | 4.23 | % | 4.65 | % | ||||||
Daily average of FHLB advances | $ | 2,070,843 | $ | 2,243,242 | $ | 2,022,596 | ||||||
Maximum amount of FHLB advances at any month end | 2,078,695 | 2,743,026 | 2,205,801 | |||||||||
Interest expense during the year | 92,402 | 94,804 | 94,048 | |||||||||
FHLB advances are collateralized as provided for in the Advances, Pledge and Security Agreement by all FHLB stock owned by the Company, deposits with the FHLB and certain mortgages or deeds of trust securing such properties as provided in the agreements with the FHLB. As a member of the
| 31 |
Table of Contents
NOTES TO CONSOLIDATED FINANCIAL STATEMENTS(CONTINUED)
FHLB of Seattle, the Company currently has a credit line of 50% of the total assets of the Company, subject to collateralization requirements. |
NOTE I | OTHER BORROWINGS |
Maturity dates of securities sold under agreements to repurchase (reverse repurchase agreements) and other borrowings were as follows:
| September 30, | 2010 | 2009 | ||||||
| (In thousands) | ||||||||
Reverse repurchase agreements and other borrowings: | ||||||||
Within 1 year | $ | — | $ | 600 | ||||
1 to 3 years | — | — | ||||||
4 to 5 years | 500,000 | — | ||||||
More than 5 years | 300,000 | 800,000 | ||||||
| $ | 800,000 | $ | 800,600 | |||||
$500,000,000 of the 2010 and 2009 reverse repurchase agreements and other borrowings included in the above table are callable by the counterparty. If these were to be called at the earliest call dates, the maturities of the reverse repurchase agreements and other borrowings would be as follows:
| September 30, | 2010 | 2009 | ||||||
| (In thousands) | ||||||||
Reverse repurchase agreements and other borrowings: | ||||||||
Within 1 year | $ | — | $ | 600 | ||||
1 to 3 years | 500,000 | 300,000 | ||||||
4 to 5 years | 200,000 | 200,000 | ||||||
More than 5 years | 100,000 | 300,000 | ||||||
| $ | 800,000 | $ | 800,600 | |||||
Other borrowings on the Consolidated Statements of Financial Condition at both September 30, 2010 and 2009 included the $800,000,000 of reverse repurchase agreements presented in the table above.
The Company enters into sales of reverse repurchase agreements. Fixed-coupon reverse repurchase agreements are treated as financings, and the obligations to repurchase securities sold are reflected as a liability in the consolidated statements of financial condition. During the three years ended September 30, 2010, all of the Company’s transactions were fixed-coupon reverse repurchase agreements. The dollar amount of securities underlying the agreements remain in the asset accounts. The securities pledged are registered in the Company’s name, and principal and interest payments are received by the Company; however, the securities are held by the designated trustee of the broker. Upon maturity of the agreements, the identical securities pledged as collateral will be returned to the Company.
Financial data pertaining to the weighted-average cost and the amount of securities sold under agreements to repurchase and other borrowings were as follows:
| September 30, | 2010 | 2009 | 2008 | |||||||||
Weighted average interest rate at end of year | 3.90 | % | 3.90 | % | 4.19 | % | ||||||
Weighted daily average interest rate during the year | 3.90 | % | 3.90 | % | 4.26 | % | ||||||
Daily average of securities sold under agreements to repurchase | $ | 800,000 | $ | 800,000 | $ | 803,825 | ||||||
Maximum securities sold under agreements to repurchase at any month end | 800,000 | 800,000 | 800,000 | |||||||||
Interest expense during the year | 29,867 | 31,061 | 34,260 | |||||||||
| 32 | . |
Table of Contents
Financial data pertaining to the weighted average cost and the amount of other borrowings were as follows:
| September 30, | 2010 | 2009 | 2008 | |||||||||
Weighted average interest rate at end of year | — | % | 5.98 | % | 2.00 | % | ||||||
Weighted daily average interest rate during the year | 4.98 | % | 0.69 | % | 3.23 | % | ||||||
Daily average of other borrowings | $ | 9,479 | $ | 191,989 | $ | 296,529 | ||||||
Maximum other borrowings at any month end | 14,310 | 240,600 | 475,000 | |||||||||
Interest expense during the year | 22 | 1,327 | 9,564 | |||||||||
NOTE J | INCOME TAXES |
The Consolidated Statements of Financial Condition at September 30, 2010 and 2009 include net deferred tax liabilities of $21,951,000 and $449,000, respectively, that have been provided for the temporary differences between the tax basis and the financial statement carrying amounts of liabilities and assets. The major sources of these temporary differences and their deferred tax effects were as follows:
| September 30, | 2010 | 2009 | ||||||
| (In thousands) | ||||||||
Deferred tax assets | ||||||||
Loan loss reserves | $ | 92,922 | $ | 89,020 | ||||
Asset Purchase Tax Basis Difference (net) | 22,738 | — | ||||||
Investment security deferred loss | — | — | ||||||
Valuation adjustment on available-for-sale securities | — | — | ||||||
Delinquent accrued interest | 4,060 | 5,320 | ||||||
Other, net | 1,361 | — | ||||||
Total deferred tax assets | 121,081 | 94,340 | ||||||
Deferred tax liabilities | ||||||||
FDIC Loss Guarantee Receivable (net) | 40,444 | — | ||||||
Federal Home Loan Bank stock dividends | 36,158 | 33,492 | ||||||
Valuation adjustment on available-for-sale securities | 28,866 | 31,626 | ||||||
Loan origination costs | 13,183 | 14,223 | ||||||
Depreciation | 21,578 | 12,544 | ||||||
Deferred gain on forward commitments | 1,225 | 1,546 | ||||||
Core deposit intangible | 1,578 | 983 | ||||||
Other, net | — | 375 | ||||||
Total deferred tax liabilities | 143,032 | 94,789 | ||||||
Net deferred tax asset (liability) | (21,951 | ) | (449 | ) | ||||
Current tax asset (liability) | 30,044 | (17,626 | ) | |||||
Net tax asset (liability) | $ | 8,093 | $ | (18,075 | ) | |||
A reconciliation of the statutory federal income tax rate to the effective income tax rate follows:
| Year ended September 30, | 2010 | 2009 | 2008 | |||||||||
Statutory income tax rate | 35 | % | 35 | % | 35 | % | ||||||
IRS tax settlement | -32 | — | — | |||||||||
Dividend received deduction | — | — | -1 | |||||||||
Other differences | -1 | -1 | -1 | |||||||||
State income tax | 2 | 2 | 2 | |||||||||
Effective income tax rate | 4 | % | 36 | % | 35 | % | ||||||
| 33 |
Table of Contents
NOTES TO CONSOLIDATED FINANCIAL STATEMENTS(CONTINUED)
A reconciliation of the beginning and ending amount of unrecognized tax benefits is as follows:
| 2010 | 2009 | |||||||
Balance at beginning of year | $ | 44,781 | $ | 43,108 | ||||
Tax positions related to current year: | ||||||||
Additions | 271 | — | ||||||
Reductions | — | — | ||||||
Tax positions related to prior years: | ||||||||
Additions | 3,064 | 1,706 | ||||||
Reductions | — | — | ||||||
Settlements with taxing authorities | (43,315 | ) | — | |||||
Lapses in statues of limitations | (908 | ) | (33 | ) | ||||
Balance at end of year | $ | 3,893 | $ | 44,781 | ||||
As of September 30, 2010 and 2009, the Company’s liability for uncertain tax positions was $2.9 million and $42.8 million, respectively. Included in the balance of unrecognized tax benefits at September 30, 2010, are $1.3 million of tax benefits that, if recognized, would affect the effective tax rate. The Company records interest and penalties related to uncertain tax positions in income tax expense. As of September 30, 2010 and 2009, there was approximately $1.2 million and $3.3 million, respectively, of accrued interest and $0.3 million and $0.3 million, respectively, of accrued penalties.
Based on current information the Company does not expect any changes in the amount of unrecognized tax benefits over the next twelve months to have a significant impact on the results of operations or the financial position of the Company.
The Company’s federal income tax returns for 2006 through 2010 are open tax years. State income tax returns are generally subject to examination for a period of three to five years after filing of the respective return. The state impact of any federal changes remains subject to examination by various states for a period of up to two years after formal notification to the states. The Company has various federal and state income tax returns in the process of examination, administrative appeals or litigation. The Company’s unrecognized tax benefits are related to state returns open from 1999 through 2009.
The Company has been examined by the Internal Revenue Service through the year ended September 30, 1990. There were no material changes made to the Company’s originally reported taxable income as a result of this examination.
NOTE K | 401(k) AND EMPLOYEE STOCK OWNERSHIP PLAN |
The Company maintains a 401(k) and Employee Stock Ownership Plan (Plan) for the benefit of its employees. Company contributions are made semi-annually as approved by the Board of Directors. Such amounts are not in excess of amounts permitted by the Employee Retirement Income Security Act of 1974.
Plan participants may make voluntary after-tax contributions of their considered earnings as defined by the Plan. In addition, participants may make pre-tax contributions up to the statutory limits through the 401(k) provisions of the Plan. The annual addition from contributions to an individual participant’s account in this Plan cannot exceed the lesser of 100% of base salary or $49,000. Under provisions of the Plan, employees are eligible to participate on the date of hire and become fully vested in the Company’s contributions following six years of service. In August 1995 the Company received a favorable determination from the Internal Revenue Service to include an Employee Stock Ownership feature as part of the Plan. This feature allows employees to direct a portion of their vested account balance toward the purchase of Company stock. Company contributions to the Plan amounted to $4,800,000, $4,200,000 and $3,595,000 for the years ended September 30, 2010, 2009 and 2008, respectively.
| 34 | . |
Table of Contents
NOTE L | STOCK OPTION PLANS |
The Company has two equity-based compensation plans (Plans) which provide for a combination of stock options and stock grants. Option awards are granted with an exercise price equal to the market price of the Company’s stock at the date of grant; those option awards generally vest based on 5 years of continuous service and have 10-year contractual terms. The Company’s policy is to issue new shares upon option exercises. Stockholders authorized 4,480,101 shares and 4,099,480 shares of common stock, as adjusted for stock splits and stock dividends, to be reserved pursuant to the 1994 Stock Option and Stock Appreciation Rights Plan (the 1994 Plan) and the 2001 Long-Term Incentive Plan (the 2001 Plan), respectively. The two Plans are substantially similar. Of the 8,579,581 total shares authorized by stockholders under the two Plans, 2,311,410 shares remain available for issuance. Each of the Plans has been approved by the Company’s stockholders.
The fair value of options granted is estimated on the date of grant using the Black-Scholes option-pricing model. This model requires input of highly subjective assumptions, changes to which can materially affect the fair value estimate. Additionally, there may be other factors that would otherwise have a significant effect on the value of employee stock options granted but are not considered by the model. Expected volatility is based on the historical volatility of the Company’s stock. The risk-free interest rate is based on the U.S. Treasury yield curve that is in effect at the time of grant with a remaining term equal to the options’ expected life. The expected term represents the period of time that options granted are expected to be outstanding. The following weighted-average assumptions were used to estimate the fair value of options granted during the periods indicated:
| Year ended September 30, | 2010 | 2009 | 2008 | |||||||||
Annual dividend yield | 1.20 | % | 3.83 | % | 3.66 | % | ||||||
Expected volatility | 26 | % | 24 | % | 17 | % | ||||||
Risk-free interest rate | 2.20 | % | 1.73 | % | 2.48 | % | ||||||
Expected life | 4.5 years | 4.5 years | 4.5 years | |||||||||
During 2010, 2009 and 2008, the Company recognized $1,213,000, $1,327,000 and 1,286,000 of compensation cost for stock options, net of forfeitures.
A summary of option activity under the Plans as of September 30, 2010, and changes during the year then ended is as follows:
| Options | Shares | Weighted Average Exercise Price | Weighted Average Remaining Contractual Term | Aggregate (In thousands) | ||||||||||||
Outstanding at September 30, 2009 | 2,890,070 | $ | 19.75 | |||||||||||||
Granted | 72,500 | 19.13 | ||||||||||||||
Exercised | -157,191 | 12.71 | ||||||||||||||
Forfeited | -150,882 | 19.51 | ||||||||||||||
Outstanding at September 30, 2010 | 2,654,497 | $ | 20.16 | 5 | $ | 1,299 | ||||||||||
Exercisable at September 30, 2010 | 1,437,414 | $ | 20.35 | 4 | $ | 77 | ||||||||||
| The weighted average grant date fair value of options granted during the years 2010, 2009 and 2008 was $4.43, $1.60 and $2.54, respectively. The total intrinsic value of options exercised during the years ended September 30, 2010, 2009 and 2008 was $975,000, $65,000 and $1,234,000, respectively. Likewise, the total grant date fair value of options exercised during the years ended September 30, 2010, 2009 and 2008 was $482,000, $57,000 and $441,000, respectively. |
| 35 |
Table of Contents
NOTES TO CONSOLIDATED FINANCIAL STATEMENTS(CONTINUED)
| A summary of the status of the Company’s nonvested options as of September 30, 2010, and changes during the year then ended is as follows: |
| Nonvested Options | Shares | Weighted Average Grant Date Fair Value | ||||||
Outstanding at September 30, 2009 | 1,707,315 | $ | 2.76 | |||||
Granted | 72,500 | 4.43 | ||||||
Vested | -448,572 | 3.34 | ||||||
Forfeited | -114,160 | 2.61 | ||||||
Outstanding at September 30, 2010 | 1,217,083 | $ | 2.66 | |||||
| As of September 30, 2010, unrecognized compensation cost for stock options, net of forfeitures, totaled $2,087,000, which is expected to be recognized over a weighted average remaining period of 1.5 years. |
Cash received from option exercises for the years ended September 30, 2010, 2009 and 2008 was $1,760,000, $158,000 and $2,198,000, respectively. The actual tax benefit realized for the tax deductions from option exercises totaled $227,000, $21,000 and $337,000, respectively, for the years ended September 30, 2010, 2009 and 2008.
The Company also grants shares of restricted stock pursuant to its plans. These shares of restricted stock vest over a period of one to seven years. The Company has issued a total of 361,735 shares of restricted stock, with a fair market value at the date of grant of $7.0 million. As of September 30, 2010, 177,582 shares remained restricted. The Company accounts for restricted stock grants by recording the fair value of the grant to compensation expense over the vesting period. Compensation expense related to restricted stock was $1,055,000, $864,000 and $795,000 for the years ended September 30, 2010, 2009 and 2008, respectively.
NOTE M | STOCKHOLDERS’ EQUITY |
Washington Federal Savings is subject to various regulatory capital requirements administered by the Office of Thrift Supervision (OTS). Failure to meet minimum capital requirements can initiate certain mandatory and possibly additional discretionary action by regulators that, if undertaken, could have a direct material effect on the Company’s financial statements. Under capital adequacy guidelines and the regulatory framework for prompt corrective action, Washington Federal Savings must meet specific capital guidelines that involve quantitative measures of Washington Federal Savings’ assets, liabilities and certain off-balance sheet items as calculated under regulatory accounting practices. Washington Federal Savings’ capital amounts and classification are also subject to qualitative judgments by the regulators about capital components, risk-weightings and other factors. The Company and the Bank are subject to certain restrictions on the amount of dividends that they may declare without prior regulatory approval.
| �� 36 | . |
Table of Contents
| As of September 30, 2010 and 2009, the OTS categorized Washington Federal Savings as well capitalized under the regulatory framework for prompt corrective action. To be categorized as well capitalized, Washington Federal Savings must maintain minimum total risk-based, Tier 1 risk-based and Tier 1 leverage ratios as set forth in the following table. There are no conditions or events since that notification that Management believes have changed Washington Federal Savings’ categorization. |
| Actual | Capital Adequacy Guidelines | Categorized as Well Capitalized Under Prompt Corrective Action Provisions | ||||||||||||||||||||||
| Capital | Ratio | Capital | Ratio | Capital | Ratio | |||||||||||||||||||
| September 30, 2010 | (In thousands) | |||||||||||||||||||||||
Total capital to risk-weighted assets | $ | 1,619,206 | 23.39 | % | $ | 553,761 | 8.00 | % | $ | 692,201 | 10.00 | % | ||||||||||||
Tier I capital to risk-weighted assets | 1,534,681 | 22.17 | % | NA | NA | 415,321 | 6.00 | % | ||||||||||||||||
Core capital to adjusted tangible assets | 1,534,681 | 11.67 | % | NA | NA | 657,606 | 5.00 | % | ||||||||||||||||
Core capital to total assets | 1,534,681 | 11.67 | % | 394,563 | 3.00 | % | NA | NA | ||||||||||||||||
Tangible capital to tangible assets | 1,534,681 | 11.67 | % | 197,282 | 1.50 | % | NA | NA | ||||||||||||||||
September 30, 2009 | ||||||||||||||||||||||||
Total capital to risk-weighted assets | $ | 1,469,857 | 21.57 | % | $ | 545,034 | 8.00 | % | $ | 681,293 | 10.00 | % | ||||||||||||
Tier I capital to risk-weighted assets | 1,414,885 | 20.77 | % | NA | NA | 408,776 | 6.00 | % | ||||||||||||||||
Core capital to adjusted tangible assets | 1,414,885 | 11.56 | % | NA | NA | 612,094 | 5.00 | % | ||||||||||||||||
Core capital to total assets | 1,414,885 | 11.56 | % | 367,257 | 3.00 | % | NA | NA | ||||||||||||||||
Tangible capital to tangible assets | 1,414,885 | 11.56 | % | 183,628 | 1.50 | % | NA | NA | ||||||||||||||||
On November 14, 2008, the Company entered into a Letter Agreement with the United States Department of the Treasury (“Treasury”) to participate in the Troubled Asset Relief Program Capital Purchase Program (“CPP”). Pursuant to the Agreement, the Company issued and sold to the Treasury (i) 200,000 shares of the Company’s Fixed Rate Cumulative Perpetual Preferred Stock, and (ii) a warrant to purchase 1,707,456 shares of the Company’s common stock, par value $1.00 per share, for an aggregate purchase price for both the preferred stock and warrants of $200 million in cash. The Preferred Stock qualified as Tier 1 capital and paid cumulative dividends at a rate of 5% per annum for the first five years, and 9% per annum thereafter. On May 27, 2009, the Company repurchased the $200 million of preferred stock. The Company decided not to repurchase the 1.7 million warrants issued in conjunction with the preferred stock at this time. The Treasury has sold all of the warrants.
On September 15, 2009, the Company issued additional common stock in a follow on offering for the first time since going public in 1982. Net proceeds received totaled $333,176,688 upon the issuance of 24,150,000 additional common shares. The use of the proceeds from this offering will be used for general corporate purposes, which may include capital to support growth and acquisition opportunities.
At periodic intervals, the OTS and the Federal Deposit Insurance Corporation (FDIC) routinely examine the Company’s financial statements as part of their oversight of the savings and loan industry. Based on their examinations, these regulators can direct that the Company’s financial statements be adjusted in accordance with their findings. The extent to which forthcoming regulatory examinations may result in adjustments to the financial statements cannot be determined; however, no adjustments were proposed as a result of the most recent OTS examination which concluded in February 2010.
The Company has an ongoing stock repurchase program. No shares were repurchased during 2010 or 2009. As of September 30, 2010, Management had authorization from the Board of Directors to repurchase up to 2.9 million additional shares.
| 37 |
Table of Contents
NOTES TO CONSOLIDATED FINANCIAL STATEMENTS(CONTINUED)
NOTE N | FAIR VALUES OF FINANCIAL INSTRUMENTS |
U.S. GAAP requires disclosure of fair value information about financial instruments, whether or not recognized on the statement of financial condition, for which it is practicable to estimate those values. Certain financial instruments and all non-financial instruments are excluded from the disclosure requirements. Accordingly, the aggregate fair value estimates presented do not reflect the underlying fair value of the Company. Although Management is not aware of any factors that would materially affect the estimated fair value amounts presented, such amounts have not been comprehensively revalued for purposes of these financial statements since that date, and therefore, estimates of fair value subsequent to that date may differ significantly from the amounts presented below.
| 2010 | 2009 | |||||||||||||||
Carrying Amount | Estimated Fair Value | Carrying Amount | Estimated Fair Value | |||||||||||||
| (In thousands) | ||||||||||||||||
Financial assets | ||||||||||||||||
Cash and cash equivalents | $ | 888,622 | $ | 888,622 | $ | 498,388 | $ | 498,388 | ||||||||
Available-for-sale securities: | ||||||||||||||||
Equity securities | — | — | — | — | ||||||||||||
Obligations of U.S. government | 341,006 | 341,006 | 13,824 | 13,824 | ||||||||||||
Obligations of states and political subdivisions | — | — | — | — | ||||||||||||
Obligations of foreign governments | — | — | — | — | ||||||||||||
Corporate debt securities | 10,000 | 10,000 | — | — | ||||||||||||
Mortgage-backed securities | ||||||||||||||||
Agency pass-through certificates | 2,130,087 | 2,130,087 | 2,187,259 | 2,187,259 | ||||||||||||
Other debt securities | — | — | — | — | ||||||||||||
Total available-for-sale securities | 2,481,093 | 2,481,093 | 2,201,083 | 2,201,083 | ||||||||||||
Held-to-maturity securities: | ||||||||||||||||
Equity securities | — | — | — | — | ||||||||||||
Obligations of U.S. government | — | — | — | — | ||||||||||||
Obligations of states and political subdivisions | 7,055 | 7,269 | 7,435 | 7,980 | ||||||||||||
Obligations of foreign governments | — | — | — | — | ||||||||||||
Corporate debt securities | — | — | — | — | ||||||||||||
Mortgage-backed securities | ||||||||||||||||
Agency pass-through certificates | 73,052 | 77,631 | 95,607 | 99,283 | ||||||||||||
Other debt securities | — | — | — | — | ||||||||||||
Total held-to-maturity securities | 80,107 | 84,900 | 103,042 | 107,263 | ||||||||||||
Loans receivable | 8,423,703 | 8,899,937 | 8,983,430 | 9,223,038 | ||||||||||||
Covered loans | 534,474 | 534,474 | — | — | ||||||||||||
FHLB stock | 151,748 | 151,748 | 144,495 | 144,495 | ||||||||||||
Financial liabilities | ||||||||||||||||
Customer accounts | 8,852,540 | 8,811,009 | 7,842,310 | 7,861,129 | ||||||||||||
FHLB advances and other borrowings | 2,665,548 | 2,965,921 | 2,879,530 | 2,968,519 | ||||||||||||
The following methods and assumptions were used to estimate the fair value of financial instruments:
Cash and cash equivalents – The carrying amount of these items is a reasonable estimate of their fair value.
Available-for-sale securities and held-to-maturity securities – The estimated fair value of all investment securities are based upon the assumptions market participants would use in pricing the security. Such assumptions may include observable and unobservable inputs such as quoted market prices, dealer quotes and discounted cash flows.
Loans receivable – For certain homogeneous categories of loans, such as fixed- and variable-rate residential mortgages, fair value is estimated using quoted market prices for securities backed by similar loans, adjusted for differences in loan characteristics. The fair value of other loan types is estimated by discounting the future cash flows and estimated prepayments using the current rates at which similar
| 38 | . |
Table of Contents
loans would be made to borrowers with similar credit ratings and for the same remaining term. Some loan types were valued at carrying value because of their floating rate or expected maturity characteristics. Net deferred loan fees is not included in the fair value calculation but is included in the carrying amount. |
Covered loans – These loans were recorded at estimated fair value on the acquisition date and at September 30, 2010, carrying value approximates fair value.
FHLB stock – The fair value is based upon the redemption value of the stock which equates to its carrying value.
Customer accounts – The fair value of demand deposits, savings accounts, and money market accounts is the amount payable on demand at the reporting date. The fair value of fixed-maturity certificates of deposit is estimated by discounting the estimated future cash flows using the rates currently offered for deposits with similar remaining maturities.
FHLB advances and other borrowings – The fair value of FHLB advances and other borrowings is estimated by discounting the estimated future cash flows using rates currently available to the Company for debt with similar remaining maturities.
NOTE O | FINANCIAL INFORMATION – WASHINGTON FEDERAL, INC. |
The following Washington Federal, Inc. (parent company only) financial information should be read in conjunction with the other notes to the Consolidated Financial Statements.
Statements of Financial Condition | ||||||||
| September 30, | 2010 | 2009 | ||||||
| (In thousands) | ||||||||
Assets | ||||||||
Cash | $ | 4,646 | $ | 39,249 | ||||
Investment in subsidiary | 1,842,081 | 1,726,113 | ||||||
Other Assets | — | 434 | ||||||
Dividend receivable | — | — | ||||||
Total assets | $ | 1,846,727 | $ | 1,765,796 | ||||
Liabilities | ||||||||
Borrowed money | $ | — | $ | 14,310 | ||||
Dividend payable and other liabilities | 5,580 | 5,600 | ||||||
Other liabilities | — | 401 | ||||||
Total liabilities | 5,580 | 20,311 | ||||||
Stockholders’ equity | ||||||||
Common stock, $1.00 par value, 300,000,000 shares authorized; 112,247,748 shares outstanding | $ | 129,556 | $ | 129,320 | ||||
Paid-in capital | 1,578,527 | 1,574,555 | ||||||
Accumulated other comprehensive income (loss), net of tax | 49,682 | 54,431 | ||||||
Treasury stock, at cost; 17,072,324 shares | (208,985 | ) | (208,985 | ) | ||||
Retained earnings | 292,367 | 196,164 | ||||||
Total stockholders’ equity | 1,841,147 | 1,745,485 | ||||||
Total liabilities and stockholders’ equity | $ | 1,846,727 | $ | 1,765,796 | ||||
| 39 |
Table of Contents
NOTES TO CONSOLIDATED FINANCIAL STATEMENTS(CONTINUED)
Statements of Operations | ||||||||||||
| Year ended September 30, | 2010 | 2009 | 2008 | |||||||||
| (In thousands) | ||||||||||||
Income | ||||||||||||
Dividends from subsidiary | $ | — | $ | 18,833 | $ | 65,000 | ||||||
Other | 14 | 24 | 24 | |||||||||
Total Income | 14 | 18,857 | 65,024 | |||||||||
Expense | ||||||||||||
Miscellaneous | 1,046 | 1,996 | 1,245 | |||||||||
Total expense | 1,046 | 1,996 | 1,245 | |||||||||
Net income before equity in undistributed net income of subsidiary | (1,032 | ) | 16,861 | 63,779 | ||||||||
Equity in undistributed net income of subsidiary | 119,324 | 30,611 | (1,881 | ) | ||||||||
Income before income taxes | 118,292 | 47,472 | 61,898 | |||||||||
Income tax benefit | 361 | 700 | 434 | |||||||||
Net income | $ | 118,653 | $ | 48,172 | $ | 62,332 | ||||||
Preferred dividends accrued | — | 7,488 | — | |||||||||
Net income available to common shareholders | $ | 118,653 | $ | 40,684 | $ | 62,332 | ||||||
Statements of Cash Flows | ||||||||||||
| 2010 | 2009 | 2008 | ||||||||||
| (In thousands) | ||||||||||||
Cash Flows From Operating Activities | ||||||||||||
Net income | $ | 118,653 | $ | 48,172 | $ | 62,332 | ||||||
Adjustments to reconcile net income to net cash provided by operating activities | ||||||||||||
Equity in undistributed net income of subsidiaries | (119,324 | ) | (30,611 | ) | 1,881 | |||||||
Decrease (increase) in dividend receivable | — | 18,434 | (5,124 | ) | ||||||||
Decrease (increase) in other assets | 1,309 | (434 | ) | — | ||||||||
Increase (decrease) in other liabilities | (421 | ) | (11,589 | ) | 551 | |||||||
Net cash provided by (used in) operating activities | 217 | 23,972 | 59,640 | |||||||||
Cash Flows From Financing Activities | ||||||||||||
Proceeds from exercise of common stock options and related tax benefit | 1,940 | 180 | 2,546 | |||||||||
Proceeds from Employee Stock Ownership Plan | — | 1,341 | 5,771 | |||||||||
Net proceeds from follow on stock offering | — | 333,177 | — | |||||||||
Downstream stock offering proceeds to the Bank | — | (300,000 | ) | — | ||||||||
Proceeds from issuance of preferred stock and warrants | — | 200,000 | — | |||||||||
Preferred stock redeemed | — | (200,000 | ) | — | ||||||||
Increase (decrease) in borrowings | (14,310 | ) | — | 4,000 | ||||||||
Treasury stock purchased | — | — | — | |||||||||
Dividends paid on preferred stock | — | (5,361 | ) | — | ||||||||
Dividends paid on common stock | (22,450 | ) | (18,847 | ) | (73,688 | ) | ||||||
Net cash used by financing activities | (34,820 | ) | 10,490 | (61,371 | ) | |||||||
Increase (decrease) in cash | (34,603 | ) | 34,462 | (1,731 | ) | |||||||
Cash at beginning of year | 39,249 | 4,787 | 6,518 | |||||||||
Cash at end of year | $ | 4,646 | $ | 39,249 | $ | 4,787 | ||||||
| 40 | . |
Table of Contents
NOTE P | SELECTED QUARTERLY FINANCIAL DATA (UNAUDITED) |
The following is a summary of the unaudited interim results of operations by quarter:
| Year ended September 30, 2010 | First Quarter | Second Quarter | Third Quarter | Fourth Quarter | ||||||||||||
| (In thousands, except per share data) | ||||||||||||||||
Interest income | $ | 165,670 | $ | 165,034 | $ | 167,371 | $ | 165,485 | ||||||||
Interest expense | 67,905 | 67,994 | 68,086 | 65,116 | ||||||||||||
Net interest income | 97,765 | 97,040 | 99,285 | 100,369 | ||||||||||||
Provision for loan losses | 69,750 | 63,423 | 20,736 | 26,000 | ||||||||||||
Other operating income (REO expense) | 11,518 | 74,419 | (25,877 | ) | (20,105 | ) | ||||||||||
Other operating expense | 26,977 | 39,961 | 32,877 | 31,665 | ||||||||||||
Income before income taxes | 12,556 | 68,075 | 19,795 | 22,599 | ||||||||||||
Income taxes | 4,645 | (14,036 | ) | 7,127 | 6,636 | |||||||||||
Net income | $ | 7,911 | $ | 82,111 | $ | 12,668 | $ | 15,963 | ||||||||
Basic earnings per share | $ | .08 | $ | .73 | $ | .11 | $ | .14 | ||||||||
Diluted earnings per share | .07 | .73 | .11 | .14 | ||||||||||||
Cash dividends per share | 0.05 | 0.05 | 0.05 | 0.05 | ||||||||||||
Return of average assets | 0.25 | % | 2.44 | % | 0.37 | % | 0.47 | % | ||||||||
NOTE Q | FAIR VALUE MEASUREMENTS |
U.S. GAAP defines fair value as the exchange price that would be received for an asset or paid to transfer a liability (an exit price) in the principal or most advantageous market for the asset or liability in an orderly transaction between market participants on the measurement date. U.S. GAAP also establishes a fair value hierarchy which requires an entity to maximize the use of observable inputs and minimize the use of unobservable inputs when measuring fair value. The standard describes three levels of inputs that may be used to measure fair value:
Level 1: Quoted prices (unadjusted) for identical assets or liabilities in active exchange markets that the entity has the ability to access as of the measurement date.
Level 2: Significant other observable inputs other than Level 1 prices, such as quoted prices for similar assets or liabilities, quoted prices in markets that are not active and other inputs that are observable or can be corroborated by observable market data.
Level 3: Significant unobservable inputs that reflect a company’s own assumptions about the assumptions that market participants would use in pricing an asset or liability.
The following is a description of the valuation methodologies used to measure and report fair value of financial assets and liabilities on a recurring or nonrecurring basis:
Measured on a Recurring Basis
Securities
Securities available for sale are recorded at fair value on a recurring basis. Fair value is determined with quoted prices for similar assets or liabilities, quoted prices in markets that are not active and other inputs that are observable or can be corroborated by observable market data (Level 2).
| 41 |
Table of Contents
NOTES TO CONSOLIDATED FINANCIAL STATEMENTS(CONTINUED)
The following table presents the balance of assets measured at fair value on a recurring basis at September 30, 2010:
| Fair Value at September 30, 2010 | ||||||||||||||||
| Level 1 | Level 2 | Level 3 | Total | |||||||||||||
| (In thousands) | ||||||||||||||||
Available-for-sale securities | ||||||||||||||||
Equity securities | $ | — | $ | 526 | $ | — | $ | 526 | ||||||||
Obligations of U.S. government | — | 340,480 | — | 340,480 | ||||||||||||
Obligations of states and political subdivisions | — | — | — | — | ||||||||||||
Obligations of foreign governments | — | — | — | — | ||||||||||||
Corporate debt securities | — | 10,000 | — | 10,000 | ||||||||||||
Mortgage-backed securities | ||||||||||||||||
Agency pass-through certificates | — | 2,130,087 | — | 2,130,087 | ||||||||||||
Other debt securities | — | — | — | — | ||||||||||||
Balance at end of period | $ | — | $ | 2,481,093 | $ | — | $ | 2,481,093 | ||||||||
There were no transfers between, into and/or out of Levels 1, 2 or 3 during the year ended September 30, 2010.
Measured on a Nonrecurring Basis
Impaired Loans & Real Estate Held for Sale
From time to time, and on a nonrecurring basis, fair value adjustments to collateral dependent loans and real estate held for sale are recorded to reflect write-downs of principal balances based on the current appraised or estimated value of the collateral.
Real estate held for sale consists principally of properties acquired through foreclosure.
The following table presents the aggregated balance of assets measured at estimated fair value on a nonrecurring basis for the year ended September 30, 2010, and the total losses resulting from those fair value adjustments for the quarter and year ended September 30, 2010. The following estimated fair values are shown gross of estimated selling costs:
| Through September 30, 2010 | Quarter Ended September 30, 2010 | Year Ended September 30, 2010 | ||||||||||||||||||||||
| Level 1 | Level 2 | Level 3 | Total | Total Losses | Total Losses | |||||||||||||||||||
| (In thousands) | ||||||||||||||||||||||||
Impaired loans (1) | $ | — | $ | — | $ | 463,756 | $ | 463,756 | $ | 4,129 | $ | 81,944 | ||||||||||||
Real estate held for sale (2) | — | — | 223,760 | 223,760 | 25,665 | 102,612 | ||||||||||||||||||
Balance at end of period | $ | — | $ | — | $ | 687,516 | $ | 687,516 | $ | 29,794 | $ | 184,556 | ||||||||||||
| (1) | The loss represents remeasurements of collateral dependent loans. |
| (2) | The loss represents aggregate writedowns and charge-offs on real estate held for sale. |
There were no liabilities carried at fair value, measured on a recurring or nonrecurring basis, at September 30, 2010.
NOTE R | COVERED ASSETS |
Covered assets represent loans and real estate held for sale acquired from the FDIC that are subject to the loss sharing agreements and were $578,629,000 as of September 30, 2010.
The Company evaluated the acquired loans and concluded that $493,434,000 of loans were impaired and would be accounted for under ASC 310-30 as of January 8, 2010. Loans are accounted for under ASC 310-30 when there is evidence of credit deterioration since origination and for which it is probable, at acquisition, that the Company would be unable to collect all contractually required payments.
| 42 | . |
Table of Contents
The following table reflects the carrying value of all acquired impaired and non-impaired loans as of September 30, 2010:
| Acquired Impaired Loans | Acquired Non-impaired Loans | Total | ||||||||||
| (In thousands) | ||||||||||||
Single-family residential | $ | 7,872 | $ | 58,863 | $ | 66,735 | ||||||
Construction – speculative | 24,353 | 5,277 | 29,630 | |||||||||
Construction – custom | 6,533 | 394 | 6,927 | |||||||||
Land – acquisition & development | 78,308 | 24,674 | 102,982 | |||||||||
Land – consumer lot loans | 499 | 1,314 | 1,813 | |||||||||
Multi-family | 12,342 | 41,916 | 54,258 | |||||||||
Commercial real estate | 127,844 | 181,143 | 308,987 | |||||||||
Commercial & industrial | 45,214 | 38,340 | 83,554 | |||||||||
HELOC | 1,911 | 24,676 | 26,587 | |||||||||
Consumer | 1,956 | 1,955 | 3,911 | |||||||||
Total covered loans | $ | 306,832 | $ | 378,552 | 685,384 | |||||||
Discount | (150,910 | ) | ||||||||||
Covered loans, net | $ | 534,474 | ||||||||||
Changes in the carrying amount and accretable yield for acquired impaired and non-impaired loans were as follows for the nine months ended September 30, 2010:
| Acquired Impaired | Acquired Non-impaired | |||||||||||||||
| Accretable Yield | Carrying Amount of Loans | Accretable Yield | Carrying Amount of Loans | |||||||||||||
| (In thousands) | ||||||||||||||||
Balance at beginning of period | $ | — | $ | — | $ | — | $ | — | ||||||||
Additions (1) | 36,731 | 246,383 | 50,000 | 425,000 | ||||||||||||
Accretion | (9,712 | ) | 9,712 | (10,187 | ) | 10,187 | ||||||||||
Transfers to REO | — | (34,536 | ) | — | — | |||||||||||
Payments received, net | — | (31,029 | ) | — | (91,243 | ) | ||||||||||
Balance at end of period | $ | 27,019 | $ | 190,530 | $ | 39,813 | $ | 343,944 | ||||||||
| (1) | Represents the estimated fair value of the loans at the date of acquisition |
At September 30, 2010, none of the acquired impaired or non-impaired loans were classified as non-performing assets. Therefore, interest income, through accretion of the difference between the carrying amount of the loans and the expected cash flows, was recognized on all acquired loans. There was no allowance for loan losses related to the covered loans at September 30, 2010, as these loans are performing as anticipated in the projections used in the purchase accounting fair value calculations.
The outstanding principal balance of acquired loans was $968,434,000 and $685,384,000 as of January 8, 210 and September 30, 2010, respectively.
The following table shows the activity for the FDIC Indemnification asset:
| 2010 | 2009 | |||||||
| (In thousands) | ||||||||
Beg Balance | $ | — | $ | — | ||||
Additions | 227,500 | — | ||||||
Payments received | (92,551 | ) | — | |||||
Amortization FAS91 | (8,150 | ) | — | |||||
Accretion | 4,329 | — | ||||||
Ending Balance | $ | 131,128 | $ | — | ||||
| 43 |
Table of Contents

MANAGEMENT’S REPORT ON INTERNAL CONTROL OVER FINANCIAL REPORTING
The management of Washington Federal, Inc. (the “Company”) is responsible for establishing and maintaining adequate internal control over financial reporting. The Company’s internal control system was designed to provide reasonable assurance to the Company’s management and Board of Directors regarding the preparation and fair presentation of published financial statements.
The Company’s management assessed the effectiveness of the Company’s internal control over financial reporting as of September 30, 2010. In making this assessment, the Company’s management used the criteria set forth by the Committee of Sponsoring Organizations of the Treadway Commission (COSO) in Internal Control-Integrated Framework. Based on its assessment, the Company’s management believes that as of September 30, 2010, the Company’s internal control over financial reporting was effective based on those criteria.
The Company’s independent auditors, Deloitte & Touche LLP, an independent registered public accounting firm, have issued an audit report on the Company’s internal control over financial reporting and their report follows.
November 11, 2010

Roy M. Whitehead
Chairman, President and
Chief Executive Officer

Brent J. Beardall
Executive Vice President and
Chief Financial Officer
REPORT OF INDEPENDENT REGISTERED PUBLIC ACCOUNTING FIRM
To the Board of Directors and Stockholders of
Washington Federal, Inc.
Seattle, Washington
We have audited the accompanying consolidated statements of financial condition of Washington Federal, Inc. and subsidiaries (the “Company”) as of September 30, 2010 and 2009, and the related consolidated statements of operations, stockholders’ equity, and cash flows for each of the three years in the period ended September 30, 2010. These consolidated financial statements are the responsibility of the Company’s management. Our responsibility is to express an opinion on these consolidated financial statements based on our audits.
We conducted our audits in accordance with the standards of the Public Company Accounting Oversight Board (United States). Those standards require that we plan and perform the audit to obtain reasonable assurance about whether the financial statements are free of material misstatement. An audit includes examining, on a test basis, evidence supporting the amounts and disclosures in the financial statements. An audit also includes assessing the accounting principles used and significant estimates made by management, as well as evaluating the overall financial statement presentation. We believe that our audits provide a reasonable basis for our opinion.
In our opinion, such consolidated financial statements present fairly, in all material respects, the consolidated financial position of Washington Federal, Inc. and subsidiaries as of September 30, 2010 and 2009, and the results of their operations and their cash flows for each of the three years in the period ended September 30, 2010, in conformity with accounting principles generally accepted in the United States of America.
We have also audited, in accordance with the standards of the Public Company Accounting Oversight Board (United States), the Company’s internal control over financial reporting as of September 30, 2010, based on the criteria established in Internal Control—Integrated Framework issued by the Committee of Sponsoring Organizations of the Treadway Commission and our report dated November 11, 2010 expressed an unqualified opinion on the Company’s internal control over financial reporting.

Seattle, Washington
November 11, 2010
| 44 | . |
Table of Contents
REPORT OF INDEPENDENT REGISTERED PUBLIC ACCOUNTING FIRM
To the Board of Directors and Stockholders of
Washington Federal, Inc.
Seattle, Washington
We have audited the internal control over financial reporting of Washington Federal, Inc. and subsidiaries (the “Company”) as of September 30, 2010, based on criteria established in Internal Control—Integrated Framework issued by the Committee of Sponsoring Organizations of the Treadway Commission. Because management’s assessment and our audit were conducted to meet the reporting requirements of Section 112 of the Federal Deposit Insurance Corporation Improvement Act (FDICIA), management’s assessment and our audit of the Company’s internal control over financial reporting included controls over the preparation of the schedules equivalent to the basic financial statements in accordance with the Office of Thrift Supervision Instructions for the Thrift Financial Report (“TFR”) for Schedules SC, SO, and the Reconciliation of Equity Capital included on Schedule SI. The Company’s management is responsible for maintaining effective internal control over financial reporting and for its assessment of the effectiveness of internal control over financial reporting, including controls over the preparation of regulatory financial statements in accordance with the instructions for the TFR, included in the accompanying Management Report. Our responsibility is to express an opinion on the Company’s internal control over financial reporting based on our audit.
We conducted our audit in accordance with the standards of the Public Company Accounting Oversight Board (United States). Those standards require that we plan and perform the audit to obtain reasonable assurance about whether effective internal control over financial reporting was maintained in all material respects. Our audit included obtaining an understanding of internal control over financial reporting, assessing the risk that a material weakness exists, testing and evaluating the design and operating effectiveness of internal control based on the assessed risk, and performing such other procedures as we considered necessary in the circumstances. We believe that our audit provides a reasonable basis for our opinion.
A company’s internal control over financial reporting is a process designed by, or under the supervision of, the company’s principal executive and principal financial officers, or persons performing similar functions, and effected by the company’s board of directors, management, and other personnel to provide reasonable assurance regarding the reliability of financial reporting and the preparation of financial statements for external purposes in accordance with generally accepted accounting principles. A company’s internal control over financial reporting includes those policies and procedures that (1) pertain to the maintenance of records that, in reasonable detail, accurately and fairly reflect the transactions and dispositions of the assets of the company; (2) provide reasonable assurance that transactions are recorded as necessary to permit preparation of financial statements in accordance with generally accepted accounting principles, and that receipts and expenditures of the company are being made only in accordance with authorizations of management and directors of the company; and (3) provide reasonable assurance regarding prevention or timely detection of unauthorized acquisition, use, or disposition of the company’s assets that could have a material effect on the financial statements.
Because of the inherent limitations of internal control over financial reporting, including the possibility of collusion or improper management override of controls, material misstatements due to error or fraud may not be prevented or detected on a timely basis. Also, projections of any evaluation of the effectiveness of the internal control over financial reporting to future periods are subject to the risk that the controls may become inadequate because of changes in conditions, or that the degree of compliance with the policies or procedures may deteriorate.
In our opinion, the Company maintained, in all material respects, effective internal control over financial reporting as of September 30, 2010, including controls over the preparation of regulatory financial statements in accordance with the instructions for the TFR, based on criteria established in Internal Control—Integrated Framework issued by the Committee of Sponsoring Organizations of the Treadway Commission.
We have not examined and, accordingly, we do not express an opinion or any other form of assurance on management’s statement referring to compliance with laws and regulations.
We have also audited, in accordance with the standards of the Public Company Accounting Oversight Board (United States), the consolidated financial statements as of and for the year ended September 30, 2010, of the Company and our report dated November 11, 2010, expressed an unqualified opinion on those consolidated financial statements.
Seattle, Washington
November 11, 2010
| 45 |
Table of Contents
The following graphs compare the cumulative total return to Washington Federal stockholders (stock price appreciation plus reinvested dividends) to the cumulative total return of the Nasdaq Stock Market Index (U.S. Companies) and the Nasdaq Financial Stocks Index for the five year period ended September 30, 2010 and since Washington Federal first became a publicly traded company on November 9, 1982, respectively. The graphs assume that $100 was invested on September 30, 2005 and November 9, 1982, respectively, in Washington Federal Common Stock, the Nasdaq Stock Market Index and the Nasdaq Financial Stocks Index, and that all dividends were reinvested. Management of Washington Federal cautions that the stock price performance shown in the graphs below should not be considered indicative of potential future stock price performance.
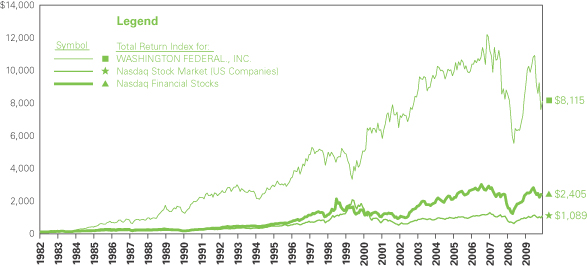
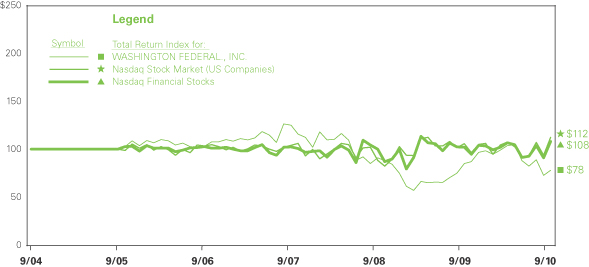
| 46 | . |
Table of Contents

GENERAL CORPORATE AND STOCKHOLDERS’ INFORMATION
Corporate | 425 Pike Street |
Headquarters | Seattle, Washington 98101 |
| (206) 624-7930 |
Independent | Deloitte & Touche LLP |
Auditors | Seattle, Washington |
Transfer Agent, Registrar and Dividend | Stockholder inquiries regarding transfer requirements, cash or stock dividends, lost certificates, consolidating records, correcting a name or changing an address should be directed to the transfer agent: |
Disbursing Agent | American Stock Transfer & Trust Company |
| 59 Maiden Lane |
| Plaza Level |
| New York, NY 10038 |
| Telephone: 1-888-888-0315 |
| www.amstock.com |
Annual Meeting | The annual meeting of stockholders will be held on January 19, 2011, at 2 p.m., Pacific Time at Benaroya Hall, 200 University Street, Seattle, Washington |
Form 10-K | To find out more about the Company, please visit our website. The Company uses its website to distribute financial and other material information about the Company. This report and all SEC filings of the Company are available through the Company’s website: |
| www.washingtonfederal.com |
Stock Information | Washington Federal, Inc. is traded on the NASDAQ Global Select Market. The common stock symbol is WFSL. At September 30, 2010, there were approximately 1,871 stockholders of record. |
| Stock Prices | ||||||||||||
| Quarter Ended | High | Low | Dividends | |||||||||
December 31, 2008 | $ | 19.80 | $ | 11.97 | $ | 0.05 | ||||||
March 31, 2009 | 15.03 | 9.94 | 0.05 | |||||||||
June 30, 2009 | 14.78 | 11.33 | 0.05 | |||||||||
September 30, 2009 | 16.98 | 12.14 | 0.05 | |||||||||
December 31, 2009 | 19.98 | 16.25 | 0.05 | |||||||||
March 31, 2010 | 20.99 | 18.65 | 0.05 | |||||||||
June 30, 2010 | 21.56 | 16.44 | 0.05 | |||||||||
September 30, 2010 | 17.42 | 14.43 | 0.05 | |||||||||
Our Board of Directors’ dividend policy is to review our financial performance, capital adequacy, regulatory compliance and cash resources on a quarterly basis, and, if such review is favorable, to declare and pay a cash dividend to shareholders.
| 47 |
Table of Contents

DIRECTORS, OFFICERS AND OFFICES
CORPORATE HEADQUARTERS
425 Pike Street Seattle, WA 98101 (206) 624-7930
BOARD OF DIRECTORS
ROY M. WHITEHEAD Chairman, President and Chief Executive Officer
DEREK L. CHINN Former President and Chief Executive Officer, United Savings and Loan Bank
JOHN F. CLEARMAN Former Chief Financial Officer, Milliman USA, Inc.
JAMES J. DOUD, JR. Former Executive Vice President and Chief Operating Officer of Matthew G. Norton Co.
H. DENNIS HALVORSON Former Chief Executive Officer, United Bank
ANNA C. JOHNSON Senior Partner Scan East West Travel
THOMAS J. KELLEY Faculty member, Albers School of Business, Seattle University and retired partner, Arthur Andersen LLP
CHARLES R. RICHMOND Former Executive Vice President, Washington Federal
BARBARA L. SMITH, PhD. Owner, B. Smith Consulting Group
DIRECTOR EMERITUS
W. ALDEN HARRIS | EXECUTIVE MANAGEMENT COMMITTEE
ROY M. WHITEHEAD Chairman, President and Chief Executive Officer
BRENT J. BEARDALL Executive Vice President and Chief Financial Officer
LINDA S. BROWER Executive Vice President Human Resources, Deposit Operations and Marketing
EDWIN C. HEDLUND Executive Vice President Mortgage & Consumer Lending and Corporate Secretary
JACK B. JACOBSON Executive Vice President Commercial Real Estate
THOMAS E. KASANDERS Executive Vice President Business Banking
MARK A. SCHOONOVER Executive Vice President Chief Credit Officer
ANGELA D. VEKSLER Senior Vice President Chief Information Officer | DEPARTMENT MANAGERS
Accounting CHAD J. LEONARD Vice President and Controller
ROBERT C. ZIRK Vice President Internal Controls and Taxes
Commercial Real Estate THOMAS R. POZARYCKI Senior Vice President
FRED H. REININGER Senior Vice President
Consumer Underwriting MICHAEL R. BUSH Senior Vice President
Special Assets RONALD L. MCKENZIE Senior Vice President
Commercial Appraisal Review JAMES M. CORBIN Vice President
Corporate Real Estate KEITH D. TAYLOR Senior Vice President
Information Systems TERRY O. PERMENTER Senior Vice President & Chief Software Architect
Deposit Operations TERESA M. RODIN Senior Vice President
Enterprise Risk Manager DIANE L. KELLEHER Senior Vice President
Internal Audit BARBARA A. MURPHY Senior Vice President
Commercial Loan Servicing JUDY R. GRAMS Vice President
Commercial Loan Processing MARK A. ROGERS Vice President
Consumer Loan Servicing BETSY J. NELSON Vice President
Loan Review MARK C. DeRITIS Vice President
Marketing and Investor Relations CATHY E. COOPER Senior Vice President
Mortgage Loan Operations RONDA F. TOMLINSON Senior Vice President
Permanent Loan Production PATRICK J. CARSON Vice President
Training Manager KIM E. ROBISON Vice President
Wholesale Underwriting COLLEEN E. WELLS Senior Vice President | SOUTH SOUND WASHINGTON
18 Office Locations Division Manager GREGORY J. TOSO Senior Vice President 9919 Bridgeport Way S.W. Lakewood, WA 98499
MIDSOUND WASHINGTON
16 Office Locations Division Manager LISA M. KING Senior Vice President 5809 196th S.W. Lynnwood, WA 98036
EASTSIDE WASHINGTON
14 Office Locations Division Manager VICTOR I. MIZUMORI Senior Vice President 400 108th Ave. N.E. Bellevue, WA 98004
NORTHERN WASHINGTON
16 Office Locations Regional Executive THOMAS F. KENNEY Senior Vice President Division Manager GREGORY A. PECK Senior Vice President 1500 Cornwall Ave. Bellingham, WA 98225
WESTERN IDAHO
10 Office Locations Division Manager ROBERT P. LINK Senior Vice President 1001 W. Idaho St. Boise, ID 83701
EASTERN IDAHO
6 Office Locations Division Manager JEFFREY B. HARRIS Vice President 500 North Capital Idaho Falls, ID 83402 | OREGON
28 Office Locations Division Manager PEGGY L. HOBIN Senior Vice President 14990 S.W. Bangy Rd. Lake Oswego, OR 97035
UTAH
10 Office Locations Division Manager MARLISE G. FISHER Senior Vice President 505 E. 200 South Salt Lake City, UT 84102
NEW MEXICO
13 Office Locations Division Manager R. HAL BAILEY Senior Vice President 4301 The 25 Way N.E. Albuquerque, NM 87109
PHOENIX ARIZONA
13 Office Locations Division Manager JOHN N. PIRTLE Senior Vice President 2196 E. Camelback Rd., Suite 100 Phoenix, AZ 85016
TUCSON ARIZONA
8 Office Locations Division Manager BRYAN L. LUTZ Vice President 4788 E. Sunrise Dr. Tucson, AZ 85718
NEVADA
4 Office Locations Division Manager PAMELA K. CALLAHAN Vice President 9340 Sun City Blvd. #103 Las Vegas, NV 89134
TEXAS
4 Office Locations Division Manager BILL C. CHILDERS Vice President 5900 Chapel Hill Blvd. Plano, TX 75093 | SUBSIDIARIES
First Insurance Agency, Inc. 1501 Riverside Dr. Mount Vernon, WA 98273 1-800-562-2555 DUANE E. HENSON President |
| 48 | . |
Table of Contents