UNITED STATES
SECURITIES AND EXCHANGE COMMISSION
Washington, D.C. 20549
FORM N-CSR
CERTIFIED SHAREHOLDER REPORT OF REGISTERED
MANAGEMENT INVESTMENT COMPANIES
Investment Company Act file number 811-01519
STATE FARM ASSOCIATES’ FUNDS TRUST
(Exact name of registrant as specified in charter)
One State Farm Plaza
Bloomington, IL 61710-0001
(Address of principal executive offices) (Zip code)
| | |
| | Alan Goldberg |
| | K&L Gates LLP |
| Paul J. Smith | | Three First National Plaza |
| One State Farm Plaza | | 70 West Madison St., Suite 3100 |
| Bloomington, Illinois 61710-0001 | | Chicago, Illinois 60602 |
(Names and addresses of agents for service)
Registrant’s telephone number, including area code: 1-800-447-0740
Date of fiscal year end: 11/30/2013
Date of reporting period: 11/30/2013
| ITEM 1. | REPORTS TO STOCKHOLDERS. |
November 30, 2013

Before investing, consider the Funds’ investment objectives, risks, charges and expenses. Contact State Farm VP Management Corp. (1-800-447-0740) for a prospectus or summary prospectus containing this and other information. Read it carefully.
A description of the policies and procedures that the Funds use to determine how to vote proxies relating to portfolio securities, and information regarding how the Funds voted proxies relating to portfolio securities during the most recent 12-month period ended June 30, are available without charge upon request at 1-800-447-0740 and at “http://www.sec.gov.”
The Funds file complete schedules of portfolio holdings for each Fund with the Securities and Exchange Commission (the “Commission”) for the first and third quarters of each fiscal year on Form N-Q. The Funds’ Forms N-Q are available on the Commission’s website at “http://www.sec.gov.” The Funds’ Forms N-Q may be reviewed and copied at the Commission’s Public Reference Room in Washington, D.C., and information on the operation of the Public Reference Room may be obtained by calling 1-800-SEC-0330. The Funds make the information on Form N-Q available to shareholders upon request without charge at 1-800-447-0740.
Any website referenced in this report is an inactive textual reference only, and information contained in or otherwise accessible through that website does not form a part of, and is not incorporated by reference into, this report.
ANNUAL REPORT
Electronic Delivery
As a State Farm Mutual Funds shareholder, we wish to remind you that you can elect to have future Annual Reports, Semi-Annual Reports, Prospectuses, statements, and tax forms delivered electronically rather than receiving large, bulky paper reports through the mail. This is a great way to help reduce internal fund costs related to printing and mailing these materials as well as a way to be environmentally friendly. Please consider signing up for electronic delivery today by going on statefarm.com or contacting the State Farm Mutual Funds Response Center at 1-800-447-0740 for assistance.
Compensation Deduction or Automatic Investment Plan (AIP)1
State Farm Mutual Funds allow you to make regular investments in a Fund with compensation deduction (agent/employee only) or an Automatic Investment Plan through an electronic transfer of funds from your bank/credit union account. If you wish to begin compensation deduction or an Automatic Investment Plan, the minimum amount required for both initial and subsequent investments is $50. Please consider signing up today for compensation deduction by going on the State Farm intranet or signing up for AIP by contacting the State Farm Mutual Funds Response Center at 1-800-447-0740 for assistance.
| 1 | Automatic investment plans do not assure a profit or protect against loss. |
Message to Shareholders of State Farm Associates’ Funds Trust
Dear Fellow Shareholders,
Thank you for investing with State Farm Mutual Funds. Enclosed is the Annual Report for the 12-month period ended November 30, 2013. In this report you will find management’s discussion of investment philosophy and process for each of the Funds offered by the Trust, factors that affected each Fund’s performance over the 12-month period, and benchmark index comparisons that are designed to put that performance into context.
During the 2013 fiscal year, the U.S. and international equity markets experienced positive returns while fixed income markets were mixed, with some fixed income indices achieving negative single-digit total returns, due primarily to higher interest rates.
The table below shows annual total returns for each of the four Funds compared to their respective benchmarks for the 12-month period ended November 30, 2013.
| | |
Average Annual Total Returns (as of November 30, 2013)1 | | |
| Fund | | Annual Total Returns
1-year |
State Farm Growth Fund | | 24.06% |
Benchmark: S&P 500® Index | | 30.30% |
| | |
State Farm Balanced Fund | | 12.59% |
Benchmark: Blended benchmark* | | 17.21% |
| | |
State Farm Interim Fund | | -0.51% |
Benchmark: Barclays 1-5 Year U.S. Treasury Index | | 0.25% |
| | |
State Farm Municipal Bond Fund | | -2.05% |
Benchmark: Barclays 7-Year Municipal Bond Index | | -1.77% |
| | | |
* 60% S&P 500 Index / 40% Barclays Intermediate Gov/Credit Index (rebalanced on a monthly basis) |
The performance data quoted represents past performance and does not guarantee future results. Investment return and principal value will fluctuate and Fund shares, when redeemed, may be worth more or less than their original cost. Recent performance may be less than the figures shown. Obtain total returns current to the most recent month-end by calling our Mutual Funds Response Center at 1-800-447-0740. It is not possible to invest directly in an index.
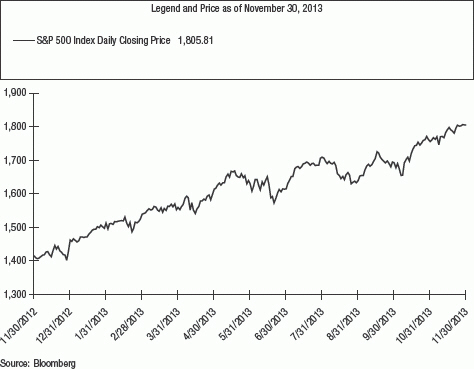
In the U.S., equity markets (as represented by the S&P 500® Index) achieved positive total returns in ten of the past twelve months ended November 30, 2013. Throughout the period, equity markets were influenced by many positive factors including: generally subdued inflation, improving corporate earnings, and modest positive growth in Gross Domestic Product (GDP) – all factors that contributed to improved investor confidence and an increase in equity market price-to-earnings (P/E) valuations. In addition, the Federal Reserve maintained an accommodative monetary policy by leaving the Fed Funds Rate unchanged in a target range of 0% to 0.25%, where it remained for the entire 12-month period ended November 30, 2013.
| 1 | Source: State Farm Mutual Funds returns prepared by State Farm Investment Management Corp. (SFIMC), the Funds’ investment adviser. S&P 500 Index return provided by Bloomberg. The S&P 500 Index is a capitalization-weighted measure of common stocks of 500 large U.S. companies. S&P 500 is a registered trademark of Standard & Poor’s Financial Services LLC. |
| | The blended benchmark return provided by SFIMC. The blended benchmark is comprised of 60% S&P 500 Index / 40% Barclays Intermediate Gov/Credit Index. The Barclays Intermediate Gov/Credit Index contains approximately 4,758 U.S. Treasury, corporate and other securities with an average maturity of about 4.17 years. |
| | The Barclays 1-5 Year U.S. Treasury Index return provided by Barclays Inc. The Barclays 1-5 Year U.S. Treasury Index measures the performance of short-term U.S. Treasury Securities maturing within one to five years. |
| | The Barclays 7-Year Municipal Bond Index return provided by Barclays Inc. The Barclays 7-Year Municipal Bond Index is an unmanaged index comprised of investment grade municipal bonds with maturities of six to eight years. |
1
Message to Shareholders of State Farm Associates’ Funds Trust (continued)
However, the market environment was not without its challenges. In December 2012, equity markets became concerned with the U.S. congressional budget vote on what was known as the “fiscal cliff” and the impacts of the resulting fiscal decisions. During February and March, several international equity markets turned negative and became increasingly volatile as unresolved concerns about sovereign debt issues in several European countries as well as a banking crisis in the small island nation of Cyprus weighed on investor sentiment.2 Throughout the second half of the fiscal year, the markets were focused on commentary from the Federal Reserve about its intentions and timing of potentially reducing its asset-purchase programs known as “quantitative easing.” In addition, in the fall of 2013, the markets digested renewed fears of the fiscal cliff and a two week U.S. government shutdown in October 2013. Despite these challenges, the S&P 500 Index reached all-time highs during the year. For the 12-month period ended November 30, 2013, the S&P 500 Index had a price increase from 1,416.18 to 1,805.81, and posted a total return of 30.30%, including reinvested dividends.
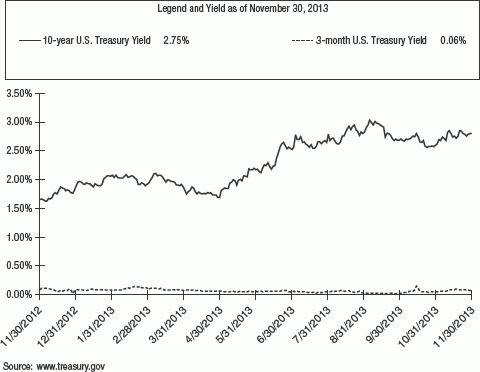
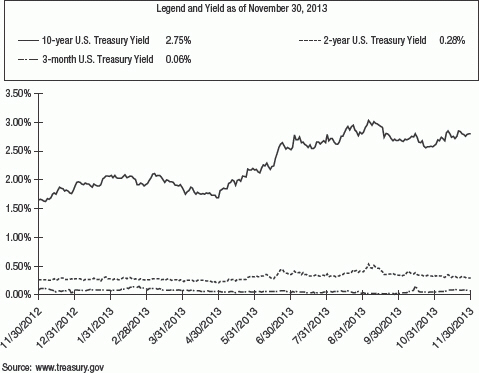
Meanwhile, prices of Treasury bonds declined as concerns grew that the Federal Reserve might start reducing the amount of its asset-purchase programs sooner than expected by the markets. Over the entire 12-months, the yield on 10-year U.S. Treasuries rose from 1.62% at the beginning of the period, to a high of 2.98% on September 5, 2013, before settling down to 2.75% on November 30, 2013. Short-term yields remained low, with 3-month U.S. Treasury yields declining 2 basis points from 0.08% at the beginning of the period, to 0.06% on November 30, 2013.3
| 2 | Foreign securities involve risks not normally associated with investing in the U.S., including higher trading and custody costs, less stringent accounting, legal and reporting practices, potential for political and economic instability, and the fluctuation and potential regulation of currency exchange and exchange rates, all of which are magnified in emerging markets. |
| 3 | Source: The U.S. Department of Treasury. A 10-year U.S. Treasury Bond is a debt obligation issued by the U.S. Treasury that has a term of more than one year, but not more than 10 years. A 3-month U.S. Treasury Bill is a debt obligation issued by the U.S. Treasury that has a term of 92 days or less. U.S. Treasury securities are backed by the full faith and credit of the U.S. government and are guaranteed only as to the prompt payment of principal and interest, and are subject to market risks if sold prior to maturity. Bonds have historically been less volatile than stocks, but are sensitive to changes in interest rates. Past performance does not guarantee future results. |
2
Message to Shareholders of State Farm Associates’ Funds Trust (continued)
Among major fixed income indices, the Barclays 1-5 Year Treasury Index and the Barclays 7-Year Municipal Bond Index posted total returns of 0.25% and –1.77%, respectively, over the 12-month period ended November 30, 2013, as bond price declines, due primarily to higher interest rates, offset bond coupon income.
With negative total returns for some bond-oriented indices, it is important to remember the risk that is present when investing, even in bond funds. Investing involves risk, including a potential for loss.
While dramatic changes in the markets, either positive or negative, are part of investing, State Farm Investment Management Corp. has consistently maintained a long term, disciplined approach to managing investment risk.
Included for your review are audited financial statements and a complete list of portfolio holdings to help you further understand the Funds you own. We encourage your review and consideration of this entire report. Thank you for your continued investment in State Farm Mutual Funds.
|
| Sincerely, |
|
 |
|
| Joe R. Monk Jr. |
| Senior Vice President |
| State Farm Investment Management Corp. |
3
State Farm Growth Fund Management’s Discussion of Fund Performance (unaudited)
Overview
Describe the Fund’s investment objective and philosophy.
The State Farm Growth Fund is managed with a long-term investment orientation. Our investment process is based on a rigorous fundamental analysis of companies. We focus on risk as well as the potential for reward. We look for well managed companies with a niche or business specialty that serves an appropriately-sized market opportunity. We prefer companies with a strong customer focus and a history of prudent financial decisions. We also believe that dividends are an important part of an investment’s total return and therefore prefer companies that pay a regular dividend. While we are conscious of how the Fund’s portfolio differs from its broad-based benchmark, the S&P 500 Index, we do not make decisions based upon the Index.
Describe the relevant market environment as it related to the Fund for the reporting period.
The market environment was influenced by many positive factors including: generally subdued inflation, improving corporate earnings, and modest positive growth in Gross Domestic Product (GDP) – all factors that contributed to improved investor confidence and an increase in equity market price-to-earnings (P/E) valuations. In addition, the Federal Reserve maintained an accommodative monetary policy by leaving the Fed Funds Rate unchanged in a target range of 0% to 0.25%, where it remained for the entire 12-month period ended November 30, 2013.
However, the market environment was not without its challenges. In December 2012, equity markets became concerned with the U.S. congressional budget vote on what was known as the “fiscal cliff” and the impacts of the resulting fiscal decisions. During February and March, several international equity markets turned negative and became increasingly volatile as unresolved concerns about sovereign debt issues in several European countries as well as a banking crisis in the small island nation of Cyprus weighed on investor sentiment. Throughout the second half of the fiscal year, the markets were focused on commentary from the Federal Reserve about its intentions and timing of potentially reducing its asset-purchase programs known as “quantitative easing.” In addition, in the fall of 2013, the markets digested renewed fears of the fiscal cliff and a two week U.S. government shutdown in October 2013.
Throughout the year, oil and gold prices were volatile. Oil prices began the period at around $89/barrel and ranged between approximately $86 and $111/barrel during the period, before ending the period November 2013 around $93/barrel, an increase of 4% for the 12-month period. Gold prices began the period at around $1,711 per troy ounce and ranged between approximately $1,183 and $1,722 per troy ounce during the period, before ending the period November 2013 around $1,251/oz., a decrease of –27% for the 12-month period.
Despite the sovereign debt crisis in Europe, the U.S. dollar fell against the euro during the period. For the period December 2012 through November 2013, the U.S. dollar declined by approximately –4% to $1.36/euro. Versus the British pound, the U.S. dollar fell by approximately –2% during the period to $1.64/£.
The 12-month total return for the S&P 500 Index was 30.30% for the period ended November 30, 2013. The total return for the period reflected an increase in corporate earnings per share for the S&P 500 Index companies of approximately 6%, an expansion of the price/earnings valuation of the S&P 500 Index of approximately 22%, and a dividend return of approximately 2.20%.
4
Provide an illustration of the Fund’s investments.
Fund Composition*
(unaudited)
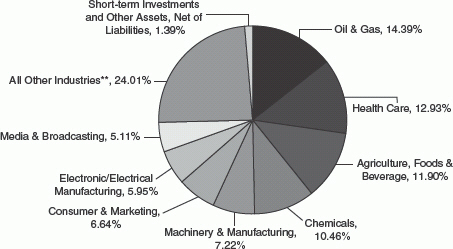
| | * | Illustrated by Industry and based on total net assets as of November 30, 2013. Please refer to the Schedule of Investments later in this report for details concerning Fund holdings. |
| | ** | Represents 10 other industries, each of which represents less than 5% of total net assets. |
5
How did the Fund perform during the reporting period?
For the 1-year period ended November 30, 2013, the State Farm Growth Fund had a total return of 24.06% after expenses, compared to a 30.30% total return for the S&P 500 Index. The line graph below provides additional perspective on the Fund’s long term results.
Comparison of change in value of $10,000 investment
for the years ended November 30
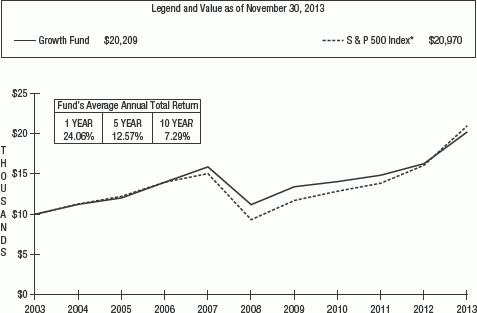
The performance data quoted above represents past performance and does not guarantee future results. Investment return and principal value will fluctuate and Fund shares, when redeemed, may be worth more or less than their original cost. Recent performance may be less than the figures shown. Obtain total returns current to the most recent month-end by calling our Mutual Funds Response Center at 1-800-447-0740. These figures do not reflect the deduction of taxes that a shareholder would pay on Fund distributions or the redemption of Fund shares.
Performance Analysis
What factors helped and hindered performance during the reporting period?
The tables below show the securities that were the leading contributors and detractors to Fund performance during the period as well as the performance of the top ten holdings of the Fund.
Performance of Top 5 Contributors
| | | | | | |
| Security | | Sector | | % of Net Assets as of 11/30/13 | | 12/1/12 to 11/30/13 % Price Change |
| Johnson & Johnson | | Health Care | | 6.2% | | 36% |
| Walt Disney Co., The | | Media & Broadcasting | | 5.1% | | 42% |
| Archer-Daniels-Midland Co. | | Agriculture, Foods, & Beverage | | 3.7% | | 51% |
| Hewlett-Packard Co. | | Computers | | 2.2% | | 111% |
Sigma-Aldrich Corp. | | Chemicals | | 6.3% | | 19% |
| * | The S&P 500 Index is a capitalization-weighted measure of the common stocks of 500 large U.S. companies. |
The S&P 500 Index represents an unmanaged group of stocks that differs from the composition of the Growth Fund. Unlike an investment in the Growth Fund, a theoretical investment in the Index does not reflect any expenses. It is not possible to invest directly in an index.
6
Performance of Top 5 Detractors
| | | | | | |
| Security | | Sector | | % of Net Assets as of 11/30/13 | | 12/1/12 to 11/30/13 % Price Change |
| International Business Machines Corp. | | Computers | | 2.8% | | -5% |
| BHP Billiton PLC | | Mining & Metals | | 0.8% | | -3% |
| Caterpillar Inc. | | Machinery & Manufacturing | | 2.0% | | -1% |
| Royal Dutch Shell PLC ADR Class A | | Oil & Gas | | 0.9% | | -0.4% |
| Croda International PLC* | | Chemicals | | 0.03% | | -3% |
*Purchased after 11/30/12. Price Change period is from date of purchase to 11/30/13. |
Performance of Top 10 Holdings
| | | | | | |
| Security | | Sector | | % of Net Assets as of 11/30/13 | | 12/1/12 to 11/30/13 % Price Change |
| Exxon Mobil Corp. | | Oil & Gas | | 6.5% | | 6% |
| Sigma-Aldrich Corp. | | Chemicals | | 6.3% | | 19% |
| Johnson & Johnson | | Health Care | | 6.2% | | 36% |
| Walt Disney Co., The | | Media & Broadcasting | | 5.1% | | 42% |
| Procter & Gamble Co., The | | Consumer & Marketing | | 3.9% | | 21% |
| Archer-Daniels-Midland Co. | | Agriculture, Foods, & Beverage | | 3.7% | | 51% |
| Chevron Corp. | | Oil & Gas | | 3.4% | | 16% |
| Wells Fargo & Co. | | Banks | | 3.1% | | 33% |
| Wal-Mart Stores Inc. | | Retailers | | 2.9% | | 12% |
International Business Machines Corp. | | Computers | | 2.8% | | -5% |
The State Farm Growth Fund’s portfolio turnover over the past 12-months was 0.68%, which is consistent with the Fund’s investment philosophy and approach. There were 72 holdings in the Fund totaling approximately $3.7 billion in assets at the end of the reporting period compared to 63 holdings and approximately $3.1 billion in assets one year earlier. As discussed in the Overview – we feel that a company’s dividend policy is an important component in the analysis and selection of securities for the State Farm Growth Fund. From December 1, 2012, through November 30, 2013, 47 of the stocks in the portfolio, accounting for over 73% of the Fund’s total net assets, increased their dividends.
Given the performance analysis above, what factors should shareholders take into consideration when reviewing the Fund’s performance?
We are long-term investors who spend a lot of time getting to know companies and the people who run them. We seek to understand the company’s long term strategies as well as the competitive advantages and risks inherent in them. When we invest in a company, it is normally our intention to maintain that investment for a very long period of time. Our investment strategy generally is not influenced by short term factors. Our philosophy sometimes will result in periods when the Fund’s performance trails that of the market. We define risk as the permanent loss of investment capital. We believe that our philosophy combined with our views on risk have produced competitive returns versus the benchmark over a long period of time.
7
State Farm Balanced Fund Management’s Discussion of Fund Performance (unaudited)
Overview
Describe the Fund’s investment objective and philosophy.
The State Farm Balanced Fund is invested in a combination of stocks and bonds in the pursuit of long-term growth of principal while providing some current income. The Balanced Fund seeks to achieve its objective by investing approximately 60% of its total assets in common stocks, and ordinarily limits its common stock investments to no more than 75% of total assets. The Balanced Fund ordinarily invests at least 25% of its total assets in fixed income securities, but for a time may choose to invest as much as 75% of its total assets in fixed income securities, including short-term securities. The equity allocation is managed with a conservative bias that favors large capitalization companies that we believe are well managed with a niche or business specialty. The fixed income component invests in high quality U.S. government and corporate bonds primarily of intermediate maturity and seeks to provide shareowners with current income in addition to some protection from equity market volatility. We tend to maintain a long term investment orientation with both the stock and bond investments in the Fund.
Describe the relevant market environment as it related to the Fund for the reporting period.
The market environment was influenced by many positive factors including: generally subdued inflation, improving corporate earnings, and modest positive growth in Gross Domestic Product (GDP) – all factors that contributed to improved investor confidence and an increase in equity market price-to-earnings (P/E) valuations. In addition, the Federal Reserve maintained an accommodative monetary policy by leaving the Fed Funds Rate unchanged in a target range of 0% to 0.25%, where it remained for the entire 12-month period ended November 30, 2013.
However, the market environment was not without its challenges. In December 2012, equity markets became concerned with the U.S. congressional budget vote on what was known as the “fiscal cliff” and the impacts of the resulting fiscal decisions. During February and March, several international equity markets turned negative and became increasingly volatile as unresolved concerns about sovereign debt issues in several European countries as well as a banking crisis in the small island nation of Cyprus weighed on investor sentiment. Throughout the second half of the fiscal year, the markets were focused on commentary from the Federal Reserve about its intentions and timing of potentially reducing its asset-purchase programs known as “quantitative easing.” In addition, in the fall of 2013, the markets digested renewed fears of the fiscal cliff and a two week U.S. government shutdown in October 2013.
Throughout the year, oil and gold prices were volatile. Oil prices began the period at around $89/barrel and ranged between approximately $86 and $111/barrel during the period, before ending the period November 2013 around $93/barrel, an increase of 4% for the 12-month period. Gold prices began the period at around $1,711 per troy ounce and ranged between approximately $1,183 and $1,722 per troy ounce during the period, before ending the period November 2013 around $1,251/oz., a decrease of –27% for the 12-month period.
Despite the sovereign debt crisis in Europe, the U.S. dollar fell against the euro during the period. For the period December 2012 through November 2013, the U.S. dollar declined by approximately –4% to $1.36/euro. Versus the British pound, the U.S. dollar fell by approximately –2% during the period to $1.64/£.
The 12-month total return for the S&P 500 Index was 30.30% for the period ended November 30, 2013. The total return for the period reflected an increase in corporate earnings per share for the S&P 500 Index companies of approximately 6%, an expansion of the price/earnings valuation of the S&P 500 Index of approximately 22%, and a dividend return of approximately 2.20%.
Bond markets, as represented by the Barclays Intermediate Government/Credit Index, generated a total return of
–0.33% during the 12-month period ended November 30, 2013. The performance of the Index was comprised of the Intermediate Credit-portion (35.8% Index weighting), which posted a total return of 0.30%, and the Intermediate Government-portion (64.2% Index weighting), which generated a total return of –0.68%. The total return of the Intermediate Credit-portion was comprised of a price return of –3.45% and a coupon return of 3.75%. Meanwhile, the total return of the Intermediate Government-portion was comprised of a price return of –2.48% and a coupon return of 1.80%.1
8
Provide an illustration of the Fund’s investments.
Fund Composition*
(unaudited)
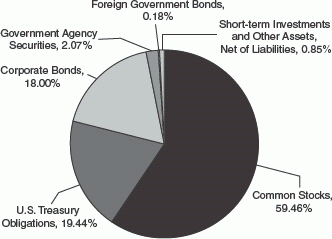
| | * | Illustrated by Type of Security and based on total net assets as of November 30, 2013. Please refer to the Schedule of Investments later in this report for details concerning Fund holdings. |
9
How did the Fund perform during the reporting period?
For the 1-year period ended November 30, 2013, the State Farm Balanced Fund had a total return of 12.59% after expenses. The total return of the blended benchmark was 17.21% for the same period. The blended benchmark used is a combination of 60% S&P 500 Index and 40% Barclays Intermediate Government/Credit Index (rebalanced on a monthly basis). The total return of the all equity benchmark S&P 500 Index was 30.30%, while the fixed income benchmark Barclays Intermediate Government/Credit Index had a total return of –0.33% over the same time period. The line graph below provides additional perspective on the Fund’s long term results.
Comparison of change in value of $10,000 investment
for the years ended November 30
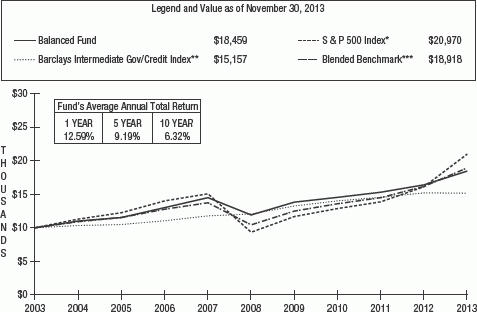
The performance data quoted above represents past performance and does not guarantee future results. Investment return and principal value will fluctuate and Fund shares, when redeemed, may be worth more or less than their original cost. Recent performance may be less than the figures shown. Obtain total returns current to the most recent month-end by calling our Mutual Funds Response Center at 1-800-447-0740. These figures do not reflect the deduction of taxes that a shareholder would pay on Fund distributions or the redemption of Fund shares.
| | |
| |
| * | | The S&P 500 Index is a capitalization-weighted measure of the common stocks of 500 large U.S. companies. |
| |
| ** | | The Barclays Intermediate Government/Credit Index contains approximately 4,758 U.S. Treasury, corporate and other securities with an average maturity of about 4.17 years. |
| |
| *** | | State Farm Investment Management Corp. computes the Blended Benchmark using 60% S&P 500 Index and 40% Barclays Intermediate Gov/Credit Index (rebalanced on a monthly basis). |
| |
| | The S&P 500 Index and the Barclays Intermediate Gov/Credit Index represent unmanaged groups of stocks and bonds that differ from the composition of the Balanced Fund. Unlike an investment in the Balanced Fund, theoretical investments in the Indices or Blended Benchmark do not reflect any expenses. It is not possible to invest directly in an index or the Blended Benchmark. |
10
Performance Analysis
What factors helped and hindered performance during the reporting period?
Equity portion of the Fund (59.46% of total net assets at the end of the period)
The tables below show the equity securities that were the leading contributors and detractors to Fund performance during the period as well as the performance of the top ten equity holdings of the Fund.
Performance of Top 5 Contributors
| | | | | | |
Security | | Sector | | % of Net Assets
as of 11/30/13 | | 12/1/12 to 11/30/13
% Price Change |
| Walt Disney Co., The | | Media & Broadcasting | | 4.9% | | 42% |
| Archer-Daniels-Midland Co. | | Agriculture, Foods, & Beverage | | 2.5% | | 51% |
| Hewlett-Packard Co. | | Computers | | 1.3% | | 111% |
| Johnson & Johnson | | Health Care | | 2.6% | | 36% |
| Wells Fargo & Co. | | Banks | | 2.1% | | 33% |
Performance of Top 5 Detractors
| | | | | | |
Security | | Sector | | % of Net Assets
as of 11/30/13 | | 12/1/12 to 11/30/13
% Price Change |
| International Business Machines Corp. | | Computers | | 1.8% | | -5% |
| Newmont Mining Corp. | | Mining & Metals | | 0.05% | | -47% |
| BHP Billiton PLC | | Mining & Metals | | 0.3% | | -3% |
| Catepillar Inc. | | Machinery & Manufacturing | | 1.4% | | -1% |
| Royal Dutch Shell PLC ADR Class A | | Oil & Gas | | 0.9% | | -0.4% |
| | | | | | | |
| | | | | | | |
| | | | | | | |
Performance of Top 10 Holdings
| | | | | | |
Security | | Sector | | % of Net Assets
as of 11/30/13 | | 12/1/12 to 11/30/13
% Price Change |
| Walt Disney Co., The | | Media & Broadcasting | | 4.9% | | 42% |
| Sigma-Aldrich Corp. | | Chemicals | | 2.7% | | 19% |
| Exxon Mobil Corp. | | Oil & Gas | | 2.7% | | 6% |
| Procter & Gamble Co., The | | Consumer & Marketing | | 2.6% | | 21% |
| Johnson & Johnson | | Health Care | | 2.6% | | 36% |
| Archer-Daniels-Midland Co. | | Agriculture, Foods, & Beverage | | 2.5% | | 51% |
| Chevron Corp. | | Oil & Gas | | 2.3% | | 16% |
| Wells Fargo & Co. | | Banks | | 2.1% | | 33% |
International Business Machines Corp. | | Computers | | 1.8% | | -5% |
| Air Products & Chemicals Inc. | | Chemicals | | 1.6% | | 31% |
Turnover in the equity portion of the State Farm Balanced Fund’s portfolio over the past 12 months was 1.14%, which is consistent with the Fund’s investment philosophy and approach. There were 76 holdings in the equity portion of the Fund totaling approximately $916 million in assets at the end of the reporting period compared to 72 holdings and approximately $738 million in assets one year earlier. We also feel that a company’s dividend policy is an important component in the analysis and selection of equity securities for the State Farm Balanced Fund. From December 1, 2012, through November 30, 2013, 51 of the stocks in the portfolio, accounting for over 70% of the equity portion of the Fund’s net assets, increased their dividends.
Fixed Income portion of the Fund (40.13% of total net assets at the end of the period)
An intermediate maturity structure continues to be the Fund’s investment orientation with 75.6% of the fixed income securities (representing 30.4% of total net assets) maturing within 3-11 years. These securities included U.S. Treasury securities (19.44% of total net assets) and corporate bonds (18.00% of total net assets). From a credit rating standpoint, the majority of the fixed income portion of the Fund was invested in Aaa-rated securities, including U.S. Treasury bonds and certain corporate bonds (50.2% of fixed income assets). The remaining corporate fixed income portfolio was invested in Aa-rated bonds (9.9% of fixed income assets), single A-rated debt (29.2% of fixed income assets), and Baa-rated bonds (4.8% of fixed income assets).2
| | 2 | Ratings by Moody’s Investor Services Inc. (“Moody’s”). Percentages are based on total fixed income investments as of November 30, 2013. Of the remaining fixed income investments, 4.37% were not rated by Moody’s, and 1.09% were short-term investments. |
11
The negative total return of the fixed income portion of the Fund over the 12-month period was generated by the Fund’s holdings of U.S. Treasury securities and corporate bonds, which both had negative total returns in the low-single digits. The Fund’s corporate bonds provided the greatest detraction to the returns of the fixed income portion of the Fund. The Fund’s fixed-income investment orientation of investing in intermediate-term, higher quality bonds helped to provide stability and serve as a buffer to the volatility from the equity portion of the State Farm Balanced Fund throughout the year. The duration of the State Farm Balanced Fund’s bond portfolio at the end of November 2013 stood at 4.8 years, which is up from 4.6 years on December 1, 2012. Duration is a statistical calculation that measures a bond’s (or in this case, a bond portfolio’s) price sensitivity relative to general movements in interest rates.
Given the performance analysis above, what factors should shareholders take into consideration when reviewing the Fund’s performance?
The Fund is designed and managed as a balanced fund that blends both stocks and bonds together in one convenient investment. Given that structure, performance for the Fund over the long term will typically (but not always) fall somewhere in between the return of a stock index like the S&P 500 Index and a bond index like the Barclays Intermediate Government/Credit Index.
12
State Farm Interim Fund Management’s Discussion of Fund Performance (unaudited)
Overview
Describe the Fund’s investment objective and philosophy.
The State Farm Interim Fund is managed in a fashion that seeks to achieve over a period of years, the highest yield consistent with relatively low price volatility. When managing the Fund, we are generally buy-and-hold investors who focus primarily on U.S. Government obligations. General investment practice within the Fund is to distribute the Fund’s investments in varying amounts among securities maturing in up to six or seven years from the time of purchase, but may occasionally purchase securities maturing in up to 15 years.
Describe the relevant market environment as it related to the Fund for the reporting period.
Throughout the 1-year period ended November 30, 2013, fixed income markets were impacted by factors including: generally subdued inflation, improving corporate earnings, and modest positive growth in Gross Domestic Product (GDP). Moreover, the Federal Reserve maintained an accommodative monetary policy by leaving the Fed Funds Rate unchanged in a target range of 0% to 0.25%, where it remained for the entire 12-month period ended November 30, 2013.
Interest rates were affected by concerns arising from the December 2012 U.S. congressional budget vote on what was known as the “fiscal cliff” and the anticipated impacts of the resulting fiscal decisions. In addition, during the second half of the fiscal year, the markets were focused on commentary from the Federal Reserve about its intentions and timing of potentially reducing its asset-purchase programs known as “quantitative easing.” In the fall of 2013, the markets digested renewed fears of another fiscal cliff and a two week U.S. government shutdown in October 2013.
During the 1-year period, the U.S. Treasury yield curve steepened with interest rates rising on long- and intermediate-maturity U.S. Treasuries, while decreasing or remaining flat on shorter-maturity U.S. Treasuries. For example, the yield on 10-year U.S. Treasuries increased 113 basis points from 1.62% at the beginning of the period, to 2.75% on November 30, 2013, while the yield on 2-year U.S. Treasuries increased only 3 basis points from 0.25% at the beginning of the period, to 0.28% on November 30, 2013. Short-term yields remained at low levels, with 3-month U.S. Treasury yields decreasing from 0.08% at the beginning of the period, to 0.06% on November 30, 2013.
Overall, for the year ended November 30, 2013, short- and intermediate-maturity U.S. Treasuries outperformed relative to longer-maturity U.S. Treasuries. For the 1-year period, the total return for 1-3 year U.S. Treasuries and Intermediate-maturity U.S. Treasuries were 0.53% and –0.76%, respectively, compared to a total return of –14.03% on 20+ year U.S. Treasuries.
13
Provide an illustration of the Fund’s investments.
Provided below is the maturity allocation of the Interim Fund as of November 30, 2013, along with the maturity allocation of the Barclays 1-5 Year U.S. Treasury Index for comparison.
Maturity Allocation: State Farm Interim Fund
compared to the Barclays 1-5 Year U.S. Treasury Index
(unaudited)*
| | | | | | |
Maturity | | State Farm
Interim Fund
Allocation | | Barclays
1-5 Year U.S. Treasury Index
Allocation | | |
0 - 1 Years | | 10.75%** | | 0.00% | | |
1 - 2 Years | | 12.33% | | 33.27% | | |
2 - 3 Years | | 13.01% | | 27.06% | | |
3 - 4 Years | | 13.64% | | 20.60% | | |
4 - 5 Years | | 30.93% | | 16.06% | | |
5 - 6 Years | | 19.34% | | 3.01% | | |
6+ Years | | 0.00% | | 0.00% | | |
| | | | | | | |
Totals | | 100.00% | | 100.00% | | |
| | * | Illustrated by Maturity and based on total investments for the Fund and total securities for the Index as of November 30, 2013. Please refer to the Schedule of Investments later in this report for details concerning Fund holdings. | |
| | ** | Includes a 0.14% allocation to the JPMorgan U.S. Government Money Market Fund. | |
14
How did the Fund perform during the reporting period?
For the 1-year period ended November 30, 2013, the State Farm Interim Fund had a total return of –0.51% after expenses, compared to a total return of 0.25% for the Barclays 1-5 Year U.S. Treasury Index. The line graph below provides perspective on the Fund’s long term results.
Comparison of change in value of $10,000 investment
for the years ended November 30
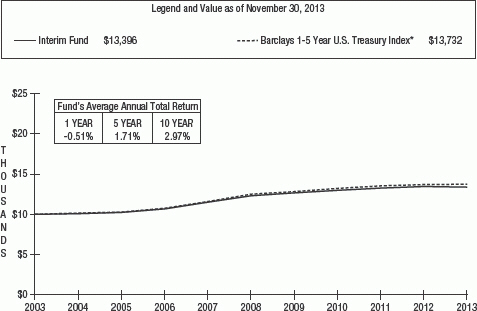
The performance data quoted above represents past performance and does not guarantee future results. Investment return and principal value will fluctuate and Fund shares, when redeemed, may be worth more or less than their original cost. Recent performance may be less than the figures shown. Obtain total returns current to the most recent month-end by calling our Mutual Funds Response Center at 1-800-447-0740. These figures do not reflect the deduction of taxes that a shareholder would pay on Fund distributions or the redemption of Fund shares.
Performance Analysis
What factors helped and hindered performance during the reporting period?
Short-maturity U.S. Treasury Notes provided a positive total return while U.S. Treasury Notes with maturities greater than four years had a negative total return for the 1-year period. The Fund’s exposure to U.S. Treasury Notes with maturities greater than four years contributed to the Fund underperforming its benchmark. As mentioned earlier, the Fund generally maintains exposure across a six-year maturity spectrum. As U.S. Treasury Notes mature, they are reinvested in U.S. Treasury Notes at prevailing interest rate levels.
The duration of the State Farm Interim Fund at the end of November 2013 stood at 3.3 years, which is up from 3.2 years on December 1, 2012. The Fund’s duration was higher than the duration of its benchmark (the Barclays 1-5 Year U.S. Treasury Index) of 2.6 years as of November 30, 2013. In an environment of rising interest rates during the reporting period, the Fund underperformed relative to its benchmark due in part to its higher duration orientation. Duration is a statistical calculation that measures a bond’s (or in this case, a bond fund’s) price sensitivity relative to general movements in interest rates.
Given the performance analysis above, what factors should shareholders take into consideration when reviewing the Fund’s performance?
Given its investment objective of high current income consistent with low price volatility, the Fund is designed to be a stable, low risk element of a diversified portfolio. As interest rates fall, bond prices rise and vice versa. If interest rates remain at current low levels or decline further, total returns (interest plus price gains) may increase. Conversely, if interest rates increase, total returns may decline.
| * | The Barclays 1-5 Year U.S. Treasury Index measures the performance of short-term U.S. Treasury Securities maturing within one to five years. |
The Barclays 1-5 Year U.S. Treasury Index represents an unmanaged group of bonds that differs from the composition of the Interim Fund. Unlike an investment in the Interim Fund, a theoretical investment in the Index does not reflect any expenses. It is not possible to invest directly in an index.
15
State Farm Municipal Bond Fund Management’s Discussion of Fund Performance (unaudited)
Overview
Describe the Fund’s investment objective and philosophy.
The State Farm Municipal Bond Fund seeks as high a rate of income exempt from federal income taxes as is consistent with prudent investment management. Income may be subject to state and local taxes and (if applicable) the Alternative Minimum Tax (AMT). In managing the Fund, we focus on high credit quality bonds with an investment philosophy that seeks to provide competitive total returns, while managing for tax efficiency within the municipal bond asset class over the long run. The municipal bond market, while relatively small in total assets compared to the taxable market, is very broad by number of issuers. As a result, we believe that fundamental research and professional management are critical to success. While we diversify the maturity spectrum of the bonds within the portfolio, we tend to favor the intermediate-maturity range for the bulk of the Fund’s assets. The Fund also seeks to remain invested mainly in bonds of high-credit quality in an attempt to reduce the risk of loss to investment principal as a result of credit losses.
In selecting securities for the Fund, we generally invest in the 5-15 year maturity range and avoid long maturities. While we are conscious of how the Fund’s portfolio differs from its benchmark, the Barclays 7-Year Municipal Bond Index, we do not make decisions based upon the Index.
Describe the relevant market environment as it related to the Fund for the reporting period.
Throughout the 1-year period ended November 30, 2013, fixed income markets were impacted by factors including: generally subdued inflation, improving corporate earnings, and modest positive growth in Gross Domestic Product (GDP). Moreover, the Federal Reserve maintained an accommodative monetary policy by leaving the Fed Funds Rate unchanged in a target range of 0% to 0.25%, where it remained for the entire 12-month period ended November 30, 2013.
Interest rates were affected by concerns arising from the December 2012 U.S. congressional budget vote on what was known as the “fiscal cliff” and the anticipated impacts of the resulting fiscal decisions. In addition, during the second half of the fiscal year, the markets were focused on commentary from the Federal Reserve about its intentions and timing of potentially reducing its asset-purchase programs known as “quantitative easing.” In the fall of 2013, the markets digested renewed fears of another fiscal cliff and a two week U.S. government shutdown in October 2013.
As illustrated in Table 1 below, the municipal bond yield curve steepened as intermediate- and longer-maturity yields increased while short-maturity yields declined over the 1-year period ended November 30, 2013.
Table 1: Municipal Market Data (MMD) Yields (%) - AAA-Rated General Obligation Municipal Bonds1
| | | | | | | | |
Date | | 1-Year | | 5-Year | | 10-Year | | 20-Year |
December 1, 2012 | | 0.20% | | 0.64% | | 1.47% | | 2.10% |
November 30, 2013 | | 0.17% | | 1.16% | | 2.65% | | 3.77% |
| | | | | | | | | |
Increase (Decrease) in Yield | | -0.03% | | 0.52% | | 1.18% | | 1.67% |
| | 1 | The Municipal Market Data AAA yield curve is indicative of AAA tax-exempt offered-side, institutional yield levels and may vary from actual yields attained. Source: © 2013 Thomson Reuters. Information provided by Thomson Reuters is not intended for trading purposes, nor do they provide any form of advice (investment, tax, legal) amounting to investment advice, or make any recommendations regarding particular financial instruments, investments or products. Neither Thomson Reuters nor its third party content providers shall be liable for any errors, inaccuracies, or for any actions taken in reliance thereon. THOMSON REUTERS EXPRESSLY DISCLAIMS ALL WARRANTIES, EXPRESSED OR IMPLIED, AS TO THE ACCURACY OF THE INFORMATION, OR AS TO THE FITNESS OF THE INFORMATION FOR ANY PURPOSE. |
As illustrated in Table 2 below, annual total returns (as of November 30, 2013) on various components of the Barclays Municipal Bond Index were negative along the longer-end of the maturity yield curve.
Table 2: Barclays Municipal Bond Index - Component Returns by Maturity2
| | |
| | | Annual Total Return |
| Maturity | | (as of November 30, 2013) |
1-Year Municipal Bonds | | 0.77% |
3-Year Municipal Bonds | | 1.19% |
5-Year Municipal Bonds | | 0.33% |
7-Year Municipal Bonds | | -1.77% |
10-Year Municipal Bonds | | -3.24% |
15-Year Municipal Bonds | | -4.66% |
20-Year Municipal Bonds | | -5.72% |
Long-Bond (22+ Year) Municipal Bonds | | -7.18% |
| | 2 | Source: Barclays Live®. Past performance does not guarantee future results. The data illustrated provides component annual total returns by municipal bond maturities of the Barclays Municipal Bond Index. |
16
From a total return standpoint, the higher end of investment-grade quality municipal bonds (Aaa and Aa rated bonds) outperformed relative to lower investment-grade quality municipal bonds (A and Baa rated bonds) within the Barclays Municipal Bond Index over the reporting period as illustrated by those credit quality component returns in Table 3 below.
Table 3: Barclays Municipal Bond Index - Component Returns by Credit Quality Ratings3
| | |
Credit Quality | | Annual Total Return
(as of November 30, 2013) |
Aaa Rated Bonds | | -2.43% |
Aa Rated Bonds | | -3.03% |
A Rated Bonds | | -3.76% |
Baa Rated Bonds | | -7.74% |
| | 3 | Source: Barclays Live®. Past performance does not guarantee future results. The data illustrated provides component annual total returns by credit quality ratings of the Barclays Municipal Bond Index. |
As of November 30, 2013, the 3.77% yield on 20-year Aaa-rated municipal bonds exceeded the 3.54% yield offered on comparable 20-year taxable U.S. Treasuries by 23 basis points, which is not a normal yield spread relationship. Typically, long-term municipal bonds offer approximately 75% to 90% of the yields available on comparable U.S. Treasuries because of the income tax benefits associated with municipal bonds. This yield comparison has been typically used as a general gauge within the industry to determine the relative attractiveness of municipal securities.
Provide an illustration of the Fund’s investments.
Provided below is the maturity allocation of the Municipal Bond Fund as of November 30, 2013, along with the maturity allocation of the Barclays 7-Year Municipal Bond Index for comparison.
Maturity Allocation: State Farm Municipal Bond Fund
compared to the Barclays 7-Year Municipal Bond Index
(unaudited)*
| | | | |
Maturity | | State Farm
Municipal Bond Fund
Allocation | | Barclays
7-Year Municipal Bond Index
Allocation |
0-6 Years | | 20.63%** | | 0.00% |
6-12 Years | | 57.01% | | 100.00% |
12-22 Years | | 22.36% | | 0.00% |
22+ Years | | 0.00% | | 0.00% |
| | | | | |
Totals | | 100.00% | | 100.00% |
| | * | Illustrated by Maturity and based on total investments for the Fund and total securities for the Index as of November 30, 2013. Please refer to the Schedule of Investments later in this report for details concerning Fund holdings. | |
| | ** | Includes a 0.77% allocation to the JPMorgan Tax Free Money Market Fund. | |
How did the Fund perform during the reporting period?
The State Farm Municipal Bond Fund had a total return of –2.05% for the 1-year period ended November 30, 2013, after expenses, compared to a –1.77% for the Barclays 7-Year Municipal Bond Index. The line graph below provides additional perspective on the Fund’s long term results.
17
Comparison of change in value of $10,000 investment
for the years ended November 30
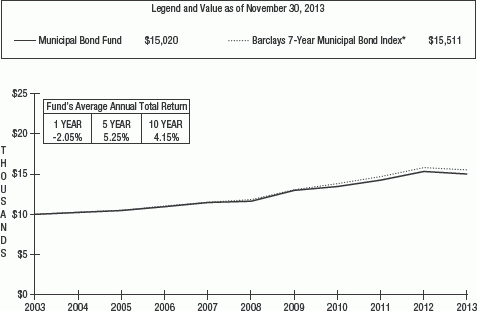
The performance data quoted above represents past performance and does not guarantee future results. Investment return and principal value will fluctuate and Fund shares, when redeemed, may be worth more or less than their original cost. Recent performance may be less than the figures shown. Obtain total returns current to the most recent month-end by calling our Mutual Funds Response Center at 1-800-447-0740. These figures do not reflect the deduction of taxes that a shareholder would pay on Fund distributions or the redemption of Fund shares.
Performance Analysis
What factors helped and hindered performance during the reporting period?
The Fund produced a negative total return for the 1-year period. As illustrated in Table 2 above, longer-maturity bonds underperformed intermediate maturities, which in turn underperformed short maturities over the 1-year period. Consistent with the Fund’s intermediate-maturity orientation, none of the Fund’s total investments were in bonds having maturities over 22 years as of November 30, 2013. Relative to the Barclays 7-Year Municipal Bond Index, the Fund had a higher concentration in bonds having maturities between 12-22 years, which underperformed relative to intermediate-maturity bonds during the year. This factor played a part in the Fund underperforming the Barclays 7-Year Municipal Bond Index during the reporting period.
We seek to maintain the risk profile of the Fund with respect to volatility (duration), interest rate risk and capital (credit risk). Throughout the reporting period, the Fund’s modified duration decreased slightly from 4.50 years as of December 1, 2012 to 4.44 years as of November 30, 2013. Modified duration is a statistical calculation that measures a bond’s (or in this case, a bond fund’s) price sensitivity relative to general movements in interest rates. The Fund maintained a high quality credit orientation consistent with the Fund’s historical investment philosophy throughout the reporting period ended November 30, 2013.
Table 4 below provides an illustration of the Fund’s credit quality orientation compared to the Index benchmark as of November 30, 2013. Over the reporting period, the higher end of investment-grade quality municipal bonds (Aaa and Aa rated bonds) outperformed relative to lower investment-grade quality municipal bonds (A and Baa rated bonds) as previously illustrated in Table 3 above.
| * | The Barclays 7-Year Municipal Bond Index is an unmanaged index comprised of investment grade municipal bonds with maturities of six to eight years. |
| | The Barclays 7-Year Municipal Bond Index differs from the composition of the Municipal Bond Fund. Unlike an investment in the Municipal Bond Fund, a theoretical investment in the Index does not reflect any expenses. It is not possible to invest directly in an index. |
18
Table 4: Credit Ratings Comparison (as of November 30, 2013)4
| | | | | | | | |
Credit Ratings | | State Farm
Municipal Bond Fund
Allocation | | | Barclays
7-Year Municipal Bond Index
Allocation | |
Aaa/AAA | | | 10.22% | | | | 14.72% | |
Aa/AA | | | 74.38% | | | | 52.13% | |
A | | | 12.03% | | | | 26.42% | |
Baa/BBB or Lower | | | 0.00% | | | | 6.21% | |
NR (Not Rated) | | | 3.37%* | | | | 0.52% | |
| | | | | | | | | |
Totals | | | 100.00% | | | | 100.00% | |
| | 4 | Illustrated by Credit Quality and based on total investments for the Fund and total securities for the Index as of November 30, 2013. Reflects the lower of Moody’s and Standard and Poor’s issuer specific ratings. The issuer specific ratings do not reflect any bond insurer rating. |
| | * | Includes a 0.77% allocation to the JPMorgan Tax Free Money Market Fund. |
As highlighted earlier, the difference in maturity structure between the Fund and its benchmark along with the Fund’s higher credit quality orientation than its benchmark played a role in the Fund’s relative performance versus the benchmark during the reporting period. The objective of the Fund is to seek as high a rate of income exempt from federal income taxes as is consistent with prudent investment management. The Fund has been invested with a bias towards high-credit quality, intermediate maturity bonds. Adopting additional risk by increasing duration significantly and/or increasing the weighting in lower-credit quality bonds would not have been consistent with the Fund’s historical investment philosophy.
The number of individual bonds held in the portfolio over the reporting period increased by one, from 438 to 439 bonds. Turnover for the reporting period was 10.5%. Investments within the State of Florida represented the largest single allocation in any state representing 6.20% of total net assets, which is up from 5.90% from the beginning of the reporting period.
The largest additions to the portfolio included net acquisitions of bonds in Michigan and Arkansas. Bonds secured by a general obligation pledge accounted for approximately 80% of all new acquisitions with revenue bond purchases representing 20% of the total. The average ratings quality of new bond purchases was Aa/AA. The largest net reduction of holdings occurred through sales and maturities of bonds in Louisiana and Illinois.
Given the performance analysis above, what factors should shareholders take into consideration when reviewing the Fund’s performance?
The State Farm Municipal Bond Fund seeks a high level of income exempt from federal income tax through investment in a diversified portfolio of high quality bonds. We utilize a long-term philosophy seeking to provide competitive total returns relative to the municipal bond asset class while managing for tax efficiency.
19
Expense Example (unaudited)
As a shareholder of a Fund, you incur ongoing costs, including management fees and other Fund expenses. The Example in the following table is intended to help you understand your ongoing costs (in dollars) of investing in a Fund and to compare these costs with the ongoing costs of investing in other mutual funds.
The Example is based on an investment of $1,000 invested at the beginning of the period and held for the entire period as stated in the table below.
Actual Expenses
The first line under each Fund name in the table below provides information about actual account values and actual expenses. You may use the information in this line, together with the amount you invested, to estimate the expenses that you paid over the period. Simply divide your account value for a Fund by $1,000 (for example, an $8,600 account value divided by $1,000 = 8.6), then multiply the result by the number in the first line under the heading entitled “Expenses Paid During Period” for the applicable Fund to estimate the expenses you paid on your account for that Fund during this period. If your account has multiple Fund positions, add up the results calculated for each Fund position within your account to estimate the expenses you paid on your total account value. A potential account fee of $10 per calendar quarter is not included in the expenses shown in the table. This fee will be charged to an account (other than a SEP IRA, SIMPLE IRA, Archer Medical Savings Account, Tax Sheltered Account under §403(b)(7) of the Internal Revenue Code or an account held under other employer-sponsored qualified retirement plans) if the balance in the account falls below $5,000 at the close of business on the second business day of the last month of the calendar quarter, unless the account has been open for less than a year as of the second business day of the last month of the calendar quarter. You should consider any account fee you incurred when estimating the total ongoing expenses paid over the period and the impact of this fee on your ending account value. This additional fee has the effect of reducing investment returns.
Hypothetical Example for Comparison Purposes
The second line under each Fund name in the table below provides information about hypothetical account values and hypothetical expenses based on the Fund’s actual expense ratio and an assumed rate of return of 5% per year before expenses, which is not the Fund’s actual return. The hypothetical account values and expenses may not be used to estimate the actual ending account balance or expenses you paid for the period. You may use this information to compare the ongoing costs of investing in the Fund and other funds. To do so, compare this 5% hypothetical example with the 5% hypothetical examples that appear in the shareholder reports of the other funds. A potential account fee of $10 per calendar quarter is not included in the expenses shown in the table. This fee will be charged to an account (other than a SEP IRA, SIMPLE IRA, Archer Medical Savings Account, Tax Sheltered Account under §403(b)(7) of the Internal Revenue Code or an account held under other employer-sponsored qualified retirement plans) if the balance in the account falls below $5,000 at the close of business on the second business day of the last month of the calendar quarter, unless the account has been open for less than a year as of the second business day of the last month of the calendar quarter. You should consider any account fee that you incurred when estimating the total ongoing expenses paid over the period and the impact of this fee on your ending account value. This additional fee has the effect of increasing the costs of investing.
Please note that the expenses shown in the table are meant to highlight your ongoing costs only. Therefore, the second line under each Fund name in the table is useful in comparing ongoing costs only, and will not help you determine the relative total costs of owning different funds, including those that have transactional costs, such as sales charges (loads), redemption fees, or exchange fees.
| | | | | | | | | | | | | | | | | | | | |
| | | Beginning
Account Value
June 1, 2013 | | Ending
Account Value
November 30, 2013 | | Annualized Expense
Ratio Based
on the Period
June 1, 2013 to
November 30, 2013 | | Expenses Paid
During Period
June 1, 2013 to
November 30, 2013* |
| | | | |
State Farm Growth Fund | | | | | | | | | | | | | | | | | | | | |
| | | | |
Actual | | | $ | 1,000.00 | | | | $ | 1,091.06 | | | | | 0.12 | % | | | $ | 0.63 | |
| | | | |
Hypothetical (5% return before expenses) | | | $ | 1,000.00 | | | | $ | 1,024.47 | | | | | 0.12 | % | | | $ | 0.61 | |
| | | | |
State Farm Balanced Fund | | | | | | | | | | | | | | | | | | | | |
| | | | |
Actual | | | $ | 1,000.00 | | | | $ | 1,050.20 | | | | | 0.13 | % | | | $ | 0.67 | |
| | | | |
Hypothetical (5% return before expenses) | | | $ | 1,000.00 | | | | $ | 1,024.42 | | | | | 0.13 | % | | | $ | 0.66 | |
| | | | |
State Farm Interim Fund | | | | | | | | | | | | | | | | | | | | |
| | | | |
Actual | | | $ | 1,000.00 | | | | $ | 1,002.06 | | | | | 0.16 | % | | | $ | 0.80 | |
| | | | |
Hypothetical (5% return before expenses) | | | $ | 1,000.00 | | | | $ | 1,024.27 | | | | | 0.16 | % | | | $ | 0.81 | |
| | | | |
State Farm Municipal Bond Fund | | | | | | | | | | | | | | | | | | | | |
| | | | |
Actual | | | $ | 1,000.00 | | | | $ | 989.19 | | | | | 0.16 | % | | | $ | 0.80 | |
| | | | |
Hypothetical (5% return before expenses) | | | $ | 1,000.00 | | | | $ | 1,024.27 | | | | | 0.16 | % | | | $ | 0.81 | |
| * | Expenses are equal to the applicable Fund’s annualized expense ratio (provided in the table), multiplied by the average account value over the period, multiplied by 183/365 (to reflect the one-half year period). |
20
Board Approval of Investment Advisory Agreement (unaudited)
At a meeting of the Board of Trustees (the “Board”) of State Farm Associates’ Funds Trust (“Associates’ Funds Trust”) held on June 14, 2013 all of the Trustees present, including those Trustees who were not “interested persons” as defined by Section 2(a)(19) of the Investment Company Act of 1940, as amended (the “Independent Trustees”), of Associates’ Funds Trust, approved the continuation of the Investment Advisory and Management Services Agreement between State Farm Investment Management Corp. (“SFIMC”) and Associates’ Funds Trust (the “Advisory Agreement”).
In considering whether to approve the continuation of the Advisory Agreement, the Independent Trustees were assisted in their review by independent legal counsel, which had sent to SFIMC a request for information to be provided to the Independent Trustees in connection with their consideration of the continuation of the Advisory Agreement. SFIMC provided materials to the Independent Trustees responding to that request, including a fund-by-fund profitability analysis on each series of the Associates’ Funds Trust (each, a “Fund,” and collectively, the “Funds”), as well as an explanation of the methodology by which SFIMC had calculated that profitability. SFIMC also provided the Board with additional information that SFIMC believed would be useful to the Board in evaluating whether to approve the continuation of the Advisory Agreement. The Board also received a report prepared by Strategic Insight, an independent fund tracking organization (the “Strategic Insight Report”), relating to the performance and expenses of each Fund. In addition, the Board received and reviewed a memorandum from the legal counsel to Associates’ Funds Trust and its Independent Trustees regarding their responsibilities (particularly the Independent Trustees’ responsibilities) in considering whether to approve the continuation of the Advisory Agreement.
The Independent Trustees of Associates’ Funds Trust reviewed these materials at meetings held on March 15, 2013, May 29, 2013, and June 14, 2013, during which meetings SFIMC management responded to specific questions from the Independent Trustees and provided follow-up information. The Independent Trustees discussed all of this material extensively among themselves, with their independent legal counsel and with the other Board members, after which the Board considered various factors described below, no one of which alone was considered dispositive. However, the material factors and conclusions that formed the basis for the Board’s determination to approve the continuation of the Advisory Agreement are discussed separately below.
Investment Performance
The Board considered the performance of each Fund. Among other things, the Board examined the year-to-date, one-, three-, five- and ten-year performance of each Fund as compared to the performance of one or more benchmark indexes and a peer group of funds with comparable investment objectives, investment strategies, asset size and no-load structures compiled by Strategic Insight (“Peer Funds”). The Board considered the information contained in the Strategic Insight Report relating to the overall performance of the Funds, including as compared to each Fund’s benchmark and/or index and Peer Funds. The Board noted the favorable long-term performance of the Growth and Balanced Funds compared to each Fund’s benchmark(s) and Peer Funds. The Board noted that the short-term performance of the Growth Fund and Balanced Fund had moderately lagged the performance of each Fund’s benchmark(s) and Peer Funds given the conservative nature by which SFIMC manages those Funds. In that regard, management confirmed to the Board its philosophy to manage the Growth Fund and Balanced Fund in a manner such that the Funds generally will tend to underperform their benchmarks and Peer Funds in periods of strong market performance or periods in which increased risk is rewarded. The Board and management noted that over long-term market cycles, this conservative investment approach generally has provided competitive investment performance for these two Funds and for the other Funds of Associates’ Funds Trust. The Board also noted the favorable performance of the Interim and Municipal Bond Funds compared to each Fund’s benchmark(s) and Peer Funds. After extensive discussion of this and other performance information, the Board concluded that the investment performance of the Funds over the periods reviewed was acceptable.
Fees and Expenses
The Board examined the fee structure and expense ratio of each Fund, including in comparison to Peer Funds. The Board concluded that each Fund’s expense structure and overall fees were relatively low and were acceptable. In connection with examining the fee structure and expense ratio of each Fund, the Board considered the amount of profits earned (or losses incurred) by SFIMC in providing advisory and management services to each Fund, as well as the methodology by which that profit (or loss) was calculated. The Board concluded that each Fund’s expense structure and overall fees were acceptable.
In the context of reviewing the Funds’ fees, the Board also discussed the extent to which economies of scale will be realized as each Fund grows and whether each Fund’s fee levels reflect economies of scale for the benefit of the Fund. Economies of scale occur when a mutual fund’s expenses per unit, such as per dollar invested in the fund, decreases as the fund increases in size. The Board considered that the Advisory Agreement includes breakpoints for each Fund, which can lead to economies of scale for Fund shareholders as assets increase.
21
Nature, Extent and Quality of Services
The Board considered the nature, extent and quality of the advisory services provided by SFIMC to the Funds. The Board considered the make-up, education and experience of the SFIMC investment management teams responsible for managing the Funds, and concluded that these teams have a satisfactory, long-term track record in managing the Funds. The Board also considered the compliance environment of the Funds, and SFIMC’s management of that environment. After considering this information, the Board concluded that SFIMC had more than sufficient resources and expertise to capably continue to manage the Funds.
The Board next discussed whether SFIMC derives any other direct or indirect benefits from serving as investment adviser to the Funds. SFIMC discussed the various ancillary services that it provides the Funds, including serving as transfer agent, and its affiliate, State Farm VP Management Corp., serving as the Funds’ distributor. SFIMC explained to the Board that, in exchange for providing transfer agency services, SFIMC receives proceeds from the account fee imposed on shareholders of Associates’ Funds Trust. Management also explained that State Farm VP Management Corp. receives no fees from Associates’ Funds Trust for providing distribution services. SFIMC indicated to the Board that it was not aware of any other ancillary or other benefits that SFIMC (and its affiliates) receive from Associates’ Funds Trust, particularly because SFIMC does not execute securities trades on behalf of the Funds through an affiliated broker-dealer. The Board concluded that the lack of any material ancillary, or so-called “fallout,” benefits enables SFIMC to manage assets of the Funds in a manner that appears to be free of conflicts of interest.
Based on the Trustees’ deliberations and their evaluation of the information provided by SFIMC, the Board, including all of the Independent Trustees voting separately, unanimously approved the continuation of the Advisory Agreement for all the Funds through June 30, 2014.
22
STATE FARM ASSOCIATES’ FUNDS TRUST GROWTH FUND
SCHEDULE OF INVESTMENTS
November 30, 2013
| | | | | | | | |
| | | Shares | | | Value | |
Common Stocks (98.61%) | | | | | |
|
Agriculture, Foods, & Beverage (11.90%) | |
Archer-Daniels-Midland Co. | | | 3,477,500 | | | $ | 139,969,375 | |
Coca-Cola Co., The | | | 2,054,600 | | | | 82,574,374 | |
Kellogg Co. | | | 930,000 | | | | 56,395,200 | |
McCormick & Company Inc. | | | 428,600 | | | | 29,573,400 | |
Nestle SA ADR | | | 1,175,800 | | | | 85,962,738 | |
PepsiCo Inc. | | | 641,400 | | | | 54,172,644 | |
| | | | | | | | |
| | | | | | | 448,647,731 | |
| | | | | | | | |
Banks (4.61%) | | | | | | | | |
M&T Bank Corp. | | | 213,400 | | | | 24,617,824 | |
Northern Trust Corp. | | | 460,500 | | | | 27,164,895 | |
U.S. Bancorp | | | 141,400 | | | | 5,545,708 | |
Wells Fargo & Co. | | | 2,643,100 | | | | 116,349,262 | |
| | | | | | | | |
| | | | | | | 173,677,689 | |
| | | | | | | | |
Building Materials & Construction (1.55%) | |
Vulcan Materials Co. | | | 1,039,200 | | | | 58,579,704 | |
| | | | | | | | |
Chemicals (10.46%) | | | | | | | | |
Air Products & Chemicals Inc. | | | 830,000 | | | | 90,328,900 | |
Croda International PLC | | | 25,800 | | | | 981,112 | |
E.I. du Pont de Nemours & Co. | | | 229,200 | | | | 14,068,296 | |
International Flavors & Fragrances Inc. | | | 525,000 | | | | 46,383,750 | |
Novozymes A/S B Shares | | | 135,300 | | | | 5,233,260 | |
Sigma-Aldrich Corp. | | | 2,750,000 | | | | 237,160,000 | |
| | | | | | | | |
| | | | | | | 394,155,318 | |
| | | | | | | | |
Computer Software & Services (1.52%) | |
Automatic Data Processing Inc. | | | 109,900 | | | | 8,794,198 | |
Facebook Inc. Class A (a) | | | 115,000 | | | | 5,406,150 | |
Google Inc. Class A (a) | | | 5,900 | | | | 6,251,581 | |
SAP AG | | | 444,800 | | | | 36,843,251 | |
| | | | | | | | |
| | | | | | | 57,295,180 | |
| | | | | | | | |
Computers (4.96%) | | | | | | | | |
Hewlett-Packard Co. | | | 3,019,400 | | | | 82,580,590 | |
International Business Machines Corp. | | | 580,000 | | | | 104,214,400 | |
| | | | | | | | |
| | | | | | | 186,794,990 | |
| | | | | | | | |
Consumer & Marketing (6.64%) | | | | | |
AptarGroup Inc. | | | 677,405 | | | | 43,977,133 | |
Colgate-Palmolive Co. | | | 872,600 | | | | 57,425,806 | |
Procter & Gamble Co., The | | | 1,765,155 | | | | 148,661,354 | |
| | | | | | | | |
| | | | | | | 250,064,293 | |
| | | | | | | | |
Electronic/Electrical Manufacturing (5.95%) | |
Agilent Technologies Inc. | | | 548,071 | | | | 29,360,163 | |
Emerson Electric Co. | | | 729,400 | | | | 48,862,506 | |
General Electric Co. | | | 3,848,900 | | | | 102,611,674 | |
Linear Technology Corp. | | | 1,023,400 | | | | 43,545,670 | |
| | | | | | | | |
| | | | | | | 224,380,013 | |
| | | | | | | | |
| | | | | | | | |
| | | Shares | | | Value | |
Common Stocks (Cont.) | | | | | | | | |
|
Financial Services (0.75%) | |
Berkshire Hathaway Inc. Class A (a) | | | 162 | | | $ | 28,309,500 | |
Berkshire Hathaway Inc. Class B (a) | | | 143 | | | | 16,664 | |
| | | | | | | | |
| | | | | | | 28,326,164 | |
| | | | | | | | |
Health Care (12.93%) | | | | | | | | |
Abbott Laboratories | | | 847,500 | | | | 32,366,025 | |
AbbVie Inc. | | | 847,500 | | | | 41,061,375 | |
Amgen Inc. | | | 106,300 | | | | 12,126,704 | |
Baxter International Inc. | | | 43,600 | | | | 2,984,420 | |
Eli Lilly & Co. | | | 997,000 | | | | 50,069,340 | |
Johnson & Johnson | | | 2,481,600 | | | | 234,908,256 | |
Merck & Co. Inc. | | | 419,400 | | | | 20,898,702 | |
Pfizer Inc. | | | 2,239,031 | | | | 71,044,454 | |
Zoetis Inc. | | | 705,696 | | | | 21,982,430 | |
| | | | | | | | |
| | | | | | | 487,441,706 | |
| | | | | | | | |
Machinery & Manufacturing (7.22%) | |
3M Co. | | | 564,000 | | | | 75,299,642 | |
ASML Holding NV NY Reg. Shares | | | 55,050 | | | | 5,140,569 | |
Caterpillar Inc. | | | 877,700 | | | | 74,253,420 | |
Deere & Co. | | | 42,900 | | | | 3,613,896 | |
Donaldson Company Inc. | | | 112,800 | | | | 4,707,144 | |
HNI Corp. | | | 1,439,200 | | | | 57,049,888 | |
Illinois Tool Works Inc. | | | 652,500 | | | | 51,925,950 | |
| | | | | | | | |
| | | | | | | 271,990,509 | |
| | | | | | | | |
Media & Broadcasting (5.11%) | |
Walt Disney Co., The | | | 2,728,640 | | | | 192,478,266 | |
| | | | | | | | |
Mining & Metals (3.43%) | | | | | | | | |
BHP Billiton PLC | | | 941,859 | | | | 28,650,237 | |
Nucor Corp. | | | 531,200 | | | | 27,123,072 | |
Rio Tinto PLC | | | 476,280 | | | | 25,418,075 | |
Rio Tinto PLC ADR | | | 907,200 | | | | 48,126,960 | |
| | | | | | | | |
| | | | | | | 129,318,344 | |
| | | | | | | | |
Oil & Gas (14.39%) | |
BG Group PLC | | | 3,199,100 | | | | 65,355,071 | |
Bill Barrett Corp. (a) | | | 767,300 | | | | 20,632,697 | |
Chevron Corp. | | | 1,060,000 | | | | 129,786,400 | |
Devon Energy Corp. | | | 212,204 | | | | 12,863,806 | |
Dril-Quip Inc. (a) | | | 16,100 | | | | 1,747,816 | |
Exxon Mobil Corp. | | | 2,615,200 | | | | 244,468,896 | |
Imperial Oil Ltd. | | | 25,300 | | | | 1,089,165 | |
Noble Energy Inc. | | | 89,300 | | | | 6,272,432 | |
Royal Dutch Shell PLC ADR Class A | | | 487,900 | | | | 32,542,930 | |
Schlumberger Ltd. | | | 59,100 | | | | 5,225,622 | |
Spectra Energy Corp. | | | 399,950 | | | | 13,418,322 | |
Tidewater Inc. | | | 154,191 | | | | 8,795,055 | |
| | | | | | | | |
| | | | | | | 542,198,212 | |
| | | | | | | | |
| | | | |
| See accompanying notes to financial statements. | | | 23 | |
STATE FARM ASSOCIATES’ FUNDS TRUST GROWTH FUND
SCHEDULE OF INVESTMENTS (continued)
November 30, 2013
| | | | | | | | |
| | | Shares | | | Value | |
Common Stocks (Cont.) | | | | | |
| | |
Retailers (2.88%) | | | | | | | | |
Wal-Mart Stores Inc. | | | 1,339,100 | | | $ | 108,480,491 | |
| | | | | | | | |
Telecom & Telecom Equipment (3.40%) | |
AT&T Inc. | | | 2,140,534 | | | | 75,368,202 | |
Corning Inc. | | | 1,284,600 | | | | 21,940,968 | |
Verizon Communications Inc. | | | 624,900 | | | | 31,007,538 | |
| | | | | | | | |
| | | | | | | 128,316,708 | |
| | | | | | | | |
Transportation (0.34%) | | | | | |
GATX Corp. | | | 190,700 | | | | 9,567,419 | |
Union Pacific Corp. | | | 20,825 | | | | 3,374,483 | |
| | | | | | | | |
| | | | | | | 12,941,902 | |
| | | | | | | | |
Utilities & Energy (0.57%) | | | | | |
Duke Energy Corp. | | | 306,966 | | | | 21,475,341 | |
| | | | | | | | |
Total Common Stocks (cost $1,147,592,581) | | | | 3,716,562,561 | |
| | | | | | | | |
Short-term Investments (1.00%) | |
JPMorgan U.S. Government Money Market Fund | | | 37,721,085 | | | | 37,721,085 | |
| | | | | | | | |
Total Short-term Investments (cost $37,721,085) | | | | 37,721,085 | |
| | | | | | | | |
TOTAL INVESTMENTS (99.61%) (cost $1,185,313,666) | | | | 3,754,283,646 | |
OTHER ASSETS, NET OF LIABILITIES (0.39%) | | | | 14,840,402 | |
| | | | | | | | |
NET ASSETS (100.00%) | | | | | | $ | 3,769,124,048 | |
| | | | | | | | |
| (a) | Non-income producing security. |
ADR – American Depositary Receipt
| | |
24 | | See accompanying notes to financial statements. |
STATE FARM ASSOCIATES’ FUNDS TRUST BALANCED FUND
SCHEDULE OF INVESTMENTS
November 30, 2013
| | | | | | | | |
| | | Shares | | | Value | |
Common Stocks (59.46%) | | | | | | | | |
|
Agriculture, Foods, & Beverage (6.97%) | |
Archer-Daniels-Midland Co. | | | 940,561 | | | $ | 37,857,580 | |
Campbell Soup Co. | | | 26,000 | | | | 1,006,980 | |
Coca-Cola Co., The | | | 410,000 | | | | 16,477,900 | |
Kellogg Co. | | | 310,000 | | | | 18,798,400 | |
Nestle SA ADR | | | 252,500 | | | | 18,460,275 | |
PepsiCo Inc. | | | 110,100 | | | | 9,299,046 | |
Sysco Corp. | | | 165,300 | | | | 5,559,039 | |
| | | | | | | | |
| | | | | | | 107,459,220 | |
| | | | | | | | |
Banks (3.10%) | | | | | | | | |
M&T Bank Corp. | | | 58,300 | | | | 6,725,488 | |
Northern Trust Corp. | | | 104,700 | | | | 6,176,253 | |
U.S. Bancorp | | | 48,300 | | | | 1,894,326 | |
Wells Fargo & Co. | | | 747,600 | | | | 32,909,352 | |
| | | | | | | | |
| | | | | | | 47,705,419 | |
| | | | | | | | |
Building Materials & Construction (0.59%) | |
Vulcan Materials Co. | | | 160,200 | | | | 9,030,474 | |
| | | | | | | | |
Chemicals (6.07%) | | | | | | | | |
Air Products & Chemicals Inc. | | | 230,000 | | | | 25,030,900 | |
Dow Chemical Co., The | | | 69,000 | | | | 2,695,140 | |
E.I. du Pont de Nemours & Co. | | | 132,105 | | | | 8,108,605 | |
International Flavors & Fragrances Inc. | | | 120,000 | | | | 10,602,000 | |
Novozymes A/S B Shares | | | 124,350 | | | | 4,809,726 | |
Sigma-Aldrich Corp. | | | 491,000 | | | | 42,343,840 | |
| | | | | | | | |
| | | | | | | 93,590,211 | |
| | | | | | | | |
Computer Software & Services (0.98%) | |
Automatic Data Processing Inc. | | | 47,400 | | | | 3,792,948 | |
Facebook Inc. Class A (a) | | | 68,950 | | | | 3,241,340 | |
Google Inc. Class A (a) | | | 3,550 | | | | 3,761,544 | |
SAP AG | | | 52,800 | | | | 4,373,479 | |
| | | | | | | | |
| | | | | | | 15,169,311 | |
| | | | | | | | |
Computers (3.11%) | | | | | | | | |
Hewlett-Packard Co. | | | 754,000 | | | | 20,621,900 | |
International Business Machines Corp. | | | 152,100 | | | | 27,329,328 | |
| | | | | | | | |
| | | | | | | 47,951,228 | |
| | | | | | | | |
Consumer & Marketing (3.52%) | | | | | |
AptarGroup Inc. | | | 134,100 | | | | 8,705,772 | |
Colgate-Palmolive Co. | | | 80,000 | | | | 5,264,800 | |
Procter & Gamble Co., The | | | 477,700 | | | | 40,231,894 | |
| | | | | | | | |
| | | | | | | 54,202,466 | |
| | | | | | | | |
Electronic/Electrical Manufacturing (2.85%) | |
Agilent Technologies Inc. | | | 143,787 | | | | 7,702,670 | |
Emerson Electric Co. | | | 98,600 | | | | 6,605,214 | |
General Electric Co. | | | 796,300 | | | | 21,229,358 | |
KLA-Tencor Corp. | | | 45,100 | | | | 2,880,537 | |
Linear Technology Corp. | | | 130,100 | | | | 5,535,755 | |
| | | | | | | | |
| | | | | | | 43,953,534 | |
| | | | | | | | |
| | | | | | | | |
| | | Shares | | | Value | |
Common Stocks (Cont.) | | | | | | | | |
| | |
Financial Services (0.39%) | | | | | | | | |
Berkshire Hathaway Inc. Class A (a) | | | 34 | | | $ | 5,941,500 | |
Berkshire Hathaway Inc. Class B (a) | | | 533 | | | | 62,110 | |
| | | | | | | | |
| | | | | | | 6,003,610 | |
| | | | | | | | |
Health Care (8.06%) | | | | | | | | |
Abbott Laboratories | | | 92,000 | | | | 3,513,480 | |
AbbVie Inc. | | | 92,000 | | | | 4,457,400 | |
Allergan Inc. | | | 154,800 | | | | 15,023,340 | |
Amgen Inc. | | | 53,100 | | | | 6,057,648 | |
Baxter International Inc. | | | 29,100 | | | | 1,991,895 | |
Eli Lilly & Co. | | | 212,000 | | | | 10,646,640 | |
Johnson & Johnson | | | 417,700 | | | | 39,539,482 | |
Medtronic Inc. | | | 21,600 | | | | 1,238,112 | |
Merck & Co. Inc. | | | 144,100 | | | | 7,180,503 | |
Pfizer Inc. | | | 728,140 | | | | 23,103,882 | |
Teva Pharmaceutical Industries Ltd. Sponsored ADR | | | 103,900 | | | | 4,234,964 | |
Zoetis Inc. | | | 229,495 | | | | 7,148,769 | |
| | | | | | | | |
| | | | | | | 124,136,115 | |
| | | | | | | | |
Machinery & Manufacturing (4.33%) | |
3M Co. | | | 124,600 | | | | 16,635,346 | |
ASML Holding NV NY Reg. Shares | | | 32,500 | | | | 3,034,850 | |
Caterpillar Inc. | | | 262,400 | | | | 22,199,040 | |
Deere & Co. | | | 38,700 | | | | 3,260,088 | |
Donaldson Company Inc. | | | 115,800 | | | | 4,832,334 | |
HNI Corp. | | | 160,000 | | | | 6,342,400 | |
Illinois Tool Works Inc. | | | 130,600 | | | | 10,393,148 | |
| | | | | | | | |
| | | | | | | 66,697,206 | |
| | | | | | | | |
Media & Broadcasting (4.90%) | | | | | |
Lee Enterprises Inc. Class A (a) | | | 84,000 | | | | 299,040 | |
Walt Disney Co., The | | | 1,065,995 | | | | 75,195,287 | |
| | | | | | | | |
| | | | | | | 75,494,327 | |
| | | | | | | | |
Mining & Metals (3.37%) | | | | | |
BHP Billiton PLC | | | 169,900 | | | | 5,168,157 | |
Newmont Mining Corp. | | | 29,200 | | | | 725,036 | |
Nucor Corp. | | | 436,800 | | | | 22,303,008 | |
Rio Tinto PLC | | | 153,825 | | | | 8,209,321 | |
Rio Tinto PLC ADR | | | 293,000 | | | | 15,543,650 | |
| | | | | | | | |
| | | | | | | 51,949,172 | |
| | | | | | | | |
Oil & Gas (7.26%) | | | | | | | | |
BG Group PLC | | | 256,800 | | | | 5,246,220 | |
Bill Barrett Corp. (a) | | | 100,000 | | | | 2,689,000 | |
Chevron Corp. | | | 288,000 | | | | 35,262,720 | |
Devon Energy Corp. | | | 76,170 | | | | 4,617,425 | |
Exxon Mobil Corp. | | | 448,000 | | | | 41,879,040 | |
Noble Energy Inc. | | | 39,800 | | | | 2,795,552 | |
Royal Dutch Shell PLC ADR Class A | | | 216,400 | | | | 14,433,880 | |
Schlumberger Ltd. | | | 25,900 | | | | 2,290,078 | |
| | | | |
| See accompanying notes to financial statements. | | | 25 | |
STATE FARM ASSOCIATES’ FUNDS TRUST BALANCED FUND
SCHEDULE OF INVESTMENTS (continued)
November 30, 2013
| | | | | | | | |
| | | Shares | | | Value | |
Common Stocks (Cont.) | | | | | | | | |
| | |
Oil & Gas (Cont.) | | | | | | | | |
Spectra Energy Corp. | | | 79,650 | | | $ | 2,672,258 | |
| | | | | | | | |
| | | | | | | 111,886,173 | |
| | | | | | | | |
Retailers (1.45%) | | | | | | | | |
Wal-Mart Stores Inc. | | | 276,700 | | | | 22,415,467 | |
| | | | | | | | |
Telecom & Telecom Equipment (1.82%) | | | | | |
AT&T Inc. | | | 533,359 | | | | 18,779,571 | |
Corning Inc. | | | 372,300 | | | | 6,358,884 | |
Verizon Communications Inc. | | | 57,800 | | | | 2,868,036 | |
| | | | | | | | |
| | | | | | | 28,006,491 | |
| | | | | | | | |
Transportation (0.36%) | | | | | | | | |
GATX Corp. | | | 68,200 | | | | 3,421,594 | |
Union Pacific Corp. | | | 12,825 | | | | 2,078,163 | |
| | | | | | | | |
| | | | | | | 5,499,757 | |
| | | | | | | | |
Utilities & Energy (0.33%) | | | | | | | | |
Duke Energy Corp. | | | 72,333 | | | | 5,060,417 | |
| | | | | | | | |
Total Common Stocks (cost $297,375,294) | | | | | | | 916,210,598 | |
| | | | | | | | |
| | |
| | | Principal
amount | | | Value | |
Corporate Bonds (18.00%) | | | | | | | | |
| | |
Aerospace/Defense (0.06%) | | | | | | | | |
Lockheed Martin Corp. | | | | | | | | |
3.350%, 09/15/2021 | | $ | 1,000,000 | | | $ | 1,001,266 | |
| | | | | | | | |
Agriculture, Foods, & Beverage (1.28%) | | | | | |
General Mills Inc. | | | | | | | | |
5.200%, 03/17/2015 | | | 500,000 | | | | 529,428 | |
Bottling Group LLC | | | | | | | | |
5.500%, 04/01/2016 | | | 1,000,000 | | | | 1,108,230 | |
Hershey Co. | | | | | | | | |
5.450%, 09/01/2016 | | | 500,000 | | | | 560,130 | |
Kraft Foods Inc. | | | | | | | | |
6.500%, 08/11/2017 | | | 1,000,000 | | | | 1,180,308 | |
Coca-Cola Co., The | | | | | | | | |
5.350%, 11/15/2017 | | | 2,000,000 | | | | 2,303,380 | |
Sysco Corp. | | | | | | | | |
5.250%, 02/12/2018 | | | 1,000,000 | | | | 1,136,958 | |
Pepsico Inc. | | | | | | | | |
5.000%, 06/01/2018 | | | 1,000,000 | | | | 1,134,830 | |
Coca-Cola Co., The | | | | | | | | |
2.450%, 11/01/2020 | | | 1,000,000 | | | | 986,400 | |
Kellogg Co. | | | | | | | | |
4.000%, 12/15/2020 | | | 2,000,000 | | | | 2,103,750 | |
Pepsico Inc. | | | | | | | | |
2.750%, 03/05/2022 | | | 1,000,000 | | | | 949,315 | |
Kellogg Co. | | | | | | | | |
3.125%, 05/17/2022 | | | 1,000,000 | | | | 964,863 | |
| | | | | | | | |
| | | Principal
amount | | | Value | |
Corporate Bonds (Cont.) | | | | | | | | |
|
Agriculture, Foods, & Beverage (Cont.) | |
Sysco Corp. | | | | | | | | |
2.600%, 06/12/2022 | | $ | 1,000,000 | | | $ | 934,811 | |
Campbell Soup Co. | | | | | | | | |
2.500%, 08/02/2022 | | | 1,000,000 | | | | 897,161 | |
Kellogg Co. | | | | | | | | |
2.750%, 03/01/2023 | | | 1,000,000 | | | | 921,666 | |
Pepsico Inc. | | | | | | | | |
2.750%, 03/01/2023 | | | 1,000,000 | | | | 928,347 | |
Coca-Cola Co., The | | | | | | | | |
2.500%, 04/01/2023 | | | 2,000,000 | | | | 1,858,524 | |
Hershey Co. | | | | | | | | |
2.625%, 05/01/2023 | | | 1,300,000 | | | | 1,215,345 | |
| | | | | | | | |
| | | | | | | 19,713,446 | |
| | | | | | | | |
Automotive (0.36%) | | | | | | | | |
American Honda Finance | | | | | | | | |
2.125%, 10/10/2018 | | | 500,000 | | | | 505,478 | |
Toyota Motor Credit Corp. | | | | | | | | |
2.000%, 10/24/2018 | | | 1,000,000 | | | | 1,005,231 | |
Johnson Controls Inc. | | | | | | | | |
4.250%, 03/01/2021 | | | 2,000,000 | | | | 2,071,684 | |
Toyota Motor Credit Corp. | | | | | | | | |
3.300%, 01/12/2022 | | | 1,000,000 | | | | 1,001,328 | |
2.625%, 01/10/2023 | | | 1,000,000 | | | | 933,715 | |
| | | | | | | | |
| | | | | | | 5,517,436 | |
| | | | | | | | |
Banks (0.65%) | | | | | | | | |
Mellon Funding Corp. | | | | | | | | |
5.200%, 05/15/2014 | | | 500,000 | | | | 510,176 | |
US Bank NA | | | | | | | | |
4.950%, 10/30/2014 | | | 1,500,000 | | | | 1,561,484 | |
Wachovia Bank NA | | | | | | | | |
5.600%, 03/15/2016 | | | 750,000 | | | | 827,006 | |
Bank of America NA | | | | | | | | |
6.000%, 06/15/2016 | | | 1,000,000 | | | | 1,106,263 | |
5.300%, 03/15/2017 | | | 500,000 | | | | 557,399 | |
Wachovia Corp. | | | | | | | | |
5.750%, 06/15/2017 | | | 750,000 | | | | 862,352 | |
Wachovia Bank NA | | | | | | | | |
6.000%, 11/15/2017 | | | 500,000 | | | | 581,587 | |
Wells Fargo & Co. | | | | | | | | |
5.625%, 12/11/2017 | | | 500,000 | | | | 579,367 | |
Bank of New York Mellon Corp. | | | | | | | | |
2.100%, 08/01/2018 | | | 1,000,000 | | | | 1,010,159 | |
US Bancorp | | | | | | | | |
1.950%, 11/15/2018 | | | 1,000,000 | | | | 1,005,218 | |
Wells Fargo & Co. | | | | | | | | |
2.150%, 01/15/2019 | | | 500,000 | | | | 504,671 | |
US Bancorp | | | | | | | | |
3.000%, 03/15/2022 | | | 1,000,000 | | | | 976,904 | |
| | | | | | | | |
| | | | | | | 10,082,586 | |
| | | | | | | | |
| | |
26 | | See accompanying notes to financial statements. |
STATE FARM ASSOCIATES’ FUNDS TRUST BALANCED FUND
SCHEDULE OF INVESTMENTS (continued)
November 30, 2013
| | | | | | | | |
| | | Principal
amount | | | Value | |
Corporate Bonds (Cont.) | |
Chemicals (0.72%) | |
E.I. du Pont de Nemours and Co. | | | | | | | | |
4.875%, 04/30/2014 | | $ | 3,000,000 | | | $ | 3,055,596 | |
Praxair Inc. | | | | | | | | |
4.625%, 03/30/2015 | | | 1,000,000 | | | | 1,055,403 | |
5.375%, 11/01/2016 | | | 1,000,000 | | | | 1,125,328 | |
Monsanto Co. | | | | | | | | |
1.850%, 11/15/2018 | | | 500,000 | | | | 500,295 | |
Praxair Inc. | | | | | | | | |
2.450%, 02/15/2022 | | | 2,000,000 | | | | 1,866,260 | |
Monsanto Co. | | | | | | | | |
2.200%, 07/15/2022 | | | 1,300,000 | | | | 1,185,168 | |
PPG Industries Inc. | | | | | | | | |
2.700%, 08/15/2022 | | | 500,000 | | | | 463,412 | |
E.I. du Pont de Nemours and Co. | | | | | | | | |
2.800%, 02/15/2023 | | | 1,000,000 | | | | 931,023 | |
Praxair Inc. | | | | | | | | |
2.700%, 02/21/2023 | | | 1,000,000 | | | | 940,379 | |
| | | | | | | | |
| | | | | | | 11,122,864 | |
| | | | | | | | |
Commercial Service/Supply (0.16%) | |
Pitney Bowes Inc. | | | | | | | | |
5.750%, 09/15/2017 | | | 500,000 | | | | 553,728 | |
Cintas Corp. No. 2 | | | | | | | | |
3.250%, 06/01/2022 | | | 2,000,000 | | | | 1,941,904 | |
| | | | | | | | |
| | | | | | | 2,495,632 | |
| | | | | | | | |
Computer Software & Services (0.74%) | |
Oracle Corp. | | | | | | | | |
2.375%, 01/15/2019 | | | 1,000,000 | | | | 1,016,310 | |
Microsoft Corp. | | | | | | | | |
4.000%, 02/08/2021 | | | 2,000,000 | | | | 2,136,102 | |
2.125%, 11/15/2022 | | | 2,000,000 | | | | 1,805,998 | |
Intel Corp. | | | | | | | | |
2.700%, 12/15/2022 | | | 2,000,000 | | | | 1,856,264 | |
Microsoft Corp. | | | | | | | | |
2.375%, 05/01/2023 | | | 1,000,000 | | | | 908,135 | |
Texas Instruments Inc. | | | | | | | | |
2.250%, 05/01/2023 | | | 3,000,000 | | | | 2,694,609 | |
Oracle Corp. | | | | | | | | |
3.625%, 07/15/2023 | | | 1,000,000 | | | | 994,679 | |
| | | | | | | | |
| | | | | | | 11,412,097 | |
| | | | | | | | |
Computers (0.39%) | |
International Business Machines Corp. | | | | | | | | |
5.700%, 09/14/2017 | | | 1,000,000 | | | | 1,157,769 | |
1.875%, 05/15/2019 | | | 3,000,000 | | | | 2,964,297 | |
1.625%, 05/15/2020 | | | 2,000,000 | | | | 1,880,264 | |
| | | | | | | | |
| | | | | | | 6,002,330 | |
| | | | | | | | |
Consumer & Marketing (1.58%) | |
Ecolab Inc. | | | | | | | | |
4.875%, 02/15/2015 | | | 1,000,000 | | | | 1,048,958 | |
| | | | | | | | |
| | | Principal
amount | | | Value | |
Corporate Bonds (Cont.) | |
Consumer & Marketing (Cont.) | |
Procter & Gamble Co., The | | | | | | | | |
3.150%, 09/01/2015 | | $ | 2,000,000 | | | $ | 2,092,554 | |
Kimberly-Clark Corp. | | | | | | | | |
6.125%, 08/01/2017 | | | 1,500,000 | | | | 1,746,765 | |
Danaher Corp. | | | | | | | | |
5.625%, 01/15/2018 | | | 1,000,000 | | | | 1,145,121 | |
McDonald’s Corp. | | | | | | | | |
5.350%, 03/01/2018 | | | 1,000,000 | | | | 1,151,510 | |
Unilever Capital Corp. | | | | | | | | |
2.200%, 03/06/2019 | | | 1,000,000 | | | | 1,013,052 | |
4.250%, 02/10/2021 | | | 3,000,000 | | | | 3,268,770 | |
McDonald’s Corp. | | | | | | | | |
3.625%, 05/20/2021 | | | 2,000,000 | | | | 2,084,228 | |
2.625%, 01/15/2022 | | | 1,000,000 | | | | 959,809 | |
Procter & Gamble Co., The | | | | | | | | |
2.300%, 02/06/2022 | | | 1,000,000 | | | | 946,726 | |
Colgate-Palmolive Co. | | | | | | | | |
2.300%, 05/03/2022 | | | 2,000,000 | | | | 1,873,640 | |
1.950%, 02/01/2023 | | | 1,000,000 | | | | 891,019 | |
2.100%, 05/01/2023 | | | 2,000,000 | | | | 1,796,498 | |
NIKE Inc. | | | | | | | | |
2.250%, 05/01/2023 | | | 1,500,000 | | | | 1,365,384 | |
Kimberly-Clark Corp. | | | | | | | | |
2.400%, 06/01/2023 | | | 1,000,000 | | | | 924,005 | |
Procter & Gamble Co., The | | | | | | | | |
3.100%, 08/15/2023 | | | 2,000,000 | | | | 1,968,460 | |
| | | | | | | | |
| | | | | | | 24,276,499 | |
| | | | | | | | |
Electronic/Electrical Manufacturing (0.24%) | |
Emerson Electric Co. | | | | | | | | |
5.375%, 10/15/2017 | | | 1,000,000 | | | | 1,149,500 | |
5.250%, 10/15/2018 | | | 500,000 | | | | 577,775 | |
General Electric Co. | | | | | | | | |
2.700%, 10/09/2022 | | | 1,000,000 | | | | 950,497 | |
Emerson Electric Co. | | | | | | | | |
2.625%, 02/15/2023 | | | 1,000,000 | | | | 952,098 | |
| | | | | | | | |
| | | | | | | 3,629,870 | |
| | | | | | | | |
Financial Services (0.49%) | |
JPMorgan Chase Bank NA | | | | | | | | |
5.875%, 06/13/2016 | | | 500,000 | | | | 558,598 | |
General Electric Capital Corp. | | | | | | | | |
5.375%, 10/20/2016 | | | 500,000 | | | | 559,740 | |
5.400%, 02/15/2017 | | | 500,000 | | | | 562,857 | |
5.625%, 09/15/2017 | | | 500,000 | | | | 574,178 | |
JPMorgan Chase Bank NA | | | | | | | | |
6.000%, 10/01/2017 | | | 1,500,000 | | | | 1,733,180 | |
General Electric Capital Corp. | | | | | | | | |
5.625%, 05/01/2018 | | | 500,000 | | | | 580,294 | |
JPMorgan Chase & Co. | | | | | | | | |
4.500%, 01/24/2022 | | | 1,000,000 | | | | 1,061,453 | |
General Electric Capital Corp. | | | | | | | | |
3.150%, 09/07/2022 | | | 1,000,000 | | | | 971,485 | |
| | | | |
| See accompanying notes to financial statements. | | | 27 | |
STATE FARM ASSOCIATES’ FUNDS TRUST BALANCED FUND
SCHEDULE OF INVESTMENTS (continued)
November 30, 2013
| | | | | | | | |
| | | Principal
amount | | | Value | |
Corporate Bonds (Cont.) | | | | | | | | |
| | |
Financial Services (Cont.) | | | | | | | | |
JPMorgan Chase & Co. | | | | | | | | |
3.200%, 01/25/2023 | | $ | 1,000,000 | | | $ | 948,727 | |
| | | | | | | | |
| | | | | | | 7,550,512 | |
| | | | | | | | |
Health Care (2.08%) | | | | | | | | |
Schering-Plough Corp. | | | | | | | | |
5.300%, 12/01/2013 | | | 1,000,000 | | | | 1,000,000 | |
Pfizer Inc. | | | | | | | | |
4.500%, 02/15/2014 | | | 1,000,000 | | | | 1,008,233 | |
GlaxoSmithKline Capital Inc. | | | | | | | | |
4.375%, 04/15/2014 | | | 3,000,000 | | | | 3,043,434 | |
AstraZeneca PLC | | | | | | | | |
5.400%, 06/01/2014 | | | 2,000,000 | | | | 2,048,756 | |
Baxter International Inc. | | | | | | | | |
1.850%, 01/15/2017 | | | 1,000,000 | | | | 1,023,285 | |
Eli Lilly & Co. | | | | | | | | |
5.200%, 03/15/2017 | | | 1,000,000 | | | | 1,128,714 | |
Amgen Inc. | | | | | | | | |
5.850%, 06/01/2017 | | | 1,000,000 | | | | 1,143,132 | |
Johnson & Johnson | | | | | | | | |
5.550%, 08/15/2017 | | | 1,000,000 | | | | 1,157,333 | |
AstraZeneca PLC | | | | | | | | |
5.900%, 09/15/2017 | | | 750,000 | | | | 871,508 | |
Bristol-Myers Squibb Co. | | | | | | | | |
5.450%, 05/01/2018 | | | 500,000 | | | | 580,056 | |
GlaxoSmithKline Capital Inc. | | | | | | | | |
5.650%, 05/15/2018 | | | 1,000,000 | | | | 1,163,950 | |
Baxter International Inc. | | | | | | | | |
5.375%, 06/01/2018 | | | 2,000,000 | | | | 2,299,044 | |
AstraZeneca PLC | | | | | | | | |
1.950%, 09/18/2019 | | | 500,000 | | | | 492,770 | |
Becton Dickinson & Co. | | | | | | | | |
3.125%, 11/08/2021 | | | 1,000,000 | | | | 981,635 | |
Medtronic Inc. | | | | | | | | |
3.125%, 03/15/2022 | | | 2,000,000 | | | | 1,956,160 | |
Bristol-Myers Squibb Co. | | | | | | | | |
2.000%, 08/01/2022 | | | 1,500,000 | | | | 1,351,941 | |
Baxter International Inc. | | | | | | | | |
2.400%, 08/15/2022 | | | 1,000,000 | | | | 923,735 | |
Merck & Co. Inc. | | | | | | | | |
2.400%, 09/15/2022 | | | 1,000,000 | | | | 923,107 | |
Novartis Capital Corp. | | | | | | | | |
2.400%, 09/21/2022 | | | 2,000,000 | | | | 1,850,296 | |
GlaxoSmithKline Capital Inc. | | | | | | | | |
2.800%, 03/18/2023 | | | 1,000,000 | | | | 944,037 | |
Medtronic Inc. | | | | | | | | |
2.750%, 04/01/2023 | | | 500,000 | | | | 465,785 | |
Merck & Co. Inc. | | | | | | | | |
2.800%, 05/18/2023 | | | 3,000,000 | | | | 2,824,998 | |
Baxter International Inc. | | | | | | | | |
3.200%, 06/15/2023 | | | 1,000,000 | | | | 968,678 | |
Pfizer Inc. | | | | | | | | |
3.000%, 06/15/2023 | | | 2,000,000 | | | | 1,913,122 | |
| | | | | | | | |
| | | | | | | 32,063,709 | |
| | | | | | | | |
| | | | | | | | |
| | | Principal
amount | | | Value | |
Corporate Bonds (Cont.) | | | | | | | | |
|
Machinery & Manufacturing (1.56%) | |
Cooper U.S. Inc. | | | | | | | | |
5.450%, 04/01/2015 | | $ | 500,000 | | | $ | 530,862 | |
Ingersoll-Rand Co. Ltd. | | | | | | | | |
4.750%, 05/15/2015 | | | 1,000,000 | | | | 1,044,607 | |
Eaton Corp. | | | | | | | | |
5.300%, 03/15/2017 | | | 1,500,000 | | | | 1,654,996 | |
John Deere Capital Corp. | | | | | | | | |
5.500%, 04/13/2017 | | | 1,000,000 | | | | 1,136,947 | |
Cooper U.S. Inc. | | | | | | | | |
6.100%, 07/01/2017 | | | 1,000,000 | | | | 1,146,451 | |
United Technologies Corp. | | | | | | | | |
5.375%, 12/15/2017 | | | 1,500,000 | | | | 1,735,593 | |
Dover Corp. | | | | | | | | |
5.450%, 03/15/2018 | | | 1,000,000 | | | | 1,145,814 | |
Caterpillar Financial Services Corp. | | | | | | | | |
5.450%, 04/15/2018 | | | 1,000,000 | | | | 1,153,080 | |
Caterpillar Inc. | | | | | | | | |
3.900%, 05/27/2021 | | | 2,000,000 | | | | 2,099,144 | |
John Deere Capital Corp. | | | | | | | | |
2.750%, 03/15/2022 | | | 1,000,000 | | | | 955,435 | |
Caterpillar Financial Services Corp. | | | | | | | | |
2.850%, 06/01/2022 | | | 1,000,000 | | | | 956,806 | |
United Technologies Corp. | | | | | | | | |
3.100%, 06/01/2022 | | | 1,000,000 | | | | 982,315 | |
Deere & Co. | | | | | | | | |
2.600%, 06/08/2022 | | | 2,000,000 | | | | 1,892,434 | |
Covidien International | | | | | | | | |
3.200%, 06/15/2022 | | | 2,000,000 | | | | 1,950,164 | |
3M Co. | | | | | | | | |
2.000%, 06/26/2022 | | | 1,500,000 | | | | 1,393,857 | |
Thermo Fisher Scientific Inc. | | | | | | | | |
3.150%, 01/15/2023 | | | 1,000,000 | | | | 930,436 | |
Caterpillar Financial Services Corp. | | | | | | | | |
2.625%, 03/01/2023 | | | 1,000,000 | | | | 920,110 | |
Covidien International | | | | | | | | |
2.950%, 06/15/2023 | | | 1,000,000 | | | | 937,841 | |
Total Capital Canada Ltd. | | | | | | | | |
2.750%, 07/15/2023 | | | 500,000 | | | | 468,004 | |
Honeywell International Inc. | | | | | | | | |
3.350%, 12/01/2023 | | | 1,000,000 | | | | 992,352 | |
| | | | | | | | |
| | | | | | | 24,027,248 | |
| | | | | | | | |
Media & Broadcasting (0.26%) | | | | | |
Walt Disney Co., The | | | | | | | | |
6.000%, 07/17/2017 | | | 1,000,000 | | | | 1,166,121 | |
Comcast Corp. | | | | | | | | |
3.125%, 07/15/2022 | | | 2,000,000 | | | | 1,931,438 | |
Reed Elsevier Capital | | | | | | | | |
3.125%, 10/15/2022 | | | 1,000,000 | | | | 933,721 | |
| | | | | | | | |
| | | | | | | 4,031,280 | |
| | | | | | | | |
| | |
28 | | See accompanying notes to financial statements. |
STATE FARM ASSOCIATES’ FUNDS TRUST BALANCED FUND
SCHEDULE OF INVESTMENTS (continued)
November 30, 2013
| | | | | | | | |
| | | Principal
amount | | | Value | |
Corporate Bonds (Cont.) | | | | | | | | |
Mining & Metals (0.57%) | | | | | | | | |
| BHP Billiton Finance USA Ltd. | | | | | | | | |
| 5.250%, 12/15/2015 | | $ | 2,000,000 | | | $ | 2,178,116 | |
| 5.400%, 03/29/2017 | | | 500,000 | | | | 564,700 | |
| Rio Tinto Finance USA Ltd. PLC | | | | | | | | |
| 2.250%, 12/14/2018 | | | 500,000 | | | | 502,671 | |
| Alcoa Inc. | | | | | | | | |
| 5.720%, 02/23/2019 | | | 2,244,000 | | | | 2,402,512 | |
| BHP Billiton Finance USA Ltd. | | | | | | | | |
| 3.250%, 11/21/2021 | | | 1,000,000 | | | | 997,147 | |
| Alcoa Inc. | | | | | | | | |
| 5.870%, 02/23/2022 | | | 756,000 | | | | 773,176 | |
| Rio Tinto Finance USA Ltd. PLC | | | | | | | | |
| 2.875%, 08/21/2022 | | | 1,000,000 | | | | 931,124 | |
| BHP Billiton Finance USA Ltd. | | | | | | | | |
| 3.850%, 09/30/2023 | | | 500,000 | | | | 504,020 | |
| | | | | | | | |
| | | | | | | 8,853,466 | |
| | | | | | | | |
Oil & Gas (1.55%) | | | | | | | | |
| ConocoPhillips Canada | | | | | | | | |
| 5.625%, 10/15/2016 | | | 500,000 | | | | 565,846 | |
| Shell International Finance | | | | | | | | |
| 5.200%, 03/22/2017 | | | 1,000,000 | | | | 1,127,500 | |
| Total Capital International SA | | | | | | | | |
| 1.550%, 06/28/2017 | | | 1,500,000 | | | | 1,516,320 | |
| Marathon Oil Corp. | | | | | | | | |
| 5.900%, 03/15/2018 | | | 1,000,000 | | | | 1,146,476 | |
| ConocoPhillips | | | | | | | | |
| 5.200%, 05/15/2018 | | | 1,000,000 | | | | 1,142,039 | |
| Shell International Finance | | | | | | | | |
| 1.900%, 08/10/2018 | | | 1,000,000 | | | | 1,009,079 | |
| Total Capital SA | | | | | | | | |
| 2.125%, 08/10/2018 | | | 1,000,000 | | | | 1,017,355 | |
| Chevron Corp. | | | | | | | | |
| 4.950%, 03/03/2019 | | | 3,000,000 | | | | 3,432,669 | |
| BP Capital Markets PLC | | | | | | | | |
| 4.750%, 03/10/2019 | | | 3,000,000 | | | | 3,374,034 | |
| Shell International Finance | | | | | | | | |
| 4.300%, 09/22/2019 | | | 1,000,000 | | | | 1,112,162 | |
| Trans-Canada Pipelines | | | | | | | | |
| 2.500%, 08/01/2022 | | | 2,000,000 | | | | 1,843,052 | |
| Shell International Finance | | | | | | | | |
| 2.375%, 08/21/2022 | | | 1,000,000 | | | | 926,036 | |
| Chevron Corp. | | | | | | | | |
| 2.355%, 12/05/2022 | | | 1,000,000 | | | | 918,740 | |
| Total Capital International SA | | | | | | | | |
| 2.700%, 01/25/2023 | | | 1,000,000 | | | | 932,558 | |
| Occidental Petroleum Corp. | | | | | | | | |
| 2.700%, 02/15/2023 | | | 2,000,000 | | | | 1,853,982 | |
| Chevron Corp. | | | | | | | | |
| 3.191%, 06/24/2023 | | | 1,000,000 | | | | 974,208 | |
| Schlumberger Investment | | | | | | | | |
| 3.650%, 12/01/2023 | | | 1,000,000 | | | | 1,003,702 | |
| | | | | | | | |
| | | | | | | 23,895,758 | |
| | | | | | | | |
| | | | | | | | |
| | | Principal
amount | | | Value | |
Corporate Bonds (Cont.) | | | | | | | | |
Retailers (0.99%) | | | | | | | | |
| Lowe’s Companies Inc. | | | | | | | | |
| 5.000%, 10/15/2015 | | $ | 1,000,000 | | | $ | 1,081,066 | |
| Home Depot Inc. | | | | | | | | |
| 5.400%, 03/01/2016 | | | 1,000,000 | | | | 1,104,527 | |
| Target Corp. | | | | | | | | |
| 5.875%, 07/15/2016 | | | 1,300,000 | | | | 1,475,674 | |
| Lowe’s Companies Inc. | | | | | | | | |
| 5.400%, 10/15/2016 | | | 1,000,000 | | | | 1,124,141 | |
| Target Corp. | | | | | | | | |
| 5.375%, 05/01/2017 | | | 1,500,000 | | | | 1,706,498 | |
| 6.000%, 01/15/2018 | | | 500,000 | | | | 586,430 | |
| Wal-Mart Stores Inc. | | | | | | | | |
| 5.800%, 02/15/2018 | | | 1,000,000 | | | | 1,169,930 | |
| Home Depot Inc. | | | | | | | | |
| 2.250%, 09/10/2018 | | | 1,000,000 | | | | 1,019,335 | |
| Wal-Mart Stores Inc. | | | | | | | | |
| 4.250%, 04/15/2021 | | | 2,000,000 | | | | 2,173,542 | |
| Lowe’s Companies Inc. | | | | | | | | |
| 3.120%, 04/15/2022 | | | 1,000,000 | | | | 975,400 | |
| Home Depot Inc. | | | | | | | | |
| 2.700%, 04/01/2023 | | | 2,000,000 | | | | 1,862,828 | |
| Wal-Mart Stores Inc. | | | | | | | | |
| 2.550%, 04/11/2023 | | | 1,000,000 | | | | 925,448 | |
| | | | | | | | |
| | | | | | | 15,204,819 | |
| | | | | | | | |
Telecom & Telecom Equipment (0.59%) | |
| Verizon Communications Inc. | | | | | | | | |
| 5.500%, 02/15/2018 | | | 500,000 | | | | 569,078 | |
| AT&T Inc. | | | | | | | | |
| 2.375%, 11/27/2018 | | | 1,000,000 | | | | 1,003,165 | |
| Verizon Communications Inc. | | | | | | | | |
| 4.500%, 09/15/2020 | | | 1,000,000 | | | | 1,073,800 | |
| AT&T Inc. | | | | | | | | |
| 3.000%, 02/15/2022 | | | 3,000,000 | | | | 2,803,800 | |
| Vodafone Group PLC | | | | | | | | |
| 2.500%, 09/26/2022 | | | 1,000,000 | | | | 889,441 | |
| Verizon Communications Inc. | | | | | | | | |
| 2.450%, 11/01/2022 | | | 2,000,000 | | | | 1,779,170 | |
| Vodafone Group PLC | | | | | | | | |
| 2.950%, 02/19/2023 | | | 1,000,000 | | | | 914,601 | |
| | | | | | | | |
| | | | | | | 9,033,055 | |
| | | | | | | | |
Transportation (0.44%) | | | | | | | | |
| United Parcel Service Inc. | | | | | | | | |
| 5.500%, 01/15/2018 | | | 1,000,000 | | | | 1,151,756 | |
| Burlington North Santa Fe | | | | | | | | |
| 3.050%, 09/01/2022 | | | 500,000 | | | | 472,994 | |
| United Parcel Service Inc. | | | | | | | | |
| 2.450%, 10/01/2022 | | | 2,000,000 | | | | 1,867,660 | |
| Burlington North Santa Fe | | | | | | | | |
| 3.000%, 03/15/2023 | | | 1,500,000 | | | | 1,396,682 | |
| Union Pacific Corp. | | | | | | | | |
| 2.750%, 04/15/2023 | | | 1,000,000 | | | | 923,801 | |
| | | | |
| See accompanying notes to financial statements. | | | 29 | |
STATE FARM ASSOCIATES’ FUNDS TRUST BALANCED FUND
SCHEDULE OF INVESTMENTS (continued)
November 30, 2013
| | | | | | | | |
| | | Principal
amount | | | Value | |
Corporate Bonds (Cont.) | | | | | | | | |
Transportation (Cont.) | | | | | | | | |
Norfolk Southern Corp. | | | | | | | | |
3.850%, 01/15/2024 | | $ | 1,000,000 | | | $ | 991,571 | |
| | | | | | | | |
| | | | | | | 6,804,464 | |
| | | | | | | | |
Utilities & Energy (3.29%) | | | | | | | | |
| Commonwealth Edison Co. | | | | | | | | |
| 4.700%, 04/15/2015 | | | 1,000,000 | | | | 1,055,060 | |
| Georgia Power Co. | | | | | | | | |
| 5.250%, 12/15/2015 | | | 2,000,000 | | | | 2,180,240 | |
| Union Electric Co. | | | | | | | | |
| 5.400%, 02/01/2016 | | | 2,000,000 | | | | 2,181,904 | |
| Consolidated Edison Co. NY | | | | | | | | |
| 5.300%, 12/01/2016 | | | 1,000,000 | | | | 1,128,885 | |
| Georgia Power Co. | | | | | | | | |
| 5.700%, 06/01/2017 | | | 1,000,000 | | | | 1,139,156 | |
| MidAmerican Energy Co. | | | | | | | | |
| 5.950%, 07/15/2017 | | | 500,000 | | | | 578,217 | |
| NSTAR Electric Co. | | | | | | | | |
| 5.625%, 11/15/2017 | | | 1,500,000 | | | | 1,724,618 | |
| Northern States Power Co. | | | | | | | | |
| 5.250%, 03/01/2018 | | | 1,000,000 | | | | 1,143,013 | |
| PECO Energy Co. | | | | | | | | |
| 5.350%, 03/01/2018 | | | 1,000,000 | | | | 1,149,737 | |
| Commonwealth Edison Co. | | | | | | | | |
| 5.800%, 03/15/2018 | | | 500,000 | | | | 582,310 | |
| Ameren Union Electric | | | | | | | | |
| 6.000%, 04/01/2018 | | | 1,000,000 | | | | 1,149,797 | |
| Consolidated Edison Co. NY | | | | | | | | |
| 5.850%, 04/01/2018 | | | 500,000 | | | | 585,079 | |
| Duke Energy Carolinas | | | | | | | | |
| 5.100%, 04/15/2018 | | | 1,000,000 | | | | 1,142,973 | |
| Public Service Electric and Gas Co. | | | | | | | | |
| 5.300%, 05/01/2018 | | | 500,000 | | | | 574,356 | |
| 2.300%, 09/15/2018 | | | 1,000,000 | | | | 1,025,692 | |
| MidAmerican Energy Co. | | | | | | | | |
| 2.400%, 03/15/2019 | | | 1,500,000 | | | | 1,532,382 | |
| Kentucky Utilities | | | | | | | | |
| 3.250%, 11/01/2020 | | | 500,000 | | | | 511,162 | |
| Southern California Edison Co. | | | | | | | | |
| 3.875%, 06/01/2021 | | | 2,000,000 | | | | 2,117,888 | |
| San Diego Gas & Electric Co. | | | | | | | | |
| 3.000%, 08/15/2021 | | | 500,000 | | | | 500,298 | |
| Carolina Power & Light Co. | | | | | | | | |
| 2.800%, 05/15/2022 | | | 2,000,000 | | | | 1,913,804 | |
| Consumers Energy Co. | | | | | | | | |
| 2.850%, 05/15/2022 | | | 1,000,000 | | | | 961,261 | |
| Georgia Power Co. | | | | | | | | |
| 2.850%, 05/15/2022 | | | 1,000,000 | | | | 949,926 | |
| Detroit Edison Co. | | | | | | | | |
| 2.650%, 06/15/2022 | | | 500,000 | | | | 472,754 | |
| CenterPoint Energy Houston LLC | | | | | | | | |
| 2.250%, 08/01/2022 | | | 1,000,000 | | | | 918,546 | |
| Baltimore Gas & Electric Co. | | | | | | | | |
| 2.800%, 08/15/2022 | | | 1,000,000 | | | | 942,054 | |
| Northern States Power Co. | | | | | | | | |
| 2.150%, 08/15/2022 | | | 500,000 | | | | 453,594 | |
| | | | | | | | |
| | | Principal
amount | | | Value | |
Corporate Bonds (Cont.) | | | | | | | | |
Utilities & Energy (Cont.) | | | | | | | | |
| Pacific Gas & Electric | | | | | | | | |
| 2.450%, 08/15/2022 | | $ | 1,000,000 | | | $ | 906,279 | |
| Ameren Illinois Co. | | | | | | | | |
| 2.700%, 09/01/2022 | | | 1,000,000 | | | | 948,082 | |
| PPL Electric Utilities | | | | | | | | |
| 2.500%, 09/01/2022 | | | 1,000,000 | | | | 935,232 | |
| PECO Energy Co. | | | | | | | | |
| 2.375%, 09/15/2022 | | | 500,000 | | | | 456,322 | |
| Public Service Company of Colorado | | | | | | | | |
| 2.250%, 09/15/2022 | | | 1,000,000 | | | | 910,387 | |
| Tampa Electric Co. | | | | | | | | |
| 2.600%, 09/15/2022 | | | 500,000 | | | | 466,548 | |
| NSTAR Electric Co. | | | | | | | | |
| 2.375%, 10/15/2022 | | | 500,000 | | | | 459,932 | |
| Public Service Company of Colorado | | | | | | | | |
| 2.500%, 03/15/2023 | | | 1,000,000 | | | | 925,764 | |
| Virginia Electric & Power Co. | | | | | | | | |
| 2.750%, 03/15/2023 | | | 1,000,000 | | | | 947,008 | |
| Northern States Power Co. | | | | | | | | |
| 2.600%, 05/15/2023 | | | 1,000,000 | | | | 932,657 | |
| Public Service Electric and Gas Co. | | | | | | | | |
| 2.375%, 05/15/2023 | | | 2,000,000 | | | | 1,829,284 | |
| Florida Power & Light Co. | | | | | | | | |
| 2.750%, 06/01/2023 | | | 2,000,000 | | | | 1,904,546 | |
| Pacificorp | | | | | | | | |
| 2.950%, 06/01/2023 | | | 1,000,000 | | | | 952,716 | |
| Pacific Gas & Electric | | | | | | | | |
| 3.250%, 06/15/2023 | | | 1,000,000 | | | | 953,204 | |
| Consumers Energy Co. | | | | | | | | |
| 3.375%, 08/15/2023 | | | 1,000,000 | | | | 988,064 | |
| Laclede Gas Co. | | | | | | | | |
| 3.400%, 08/15/2023 | | | 1,000,000 | | | | 988,484 | |
| Duke Energy Ohio Inc. | | | | | | | | |
| 3.800%, 09/01/2023 | | | 1,000,000 | | | | 1,016,200 | |
| San Diego Gas & Electric Co. | | | | | | | | |
| 3.600%, 09/01/2023 | | | 2,000,000 | | | | 2,029,402 | |
Public Service Company of New Hampshire | | | | | | | | |
| 3.500%, 11/01/2023 | | | 500,000 | | | | 495,002 | |
| Delmarva Power & Light Co. | | | | | | | | |
| 3.500%, 11/15/2023 | | | 1,000,000 | | | | 992,439 | |
| DTE Electric Co. | | | | | | | | |
| 3.650%, 03/15/2024 | | | 2,000,000 | | | | 2,018,554 | |
| | | | | | | | |
| | | | | | | 50,670,812 | |
| | | | | | | | |
Total Corporate Bonds (cost $272,431,860) | | | | | | | 277,389,149 | |
| | | | | | | | |
Foreign Government Bonds (0.18%) | | | | | | | | |
| Province of New Brunswick (Canada) | | | | | | | | |
5.200%, 02/21/2017 | | | 2,500,000 | | | | 2,837,850 | |
| | | | | | | | |
Total Foreign Government Bonds (cost $2,496,484) | | | | | | | 2,837,850 | |
| | | | | | | | |
| | |
30 | | See accompanying notes to financial statements. |
STATE FARM ASSOCIATES’ FUNDS TRUST BALANCED FUND
SCHEDULE OF INVESTMENTS (continued)
November 30, 2013
| | | | | | | | |
| | | Principal
amount | | | Value | |
Government Agency Securities (b) (2.07%) | |
|
Agency Commercial Mortgage-Backed Securities (1.76%) | |
Federal Home Loan Mortgage Corp. | |
2.789%, 01/25/2022 | | $ | 10,000,000 | | | $ | 9,922,820 | |
2.839%, 10/25/2022 | | | 9,915,449 | | | | 10,239,754 | |
Federal National Mortgage Association | |
2.715%, 02/25/2022 | | | 7,000,000 | | | | 6,871,879 | |
| | | | | | | | |
| | | | | | | 27,034,453 | |
| | | | | | | | |
Agency Notes & Bonds (0.31%) | |
Tennessee Valley Authority | | | | | | | | |
5.500%, 07/18/2017 | | | 1,000,000 | | | | 1,156,884 | |
1.750%, 10/15/2018 | | | 1,500,000 | | | | 1,509,957 | |
3.875%, 02/15/2021 | | | 2,000,000 | | | | 2,151,818 | |
| | | | | | | | |
| | | | | | | 4,818,659 | |
| | | | | | | | |
Total Government Agency Securities (cost $31,761,373) | | | | 31,853,112 | |
| | | | | | | | |
U.S. Treasury Obligations (19.44%) | |
U.S. Treasury Notes | | | | | | | | |
4.000%, 02/15/2014 | | | 10,000,000 | | | | 10,079,300 | |
4.250%, 11/15/2014 | | | 20,000,000 | | | | 20,775,000 | |
4.000%, 02/15/2015 | | | 15,000,000 | | | | 15,683,790 | |
4.125%, 05/15/2015 | | | 20,000,000 | | | | 21,131,240 | |
4.500%, 02/15/2016 | | | 15,000,000 | | | | 16,373,430 | |
5.125%, 05/15/2016 | | | 20,000,000 | | | | 22,312,500 | |
4.625%, 02/15/2017 | | | 20,000,000 | | | | 22,506,240 | |
3.250%, 03/31/2017 | | | 5,000,000 | | | | 5,416,015 | |
3.500%, 02/15/2018 | | | 20,000,000 | | | | 21,995,320 | |
3.750%, 11/15/2018 | | | 10,000,000 | | | | 11,156,250 | |
3.125%, 05/15/2019 | | | 20,000,000 | | | | 21,681,240 | |
3.625%, 08/15/2019 | | | 10,000,000 | | | | 11,090,620 | |
3.375%, 11/15/2019 | | | 10,000,000 | | | | 10,953,120 | |
3.625%, 02/15/2020 | | | 10,000,000 | | | | 11,085,940 | |
3.500%, 05/15/2020 | | | 20,000,000 | | | | 22,000,000 | |
3.625%, 02/15/2021 | | | 10,000,000 | | | | 11,021,880 | |
2.000%, 11/15/2021 | | | 25,000,000 | | | | 24,382,800 | |
2.500%, 08/15/2023 | | | 10,000,000 | | | | 9,813,280 | |
2.750%, 11/15/2023 | | | 10,000,000 | | | | 10,007,810 | |
| | | | | | | | |
Total U.S. Treasury Obligations (cost $281,412,201) | | | | 299,465,775 | |
| | | | | | | | |
| | | | | | | | |
| | | Shares | | | Value | |
Short-term Investments (0.44%) | | | | | |
JPMorgan U.S. Government Money Market Fund | | | 6,717,245 | | | $ | 6,717,245 | |
| | | | | | | | |
Total Short-term Investments (cost $ 6,717,245) | | | | 6,717,245 | |
| | | | | | | | |
TOTAL INVESTMENTS (99.59%) (cost $ 892,194,457) | | | | 1,534,473,729 | |
OTHER ASSETS, NET OF LIABILITIES (0.41%) | | | | 6,361,570 | |
| | | | | | | | |
NET ASSETS (100.00%) | | | $ | 1,540,835,299 | |
| | | | | | | | |
| | | | | | | | |
| (a) | Non-income producing security. |
| (b) | The obligations of these U.S. Government-sponsored entities are neither issued nor guaranteed by the United States Treasury. |
ADR – American Depositary Receipt
| | | | |
| See accompanying notes to financial statements. | | | 31 | |
STATE FARM ASSOCIATES’ FUNDS TRUST INTERIM FUND
SCHEDULE OF INVESTMENTS
November 30, 2013
| | | | | | | | |
| | | Principal
amount | | | Value | |
U.S. Treasury Obligations (99.71%) | | | | | |
U.S. Treasury Notes | | | | | | | | |
4.000%, 02/15/2014 | | $ | 10,000,000 | | | $ | 10,079,300 | |
4.750%, 05/15/2014 | | | 10,000,000 | | | | 10,208,980 | |
2.625%, 06/30/2014 | | | 10,000,000 | | | | 10,143,750 | |
4.250%, 08/15/2014 | | | 10,000,000 | | | | 10,287,500 | |
4.250%, 11/15/2014 | | | 5,000,000 | | | | 5,193,750 | |
4.000%, 02/15/2015 | | | 5,000,000 | | | | 5,227,930 | |
4.125%, 05/15/2015 | | | 5,000,000 | | | | 5,282,810 | |
1.750%, 07/31/2015 | | | 10,000,000 | | | | 10,250,390 | |
4.250%, 08/15/2015 | | | 20,000,000 | | | | 21,362,500 | |
2.625%, 02/29/2016 | | | 10,000,000 | | | | 10,512,500 | |
2.625%, 04/30/2016 | | | 20,000,000 | | | | 21,079,680 | |
1.500%, 06/30/2016 | | | 8,000,000 | | | | 8,223,128 | |
1.000%, 10/31/2016 | | | 10,000,000 | | | | 10,128,910 | |
3.000%, 02/28/2017 | | | 10,000,000 | | | | 10,742,970 | |
2.375%, 07/31/2017 | | | 10,000,000 | | | | 10,546,880 | |
1.875%, 08/31/2017 | | | 10,000,000 | | | | 10,363,280 | |
1.875%, 09/30/2017 | | | 10,000,000 | | | | 10,356,250 | |
1.875%, 10/31/2017 | | | 10,000,000 | | | | 10,353,120 | |
2.250%, 11/30/2017 | | | 10,000,000 | | | | 10,496,090 | |
2.750%, 12/31/2017 | | | 12,500,000 | | | | 13,370,112 | |
2.625%, 01/31/2018 | | | 20,000,000 | | | | 21,282,820 | |
2.750%, 02/28/2018 | | | 10,000,000 | | | | 10,693,750 | |
2.875%, 03/31/2018 | | | 10,000,000 | | | | 10,740,620 | |
2.625%, 04/30/2018 | | | 10,000,000 | | | | 10,636,720 | |
2.375%, 05/31/2018 | | | 10,000,000 | | | | 10,525,780 | |
2.375%, 06/30/2018 | | | 10,000,000 | | | | 10,515,620 | |
2.250%, 07/31/2018 | | | 10,000,000 | | | | 10,460,160 | |
1.375%, 09/30/2018 | | | 10,000,000 | | | | 10,031,250 | |
1.375%, 11/30/2018 | | | 10,000,000 | | | | 10,012,500 | |
1.375%, 12/31/2018 | | | 10,000,000 | | | | 9,992,970 | |
1.250%, 01/31/2019 | | | 10,000,000 | | | | 9,915,620 | |
1.375%, 02/28/2019 | | | 10,000,000 | | | | 9,959,380 | |
1.500%, 03/31/2019 | | | 10,000,000 | | | | 10,000,000 | |
1.125%, 05/31/2019 | | | 10,000,000 | | | | 9,759,380 | |
1.250%, 10/31/2019 | | | 15,000,000 | | | | 14,596,875 | |
| | | | | | | | |
Total U.S. Treasury Obligations (cost $380,190,189) | | | | | | | 383,333,275 | |
| | | | | | | | |
| | |
| | | Shares | | | Value | |
Short-term Investments (0.14%) | |
JPMorgan U.S. Government Money Market Fund | | | 552,746 | | | $ | 552,746 | |
| | | | | | | | |
Total Short-term Investments (cost $552,746) | | | | 552,746 | |
| | | | | | | | |
TOTAL INVESTMENTS (99.85%) (cost $380,742,935) | | | | 383,886,021 | |
OTHER ASSETS, NET OF LIABILITIES (0.15%) | | | | 566,989 | |
| | | | | | | | |
NET ASSETS (100.00%) | | | $ | 384,453,010 | |
| | | | | | | | |
| | | | | | | | |
| | |
32 | | See accompanying notes to financial statements. |
STATE FARM ASSOCIATES’ FUNDS TRUST MUNICIPAL BOND FUND
SCHEDULE OF INVESTMENTS
November 30, 2013
| | | | | | | | | | | | | | | | | | |
| | | Coupon
rate | | | Maturity
date | | | Rating (a) | | Principal
amount | | | Value | |
Long-term Municipal Bonds (98.07%) | | | | | | | | | | | | | | | | | | |
Alabama (1.83%) | | | | | | | | | | | | | | | | | | |
City of Hoover, Alabama, General Obligation Warrants (Prerefunded to 03-01-2014 @ 102) (b) | | | 5.000% | | | | 03/01/2017 | | | Aa1 | | $ | 2,000,000 | | | $ | 2,063,660 | |
City of Phenix City, General Obligation Warrants, Series 2010-B | | | 5.000% | | | | 02/01/2019 | | | AA- | | | 1,030,000 | | | | 1,204,379 | |
City of Athens, Alabama, General Obligation Warrants | | | 4.000% | | | | 09/01/2019 | | | AA- | | | 1,145,000 | | | | 1,301,888 | |
Board of Education of the City of Hoover, Capital Outlay Warrants, Series 2005 | | | 3.500% | | | | 02/15/2026 | | | Aa2 | | | 985,000 | | | | 957,272 | |
City of Madison (Alabama), General Obligation School Warrants, Series 2009 | | | 5.250% | | | | 02/01/2027 | | | Aa2 | | | 2,540,000 | | | | 2,779,370 | |
City of Madison (Alabama), General Obligation School Warrants, Series 2009 | | | 5.250% | | | | 02/01/2028 | | | Aa2 | | | 1,500,000 | | | | 1,630,215 | |
City of Florence (Alabama), Water and Sewer Revenue Warrants, Series 2011 | | | 5.000% | | | | 08/15/2029 | | | A1 | | | 1,620,000 | | | | 1,743,428 | |
| | | | | | | | | | | | | | | | | | |
| | | | | | | | | | | | | | | | | 11,680,212 | |
| | | | | | | | | | | | | | | | | | |
Alaska (1.62%) | | | | | | | | | | | | | | | | | | |
Municipality of Anchorage, Alaska, Senior Lien Refunding Electric Revenue Bonds, 1996 | | | 6.500% | | | | 12/01/2014 | | | NR | | | 2,000,000 | | | | 2,105,200 | |
Municipality of Anchorage, Alaska, Senior Lien Electric Revenue Bonds, 2009 Series A (Tax-Exempt) | | | 4.000% | | | | 12/01/2021 | | | A+ | | | 1,955,000 | | | | 2,036,406 | |
Municipality of Anchorage, Alaska, Wastewater Revenue and Refunding Bonds, 2007 | | | 4.625% | | | | 05/01/2022 | | | AA | | | 585,000 | | | | 619,462 | |
Municipality of Anchorage, Alaska, Water Revenue and Refunding Bonds, 2007 | | | 4.625% | | | | 05/01/2022 | | | AA | | | 295,000 | | | | 308,366 | |
Municipality of Anchorage, Alaska, 2007 General Obligation Refunding Bonds, Series B (Schools) | | | 4.500% | | | | 09/01/2022 | | | AAA | | | 1,000,000 | | | | 1,075,800 | |
Municipality of Anchorage, Alaska, Wastewater Revenue and Refunding Bonds, 2007 | | | 4.750% | | | | 05/01/2023 | | | AA | | | 645,000 | | | | 681,294 | |
Municipality of Anchorage, Alaska, Water Revenue and Refunding Bonds, 2007 | | | 4.750% | | | | 05/01/2023 | | | AA | | | 1,110,000 | | | | 1,159,262 | |
Municipality of Anchorage, Alaska, 2005 General Obligation Bonds, Series F (General Purpose) | | | 4.125% | | | | 09/01/2023 | | | Aa2 | | | 1,000,000 | | | | 1,030,780 | |
Matanuska Susitna Borough, Alaska General Obligation Unlimited Bonds | | | 5.500% | | | | 07/01/2025 | | | Aa2 | | | 1,190,000 | | | | 1,331,931 | |
| | | | | | | | | | | | | | | | | | |
| | | | | | | | | | | | | | | | | 10,348,501 | |
| | | | | | | | | | | | | | | | | | |
Arizona (5.41%) | | | | | | | | | | | | | | | | | | |
Maricopa County, Arizona, Cave Creek Unified School District No. 93, School Improvement Bonds, Project of 2000, Series C (2006) | | | 4.250% | | | | 07/01/2015 | | | A+ | | | 525,000 | | | | 555,760 | |
Tucson Unified School District No. 1 of Pima County, Arizona, Refunding Bonds, Tax-Exempt Series 2011 | | | 4.000% | | | | 07/01/2016 | | | Aa2 | | | 450,000 | | | | 487,107 | |
Amphitheater Unified School District No. 10 of Pima County, Arizona, School Improvement Bonds, Project of 2007, Series B (2009), (Bank Qualified) | | | 4.000% | | | | 07/01/2019 | | | A+ | | | 500,000 | | | | 553,335 | |
City of Glendale, Arizona, General Obligation Refunding Bonds, Series 2010 | | | 5.000% | | | | 07/01/2019 | | | A3 | | | 4,180,000 | | | | 4,762,608 | |
Tucson Unified School District No. 1 of Pima County, Arizona, Refunding Bonds, Tax-Exempt Series 2011 | | | 5.000% | | | | 07/01/2020 | | | Aa2 | | | 1,965,000 | | | | 2,279,184 | |
Amphitheater Unified School District No. 10 of Pima County, Arizona, School Improvement Bonds, Project of 2007, Series B (2009), (Bank Qualified) | | | 5.000% | | | | 07/01/2021 | | | A+ | | | 500,000 | | | | 556,950 | |
Maricopa County, Arizona, Tempe Elementary School District No. 3, School Improvement Bonds, Project of 2005, Series B (2007) | | | 4.500% | | | | 07/01/2021 | | | Aa2 | | | 2,500,000 | | | | 2,627,900 | |
Paradise Valley Unified School District No. 69 of Maricopa County, Arizona, School Improvement Bonds, Project of 2011, Series A (2012) | | | 3.000% | | | | 07/01/2021 | | | Aa2 | | | 1,000,000 | | | | 1,021,790 | |
Tucson Unified School District No. 1 of Pima County, Arizona, School Improvement Bonds, Project of 2004, Series C (2007) | | | 4.500% | | | | 07/01/2021 | | | A+ | | | 1,000,000 | | | | 1,070,450 | |
Paradise Valley Unified School District No. 69 of Maricopa County, Arizona, School Improvement Bonds, Project of 2011, Series A (2012) | | | 3.000% | | | | 07/01/2022 | | | Aa2 | | | 720,000 | | | | 727,063 | |
Pima County, Arizona, Sewer System Revenue Obligations, Series 2012A | | | 3.000% | | | | 07/01/2022 | | | A+ | | | 1,500,000 | | | | 1,492,110 | |
Pima County, Arizona, Sewer System Revenue Obligations, Series 2012A | | | 5.000% | | | | 07/01/2022 | | | A+ | | | 500,000 | | | | 574,290 | |
Tucson Unified School District No. 1 of Pima County, Arizona, Refunding Bonds, Tax-Exempt Series 2011 | | | 5.000% | | | | 07/01/2022 | | | Aa2 | | | 1,000,000 | | | | 1,152,660 | |
Amphitheater Unified School District No. 10 of Pima County, Arizona, School Improvement Bonds, Project of 2007, Series B (2009), (Bank Qualified) | | | 5.000% | | | | 07/01/2023 | | | A+ | | | 1,000,000 | | | | 1,093,350 | |
Litchfield Elementary School District No. 79 of Maricopa County, Arizona, School Improvement Bonds, Project of 2009, Series A (2011) | | | 5.000% | | | | 07/01/2023 | | | Aa2 | | | 1,000,000 | | | | 1,126,660 | |
Paradise Valley Unified School District No. 69 of Maricopa County, Arizona, School Improvement Bonds, Project of 2011, Series A (2012) | | | 3.000% | | | | 07/01/2023 | | | Aa2 | | | 1,360,000 | | | | 1,358,858 | |
Paradise Valley Unified School District No. 69 of Maricopa County, Arizona, School Improvement Bonds, Project of 2011, Series B (2013) | | | 3.000% | | | | 07/01/2023 | | | Aa2 | | | 1,525,000 | | | | 1,523,719 | |
Pima County, Arizona, General Obligation Bonds, Series 2009A | | | 4.000% | | | | 07/01/2023 | | | AA- | | | 1,500,000 | | | | 1,590,690 | |
| | | | |
| See accompanying notes to financial statements. | | | 33 | |
STATE FARM ASSOCIATES’ FUNDS TRUST MUNICIPAL BOND FUND
SCHEDULE OF INVESTMENTS (continued)
November 30, 2013
| | | | | | | | | | | | | | | | | | |
| | | Coupon
rate | | | Maturity
date | | | Rating (a) | | Principal
amount | | | Value | |
Long-term Municipal Bonds (Cont.) | | | | | | | | | | | | | | | | | | |
Arizona (Cont.) | | | | | | | | | | | | | | | | | | |
Pima County, Arizona, Sewer System Revenue Obligations, Series 2012A | | | 5.000% | | | | 07/01/2023 | | �� | A+ | | $ | 1,060,000 | | | $ | 1,196,984 | |
Pinal County Community College District of Pinal County, Arizona, General Obligation Bonds, Project of 2008, Series B (2012) | | | 4.500% | | | | 07/01/2023 | | | AA- | | | 1,705,000 | | | | 1,828,101 | |
Salt River Project Agricultural Improvement and Power District, Arizona, Salt River Project Electric System Refunding Revenue Bonds, 2008 Series A | | | 5.000% | | | | 01/01/2024 | | | AA | | | 1,500,000 | | | | 1,640,130 | |
Amphitheater Unified School District No. 10 of Pima County, Arizona, School Improvement Bonds, Project of 2007, Series B (2009), (Bank Qualified) | | | 5.000% | | | | 07/01/2024 | | | A+ | | | 1,000,000 | | | | 1,087,490 | |
Phoenix Union High School District No. 210 of Maricopa County, Arizona, School Improvement Bonds, Project of 2011, Tax-Exempt Series A (2012) | | | 4.000% | | | | 07/01/2024 | | | Aa2 | | | 1,165,000 | | | | 1,228,120 | |
Amphitheater Unified School District No. 10 of Pima County, Arizona, School Improvement Bonds, Project of 2007, Series D (2013) | | | 5.000% | | | | 07/01/2026 | | | A+ | | | 555,000 | | | | 611,771 | |
Pima County, Arizona, General Obligation Bonds, Series 2012A | | | 4.000% | | | | 07/01/2026 | | | AA- | | | 2,000,000 | | | | 2,040,740 | |
Amphitheater Unified School District No. 10 of Pima County, Arizona, School Improvement Bonds, Project of 2007, Series D (2013) | | | 5.000% | | | | 07/01/2027 | | | A+ | | | 400,000 | | | | 436,536 | |
| | | | | | | | | | | | | | | | | | |
| | | | | | | | | | | | | | | | | 34,624,356 | |
| | | | | | | | | | | | | | | | | | |
Arkansas (3.21%) | | | | | | | | | | | | | | | | | | |
Beaver Water District of Benton and Washington Counties, Arkansas, Water Refunding Revenue Bonds, Series 2010 | | | 3.000% | | | | 11/15/2019 | | | AA- | | | 1,390,000 | | | | 1,468,368 | |
Little Rock School District of Pulaski County, Arkansas, Refunding Bonds | | | 3.000% | | | | 02/01/2020 | | | NR | | | 1,250,000 | | | | 1,267,775 | |
Cabot School District No. 4 of Lonoke County, Arkansas, Refunding Bonds | | | 3.000% | | | | 02/01/2021 | | | NR | | | 645,000 | | | | 649,444 | |
Conway School District No. 1 of Faulkner County, Arkansas Refunding Bonds (Prerefunded to 02-01-2015 @ 100) (b) | | | 4.000% | | | | 02/01/2021 | | | NR | | | 1,515,000 | | | | 1,580,660 | |
City of Little Rock, Arkansas, Sewer Construction Revenue Bonds, Series 2007A | | | 4.500% | | | | 06/01/2021 | | | Aa3 | | | 1,320,000 | | | | 1,401,378 | |
Cabot School District No. 4 of Lonoke County, Arkansas, Refunding Bonds | | | 3.000% | | | | 02/01/2022 | | | NR | | | 660,000 | | | | 654,786 | |
Rogers School District No. 30 of Benton County, Arkansas Refunding Bonds | | | 3.000% | | | | 02/01/2022 | | | NR | | | 1,000,000 | | | | 986,420 | |
Bentonville School District No. 6 of Benton County, Arkansas Construction Bonds, Series E | | | 3.000% | | | | 06/01/2022 | | | Aa2 | | | 980,000 | | | | 983,557 | |
City of Little Rock, Arkansas, Sewer Revenue Bonds, Series 2008 | | | 5.125% | | | | 10/01/2022 | | | Aa3 | | | 100,000 | | | | 111,521 | |
Cabot School District No. 4 of Lonoke County, Arkansas, Refunding Bonds | | | 3.000% | | | | 02/01/2023 | | | NR | | | 675,000 | | | | 660,136 | |
State of Arkansas, General Obligation Four-Lane Highway Construction and Improvement Bonds, Series 2013 | | | 3.500% | | | | 06/15/2023 | | | AA | | | 6,000,000 | | | | 6,164,100 | |
City of Little Rock, Arkansas, Sewer Revenue Bonds, Series 2008 | | | 5.250% | | | | 10/01/2024 | | | Aa3 | | | 335,000 | | | | 371,790 | |
Springdale School District No. 50 of Washington County, Arkansas Refunding and Construction Bonds, Series A | | | 4.000% | | | | 06/01/2025 | | | Aa2 | | | 2,000,000 | | | | 2,078,620 | |
City of Fort Smith, Arkansas, Water and Sewer Refunding and Construction Revenue Bonds, Series 2008 | | | 5.250% | | | | 10/01/2028 | | | A | | | 1,500,000 | | | | 1,612,095 | |
City of Little Rock, Arkansas, Sewer Revenue Bonds, Series 2008 | | | 5.500% | | | | 10/01/2030 | | | Aa3 | | | 500,000 | | | | 546,805 | |
| | | | | | | | | | | | | | | | | | |
| | | | | | | | | | | | | | | | | 20,537,455 | |
| | | | | | | | | | | | | | | | | | |
California (2.89%) | | | | | | | | | | | | | | | | | | |
Golden West Schools Financing Authority, 2005 General Obligation Revenue Bonds | | | 5.000% | | | | 08/01/2015 | | | AA | | | 1,515,000 | | | | 1,632,958 | |
Desert Water Agency Financing Corporation (Water System Improvement Project) Series 2007 | | | 4.500% | | | | 05/01/2021 | | | AA | | | 740,000 | | | | 789,595 | |
Desert Water Agency Financing Corporation (Water System Improvement Project) Series 2007 | | | 4.625% | | | | 05/01/2022 | | | AA | | | 770,000 | | | | 819,981 | |
Santa Barbara Schools Financing Authority 2007 General Obligation Revenue Bonds, Series A (Santa Barbara Elementary School District General Obligation Bond Refunding) (Santa Barbara County, California) | | | 4.750% | | | | 08/01/2022 | | | Aa3 | | | 1,160,000 | | | | 1,246,884 | |
City of San Jose, General Obligation Bonds, Series 2007 (Parks and Public Safety Projects) | | | 4.500% | | | | 09/01/2022 | | | Aa1 | | | 2,900,000 | | | | 3,020,350 | |
Desert Water Agency Financing Corporation (Water System Improvement Project) Series 2007 | | | 4.750% | | | | 05/01/2023 | | | AA | | | 810,000 | | | | 861,216 | |
Kern High School District (Kern County, California), General Obligation Bonds, 2004 Election, Series C | | | 4.750% | | | | 08/01/2023 | | | A+ | | | 1,685,000 | | | | 1,740,319 | |
Santa Barbara Schools Financing Authority 2007 General Obligation Revenue Bonds, Series B (Santa Barbara High School District General Obligation Bond Refunding) (Santa Barbara County, California) | | | 4.750% | | | | 08/01/2023 | | | Aa3 | | | 1,435,000 | | | | 1,539,368 | |
| | |
34 | | See accompanying notes to financial statements. |
STATE FARM ASSOCIATES’ FUNDS TRUST MUNICIPAL BOND FUND
SCHEDULE OF INVESTMENTS (continued)
November 30, 2013
| | | | | | | | | | | | | | | | | | |
| | | Coupon
rate | | | Maturity
date | | | Rating (a) | | Principal
amount | | | Value | |
Long-term Municipal Bonds (Cont.) | | | | | | | | | | | | | | | | | | |
California (Cont.) | | | | | | | | | | | | | | | | | | |
Desert Water Agency Financing Corporation (Water System Improvement Project) Series 2007 | | | 4.750% | | | | 05/01/2024 | | | AA | | $ | 845,000 | | | $ | 892,726 | |
Carmel Unified School District (Monterey County, California), General Obligation Bonds, Election of 2005, Series 2008 | | | 4.750% | | | | 08/01/2025 | | | AAA | | | 575,000 | | | | 613,266 | |
Marin Community College District (Marin County, California), Election of 2004 General Obligation Bonds, Series C | | | 4.000% | | | | 08/01/2025 | | | AA | | | 1,115,000 | | | | 1,198,658 | |
Marin Community College District (Marin County, California), Election of 2004 General Obligation Bonds, Series C | | | 4.250% | | | | 08/01/2026 | | | AA | | | 1,275,000 | | | | 1,373,328 | |
Santa Barbara Community College District, (Santa Barbara County, California), General Obligation Bonds, Election of 2008, Series A | | | 5.250% | | | | 08/01/2026 | | | Aa1 | | | 1,555,000 | | | | 1,706,690 | |
Santa Clara Unified School District (Santa Clara County, California), General Obligation Bonds, Election of 2004, Series 2008 | | | 4.875% | | | | 07/01/2027 | | | AA | | | 1,000,000 | | | | 1,033,050 | |
| | | | | | | | | | | | | | | | | | |
| | | | | | | | | | | | | | | | | 18,468,389 | |
| | | | | | | | | | | | | | | | | | |
Colorado (3.09%) | | | | | | | | | | | | | | | | | | |
City of Colorado Springs, Colorado, Utilities System, Subordinate Lien Improvement Revenue Bonds, Series 2005B | | | 4.750% | | | | 11/15/2015 | | | Aa2 | | | 510,000 | | | | 553,197 | |
Highlands Ranch Metropolitan District No. 2, (Douglas County, Colorado) General Obligation Refunding Bonds, Series 2005 | | | 4.500% | | | | 06/15/2017 | | | AA+ | | | 1,705,000 | | | | 1,801,043 | |
City of Colorado Springs, Colorado, Utilities System Subordinate Lien Improvement Revenue Bonds, Series 2005B (Prerefunded to 11-15-2015 @ 100) (b) | | | 4.750% | | | | 11/15/2019 | | | Aa2 | | | 600,000 | | | | 651,798 | |
El Paso County School District No. 20 (Academy), El Paso County, Colorado, General Obligation Refunding Bonds, Series 2012 | | | 3.000% | | | | 12/15/2021 | | | Aa2 | | | 830,000 | | | | 864,320 | |
Jefferson County, Colorado, School District No. 1 | | | 5.000% | | | | 12/15/2021 | | | AA- | | | 3,000,000 | | | | 3,535,440 | |
St. Vrain Valley School District No. RE-1J, (Boulder, Larimer and Weld Counties, and the City and County of Broomfield, Colorado), General Obligation Refunding Bonds, Series 2012 | | | 3.000% | | | | 12/15/2021 | | | Aa2 | | | 2,820,000 | | | | 2,895,068 | |
Cherry Creek School District No. 5, (Arapahoe County, Colorado), General Obligation Bonds, Series 2012B | | | 3.000% | | | | 12/15/2023 | | | AA | | | 4,215,000 | | | | 4,211,333 | |
City of Aurora, Colorado, First-Lien Water Refunding Revenue Bonds, Series 2008A | | | 4.750% | | | | 08/01/2025 | | | Aa2 | | | 1,500,000 | | | | 1,616,655 | |
City of Aurora, Colorado, First-Lien Water Refunding Revenue Bonds, Series 2008A | | | 4.750% | | | | 08/01/2026 | | | Aa2 | | | 1,465,000 | | | | 1,567,726 | |
City of Aurora, Colorado, First-Lien Water Improvement Revenue Bonds, Series 2007A | | | 5.000% | | | | 08/01/2032 | | | Aa2 | | | 2,000,000 | | | | 2,100,680 | |
| | | | | | | | | | | | | | | | | | |
| | | | | | | | | | | | | | | | | 19,797,260 | |
| | | | | | | | | | | | | | | | | | |
Connecticut (2.31%) | | | | | | | | | | | | | | | | | | |
The University of Connecticut, General Obligation Bonds, Series A 2004 (Prerefunded to 01-15-2014 @ 100) (b) | | | 5.000% | | | | 01/15/2018 | | | Aa3 | | | 600,000 | | | | 603,312 | |
Town of New Canaan, Connecticut, General Obligation Refunding Bonds, Issue of 2010, Series A | | | 5.000% | | | | 06/15/2020 | | | Aaa | | | 500,000 | | | | 567,675 | |
Town of Trumbull, Connecticut, General Obligation Refunding Bonds, Issue of 2009 | | | 4.000% | | | | 09/15/2020 | | | Aa2 | | | 525,000 | | | | 575,421 | |
Town of Stonington, Connecticut, General Obligation Bonds, Issue of 2012 | | | 3.000% | | | | 04/01/2021 | | | Aa1 | | | 425,000 | | | | 438,864 | |
Town of Trumbull, Connecticut, General Obligation Refunding Bonds, Issue of 2009 | | | 4.000% | | | | 09/15/2021 | | | Aa2 | | | 500,000 | | | | 539,000 | |
State of Connecticut, General Obligation Refunding Bonds, 2006 Series E | | | 4.500% | | | | 12/15/2021 | | | Aa3 | | | 1,900,000 | | | | 2,034,938 | |
Town of Stonington, Connecticut, General Obligation Bonds, Issue of 2012 | | | 3.000% | | | | 04/01/2022 | | | Aa1 | | | 600,000 | | | | 609,690 | |
Town of Darien, Connecticut, General Obligation Refunding Bonds, Issue of 2012, Series B | | | 2.000% | | | | 08/01/2022 | | | Aaa | | | 1,550,000 | | | | 1,455,667 | |
City of Stamford, Connecticut, General Obligation Bonds, Issue of 2013 | | | 2.000% | | | | 02/01/2023 | | | Aa1 | | | 2,450,000 | | | | 2,207,180 | |
Town of Bethel, Connecticut, General Obligation Sewer Bonds, Issue of 2009, Series B | | | 4.000% | | | | 11/15/2023 | | | AA+ | | | 620,000 | | | | 638,061 | |
City of Stamford, Connecticut, General Obligation Bonds, Issue of 2013 | | | 2.250% | | | | 02/01/2024 | | | Aa1 | | | 2,400,000 | | | | 2,158,080 | |
Town of New Canaan, Connecticut, General Obligation Refunding Bonds, Issue of 2010, Series A | | | 4.000% | | | | 06/15/2024 | | | Aaa | | | 1,000,000 | | | | 1,049,850 | |
State of Connecticut Health and Education Facilities Authority Revenue Bonds, Yale University Issue
Series T-1 | | | 4.700% | | | | 07/01/2029 | | | Aaa | | | 1,800,000 | | | | 1,909,242 | |
| | | | | | | | | | | | | | | | | | |
| | | | | | | | | | | | | | | | | 14,786,980 | |
| | | | | | | | | | | | | | | | | | |
Delaware (0.33%) | | | | | | | | | | | | | | | | | | |
State of Delaware, General Obligation Bonds, Series 2007A (Prerefunded to 05-01-2015 @ 100) (b) | | | 4.250% | | | | 05/01/2021 | | | Aaa | | | 1,125,000 | | | | 1,189,046 | |
| | | | |
| See accompanying notes to financial statements. | | | 35 | |
STATE FARM ASSOCIATES’ FUNDS TRUST MUNICIPAL BOND FUND
SCHEDULE OF INVESTMENTS (continued)
November 30, 2013
| | | | | | | | | | | | | | | | | | |
| | | Coupon
rate | | | Maturity
date | | | Rating (a) | | Principal
amount | | | Value | |
Long-term Municipal Bonds (Cont.) | | | | | | | | | | | | | | | | | | |
Delaware (Cont.) | | | | | | | | | | | | | | | | | | |
New Castle County, Delaware, General Obligation Bonds, Series 2012B | | | 3.000% | | | | 07/15/2023 | | | Aaa | | $ | 900,000 | | | $ | 906,111 | |
| | | | | | | | | | | | | | | | | | |
| | | | | | | | | | | | | | | | | 2,095,157 | |
| | | | | | | | | | | | | | | | | | |
Florida (6.20%) | | | | | | | | | | | | | | | | | | |
City of Titusville, Florida, Water and Sewer Revenue Refunding Bonds, Series 2010 | | | 5.000% | | | | 10/01/2018 | | | A+ | | | 1,000,000 | | | | 1,134,350 | |
Pasco County, Florida, Water and Sewer Refunding Revenue Bonds, Series 2006 | | | 4.500% | | | | 10/01/2019 | | | Aa2 | | | 2,025,000 | | | | 2,157,982 | |
City of Pompano Beach, Florida, Water and Sewer Refunding Revenue Bonds Series 2006B | | | 4.500% | | | | 07/01/2020 | | | NR | | | 1,220,000 | | | | 1,227,613 | |
JEA Florida, Water and Sewer System Revenue Bonds, 2010 Series D | | | 3.600% | | | | 10/01/2020 | | | Aa2 | | | 1,220,000 | | | | 1,252,354 | |
Pasco County, Florida, Water and Sewer Revenue Bonds, Series 2009A | | | 5.000% | | | | 10/01/2020 | | | Aa2 | | | 1,390,000 | | | | 1,548,516 | |
Fort Lauderdale, Florida, Water and Sewer Revenue Bonds | | | 4.000% | | | | 03/01/2021 | | | Aa1 | | | 1,170,000 | | | | 1,292,955 | |
State of Florida, State Board of Education, Public Education Capital Outlay Bonds 2004 Series D | | | 4.375% | | | | 06/01/2021 | | | Aa1 | | | 1,000,000 | | | | 1,069,490 | |
State of Florida, Department of Transportation, Turnpike Revenue Bonds, Series 2006A | | | 4.200% | | | | 07/01/2021 | | | Aa3 | | | 3,500,000 | | | | 3,708,250 | |
City of Titusville, Florida, Water and Sewer Revenue Refunding Bonds, Series 2010 | | | 5.000% | | | | 10/01/2021 | | | A+ | | | 600,000 | | | | 663,540 | |
Orlando Utilities Commission, Utility System Revenue Refunding Bonds, Series 2006 | | | 4.750% | | | | 10/01/2021 | | | Aa2 | | | 1,000,000 | | | | 1,085,490 | |
Pasco County, Florida, Water and Sewer Revenue Bonds, Series 2009A | | | 4.000% | | | | 10/01/2021 | | | Aa2 | | | 1,455,000 | | | | 1,536,975 | |
Fort Lauderdale, Florida, Water and Sewer Revenue Bonds | | | 4.000% | | | | 03/01/2022 | | | Aa1 | | | 1,215,000 | | | | 1,325,468 | |
Coral Springs Improvement District, Subordinate Water and Sewer Revenue Bonds, Series 2007 | | | 4.375% | | | | 06/01/2022 | | | NR | | | 1,500,000 | | | | 1,534,845 | |
JEA Florida, Electric System Revenue Bonds, Series Three 2009A | | | 5.000% | | | | 10/01/2022 | | | AA- | | | 1,820,000 | | | | 1,843,041 | |
Tohopekaliga Water Authority, Utility System Revenue Refunding Bonds, Series 2011A | | | 5.000% | | | | 10/01/2022 | | | Aa2 | | | 365,000 | | | | 416,655 | |
Fort Lauderdale, Florida, Water and Sewer Revenue Bonds | | | 4.000% | | | | 09/01/2023 | | | Aa1 | | | 1,290,000 | | | | 1,390,710 | |
Tohopekaliga Water Authority, Utility System Revenue Refunding Bonds, Series 2011A | | | 5.000% | | | | 10/01/2023 | | | Aa2 | | | 200,000 | | | | 225,474 | |
City of Hollywood, Florida, General Obligation Bonds, Series 2005 | | | 5.000% | | | | 06/01/2024 | | | A1 | | | 3,000,000 | | | | 3,132,510 | |
State of Florida, Department of Transportation, Turnpike Revenue Bonds, Series 2006A | | | 4.250% | | | | 07/01/2024 | | | Aa3 | | | 2,500,000 | | | | 2,607,600 | |
State of Florida, Department of Transportation, Turnpike Revenue Bonds, Series 2010B | | | 5.000% | | | | 07/01/2024 | | | Aa3 | | | 2,000,000 | | | | 2,245,840 | |
State of Florida, Department of Transportation, Turnpike Revenue Bonds, Series 2010B | | | 5.000% | | | | 07/01/2025 | | | Aa3 | | | 2,485,000 | | | | 2,768,439 | |
City of West Palm Beach, Florida, Utility System Revenue Refunding Bonds, Series 2008A | | | 5.000% | | | | 10/01/2026 | | | Aa2 | | | 2,000,000 | | | | 2,187,760 | |
Lee County, Florida, Water and Sewer Revenue Bonds, Series 2013A | | | 5.000% | | | | 10/01/2026 | | | Aa3 | | | 400,000 | | | | 445,628 | |
State of Florida, State Board of Education, Public Education Capital Outlay Bonds, 2004 Series C | | | 4.750% | | | | 06/01/2029 | | | Aa1 | | | 2,000,000 | | | | 2,086,260 | |
Lee County, Florida, Water and Sewer Revenue Bonds, Series 2013A | | | 5.000% | | | | 10/01/2032 | | | Aa3 | | | 750,000 | | | | 795,990 | |
| | | | | | | | | | | | | | | | | | |
| | | | | | | | | | | | | | | | | 39,683,735 | |
| | | | | | | | | | | | | | | | | | |
Georgia (1.73%) | | | | | | | | | | | | | | | | | | |
Cherokee County Water and Sewerage Authority (Georgia), Water and Sewerage Revenue Refunding Bonds, Series 2010 | | | 3.500% | | | | 08/01/2020 | | | Aa2 | | | 200,000 | | | | 213,206 | |
Cherokee County Water and Sewerage Authority (Georgia), Water and Sewerage Revenue Refunding Bonds, Series 2010 | | | 4.000% | | | | 08/01/2021 | | | Aa2 | | | 250,000 | | | | 268,415 | |
Fayette County, Georgia, Water Revenue Bond, Series 2009 | | | 5.000% | | | | 10/01/2021 | | | Aa2 | | | 1,790,000 | | | | 2,025,940 | |
Henry County and Henry County Water and Sewerage Authority (Georgia), Water and Sewerage Revenue Refunding Bonds, Series 2010 | | | 5.000% | | | | 02/01/2022 | | | Aa2 | | | 1,000,000 | | | | 1,168,610 | |
Fulton County, Georgia, Water and Sewerage Revenue Refunding Bonds, Series 2011 | | | 5.000% | | | | 01/01/2024 | | | Aa3 | | | 1,660,000 | | | | 1,863,433 | |
Fayette County, Georgia, Water Revenue Bond, Series 2009 | | | 4.375% | | | | 10/01/2024 | | | Aa2 | | | 750,000 | | | | 805,125 | |
Unified Government of Athens-Clarke County, Georgia, Water and Sewerage Revenue Bonds, Series 2008 | | | 5.625% | | | | 01/01/2028 | | | AA- | | | 1,000,000 | | | | 1,125,200 | |
Forsyth County, Georgia, General Obligation Bonds, Series 2008A | | | 5.000% | | | | 03/01/2028 | | | AA+ | | | 1,000,000 | | | | 1,089,710 | |
Spalding County Water and Sewerage Facilities Authority (Georgia), Revenue Bonds, Series 2008 | | | 6.125% | | | | 09/01/2028 | | | A1 | | | 2,300,000 | | | | 2,539,315 | |
| | | | | | | | | | | | | | | | | | |
| | | | | | | | | | | | | | | | | 11,098,954 | |
| | | | | | | | | | | | | | | | | | |
Hawaii (0.80%) | | | | | | | | | | | | | | | | | | |
City and County of Honolulu, General Obligation Bonds, Series 2005F (Prerefunded to 07-01-2015 @ 100) (b) | | | 5.000% | | | | 07/01/2026 | | | Aa1 | | | 2,140,000 | | | | 2,297,911 | |
State of Hawaii Highway Revenue Bonds Series 2008 | | | 5.750% | | | | 01/01/2027 | | | Aa2 | | | 2,000,000 | | | | 2,227,180 | |
| | |
36 | | See accompanying notes to financial statements. |
STATE FARM ASSOCIATES’ FUNDS TRUST MUNICIPAL BOND FUND
SCHEDULE OF INVESTMENTS (continued)
November 30, 2013
| | | | | | | | | | | | | | | | | | |
| | | Coupon
rate | | | Maturity
date | | | Rating (a) | | Principal
amount | | | Value | |
Long-term Municipal Bonds (Cont.) | | | | | | | | | | | | | | | | | | |
| | | | | |
Hawaii (Cont.) | | | | | | | | | | | | | | | | | | |
County of Hawaii, General Obligation Bonds, 2013 Series A | | | 5.000% | | | | 09/01/2031 | | | AA- | | $ | 575,000 | | | $ | 619,229 | |
| | | | | | | | | | | | | | | | | | |
| | | | | | | | | | | | | | | | | 5,144,320 | |
| | | | | | | | | | | | | | | | | | |
Idaho (0.17%) | | | | | | | | | | | | | | | | | | |
Independent School District of Boise City, Ada and Boise Counties, Idaho, General Obligation Bonds, Series 2007 | | | 4.625% | | | | 08/01/2022 | | | AA | | | 1,000,000 | | | | 1,074,910 | |
| | | | | | | | | | | | | | | | | | |
Illinois (2.27%) | | | | | | | | | | | | | | | | | | |
Community Unit School District Number 200-U Will County, Illinois (Prerefunded to 11-01-2015 @ 100) (b) | | | 5.000% | | | | 11/01/2019 | | | A1 | | | 1,650,000 | | | | 1,797,460 | |
The Illinois State Toll Highway Authority, Toll Highway Senior Priority Revenue Bonds, 2005 Series A | | | 4.125% | | | | 01/01/2020 | | | Aa3 | | | 5,000,000 | | | | 5,186,000 | |
School District Number 161, Will County, Illinois, General Obligation School Bonds, Series 2005 | | | 5.000% | | | | 01/01/2020 | | | Aa2 | | | 1,360,000 | | | | 1,410,116 | |
County of Lake, Illinois, Water and Sewer System Revenue Refunding Bonds Series B of 2006 | | | 4.375% | | | | 12/01/2020 | | | Aa1 | | | 1,465,000 | | | | 1,584,192 | |
Community Consolidated School District Number 201, Grundy, Kendall and Will Counties, Illinois, (Minooka), General Obligation Refunding School Bonds, Series 2010A | | | 5.250% | | | | 10/15/2022 | | | AA- | | | 1,200,000 | | | | 1,310,400 | |
Community Consolidated School District Number 201, Grundy, Kendall and Will Counties, Illinois, (Minooka), General Obligation Refunding School Bonds, Series 2010A | | | 5.250% | | | | 10/15/2023 | | | AA- | | | 2,000,000 | | | | 2,182,900 | |
School District Number 161, Will County, Illinois, General Obligation School Bonds, Series 2005
(Prerefunded to 01-01-2015 @ 100) (b) | | | 5.000% | | | | 01/01/2024 | | | Aa2 | | | 130,000 | | | | 136,625 | |
School District Number 161, Will County, Illinois, General Obligation School Bonds, Series 2005 | | | 5.000% | | | | 01/01/2024 | | | Aa2 | | | 870,000 | | | | 897,040 | |
| | | | | | | | | | | | | | | | | | |
| | | | | | | | | | | | | | | | | 14,504,733 | |
| | | | | | | | | | | | | | | | | | |
Indiana (2.01%) | | | | | | | | | | | | | | | | | | |
Zionsville Community Schools Building Corporation, Boone County, Indiana, First Mortgage Bonds, Series 2005A | | | 5.000% | | | | 07/15/2018 | | | AA- | | | 1,665,000 | | | | 1,773,558 | |
Town of Zionsville, Indiana, Sewage Works Revenue Bonds of 2010, Series A | | | 2.800% | | | | 07/15/2019 | | | AA- | | | 230,000 | | | | 243,110 | |
City of Bloomington, Indiana, Waterworks Revenue Bonds of 2011, Series B | | | 3.500% | | | | 07/01/2020 | | | AA- | | | 910,000 | | | | 944,671 | |
Lebanon Middle School Building Corporation, Lebanon, Indiana, Unlimited Ad Valorem Property Tax First Mortgage Bonds, Series 2011 | | | 4.000% | | | | 07/10/2020 | | | A+ | | | 2,075,000 | | | | 2,243,552 | |
Town of Zionsville, Indiana, Sewage Works Revenue Bonds of 2010, Series A | | | 3.000% | | | | 07/15/2020 | | | AA- | | | 245,000 | | | | 257,960 | |
City of Fort Wayne, Indiana, Sewage Works Revenue Bonds of 2010 | | | 4.500% | | | | 08/01/2020 | | | Aa3 | | | 2,075,000 | | | | 2,351,162 | |
Ball State University Board of Trustees, Ball State University Student Fee Bonds, Series 0 | | | 5.250% | | | | 07/01/2022 | | | Aa3 | | | 500,000 | | | | 554,075 | |
City of Noblesville, Indiana, Sewage Works Revenue Bonds of 2011 | | | 4.000% | | | | 07/01/2022 | | | Aa2 | | | 185,000 | | | | 194,374 | |
Ball State University Board of Trustees, Ball State University Student Fee Bonds, Series 0 | | | 5.250% | | | | 07/01/2023 | | | Aa3 | | | 1,060,000 | | | | 1,168,851 | |
City of Noblesville, Indiana, Sewage Works Revenue Bonds of 2011 | | | 4.250% | | | | 07/01/2023 | | | Aa2 | | | 215,000 | | | | 227,698 | |
City of Noblesville, Indiana, Sewage Works Revenue Bonds of 2011 | | | 4.375% | | | | 07/01/2024 | | | Aa2 | | | 210,000 | | | | 221,556 | |
The Trustees of Ivy Tech Community College of Indiana, Ivy Tech Community College Student Fee Bonds, Series K | | | 5.000% | | | | 07/01/2024 | | | AA- | | | 1,000,000 | | | | 1,069,710 | |
City of Fort Wayne, Indiana, Sewage Works Revenue Bonds of 2010 | | | 4.500% | | | | 08/01/2025 | | | Aa3 | | | 1,530,000 | | | | 1,631,347 | |
| | | | | | | | | | | | | | | | | | |
| | | | | | | | | | | | | | | | | 12,881,624 | |
| | | | | | | | | | | | | | | | | | |
Iowa (2.58%) | | | | | | | | | | | | | | | | | | |
City of Des Moines, Iowa, General Obligation Bonds, Series 2007C Urban Renewal | | | 4.000% | | | | 06/01/2015 | | | Aa1 | | | 990,000 | | | | 1,044,480 | |
Board of Regents, State of Iowa, Utility System Revenue Bonds, Series S.U.I. 2006 | | | 4.000% | | | | 11/01/2015 | | | Aa1 | | | 975,000 | | | | 1,034,153 | |
Black Hawk County, Iowa, General Obligation Bonds, Series 2008B | | | 4.600% | | | | 06/01/2018 | | | Aa2 | | | 520,000 | | | | 545,979 | |
City of West Des Moines, Iowa, General Obligation Bonds, Series 2004A (Prerefunded to 06-01-2014 @ 100) (b) | | | 5.000% | | | | 06/01/2018 | | | Aaa | | | 850,000 | | | | 870,256 | |
City of Des Moines, Iowa, General Obligation Refunding Bonds, Series 2010B (Urban Renewal) | | | 4.000% | | | | 06/01/2019 | | | Aa1 | | | 1,190,000 | | | | 1,304,633 | |
Clear Creek Amana Community School District, Iowa, General Obligation School Bonds | | | 4.625% | | | | 06/01/2019 | | | Aa3 | | | 1,200,000 | | | | 1,217,352 | |
City of Des Moines, Iowa, General Obligation Refunding Bonds, Series 2010B (Urban Renewal) | | | 4.000% | | | | 06/01/2022 | | | Aa1 | | | 1,350,000 | | | | 1,429,636 | |
Board of Regents, State of Iowa, Academic Building Revenue Bonds, Series S.U.I. 2008 | | | 4.625% | | | | 07/01/2025 | | | AA | | | 1,775,000 | | | | 1,906,048 | |
Board of Regents, State of Iowa, Academic Building Revenue Bonds, Series S.U.I. 2008 | | | 4.625% | | | | 07/01/2026 | | | AA | | | 1,750,000 | | | | 1,870,680 | |
| | | | |
| See accompanying notes to financial statements. | | | 37 | |
STATE FARM ASSOCIATES’ FUNDS TRUST MUNICIPAL BOND FUND
SCHEDULE OF INVESTMENTS (continued)
November 30, 2013
| | | | | | | | | | | | | | | | | | |
| | | Coupon
rate | | | Maturity
date | | | Rating (a) | | Principal
amount | | | Value | |
Long-term Municipal Bonds (Cont.) | | | | | | | | | | | | | | | | | | |
Iowa (Cont.) | | | | | | | | | | | | | | | | | | |
Ankeny Community School District Polk County, Iowa, General Obligation School Bonds, Series 2009 | | | 5.000% | | | | 06/01/2027 | | | Aa3 | | $ | 2,000,000 | | | $ | 2,151,880 | |
Board of Regents, State of Iowa, Academic Building Revenue Bonds, Series S.U.I. 2008 | | | 4.750% | | | | 07/01/2027 | | | AA | | | 1,950,000 | | | | 2,092,233 | |
Waukee Community School District, Iowa, General Obligation School Bonds, Series 2009 | | | 5.000% | | | | 06/01/2028 | | | Aa2 | | | 1,000,000 | | | | 1,066,120 | |
| | | | | | | | | | | | | | | | | | |
| | | | | | | | | | | | | | | | | 16,533,450 | |
| | | | | | | | | | | | | | | | | | |
Kansas (3.92%) | | | | | | | | | | | | | | | | | | |
Kansas Development Finance Authority, Kansas Water Pollution Control Revolving Fund Revenue Bonds | | | 5.500% | | | | 05/01/2015 | | | Aaa | | | 2,000,000 | | | | 2,148,100 | |
City of Overland Park, Kansas Internal Improvement Bonds, Series 2006A (Prerefunded to 09-01-2014 @ 100) (b) | | | 4.250% | | | | 09/01/2016 | | | Aaa | | | 1,220,000 | | | | 1,257,064 | |
City of Derby, Kansas, General Obligation Water System Refunding Bonds, Series A (Prerefunded to
12-01-2013 @ 100) (b) | | | 5.000% | | | | 12/01/2017 | | | Aa3 | | | 670,000 | | | | 670,000 | |
Unified School District No. 263, Sedgwick County, Kansas (Mulvane) General Obligation School Building Bonds, Series 2004 (Prerefunded to 09-01-2014 @ 100) (b) | | | 5.000% | | | | 09/01/2018 | | | A1 | | | 1,000,000 | | | | 1,035,550 | |
Unified School District No. 265, Sedgwick County, Kansas (Goddard), General Obligation Refunding and Improvement Bonds Series 2005 (Prerefunded to 10-01-2015 @ 100) (b) | | | 5.000% | | | | 10/01/2018 | | | Aa3 | | | 540,000 | | | | 586,672 | |
Unified School District No. 265, Sedgwick County, Kansas (Goddard), General Obligation Refunding and Improvement Bonds Series 2005 (Prerefunded to 10-01-2015 @ 100) (b) | | | 5.000% | | | | 10/01/2018 | | | Aa3 | | | 370,000 | | | | 401,624 | |
City of Wichita, Kansas, General Obligation Bonds, Series 790 (Prerefunded to 09-01-2014 @ 101) (b) | | | 4.375% | | | | 09/01/2019 | | | Aa1 | | | 980,000 | | | | 1,020,092 | |
Johnson County, Kansas, Internal Improvement Bonds, Series 2007B, (General Obligation Payable from Unlimited Ad Valorem Taxes) | | | 4.500% | | | | 09/01/2022 | | | Aaa | | | 1,000,000 | | | | 1,075,800 | |
Unified School District No. 512, Johnson County, Kansas, (Shawnee Mission), General Obligation Refunding Bonds, Series 2012-A | | | 2.000% | | | | 10/01/2022 | | | Aaa | | | 2,010,000 | | | | 1,844,537 | |
City of Lawrence, Kansas, Water and Sewage System, Improvement Revenue Bonds, Series 2007 | | | 4.500% | | | | 11/01/2022 | | | Aa2 | | | 890,000 | | | | 961,040 | |
Johnson County, Kansas, Internal Improvement Bonds, Series 2007B, (General Obligation Payable from Unlimited Ad Valorem Taxes) | | | 4.500% | | | | 09/01/2023 | | | Aaa | | | 1,615,000 | | | | 1,734,429 | |
Johnson County, Kansas, Internal Improvement Bonds, Series 2007B, (General Obligation Payable from Unlimited Ad Valorem Taxes) | | | 4.625% | | | | 09/01/2024 | | | Aaa | | | 1,895,000 | | | | 2,033,714 | |
City of Wichita, Kansas, Water and Sewer Utility, Revenue Bonds, Series 2009A | | | 5.000% | | | | 10/01/2024 | | | AA- | | | 2,000,000 | | | | 2,219,000 | |
Johnson County, Kansas, Internal Improvement Bonds, Series 2008A | | | 4.500% | | | | 09/01/2025 | | | Aaa | | | 1,115,000 | | | | 1,197,042 | |
City of Wichita, Kansas, Water and Sewer Utility Revenue Bonds, Series 2005C | | | 5.000% | | | | 10/01/2025 | | | AA- | | | 1,240,000 | | | | 1,328,710 | |
Johnson County, Kansas, Internal Improvement Bonds, Series 2008A | | | 4.750% | | | | 09/01/2026 | | | Aaa | | | 2,220,000 | | | | 2,402,684 | |
Unified School District No. 233, Johnson County, Kansas (Olathe), General Obligation School Improvement and Refunding Bonds, Series 2013C | | | 4.500% | | | | 09/01/2028 | | | Aa2 | | | 3,000,000 | | | | 3,141,600 | |
| | | | | | | | | | | | | | | | | | |
| | | | | | | | | | | | | | | | | 25,057,658 | |
| | | | | | | | | | | | | | | | | | |
Kentucky (1.70%) | | | | | | | | | | | | | | | | | | |
Sanitation District No. 1, Sanitation District Revenue Bonds, Series 2006, Campbell, Kenton and Boone Counties, Kentucky | | | 4.300% | | | | 08/01/2017 | | | Aa2 | | | 1,275,000 | | | | 1,355,644 | |
Boone-Florence Water Commission (Kentucky), Water Supply System Refunding Revenue Bonds, Series 2010 | | | 3.250% | | | | 12/01/2018 | | | Aa3 | | | 2,040,000 | | | | 2,183,636 | |
Louisville/Jefferson County Metro Government, General Obligation Bonds, Series 2006A | | | 4.500% | | | | 11/01/2020 | | | Aa1 | | | 1,565,000 | | | | 1,694,848 | |
Boone-Florence Water Commission (Kentucky), Water Supply System Refunding Revenue Bonds, Series 2010 | | | 3.250% | | | | 12/01/2020 | | | Aa3 | | | 1,780,000 | | | | 1,851,218 | |
Louisville and Jefferson County Metropolitan Sewer District, (Commonwealth of Kentucky), Sewer and Drainage System Revenue Bonds, Series 2007A | | | 5.000% | | | | 05/15/2024 | | | Aa3 | | | 1,500,000 | | | | 1,620,150 | |
Louisville/Jefferson County Metro Government, General Obligation Bonds, Series 2006A | | | 4.250% | | | | 11/01/2025 | | | Aa1 | | | 1,000,000 | | | | 1,060,330 | |
Northern Kentucky Water District Revenue Bonds, 2013 Series A | | | 4.000% | | | | 02/01/2028 | | | Aa3 | | | 1,110,000 | | | | 1,105,205 | |
| | | | | | | | | | | | | | | | | | |
| | | | | | | | | | | | | | | | | 10,871,031 | |
| | | | | | | | | | | | | | | | | | |
Louisiana (0.29%) | | | | | | | | | | | | | | | | | | |
City of Shreveport, State of Louisiana, General Obligation Refunding Bonds, Series 2005A | | | 5.000% | | | | 05/01/2019 | | | A+ | | | 1,340,000 | | | | 1,400,689 | |
| | |
38 | | See accompanying notes to financial statements. |
STATE FARM ASSOCIATES’ FUNDS TRUST MUNICIPAL BOND FUND
SCHEDULE OF INVESTMENTS (continued)
November 30, 2013
| | | | | | | | | | | | | | | | | | |
| | | Coupon
rate | | | Maturity
date | | | Rating (a) | | Principal
amount | | | Value | |
Long-term Municipal Bonds (Cont.) | | | | | | | | | | | | | | | | | | |
Louisiana (Cont.) | | | | | | | | | | | | | | | | | | |
Caddo Parish, Louisiana, General Obligation Bonds Series 2007 | | | 4.500% | | | | 02/01/2020 | | | Aa2 | | $ | 405,000 | | | $ | 435,703 | |
| | | | | | | | | | | | | | | | | | |
| | | | | | | | | | | | | | | | | 1,836,392 | |
| | | | | | | | | | | | | | | | | | |
Maine (0.61%) | | | | | | | | | | | | | | | | | | |
Maine Municipal Bond Bank, 2007 Series A Refunding Bonds | | | 4.500% | | | | 11/01/2020 | | | Aa2 | | | 100,000 | | | | 109,076 | |
Maine Municipal Bond Bank, 2007 Series A Refunding Bonds | | | 4.500% | | | | 11/01/2021 | | | Aa2 | | | 3,515,000 | | | | 3,796,938 | |
| | | | | | | | | | | | | | | | | | |
| | | | | | | | | | | | | | | | | 3,906,014 | |
| | | | | | | | | | | | | | | | | | |
Maryland (1.72%) | | | | | | | | | | | | | | | | | | |
State of Maryland, General Obligation Bonds, State and Local Facilities Loan of 2002, Second Series | | | 5.500% | | | | 08/01/2014 | | | Aaa | | | 430,000 | | | | 445,102 | |
Prince George’s County, Maryland, General Obligation Consolidated Public Improvement Bonds, Series 2005 (Prerefunded to 10-01-2015 @ 100) (b) | | | 4.000% | | | | 10/01/2017 | | | Aaa | | | 455,000 | | | | 486,049 | |
Washington Suburban Sanitary District, Maryland | | | 5.000% | | | | 06/01/2019 | | | Aaa | | | 2,000,000 | | | | 2,100,440 | |
State of Maryland, General Obligation Bonds, State and Local Facilities Loan of 2012, Second Series B, Tax-Exempt Bonds | | | 2.250% | | | | 08/01/2023 | | | Aaa | | | 2,000,000 | | | | 1,843,880 | |
Howard County, Maryland, General Obligation Consolidated Public Improvement Bonds, 2012 Series A | | | 4.000% | | | | 02/15/2026 | | | Aaa | | | 2,075,000 | | | | 2,189,084 | |
University System of Maryland, Auxiliary Facility and Tuition Revenue Bonds, 2008 Series A | | | 4.625% | | | | 04/01/2026 | | | Aa1 | | | 2,140,000 | | | | 2,288,965 | |
The City of Frederick, Maryland, General Obligation Bonds and Notes, Public Improvements Bonds, Tax-Exempt Series 2009A | | | 5.000% | | | | 03/01/2027 | | | Aa2 | | | 1,500,000 | | | | 1,655,925 | |
| | | | | | | | | | | | | | | | | | |
| | | | | | | | | | | | | | | | | 11,009,445 | |
| | | | | | | | | | | | | | | | | | |
Massachusetts (0.33%) | | | | | | | | | | | | | | | | | | |
The Commonwealth of Massachusetts, Commonwealth Transportation Fund Revenue Bonds, (Accelerated Bridge Program), 2013 Series A | | | 5.000% | | | | 06/01/2034 | | | Aaa | | | 2,000,000 | | | | 2,143,080 | |
| | | | | | | | | | | | | | | | | | |
Michigan (3.34%) | | | | | | | | | | | | | | | | | | |
Forest Hills Public Schools, County of Kent, State of Michigan, 2010 School Building and Site Bonds, Series II, (General Obligation - Unlimited Tax) | | | 4.000% | | | | 05/01/2018 | | | AA | | | 500,000 | | | | 553,125 | |
Board of Trustees of Northern Michigan University, General Revenue Bonds, Series 2008A | | | 5.000% | | | | 12/01/2018 | | | A | | | 440,000 | | | | 506,475 | |
Traverse City Area Public Schools, Counties of Grand Traverse, Leelanau and Benzie, State of Michigan, 2010 School Building and Site Bonds (General Obligation - Unlimited Tax) | | | 3.500% | | | | 05/01/2020 | | | AA | | | 1,000,000 | | | | 1,071,110 | |
Plymouth-Canton Community Schools, Counties of Wayne and Washtenaw, State of Michigan, 2012 Refunding Bonds, Series A, (General Obligation - Unlimited Tax) | | | 5.000% | | | | 05/01/2021 | | | Aa2 | | | 425,000 | | | | 488,686 | |
Forest Hills Public Schools County of Kent, State of Michigan, 2007 School Building and Site Bonds (General Obligation - Unlimited Tax) | | | 4.750% | | | | 05/01/2022 | | | AA | | | 2,000,000 | | | | 2,146,780 | |
Forest Hills Public Schools, County of Kent, State of Michigan, 2010 School Building and Site Bonds, Series II, (General Obligation - Unlimited Tax) | | | 4.000% | | | | 05/01/2022 | | | AA | | | 700,000 | | | | 747,257 | |
Hudsonville Public Schools, Counties of Ottawa and Allegan, State of Michigan, 2011 School Building and Site Bonds, (General Obligation - Unlimited Tax) | | | 5.000% | | | | 05/01/2022 | | | A+ | | | 275,000 | | | | 311,482 | |
Plymouth-Canton Community Schools, Counties of Wayne and Washtenaw, State of Michigan, 2012 Refunding Bonds, Series A, (General Obligation - Unlimited Tax) | | | 5.000% | | | | 05/01/2022 | | | Aa2 | | | 450,000 | | | | 516,794 | |
East Grand Rapids Public Schools, County of Kent, State of Michigan, 2012 Refunding Bonds, (General Obligation - Unlimited Tax) | | | 4.000% | | | | 05/01/2023 | | | AA | | | 1,485,000 | | | | 1,553,310 | |
Hudsonville Public Schools, Counties of Ottawa and Allegan, State of Michigan, 2011 School Building and Site Bonds, (General Obligation - Unlimited Tax) | | | 5.000% | | | | 05/01/2023 | | | A+ | | | 400,000 | | | | 447,144 | |
Hudsonville Public Schools, Counties of Ottawa and Allegan, State of Michigan, 2011 School Building and Site Bonds, (General Obligation - Unlimited Tax) | | | 5.000% | | | | 05/01/2024 | | | A+ | | | 600,000 | | | | 664,458 | |
Howell Public Schools, County of Livingston, State of Michigan, 2011 Refunding Bonds, Series B, (General Obligation - Unlimited Tax) | | | 5.000% | | | | 05/01/2025 | | | A+ | | | 1,880,000 | | | | 2,057,434 | |
Hudsonville Public Schools, Counties of Ottawa and Allegan, State of Michigan, 2013 Refunding Bonds, (General Obligation - Unlimited Tax) | | | 4.000% | | | | 05/01/2025 | | | A+ | | | 700,000 | | | | 725,557 | |
Plymouth-Canton Community Schools, Counties of Wayne and Washtenaw, State of Michigan, 2012 Refunding Bonds, Series A, (General Obligation - Unlimited Tax) | | | 5.000% | | | | 05/01/2025 | | | Aa2 | | | 1,260,000 | | | | 1,396,597 | |
| | | | |
| See accompanying notes to financial statements. | | | 39 | |
STATE FARM ASSOCIATES’ FUNDS TRUST MUNICIPAL BOND FUND
SCHEDULE OF INVESTMENTS (continued)
November 30, 2013
| | | | | | | | | | | | | | | | | | |
| | | Coupon
rate | | | Maturity
date | | | Rating (a) | | Principal
amount | | | Value | |
Long-term Municipal Bonds (Cont.) | | | | | | | | | | | | | | | | | | |
Michigan (Cont.) | | | | | | | | | | | | | | | | | | |
Hudsonville Public Schools, Counties of Ottawa and Allegan, State of Michigan, 2013 Refunding Bonds, (General Obligation - Unlimited Tax) | | | 4.000% | | | | 05/01/2026 | | | A+ | | $ | 1,290,000 | | | $ | 1,309,195 | |
Plymouth-Canton Community Schools, Counties of Wayne and Washtenaw, State of Michigan, 2012 Refunding Bonds, Series A, (General Obligation - Unlimited Tax) | | | 4.000% | | | | 05/01/2026 | | | Aa2 | | | 2,300,000 | | | | 2,303,197 | |
Plymouth-Canton Community Schools, Counties of Wayne and Washtenaw, State of Michigan, 2013 School Building and Site Bonds, Series A, (General Obligation - Unlimited Tax) | | | 4.000% | | | | 05/01/2026 | | | A+ | | | 3,850,000 | | | | 3,838,681 | |
City of Petoskey, County of Emmet, State of Michigan, Water Supply and Sewage Disposal System Revenue and Revenue Refunding Bonds, Series 2011 | | | 4.500% | | | | 02/01/2028 | | | AA- | | | 750,000 | | | | 755,895 | |
| | | | | | | | | | | | | | | | | | |
| | | | | | | | | | | | | | | | | 21,393,177 | |
| | | | | | | | | | | | | | | | | | |
Minnesota (0.67%) | | | | | | | | | | | | | | | | | | |
Independent School District No. 194 (Lakeville), Minnesota, General Obligation Refunding Bonds, Series 2012D | | | 5.000% | | | | 02/01/2022 | | | Aa3 | | | 2,720,000 | | | | 3,175,246 | |
State of Minnesota, General Obligation State Various Purpose Bonds, Series 2009H | | | 4.500% | | | | 11/01/2024 | | | Aa1 | | | 1,000,000 | | | | 1,114,440 | |
| | | | | | | | | | | | | | | | | | |
| | | | | | | | | | | | | | | | | 4,289,686 | |
| | | | | | | | | | | | | | | | | | |
Mississippi (2.25%) | | | | | | | | | | | | | | | | | | |
State of Mississippi, General Obligation Refunding Bonds, Series 2002A | | | 5.500% | | | | 12/01/2015 | | | Aa2 | | | 2,000,000 | | | | 2,202,140 | |
DeSoto County School District, DeSoto County, Mississippi, General Obligation Bonds, Series 2005
(Prerefunded to 05-01-2014 @ 100) (b) | | | 4.000% | | | | 05/01/2018 | | | Aa1 | | | 1,585,000 | | | | 1,609,900 | |
City of Jackson, Mississippi, Water and Sewer System Revenue Refunding Bonds, Series 2005 | | | 4.500% | | | | 09/01/2018 | | | A1 | | | 1,000,000 | | | | 1,049,770 | |
City of Ridgeland, Mississippi, General Obligation Public Improvement Bonds, Series 2007A | | | 4.375% | | | | 08/01/2019 | | | Aa2 | | | 475,000 | | | | 525,573 | |
City of Ridgeland, Mississippi, General Obligation Public Improvement Bonds, Series 2007B | | | 4.375% | | | | 08/01/2019 | | | Aa2 | | | 525,000 | | | | 580,897 | |
City of Ridgeland, Mississippi, General Obligation Public Improvement Bonds, Series 2007A | | | 4.500% | | | | 08/01/2020 | | | Aa2 | | | 500,000 | | | | 542,215 | |
City of Ridgeland, Mississippi, General Obligation Public Improvement Bonds, Series 2007B | | | 4.500% | | | | 08/01/2020 | | | Aa2 | | | 400,000 | | | | 433,772 | |
Mississippi Development Bank, Special Obligation Bonds, Series 2010A, (City of Jackson, Mississippi General Obligation, Refunding Project) | | | 5.000% | | | | 03/01/2022 | | | AA- | | | 1,000,000 | | | | 1,120,890 | |
Madison County School District, Madison County, Mississippi, General Obligation Refunding Bonds, Series 2012 | | | 4.000% | | | | 04/15/2022 | | | AA- | | | 2,480,000 | | | | 2,747,294 | |
Mississippi Development Bank, Special Obligation Bonds, Series 2008 (Jackson Public School District General Obligation Bond Project) | | | 5.375% | | | | 04/01/2025 | | | NR | | | 2,290,000 | | | | 2,477,070 | |
Mississippi Development Bank, Special Obligation Bonds, Series 2008 (Jackson Public School District General Obligation Bond Project) | | | 5.375% | | | | 04/01/2026 | | | NR | | | 1,000,000 | | | | 1,077,100 | |
| | | | | | | | | | | | | | | | | | |
| | | | | | | | | | | | | | | | | 14,366,621 | |
| | | | | | | | | | | | | | | | | | |
Missouri (3.04%) | | | | | | | | | | | | | | | | | | |
Reorganized School District No. 7 of Jackson County, Missouri (Lee’s Summit, Missouri School District), General Obligation Refunding Bonds, Series 2005 | | | 4.500% | | | | 03/01/2019 | | | Aa1 | | | 1,850,000 | | | | 1,914,028 | |
State Environmental Improvement and Energy, Resources Authority (State of Missouri), Water Pollution Control and Drinking Water Revenue Bonds, (State Revolving Funds Programs), Series 2007A | | | 4.500% | | | | 01/01/2021 | | | Aaa | | | 1,060,000 | | | | 1,144,122 | |
Health and Education Facilities Authority of the State of Missouri, Educational Facilities Revenue Bonds (The Washington University), Series 2007B | | | 4.200% | | | | 01/15/2021 | | | Aaa | | | 530,000 | | | | 561,720 | |
The School District of Columbia, Boone County, State of Missouri, General Obligation Refunding and Improvement Bonds, Series 2012 | | | 3.500% | | | | 03/01/2022 | | | Aa1 | | | 545,000 | | | | 579,079 | |
City of Ladue School District, St. Louis County, Missouri, General Obligation Refunding and Improvement Bonds, Series 2007 | | | 5.000% | | | | 03/01/2023 | | | AAA | | | 1,455,000 | | | | 1,605,782 | |
The School District of Columbia, Boone County, State of Missouri, General Obligation Refunding and Improvement Bonds, Series 2012 | | | 4.000% | | | | 03/01/2024 | | | Aa1 | | | 2,050,000 | | | | 2,197,088 | |
Parkway C-2 School District, St. Louis County, Missouri, General Obligation Refunding and Improvement Bonds, Series 2009 | | | 4.625% | | | | 03/01/2025 | | | AAA | | | 3,000,000 | | | | 3,198,690 | |
Reorganized School District No. 7 of Jackson County, Missouri (Lee’s Summit, Missouri School District), General Obligation School Building Bonds, Series 2008 | | | 4.750% | | | | 03/01/2027 | | | Aa1 | | | 5,750,000 | | | | 6,138,298 | |
| | |
40 | | See accompanying notes to financial statements. |
STATE FARM ASSOCIATES’ FUNDS TRUST MUNICIPAL BOND FUND
SCHEDULE OF INVESTMENTS (continued)
November 30, 2013
| | | | | | | | | | | | | | | | | | |
| | | Coupon
rate | | | Maturity
date | | | Rating (a) | | Principal
amount | | | Value | |
Long-term Municipal Bonds (Cont.) | | | | | | | | | | | | | | | | | | |
Missouri (Cont.) | | | | | | | | | | | | | | | | | | |
Platte County R-III School District of Platte County, Missouri, General Obligation School Building Bonds, Series 2008 | | | 5.000% | | | | 03/01/2028 | | | AA | | $ | 2,000,000 | | | $ | 2,105,900 | |
| | | | | | | | | | | | | | | | | | |
| | | | | | | | | | | | | | | | | 19,444,707 | |
| | | | | | | | | | | | | | | | | | |
Montana (0.08%) | | | | | | | | | | | | | | | | | | |
State of Montana, General Obligation Bonds, (Water Pollution Control State Revolving Fund Program), Series 2005G | | | 4.750% | | | | 07/15/2018 | | | AA | | | 490,000 | | | | 519,096 | |
| | | | | | | | | | | | | | | | | | |
Nebraska (2.41%) | | | | | | | | | | | | | | | | | | |
City of Omaha, Nebraska, Various Purpose Bonds Series of 2005 (Prerefunded to 11-15-2015 @ 100) (b) | | | 4.500% | | | | 11/15/2018 | | | Aa1 | | | 2,140,000 | | | | 2,316,550 | |
City of Omaha, Nebraska, Various Purpose Bonds Series of 2005 (Prerefunded to 11-15-2015 @ 100) (b) | | | 4.500% | | | | 11/15/2019 | | | Aa1 | | | 2,140,000 | | | | 2,316,550 | |
City of Omaha, Nebraska, Sanitary Sewerage System Revenue Bonds, Series of 2006 | | | 4.250% | | | | 11/15/2020 | | | Aa2 | | | 1,565,000 | | | | 1,668,525 | |
Douglas County School District 0010, (Elkhorn Public Schools), General Obligation Refunding Bonds, Series 2011 | | | 4.000% | | | | 12/15/2022 | | | AA- | | | 1,290,000 | | | | 1,377,643 | |
Douglas County School District 0010, (Elkhorn Public Schools), General Obligation Refunding Bonds, Series 2011 | | | 5.000% | | | | 12/15/2023 | | | AA- | | | 1,560,000 | | | | 1,760,990 | |
Douglas County School District 0001, (Omaha, Nebraska, Public Schools), General Obligation Refunding Bonds, Series 2010 | | | 4.000% | | | | 12/15/2024 | | | Aa1 | | | 3,000,000 | | | | 3,198,300 | |
Douglas County School District 0010, (Elkhorn Public Schools), General Obligation Refunding Bonds, Series 2011 | | | 5.000% | | | | 12/15/2026 | | | AA- | | | 1,925,000 | | | | 2,090,492 | |
Douglas County School District 0010, (Elkhorn Public Schools), General Obligation Bonds, Series 2012B | | | 4.000% | | | | 01/15/2029 | | | AA- | | | 730,000 | | | | 723,437 | |
| | | | | | | | | | | | | | | | | | |
| | | | | | | | | | | | | | | | | 15,452,487 | |
| | | | | | | | | | | | | | | | | | |
New Hampshire (0.57%) | | | | | | | | | | | | | | | | | | |
City of Concord, New Hampshire, General Obligation Bonds, Capital Improvement Bonds, Series A | | | 4.750% | | | | 07/15/2016 | | | Aa1 | | | 400,000 | | | | 426,152 | |
City of Concord, New Hampshire, General Obligation Bonds, Capital Improvement Bonds, Series A (Prerefunded to
07-15-2015 @ 100) (b) | | | 4.750% | | | | 07/15/2016 | | | NR | | | 115,000 | | | | 123,136 | |
State of New Hampshire, General Obligation Refunding Bonds, 2006 Series A | | | 4.250% | | | | 10/15/2020 | | | AA | | | 1,405,000 | | | | 1,503,490 | |
New Hampshire Municipal Bond Bank Series B Bonds | | | 4.750% | | | | 08/15/2023 | | | A1 | | | 1,500,000 | | | | 1,587,915 | |
| | | | | | | | | | | | | | | | | | |
| | | | | | | | | | | | | | | | | 3,640,693 | |
| | | | | | | | | | | | | | | | | | |
New Jersey (4.38%) | | | | | | | | | | | | | | | | | | |
State of New Jersey, General Obligation Bonds, Various Purpose | | | 5.250% | | | | 08/01/2014 | | | Aa3 | | | 7,000,000 | | | | 7,232,890 | |
Borough of Fort Lee, New Jersey, General Obligation Bonds, Series 2005 (Prerefunded to 07-15-2014 @ 100) (b) | | | 4.000% | | | | 07/15/2018 | | | Aa2 | | | 1,230,000 | | | | 1,258,659 | |
Township of Parsippany-Troy Hills, In the County of Morris, New Jersey, General Obligation Bonds | | | 2.500% | | | | 11/01/2018 | | | AA | | | 1,410,000 | | | | 1,477,835 | |
Township of Toms River, County of Ocean, New Jersey, General Improvement Bonds, Series 2010A | | | 3.000% | | | | 06/15/2019 | | | AA | | | 1,900,000 | | | | 1,988,616 | |
Middlesex County Improvement Authority, (County of Middlesex, State of New Jersey), County-Guaranteed Open Space Trust Fund Revenue Bonds, Series 2009A | | | 4.000% | | | | 12/15/2019 | | | Aa2 | | | 1,540,000 | | | | 1,721,581 | |
The Board of Education of the Township of Millstone, in the County of Monmouth, New Jersey, School District Refunding Bonds, Series 2011 | | | 5.000% | | | | 07/15/2020 | | | A+ | | | 1,075,000 | | | | 1,203,076 | |
The Board of Education of the Borough of Madison, in the County of Morris, New Jersey, Refunding School Bonds, Series 2012 B | | | 3.000% | | | | 12/15/2020 | | | AA | | | 315,000 | | | | 323,659 | |
Middlesex County Improvement Authority, (County of Middlesex, State of New Jersey), County-Guaranteed Open Space Trust Fund Revenue Bonds, Series 2009A | | | 4.000% | | | | 12/15/2020 | | | Aa2 | | | 750,000 | | | | 818,760 | |
Township of Parsippany-Troy Hills, In the County of Morris, New Jersey, General Obligation Bonds | | | 3.000% | | | | 11/01/2021 | | | AA | | | 1,775,000 | | | | 1,796,122 | |
The Board of Education of the Borough of Madison, in the County of Morris, New Jersey, Refunding School Bonds, Series 2012 B | | | 3.000% | | | | 12/15/2021 | | | AA | | | 685,000 | | | | 693,309 | |
The Board of Education of the Township of South Brunswick, in the County of Middlesex, New Jersey, Refunding School Bonds, Series 2007 AA | | | 4.500% | | | | 08/01/2022 | | | Aa2 | | | 1,240,000 | | | | 1,319,000 | |
| | | | |
| See accompanying notes to financial statements. | | | 41 | |
STATE FARM ASSOCIATES’ FUNDS TRUST MUNICIPAL BOND FUND
SCHEDULE OF INVESTMENTS (continued)
November 30, 2013
| | | | | | | | | | | | | | | | | | |
| | | Coupon
rate | | | Maturity
date | | | Rating (a) | | Principal
amount | | | Value | |
Long-term Municipal Bonds (Cont.) | | | | | | | | | | | | | | | | | | |
New Jersey (Cont.) | | | | | | | | | | | | | | | | | | |
The Board of Education of the Township of South Brunswick, in the County of Middlesex, New Jersey, Refunding School Bonds | | | 4.000% | | | | 12/01/2022 | | | AA | | $ | 750,000 | | | $ | 813,465 | |
The Board of Education of the Borough of Madison, in the County of Morris, New Jersey, Refunding School Bonds, Series 2012 B | | | 3.000% | | | | 12/15/2022 | | | AA | | | 600,000 | | | | 596,706 | |
Township of Moorestown, in the County of Burlington, New Jersey, General Obligation Bonds Consisting of General Improvement Bonds and Water-Sewer Utility Bonds | | | 3.000% | | | | 01/15/2023 | | | Aa2 | | | 1,065,000 | | | | 1,054,073 | |
The Board of Education of the Borough of Madison, in the County of Morris, New Jersey, Refunding School Bonds, Series 2012 B | | | 4.000% | | | | 12/15/2023 | | | AA | | | 465,000 | | | | 489,864 | |
The Board of Education, of the Somerset Hills School District, in the County of Somerset, New Jersey, Refunding School Bonds, Series 2012 | | | 4.000% | | | | 03/15/2024 | | | Aa1 | | | 2,345,000 | | | | 2,503,311 | |
The County of Morris, New Jersey, General Obligation Bonds,
Series 2012 B, General Improvement Bonds of 2012 | | | 2.125% | | | | 12/15/2024 | | | Aaa | | | 1,756,000 | | | | 1,570,918 | |
Township of Moorestown, in the County of Burlington, New Jersey, General Obligation Bonds Consisting of General Improvement Bonds and Water-Sewer Utility Bonds | | | 4.000% | | | | 01/15/2030 | | | Aa2 | | | 1,140,000 | | | | 1,147,763 | |
| | | | | | | | | | | | | | | | | | |
| | | | | | | | | | | | | | | | | 28,009,607 | |
| | | | | | | | | | | | | | | | | | |
New Mexico (2.98%) | | | | | | | | | | | | | | | | | | |
State Transportation, Refunding Revenue Bonds, (Senior Lien),
Series 2010B | | | 4.000% | | | | 06/15/2019 | | | Aa1 | | | 3,500,000 | | | | 3,946,845 | |
Las Cruces School District No. 2, General Obligation School Bonds, Series 2011A | | | 4.000% | | | | 08/01/2021 | | | Aa2 | | | 1,500,000 | | | | 1,629,510 | |
City of Rio Rancho, New Mexico, Water and Wastewater System Revenue Bonds, Series 2005 (Prerefunded to 05-15-2015 @ 100) (b) | | | 5.000% | | | | 05/15/2022 | | | AA- | | | 1,365,000 | | | | 1,458,598 | |
Santa Fe Public School District, Santa Fe County, New Mexico, General Obligation Bonds, Series 2012 | | | 3.000% | | | | 08/01/2022 | | | AA | | | 2,000,000 | | | | 2,019,760 | |
City of Rio Rancho, New Mexico, Water and Wastewater System Revenue Bonds, Series 2005 (Prerefunded to 05-15-2015 @ 100) (b) | | | 5.000% | | | | 05/15/2023 | | | AA- | | | 1,320,000 | | | | 1,410,512 | |
City of Albuquerque, New Mexico, General Obligation General Purpose Bonds, Series 2012A | | | 4.000% | | | | 07/01/2023 | | | Aa1 | | | 2,450,000 | | | | 2,608,711 | |
Albuquerque Municipal School District No. 12, Bernalillo and Sandoval Counties, New Mexico, General Obligation School Building Bonds Series 2008B | | | 4.500% | | | | 08/01/2023 | | | AA | | | 2,000,000 | | | | 2,112,240 | |
Albuquerque Bernalillo County Water Utility Authority, Joint Water and Sewer System Improvement Revenue Bonds, Series 2005 | | | 4.400% | | | | 07/01/2024 | | | Aa2 | | | 1,000,000 | | | | 1,034,331 | |
City of Santa Fe, New Mexico, General Obligation Bonds, Series 2013 | | | 4.000% | | | | 08/01/2026 | | | AA | | | 675,000 | | | | 687,440 | |
City of Santa Fe, New Mexico, General Obligation Bonds, Series 2013 | | | 4.000% | | | | 08/01/2027 | | | AA | | | 700,000 | | | | 705,558 | |
City of Santa Fe, New Mexico, General Obligation Bonds, Series 2013 | | | 4.000% | | | | 08/01/2028 | | | AA | | | 725,000 | | | | 722,578 | |
City of Santa Fe, New Mexico, General Obligation Bonds, Series 2013 | | | 4.000% | | | | 08/01/2029 | | | AA | | | 750,000 | | | | 737,108 | |
| | | | | | | | | | | | | | | | | | |
| | | | | | | | | | | | | | | | | 19,073,191 | |
| | | | | | | | | | | | | | | | | | |
New York (2.97%) | | | | | | | | | | | | | | | | | | |
Minisink Valley Central School District, Orange and Sullivan Counties, New York, School District (Serial) Bonds, 2005 Series B (Economically Defeased to 06-15-2015 @ 100) (b) | | | 4.000% | | | | 06/15/2017 | | | Aa3 | | | 1,000,000 | | | | 1,057,730 | |
New York State Thruway Authority, Second General Highway and Bridge Trust Fund Bonds, Series 2005B | | | 5.000% | | | | 04/01/2019 | | | AA | | | 2,000,000 | | | | 2,164,040 | |
Town of Brookhaven, Suffolk County, New York, Public Improvement Serial Bonds - 2010 | | | 3.250% | | | | 03/15/2020 | | | Aa2 | | | 1,665,000 | | | | 1,731,850 | |
Minisink Valley Central School District, Orange and Sullivan Counties, New York, School District (Serial) Bonds, 2009 | | | 3.000% | | | | 04/15/2020 | | | AA | | | 825,000 | | | | 842,968 | |
Minisink Valley Central School District, Orange and Sullivan Counties, New York, 2006 Series B Bonds | | | 4.300% | | | | 06/01/2020 | | | Aa3 | | | 695,000 | | | | 718,560 | |
County of Saratoga, New York, Public Improvement (Serial) Bonds, Series 2010B | | | 4.000% | | | | 07/15/2020 | | | AA | | | 410,000 | | | | 432,132 | |
Minisink Valley Central School District, Orange and Sullivan Counties, New York, 2006 Series B Bonds | | | 4.300% | | | | 06/01/2021 | | | Aa3 | | | 625,000 | | | | 644,062 | |
County of Suffolk, New York, Public Improvement Serial Bonds - 2009 Series C | | | 4.000% | | | | 10/15/2021 | | | A2 | | | 3,000,000 | | | | 3,146,940 | |
Hauppauge Union Free School District, Suffolk County, New York, School District Serial Bonds - 2010 | | | 4.000% | | | | 07/15/2022 | | | Aa2 | | | 1,265,000 | | | | 1,358,977 | |
County of Saratoga, New York, Public Improvement (Serial) Bonds, Series 2010B | | | 4.000% | | | | 07/15/2023 | | | AA | | | 465,000 | | | | 477,746 | |
Hauppauge Union Free School District, Suffolk County, New York, School District Serial Bonds - 2010 | | | 4.000% | | | | 07/15/2023 | | | Aa2 | | | 1,615,000 | | | | 1,724,513 | |
| | |
42 | | See accompanying notes to financial statements. |
STATE FARM ASSOCIATES’ FUNDS TRUST MUNICIPAL BOND FUND
SCHEDULE OF INVESTMENTS (continued)
November 30, 2013
| | | | | | | | | | | | | | | | | | |
| | | Coupon
rate | | | Maturity
date | | | Rating (a) | | Principal
amount | | | Value | |
Long-term Municipal Bonds (Cont.) | | | | | | | | | | | | | | | | | | |
New York (Cont.) | | | | | | | | | | | | | | | | | | |
Miller Place Union Free School District, In the Town of Brookhaven, Suffolk County, New York, School District Serial Bonds - 2010 | | | 4.000% | | | | 02/15/2026 | | | Aa2 | | $ | 460,000 | | | $ | 475,792 | |
The Port Authority of New York and New Jersey Consolidated Bonds, One Hundred Fifty-Third Series | | | 4.750% | | | | 07/15/2029 | | | Aa3 | | | 1,000,000 | | | | 1,041,970 | |
The Port Authority of New York and New Jersey Consolidated Bonds, One Hundred Seventy-Ninth Series | | | 5.000% | | | | 12/01/2032 | | | Aa3 | | | 3,000,000 | | | | 3,214,440 | |
| | | | | | | | | | | | | | | | | | |
| | | | | | | | | | | | | | | | | 19,031,720 | |
| | | | | | | | | | | | | | | | | | |
North Carolina (1.64%) | | | | | | | | | | | | | | | | | | |
County of Orange, North Carolina, General Obligation Refunding Bonds, Series 2011 | | | 3.000% | | | | 02/01/2019 | | | Aa1 | | | 1,000,000 | | | | 1,086,100 | |
North Carolina, Orange Water and Sewer Authority, Water and Sewer System Revenue Bonds, Series 2006 | | | 4.375% | | | | 07/01/2019 | | | Aa1 | | | 855,000 | | | | 919,783 | |
City of Fayetteville, North Carolina, Public Works Commission, Revenue Bonds, Series 2009B | | | 5.000% | | | | 03/01/2022 | | | Aa2 | | | 1,000,000 | | | | 1,135,750 | |
County of Pender, North Carolina, General Obligation School Bonds, Series 2007 | | | 4.375% | | | | 03/01/2022 | | | AA- | | | 545,000 | | | | 585,243 | |
County of Wake, North Carolina, General Obligation Public Improvement Bonds, Series 2011 | | | 4.000% | | | | 04/01/2024 | | | Aaa | | | 1,000,000 | | | | 1,074,140 | |
City of Charlotte, North Carolina, General Obligation Refunding Bonds, Series 2009B | | | 4.000% | | | | 06/01/2024 | | | Aaa | | | 1,000,000 | | | | 1,060,690 | |
City of Durham, North Carolina, General Obligation Bonds,
Series 2012A | | | 3.000% | | | | 07/01/2024 | | | Aaa | | | 255,000 | | | | 256,341 | |
City of Asheville, North Carolina, Water System Revenue Bonds, Series 2007 | | | 4.750% | | | | 08/01/2024 | | | Aa2 | | | 1,555,000 | | | | 1,626,577 | |
City of Durham, North Carolina, General Obligation Bonds,
Series 2012A | | | 3.000% | | | | 07/01/2025 | | | Aaa | | | 455,000 | | | | 450,596 | |
State of North Carolina, General Obligation Public Improvement Bonds, Series 2010A | | | 4.000% | | | | 05/01/2026 | | | Aaa | | | 1,000,000 | | | | 1,076,620 | |
Metropolitan Sewerage District of Buncombe County, North Carolina, Sewerage System Revenue Refunding Bonds,
Series 2013 | | | 4.000% | | | | 07/01/2027 | | | Aa2 | | | 1,210,000 | | | | 1,237,056 | |
| | | | | | | | | | | | | | | | | | |
| | | | | | | | | | | | | | | | | 10,508,896 | |
| | | | | | | | | | | | | | | | | | |
| | | | | |
North Dakota (0.16%) | | | | | | | | | | | | | | | | | | |
West Fargo Public School District No. 6, Cass County, North Dakota, General Obligation School Building Bonds,
Series 2011 | | | 4.000% | | | | 05/01/2026 | | | Aa3 | | | 1,000,000 | | | | 1,027,750 | |
| | | | | | | | | | | | | | | | | | |
Ohio (2.29%) | | | | | | | | | | | | | | | | | | |
Lakota Local School District, County of Butler, Ohio, General Obligation Unlimited Tax, School Improvement and Refunding Bonds, Series 2001 | | | 5.250% | | | | 12/01/2013 | | | Aa1 | | | 705,000 | | | | 705,000 | |
Indian Hill Exempted Village School District, County of Hamilton, Ohio, School Improvement Refunding Bonds, Series 2006 | | | 4.375% | | | | 12/01/2020 | | | Aaa | | | 1,580,000 | | | | 1,702,766 | |
State of Ohio, Common Schools General Obligation Bonds, Series 2005C (Prerefunded to 06-15-2015 @ 100) (b) | | | 4.300% | | | | 06/15/2021 | | | Aa1 | | | 2,000,000 | | | | 2,122,080 | |
Board of Education, City School District of the City of Cincinnati, County of Hamilton, Ohio, Classroom Facilities Construction and Improvement Refunding Bonds, Series 2006 (Voted General Obligation Unlimited Tax) | | | 5.250% | | | | 12/01/2022 | | | AA- | | | 1,000,000 | | | | 1,179,620 | |
Plain Local School District, County of Stark, Ohio, General Obligation (Unlimited Tax), School Improvement Refunding Bonds, Series 2011A | | | 4.300% | | | | 11/01/2023 | | | AA- | | | 2,840,000 | | | | 3,003,754 | |
City of Cincinnati, Ohio, Water System Revenue Bonds,
Series 2012A | | | 4.000% | | | | 12/01/2024 | | | Aaa | | | 2,155,000 | | | | 2,263,289 | |
State of Ohio, Common Schools General Obligation Bonds, Series 2006D | | | 4.300% | | | | 09/15/2025 | | | Aa1 | | | 2,000,000 | | | | 2,087,400 | |
Miami University, (A State University of Ohio), General Receipts Revenue and Refunding Bonds, Series 2011 | | | 5.000% | | | | 09/01/2026 | | | Aa3 | | | 1,430,000 | | | | 1,579,392 | |
| | | | | | | | | | | | | | | | | | |
| | | | | | | | | | | | | | | | | 14,643,301 | |
| | | | | | | | | | | | | | | | | | |
| | | | | |
Oklahoma (0.88%) | | | | | | | | | | | | | | | | | | |
Oklahoma Water Resources Board, State Loan Program Revenue Bonds, Refunding Series 2006B | | | 5.000% | | | | 10/01/2020 | | | AAA | | | 1,230,000 | | | | 1,358,338 | |
City of Tulsa, Oklahoma, General Obligation Bonds, Series 2013 | | | 4.000% | | | | 03/01/2023 | | | AA | | | 2,500,000 | | | | 2,686,950 | |
City of Tulsa, Oklahoma, General Obligation Bonds, Series 2008 | | | 4.625% | | | | 05/01/2025 | | | AA | | | 1,485,000 | | | | 1,590,613 | |
| | | | | | | | | | | | | | | | | | |
| | | | | | | | | | | | | | | | | 5,635,901 | |
| | | | | | | | | | | | | | | | | | |
| | | | | |
Oregon (2.35%) | | | | | | | | | | | | | | | | | | |
Reynolds School District 7, Multnomah County, Oregon, General Obligation Refunding Bonds Series 2000 | | | 5.000% | | | | 06/15/2015 | | | Aa2 | | | 2,135,000 | | | | 2,289,830 | |
| | | | |
| See accompanying notes to financial statements. | | | 43 | |
STATE FARM ASSOCIATES’ FUNDS TRUST MUNICIPAL BOND FUND
SCHEDULE OF INVESTMENTS (continued)
November 30, 2013
| | | | | | | | | | | | | | | | | | |
| | | Coupon
rate | | | Maturity
date | | | Rating (a) | | Principal
amount | | | Value | |
Long-term Municipal Bonds (Cont.) | | | | | | | | | | | | | | | | | | |
Oregon (Cont.) | | | | | | | | | | | | | | | | | | |
City of Hillsboro, Oregon, Full Faith and Credit Bonds, Series 2004 (Prerefunded to 06-01-2014 @ 100) (b) | | | 4.750% | | | | 06/01/2018 | | | Aa3 | | $ | 500,000 | | | $ | 511,175 | |
Oregon City School District No. 62, Clackamas County, Oregon, General Obligation Refunding Bonds, Series 2004 (Prerefunded to 06-15-2014 @ 100) (b) | | | 5.000% | | | | 06/15/2018 | | | Aa3 | | | 1,625,000 | | | | 1,666,340 | |
State of Oregon Housing and Community Services Department, Mortgage Revenue Bonds (Single-Family Mortgage Program) 2007 Series C | | | 4.625% | | | | 07/01/2020 | | | Aa2 | | | 190,000 | | | | 196,222 | |
City of Portland, Oregon, First Lien Water System Revenue and Refunding Bonds, 2010 Series A (Tax Exempt) | | | 4.000% | | | | 05/01/2021 | | | Aaa | | | 1,000,000 | | | | 1,092,630 | |
City of Portland, Oregon, Second Lien Sewer System Revenue and Refunding Bonds, 2008 Series B | | | 5.000% | | | | 06/15/2023 | | | Aa3 | | | 1,500,000 | | | | 1,704,435 | |
City of Portland, Oregon, First Lien Water System Revenue Bonds, 2011 Series A | | | 4.000% | | | | 05/01/2025 | | | Aaa | | | 1,330,000 | | | | 1,395,170 | |
State of Oregon, State Board of Higher Education, General Obligation Bonds 2009 Series A Serial Bonds (Prerefunded to 08-01-2018 @ 100) (b) | | | 5.750% | | | | 08/01/2025 | | | Aa1 | | | 745,000 | | | | 901,502 | |
State of Oregon, State Board of Higher Education, General Obligation Bonds 2009 Series A Serial Bonds (Prerefunded to 08-01-2018 @ 100) (b) | | | 5.750% | | | | 08/01/2026 | | | Aa1 | | | 670,000 | | | | 810,747 | |
State of Oregon, State Board of Higher Education, General Obligation Bonds 2009 Series A Serial Bonds (Prerefunded to 08-01-2018 @ 100) (b) | | | 5.750% | | | | 08/01/2027 | | | Aa1 | | | 750,000 | | | | 907,552 | |
Tualatin Hills Park & Recreation District, Washington County, Oregon, General Obligation Bonds, Series 2009 | | | 4.625% | | | | 06/01/2028 | | | AA | | | 1,335,000 | | | | 1,390,469 | |
Portland Community College District, Multnomah, Washington, Yamhill, Clackamas and Columbia Counties, Oregon, General Obligation Bonds, Series 2009 | | | 5.000% | | | | 06/15/2029 | | | AA | | | 2,000,000 | | | | 2,170,580 | |
| | | | | | | | | | | | | | | | | | |
| | | | | | | | | | | | | | | | | 15,036,652 | |
| | | | | | | | | | | | | | | | | | |
Pennsylvania (2.54%) | | | | | | | | | | | | | | | | | | |
Bellefonte Area School District, Centre County, Pennsylvania, General Obligation Bonds, Series A of 2004 (Prerefunded to 05-15-2014 @ 100) (b) | | | 4.500% | | | | 05/15/2016 | | | A+ | | | 1,070,000 | | | | 1,090,801 | |
Bellefonte Area School District, Centre County, Pennsylvania, General Obligation Bonds, Series A of 2004 (Prerefunded to 05-15-2014 @ 100) (b) | | | 4.500% | | | | 05/15/2017 | | | A+ | | | 1,010,000 | | | | 1,029,634 | |
Dover Township Sewer Authority, York County, Pennsylvania, Guaranteed Sewer Revenue Bonds, Series 2004 | | | 5.000% | | | | 11/01/2017 | | | NR | | | 1,030,000 | | | | 1,063,248 | |
Bellefonte Area School District, Centre County, Pennsylvania, General Obligation Bonds, Series A of 2004 (Prerefunded to 05-15-2014 @ 100) (b) | | | 4.750% | | | | 05/15/2018 | | | A+ | | | 1,160,000 | | | | 1,183,850 | |
Dover Township Sewer Authority, York County, Pennsylvania, Guaranteed Sewer Revenue Bonds, Series 2004 | | | 5.000% | | | | 11/01/2018 | | | NR | | | 1,000,000 | | | | 1,028,780 | |
County of Chester, Commonwealth of Pennsylvania, General Obligation Bonds Series of 2006 | | | 4.375% | | | | 11/15/2021 | | | Aaa | | | 2,300,000 | | | | 2,450,788 | |
Township of Cranberry, Butler County, Pennsylvania, General Obligation Bonds, Series of 2011 | | | 4.500% | | | | 03/01/2025 | | | Aa2 | | | 1,605,000 | | | | 1,705,746 | |
Township of Cranberry, Butler County, Pennsylvania, General Obligation Bonds, Series of 2011 | | | 4.500% | | | | 03/01/2027 | | | Aa2 | | | 2,505,000 | | | | 2,619,804 | |
Township of Hampden, (Cumberland County, Pennsylvania), General Obligation Bonds, Series of 2012 | | | 5.000% | | | | 05/15/2027 | | | AA | | | 2,200,000 | | | | 2,442,000 | |
County of Northampton, Commonwealth of Pennsylvania, General Obligation Bonds, Series B of 2012 (Tax-Exempt) | | | 5.000% | | | | 10/01/2030 | | | AA | | | 1,500,000 | | | | 1,620,960 | |
| | | | | | | | | | | | | | | | | | |
| | | | | | | | | | | | | | | | | 16,235,611 | |
| | | | | | | | | | | | | | | | | | |
Rhode Island (0.17%) | | | | | | | | | | | | | | | | | | |
State of Rhode Island and Providence Plantations, General Obligation Bonds, Consolidated Capital Development Loan of 2007, Series A | | | 4.750% | | | | 08/01/2023 | | | Aa2 | | | 1,000,000 | | | | 1,084,730 | |
| | | | | | | | | | | | | | | | | | |
South Carolina (1.88%) | | | | | | | | | | | | | | | | | | |
Lugoff-Elgin Water Authority (South Carolina) Waterworks System Revenue Bonds, Series 2007 | | | 5.000% | | | | 07/01/2022 | | | A1 | | | 1,000,000 | | | | 1,113,980 | |
Fort Mill School District No. 4 of York County, South Carolina, General Obligation Advanced Refunding Bonds, Series 2012A | | | 4.000% | | | | 03/01/2023 | | | AA- | | | 2,315,000 | | | | 2,521,498 | |
School District No. 1 of Richland County, South Carolina, General Obligation Refunding Bonds, Series 2011A | | | 4.000% | | | | 03/01/2023 | | | AA- | | | 1,675,000 | | | | 1,806,705 | |
City of Columbia, South Carolina, Waterworks and Sewer System Revenue Bonds, Series 2010 | | | 4.500% | | | | 02/01/2025 | | | AA | | | 1,035,000 | | | | 1,126,525 | |
| | |
44 | | See accompanying notes to financial statements. |
STATE FARM ASSOCIATES’ FUNDS TRUST MUNICIPAL BOND FUND
SCHEDULE OF INVESTMENTS (continued)
November 30, 2013
| | | | | | | | | | | | | | | | | | |
| | | Coupon
rate | | | Maturity
date | | | Rating (a) | | Principal
amount | | | Value | |
Long-term Municipal Bonds (Cont.) | | | | | | | | | | | | | | | | | | |
South Carolina (Cont.) | | | | | | | | | | | | | | | | | | |
School District No. 1 of Richland County, South Carolina, General Obligation Bonds, Series 2006B | | | 4.450% | | | | 03/01/2025 | | | Aa2 | | $ | 1,000,000 | | | $ | 1,060,320 | |
Berkeley County, South Carolina, Water and Sewer System Refunding Revenue Bonds, Series 2008A | | | 4.750% | | | | 06/01/2025 | | | Aa3 | | | 800,000 | | | | 871,760 | |
University of South Carolina, Higher Education Revenue Bonds, Series 2008A | | | 4.750% | | | | 06/01/2025 | | | Aa2 | | | 1,130,000 | | | | 1,230,864 | |
Spartanburg Sanitary Sewer District, South Carolina, Sewer System Refunding Convertible Bonds, Series 2013B | | | 5.000% | | | | 03/01/2030 | | | A1 | | | 2,160,000 | | | | 2,280,917 | |
| | | | | | | | | | | | | | | | | | |
| | | | | | | | | | | | | | | | | 12,012,569 | |
| | | | | | | | | | | | | | | | | | |
South Dakota (0.26%) | | | | | | | | | | | | | | | | | | |
Harrisburg School District No. 41-2, Lincoln County, South Dakota, General Obligation Refunding Bonds, Series 2012 | | | 2.150% | | | | 01/15/2020 | | | AA- | | | 930,000 | | | | 916,320 | |
Harrisburg School District No. 41-2, Lincoln County, South Dakota, General Obligation Refunding Bonds, Series 2012 | | | 2.500% | | | | 01/15/2022 | | | AA- | | | 475,000 | | | | 469,138 | |
Harrisburg School District 41-2, South Dakota, General Obligation Bonds, Series 2012 | | | 3.000% | | | | 07/15/2022 | | | AA- | | | 250,000 | | | | 249,618 | |
| | | | | | | | | | | | | | | | | | |
| | | | | | | | | | | | | | | | | 1,635,076 | |
| | | | | | | | | | | | | | | | | | |
Tennessee (2.42%) | | | | | | | | | | | | | | | | | | |
City of Knoxville, Tennessee, Water System Revenue Bonds, Series U-2009 | | | 4.000% | | | | 03/01/2021 | | | Aa2 | | | 1,050,000 | | | | 1,143,062 | |
City of Knoxville, Tennessee, Water System Revenue Refunding Bonds, Series X-2012 | | | 3.000% | | | | 03/01/2022 | | | Aa2 | | | 655,000 | | | | 673,052 | |
The Metropolitan Government of Nashville and Davidson County (Tennessee), Electric System Revenue Bonds, 2011 Series A | | | 4.500% | | | | 05/15/2022 | | | AA+ | | | 2,760,000 | | | | 3,120,925 | |
City of Knoxville, Tennessee, Water System Revenue Refunding Bonds, Series X-2012 | | | 3.000% | | | | 03/01/2023 | | | Aa2 | | | 670,000 | | | | 680,472 | |
Tennessee State School Bond Authority, Higher Educational Facilities, Second Program Bonds, 2008 Series B | | | 4.750% | | | | 05/01/2023 | | | AA | | | 2,000,000 | | | | 2,177,960 | |
The Metropolitan Government of Nashville and Davidson County (Tennessee), General Obligation Improvement and Refunding Bonds, Series 2010A | | | 4.000% | | | | 07/01/2023 | | | AA | | | 2,000,000 | | | | 2,123,420 | |
State of Tennessee, General Obligation Bonds, 2007 Series A (Prerefunded to 10-01-2015 @ 100) (b) | | | 4.400% | | | | 10/01/2023 | | | AA+ | | | 1,050,000 | | | | 1,129,286 | |
City of Knoxville, Tennessee, Electric System Revenue Refunding Bonds, Series CC-2013 | | | 3.000% | | | | 07/01/2024 | | | Aa2 | | | 590,000 | | | | 585,233 | |
The Metropolitan Government of Nashville and Davidson County (Tennessee), Electric System Revenue Bonds, 2008 Series A | | | 4.750% | | | | 05/15/2025 | | | AA+ | | | 1,000,000 | | | | 1,073,200 | |
City of Knoxville, Tennessee, Electric System Revenue Refunding Bonds, Series CC-2013 | | | 3.000% | | | | 07/01/2025 | | | Aa2 | | | 540,000 | | | | 519,788 | |
City of Chattanooga, Tennessee, General Obligation Refunding Bonds, Series 2007A | | | 4.750% | | | | 03/01/2026 | | | AAA | | | 2,000,000 | | | | 2,100,320 | |
City of Knoxville, Tennessee, Electric System Revenue Refunding Bonds, Series CC-2013 | | | 3.000% | | | | 07/01/2026 | | | Aa2 | | | 150,000 | | | | 140,808 | |
| | | | | | | | | | | | | | | | | | |
| | | | | | | | | | | | | | | | | 15,467,526 | |
| | | | | | | | | | | | | | | | | | |
Texas (3.75%) | | | | | | | | | | | | | | | | | | |
City of Plano, Texas, (Collin and Denton Counties), General Obligation Refunding and Improvement Bonds, Series 2011 | | | 5.000% | | | | 09/01/2019 | | | Aaa | | | 1,000,000 | | | | 1,185,780 | |
Lake Travis Independent School District, Unlimited Tax School Building Bonds, Series 2006A (Prerefunded to 02-15-2016 @ 100) (b) | | | 5.000% | | | | 02/15/2020 | | | AA+ | | | 1,535,000 | | | | 1,689,298 | |
Clear Creek Independent School District (Galveston and Harris Counties, Texas) Unlimited Tax School Building Bonds, Series 2007 | | | 4.750% | | | | 02/15/2021 | | | Aa2 | | | 490,000 | | | | 528,357 | |
Fort Worth Independent School District, (Tarrant County, Texas), Unlimited Tax School Building Bonds, Series 2010 | | | 4.000% | | | | 02/15/2021 | | | AA | | | 1,000,000 | | | | 1,095,820 | |
Clear Creek Independent School District (Galveston and Harris Counties, Texas) Unlimited Tax School Building Bonds, Series 2007 | | | 4.750% | | | | 02/15/2022 | | | Aa2 | | | 470,000 | | | | 502,736 | |
Coppell Independent School District (Dallas County, Texas) Unlimited Tax School Building Bonds, Series 2007 | | | 5.000% | | | | 08/15/2022 | | | AA | | | 375,000 | | | | 420,158 | |
Coppell Independent School District (Dallas County, Texas) Unlimited Tax School Building Bonds, Series 2007 | | | 5.000% | | | | 08/15/2023 | | | AA | | | 395,000 | | | | 441,811 | |
City of Austin, Texas (Travis, Williamson and Hays Counties), Water and Wastewater System Refunding Bonds, Series 2010A | | | 5.000% | | | | 11/15/2025 | | | Aa2 | | | 2,345,000 | | | | 2,615,308 | |
City of Austin, Texas, (Travis and Williamson Counties), Water and Wastewater System Revenue Refunding Bonds, Series 2009A | | | 5.000% | | | | 11/15/2025 | | | Aa2 | | | 2,000,000 | | | | 2,206,040 | |
Carrollton-Farmers Branch Independent School District (Dallas and Denton Counties, Texas), Unlimited Tax School Building and Refunding Bonds, Series 2008 | | | 4.625% | | | | 02/15/2026 | | | AA | | | 1,165,000 | | | | 1,250,033 | |
| | | | |
| See accompanying notes to financial statements. | | | 45 | |
STATE FARM ASSOCIATES’ FUNDS TRUST MUNICIPAL BOND FUND
SCHEDULE OF INVESTMENTS (continued)
November 30, 2013
| | | | | | | | | | | | | | | | | | |
| | | Coupon
rate | | | Maturity
date | | | Rating (a) | | Principal
amount | | | Value | |
Long-term Municipal Bonds (Cont.) | | | | | | | | | | | | | | | | | | |
Texas (Cont.) | | | | | | | | | | | | | | | | | | |
Hays County, Texas, Pass-Through Toll Revenue and Unlimited Tax Bonds, Series 2011 | | | 4.750% | | | | 02/15/2026 | | | AA | | $ | 1,620,000 | | | $ | 1,733,724 | |
City of Austin, Texas (Travis and Williamson Counties), Electric Utility System Revenue Refunding Bonds, Series 2008A | | | 5.250% | | | | 11/15/2026 | | | A1 | | | 3,000,000 | | | | 3,330,000 | |
City of Austin, Texas (Travis, Williamson and Hays Counties), Water and Wastewater System Refunding Bonds, Series 2010A | | | 5.000% | | | | 11/15/2026 | | | Aa2 | | | 2,465,000 | | | | 2,716,800 | |
Trinity River Authority of Texas, (Tarrant County Water Project) Improvement Revenue Bonds, Series 2008 | | | 5.750% | | | | 02/01/2027 | | | Aa3 | | | 1,000,000 | | | | 1,119,590 | |
Parker County, Texas, Unlimited Tax Road Bonds, Series 2009 | | | 5.000% | | | | 02/15/2027 | | | AA- | | | 1,000,000 | | | | 1,063,820 | |
New Braunfels Independent School District (A political subdivision of the State of Texas located in Comal and Guadalupe Counties, Texas), Unlimited Tax School Building Bonds, Series 2008 | | | 5.000% | | | | 02/01/2028 | | | AA | | | 1,000,000 | | | | 1,031,140 | |
Conroe Independent School District, (A political subdivision of the State of Texas located within Montgomery County, Texas) Unlimited Tax School Building Bonds, Series 2009A | | | 5.250% | | | | 02/15/2028 | | | Aa2 | | | 1,000,000 | | | | 1,095,100 | |
| | | | | | | | | | | | | | | | | | |
| | | | | | | | | | | | | | | | | 24,025,515 | |
| | | | | | | | | | | | | | | | | | |
Utah (0.90%) | | | | | | | | | | | | | | | | | | |
Park City, Utah, Water Revenue Bonds, Series 2010, (Bank Qualified) | | | 4.000% | | | | 12/15/2020 | | | Aa2 | | | 410,000 | | | | 454,887 | |
Park City, Utah, Water Revenue Bonds, Series 2010, (Bank Qualified) | | | 4.000% | | | | 12/15/2021 | | | Aa2 | | | 600,000 | | | | 654,300 | |
Davis County School District Board of Education, Davis County, Utah, General Obligation School Building Bonds (Utah School Bond Guaranty Program), Series 2007 | | | 4.750% | | | | 06/01/2022 | | | Aa2 | | | 2,375,000 | | | | 2,563,338 | |
Ogden City, Utah, Sewer and Water Revenue Bonds, Series 2008 | | | 5.000% | | | | 06/15/2029 | | | Aa3 | | | 1,970,000 | | | | 2,055,025 | |
| | | | | | | | | | | | | | | | | | |
| | | | | | | | | | | | | | | | | 5,727,550 | |
| | | | | | | | | | | | | | | | | | |
Virginia (2.88%) | | | | | | | | | | | | | | | | | | |
Rivanna Water and Sewer Authority, Regional Water and Sewer System Revenue and Refunding Bonds, Series 2005B | | | 4.500% | | | | 10/01/2019 | | | Aa2 | | | 1,020,000 | | | | 1,073,356 | |
County of Chesterfield, Virginia, Water and Sewer Revenue Bonds, Series 2007 | | | 4.250% | | | | 11/01/2020 | | | Aaa | | | 2,540,000 | | | | 2,751,785 | |
Henrico County, Virginia, General Obligation Public Improvement Bonds, Series 2006 (Prerefunded to 12-01-2016 @ 100) (b) | | | 4.125% | | | | 12/01/2020 | | | Aaa | | | 2,100,000 | | | | 2,325,099 | |
Virginia Public School Authority, School Financing Bonds (1997 Resolution), Refunding Series 2009 C | | | 4.000% | | | | 08/01/2021 | | | Aa1 | | | 1,500,000 | | | | 1,631,205 | |
County of Culpeper, Virginia, General Obligation School and Refunding Bonds, Series 2012 | | | 3.000% | | | | 01/15/2022 | | | Aa2 | | | 390,000 | | | | 397,012 | |
County of Spotsylvania, Virginia, Water and Sewer System Revenue Bonds, Series 2007 | | | 5.000% | | | | 06/01/2023 | | | Aa3 | | | 1,235,000 | | | | 1,345,829 | |
Loudoun County, Virginia, General Obligation Public Improvement Bonds, Series 2011A | | | 4.000% | | | | 12/01/2025 | | | Aaa | | | 1,400,000 | | | | 1,478,652 | |
Virginia Public School Authority, School Financing Bonds (1997 Resolution), Series 2004A (Prerefunded to 08-01-2014 @
100) (b) | | | 4.750% | | | | 08/01/2026 | | | Aa1 | | | 1,000,000 | | | | 1,029,920 | |
Virginia Public School Authority, Special Obligation School Financing Bonds, Fluvanna County, Series 2008 (Prerefunded to 12-01-2018 @ 100) (b) | | | 6.250% | | | | 12/01/2026 | | | AA- | | | 2,000,000 | | | | 2,485,740 | |
Loudoun County Sanitation Authority (Virginia), Water and Sewer System Revenue and Refunding Bonds, Series 2013 | | | 4.000% | | | | 01/01/2027 | | | Aa1 | | | 650,000 | | | | 672,510 | |
County of Stafford, Virginia, General Obligation Public Improvement Bonds, Series 2013 | | | 4.000% | | | | 07/01/2030 | | | Aa2 | | | 1,205,000 | | | | 1,223,196 | |
Virginia Public School Authority, School Financing Bonds (1997 Resolution), Series 2012 D | | | 4.000% | | | | 08/01/2030 | | | Aa1 | | | 2,000,000 | | | | 1,997,500 | |
| | | | | | | | | | | | | | | | | | |
| | | | | | | | | | | | | | | | | 18,411,804 | |
| | | | | | | | | | | | | | | | | | |
Washington (4.18%) | | | | | | | | | | | | | | | | | | |
Public Utility District No. 1 of Douglas County, Washington, Electric Distribution System Revenue and Refunding Bonds, Series 2004 (Prerefunded to 12-01-2013 @ 100) (b) | | | 5.000% | | | | 12/01/2017 | | | Aa3 | | | 705,000 | | | | 705,000 | |
Tukwila School District No. 406, King County, Washington, Unlimited Tax General Obligation Refunding Bonds, 2004 (Prerefunded to 12-01-2014 @ 100) (b) | | | 5.000% | | | | 12/01/2017 | | | Aa2 | | | 1,000,000 | | | | 1,047,220 | |
Public Utility District No. 1 of Douglas County, Washington, Electric Distribution System Revenue and Refunding Bonds, Series 2004 (Prerefunded to 12-01-2013 @ 100) (b) | | | 5.000% | | | | 12/01/2018 | | | Aa3 | | | 740,000 | | | | 740,000 | |
Bethel School District No. 403, Pierce County, Washington, Unlimited Tax General Obligation Bonds, 2006 | | | 5.000% | | | | 12/01/2020 | | | Aa2 | | | 1,000,000 | | | | 1,076,110 | |
| | |
46 | | See accompanying notes to financial statements. |
STATE FARM ASSOCIATES’ FUNDS TRUST MUNICIPAL BOND FUND
SCHEDULE OF INVESTMENTS (continued)
November 30, 2013
| | | | | | | | | | | | | | | | | | |
| | | Coupon
rate | | | Maturity
date | | | Rating (a) | | Principal
amount | | | Value | |
Long-term Municipal Bonds (Cont.) | | | | | | | | | | | | | | | | | | |
Washington (Cont.) | | | | | | | | | | | | | | | | | | |
Public Utility District No. 1 of Franklin County, Washington, Electric Revenue and Refunding Bonds, Series 2007 | | | 4.750% | | | | 09/01/2022 | | | A | | $ | 985,000 | | | $ | 1,043,026 | |
Public Utility District No. 1 of Franklin County, Washington, Electric Revenue and Refunding Bonds, Series 2007 (Prerefunded to 09-01-2017 @ 100) (b) | | | 4.750% | | | | 09/01/2022 | | | NR | | | 15,000 | | | | 17,240 | |
Issaquah School District No. 411, King County, Washington, Unlimited Tax General Obligation and Refunding Bonds, 2012 | | | 2.500% | | | | 12/01/2022 | | | AA | | | 1,280,000 | | | | 1,229,222 | |
Public Utility District No. 1 of Douglas County, Washington, Electric Distribution System Revenue and Refunding Bonds, Series 2012 | | | 3.000% | | | | 12/01/2022 | | | Aa3 | | | 920,000 | | | | 907,847 | |
Renton School District No. 403, King County, Washington, Unlimited Tax General Obligation Bonds, 2003 (Prerefunded to 12-01-2013 @ 100) (b) | | | 4.625% | | | | 12/01/2022 | | | Aa2 | | | 2,000,000 | | | | 2,000,000 | |
Public Utility District No. 1 of Douglas County, Washington, Electric Distribution System Revenue and Refunding Bonds, Series 2012 | | | 5.000% | | | | 12/01/2023 | | | Aa3 | | | 505,000 | | | | 579,366 | |
Public Utility District No. 1 of Klickitat County, Washington, Electric System Revenue and Refunding Bonds, Series 2006B | | | 5.000% | | | | 12/01/2023 | | | A2 | | | 1,000,000 | | | | 1,070,140 | |
College Place School District No. 250, Walla Walla County, Washington, Unlimited Tax General Obligation Bonds, Series 2012 | | | 4.000% | | | | 12/01/2024 | | | A1 | | | 1,875,000 | | | | 1,940,569 | |
Yakima School District No. 7, Yakima County, Washington, Unlimited Tax General Obligation and Refunding Bonds, 2009 | | | 4.625% | | | | 12/01/2024 | | | Aa3 | | | 4,000,000 | | | | 4,259,120 | |
Public Utility District No. 1 of Clark County, Washington, Water System Revenue Bonds, Series 2008 | | | 5.000% | | | | 01/01/2025 | | | AA- | | | 565,000 | | | | 607,951 | |
The City of Seattle, Washington, Municipal Light and Power Improvement and Refunding Revenue Bonds, 2008 | | | 6.000% | | | | 04/01/2025 | | | Aa2 | | | 1,325,000 | | | | 1,526,268 | |
Bellevue School District No. 405, King County, Washington, Unlimited Tax General Obligation Bonds, 2008 | | | 4.750% | | | | 12/01/2025 | | | AA+ | | | 1,000,000 | | | | 1,083,960 | |
Lake Washington School District No. 414, King County, Washington, Unlimited Tax General Obligation Bonds, 2008 | | | 5.000% | | | | 12/01/2025 | | | AA | | | 2,000,000 | | | | 2,213,460 | |
Public Utility District No. 1 of Clark County, Washington, Water System Revenue Bonds, Series 2008 | | | 5.000% | | | | 01/01/2026 | | | AA- | | | 500,000 | | | | 535,370 | |
State of Washington, Various Purpose General Obligation Refunding Bonds, Series R-2013C | | | 4.000% | | | | 07/01/2026 | | | Aa1 | | | 2,500,000 | | | | 2,586,475 | |
State of Washington, Various Purpose General Obligation Bonds, Series 2009A | | | 5.000% | | | | 07/01/2031 | | | Aa1 | | | 1,500,000 | | | | 1,602,825 | |
| | | | | | | | | | | | | | | | | | |
| | | | | | | | | | | | | | | | | 26,771,169 | |
| | | | | | | | | | | | | | | | | | |
West Virginia (1.93%) | | | | | | | | | | | | | | | | | | |
West Virginia University Board of Governors, University Improvement Revenue Bonds (West Virginia University Projects), 2011 Series B | | | 5.000% | | | | 10/01/2023 | | | A+ | | | 2,510,000 | | | | 2,837,153 | |
West Virginia University Board of Governors, University Improvement Revenue Bonds (West Virginia University Projects), 2011 Series B | | | 5.000% | | | | 10/01/2024 | | | A+ | | | 3,200,000 | | | | 3,579,360 | |
West Virginia University Board of Governors, University Revenue Improvement Bonds (West Virginia University Projects), 2004 Series C (Prerefunded to 10-01-2014 @ 100) (b) | | | 5.000% | | | | 10/01/2024 | | | A+ | | | 2,500,000 | | | | 2,598,850 | |
The Board of Education of the County of Manongalia (West Virginia), Public School Refunding Bonds, Series 2012 | | | 4.000% | | | | 05/01/2025 | | | AA | | | 1,105,000 | | | | 1,128,735 | |
The Board of Education of the County of Manongalia (West Virginia), Public School Refunding Bonds, Series 2012 | | | 4.000% | | | | 05/01/2026 | | | AA | | | 2,180,000 | | | | 2,207,926 | |
| | | | | | | | | | | | | | | | | | |
| | | | | | | | | | | | | | | | | 12,352,024 | |
| | | | | | | | | | | | | | | | | | |
Wisconsin (1.85%) | | | | | | | | | | | | | | | | | | |
Village of Whitefish Bay, Wisconsin (Milwaukee County), General Obligation Corporate Purpose Bonds, Series 2013A | | | 2.250% | | | | 04/01/2021 | | | Aa1 | | | 350,000 | | | | 336,749 | |
City of Sturgeon Bay, Door County, Wisconsin, General Obligation Refunding Bonds | | | 4.750% | | | | 10/01/2021 | | | Aa3 | | | 545,000 | | | | 579,608 | |
School District of New Richmond, St. Croix County, Wisconsin, General Obligation Refunding Bonds | | | 4.750% | | | | 04/01/2022 | | | Aa2 | | | 1,000,000 | | | | 1,077,960 | |
Village of Whitefish Bay, Wisconsin (Milwaukee County), General Obligation Corporate Purpose Bonds, Series 2013A | | | 2.500% | | | | 04/01/2022 | | | Aa1 | | | 375,000 | | | | 359,516 | |
City of Sheboygan, Sheboygan County, Wisconsin, General Obligation Corporate Purpose Bonds, Series 2007B | | | 4.750% | | | | 10/01/2022 | | | Aa2 | | | 800,000 | | | | 879,568 | |
Village of Whitefish Bay, Wisconsin (Milwaukee County), General Obligation Corporate Purpose Bonds, Series 2013A | | | 2.500% | | | | 04/01/2023 | | | Aa1 | | | 385,000 | | | | 362,308 | |
| | | | |
| See accompanying notes to financial statements. | | | 47 | |
STATE FARM ASSOCIATES’ FUNDS TRUST MUNICIPAL BOND FUND
SCHEDULE OF INVESTMENTS (continued)
November 30, 2013
| | | | | | | | | | | | | | | | | | |
| | | Coupon
rate | | | Maturity
date | | | Rating (a) | | Principal
amount | | | Value | |
Long-term Municipal Bonds (Cont.) | | | | | | | | | | | | | | | | | | |
Wisconsin (Cont.) | | | | | | | | | | | | | | | | | | |
State of Wisconsin, General Obligation Bonds of 2007, Series B (Prerefunded to 05-01-2015 @ 100) (b) | | | 4.750 | % | | | 05/01/2023 | | | Aa2 | | $ | 2,335,000 | | | $ | 2,482,619 | |
City of Sheboygan, Sheboygan County, Wisconsin, General Obligation Corporate Purpose Bonds, Series 2007B | | | 4.750 | % | | | 10/01/2023 | | | Aa2 | | | 300,000 | | | | 328,296 | |
City of Fond Du Lac, Fond Du Lac County, Wisconsin, Waterworks System Revenue Bonds, Series 2010 | | | 5.000 | % | | | 09/01/2025 | | | A+ | | | 1,000,000 | | | | 1,079,360 | |
Western Technical College District, Wisconsin, General Obligation Refunding Bonds, Series 2013C | | | 5.000 | % | | | 04/01/2029 | | | AA+ | | | 3,000,000 | | | | 3,232,020 | |
State of Wisconsin, General Obligation Bonds of 2008, Series D | | | 6.000 | % | | | 05/01/2029 | | | Aa2 | | | 1,000,000 | | | | 1,150,170 | |
| | | | | | | | | | | | | | | | | | |
| | | | | | | | | | | | | | | | | 11,868,174 | |
| | | | | | | | | | | | | | | | | | |
Wyoming (0.28%) | | | | | | | | | | | | | | | | | | |
City of Cheyenne, Wyoming, Refunding Revenue Water Bonds, Series 2007 | | | 5.000 | % | | | 12/01/2024 | | | AA | | | 1,700,000 | | | | 1,794,979 | |
| | | | | | | | | | | | | | | | | | |
Total Long-term Municipal Bonds (cost $608,290,841) | | | | | | | | | | | | | | | | | 627,543,868 | |
| | | | | | | | | | | | | | | | | | |
| | | | | |
| | | | | | | | | | | Shares | | | Value | |
Short-term Investments (0.76%) | | | | | | | | | | | | | | | | | | |
JPMorgan Tax Free Money Market Fund | | | | | | | | | | | | | 4,852,188 | | | $ | 4,852,188 | |
| | | | | | | | | | | | | | | | | | |
Total Short-term Investments (cost $4,852,188) | | | | | | | | | | | | | | | | | 4,852,188 | |
| | | | | | | | | | | | | | | | | | |
TOTAL INVESTMENTS (98.83%) (cost $613,143,029) | | | | | | | | | | | | | | | | | 632,396,056 | |
OTHER ASSETS, NET OF LIABILITIES (1.17%) | | | | | | | | | | | | | | | | | 7,461,552 | |
| | | | | | | | | | | | | | | | | | |
NET ASSETS (100.00%) | | | | | | | | | | | | | | | | $ | 639,857,608 | |
| | | | | | | | | | | | | | | | | | |
| (a) | Ratings are not audited and represent the lower of Moody’s or S&P issuer specific ratings. |
| (b) | Advanced Refunded Bonds are backed by an escrow or trust containing U.S. Government, U.S. Government Agency or other securities to support the timely payment of principal and interest. |
NR – Not Rated
| | |
48 | | See accompanying notes to financial statements. |
(This page intentionally left blank.)
49
STATE FARM ASSOCIATES’ FUNDS TRUST
STATEMENTS OF ASSETS AND LIABILITIES
November 30, 2013
| | | | | | | | | | | | | | | | |
| | | Growth Fund | | | Balanced Fund | | | Interim Fund | | | Municipal Bond
Fund | |
Assets | | | | | | | | | | | | | | | | |
Investments in securities at identified cost | | $ | 1,185,313,666 | | | | 892,194,457 | | | | 380,742,935 | | | | 613,143,029 | |
| | | | | | | | | | | | | | | | |
Investments in securities at market value | | $ | 3,754,283,646 | | | | 1,534,473,729 | | | | 383,886,021 | | | | 632,396,056 | |
Receivable for: | | | | | | | | | | | | | | | | |
Dividends and interest | | | 11,370,821 | | | | 7,000,061 | | | | 2,372,603 | | | | 7,828,649 | |
Shares of the Fund sold | | | 4,179,484 | | | | 667,081 | | | | 193,693 | | | | 199,787 | |
Securities sold | | | 47,157 | | | | — | | | | — | | | | — | |
Prepaid expenses | | | 18,570 | | | | 7,801 | | | | 2,293 | | | | 3,691 | |
| | | | | | | | | | | | | | | | |
Total assets | | | 3,769,899,678 | | | | 1,542,148,672 | | | | 386,454,610 | | | | 640,428,183 | |
| | | | | | | | | | | | | | | | |
Liabilities and Net Assets | | | | | | | | | | | | | | | | |
Distributions to shareholders | | | — | | | | — | | | | 5,551 | | | | 378,202 | |
Payable for: | | | | | | | | | | | | | | | | |
Shares of the Fund redeemed | | | 323,681 | | | | 95,481 | | | | 1,903,279 | | | | 52,243 | |
Securities purchased | | | — | | | | 999,370 | | | | — | | | | — | |
Due to affiliates | | | 371,613 | | | | 165,771 | | | | 54,130 | | | | 79,755 | |
Accrued liabilities | | | 80,336 | | | | 52,751 | | | | 38,640 | | | | 60,375 | |
| | | | | | | | | | | | | | | | |
Total liabilities | | | 775,630 | | | | 1,313,373 | | | | 2,001,600 | | | | 570,575 | |
| | | | | | | | | | | | | | | | |
Net assets applicable to shares outstanding of common stock | | $ | 3,769,124,048 | | | | 1,540,835,299 | | | | 384,453,010 | | | | 639,857,608 | |
| | | | | | | | | | | | | | | | |
Fund shares outstanding (no par value, unlimited number of shares authorized) | | | 55,906,976 | | | | 24,847,283 | | | | 38,226,095 | | | | 74,193,306 | |
Net asset value, offering price and redemption price per share | | $ | 67.42 | | | | 62.01 | | | | 10.06 | | | | 8.62 | |
| | | | | | | | | | | | | | | | |
Analysis of Net Assets | | | | | | | | | | | | | | | | |
Paid-in-capital | | $ | 1,228,070,680 | | | | 885,296,392 | | | | 381,387,764 | | | | 620,006,244 | |
Accumulated net realized gain (loss) | | | (65,177,742 | ) | | | (5,058,132 | ) | | | (77,840 | ) | | | 598,337 | |
Net unrealized appreciation (depreciation) | | | 2,568,982,439 | | | | 642,279,482 | | | | 3,143,086 | | | | 19,253,027 | |
Undistributed net investment income (loss) | | | 37,248,671 | | | | 18,317,557 | | | | — | | | | — | |
| | | | | | | | | | | | | | | | |
Net assets applicable to shares outstanding | | $ | 3,769,124,048 | | | | 1,540,835,299 | | | | 384,453,010 | | | | 639,857,608 | |
| | | | | | | | | | | | | | | | |
| | |
50 | | See accompanying notes to financial statements. |
STATE FARM ASSOCIATES’ FUNDS TRUST
STATEMENTS OF OPERATIONS
Year ended November 30, 2013
| | | | | | | | | | | | | | | | |
| | | Growth Fund | | | Balanced Fund | | | Interim Fund | | | Municipal Bond
Fund | |
Investment Income: | | | | | | | | | | | | | | | | |
Dividends | | $ | 87,308,891 | | | | 21,585,653 | | | | — | | | | — | |
Interest | | | 4,502 | | | | 20,511,899 | | | | 6,563,038 | | | | 41,432 | |
Tax-exempt interest | | | — | | | | — | | | | — | | | | 24,114,650 | |
| | | | | | | | | | | | | | | | |
| | | 87,313,393 | | | | 42,097,552 | | | | 6,563,038 | | | | 24,156,082 | |
Less: foreign withholding taxes | | | (723,744 | ) | | | (237,500 | ) | | | — | | | | — | |
| | | | | | | | | | | | | | | | |
Total investment income | | | 86,589,649 | | | | 41,860,052 | | | | 6,563,038 | | | | 24,156,082 | |
| | | | |
Expenses: | | | | | | | | | | | | | | | | |
Investment advisory and management fees | | | 3,615,632 | | | | 1,602,171 | | | | 482,458 | | | | 743,604 | |
Trustees’ fees and expenses | | | 148,530 | | | | 62,966 | | | | 18,363 | | | | 29,720 | |
Reports to shareholders | | | 93,767 | | | | 46,314 | | | | 17,831 | | | | 16,700 | |
Professional fees | | | 102,133 | | | | 60,177 | | | | 58,813 | | | | 60,160 | |
Errors and omissions insurance | | | 47,155 | | | | 19,939 | | | | 5,741 | | | | 9,502 | |
Custodian fees | | | 67,221 | | | | 23,000 | | | | 573 | | | | 6,883 | |
ICI dues | | | 34,525 | | | | 14,168 | | | | 3,820 | | | | 6,304 | |
Regulatory fees | | | 36,797 | | | | 31,947 | | | | 29,989 | | | | 34,354 | |
Fidelity bond expense | | | 4,801 | | | | 2,133 | | | | 649 | | | | 1,017 | |
Securities valuation fees | | | 1,990 | | | | 25,087 | | | | 3,888 | | | | 134,225 | |
| | | | | | | | | | | | | | | | |
Total expenses | | | 4,152,551 | | | | 1,887,902 | | | | 622,125 | | | | 1,042,469 | |
| | | | | | | | | | | | | | | | |
Net investment income | | | 82,437,098 | | | | 39,972,150 | | | | 5,940,913 | | | | 23,113,613 | |
| | | | |
Realized and unrealized gain (loss): | | | | | | | | | | | | | | | | |
Net realized gain (loss) on sales of investments | | | 1,745,325 | | | | (3,455,235 | ) | | | 448,120 | | | | 598,337 | |
Net realized gain (loss) on foreign currency transactions | | | 38,254 | | | | 7,988 | | | | — | | | | — | |
Change in net unrealized appreciation (depreciation) on investments and foreign currency transactions | | | 655,864,832 | | | | 134,619,399 | | | | (8,671,899 | ) | | | (37,949,417 | ) |
| | | | | | | | | | | | | | | | |
Net realized and unrealized gain (loss) on investments | | | 657,648,411 | | | | 131,172,152 | | | | (8,223,779 | ) | | | (37,351,080 | ) |
| | | | | | | | | | | | | | | | |
Net change in net assets resulting from operations | | $ | 740,085,509 | | | | 171,144,302 | | | | (2,282,866 | ) | | | (14,237,467 | ) |
| | | | | | | | | | | | | | | | |
| | | | |
| See accompanying notes to financial statements. | | | 51 | |
STATE FARM ASSOCIATES’ FUNDS TRUST
STATEMENTS OF CHANGES IN NET ASSETS
| | | | | | | | |
| | | Growth Fund | |
Years ended November 30, | | 2013 | | | 2012 | |
From operations: | | | | | | | | |
Net investment income | | $ | 82,437,098 | | | | 79,824,837 | |
Net realized gain (loss) | | | 1,783,579 | | | | (17,492,533 | ) |
Change in net unrealized appreciation or depreciation | | | 655,864,832 | | | | 226,880,886 | |
| | | | | | | | |
Net change in net assets resulting from operations | | | 740,085,509 | | | | 289,213,190 | |
Distributions to shareholders from and in excess of: | | | | | | | | |
Net investment income | | | (81,962,353 | ) | | | (77,303,988 | ) |
Net realized gain | | | — | | | | — | |
| | | | | | | | |
Total distributions to shareholders | | | (81,962,353 | ) | | | (77,303,988 | ) |
From Fund share transactions: | | | | | | | | |
Proceeds from shares sold | | | 216,155,876 | | | | 146,927,215 | |
Reinvestment of distributions | | | 77,708,471 | | | | 73,349,960 | |
| | | | | | | | |
| | | 293,864,347 | | | | 220,277,175 | |
Less payments for shares redeemed | | | (328,000,859 | ) | | | (320,116,813 | ) |
| | | | | | | | |
Net increase (decrease) in net assets from Fund share transactions | | | (34,136,512 | ) | | | (99,839,638 | ) |
| | | | | | | | |
Total increase (decrease) in net assets | | | 623,986,644 | | | | 112,069,564 | |
| | | | | | | | |
Net assets: | | | | | | | | |
Beginning of period | | | 3,145,137,404 | | | | 3,033,067,840 | |
| | | | | | | | |
End of period* | | $ | 3,769,124,048 | | | | 3,145,137,404 | |
| | | | | | | | |
*Including undistributed net investment income (loss) | | $ | 37,248,671 | | | | 37,016,923 | |
| | | | | | | | |
Share Information | | | | | | | | |
Sold | | | 3,497,059 | | | | 2,683,840 | |
Issued in reinvestment of distributions | | | 1,326,996 | | | | 1,406,340 | |
Redeemed | | | (5,374,565 | ) | | | (5,847,190 | ) |
| | | | | | | | |
Net increase (decrease) | | | (550,510 | ) | | | (1,757,010 | ) |
| | | | | | | | |
| | |
52 | | See accompanying notes to financial statements. |
| | | | | | | | | | | | | | | | | | | | | | |
| Balanced Fund | | | Interim Fund | | | Municipal Bond Fund | |
| 2013 | | | 2012 | | | 2013 | | | 2012 | | | 2013 | | | 2012 | |
| | | | | | | | | | | | | | | | | | | | | | |
| | 39,972,150 | | | | 38,370,601 | | | | 5,940,913 | | | | 7,482,385 | | | | 23,113,613 | | | | 22,913,199 | |
| | (3,447,247 | ) | | | (1,601,105 | ) | | | 448,120 | | | | — | | | | 598,337 | | | | 15,847 | |
| | 134,619,399 | | | | 55,963,831 | | | | (8,671,899 | ) | | | (853,799 | ) | | | (37,949,417 | ) | | | 23,891,112 | |
| | | | | | | | | | | | | | | | | | | | | | |
| | 171,144,302 | | | | 92,733,327 | | | | (2,282,866 | ) | | | 6,628,586 | | | | (14,237,467 | ) | | | 46,820,158 | |
| | | | | | | | | | | | | | | | | | | | | | |
| | (39,236,681 | ) | | | (37,487,403 | ) | | | (5,940,913 | ) | | | (7,482,385 | ) | | | (23,113,613 | ) | | | (22,913,199 | ) |
| | — | | | | (1,521,132 | ) | | | — | | | | — | | | | (15,847 | ) | | | (1,472,938 | ) |
| | | | | | | | | | | | | | | | | | | | | | |
| | (39,236,681 | ) | | | (39,008,535 | ) | | | (5,940,913 | ) | | | (7,482,385 | ) | | | (23,129,460 | ) | | | (24,386,137 | ) |
| | | | | | | | | | | | | | | | | | | | | | |
| | 152,639,867 | | | | 101,826,465 | | | | 91,418,200 | | | | 104,092,036 | | | | 59,706,437 | | | | 77,459,673 | |
| | 37,610,235 | | | | 37,373,598 | | | | 5,783,911 | | | | 7,304,668 | | | | 18,561,259 | | | | 19,580,623 | |
| | | | | | | | | | | | | | | | | | | | | | |
| | 190,250,102 | | | | 139,200,063 | | | | 97,202,111 | | | | 111,396,704 | | | | 78,267,696 | | | | 97,040,296 | |
| | (135,782,699 | ) | | | (126,219,730 | ) | | | (136,582,845 | ) | | | (84,750,975 | ) | | | (84,564,888 | ) | | | (43,559,325 | ) |
| | | | | | | | | | | | | | | | | | | | | | |
| | 54,467,403 | | | | 12,980,333 | | | | (39,380,734 | ) | | | 26,645,729 | | | | (6,297,192 | ) | | | 53,480,971 | |
| | | | | | | | | | | | | | | | | | | | | | |
| | 186,375,024 | | | | 66,705,125 | | | | (47,604,513 | ) | | | 25,791,930 | | | | (43,664,119 | ) | | | 75,914,992 | |
| | | | | | | | | | | | | | | | | | | | | | |
| | | | | | | | | | | | | | | | | | | | | | |
| | 1,354,460,275 | | | | 1,287,755,150 | | | | 432,057,523 | | | | 406,265,593 | | | | 683,521,727 | | | | 607,606,735 | |
| | | | | | | | | | | | | | | | | | | | | | |
| | 1,540,835,299 | | | | 1,354,460,275 | | | | 384,453,010 | | | | 432,057,523 | | | | 639,857,608 | | | | 683,521,727 | |
| | | | | | | | | | | | | | | | | | | | | | |
| | 18,317,557 | | | | 17,574,100 | | | | — | | | | — | | | | — | | | | — | |
| | | | | | | | | | | | | | | | | | | | | | |
| | | | | | | | | | | | | | | | | | | | | | |
| | 2,579,295 | | | | 1,818,557 | | | | 9,031,229 | | | | 10,149,849 | | | | 6,702,952 | | | | 8,632,073 | |
| | 656,583 | | | | 691,184 | | | | 571,831 | | | | 711,655 | | | | 2,110,234 | | | | 2,180,143 | |
| | (2,297,447 | ) | | | (2,260,994 | ) | | | (13,503,666 | ) | | | (8,266,943 | ) | | | (9,663,401 | ) | | | (4,856,804 | ) |
| | | | | | | | | | | | | | | | | | | | | | |
| | 938,431 | | | | 248,747 | | | | (3,900,606 | ) | | | 2,594,561 | | | | (850,215 | ) | | | 5,955,412 | |
| | | | | | | | | | | | | | | | | | | | | | |
| | | | |
| See accompanying notes to financial statements. | | | 53 | |
STATE FARM ASSOCIATES’ FUNDS TRUST
NOTES TO FINANCIAL STATEMENTS
1. Investment Objective
The State Farm Associates’ Funds Trust (the “Trust”) has four separate investment portfolios (each a “Fund” and together, the “Funds”). The Trust is registered under the Investment Company Act of 1940 as an open-end, management investment company. Each Fund has its own investment objective, investment policies, restrictions, and attendant risks and is diversified as defined in the Investment Company Act of 1940. State Farm Investment Management Corp. (“SFIMC”) is the Trust’s investment adviser.
The State Farm Growth Fund (the “Growth Fund”) seeks long-term growth of capital which may be supplemented by income. The Growth Fund seeks to achieve this objective by investing under normal circumstances at least 80% of its assets in common stocks and other income producing equity securities.
The State Farm Balanced Fund (the “Balanced Fund”) seeks long-term growth of principal while providing some current income. The Balanced Fund seeks to achieve its objective by investing under normal circumstances approximately 60% of its assets in common stocks, and ordinarily limits its common stock investments to no more than 75% of total assets. The Balanced Fund ordinarily invests at least 25% of its total assets in fixed income securities. The Balanced Fund invests in bonds to provide relative stability of principal and income.
The State Farm Interim Fund (the “Interim Fund”) seeks the realization over a period of years of the highest yield consistent with relatively low price volatility. The Interim Fund seeks to achieve its investment objective through investment in high quality debt securities with short and intermediate-term maturities.
The State Farm Municipal Bond Fund (the “Municipal Bond Fund”) seeks as high a rate of income exempt from federal income taxes as is consistent with prudent investment management. The Municipal Bond Fund seeks to achieve its investment objective through investment primarily in a diversified selection of municipal bonds with maturities of one to seventeen years. The Municipal Bond Fund normally invests so that either (1) at least 80% of the Fund’s net investment income is exempt from regular federal income tax or (2) at least 80% of the Fund’s net assets are invested in securities that produce income exempt from regular federal income tax.
2. Significant Accounting Policies
The following is a summary of significant accounting policies followed by the Funds in the preparation of their financial statements in accordance with U.S. generally accepted accounting principles (“GAAP”).
Fund Share Valuation
Fund shares are sold and redeemed on a continuous basis at net asset value. The net asset value per share is determined daily on each day the New York Stock Exchange is open. The net asset value for each Fund is determined as of the close of regular session trading on the New York Stock Exchange (usually 3:00 p.m. Central Time). The net asset value per share is computed by dividing the total value of a Fund’s investments and other assets, less liabilities, by the number of Fund shares outstanding.
Securities Valuation
All investments in securities are recorded at their fair value. For more information see Note 3 Securities Valuation.
Securities Transactions and Investment Income
For financial reporting purposes, security transactions are accounted for on trade date (date the order to buy or sell is executed) and dividend income is recorded on the ex-dividend date. Interest income is recorded on the accrual basis, and includes amortization of premiums and discounts on fixed income securities. Realized gains and losses from security transactions are reported on an identified cost basis.
Expenses
Expenses arising in connection with a specific Fund are allocated to that Fund. Common Trust expenses are allocated between the Funds in proportion to each Fund’s relative net assets.
Income Taxes and Distributions to Shareholders
Each Fund is a separate taxpayer for federal income tax purposes. It is the Funds’ policy to comply with the provisions of Subchapter M of the Internal Revenue Code applicable to regulated investment companies and, in the manner provided therein, to distribute substantially all of their taxable income, including any net realized gain on sales of investments, reportable for federal income tax purposes.
For more information refer to Note 4 Income Taxes and Distributions to Shareholders.
Foreign Currency Translation
Investment securities and other assets and liabilities denominated in a foreign currency are translated into U.S. dollars at the prevailing foreign exchange rates at November 30, 2013. Purchases and sales of investment securities and income and expense items denominated in foreign currencies are
STATE FARM ASSOCIATES’ FUNDS TRUST
NOTES TO FINANCIAL STATEMENTS (continued)
translated into U.S. dollars at the prevailing foreign exchange rates on the respective dates of transactions. That portion of realized and unrealized gains and losses on investments that results from fluctuations in foreign currency exchange rates is not separately disclosed, but is included with realized and unrealized gains and losses on investment securities.
Use of Estimates
The preparation of financial statements in conformity with GAAP requires management to make estimates and assumptions that affect the amounts reported in the financial statements and accompanying notes. Actual results could differ from those estimates.
Commitments and Contingencies
In the normal course of business, the Trust enters into contracts on behalf of the Funds that may contain provisions for general indemnifications. Each Fund’s maximum exposure under these indemnification provisions is unknown, as this would involve future claims that may be made against each Fund that are not known at this time. However, based on experience, the Funds believe the risk of loss from these indemnification provisions is remote.
Securities Purchased on a “When-Issued” Basis
The Municipal Bond Fund may purchase municipal bonds on a “when-issued” basis. Delivery and payment for these securities may be a month or more after the purchase date, during which time such securities are subject to market fluctuations. The Municipal Bond Fund identifies and holds specific liquid assets with a market value at least equal to the amount of the when-issued purchase commitments in order to ensure that it can meet those commitments. It is possible that the securities will never be issued and the commitment cancelled. At November 30, 2013, the Municipal Bond Fund did not have any commitments for when-issued securities.
3. Securities Valuation
Investments are valued at fair value pursuant to valuation procedures approved by the Trust’s Board of Trustees (the “Board”). The valuation procedures assign to SFIMC the responsibility for determining fair value using the processes and factors as outlined in the valuation procedures. If SFIMC cannot determine fair value based on the valuation procedures, the Board or the Executive Committee of the Board will determine fair value.
Fair value is defined as the price that the Funds would receive to sell an asset or pay to transfer a liability in an orderly transaction between market participants at the measurement date. A three-tier hierarchy is used to classify fair value measurements for disclosure purposes. The three-tier hierarchy of inputs is summarized in three broad levels as follows:
| | — | | Level 1 - Unadjusted quoted prices in active markets that are accessible to the Funds for identical assets or liabilities. |
| | — | | Level 2 - Inputs other than quoted prices included within Level 1 that are observable for the asset or liability, either directly or indirectly. These inputs may include quoted prices for the identical instrument on an inactive market, quoted prices for similar instruments in active markets, interest rates, yield curves and credit spreads. For assets or liabilities with a specified (contractual) term, a Level 2 input must be observable for substantially the full term of the asset or liability. |
| | — | | Level 3 - Unobservable inputs for the asset or liability to the extent that relevant observable inputs are not available. These inputs, based on the best information available in the circumstances, would include reasonably available information about the assumptions that a market participant would use in valuing the asset or liability and might include SFIMC’s own data. |
To the extent that valuation is based on models or inputs that are less observable or unobservable in the market, the determination of fair value requires more judgment. Accordingly, the degree of judgment exercised in determining fair value is greatest for instruments categorized in Level 3.
The inputs used to measure the fair value of an asset or liability might be categorized within different levels of the fair value hierarchy. In those cases, the fair value measurement is categorized in its entirety in the same level of the fair value hierarchy as the lowest level input that is significant to the entire measurement.
Stocks, closed-end registered investment companies and exchange-traded funds (“ETFs”) traded on securities exchanges, or in an over-the-counter market in which transaction prices are reported, are valued at the last sales price on the day of valuation or, if there are no reported sales on that day, at the last reported bid price for the day. Stocks traded on NASDAQ are valued at the NASDAQ Official Closing Price. Long-term debt securities and U.S. Treasury bills are generally valued using quotations provided by an independent pricing service. Short-term debt securities with remaining maturities of 60 days or less (other than U.S. Treasury bills) are generally valued on an amortized cost basis, which approximates market value. Investments in open-end investment companies are valued each day based on the closing net asset value of the respective fund. Short sales, if any, are valued at market value.
Portfolio securities that are primarily traded on foreign securities exchanges (“foreign securities”) are valued at the closing values of such securities on the respective exchange where each security is primarily traded. SFIMC may determine that a market quotation for a foreign security held by a Fund is not reliable because of events or circumstances that have occurred between the time of the market quotation and the time the net asset value of the Fund is calculated (“subsequent event”). A subsequent event might include company-specific developments, a development that might affect an entire market or region, a potentially global development or a significant change in one or more U.S. securities indexes. If SFIMC determines that the market quotation for a foreign security is not reliable, SFIMC may determine the foreign security’s value in SFIMC’s reasonable judgment.
STATE FARM ASSOCIATES’ FUNDS TRUST
NOTES TO FINANCIAL STATEMENTS (continued)
For securities other than foreign securities, for which market prices are not readily available or are considered unreliable, SFIMC is required to obtain bid price quotations from brokers or dealers in the securities. If SFIMC cannot obtain a quotation for the security or if SFIMC believes the quotation does not represent the security’s fair value, then SFIMC will determine the security’s value in SFIMC’s reasonable judgment.
In determining a value based on reasonable judgment, SFIMC may use different methodologies, including multiple of earnings, multiple of book value, discount from market of a similar freely traded security or, for debt securities, yield to maturity. Other factors SFIMC may consider in determining value for a security include, but are not limited to, fundamental analytical data relating to the security, the nature and duration of any restrictions on disposition of the security, the last traded price of the security, significant global or regional events such as political unrest, natural disasters, and war, and significant movements in major market indices, exchange traded funds, index futures or other financial instruments in the U.S. or other markets. All securities valued based on SFIMC’s reasonable judgment are subsequently reported to the Board on a quarterly basis.
SFIMC reviews the pricing methodologies of the Funds’ approved pricing vendors, including reviewing a vendor’s key inputs and assumptions in valuing securities. SFIMC also engages in transaction back-testing with respect to portfolio securities sold by the Funds to compare unrealized gains and losses to realized gains and losses.
The inputs or methodology used for valuing securities are not necessarily an indication of the risk associated with investing in those securities. The following is a summary of the inputs used to value each Fund’s assets and liabilities as of November 30, 2013:
| | | | | | | | | | | | | | |
| | | | | | Investments in Securities | | | |
Fund | | Level 1 | | | Level 2 | | | Level 3 | | Total | |
Growth Fund | | | | | | | | | | | | | | |
Common Stocks (a) | | $ | 3,716,562,561 | | | $ | — | | | $— | | $ | 3,716,562,561 | |
Short-term Investments | | | 37,721,085 | | | | — | | | — | | | 37,721,085 | |
Balanced Fund | | | | | | | | | | | | | | |
Common Stocks (a) | | | 916,210,598 | | | | — | | | — | | | 916,210,598 | |
Corporate Bonds (a) | | | — | | | | 277,389,149 | | | — | | | 277,389,149 | |
Foreign Government Bonds | | | — | | | | 2,837,850 | | | — | | | 2,837,850 | |
Agency Commercial Mortgage-Backed Securities | | | — | | | | 27,034,453 | | | — | | | 27,034,453 | |
Agency Notes & Bonds | | | — | | | | 4,818,659 | | | — | | | 4,818,659 | |
U.S. Treasury Obligations | | | — | | | | 299,465,775 | | | — | | | 299,465,775 | |
Short-term Investments | | | 6,717,245 | | | | — | | | — | | | 6,717,245 | |
Interim Fund | | | | | | | | | | | | | | |
U.S. Treasury Obligations | | | — | | | | 383,333,275 | | | — | | | 383,333,275 | |
Short-term Investments | | | 552,746 | | | | — | | | — | | | 552,746 | |
Municipal Bond Fund | | | | | | | | | | | | | | |
Long-term Municipal Bonds | | | — | | | | 627,543,868 | | | — | | | 627,543,868 | |
Short-term Investments | | | 4,852,188 | | | | — | | | — | | | 4,852,188 | |
| | | | | | | | | | | | | | | |
| (a) Industry classification is disclosed in the Schedules of Investments. | | | | | | | |
The Funds did not hold any Level 3 securities or derivative instruments as of November 30, 2012 or for the year ended November 30, 2013. There were no transfers of securities between Level 1 and Level 2 as of November 30, 2013 as compared to November 30, 2012.
4. Income Taxes and Distributions to Shareholders
As of November 30, 2013, the Trust’s management completed a review of uncertain tax positions taken by the Funds, if any, and determined that no tax liability was required for unrecognized tax benefits, and no additional disclosures were needed. Generally, the tax authorities can initiate examinations of tax returns within the three year period beginning on the date such returns are filed. As a result, some tax returns are still open and subject to examination. In addition, as of November 30, 2013, management is not aware of any tax positions for which it is reasonably possible that the total amounts of unrecognized tax benefits will significantly change in the next twelve months.
STATE FARM ASSOCIATES’ FUNDS TRUST
NOTES TO FINANCIAL STATEMENTS (continued)
As of November 30, 2013, each Fund’s aggregate securities holdings’ unrealized gains and losses based on cost for federal income tax purposes were as follows:
| | | | | | | | | | | | | | | | |
Fund | | Cost of Investments for
Federal Tax Purposes | | | Gross Unrealized
Appreciation | | | Gross Unrealized
(Depreciation) | | | Net Unrealized
Appreciation (Depreciation) | |
Growth Fund | | | $1,185,313,666 | | | | $2,569,412,839 | | | | $ (442,859) | | | | $2,568,969,980 | |
Balanced Fund | | | 892,194,457 | | | | 654,418,818 | | | | (12,139,546) | | | | 642,279,272 | |
Interim Fund | | | 380,742,935 | | | | 5,047,260 | | | | (1,904,174) | | | | 3,143,086 | |
Municipal Bond Fund | | | 613,143,029 | | | | 25,003,174 | | | | (5,750,147) | | | | 19,253,027 | |
The differences, if any, between the cost of investments for federal income tax purposes and the cost of investments reflected on the Statements of Assets and Liabilities and Schedules of Investments are primarily related to the timing of recognition of gains and losses and investment income.
The Growth Fund and Balanced Fund declare and pay income dividends, if any, at least annually. The Interim Fund and Municipal Bond Fund declare dividends daily equal to each Fund’s respective net investment income, and distributions of such amounts are made on the last business day of each month.
Net realized gains on sales of investments, if any, are distributed annually after the close of the Fund’s fiscal year. Dividends and distributions payable to shareholders are recorded by the respective Fund on the ex-dividend date.
On December 18, 2013, the Growth Fund declared an ordinary income dividend of $0.75775 per share to shareholders of record on December 17, 2013 (reinvestment date December 18, 2013).
On December 18, 2013, the Balanced Fund declared an ordinary income dividend of $0.86144 per share to shareholders of record on December 17, 2013 (reinvestment date December 18, 2013).
On December 18, 2013, the Municipal Bond Fund declared a capital gain distribution of $0.00811 per share to shareholders of record on December 17, 2013 (reinvestment date December 18, 2013).
After utilizing capital loss carryforwards to offset realized capital gains during the year ended November 30, 2013, the following Funds had unused capital loss carryforwards available for federal income tax purposes to be applied against future capital gains realized after November 30, 2013, if any. Future capital loss carryforward utilization in any given year may be subject to Internal Revenue Code limitations. If not applied, the carryforwards will expire as follows:
| | | | | | | | | | | | | | | | | | | | | | | | | | | | | | | | | | |
| | | | | | Non Expiring | | | Year of Expiration | | | | |
| | | Utilized | | | Short-term | | Long-term | | | 2014 | | | 2015 | | | 2016 | | | 2017 | | | 2018 | | | Total | |
Growth Fund | | | $1,745,325 | | | $ — | | | $15,756,014 | | | | $ — | | | | $ — | | | | $25,639,404 | | | | $14,963,272 | | | | $8,819,052 | | | | $65,177,742 | |
Balanced Fund | | | — | | | — | | | 5,058,132 | | | | — | | | | — | | | | — | | | | — | | | | — | | | | 5,058,132 | |
Interim Fund | | | 448,120 | | | — | | | — | | | | — | | | | 77,840 | | | | — | | | | — | | | | — | | | | 77,840 | |
Capital losses incurred on or after December 1, 2011 are permitted to carry forward indefinitely. These losses must be utilized prior to losses incurred before December 1, 2011. Therefore, any losses incurred prior to December 1, 2011 may be more likely to expire unused.
STATE FARM ASSOCIATES’ FUNDS TRUST
NOTES TO FINANCIAL STATEMENTS (continued)
As of November 30, 2013, in accordance with federal tax regulations, the components of distributable earnings on a tax basis were as follows:
| | | | | | | | | | | | | | | | | | | | |
Fund | | Undistributed
Ordinary Income | | | Undistributed
Long-term Gain | | | Unrealized
Appreciation (Depreciation) | | | Accumulated
Capital and Other Losses | | | Total | |
Growth Fund | | | $37,248,671 | | | | $ — | | | | $2,568,982,439 | | | | $(65,177,742) | | | | $2,541,053,368 | |
Balanced Fund | | | 18,317,557 | | | | — | | | | 642,279,482 | | | | (5,058,132) | | | | 655,538,907 | |
Interim Fund | | | — | | | | — | | | | 3,143,086 | | | | (77,840) | | | | 3,065,246 | |
Municipal Bond Fund | | | — | | | | 598,337 | | | | 19,253,027 | | | | — | | | | 19,851,364 | |
The timing and characterization of certain income and capital gain distributions are determined annually in accordance with federal income tax regulations, which may differ from GAAP. These differences are primarily due to the recognition of net realized losses, the timing of Fund distributions, expiring capital loss carryforwards, and foreign currency transactions. As a result, net investment income and net realized gain or loss on investment transactions for a reporting period may differ from distributions during such period. Accordingly, each Fund may periodically make reclassifications among certain capital accounts without impacting its net asset value.
As of November 30, 2013, these reclassifications were as follows:
| | | | | | | | | | | | |
Fund | | Paid in
Capital | | | Accumulated
Net Realized
Gain (Loss) | | | Accumulated
Undistributed Net
Investment Income (Loss) | |
Growth Fund | | | $ — | | | | $242,997 | | | | $(242,997) | |
Balanced Fund | | | — | | | | (7,988) | | | | 7,988 | |
The tax character of distributions was designated as follows for the years ended November 30, 2013 and November 30, 2012, respectively:
| | | | | | | | |
2013 | | Tax-Exempt Income | | Ordinary Income | | Long-term Capital Gain | | Total |
Municipal Bond Fund | | $23,073,787 | | $39,826 | | $15,847 | | $23,129,460 |
| | | | | | | | |
2012 | | Tax-Exempt Income | | Ordinary Income | | Long-term Capital Gain | | Total |
Municipal Bond Fund | | $22,822,438 | | $220,876 | | $1,342,823 | | $24,386,137 |
For the remaining Funds, the tax distributions of ordinary income and long-term capital gains were the same as the distributions from net investment income and capital gains reflected in the Statements of Changes in Net Assets for the years ended November 30, 2013 and November 30, 2012.
STATE FARM ASSOCIATES’ FUNDS TRUST
NOTES TO FINANCIAL STATEMENTS (continued)
5. Transactions with Affiliates
The Trust has entered into an investment advisory and management services agreement with SFIMC pursuant to which each Fund pays SFIMC an annual fee (computed on a daily basis and paid monthly) at the following annual rates:
| | |
Growth Fund | | 0.20% of the first $100 million of average net assets 0.15% of the next $100 million of average net assets 0.10% of the average net assets in excess of $200 million |
| | |
Balanced Fund | | 0.20% of the first $100 million of average net assets 0.15% of the next $100 million of average net assets 0.10% of the average net assets in excess of $200 million |
| | |
Interim Fund | | 0.20% of the first $50 million of average net assets 0.15% of the next $50 million of average net assets 0.10% of the average net assets in excess of $100 million |
| | |
Municipal Bond Fund | | 0.20% of the first $50 million of average net assets 0.15% of the next $50 million of average net assets 0.10% of the average net assets in excess of $100 million |
Other than proceeds from the account fee imposed on certain shareholders of the Trust, the Funds do not pay any direct or indirect discount, commission or other compensation for transfer agent services provided by SFIMC or for distribution and underwriting services provided by State Farm VP Management Corp.
Certain officers and/or trustees of the Trust are also officers and/or directors of SFIMC. The Trust made no payments to its officers or trustees except for trustees’ fees paid to or accrued for the Trust’s independent trustees.
SFIMC reimbursed the Growth Fund $3,497 for a loss associated with a June 2013 trading error.
Expense Reduction Agreement
SFIMC has agreed to reimburse a Fund if, and to the extent, a Fund’s total annual operating expenses (excluding taxes, interest, extraordinary litigation expenses, brokerage commissions and other portfolio transaction costs) exceed 0.40% of the Fund’s average net assets.
Line of Credit
State Farm Mutual Automobile Insurance Company (“Auto Company”), the parent company of SFIMC, has entered into a Line of Credit Agreement with the Trust. Under that agreement, a Fund may request and Auto Company, in its complete discretion, may lend money to a Fund for up to 30 days on an unsecured basis. Auto Company will not lend more than $50 million at any one time to the Funds and to the other mutual funds advised by SFIMC. Under the agreement, a Fund will pay interest to Auto Company on any outstanding loan at a benchmark interest rate that approximates the rate that creditworthy corporate issuers pay on short-term commercial paper. The Funds did not borrow under the Line of Credit Agreement during the year ended November 30, 2013.
6. Investment Transactions
For the year ended November 30, 2013, investment transactions (exclusive of short-term instruments) were as follows:
| | | | | | | | | | | | | | | | |
| | | Purchases (excluding U.S.
Government Obligations) | | | Sales (excluding U.S.
Government Obligations) | | | Purchases of U.S.
Government Obligations | | | Sales of U.S.
Government Obligations | |
Growth Fund | | | $ 33,038,286 | | | | $23,124,685 | | | | $ — | | | | $ — | |
Balanced Fund | | | 120,441,119 | | | | 29,823,520 | | | | 19,775,391 | | | | 40,000,000 | |
Interim Fund | | | — | | | | 5,000,000 | | | | 64,987,109 | | | | 75,607,813 | |
Municipal Bond Fund | | | 69,012,547 | | | | 72,962,311 | | | | — | | | | — | |
FINANCIAL HIGHLIGHTS
The financial highlights table is intended to help you understand the financial performance of each Fund for the past five years. Certain information reflects financial results for a single Fund share. The total returns within each table represent the rate that an investor would have earned (or lost) on an investment in the Fund (assuming reinvestment of all dividends and distributions).
STATE FARM ASSOCIATES’ FUNDS TRUST GROWTH FUND
(For a share outstanding throughout each period)
| | | | | | | | | | | | | | | | | | | | |
| | | Year ended November 30, | |
| | | | | |
| | | 2013 | | | 2012 | | | 2011 | | | 2010 | | | 2009 | |
Net asset value, beginning of period | | $ | 55.71 | | | | 52.10 | | | | 50.42 | | | | 49.23 | | | | 42.27 | |
| | | | | |
Income from Investment Operations | | | | | | | | | | | | | | | | | | | | |
Net investment income (a) | | | 1.47 | | | | 1.38 | | | | 1.23 | | | | 1.12 | | | | 1.14 | |
Net gain (loss) on investments (both realized and unrealized) | | | 11.70 | | | | 3.57 | | | | 1.64 | | | | 1.17 | | | | 7.05 | |
| | | | | | | | | | | | | | | | | | | | |
Total from investment operations | | | 13.17 | | | | 4.95 | | | | 2.87 | | | | 2.29 | | | | 8.19 | |
| | | | | | | | | | | | | | | | | | | | |
Less Distributions | | | | | | | | | | | | | | | | | | | | |
Net investment income | | | (1.46 | ) | | | (1.34 | ) | | | (1.19 | ) | | | (1.10 | ) | | | (1.23 | ) |
| | | | | | | | | | | | | | | | | | | | |
Total distributions | | | (1.46 | ) | | | (1.34 | ) | | | (1.19 | ) | | | (1.10 | ) | | | (1.23 | ) |
| | | | | | | | | | | | | | | | | | | | |
Net asset value, end of period | | $ | 67.42 | | | | 55.71 | | | | 52.10 | | | | 50.42 | | | | 49.23 | |
| | | | | | | | | | | | | | | | | | | | |
| | | | | |
Total Return | | | 24.06 | % | | | 9.69 | % | | | 5.63 | % | | | 4.86 | % | | | 19.92 | % |
| | | | | |
Ratios/Supplemental Data | | | | | | | | | | | | | | | | | | | | |
Net assets, end of period (millions) | | $ | 3,769.1 | | | | 3,145.1 | | | | 3,033.1 | | | | 2,995.7 | | | | 2,981.1 | |
| | | | | |
Average net asset ratios | | | | | | | | | | | | | | | | | | | | |
Expenses | | | 0.12 | % | | | 0.12 | % | | | 0.12 | % | | | 0.12 | % | | | 0.13 | % |
Net investment income | | | 2.38 | % | | | 2.53 | % | | | 2.32 | % | | | 2.29 | % | | | 2.71 | % |
| | | | | |
Portfolio turnover rate (b) | | | 1 | % | | | 0 | % | | | 1 | % | | | 1 | % | | | 1 | % |
| (a) | Average shares outstanding for the period were used to calculate net investment income per share. |
| (b) | Portfolio turnover rate rounds to less than 1% for the year ended November 30, 2012. |
| | |
60 | | See accompanying notes to financial statements. |
STATE FARM ASSOCIATES’ FUNDS TRUST BALANCED FUND
(For a share outstanding throughout each period)
| | | | | | | | | | | | | | | | | | | | |
| | | Year ended November 30, | |
| | | | | |
| | | 2013 | | | 2012 | | | 2011 | | | 2010 | | | 2009 | |
Net asset value, beginning of period | | $ | 56.65 | | | | 54.43 | | | | 53.22 | | | | 52.17 | | | | 46.64 | |
| | | | | |
Income from Investment Operations | | | | | | | | | | | | | | | | | | | | |
Net investment income (a) | | | 1.63 | | | | 1.60 | | | | 1.56 | | | | 1.52 | | | | 1.64 | |
Net gain (loss) on investments (both realized and unrealized) | | | 5.36 | | | | 2.26 | | | | 1.21 | | | | 1.06 | | | | 5.67 | |
| | | | | | | | | | | | | | | | | | | | |
Total from investment operations | | | 6.99 | | | | 3.86 | | | | 2.77 | | | | 2.58 | | | | 7.31 | |
| | | | | | | | | | | | | | | | | | | | |
Less Distributions | | | | | | | | | | | | | | | | | | | | |
Net investment income | | | (1.63 | ) | | | (1.58 | ) | | | (1.56 | ) | | | (1.53 | ) | | | (1.78 | ) |
Net realized gain (b) | | | — | | | | (0.06 | ) | | | — | | | | — | | | | — | |
| | | | | | | | | | | | | | | | | | | | |
Total distributions | | | (1.63 | ) | | | (1.64 | ) | | | (1.56 | ) | | | (1.53 | ) | | | (1.78 | ) |
| | | | | | | | | | | | | | | | | | | | |
Net asset value, end of period | | $ | 62.01 | | | | 56.65 | | | | 54.43 | | | | 53.22 | | | | 52.17 | |
| | | | | | | | | | | | | | | | | | | | |
| | | | | |
Total Return | | | 12.59 | % | | | 7.26 | % | | | 5.21 | % | | | 5.15 | % | | | 16.17 | % |
| | | | | |
Ratios/Supplemental Data | | | | | | | | | | | | | | | | | | | | |
Net assets, end of period (millions) | | $ | 1,540.8 | | | | 1,354.5 | | | | 1,287.8 | | | | 1,248.9 | | | | 1,202.7 | |
| | | | | |
Average net asset ratios | | | | | | | | | | | | | | | | | | | | |
Expenses | | | 0.13 | % | | | 0.13 | % | | | 0.13 | % | | | 0.13 | % | | | 0.14 | % |
Net investment income | | | 2.75 | % | | | 2.86 | % | | | 2.86 | % | | | 2.93 | % | | | 3.48 | % |
| | | | | |
Portfolio turnover rate | | | 5 | % | | | 5 | % | | | 6 | % | | | 5 | % | | | 1 | % |
| (a) | Average shares outstanding for the period were used to calculate net investment income per share. |
| (b) | Net realized gain distributions represent less than $0.01 per share for the year ended November 30, 2009. |
| | | | |
| See accompanying notes to financial statements. | | | 61 | |
STATE FARM ASSOCIATES’ FUNDS TRUST INTERIM FUND
(For a share outstanding throughout each period)
| | | | | | | | | | | | | | | | | | | | |
| | | Year ended November 30, | |
| | | | | |
| | | 2013 | | | 2012 | | | 2011 | | | 2010 | | | 2009 | |
Net asset value, beginning of period | | $ | 10.26 | | | | 10.28 | | | | 10.30 | | | | 10.31 | | | | 10.30 | |
| | | | | |
Income from Investment Operations | | | | | | | | | | | | | | | | | | | | |
Net investment income | | | 0.15 | | | | 0.19 | | | | 0.24 | | | | 0.26 | | | | 0.28 | |
Net gain (loss) on investments (both realized and unrealized) | | | (0.20 | ) | | | (0.02 | ) | | | (0.02 | ) | | | (0.01 | ) | | | 0.01 | |
| | | | | | | | | | | | | | | | | | | | |
Total from investment operations | | | (0.05 | ) | | | 0.17 | | | | 0.22 | | | | 0.25 | | | | 0.29 | |
| | | | | | | | | | | | | | | | | | | | |
Less Distributions | | | | | | | | | | | | | | | | | | | | |
Net investment income | | | (0.15 | ) | | | (0.19 | ) | | | (0.24 | ) | | | (0.26 | ) | | | (0.28 | ) |
| | | | | | | | | | | | | | | | | | | | |
Total distributions | | | (0.15 | ) | | | (0.19 | ) | | | (0.24 | ) | | | (0.26 | ) | | | (0.28 | ) |
| | | | | | | | | | | | | | | | | | | | |
Net asset value, end of period | | $ | 10.06 | | | | 10.26 | | | | 10.28 | | | | 10.30 | | | | 10.31 | |
| | | | | | | | | | | | | | | | | | | | |
| | | | | |
Total Return | | | (0.51 | )% | | | 1.66 | % | | | 2.19 | % | | | 2.43 | % | | | 2.81 | % |
| | | | | |
Ratios/Supplemental Data | | | | | | | | | | | | | | | | | | | | |
Net assets, end of period (millions) | | $ | 384.5 | | | | 432.1 | | | | 406.3 | | | | 375.2 | | | | 348.3 | |
| | | | | |
Average net asset ratios | | | | | | | | | | | | | | | | | | | | |
Expenses | | | 0.15 | % | | | 0.15 | % | | | 0.16 | % | | | 0.16 | % | | | 0.16 | % |
Net investment income | | | 1.46 | % | | | 1.84 | % | | | 2.36 | % | | | 2.50 | % | | | 2.68 | % |
| | | | | |
Portfolio turnover rate | | | 17 | % | | | 24 | % | | | 17 | % | | | 11 | % | | | 11 | % |
| | |
62 | | See accompanying notes to financial statements. |
STATE FARM ASSOCIATES’ FUNDS TRUST MUNICIPAL BOND FUND
(For a share outstanding throughout each period)
| | | | | | | | | | | | | | | | | | | | |
| | | Year ended November 30, | |
| | | | | |
| | | 2013 | | | 2012 | | | 2011 | | | 2010 | | | 2009 | |
Net asset value, beginning of period | | $ | 9.11 | | | | 8.79 | | | | 8.64 | | | | 8.70 | | | | 8.16 | |
| | | | | |
Income from Investment Operations | | | | | | | | | | | | | | | | | | | | |
Net investment income | | | 0.30 | | | | 0.32 | | | | 0.34 | | | | 0.35 | | | | 0.37 | |
Net gain (loss) on investments (both realized and unrealized) | | | (0.49 | ) | | | 0.34 | | | | 0.16 | | | | (0.04 | ) | | | 0.56 | |
| | | | | | | | | | | | | | | | | | | | |
Total from investment operations | | | (0.19 | ) | | | 0.66 | | | | 0.50 | | | | 0.31 | | | | 0.93 | |
| | | | | | | | | | | | | | | | | | | | |
Less Distributions | | | | | | | | | | | | | | | | | | | | |
Net investment income | | | (0.30 | ) | | | (0.32 | ) | | | (0.34 | ) | | | (0.35 | ) | | | (0.37 | ) |
Net realized gain (a) | | | — | | | | (0.02 | ) | | | (0.01 | ) | | | (0.02 | ) | | | (0.02 | ) |
| | | | | | | | | | | | | | | | | | | | |
Total distributions | | | (0.30 | ) | | | (0.34 | ) | | | (0.35 | ) | | | (0.37 | ) | | | (0.39 | ) |
| | | | | | | | | | | | | | | | | | | | |
Net asset value, end of period | | $ | 8.62 | | | | 9.11 | | | | 8.79 | | | | 8.64 | | | | 8.70 | |
| | | | | | | | | | | | | | | | | | | | |
| | | | | |
Total Return | | | (2.05 | )% | | | 7.63 | % | | | 5.97 | % | | | 3.64 | % | | | 11.53 | % |
| | | | | |
Ratios/Supplemental Data | | | | | | | | | | | | | | | | | | | | |
Net assets, end of period (millions) | | $ | 639.9 | | | | 683.5 | | | | 607.6 | | | | 585.0 | | | | 544.5 | |
| | | | | |
Average net asset ratios | | | | | | | | | | | | | | | | | | | | |
Expenses | | | 0.16 | % | | | 0.15 | % | | | 0.16 | % | | | 0.15 | % | | | 0.16 | % |
Net investment income | | | 3.46 | % | | | 3.55 | % | | | 3.93 | % | | | 4.04 | % | | | 4.27 | % |
| | | | | |
Portfolio turnover rate | | | 11 | % | | | 4 | % | | | 11 | % | | | 9 | % | | | 9 | % |
| (a) | Net realized gain distributions represent less than $0.01 per share for the year ended November 30, 2013. |
| | | | |
| See accompanying notes to financial statements. | | | 63 | |
REPORT OF INDEPENDENT REGISTERED PUBLIC ACCOUNTING FIRM
To the Board of Trustees and Shareholders of the State Farm Associates’ Funds Trust:
In our opinion, the accompanying statements of assets and liabilities, including the schedules of investments, and the related statements of operations and of changes in net assets and the financial highlights present fairly, in all material respects, the financial position of State Farm Growth Fund, State Farm Balanced Fund, State Farm Interim Fund and State Farm Municipal Bond Fund, four funds comprising the State Farm Associates’ Funds Trust (the “Funds”), at November 30, 2013, the results of each of their operations for the year then ended, the changes in each of their net assets and the financial highlights for each of the two years in the period then ended, in conformity with accounting principles generally accepted in the United States of America. These financial statements and financial highlights (hereafter referred to as “financial statements”) are the responsibility of the Funds’ management; our responsibility is to express an opinion on these financial statements based on our audits. We conducted our audits of these financial statements in accordance with the standards of the Public Company Accounting Oversight Board (United States). Those standards require that we plan and perform the audits to obtain reasonable assurance about whether the financial statements are free of material misstatement. An audit includes examining, on a test basis, evidence supporting the amounts and disclosures in the financial statements, assessing the accounting principles used and significant estimates made by management, and evaluating the overall financial statement presentation. We believe that our audits, which included confirmation of securities at November 30, 2013 by correspondence with the custodian and brokers, provide a reasonable basis for our opinion. The financial highlights of the Funds for the periods ended November 30, 2010 and prior were audited by another independent registered public accounting firm whose report dated January 24, 2011 expressed an unqualified opinion on those financial highlights.
PricewaterhouseCoopers LLP
Chicago, Illinois
January 22, 2014
64
FEDERAL INCOME TAX INFORMATION (unaudited)
The following information is provided as required by the Internal Revenue Code for dividends paid by each Fund during the year ended November 30, 2013.
| | | | | | | | | | | | | | | | |
Fund | | Total Capital Gain
Distributed | | | Total Qualified
Dividend Income
Distributed | | | Total Distributions
Qualifying for the
Dividends-Received
Deduction | | | Total Exempt
Interest Distributed | |
Growth | | | $ — | | | | $81,962,353 | | | | $77,097,585 | | | | $ — | |
Balanced | | | — | | | | 20,977,325 | | | | 18,200,382 | | | | — | |
Interim | | | — | | | | — | | | | — | | | | — | |
Municipal Bond | | | 15,847 | | | | — | | | | — | | | | 23,073,787 | |
Shareholders are advised to consult their own tax advisor with respect to the tax consequences of their investment in the Funds. Individual shareholders should refer to their Form 1099 to determine the amounts to be included on their federal income tax return.
65
Management Information –State Farm Associates’ Funds Trust, November 30, 2013 (unaudited)
I. Information about Non-Interested (Independent) Trustees of State Farm Associates’ Funds Trust
| | | | | | | | | | |
Name, Address, and Age | | Position
Held with
Fund | | Length of Time Served
and Term of Office | | Principal Occupation(s) During the Past 5 years | | Number of
Portfolios
in Fund
Complex
Overseen
by Trustee | | Other
Directorships
Held by Trustee |
Thomas M. Mengler One State Farm Plaza Bloomington, Illinois 61710 Age 60 | | Trustee | | Began service in 1998 to the predecessor of the Trust and serves until successor is elected or appointed. | | PRESIDENT (since 6/2012) - St. Mary’s University; DEAN and PROFESSOR OF LAW (before 6/2012) – University of St. Thomas School of Law; TRUSTEE – State Farm Variable Product Trust, State Farm Mutual Fund Trust. | | 28 | | None |
James A. Shirk One State Farm Plaza Bloomington, Illinois 61710 Age 69 | | Trustee | | Began service in 1987 to the predecessor of the Trust and serves until successor is elected or appointed. | | DIRECTOR and PRESIDENT – Beer Nuts, Inc. (manufacturer of snack foods); PRESIDENT/OWNER - Tiehack Development Company (land developer); TRUSTEE – State Farm Variable Product Trust, State Farm Mutual Fund Trust. | | 28 | | None |
Victor J. Boschini One State Farm Plaza Bloomington, Illinois 61710 Age 57 | | Trustee | | Began service in 2001 and serves until successor is elected or appointed. | | CHANCELLOR – Texas Christian University; TRUSTEE – State Farm Variable Product Trust, State Farm Mutual Fund Trust. | | 28 | | None |
David L. Vance One State Farm Plaza Bloomington, Illinois 61710 Age 61 | | Trustee | | Began service in 2001 and serves until successor is elected or appointed. | | EXECUTIVE DIRECTOR (since 8/2012) - Center for Talent Reporting, Inc. (nonprofit dedicated to improving the management of human capital); PRESIDENT/OWNER (since 7/2010) - Poudre River Press LLC (book publisher); CONSULTANT/ PRESIDENT/OWNER – Manage Learning LLC (consults with organizations on learning strategy, governance, measurement and evaluation); ADJUNCT FACULTY (since 2/2010) - Bellevue University and University of Southern Mississippi; TRUSTEE – State Farm Variable Product Trust, State Farm Mutual Fund Trust. | | 28 | | None |
Alan R. Latshaw One State Farm Plaza Bloomington, Illinois 61710 Age 62 | | Trustee | | Began service in 2005 and serves until successor is elected or appointed. | | RETIRED; TRUSTEE – State Farm Variable Product Trust, State Farm Mutual Fund Trust. | | 28 | | TRUSTEE – MainStay Funds (79 portfolios) |
Anita M. Nagler One State Farm Plaza Bloomington, Illinois 61710 Age 57 | | Trustee | | Began service in 2006 and serves until successor is elected or appointed. | | DIRECTOR - Baron Capital Group, Inc. (investment adviser and distributor of mutual funds); PRIVATE INVESTOR; TRUSTEE – State Farm Variable Product Trust, State Farm Mutual Fund Trust. | | 28 | | None |
Diane L. Wallace One State Farm Plaza Bloomington, IL 61710 Age 55 | | Trustee | | Began service in 2013 and serves until successor is elected or appointed. | | RETIRED; TRUSTEE - State Farm Variable Product Trust, State Farm Mutual Fund Trust. | | 28 | | None |
66
Management Information –
State Farm Associates’ Funds Trust, November 30, 2013 (unaudited)
II. Information about Interested Trustees/Officers of State Farm Associates’ Funds Trust
| | | | | | | | | | | | |
Name, Address, and Age | | Position(s)
Held with
Fund | | Length of Time Served
and Term of Office | | Principal Occupation(s) During the Past 5 years | | Number of
Portfolios
in Fund
Complex
Overseen
by Trustee | | | Other
Directorships
Held by
Trustee |
Edward B. Rust, Jr.* One State Farm Plaza Bloomington, Illinois 61710 Age 63 | | Trustee and
Chairperson
of the Board | | Began service as Trustee in 1991 to the predecessor of the Trust and serves until successor is elected or appointed. Began service as Chairperson of the Board in 2012 and serves until removed. | | CHAIRMAN OF THE BOARD, CHIEF EXECUTIVE OFFICER, PRESIDENT and DIRECTOR – State Farm Mutual Automobile Insurance Company; PRESIDENT and DIRECTOR – State Farm VP Management Corp., State Farm Investment Management Corp.; TRUSTEE, PRESIDENT (before 12/2012) and CHAIRPERSON OF THE BOARD (since 12/2012) – State Farm Variable Product Trust, State Farm Mutual Fund Trust. | | | 28 | | | DIRECTOR – McGraw-Hill Financial (financial ratings/ information); DIRECTOR – Caterpillar, Inc. (manufacturer of heavy equipment and earth-moving machinery); DIRECTOR – Helmerich & Payne, Inc. (energy exploration and production company) |
Michael L. Tipsord* One State Farm Plaza Bloomington, Illinois 61710 Age 54 | | Trustee and
President | | Began service in 2002 as a Trustee of the Trust and serves until successor is elected or appointed. Began service as President in 2012 and serves until removed. | | VICE CHAIRMAN and CHIEF OPERATING OFFICER (since 12/2010), CHIEF FINANCIAL OFFICER (before 12/2010) and DIRECTOR – State Farm Mutual Automobile Insurance Company; DIRECTOR, SENIOR VICE PRESIDENT and TREASURER – State Farm Investment Management Corp., State Farm VP Management Corp.; TRUSTEE, SENIOR VICE PRESIDENT and TREASURER (before 12/2012) and PRESIDENT (since 12/2012) – State Farm Variable Product Trust, State Farm Mutual Fund Trust. | | | 28 | | | DIRECTOR – Navigant Consulting, Inc. (international consulting firm) |
| * | Messrs. Rust and Tipsord are “interested” Trustees as defined by the Investment Company Act of 1940 because of their respective positions with State Farm Associates’ Funds Trust, State Farm VP Management Corp., State Farm Investment Management Corp., and with the affiliates of these companies. |
67
Management Information –
State Farm Associates’ Funds Trust, November 30, 2013 (unaudited)
III. Information about Officers of State Farm Associates’ Fund Trust
| | | | | | |
Name, Address, and Age | | Position(s)
Held with
Fund | | Length of Time Served
and Term of Office | | Principal Occupation(s) During the Past 5 years |
Paul N. Eckley One State Farm Plaza Bloomington, Illinois 61710 Age 59 | | Senior Vice
President | | Began service in 1999 to the predecessor of the Trust and serves until removed. | | SENIOR VICE PRESIDENT – INVESTMENTS - State Farm Mutual Automobile Insurance Company. |
Joseph P. Young One State Farm Plaza Bloomington, Illinois 61710 Age 50 | | Vice
President | | Began service in December 2011 and serves until removed. | | VICE PRESIDENT – FIXED INCOME (since 12/2011), ASSISTANT VICE PRESIDENT - FIXED INCOME (6/2011 - 12/2011) - State Farm Mutual Automobile Insurance Company; VICE PRESIDENT - FIXED INCOME (3/1998 - 5/2011) - Nationwide Insurance; VICE PRESIDENT (since 3/2012) - State Farm Investment Management Corp.; VICE PRESIDENT (since 12/2011) - State Farm Variable Product Trust, State Farm Mutual Fund Trust. |
Paul J. Smith One State Farm Plaza Bloomington, Illinois 61710 Age 50 | | Senior Vice
President
and
Treasurer | | Began service in June 2011 as Senior Vice President and in December 2012 as Treasurer and serves until removed. | | CHIEF FINANCIAL OFFICER (since 12/2010), TREASURER (since 6/2009), SENIOR VICE PRESIDENT (3/2007 - 1/2013) and EXECUTIVE VICE PRESIDENT (since 1/2013) - State Farm Mutual Automobile Insurance Company; DIRECTOR (since 3/2011) and SENIOR VICE PRESIDENT (since 12/2009) – State Farm Investment Management Corp., State Farm VP Management Corp.; SENIOR VICE PRESIDENT (since 6/2011) and TREASURER (since 12/2012) – State Farm Variable Product Trust, State Farm Mutual Fund Trust. |
Joe R. Monk Jr. One State Farm Plaza Bloomington, IL 61710 Age 50 | | Senior Vice
President | | Began service in March 2011 and serves until removed. | | SENIOR VICE PRESIDENT, CHIEF ADMINISTRATIVE OFFICER (since 4/2010) and OPERATIONS VICE PRESIDENT (6/2008 - 4/2010) - State Farm Life Insurance Company; SENIOR VICE PRESIDENT - MUTUAL FUNDS (since 1/2011), VICE PRESIDENT – HEALTH (since 4/2010) and OPERATIONS VICE PRESIDENT - HEALTH (6/2008 - 4/2010) - State Farm Mutual Automobile Insurance Company; SENIOR VICE PRESIDENT and DIRECTOR (since 7/2010) – State Farm Investment Management Corp., State Farm VP Management Corp.; SENIOR VICE PRESIDENT (since 3/2011) - State Farm Variable Product Trust, State Farm Mutual Fund Trust. |
David R. Grizzle Three State Farm Plaza Bloomington, Illinois 61791 Age 54 | | Chief
Compliance
Officer and
Assistant
Secretary-
Treasurer | | Began service as Assistant Secretary- Treasurer in 2001 and as Chief Compliance Officer in 2006 and serves until removed. | | CHIEF COMPLIANCE OFFICER – State Farm Variable Product Trust, State Farm Mutual Fund Trust; DIRECTOR – MUTUAL FUNDS – State Farm Mutual Automobile Insurance Company; ASSISTANT SECRETARY – TREASURER – State Farm Variable Product Trust, State Farm Mutual Fund Trust; CHIEF COMPLIANCE OFFICER and ASSISTANT SECRETARY - TREASURER – State Farm Investment Management Corp.; ASSISTANT SECRETARY – TREASURER – State Farm VP Management Corp. |
Dick Paul One State Farm Plaza Bloomington, Illinois 61710 Age 54 | | Vice
President | | Began service in March 2012 and serves until removed. | | VICE PRESIDENT - LIFE/HEALTH/MUTUAL FUNDS (since 1/2012), OPERATIONS VICE PRESIDENT - LIFE/HEALTH (5/2009 - 2/2012), EXECUTIVE ASSISTANT (1/2009 - 5/2009) and ASSISTANT VICE PRESIDENT - MUTUAL FUNDS (8/2005 - 1/2009) - State Farm Mutual Automobile Insurance Company; VICE PRESIDENT (since 3/2012) - State Farm Investment Management Corp., State Farm VP Management Corp., State Farm Variable Product Trust, State Farm Mutual Fund Trust. |
Mark D. Mikel Three State Farm Plaza Bloomington, IL 61791 Age 43 | | Vice
President
and
Secretary | | Began service in 2012 and serves until removed. | | ASSISTANT VICE PRESIDENT - MUTUAL FUNDS (since 12/2012) and MUTUAL FUNDS DIRECTOR (before 12/2012) - State Farm Mutual Automobile Insurance Company; ASSISTANT SECRETARY - TREASURER - State Farm Investment Management Corp., State Farm VP Management Corp.; VICE PRESIDENT AND SECRETARY (since 12/2012) - State Farm Variable Product Trust, State Farm Mutual Fund Trust. |
The Trust’s Statement of Additional Information (“SAI”) includes additional information about the Trustees of the Trust, and the SAI is available without charge upon request. Call toll-free 1-800-447-0740 to request a copy of the SAI.
68
| | | | |
| P.O. Box 219548 | | U.S. POSTAGE | | |
| Kansas City, MO 64121-9548 | | PAID | | |
| | LANCASTER, PA | | |
| FORWARDING SERVICE REQUESTED | | PERMIT NO. 1275 | | |
PRESORTED STANDARD
| | | | |
| | Not FDIC Insured | | • May Lose Value • No Bank Guarantee |
| | | | |
State Farm VP Management Corp. (Underwriter and Distributor of Securities Products) One State Farm Plaza Bloomington, Illinois 61710-0001 1-800-447-0740 | | There is no assurance that the Funds will achieve their investment objectives. Investment return and principal value will fluctuate and Fund shares, when redeemed, may be worth more or less than their original cost. State Farm Mutual Funds are not insurance products. |
statefarm.com®
1-2014
| | | | |
| 190-4049.15-CH | | AP2014/01/0038 | | Printed in U.S.A. |
As of the end of the period covered by this report, the registrant has adopted a code of ethics that applies to the registrants’ principal executive officer, principal financial officer, principal accounting officer or controller, or persons performing similar functions (each a “covered person”). During the period covered by this Form N-CSR, registrant did not make any amendment to any provisions of such code of ethics that applies to a covered person and that relates to any element of such code set forth in paragraph (b) of Item 2 of Form N-CSR, and registrant did not grant any waiver from such code of ethics provisions. Registrant hereby undertakes to provide a copy of such code of ethics to any person upon request, without charge. To request a copy of the code of ethics, contact the registrant at 1-800-447-0740.
| ITEM 3. | AUDIT COMMITTEE FINANCIAL EXPERT. |
Registrant’s board of trustees has determined that Alan Latshaw and Anita Nagler, members of the registrant’s Audit Committee, each have all of the attributes to be deemed an “audit committee financial expert,” as such term is defined in Instruction 2(b) to Item 3 of Form N-CSR. Mr. Latshaw and Ms. Nagler are “independent” as such term is defined in paragraph (a)(2) of Item 3 of Form N-CSR.
As indicated in Instruction 2(d) to Item 3 of Form N-CSR, a person who is determined to be an audit committee financial expert will not be deemed an “expert” for any purpose, including without limitation for the purposes of Section 11 of the Securities Act of 1933, as a result of being designated or identified as an audit committee financial expert pursuant to this Item 3 of Form N-CSR. The designation or identification of a person as an audit committee financial expert pursuant to this Item 3 of Form N-CSR does not impose on such person any duties, obligations, or liability that are greater than the duties, obligations, and liability imposed on such person as a member of the Audit Committee and board of trustees in the absence of such designation or identification. The designation or identification of a person as an audit committee financial expert pursuant to this Item 3 of Form N-CSR does not affect the duties, obligations, or liability of any other member of the Audit Committee or board of trustees.
| ITEM 4. | PRINCIPAL ACCOUNTANT FEES AND SERVICES. |
| | | | | | |
| | Billed to registrant for fiscal year ending November 30, 2013: | | $ | 139,432 | |
| | Billed to registrant for fiscal year ending November 30, 2012: | | $ | 119,805 | |
The audit fees for November 30, 2013 are based on amounts billed and expected to be billed to registrant by the registrant’s independent registered public accountant and include an estimated amount from the registrant’s independent registered public accountant for the out-of-pocket expenses it expects to bill to registrant for that time period.
| | | | | | |
| | Billed to registrant for fiscal year ending November 30, 2013: | | $ | 0 | |
| | Billed to registrant for fiscal year ending November 30, 2012: | | $ | 0 | |
The nature of the services comprising the fees disclosed under this category: not applicable
Fees required to be approved pursuant to paragraph (c)(7)(ii) of Rule 2-01 of Reg. S-X:
| | | | | | |
| | Billed for fiscal year ending November 30, 2013: | | $ | 0 | |
| | Billed for fiscal year ending November 30, 2012: | | $ | 0 | |
The nature of the services comprising the fees disclosed under this category: not applicable
| | | | | | |
| | Billed to registrant for fiscal year ending November 30, 2013: | | $ | 19,150 | |
| | Billed to registrant for fiscal year ending November 30, 2012: | | $ | 18,925 | |
The nature of the services comprising the fees disclosed under this category:
Includes fees for reviewing the registrant’s compliance with tax qualification tests relating to asset diversification, gross income, and distribution requirements to maintain the registrant’s status as a Regulated Investment Company under current provisions of the Internal Revenue Code. Also includes fees for reviewing the registrant’s tax returns (federal, state, and excise) and a review of income tax and excise tax positions, issues and tax accounting methods with respect to the registrant.
Fees required to be approved pursuant to paragraph (c)(7)(ii) of Rule 2-01 of Reg. S-X:
| | | | | | |
| | Billed for fiscal year ending November 30, 2013: | | $ | 0 | |
| | Billed for fiscal year ending November 30, 2012: | | $ | 0 | |
The nature of the services comprising the fees disclosed under this category: not applicable
| | | | | | |
| | Billed to registrant for fiscal year ending November 30, 2013: | | $ | 0 | |
| | Billed to registrant for fiscal year ending November 30, 2012: | | $ | 0 | |
The nature of the services comprising the fees disclosed under this category include: not applicable
Fees required to be approved pursuant to paragraph (c)(7)(ii) of Rule 2-01 of Reg. S-X:
| | | | | | |
| | Billed for fiscal year ending November 30, 2013: | | $ | 20,600 | |
| | Billed for fiscal year ending November 30, 2012: | | $ | 20,000 | |
The nature of the services comprising the fees disclosed under this category:
These fees were approved pursuant to paragraph (c)(7)(ii) of Rule 2-01 of Reg. S-X and were billed to registrant’s transfer agent, State Farm Investment Management Corp., by the registrant’s independent registered public accountant. These fees related to the performance of an internal control review of the internal controls of the registrant’s transfer agent and issuance of a report in accordance with Rule 17Ad-13 under the Securities Exchange Act of 1934 by the registrant’s independent registered public accountant.
| (e)(1) | The Audit Committee’s pre-approval policies and procedures described in paragraph (c)(7) of Rule 2-01 of Regulation S-X: |
The Audit Committee (the “Committee”) will approve and recommend to the Board, the selection, retention or termination of the independent registered public accountants of the Trust, and review the independent registered public accountant’s fees to determine whether those fees appear to be appropriate for the services rendered.
| | a. | Any engagement shall be pursuant to a written engagement letter approved by the Committee, which shall provide, among other things, that: |
| | - | the Committee shall be directly responsible for the appointment, compensation and oversight of the independent registered public accountants; and |
| | - | the independent registered public accountants shall report directly to the Committee. |
| | b. | Pre-approve any engagement of the independent registered public accountants to provide any services (other than the prohibited non-audit services specified in section c. below) to the Trust, or to SFIMC [State Farm Investment Management Corp.] and any entity controlling, controlled by, or under common control with SFIMC that provides ongoing services to the Trust (if the engagement relates directly to the operations and financial reporting of the Trust), including the fees and other compensation to be paid to the independent registered public accountants. The Chairman of the Committee may grant such pre-approval. Any such delegated pre-approval shall be presented to the Committee by the Chairman at the next meeting of the Committee. |
| | (1) | Pre-approval of non-audit services for the Trust is waived, if: |
| | a. | the aggregate amount of all non-audit services provided to the Trust is less than 5% of the total fees paid by the Trust to its independent registered public accountants during the fiscal year in which the non-audit services are provided; |
| | b. | the services were not recognized by management at the time of the engagement as non-audit services; and |
| | c. | such services are promptly brought to the attention of the Committee by management and the Committee approves them (which may be by delegation as provided for above) prior to the completion of the audit. |
| | (2) | Pre-approval of non-audit services for SFIMC or any entity controlling, controlled by, or under common control with SFIMC that provides ongoing services to the Trust is waived, if: |
| | a. | the aggregate amount of all non-audit services provided is less than 5% of the total fees paid by the Trust, SFIMC and any entity controlling, controlled by, or under common control with SFIMC that provides ongoing services to the Trust to its independent registered public accountants during the fiscal year in which the non-audit services are provided that would have to be pre-approved; |
| | b. | the services were not recognized by management at the time of the engagement as non-audit services; and |
| | c. | such services are promptly brought to the attention of the Committee by management and the Committee approves them (which may be by delegation) prior to the completion of the audit. |
| | c. | The independent registered public accountants shall not perform any of the following non-audit services for the Trust: |
| | (1) | bookkeeping or other services related to the accounting records or financial statements of the Trust; |
| | (2) | financial information systems design and implementation; |
| | (3) | appraisal or valuation services, fairness opinions, or contribution-in-kind reports; |
| | (5) | internal audit outsourcing services; |
| | (6) | management functions or human resources; |
| | (7) | broker or dealer, investment adviser, or investment banking services; |
| | (8) | legal services and expert services unrelated to the audit; and |
| | (9) | any other services that the Public Company Accounting Oversight Board determines are impermissible. |
| (e)(2) | The percentage of services described in each of paragraphs (b) through (d) of this Item that were rendered to the registrant and approved by the Committee pursuant to paragraph (c)(7)(i)(C) of Rule 2-01 of Regulation S-X: |
| | | | | | | | |
| | | | Paragraph (b) | | Paragraph (c) | | Paragraph (d) |
| | Fiscal year ending November 30, 2013: | | not applicable | | not applicable | | not applicable |
| | Fiscal year ending November 30, 2012: | | not applicable | | not applicable | | not applicable |
The percentage of services described in each of paragraphs (b) through (d) of this Item that were approved by the Committee pursuant to paragraph (c)(7)(ii) of Rule 2-01 of Regulation S-X:
| | | | | | | | |
| | | | Paragraph (b) | | Paragraph (c) | | Paragraph (d) |
| | Fiscal year ending November 30, 2013: | | not applicable | | 0% | | 100% |
| | Fiscal year ending November 30, 2012: | | not applicable | | 0% | | 100% |
(f) Not applicable.
(g) Aggregate non-audit fees billed by the registrant’s accountant for services rendered to registrant:
| | | | |
Fiscal year ending November 30, 2013: | | $ | 19,150 | |
Fiscal year ending November 30, 2012: | | $ | 18,925 | |
Aggregate non-audit fees billed by the registrant’s accountant for services rendered to registrant’s investment adviser (not including any sub-adviser whose role is primarily portfolio management and is subcontracted with or overseen by another investment adviser):
| | | | |
Fiscal year ending November 30, 2013: | | $ | 20,600 | |
Fiscal year ending November 30, 2012: | | $ | 20,000 | |
Aggregate non-audit fees billed by the registrant’s accountant for services rendered to any entity controlling, controlled by, or under common control with the adviser that provides ongoing services to the registrant:
| | | | |
Fiscal year ending November 30, 2013: | | $ | 0 | |
Fiscal year ending November 30, 2012: | | $ | 0 | |
(h) Not applicable.
| ITEM 5. | AUDIT COMMITTEE OF LISTED REGISTRANTS. |
Not applicable.
(a) The information required by this Item 6 is included as part of the report to shareholders under Item 1 of this Form N-CSR.
(b) Not applicable.
| ITEM 7. | DISCLOSURE OF PROXY VOTING POLICIES AND PROCEDURES FOR CLOSED-END MANAGEMENT INVESTMENT COMPANIES. |
Not applicable.
| ITEM 8. | PORTFOLIO MANAGERS OF CLOSED-END MANAGEMENT INVESTMENT COMPANIES. |
Not applicable.
| ITEM 9. | PURCHASES OF EQUITY SECURITIES BY CLOSED-END MANAGEMENT INVESTMENT COMPANY AND AFFILIATED PURCHASERS. |
Not applicable.
| ITEM 10. | SUBMISSION OF MATTERS TO A VOTE OF SECURITY HOLDERS. |
There were no material changes to the procedures by which shareholders may recommend nominees to the State Farm Associates’ Funds Trust Board of Trustees.
| ITEM 11. | CONTROLS AND PROCEDURES. |
(a) The registrant’s principal executive officer and principal financial officer evaluated the effectiveness of the registrant’s disclosure controls and procedures (as defined in Rule 30a-3(c) under the Investment Company Act of 1940 (the “Act”) (17 CFR 270.30a-3(c))) as of a date within 90 days of the filing date of this report (the “Evaluation Date”), and based on their evaluation as of the Evaluation Date of these controls and procedures as required by Rule 30a-3(b) under the Act (17 CFR 270.30a-3(b)) and Rules 13a-15(b) or 15d-15(b) under the Securities Exchange Act of 1934 (17 CFR 240.13a-15(b) or 240.15d-15(b)) (as applicable), concluded that the registrant’s disclosure controls and procedures are effective.
(b) No change in the registrant’s internal control over financial reporting (as defined in Rule 30a-3(d) under the Act (17 CFR 270.30a-3(d))) occurred during the second fiscal quarter of the period covered by this report that has materially affected, or is reasonably likely to materially affect, the registrant’s internal control over financial reporting.
(a)(1) Not applicable.
(a)(2) A separate certification for each principal executive officer and principal financial officer of the registrant as required by Rule 30a-2(a) under the Act (17 CFR 270.30a-2(a)): Attached hereto as EX-99.CERT.
(a)(3) Not applicable.
(b) Certification of principal executive officer and principal financial officer as required by Rule 30a-2(b) under the Act (17 CFR 270.30a-2(b)), Rule 13a-14(b) or Rule 15d-14(b) under the Securities Exchange Act of 1934 (17 CFR 240.13a-14(b) or 240.15d-14(b))(as applicable), and Section 1350 of Chapter 63 of Title 18 of the United States Code (18 U.S.C. 1350): Attached hereto as EX-99.906CERT.
SIGNATURES
Pursuant to the requirements of the Securities Exchange Act of 1934 and the Investment Company Act of 1940, the registrant has duly caused this report to be signed on its behalf by the undersigned, thereunto duly authorized.
State Farm Associates’ Funds Trust
| | |
| By | | /s/ Michael L. Tipsord |
| | Michael L. Tipsord |
| | President |
Date January 24, 2014
Pursuant to the requirements of the Securities Exchange Act of 1934 and the Investment Company Act of 1940, this report has been signed below by the following persons on behalf of the registrant and in the capacities and on the dates indicated.
| | |
| By | | /s/ Michael L. Tipsord |
| | Michael L. Tipsord |
| | President |
Date January 24, 2014
| | |
| By | | /s/ Paul J. Smith |
| | Paul J. Smith |
| | Senior Vice President and Treasurer |
Date January 24, 2014