UNITED STATES
SECURITIES AND EXCHANGE COMMISSION
Washington, D.C. 20549
FORM N-CSR
CERTIFIED SHAREHOLDER REPORT OF REGISTERED
MANAGEMENT INVESTMENT COMPANIES
Investment Company Act file number 811-01519
STATE FARM ASSOCIATES’ FUNDS TRUST
(Exact name of registrant as specified in charter)
| | |
One State Farm Plaza Bloomington, IL | | 61710-0001 |
| (Address of principal executive offices) | | (Zip code) |
| | |
| | |
| | Alan Goldberg |
| | K&L Gates LLP |
| Paul J. Smith | | Three First National Plaza |
| One State Farm Plaza | | 70 West Madison St., Suite 3100 |
| Bloomington, Illinois 61710-0001 | | Chicago, Illinois 60602 |
(Names and addresses of agents for service)
Registrant’s telephone number, including area code: 1-800-447-0740
Date of fiscal year end: 11/30/2014
Date of reporting period: 05/31/2014
| ITEM 1. | REPORTS TO STOCKHOLDERS. |
Before investing, consider the Funds’ investment objectives, risks, charges and expenses. Contact State Farm VP Management Corp. (1-800-447-0740) for a prospectus or summary prospectus containing this and other information. Read it carefully.
A description of the policies and procedures that the Funds use to determine how to vote proxies relating to portfolio securities, and information regarding how the Funds voted proxies relating to portfolio securities during the most recent 12-month period ended June 30, are available without charge upon request at 1-800-447-0740 and at “http://www.sec.gov.”
The Funds file complete schedules of portfolio holdings for each Fund with the Securities and Exchange Commission (the “Commission”) for the first and third quarters of each fiscal year on Form N-Q. The Funds’ Forms N-Q are available on the Commission’s website at “http://www.sec.gov.” The Funds’ Forms N-Q may be reviewed and copied at the Commission’s Public Reference Room in Washington, D.C., and information on the operation of the Public Reference Room may be obtained by calling 1-800-SEC-0330. The Funds make the information on Form N-Q available to shareholders upon request without charge at 1-800-447-0740.
Any website referenced in this report is an inactive textual reference only, and information contained in or otherwise accessible through that website does not form a part of, and is not incorporated by reference into, this report.
SEMI-ANNUAL REPORT
Electronic Delivery
As a State Farm Mutual Funds shareholder, we wish to remind you that you can elect to have future Annual Reports, Semi-Annual Reports, Prospectuses, statements, and tax forms delivered electronically rather than receiving large, bulky paper reports through the mail. This is a great way to help reduce internal fund costs related to printing and mailing these materials as well as a way to be environmentally friendly. Please consider signing up for electronic delivery today by going on statefarm.com or contacting the State Farm Mutual Funds Response Center at 1-800-447-0740 for assistance.
Compensation Deduction or Automatic Investment Plan (AIP)1
State Farm Mutual Funds allow you to make regular investments in a Fund with compensation deduction (agent/employee only) or an Automatic Investment Plan through an electronic transfer of funds from your bank/credit union account. If you wish to begin compensation deduction or an Automatic Investment Plan, the minimum amount required for both initial and subsequent investments is $50. Please consider signing up today for compensation deduction by going on the State Farm intranet or signing up for AIP by contacting the State Farm Mutual Funds Response Center at 1-800-447-0740 for assistance.
| 1 | Automatic investment plans do not assure a profit or protect against loss. |
Message to Shareholders of State Farm Associates’ Funds Trust
Dear Shareholders,
Thank you for investing with State Farm Mutual Funds®. Enclosed is the Semi-Annual Report for the 6-month period ended May 31, 2014, for the State Farm Associates’ Funds Trust. We encourage your review and consideration of this entire report.
State Farm Investment Management Corp. has consistently maintained a long-term, disciplined approach to managing investment risk and providing competitive investment products that can help you, our valued shareholder, with your investment goals1. We believe that remaining focused on your long-term goals and maintaining an appropriate asset allocation mix are important elements in pursuing investment success2.
Market Review
During the 6-month period ended May 31, 2014, the equity and fixed income markets both experienced positive returns.
The U.S. equity markets (as represented by the S&P 500 Index3) rose in December and continued an uneven climb during the 6-month period ended May 31, 2014, as illustrated in the chart below. The S&P 500 Index achieved positive total returns for five of those six months, and suffered its only monthly decline (–3.5%) in January. Investors absorbed mixed news throughout the period to help push the S&P 500 Index total return to 7.6% for the 6-month period ended May 31, 2014, and saw the S&P 500 Index reach a new closing price high (1,923.57) at period end.
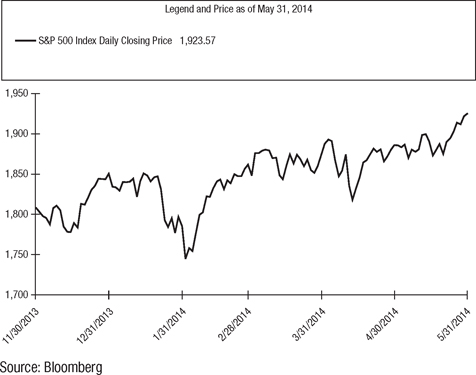
The positive factors influencing U.S. equity markets included improved corporate earnings, growing levels of business cash-on-hand, a continued trend of generally subdued inflation, and improvement in several sectors of the U.S. economy, such as labor, manufacturing, and consumer spending. In addition, the Federal Reserve (the “Fed”) continued its accommodative monetary policy, keeping the Federal Funds Rate unchanged with a target range of 0% to 0.25%.
| 1 | Investing involves risk, including potential for loss. |
| 2 | Asset allocation does not assure a profit or protect against loss. |
| 3 | Source: Standard & Poor’s. The S&P 500® Index is a capitalization-weighted measure of common stocks of 500 large U.S. companies. It is not possible to invest directly in an index. Past performance does not guarantee future results. |
1
Message to Shareholders of State Farm Associates’ Funds Trust (continued)
Meanwhile, political and military tensions between Russia and Ukraine provided uncertainty for the markets early in 2014, but those negative headwinds subsided as tensions eased in May. First quarter (January-March) U.S. Gross Domestic Product (GDP) was revised downward to –2.9% on an annualized basis, representing the economy’s first contraction in three years. However, for the most part, investors viewed the slowdown as temporary and attributed it to the severe ‘polar vortex’ winter weather system that affected a majority of the country, as well as to the drawdown of business inventories that had built-up in the prior year.
The relative strength of the bond markets surprised many in 2014 after fixed income investments in general suffered losses in the prior year, due in part, to changing interest rate expectations resulting from the Fed announcing that it would start reducing the amount of its asset-purchase programs known as “quantitative easing.”
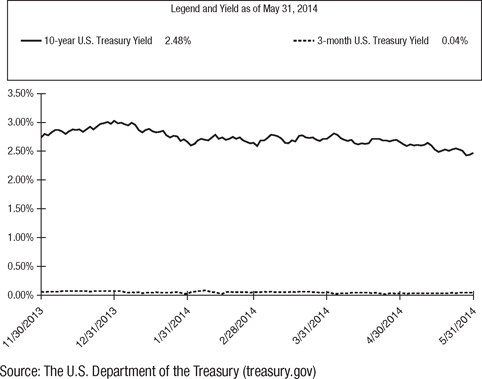
Among major fixed income indices, the Barclays 1-5 year Treasury Index4 and the Barclays 7-year Municipal Bond Index5 posted total returns of 0.41% and 3.92%, respectively, over the 6-month period ended May 31, 2014, as price increases added to bond coupon income. Meanwhile, as the chart below shows, after beginning December at 2.75% and rising above 3.0% at the end of 2013, 10-year U.S. Treasury yields decreased in early 2014 and maintained that level to finish the period ended May 31, 2014, at 2.48%6. Short-term yields remained low, with the 3-month U.S. Treasury yields starting December at 0.06%, climbing to 0.07% at the end of 2013, and settling at 0.04% for the period ended May 31, 2014.
| 4 | Source: Barclays Inc. The Barclays 1-5 Year U.S. Treasury Index measures the performance of short-term U.S. Treasury Securities maturing within one to five years. It is not possible to invest directly in an index. Past performance does not guarantee future results. |
| 5 | Source: Barclays Inc. The Barclays 7-year Municipal Bond Index is an unmanaged index comprised of investment grade municipal bonds with maturities of six to eight years. It is not possible to invest directly in an index. Past performance does not guarantee future results. |
| 6 | Source: The U.S. Department of the Treasury. A 10-year U.S. Treasury Bond is a debt obligation issued by the U.S. Treasury that has a term of more than one year, but not more than 10 years. A 3-month U.S. Treasury Bill is a debt obligation issued by the U.S. Treasury that has a term of 92 days or less. U.S. Treasury securities are backed by the full faith and credit of the U.S. government and are guaranteed only as to the prompt payment of principal and interest, and are subject to market risks if sold prior to maturity. Bonds have historically been less volatile than stocks, but are sensitive to changes in interest rates. Past performance does not guarantee future results. |
2
Message to Shareholders of State Farm Associates’ Funds Trust (continued)
In December, the Fed started reducing its $85 billion per month “quantitative easing” purchases to $75 billion per month, and it repeated similar $10 billion per month reductions in January, March and April as new Fed chair Janet Yellen marked her debut with no abrupt changes in U.S. monetary policy. Despite this continued Fed tapering and evidence that the economy was on solid ground, the major U.S. fixed income markets generated positive total returns, as the demand for bonds outstripped supply during the 6-month period ended May 31, 2014.
Look for a detailed discussion of factors that impacted the performance of the Funds during the time frame of December 1, 2013 through November 30, 2014 in the State Farm Associates’ Funds Trust Annual Report.
On behalf of the entire State Farm Mutual Funds team, thank you for your continued business and allowing us to help serve your investment needs.
|
| Sincerely, |
|
 |
| Joe R. Monk Jr. |
| Senior Vice President |
| State Farm Investment Management Corp. |
3
Portfolio Summary
State Farm Growth Fund
Fund Composition*
(unaudited)

| * | Illustrated by Industry and based on total net assets as of May 31, 2014. Please refer to the Schedule of Investments later in this report for details concerning Fund holdings. |
| ** | Represents 9 other industries, each of which represents less than 5% of total net assets. |
State Farm Balanced Fund
Fund Composition*
(unaudited)
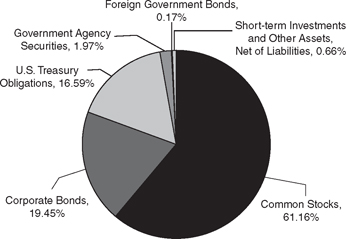
| * | Illustrated by Type of Security and based on total net assets as of May 31, 2014. Please refer to the Schedule of Investments later in this report for details concerning Fund holdings. |
4
Portfolio Summary (continued)
State Farm Interim Fund
Fund Composition*
(unaudited)
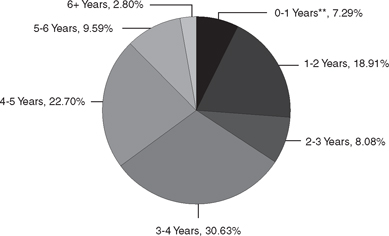
| * | Illustrated by Maturity and based on total investments as of May 31, 2014. Please refer to the Schedule of Investments later in this report for details concerning Fund holdings. |
| ** | Includes a 0.21% allocation to the JPMorgan US Government Money Market Fund. |
State Farm Municipal Bond Fund
Fund Composition*
(unaudited)
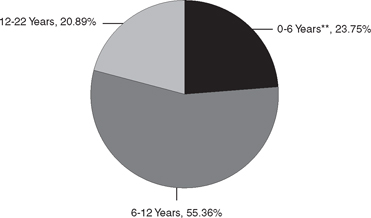
| * | Illustrated by Maturity and based on total investments as of May 31, 2014. Please refer to the Schedule of Investments later in this report for details concerning Fund holdings. |
| ** | Includes a 3.07% allocation to the JPMorgan Tax Free Money Market Fund. |
5
Expense Example (unaudited)
As a shareholder of a Fund, you incur ongoing costs, including management fees and other Fund expenses. The Example in the following table is intended to help you understand your ongoing costs (in dollars) of investing in a Fund and to compare these costs with the ongoing costs of investing in other mutual funds.
The Example is based on an investment of $1,000 invested at the beginning of the period and held for the entire period as stated in the table below.
Actual Expenses
The first line under each Fund name in the table below provides information about actual account values and actual expenses. You may use the information in this line, together with the amount you invested, to estimate the expenses that you paid over the period. Simply divide your account value for a Fund by $1,000 (for example, an $8,600 account value divided by $1,000 = 8.6), then multiply the result by the number in the first line under the heading entitled “Expenses Paid During Period” for the applicable Fund to estimate the expenses you paid on your account for that Fund during this period. If your account has multiple Fund positions, add up the results calculated for each Fund position within your account to estimate the expenses you paid on your total account value. A potential account fee of $10 per calendar quarter is not included in the expenses shown in the table. This fee will be charged to an account (other than a SEP IRA, SIMPLE IRA, Archer Medical Savings Account, Tax Sheltered Account under §403(b)(7) of the Internal Revenue Code or an account held under other employer-sponsored qualified retirement plans) if the balance in the account falls below $5,000 at the close of business on the second business day of the last month of the calendar quarter, unless the account has been open for less than a year as of the second business day of the last month of the calendar quarter. You should consider any account fee you incurred when estimating the total ongoing expenses paid over the period and the impact of this fee on your ending account value. This additional fee has the effect of reducing investment returns.
Hypothetical Example for Comparison Purposes
The second line under each Fund name in the table below provides information about hypothetical account values and hypothetical expenses based on the Fund’s actual expense ratio and an assumed rate of return of 5% per year before expenses, which is not the Fund’s actual return. The hypothetical account values and expenses may not be used to estimate the actual ending account balance or expenses you paid for the period. You may use this information to compare the ongoing costs of investing in the Fund and other funds. To do so, compare this 5% hypothetical example with the 5% hypothetical examples that appear in the shareholder reports of the other funds. A potential account fee of $10 per calendar quarter is not included in the expenses shown in the table. This fee will be charged to an account (other than a SEP IRA, SIMPLE IRA, Archer Medical Savings Account, Tax Sheltered Account under §403(b)(7) of the Internal Revenue Code or an account held under other employer-sponsored qualified retirement plans) if the balance in the account falls below $5,000 at the close of business on the second business day of the last month of the calendar quarter, unless the account has been open for less than a year as of the second business day of the last month of the calendar quarter. You should consider any account fee that you incurred when estimating the total ongoing expenses paid over the period and the impact of this fee on your ending account value. This additional fee has the effect of increasing the costs of investing.
Please note that the expenses shown in the table are meant to highlight your ongoing costs only. Therefore, the second line under each Fund name in the table is useful in comparing ongoing costs only, and will not help you determine the relative total costs of owning different funds, including those that have transactional costs, such as sales charges (loads), redemption fees, or exchange fees.
| | | | | | | | | | | | | | | | |
| | | Beginning
Account Value
December 1, 2013 | | | Ending
Account Value
May 31, 2014 | | | Annualized Expense
Ratio Based
on the Period
December 1, 2013 to
May 31, 2014 | | | Expenses Paid
During Period
December 1, 2013 to
May 31, 2014* | |
State Farm Growth Fund | | | | | | | | | | | | | | | | |
Actual | | $ | 1,000.00 | | | $ | 1,082.93 | | | | 0.12 | % | | $ | 0.62 | |
Hypothetical (5% return before expenses) | | $ | 1,000.00 | | | $ | 1,024.33 | | | | 0.12 | % | | $ | 0.61 | |
| | | | | | | | | | | | | | | | |
State Farm Balanced Fund | | | | | | | | | | | | | | | | |
Actual | | $ | 1,000.00 | | | $ | 1,071.38 | | | | 0.13 | % | | $ | 0.67 | |
Hypothetical (5% return before expenses) | | $ | 1,000.00 | | | $ | 1,024.28 | | | | 0.13 | % | | $ | 0.66 | |
| | | | | | | | | | | | | | | | |
State Farm Interim Fund | | | | | | | | | | | | | | | | |
Actual | | $ | 1,000.00 | | | $ | 1,003.74 | | | | 0.16 | % | | $ | 0.80 | |
Hypothetical (5% return before expenses) | | $ | 1,000.00 | | | $ | 1,024.13 | | | | 0.16 | % | | $ | 0.81 | |
| | | | | | | | | | | | | | | | |
State Farm Municipal Bond Fund | | | | | | | | | | | | | | | | |
Actual | | $ | 1,000.00 | | | $ | 1,044.61 | | | | 0.16 | % | | $ | 0.82 | |
Hypothetical (5% return before expenses) | | $ | 1,000.00 | | | $ | 1,024.13 | | | | 0.16 | % | | $ | 0.81 | |
| | | | | | | | | | | | | | | | |
| * | Expenses are equal to the applicable Fund’s annualized expense ratio (provided in the table), multiplied by the average account value over the period, multiplied by 182/365 (to reflect the one-half year period). |
6
STATE FARM ASSOCIATES’ FUNDS TRUST GROWTH FUND
SCHEDULE OF INVESTMENTS
May 31, 2014
(Unaudited)
| | | | | | | | |
| | | Shares | | | Value | |
Common Stocks (98.08%) | | | | | | | | |
Agriculture, Foods, & Beverage (11.96%) | | | | | | | | |
Archer-Daniels-Midland Co. | | | 3,477,500 | | | $ | 156,278,850 | |
Coca-Cola Co., The | | | 2,054,600 | | | | 84,053,686 | |
Kellogg Co. | | | 930,000 | | | | 64,151,400 | |
McCormick & Company Inc. | | | 428,600 | | | | 30,992,066 | |
Nestle SA ADR | | | 1,175,800 | | | | 92,388,485 | |
PepsiCo Inc. | | | 641,400 | | | | 56,654,862 | |
| | | | | | | | |
| | | | | | | 484,519,349 | |
| | | | | | | | |
Banks (4.79%) | | | | | | | | |
M&T Bank Corp. | | | 213,400 | | | | 25,900,358 | |
Northern Trust Corp. | | | 460,500 | | | | 27,814,200 | |
U.S. Bancorp | | | 141,400 | | | | 5,965,666 | |
Wells Fargo & Co. | | | 2,643,100 | | | | 134,216,618 | |
| | | | | | | | |
| | | | | | | 193,896,842 | |
| | | | | | | | |
Building Materials & Construction (1.56%) | | | | | | | | |
Vulcan Materials Co. | | | 1,039,200 | | | | 63,360,024 | |
| | | | | | | | |
Chemicals (11.01%) | | | | | | | | |
Air Products & Chemicals Inc. | | | 830,000 | | | | 99,575,100 | |
Croda International PLC | | | 25,800 | | | | 1,138,123 | |
E.I. du Pont de Nemours & Co. | | | 229,200 | | | | 15,885,852 | |
International Flavors & Fragrances Inc. | | | 525,000 | | | | 52,111,500 | |
Novozymes A/S B Shares | | | 135,300 | | | | 6,614,163 | |
Sigma-Aldrich Corp. | | | 2,750,000 | | | | 270,957,500 | |
| | | | | | | | |
| | | | | | | 446,282,238 | |
| | | | | | | | |
Computer Software & Services (1.40%) | | | | | | | | |
Automatic Data Processing Inc. | | | 109,900 | | | | 8,756,832 | |
Facebook Inc.
Class A (a) | | | 115,000 | | | | 7,279,500 | |
Google Inc. Class A (a) | | | 5,900 | | | | 3,372,735 | |
Google Inc. Class C (a) | | | 5,900 | | | | 3,309,782 | |
SAP AG | | | 444,800 | | | | 34,055,190 | |
| | | | | | | | |
| | | | | | | 56,774,039 | |
| | | | | | | | |
Computers (5.14%) | | | | | | | | |
Hewlett-Packard Co. | | | 3,019,400 | | | | 101,149,900 | |
International Business Machines Corp. | | | 580,000 | | | | 106,928,800 | |
| | | | | | | | |
| | | | | | | 208,078,700 | |
| | | | | | | | |
Consumer & Marketing (6.11%) | | | | | | | | |
AptarGroup Inc. | | | 677,405 | | | | 45,108,399 | |
Colgate-Palmolive Co. | | | 872,600 | | | | 59,685,840 | |
Procter & Gamble Co., The | | | 1,765,155 | | | | 142,606,872 | |
| | | | | | | | |
| | | | | | | 247,401,111 | |
| | | | | | | | |
Electronic/Electrical Manufacturing (5.68%) | | | | | | | | |
Agilent Technologies Inc. | | | 548,071 | | | | 31,207,163 | |
Emerson Electric Co. | | | 729,400 | | | | 48,672,862 | |
General Electric Co. | | | 3,848,900 | | | | 103,112,031 | |
Linear Technology Corp. | | | 1,023,400 | | | | 47,240,144 | |
| | | | | | | | |
| | | | | | | 230,232,200 | |
| | | | | | | | |
| | | | | | | | |
| | | Shares | | | Value | |
Common Stocks (Cont.) | | | | | | | | |
Financial Services (0.77%) | | | | | | | | |
Berkshire Hathaway Inc. Class A (a) | | | 162 | | | $ | 31,104,000 | |
Berkshire Hathaway Inc. Class B (a) | | | 143 | | | | 18,353 | |
| | | | | | | | |
| | | | | | | 31,122,353 | |
| | | | | | | | |
Health Care (12.90%) | | | | | | | | |
Abbott Laboratories | | | 847,500 | | | | 33,908,475 | |
AbbVie Inc. | | | 847,500 | | | | 46,044,675 | |
Amgen Inc. | | | 159,250 | | | | 18,471,408 | |
Baxter International Inc. | | | 43,600 | | | | 3,244,276 | |
Eli Lilly and Co. | | | 997,000 | | | | 59,680,420 | |
Johnson & Johnson | | | 2,481,600 | | | | 251,783,136 | |
Merck & Co. Inc. | | | 296,750 | | | | 17,169,955 | |
Novo Nordisk A/S Sponsored ADR | | | 105,600 | | | | 4,464,768 | |
Pfizer Inc. | | | 2,239,031 | | | | 66,342,489 | |
Zoetis Inc. | | | 705,696 | | | | 21,664,867 | |
| | | | | | | | |
| | | | | | | 522,774,469 | |
| | | | | | | | |
Machinery & Manufacturing (7.25%) | | | | | | | | |
3M Co. | | | 564,000 | | | | 80,398,200 | |
ASML Holding NV NY Reg. Shares | | | 55,050 | | | | 4,727,694 | |
Caterpillar Inc. | | | 877,700 | | | | 89,727,271 | |
Deere & Co. | | | 42,900 | | | | 3,911,193 | |
Donaldson Company Inc. | | | 112,800 | | | | 4,594,344 | |
HNI Corp. | | | 1,439,200 | | | | 53,869,256 | |
Illinois Tool Works Inc. | | | 652,500 | | | | 56,473,875 | |
| | | | | | | | |
| | | | | | | 293,701,833 | |
| | | | | | | | |
Media & Broadcasting (5.66%) | | | | | | | | |
Walt Disney Co., The | | | 2,728,640 | | | | 229,233,046 | |
| | | | | | | | |
Mining & Metals (3.14%) | | | | | | | | |
BHP Billiton PLC | | | 941,859 | | | | 29,476,864 | |
Nucor Corp. | | | 531,200 | | | | 26,894,656 | |
Rio Tinto PLC | | | 476,280 | | | | 24,393,622 | |
Rio Tinto PLC ADR | | | 907,200 | | | | 46,611,936 | |
| | | | | | | | |
| | | | | | | 127,377,078 | |
| | | | | | | | |
Oil & Gas (13.77%) | | | | | | | | |
BG Group PLC | | | 3,199,100 | | | | 65,442,818 | |
Chevron Corp. | | | 1,060,000 | | | | 130,157,400 | |
Devon Energy Corp. | | | 212,204 | | | | 15,681,876 | |
Dril-Quip Inc. (a) | | | 16,100 | | | | 1,645,742 | |
Exxon Mobil Corp. | | | 2,615,200 | | | | 262,906,056 | |
Imperial Oil Ltd. | | | 25,300 | | | | 1,245,519 | |
Noble Energy Inc. | | | 89,300 | | | | 6,435,851 | |
Royal Dutch Shell PLC ADR Class A | | | 487,900 | | | | 38,348,940 | |
Schlumberger Ltd. | | | 113,200 | | | | 11,777,328 | |
Spectra Energy Corp. | | | 399,950 | | | | 16,229,971 | |
Tidewater Inc. | | | 154,191 | | | | 8,036,435 | |
| | | | | | | | |
| | | | | | | 557,907,936 | |
| | | | | | | | |
Retailers (2.54%) | | | | | | | | |
Wal-Mart Stores Inc. | | | 1,339,100 | | | | 102,802,707 | |
| | | | | | | | |
| | |
| See accompanying notes to financial statements. | | 7 |
STATE FARM ASSOCIATES’ FUNDS TRUST GROWTH FUND
SCHEDULE OF INVESTMENTS (continued)
May 31, 2014
(Unaudited)
| | | | | | | | |
| | | Shares | | | Value | |
Common Stocks (Cont.) | | | | | | | | |
Telecom & Telecom Equipment (3.32%) | | | | | | | | |
AT&T Inc. | | | 2,140,534 | | | $ | 75,924,741 | |
Corning Inc. | | | 1,284,600 | | | | 27,361,980 | |
Verizon Communications Inc. | | | 624,900 | | | | 31,220,004 | |
| | | | | | | | |
| | | | | | | 134,506,725 | |
| | | | | | | | |
Transportation (0.54%) | | | | | | | | |
GATX Corp. | | | 190,700 | | | | 12,557,595 | |
Union Pacific Corp. | | | 47,575 | | | | 9,480,270 | |
| | | | | | | | |
| | | | | | | 22,037,865 | |
| | | | | | | | |
Utilities & Energy (0.54%) | | | | | | | | |
Duke Energy Corp. | | | 306,966 | | | | 21,819,143 | |
| | | | | | | | |
Total Common Stocks | | | | | | | | |
(cost $1,141,888,707) | | | | | | | 3,973,827,658 | |
| | | | | | | | |
Short-term Investments (1.57%) | | | | | | | | |
JPMorgan U.S. Government Money Market Fund | | | 63,624,434 | | | | 63,624,434 | |
| | | | | | | | |
Total Short-term Investments | | | | | | | | |
(cost $63,624,434) | | | | | | | 63,624,434 | |
| | | | | | | | |
TOTAL INVESTMENTS (99.65%) | | | | | | | | |
(cost $1,205,513,141) | | | | | | | 4,037,452,092 | |
OTHER ASSETS, NET OF LIABILITIES (0.35%) | | | | | | | 14,304,955 | |
| | | | | | | | |
NET ASSETS (100.00%) | | | | | | $ | 4,051,757,047 | |
| | | | | | | | |
| (a) | Non-income producing security. |
ADR - American Depositary Receipt
| | |
| 8 | | See accompanying notes to financial statements. |
STATE FARM ASSOCIATES’ FUNDS TRUST BALANCED FUND
SCHEDULE OF INVESTMENTS
May 31, 2014
(Unaudited)
| | | | | | | | |
| | | Shares | | | Value | |
Common Stocks (61.16%) | | | | | | | | |
Agriculture, Foods, & Beverage (7.17%) | | | | | | | | |
Archer-Daniels-Midland Co. | | | 940,561 | | | $ | 42,268,811 | |
Campbell Soup Co. | | | 26,000 | | | | 1,193,400 | |
Coca-Cola Co., The | | | 410,000 | | | | 16,773,100 | |
Kellogg Co. | | | 310,000 | | | | 21,383,800 | |
Nestle SA ADR | | | 252,500 | | | | 19,840,188 | |
PepsiCo Inc. | | | 110,100 | | | | 9,725,133 | |
Sysco Corp. | | | 165,300 | | | | 6,203,709 | |
| | | | | | | | |
| | | | | | | 117,388,141 | |
| | | | | | | | |
Banks (3.26%) | | | | | | | | |
M&T Bank Corp. | | | 58,300 | | | | 7,075,871 | |
Northern Trust Corp. | | | 104,700 | | | | 6,323,880 | |
U.S. Bancorp | | | 48,300 | | | | 2,037,777 | |
Wells Fargo & Co. | | | 747,600 | | | | 37,963,128 | |
| | | | | | | | |
| | | | | | | 53,400,656 | |
| | | | | | | | |
Building Materials & Construction (0.60%) | | | | | | | | |
Vulcan Materials Co. | | | 160,200 | | | | 9,767,394 | |
| | | | | | | | |
Chemicals (6.52%) | | | | | | | | |
Air Products & Chemicals Inc. | | | 230,000 | | | | 27,593,100 | |
Dow Chemical Co., The | | | 69,000 | | | | 3,596,280 | |
E.I. du Pont de Nemours & Co. | | | 132,105 | | | | 9,156,198 | |
International Flavors & Fragrances Inc. | | | 120,000 | | | | 11,911,200 | |
Novozymes A/S B Shares | | | 124,350 | | | | 6,078,871 | |
Sigma-Aldrich Corp. | | | 491,000 | | | | 48,378,230 | |
| | | | | | | | |
| | | | | | | 106,713,879 | |
| | | | | | | | |
Computer Software & Services (0.99%) | | | | | | | | |
Automatic Data Processing Inc. | | | 47,400 | | | | 3,776,832 | |
Facebook Inc. Class A (a) | | | 68,950 | | | | 4,364,535 | |
Google Inc. Class A (a) | | | 3,550 | | | | 2,029,358 | |
Google Inc. Class C (a) | | | 3,550 | | | | 1,991,479 | |
SAP AG | | | 52,800 | | | | 4,042,523 | |
| | | | | | | | |
| | | | | | | 16,204,727 | |
| | | | | | | | |
Computers (3.26%) | | | | | | | | |
Hewlett-Packard Co. | | | 754,000 | | | | 25,259,000 | |
International Business Machines Corp. | | | 152,100 | | | | 28,041,156 | |
| | | | | | | | |
| | | | | | | 53,300,156 | |
| | | | | | | | |
Consumer & Marketing (3.24%) | | | | | | | | |
AptarGroup Inc. | | | 134,100 | | | | 8,929,719 | |
Colgate-Palmolive Co. | | | 80,000 | | | | 5,472,000 | |
Procter & Gamble Co., The | | | 477,700 | | | | 38,593,383 | |
| | | | | | | | |
| | | | | | | 52,995,102 | |
| | | | | | | | |
Electronic/Electrical Manufacturing (2.75%) | | | | | | | | |
Agilent Technologies Inc. | | | 143,787 | | | | 8,187,232 | |
Emerson Electric Co. | | | 98,600 | | | | 6,579,578 | |
General Electric Co. | | | 796,300 | | | | 21,332,877 | |
KLA-Tencor Corp. | | | 45,100 | | | | 2,954,952 | |
Linear Technology Corp. | | | 130,100 | | | | 6,005,416 | |
| | | | | | | | |
| | | | | | | 45,060,055 | |
| | | | | | | | |
| | | | | | | | |
| | | Shares | | | Value | |
Common Stocks (Cont.) | | | | | | | | |
Financial Services (0.40%) | | | | | | | | |
Berkshire Hathaway Inc. Class A (a) | | | 34 | | | $ | 6,528,000 | |
Berkshire Hathaway Inc. Class B (a) | | | 533 | | | | 68,405 | |
| | | | | | | | |
| | | | | | | 6,596,405 | |
| | | | | | | | |
Health Care (8.90%) | | | | | | | | |
Abbott Laboratories | | | 92,000 | | | | 3,680,920 | |
AbbVie Inc. | | | 92,000 | | | | 4,998,360 | |
Allergan Inc. | | | 154,800 | | | | 25,922,808 | |
Amgen Inc. | | | 70,750 | | | | 8,206,292 | |
Baxter International Inc. | | | 29,100 | | | | 2,165,331 | |
Eli Lilly and Co. | | | 212,000 | | | | 12,690,320 | |
Johnson & Johnson | | | 417,700 | | | | 42,379,842 | |
Medtronic Inc. | | | 21,600 | | | | 1,318,248 | |
Merck & Co. Inc. | | | 103,200 | | | | 5,971,152 | |
Novo Nordisk A/S Sponsored ADR | | | 107,700 | | | | 4,553,556 | |
Pfizer Inc. | | | 728,140 | | | | 21,574,788 | |
Teva Pharmaceutical Industries Ltd. Sponsored ADR | | | 103,900 | | | | 5,245,911 | |
Zoetis Inc. | | | 229,495 | | | | 7,045,496 | |
| | | | | | | | |
| | | | | | | 145,753,024 | |
| | | | | | | | |
Machinery & Manufacturing (4.45%) | | | | | | | | |
3M Co. | | | 124,600 | | | | 17,761,728 | |
ASML Holding NV NY Reg. Shares | | | 32,500 | | | | 2,791,100 | |
Caterpillar Inc. | | | 262,400 | | | | 26,825,152 | |
Deere & Co. | | | 38,700 | | | | 3,528,279 | |
Donaldson Company Inc. | | | 115,800 | | | | 4,716,534 | |
HNI Corp. | | | 160,000 | | | | 5,988,800 | |
Illinois Tool Works Inc. | | | 130,600 | | | | 11,303,430 | |
| | | | | | | | |
| | | | | | | 72,915,023 | |
| | | | | | | | |
Media & Broadcasting (5.49%) | | | | | | | | |
Lee Enterprises Inc. Class A (a) | | | 84,000 | | | | 342,720 | |
Walt Disney Co., The | | | 1,065,995 | | | | 89,554,240 | |
| | | | | | | | |
| | | | | | | 89,896,960 | |
| | | | | | | | |
Mining & Metals (3.12%) | | | | | | | | |
BHP Billiton PLC | | | 169,900 | | | | 5,317,271 | |
Newmont Mining Corp. | | | 29,200 | | | | 668,388 | |
Nucor Corp. | | | 436,800 | | | | 22,115,184 | |
Rio Tinto PLC | | | 153,825 | | | | 7,878,452 | |
Rio Tinto PLC ADR | | | 293,000 | | | | 15,054,340 | |
| | | | | | | | |
| | | | | | | 51,033,635 | |
| | | | | | | | |
Oil & Gas (7.15%) | | | | | | | | |
BG Group PLC | | | 256,800 | | | | 5,253,264 | |
Chevron Corp. | | | 288,000 | | | | 35,363,520 | |
Devon Energy Corp. | | | 76,170 | | | | 5,628,963 | |
Exxon Mobil Corp. | | | 448,000 | | | | 45,037,440 | |
Noble Energy Inc. | | | 39,800 | | | | 2,868,386 | |
Royal Dutch Shell PLC ADR Class A | | | 216,400 | | | | 17,009,040 | |
Schlumberger Ltd. | | | 25,900 | | | | 2,694,636 | |
Spectra Energy Corp. | | | 79,650 | | | | 3,232,197 | |
| | | | | | | | |
| | | | | | | 117,087,446 | |
| | | | | | | | |
| | |
| See accompanying notes to financial statements. | | 9 |
STATE FARM ASSOCIATES’ FUNDS TRUST BALANCED FUND
SCHEDULE OF INVESTMENTS (continued)
May 31, 2014
(Unaudited)
| | | | | | | | |
| | | Shares | | | Value | |
Common Stocks (Cont.) | | | | | | | | |
Retailers (1.30%) | | | | | | | | |
Wal-Mart Stores Inc. | | | 276,700 | | | $ | 21,242,259 | |
| | | | | | | | |
Telecom & Telecom Equipment (1.82%) | | | | | | | | |
AT&T Inc. | | | 533,359 | | | | 18,918,244 | |
Corning Inc. | | | 372,300 | | | | 7,929,990 | |
Verizon Communications Inc. | | | 57,800 | | | | 2,887,688 | |
| | | | | | | | |
| | | | | | | 29,735,922 | |
| | | | | | | | |
Transportation (0.43%) | | | | | | | | |
GATX Corp. | | | 68,200 | | | | 4,490,970 | |
Union Pacific Corp. | | | 12,825 | | | | 2,555,638 | |
| | | | | | | | |
| | | | | | | 7,046,608 | |
| | | | | | | | |
Utilities & Energy (0.31%) | | | | | | | | |
Duke Energy Corp. | | | 72,333 | | | | 5,141,430 | |
| | | | | | | | |
Total Common Stocks | | | | | | | | |
(cost $299,557,418) | | | | | | | 1,001,278,822 | |
| | | | | | | | |
| | |
| | | Principal
amount | | | Value | |
Corporate Bonds (19.45%) | | | | | | | | |
Aerospace/Defense (0.06%) | | | | | | | | |
Lockheed Martin Corp. | | | | | | | | |
3.350%, 09/15/2021 | | $ | 1,000,000 | | | $ | 1,046,234 | |
| | | | | | | | |
Agriculture, Foods, & Beverage (1.41%) | | | | | | | | |
General Mills Inc. | | | | | | | | |
5.200%, 03/17/2015 | | | 500,000 | | | | 518,459 | |
Bottling Group LLC | | | | | | | | |
5.500%, 04/01/2016 | | | 1,000,000 | | | | 1,089,792 | |
Hershey Co. | | | | | | | | |
5.450%, 09/01/2016 | | | 500,000 | | | | 552,514 | |
Kraft Foods Inc. | | | | | | | | |
6.500%, 08/11/2017 | | | 1,000,000 | | | | 1,154,366 | |
Coca-Cola Co., The | | | | | | | | |
5.350%, 11/15/2017 | | | 2,000,000 | | | | 2,283,260 | |
Sysco Corp. | | | | | | | | |
5.250%, 02/12/2018 | | | 1,000,000 | | | | 1,126,110 | |
Pepsico Inc. | | | | | | | | |
5.000%, 06/01/2018 | | | 1,000,000 | | | | 1,131,492 | |
Coca-Cola Co., The | | | | | | | | |
2.450%, 11/01/2020 | | | 1,000,000 | | | | 1,010,831 | |
Kellogg Co. | | | | | | | | |
4.000%, 12/15/2020 | | | 2,000,000 | | | | 2,129,124 | |
Pepsico Inc. | | | | | | | | |
2.750%, 03/05/2022 | | | 1,000,000 | | | | 989,133 | |
Kellogg Co. | | | | | | | | |
3.125%, 05/17/2022 | | | 1,000,000 | | | | 1,004,744 | |
Sysco Corp. | | | | | | | | |
2.600%, 06/12/2022 | | | 1,000,000 | | | | 968,380 | |
Campbell Soup Co. | | | | | | | | |
2.500%, 08/02/2022 | | | 1,000,000 | | | | 943,341 | |
Kellogg Co. | | | | | | | | |
2.750%, 03/01/2023 | | | 1,000,000 | | | | 963,876 | |
| | | | | | | | |
| | | Principal
amount | | | Value | |
Corporate Bonds (Cont.) | | | | | | | | |
Agriculture, Foods, & Beverage (Cont.) | | | | | | | | |
Pepsico Inc. | | | | | | | | |
2.750%, 03/01/2023 | | $ | 1,000,000 | | | $ | 973,561 | |
Coca-Cola Co., The | | | | | | | | |
2.500%, 04/01/2023 | | | 2,000,000 | | | | 1,930,900 | |
Hershey Co. | | | | | | | | |
2.625%, 05/01/2023 | | | 1,300,000 | | | | 1,262,396 | |
Mondelez International Inc. | | | | | | | | |
4.000%, 02/01/2024 | | | 1,000,000 | | | | 1,035,127 | |
General Mills Inc. | | | | | | | | |
3.650%, 02/15/2024 | | | 1,000,000 | | | | 1,028,419 | |
Pepsico Inc. | | | | | | | | |
3.600%, 03/01/2024 | | | 1,000,000 | | | | 1,027,783 | |
| | | | | | | | |
| | | | | | | 23,123,608 | |
| | | | | | | | |
Automotive (0.44%) | | | | | | | | |
American Honda Finance Corp. | | | | | | | | |
2.125%, 10/10/2018 | | | 500,000 | | | | 509,138 | |
Toyota Motor Credit Corp. | | | | | | | | |
2.000%, 10/24/2018 | | | 1,000,000 | | | | 1,014,443 | |
2.100%, 01/17/2019 | | | 500,000 | | | | 506,010 | |
Johnson Controls Inc. | | | | | | | | |
4.250%, 03/01/2021 | | | 2,000,000 | | | | 2,174,760 | |
Toyota Motor Credit Corp. | | | | | | | | |
2.750%, 05/17/2021 | | | 1,000,000 | | | | 1,012,900 | |
3.300%, 01/12/2022 | | | 1,000,000 | | | | 1,030,057 | |
2.625%, 01/10/2023 | | | 1,000,000 | | | | 974,177 | |
| | | | | | | | |
| | | | | | | 7,221,485 | |
| | | | | | | | |
Banks (0.80%) | | | | | | | | |
US Bank NA | | | | | | | | |
4.950%, 10/30/2014 | | | 1,500,000 | | | | 1,529,109 | |
Wachovia Bank NA | | | | | | | | |
5.600%, 03/15/2016 | | | 750,000 | | | | 813,676 | |
Bank of America NA | | | | | | | | |
6.000%, 06/15/2016 | | | 1,000,000 | | | | 1,097,102 | |
5.300%, 03/15/2017 | | | 500,000 | | | | 551,000 | |
Wachovia Corp. | | | | | | | | |
5.750%, 06/15/2017 | | | 750,000 | | | | 850,354 | |
Wachovia Bank NA | | | | | | | | |
6.000%, 11/15/2017 | | | 500,000 | | | | 575,354 | |
Wells Fargo & Co. | | | | | | | | |
5.625%, 12/11/2017 | | | 500,000 | | | | 569,198 | |
Bank of New York Mellon Corp. | | | | | | | | |
2.100%, 08/01/2018 | | | 1,000,000 | | | | 1,015,402 | |
US Bancorp | | | | | | | | |
1.950%, 11/15/2018 | | | 1,000,000 | | | | 1,008,483 | |
Wells Fargo & Co. | | | | | | | | |
2.150%, 01/15/2019 | | | 500,000 | | | | 505,552 | |
Bank of New York Mellon Corp. | | | | | | | | |
2.200%, 03/04/2019 | | | 1,000,000 | | | | 1,010,301 | |
Wells Fargo & Co. | | | | | | | | |
3.000%, 01/22/2021 | | | 1,000,000 | | | | 1,020,840 | |
| | |
| 10 | | See accompanying notes to financial statements. |
STATE FARM ASSOCIATES’ FUNDS TRUST BALANCED FUND
SCHEDULE OF INVESTMENTS (continued)
May 31, 2014
(Unaudited)
| | | | | | | | |
| | | Principal
amount | | | Value | |
Corporate Bonds (Cont.) | | | | | | | | |
Banks (Cont.) | | | | | | | | |
US Bancorp | | | | | | | | |
3.000%, 03/15/2022 | | $ | 1,000,000 | | | $ | 1,011,863 | |
3.700%, 01/30/2024 | | | 500,000 | | | | 520,996 | |
Bank of New York Mellon Corp. | | | | | | | | |
3.650%, 02/04/2024 | | | 1,000,000 | | | | 1,034,604 | |
| | | | | | | | |
| | | | | | | 13,113,834 | |
| | | | | | | | |
Chemicals (0.50%) | | | | | | | | |
Praxair Inc. | | | | | | | | |
4.625%, 03/30/2015 | | | 1,000,000 | | | | 1,035,588 | |
5.375%, 11/01/2016 | | | 1,000,000 | | | | 1,100,613 | |
Monsanto Co. | | | | | | | | |
1.850%, 11/15/2018 | | | 500,000 | | | | 501,333 | |
Praxair Inc. | | | | | | | | |
2.450%, 02/15/2022 | | | 2,000,000 | | | | 1,929,240 | |
Monsanto Co. | | | | | | | | |
2.200%, 07/15/2022 | | | 1,300,000 | | | | 1,237,587 | |
PPG Industries Inc. | | | | | | | | |
2.700%, 08/15/2022 | | | 500,000 | | | | 483,238 | |
E.I. du Pont de Nemours and Co. | | | | | | | | |
2.800%, 02/15/2023 | | | 1,000,000 | | | | 978,962 | |
Praxair Inc. | | | | | | | | |
2.700%, 02/21/2023 | | | 1,000,000 | | | | 978,836 | |
| | | | | | | | |
| | | | | | | 8,245,397 | |
| | | | | | | | |
Commercial Service/Supply (0.16%) | | | | | | | | |
Pitney Bowes Inc. | | | | | | | | |
5.750%, 09/15/2017 | | | 500,000 | | | | 562,836 | |
Cintas Corp. No. 2 | | | | | | | | |
3.250%, 06/01/2022 | | | 2,000,000 | | | | 1,998,988 | |
| | | | | | | | |
| | | | | | | 2,561,824 | |
| | | | | | | | |
Computer Software & Services (0.79%) | | | | | | | | |
Oracle Corp. | | | | | | | | |
2.375%, 01/15/2019 | | | 1,000,000 | | | | 1,024,120 | |
Microsoft Corp. | | | | | | | | |
4.000%, 02/08/2021 | | | 2,000,000 | | | | 2,210,972 | |
2.125%, 11/15/2022 | | | 2,000,000 | | | | 1,909,662 | |
Intel Corp. | | | | | | | | |
2.700%, 12/15/2022 | | | 2,000,000 | | | | 1,951,112 | |
Microsoft Corp. | | | | | | | | |
2.375%, 05/01/2023 | | | 1,000,000 | | | | 962,298 | |
Texas Instruments Inc. | | | | | | | | |
2.250%, 05/01/2023 | | | 3,000,000 | | | | 2,801,181 | |
Oracle Corp. | | | | | | | | |
3.625%, 07/15/2023 | | | 1,000,000 | | | | 1,035,970 | |
Google Inc. | | | | | | | | |
3.375%, 02/25/2024 | | | 1,000,000 | | | | 1,027,378 | |
| | | | | | | | |
| | | | | | | 12,922,693 | |
| | | | | | | | |
Computers (0.37%) | | | | | | | | |
International Business Machines Corp. | | | | | | | | |
5.700%, 09/14/2017 | | | 1,000,000 | | | | 1,143,578 | |
| | | | | | | | |
| | | Principal
amount | | | Value | |
Corporate Bonds (Cont.) | | | | | | | | |
Computers (Cont.) | | | | | | | | |
1.875%, 05/15/2019 | | $ | 3,000,000 | | | $ | 3,001,077 | |
1.625%, 05/15/2020 | | | 2,000,000 | | | | 1,919,164 | |
| | | | | | | | |
| | | | | | | 6,063,819 | |
| | | | | | | | |
Consumer & Marketing (1.54%) | | | | | | | | |
Ecolab Inc. | | | | | | | | |
4.875%, 02/15/2015 | | | 1,000,000 | | | | 1,029,134 | |
Procter & Gamble Co., The | | | | | | | | |
3.150%, 09/01/2015 | | | 2,000,000 | | | | 2,071,142 | |
Kimberly-Clark Corp. | | | | | | | | |
6.125%, 08/01/2017 | | | 1,500,000 | | | | 1,732,926 | |
Danaher Corp. | | | | | | | | |
5.625%, 01/15/2018 | | | 1,000,000 | | | | 1,145,803 | |
McDonald’s Corp. | | | | | | | | |
5.350%, 03/01/2018 | | | 1,000,000 | | | | 1,143,193 | |
Unilever Capital Corp. | | | | | | | | |
2.200%, 03/06/2019 | | | 1,000,000 | | | | 1,017,348 | |
Kimberly-Clark Corp. | | | | | | | | |
1.900%, 05/22/2019 | | | 500,000 | | | | 501,008 | |
Unilever Capital Corp. | | | | | | | | |
4.250%, 02/10/2021 | | | 3,000,000 | | | | 3,315,900 | |
McDonald’s Corp. | | | | | | | | |
3.625%, 05/20/2021 | | | 2,000,000 | | | | 2,137,280 | |
2.625%, 01/15/2022 | | | 1,000,000 | | | | 988,248 | |
Procter & Gamble Co., The | | | | | | | | |
2.300%, 02/06/2022 | | | 1,000,000 | | | | 976,018 | |
Colgate-Palmolive Co. | | | | | | | | |
2.300%, 05/03/2022 | | | 2,000,000 | | | | 1,954,894 | |
1.950%, 02/01/2023 | | | 1,000,000 | | | | 923,541 | |
2.100%, 05/01/2023 | | | 2,000,000 | | | | 1,868,070 | |
NIKE Inc. | | | | | | | | |
2.250%, 05/01/2023 | | | 1,500,000 | | | | 1,420,832 | |
Kimberly-Clark Corp. | | | | | | | | |
2.400%, 06/01/2023 | | | 1,000,000 | | | | 953,231 | |
Procter & Gamble Co., The | | | | | | | | |
3.100%, 08/15/2023 | | | 2,000,000 | | | | 2,021,186 | |
| | | | | | | | |
| | | | | | | 25,199,754 | |
| | | | | | | | |
Electronic/Electrical Manufacturing (0.29%) | | | | | | | | |
Emerson Electric Co. | | | | | | | | |
5.375%, 10/15/2017 | | | 1,000,000 | | | | 1,133,058 | |
5.250%, 10/15/2018 | | | 500,000 | | | | 575,540 | |
General Electric Co. | | | | | | | | |
2.700%, 10/09/2022 | | | 1,000,000 | | | | 985,450 | |
Emerson Electric Co. | | | | | | | | |
2.625%, 02/15/2023 | | | 1,000,000 | | | | 976,168 | |
General Electric Co. | | | | | | | | |
3.375%, 03/11/2024 | | | 1,000,000 | | | | 1,018,998 | |
| | | | | | | | |
| | | | | | | 4,689,214 | |
| | | | | | | | |
Financial Services (0.50%) | | | | | | | | |
JPMorgan Chase Bank NA | | | | | | | | |
5.875%, 06/13/2016 | | | 500,000 | | | | 549,080 | |
| | |
| See accompanying notes to financial statements. | | 11 |
STATE FARM ASSOCIATES’ FUNDS TRUST BALANCED FUND
SCHEDULE OF INVESTMENTS (continued)
May 31, 2014
(Unaudited)
| | | | | | | | |
| | | Principal
amount | | | Value | |
Corporate Bonds (Cont.) | | | | | | | | |
Financial Services (Cont.) | | | | | | | | |
General Electric Capital Corp. | | | | | | | | |
5.375%, 10/20/2016 | | $ | 500,000 | | | $ | 552,914 | |
5.400%, 02/15/2017 | | | 500,000 | | | | 557,717 | |
5.625%, 09/15/2017 | | | 500,000 | | | | 567,015 | |
JPMorgan Chase Bank NA | | | | | | | | |
6.000%, 10/01/2017 | | | 1,500,000 | | | | 1,709,826 | |
General Electric Capital Corp. | | | | | | | | |
5.625%, 05/01/2018 | | | 500,000 | | | | 574,566 | |
JPMorgan Chase & Co. | | | | | | | | |
4.500%, 01/24/2022 | | | 1,000,000 | | | | 1,093,317 | |
General Electric Capital Corp. | | | | | | | | |
3.150%, 09/07/2022 | | | 1,000,000 | | | | 1,011,807 | |
JPMorgan Chase & Co. | | | | | | | | |
3.200%, 01/25/2023 | | | 1,000,000 | | | | 991,229 | |
3.625%, 05/13/2024 | | | 500,000 | | | | 503,644 | |
| | | | | | | | |
| | | | | | | 8,111,115 | |
| | | | | | | | |
Health Care (2.26%) | | | | | | | | |
AstraZeneca PLC | | | | | | | | |
5.400%, 06/01/2014 | | | 2,000,000 | | | | 2,000,000 | |
Baxter International Inc. | | | | | | | | |
1.850%, 01/15/2017 | | | 1,000,000 | | | | 1,024,283 | |
Eli Lilly and Co. | | | | | | | | |
5.200%, 03/15/2017 | | | 1,000,000 | | | | 1,113,775 | |
Amgen Inc. | | | | | | | | |
5.850%, 06/01/2017 | | | 1,000,000 | | | | 1,130,321 | |
Johnson & Johnson | | | | | | | | |
5.550%, 08/15/2017 | | | 1,000,000 | | | | 1,144,587 | |
AstraZeneca PLC | | | | | | | | |
5.900%, 09/15/2017 | | | 750,000 | | | | 860,752 | |
GlaxoSmithKline Capital Inc. | | | | | | | | |
5.650%, 05/15/2018 | | | 1,000,000 | | | | 1,155,254 | |
Baxter International Inc. | | | | | | | | |
5.375%, 06/01/2018 | | | 2,000,000 | | | | 2,283,550 | |
Eli Lilly and Co. | | | | | | | | |
1.950%, 03/15/2019 | | | 1,000,000 | | | | 1,003,750 | |
Pfizer Inc. | | | | | | | | |
2.100%, 05/15/2019 | | | 1,000,000 | | | | 1,008,108 | |
Amgen Inc. | | | | | | | | |
2.200%, 05/22/2019 | | | 1,000,000 | | | | 1,000,590 | |
AstraZeneca PLC | | | | | | | | |
1.950%, 09/18/2019 | | | 500,000 | | | | 498,314 | |
Becton Dickinson & Co. | | | | | | | | |
3.125%, 11/08/2021 | | | 1,000,000 | | | | 1,029,288 | |
Medtronic Inc. | | | | | | | | |
3.125%, 03/15/2022 | | | 2,000,000 | | | | 2,040,134 | |
Bristol-Myers Squibb Co. | | | | | | | | |
2.000%, 08/01/2022 | | | 1,500,000 | | | | 1,394,498 | |
Baxter International Inc. | | | | | | | | |
2.400%, 08/15/2022 | | | 1,000,000 | | | | 946,359 | |
Merck & Co. Inc. | | | | | | | | |
2.400%, 09/15/2022 | | | 1,000,000 | | | | 958,605 | |
Novartis Capital Corp. | | | | | | | | |
2.400%, 09/21/2022 | | | 2,000,000 | | | | 1,929,956 | |
GlaxoSmithKline Capital Inc. | | | | | | | | |
2.800%, 03/18/2023 | | | 1,000,000 | | | | 977,258 | |
| | | | | | | | |
| | | Principal
amount | | | Value | |
Corporate Bonds (Cont.) | | | | | | | | |
Health Care (Cont.) | | | | | | | | |
Medtronic Inc. | | | | | | | | |
2.750%, 04/01/2023 | | $ | 500,000 | | | $ | 486,672 | |
Merck & Co. Inc. | | | | | | | | |
2.800%, 05/18/2023 | | | 3,000,000 | | | | 2,935,308 | |
Baxter International Inc. | | | | | | | | |
3.200%, 06/15/2023 | | | 1,000,000 | | | | 993,226 | |
Pfizer Inc. | | | | | | | | |
3.000%, 06/15/2023 | | | 2,000,000 | | | | 1,987,892 | |
Johnson & Johnson | | | | | | | | |
3.375%, 12/05/2023 | | | 1,500,000 | | | | 1,571,883 | |
Medtronic Inc. | | | | | | | | |
3.625%, 03/15/2024 | | | 1,000,000 | | | | 1,036,548 | |
Novartis Capital Corp. | | | | | | | | |
3.400%, 05/06/2024 | | | 1,500,000 | | | | 1,529,506 | |
Pfizer Inc. | | | | | | | | |
3.400%, 05/15/2024 | | | 1,000,000 | | | | 1,017,150 | |
Stryker Corp. | | | | | | | | |
3.375%, 05/15/2024 | | | 1,000,000 | | | | 998,943 | |
Amgen Inc. | | | | | | | | |
3.625%, 05/22/2024 | | | 1,000,000 | | | | 1,009,647 | |
| | | | | | | | |
| | | | | | | 37,066,157 | |
| | | | | | | | |
Machinery & Manufacturing (1.71%) | | | | | | | | |
Cooper U.S. Inc. | | | | | | | | |
5.450%, 04/01/2015 | | | 500,000 | | | | 520,441 | |
Ingersoll-Rand Co. Ltd. | | | | | | | | |
4.750%, 05/15/2015 | | | 1,000,000 | | | | 1,039,642 | |
Eaton Corp. | | | | | | | | |
5.300%, 03/15/2017 | | | 1,500,000 | | | | 1,649,120 | |
John Deere Capital Corp. | | | | | | | | |
5.500%, 04/13/2017 | | | 1,000,000 | | | | 1,125,039 | |
Cooper U.S. Inc. | | | | | | | | |
6.100%, 07/01/2017 | | | 1,000,000 | | | | 1,129,734 | |
United Technologies Corp. | | | | | | | | |
5.375%, 12/15/2017 | | | 1,500,000 | | | | 1,711,500 | |
Dover Corp. | | | | | | | | |
5.450%, 03/15/2018 | | | 1,000,000 | | | | 1,135,255 | |
Caterpillar Financial Services Corp. | | | | | | | | |
5.450%, 04/15/2018 | | | 1,000,000 | | | | 1,145,000 | |
3M Co. | | | | | | | | |
1.625%, 06/15/2019 | | | 2,000,000 | | | | 1,985,322 | |
John Deere Capital Corp. | | | | | | | | |
2.800%, 03/04/2021 | | | 500,000 | | | | 507,782 | |
Caterpillar Inc. | | | | | | | | |
3.900%, 05/27/2021 | | | 2,000,000 | | | | 2,169,940 | |
John Deere Capital Corp. | | | | | | | | |
2.750%, 03/15/2022 | | | 1,000,000 | | | | 992,544 | |
Caterpillar Financial Services Corp. | | | | | | | | |
2.850%, 06/01/2022 | | | 1,000,000 | | | | 995,945 | |
United Technologies Corp. | | | | | | | | |
3.100%, 06/01/2022 | | | 1,000,000 | | | | 1,020,828 | |
Deere & Co. | | | | | | | | |
2.600%, 06/08/2022 | | | 2,000,000 | | | | 1,954,964 | |
Covidien International | | | | | | | | |
3.200%, 06/15/2022 | | | 2,000,000 | | | | 2,023,034 | |
| | |
| 12 | | See accompanying notes to financial statements. |
STATE FARM ASSOCIATES’ FUNDS TRUST BALANCED FUND
SCHEDULE OF INVESTMENTS (continued)
May 31, 2014
(Unaudited)
| | | | | | | | |
| | | Principal
amount | | | Value | |
Corporate Bonds (Cont.) | | | | | | | | |
Machinery & Manufacturing (Cont.) | | | | | | | | |
3M Co. | | | | | | | | |
2.000%, 06/26/2022 | | $ | 1,500,000 | | | $ | 1,428,879 | |
Thermo Fisher Scientific Inc. | | | | | | | | |
3.150%, 01/15/2023 | | | 1,000,000 | | | | 991,981 | |
Caterpillar Financial Services Corp. | | | | | | | | |
2.625%, 03/01/2023 | | | 1,000,000 | | | | 967,039 | |
Covidien International | | | | | | | | |
2.950%, 06/15/2023 | | | 1,000,000 | | | | 974,594 | |
Total Capital Canada Ltd. | | | | | | | | |
2.750%, 07/15/2023 | | | 500,000 | | | | 484,360 | |
Honeywell International Inc. | | | | | | | | |
3.350%, 12/01/2023 | | | 1,000,000 | | | | 1,022,304 | |
Caterpillar Inc. | | | | | | | | |
3.400%, 05/15/2024 | | | 1,000,000 | | | | 1,015,126 | |
| | | | | | | | |
| | | | | | | 27,990,373 | |
| | | | | | | | |
Media & Broadcasting (0.44%) | | | | | | | | |
Walt Disney Co., The | | | | | | | | |
6.000%, 07/17/2017 | | | 1,000,000 | | | | 1,149,252 | |
1.850%, 05/30/2019 | | | 2,000,000 | | | | 1,995,520 | |
Comcast Corp. | | | | | | | | |
3.125%, 07/15/2022 | | | 2,000,000 | | | | 2,035,596 | |
Reed Elsevier Capital | | | | | | | | |
3.125%, 10/15/2022 | | | 1,000,000 | | | | 983,163 | |
Comcast Corp. | | | | | | | | |
3.600%, 03/01/2024 | | | 1,000,000 | | | | 1,033,449 | |
| | | | | | | | |
| | | | | | | 7,196,980 | |
| | | | | | | | |
Mining & Metals (0.59%) | | | | | | | | |
BHP Billiton Finance USA Ltd. | | | | | | | | |
5.250%, 12/15/2015 | | | 2,000,000 | | | | 2,148,562 | |
5.400%, 03/29/2017 | | | 500,000 | | | | 560,890 | |
Rio Tinto Finance USA PLC | | | | | | | | |
2.250%, 12/14/2018 | | | 500,000 | | | | 507,398 | |
Alcoa Inc. | | | | | | | | |
5.720%, 02/23/2019 | | | 2,244,000 | | | | 2,476,593 | |
Rio Tinto Finance USA Ltd. | | | | | | | | |
3.500%, 11/02/2020 | | | 500,000 | | | | 522,876 | |
BHP Billiton Finance USA Ltd. | | | | | | | | |
3.250%, 11/21/2021 | | | 1,000,000 | | | | 1,033,031 | |
Alcoa Inc. | | | | | | | | |
5.870%, 02/23/2022 | | | 756,000 | | | | 819,920 | |
Rio Tinto Finance USA PLC | | | | | | | | |
2.875%, 08/21/2022 | | | 1,000,000 | | | | 974,736 | |
BHP Billiton Finance USA Ltd. | | | | | | | | |
3.850%, 09/30/2023 | | | 500,000 | | | | 525,292 | |
| | | | | | | | |
| | | | | | | 9,569,298 | |
| | | | | | | | |
Oil & Gas (1.67%) | | | | | | | | |
ConocoPhillips Canada | | | | | | | | |
5.625%, 10/15/2016 | | | 500,000 | | | | 558,153 | |
Shell International Finance | | | | | | | | |
5.200%, 03/22/2017 | | | 1,000,000 | | | | 1,117,801 | |
Total Capital International SA | | | | | | | | |
1.550%, 06/28/2017 | | | 1,500,000 | | | | 1,521,766 | |
| | | | | | | | |
| | | Principal
amount | | | Value | |
Corporate Bonds (Cont.) | | | | | | | | |
Oil & Gas (Cont.) | | | | | | | | |
Marathon Oil Corp. | | | | | | | | |
5.900%, 03/15/2018 | | $ | 1,000,000 | | | $ | 1,154,031 | |
ConocoPhillips | | | | | | | | |
5.200%, 05/15/2018 | | | 1,000,000 | | | | 1,133,174 | |
Shell International Finance | | | | | | | | |
1.900%, 08/10/2018 | | | 1,000,000 | | | | 1,015,855 | |
Total Capital SA | | | | | | | | |
2.125%, 08/10/2018 | | | 1,000,000 | | | | 1,022,488 | |
Chevron Corp. | | | | | | | | |
4.950%, 03/03/2019 | | | 3,000,000 | | | | 3,443,187 | |
BP Capital Markets PLC | | | | | | | | |
4.750%, 03/10/2019 | | | 3,000,000 | | | | 3,377,985 | |
Exxon Mobil Corp. | | | | | | | | |
1.819%, 03/15/2019 | | | 1,000,000 | | | | 1,011,807 | |
Shell International Finance | | | | | | | | |
4.300%, 09/22/2019 | | | 1,000,000 | | | | 1,114,703 | |
Trans-Canada Pipelines | | | | | | | | |
2.500%, 08/01/2022 | | | 2,000,000 | | | | 1,924,240 | |
Shell International Finance | | | | | | | | |
2.375%, 08/21/2022 | | | 1,000,000 | | | | 965,611 | |
Chevron Corp. | | | | | | | | |
2.355%, 12/05/2022 | | | 1,000,000 | | | | 960,127 | |
Total Capital International SA | | | | | | | | |
2.700%, 01/25/2023 | | | 1,000,000 | | | | 973,774 | |
Occidental Petroleum Corp. | | | | | | | | |
2.700%, 02/15/2023 | | | 2,000,000 | | | | 1,947,246 | |
Chevron Corp. | | | | | | | | |
3.191%, 06/24/2023 | | | 1,000,000 | | | | 1,014,137 | |
Schlumberger Investment | | | | | | | | |
3.650%, 12/01/2023 | | | 1,000,000 | | | | 1,040,977 | |
Exxon Mobil Corp. | | | | | | | | |
3.176%, 03/15/2024 | | | 2,000,000 | | | | 2,049,498 | |
| | | | | | | | |
| | | | | | | 27,346,560 | |
| | | | | | | | |
Retailers (1.09%) | | | | | | | | |
Lowe’s Companies Inc. | | | | | | | | |
5.000%, 10/15/2015 | | | 1,000,000 | | | | 1,060,687 | |
Home Depot Inc. | | | | | | | | |
5.400%, 03/01/2016 | | | 1,000,000 | | | | 1,085,076 | |
Target Corp. | | | | | | | | |
5.875%, 07/15/2016 | | | 1,300,000 | | | | 1,443,586 | |
Lowe’s Companies Inc. | | | | | | | | |
5.400%, 10/15/2016 | | | 1,000,000 | | | | 1,106,547 | |
Target Corp. | | | | | | | | |
5.375%, 05/01/2017 | | | 1,500,000 | | | | 1,683,600 | |
6.000%, 01/15/2018 | | | 500,000 | | | | 579,668 | |
Wal-Mart Stores Inc. | | | | | | | | |
5.800%, 02/15/2018 | | | 1,000,000 | | | | 1,160,438 | |
Home Depot Inc. | | | | | | | | |
2.250%, 09/10/2018 | | | 1,000,000 | | | | 1,028,355 | |
CVS Caremark Corp. | | | | | | | | |
2.250%, 12/05/2018 | | | 1,000,000 | | | | 1,014,466 | |
Wal-Mart Stores Inc. | | | | | | | | |
4.250%, 04/15/2021 | | | 2,000,000 | | | | 2,231,656 | |
| | |
| See accompanying notes to financial statements. | | 13 |
STATE FARM ASSOCIATES’ FUNDS TRUST BALANCED FUND
SCHEDULE OF INVESTMENTS (continued)
May 31, 2014
(Unaudited)
| | | | | | | | |
| | | Principal
amount | | | Value | |
Corporate Bonds (Cont.) | | | | | | | | |
Retailers (Cont.) | | | | | | | | |
Lowe’s Companies Inc. | | | | | | | | |
3.120%, 04/15/2022 | | $ | 1,000,000 | | | $ | 1,024,071 | |
Home Depot Inc. | | | | | | | | |
2.700%, 04/01/2023 | | | 2,000,000 | | | | 1,945,060 | |
Wal-Mart Stores Inc. | | | | | | | | |
2.550%, 04/11/2023 | | | 1,000,000 | | | | 969,227 | |
CVS Caremark Corp. | | | | | | | | |
4.000%, 12/05/2023 | | | 1,000,000 | | | | 1,055,682 | |
Wal-Mart Stores Inc. | | | | | | | | |
3.300%, 04/22/2024 | | | 500,000 | | | | 506,722 | |
| | | | | | | | |
| | | | | | | 17,894,841 | |
| | | | | | | | |
Telecom & Telecom Equipment (0.80%) | | | | | | | | |
AT&T Inc. | | | | | | | | |
2.375%, 11/27/2018 | | | 1,000,000 | | | | 1,020,858 | |
2.300%, 03/11/2019 | | | 1,000,000 | | | | 1,010,503 | |
Verizon Communications Inc. | | | | | | | | |
4.500%, 09/15/2020 | | | 1,000,000 | | | | 1,105,300 | |
3.450%, 03/15/2021 | | | 1,000,000 | | | | 1,036,813 | |
AT&T Inc. | | | | | | | | |
3.000%, 02/15/2022 | | | 3,000,000 | | | | 2,994,351 | |
Vodafone Group PLC | | | | | | | | |
2.500%, 09/26/2022 | | | 1,000,000 | | | | 934,790 | |
Verizon Communications Inc. | | | | | | | | |
2.450%, 11/01/2022 | | | 2,000,000 | | | | 1,886,298 | |
Vodafone Group PLC | | | | | | | | |
2.950%, 02/19/2023 | | | 1,000,000 | | | | 958,465 | |
Cisco Systems Inc. | | | | | | | | |
3.625%, 03/04/2024 | | | 1,000,000 | | | | 1,027,946 | |
Verizon Communications Inc. | | | | | | | | |
4.150%, 03/15/2024 | | | 1,000,000 | | | | 1,047,721 | |
| | | | | | | | |
| | | | | | | 13,023,045 | |
| | | | | | | | |
Transportation (0.56%) | | | | | | | | |
United Parcel Service Inc. | | | | | | | | |
5.500%, 01/15/2018 | | | 1,000,000 | | | | 1,148,275 | |
Union Pacific Corp. | | | | | | | | |
2.250%, 02/15/2019 | | | 1,000,000 | | | | 1,018,925 | |
Burlington North Santa Fe | | | | | | | | |
3.050%, 09/01/2022 | | | 500,000 | | | | 499,363 | |
United Parcel Service Inc. | | | | | | | | |
2.450%, 10/01/2022 | | | 2,000,000 | | | | 1,941,448 | |
Burlington North Santa Fe | | | | | | | | |
3.000%, 03/15/2023 | | | 1,500,000 | | | | 1,478,596 | |
Union Pacific Corp. | | | | | | | | |
2.750%, 04/15/2023 | | | 1,000,000 | | | | 980,097 | |
Norfolk Southern Corp. | | | | | | | | |
3.850%, 01/15/2024 | | | 1,000,000 | | | | 1,040,111 | |
Burlington North Santa Fe | | | | | | | | |
3.750%, 04/01/2024 | | | 1,000,000 | | | | 1,036,318 | |
| | | | | | | | |
| | | | | | | 9,143,133 | |
| | | | | | | | |
Utilities & Energy (3.47%) | | | | | | | | |
Commonwealth Edison Co. | | | | | | | | |
4.700%, 04/15/2015 | | | 1,000,000 | | | | 1,036,757 | |
| | | | | | | | |
| | | Principal
amount | | | Value | |
Corporate Bonds (Cont.) | | | | | | | | |
Utilities & Energy (Cont.) | | | | | | | | |
Georgia Power Co. | | | | | | | | |
5.250%, 12/15/2015 | | $ | 2,000,000 | | | $ | 2,138,672 | |
Union Electric Co. | | | | | | | | |
5.400%, 02/01/2016 | | | 2,000,000 | | | | 2,148,198 | |
Consolidated Edison Co. NY | | | | | | | | |
5.300%, 12/01/2016 | | | 1,000,000 | | | | 1,109,796 | |
Georgia Power Co. | | | | | | | | |
5.700%, 06/01/2017 | | | 1,000,000 | | | | 1,128,769 | |
MidAmerican Energy Co. | | | | | | | | |
5.950%, 07/15/2017 | | | 500,000 | | | | 569,605 | |
NSTAR Electric Co. | | | | | | | | |
5.625%, 11/15/2017 | | | 1,500,000 | | | | 1,704,522 | |
Northern States Power Co. | | | | | | | | |
5.250%, 03/01/2018 | | | 1,000,000 | | | | 1,130,574 | |
PECO Energy Co. | | | | | | | | |
5.350%, 03/01/2018 | | | 1,000,000 | | | | 1,130,300 | |
Commonwealth Edison Co. | | | | | | | | |
5.800%, 03/15/2018 | | | 500,000 | | | | 574,597 | |
Ameren Union Electric | | | | | | | | |
6.000%, 04/01/2018 | | | 1,000,000 | | | | 1,126,593 | |
Consolidated Edison Co. NY | | | | | | | | |
5.850%, 04/01/2018 | | | 500,000 | | | | 576,971 | |
Duke Energy Carolinas | | | | | | | | |
5.100%, 04/15/2018 | | | 1,000,000 | | | | 1,133,538 | |
Public Service Electric and Gas Co. | | | | | | | | |
5.300%, 05/01/2018 | | | 500,000 | | | | 570,684 | |
2.300%, 09/15/2018 | | | 1,000,000 | | | | 1,023,105 | |
MidAmerican Energy Co. | | | | | | | | |
2.400%, 03/15/2019 | | | 1,500,000 | | | | 1,535,670 | |
Public Service Electric and Gas Co. | | | | | | | | |
1.800%, 06/01/2019 | | | 1,000,000 | | | | 996,807 | |
Kentucky Utilities | | | | | | | | |
3.250%, 11/01/2020 | | | 500,000 | | | | 522,756 | |
Southern California Edison Co. | | | | | | | | |
3.875%, 06/01/2021 | | | 2,000,000 | | | | 2,167,756 | |
San Diego Gas & Electric Co. | | | | | | | | |
3.000%, 08/15/2021 | | | 500,000 | | | | 515,789 | |
Carolina Power & Light Co. | | | | | | | | |
2.800%, 05/15/2022 | | | 2,000,000 | | | | 2,000,376 | |
Consumers Energy Co. | | | | | | | | |
2.850%, 05/15/2022 | | | 1,000,000 | | | | 1,000,188 | |
Georgia Power Co. | | | | | | | | |
2.850%, 05/15/2022 | | | 1,000,000 | | | | 992,446 | |
Detroit Edison Co. | | | | | | | | |
2.650%, 06/15/2022 | | | 500,000 | | | | 494,381 | |
CenterPoint Energy Houston LLC | | | | | | | | |
2.250%, 08/01/2022 | | | 1,000,000 | | | | 962,442 | |
Baltimore Gas & Electric Co. | | | | | | | | |
2.800%, 08/15/2022 | | | 1,000,000 | | | | 987,887 | |
Northern States Power Co. | | | | | | | | |
2.150%, 08/15/2022 | | | 500,000 | | | | 475,370 | |
Pacific Gas & Electric | | | | | | | | |
2.450%, 08/15/2022 | | | 1,000,000 | | | | 957,650 | |
Ameren Illinois Co. | | | | | | | | |
2.700%, 09/01/2022 | | | 1,000,000 | | | | 990,682 | |
| | |
| 14 | | See accompanying notes to financial statements. |
STATE FARM ASSOCIATES’ FUNDS TRUST BALANCED FUND
SCHEDULE OF INVESTMENTS (continued)
May 31, 2014
(Unaudited)
| | | | | | | | |
| | | Principal
amount | | | Value | |
Corporate Bonds (Cont.) | | | | | | | | |
Utilities & Energy (Cont.) | | | | | | | | |
PPL Electric Utilities | | | | | | | | |
2.500%, 09/01/2022 | | $ | 1,000,000 | | | $ | 977,514 | |
PECO Energy Co. | | | | | | | | |
2.375%, 09/15/2022 | | | 500,000 | | | | 482,322 | |
Public Service Company of Colorado | | | | | | | | |
2.250%, 09/15/2022 | | | 1,000,000 | | | | 957,632 | |
Tampa Electric Co. | | | | | | | | |
2.600%, 09/15/2022 | | | 500,000 | | | | 481,597 | |
NSTAR Electric Co. | | | | | | | | |
2.375%, 10/15/2022 | | | 500,000 | | | | 476,411 | |
Public Service Company of Colorado | | | | | | | | |
2.500%, 03/15/2023 | | | 1,000,000 | | | | 963,343 | |
Virginia Electric & Power Co. | | | | | | | | |
2.750%, 03/15/2023 | | | 1,000,000 | | | | 984,054 | |
Northern States Power Co. | | | | | | | | |
2.600%, 05/15/2023 | | | 1,000,000 | | | | 965,962 | |
Public Service Electric and Gas Co. | | | | | | | | |
2.375%, 05/15/2023 | | | 2,000,000 | | | | 1,910,552 | |
Florida Power & Light Co. | | | | | | | | |
2.750%, 06/01/2023 | | | 2,000,000 | | | | 1,975,276 | |
Pacificorp | | | | | | | | |
2.950%, 06/01/2023 | | | 1,000,000 | | | | 993,181 | |
Pacific Gas & Electric | | | | | | | | |
3.250%, 06/15/2023 | | | 1,000,000 | | | | 1,002,545 | |
Consumers Energy Co. | | | | | | | | |
3.375%, 08/15/2023 | | | 1,000,000 | | | | 1,033,399 | |
Laclede Gas Co. | | | | | | | | |
3.400%, 08/15/2023 | | | 1,000,000 | | | | 1,021,626 | |
Duke Energy Ohio Inc. | | | | | | | | |
3.800%, 09/01/2023 | | | 1,000,000 | | | | 1,061,029 | |
San Diego Gas & Electric Co. | | | | | | | | |
3.600%, 09/01/2023 | | | 2,000,000 | | | | 2,103,228 | |
Public Service Company of New Hampshire | | | | | | | | |
3.500%, 11/01/2023 | | | 500,000 | | | | 517,145 | |
Delmarva Power & Light Co. | | | | | | | | |
3.500%, 11/15/2023 | | | 1,000,000 | | | | 1,034,420 | |
Alabama Power Co. | | | | | | | | |
3.550%, 12/01/2023 | | | 1,000,000 | | | | 1,043,688 | |
Virginia Electric & Power Co. | | | | | | | | |
3.450%, 02/15/2024 | | | 1,000,000 | | | | 1,024,257 | |
DTE Electric Co. | | | | | | | | |
3.650%, 03/15/2024 | | | 2,000,000 | | | | 2,092,608 | |
Potomac Electric Power Co. | | | | | | | | |
3.600%, 03/15/2024 | | | 1,000,000 | | | | 1,037,832 | |
Florida Power & Light Co. | | | | | | | | |
3.250%, 06/01/2024 | | | 1,000,000 | | | | 1,013,881 | |
| | | | | | | | |
| | | | | | | 56,856,383 | |
| | | | | | | | |
Total Corporate Bonds | | | | | | | | |
(cost $307,429,537) | | | | | | | 318,385,747 | |
| | | | | | | | |
Foreign Government Bonds (0.17%) | | | | | | | | |
Province of New Brunswick (Canada) | | | | | | | | |
5.200%, 02/21/2017 | | | 2,500,000 | | | | 2,792,525 | |
| | | | | | | | |
Total Foreign Government Bonds | | | | | | | | |
(cost $2,496,988) | | | | | | | 2,792,525 | |
| | | | | | | | |
| | | | | | | | |
| | | Principal
amount | | | Value | |
Government Agency Securities (b) (1.97%) | | | | | | | | |
Agency Commercial Mortgage-Backed Securities (1.67%) | | | | | | | | |
Federal Home Loan Mortgage Corp. | | | | | | | | |
2.789%, 01/25/2022 | | $ | 10,000,000 | | | $ | 10,182,220 | |
2.839%, 10/25/2022 | | | 9,774,835 | | | | 10,149,211 | |
Federal National Mortgage Association | | | | | | | | |
2.715%, 02/25/2022 | | | 7,000,000 | | | | 7,027,545 | |
| | | | | | | | |
| | | | | | | 27,358,976 | |
| | | | | | | | |
Agency Notes & Bonds (0.30%) | | | | | | | | |
Tennessee Valley Authority | | | | | | | | |
5.500%, 07/18/2017 | | | 1,000,000 | | | | 1,139,783 | |
1.750%, 10/15/2018 | | | 1,500,000 | | | | 1,519,127 | |
3.875%, 02/15/2021 | | | 2,000,000 | | | | 2,211,800 | |
| | | | | | | | |
| | | | | | | 4,870,710 | |
| | | | | | | | |
Total Government Agency Securities | | | | | | | | |
(cost $31,594,259) | | | | | | | 32,229,686 | |
| | | | | | | | |
U.S. Treasury Obligations (16.59%) | | | | | | | | |
U.S. Treasury Notes | | | | | | | | |
4.250%, 11/15/2014 | | | 15,000,000 | | | | 15,281,835 | |
4.000%, 02/15/2015 | | | 15,000,000 | | | | 15,412,500 | |
4.125%, 05/15/2015 | | | 20,000,000 | | | | 20,760,940 | |
4.500%, 02/15/2016 | | | 15,000,000 | | | | 16,081,050 | |
5.125%, 05/15/2016 | | | 20,000,000 | | | | 21,854,680 | |
4.625%, 02/15/2017 | | | 20,000,000 | | | | 22,129,680 | |
3.250%, 03/31/2017 | | | 5,000,000 | | | | 5,354,690 | |
3.500%, 02/15/2018 | | | 15,000,000 | | | | 16,313,670 | |
3.750%, 11/15/2018 | | | 10,000,000 | | | | 11,047,660 | |
3.125%, 05/15/2019 | | | 15,000,000 | | | | 16,153,125 | |
3.625%, 08/15/2019 | | | 10,000,000 | | | | 11,028,910 | |
3.375%, 11/15/2019 | | | 10,000,000 | | | | 10,911,720 | |
3.625%, 02/15/2020 | | | 10,000,000 | | | | 11,049,220 | |
3.500%, 05/15/2020 | | | 20,000,000 | | | | 21,960,940 | |
3.625%, 02/15/2021 | | | 10,000,000 | | | | 11,062,500 | |
2.000%, 11/15/2021 | | | 25,000,000 | | | | 24,794,925 | |
2.500%, 08/15/2023 | | | 10,000,000 | | | | 10,103,120 | |
2.750%, 11/15/2023 | | | 10,000,000 | | | | 10,296,880 | |
| | | | | | | | |
Total U.S. Treasury Obligations | | | | | | | | |
(cost $256,034,893) | | | | | | | 271,598,045 | |
| | | | | | | | |
| | |
| See accompanying notes to financial statements. | | 15 |
STATE FARM ASSOCIATES’ FUNDS TRUST BALANCED FUND
SCHEDULE OF INVESTMENTS (continued)
May 31, 2014
(Unaudited)
| | | | | | | | |
| | | Shares | | | Value | |
Short-term Investments (0.50%) | | | | | | | | |
JPMorgan U.S. Government Money Market Fund | | | 8,241,864 | | | $ | 8,241,864 | |
| | | | | | | | |
Total Short-term Investments | | | | | | | | |
(cost $8,241,864) | | | | | | | 8,241,864 | |
| | | | | | | | |
TOTAL INVESTMENTS (99.84%) | | | | | | | | |
(cost $905,354,959) | | | | | | | 1,634,526,689 | |
OTHER ASSETS, NET OF LIABILITIES (0.16%) | | | | | | | 2,585,333 | |
| | | | | | | | |
NET ASSETS (100.00%) | | | | | | $ | 1,637,112,022 | |
| | | | | | | | |
| (a) | Non-income producing security. |
| (b) | The obligations of these U.S. Government-sponsored entities are neither issued nor guaranteed by the United States Treasury. On September 7, 2008, the Federal Housing Finance Agency placed the Federal National Mortgage Association (“Fannie Mae”) and the Federal Home Loan Mortgage Corp. (“Freddie Mac”) into conservatorship. The United States Treasury has put in place a set of financing agreements to help ensure that these entities continue to meet their obligations to holders of bonds they have issued or guaranteed. |
ADR - American Depositary Receipt
| | |
| 16 | | See accompanying notes to financial statements. |
STATE FARM ASSOCIATES’ FUNDS TRUST INTERIM FUND
SCHEDULE OF INVESTMENTS
May 31, 2014
(Unaudited)
| | | | | | | | |
| | | Principal
amount | | | Value | |
U.S. Treasury Obligations (99.07%) | | | | | | | | |
U.S. Treasury Notes | | | | | | | | |
2.625%, 06/30/2014 | | $ | 5,000,000 | | | $ | 5,009,765 | |
4.250%, 08/15/2014 | | | 10,000,000 | | | | 10,085,550 | |
4.250%, 11/15/2014 | | | 5,000,000 | | | | 5,093,945 | |
4.000%, 02/15/2015 | | | 5,000,000 | | | | 5,137,500 | |
4.125%, 05/15/2015 | | | 5,000,000 | | | | 5,190,235 | |
1.750%, 07/31/2015 | | | 10,000,000 | | | | 10,187,110 | |
4.250%, 08/15/2015 | | | 20,000,000 | | | | 20,985,940 | |
2.625%, 02/29/2016 | | | 10,000,000 | | | | 10,410,550 | |
2.625%, 04/30/2016 | | | 20,000,000 | | | | 20,872,660 | |
1.500%, 06/30/2016 | | | 8,000,000 | | | | 8,181,248 | |
1.000%, 10/31/2016 | | | 10,000,000 | | | | 10,109,380 | |
3.000%, 02/28/2017 | | | 10,000,000 | | | | 10,628,120 | |
2.375%, 07/31/2017 | | | 10,000,000 | | | | 10,469,530 | |
1.875%, 08/31/2017 | | | 10,000,000 | | | | 10,309,380 | |
1.875%, 09/30/2017 | | | 10,000,000 | | | | 10,304,690 | |
1.875%, 10/31/2017 | | | 10,000,000 | | | | 10,303,120 | |
2.250%, 11/30/2017 | | | 10,000,000 | | | | 10,427,340 | |
2.750%, 12/31/2017 | | | 12,500,000 | | | | 13,253,900 | |
2.625%, 01/31/2018 | | | 12,000,000 | | | | 12,671,256 | |
2.750%, 02/28/2018 | | | 10,000,000 | | | | 10,609,380 | |
2.875%, 03/31/2018 | | | 10,000,000 | | | | 10,655,470 | |
2.625%, 04/30/2018 | | | 10,000,000 | | | | 10,558,590 | |
2.375%, 05/31/2018 | | | 10,000,000 | | | | 10,461,720 | |
2.375%, 06/30/2018 | | | 10,000,000 | | | | 10,462,500 | |
2.250%, 07/31/2018 | | | 10,000,000 | | | | 10,405,470 | |
1.375%, 11/30/2018 | | | 10,000,000 | | | | 10,000,780 | |
1.375%, 12/31/2018 | | | 10,000,000 | | | | 9,988,280 | |
1.250%, 01/31/2019 | | | 10,000,000 | | | | 9,916,410 | |
1.375%, 02/28/2019 | | | 10,000,000 | | | | 9,959,380 | |
1.500%, 03/31/2019 | | | 10,000,000 | | | | 10,010,160 | |
1.125%, 05/31/2019 | | | 10,000,000 | | | | 9,803,910 | |
1.250%, 10/31/2019 | | | 15,000,000 | | | | 14,689,455 | |
1.375%, 01/31/2020 | | | 10,000,000 | | | | 9,807,030 | |
1.875%, 06/30/2020 | | | 10,000,000 | | | | 10,025,000 | |
| | | | | | | | |
Total U.S. Treasury Obligations | | | | | | | | |
(cost $354,646,455) | | | | | | | 356,984,754 | |
| | | | | | | | |
| | |
| | | Shares | | | Value | |
Short-term Investments (0.20%) | | | | | | | | |
JPMorgan U.S. Government Money Market Fund | | | 735,714 | | | $ | 735,714 | |
| | | | | | | | |
Total Short-term Investments | | | | | | | | |
(cost $735,714) | | | | | | | 735,714 | |
| | | | | | | | |
TOTAL INVESTMENTS (99.27%) | | | | | | | | |
(cost $355,382,169) | | | | | | | 357,720,468 | |
OTHER ASSETS, NET OF LIABILITIES (0.73%) | | | | | | | 2,621,267 | |
| | | | | | | | |
NET ASSETS (100.00%) | | | | | | $ | 360,341,735 | |
| | | | | | | | |
| | |
| See accompanying notes to financial statements. | | 17 |
STATE FARM ASSOCIATES’ FUNDS TRUST MUNICIPAL BOND FUND
SCHEDULE OF INVESTMENTS
May 31, 2014
(Unaudited)
| | | | | | | | | | | | | | | | | | | | |
| | | Coupon
rate | | | Maturity date | | | Rating (a) | | | Principal
amount | | | Value | |
Long-term Municipal Bonds (96.30%) | | | | | | | | | | | | | | | | | | | | |
Alabama (1.54%) | | | | | | | | | | | | | | | | | | | | |
City of Phenix City, General Obligation Warrants, Series 2010-B | | | 5.000 | % | | | 02/01/2019 | | | | AA- | | | $ | 1,030,000 | | | $ | 1,192,606 | |
City of Athens, Alabama, General Obligation Warrants | | | 4.000 | % | | | 09/01/2019 | | | | AA- | | | | 1,145,000 | | | | 1,294,308 | |
Board of Education of the City of Hoover, Capital Outlay Warrants, Series 2005 | | | 3.500 | % | | | 02/15/2026 | | | | Aa2 | | | | 985,000 | | | | 987,197 | |
City of Madison (Alabama), General Obligation School Warrants, Series 2009 | | | 5.250 | % | | | 02/01/2027 | | | | Aa2 | | | | 2,540,000 | | | | 2,918,790 | |
City of Madison (Alabama), General Obligation School Warrants, Series 2009 | | | 5.250 | % | | | 02/01/2028 | | | | Aa2 | | | | 1,500,000 | | | | 1,721,520 | |
City of Florence (Alabama), Water and Sewer Revenue Warrants, Series 2011 | | | 5.000 | % | | | 08/15/2029 | | | | A1 | | | | 1,620,000 | | | | 1,814,141 | |
| | | | | | | | | | | | | | | | | | | | |
| | | | | | | | | | | | | | | | | | | 9,928,562 | |
| | | | | | | | | | | | | | | | | | | | |
Alaska (1.84%) | | | | | | | | | | | | | | | | | | | | |
Municipality of Anchorage, Alaska, Senior Lien Refunding Electric Revenue Bonds, 1996 | | | 6.500 | % | | | 12/01/2014 | | | | NR | | | | 2,000,000 | | | | 2,061,680 | |
Municipality of Anchorage, Alaska, Senior Lien Electric Revenue Bonds, 2009 Series A (Tax-Exempt) | | | 4.000 | % | | | 12/01/2021 | | | | A+ | | | | 1,955,000 | | | | 2,075,702 | |
Municipality of Anchorage, Alaska, Wastewater Revenue and Refunding Bonds, 2007 | | | 4.625 | % | | | 05/01/2022 | | | | AA | | | | 585,000 | | | | 632,479 | |
Municipality of Anchorage, Alaska, Water Revenue and Refunding Bonds, 2007 | | | 4.625 | % | | | 05/01/2022 | | | | AA | | | | 295,000 | | | | 317,028 | |
Municipality of Anchorage, Alaska, 2007 General Obligation Refunding Bonds, Series B (Schools) | | | 4.500 | % | | | 09/01/2022 | | | | AAA | | | | 1,000,000 | | | | 1,112,030 | |
Municipality of Anchorage, Alaska, Wastewater Revenue and Refunding Bonds, 2007 | | | 4.750 | % | | | 05/01/2023 | | | | AA | | | | 645,000 | | | | 699,244 | |
Municipality of Anchorage, Alaska, Water Revenue and Refunding Bonds, 2007 | | | 4.750 | % | | | 05/01/2023 | | | | AA | | | | 1,110,000 | | | | 1,194,182 | |
Municipality of Anchorage, Alaska, 2005 General Obligation Bonds, Series F (General Purpose) | | | 4.125 | % | | | 09/01/2023 | | | | Aa2 | | �� | | 1,000,000 | | | | 1,027,530 | |
Matanuska-Susitna Borough, Alaska, General Obligation School Bonds, 2009 Series A | | | 5.500 | % | | | 07/01/2025 | | | | Aa2 | | | | 1,190,000 | | | | 1,393,788 | |
Matanuska-Susitna Borough, Alaska, General Obligation Transportation System Bonds, 2014 Series A | | | 5.000 | % | | | 08/01/2031 | | | | AA+ | | | | 1,225,000 | | | | 1,390,461 | |
| | | | | | | | | | | | | | | | | | | | |
| | | | | | | | | | | | | | | | | | | 11,904,124 | |
| | | | | | | | | | | | | | | | | | | | |
Arizona (5.33%) | | | | | | | | | | | | | | | | | | | | |
Maricopa County, Arizona, Cave Creek Unified School District No. 93, School Improvement Bonds, Project of 2000, Series C (2006) | | | 4.250 | % | | | 07/01/2015 | | | | A+ | | | | 525,000 | | | | 546,892 | |
Tucson Unified School District No. 1 of Pima County, Arizona, Refunding Bonds, Tax-Exempt Series 2011 | | | 4.000 | % | | | 07/01/2016 | | | | Aa2 | | | | 450,000 | | | | 480,730 | |
Amphitheater Unified School District No. 10 of Pima County, Arizona, School Improvement Bonds, Project of 2007, Series B (2009), (Bank Qualified) | | | 4.000 | % | | | 07/01/2019 | | | | A+ | | | | 500,000 | | | | 550,820 | |
City of Glendale, Arizona, General Obligation Refunding Bonds, Series 2010 | | | 5.000 | % | | | 07/01/2019 | | | | BBB+ | | | | 4,180,000 | | | | 4,692,050 | |
Tucson Unified School District No. 1 of Pima County, Arizona, Refunding Bonds, Tax-Exempt Series 2011 | | | 5.000 | % | | | 07/01/2020 | | | | Aa2 | | | | 1,965,000 | | | | 2,314,141 | |
Amphitheater Unified School District No. 10 of Pima County, Arizona, School Improvement Bonds, Project of 2007, Series B (2009), (Bank Qualified) | | | 5.000 | % | | | 07/01/2021 | | | | A+ | | | | 500,000 | | | | 578,575 | |
Maricopa County, Arizona, Tempe Elementary School District No. 3, School Improvement Bonds, Project of 2005, Series B (2007) | | | 4.500 | % | | | 07/01/2021 | | | | Aa2 | | | | 2,500,000 | | | | 2,745,925 | |
Paradise Valley Unified School District No. 69 of Maricopa County, Arizona, School Improvement Bonds, Project of 2011, Series A (2012) | | | 3.000 | % | | | 07/01/2021 | | | | Aa2 | | | | 1,000,000 | | | | 1,043,460 | |
Tucson Unified School District No. 1 of Pima County, Arizona, School Improvement Bonds, Project of 2004, Series C (2007) | | | 4.500 | % | | | 07/01/2021 | | | | A+ | | | | 1,000,000 | | | | 1,091,390 | |
Paradise Valley Unified School District No. 69 of Maricopa County, Arizona, School Improvement Bonds, Project of 2011, Series A (2012) | | | 3.000 | % | | | 07/01/2022 | | | | Aa2 | | | | 720,000 | | | | 749,383 | |
Pima County, Arizona, Sewer System Revenue Obligations, Series 2012A | | | 5.000 | % | | | 07/01/2022 | | | | AA- | | | | 500,000 | | | | 597,740 | |
Pima County, Arizona, Sewer System Revenue Obligations, Series 2012A | | | 3.000 | % | | | 07/01/2022 | | | | AA- | | | | 495,000 | | | | 511,889 | |
Tucson Unified School District No. 1 of Pima County, Arizona, Refunding Bonds, Tax-Exempt Series 2011 | | | 5.000 | % | | | 07/01/2022 | | | | Aa2 | | | | 1,000,000 | | | | 1,195,480 | |
Amphitheater Unified School District No. 10 of Pima County, Arizona, School Improvement Bonds, Project of 2007, Series B (2009), (Bank Qualified) | | | 5.000 | % | | | 07/01/2023 | | | | A+ | | | | 1,000,000 | | | | 1,152,430 | |
Litchfield Elementary School District No. 79 of Maricopa County, Arizona, School Improvement Bonds, Project of 2009, Series A (2011) | | | 5.000 | % | | | 07/01/2023 | | | | Aa2 | | | | 1,000,000 | | | | 1,152,070 | |
Paradise Valley Unified School District No. 69 of Maricopa County, Arizona, School Improvement Bonds, Project of 2011, Series A (2012) | | | 3.000 | % | | | 07/01/2023 | | | | Aa2 | | | | 1,060,000 | | | | 1,096,167 | |
Paradise Valley Unified School District No. 69 of Maricopa County, Arizona, School Improvement Bonds, Project of 2011, Series B (2013) | | | 3.000 | % | | | 07/01/2023 | | | | Aa2 | | | | 1,255,000 | | | | 1,302,552 | |
Pima County, Arizona, General Obligation Bonds, Series 2009A | | | 4.000 | % | | | 07/01/2023 | | | | AA- | | | | 1,500,000 | | | | 1,618,485 | |
| | |
| 18 | | See accompanying notes to financial statements. |
STATE FARM ASSOCIATES’ FUNDS TRUST MUNICIPAL BOND FUND
SCHEDULE OF INVESTMENTS (continued)
May 31, 2014
(Unaudited)
| | | | | | | | | | | | | | | | | | | | |
| | | Coupon
rate | | | Maturity date | | | Rating (a) | | | Principal
amount | | | Value | |
Long-term Municipal Bonds (Cont.) | | | | | | | | | | | | | | | | | | | | |
Arizona (Cont.) | | | | | | | | | | | | | | | | | | | | |
Pima County, Arizona, Sewer System Revenue Obligations, Series 2012A | | | 5.000 | % | | | 07/01/2023 | | | | AA- | | | $ | 1,060,000 | | | $ | 1,250,970 | |
Pinal County Community College District of Pinal County, Arizona, General Obligation Bonds, Project of 2008, Series B (2012) | | | 4.500 | % | | | 07/01/2023 | | | | AA- | | | | 1,705,000 | | | | 1,874,886 | |
Salt River Project Agricultural Improvement and Power District, Arizona, Salt River Project Electric System Refunding Revenue Bonds, 2008 Series A | | | 5.000 | % | | | 01/01/2024 | | | | AA | | | | 1,500,000 | | | | 1,694,370 | |
Amphitheater Unified School District No. 10 of Pima County, Arizona, School Improvement Bonds, Project of 2007, Series B (2009), (Bank Qualified) | | | 5.000 | % | | | 07/01/2024 | | | | A+ | | | | 1,000,000 | | | | 1,150,330 | |
Phoenix Union High School District No. 210 of Maricopa County, Arizona, School Improvement Bonds, Project of 2011, Tax-Exempt Series A (2012) | | | 4.000 | % | | | 07/01/2024 | | | | Aa2 | | | | 1,165,000 | | | | 1,268,033 | |
Amphitheater Unified School District No. 10 of Pima County, Arizona, School Improvement Bonds, Project of 2007, Series D (2013) | | | 5.000 | % | | | 07/01/2026 | | | | A+ | | | | 555,000 | | | | 655,166 | |
Pima County, Arizona, General Obligation Bonds, Series 2012A | | | 4.000 | % | | | 07/01/2026 | | | | AA- | | | | 2,000,000 | | | | 2,126,200 | |
Amphitheater Unified School District No. 10 of Pima County, Arizona, School Improvement Bonds, Project of 2007, Series D (2013) | | | 5.000 | % | | | 07/01/2027 | | | | A+ | | | | 400,000 | | | | 468,336 | |
Salt River Project Agricultural Improvement and Power District, Arizona, Salt River Project Electric System Revenue Bonds, 2009
Series A | | | 5.000 | % | | | 01/01/2032 | | | | AA | | | | 500,000 | | | | 561,300 | |
| | | | | | | | | | | | | | | | | | | | |
| | | | | | | | | | | | | | | | | | | 34,469,770 | |
| | | | | | | | | | | | | | | | | | | | |
Arkansas (2.90%) | | | | | | | | | | | | | | | | | | | | |
Beaver Water District of Benton and Washington Counties, Arkansas, Water Refunding Revenue Bonds, Series 2010 | | | 3.000 | % | | | 11/15/2019 | | | | AA- | | | | 1,390,000 | | | | 1,476,166 | |
Little Rock School District of Pulaski County, Arkansas, Refunding Bonds | | | 3.000 | % | | | 02/01/2020 | | | | NR | | | | 1,250,000 | | | | 1,270,275 | |
Conway School District No. 1 of Faulkner County, Arkansas Refunding Bonds (Prerefunded to 02-01-2015 @ 100) (b) | | | 4.000 | % | | | 02/01/2021 | | | | NR | | | | 1,515,000 | | | | 1,552,542 | |
City of Little Rock, Arkansas, Sewer Construction Revenue Bonds, Series 2007A | | | 4.500 | % | | | 06/01/2021 | | | | Aa3 | | | | 1,320,000 | | | | 1,444,357 | |
City of Little Rock, Arkansas, Sewer Revenue Bonds, Series 2008 | | | 5.125 | % | | | 10/01/2022 | | | | Aa3 | | | | 100,000 | | | | 114,042 | |
Cabot School District No. 4 of Lonoke County, Arkansas, Refunding Bonds | | | 3.000 | % | | | 02/01/2023 | | | | NR | | | | 675,000 | | | | 690,964 | |
State of Arkansas, General Obligation Four-Lane Highway Construction and Improvement Bonds, Series 2013 | | | 3.500 | % | | | 06/15/2023 | | | | AA | | | | 6,000,000 | | | | 6,364,740 | |
City of Little Rock, Arkansas, Sewer Revenue Bonds, Series 2008 | | | 5.250 | % | | | 10/01/2024 | | | | Aa3 | | | | 335,000 | | | | 383,776 | |
Springdale School District No. 50 of Washington County, Arkansas Refunding and Construction Bonds, Series A | | | 4.000 | % | | | 06/01/2025 | | | | Aa2 | | | | 2,000,000 | | | | 2,123,980 | |
City of Fort Smith, Arkansas, Water and Sewer Refunding and Construction Revenue Bonds, Series 2008 | | | 5.250 | % | | | 10/01/2028 | | | | A | | | | 1,500,000 | | | | 1,729,230 | |
Rogers School District No. 30 of Benton County, Arkansas Refunding Bonds | | | 4.000 | % | | | 02/01/2030 | | | | NR | | | | 1,000,000 | | | | 1,032,440 | |
City of Little Rock, Arkansas, Sewer Revenue Bonds, Series 2008 | | | 5.500 | % | | | 10/01/2030 | | | | Aa3 | | | | 500,000 | | | | 574,160 | |
| | | | | | | | | | | | | | | | | | | | |
| | | | | | | | | | | | | | | | | | | 18,756,672 | |
| | | | | | | | | | | | | | | | | | | | |
California (2.91%) | | | | | | | | | | | | | | | | | | | | |
Golden West Schools Financing Authority, 2005 General Obligation Revenue Bonds | | | 5.000 | % | | | 08/01/2015 | | | | AA | | | | 1,515,000 | | | | 1,599,643 | |
Desert Water Agency Financing Corporation (Water System Improvement Project) Series 2007 | | | 4.500 | % | | | 05/01/2021 | | | | AA | | | | 740,000 | | | | 818,018 | |
Desert Water Agency Financing Corporation (Water System Improvement Project) Series 2007 | | | 4.625 | % | | | 05/01/2022 | | | | AA | | | | 770,000 | | | | 851,728 | |
Santa Barbara Schools Financing Authority 2007 General Obligation Revenue Bonds, Series A (Santa Barbara Elementary School District General Obligation Bond Refunding) (Santa Barbara County, California) | | | 4.750 | % | | | 08/01/2022 | | | | Aa3 | | | | 1,160,000 | | | | 1,252,696 | |
City of San Jose, General Obligation Bonds, Series 2007 (Parks and Public Safety Projects) | | | 4.500 | % | | | 09/01/2022 | | | | Aa1 | | | | 2,900,000 | | | | 3,043,753 | |
Desert Water Agency Financing Corporation (Water System Improvement Project) Series 2007 | | | 4.750 | % | | | 05/01/2023 | | | | AA | | | | 810,000 | | | | 896,548 | |
Kern High School District (Kern County, California), General Obligation Bonds, 2004 Election, Series C | | | 4.750 | % | | | 08/01/2023 | | | | A+ | | | | 1,685,000 | | | | 1,734,809 | |
Santa Barbara Schools Financing Authority 2007 General Obligation Revenue Bonds, Series B (Santa Barbara High School District General Obligation Bond Refunding) (Santa Barbara County, California) | | | 4.750 | % | | | 08/01/2023 | | | | Aa3 | | | | 1,435,000 | | | | 1,548,752 | |
Desert Water Agency Financing Corporation (Water System Improvement Project) Series 2007 | | | 4.750 | % | | | 05/01/2024 | | | | AA | | | | 845,000 | | | | 931,925 | |
| | |
| See accompanying notes to financial statements. | | 19 |
STATE FARM ASSOCIATES’ FUNDS TRUST MUNICIPAL BOND FUND
SCHEDULE OF INVESTMENTS (continued)
May 31, 2014
(Unaudited)
| | | | | | | | | | | | | | | | | | | | |
| | | Coupon
rate | | | Maturity date | | | Rating (a) | | | Principal
amount | | | Value | |
Long-term Municipal Bonds (Cont.) | | | | | | | | | | | | | | | | | | | | |
California (Cont.) | | | | | | | | | | | | | | | | | | | | |
Carmel Unified School District (Monterey County, California), General Obligation Bonds, Election of 2005, Series 2008 | | | 4.750 | % | | | 08/01/2025 | | | | AAA | | | $ | 575,000 | | | $ | 654,787 | |
Marin Community College District (Marin County, California), Election of 2004 General Obligation Bonds, Series C | | | 4.000 | % | | | 08/01/2025 | | | | AA | | | | 1,115,000 | | | | 1,231,662 | |
Marin Community College District (Marin County, California), Election of 2004 General Obligation Bonds, Series C | | | 4.250 | % | | | 08/01/2026 | | | | AA | | | | 1,275,000 | | | | 1,426,585 | |
Santa Barbara Community College District, (Santa Barbara County, California), General Obligation Bonds, Election of 2008, Series A | | | 5.250 | % | | | 08/01/2026 | | | | Aa1 | | | | 1,555,000 | | | | 1,781,066 | |
Santa Clara Unified School District (Santa Clara County, California), General Obligation Bonds, Election of 2004, Series 2008 | | | 4.875 | % | | | 07/01/2027 | | | | AA | | | | 1,000,000 | | | | 1,083,690 | |
| | | | | | | | | | | | | | | | | | | | |
| | | | | | | | | | | | | | | | | | | 18,855,662 | |
| | | | | | | | | | | | | | | | | | | | |
Colorado (2.46%) | | | | | | | | | | | | | | | | | | | | |
City of Colorado Springs, Colorado, Utilities System, Subordinate Lien Improvement Revenue Bonds, Series 2005B | | | 4.750 | % | | | 11/15/2015 | | | | Aa2 | | | | 510,000 | | | | 543,441 | |
Highlands Ranch Metropolitan District No. 2, (Douglas County, Colorado) General Obligation Refunding Bonds, Series 2005 | | | 4.500 | % | | | 06/15/2017 | | | | AA+ | | | | 1,705,000 | | | | 1,770,148 | |
City of Colorado Springs, Colorado, Utilities System Subordinate Lien Improvement Revenue Bonds, Series 2005B (Prerefunded to 11-15-2015 @ 100) (b) | | | 4.750 | % | | | 11/15/2019 | | | | Aa2 | | | | 600,000 | | | | 639,432 | |
El Paso County School District No. 20 (Academy), El Paso County, Colorado, General Obligation Refunding Bonds, Series 2012 | | | 3.000 | % | | | 12/15/2021 | | | | Aa2 | | | | 305,000 | | | | 324,465 | |
Jefferson County, Colorado, School District No. 1 | | | 5.000 | % | | | 12/15/2021 | | | | AA- | | | | 3,000,000 | | | | 3,612,300 | |
Cherry Creek School District No. 5, (Arapahoe County, Colorado), General Obligation Bonds, Series 2012B | | | 3.000 | % | | | 12/15/2023 | | | | AA | | | | 3,400,000 | | | | 3,521,890 | |
City of Aurora, Colorado, First-Lien Water Refunding Revenue Bonds, Series 2008A | | | 4.750 | % | | | 08/01/2025 | | | | Aa2 | | | | 1,500,000 | | | | 1,679,055 | |
City of Aurora, Colorado, First-Lien Water Refunding Revenue Bonds, Series 2008A | | | 4.750 | % | | | 08/01/2026 | | | | Aa2 | | | | 1,465,000 | | | | 1,635,497 | |
City of Aurora, Colorado, First-Lien Water Improvement Revenue Bonds, Series 2007A | | | 5.000 | % | | | 08/01/2032 | | | | Aa2 | | | | 2,000,000 | | | | 2,207,920 | |
| | | | | | | | | | | | | | | | | | | | |
| | | | | | | | | | | | | | | | | | | 15,934,148 | |
| | | | | | | | | | | | | | | | | | | | |
Connecticut (2.06%) | | | | | | | | | | | | | | | | | | | | |
Town of New Canaan, Connecticut, General Obligation Refunding Bonds, Issue of 2010, Series A | | | 5.000 | % | | | 06/15/2020 | | | | Aaa | | | | 500,000 | | | | 575,605 | |
Town of Trumbull, Connecticut, General Obligation Refunding Bonds, Issue of 2009 | | | 4.000 | % | | | 09/15/2020 | | | | Aa2 | | | | 525,000 | | | | 584,325 | |
Town of Stonington, Connecticut, General Obligation Bonds, Issue of 2012 | | | 3.000 | % | | | 04/01/2021 | | | | Aa1 | | | | 125,000 | | | | 132,405 | |
Town of Trumbull, Connecticut, General Obligation Refunding Bonds, Issue of 2009 | | | 4.000 | % | | | 09/15/2021 | | | | Aa2 | | | | 500,000 | | | | 550,655 | |
State of Connecticut, General Obligation Refunding Bonds, 2006 Series E | | | 4.500 | % | | | 12/15/2021 | | | | Aa3 | | | | 1,900,000 | | | | 2,071,741 | |
Town of Stonington, Connecticut, General Obligation Bonds, Issue of 2012 | | | 3.000 | % | | | 04/01/2022 | | | | Aa1 | | | | 600,000 | | | | 628,440 | |
Town of Darien, Connecticut, General Obligation Refunding Bonds, Issue of 2012, Series B | | | 2.000 | % | | | 08/01/2022 | | | | Aaa | | | | 1,550,000 | | | | 1,534,965 | |
City of Stamford, Connecticut, General Obligation Bonds, Issue of 2013 | | | 2.000 | % | | | 02/01/2023 | | | | Aa1 | | | | 1,650,000 | | | | 1,594,510 | |
Town of Bethel, Connecticut, General Obligation Sewer Bonds, Issue of 2009, Series B | | | 4.000 | % | | | 11/15/2023 | | | | AAA | | | | 620,000 | | | | 649,314 | |
City of Stamford, Connecticut, General Obligation Bonds, Issue of 2013 | | | 2.250 | % | | | 02/01/2024 | | | | Aa1 | | | | 2,000,000 | | | | 1,969,140 | |
Town of New Canaan, Connecticut, General Obligation Refunding Bonds, Issue of 2010, Series A | | | 4.000 | % | | | 06/15/2024 | | | | Aaa | | | | 1,000,000 | | | | 1,067,860 | |
State of Connecticut Health and Education Facilities Authority Revenue Bonds, Yale University Issue Series T-1 | | | 4.700 | % | | | 07/01/2029 | | | | Aaa | | | | 1,800,000 | | | | 1,965,060 | |
| | | | | | | | | | | | | | | | | | | | |
| | | | | | | | | | | | | | | | | | | 13,324,020 | |
| | | | | | | | | | | | | | | | | | | | |
Delaware (0.18%) | | | | | | | | | | | | | | | | | | | | |
State of Delaware, General Obligation Bonds, Series 2007A (Prerefunded to 05-01-2015 @ 100) (b) | | | 4.250 | % | | | 05/01/2021 | | | | Aaa | | | | 1,125,000 | | | | 1,167,064 | |
| | | | | | | | | | | | | | | | | | | | |
Florida (5.94%) | | | | | | | | | | | | | | | | | | | | |
City of Titusville, Florida, Water and Sewer Revenue Refunding Bonds, Series 2010 | | | 5.000 | % | | | 10/01/2018 | | | | A+ | | | | 1,000,000 | | | | 1,144,660 | |
Pasco County, Florida, Water and Sewer Refunding Revenue Bonds, Series 2006 | | | 4.500 | % | | | 10/01/2019 | | | | Aa2 | | | | 2,025,000 | | | | 2,135,423 | |
City of Pompano Beach, Florida, Water and Sewer Refunding Revenue Bonds Series 2006B | | | 4.500 | % | | | 07/01/2020 | | | | NR | | | | 1,220,000 | | | | 1,221,684 | |
JEA Florida, Water and Sewer System Revenue Bonds, 2010 Series D | | | 3.600 | % | | | 10/01/2020 | | | | Aa2 | | | | 1,220,000 | | | | 1,245,376 | |
| | |
| 20 | | See accompanying notes to financial statements. |
STATE FARM ASSOCIATES’ FUNDS TRUST MUNICIPAL BOND FUND
SCHEDULE OF INVESTMENTS (continued)
May 31, 2014
(Unaudited)
| | | | | | | | | | | | | | | | | | | | |
| | | Coupon
rate | | | Maturity date | | | Rating (a) | | | Principal
amount | | | Value | |
Long-term Municipal Bonds (Cont.) | | | | | | | | | | | | | | | | | | | | |
Florida (Cont.) | | | | | | | | | | | | | | | | | | | | |
Pasco County, Florida, Water and Sewer Revenue Bonds, Series 2009A | | | 5.000 | % | | | 10/01/2020 | | | | Aa2 | | | $ | 1,390,000 | | | $ | 1,625,647 | |
Fort Lauderdale, Florida, Water and Sewer Revenue Bonds | | | 4.000 | % | | | 03/01/2021 | | | | Aa1 | | | | 1,170,000 | | | | 1,296,933 | |
State of Florida, State Board of Education, Public Education Capital Outlay Bonds 2004 Series D | | | 4.375 | % | | | 06/01/2021 | | | | Aa1 | | | | 1,000,000 | | | | 1,080,130 | |
State of Florida, Department of Transportation, Turnpike Revenue Bonds, Series 2006A | | | 4.200 | % | | | 07/01/2021 | | | | Aa3 | | | | 3,500,000 | | | | 3,748,675 | |
City of Titusville, Florida, Water and Sewer Revenue Refunding Bonds, Series 2010 | | | 5.000 | % | | | 10/01/2021 | | | | A+ | | | | 600,000 | | | | 678,042 | |
Orlando Utilities Commission, Utility System Revenue Refunding Bonds, Series 2006 | | | 4.750 | % | | | 10/01/2021 | | | | Aa2 | | | | 1,000,000 | | | | 1,075,640 | |
Pasco County, Florida, Water and Sewer Revenue Bonds, Series 2009A | | | 4.000 | % | | | 10/01/2021 | | | | Aa2 | | | | 1,455,000 | | | | 1,589,718 | |
Fort Lauderdale, Florida, Water and Sewer Revenue Bonds | | | 4.000 | % | | | 03/01/2022 | | | | Aa1 | | | | 1,215,000 | | | | 1,336,597 | |
Coral Springs Improvement District, Subordinate Water and Sewer Revenue Bonds, Series 2007 | | | 4.375 | % | | | 06/01/2022 | | | | NR | | | | 1,500,000 | | | | 1,615,185 | |
Tohopekaliga Water Authority, Utility System Revenue Refunding Bonds, Series 2011A | | | 5.000 | % | | | 10/01/2022 | | | | Aa2 | | | | 365,000 | | | | 434,324 | |
Fort Lauderdale, Florida, Water and Sewer Revenue Bonds | | | 4.000 | % | | | 09/01/2023 | | | | Aa1 | | | | 1,290,000 | | | | 1,406,332 | |
Tohopekaliga Water Authority, Utility System Revenue Refunding Bonds, Series 2011A | | | 5.000 | % | | | 10/01/2023 | | | | Aa2 | | | | 200,000 | | | | 235,026 | |
City of Hollywood, Florida, General Obligation Bonds, Series 2005 | | | 5.000 | % | | | 06/01/2024 | | | | A1 | | | | 3,000,000 | | | | 3,100,260 | |
State of Florida, Department of Transportation, Turnpike Revenue Bonds, Series 2006A | | | 4.250 | % | | | 07/01/2024 | | | | Aa3 | | | | 2,500,000 | | | | 2,663,625 | |
State of Florida, Department of Transportation, Turnpike Revenue Bonds, Series 2010B | | | 5.000 | % | | | 07/01/2024 | | | | Aa3 | | | | 2,000,000 | | | | 2,318,200 | |
State of Florida, Department of Transportation, Turnpike Revenue Bonds, Series 2010B | | | 5.000 | % | | | 07/01/2025 | | | | Aa3 | | | | 2,485,000 | | | | 2,857,502 | |
City of West Palm Beach, Florida, Utility System Revenue Refunding Bonds, Series 2008A | | | 5.000 | % | | | 10/01/2026 | | | | Aa2 | | | | 2,000,000 | | | | 2,242,060 | |
Lee County, Florida, Water and Sewer Revenue Bonds, Series 2013A | | | 5.000 | % | | | 10/01/2026 | | | | Aa3 | | | | 400,000 | | | | 464,636 | |
State of Florida, State Board of Education, Public Education Capital Outlay Bonds, 2004
Series C | | | 4.750 | % | | | 06/01/2029 | | | | Aa1 | | | | 2,000,000 | | | | 2,095,660 | |
Lee County, Florida, Water and Sewer Revenue Bonds, Series 2013A | | | 5.000 | % | | | 10/01/2032 | | | | Aa3 | | | | 750,000 | | | | 842,625 | |
| | | | | | | | | | | | | | | | | | | | |
| | | | | | | | | | | | | | | | | | | 38,453,960 | |
| | | | | | | | | | | | | | | | | | | | |
Georgia (1.78%) | | | | | | | | | | | | | | | | | | | | |
Cherokee County Water and Sewerage Authority (Georgia), Water and Sewerage Revenue Refunding Bonds, Series 2010 | | | 3.500 | % | | | 08/01/2020 | | | | Aa2 | | | | 200,000 | | | | 215,132 | |
Cherokee County Water and Sewerage Authority (Georgia), Water and Sewerage Revenue Refunding Bonds, Series 2010 | | | 4.000 | % | | | 08/01/2021 | | | | Aa2 | | | | 250,000 | | | | 278,678 | |
Fayette County, Georgia, Water Revenue Bond, Series 2009 | | | 5.000 | % | | | 10/01/2021 | | | | Aa2 | | | | 1,790,000 | | | | 2,091,454 | |
Henry County and Henry County Water and Sewerage Authority (Georgia), Water and Sewerage Revenue Refunding Bonds, Series 2010 | | | 5.000 | % | | | 02/01/2022 | | | | Aa2 | | | | 1,000,000 | | | | 1,187,500 | |
Fulton County, Georgia, Water and Sewerage Revenue Refunding Bonds, Series 2011 | | | 5.000 | % | | | 01/01/2024 | | | | Aa3 | | | | 1,660,000 | | | | 1,930,912 | |
Fayette County, Georgia, Water Revenue Bond, Series 2009 | | | 4.375 | % | | | 10/01/2024 | | | | Aa2 | | | | 750,000 | | | | 836,318 | |
Unified Government of Athens-Clarke County, Georgia, Water and Sewerage Revenue Bonds, Series 2008 | | | 5.625 | % | | | 01/01/2028 | | | | AA- | | | | 1,000,000 | | | | 1,148,270 | |
Forsyth County, Georgia, General Obligation Bonds, Series 2008A | | | 5.000 | % | | | 03/01/2028 | | | | AA+ | | | | 1,000,000 | | | | 1,138,440 | |
Spalding County Water and Sewerage Facilities Authority (Georgia), Revenue Bonds, Series 2008 | | | 6.125 | % | | | 09/01/2028 | | | | A1 | | | | 2,300,000 | | | | 2,692,081 | |
| | | | | | | | | | | | | | | | | | | | |
| | | | | | | | | | | | | | | | | | | 11,518,785 | |
| | | | | | | | | | | | | | | | | | | | |
Hawaii (0.81%) | | | | | | | | | | | | | | | | | | | | |
City and County of Honolulu, General Obligation Bonds, Series 2005F (Prerefunded to
07-01-2015 @ 100) (b) | | | 5.000 | % | | | 07/01/2026 | | | | Aa1 | | | | 2,140,000 | | | | 2,250,253 | |
State of Hawaii Highway Revenue Bonds Series 2008 | | | 5.750 | % | | | 01/01/2027 | | | | Aa2 | | | | 2,000,000 | | | | 2,338,700 | |
County of Hawaii, General Obligation Bonds, 2013 Series A | | | 5.000 | % | | | 09/01/2031 | | | | AA- | | | | 575,000 | | | | 656,138 | |
| | | | | | | | | | | | | | | | | | | | |
| | | | | | | | | | | | | | | | | | | 5,245,091 | |
| | | | | | | | | | | | | | | | | | | | |
Idaho (0.17%) | | | | | | | | | | | | | | | | | | | | |
Independent School District of Boise City, Ada and Boise Counties, Idaho, General Obligation Bonds, Series 2007 | | | 4.625 | % | | | 08/01/2022 | | | | AA | | | | 1,000,000 | | | | 1,108,450 | |
| | | | | | | | | | | | | | | | | | | | |
Illinois (2.25%) | | | | | | | | | | | | | | | | | | | | |
Community Unit School District Number 200-U Will County, Illinois (Prerefunded to
11-01-2015 @ 100) (b) | | | 5.000 | % | | | 11/01/2019 | | | | A1 | | | | 1,650,000 | | | | 1,761,326 | |
| | |
| See accompanying notes to financial statements. | | 21 |
STATE FARM ASSOCIATES’ FUNDS TRUST MUNICIPAL BOND FUND
SCHEDULE OF INVESTMENTS (continued)
May 31, 2014
(Unaudited)
| | | | | | | | | | | | | | | | | | | | |
| | | Coupon
rate | | | Maturity date | | | Rating (a) | | | Principal
amount | | | Value | |
Long-term Municipal Bonds (Cont.) | | | | | | | | | | | | | | | | | | | | |
Illinois (Cont.) | | | | | | | | | | | | | | | | | | | | |
The Illinois State Toll Highway Authority, Toll Highway Senior Priority Revenue Bonds, 2005 Series A (Prerefunded to 07-01-2015 @
100) (b) | | | 4.125 | % | | | 01/01/2020 | | | | Aa3 | | | $ | 5,000,000 | | | $ | 5,210,650 | |
School District Number 161, Will County, Illinois, General Obligation School Bonds, Series 2005 | | | 5.000 | % | | | 01/01/2020 | | | | Aa2 | | | | 1,360,000 | | | | 1,393,252 | |
County of Lake, Illinois, Water and Sewer System Revenue Refunding Bonds Series B of 2006 | | | 4.375 | % | | | 12/01/2020 | | | | Aa1 | | | | 1,465,000 | | | | 1,590,536 | |
Community Consolidated School District Number 201, Grundy, Kendall and Will Counties, Illinois, (Minooka), General Obligation Refunding School Bonds, Series 2010A | | | 5.250 | % | | | 10/15/2022 | | | | AA- | | | | 1,200,000 | | | | 1,338,480 | |
Community Consolidated School District Number 201, Grundy, Kendall and Will Counties, Illinois, (Minooka), General Obligation Refunding School Bonds, Series 2010A | | | 5.250 | % | | | 10/15/2023 | | | | AA- | | | | 2,000,000 | | | | 2,218,220 | |
School District Number 161, Will County, Illinois, General Obligation School Bonds, Series 2005 (Prerefunded to 01-01-2015 @ 100) (b) | | | 5.000 | % | | | 01/01/2024 | | | | Aa2 | | | | 130,000 | | | | 133,600 | |
School District Number 161, Will County, Illinois, General Obligation School Bonds, Series 2005 | | | 5.000 | % | | | 01/01/2024 | | | | Aa2 | | | | 870,000 | | | | 890,358 | |
| | | | | | | | | | | | | | | | | | | | |
| | | | | | | | | | | | | | | | | | | 14,536,422 | |
| | | | | | | | | | | | | | | | | | | | |
Indiana (2.01%) | | | | | | | | | | | | | | | | | | | | |
Zionsville Community Schools Building Corporation, Boone County, Indiana, First Mortgage Bonds, Series 2005A | | | 5.000 | % | | | 07/15/2018 | | | | AA- | | | | 1,665,000 | | | | 1,746,385 | |
Town of Zionsville, Indiana, Sewage Works Revenue Bonds of 2010, Series A | | | 2.800 | % | | | 07/15/2019 | | | | AA- | | | | 230,000 | | | | 242,917 | |
City of Bloomington, Indiana, Waterworks Revenue Bonds of 2011, Series B | | | 3.500 | % | | | 07/01/2020 | | | | AA- | | | | 910,000 | | | | 955,737 | |
Lebanon Middle School Building Corporation, Lebanon, Indiana, Unlimited Ad Valorem Property Tax First Mortgage Bonds, Series 2011 | | | 4.000 | % | | | 07/10/2020 | | | | A+ | | | | 2,075,000 | | | | 2,267,249 | |
Town of Zionsville, Indiana, Sewage Works Revenue Bonds of 2010, Series A | | | 3.000 | % | | | 07/15/2020 | | | | AA- | | | | 245,000 | | | | 259,876 | |
City of Fort Wayne, Indiana, Sewage Works Revenue Bonds of 2010 | | | 4.500 | % | | | 08/01/2020 | | | | Aa3 | | | | 2,075,000 | | | | 2,365,085 | |
Ball State University Board of Trustees, Ball State University Student Fee Bonds, Series 0 | | | 5.250 | % | | | 07/01/2022 | | | | Aa3 | | | | 500,000 | | | | 557,480 | |
City of Noblesville, Indiana, Sewage Works Revenue Bonds of 2011 | | | 4.000 | % | | | 07/01/2022 | | | | Aa2 | | | | 185,000 | | | | 196,953 | |
Ball State University Board of Trustees, Ball State University Student Fee Bonds, Series 0 | | | 5.250 | % | | | 07/01/2023 | | | | Aa3 | | | | 1,060,000 | | | | 1,178,953 | |
City of Noblesville, Indiana, Sewage Works Revenue Bonds of 2011 | | | 4.250 | % | | | 07/01/2023 | | | | Aa2 | | | | 215,000 | | | | 231,871 | |
City of Noblesville, Indiana, Sewage Works Revenue Bonds of 2011 | | | 4.375 | % | | | 07/01/2024 | | | | Aa2 | | | | 210,000 | | | | 226,750 | |
The Trustees of Ivy Tech Community College of Indiana, Ivy Tech Community College Student Fee Bonds, Series K | | | 5.000 | % | | | 07/01/2024 | | | | AA- | | | | 1,000,000 | | | | 1,080,860 | |
City of Fort Wayne, Indiana, Sewage Works Revenue Bonds of 2010 | | | 4.500 | % | | | 08/01/2025 | | | | Aa3 | | | | 1,530,000 | | | | 1,672,520 | |
| | | | | | | | | | | | | | | | | | | | |
| | | | | | | | | | | | | | | | | | | 12,982,636 | |
| | | | | | | | | | | | | | | | | | | | |
Iowa (2.61%) | | | | | | | | | | | | | | | | | | | | |
City of Des Moines, Iowa, General Obligation Bonds, Series 2007C Urban Renewal | | | 4.000 | % | | | 06/01/2015 | | | | Aa2 | | | | 990,000 | | | | 1,027,353 | |
Board of Regents, State of Iowa, Utility System Revenue Bonds, Series S.U.I. 2006 (Escrowed to maturity) (b) | | | 4.000 | % | | | 11/01/2015 | | | | Aa1 | | | | 975,000 | | | | 1,027,075 | |
Black Hawk County, Iowa, General Obligation Bonds, Series 2008B | | | 4.600 | % | | | 06/01/2018 | | | | Aa2 | | | | 520,000 | | | | 540,483 | |
City of West Des Moines, Iowa, General Obligation Bonds, Series 2004A (Prerefunded to 06-01-2014 @ 100) (b) | | | 5.000 | % | | | 06/01/2018 | | | | Aaa | | | | 850,000 | | | | 850,000 | |
City of Des Moines, Iowa, General Obligation Refunding Bonds, Series 2010B (Urban Renewal) | | | 4.000 | % | | | 06/01/2019 | | | | Aa2 | | | | 1,190,000 | | | | 1,312,630 | |
Clear Creek Amana Community School District, Iowa, General Obligation School Bonds | | | 4.625 | % | | | 06/01/2019 | | | | Aa3 | | | | 1,200,000 | | | | 1,200,000 | |
City of Des Moines, Iowa, General Obligation Refunding Bonds, Series 2010B (Urban Renewal) | | | 4.000 | % | | | 06/01/2022 | | | | Aa2 | | | | 1,350,000 | | | | 1,449,333 | |
Board of Regents, State of Iowa, Academic Building Revenue Bonds, Series S.U.I. 2008 | | | 4.625 | % | | | 07/01/2025 | | | | AA | | | | 1,775,000 | | | | 1,978,557 | |
Board of Regents, State of Iowa, Academic Building Revenue Bonds, Series S.U.I. 2008 | | | 4.625 | % | | | 07/01/2026 | | | | AA | | | | 1,750,000 | | | | 1,943,392 | |
Ankeny Community School District Polk County, Iowa, General Obligation School Bonds, Series 2009 | | | 5.000 | % | | | 06/01/2027 | | | | Aa3 | | | | 2,000,000 | | | | 2,222,680 | |
Board of Regents, State of Iowa, Academic Building Revenue Bonds, Series S.U.I. 2008 | | | 4.750 | % | | | 07/01/2027 | | | | AA | | | | 1,950,000 | | | | 2,177,468 | |
Waukee Community School District, Iowa, General Obligation School Bonds, Series 2009 | | | 5.000 | % | | | 06/01/2028 | | | | Aa2 | | | | 1,000,000 | | | | 1,154,180 | |
| | | | | | | | | | | | | | | | | | | | |
| | | | | | | | | | | | | | | | | | | 16,883,151 | |
| | | | | | | | | | | | | | | | | | | | |
Kansas (3.84%) | | | | | | | | | | | | | | | | | | | | |
Kansas Development Finance Authority, Kansas Water Pollution Control Revolving Fund Revenue Bonds | | | 5.500 | % | | | 05/01/2015 | | | | Aaa | | | | 2,000,000 | | | | 2,097,080 | |
| | |
| 22 | | See accompanying notes to financial statements. |
STATE FARM ASSOCIATES’ FUNDS TRUST MUNICIPAL BOND FUND
SCHEDULE OF INVESTMENTS (continued)
May 31, 2014
(Unaudited)
| | | | | | | | | | | | | | | | | | | | |
| | | Coupon
rate | | | Maturity date | | | Rating (a) | | | Principal
amount | | | Value | |
Long-term Municipal Bonds (Cont.) | | | | | | | | | | | | | | | | | | | | |
Kansas (Cont.) | | | | | | | | | | | | | | | | | | | | |
City of Overland Park, Kansas Internal Improvement Bonds, Series 2006A (Prerefunded to 09-01-2014 @ 100) (b) | | | 4.250 | % | | | 09/01/2016 | | | | Aaa | | | $ | 1,220,000 | | | $ | 1,232,224 | |
Unified School District No. 263, Sedgwick County, Kansas (Mulvane) General Obligation School Building Bonds, Series 2004 (Prerefunded to 09-01-2014 @ 100) (b) | | | 5.000 | % | | | 09/01/2018 | | | | A1 | | | | 1,000,000 | | | | 1,011,710 | |
Unified School District No. 265, Sedgwick County, Kansas (Goddard), General Obligation Refunding and Improvement Bonds Series 2005 (Prerefunded to 10-01-2015 @ 100) (b) | | | 5.000 | % | | | 10/01/2018 | | | | Aa3 | | | | 540,000 | | | | 574,652 | |
Unified School District No. 265, Sedgwick County, Kansas (Goddard), General Obligation Refunding and Improvement Bonds Series 2005 (Prerefunded to 10-01-2015 @ 100) (b) | | | 5.000 | % | | | 10/01/2018 | | | | Aa3 | | | | 370,000 | | | | 393,488 | |
City of Wichita, Kansas, General Obligation Bonds, Series 790 (Prerefunded to 09-01-2014 @ 101) (b) | | | 4.375 | % | | | 09/01/2019 | | | | Aa1 | | | | 980,000 | | | | 999,796 | |
Johnson County, Kansas, Internal Improvement Bonds, Series 2007B, (General Obligation Payable from Unlimited Ad Valorem Taxes) | | | 4.500 | % | | | 09/01/2022 | | | | Aaa | | | | 1,000,000 | | | | 1,104,600 | |
Unified School District No. 512, Johnson County, Kansas, (Shawnee Mission), General Obligation Refunding Bonds, Series 2012-A | | | 2.000 | % | | | 10/01/2022 | | | | Aaa | | | | 2,010,000 | | | | 1,946,645 | |
City of Lawrence, Kansas, Water and Sewage System, Improvement Revenue Bonds, Series 2007 | | | 4.500 | % | | | 11/01/2022 | | | | Aa2 | | | | 890,000 | | | | 981,189 | |
Johnson County, Kansas, Internal Improvement Bonds, Series 2007B, (General Obligation Payable from Unlimited Ad Valorem Taxes) | | | 4.500 | % | | | 09/01/2023 | | | | Aaa | | | | 1,615,000 | | | | 1,781,216 | |
Johnson County, Kansas, Internal Improvement Bonds, Series 2007B, (General Obligation Payable from Unlimited Ad Valorem Taxes) | | | 4.625 | % | | | 09/01/2024 | | | | Aaa | | | | 1,895,000 | | | | 2,091,151 | |
City of Wichita, Kansas, Water and Sewer Utility, Revenue Bonds, Series 2009A | | | 5.000 | % | | | 10/01/2024 | | | | AA- | | | | 2,000,000 | | | | 2,261,620 | |
Johnson County, Kansas, Internal Improvement Bonds, Series 2008A | | | 4.500 | % | | | 09/01/2025 | | | | Aaa | | | | 1,115,000 | | | | 1,246,102 | |
City of Wichita, Kansas, Water and Sewer Utility Revenue Bonds, Series 2005C | | | 5.000 | % | | | 10/01/2025 | | | | AA- | | | | 1,240,000 | | | | 1,308,857 | |
Johnson County, Kansas, Internal Improvement Bonds, Series 2008A | | | 4.750 | % | | | 09/01/2026 | | | | Aaa | | | | 2,220,000 | | | | 2,502,695 | |
Unified School District No. 233, Johnson County, Kansas (Olathe), General Obligation School Improvement and Refunding Bonds, Series 2013C | | | 4.500 | % | | | 09/01/2028 | | | | Aa2 | | | | 3,000,000 | | | | 3,282,660 | |
| | | | | | | | | | | | | | | | | | | | |
| | | | | | | | | | | | | | | | | | | 24,815,685 | |
| | | | | | | | | | | | | | | | | | | | |
Kentucky (1.73%) | | | | | | | | | | | | | | | | | | | | |
Sanitation District No. 1, Sanitation District Revenue Bonds, Series 2006, Campbell, Kenton and Boone Counties, Kentucky | | | 4.300 | % | | | 08/01/2017 | | | | Aa2 | | | | 1,275,000 | | | | 1,374,004 | |
Boone-Florence Water Commission (Kentucky), Water Supply System Refunding Revenue Bonds, Series 2010 | | | 3.250 | % | | | 12/01/2018 | | | | Aa3 | | | | 2,040,000 | | | | 2,222,335 | |
Louisville/Jefferson County Metro Government, General Obligation Bonds, Series 2006A | | | 4.500 | % | | | 11/01/2020 | | | | Aa1 | | | | 1,565,000 | | | | 1,700,873 | |
Boone-Florence Water Commission (Kentucky), Water Supply System Refunding Revenue Bonds, Series 2010 | | | 3.250 | % | | | 12/01/2020 | | | | Aa3 | | | | 1,780,000 | | | | 1,953,497 | |
Louisville and Jefferson County Metropolitan Sewer District, (Commonwealth of Kentucky), Sewer and Drainage System Revenue Bonds, Series 2007A | | | 5.000 | % | | | 05/15/2024 | | | | Aa3 | | | | 1,500,000 | | | | 1,687,035 | |
Louisville/Jefferson County Metro Government, General Obligation Bonds, Series 2006A | | | 4.250 | % | | | 11/01/2025 | | | | Aa1 | | | | 1,000,000 | | | | 1,071,190 | |
Northern Kentucky Water District Revenue Bonds, 2013 Series A | | | 4.000 | % | | | 02/01/2028 | | | | Aa3 | | | | 1,110,000 | | | | 1,179,064 | |
| | | | | | | | | | | | | | | | | | | | |
| | | | | | | | | | | | | | | | | | | 11,187,998 | |
| | | | | | | | | | | | | | | | | | | | |
Louisiana (0.28%) | | | | | | | | | | | | | | | | | | | | |
City of Shreveport, State of Louisiana, General Obligation Refunding Bonds, Series 2005A | | | 5.000 | % | | | 05/01/2019 | | | | A+ | | | | 1,340,000 | | | | 1,381,647 | |
Caddo Parish, Louisiana, General Obligation Bonds Series 2007 (Prerefunded to
02-01-2017 @ 100) (b) | | | 4.500 | % | | | 02/01/2020 | | | | Aa2 | | | | 405,000 | | | | 447,950 | |
| | | | | | | | | | | | | | | | | | | | |
| | | | | | | | | | | | | | | | | | | 1,829,597 | |
| | | | | | | | | | | | | | | | | | | | |
Maine (0.61%) | | | | | | | | | | | | | | | | | | | | |
Maine Municipal Bond Bank, 2007 Series A Refunding Bonds | | | 4.500 | % | | | 11/01/2020 | | | | Aa2 | | | | 100,000 | | | | 110,106 | |
Maine Municipal Bond Bank, 2007 Series A Refunding Bonds | | | 4.500 | % | | | 11/01/2021 | | | | Aa2 | | | | 3,515,000 | | | | 3,861,579 | |
| | | | | | | | | | | | | | | | | | | | |
| | | | | | | | | | | | | | | | | | | 3,971,685 | |
| | | | | | | | | | | | | | | | | | | | |
Maryland (1.44%) | | | | | | | | | | | | | | | | | | | | |
State of Maryland, General Obligation Bonds, State and Local Facilities Loan of 2002, Second Series | | | 5.500 | % | | | 08/01/2014 | | | | Aaa | | | | 430,000 | | | | 433,797 | |
| | |
| See accompanying notes to financial statements. | | 23 |
STATE FARM ASSOCIATES’ FUNDS TRUST MUNICIPAL BOND FUND
SCHEDULE OF INVESTMENTS (continued)
May 31, 2014
(Unaudited)
| | | | | | | | | | | | | | | | | | | | |
| | | Coupon
rate | | | Maturity date | | | Rating (a) | | | Principal
amount | | | Value | |
Long-term Municipal Bonds (Cont.) | | | | | | | | | | | | | | | | | | | | |
Maryland (Cont.) | | | | | | | | | | | | | | | | | | | | |
Prince George’s County, Maryland, General Obligation Consolidated Public Improvement Bonds, Series 2005 (Prerefunded to 10-01-2015 @ 100) (b) | | | 4.000 | % | | | 10/01/2017 | | | | Aaa | | | $ | 455,000 | | | $ | 478,178 | |
Washington Suburban Sanitary District, Maryland | | | 5.000 | % | | | 06/01/2019 | | | | Aaa | | | | 2,000,000 | | | | 2,093,420 | |
Howard County, Maryland, General Obligation Consolidated Public Improvement Bonds, 2012 Series A | | | 4.000 | % | | | 02/15/2026 | | | | Aaa | | | | 2,075,000 | | | | 2,228,986 | |
University System of Maryland, Auxiliary Facility and Tuition Revenue Bonds, 2008 Series A | | | 4.625 | % | | | 04/01/2026 | | | | Aa1 | | | | 2,140,000 | | | | 2,360,784 | |
The City of Frederick, Maryland, General Obligation Bonds and Notes, Public Improvements Bonds, Tax-Exempt Series 2009A | | | 5.000 | % | | | 03/01/2027 | | | | Aa2 | | | | 1,500,000 | | | | 1,736,415 | |
| | | | | | | | | | | | | | | | | | | | |
| | | | | | | | | | | | | | | | | | | 9,331,580 | |
| | | | | | | | | | | | | | | | | | | | |
Massachusetts (0.70%) | | | | | | | | | | | | | | | | | | | | |
The Commonwealth of Massachusetts, Commonwealth Transportation Fund Revenue Bonds, (Accelerated Bridge Program), 2013 Series A | | | 5.000 | % | | | 06/01/2034 | | | | Aaa | | | | 2,000,000 | | | | 2,243,900 | |
The Commonwealth of Massachusetts, General Obligation Bonds, Consolidated Loan of 2014, Series A | | | 5.000 | % | | | 12/01/2034 | | | | Aa1 | | | | 2,000,000 | | | | 2,279,540 | |
| | | | | | | | | | | | | | | | | | | | |
| | | | | | | | | | | | | | | | | | | 4,523,440 | |
| | | | | | | | | | | | | | | | | | | | |
Michigan (3.45%) | | | | | | | | | | | | | | | | | | | | |
Forest Hills Public Schools, County of Kent, State of Michigan, 2010 School Building and Site Bonds, Series II, (General Obligation - Unlimited Tax) | | | 4.000 | % | | | 05/01/2018 | | | | Aa2 | | | | 500,000 | | | | 554,910 | |
Board of Trustees of Northern Michigan University, General Revenue Bonds, Series 2008A | | | 5.000 | % | | | 12/01/2018 | | | | A | | | | 440,000 | | | | 504,588 | |
Traverse City Area Public Schools, Counties of Grand Traverse, Leelanau and Benzie, State of Michigan, 2010 School Building and Site Bonds (General Obligation - Unlimited Tax) | | | 3.500 | % | | | 05/01/2020 | | | | AA | | | | 1,000,000 | | | | 1,094,280 | |
Plymouth-Canton Community Schools, Counties of Wayne and Washtenaw, State of Michigan, 2012 Refunding Bonds, Series A, (General Obligation - Unlimited Tax) | | | 5.000 | % | | | 05/01/2021 | | | | Aa2 | | | | 425,000 | | | | 502,367 | |
Forest Hills Public Schools County of Kent, State of Michigan, 2007 School Building and Site Bonds (General Obligation - Unlimited Tax) | | | 4.750 | % | | | 05/01/2022 | | | | Aa2 | | | | 2,000,000 | | | | 2,195,680 | |
Forest Hills Public Schools, County of Kent, State of Michigan, 2010 School Building and Site Bonds, Series II, (General Obligation - Unlimited Tax) | | | 4.000 | % | | | 05/01/2022 | | | | Aa2 | | | | 700,000 | | | | 762,552 | |
Hudsonville Public Schools, Counties of Ottawa and Allegan, State of Michigan, 2011 School Building and Site Bonds, (General Obligation - Unlimited Tax) | | | 5.000 | % | | | 05/01/2022 | | | | A+ | | | | 275,000 | | | | 325,061 | |
Plymouth-Canton Community Schools, Counties of Wayne and Washtenaw, State of Michigan, 2012 Refunding Bonds, Series A, (General Obligation - Unlimited Tax) | | | 5.000 | % | | | 05/01/2022 | | | | Aa2 | | | | 450,000 | | | | 531,680 | |
East Grand Rapids Public Schools, County of Kent, State of Michigan, 2012 Refunding Bonds, (General Obligation - Unlimited Tax) | | | 4.000 | % | | | 05/01/2023 | | | | AA | | | | 1,485,000 | | | | 1,600,696 | |
Hudsonville Public Schools, Counties of Ottawa and Allegan, State of Michigan, 2011 School Building and Site Bonds, (General Obligation - Unlimited Tax) | | | 5.000 | % | | | 05/01/2023 | | | | A+ | | | | 400,000 | | | | 469,448 | |
Hudsonville Public Schools, Counties of Ottawa and Allegan, State of Michigan, 2011 School Building and Site Bonds, (General Obligation - Unlimited Tax) | | | 5.000 | % | | | 05/01/2024 | | | | A+ | | | | 600,000 | | | | 700,416 | |
Howell Public Schools, County of Livingston, State of Michigan, 2011 Refunding Bonds, Series B, (General Obligation - Unlimited Tax) | | | 5.000 | % | | | 05/01/2025 | | | | A+ | | | | 1,880,000 | | | | 2,146,979 | |
Hudsonville Public Schools, Counties of Ottawa and Allegan, State of Michigan, 2013 Refunding Bonds, (General Obligation - Unlimited Tax) | | | 4.000 | % | | | 05/01/2025 | | | | A+ | | | | 700,000 | | | | 753,214 | |
Plymouth-Canton Community Schools, Counties of Wayne and Washtenaw, State of Michigan, 2012 Refunding Bonds, Series A, (General Obligation - Unlimited Tax) | | | 5.000 | % | | | 05/01/2025 | | | | Aa2 | | | | 1,260,000 | | | | 1,473,898 | |
Hudsonville Public Schools, Counties of Ottawa and Allegan, State of Michigan, 2013 Refunding Bonds, (General Obligation - Unlimited Tax) | | | 4.000 | % | | | 05/01/2026 | | | | A+ | | | | 1,290,000 | | | | 1,367,361 | |
Plymouth-Canton Community Schools, Counties of Wayne and Washtenaw, State of Michigan, 2012 Refunding Bonds, Series A, (General Obligation - Unlimited Tax) | | | 4.000 | % | | | 05/01/2026 | | | | Aa2 | | | | 2,300,000 | | | | 2,442,485 | |
Plymouth-Canton Community Schools, Counties of Wayne and Washtenaw, State of Michigan, 2013 School Building and Site Bonds, Series A, (General Obligation - Unlimited Tax) | | | 4.000 | % | | | 05/01/2026 | | | | A+ | | | | 3,850,000 | | | | 4,114,726 | |
City of Petoskey, County of Emmet, State of Michigan, Water Supply and Sewage Disposal System Revenue and Revenue Refunding Bonds, Series 2011 | | | 4.500 | % | | | 02/01/2028 | | | | AA- | | | | 750,000 | | | | 785,542 | |
| | | | | | | | | | | | | | | | | | | | |
| | | | | | | | | | | | | | | | | | | 22,325,883 | |
| | | | | | | | | | | | | | | | | | | | |
| | |
| 24 | | See accompanying notes to financial statements. |
STATE FARM ASSOCIATES’ FUNDS TRUST MUNICIPAL BOND FUND
SCHEDULE OF INVESTMENTS (continued)
May 31, 2014
(Unaudited)
| | | | | | | | | | | | | | | | | | | | |
| | | Coupon
rate | | | Maturity date | | | Rating (a) | | | Principal
amount | | | Value | |
Long-term Municipal Bonds (Cont.) | | | | | | | | | | | | | | | | | | | | |
Minnesota (0.68%) | | | | | | | | | | | | | | | | | | | | |
Independent School District No. 194 (Lakeville), Minnesota, General Obligation Refunding Bonds, Series 2012D | | | 5.000 | % | | | 02/01/2022 | | | | Aa3 | | | $ | 2,720,000 | | | $ | 3,279,531 | |
State of Minnesota, General Obligation State Various Purpose Bonds, Series 2009H | | | 4.500 | % | | | 11/01/2024 | | | | Aa1 | | | | 1,000,000 | | | | 1,145,750 | |
| | | | | | | | | | | | | | | | | | | | |
| | | | | | | | | | | | | | | | | | | 4,425,281 | |
| | | | | | | | | | | | | | | | | | | | |
Mississippi (2.00%) | | | | | | | | | | | | | | | | | | | | |
State of Mississippi, General Obligation Refunding Bonds, Series 2002A | | | 5.500 | % | | | 12/01/2015 | | | | Aa2 | | | | 2,000,000 | | | | 2,157,480 | |
City of Jackson, Mississippi, Water and Sewer System Revenue Refunding Bonds, Series 2005 | | | 4.500 | % | | | 09/01/2018 | | | | A1 | | | | 1,000,000 | | | | 1,044,720 | |
City of Ridgeland, Mississippi, General Obligation Public Improvement Bonds, Series 2007A | | | 4.375 | % | | | 08/01/2019 | | | | Aa2 | | | | 475,000 | | | | 519,892 | |
City of Ridgeland, Mississippi, General Obligation Public Improvement Bonds, Series 2007B | | | 4.375 | % | | | 08/01/2019 | | | | Aa2 | | | | 525,000 | | | | 574,618 | |
City of Ridgeland, Mississippi, General Obligation Public Improvement Bonds, Series 2007A | | | 4.500 | % | | | 08/01/2020 | | | | Aa2 | | | | 500,000 | | | | 549,510 | |
City of Ridgeland, Mississippi, General Obligation Public Improvement Bonds, Series 2007B | | | 4.500 | % | | | 08/01/2020 | | | | Aa2 | | | | 400,000 | | | | 439,608 | |
Mississippi Development Bank, Special Obligation Bonds, Series 2010A, (City of Jackson, Mississippi General Obligation, Refunding Project) | | | 5.000 | % | | | 03/01/2022 | | | | AA- | | | | 1,000,000 | | | | 1,136,920 | |
Madison County School District, Madison County, Mississippi, General Obligation Refunding Bonds, Series 2012 | | | 4.000 | % | | | 04/15/2022 | | | | AA- | | | | 2,480,000 | | | | 2,816,015 | |
Mississippi Development Bank, Special Obligation Bonds, Series 2008 (Jackson Public School District General Obligation Bond Project) | | | 5.375 | % | | | 04/01/2025 | | | | NR | | | | 2,290,000 | | | | 2,583,990 | |
Mississippi Development Bank, Special Obligation Bonds, Series 2008 (Jackson Public School District General Obligation Bond Project) | | | 5.375 | % | | | 04/01/2026 | | | | NR | | | | 1,000,000 | | | | 1,124,830 | |
| | | | | | | | | | | | | | | | | | | | |
| | | | | | | | | | | | | | | | | | | 12,947,583 | |
| | | | | | | | | | | | | | | | | | | | |
Missouri (3.07%) | | | | | | | | | | | | | | | | | | | | |
Reorganized School District No. 7 of Jackson County, Missouri (Lee’s Summit, Missouri School District), General Obligation Refunding Bonds, Series 2005 | | | 4.500 | % | | | 03/01/2019 | | | | Aa1 | | | | 1,850,000 | | | | 1,904,556 | |
State Environmental Improvement and Energy, Resources Authority (State of Missouri), Water Pollution Control and Drinking Water Revenue Bonds, (State Revolving Funds Programs), Series 2007A | | | 4.500 | % | | | 01/01/2021 | | | | Aaa | | | | 1,060,000 | | | | 1,170,367 | |
Health and Education Facilities Authority of the State of Missouri, Educational Facilities Revenue Bonds (The Washington University), Series 2007B | | | 4.200 | % | | | 01/15/2021 | | | | Aaa | | | | 530,000 | | | | 567,529 | |
The School District of Columbia, Boone County, State of Missouri, General Obligation Refunding and Improvement Bonds, Series 2012 | | | 3.500 | % | | | 03/01/2022 | | | | Aa1 | | | | 445,000 | | | | 489,958 | |
City of Ladue School District, St. Louis County, Missouri, General Obligation Refunding and Improvement Bonds, Series 2007 | | | 5.000 | % | | | 03/01/2023 | | | | AAA | | | | 1,455,000 | | | | 1,612,824 | |
The School District of Columbia, Boone County, State of Missouri, General Obligation Refunding and Improvement Bonds, Series 2012 | | | 4.000 | % | | | 03/01/2024 | | | | Aa1 | | | | 2,050,000 | | | | 2,288,087 | |
Parkway C-2 School District, St. Louis County, Missouri, General Obligation Refunding and Improvement Bonds, Series 2009 | | | 4.625 | % | | | 03/01/2025 | | | | AAA | | | | 3,000,000 | | | | 3,265,050 | |
Reorganized School District No. 7 of Jackson County, Missouri (Lee’s Summit, Missouri School District), General Obligation School Building Bonds, Series 2008 | | | 4.750 | % | | | 03/01/2027 | | | | Aa1 | | | | 5,750,000 | | | | 6,336,845 | |
Platte County R-III School District of Platte County, Missouri, General Obligation School Building Bonds, Series 2008 | | | 5.000 | % | | | 03/01/2028 | | | | AA | | | | 2,000,000 | | | | 2,245,960 | |
| | | | | | | | | | | | | | | | | | | | |
| | | | | | | | | | | | | | | | | | | 19,881,176 | |
| | | | | | | | | | | | | | | | | | | | |
Montana (0.08%) | | | | | | | | | | | | | | | | | | | | |
State of Montana, General Obligation Bonds, (Water Pollution Control State Revolving Fund Program), Series 2005G | | | 4.750 | % | | | 07/15/2018 | | | | AA | | | | 490,000 | | | | 513,608 | |
| | | | | | | | | | | | | | | | | | | | |
Nebraska (2.42%) | | | | | | | | | | | | | | | | | | | | |
City of Omaha, Nebraska, Various Purpose Bonds Series of 2005 (Prerefunded to 11-15-2015 @ 100) (b) | | | 4.500 | % | | | 11/15/2018 | | | | Aa1 | | | | 2,140,000 | | | | 2,274,520 | |
City of Omaha, Nebraska, Various Purpose Bonds Series of 2005 (Prerefunded to 11-15-2015 @ 100) (b) | | | 4.500 | % | | | 11/15/2019 | | | | Aa1 | | | | 2,140,000 | | | | 2,274,520 | |
| | |
| See accompanying notes to financial statements. | | 25 |
STATE FARM ASSOCIATES’ FUNDS TRUST MUNICIPAL BOND FUND
SCHEDULE OF INVESTMENTS (continued)
May 31, 2014
(Unaudited)
| | | | | | | | | | | | | | | | | | | | |
| | | Coupon
rate | | | Maturity date | | | Rating (a) | | | Principal
amount | | | Value | |
Long-term Municipal Bonds (Cont.) | | | | | | | | | | | | | | | | | | | | |
Nebraska (Cont.) | | | | | | | | | | | | | | | | | | | | |
City of Omaha, Nebraska, Sanitary Sewerage System Revenue Bonds, Series of 2006 | | | 4.250 | % | | | 11/15/2020 | | | | Aa2 | | | $ | 1,565,000 | | | $ | 1,686,068 | |
Douglas County School District 0010, (Elkhorn Public Schools), General Obligation Refunding Bonds, Series 2011 | | | 4.000 | % | | | 12/15/2022 | | | | AA- | | | | 1,290,000 | | | | 1,414,640 | |
Douglas County School District 0010, (Elkhorn Public Schools), General Obligation Refunding Bonds, Series 2011 | | | 5.000 | % | | | 12/15/2023 | | | | AA- | | | | 1,560,000 | | | | 1,807,619 | |
Douglas County School District 0001, (Omaha, Nebraska, Public Schools), General Obligation Refunding Bonds, Series 2010 | | | 4.000 | % | | | 12/15/2024 | | | | Aa1 | | | | 3,000,000 | | | | 3,279,900 | |
Douglas County School District 0010, (Elkhorn Public Schools), General Obligation Refunding Bonds, Series 2011 | | | 5.000 | % | | | 12/15/2026 | | | | AA- | | | | 1,925,000 | | | | 2,164,816 | |
Douglas County School District 0010, (Elkhorn Public Schools), General Obligation Bonds, Series 2012B | | | 4.000 | % | | | 01/15/2029 | | | | AA- | | | | 730,000 | | | | 764,135 | |
| | | | | | | | | | | | | | | | | | | | |
| | | | | | | | | | | | | | | | | | | 15,666,218 | |
| | | | | | | | | | | | | | | | | | | | |
New Hampshire (0.57%) | | | | | | | | | | | | | | | | | | | | |
City of Concord, New Hampshire, General Obligation Bonds, Capital Improvement Bonds, Series A | | | 4.750 | % | | | 07/15/2016 | | | | Aa1 | | | | 400,000 | | | | 419,456 | |
City of Concord, New Hampshire, General Obligation Bonds, Capital Improvement Bonds, Series A (Prerefunded to 07-15-2015 @ 100) (b) | | | 4.750 | % | | | 07/15/2016 | | | | NR | | | | 115,000 | | | | 120,752 | |
State of New Hampshire, General Obligation Refunding Bonds, 2006 Series A | | | 4.250 | % | | | 10/15/2020 | | | | AA | | | | 1,405,000 | | | | 1,499,458 | |
New Hampshire Municipal Bond Bank Series B Bonds | | | 4.750 | % | | | 08/15/2023 | | | | A1 | | | | 1,500,000 | | | | 1,638,810 | |
| | | | | | | | | | | | | | | | | | | | |
| | | | | | | | | | | | | | | | | | | 3,678,476 | |
| | | | | | | | | | | | | | | | | | | | |
New Jersey (3.94%) | | | | | | | | | | | | | | | | | | | | |
State of New Jersey, General Obligation Bonds, Various Purpose | | | 5.250 | % | | | 08/01/2014 | | | | A1 | | | | 7,000,000 | | | | 7,058,100 | |
Borough of Fort Lee, New Jersey, General Obligation Bonds, Series 2005 (Prerefunded to 07-15-2014 @
100) (b) | | | 4.000 | % | | | 07/15/2018 | | | | Aa2 | | | | 1,230,000 | | | | 1,235,387 | |
Township of Parsippany-Troy Hills, In the County of Morris, New Jersey, General Obligation Bonds | | | 2.500 | % | | | 11/01/2018 | | | | AA | | | | 1,410,000 | | | | 1,486,605 | |
Township of Toms River, County of Ocean, New Jersey, General Improvement Bonds, Series 2010A | | | 3.000 | % | | | 06/15/2019 | | | | AA | | | | 1,900,000 | | | | 1,998,097 | |
Middlesex County Improvement Authority, (County of Middlesex, State of New Jersey), County-Guaranteed Open Space Trust Fund Revenue Bonds, Series 2009A | | | 4.000 | % | | | 12/15/2019 | | | | Aa2 | | | | 1,540,000 | | | | 1,714,143 | |
The Board of Education of the Township of Millstone, in the County of Monmouth, New Jersey, School District Refunding Bonds, Series 2011 | | | 5.000 | % | | | 07/15/2020 | | | | A+ | | | | 1,075,000 | | | | 1,208,945 | |
The Board of Education of the Borough of Madison, in the County of Morris, New Jersey, Refunding School Bonds, Series 2012 B | | | 3.000 | % | | | 12/15/2020 | | | | AA | | | | 315,000 | | | | 327,521 | |
Middlesex County Improvement Authority, (County of Middlesex, State of New Jersey), County-Guaranteed Open Space Trust Fund Revenue Bonds, Series 2009A | | | 4.000 | % | | | 12/15/2020 | | | | Aa2 | | | | 750,000 | | | | 822,802 | |
Township of Parsippany-Troy Hills, In the County of Morris, New Jersey, General Obligation Bonds | | | 3.000 | % | | | 11/01/2021 | | | | AA | | | | 1,775,000 | | | | 1,866,466 | |
The Board of Education of the Borough of Madison, in the County of Morris, New Jersey, Refunding School Bonds, Series 2012 B | | | 3.000 | % | | | 12/15/2021 | | | | AA | | | | 685,000 | | | | 709,324 | |
The Board of Education of the Township of South Brunswick, in the County of Middlesex, New Jersey, Refunding School Bonds, Series 2007 AA | | | 4.500 | % | | | 08/01/2022 | | | | Aa2 | | | | 1,240,000 | | | | 1,323,787 | |
The Board of Education of the Township of South Brunswick, in the County of Middlesex, New Jersey, Refunding School Bonds | | | 4.000 | % | | | 12/01/2022 | | | | AA+ | | | | 750,000 | | | | 834,480 | |
The Board of Education of the Borough of Madison, in the County of Morris, New Jersey, Refunding School Bonds, Series 2012 B | | | 3.000 | % | | | 12/15/2022 | | | | AA | | | | 600,000 | | | | 616,398 | |
The Board of Education of the Borough of Madison, in the County of Morris, New Jersey, Refunding School Bonds, Series 2012 B | | | 4.000 | % | | | 12/15/2023 | | | | AA | | | | 465,000 | | | | 505,976 | |
The Board of Education, of the Somerset Hills School District, in the County of Somerset, New Jersey, Refunding School Bonds, Series 2012 | | | 4.000 | % | | | 03/15/2024 | | | | Aa1 | | | | 2,345,000 | | | | 2,588,739 | |
Township of Moorestown, in the County of Burlington, New Jersey, General Obligation Bonds Consisting of General Improvement Bonds and Water-Sewer Utility Bonds | | | 4.000 | % | | | 01/15/2030 | | | | Aa2 | | | | 1,140,000 | | | | 1,217,896 | |
| | | | | | | | | | | | | | | | | | | | |
| | | | | | | | | | | | | | | | | | | 25,514,666 | |
| | | | | | | | | | | | | | | | | | | | |
New Mexico (3.00%) | | | | | | | | | | | | | | | | | | | | |
State Transportation, Refunding Revenue Bonds, (Senior Lien), Series 2010B | | | 4.000 | % | | | 06/15/2019 | | | | Aa1 | | | | 3,500,000 | | | | 3,955,070 | |
| | |
| 26 | | See accompanying notes to financial statements. |
STATE FARM ASSOCIATES’ FUNDS TRUST MUNICIPAL BOND FUND
SCHEDULE OF INVESTMENTS (continued)
May 31, 2014
(Unaudited)
| | | | | | | | | | | | | | | | | | | | |
| | | Coupon
rate | | | Maturity date | | | Rating (a) | | | Principal
amount | | | Value | |
Long-term Municipal Bonds (Cont.) | | | | | | | | | | | | | | | | | | | | |
New Mexico (Cont.) | | | | | | | | | | | | | | | | | | | | |
Las Cruces School District No. 2, General Obligation School Bonds, Series 2011A | | | 4.000 | % | | | 08/01/2021 | | | | Aa2 | | | $ | 1,500,000 | | | $ | 1,651,950 | |
City of Rio Rancho, New Mexico, Water and Wastewater System Revenue Bonds, Series 2005 (Prerefunded to 05-15-2015 @ 100) (b) | | | 5.000 | % | | | 05/15/2022 | | | | AA- | | | | 1,365,000 | | | | 1,427,244 | |
Santa Fe Public School District, Santa Fe County, New Mexico, General Obligation Bonds, Series 2012 | | | 3.000 | % | | | 08/01/2022 | | | | AA | | | | 2,000,000 | | | | 2,082,360 | |
City of Rio Rancho, New Mexico, Water and Wastewater System Revenue Bonds, Series 2005 (Prerefunded to 05-15-2015 @ 100) (b) | | | 5.000 | % | | | 05/15/2023 | | | | AA- | | | | 1,320,000 | | | | 1,380,192 | |
City of Albuquerque, New Mexico, General Obligation General Purpose Bonds, Series 2012A | | | 4.000 | % | | | 07/01/2023 | | | | Aa1 | | | | 2,450,000 | | | | 2,676,135 | |
Albuquerque Municipal School District No. 12, Bernalillo and Sandoval Counties, New Mexico, General Obligation School Building Bonds Series 2008B | | | 4.500 | % | | | 08/01/2023 | | | | AA | | | | 2,000,000 | | | | 2,167,000 | |
Albuquerque Bernalillo County Water Utility Authority, Joint Water and Sewer System Improvement Revenue Bonds, Series 2005 | | | 4.400 | % | | | 07/01/2024 | | | | Aa2 | | | | 1,000,000 | | | | 1,028,739 | |
City of Santa Fe, New Mexico, General Obligation Bonds, Series 2013 | | | 4.000 | % | | | 08/01/2026 | | | | AA | | | | 675,000 | | | | 719,759 | |
City of Santa Fe, New Mexico, General Obligation Bonds, Series 2013 | | | 4.000 | % | | | 08/01/2027 | | | | AA | | | | 700,000 | | | | 745,276 | |
City of Santa Fe, New Mexico, General Obligation Bonds, Series 2013 | | | 4.000 | % | | | 08/01/2028 | | | | AA | | | | 725,000 | | | | 765,984 | |
City of Santa Fe, New Mexico, General Obligation Bonds, Series 2013 | | | 4.000 | % | | | 08/01/2029 | | | | AA | | | | 750,000 | | | | 786,938 | |
| | | | | | | | | | | | | | | | | | | | |
| | | | | | | | | | | | | | | | | | | 19,386,647 | |
| | | | | | | | | | | | | | | | | | | | |
New York (3.45%) | | | | | | | | | | | | | | | | | | | | |
Minisink Valley Central School District, Orange and Sullivan Counties, New York, School District (Serial) Bonds, 2005 Series B (Economically Defeased to 06-15-2015 @ 100) (b) | | | 4.000 | % | | | 06/15/2017 | | | | Aa3 | | | | 1,000,000 | | | | 1,039,950 | |
New York State Thruway Authority, Second General Highway and Bridge Trust Fund Bonds, Series 2005B | | | 5.000 | % | | | 04/01/2019 | | | | AA | | | | 1,730,000 | | | | 1,836,949 | |
New York State Thruway Authority, Second General Highway and Bridge Trust Fund Bonds, Series 2005B (Prerefunded to 10-01-2015 @ 100) (b) | | | 5.000 | % | | | 04/01/2019 | | | | NR | | | | 270,000 | | | | 287,064 | |
Town of Brookhaven, Suffolk County, New York, Public Improvement Serial Bonds - 2010 | | | 3.250 | % | | | 03/15/2020 | | | | Aa2 | | | | 1,665,000 | | | | 1,770,411 | |
Minisink Valley Central School District, Orange and Sullivan Counties, New York, School District (Serial) Bonds, 2009 | | | 3.000 | % | | | 04/15/2020 | | | | AA | | | | 825,000 | | | | 851,788 | |
Minisink Valley Central School District, Orange and Sullivan Counties, New York, 2006 Series B Bonds | | | 4.300 | % | | | 06/01/2020 | | | | Aa3 | | | | 695,000 | | | | 738,410 | |
County of Saratoga, New York, Public Improvement (Serial) Bonds, Series 2010B | | | 4.000 | % | | | 07/15/2020 | | | | AA | | | | 410,000 | | | | 438,220 | |
Minisink Valley Central School District, Orange and Sullivan Counties, New York, 2006 Series B Bonds | | | 4.300 | % | | | 06/01/2021 | | | | Aa3 | | | | 625,000 | | | | 663,275 | |
County of Suffolk, New York, Public Improvement Serial Bonds - 2009 Series C | | | 4.000 | % | | | 10/15/2021 | | | | A3 | | | | 3,000,000 | | | | 3,227,640 | |
Hauppauge Union Free School District, Suffolk County, New York, School District Serial Bonds - 2010 | | | 4.000 | % | | | 07/15/2022 | | | | Aa2 | | | | 1,265,000 | | | | 1,382,228 | |
County of Saratoga, New York, Public Improvement (Serial) Bonds, Series 2010B | | | 4.000 | % | | | 07/15/2023 | | | | AA | | | | 465,000 | | | | 487,041 | |
Hauppauge Union Free School District, Suffolk County, New York, School District Serial Bonds - 2010 | | | 4.000 | % | | | 07/15/2023 | | | | Aa2 | | | | 1,615,000 | | | | 1,759,752 | |
Miller Place Union Free School District, In the Town of Brookhaven, Suffolk County, New York, School District Serial Bonds - 2010 | | | 4.000 | % | | | 02/15/2026 | | | | Aa2 | | | | 460,000 | | | | 484,210 | |
The Port Authority of New York and New Jersey Consolidated Bonds, One Hundred Fifty-Third Series | | | 4.750 | % | | | 07/15/2029 | | | | Aa3 | | | | 1,000,000 | | | | 1,092,740 | |
The Port Authority of New York and New Jersey Consolidated Bonds, One Hundred Seventy-Ninth Series | | | 5.000 | % | | | 12/01/2032 | | | | Aa3 | | | | 3,000,000 | | | | 3,454,920 | |
New York City, Municipal Water Finance Authority, Water and Sewer System Second General Resolution Revenue Bonds, Fiscal 2014 Series DD | | | 5.000 | % | | | 06/15/2035 | | | | Aa2 | | | | 2,500,000 | | | | 2,823,925 | |
| | | | | | | | | | | | | | | | | | | | |
| | | | | | | | | | | | | | | | | | | 22,338,523 | |
| | | | | | | | | | | | | | | | | | | | |
North Carolina (1.58%) | | | | | | | | | | | | | | | | | | | | |
County of Orange, North Carolina, General Obligation Refunding Bonds, Series 2011 | | | 3.000 | % | | | 02/01/2019 | | | | Aaa | | | | 1,000,000 | | | | 1,084,140 | |
North Carolina, Orange Water and Sewer Authority, Water and Sewer System Revenue Bonds, Series 2006 | | | 4.375 | % | | | 07/01/2019 | | | | Aa1 | | | | 855,000 | | | | 917,586 | |
City of Fayetteville, North Carolina, Public Works Commission, Revenue Bonds, Series 2009B | | | 5.000 | % | | | 03/01/2022 | | | | Aa2 | | | | 1,000,000 | | | | 1,153,150 | |
County of Pender, North Carolina, General Obligation School Bonds, Series 2007 | | | 4.375 | % | | | 03/01/2022 | | | | AA- | | | | 545,000 | | | | 587,837 | |
| | |
| See accompanying notes to financial statements. | | 27 |
STATE FARM ASSOCIATES’ FUNDS TRUST MUNICIPAL BOND FUND
SCHEDULE OF INVESTMENTS (continued)
May 31, 2014
(Unaudited)
| | | | | | | | | | | | | | | | | | | | |
| | | Coupon
rate | | | Maturity date | | | Rating (a) | | | Principal
amount | | | Value | |
Long-term Municipal Bonds (Cont.) | | | | | | | | | | | | | | | | | | | | |
North Carolina (Cont.) | | | | | | | | | | | | | | | | | | | | |
County of Wake, North Carolina, General Obligation Public Improvement Bonds, Series 2011 | | | 4.000 | % | | | 04/01/2024 | | | | Aaa | | | $ | 1,000,000 | | | $ | 1,110,120 | |
City of Charlotte, North Carolina, General Obligation Refunding Bonds, Series 2009B | | | 4.000 | % | | | 06/01/2024 | | | | Aaa | | | | 1,000,000 | | | | 1,092,070 | |
City of Durham, North Carolina, General Obligation Bonds, Series 2012A | | | 3.000 | % | | | 07/01/2024 | | | | Aaa | | | | 155,000 | | | | 162,252 | |
City of Asheville, North Carolina, Water System Revenue Bonds, Series 2007 | | | 4.750 | % | | | 08/01/2024 | | | | Aa2 | | | | 1,555,000 | | | | 1,714,854 | |
State of North Carolina, General Obligation Public Improvement Bonds, Series 2010A | | | 4.000 | % | | | 05/01/2026 | | | | Aaa | | | | 1,000,000 | | | | 1,107,390 | |
Metropolitan Sewerage District of Buncombe County, North Carolina, Sewerage System Revenue Refunding Bonds, Series 2013 | | | 4.000 | % | | | 07/01/2027 | | | | Aa2 | | | | 1,210,000 | | | | 1,309,486 | |
| | | | | | | | | | | | | | | | | | | | |
| | | | | | | | | | | | | | | | | | | 10,238,885 | |
| | | | | | | | | | | | | | | | | | | | |
North Dakota (0.17%) | | | | | | | | | | | | | | | | | | | | |
West Fargo Public School District No. 6, Cass County, North Dakota, General Obligation School Building Bonds, Series 2011 | | | 4.000 | % | | | 05/01/2026 | | | | Aa3 | | | | 1,000,000 | | | | 1,064,530 | |
| | | | | | | | | | | | | | | | | | | | |
Ohio (2.63%) | | | | | | | | | | | | | | | | | | | | |
Indian Hill Exempted Village School District, County of Hamilton, Ohio, School Improvement Refunding Bonds, Series 2006 | | | 4.375 | % | | | 12/01/2020 | | | | Aaa | | | | 1,580,000 | | | | 1,691,485 | |
State of Ohio, Common Schools General Obligation Bonds, Series 2005C (Prerefunded to 06-15-2015 @ 100) (b) | | | 4.300 | % | | | 06/15/2021 | | | | Aa1 | | | | 2,000,000 | | | | 2,084,380 | |
Board of Education, City School District of the City of Cincinnati, County of Hamilton, Ohio, Classroom Facilities Construction and Improvement Refunding Bonds, Series 2006 (Voted General Obligation Unlimited Tax) | | | 5.250 | % | | | 12/01/2022 | | | | AA- | | | | 1,000,000 | | | | 1,217,770 | |
Plain Local School District, County of Stark, Ohio, General Obligation (Unlimited Tax), School Improvement Refunding Bonds, Series 2011A | | | 4.300 | % | | | 11/01/2023 | | | | AA- | | | | 2,840,000 | | | | 3,093,413 | |
City of Cincinnati, Ohio, Water System Revenue Bonds, Series 2012A | | | 4.000 | % | | | 12/01/2024 | | | | Aaa | | | | 2,155,000 | | | | 2,404,226 | |
State of Ohio, Common Schools General Obligation Bonds, Series 2006D | | | 4.300 | % | | | 09/15/2025 | | | | Aa1 | | | | 2,000,000 | | | | 2,090,780 | |
Miami University, (A State University of Ohio), General Receipts Revenue and Refunding Bonds, Series 2011 | | | 5.000 | % | | | 09/01/2026 | | | | Aa3 | | | | 1,430,000 | | | | 1,637,879 | |
Lakewood City School District, Ohio, General Obligation (Unlimited Tax), School Facilities Improvement Bonds, Series 2014A | | | 5.000 | % | | | 11/01/2028 | | | | AA- | | | | 1,000,000 | | | | 1,142,840 | |
Lakewood City School District, Ohio, General Obligation (Unlimited Tax), School Facilities Improvement Bonds, Series 2014A | | | 5.000 | % | | | 11/01/2032 | | | | AA- | | | | 1,500,000 | | | | 1,676,520 | |
| | | | | | | | | | | | | | | | | | | | |
| | | | | | | | | | | | | | | | | | | 17,039,293 | |
| | | | | | | | | | | | | | | | | | | | |
Oklahoma (0.88%) | | | | | | | | | | | | | | | | | | | | |
Oklahoma Water Resources Board, State Loan Program Revenue Bonds, Refunding Series 2006B | | | 5.000 | % | | | 10/01/2020 | | | | AAA | | | | 1,230,000 | | | | 1,341,586 | |
City of Tulsa, Oklahoma, General Obligation Bonds, Series 2013 | | | 4.000 | % | | | 03/01/2023 | | | | AA | | | | 2,500,000 | | | | 2,742,825 | |
City of Tulsa, Oklahoma, General Obligation Bonds, Series 2008 | | | 4.625 | % | | | 05/01/2025 | | | | AA | | | | 1,485,000 | | | | 1,607,913 | |
| | | | | | | | | | | | | | | | | | | | |
| | | | | | | | | | | | | | | | | | | 5,692,324 | |
| | | | | | | | | | | | | | | | | | | | |
Oregon (2.34%) | | | | | | | | | | | | | | | | | | | | |
Reynolds School District 7, Multnomah County, Oregon, General Obligation Refunding Bonds Series 2000 | | | 5.000 | % | | | 06/15/2015 | | | | Aa2 | | | | 2,135,000 | | | | 2,240,896 | |
City of Hillsboro, Oregon, Full Faith and Credit Bonds, Series 2004 (Prerefunded to 06-01-2014 @ 100) (b) | | | 4.750 | % | | | 06/01/2018 | | | | Aa3 | | | | 500,000 | | | | 500,000 | |
Oregon City School District No. 62, Clackamas County, Oregon, General Obligation Refunding Bonds, Series 2004 (Prerefunded to 06-15-2014 @ 100) (b) | | | 5.000 | % | | | 06/15/2018 | | | | Aa3 | | | | 1,625,000 | | | | 1,627,405 | |
State of Oregon Housing and Community Services Department, Mortgage Revenue Bonds (Single-Family Mortgage Program) 2007 Series C | | | 4.625 | % | | | 07/01/2020 | | | | Aa2 | | | | 170,000 | | | | 177,300 | |
City of Portland, Oregon, First Lien Water System Revenue and Refunding Bonds, 2010 Series A (Tax Exempt) | | | 4.000 | % | | | 05/01/2021 | | | | Aaa | | | | 1,000,000 | | | | 1,106,210 | |
City of Portland, Oregon, Second Lien Sewer System Revenue and Refunding Bonds, 2008 Series B | | | 5.000 | % | | | 06/15/2023 | | | | Aa3 | | | | 1,500,000 | | | | 1,706,475 | |
City of Portland, Oregon, First Lien Water System Revenue Bonds, 2011 Series A | | | 4.000 | % | | | 05/01/2025 | | | | Aaa | | | | 1,330,000 | | | | 1,440,895 | |
State of Oregon, State Board of Higher Education, General Obligation Bonds 2009 Series A Serial Bonds (Prerefunded to 08-01-2018 @ 100) (b) | | | 5.750 | % | | | 08/01/2025 | | | | Aa1 | | | | 745,000 | | | | 891,467 | |
| | |
| 28 | | See accompanying notes to financial statements. |
STATE FARM ASSOCIATES’ FUNDS TRUST MUNICIPAL BOND FUND
SCHEDULE OF INVESTMENTS (continued)
May 31, 2014
(Unaudited)
| | | | | | | | | | | | | | | | | | | | |
| | | Coupon
rate | | | Maturity date | | | Rating (a) | | | Principal
amount | | | Value | |
Long-term Municipal Bonds (Cont.) | | | | | | | | | | | | | | | | | | | | |
Oregon (Cont.) | | | | | | | | | | | | | | | | | | | | |
State of Oregon, State Board of Higher Education, General Obligation Bonds 2009 Series A Serial Bonds (Prerefunded to
08-01-2018 @ 100) (b) | | | 5.750 | % | | | 08/01/2026 | | | | Aa1 | | | $ | 670,000 | | | $ | 801,722 | |
State of Oregon, State Board of Higher Education, General Obligation Bonds 2009 Series A Serial Bonds (Prerefunded to
08-01-2018 @ 100) (b) | | | 5.750 | % | | | 08/01/2027 | | | | Aa1 | | | | 750,000 | | | | 897,450 | |
Tualatin Hills Park & Recreation District, Washington County, Oregon, General Obligation Bonds, Series 2009 | | | 4.625 | % | | | 06/01/2028 | | | | AA | | | | 1,335,000 | | | | 1,462,746 | |
Portland Community College District, Multnomah, Washington, Yamhill, Clackamas and Columbia Counties, Oregon, General Obligation Bonds, Series 2009 | | | 5.000 | % | | | 06/15/2029 | | | | AA | | | | 2,000,000 | | | | 2,283,720 | |
| | | | | | | | | | | | | | | | | | | | |
| | | | | | | | | | | | | | | | | | | 15,136,286 | |
| | | | | | | | | | | | | | | | | | | | |
Pennsylvania (2.05%) | | | | | | | | | | | | | | | | | | | | |
Dover Township Sewer Authority, York County, Pennsylvania, Guaranteed Sewer Revenue Bonds, Series 2004 | | | 5.000 | % | | | 11/01/2017 | | | | NR | | | | 1,030,000 | | | | 1,044,986 | |
Dover Township Sewer Authority, York County, Pennsylvania, Guaranteed Sewer Revenue Bonds, Series 2004 | | | 5.000 | % | | | 11/01/2018 | | | | NR | | | | 1,000,000 | | | | 1,013,060 | |
County of Chester, Commonwealth of Pennsylvania, General Obligation Bonds Series of 2006 | | | 4.375 | % | | | 11/15/2021 | | | | Aaa | | | | 2,300,000 | | | | 2,461,161 | |
Township of Cranberry, Butler County, Pennsylvania, General Obligation Bonds, Series of 2011 | | | 4.500 | % | | | 03/01/2025 | | | | Aa2 | | | | 1,605,000 | | | | 1,763,221 | |
Township of Cranberry, Butler County, Pennsylvania, General Obligation Bonds, Series of 2011 | | | 4.500 | % | | | 03/01/2027 | | | | Aa2 | | | | 2,505,000 | | | | 2,716,773 | |
Township of Hampden, (Cumberland County, Pennsylvania), General Obligation Bonds, Series of 2012 | | | 5.000 | % | | | 05/15/2027 | | | | AA | | | | 2,200,000 | | | | 2,525,600 | |
County of Northampton, Commonwealth of Pennsylvania, General Obligation Bonds, Series B of 2012 (Tax-Exempt) | | | 5.000 | % | | | 10/01/2030 | | | | AA | | | | 1,500,000 | | | | 1,710,015 | |
| | | | | | | | | | | | | | | | | | | | |
| | | | | | | | | | | | | | | | | | | 13,234,816 | |
| | | | | | | | | | | | | | | | | | | | |
Rhode Island (0.17%) | | | | | | | | | | | | | | | | | | | | |
State of Rhode Island and Providence Plantations, General Obligation Bonds, Consolidated Capital Development Loan of 2007, Series A | | | 4.750 | % | | | 08/01/2023 | | | | Aa2 | | | | 1,000,000 | | | | 1,095,320 | |
| | | | | | | | | | | | | | | | | | | | |
South Carolina (1.92%) | | | | | | | | | | | | | | | | | | | | |
Lugoff-Elgin Water Authority (South Carolina) Waterworks System Revenue Bonds, Series 2007 | | | 5.000 | % | | | 07/01/2022 | | | | A1 | | | | 1,000,000 | | | | 1,112,450 | |
Fort Mill School District No. 4 of York County, South Carolina, General Obligation Advanced Refunding Bonds, Series 2012A | | | 4.000 | % | | | 03/01/2023 | | | | AA- | | | | 2,315,000 | | | | 2,599,629 | |
School District No. 1 of Richland County, South Carolina, General Obligation Refunding Bonds, Series 2011A | | | 4.000 | % | | | 03/01/2023 | | | | AA- | | | | 1,675,000 | | | | 1,862,717 | |
City of Columbia, South Carolina, Waterworks and Sewer System Revenue Bonds, Series 2010 | | | 4.500 | % | | | 02/01/2025 | | | | AA | | | | 1,035,000 | | | | 1,153,973 | |
School District No. 1 of Richland County, South Carolina, General Obligation Bonds, Series 2006B | | | 4.450 | % | | | 03/01/2025 | | | | Aa2 | | | | 1,000,000 | | | | 1,077,810 | |
Berkeley County, South Carolina, Water and Sewer System Refunding Revenue Bonds, Series 2008A | | | 4.750 | % | | | 06/01/2025 | | | | Aa3 | | | | 800,000 | | | | 886,592 | |
University of South Carolina, Higher Education Revenue Bonds, Series 2008A | | | 4.750 | % | | | 06/01/2025 | | | | Aa2 | | | | 1,130,000 | | | | 1,254,616 | |
Spartanburg Sanitary Sewer District, South Carolina, Sewer System Refunding Convertible Bonds, Series 2013B | | | 5.000 | % | | | 03/01/2030 | | | | A1 | | | | 2,160,000 | | | | 2,443,781 | |
| | | | | | | | | | | | | | | | | | | | |
| | | | | | | | | | | | | | | | | | | 12,391,568 | |
| | | | | | | | | | | | | | | | | | | | |
South Dakota (0.04%) | | | | | | | | | | | | | | | | | | | | |
Harrisburg School District 41-2, South Dakota, General Obligation Bonds, Series 2012 | | | 3.000 | % | | | 07/15/2022 | | | | AA- | | | | 250,000 | | | | 257,038 | |
| | | | | | | | | | | | | | | | | | | | |
Tennessee (2.46%) | | | | | | | | | | | | | | | | | | | | |
City of Knoxville, Tennessee, Water System Revenue Bonds, Series U-2009 | | | 4.000 | % | | | 03/01/2021 | | | | Aa2 | | | | 1,050,000 | | | | 1,152,512 | |
City of Knoxville, Tennessee, Water System Revenue Refunding Bonds, Series X-2012 | | | 3.000 | % | | | 03/01/2022 | | | | Aa2 | | | | 655,000 | | | | 693,560 | |
The Metropolitan Government of Nashville and Davidson County (Tennessee), Electric System Revenue Bonds, 2011 Series A | | | 4.500 | % | | | 05/15/2022 | | | | AA+ | | | | 2,760,000 | | | | 3,182,225 | |
City of Knoxville, Tennessee, Water System Revenue Refunding Bonds, Series X-2012 | | | 3.000 | % | | | 03/01/2023 | | | | Aa2 | | | | 670,000 | | | | 700,398 | |
| | |
| See accompanying notes to financial statements. | | 29 |
STATE FARM ASSOCIATES’ FUNDS TRUST MUNICIPAL BOND FUND
SCHEDULE OF INVESTMENTS (continued)
May 31, 2014
(Unaudited)
| | | | | | | | | | | | | | | | | | | | |
| | | Coupon
rate | | | Maturity date | | | Rating (a) | | | Principal
amount | | | Value | |
Long-term Municipal Bonds (Cont.) | | | | | | | | | | | | | | | | | | | | |
Tennessee (Cont.) | | | | | | | | | | | | | | | | | | | | |
Tennessee State School Bond Authority, Higher Educational Facilities, Second Program Bonds, 2008 Series B | | | 4.750 | % | | | 05/01/2023 | | | | AA | | | $ | 2,000,000 | | | $ | 2,242,580 | |
The Metropolitan Government of Nashville and Davidson County (Tennessee), General Obligation Improvement and Refunding Bonds, Series 2010A | | | 4.000 | % | | | 07/01/2023 | | | | Aa2 | | | | 2,000,000 | | | | 2,203,640 | |
State of Tennessee, General Obligation Bonds, 2007 Series A (Prerefunded to 10-01-2015 @ 100) (b) | | | 4.400 | % | | | 10/01/2023 | | | | AA+ | | | | 1,050,000 | | | | 1,109,042 | |
The Metropolitan Government of Nashville and Davidson County (Tennessee), Electric System Revenue Bonds, 2008 Series A | | | 4.750 | % | | | 05/15/2025 | | | | AA+ | | | | 1,000,000 | | | | 1,115,550 | |
City of Knoxville, Tennessee, Electric System Revenue Refunding Bonds, Series CC-2013 | | | 3.000 | % | | | 07/01/2025 | | | | Aa2 | | | | 100,000 | | | | 101,919 | |
City of Chattanooga, Tennessee, General Obligation Refunding Bonds, Series 2007A | | | 4.750 | % | | | 03/01/2026 | | | | AAA | | | | 2,000,000 | | | | 2,176,740 | |
Harpeth Valley Utilities District of Davidson and Williamson Counties, Tennessee, Utilities Revenue Bonds, Series 2014 | | | 5.000 | % | | | 09/01/2031 | | | | AA | | | | 1,065,000 | | | | 1,231,236 | |
| | | | | | | | | | | | | | | | | | | | |
| | | | | | | | | | | | | | | | | | | 15,909,402 | |
| | | | | | | | | | | | | | | | | | | | |
Texas (3.82%) | | | | | | | | | | | | | | | | | | | | |
City of Plano, Texas, (Collin and Denton Counties), General Obligation Refunding and Improvement Bonds, Series 2011 | | | 5.000 | % | | | 09/01/2019 | | | | Aaa | | | | 1,000,000 | | | | 1,182,420 | |
Lake Travis Independent School District, Unlimited Tax School Building Bonds, Series 2006A (Prerefunded to 02-15-2016 @ 100) (b) | | | 5.000 | % | | | 02/15/2020 | | | | AA+ | | | | 1,535,000 | | | | 1,657,861 | |
Clear Creek Independent School District (Galveston and Harris Counties, Texas) Unlimited Tax School Building Bonds, Series 2007 | | | 4.750 | % | | | 02/15/2021 | | | | Aa2 | | | | 490,000 | | | | 535,340 | |
Fort Worth Independent School District, (Tarrant County, Texas), Unlimited Tax School Building Bonds, Series 2010 | | | 4.000 | % | | | 02/15/2021 | | | | AA | | | | 1,000,000 | | | | 1,109,440 | |
Clear Creek Independent School District (Galveston and Harris Counties, Texas) Unlimited Tax School Building Bonds, Series 2007 | | | 4.750 | % | | | 02/15/2022 | | | | Aa2 | | | | 470,000 | | | | 512,178 | |
Coppell Independent School District (Dallas County, Texas) Unlimited Tax School Building Bonds, Series 2007 | | | 5.000 | % | | | 08/15/2022 | | | | AA | | | | 375,000 | | | | 421,954 | |
Coppell Independent School District (Dallas County, Texas) Unlimited Tax School Building Bonds, Series 2007 | | | 5.000 | % | | | 08/15/2023 | | | | AA | | | | 395,000 | | | | 443,790 | |
City of Austin, Texas (Travis, Williamson and Hays Counties), Water and Wastewater System Refunding Bonds, Series 2010A | | | 5.000 | % | | | 11/15/2025 | | | | Aa2 | | | | 2,345,000 | | | | 2,686,033 | |
City of Austin, Texas, (Travis and Williamson Counties), Water and Wastewater System Revenue Refunding Bonds, Series 2009A | | | 5.000 | % | | | 11/15/2025 | | | | Aa2 | | | | 2,000,000 | | | | 2,334,040 | |
Carrollton-Farmers Branch Independent School District (Dallas and Denton Counties, Texas), Unlimited Tax School Building and Refunding Bonds, Series 2008 | | | 4.625 | % | | | 02/15/2026 | | | | AA | | | | 1,165,000 | | | | 1,267,345 | |
Hays County, Texas, Pass-Through Toll Revenue and Unlimited Tax Bonds, Series 2011 | | | 4.750 | % | | | 02/15/2026 | | | | AA | | | | 1,620,000 | | | | 1,779,845 | |
City of Austin, Texas (Travis and Williamson Counties), Electric Utility System Revenue Refunding Bonds, Series 2008A | | | 5.250 | % | | | 11/15/2026 | | | | A1 | | | | 3,000,000 | | | | 3,478,020 | |
City of Austin, Texas (Travis, Williamson and Hays Counties), Water and Wastewater System Refunding Bonds, Series 2010A | | | 5.000 | % | | | 11/15/2026 | | | | Aa2 | | | | 2,465,000 | | | | 2,795,261 | |
Trinity River Authority of Texas, (Tarrant County Water Project) Improvement Revenue Bonds, Series 2008 | | | 5.750 | % | | | 02/01/2027 | | | | Aa3 | | | | 1,000,000 | | | | 1,150,330 | |
Parker County, Texas, Unlimited Tax Road Bonds, Series 2009 | | | 5.000 | % | | | 02/15/2027 | | | | AA | | | | 1,000,000 | | | | 1,149,810 | |
New Braunfels Independent School District (A political subdivision of the State of Texas located in Comal and Guadalupe Counties, Texas), Unlimited Tax School Building Bonds, Series 2008 | | | 5.000 | % | | | 02/01/2028 | | | | AA | | | | 1,000,000 | | | | 1,092,230 | |
Conroe Independent School District, (A political subdivision of the State of Texas located within Montgomery County, Texas) Unlimited Tax School Building Bonds, Series 2009A | | | 5.250 | % | | | 02/15/2028 | | | | Aa2 | | | | 1,000,000 | | | | 1,125,520 | |
| | | | | | | | | | | | | | | | | | | | |
| | | | | | | | | | | | | | | | | | | 24,721,417 | |
| | | | | | | | | | | | | | | | | | | | |
Utah (0.92%) | | | | | | | | | | | | | | | | | | | | |
Park City, Utah, Water Revenue Bonds, Series 2010, (Bank Qualified) | | | 4.000 | % | | | 12/15/2020 | | | | Aa2 | | | | 410,000 | | | | 456,592 | |
Park City, Utah, Water Revenue Bonds, Series 2010, (Bank Qualified) | | | 4.000 | % | | | 12/15/2021 | | | | Aa2 | | | | 600,000 | | | | 661,536 | |
Davis County School District Board of Education, Davis County, Utah, General Obligation School Building Bonds (Utah School Bond Guaranty Program), Series 2007 | | | 4.750 | % | | | 06/01/2022 | | | | Aa2 | | | | 2,375,000 | | | | 2,636,844 | |
| | |
| 30 | | See accompanying notes to financial statements. |
STATE FARM ASSOCIATES’ FUNDS TRUST MUNICIPAL BOND FUND
SCHEDULE OF INVESTMENTS (continued)
May 31, 2014
(Unaudited)
| | | | | | | | | | | | | | | | | | | | |
| | | Coupon
rate | | | Maturity date | | | Rating (a) | | | Principal
amount | | | Value | |
Long-term Municipal Bonds (Cont.) | | | | | | | | | | | | | | | | | | | | |
Utah (Cont.) | | | | | | | | | | | | | | | | | | | | |
Ogden City, Utah, Sewer and Water Revenue Bonds, Series 2008 | | | 5.000 | % | | | 06/15/2029 | | | | Aa3 | | | $ | 1,970,000 | | | $ | 2,189,675 | |
| | | | | | | | | | | | | | | | | | | | |
| | | | | | | | | | | | | | | | | | | 5,944,647 | |
| | | | | | | | | | | | | | | | | | | | |
Virginia (2.82%) | | | | | | | | | | | | | | | | | | | | |
Rivanna Water and Sewer Authority, Regional Water and Sewer System Revenue and Refunding Bonds, Series 2005B | | | 4.500 | % | | | 10/01/2019 | | | | Aa2 | | | | 1,020,000 | | | | 1,061,208 | |
County of Chesterfield, Virginia, Water and Sewer Revenue Bonds, Series 2007 | | | 4.250 | % | | | 11/01/2020 | | | | Aaa | | | | 2,540,000 | | | | 2,744,800 | |
Henrico County, Virginia, General Obligation Public Improvement Bonds, Series 2006 (Prerefunded to 12-01-2016 @ 100) (b) | | | 4.125 | % | | | 12/01/2020 | | | | Aaa | | | | 2,100,000 | | | | 2,294,292 | |
Virginia Public School Authority, School Financing Bonds (1997 Resolution), Refunding Series 2009 C | | | 4.000 | % | | | 08/01/2021 | | | | Aa1 | | | | 1,500,000 | | | | 1,656,390 | |
County of Spotsylvania, Virginia, Water and Sewer System Revenue Bonds, Series 2007 | | | 5.000 | % | | | 06/01/2023 | | | | Aa3 | | | | 1,235,000 | | | | 1,351,115 | |
Loudoun County, Virginia, General Obligation Public Improvement Bonds, Series 2011A | | | 4.000 | % | | | 12/01/2025 | | | | Aaa | | | | 1,400,000 | | | | 1,534,792 | |
Virginia Public School Authority, School Financing Bonds (1997 Resolution), Series 2004A (Prerefunded to 08-01-2014 @ 100) (b) | | | 4.750 | % | | | 08/01/2026 | | | | Aa1 | | | | 1,000,000 | | | | 1,007,280 | |
Virginia Public School Authority, Special Obligation School Financing Bonds, Fluvanna County, Series 2008 (Prerefunded to
12-01-2018 @ 100) (b) | | | 6.250 | % | | | 12/01/2026 | | | | Aa2 | | | | 2,000,000 | | | | 2,456,100 | |
Loudoun County Sanitation Authority (Virginia), Water and Sewer System Revenue and Refunding Bonds, Series 2013 | | | 4.000 | % | | | 01/01/2027 | | | | Aa1 | | | | 650,000 | | | | 706,498 | |
County of Stafford, Virginia, General Obligation Public Improvement Bonds, Series 2013 | | | 4.000 | % | | | 07/01/2030 | | | | Aa2 | | | | 1,205,000 | | | | 1,300,087 | |
Virginia Public School Authority, School Financing Bonds (1997 Resolution), Series 2012 D | | | 4.000 | % | | | 08/01/2030 | | | | Aa1 | | | | 2,000,000 | | | | 2,121,400 | |
| | | | | | | | | | | | | | | | | | | | |
| | | | | | | | | | | | | | | | | | | 18,233,962 | |
| | | | | | | | | | | | | | | | | | | | |
Washington (4.36%) | | | | | | | | | | | | | | | | | | | | |
Tukwila School District No. 406, King County, Washington, Unlimited Tax General Obligation Refunding Bonds, 2004 (Prerefunded to
12-01-2014 @ 100) (b) | | | 5.000 | % | | | 12/01/2017 | | | | Aa2 | | | | 1,000,000 | | | | 1,023,730 | |
Bethel School District No. 403, Pierce County, Washington, Unlimited Tax General Obligation Bonds, 2006 (Prerefunded to 06-01-2016 @ 100) (b) | | | 5.000 | % | | | 12/01/2020 | | | | Aa2 | | | | 1,000,000 | | | | 1,092,630 | |
Public Utility District No. 1 of Franklin County, Washington, Electric Revenue and Refunding Bonds, Series 2007 | | | 4.750 | % | | | 09/01/2022 | | | | A | | | | 985,000 | | | | 1,068,942 | |
Public Utility District No. 1 of Franklin County, Washington, Electric Revenue and Refunding Bonds, Series 2007 (Prerefunded to
09-01-2017 @ 100) (b) | | | 4.750 | % | | | 09/01/2022 | | | | NR | | | | 15,000 | | | | 17,006 | |
Issaquah School District No. 411, King County, Washington, Unlimited Tax General Obligation and Refunding Bonds, 2012 | | | 2.500 | % | | | 12/01/2022 | | | | AA+ | | | | 680,000 | | | | 683,114 | |
Public Utility District No. 1 of Douglas County, Washington, Electric Distribution System Revenue and Refunding Bonds, Series 2012 | | | 3.000 | % | | | 12/01/2022 | | | | Aa3 | | | | 820,000 | | | | 836,056 | |
Public Utility District No. 1 of Douglas County, Washington, Electric Distribution System Revenue and Refunding Bonds, Series 2012 | | | 5.000 | % | | | 12/01/2023 | | | | Aa3 | | | | 505,000 | | | | 595,552 | |
Public Utility District No. 1 of Klickitat County, Washington, Electric System Revenue and Refunding Bonds, Series 2006B | | | 5.000 | % | | | 12/01/2023 | | | | A2 | | | | 1,000,000 | | | | 1,097,930 | |
College Place School District No. 250, Walla Walla County, Washington, Unlimited Tax General Obligation Bonds, Series 2012 | | | 4.000 | % | | | 12/01/2024 | | | | A1 | | | | 1,875,000 | | | | 2,011,481 | |
Yakima School District No. 7, Yakima County, Washington, Unlimited Tax General Obligation and Refunding Bonds, 2009 | | | 4.625 | % | | | 12/01/2024 | | | | Aa3 | | | | 4,000,000 | | | | 4,547,960 | |
Public Utility District No. 1 of Clark County, Washington, Water System Revenue Bonds, Series 2008 | | | 5.000 | % | | | 01/01/2025 | | | | Aa2 | | | | 565,000 | | | | 637,862 | |
The City of Seattle, Washington, Municipal Light and Power Improvement and Refunding Revenue Bonds, 2008 | | | 6.000 | % | | | 04/01/2025 | | | | Aa2 | | | | 1,325,000 | | | | 1,576,313 | |
Bellevue School District No. 405, King County, Washington, Unlimited Tax General Obligation Bonds, 2008 | | | 4.750 | % | | | 12/01/2025 | | | | AA+ | | | | 1,000,000 | | | | 1,122,570 | |
Lake Washington School District No. 414, King County, Washington, Unlimited Tax General Obligation Bonds, 2008 | | | 5.000 | % | | | 12/01/2025 | | | | AA | | | | 2,000,000 | | | | 2,299,200 | |
Public Utility District No. 1 of Clark County, Washington, Water System Revenue Bonds, Series 2008 | | | 5.000 | % | | | 01/01/2026 | | | | Aa2 | | | | 500,000 | | | | 563,640 | |
State of Washington, Various Purpose General Obligation Refunding Bonds, Series R-2013C | | | 4.000 | % | | | 07/01/2026 | | | | Aa1 | | | | 2,500,000 | | | | 2,728,425 | |
| | |
| See accompanying notes to financial statements. | | 31 |
STATE FARM ASSOCIATES’ FUNDS TRUST MUNICIPAL BOND FUND
SCHEDULE OF INVESTMENTS (continued)
May 31, 2014
(Unaudited)
| | | | | | | | | | | | | | | | | | | | |
| | | Coupon
rate | | | Maturity date | | | Rating (a) | | | Principal
amount | | | Value | |
Long-term Municipal Bonds (Cont.) | | | | | | | | | | | | | | | | | | | | |
Washington (Cont.) | | | | | | | | | | | | | | | | | | | | |
Public Utility District No. 1 of Cowlitz County, Washington, Production System Revenue Refunding Bonds, 2014 (c) | | | 5.000 | % | | | 09/01/2029 | | | | A1 | | | $ | 1,000,000 | | | $ | 1,133,460 | |
Public Utility District No. 1 of Clark County, Washington, Water System Revenue Bonds, Series 2014 (c) | | | 5.000 | % | | | 01/01/2030 | | | | Aa2 | | | | 985,000 | | | | 1,136,355 | |
Public Utility District No. 1 of Cowlitz County, Washington, Production System Revenue Refunding Bonds, 2014 (c) | | | 5.000 | % | | | 09/01/2030 | | | | A1 | | | | 2,100,000 | | | | 2,365,398 | |
State of Washington, Various Purpose General Obligation Bonds, Series 2009A | | | 5.000 | % | | | 07/01/2031 | | | | Aa1 | | | | 1,500,000 | | | | 1,683,990 | |
| | | | | | | | | | | | | | | | | | | | |
| | | | | | | | | | | | | | | | | | | 28,221,614 | |
| | | | | | | | | | | | | | | | | | | | |
West Virginia (1.97%) | | | | | | | | | | | | | | | | | | | | |
West Virginia University Board of Governors, University Improvement Revenue Bonds (West Virginia University Projects), 2011 Series B | | | 5.000 | % | | | 10/01/2023 | | | | A+ | | | | 2,510,000 | | | | 2,962,528 | |
West Virginia University Board of Governors, University Improvement Revenue Bonds (West Virginia University Projects), 2011 Series B | | | 5.000 | % | | | 10/01/2024 | | | | A+ | | | | 3,200,000 | | | | 3,748,704 | |
West Virginia University Board of Governors, University Revenue Improvement Bonds (West Virginia University Projects), 2004 Series C (Prerefunded to 10-01-2014 @ 100) (b) | | | 5.000 | % | | | 10/01/2024 | | | | A+ | | | | 2,500,000 | | | | 2,539,375 | |
The Board of Education of the County of Manongalia (West Virginia), Public School Refunding Bonds, Series 2012 | | | 4.000 | % | | | 05/01/2025 | | | | AA | | | | 1,105,000 | | | | 1,179,046 | |
The Board of Education of the County of Manongalia (West Virginia), Public School Refunding Bonds, Series 2012 | | | 4.000 | % | | | 05/01/2026 | | | | AA | | | | 2,180,000 | | | | 2,307,203 | |
| | | | | | | | | | | | | | | | | | | | |
| | | | | | | | | | | | | | | | | | | 12,736,856 | |
| | | | | | | | | | | | | | | | | | | | |
Wisconsin (1.84%) | | | | | | | | | | | | | | | | | | | | |
Village of Whitefish Bay, Wisconsin (Milwaukee County), General Obligation Corporate Purpose Bonds, Series 2013A | | | 2.250 | % | | | 04/01/2021 | | | | Aa1 | | | | 250,000 | | | | 258,660 | |
City of Sturgeon Bay, Door County, Wisconsin, General Obligation Refunding Bonds (Prerefunded to 10-01-2016 @ 100) (b) | | | 4.750 | % | | | 10/01/2021 | | | | Aa3 | | | | 545,000 | | | | 600,743 | |
School District of New Richmond, St. Croix County, Wisconsin, General Obligation Refunding Bonds (Prerefunded to
04-01-2017 @ 100) (b) | | | 4.750 | % | | | 04/01/2022 | | | | Aa2 | | | | 1,000,000 | | | | 1,118,160 | |
Village of Whitefish Bay, Wisconsin (Milwaukee County), General Obligation Corporate Purpose Bonds, Series 2013A | | | 2.500 | % | | | 04/01/2022 | | | | Aa1 | | | | 175,000 | | | | 182,032 | |
City of Sheboygan, Sheboygan County, Wisconsin, General Obligation Corporate Purpose Bonds, Series 2007B | | | 4.750 | % | | | 10/01/2022 | | | | AA- | | | | 800,000 | | | | 922,880 | |
Village of Whitefish Bay, Wisconsin (Milwaukee County), General Obligation Corporate Purpose Bonds, Series 2013A | | | 2.500 | % | | | 04/01/2023 | | | | Aa1 | | | | 285,000 | | | | 292,025 | |
State of Wisconsin, General Obligation Bonds of 2007, Series B (Prerefunded to 05-01-2015 @ 100) (b) | | | 4.750 | % | | | 05/01/2023 | | | | Aa2 | | | | 2,335,000 | | | | 2,431,809 | |
City of Sheboygan, Sheboygan County, Wisconsin, General Obligation Corporate Purpose Bonds, Series 2007B | | | 4.750 | % | | | 10/01/2023 | | | | AA- | | | | 300,000 | | | | 343,218 | |
City of Fond Du Lac, Fond Du Lac County, Wisconsin, Waterworks System Revenue Bonds, Series 2010 | | | 5.000 | % | | | 09/01/2025 | | | | A+ | | | | 1,000,000 | | | | 1,105,830 | |
Western Technical College District, Wisconsin, General Obligation Refunding Bonds, Series 2013C | | | 5.000 | % | | | 04/01/2029 | | | | AA+ | | | | 3,000,000 | | | | 3,496,050 | |
State of Wisconsin, General Obligation Bonds of 2008, Series D | | | 6.000 | % | | | 05/01/2029 | | | | Aa2 | | | | 1,000,000 | | | | 1,174,760 | |
| | | | | | | | | | | | | | | | | | | | |
| | | | | | | | | | | | | | | | | | | 11,926,167 | |
| | | | | | | | | | | | | | | | | | | | |
Wyoming (0.28%) | | | | | | | | | | | | | | | | | | | | |
City of Cheyenne, Wyoming, Refunding Revenue Water Bonds, Series 2007 (Prerefunded to 12-01-2015 @ 100) (b) | | | 5.000 | % | | | 12/01/2024 | | | | AA | | | | 1,700,000 | | | | 1,819,884 | |
| | | | | | | | | | | | | | | | | | | | |
Total Long-term Municipal Bonds | | | | | | | | | | | | | | | | | | | | |
(cost $587,834,097) | | | | | | | | | | | | | | | | | | | 623,070,572 | |
| | | | | | | | | | | | | | | | | | | | |
| | |
| 32 | | See accompanying notes to financial statements. |
STATE FARM ASSOCIATES’ FUNDS TRUST MUNICIPAL BOND FUND
SCHEDULE OF INVESTMENTS (continued)
May 31, 2014
(Unaudited)
| | | | | | | | |
| | | Shares | | | Value | |
Short-term Investments (3.04%) | | | | | | | | |
JPMorgan Tax Free Money Market Fund | | | 19,705,648 | | | $ | 19,705,648 | |
| | | | | | | | |
Total Short-term Investments | | | | | | | | |
(cost $19,705,648) | | | | | | | 19,705,648 | |
| | | | | | | | |
TOTAL INVESTMENTS (99.34%) | | | | | | | | |
(cost $607,539,745) | | | | | | | 642,776,220 | |
OTHER ASSETS, NET OF LIABILITIES (0.66%) | | | | | | | 4,255,819 | |
| | | | | | | | |
NET ASSETS (100.00%) | | | | | | $ | 647,032,039 | |
| | | | | | | | |
| (a) | Ratings are not audited and represent the lower of Moody’s or S&P issuer specific ratings. |
| (b) | Advanced Refunded Bonds are backed by an escrow or trust containing U.S. Government, U.S. Government Agency or other securities to support the timely payment of principal and interest. |
| (c) | Security purchased on a “when-issued” basis. |
NR - Not Rated
| | |
| See accompanying notes to financial statements. | | 33 |
STATE FARM ASSOCIATES’ FUNDS TRUST
STATEMENTS OF ASSETS AND LIABILITIES
May 31, 2014
(Unaudited)
| | | | | | | | | | | | | | | | |
| | | Growth Fund | | | Balanced Fund | | | Interim Fund | | | Municipal Bond
Fund | |
Assets | | | | | | | | | | | | | | | | |
Investments in securities at identified cost | | $ | 1,205,513,141 | | | | 905,354,959 | | | | 355,382,169 | | | | 607,539,745 | |
| | | | | | | | | | | | | | | | |
Investments in securities at market value | | $ | 4,037,452,092 | | | | 1,634,526,689 | | | | 357,720,468 | | | | 642,776,220 | |
Receivable for: | | | | | | | | | | | | | | | | |
Dividends and interest | | | 12,697,205 | | | | 7,343,075 | | | | 2,189,044 | | | | 7,612,626 | |
Shares of the Fund sold | | | 2,279,767 | | | | 1,131,232 | | | | 643,774 | | | | 179,610 | |
Securities sold | | | — | | | | — | | | | — | | | | 1,687,315 | |
Prepaid expenses | | | 70,858 | | | | 30,379 | | | | 8,584 | | | | 11,947 | |
| | | | | | | | | | | | | | | | |
Total assets | | | 4,052,499,922 | | | | 1,643,031,375 | | | | 360,561,870 | | | | 652,267,718 | |
| | | | | | | | | | | | | | | | |
Liabilities and Net Assets | | | | | | | | | | | | | | | | |
Distributions to shareholders | | | — | | | | — | | | | 4,289 | | | | 356,866 | |
Payable for: | | | | | | | | | | | | | | | | |
Shares of the Fund redeemed | | | 206,456 | | | | 680,719 | | | | 125,777 | | | | 85,683 | |
Securities purchased | | | — | | | | 4,984,870 | | | | — | | | | 4,644,033 | |
Due to affiliates | | | 433,262 | | | | 187,250 | | | | 46,607 | | | | 82,267 | |
Accrued liabilities | | | 103,157 | | | | 66,514 | | | | 43,462 | | | | 66,830 | |
| | | | | | | | | | | | | | | | |
Total liabilities | | | 742,875 | | | | 5,919,353 | | | | 220,135 | | | | 5,235,679 | |
| | | | | | | | | | | | | | | | |
Net assets applicable to shares outstanding of common stock | | $ | 4,051,757,047 | | | | 1,637,112,022 | | | | 360,341,735 | | | | 647,032,039 | |
| | | | | | | | | | | | | | | | |
Fund shares outstanding (no par value, unlimited number of shares authorized) | | | 56,116,890 | | | | 24,986,453 | | | | 35,932,095 | | | | 73,234,652 | |
Net asset value, offering price and redemption price per share | | $ | 72.20 | | | | 65.52 | | | | 10.03 | | | | 8.84 | |
| | | | | | | | | | | | | | | | |
Analysis of Net Assets | | | | | | | | | | | | | | | | |
Paid-in-capital | | $ | 1,241,952,031 | | | | 893,710,239 | | | | 358,463,952 | | | | 611,859,210 | |
Accumulated net realized gain (loss) | | | (64,228,940 | ) | | | (4,554,440 | ) | | | (460,516 | ) | | | (63,646 | ) |
Net unrealized appreciation (depreciation) | | | 2,831,947,635 | | | | 729,171,890 | | | | 2,338,299 | | | | 35,236,475 | |
Undistributed net investment income (loss) | | | 42,086,321 | | | | 18,784,333 | | | | — | | | | — | |
| | | | | | | | | | | | | | | | |
Net assets applicable to shares outstanding | | $ | 4,051,757,047 | | | | 1,637,112,022 | | | | 360,341,735 | | | | 647,032,039 | |
| | | | | | | | | | | | | | | | |
| | |
| 34 | | See accompanying notes to financial statements. |
STATE FARM ASSOCIATES’ FUNDS TRUST
STATEMENTS OF OPERATIONS
Six months ended May 31, 2014
(Unaudited)
| | | | | | | | | | | | | | | | |
| | | Growth Fund | | | Balanced Fund | | | Interim Fund | | | Municipal Bond
Fund | |
Investment Income: | | | | | | | | | | | | | | | | |
Dividends | | $ | 50,126,404 | | | | 12,505,710 | | | | 34 | | | | 535 | |
Interest | | | 2,928 | | | | 10,528,356 | | | | 2,766,083 | | | | 23,332 | |
Tax-exempt interest | | | — | | | | — | | | | — | | | | 11,659,533 | |
| | | | | | | | | | | | | | | | |
| | | 50,129,332 | | | | 23,034,066 | | | | 2,766,117 | | | | 11,683,400 | |
Less: foreign withholding taxes | | | (682,014 | ) | | | (199,059 | ) | | | — | | | | — | |
| | | | | | | | | | | | | | | | |
Total investment income | | | 49,447,318 | | | | 22,835,007 | | | | 2,766,117 | | | | 11,683,400 | |
Expenses: | | | | | | | | | | | | | | | | |
Investment advisory and management fees | | | 1,996,405 | | | | 856,680 | | | | 220,081 | | | | 352,762 | |
Trustees’ fees and expenses | | | 98,789 | | | | 40,210 | | | | 9,720 | | | | 16,469 | |
Reports to shareholders | | | 47,344 | | | | 22,607 | | | | 8,675 | | | | 8,243 | |
Professional fees | | | 53,083 | | | | 36,778 | | | | 28,779 | | | | 30,442 | |
Errors and omissions insurance | | | 24,299 | | | | 10,170 | | | | 2,914 | | | | 4,728 | |
Custodian fees | | | 57,396 | | | | 14,783 | | | | 259 | | | | 3,376 | |
ICI dues | | | 17,610 | | | | 7,553 | | | | 2,308 | | | | 2,397 | |
Regulatory fees | | | 20,147 | | | | 16,534 | | | | 15,138 | | | | 17,323 | |
Fidelity bond expense | | | 3,619 | | | | 1,509 | | | | 426 | | | | 702 | |
Securities valuation fees | | | 967 | | | | 12,569 | | | | 1,796 | | | | 64,027 | |
| | | | | | | | | | | | | | | | |
Total expenses | | | 2,319,659 | | | | 1,019,393 | | | | 290,096 | | | | 500,469 | |
| | | | | | | | | | | | | | | | |
Net investment income | | | 47,127,659 | | | | 21,815,614 | | | | 2,476,021 | | | | 11,182,931 | |
Realized and unrealized gain (loss): | | | | | | | | | | | | | | | | |
Net realized gain (loss) on sales of investments | | | 953,614 | | | | 505,330 | | | | (382,676 | ) | | | (63,646 | ) |
Net realized gain (loss) on foreign currency transactions | | | (4,812 | ) | | | (1,638 | ) | | | — | | | | — | |
Change in net unrealized appreciation (depreciation) on investments and foreign currency transactions | | | 262,965,196 | | | | 86,892,408 | | | | (804,787 | ) | | | 15,983,448 | |
| | | | | | | | | | | | | | | | |
Net realized and unrealized gain (loss) on investments | | | 263,913,998 | | | | 87,396,100 | | | | (1,187,463 | ) | | | 15,919,802 | |
| | | | | | | | | | | | | | | | |
Net change in net assets resulting from operations | | $ | 311,041,657 | | | | 109,211,714 | | | | 1,288,558 | | | | 27,102,733 | |
| | | | | | | | | | | | | | | | |
| | |
| See accompanying notes to financial statements. | | 35 |
STATE FARM ASSOCIATES’ FUNDS TRUST
STATEMENTS OF CHANGES IN NET ASSETS
| | | | | | | | |
| | | Growth Fund | |
Six months ended May 31, 2014 (Unaudited) and the year ended November 30, 2013 | | 2014 | | | 2013 | |
From operations: | | | | | | | | |
Net investment income | | $ | 47,127,659 | | | | 82,437,098 | |
Net realized gain (loss) | | | 948,802 | | | | 1,783,579 | |
Change in net unrealized appreciation or depreciation | | | 262,965,196 | | | | 655,864,832 | |
| | | | | | | | |
Net change in net assets resulting from operations | | | 311,041,657 | | | | 740,085,509 | |
Distributions to shareholders from and in excess of: | | | | | | | | |
Net investment income | | | (42,290,009 | ) | | | (81,962,353 | ) |
Net realized gain | | | — | | | | — | |
| | | | | | | | |
Total distributions to shareholders | | | (42,290,009 | ) | | | (81,962,353 | ) |
From Fund share transactions: | | | | | | | | |
Proceeds from shares sold | | | 130,387,039 | | | | 216,155,876 | |
Reinvestment of distributions | | | 40,147,432 | | | | 77,708,471 | |
| | | | | | | | |
| | | 170,534,471 | | | | 293,864,347 | |
Less payments for shares redeemed | | | (156,653,120 | ) | | | (328,000,859 | ) |
| | | | | | | | |
Net increase (decrease) in net assets from Fund share transactions | | | 13,881,351 | | | | (34,136,512 | ) |
| | | | | | | | |
Total increase (decrease) in net assets | | | 282,632,999 | | | | 623,986,644 | |
| | | | | | | | |
Net assets: | | | | | | | | |
Beginning of period | | | 3,769,124,048 | | | | 3,145,137,404 | |
| | | | | | | | |
End of period* | | $ | 4,051,757,047 | | | | 3,769,124,048 | |
| | | | | | | | |
* Including undistributed net investment income (loss) | | $ | 42,086,321 | | | | 37,248,671 | |
| | | | | | | | |
Share Information | | | | | | | | |
Sold | | | 1,892,614 | | | | 3,497,059 | |
Issued in reinvestment of distributions | | | 595,394 | | | | 1,326,996 | |
Redeemed | | | (2,278,094 | ) | | | (5,374,565 | ) |
| | | | | | | | |
Net increase (decrease) | | | 209,914 | | | | (550,510 | ) |
| | | | | | | | |
| | |
| 36 | | See accompanying notes to financial statements. |
| | | | | | | | | | | | | | | | | | | | | | |
| Balanced Fund | | | Interim Fund | | | Municipal Bond Fund | |
| 2014 | | | 2013 | | | 2014 | | | 2013 | | | 2014 | | | 2013 | |
| | | | | | | | | | | | | | | | | | | | | | | |
| | 21,815,614 | | | | 39,972,150 | | | | 2,476,021 | | | | 5,940,913 | | | | 11,182,931 | | | | 23,113,613 | |
| | 503,692 | | | | (3,447,247 | ) | | | (382,676 | ) | | | 448,120 | | | | (63,646 | ) | | | 598,337 | |
| | 86,892,408 | | | | 134,619,399 | | | | (804,787 | ) | | | (8,671,899 | ) | | | 15,983,448 | | | | (37,949,417 | ) |
| | | | | | | | | | | | | | | | | | | | | | |
| | 109,211,714 | | | | 171,144,302 | | | | 1,288,558 | | | | (2,282,866 | ) | | | 27,102,733 | | | | (14,237,467 | ) |
| | | | | | | | | | | | | | | | | | | | | | | |
| | (21,348,838 | ) | | | (39,236,681 | ) | | | (2,476,021 | ) | | | (5,940,913 | ) | | | (11,182,931 | ) | | | (23,113,613 | ) |
| | — | | | | — | | | | — | | | | — | | | | (598,337 | ) | | | (15,847 | ) |
| | | | | | | | | | | | | | | | | | | | | | |
| | (21,348,838 | ) | | | (39,236,681 | ) | | | (2,476,021 | ) | | | (5,940,913 | ) | | | (11,781,268 | ) | | | (23,129,460 | ) |
| | | | | | | | | | | | | | | | | | | | | | | |
| | 70,575,185 | | | | 152,639,867 | | | | 34,643,928 | | | | 91,418,200 | | | | 13,624,922 | | | | 59,706,437 | |
| | 20,457,467 | | | | 37,610,235 | | | | 2,426,250 | | | | 5,783,911 | | | | 9,449,134 | | | | 18,561,259 | |
| | | | | | | | | | | | | | | | | | | | | | |
| | 91,032,652 | | | | 190,250,102 | | | | 37,070,178 | | | | 97,202,111 | | | | 23,074,056 | | | | 78,267,696 | |
| | (82,618,805 | ) | | | (135,782,699 | ) | | | (59,993,990 | ) | | | (136,582,845 | ) | | | (31,221,090 | ) | | | (84,564,888 | ) |
| | | | | | | | | | | | | | | | | | | | | | |
| | 8,413,847 | | | | 54,467,403 | | | | (22,923,812 | ) | | | (39,380,734 | ) | | | (8,147,034 | ) | | | (6,297,192 | ) |
| | | | | | | | | | | | | | | | | | | | | | |
| | 96,276,723 | | | | 186,375,024 | | | | (24,111,275 | ) | | | (47,604,513 | ) | | | 7,174,431 | | | | (43,664,119 | ) |
| | | | | | | | | | | | | | | | | | | | | | |
| | | | | | | | | | | | | | | | | | | | | | | |
| | 1,540,835,299 | | | | 1,354,460,275 | | | | 384,453,010 | | �� | | 432,057,523 | | | | 639,857,608 | | | | 683,521,727 | |
| | | | | | | | | | | | | | | | | | | | | | |
| | 1,637,112,022 | | | | 1,540,835,299 | | | | 360,341,735 | | | | 384,453,010 | | | | 647,032,039 | | | | 639,857,608 | |
| | | | | | | | | | | | | | | | | | | | | | |
| | 18,784,333 | | | | 18,317,557 | | | | — | | | | — | | | | — | | | | — | |
| | | | | | | | | | | | | | | | | | | | | | |
| | | | | | | | | | | | | | | | | | | | | | | |
| | 1,120,480 | | | | 2,579,295 | | | | 3,463,428 | | | | 9,031,229 | | | | 1,558,991 | | | | 6,702,952 | |
| | 332,371 | | | | 656,583 | | | | 242,606 | | | | 571,831 | | | | 1,085,510 | | | | 2,110,234 | |
| | (1,313,681 | ) | | | (2,297,447 | ) | | | (6,000,034 | ) | | | (13,503,666 | ) | | | (3,603,155 | ) | | | (9,663,401 | ) |
| | | | | | | | | | | | | | | | | | | | | | |
| | 139,170 | | | | 938,431 | | | | (2,294,000 | ) | | | (3,900,606 | ) | | | (958,654 | ) | | | (850,215 | ) |
| | | | | | | | | | | | | | | | | | | | | | |
| | |
| See accompanying notes to financial statements. | | 37 |
STATE FARM ASSOCIATES’ FUNDS TRUST
NOTES TO FINANCIAL STATEMENTS
(Unaudited)
The State Farm Associates’ Funds Trust (the “Trust”) has four separate investment portfolios (each a “Fund” and together, the “Funds”). The Trust is registered under the Investment Company Act of 1940 as an open-end, management investment company. Each Fund has its own investment objective, investment policies, restrictions, and attendant risks and is diversified as defined in the Investment Company Act of 1940. State Farm Investment Management Corp. (“SFIMC”) is the Trust’s investment adviser.
The State Farm Growth Fund (the “Growth Fund”) seeks long-term growth of capital which may be supplemented by income. The Growth Fund seeks to achieve this objective by investing under normal circumstances at least 80% of its assets in common stocks and other income producing equity securities.
The State Farm Balanced Fund (the “Balanced Fund”) seeks long-term growth of principal while providing some current income. The Balanced Fund seeks to achieve its objective by investing under normal circumstances approximately 60% of its assets in common stocks, and ordinarily limits its common stock investments to no more than 75% of total assets. The Balanced Fund ordinarily invests at least 25% of its total assets in fixed income securities. The Balanced Fund invests in bonds to provide relative stability of principal and income.
The State Farm Interim Fund (the “Interim Fund”) seeks the realization over a period of years of the highest yield consistent with relatively low price volatility. The Interim Fund seeks to achieve its investment objective through investment in high quality debt securities with short and intermediate-term maturities.
The State Farm Municipal Bond Fund (the “Municipal Bond Fund”) seeks as high a rate of income exempt from federal income taxes as is consistent with prudent investment management. The Municipal Bond Fund seeks to achieve its investment objective through investment primarily in a diversified selection of municipal bonds with maturities of one to seventeen years. The Municipal Bond Fund normally invests so that either (1) at least 80% of the Fund’s net investment income is exempt from regular federal income tax or (2) at least 80% of the Fund’s net assets are invested in securities that produce income exempt from regular federal income tax.
| 2. | Significant Accounting Policies |
The following is a summary of significant accounting policies followed by the Funds in the preparation of their financial statements in accordance with U.S. generally accepted accounting principles (“GAAP”).
Fund Share Valuation
Fund shares are sold and redeemed on a continuous basis at net asset value. The net asset value per share is determined daily on each day the New York Stock Exchange is open. The net asset value for each Fund is determined as of the close of regular session trading on the New York Stock Exchange (usually 3:00 p.m. Central Time). The net asset value per share is computed by dividing the total value of a Fund’s investments and other assets, less liabilities, by the number of Fund shares outstanding.
Securities Valuation
All investments in securities are recorded at their fair value. For more information see Note 3 Securities Valuation.
Securities Transactions and Investment Income
For financial reporting purposes, security transactions are accounted for on trade date (date the order to buy or sell is executed) and dividend income is recorded on the ex-dividend date. Interest income is recorded on the accrual basis, and includes amortization of premiums and discounts on fixed income securities. Realized gains and losses from security transactions are reported on an identified cost basis.
Expenses
Expenses arising in connection with a specific Fund are allocated to that Fund. Common Trust expenses are allocated between the Funds in proportion to each Fund’s relative net assets.
Income Taxes and Distributions to Shareholders
Each Fund is a separate taxpayer for federal income tax purposes. It is the Funds’ policy to comply with the provisions of Subchapter M of the Internal Revenue Code applicable to regulated investment companies and, in the manner provided therein, to distribute substantially all of their taxable income, including any net realized gain on sales of investments, reportable for federal income tax purposes.
For more information refer to Note 4 Income Taxes and Distributions to Shareholders.
Foreign Currency Translation
Investment securities and other assets and liabilities denominated in a foreign currency are translated into U.S. dollars at the prevailing foreign exchange rates at May 31, 2014. Purchases and sales of investment securities and income and expense items denominated in foreign currencies are translated
38
STATE FARM ASSOCIATES’ FUNDS TRUST
NOTES TO FINANCIAL STATEMENTS (continued)
(Unaudited)
into U.S. dollars at the prevailing foreign exchange rates on the respective dates of transactions. That portion of realized and unrealized gains and losses on investments that results from fluctuations in foreign currency exchange rates is not separately disclosed, but is included with realized and unrealized gains and losses on investment securities.
Use of Estimates
The preparation of financial statements in conformity with GAAP requires management to make estimates and assumptions that affect the amounts reported in the financial statements and accompanying notes. Actual results could differ from those estimates.
Commitments and Contingencies
In the normal course of business, the Trust enters into contracts on behalf of the Funds that may contain provisions for general indemnifications. Each Fund’s maximum exposure under these indemnification provisions is unknown, as this would involve future claims that may be made against each Fund that are not known at this time. However, based on experience, the Funds believe the risk of loss from these indemnification provisions is remote.
Securities Purchased on a “When-Issued” Basis
The Municipal Bond Fund may purchase municipal bonds on a “when-issued” basis. Delivery and payment for these securities may be a month or more after the purchase date, during which time such securities are subject to market fluctuations. The Municipal Bond Fund identifies and holds specific liquid assets with a market value at least equal to the amount of the when-issued purchase commitments in order to ensure that it can meet those commitments. It is possible that the securities will never be issued and the commitment cancelled. At May 31, 2014, the Municipal Bond Fund had commitments of $4,644,033 (representing 0.72% of net assets) for when-issued securities.
Investments are valued at fair value pursuant to valuation procedures approved by the Trust’s Board of Trustees (the “Board”). The valuation procedures assign to SFIMC the responsibility for determining fair value using the processes and factors as outlined in the valuation procedures. If SFIMC cannot determine fair value based on the valuation procedures, the Board or the Executive Committee of the Board will determine fair value.
Fair value is defined as the price that the Funds would receive to sell an asset or pay to transfer a liability in an orderly transaction between market participants at the measurement date. A three-tier hierarchy is used to classify fair value measurements for disclosure purposes. The three-tier hierarchy of inputs is summarized in three broad levels as follows:
| | • | | Level 1 - Unadjusted quoted prices in active markets that are accessible to the Funds for identical assets or liabilities. |
| | • | | Level 2 - Inputs other than quoted prices included within Level 1 that are observable for the asset or liability, either directly or indirectly. These inputs may include quoted prices for the identical instrument on an inactive market, quoted prices for similar instruments in active markets, interest rates, yield curves and credit spreads. For assets or liabilities with a specified (contractual) term, a Level 2 input must be observable for substantially the full term of the asset or liability. |
| | • | | Level 3 - Unobservable inputs for the asset or liability to the extent that relevant observable inputs are not available. These inputs, based on the best information available in the circumstances, would include reasonably available information about the assumptions that a market participant would use in valuing the asset or liability and might include SFIMC’s own data. |
To the extent that valuation is based on models or inputs that are less observable or unobservable in the market, the determination of fair value requires more judgment. Accordingly, the degree of judgment exercised in determining fair value is greatest for instruments categorized in Level 3.
The inputs used to measure the fair value of an asset or liability might be categorized within different levels of the fair value hierarchy. In those cases, the fair value measurement is categorized in its entirety in the same level of the fair value hierarchy as the lowest level input that is significant to the entire measurement.
Stocks, closed-end registered investment companies and exchange-traded funds (“ETFs”) traded on securities exchanges, or in an over-the-counter (“OTC”) market in which transaction prices are reported, are valued at the last sales price on the day of valuation or, if there are no reported sales on that day, at the last reported bid price for the day. Stocks traded on NASDAQ are valued at the NASDAQ Official Closing Price. Long-term debt securities and U.S.Treasury bills are generally valued using quotations provided by an independent pricing service. Short-term debt securities with remaining maturities of 60 days or less (other than U.S.Treasury bills) are generally valued on an amortized cost basis, which approximates market value. Investments in open-end investment companies are valued each day based on the closing net asset value of the respective fund. Short sales, if any, are valued at market value.
Portfolio securities that are primarily traded on foreign securities exchanges (“foreign securities”) are valued at the closing values of such securities on the respective exchange where each security is primarily traded. SFIMC may determine that a market quotation for a foreign security held by a Fund is not reliable because of events or circumstances that have occurred between the time of the market quotation and the time the net asset value of the Fund is calculated (“subsequent event”). A subsequent event might include company-specific developments, a development that might affect an entire
39
STATE FARM ASSOCIATES’ FUNDS TRUST
NOTES TO FINANCIAL STATEMENTS (continued)
(Unaudited)
market or region, a potentially global development or a significant change in one or more U.S. securities indexes. If SFIMC determines that the market quotation for a foreign security is not reliable, SFIMC may determine the foreign security’s value in SFIMC’s reasonable judgment.
For securities other than foreign securities, for which market prices are not readily available or are considered unreliable, SFIMC is required to obtain bid price quotations from brokers or dealers in the securities. If SFIMC cannot obtain a quotation for the security or if SFIMC believes the quotation does not represent the security’s fair value, then SFIMC will determine the security’s value in SFIMC’s reasonable judgment.
In determining a value based on reasonable judgment, SFIMC may use different methodologies, including multiple of earnings, multiple of book value, discount from market of a similar freely traded security or, for debt securities, yield to maturity. Other factors SFIMC may consider in determining value for a security include, but are not limited to, fundamental analytical data relating to the security, the nature and duration of any restrictions on disposition of the security, the last traded price of the security, significant global or regional events such as political unrest, natural disasters, and war, and significant movements in major market indices, ETFs, index futures or other financial instruments in the U.S. or other markets. All securities valued based on SFIMC’s reasonable judgment are subsequently reported to the Board on a quarterly basis.
SFIMC reviews the pricing methodologies of the Funds’ approved pricing vendors, including reviewing a vendor’s key inputs and assumptions in valuing securities. SFIMC also engages in transaction back-testing with respect to portfolio securities sold by the Funds to compare unrealized gains and losses to realized gains and losses.
The inputs or methodology used for valuing securities are not necessarily an indication of the risk associated with investing in those securities. The following is a summary of the inputs used to value each Fund’s assets and liabilities as of May 31, 2014:
| | | | | | | | | | | | | | | | | | |
| | | |
| | | Investments in Securities | | | |
| | | | | | |
Fund | | Level 1 | | | Level 2 | | | Level 3 | | | Total | | | |
Growth Fund | | | | | | | | | | | | | | | | | | |
Common Stocks (a) | | $ | 3,973,827,658 | | | $ | — | | | $ | — | | | $ | 3,973,827,658 | | | |
Short-term Investments | | | 63,624,434 | | | | — | | | | — | | | | 63,624,434 | | | |
Balanced Fund | | | | | | | | | | | | | | | | | | |
Common Stocks (a) | | | 1,001,278,822 | | | | — | | | | — | | | | 1,001,278,822 | | | |
Corporate Bonds (a) | | | — | | | | 318,385,747 | | | | — | | | | 318,385,747 | | | |
Foreign Government Bonds | | | — | | | | 2,792,525 | | | | — | | | | 2,792,525 | | | |
Agency Commercial Mortgage-Backed Securities | | | — | | | | 27,358,976 | | | | — | | | | 27,358,976 | | | |
Agency Notes & Bonds | | | — | | | | 4,870,710 | | | | — | | | | 4,870,710 | | | |
U.S. Treasury Obligations | | | — | | | | 271,598,045 | | | | — | | | | 271,598,045 | | | |
Short-term Investments | | | 8,241,864 | | | | — | | | | — | | | | 8,241,864 | | | |
Interim Fund | | | | | | | | | | | | | | | | | | |
U.S. Treasury Obligations | | | — | | | | 356,984,754 | | | | — | | | | 356,984,754 | | | |
Short-term Investments | | | 735,714 | | | | — | | | | — | | | | 735,714 | | | |
Municipal Bond Fund | | | | | | | | | | | | | | | | | | |
Long-term Municipal Bonds | | | — | | | | 623,070,572 | | | | — | | | | 623,070,572 | | | |
Short-term Investments | | | 19,705,648 | | | | — | | | | — | | | | 19,705,648 | | | |
| |
(a) Industry classification is disclosed in the Schedules of Investments. |
The Funds did not hold any Level 3 securities or derivative instruments as of November 30, 2013 or for the period ended May 31, 2014. There were no transfers of securities between Level 1 and Level 2 as of May 31, 2014 as compared to November 30, 2013.
| 4. | Income Taxes and Distributions to Shareholders |
As of November 30, 2013, the Trust’s management completed a review of uncertain tax positions taken by the Funds, if any, and determined that no tax liability was required for unrecognized tax benefits, and no additional disclosures were needed. Generally, the tax authorities can initiate examinations of tax returns within the three year period beginning on the date such returns are filed. As a result, some tax returns are still open and subject to examination. In addition, as of November 30, 2013, management is not aware of any tax positions for which it is reasonably possible that the total amounts of unrecognized tax benefits will significantly change for the period ending November 30, 2014.
40
STATE FARM ASSOCIATES’ FUNDS TRUST
NOTES TO FINANCIAL STATEMENTS (continued)
(Unaudited)
As of May 31, 2014, each Fund’s aggregate securities holdings’ unrealized gains and losses based on cost for federal income tax purposes were as follows:
| | | | | | | | | | | | | | | | |
Fund | | Cost of Investments
for Federal Tax Purposes | | | Gross Unrealized
Appreciation | | | Gross Unrealized
(Depreciation) | | | Net
Unrealized
Appreciation
(Depreciation) | |
Growth Fund | | $ | 1,205,513,141 | | | $ | 2,832,757,147 | | | $ | (818,196 | ) | | $ | 2,831,938,951 | |
Balanced Fund | | | 905,354,959 | | | | 734,873,198 | | | | (5,701,468 | ) | | | 729,171,730 | |
Interim Fund | | | 355,382,169 | | | | 3,816,556 | | | | (1,478,257 | ) | | | 2,338,299 | |
Municipal Bond Fund | | | 607,539,745 | | | | 36,274,417 | | | | (1,037,942 | ) | | | 35,236,475 | |
The differences, if any, between the cost of investments for federal income tax purposes and the cost of investments reflected on the Statements of Assets and Liabilities and Schedules of Investments are primarily related to the timing of recognition of gains and losses and investment income.
The Growth Fund and Balanced Fund declare and pay income dividends, if any, at least annually. The Interim Fund and Municipal Bond Fund declare dividends daily equal to each Fund’s respective net investment income, and distributions of such amounts are made on the last business day of each month.
Net realized gains on sales of investments, if any, are distributed annually after the close of the Fund’s fiscal year. Dividends and distributions payable to shareholders are recorded by the respective Fund on the ex-dividend date.
On June 26, 2014, the Growth Fund declared an ordinary income dividend of $0.79000 per share to shareholders of record on June 25, 2014 (reinvestment date June 26, 2014).
On June 26, 2014, the Balanced Fund declared an ordinary income dividend of $0.81000 per share to shareholders of record on June 25, 2014 (reinvestment date June 26, 2014).
After utilizing capital loss carryforwards to offset realized capital gains during the year ended November 30, 2013, the following Funds had unused capital loss carryforwards available for federal income tax purposes to be applied against future capital gains realized after November 30, 2013, if any. Future capital loss carryforward utilization in any given year may be subject to Internal Revenue Code limitations. If not applied, the carryforwards will expire as follows:
| | | | | | | | | | | | | | | | | | | | | | | | | | | | | | | | | | | | |
| | | | | | Non Expiring | | | Year of Expiration | | | | |
| | Utilized | | | Short-term | | | Long-term | | | 2014 | | | 2015 | | | 2016 | | | 2017 | | | 2018 | | | Total | |
Growth Fund | | $ | 1,745,325 | | | $ | — | | | $ | 15,756,014 | | | $ | — | | | $ | — | | | $ | 25,639,404 | | | $ | 14,963,272 | | | $ | 8,819,052 | | | $ | 65,177,742 | |
Balanced Fund | | | — | | | | — | | | | 5,058,132 | | | | — | | | | — | | | | — | | | | — | | | | — | | | | 5,058,132 | |
Interim Fund | | | 448,120 | | | | — | | | | — | | | | — | | | | 77,840 | | | | — | | | | — | | | | — | | | | 77,840 | |
Capital losses incurred on or after December 1, 2011 are permitted to carry forward indefinitely. These losses must be utilized prior to losses incurred before December 1, 2011. Therefore, any losses incurred prior to December 1, 2011 may be more likely to expire unused.
As of November 30, 2013, in accordance with federal tax regulations, the components of distributable earnings on a tax basis were as follows:
| | | | | | | | | | | | | | | | | | | | |
Fund | | Undistributed
Ordinary Income | | | Undistributed
Long-
term Gain | | | Unrealized
Appreciation (Depreciation) | | | Accumulated
Capital and Other Losses | | | Total | |
Growth Fund | | $ | 37,248,671 | | | $ | — | | | $ | 2,568,982,439 | | | $ | (65,177,742 | ) | | $ | 2,541,053,368 | |
Balanced Fund | | | 18,317,557 | | | | — | | | | 642,279,482 | | | | (5,058,132 | ) | | | 655,538,907 | |
Interim Fund | | | — | | | | — | | | | 3,143,086 | | | | (77,840 | ) | | | 3,065,246 | |
Municipal Bond Fund | | | — | | | | 598,337 | | | | 19,253,027 | | | | — | | | | 19,851,364 | |
The timing and characterization of certain income and capital gain distributions are determined annually in accordance with federal income tax regulations, which may differ from GAAP. These differences are primarily due to the recognition of net realized losses, the timing of Fund distributions, expiring capital loss carryforwards, and foreign currency transactions. As a result, net investment income and net realized gain or loss on investment transactions for a reporting period may differ from distributions during such period. Accordingly, each Fund may periodically make reclassifications among certain capital accounts without impacting its net asset value.
41
STATE FARM ASSOCIATES’ FUNDS TRUST
NOTES TO FINANCIAL STATEMENTS (continued)
(Unaudited)
As of November 30, 2013, these reclassifications were as follows:
| | | | | | | | | | | | |
Fund | | Paid in
Capital | | | Accumulated
Net Realized
Gain (Loss) | | | Accumulated
Undistributed Net
Investment Income (Loss) | |
Growth Fund | | $ | — | | | $ | 242,997 | | | $ | (242,997 | ) |
Balanced Fund | | | — | | | | (7,988 | ) | | | 7,988 | |
The tax character of distributions was designated as follows for the year ended November 30, 2013.
| | | | | | | | | | | | | | | | |
2013 | | Tax-Exempt Income | | | Ordinary Income | | | Long-
term Capital Gain | | | Total | |
Municipal Bond Fund | | $ | 23,073,787 | | | $ | 39,826 | | | $ | 15,847 | | | $ | 23,129,460 | |
For the remaining Funds, the tax distributions of ordinary income and long-term capital gains were the same as the distributions from net investment income and capital gains reflected in the Statements of Changes in Net Assets for the year ended November 30, 2013.
| 5. | Transactions with Affiliates |
The Trust has entered into an investment advisory and management services agreement with SFIMC pursuant to which each Fund pays SFIMC an annual fee (computed on a daily basis and paid monthly) at the following annual rates:
| | |
Growth Fund | | 0.20% of the first $100 million of average net assets |
| | | 0.15% of the next $100 million of average net assets |
| | | 0.10% of the average net assets in excess of $200 million |
| | |
Balanced Fund | | 0.20% of the first $100 million of average net assets |
| | | 0.15% of the next $100 million of average net assets |
| | | 0.10% of the average net assets in excess of $200 million |
| | |
Interim Fund | | 0.20% of the first $50 million of average net assets |
| | | 0.15% of the next $50 million of average net assets |
| | | 0.10% of the average net assets in excess of $100 million |
| | |
Municipal Bond Fund | | 0.20% of the first $50 million of average net assets |
| | | 0.15% of the next $50 million of average net assets |
| | | 0.10% of the average net assets in excess of $100 million |
Other than proceeds from the account fee imposed on certain shareholders of the Trust, the Funds do not pay any direct or indirect discount, commission or other compensation for transfer agent services provided by SFIMC or for distribution and underwriting services provided by State Farm VP Management Corp.
Certain officers and/or trustees of the Trust are also officers and/or directors of SFIMC. The Trust made no payments to its officers or trustees except for trustees’ fees paid to or accrued for the Trust’s independent trustees.
Expense Reduction Agreement
SFIMC has agreed to reimburse a Fund if, and to the extent, a Fund’s total annual operating expenses (excluding taxes, interest, extraordinary litigation expenses, brokerage commissions and other portfolio transaction costs) exceed 0.40% of the Fund’s average net assets.
Line of Credit
State Farm Mutual Automobile Insurance Company (“Auto Company”), the parent company of SFIMC, has entered into a Line of Credit Agreement with the Trust. Under that agreement, a Fund may request and Auto Company, in its complete discretion, may lend money to a Fund for up to 30 days on an unsecured basis. Auto Company will not lend more than $50 million at any one time to the Funds and to the other mutual funds advised by SFIMC. Under
42
STATE FARM ASSOCIATES’ FUNDS TRUST
NOTES TO FINANCIAL STATEMENTS (continued)
(Unaudited)
the agreement, a Fund will pay interest to Auto Company on any outstanding loan at a benchmark interest rate that approximates the rate that creditworthy corporate issuers pay on short-term commercial paper. The Funds did not borrow under the Line of Credit Agreement during the period ended May 31, 2014.
| 6. | Investment Transactions |
For the period ended May 31, 2014, investment transactions (exclusive of short-term instruments) were as follows:
| | | | | | | | | | | | | | | | |
| | | Purchases
(excluding U.S.
Government
Obligations) | | | Sales
(excluding U.S.
Government
Obligations) | | | Purchases of U.S.
Government
Obligations | | | Sales of U.S.
Government
Obligations | |
Growth Fund | | $ | 22,142,972 | | | $ | 28,800,394 | | | $ | — | | | $ | — | |
Balanced Fund | | | 51,445,778 | | | | 14,254,550 | | | | — | | | | 25,972,656 | |
Interim Fund | | | — | | | | — | | | | 19,737,109 | | | | 43,417,852 | |
Municipal Bond Fund | | | 16,310,509 | | | | 35,585,972 | | | | — | | | | — | |
43
FINANCIAL HIGHLIGHTS
The financial highlights table is intended to help you understand the financial performance of each Fund for the past five years. Certain information reflects financial results for a single Fund share. The total returns within each table represent the rate that an investor would have earned (or lost) on an investment in the Fund (assuming reinvestment of all dividends and distributions).
STATE FARM ASSOCIATES’ FUNDS TRUST GROWTH FUND
(For a share outstanding throughout each period)
| | | | | | | | | | | | | | | | | | | | | | | | |
| | | | | | Year ended November 30, | |
| | | Six months ended
May 31, 2014
(Unaudited) | | | 2013 | | | 2012 | | | 2011 | | | 2010 | | | 2009 | |
Net asset value, beginning of period | | $ | 67.42 | | | $ | 55.71 | | | | 52.10 | | | | 50.42 | | | | 49.23 | | | | 42.27 | |
| | | | | | |
Income from Investment Operations | | | | | | | | | | | | | | | | | | | | | | | | |
Net investment income (a) | | | 0.84 | | | | 1.47 | | | | 1.38 | | | | 1.23 | | | | 1.12 | | | | 1.14 | |
Net gain (loss) on investments (both realized and unrealized) | | | 4.70 | | | | 11.70 | | | | 3.57 | | | | 1.64 | | | | 1.17 | | | | 7.05 | |
| | | | | | | | | | | | | | | | | | | | | | | | |
Total from investment operations | | | 5.54 | | | | 13.17 | | | | 4.95 | | | | 2.87 | | | | 2.29 | | | | 8.19 | |
| | | | | | | | | | | | | | | | | | | | | | | | |
Less Distributions | | | | | | | | | | | | | | | | | | | | | | | | |
Net investment income | | | (0.76 | ) | | | (1.46 | ) | | | (1.34 | ) | | | (1.19 | ) | | | (1.10 | ) | | | (1.23 | ) |
Net realized gain | | | — | | | | — | | | | — | | | | — | | | | — | | | | — | |
| | | | | | | | | | | | | | | | | | | | | | | | |
Total distributions | | | (0.76 | ) | | | (1.46 | ) | | | (1.34 | ) | | | (1.19 | ) | | | (1.10 | ) | | | (1.23 | ) |
| | | | | | | | | | | | | | | | | | | | | | | | |
Net asset value, end of period | | $ | 72.20 | | | $ | 67.42 | | | | 55.71 | | | | 52.10 | | | | 50.42 | | | | 49.23 | |
| | | | | | | | | | | | | | | | | | | | | | | | |
| | | | | | |
Total Return | | | 8.29 | %(b) | | | 24.06 | % | | | 9.69 | % | | | 5.63 | % | | | 4.86 | % | | | 19.92 | % |
| | | | | | |
Ratios/Supplemental Data | | | | | | | | | | | | | | | | | | | | | | | | |
Net assets, end of period (millions) | | $ | 4,051.8 | | | $ | 3,769.1 | | | | 3,145.1 | | | | 3,033.1 | | | | 2,995.7 | | | | 2,981.1 | |
| | | | | | |
Average net asset ratios | | | | | | | | | | | | | | | | | | | | | | | | |
Expenses | | | 0.12 | %(c) | | | 0.12 | % | | | 0.12 | % | | | 0.12 | % | | | 0.12 | % | | | 0.13 | % |
Net investment income | | | 2.45 | %(c) | | | 2.38 | % | | | 2.53 | % | | | 2.32 | % | | | 2.29 | % | | | 2.71 | % |
| | | | | | |
Portfolio turnover rate (d) | | | 1 | %(c) | | | 1 | % | | | 0 | % | | | 1 | % | | | 1 | % | | | 1 | % |
| (a) | Average shares outstanding for the period were used to calculate net investment income per share. |
| (b) | Total return is not annualized for periods that are less than a full year. |
| (c) | Determined on an annualized basis. |
| (d) | Portfolio turnover rate rounds to less than 1% for the year ended November 30, 2012. |
| | |
| 44 | | See accompanying notes to financial statements. |
STATE FARM ASSOCIATES’ FUNDS TRUST BALANCED FUND
(For a share outstanding throughout each period)
| | | | | | | | | | | | | | | | | | | | | | | | |
| | | | | | Year ended November 30, | |
| | | Six months ended
May 31, 2014
(Unaudited) | | | 2013 | | | 2012 | | | 2011 | | | 2010 | | | 2009 | |
Net asset value, beginning of period | | $ | 62.01 | | | $ | 56.65 | | | | 54.43 | | | | 53.22 | | | | 52.17 | | | | 46.64 | |
| | | | | | |
Income from Investment Operations | | | | | | | | | | | | | | | | | | | | | | | | |
Net investment income (a) | | | 0.87 | | | | 1.63 | | | | 1.60 | | | | 1.56 | | | | 1.52 | | | | 1.64 | |
Net gain (loss) on investments (both realized and unrealized) | | | 3.50 | | | | 5.36 | | | | 2.26 | | | | 1.21 | | | | 1.06 | | | | 5.67 | |
| | | | | | | | | | | | | | | | | | | | | | | | |
Total from investment operations | | | 4.37 | | | | 6.99 | | | | 3.86 | | | | 2.77 | | | | 2.58 | | | | 7.31 | |
| | | | | | | | | | | | | | | | | | | | | | | | |
Less Distributions | | | | | | | | | | | | | | | | | | | | | | | | |
Net investment income | | | (0.86 | ) | | | (1.63 | ) | | | (1.58 | ) | | | (1.56 | ) | | | (1.53 | ) | | | (1.78 | ) |
Net realized gain (b) | | | — | | | | — | | | | (0.06 | ) | | | — | | | | — | | | | — | |
| | | | | | | | | | | | | | | | | | | | | | | | |
Total distributions | | | (0.86 | ) | | | (1.63 | ) | | | (1.64 | ) | | | (1.56 | ) | | | (1.53 | ) | | | (1.78 | ) |
| | | | | | | | | | | | | | | | | | | | | | | | |
Net asset value, end of period | | $ | 65.52 | | | $ | 62.01 | | | | 56.65 | | | | 54.43 | | | | 53.22 | | | | 52.17 | |
| | | | | | | | | | | | | | | | | | | | | | | | |
| | | | | | |
Total Return | | | 7.14 | %(c) | | | 12.59 | % | | | 7.26 | % | | | 5.21 | % | | | 5.15 | % | | | 16.17 | % |
| | | | | | |
Ratios/Supplemental Data | | | | | | | | | | | | | | | | | | | | | | | | |
Net assets, end of period (millions) | | $ | 1,637.1 | | | $ | 1,540.8 | | | | 1,354.5 | | | | 1,287.8 | | | | 1,248.9 | | | | 1,202.7 | |
| | | | | | |
Average net asset ratios | | | | | | | | | | | | | | | | | | | | | | | | |
Expenses | | | 0.13 | %(d) | | | 0.13 | % | | | 0.13 | % | | | 0.13 | % | | | 0.13 | % | | | 0.14 | % |
Net investment income | | | 2.79 | %(d) | | | 2.75 | % | | | 2.86 | % | | | 2.86 | % | | | 2.93 | % | | | 3.48 | % |
| | | | | | |
Portfolio turnover rate | | | 5 | %(d) | | | 5 | % | | | 5 | % | | | 6 | % | | | 5 | % | | | 1 | % |
| (a) | Average shares outstanding for the period were used to calculate net investment income per share. |
| (b) | Net realized gain distributions represent less than $0.01 per share for the year ended November 30, 2009. |
| (c) | Total return is not annualized for periods that are less than a full year. |
| (d) | Determined on an annualized basis. |
| | |
| See accompanying notes to financial statements. | | 45 |
STATE FARM ASSOCIATES’ FUNDS TRUST INTERIM FUND
(For a share outstanding throughout each period)
| | | | | | | | | | | | | | | | | | | | | | | | |
| | | | | | Year ended November 30, | |
| | | Six months ended
May 31, 2014
(Unaudited) | | | 2013 | | | 2012 | | | 2011 | | | 2010 | | | 2009 | |
Net asset value, beginning of period | | $ | 10.06 | | | $ | 10.26 | | | | 10.28 | | | | 10.30 | | | | 10.31 | | | | 10.30 | |
| | | | | | |
Income from Investment Operations | | | | | | | | | | | | | | | | | | | | | | | | |
Net investment income | | | 0.07 | | | | 0.15 | | | | 0.19 | | | | 0.24 | | | | 0.26 | | | | 0.28 | |
Net gain (loss) on investments (both realized and unrealized) | | | (0.03 | ) | | | (0.20 | ) | | | (0.02 | ) | | | (0.02 | ) | | | (0.01 | ) | | | 0.01 | |
| | | | | | | | | | | | | | | | | | | | | | | | |
Total from investment operations | | | 0.04 | | | | (0.05 | ) | | | 0.17 | | | | 0.22 | | | | 0.25 | | | | 0.29 | |
| | | | | | | | | | | | | | | | | | | | | | | | |
Less Distributions | | | | | | | | | | | | | | | | | | | | | | | | |
Net investment income | | | (0.07 | ) | | | (0.15 | ) | | | (0.19 | ) | | | (0.24 | ) | | | (0.26 | ) | | | (0.28 | ) |
Net realized gain | | | — | | | | — | | | | — | | | | — | | | | — | | | | — | |
| | | | | | | | | | | | | | | | | | | | | | | | |
Total distributions | | | (0.07 | ) | | | (0.15 | ) | | | (0.19 | ) | | | (0.24 | ) | | | (0.26 | ) | | | (0.28 | ) |
| | | | | | | | | | | | | | | | | | | | | | | | |
Net asset value, end of period | | $ | 10.03 | | | $ | 10.06 | | | | 10.26 | | | | 10.28 | | | | 10.30 | | | | 10.31 | |
| | | | | | | | | | | | | | | | | | | | | | | | |
| | | | | | |
Total Return | | | 0.37 | %(a) | | | (0.51 | )% | | | 1.66 | % | | | 2.19 | % | | | 2.43 | % | | | 2.81 | % |
| | | | | | |
Ratios/Supplemental Data | | | | | | | | | | | | | | | | | | | | | | | | |
Net assets, end of period (millions) | | $ | 360.3 | | | $ | 384.5 | | | | 432.1 | | | | 406.3 | | | | 375.2 | | | | 348.3 | |
| | | | | | |
Average net asset ratios | | | | | | | | | | | | | | | | | | | | | | | | |
Expenses | | | 0.16 | %(b) | | | 0.15 | % | | | 0.15 | % | | | 0.16 | % | | | 0.16 | % | | | 0.16 | % |
Net investment income | | | 1.35 | %(b) | | | 1.46 | % | | | 1.84 | % | | | 2.36 | % | | | 2.50 | % | | | 2.68 | % |
| | | | | | |
Portfolio turnover rate | | | 11 | %(b) | | | 17 | % | | | 24 | % | | | 17 | % | | | 11 | % | | | 11 | % |
| (a) | Total return is not annualized for periods that are less than a full year. |
| (b) | Determined on an annualized basis. |
| | |
| 46 | | See accompanying notes to financial statements. |
STATE FARM ASSOCIATES’ FUNDS TRUST MUNICIPAL BOND FUND
(For a share outstanding throughout each period)
| | | | | | | | | | | | | | | | | | | | | | | | |
| | | | | | Year ended November 30, | |
| | | Six months ended
May 31, 2014
(Unaudited) | | | 2013 | | | 2012 | | | 2011 | | | 2010 | | | 2009 | |
Net asset value, beginning of period | | $ | 8.62 | | | $ | 9.11 | | | | 8.79 | | | | 8.64 | | | | 8.70 | | | | 8.16 | |
| | | | | | |
Income from Investment Operations | | | | | | | | | | | | | | | | | | | | | | | | |
Net investment income | | | 0.15 | | | | 0.30 | | | | 0.32 | | | | 0.34 | | | | 0.35 | | | | 0.37 | |
Net gain (loss) on investments (both realized and unrealized) | | | 0.23 | | | | (0.49 | ) | | | 0.34 | | | | 0.16 | | | | (0.04 | ) | | | 0.56 | |
| | | | | | | | | | | | | | | | | | | | | | | | |
Total from investment operations | | | 0.38 | | | | (0.19 | ) | | | 0.66 | | | | 0.50 | | | | 0.31 | | | | 0.93 | |
| | | | | | | | | | | | | | | | | | | | | | | | |
Less Distributions | | | | | | | | | | | | | | | | | | | | | | | | |
Net investment income | | | (0.15 | ) | | | (0.30 | ) | | | (0.32 | ) | | | (0.34 | ) | | | (0.35 | ) | | | (0.37 | ) |
Net realized gain (a) | | | (0.01 | ) | | | — | | | | (0.02 | ) | | | (0.01 | ) | | | (0.02 | ) | | | (0.02 | ) |
| | | | | | | | | | | | | | | | | | | | | | | | |
Total distributions | | | (0.16 | ) | | | (0.30 | ) | | | (0.34 | ) | | | (0.35 | ) | | | (0.37 | ) | | | (0.39 | ) |
| | | | | | | | | | | | | | | | | | | | | | | | |
Net asset value, end of period | | $ | 8.84 | | | $ | 8.62 | | | | 9.11 | | | | 8.79 | | | | 8.64 | | | | 8.70 | |
| | | | | | | | | | | | | | | | | | | | | | | | |
| | | | | | |
Total Return | | | 4.46 | %(b) | | | (2.05 | )% | | | 7.63 | % | | | 5.97 | % | | | 3.64 | % | | | 11.53 | % |
| | | | | | |
Ratios/Supplemental Data | | | | | | | | | | | | | | | | | | | | | | | | |
Net assets, end of period (millions) | | $ | 647.0 | | | $ | 639.9 | | | | 683.5 | | | | 607.6 | | | | 585.0 | | | | 544.5 | |
| | | | | | |
Average net asset ratios | | | | | | | | | | | | | | | | | | | | | | | | |
Expenses | | | 0.16 | %(c) | | | 0.16 | % | | | 0.15 | % | | | 0.16 | % | | | 0.15 | % | | | 0.16 | % |
Net investment income | | | 3.54 | %(c) | | | 3.46 | % | | | 3.55 | % | | | 3.93 | % | | | 4.04 | % | | | 4.27 | % |
| | | | | | |
Portfolio turnover rate | | | 5 | %(c) | | | 11 | % | | | 4 | % | | | 11 | % | | | 9 | % | | | 9 | % |
| (a) | Net realized gain distributions represent less than $0.01 per share for the year ended November 30, 2013. |
| (b) | Total return is not annualized for periods that are less than a full year. |
| (c) | Determined on an annualized basis. |
| | |
| See accompanying notes to financial statements. | | 47 |
[THIS PAGE INTENTIONALLY LEFT BLANK]
48
[THIS PAGE INTENTIONALLY LEFT BLANK]
49
[THIS PAGE INTENTIONALLY LEFT BLANK]
50
Not applicable.
| ITEM 3. | AUDIT COMMITTEE FINANCIAL EXPERT. |
Not applicable.
| ITEM 4. | PRINCIPAL ACCOUNTANT FEES AND SERVICES. |
Not applicable.
| ITEM 5. | AUDIT COMMITTEE OF LISTED REGISTRANTS. |
Not applicable.
(a) The information required by this Item 6(a) is included as part of the report to shareholders under Item 1 of this Form N-CSR.
(b) Not applicable.
| ITEM 7. | DISCLOSURE OF PROXY VOTING POLICIES AND PROCEDURES FOR CLOSED-END MANAGEMENT INVESTMENT COMPANIES. |
Not applicable.
| ITEM 8. | PORTFOLIO MANAGERS OF CLOSED-END MANAGEMENT INVESTMENT COMPANIES. |
Not applicable.
| ITEM 9. | PURCHASES OF EQUITY SECURITIES BY CLOSED-END MANAGEMENT INVESTMENT COMPANY AND AFFILIATED PURCHASERS. |
Not applicable.
| ITEM 10. | SUBMISSION OF MATTERS TO A VOTE OF SECURITY HOLDERS. |
There were no material changes to the procedures by which shareholders may recommend nominees to the State Farm Associates’ Funds Trust Board of Trustees.
| ITEM 11. | CONTROLS AND PROCEDURES. |
(a) The registrant’s principal executive officer and principal financial officer evaluated the effectiveness of the registrant’s disclosure controls and procedures (as defined in Rule 30a-3(c) under the Investment Company Act of 1940 (the “Act”) (17 CFR 270.30a-3(c))) as of a date within 90 days of the filing date of this report (the “Evaluation Date”), and based on their evaluation as of the Evaluation Date of these controls and procedures as required by Rule 30a-3(b) under the Act (17 CFR 270.30a-3(b)) and Rules 13a-15(b) or 15d-15(b) under the Securities Exchange Act of 1934 (17 CFR 240.13a-15(b) or 240.15d-15(b)) (as applicable), concluded that the registrant’s disclosure controls and procedures are effective.
(b) No change in the registrant’s internal control over financial reporting (as defined in Rule 30a-3(d) under the Act (17 CFR 270.30a-3(d))) occurred during the second fiscal quarter of the period covered by this report that has materially affected, or is reasonably likely to materially affect, the registrant’s internal control over financial reporting.
(a)(1) Not applicable.
(a)(2) A separate certification for each principal executive officer and principal financial officer of the registrant as required by Rule 30a-2(a) under the Act (17 CFR 270.30a-2(a)): Attached hereto as EX-99.CERT.
(a)(3) Not applicable.
(b) Certification of principal executive officer and principal financial officer as required by Rule 30a-2(b) under the Act (17 CFR 270.30a-2(b)), Rule 13a-14(b) or Rule 15d-14(b) under the Securities Exchange Act of 1934 (17 CFR 240.13a-14(b) or 240.15d-14(b))(as applicable), and Section 1350 of Chapter 63 of Title 18 of the United States Code (18 U.S.C. 1350): Attached hereto as EX-99.906CERT.
SIGNATURES
Pursuant to the requirements of the Securities Exchange Act of 1934 and the Investment Company Act of 1940, the registrant has duly caused this report to be signed on its behalf by the undersigned, thereunto duly authorized.
| | |
State Farm Associates’ Funds Trust |
| |
By | | /s/ Michael L. Tipsord |
| | Michael L. Tipsord |
| | President |
Date July 29, 2014
Pursuant to the requirements of the Securities Exchange Act of 1934 and the Investment Company Act of 1940, this report has been signed below by the following persons on behalf of the registrant and in the capacities and on the dates indicated.
| | |
By | | /s/ Michael L. Tipsord |
| | Michael L. Tipsord |
| | President |
Date July 29, 2014
| | |
By | | /s/ Paul J. Smith |
| | Paul J. Smith |
| | Senior Vice President and Treasurer |
Date July 29, 2014