UNITED STATES
SECURITIES AND EXCHANGE COMMISSION
Washington, D.C. 20549
FORMN-CSR
CERTIFIED SHAREHOLDER REPORT OF REGISTERED
MANAGEMENT INVESTMENT COMPANIES
Investment Company Act file number811-01519
STATE FARM ASSOCIATES’ FUNDS TRUST
(Exact name of registrant as specified in charter)
| | |
One State Farm Plaza Bloomington, IL | | 61710-0001 |
| (Address of principal executive offices) | | (Zip code) |
| | |
| | Alan Goldberg |
| Paul J. Smith | | Stradley Ronon Stevens & Young, LLP |
| One State Farm Plaza | | 191 North Wacker Dr, Suite 1601 |
| Bloomington, Illinois 61710-0001 | | Chicago, Illinois 60606 |
| (Names and addresses of agents for service) |
Registrant’s telephone number, including area code:1-800-447-0740
Date of fiscal year end: 11/30/2018
Date of reporting period: 11/30/2018
| ITEM 1. | REPORTS TO STOCKHOLDERS. |
Beginning on January 1, 2021, as permitted by regulations adopted by the Securities and Exchange Commission, paper copies of the Funds’ annual and semi-annual shareholder reports will no longer be sent by mail, unless you specifically request paper copies of the reports. Instead, the reports will be made available on a website, and you will be notified by mail each time a report is posted and provided with a website link to access the report.
If you already elected to receive shareholder reports electronically, you will not be affected by this change and you need not take any action. You may elect to receive shareholder reports and other communications from a Fund electronically anytime by calling 1-800-447-0740.
You may elect to receive all future reports in paper free of charge. You may call 1-800-447-0740 to request that you continue to receive paper copies of your shareholder reports. Your election to receive reports in paper will apply to all Funds held with State Farm Mutual Funds.

Before investing, consider the Funds’ investment objectives, risks, charges and expenses. Contact State Farm VP Management Corp. (1-800-447-0740) for a prospectus or summary prospectus containing this and other information. Read it carefully.
A description of the policies and procedures that the Funds use to determine how to vote proxies relating to portfolio securities, and information regarding how the Funds voted proxies relating to portfolio securities during the most recent 12-month period ended June 30, are available without charge upon request at 1-800-447-0740 and at sec.gov.
The Funds file complete schedules of portfolio holdings for each Fund with the Securities and Exchange Commission (the “Commission”) for the first and third quarters of each fiscal year on Form N-Q. The Funds’ Forms N-Q are available on the Commission’s website at sec.gov. The Funds make the information on Form N-Q available to shareholders upon request without charge at 1-800-447-0740.
Any website referenced in this report is an inactive textual reference only, and information contained in or otherwise accessible through that website does not form a part of, and is not incorporated by reference into, this report.
ANNUAL REPORT
Electronic Delivery
As a State Farm Mutual Funds shareholder, we wish to remind you that you can elect to have future Annual Reports, Semi-Annual Reports, Prospectuses, statements, and tax forms delivered electronically rather than receiving large, bulky paper reports through the mail. This is a great way to help reduce internal fund costs related to printing and mailing these materials as well as a way to be environmentally friendly. Please consider signing up for electronic delivery today by going on statefarm.com or by calling 1-800-447-0740 for assistance.
Compensation Deduction or Automatic Investment Plan (AIP)1
State Farm Mutual Funds allow you to make regular investments in a Fund with compensation deduction (agent/employee only) or an Automatic Investment Plan through an electronic transfer of funds from your bank/credit union account. If you wish to begin compensation deduction or an Automatic Investment Plan, the minimum amount required for both initial and subsequent investments is $50. Please consider signing up today for compensation deduction by going on the State Farm intranet or signing up for AIP by calling 1-800-447-0740 for assistance.
State Farm VP Management Corp.
(Underwriter and Distributor of Securities Products)
One State Farm Plaza
Bloomington, Illinois 61710-0001
1-800-447-0740
statefarm.com
| 1 | Automatic investment plans do not assure a profit or protect against loss. |
Message to Shareholders of State Farm Associates’ Funds Trust
Dear Shareholders,
Thank you for investing with State Farm Mutual Funds®. Enclosed is the Annual Report for the 12-month period ended November 30, 2018, for the State Farm Associates’ Funds Trust (“the Trust”). In this report you will find management’s discussion of investment philosophy and process for each of the Funds offered by the Trust, factors that affected each Fund’s performance over the 12-month period, and benchmark index comparisons that are designed to put that performance into context.
State Farm Investment Management Corp. has consistently maintained a long-term, disciplined approach to managing investment risk and providing competitive investment products that can help you, our valued shareholder, with your investment goals.1 We believe that remaining focused on your long-term goals and maintaining an appropriate asset allocation mix are important elements in pursuing investment success.2
Market Review
During the 2018 fiscal year, U.S. equity and fixed income markets both experienced positive total returns.
The table below shows annual total returns for each of the four Funds compared to their respective benchmarks for the 12-month period ended November 30, 2018.
| | | | |
| Annual Total Returns (as of November 30, 2018)3 | | | | |
| | |
| | | Annual Total Returns | |
Fund | | 1-year | |
State Farm Growth Fund | | | 4.41% | |
Benchmark: S&P 500 Index | | | 6.26% | |
| | |
State Farm Balanced Fund | | | 2.49% | |
Benchmark: Blended benchmark* | | | 3.75% | |
| | |
State Farm Interim Fund | | | 0.33% | |
Benchmark: Bloomberg Barclays 1-5 Year U.S. Treasury Index | | | 0.37% | |
| | |
State Farm Municipal Bond Fund | | | 0.99% | |
Benchmark: Bloomberg Barclays 7-Year Municipal Bond Index | | | 1.26% | |
* 60% S&P 500 Index / 40% Bloomberg Barclays Intermediate Gov/Credit Index (rebalanced on a monthly basis) | |
The performance data quoted represents past performance and does not guarantee future results. Investment return and principal value will fluctuate and Fund shares, when redeemed, may be worth more or less than their original cost. Recent performance may be less than the figures shown. Obtain total returns current to the most recent month-end by calling 1-800-447-0740. It is not possible to invest directly in an index.
| 1 | Investing involves risk, including potential for loss. |
| 2 | Asset allocation does not assure a profit or protect against loss. |
| 3 | Source: State Farm Mutual Funds returns prepared by State Farm Investment Management Corp. (SFIMC), the Funds’ investment adviser. S&P 500 Index return provided by Bloomberg. The S&P 500 Index is a capitalization-weighted measure of common stocks of 500 large U.S. companies. |
The blended benchmark return provided by SFIMC. The blended benchmark is comprised of 60% S&P 500 Index / 40% Bloomberg Barclays Intermediate Gov/ Credit Index. The Bloomberg Barclays Intermediate Gov/Credit Index contains approximately 4,846 U.S. Treasury, corporate and other securities with an average maturity of about 4.29 years.
The Bloomberg Barclays 1-5 Year U.S. Treasury Index return provided by Bloomberg. The Bloomberg Barclays 1-5 Year U.S. Treasury Index measures the performance of short-term U.S. Treasury Securities maturing within one to five years.
The Bloomberg Barclays 7-Year Municipal Bond Index return provided by Bloomberg. The Bloomberg Barclays 7-Year Municipal Bond Index is an unmanaged index comprised of investment grade municipal bonds with maturities of six to eight years.
1
Message to Shareholders of State Farm Associates’ Funds Trust (continued)
During the period, U.S. equities (as represented by the S&P 500 Index) entered the tenth year of their bull-market run, supported by a growing U.S. economy and the passage of the Tax Cuts and Jobs Act, managing to achieve a 6.26% total return for the period, including dividends. Reducing the corporate tax rate helped to contribute to strong corporate earnings reports throughout the time period, particularly in the second quarter when after-tax profits for S&P 500 Index companies rose nearly 25%, year-over-year. The reduction in the corporate tax rate also helped to promote an increase in capital spending and share buybacks during the period. The increase in capital spending, employment, and consumer spending, among other factors, positively affected the overall health of the U.S. economy in the second quarter, which grew at an annualized rate above 4.0% for the first time since 2014. In September, the national unemployment rate fell to 3.7%, its lowest level since 1969.
The period was not without its challenges as multiple factors impacted equity returns and contributed to market volatility. The Federal Reserve (the “Fed”) voted to raise interest rates four times, contributing to an increase in the cost of borrowing for U.S. businesses and consumers. The U.S. Treasury curve rose and flattened. While consumer spending remained strong, existing home sales declined in six straight months during the period, influenced, in part, by an increase in mortgage rates. Fears that rising interest rates would also dampen other sectors of the economy helped contribute to pullbacks in the equity markets. Those downturns were also influenced by increasing friction between the U.S. and its trading partners that began in March when the Trump administration announced tariffs on steel and aluminum imports. The trade conflicts further intensified in the summer months when the administration introduced multiple rounds of tariffs on Chinese goods with the stated intent of reducing the trade deficit and curtailing the seizure of U.S. intellectual property. Despite a proposed revision to the North American Free Trade Agreement (“NAFTA”) – which, if passed, will be called the United States-Mexico-Canada Agreement (“USMCA”) – and the introduction of several new trade agreements between the U.S. and other nations, the uncertainty regarding the escalating trade conflict between the U.S. and China continued to weigh on markets during the period.
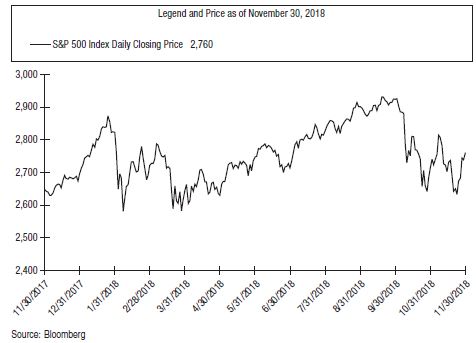
As represented by the S&P 500 Index in the chart below, U.S. equities ascended to a new historical closing price high of 2,872 on January 26. That record was promptly followed by a significant market retreat, resulting in a period low of 2,581 on February 8. The Index then staged a series of uneven climbs before reaching a new historical and period closing price high of 2,930 on September 20. That record was followed by another significant pullback in October before the Index rebounded to finish the period at 2,760 on November 30, 2018.
2
Message to Shareholders of State Farm Associates’ Funds Trust (continued)
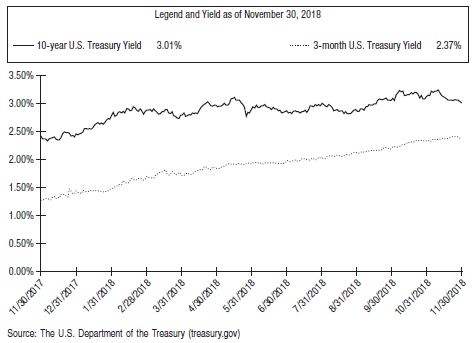
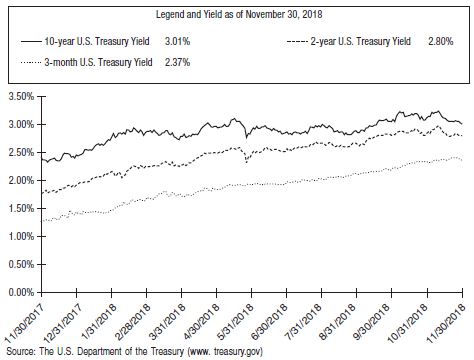
Among the major fixed income indices, the Bloomberg Barclays 1-5 Year Treasury Index and the Bloomberg Barclays 7-Year Municipal Bond Index posted total returns of 0.37% and 1.26%, respectively, as yields rose and bond prices fell over the 12-month timeframe. Both short-term (3-month) and long-term (10-year) U.S. Treasury yields increased over the period, the latter of which hit a seven-year high of 3.24% on November 8.4
Despite the increase in long-term rates, the yield curve flattened. The spread between short and long-term U.S. Treasury yields narrowed as short-term rates increased at a greater pace than long-term rates, influenced in part by the Fed’s four interest rate hikes during the period. The flattening of the yield curve continued in the final three weeks of November. Long-term yields fell from 3.24% to 3.01% after Fed officials suggested that the central bank may slow the pace of its interest rate hikes next year as it potentially moves closer to the end of its monetary policy tightening program. The Fed typically increases interest rates to help prevent the economy from overheating and causing an undesired rate of inflation. However, inflation remained near the Fed’s 2% target rate for much of the period.
Long-term yields were also weakened by continued strong demand from investors seeking the security and higher yields offered by U.S. Treasuries relative to their sovereign peers. While some unwinding of quantitative easing measures continued during the year in the U.S., foreign central banks generally continued to maintain their respective monetary stimulus programs. In June, the European Central Bank announced that it expected to end its bond buying program by the end of year, however, the slowdown in Eurozone economic growth throughout the period brought into question that reality. As a result, global bond yields remained low, compelling fixed income investors to seek out the relatively higher returns found in U.S. Treasuries, thereby exerting downward pressure on U.S. Treasury yields.
| 4 | Source: The U.S. Department of the Treasury. A 10-year U.S. Treasury Note is a debt obligation issued by the U.S. Treasury with a maturity of 10 years and that pays interest every six months. A 3-month U.S. Treasury Bill is a debt obligation issued by the U.S. Treasury that has a term of 92 days or less. U.S. Treasury securities are backed by the full faith and credit of the U.S. government and are guaranteed only as to the prompt payment of principal and interest, and are subject to market risks if sold prior to maturity. Bonds have historically been less volatile than stocks, but are sensitive to changes in interest rates. Past performance does not guarantee future results. |
3
Message to Shareholders of State Farm Associates’ Funds Trust (continued)
Included for your review are audited financial statements and a complete list of portfolio holdings to help you further understand the Funds you own. We encourage your review and consideration of this entire report.
On behalf of the entire State Farm Mutual Funds team, thank you for your continued business and allowing us to serve your investment needs.
|
| Sincerely, |
|
 |
| Joe R. Monk Jr. |
| Senior Vice President |
| State Farm Investment Management Corp. |
4
State Farm Growth Fund Management’s Discussion of Fund Performance (unaudited)
Overview
Describe the Fund’s investment objective and philosophy.
The State Farm Growth Fund is managed with a long-term investment orientation. Our investment process is based on a rigorous fundamental analysis of companies. We focus on risk as well as the potential for reward. We look for well managed companies with a business specialty that serves an appropriately-sized market opportunity. We prefer companies with a strong customer focus and a history of prudent financial decisions. We also believe that dividends are an important part of an investment’s total return and therefore prefer companies that pay a regular dividend. While we are conscious of how the Fund’s portfolio differs from its broad-based benchmark, the S&P 500 Index, we do not make decisions based upon the Index.
Describe the relevant market environment as it related to the Fund for the reporting period.
During the December 1, 2017 to November 30, 2018 reporting period equities entered the tenth year of their bull-market run, supported by a growing U.S. economy and the passage of the Tax Cuts and Jobs Act. Reducing the corporate tax rate helped to contribute to strong corporate earnings reports throughout the time period, particularly in the second quarter when after-tax profits for S&P 500 Index companies rose nearly 25%, year-over-year. The reduction in the corporate tax rate also helped to promote an increase in capital spending and share buybacks during the period. The increase in capital spending, employment, and consumer spending, among other factors, positively affected the overall health of the U.S. economy in the second quarter, which grew at an annualized rate above 4.0% for the first time since 2014. In September, the national unemployment rate fell to 3.7%, its lowest level since 1969.
The period was not without its challenges as multiple factors impacted equity returns and contributed to market volatility. The Federal Reserve (the “Fed”) voted to raise interest rates four times, contributing to an increase in the cost of borrowing for U.S. businesses and consumers. The U.S. Treasury curve rose and flattened. While consumer spending remained strong, existing home sales declined in six straight months during the period, influenced, in part, by an increase in mortgage rates. Fears that rising interest rates would also dampen other sectors of the economy helped contribute to pullbacks in the equity markets. Those downturns were also influenced by increasing friction between the U.S. and its trading partners that began in March when the Trump administration announced tariffs on steel and aluminum imports. The trade conflicts further intensified in the summer months when the administration introduced multiple rounds of tariffs on Chinese goods with the stated intent of reducing the trade deficit and curtailing the seizure of U.S. intellectual property. Despite a proposed revision to the North American Free Trade Agreement (“NAFTA”) – which, if passed, will be called the United States-Mexico-Canada Agreement (“USMCA”) – and the introduction of several new trade agreements between the U.S. and other nations, the uncertainty regarding the escalating trade conflict between the U.S. and China continued to weigh on markets during the period.
U.S. equities, as represented by the S&P 500 Index, ascended to a new historical closing price high of 2,872 on January 26. That record was promptly followed by a significant market retreat, resulting in a period low of 2,581 on February 8. The S& P 500 Index then staged a series of uneven climbs before reaching a new historical and period closing price high of 2,930 on September 20. That record was followed by another significant pullback in October before the S&P 500 Index rebounded to finish the period at 2,760 on November 30, 2018.
The total return for the S&P 500 Index was 6.26% for the 12-month reporting period. This performance reflected an increase in corporate earnings per share for the S&P 500 Index companies of approximately 27%, a contraction of the price/earnings valuation of the S&P 500 Index of approximately -18%, and a dividend return of approximately 2%. Within the relatively volatile U.S. equities market rally, growth generally outperformed value. The S&P 500 Growth Index returned 10.06% versus 2.26% from the S&P 500 Value Index due, in part, to the market’s view that growth-oriented companies were generally better positioned to benefit from the expanding economy relative to their value-oriented peers.1
Within commodities, oil prices began December 2017 at around $57 per barrel and ranged between approximately $50 to $74/ barrel before ending at around $51/barrel, a decrease of approximately 11%. Beginning the period at around $1,273 per troy ounce, gold traded between approximately $1,161 and $1,365/oz., before ending November 2018 at around $1,220/oz., a decrease of approximately 4%. In currency markets, the U.S. dollar appreciated approximately 5% and 6% versus the euro and British pound, respectively, closing November 2018 at $1.13/euro and $1.28/£.
| 1 | The S&P 500 Growth Index is a capitalization-weighted measure of growth-oriented stocks within the S&P 500 Index. It includes those S&P 500 Index companies with higher price price-to-book ratios and higher expected growth values. The S&P 500 Value Index is a capitalization-weighted measure of value-oriented stocks within the S&P 500 Index. It includes those S&P 500 Index companies with lower price-to-book ratios and lower expected growth values. |
5
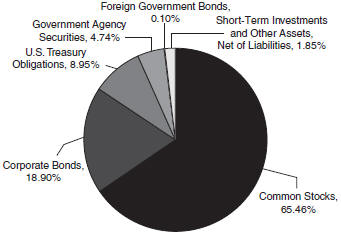
Provide an illustration of the Fund’s investments.
Fund Composition*
(unaudited)
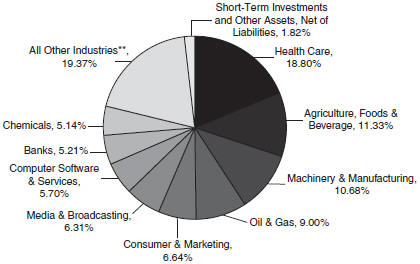
| * | Illustrated by Industry and based on total net assets as of November 30, 2018. Please refer to the Schedule of Investments later in this report for details concerning Fund holdings. |
| ** | Represents 9 other industries, each of which represents less than 5% of total net assets. |
6
How did the Fund perform during the reporting period?
For the 1-year period ended November 30, 2018, the State Farm Growth Fund experienced a total return of 4.41% after expenses, compared to a 6.26% total return for the S&P 500 Index. The line graph below provides additional perspective on the Fund’s long term results.
Comparison of change in value of $10,000 investment
for the years ended November 30
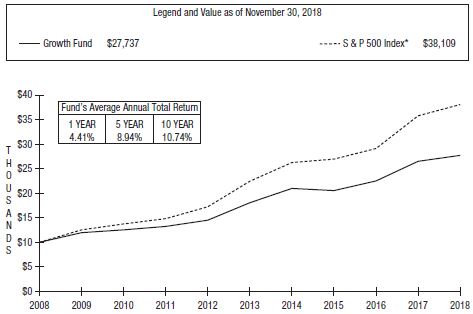
The performance data quoted above represents past performance and does not guarantee future results. Investment return and principal value will fluctuate and Fund shares, when redeemed, may be worth more or less than their original cost. Recent performance may be less than the figures shown. Obtain total returns current to the most recent month-end by calling 1-800-447-0740. These figures do not reflect the deduction of taxes that a shareholder would pay on Fund distributions or the redemption of Fund shares.
Performance Analysis
What factors helped and hindered performance during the reporting period?
The tables below show the securities that were the leading contributors and detractors to Fund performance during the period as well as the performance of the top ten holdings of the Fund.
Performance of Top 5 Contributors
| | | | | | |
| | | | | % of Net Assets | | 12/1/17 to 11/30/18 |
Security | | Sector | | as of 11/30/18 | | Total Return % |
Eli Lilly and Co. | | Health Care | | 2.4% | | 44% |
Walt Disney Co., The | | Media & Broadcasting | | 6.3% | | 12% |
Johnson & Johnson | | Health Care | | 7.3% | | 8% |
Archer-Daniels-Midland Co. | | Agriculture, Foods, & Beverage | | 3.2% | | 19% |
Pfizer Inc. | | Health Care | | 2.1% | | 32% |
| * | The S&P 500 Index is a capitalization-weighted measure of the common stocks of 500 large U.S. companies. |
The S&P 500 Index represents an unmanaged group of stocks that differs from the composition of the Growth Fund. Unlike an investment in the Growth Fund, a theoretical investment in the Index does not reflect any expenses. It is not possible to invest directly in an index.
7
Performance of Top 5 Detractors
| | | | | | |
| | | | | % of Net Assets | | 12/1/17 to 11/30/18 |
Security | | Sector | | as of 11/30/18 | | Total Return % |
General Electric Co. | | Electronic/Electrical Manufacturing | | 0.6% | | -58% |
International Business Machines Corp.* | | Computers | | Sold | | -22% |
Vulcan Materials Co. | | Building Materials & Construction | | 2.2% | | -15% |
Illinois Tool Works Inc. | | Machinery & Manufacturing | | 1.8% | | -16% |
3M Co. | | Machinery & Manufacturing | | 2.3% | | -12% |
| |
* Sold prior to 11/30/2018. Total return is from 12/1/2017 to date sold. |
Performance of Top 10 Holdings
| | | | | | |
| | | | | % of Net Assets | | 12/1/17 to 11/30/18 |
Security | | Sector | | as of 11/30/18 | | Total Return % |
Johnson & Johnson | | Health Care | | 7.3% | | 8% |
Walt Disney Co., The | | Media & Broadcasting | | 6.3% | | 12% |
Apple Inc. | | Computers | | 4.6% | | 5% |
Exxon Mobil Corp. | | Oil & Gas | | 4.2% | | -1% |
Proctor & Gamble Co., The | | Consumer & Marketing | | 3.3% | | 9% |
Archer-Daniels-Midland Co. | | Agriculture, Foods, & Beverage | | 3.2% | | 19% |
Caterpillar Inc. | | Machinery & Manufacturing | | 3.2% | | -2% |
Wells Fargo & Co. | | Banks | | 2.9% | | -1% |
Air Products & Chemicals Inc. | | Chemicals | | 2.7% | | 1% |
Walmart Inc. | | Retailers | | 2.6% | | 3% |
The State Farm Growth Fund’s portfolio turnover rate for the 1-year period was 0.14%. The Fund sold its entire positions in Celgene and Noble Energy in the first quarter, followed by full liquidations of Dril-Quip, CDK Global, and Devon Energy in the second quarter. In the third quarter, the Fund disposed of a portion of its shares in Berkshire Hathaway, while liquidating its entire positions in Imperial Oil and Enbridge. The Fund then liquidated its position in International Business Machines in the fourth quarter, while adding shares in Microsoft.
There were 70 holdings in the Fund totaling approximately $5.0 billion in assets at the end of the reporting period, compared to 78 holdings and approximately $5.0 billion in assets one year earlier. As discussed in the Overview, we believe that a company’s dividend policy is an important component in the analysis and selection of securities for the Fund. From December 1, 2017 through November 30, 2018, 60 of the stocks in the portfolio, accounting for over 93% of the Fund’s total net assets, increased their dividends in local currency terms.
Given the performance analysis above, what factors should shareholders take into consideration when reviewing the Fund’s performance?
We are long-term investors who spend a lot of time getting to know companies and the people who run them. We seek to understand the company’s long term strategies as well as the competitive advantages and risks inherent in them. When we invest in a company, it is normally our intention to maintain that investment for a very long period of time. Our investment strategy generally is not influenced by short term factors. Our philosophy sometimes will result in periods when the Fund’s performance trails that of the market. We define risk as the permanent loss of investment capital. We believe that our philosophy combined with our views on risk have produced competitive returns versus the benchmark over a long period of time.
8
State Farm Balanced Fund Management’s Discussion of Fund Performance (unaudited)
Overview
Describe the Fund’s investment objective and philosophy.
The State Farm Balanced Fund is invested in a combination of stocks and bonds in the pursuit of long-term growth of principal while providing some current income. The Balanced Fund seeks to achieve its objective by investing under normal market conditions approximately 60% of its total assets in common stocks, and ordinarily limits its common stock investments to no more than 75% of total assets. The Balanced Fund ordinarily invests at least 25% of its total assets in fixed income securities, but for a time may choose to invest as much as 75% of its total assets in fixed income securities, including short-term securities. The equity allocation is managed with a conservative bias that favors large capitalization companies that we believe are well managed with a business specialty. The fixed income component invests in high quality U.S. government and corporate bonds primarily of intermediate maturity and seeks to provide shareowners with current income in addition to some protection from equity market volatility. We tend to maintain a long term investment orientation with both the stock and bond investments in the Fund.
Describe the relevant market environment as it related to the Fund for the reporting period.
During the December 1, 2017 to November 30, 2018 reporting period equities entered the tenth year of their bull-market run, supported by a growing U.S. economy and the passage of the Tax Cuts and Jobs Act. Reducing the corporate tax rate helped to contribute to strong corporate earnings reports throughout the time period, particularly in the second quarter when after-tax profits for S&P 500 Index companies rose nearly 25%, year-over-year. The reduction in the corporate tax rate also helped to promote an increase in capital spending and share buybacks during the period. The increase in capital spending, employment, and consumer spending, among other factors, positively affected the overall health of the U.S. economy in the second quarter, which grew at an annualized rate above 4.0% for the first time since 2014. In September, the national unemployment rate fell to 3.7%, its lowest level since 1969.
The period was not without its challenges as multiple factors impacted equity returns and contributed to market volatility. The Federal Reserve (the “Fed”) voted to raise interest rates four times, contributing to an increase in the cost of borrowing for U.S. businesses and consumers. The U.S. Treasury curve rose and flattened. While consumer spending remained strong, existing home sales declined in six straight months during the period, influenced, in part, by an increase in mortgage rates. Fears that rising interest rates would also dampen other sectors of the economy helped contribute to pullbacks in the equity markets. Those downturns were also influenced by increasing friction between the U.S. and its trading partners that began in March when the Trump administration announced tariffs on steel and aluminum imports. The trade conflicts further intensified in the summer months when the administration introduced multiple rounds of tariffs on Chinese goods with the stated intent of reducing the trade deficit and curtailing the seizure of U.S. intellectual property. Despite a proposed revision to the North American Free Trade Agreement (“NAFTA”) – which, if passed, will be called the United States-Mexico-Canada Agreement (“USMCA”) – and the introduction of several new trade agreements between the U.S. and other nations, the uncertainty regarding the escalating trade conflict between the U.S. and China continued to weigh on markets during the period.
U.S. equities, as represented by the S&P 500 Index, ascended to a new historical closing price high of 2,872 on January 26. That record was promptly followed by a significant market retreat, resulting in a period low of 2,581 on February 8. The S&P 500 Index then staged a series of uneven climbs before reaching a new historical and period closing price high of 2,930 on September 20. That record was followed by another significant pullback in October before the S&P 500 Index rebounded to finish the period at 2,760 on November 30, 2018.
The total return for the S&P 500 Index was 6.26% for the 12-month reporting period. This performance reflected an increase in corporate earnings per share for the S&P 500 Index companies of approximately 27%, a contraction of the price/earnings valuation of the S&P 500 Index of approximately -18%, and a dividend return of approximately 2%. Within the relatively volatile U.S. equities market rally, growth generally outperformed value. The S&P 500 Growth Index returned 10.06% versus 2.26% from the S&P 500 Value Index due, in part, to the market’s view that growth-oriented companies were generally better positioned to benefit from the expanding economy relative to their value-oriented peers.1
9
Bond markets, as represented by the Bloomberg Barclays Intermediate Government/Credit Index, generated a total return of -0.34% during the 12-month reporting period. The performance of this index was comprised of the Intermediate Government-portion (61.8% Index weighting), which generated a total return of -0.03% and the Intermediate Credit-portion (38.2% Index weighting), which posted a total return of -0.82%. The total return of the Intermediate Government-portion was comprised of a price return of -2.05% and a coupon return of 2.02%; meanwhile, the total return of the Intermediate Credit-portion was comprised of a price return of -4.08% and a coupon return of 3.26%. Both short-term (3-month) and long-term (10-year) U.S. Treasury yields increased over the period, the latter of which hit a seven-year high of 3.24% on November 8. Despite the increase in long-term rates, the yield curve flattened. The spread between short and long-term U.S. Treasury yields narrowed as short-term rates increased at a greater pace than long-term rates, influenced in part by the Fed’s four interest rate hikes during the period. The flattening of the yield curve continued in the final three weeks of November. The 10-year U.S. Treasury yield fell from 3.24% to 3.01% after Fed officials suggested that the central bank may slow the pace of its interest rate hikes next year as it potentially moves closer to the end of its monetary policy tightening program. The Fed typically increases interest rates to help prevent the economy from overheating and causing an undesired rate of inflation. However, inflation remained near the Fed’s 2% target rate for much of the period.
Within commodities, oil prices began December 2017 at around $57 per barrel and ranged between approximately $50 to $74/ barrel before ending at around $51/barrel, a decrease of approximately 11%. Beginning the period at around $1,273 per troy ounce, gold traded between approximately $1,161 and $1,365/oz., before ending November 2018 at around $1,220/oz., a decrease of approximately 4%. In currency markets, the U.S. dollar appreciated approximately 5% and 6% versus the euro and British pound, respectively, closing November 2018 at $1.13/euro and $1.28/£.
Provide an illustration of the Fund’s investments.
Fund Composition*
(unaudited)
| * | Illustrated by Type of Security and based on total net assets as of November 30, 2018. Please refer to the Schedule of Investments later in this report for details concerning Fund holdings. |
10
How did the Fund perform during the reporting period?
For the 1-year period ended November 30, 2018, the State Farm Balanced Fund experienced a total return of 2.49% after expenses. The total return of the blended benchmark was 3.75% for the same period. The blended benchmark used is a combination of 60% S&P 500 Index and 40% Bloomberg Barclays Intermediate Government/Credit Index (rebalanced on a monthly basis). The total return of the all-equity benchmark S&P 500 Index was 6.26%, while the fixed income benchmark Bloomberg Barclays Intermediate Government/Credit Index had a total return of -0.34% over the same time period. The line graph below provides additional perspective on the Fund’s long term results.
Comparison of change in value of $10,000 investment
for the years ended November 30
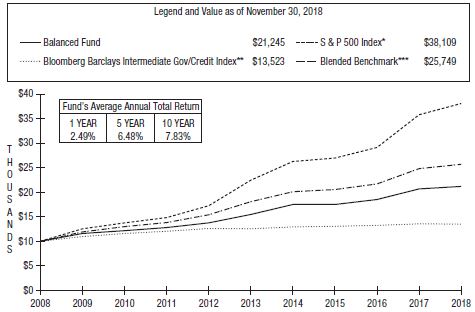
The performance data quoted above represents past performance and does not guarantee future results. Investment return and principal value will fluctuate and Fund shares, when redeemed, may be worth more or less than their original cost. Recent performance may be less than the figures shown. Obtain total returns current to the most recent month-end by calling 1-800-447-0740. These figures do not reflect the deduction of taxes that a shareholder would pay on Fund distributions or the redemption of Fund shares.
| * | The S&P 500 Index is a capitalization-weighted measure of the common stocks of 500 large U.S. companies. |
| ** | The Bloomberg Barclays Intermediate Government/Credit Index contains 4,846 U.S. Treasury, corporate and other securities with an average maturity of about 4.29 years. |
| *** | State Farm Investment Management Corp. computes the Blended Benchmark using 60% S&P 500 Index and 40% Bloomberg Barclays Intermediate Gov/Credit Index (rebalanced on a monthly basis). |
The S&P 500 Index and the Bloomberg Barclays Intermediate Gov/Credit Index represent unmanaged groups of stocks and bonds that differ from the composition of the Balanced Fund. Unlike an investment in the Balanced Fund, theoretical investments in the Indices or Blended Benchmark do not reflect any expenses. It is not possible to invest directly in an index or the Blended Benchmark.
11
Performance Analysis
What factors helped and hindered performance during the reporting period?
Equity portion of the Fund (65.46% of total net assets at the end of the period)
The tables below show the securities that were the leading contributors and detractors to Fund performance during the period as well as the performance of the top ten holdings of the Fund within the equity portion.
Performance of Top 5 Contributors
| | | | | | | | | | |
Security | | Sector | | % of Net Assets
as of 11/30/18 | | | 12/1/17 to 11/30/18
Total Return % | |
Walt Disney Co., The | | Media & Broadcasting | | | 6.4% | | | | 12% | |
Pfizer Inc. | | Health Care | | | 1.7% | | | | 32% | |
Eli Lilly and Co. | | Health Care | | | 1.3% | | | | 44% | |
Archer-Daniels-Midland Co. | | Agriculture, Foods, & Beverage | | | 2.2% | | | | 19% | |
Zoetis Inc. | | Health Care | | | 1.1% | | | | 31% | |
Performance of Top 5 Detractors | | | | | | | | | | |
Security | | Sector | | % of Net Assets
as of 11/30/18 | | | 12/1/17 to 11/30/18
Total Return % | |
General Electric Co. | | Electronic/Electrical Manufacturing | | | 0.3% | | | | -58% | |
International Business Machines Corp* | | Computers | | | Sold | | | | -22% | |
3M Co. | | Machinery & Manufacturing | | | 1.3% | | | | -12% | |
Illinois Tool Works Inc. | | Machinery & Manufacturing | | | 0.9% | | | | -16% | |
Schlumberger Ltd. | | Oil & Gas | | | 0.5% | | | | -26% | |
| | | |
* Sold prior to 11/30/2018. Total return is from 12/1/2017 to date sold. | | | | | | | | |
Performance of Top 10 Holdings | | | | | | | | |
Security | | Sector | | % of Net Assets
as of 11/30/18 | | | 12/1/17 to 11/30/18
Total Return % | |
Walt Disney Co., The | | Media & Broadcasting | | | 6.4% | | | | 12% | |
Johnson & Johnson | | Health Care | | | 3.2% | | | | 8% | |
Apple Inc. | | Computers | | | 2.9% | | | | 5% | |
Procter & Gamble Co., The | | Consumer & Marketing | | | 2.3% | | | | 9% | |
Archer-Daniels-Midland Co. | | Agriculture, Foods, & Beverage | | | 2.2% | | | | 19% | |
Exxon Mobil Corp. | | Oil & Gas | | | 2.1% | | | | -1% | |
Alphabet Inc. Class A | | Computer Software & Services | | | 2.1% | | | | 7% | |
Wells Fargo & Co. | | Banks | | | 2.1% | | | | -1% | |
Air Products & Chemicals Inc. | | Chemicals | | | 1.9% | | | | 1% | |
Caterpillar Inc. | | Machinery & Manufacturing | | | 1.8% | | | | -2% | |
Turnover in the equity portion of the State Farm Balanced Fund’s portfolio over the past 12 months was 0.71%. The Fund sold its entire positions in Noble Energy in the first quarter, followed by full liquidations of Devon Energy, CDK Global, and Newmont Mining in the second quarter when the Fund also added to its Texas Instruments and Microsoft positions. The Fund then liquidated its International Business Machines position in the fourth quarter, while purchasing additional shares in Microsoft.
There were 72 holdings in the Fund totaling approximately $1.3 billion in assets at the end of the reporting period, compared to 77 holdings and approximately $1.3 billion in assets one year earlier. As discussed in the Overview, we believe that a company’s dividend policy is an important component in the analysis and selection of securities for the Fund. From December 1, 2017, through November 30, 2018, 60 of the stocks in the portfolio, accounting for over 91% of the Fund’s total equity assets, increased their dividends in local currency terms.
Fixed Income portion of the Fund (34.39% of total net assets at the end of the period)
An intermediate maturity structure continues to be the Fund’s investment orientation with 68.9% of the fixed income securities (representing 23.69% of total net assets) maturing within 3-11 years. The largest components of the fixed income portion of the Fund were corporate bonds (18.90% of total net assets) and U.S. Treasury securities (8.95% of total net assets).
12
From a credit rating standpoint, 41.2% of the Fund’s fixed income portfolio was rated Aaa, including U.S. Treasury bonds, federal agency securities, agency commercial mortgage backed securities (“Agency CMBS”)2, and certain corporate bonds. The remaining corporate fixed income portfolio was invested in Aa-rated bonds (8.6% of fixed income assets), single A-rated debt (32.7% of fixed income assets), Baa-rated bonds (12.4% of fixed income assets) and Ba-rated bonds (0.27% of fixed income assets).
The Fund’s holdings of U.S. Treasury securities, corporate bonds, agency issues, and Agency CMBS had mixed returns, resulting in a total return of approximately -0.82% for the fixed income portion over the 12-month period. With a total return of approximately 0.38%, Treasury securities provided the greatest level of support to the returns of the fixed income portion of the Fund. However, with a total return of approximately -1.28%, corporate bonds were the largest detractor to performance within the fixed income portion.
The Fund’s fixed-income investment orientation of investing in intermediate-term, higher quality bonds helps to provide stability and serve as a buffer to volatility from within the equity portion of the Fund. The duration of the Fund’s bond portfolio at the end of November 2018 stood at 4.2 years, slightly lower than its position on December 1, 2017. The Fund’s duration was higher than the 3.9 years of its fixed income benchmark (the Bloomberg Barclays Intermediate Government/Credit Index) as of November 30, 2018. Duration is a statistical calculation that measures a bond’s (or in this case, a bond portfolio’s) price sensitivity relative to general movements in interest rates.
Given the performance analysis above, what factors should shareholders take into consideration when reviewing the Fund’s performance?
The Fund is designed and managed as a balanced fund that blends both stocks and bonds together in one convenient investment. Given that structure, performance for the Fund over the long term will typically (but not always) fall somewhere in between the return of a stock index like the S&P 500 Index and a bond index like the Bloomberg Barclays Intermediate Government/Credit Index.
| 2 | Certain Agency CMBS that are not rated by a credit rating agency carry an internal Aaa rating, assigned by State Farm Investment Management Corp., that is consistent with the rating assigned to the guarantor by a credit rating agency. |
13
State Farm Interim Fund Management’s Discussion of Fund Performance (unaudited)
Overview
Describe the Fund’s investment objective and philosophy.
The State Farm Interim Fund is managed in a fashion that seeks to achieve over a period of years, the highest yield consistent with relatively low price volatility. When managing the Fund, we are generally buy-and-hold investors who focus primarily on U.S. Government obligations. General investment practice within the Fund is to distribute the Fund’s investments in varying amounts among securities maturing in up to six or seven years from the time of purchase, but may occasionally purchase securities maturing in up to 15 years.
Describe the relevant market environment as it related to the Fund for the reporting period.
Evidence of a stronger U.S. economy influenced fixed income markets throughout the Fund’s fiscal year. In December 2017, the Tax Cuts and Jobs Act was passed. Reducing the corporate tax rate helped to contribute to strong corporate earnings reports throughout the time period, particularly in the second quarter when after-tax profits for S&P 500 Index companies rose nearly 25%, year-over-year. The reduction in the corporate tax rate also helped to promote an increase in capital spending and share buybacks during the period. The increase in capital spending, employment, and consumer spending, among other factors, positively affected the overall health of the U.S. economy in the second quarter, which grew at an annualized rate above 4.0% for the first time since 2014. In September, the national unemployment rate fell to 3.7%, its lowest level since 1969.
However, rising interest rates and increased geopolitical tension helped raise investor concerns regarding the economy’s continued expansion. The Federal Reserve (the “Fed”) voted to raise interest rates four times, contributing to an increase in the cost of borrowing for U.S. businesses and consumers. While consumer spending remained strong, existing home sales declined in six straight months during the period, influenced, in part, by rising mortgage rates. In March, the Trump administration announced tariffs on steel and aluminum imports, increasing tension between the U.S and its trading partners. The trade conflicts further intensified in the summer months when the administration introduced multiple rounds of tariffs on Chinese goods with the stated intent of reducing the trade deficit and curtailing the seizure of U.S. intellectual property. Despite a proposed revision to the North American Free Trade Agreement (“NAFTA”) – which, if passed, will be called the United States-Mexico-Canada Agreement (“USMCA”) – and the introduction of several new trade agreements between the U.S. and other nations, the uncertainty regarding the escalating trade conflict between the U.S. and China continued to weigh on markets during the period.
Short- (3-month), intermediate- (2-year), and long-term (10-year) U.S. Treasury yields increased over the period, the latter of which hit a seven-year high of 3.24% on November 8.1 Despite the increase in long-term rates, the yield curve flattened. The spread between short- and long-term U.S. Treasury yields narrowed as short- and intermediate-term rates increased at a greater pace than long-term rates, influenced in part by the Fed’s four interest rate hikes during the period. The flattening of the yield curve continued in the final three weeks of November. The 10-year U.S. Treasury yield fell from 3.24% to 3.01% after Fed officials suggested that the central bank may slow the pace of its interest rate hikes next year as it potentially moves closer to the end of its monetary policy tightening program. The Fed typically increases interest rates to help prevent the economy from overheating and causing an undesired rate of inflation. However, inflation remained near the Fed’s 2% target rate for much of the period.
| 1 | A 2-year U.S. Treasury Note is a debt obligation issued by the U.S. Treasury with a maturity of 2 years and that pays interest every six months. |
14
Overall, longer-maturity U.S. Treasuries underperformed relative to intermediate- and shorter-maturity U.S. Treasuries. For the 1-year period, the total return for the Bloomberg Barclays 20+ Year U.S. Treasury Index was -5.52%, compared with -0.06% and 0.76% for the Bloomberg Barclays Intermediate U.S. Treasury Index and Bloomberg Barclays 1-3 year U.S. Treasury Index, respectively.
Provide an illustration of the Fund’s investments.
Provided below is the maturity allocation of the Interim Fund as of November 30, 2018, along with the maturity allocation of the Bloomberg Barclays 1-5 Year U.S. Treasury Index for comparison.
Maturity Allocation: State Farm Interim Fund
compared to the Bloomberg Barclays 1-5 Year U.S. Treasury Index
(unaudited)*
| | | | |
Maturity | | State Farm
Interim Fund
Allocation | | Bloomberg Barclays 1-
5 Year U.S. Treasury Index
Allocation |
0 - 1 Years | | 21.20%** | | 0.00% |
1 - 2 Years | | 15.22% | | 29.39% |
2 - 3 Years | | 15.29% | | 27.96% |
3 - 4 Years | | 20.06% | | 19.58% |
4 - 5 Years | | 14.77% | | 20.36% |
5 - 6 Years | | 13.46% | | 2.71% |
6+ Years | | 0.00% | | 0.00% |
| | | | | |
Totals | | 100.00% | | 100.00% |
| * | Illustrated by Maturity and based on total investments for the Fund and total securities for the Index as of November 30, 2018. Please refer to the Schedule of Investments later in this report for details concerning Fund holdings. |
| ** | Includes a 2.13% allocation to the JPMorgan U.S. Government Money Market Fund Capital Shares. |
15
How did the Fund perform during the reporting period?
For the 1-year period ended November 30, 2018, the State Farm Interim Fund experienced a total return of 0.33% after expenses, compared to a total return of 0.37% for the Bloomberg Barclays 1-5 Year U.S. Treasury Index. The line graph below provides additional perspective on the Fund’s long term results.
Comparison of change in value of $10,000 investment
for the years ended November 30
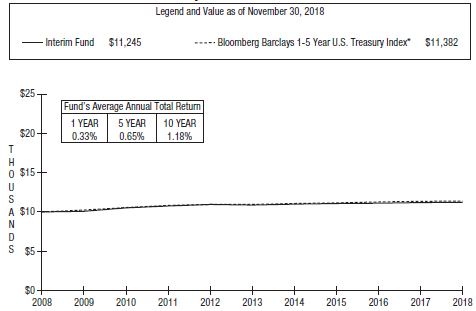
The performance data quoted above represents past performance and does not guarantee future results. Investment return and principal value will fluctuate and Fund shares, when redeemed, may be worth more or less than their original cost. Recent performance may be less than the figures shown. Obtain total returns current to the most recent month-end by calling 1-800-447-0740. These figures do not reflect the deduction of taxes that a shareholder would pay on Fund distributions or the redemption of Fund shares.
Performance Analysis
What factors helped and hindered performance during the reporting period?
Within U.S. Treasuries, shorter-term maturities generally outperformed longer-term for the 1-year period. Relative to its benchmark, the Bloomberg Barclays 1-5 Year U.S. Treasury Index, the Fund’s holdings in bonds with maturities of less than one year positively impacted its performance compared with the Index. Meanwhile, relative to its benchmark, the Fund’s lower allocation to bonds with maturities between one and five years, along with the Fund’s higher allocation to bonds with maturities greater than five years, negatively impacted its total return compared with the Index. However, the impact of Fund expenses, as well as the difference in investment structures between the Fund and its benchmark, contributed to the Fund underperforming its benchmark.
As mentioned earlier, the Fund generally maintains exposure across a six-year maturity spectrum. As U.S. Treasury Notes mature, they are reinvested in U.S. Treasury Notes at prevailing interest rate levels.
The duration of the Fund at the end of November 2018 stood at 2.62 years, similar to its duration of 2.67 years on December 1, 2017. The Fund’s duration was slightly lower than that of its benchmark (the Bloomberg Barclays 1-5 Year U.S. Treasury Index) of 2.69 years as of November 30, 2018. Duration is a statistical calculation that measures a bond’s (or in this case, a bond fund’s) price sensitivity relative to general movements in interest rates.
| * | The Bloomberg Barclays 1-5 Year U.S. Treasury Index measures the performance of short-term U.S. Treasury Securities maturing within one to five years. |
| | The Bloomberg Barclays 1-5 Year U.S. Treasury Index represents an unmanaged group of bonds that differs from the composition of the Interim Fund. Unlike an investment in the Interim Fund, a theoretical investment in the Index does not reflect any expenses. It is not possible to invest directly in an index. |
16
Given the performance analysis above, what factors should shareholders take into consideration when reviewing the Fund’s performance?
Given its investment objective of current income consistent with low price volatility, the Fund is designed to be a stable, low risk element of a diversified portfolio. Generally, as interest rates rise, bond prices decline and vice versa. If interest rates increase, total returns (interest plus price gains) may decrease. Conversely, if interest rates decrease, total returns may increase.
17
State Farm Municipal Bond Fund Management’s Discussion of Fund Performance (unaudited)
Overview
Describe the Fund’s investment objective and philosophy.
The State Farm Municipal Bond Fund seeks as high a rate of income exempt from federal income taxes as is consistent with prudent investment management. Income may be subject to state and local taxes and, if applicable, the Alternative Minimum Tax (AMT). In managing the Fund, we focus on high credit quality bonds with an investment philosophy that seeks to provide competitive total returns, while managing for tax efficiency within the municipal bond asset class over the long run. The municipal bond market, while relatively small in total assets compared to the taxable market, is very broad by number of issuers. As a result, we believe that fundamental research and professional management are critical to success. While we seek to diversify the maturity spectrum of the bonds within the portfolio, we tend to favor the intermediate-maturity range for the bulk of the Fund’s assets. The Fund also seeks to remain invested mainly in bonds of high-credit quality in an attempt to reduce the risk of loss to investment principal as a result of credit losses.
In selecting securities for the Fund, we generally invest in the 5-15 year maturity range and avoid long maturities. While we are conscious of how the Fund’s portfolio differs from its benchmark, the Bloomberg Barclays 7-Year Municipal Bond Index, we do not make decisions based upon the Index.
Describe the relevant market environment as it related to the Fund for the reporting period.
Evidence of a stronger U.S. economy influenced fixed income markets throughout the Fund’s fiscal year. In December 2017, the Tax Cuts and Jobs Act was passed. Reducing the corporate tax rate helped to contribute to strong corporate earnings reports throughout the time period, particularly in the second quarter when after-tax profits for S&P 500 Index companies rose nearly 25%, year-over-year. The reduction in the corporate tax rate also helped to promote an increase in capital spending and share buybacks during the period. The increase in capital spending, employment, and consumer spending, among other factors, positively affected the overall health of the U.S. economy in the second quarter, which grew at an annualized rate above 4.0% for the first time since 2014. In September, the national unemployment rate fell to 3.7%, its lowest level since 1969.
However, rising interest rates and increased geopolitical tension helped raise investor concerns regarding the economy’s continued expansion. The Federal Reserve (the “Fed”) voted to raise interest rates four times, contributing to an increase in the cost of borrowing for U.S. businesses and consumers. The Fed typically increases interest rates to help prevent the economy from overheating and causing an undesired rate of inflation. Inflation remained near the Fed’s 2% target rate for much of the period. While consumer spending remained strong, existing home sales declined in six straight months during the period, influenced, in part, by rising mortgage rates. In March, the Trump administration announced tariffs on steel and aluminum imports, increasing tension between the U.S and its trading partners. The trade conflicts further intensified in the summer months when the administration introduced multiple rounds of tariffs on Chinese goods with the stated intent of reducing the trade deficit and curtailing the seizure of U.S. intellectual property. Despite a proposed revision to the North American Free Trade Agreement (“NAFTA”) – which, if passed, will be called the United States-Mexico-Canada Agreement (“USMCA”) – and the introduction of several new trade agreements between the U.S. and other nations, the uncertainty regarding the escalating trade conflict between the U.S. and China continued to weigh on markets during the period.
As illustrated in Table 1 below, the municipal bond yield curve flattened, while yields increased across all maturities. Short-maturity yields increased more – both on an absolute and relative basis – compared to intermediate- and longer-maturity yields over the 1-year period ended November 30, 2018.
Table 1: Municipal Market Data (MMD) Yields (%) - AAA-Rated General Obligation Municipal Bonds1
| | | | | | | | | | |
Date | | 1-Year | | 5-Year | | 10-Year | | 20-Year | | |
December 1, 2017 | | 1.26% | | 1.76% | | 2.15% | | 2.67% | | |
November 30, 2018 | | 1.84% | | 2.14% | | 2.51% | | 3.05% | | |
Increase (Decrease) in Yield | | 0.58% | | 0.38% | | 0.36% | | 0.38% | | |
| 1 | The Municipal Market Data AAA yield curve is indicative of AAA tax-exempt offered-side, institutional yield levels and may vary from actual yields attained. Source:© 2018 Thomson Reuters. Information provided by Thomson Reuters is not intended for trading purposes, nor do they provide any form of advice (investment, tax, legal) amounting to investment advice, or make any recommendations regarding particular financial instruments, investments or products. Neither Thomson Reuters nor its third party content providers shall be liable for any errors, inaccuracies, or for any actions taken in reliance thereon. THOMSON REUTERS EXPRESSLY DISCLAIMS ALL WARRANTIES, EXPRESSED OR IMPLIED, AS TO THE ACCURACY OF THE INFORMATION, OR AS TO THE FITNESS OF THE INFORMATION FOR ANY PURPOSE. |
18
As illustrated in Table 2 below, annual total returns (as of November 30, 2018) for all segments of the Bloomberg Barclays Municipal Bond Index were positive, with mixed returns across maturities. The Bloomberg Barclays Municipal Bond Index is used to illustrate returns for municipal bonds having various maturities. The Bloomberg Barclays 7-Year Municipal Bond Index is not used to illustrate this point because the Bloomberg Barclays 7-Year Municipal Bond Index only includes municipal bonds with maturities between 6 and 8 years.
Table 2: Bloomberg Barclays Municipal Bond Index - Component Returns by Maturity2
| | | | |
Maturity | | Annual Total Return
(as of November 30, 2018) | | |
1-Year Municipal Bonds | | 1.42% | | |
3-Year Municipal Bonds | | 1.32% | | |
5-Year Municipal Bonds | | 1.17% | | |
7-Year Municipal Bonds | | 1.26% | | |
10-Year Municipal Bonds | | 1.25% | | |
15-Year Municipal Bonds | | 1.35% | | |
20-Year Municipal Bonds | | 1.11% | | |
Long-Bond (22+ Year) Municipal Bonds | | 0.51% | | |
| 2 | Source: Barclays Live®. Past performance does not guarantee future results. The data illustrated provides component annual total returns by municipal bond maturities of the Bloomberg Barclays Municipal Bond Index. |
From a total return standpoint, as illustrated in Table 3 below, the lower end of investment-grade quality municipal bonds (A and Baa rated bonds) outperformed relative to higher investment-grade quality municipal bonds (Aa and Aaa rated bonds) within the Bloomberg Barclays Municipal Bond Index. The Bloomberg Barclays Municipal Bond Index is used to illustrate annual total returns for municipal bonds with various investment grade credit qualities.
Table 3: Bloomberg Barclays Municipal Bond Index - Component Returns by Credit Quality Ratings3
| | | | |
Credit Quality | | Annual Total Return
(as of November 30, 2018) | | |
Aaa Rated Bonds | | 0.84% | | |
Aa Rated Bonds | | 1.03% | | |
A Rated Bonds | | 1.21% | | |
Baa Rated Bonds | | 2.11% | | |
| 3 | Source: Barclays Live®. Past performance does not guarantee future results. The data illustrated provides component annual total returns by credit quality ratings of the Bloomberg Barclays Municipal Bond Index. |
As of November 30, 2018, the 3.05% yield on 20-year Aaa-rated municipal bonds was less than the 3.19% yield offered on comparable 20-year taxable U.S. Treasuries, but slightly above the historical norm for that yield spread relationship. Historically, long-term municipal bonds have offered approximately 75% to 90% of the yields available on comparable U.S. Treasuries because of the income tax benefits associated with municipal bonds. However, that dynamic has shifted in recent years due, in part, to the Fed’s monetary policies stimulus programs and the Tax Cut and Jobs Act passed in 2017.
This yield comparison has been typically used as a general gauge within the industry to determine the relative attractiveness of municipal securities.
Provide an illustration of the Fund’s investments.
Provided below is the maturity allocation of the Municipal Bond Fund as of November 30, 2018, along with the maturity allocation of the Bloomberg Barclays 7-Year Municipal Bond Index for comparison.
Maturity Allocation: State Farm Municipal Bond Fund
compared to the Bloomberg Barclays 7-Year Municipal Bond Index
(unaudited)*
| | | | | | | | | | |
Maturity | | State Farm
Municipal Bond Fund
Allocation | | | Bloomberg Barclays
7-Year Municipal Bond Index
Allocation | | | |
0-6 Years | | | 34.02%** | | | | 0.00% | | | |
6-12 Years | | | 44.32% | | | | 100.00% | | | |
12-22 Years | | | 21.66% | | | | 0.00% | | | |
22+ Years | | | 0.00% | | | | 0.00% | | | |
Totals | | | 100.00% | | | | 100.00% | | | |
| * | Illustrated by Maturity and based on total investments for the Fund and total securities for the Index as of November 30, 2018. Please refer to the Schedule of Investments later in this report for details concerning Fund holdings. |
| ** | Includes a 0.22% allocation to the JPMorgan U.S. Government Money Market Fund Capital Shares. |
19
How did the Fund perform during the reporting period?
The State Farm Municipal Bond Fund experienced a total return of 0.99% for the 1-year period ended November 30, 2018, after expenses, compared to a 1.26% return for the Bloomberg Barclays 7-Year Municipal Bond Index. The line graph below provides additional perspective on the Fund’s long term results.
Comparison of change in value of $10,000 investment
for the years ended November 30
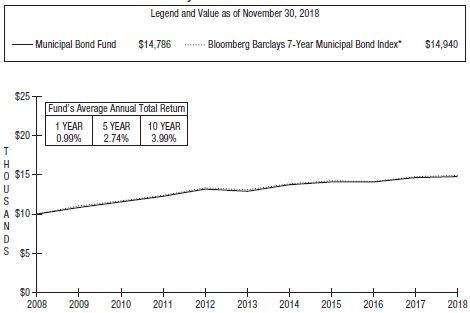
The performance data quoted above represents past performance and does not guarantee future results. Investment return and principal value will fluctuate and Fund shares, when redeemed, may be worth more or less than their original cost. Recent performance may be less than the figures shown. Obtain total returns current to the most recent month-end by calling 1-800-447-0740. These figures do not reflect the deduction of taxes that a shareholder would pay on Fund distributions or the redemption of Fund shares.
Performance Analysis
What factors helped and hindered performance during the reporting period?
The Fund produced a positive total return for the 1-year period. However, the impact of fund expenses, as well as the difference in credit quality between the Fund and its benchmark, the Bloomberg Barclays 7-Year Municipal Bond Index, played a role in the Fund underperforming the Index.
With respect to credit risk, as previously illustrated in Table 3 above, lower quality bonds (Baa and A) generally outperformed relative to higher quality bonds (Aa and Aaa) during the period. Table 4 below shows the Fund’s credit quality orientation compared to the Bloomberg Barclays 7-Year Municipal Bond Index as of November 30, 2018, with the Fund holding a smaller concentration than the Index in lower quality bonds. Throughout the reporting period, the Fund maintained a high quality credit orientation consistent with the Fund’s historical investment philosophy.
| * | The Bloomberg Barclays 7-Year Municipal Bond Index is an unmanaged index comprised of investment grade municipal bonds with maturities of six to eight years. |
| | The Bloomberg Barclays 7-Year Municipal Bond Index differs from the composition of the Municipal Bond Fund. Unlike an investment in the Municipal Bond Fund, a theoretical investment in the Index does not reflect any expenses. It is not possible to invest directly in an index. |
20
Table 4: Credit Ratings Comparison (as of November 30, 2018)4
| | | | |
Credit Ratings | | State Farm
Municipal Bond Fund
Allocation | | Bloomberg Barclays
7-Year Municipal Bond Index
Allocation |
Aaa/AAA | | 12.00% | | 16.95% |
Aa/AA | | 66.69% | | 53.16% |
A | | 16.79% | | 22.51% |
Baa/BBB or Lower | | 1.19% | | 7.38% |
NR (Not Rated) | | 3.33%* | | 0.00% |
Totals | | 100.00% | | 100.00% |
| 4 | Illustrated by Credit Quality and based on total investments for the Fund and total securities for the Index as of November 30, 2018. Reflects the lower of Moody’s and Standard and Poor’s issuer specific ratings. The issuer specific ratings do not reflect any bond insurer ratings. |
| * | Includes a 0.22% allocation to the JPMorgan U.S. Government Money Market Fund Capital Shares. |
Throughout the reporting period, the Fund’s duration increased from 4.25 years as of December 1, 2017, to 4.45 years as of November 30, 2018. The Fund’s duration was lower than the 4.92 duration of its benchmark (the Bloomberg Barclays 7-year Municipal Bond Index) at the end of the period. Duration is a statistical calculation that measures a bond’s (or in this case, a bond fund’s) price sensitivity relative to general movements in interest rates. The objective of the Fund is to seek as high a rate of income exempt from federal income taxes as is consistent with prudent investment management. We seek to maintain the risk profile of the Fund with respect to duration, interest rate risk and credit risk. The Fund has been invested with a bias towards high-credit quality, intermediate maturity bonds. Adopting additional risk by increasing duration significantly and/or increasing the weighting in lower-credit quality bonds would not have been consistent with the Fund’s investment philosophy.
The number of individual bonds held in the portfolio over the reporting period increased by 11, from 498 to 509 bonds. Turnover for the reporting period was 11.6%. Investments within the state of Washington represented the largest single allocation in any state, representing 6.59% of total net assets, which is down from 6.91% from the beginning of the reporting period. The largest additions to the portfolio included net acquisitions of bonds in Wisconsin, followed by New Mexico and Kentucky. Bonds secured by a general obligation pledge accounted for approximately 88% of all new acquisitions with revenue bond purchases representing 12% of the total. The average ratings quality of new bond purchases was Aa2/AA. The Aa2 rating is a subset of Moody’s Aa rating. The largest net reduction of holdings occurred through sales and maturities of bonds in New York, followed by Colorado.
Given the performance analysis above, what factors should shareholders take into consideration when reviewing the Fund’s performance?
The Fund seeks a high level of income exempt from federal income tax through investment in a diversified portfolio of high quality bonds. We utilize a long-term philosophy, seeking to provide competitive total returns relative to the municipal bond asset class while managing for tax efficiency.
Generally, as interest rates rise, bond prices decline and vice versa. If interest rates increase, total returns (interest plus price gains) may decrease. Conversely, if interest rates decrease, total returns may increase.
21
Expense Example (unaudited)
As a shareholder of a Fund, you incur ongoing costs, including management fees and other Fund expenses. The Example in the following table is intended to help you understand your ongoing costs (in dollars) of investing in a Fund and to compare these costs with the ongoing costs of investing in other mutual funds.
The Example is based on an investment of $1,000 invested at the beginning of the period and held for the entire period as stated in the table below.
Actual Expenses
The first line under each Fund name in the table below provides information about actual account values and actual expenses. You may use the information in this line, together with the amount you invested, to estimate the expenses that you paid over the period. Simply divide your account value for a Fund by $1,000 (for example, an $8,600 account value divided by $1,000 = 8.6), then multiply the result by the number in the first line under the heading entitled “Expenses Paid During Period” for the applicable Fund to estimate the expenses you paid on your account for that Fund during this period. If your account has multiple Fund positions, add up the results calculated for each Fund position within your account to estimate the expenses you paid on your total account value. A potential account fee of $10 per calendar quarter is not included in the expenses shown in the table. This fee will be charged to an account (other than a SEP IRA, SIMPLE IRA, Archer Medical Savings Account, Tax Sheltered Account under §403(b)(7) of the Internal Revenue Code or an account held under other employer-sponsored qualified retirement plans) if the balance in the account falls below $5,000 at the close of business on the second business day of the last month of the calendar quarter, unless the account has been open for less than a year as of the second business day of the last month of the calendar quarter. You should consider any account fee you incurred when estimating the total ongoing expenses paid over the period and the impact of this fee on your ending account value. This additional fee has the effect of reducing investment returns.
Hypothetical Example for Comparison Purposes
The second line under each Fund name in the table below provides information about hypothetical account values and hypothetical expenses based on the Fund’s actual expense ratio and an assumed rate of return of 5% per year before expenses, which is not the Fund’s actual return. The hypothetical account values and expenses may not be used to estimate the actual ending account balance or expenses you paid for the period. You may use this information to compare the ongoing costs of investing in the Fund and other funds. To do so, compare this 5% hypothetical example with the 5% hypothetical examples that appear in the shareholder reports of the other funds. A potential account fee of $10 per calendar quarter is not included in the expenses shown in the table. This fee will be charged to an account (other than a SEP IRA, SIMPLE IRA, Archer Medical Savings Account, Tax Sheltered Account under §403(b)(7) of the Internal Revenue Code or an account held under other employer-sponsored qualified retirement plans) if the balance in the account falls below $5,000 at the close of business on the second business day of the last month of the calendar quarter, unless the account has been open for less than a year as of the second business day of the last month of the calendar quarter. You should consider any account fee that you incurred when estimating the total ongoing expenses paid over the period and the impact of this fee on your ending account value. This additional fee has the effect of increasing the costs of investing.
Please note that the expenses shown in the table are meant to highlight your ongoing costs only. Therefore, the second line under each Fund name in the table is useful in comparing ongoing costs only, and will not help you determine the relative total costs of owning different funds, including those that have transactional costs, such as sales charges (loads), redemption fees, or exchange fees.
| | | | | | | | | | | | | | | | |
| | | Beginning
Account Value
June 1, 2018 | | | Ending
Account Value
November 30, 2018 | | | Annualized Expense
Ratio Based
on the Period
June 1, 2018 to
November 30, 2018 | | | Expenses Paid
During Period
June 1, 2018 to
November 30, 2018* | |
State Farm Growth Fund | | | | | | | | | | | | | | | | |
Actual | | $ | 1,000.00 | | | $ | 1,060.18 | | | | 0.12 | % | | $ | 0.62 | |
Hypothetical (5% return before expenses) | | $ | 1,000.00 | | | $ | 1,024.47 | | | | 0.12 | % | | $ | 0.61 | |
| | | | | | | | | | | | | | | | |
State Farm Balanced Fund | | | | | | | | | | | | | | | | |
Actual | | $ | 1,000.00 | | | $ | 1,034.86 | | | | 0.13 | % | | $ | 0.66 | |
Hypothetical (5% return before expenses) | | $ | 1,000.00 | | | $ | 1,024.42 | | | | 0.13 | % | | $ | 0.66 | |
| | | | | | | | | | | | | | | | |
State Farm Interim Fund | | | | | | | | | | | | | | | | |
Actual | | $ | 1,000.00 | | | $ | 1,006.59 | | | | 0.17 | % | | $ | 0.86 | |
Hypothetical (5% return before expenses) | | $ | 1,000.00 | | | $ | 1,024.22 | | | | 0.17 | % | | $ | 0.86 | |
| | | | | | | | | | | | | | | | |
State Farm Municipal Bond Fund | | | | | | | | | | | | | | | | |
Actual | | $ | 1,000.00 | | | $ | 1,005.08 | | | | 0.17 | % | | $ | 0.85 | |
Hypothetical (5% return before expenses) | | $ | 1,000.00 | | | $ | 1,024.22 | | | | 0.17 | % | | $ | 0.86 | |
| | | | | | | | | | | | | | | | |
| * | Expenses are equal to the applicable Fund’s annualized expense ratio (provided in the table), multiplied by the average account value over the period, multiplied by 183/365 (to reflect the one-half year period). |
22
Board Approval of Investment Advisory Agreement (unaudited)
At a meeting of the Board of Trustees (the “Board”) of State Farm Associates’ Funds Trust (“Associates’ Funds Trust”) held on June 15, 2018, all of the Trustees present, including those Trustees who are not “interested persons” as defined by Section 2(a)(19) of the Investment Company Act of 1940, as amended (the “Independent Trustees”), of Associates’ Funds Trust, approved the continuation of the Investment Advisory and Management Services Agreement between State Farm Investment Management Corp. (“SFIMC”) and Associates’ Funds Trust (the “Advisory Agreement”) for an additional one-year term ending June 30, 2019.
In considering whether to approve the continuation of the Advisory Agreement, the Independent Trustees were assisted in their review by independent legal counsel, which had sent to SFIMC, on behalf of the Independent Trustees, a request for information to be provided to the Independent Trustees prior to the Board’s consideration of the continuation of the Advisory Agreement. SFIMC provided materials to the Independent Trustees responding to that request, including a fund-by-fund profitability analysis on each series of the Associates’ Funds Trust (each, a “Fund,” and collectively, the “Funds”), as well as an explanation of the methodology by which SFIMC had calculated that profitability.
At the Board’s request, SFIMC also provided the Board with additional information that the Board believed would be useful to the Board in evaluating whether to approve the continuation of the Advisory Agreement. In advance of the June 15th meeting, the Board also received a report prepared by Strategic Insight, an independent fund tracking organization (the “Strategic Insight Report”), relating to the performance and expenses of each Fund. The Strategic Insight Report included information on the relative performance of each Fund as compared to a benchmark index and to a category of comparable mutual funds, as determined by Morningstar®, an independent third-party service provider (each, a “Morningstar Category”). Morningstar assigns each Fund to a category based upon the underlying securities held in the Fund’s portfolio over the past three years.
In addition, the Board received and reviewed a memorandum from the legal counsel to Associates’ Funds Trust and its Independent Trustees regarding the Board members’ responsibilities (particularly the Independent Trustees’ responsibilities) in considering whether to approve the continuation of the Advisory Agreement.
The Independent Trustees of Associates’ Funds Trust also reviewed these materials at meetings held on March 16, 2018 and May 23, 2018, during which SFIMC management responded to specific questions from the Independent Trustees and provided follow-up information. The Board also considered information it received throughout the year relating to the Funds. The Independent Trustees discussed all of this material extensively in separate meetings among themselves, with their independent legal counsel and with the other Board members, after which the Board considered the various factors described below, none of which alone was considered dispositive. However, the material factors and conclusions that formed the basis for the Board’s determination to approve the continuation of the Advisory Agreement are discussed separately below.
Investment Performance
The Board considered the investment performance of each Fund over various time periods (i.e., calendar year-to-date, one-, three-, five- and 10-year periods) ending on March 31, 2018, as compared to the performance of one or more benchmark indexes, as well as compared to the returns of the Morningstar Category, which includes all open-end funds within that category as assigned by Morningstar, Inc., without any modifications. The Board considered each Fund’s quartile ranking within its Morningstar Category, with the first quartile equal to performance in the top 25% of all funds within that category and the fourth quartile equal to performance in the bottom 25% of all funds within that category.
The Board considered that the Growth Fund’s performance compared to its Morningstar Category over all periods examined was in the fourth quartile. The Board took into account SFIMC’s explanation that the Growth Fund generally is more likely to underperform its benchmark and Morningstar Category median in periods of strong market performance or periods in which increased risk is rewarded. Conversely, SFIMC explained to the Board that the Growth Fund is more likely to outperform its benchmark and Morningstar Category during flat and down markets. The Board noted SFIMC’s belief that over long-term market cycles, this investment approach generally has provided competitive investment performance with a lower-risk profile for the Growth Fund.
The Board considered the performance of the Balanced Fund compared to its Morningstar Category, noting that it had ranked in the third quartile of its Morningstar Category for the three-, five- and ten-year periods and in the fourth quartile for the one- and year-to-date periods. The Board considered SFIMC’s explanation that the equity securities held by the Balanced Fund had risk and performance characteristics similar to those of the equity securities held by the Growth Fund. Therefore, SFIMC’s explanation of the relative performance of the Growth Fund helped the Board to understand the Balanced Fund’s relative performance.
The Board also considered the performance of the Interim and Municipal Bond Funds compared to each Fund’s Morningstar Category. It noted that each of the Interim Fund and Municipal Bond Fund had ranked in the second quartile of its Morningstar Category for the three-, five- and ten-year periods. The Board then considered SFIMC’s assertion that the Funds are managed with a low-risk profile and that they have provided long-term consistent returns.
23
After extensive discussion of this and other performance information related to the Funds, the Board concluded that the investment performance of the Funds over the periods reviewed was acceptable.
Fees and Expenses
The Board examined the fee structure and expense ratio of each Fund, including in comparison to the fee structures and expense ratios of a peer group of funds with comparable investment objectives, investment strategies, asset size and no-load structures as compiled by Strategic Insight. The Board evaluated the relative rankings of each Fund’s net total, net management and net operating expenses within that group of peer funds. The Board also took note that SFIMC did not manage any institutional clients, and that it only manages the Funds and the assets of other State Farm-sponsored mutual funds. In connection with examining the fee structure and expense ratio of each Fund, the Board considered the amount of profits earned (or losses incurred) by SFIMC in providing advisory and management services to each Fund, as well as the methodology by which that profit (or loss) was calculated.
The Board considered SFIMC’s view that the Funds’ expenses are extremely competitive and among the lowest of their peers. In reviewing the Strategic Insight Report, the Board considered that each Fund ranked in the top quarter of its expense group, and that its net total expense, net management fee and net operating expense each were lower than the expense group median. After extensive discussion, the Board concluded that each Fund’s expense structure and overall fees were acceptable.
Economies of Scale
When reviewing the Funds’ fees, the Board also discussed the extent to which economies of scale will be realized as each Fund grows and whether each Fund’s fee levels reflect economies of scale for the benefit of the Fund. Economies of scale occur when a mutual fund’s expenses per unit, such as per dollar invested in the fund, decrease as the fund increases in size. The Board considered that the Advisory Agreement includes breakpoints for each Fund, which can lead to economies of scale for Fund shareholders as assets increase.
Nature, Extent and Quality of Services
The Board considered the nature, extent and quality of the advisory services provided by SFIMC to the Funds. The Board considered the general reputation, financial resources, and business activities of SFIMC, as well as the make-up, education and experience of the SFIMC investment management teams responsible for managing the Funds, and concluded that these teams have a satisfactory, long-term track record in managing the Funds. The Board also considered the compliance environment of the Funds, and SFIMC’s management of that environment, including the view of the Associates’ Funds Trust’s Chief Compliance Officer that the compliance policies and procedures of SFIMC were reasonably designed to monitor, detect and prevent violations of the federal securities laws. After considering this information, the Board concluded that SFIMC had more than sufficient resources and expertise to capably continue to manage the Funds, and that given the past experience, SFIMC should be able to continue to provide satisfactory services to Associates’ Funds Trust.
Fallout Benefits
The Board next discussed whether SFIMC derives any other direct or indirect benefits from serving as investment adviser to the Funds. SFIMC discussed the various ancillary services that it provides the Funds, including serving as transfer agent, and its affiliate, State Farm VP Management Corp., serving as the Funds’ distributor. SFIMC explained to the Board that, in exchange for providing transfer agency services, SFIMC receives proceeds from the account fee imposed on shareholders of Associates’ Funds Trust. Management also explained that State Farm VP Management Corp. receives no fees from Associates’ Funds Trust for providing distribution services. SFIMC indicated to the Board that it was not aware of any other ancillary or other benefits that SFIMC (and its affiliates) receive from Associates’ Funds Trust, particularly because SFIMC does not execute securities trades on behalf of the Funds through an affiliated broker-dealer. The Board concluded that the lack of any material ancillary, or so-called “fallout,” benefits enables SFIMC to manage assets of the Funds in a manner that appears to be free of conflicts of interest.
Conclusion
Based on the Trustees’ extensive deliberations on the above factors and their evaluation of all of the information provided by SFIMC, Morningstar and Strategic Insight, the Board, including all of the Independent Trustees voting separately, unanimously approved the continuation of the Advisory Agreement for all the Funds through June 30, 2019.
24
STATE FARM ASSOCIATES’ FUNDS TRUST GROWTH FUND
SCHEDULE OF INVESTMENTS
November 30, 2018
| | | | | | | | |
| | | Shares | | | Value | |
Common Stocks (98.18%) | | | | | |
Agriculture, Foods, & Beverage (11.33%) | |
Archer-Daniels-Midland Co. | | | 3,477,500 | | | $ | 160,034,550 | |
Coca-Cola Co., The | | | 2,054,600 | | | | 103,551,837 | |
Kellogg Co. | | | 930,000 | | | | 59,194,500 | |
McCormick & Company Inc. | | | 428,600 | | | | 64,290,000 | |
Nestle SA ADR | | | 1,175,800 | | | | 100,201,676 | |
PepsiCo Inc. | | | 641,400 | | | | 78,212,316 | |
| | | | | | | | |
| | | | | | | 565,484,879 | |
| | | | | | | | |
Banks (5.21%) | | | | | |
M&T Bank Corp. | | | 213,400 | | | | 36,066,734 | |
Northern Trust Corp. | | | 422,700 | | | | 41,944,521 | |
U.S. Bancorp | | | 710,821 | | | | 38,711,312 | |
Wells Fargo & Co. | | | 2,643,100 | | | | 143,467,468 | |
| | | | | | | | |
| | | | | | | 260,190,035 | |
| | | | | | | | |
Building Materials & Construction (2.20%) | |
Vulcan Materials Co. | | | 1,039,200 | | | | 109,853,832 | |
| | | | | | | | |
Chemicals (5.14%) | | | | | |
Air Products & Chemicals Inc. | | | 830,000 | | | | 133,522,100 | |
Croda International PLC | | | 24,910 | | | | 1,548,022 | |
DowDuPont Inc. | | | 293,834 | | | | 16,998,297 | |
International Flavors & Fragrances Inc. | | | 525,000 | | | | 74,355,750 | |
Novozymes A/S B Shares | | | 344,484 | | | | 16,045,326 | |
Versum Materials Inc. | | | 415,000 | | | | 14,375,600 | |
| | | | | | | | |
| | | | | | | 256,845,095 | |
| | | | | | | | |
Computer Software & Services (5.70%) | | | | | |
Alphabet Inc. Class A (a) | | | 112,635 | | | | 124,985,428 | |
Alphabet Inc. Class C (a) | | | 5,916 | | | | 6,474,648 | |
Automatic Data Processing Inc. | | | 109,900 | | | | 16,201,458 | |
Facebook Inc. Class A (a) | | | 82,675 | | | | 11,624,932 | |
Microsoft Corp. | | | 828,327 | | | | 91,853,181 | |
SAP SE | | | 83,800 | | | | 8,624,055 | |
Texas Instruments Inc. | | | 245,807 | | | | 24,543,829 | |
| | | | | | | | |
| | | | | | | 284,307,531 | |
| | | | | | | | |
Computers (4.60%) | | | | | |
Apple Inc. | | | 1,287,217 | | | | 229,871,212 | |
| | | | | | | | |
Consumer & Marketing (6.64%) | | | | | |
AptarGroup Inc. | | | 677,405 | | | | 70,483,990 | |
Colgate-Palmolive Co. | | | 872,600 | | | | 55,427,552 | |
Procter & Gamble Co., The | | | 1,765,155 | | | | 166,824,799 | |
Reckitt Benckiser Group PLC | | | 163,469 | | | | 13,567,182 | |
Unilever NV New York Shares | | | 451,152 | | | | 25,043,448 | |
| | | | | | | | |
| | | | | | | 331,346,971 | |
| | | | | | | | |
Electronic/Electrical Manufacturing (1.55%) | |
Emerson Electric Co. | | | 729,400 | | | | 49,249,088 | |
General Electric Co. | | | 3,744,419 | | | | 28,083,142 | |
| | | | | | | | |
| | | | | | | 77,332,230 | |
| | | | | | | | |
Financial Services (0.93%) | | | | | |
Berkshire Hathaway Inc. Class A (a) | | | 142 | | | | 46,292,000 | |
| | | | | | | | |
| | | Shares | | | Value | |
Common Stocks (Cont.) | | | | | |
Financial Services (Cont.) | | | | | |
Berkshire Hathaway Inc. Class B (a) | | | 143 | | | $ | 31,208 | |
| | | | | | | | |
| | | | | | | 46,323,208 | |
| | | | | | | | |
Health Care (18.80%) | | | | | |
Abbott Laboratories | | | 847,500 | | | | 62,757,375 | |
AbbVie Inc. | | | 847,500 | | | | 79,893,825 | |
Agilent Technologies Inc. | | | 548,071 | | | | 39,652,937 | |
Amgen Inc. | | | 190,085 | | | | 39,585,201 | |
Eli Lilly and Co. | | | 997,000 | | | | 118,284,080 | |
Johnson & Johnson | | | 2,481,600 | | | | 364,547,040 | |
Merck & Co. Inc. | | | 296,750 | | | | 23,544,145 | |
Novo Nordisk A/S Sponsored ADR | | | 357,416 | | | | 16,662,734 | |
Pfizer Inc. | | | 2,239,031 | | | | 103,510,403 | |
Roche Holding AG Sponsored ADR | | | 732,281 | | | | 23,747,873 | |
Zoetis Inc. | | | 705,696 | | | | 66,243,684 | |
| | | | | | | | |
| | | | | | | 938,429,297 | |
| | | | | | | | |
Machinery & Manufacturing (10.68%) | | | | | |
3M Co. | | | 564,000 | | | | 117,266,880 | |
ASML Holding NV NY Reg. Shares | | | 364,933 | | | | 62,531,270 | |
Caterpillar Inc. | | | 1,162,621 | | | | 157,732,791 | |
Deere & Co. | | | 42,900 | | | | 6,644,352 | |
Donaldson Company Inc. | | | 765,513 | | | | 42,899,349 | |
HNI Corp. | | | 1,439,200 | | | | 55,481,160 | |
Illinois Tool Works Inc. | | | 652,500 | | | | 90,730,125 | |
| | | | | | | | |
| | | | | | | 533,285,927 | |
| | | | | | | | |
Media & Broadcasting (6.31%) | | | | | |
Walt Disney Co., The | | | 2,728,640 | | | | 315,130,634 | |
| | | | | | | | |
Mining & Metals (2.33%) | | | | | |
BHP Group PLC | | | 941,859 | | | | 18,025,196 | |
Nucor Corp. | | | 531,200 | | | | 32,089,792 | |
Rio Tinto PLC | | | 476,280 | | | | 21,603,801 | |
Rio Tinto PLC ADR | | | 907,200 | | | | 42,420,672 | |
South32 Ltd. | | | 941,859 | | | | 2,110,302 | |
| | | | | | | | |
| | | | | | | 116,249,763 | |
| | | | | | | | |
Oil & Gas (9.00%) | | | | | |
Chevron Corp. | | | 1,060,000 | | | | 126,076,400 | |
Exxon Mobil Corp. | | | 2,615,200 | | | | 207,908,400 | |
Royal Dutch Shell PLC ADR Class A | | | 456,900 | | | | 27,596,760 | |
Royal Dutch Shell PLC Class B | | | 2,037,807 | | | | 62,215,567 | |
Schlumberger Ltd. | | | 564,642 | | | | 25,465,354 | |
| | | | | | | | |
| | | | | | | 449,262,481 | |
| | | | | | | | |
Retailers (2.62%) | | | | | |
Walmart Inc. | | | 1,339,100 | | | | 130,763,115 | |
| | | | | | | | |
Telecom & Telecom Equipment (2.92%) | |
AT&T Inc. | | | 2,140,534 | | | | 66,870,282 | |
Corning Inc. | | | 1,284,600 | | | | 41,389,812 | |
Verizon Communications Inc. | | | 624,900 | | | | 37,681,470 | |
| | | | | | | | |
| | | | | | | 145,941,564 | |
| | | | | | | | |
| | |
| See accompanying notes to financial statements. | | 25 |
STATE FARM ASSOCIATES’ FUNDS TRUST GROWTH FUND
SCHEDULE OF INVESTMENTS (continued)
November 30, 2018
| | | | | | | | |
| | | Shares | | | Value | |
Common Stocks (Cont.) | | | | | |
Transportation (1.68%) | | | | | |
GATX Corp. | | | 190,700 | | | $ | 15,925,357 | |
Union Pacific Corp. | | | 442,075 | | | | 67,982,294 | |
| | | | | | | | |
| | | | | | | 83,907,651 | |
| | | | | | | | |
Utilities & Energy (0.54%) | | | | | |
Duke Energy Corp. | | | 306,966 | | | | 27,187,979 | |
| | | | | | | | |
Total Common Stocks | | | | | |
(cost $1,606,787,035) | | | | | | | 4,901,713,404 | |
| | | | | | | | |
Short-term Investments (1.45%) | | | | | |
JPMorgan U.S. Government Money Market Fund Capital Shares, 2.11% (b) | | | 72,497,148 | | | | 72,497,148 | |
| | | | | | | | |
Total Short-term Investments | | | | | |
(cost $72,497,148) | | | | | | | 72,497,148 | |
| | | | | | | | |
TOTAL INVESTMENTS (99.63%) | | | | | |
(cost $1,679,284,183) | | | | | | | 4,974,210,552 | |
OTHER ASSETS, NET OF LIABILITIES (0.37%) | | | | 18,375,953 | |
| | | | | | | | |
NET ASSETS (100.00%) | | | $ | 4,992,586,505 | |
| | | | | | | | |
| (a) | Non-income producing security. |
| (b) | Rate shown is the 7-day yield as of November 30, 2018. |
ADR - American Depositary Receipt
| | |
| 26 | | See accompanying notes to financial statements. |
STATE FARM ASSOCIATES’ FUNDS TRUST BALANCED FUND
SCHEDULE OF INVESTMENTS
November 30, 2018
| | | | | | | | |
| | | Shares | | | Value | |
Common Stocks (65.46%) | |
Agriculture, Foods, & Beverage (6.47%) | |
Archer-Daniels-Midland Co. | | | 940,561 | | | $ | 43,284,617 | |
Campbell Soup Co. | | | 26,000 | | | | 1,019,200 | |
Coca-Cola Co., The | | | 410,000 | | | | 20,664,000 | |
Kellogg Co. | | | 310,000 | | | | 19,731,500 | |
Nestle SA ADR | | | 319,174 | | | | 27,200,008 | |
PepsiCo Inc. | | | 110,100 | | | | 13,425,594 | |
| | | | | | | | |
| | | | | | | 125,324,919 | |
| | | | | | | | |
Banks (3.76%) | | | | | |
M&T Bank Corp. | | | 58,300 | | | | 9,853,283 | |
Northern Trust Corp. | | | 104,700 | | | | 10,389,381 | |
U.S. Bancorp | | | 218,145 | | | | 11,880,177 | |
Wells Fargo & Co. | | | 747,600 | | | | 40,579,728 | |
| | | | | | | | |
| | | | | | | 72,702,569 | |
| | | | | | | | |
Building Materials & Construction (0.87%) | |
Vulcan Materials Co. | | | 160,200 | | | | 16,934,742 | |
| | | | | | | | |
Chemicals (4.01%) | | | | | |
Air Products & Chemicals Inc. | | | 230,000 | | | | 37,000,100 | |
DowDuPont Inc. | | | 238,358 | | | | 13,789,010 | |
International Flavors & Fragrances Inc. | | | 120,000 | | | | 16,995,600 | |
Novozymes A/S B Shares | | | 124,350 | | | | 5,791,957 | |
Versum Materials Inc. | | | 115,000 | | | | 3,983,600 | |
| | | | | | | | |
| | | | | | | 77,560,267 | |
| | | | | | | | |
Computer Software & Services (5.40%) | |
Alphabet Inc. Class A (a) | | | 36,687 | | | | 40,709,730 | |
Alphabet Inc. Class C (a) | | | 3,559 | | | | 3,895,076 | |
Automatic Data Processing Inc. | | | 47,400 | | | | 6,987,708 | |
Facebook Inc. Class A (a) | | | 49,575 | | | | 6,970,741 | |
Microsoft Corp. | | | 200,914 | | | | 22,279,353 | |
SAP SE | | | 52,800 | | | | 5,433,772 | |
Texas Instruments Inc. | | | 182,262 | | | | 18,198,861 | |
| | | | | | | | |
| | | | | | | 104,475,241 | |
| | | | | | | | |
Computers (2.94%) | | | | | |
Apple Inc. | | | 318,176 | | | | 56,819,870 | |
| | | | | | | | |
Consumer & Marketing (4.39%) | | | | | |
AptarGroup Inc. | | | 134,100 | | | | 13,953,105 | |
Colgate-Palmolive Co. | | | 80,000 | | | | 5,081,600 | |
Procter & Gamble Co., The | | | 477,700 | | | | 45,147,427 | |
Reckitt Benckiser Group PLC | | | 65,387 | | | | 5,426,823 | |
Unilever NV New York Shares | | | 276,106 | | | | 15,326,644 | |
| | | | | | | | |
| | | | | | | 84,935,599 | |
| | | | | | | | |
Electronic/Electrical Manufacturing (0.65%) | |
Emerson Electric Co. | | | 98,600 | | | | 6,657,472 | |
General Electric Co. | | | 796,300 | | | | 5,972,250 | |
| | | | | | | | |
| | | | | | | 12,629,722 | |
| | | | | | | | |
| | | | | | | | |
| | | Shares | | | Value | |
Common Stocks (Cont.) | | | | | |
Financial Services (0.58%) | | | | | |
Berkshire Hathaway Inc. Class A (a) | | | 34 | | | $ | 11,084,000 | |
Berkshire Hathaway Inc. Class B (a) | | | 533 | | | | 116,322 | |
| | | | | | | | |
| | | | | | | 11,200,322 | |
| | | | | | | | |
Health Care (10.83%) | | | | | |
Abbott Laboratories | | | 146,675 | | | | 10,861,284 | |
AbbVie Inc. | | | 92,000 | | | | 8,672,840 | |
Agilent Technologies Inc. | | | 143,787 | | | | 10,402,989 | |
Amgen Inc. | | | 70,750 | | | | 14,733,688 | |
Eli Lilly and Co. | | | 212,000 | | | | 25,151,680 | |
Johnson & Johnson | | | 417,700 | | | | 61,360,130 | |
Medtronic PLC | | | 21,600 | | | | 2,106,648 | |
Merck & Co. Inc. | | | 103,200 | | | | 8,187,888 | |
Novo Nordisk A/S Sponsored ADR | | | 153,404 | | | | 7,151,694 | |
Pfizer Inc. | | | 728,140 | | | | 33,661,912 | |
Roche Holding AG Sponsored ADR | | | 179,815 | | | | 5,831,400 | |
Zoetis Inc. | | | 229,495 | | | | 21,542,696 | |
| | | | | | | | |
| | | | | | | 209,664,849 | |
| | | | | | | | |
Machinery & Manufacturing (6.55%) | | | | | |
3M Co. | | | 124,600 | | | | 25,906,832 | |
ASML Holding NV NY Reg. Shares | | | 82,440 | | | | 14,126,094 | |
Caterpillar Inc. | | | 262,400 | | | | 35,599,808 | |
Deere & Co. | | | 72,202 | | | | 11,182,646 | |
Donaldson Company Inc. | | | 279,017 | | | | 15,636,113 | |
HNI Corp. | | | 160,000 | | | | 6,168,000 | |
Illinois Tool Works Inc. | | | 130,600 | | | | 18,159,930 | |
| | | | | | | | |
| | | | | | | 126,779,423 | |
| | | | | | | | |
Media & Broadcasting (6.37%) | | | | | |
Lee Enterprises Inc. (a) | | | 84,000 | | | | 188,160 | |
Walt Disney Co., The | | | 1,065,995 | | | | 123,111,763 | |
| | | | | | | | |
| | | | | | | 123,299,923 | |
| | | | | | | | |
Mining & Metals (2.62%) | | | | | |
BHP Group PLC | | | 169,900 | | | | 3,251,528 | |
Nucor Corp. | | | 436,800 | | | | 26,387,088 | |
Rio Tinto PLC | | | 153,825 | | | | 6,977,418 | |
Rio Tinto PLC ADR | | | 293,000 | | | | 13,700,680 | |
South32 Ltd. | | | 169,900 | | | | 380,673 | |
| | | | | | | | |
| | | | | | | 50,697,387 | |
| | | | | | | | |
Oil & Gas (5.41%) | | | | | |
Chevron Corp. | | | 288,000 | | | | 34,254,720 | |
Enbridge Inc. | | | 78,375 | | | | 2,565,214 | |
Exxon Mobil Corp. | | | 512,400 | | | | 40,735,800 | |
Royal Dutch Shell PLC ADR Class A | | | 216,400 | | | | 13,070,560 | |
Royal Dutch Shell PLC Class B | | | 163,579 | | | | 4,994,173 | |
Schlumberger Ltd. | | | 201,727 | | | | 9,097,888 | |
| | | | | | | | |
| | | | | | | 104,718,355 | |
| | | | | | | | |
| | |
| See accompanying notes to financial statements. | | 27 |
STATE FARM ASSOCIATES’ FUNDS TRUST BALANCED FUND
SCHEDULE OF INVESTMENTS (continued)
November 30, 2018
| | | | | | | | |
| | | Shares | | | Value | |
Common Stocks (Cont.) | | | | | |
Retailers (1.40%) | | | | | |
Walmart Inc. | | | 276,700 | | | $ | 27,019,753 | |
| | | | | | | | |
Telecom & Telecom Equipment (1.83%) | |
AT&T Inc. | | | 533,359 | | | | 16,662,135 | |
Corning Inc. | | | 372,300 | | | | 11,995,506 | |
Verizon Communications Inc. | | | 112,490 | | | | 6,783,147 | |
| | | | | | | | |
| | | | | | | 35,440,788 | |
| | | | | | | | |
Transportation (1.05%) | | | | | |
GATX Corp. | | | 68,200 | | | | 5,695,382 | |
Union Pacific Corp. | | | 95,035 | | | | 14,614,482 | |
| | | | | | | | |
| | | | | | | 20,309,864 | |
| | | | | | | | |
Utilities & Energy (0.33%) | | | | | |
Duke Energy Corp. | | | 72,333 | | | | 6,406,534 | |
| | | | | | | | |
Total Common Stocks | | | | | |
(cost $440,650,905) | | | | | | | 1,266,920,127 | |
| | | | | | | | |
| | |
| | | Principal
amount | | | Value | |
Corporate Bonds (18.90%) | |
Aerospace/Defense (0.82%) | | | | | |
Precision Castparts Corp. | | | | | | | | |
2.250%, 06/15/2020 | | $ | 1,000,000 | | | $ | 984,336 | |
Rolls-Royce PLC (b) | | | | | | | | |
2.375%, 10/14/2020 | | | 1,000,000 | | | | 976,920 | |
Lockheed Martin Corp. | | | | | | | | |
3.350%, 09/15/2021 | | | 1,000,000 | | | | 995,538 | |
United Technologies Corp. | | | | | | | | |
3.100%, 06/01/2022 | | | 1,000,000 | | | | 975,059 | |
Boeing Co. | | | | | | | | |
2.850%, 10/30/2024 | | | 1,000,000 | | | | 960,240 | |
General Dynamics Corp. | | | | | | | | |
2.375%, 11/15/2024 | | | 500,000 | | | | 467,862 | |
Raytheon Co. | | | | | | | | |
3.150%, 12/15/2024 | | | 1,000,000 | | | | 978,764 | |
Northrop Grumman Corp. | | | | | | | | |
2.930%, 01/15/2025 | | | 1,000,000 | | | | 943,426 | |
Lockheed Martin Corp. | | | | | | | | |
2.900%, 03/01/2025 | | | 1,000,000 | | | | 947,501 | |
Precision Castparts Corp. | | | | | | | | |
3.250%, 06/15/2025 | | | 1,000,000 | | | | 963,981 | |
Rolls-Royce PLC (b) | | | | | | | | |
3.625%, 10/14/2025 | | | 1,000,000 | | | | 956,303 | |
Boeing Co. | | | | | | | | |
2.250%, 06/15/2026 | | | 500,000 | | | | 452,654 | |
General Dynamics Corp. | | | | | | | | |
2.125%, 08/15/2026 | | | 500,000 | | | | 446,383 | |
United Technologies Corp. | | | | | | | | |
2.650%, 11/01/2026 | | | 500,000 | | | | 446,362 | |
Airbus SE (b) | | | | | | | | |
3.150%, 04/10/2027 | | | 1,000,000 | | | | 949,472 | |
United Technologies Corp. | | | | | | | | |
3.125%, 05/04/2027 | | | 1,000,000 | | | | 920,131 | |
| | | | | | | | |
| | | Principal
amount | | | Value | |
Corporate Bonds (Cont.) | |
Aerospace/Defense (Cont.) | |
General Dynamics Corp. | | | | | | | | |
2.625%, 11/15/2027 | | $ | 500,000 | | | $ | 455,647 | |
Northrop Grumman Corp. | | | | | | | | |
3.250%, 01/15/2028 | | | 1,000,000 | | | | 929,543 | |
General Dynamics Corp. | | | | | | | | |
3.750%, 05/15/2028 | | | 1,200,000 | | | | 1,193,762 | |
| | | | | | | | |
| | | | | | | 15,943,884 | |
| | | | | | | | |
Agriculture, Foods, & Beverage (1.57%) | |
Coca-Cola Co., The | | | | | | | | |
2.450%, 11/01/2020 | | | 1,000,000 | | | | 987,927 | |
Kellogg Co. | | | | | | | | |
4.000%, 12/15/2020 | | | 2,000,000 | | | | 2,023,408 | |
JM Smucker Co. | | | | | | | | |
3.000%, 03/15/2022 | | | 1,000,000 | | | | 968,119 | |
Sysco Corp. | | | | | | | | |
2.600%, 06/12/2022 | | | 1,000,000 | | | | 962,938 | |
Campbell Soup Co. | | | | | | | | |
2.500%, 08/02/2022 | | | 1,000,000 | | | | 942,077 | |
Kellogg Co. | | | | | | | | |
2.750%, 03/01/2023 | | | 1,000,000 | | | | 957,143 | |
Hershey Co. | | | | | | | | |
2.625%, 05/01/2023 | | | 1,300,000 | | | | 1,252,533 | |
Mondelez International Inc. | | | | | | | | |
4.000%, 02/01/2024 | | | 1,000,000 | | | | 995,263 | |
General Mills Inc. | | | | | | | | |
3.650%, 02/15/2024 | | | 1,000,000 | | | | 984,211 | |
PepsiCo Inc. | | | | | | | | |
3.600%, 03/01/2024 | | | 1,000,000 | | | | 1,003,400 | |
JM Smucker Co. | | | | | | | | |
3.500%, 03/15/2025 | | | 1,000,000 | | | | 949,940 | |
PepsiCo Inc. | | | | | | | | |
3.500%, 07/17/2025 | | | 1,000,000 | | | | 989,839 | |
Hershey Co. | | | | | | | | |
3.200%, 08/21/2025 | | | 1,000,000 | | | | 974,499 | |
Coca-Cola Co., The | | | | | | | | |
2.875%, 10/27/2025 | | | 1,000,000 | | | | 949,112 | |
PepsiCo Inc. | | | | | | | | |
2.850%, 02/24/2026 | | | 1,000,000 | | | | 942,674 | |
Coca-Cola Co., The | | | | | | | | |
2.550%, 06/01/2026 | | | 500,000 | | | | 462,891 | |
Sysco Corp. | | | | | | | | |
3.300%, 07/15/2026 | | | 1,000,000 | | | | 941,269 | |
Hershey Co. | | | | | | | | |
2.300%, 08/15/2026 | | | 1,000,000 | | | | 902,824 | |
Coca-Cola Co., The | | | | | | | | |
2.250%, 09/01/2026 | | | 1,000,000 | | | | 900,414 | |
Danone SA (b) | | | | | | | | |
2.947%, 11/02/2026 | | | 1,000,000 | | | | 903,710 | |
General Mills Inc. | | | | | | | | |
3.200%, 02/10/2027 | | | 1,000,000 | | | | 903,484 | |
Coca-Cola Co., The | | | | | | | | |
2.900%, 05/25/2027 | | | 500,000 | | | | 471,482 | |
Sysco Corp. | | | | | | | | |
3.250%, 07/15/2027 | | | 500,000 | | | | 464,462 | |
| | |
| 28 | | See accompanying notes to financial statements. |
STATE FARM ASSOCIATES’ FUNDS TRUST BALANCED FUND
SCHEDULE OF INVESTMENTS (continued)
November 30, 2018
| | | | | | | | |
| | | Principal
amount | | | Value | |
Corporate Bonds (Cont.) | | | | | |
Agriculture, Foods, & Beverage (Cont.) | |
PepsiCo Inc. | | | | | | | | |
3.000%, 10/15/2027 | | $ | 1,500,000 | | | $ | 1,406,870 | |
Kellogg Co. | | | | | | | | |
3.400%, 11/15/2027 | | | 1,000,000 | | | | 910,643 | |
JM Smucker Co. | | | | | | | | |
3.375%, 12/15/2027 | | | 1,500,000 | | | | 1,379,181 | |
Campbell Soup Co. | | | | | | | | |
4.150%, 03/15/2028 | | | 1,000,000 | | | | 927,455 | |
General Mills Inc. | | | | | | | | |
4.200%, 04/17/2028 | | | 1,000,000 | | | | 963,711 | |
Mondelez International Inc. | | | | | | | | |
4.125%, 05/07/2028 | | | 2,000,000 | | | | 1,943,158 | |
Kellogg Co. | | | | | | | | |
4.300%, 05/15/2028 | | | 1,000,000 | | | | 977,890 | |
| | | | | | | | |
| | | | | | | 30,342,527 | |
| | | | | | | | |
Automotive (0.54%) | | | | | | | | |
Toyota Motor Credit Corp. | | | | | | | | |
2.100%, 01/17/2019 | | | 500,000 | | | | 499,592 | |
Daimler Finance NA LLC (b) | | | | | | | | |
2.250%, 03/02/2020 | | | 500,000 | | | | 492,405 | |
American Honda Finance Corp. | | | | | | | | |
2.450%, 09/24/2020 | | | 1,000,000 | | | | 985,603 | |
BMW US Capital LLC (b) | | | | | | | | |
2.000%, 04/11/2021 | | | 1,000,000 | | | | 962,652 | |
Daimler Finance NA LLC (b) | | | | | | | | |
2.000%, 07/06/2021 | | | 1,000,000 | | | | 954,058 | |
American Honda Finance Corp. | | | | | | | | |
1.650%, 07/12/2021 | | | 500,000 | | | | 478,275 | |
Toyota Motor Credit Corp. | | | | | | | | |
2.900%, 04/17/2024 | | | 1,000,000 | | | | 961,016 | |
BMW US Capital LLC (b) | | | | | | | | |
2.800%, 04/11/2026 | | | 500,000 | | | | 454,617 | |
American Honda Finance Corp. | | | | | | | | |
2.300%, 09/09/2026 | | | 1,000,000 | | | | 898,169 | |
BMW US Capital LLC (b) | | | | | | | | |
3.300%, 04/06/2027 | | | 1,000,000 | | | | 931,159 | |
Toyota Motor Credit Corp. | | | | | | | | |
3.050%, 01/11/2028 | | | 1,000,000 | | | | 940,046 | |
American Honda Finance Corp. | | | | | | | | |
3.500%, 02/15/2028 | | | 1,000,000 | | | | 960,840 | |
Daimler Finance NA LLC (b) | | | | | | | | |
3.750%, 02/22/2028 | | | 1,000,000 | | | | 932,227 | |
| | | | | | | | |
| | | | | | | 10,450,659 | |
| | | | | | | | |
Banks (1.09%) | | | | | | | | |
Wells Fargo & Co. | | | | | | | | |
2.150%, 01/15/2019 | | | 500,000 | | | | 499,595 | |
Bank of New York Mellon Corp. | | | | | | | | |
2.200%, 03/04/2019 | | | 1,000,000 | | | | 998,570 | |
Toronto-Dominion Bank, The | | | | | | | | |
3.000%, 06/11/2020 | | | 1,000,000 | | | | 996,419 | |
| | | | | | | | |
| | | Principal
amount | | | Value | |
Corporate Bonds (Cont.) | | | | | |
Banks (Cont.) | | | | | | | | |
State Street Corp. | | | | | | | | |
2.550%, 08/18/2020 | | $ | 1,000,000 | | | $ | 985,845 | |
PNC Bank NA | | | | | | | | |
2.450%, 11/05/2020 | | | 500,000 | | | | 490,482 | |
Wells Fargo & Co. | | | | | | | | |
3.000%, 01/22/2021 | | | 1,000,000 | | | | 987,928 | |
Toronto-Dominion Bank | | | | | | | | |
2.125%, 04/07/2021 | | | 1,000,000 | | | | 972,764 | |
PNC Bank NA | | | | | | | | |
2.150%, 04/29/2021 | | | 1,000,000 | | | | 967,094 | |
U.S. Bancorp | | | | | | | | |
3.000%, 03/15/2022 | | | 1,000,000 | | | | 985,539 | |
3.700%, 01/30/2024 | | | 500,000 | | | | 501,434 | |
Bank of New York Mellon Corp. | | | | | | | | |
3.650%, 02/04/2024 | | | 1,000,000 | | | | 993,193 | |
State Street Corp. | | | | | | | | |
3.300%, 12/16/2024 | | | 1,000,000 | | | | 969,367 | |
PNC Bank NA | | | | | | | | |
3.250%, 06/01/2025 | | | 500,000 | | | | 479,863 | |
State Street Corp. | | | | | | | | |
3.550%, 08/18/2025 | | | 500,000 | | | | 490,026 | |
Wells Fargo & Co. | | | | | | | | |
3.000%, 04/22/2026 | | | 1,000,000 | | | | 921,330 | |
Bank of New York Mellon Corp. | | | | | | | | |
2.800%, 05/04/2026 | | | 500,000 | | | | 463,556 | |
State Street Corp. | | | | | | | | |
2.650%, 05/19/2026 | | | 1,000,000 | | | | 917,732 | |
U.S. Bancorp | | | | | | | | |
2.375%, 07/22/2026 | | | 1,000,000 | | | | 894,352 | |
Bank of New York Mellon Corp. | | | | | | | | |
2.450%, 08/17/2026 | | | 500,000 | | | | 448,668 | |
Wells Fargo & Co. | | | | | | | | |
3.000%, 10/23/2026 | | | 1,500,000 | | | | 1,366,820 | |
U.S. Bancorp | | | | | | | | |
3.150%, 04/27/2027 | | | 1,000,000 | | | | 939,017 | |
PNC Bank NA | | | | | | | | |
3.100%, 10/25/2027 | | | 1,000,000 | | | | 933,662 | |
Bank of New York Mellon Corp. | | | | | | | | |
3.400%, 01/29/2028 | | | 2,000,000 | | | | 1,916,132 | |
U.S. Bancorp | | | | | | | | |
3.900%, 04/26/2028 | | | 1,000,000 | | | | 996,023 | |
| | | | | | | | |
| | | | | | | 21,115,411 | |
| | | | | | | | |
Chemicals (0.42%) | | | | | | | | |
Praxair Inc. | | | | | | | | |
2.450%, 02/15/2022 | | | 1,000,000 | | | | 971,303 | |
2.700%, 02/21/2023 | | | 1,000,000 | | | | 968,466 | |
3.200%, 01/30/2026 | | | 1,000,000 | | | | 969,526 | |
Air Liquide Finance (b) | | | | | | | | |
2.500%, 09/27/2026 | | | 1,000,000 | | | | 905,637 | |
Ecolab Inc. | | | | | | | | |
2.700%, 11/01/2026 | | | 1,000,000 | | | | 917,763 | |
3.250%, 12/01/2027 | | | 1,500,000 | | | | 1,420,107 | |
| | |
| See accompanying notes to financial statements. | | 29 |
STATE FARM ASSOCIATES’ FUNDS TRUST BALANCED FUND
SCHEDULE OF INVESTMENTS (continued)
November 30, 2018
| | | | | | | | |
| | | Principal
amount | | | Value | |
Corporate Bonds (Cont.) | | | | | | | | |
Chemicals (Cont.) | | | | | | | | |
PPG Industries Inc. | | | | | | | | |
3.750%, 03/15/2028 | | $ | 2,000,000 | | | $ | 1,891,354 | |
| | | | | | | | |
| | | | | | | 8,044,156 | |
| | | | | | | | |
Commercial Service/Supply (0.10%) | |
Cintas Corp. No. 2 | | | | | | | | |
3.250%, 06/01/2022 | | | 2,000,000 | | | | 1,972,812 | |
| | | | | | | | |
Computer Software & Services (0.84%) | |
Oracle Corp. | | | | | | | | |
2.375%, 01/15/2019 | | | 1,000,000 | | | | 999,450 | |
Automatic Data Processing Inc. | | | | | | | | |
2.250%, 09/15/2020 | | | 500,000 | | | | 492,899 | |
Microsoft Corp. | | | | | | | | |
2.125%, 11/15/2022 | | | 2,000,000 | | | | 1,912,668 | |
Intel Corp. | | | | | | | | |
2.700%, 12/15/2022 | | | 1,000,000 | | | | 973,473 | |
Texas Instruments Inc. | | | | | | | | |
2.250%, 05/01/2023 | | | 3,000,000 | | | | 2,854,584 | |
Alphabet Inc. | | | | | | | | |
3.375%, 02/25/2024 | | | 1,000,000 | | | | 996,379 | |
Intel Corp. | | | | | | | | |
3.700%, 07/29/2025 | | | 1,000,000 | | | | 992,450 | |
Automatic Data Processing Inc. | | | | | | | | |
3.375%, 09/15/2025 | | | 1,000,000 | | | | 986,641 | |
Intel Corp. | | | | | | | | |
2.600%, 05/19/2026 | | | 1,000,000 | | | | 924,315 | |
Oracle Corp. | | | | | | | | |
2.650%, 07/15/2026 | | | 1,000,000 | | | | 914,396 | |
Microsoft Corp. | | | | | | | | |
2.400%, 08/08/2026 | | | 500,000 | | | | 458,440 | |
Alphabet Inc. | | | | | | | | |
1.998%, 08/15/2026 | | | 1,000,000 | | | | 893,698 | |
Microsoft Corp. | | | | | | | | |
3.300%, 02/06/2027 | | | 500,000 | | | | 486,798 | |
QUALCOMM Inc. | | | | | | | | |
3.250%, 05/20/2027 | | | 1,000,000 | | | | 920,272 | |
Texas Instruments Inc. | | | | | | | | |
2.900%, 11/03/2027 | | | 500,000 | | | | 465,395 | |
Oracle Corp. | | | | | | | | |
3.250%, 11/15/2027 | | | 1,000,000 | | | | 949,884 | |
| | | | | | | | |
| | | | | | | 16,221,742 | |
| | | | | | | | |
Computers (0.26%) | | | | | | | | |
International Business Machines Corp. | | | | | | | | |
1.875%, 05/15/2019 | | | 3,000,000 | | | | 2,985,918 | |
1.625%, 05/15/2020 | | | 2,000,000 | | | | 1,952,088 | |
| | | | | | | | |
| | | | | | | 4,938,006 | |
| | | | | | | | |
Consumer & Marketing (0.86%) | | | | | |
Unilever Capital Corp. | | | | | | | | |
2.200%, 03/06/2019 | | | 1,000,000 | | | | 998,470 | |
Kimberly-Clark Corp. | | | | | | | | |
1.900%, 05/22/2019 | | | 500,000 | | | | 497,657 | |
| | | | | | | | |
| | | Principal
amount | | | Value | |
Corporate Bonds (Cont.) | | | | | | | | |
Consumer & Marketing (Cont.) | |
Unilever Capital Corp. | | | | | | | | |
4.250%, 02/10/2021 | | $ | 1,000,000 | | | $ | 1,019,741 | |
Estee Lauder Companies Inc., The | | | | | | | | |
1.700%, 05/10/2021 | | | 500,000 | | | | 480,767 | |
Procter & Gamble Co., The | | | | | | | | |
2.300%, 02/06/2022 | | | 1,000,000 | | | | 976,618 | |
Colgate-Palmolive Co. | | | | | | | | |
2.300%, 05/03/2022 | | | 1,000,000 | | | | 966,879 | |
2.100%, 05/01/2023 | | | 2,000,000 | | | | 1,890,086 | |
NIKE Inc. | | | | | | | | |
2.250%, 05/01/2023 | | | 500,000 | | | | 477,715 | |
Reckitt Benckiser Treasury Services PLC (b) | | | | | | | | |
2.750%, 06/26/2024 | | | 1,000,000 | | | | 940,519 | |
Unilever Capital Corp. | | | | | | | | |
3.100%, 07/30/2025 | | | 1,000,000 | | | | 959,214 | |
Kimberly-Clark Corp. | | | | | | | | |
3.050%, 08/15/2025 | | | 1,000,000 | | | | 961,332 | |
Procter & Gamble Co., The | | | | | | | | |
2.700%, 02/02/2026 | | | 500,000 | | | | 470,228 | |
Kimberly-Clark Corp. | | | | | | | | |
2.750%, 02/15/2026 | | | 1,000,000 | | | | 935,476 | |
Unilever Capital Corp. | | | | | | | | |
2.000%, 07/28/2026 | | | 500,000 | | | | 439,112 | |
NIKE Inc. | | | | | | | | |
2.375%, 11/01/2026 | | | 1,000,000 | | | | 903,458 | |
Unilever Capital Corp. | | | | | | | | |
2.900%, 05/05/2027 | | | 500,000 | | | | 465,634 | |
Reckitt Benckiser Treasury Services PLC (b) | | | | | | | | |
3.000%, 06/26/2027 | | | 1,000,000 | | | | 919,009 | |
Clorox Co. | | | | | | | | |
3.100%, 10/01/2027 | | | 500,000 | | | | 466,312 | |
Unilever Capital Corp. | | | | | | | | |
3.500%, 03/22/2028 | | | 1,000,000 | | | | 967,399 | |
Clorox Co. | | | | | | | | |
3.900%, 05/15/2028 | | | 1,000,000 | | | | 987,702 | |
| | | | | | | | |
| | | | | | | 16,723,328 | |
| | | | | | | | |
Electronic/Electrical Manufacturing (0.62%) | |
Johnson Controls International PLC | | | | | | | | |
4.250%, 03/01/2021 | | | 2,000,000 | | | | 2,028,958 | |
Emerson Electric Co. | | | | | | | | |
2.625%, 12/01/2021 | | | 1,000,000 | | | | 978,180 | |
Siemens Financieringsmaatschappij NV (b) | | | | | | | | |
2.900%, 05/27/2022 | | | 500,000 | | | | 487,619 | |
General Electric Co. | | | | | | | | |
2.700%, 10/09/2022 | | | 1,000,000 | | | | 902,265 | |
Emerson Electric Co. | | | | | | | | |
2.625%, 02/15/2023 | | | 1,000,000 | | | | 966,954 | |
General Electric Co. | | | | | | | | |
3.375%, 03/11/2024 | | | 1,000,000 | | | | 892,918 | |
| | |
| 30 | | See accompanying notes to financial statements. |
STATE FARM ASSOCIATES’ FUNDS TRUST BALANCED FUND
SCHEDULE OF INVESTMENTS (continued)
November 30, 2018
| | | | | | | | |
| | | Principal
amount | | | Value | |
Corporate Bonds (Cont.) | | | | | | | | |
Electronic/Electrical Manufacturing (Cont.) | |
Siemens Financieringsmaatschappij NV (b) | | | | | | | | |
3.250%, 05/27/2025 | | $ | 1,000,000 | | | $ | 963,478 | |
Emerson Electric Co. | | | | | | | | |
3.150%, 06/01/2025 | | | 1,000,000 | | | | 960,499 | |
Siemens Financieringsmaatschappij NV (b) | | | | | | | | |
2.350%, 10/15/2026 | | | 1,000,000 | | | | 894,134 | |
Honeywell International Inc. | | | | | | | | |
2.500%, 11/01/2026 | | | 2,000,000 | | | | 1,835,132 | |
ABB Finance (USA) Inc. | | | | | | | | |
3.800%, 04/03/2028 | | | 1,000,000 | | | | 987,325 | |
| | | | | | | | |
| | | | | | | 11,897,462 | |
| | | | | | | | |
Financial Services (0.42%) | | | | | | | | |
Mastercard Inc. | | | | | | | | |
2.000%, 11/21/2021 | | | 500,000 | | | | 483,700 | |
JPMorgan Chase & Co. | | | | | | | | |
4.500%, 01/24/2022 | | | 1,000,000 | | | | 1,024,784 | |
General Electric Capital Corp. | | | | | | | | |
3.150%, 09/07/2022 | | | 287,000 | | | | 263,434 | |
Visa Inc. | | | | | | | | |
2.800%, 12/14/2022 | | | 1,000,000 | | | | 977,043 | |
JPMorgan Chase & Co. | | | | | | | | |
3.200%, 01/25/2023 | | | 1,000,000 | | | | 977,549 | |
3.625%, 05/13/2024 | | | 500,000 | | | | 490,980 | |
3.125%, 01/23/2025 | | | 1,000,000 | | | | 939,931 | |
GE Capital International Funding Co. | | | | | | | | |
3.373%, 11/15/2025 | | | 747,000 | | | | 644,823 | |
Visa Inc. | | | | | | | | |
3.150%, 12/14/2025 | | | 1,000,000 | | | | 965,007 | |
JPMorgan Chase & Co. | | | | | | | | |
3.300%, 04/01/2026 | | | 1,000,000 | | | | 939,864 | |
Mastercard Inc. | | | | | | | | |
2.950%, 11/21/2026 | | | 500,000 | | | | 471,280 | |
| | | | | | | | |
| | | | | | | 8,178,395 | |
| | | | | | | | |
Health Care (2.17%) | | | | | | | | |
Eli Lilly and Co. | | | | | | | | |
1.950%, 03/15/2019 | | | 1,000,000 | | | | 997,631 | |
Pfizer Inc. | | | | | | | | |
2.100%, 05/15/2019 | | | 1,000,000 | | | | 996,170 | |
Amgen Inc. | | | | | | | | |
2.200%, 05/22/2019 | | | 1,000,000 | | | | 995,590 | |
AstraZeneca PLC | | | | | | | | |
1.950%, 09/18/2019 | | | 500,000 | | | | 494,948 | |
Becton Dickinson & Co. | | | | | | | | |
3.125%, 11/08/2021 | | | 1,000,000 | | | | 984,772 | |
Abbott Laboratories | | | | | | | | |
2.550%, 03/15/2022 | | | 1,000,000 | | | | 965,015 | |
EMD Finance LLC (b) | | | | | | | | |
2.950%, 03/19/2022 | | | 1,000,000 | | | | 974,978 | |
Bayer US Finance II LLC (b) | | | | | | | | |
2.200%, 07/15/2022 | | | 1,300,000 | | | | 1,217,116 | |
Bristol-Myers Squibb Co. | | | | | | | | |
2.000%, 08/01/2022 | | | 1,500,000 | | | | 1,434,044 | |
| | | | | | | | |
| | | Principal
amount | | | Value | |
Corporate Bonds (Cont.) | | | | | | | | |
Health Care (Cont.) | | | | | | | | |
Merck & Co. Inc. | | | | | | | | |
2.400%, 09/15/2022 | | $ | 1,000,000 | | | $ | 963,188 | |
Novartis Capital Corp. | | | | | | | | |
2.400%, 09/21/2022 | | | 1,000,000 | | | | 963,345 | |
Thermo Fisher Scientific Inc. | | | | | | | | |
3.150%, 01/15/2023 | | | 1,000,000 | | | | 971,216 | |
GlaxoSmithKline Capital Inc. | | | | | | | | |
2.800%, 03/18/2023 | | | 1,000,000 | | | | 962,393 | |
Merck & Co. Inc. | | | | | | | | |
2.800%, 05/18/2023 | | | 2,000,000 | | | | 1,946,380 | |
Medtronic Inc. | | | | | | | | |
3.625%, 03/15/2024 | | | 1,000,000 | | | | 992,401 | |
Novartis Capital Corp. | | | | | | | | |
3.400%, 05/06/2024 | | | 1,500,000 | | | | 1,481,378 | |
Pfizer Inc. | | | | | | | | |
3.400%, 05/15/2024 | | | 1,000,000 | | | | 993,112 | |
Stryker Corp. | | | | | | | | |
3.375%, 05/15/2024 | | | 1,000,000 | | | | 976,305 | |
Amgen Inc. | | | | | | | | |
3.625%, 05/22/2024 | | | 1,000,000 | | | | 979,875 | |
Bayer U.S. Finance LLC (b) | | | | | | | | |
3.375%, 10/08/2024 | | | 1,000,000 | | | | 938,722 | |
Abbott Laboratories | | | | | | | | |
2.950%, 03/15/2025 | | | 1,000,000 | | | | 947,322 | |
EMD Finance LLC (b) | | | | | | | | |
3.250%, 03/19/2025 | | | 1,000,000 | | | | 944,535 | |
Bayer US Finance II LLC (b) | | | | | | | | |
2.850%, 04/15/2025 | | | 1,000,000 | | | | 905,018 | |
Eli Lilly and Co. | | | | | | | | |
2.750%, 06/01/2025 | | | 1,000,000 | | | | 945,832 | |
Roche Holdings Inc. (b) | | | | | | | | |
3.000%, 11/10/2025 | | | 2,000,000 | | | | 1,913,094 | |
AstraZeneca PLC | | | | | | | | |
3.375%, 11/16/2025 | | | 1,000,000 | | | | 954,570 | |
Novartis Capital Corp. | | | | | | | | |
3.000%, 11/20/2025 | | | 1,000,000 | | | | 947,033 | |
Johnson & Johnson | | | | | | | | |
2.450%, 03/01/2026 | | | 500,000 | | | | 462,698 | |
Stryker Corp. | | | | | | | | |
3.500%, 03/15/2026 | | | 1,000,000 | | | | 947,659 | |
Roche Holdings Inc. (b) | | | | | | | | |
2.625%, 05/15/2026 | | | 500,000 | | | | 465,137 | |
Amgen Inc. | | | | | | | | |
2.600%, 08/19/2026 | | | 1,000,000 | | | | 895,805 | |
Roche Holdings Inc. (b) | | | | | | | | |
2.375%, 01/28/2027 | | | 1,000,000 | | | | 908,586 | |
Medtronic Global Holdings | | | | | | | | |
3.350%, 04/01/2027 | | | 1,000,000 | | | | 959,212 | |
Eli Lilly and Co. | | | | | | | | |
3.100%, 05/15/2027 | | | 500,000 | | | | 476,780 | |
AstraZeneca PLC | | | | | | | | |
3.125%, 06/12/2027 | | | 1,000,000 | | | | 921,831 | |
Amgen Inc. | | | | | | | | |
3.200%, 11/02/2027 | | | 1,000,000 | | | | 923,265 | |
Johnson & Johnson | | | | | | | | |
2.900%, 01/15/2028 | | | 2,000,000 | | | | 1,882,826 | |
| | |
| See accompanying notes to financial statements. | | 31 |
STATE FARM ASSOCIATES’ FUNDS TRUST BALANCED FUND
SCHEDULE OF INVESTMENTS (continued)
November 30, 2018
| | | | | | | | |
| | | Principal
amount | | | Value | |
Corporate Bonds (Cont.) | | | | | |
Health Care (Cont.) | | | | | | | | |
Stryker Corp. | | | | | | | | |
3.650%, 03/07/2028 | | $ | 1,000,000 | | | $ | 948,409 | |
GlaxoSmithKline Capital Inc. | | | | | | | | |
3.875%, 05/15/2028 | | | 2,000,000 | | | | 1,995,896 | |
Sanofi | | | | | | | | |
3.625%, 06/19/2028 | | | 1,500,000 | | | | 1,483,488 | |
| | | | | | | | |
| | | | | | | 42,057,575 | |
| | | | | | | | |
Machinery & Manufacturing (0.78%) | | | | | |
3M Co. | | | | | | | | |
1.625%, 06/15/2019 | | | 2,000,000 | | | | 1,986,740 | |
Caterpillar Financial Services Corp. | | | | | | | | |
2.950%, 05/15/2020 | | | 1,000,000 | | | | 995,664 | |
Danaher Corp. | | | | | | | | |
2.400%, 09/15/2020 | | | 500,000 | | | | 492,871 | |
Caterpillar Inc. | | | | | | | | |
3.900%, 05/27/2021 | | | 500,000 | | | | 505,867 | |
John Deere Capital Corp. | | | | | | | | |
2.750%, 03/15/2022 | | | 500,000 | | | | 489,518 | |
Deere & Co. | | | | | | | | |
2.600%, 06/08/2022 | | | 1,000,000 | | | | 967,230 | |
Covidien International | | | | | | | | |
3.200%, 06/15/2022 | | | 1,000,000 | | | | 986,585 | |
Caterpillar Financial Services Corp. | | | | | | | | |
2.625%, 03/01/2023 | | | 1,000,000 | | | | 959,726 | |
Caterpillar Inc. | | | | | | | | |
3.400%, 05/15/2024 | | | 1,000,000 | | | | 992,248 | |
John Deere Capital Corp. | | | | | | | | |
3.350%, 06/12/2024 | | | 1,500,000 | | | | 1,478,595 | |
Caterpillar Financial Services Corp. | | | | | | | | |
3.250%, 12/01/2024 | | | 1,000,000 | | | | 974,999 | |
3M Co. | | | | | | | | |
3.000%, 08/07/2025 | | | 1,000,000 | | | | 962,365 | |
Dover Corp. | | | | | | | | |
3.150%, 11/15/2025 | | | 1,000,000 | | | | 946,955 | |
3M Co. | | | | | | | | |
2.250%, 09/19/2026 | | | 500,000 | | | | 452,507 | |
Eaton Corp. | | | | | | | | |
3.103%, 09/15/2027 | | | 1,000,000 | | | | 925,396 | |
John Deere Capital Corp. | | | | | | | | |
3.050%, 01/06/2028 | | | 1,000,000 | | | | 935,885 | |
| | | | | | | | |
| | | | | | | 15,053,151 | |
| | | | | | | | |
Media & Broadcasting (0.30%) | | | | | |
Walt Disney Co., The | | | | | | | | |
1.850%, 05/30/2019 | | | 2,000,000 | | | | 1,988,540 | |
Comcast Corp. | | | | | | | | |
3.125%, 07/15/2022 | | | 1,000,000 | | | | 986,312 | |
Reed Elsevier Capital | | | | | | | | |
3.125%, 10/15/2022 | | | 1,000,000 | | | | 971,840 | |
Comcast Corp. | | | | | | | | |
3.600%, 03/01/2024 | | | 1,000,000 | | | | 993,291 | |
2.350%, 01/15/2027 | | | 1,000,000 | | | | 875,573 | |
| | | | | | | | |
| | | | | | | 5,815,556 | |
| | | | | | | | |
| | | | | | | | |
| | | Principal
amount | | | Value | |
Corporate Bonds (Cont.) | | | | | |
Mining & Metals (0.14%) | | | | | |
BHP Billiton Finance USA Ltd. | | | | | | | | |
3.250%, 11/21/2021 | | $ | 1,000,000 | | | $ | 997,231 | |
Alcoa Inc. | | | | | | | | |
5.870%, 02/23/2022 | | | 756,000 | | | | 768,474 | |
Rio Tinto Finance USA Ltd. | | | | | | | | |
3.750%, 06/15/2025 | | | 1,000,000 | | | | 987,665 | |
| | | | | | | | |
| | | | | | | 2,753,370 | |
| | | | | | | | |
Oil & Gas (1.41%) | | | | | | | | |
Chevron Corp. | | | | | | | | |
4.950%, 03/03/2019 | | | 3,000,000 | | | | 3,014,679 | |
BP Capital Markets PLC | | | | | | | | |
4.750%, 03/10/2019 | | | 3,000,000 | | | | 3,012,255 | |
Exxon Mobil Corp. | | | | | | | | |
1.819%, 03/15/2019 | | | 1,000,000 | | | | 997,108 | |
Shell International Finance | | | | | | | | |
4.300%, 09/22/2019 | | | 1,000,000 | | | | 1,009,661 | |
Total Capital International SA | | | | | | | | |
2.750%, 06/19/2021 | | | 1,000,000 | | | | 986,227 | |
TransCanada PipeLines Ltd. | | | | | | | | |
2.500%, 08/01/2022 | | | 2,000,000 | | | | 1,905,074 | |
Shell International Finance | | | | | | | | |
2.375%, 08/21/2022 | | | 1,000,000 | | | | 961,343 | |
Total Capital International SA | | | | | | | | |
2.700%, 01/25/2023 | | | 1,000,000 | | | | 966,045 | |
Occidental Petroleum Corp. | | | | | | | | |
2.700%, 02/15/2023 | | | 2,000,000 | | | | 1,915,290 | |
Chevron Corp. | | | | | | | | |
3.191%, 06/24/2023 | | | 1,000,000 | | | | 982,269 | |
Total Capital Canada Ltd. | | | | | | | | |
2.750%, 07/15/2023 | | | 500,000 | | | | 480,455 | |
Schlumberger Investment | | | | | | | | |
3.650%, 12/01/2023 | | | 1,000,000 | | | | 981,565 | |
Exxon Mobil Corp. | | | | | | | | |
3.176%, 03/15/2024 | | | 2,000,000 | | | | 1,969,572 | |
2.709%, 03/06/2025 | | | 1,000,000 | | | | 944,874 | |
Shell International Finance | | | | | | | | |
3.250%, 05/11/2025 | | | 1,000,000 | | | | 969,179 | |
Occidental Petroleum Corp. | | | | | | | | |
3.500%, 06/15/2025 | | | 500,000 | | | | 487,906 | |
Chevron Corp. | | | | | | | | |
3.326%, 11/17/2025 | | | 1,000,000 | | | | 973,421 | |
TransCanada PipeLines Ltd. | | | | | | | | |
4.875%, 01/15/2026 | | | 1,000,000 | | | | 1,018,155 | |
Shell International Finance | | | | | | | | |
2.875%, 05/10/2026 | | | 1,000,000 | | | | 937,206 | |
Baker Hughes, a GE Co., LLC / Baker Hughes Co-Obligor, Inc. | | | | | | | | |
3.337%, 12/15/2027 | | | 1,000,000 | | | | 898,663 | |
Sabal Trail Transmission LLC (b) | | | | | | | | |
4.246%, 05/01/2028 | | | 1,000,000 | | | | 966,429 | |
TransCanada PipeLines Ltd. | | | | | | | | |
4.250%, 05/15/2028 | | | 1,000,000 | | | | 971,663 | |
| | | | | | | | |
| | | | | | | 27,349,039 | |
| | | | | | | | |
| | |
| 32 | | See accompanying notes to financial statements. |
STATE FARM ASSOCIATES’ FUNDS TRUST BALANCED FUND
SCHEDULE OF INVESTMENTS (continued)
November 30, 2018
| | | | | | | | |
| | | Principal
amount | | | Value | |
Corporate Bonds (Cont.) | |
Retailers (1.05%) | | | | | | | | |
CVS Caremark Corp. | | | | | | | | |
2.250%, 12/05/2018 | | $ | 1,000,000 | | | $ | 999,983 | |
Target Corp. | | | | | | | | |
2.300%, 06/26/2019 | | | 1,000,000 | | | | 995,673 | |
McDonald’s Corp. | | | | | | | | |
3.625%, 05/20/2021 | | | 2,000,000 | | | | 2,010,524 | |
TJX Companies Inc., The | | | | | | | | |
2.750%, 06/15/2021 | | | 1,000,000 | | | | 984,154 | |
Home Depot Inc. | | | | | | | | |
2.625%, 06/01/2022 | | | 500,000 | | | | 489,606 | |
CVS Health Corp. | | | | | | | | |
3.500%, 07/20/2022 | | | 1,000,000 | | | | 986,190 | |
Wal-Mart Stores Inc. | | | | | | | | |
2.550%, 04/11/2023 | | | 1,000,000 | | | | 964,674 | |
CVS Caremark Corp. | | | | | | | | |
4.000%, 12/05/2023 | | | 1,000,000 | | | | 992,299 | |
Wal-Mart Stores Inc. | | | | | | | | |
3.300%, 04/22/2024 | | | 500,000 | | | | 494,196 | |
Costco Wholesale Corp. | | | | | | | | |
2.750%, 05/18/2024 | | | 1,000,000 | | | | 966,149 | |
McDonald’s Corp. | | | | | | | | |
3.250%, 06/10/2024 | | | 1,000,000 | | | | 970,232 | |
Target Corp. | | | | | | | | |
3.500%, 07/01/2024 | | | 1,000,000 | | | | 1,000,602 | |
Home Depot Inc. | | | | | | | | |
3.350%, 09/15/2025 | | | 1,000,000 | | | | 978,589 | |
Lowe’s Companies Inc. | | | | | | | | |
3.375%, 09/15/2025 | | | 1,000,000 | | | | 969,696 | |
Home Depot Inc. | | | | | | | | |
3.000%, 04/01/2026 | | | 1,000,000 | | | | 949,552 | |
Lowe’s Companies Inc. | | | | | | | | |
2.500%, 04/15/2026 | | | 1,000,000 | | | | 908,875 | |
Target Corp. | | | | | | | | |
2.500%, 04/15/2026 | | | 1,000,000 | | | | 915,842 | |
TJX Companies Inc., The | | | | | | | | |
2.250%, 09/15/2026 | | | 1,000,000 | | | | 891,925 | |
Costco Wholesale Corp. | | | | | | | | |
3.000%, 05/18/2027 | | | 1,000,000 | | | | 946,572 | |
Amazon.com Inc. | | | | | | | | |
3.150%, 08/22/2027 | | | 1,000,000 | | | | 949,042 | |
McDonald’s Corp. | | | | | | | | |
3.800%, 04/01/2028 | | | 1,000,000 | | | | 970,132 | |
| | | | | | | | |
| | | | | | | 20,334,507 | |
| | | | | | | | |
Telecom & Telecom Equipment (0.65%) | |
AT&T Inc. | | | | | | | | |
2.300%, 03/11/2019 | | | 1,000,000 | | | | 997,879 | |
Deutsche Telekom International Finance BV (b) | | | | | | | | |
1.950%, 09/19/2021 | | | 1,000,000 | | | | 953,731 | |
AT&T Inc. | | | | | | | | |
3.000%, 02/15/2022 | | | 2,000,000 | | | | 1,952,720 | |
Vodafone Group PLC | | | | | | | | |
2.500%, 09/26/2022 | | | 1,000,000 | | | | 947,236 | |
| | | | | | | | |
| | | Principal
amount | | | Value | |
Corporate Bonds (Cont.) | |
Telecom & Telecom Equipment (Cont.) | |
Verizon Communications Inc. | | | | | | | | |
2.450%, 11/01/2022 | | $ | 1,000,000 | | | $ | 956,521 | |
Vodafone Group PLC | | | | | | | | |
2.950%, 02/19/2023 | | | 1,000,000 | | | | 953,890 | |
Cisco Systems Inc. | | | | | | | | |
3.625%, 03/04/2024 | | | 1,000,000 | | | | 1,003,705 | |
Verizon Communications Inc. | | | | | | | | |
4.150%, 03/15/2024 | | | 1,000,000 | | | | 1,009,890 | |
Cisco Systems Inc. | | | | | | | | |
3.500%, 06/15/2025 | | | 500,000 | | | | 494,809 | |
2.950%, 02/28/2026 | | | 500,000 | | | | 473,669 | |
Verizon Communications Inc. | | | | | | | | |
2.625%, 08/15/2026 | | | 1,000,000 | | | | 895,469 | |
Vodafone Group PLC | | | | | | | | |
4.375%, 05/30/2028 | | | 1,000,000 | | | | 959,640 | |
Verizon Communications Inc. | | | | | | | | |
4.329%, 09/21/2028 | | | 1,012,000 | | | | 1,002,908 | |
| | | | | | | | |
| | | | | | | 12,602,067 | |
| | | | | | | | |
Transportation (0.77%) | | | | | | | | |
Union Pacific Corp. | | | | | | | | |
2.250%, 02/15/2019 | | | 1,000,000 | | | | 998,391 | |
Burlington Northern Santa Fe | | | | | | | | |
3.050%, 09/01/2022 | | | 500,000 | | | | 491,219 | |
United Parcel Service Inc. | | | | | | | | |
2.450%, 10/01/2022 | | | 1,000,000 | | | | 962,741 | |
Burlington Northern Santa Fe | | | | | | | | |
3.000%, 03/15/2023 | | | 1,500,000 | | | | 1,462,595 | |
Union Pacific Corp. | | | | | | | | |
2.750%, 04/15/2023 | | | 500,000 | | | | 484,269 | |
Norfolk Southern Corp. | | | | | | | | |
3.850%, 01/15/2024 | | | 1,000,000 | | | | 999,905 | |
Burlington Northern Santa Fe | | | | | | | | |
3.750%, 04/01/2024 | | | 1,000,000 | | | | 1,006,475 | |
Union Pacific Corp. | | | | | | | | |
3.250%, 08/15/2025 | | | 500,000 | | | | 478,329 | |
Canadian National Railway Co. | | | | | | | | |
2.750%, 03/01/2026 | | | 2,000,000 | | | | 1,878,582 | |
Union Pacific Corp. | | | | | | | | |
2.750%, 03/01/2026 | | | 1,000,000 | | | | 921,255 | |
Norfolk Southern Corp. | | | | | | | | |
2.900%, 06/15/2026 | | | 500,000 | | | | 466,276 | |
United Parcel Service Inc. | | | | | | | | |
2.400%, 11/15/2026 | | | 500,000 | | | | 452,998 | |
Union Pacific Corp. | | | | | | | | |
3.000%, 04/15/2027 | | | 1,000,000 | | | | 926,555 | |
Norfolk Southern Corp. | | | | | | | | |
3.150%, 06/01/2027 | | | 500,000 | | | | 470,574 | |
United Parcel Service Inc. | | | | | | | | |
3.050%, 11/15/2027 | | | 2,000,000 | | | | 1,882,672 | |
Union Pacific Corp. | | | | | | | | |
3.950%, 09/10/2028 | | | 1,000,000 | | | | 980,823 | |
| | | | | | | | |
| | | | | | | 14,863,659 | |
| | | | | | | | |
| | |
| See accompanying notes to financial statements. | | 33 |
STATE FARM ASSOCIATES’ FUNDS TRUST BALANCED FUND
SCHEDULE OF INVESTMENTS (continued)
November 30, 2018
| | | | | | | | |
| | | Principal
amount | | | Value | |
Corporate Bonds (Cont.) | | | | | | | | |
Utilities & Energy (4.09%) | | | | | | | | |
MidAmerican Energy Co. | | | | | | | | |
2.400%, 03/15/2019 | | $ | 1,500,000 | | | $ | 1,497,305 | |
Public Service Electric and Gas Co. | | | | | | | | |
1.800%, 06/01/2019 | | | 1,000,000 | | | | 993,165 | |
Kentucky Utilities Co. | | | | | | | | |
3.250%, 11/01/2020 | | | 500,000 | | | | 499,259 | |
Southern California Edison Co. | | | | | | | | |
3.875%, 06/01/2021 | | | 2,000,000 | | | | 1,998,328 | |
San Diego Gas & Electric Co. | | | | | | | | |
3.000%, 08/15/2021 | | | 500,000 | | | | 494,155 | |
Southern California Edison Co. | | | | | | | | |
2.400%, 02/01/2022 | | | 1,000,000 | | | | 953,056 | |
Carolina Power & Light Co. | | | | | | | | |
2.800%, 05/15/2022 | | | 1,000,000 | | | | 978,290 | |
Consumers Energy Co. | | | | | | | | |
2.850%, 05/15/2022 | | | 1,000,000 | | | | 977,584 | |
Georgia Power Co. | | | | | | | | |
2.850%, 05/15/2022 | | | 1,000,000 | | | | 970,799 | |
Detroit Edison Co. | | | | | | | | |
2.650%, 06/15/2022 | | | 500,000 | | | | 486,566 | |
CenterPoint Energy Houston LLC | | | | | | | | |
2.250%, 08/01/2022 | | | 1,000,000 | | | | 954,650 | |
Baltimore Gas & Electric Co. | | | | | | | | |
2.800%, 08/15/2022 | | | 1,000,000 | | | | 967,814 | |
Northern States Power Co. | | | | | | | | |
2.150%, 08/15/2022 | | | 500,000 | | | | 475,997 | |
Pacific Gas & Electric | | | | | | | | |
2.450%, 08/15/2022 | | | 1,000,000 | | | | 881,542 | |
Ameren Illinois Co. | | | | | | | | |
2.700%, 09/01/2022 | | | 1,000,000 | | | | 972,668 | |
PPL Electric Utilities | | | | | | | | |
2.500%, 09/01/2022 | | | 1,000,000 | | | | 963,656 | |
Public Service Company of Colorado | | | | | | | | |
2.250%, 09/15/2022 | | | 1,000,000 | | | | 955,109 | |
Tampa Electric Co. | | | | | | | | |
2.600%, 09/15/2022 | | | 500,000 | | | | 478,899 | |
NSTAR Electric Co. | | | | | | | | |
2.375%, 10/15/2022 | | | 500,000 | | | | 479,672 | |
Public Service Company of Colorado | | | | | | | | |
2.500%, 03/15/2023 | | | 1,000,000 | | | | 956,611 | |
Virginia Electric & Power Co. | | | | | | | | |
2.750%, 03/15/2023 | | | 1,000,000 | | | | 964,851 | |
Public Service Electric and Gas Co. | | | | | | | | |
2.375%, 05/15/2023 | | | 2,000,000 | | | | 1,913,080 | |
Florida Power & Light Co. | | | | | | | | |
2.750%, 06/01/2023 | | | 2,000,000 | | | | 1,955,484 | |
Pacificorp | | | | | | | | |
2.950%, 06/01/2023 | | | 1,000,000 | | | | 979,279 | |
Pacific Gas & Electric | | | | | | | | |
3.250%, 06/15/2023 | | | 1,000,000 | | | | 879,573 | |
Consumers Energy Co. | | | | | | | | |
3.375%, 08/15/2023 | | | 1,000,000 | | | | 993,253 | |
Laclede Gas Co. | | | | | | | | |
3.400%, 08/15/2023 | | | 1,000,000 | | | | 982,456 | |
Duke Energy Ohio Inc. | | | | | | | | |
3.800%, 09/01/2023 | | | 1,000,000 | | | | 1,012,853 | |
| | | | | | | | |
| | | Principal
amount | | | Value | |
Corporate Bonds (Cont.) | | | | | | | | |
Utilities & Energy (Cont.) | | | | | | | | |
San Diego Gas & Electric Co. | | | | | | | | |
3.600%, 09/01/2023 | | $ | 2,000,000 | | | $ | 1,974,828 | |
Public Service Company of New Hampshire | | | | | | | | |
3.500%, 11/01/2023 | | | 500,000 | | | | 495,621 | |
Delmarva Power & Light Co. | | | | | | | | |
3.500%, 11/15/2023 | | | 1,000,000 | | | | 994,412 | |
Alabama Power Co. | | | | | | | | |
3.550%, 12/01/2023 | | | 1,000,000 | | | | 993,366 | |
Virginia Electric & Power Co. | | | | | | | | |
3.450%, 02/15/2024 | | | 1,000,000 | | | | 989,089 | |
DTE Electric Co. | | | | | | | | |
3.650%, 03/15/2024 | | | 2,000,000 | | | | 2,003,266 | |
Potomac Electric Power Co. | | | | | | | | |
3.600%, 03/15/2024 | | | 1,000,000 | | | | 1,000,153 | |
Florida Power & Light Co. | | | | | | | | |
3.250%, 06/01/2024 | | | 1,000,000 | | | | 992,835 | |
Interstate Power & Light Co. | | | | | | | | |
3.250%, 12/01/2024 | | | 1,000,000 | | | | 968,485 | |
DTE Electric Co. | | | | | | | | |
3.375%, 03/01/2025 | | | 1,000,000 | | | | 973,106 | |
Alabama Power Co. | | | | | | | | |
2.800%, 04/01/2025 | | | 1,000,000 | | | | 939,812 | |
Arizona Public Service Co. | | | | | | | | |
3.150%, 05/15/2025 | | | 500,000 | | | | 479,534 | |
Public Service Company of Colorado | | | | | | | | |
2.900%, 05/15/2025 | | | 1,000,000 | | | | 949,074 | |
Wisconsin Electric Power | | | | | | | | |
3.100%, 06/01/2025 | | | 1,000,000 | | | | 962,514 | |
Pacific Gas & Electric | | | | | | | | |
3.500%, 06/15/2025 | | | 1,000,000 | | | | 865,199 | |
Southern California Gas Co. | | | | | | | | |
3.200%, 06/15/2025 | | | 500,000 | | | | 486,083 | |
Duke Energy Progress LLC | | | | | | | | |
3.250%, 08/15/2025 | | | 1,000,000 | | | | 971,808 | |
Interstate Power & Light Co. | | | | | | | | |
3.400%, 08/15/2025 | | | 1,000,000 | | | | 963,556 | |
Kentucky Utilities Co. | | | | | | | | |
3.300%, 10/01/2025 | | | 500,000 | | | | 483,937 | |
Louisville Gas & Electric Co. | | | | | | | | |
3.300%, 10/01/2025 | | | 1,000,000 | | | | 961,388 | |
PECO Energy Co. | | | | | | | | |
3.150%, 10/15/2025 | | | 1,000,000 | | | | 963,175 | |
NSTAR Electric Co. | | | | | | | | |
3.250%, 11/15/2025 | | | 1,000,000 | | | | 960,526 | |
Florida Power & Light Co. | | | | | | | | |
3.125%, 12/01/2025 | | | 1,000,000 | | | | 973,583 | |
Virginia Electric & Power Co. | | | | | | | | |
3.150%, 01/15/2026 | | | 1,000,000 | | | | 957,860 | |
Brooklyn Union Gas Co. (b) | | | | | | | | |
3.407%, 03/10/2026 | | | 1,000,000 | | | | 960,042 | |
Georgia Power Co. | | | | | | | | |
3.250%, 04/01/2026 | | | 1,000,000 | | | | 943,555 | |
San Diego Gas & Electric Co. | | | | | | | | |
2.500%, 05/15/2026 | | | 1,000,000 | | | | 915,540 | |
| | |
| 34 | | See accompanying notes to financial statements. |
STATE FARM ASSOCIATES’ FUNDS TRUST BALANCED FUND
SCHEDULE OF INVESTMENTS (continued)
November 30, 2018
| | | | | | | | |
| | | Principal
amount | | | Value | |
Corporate Bonds (Cont.) | | | | | | | | |
Utilities & Energy (Cont.) | | | | | | | | |
NSTAR Electric Co. | | | | | | | | |
2.700%, 06/01/2026 | | $ | 1,000,000 | | | $ | 928,087 | |
Commonwealth Edison Co. | | | | | | | | |
2.550%, 06/15/2026 | | | 1,000,000 | | | | 914,887 | |
Southern California Gas Co. | | | | | | | | |
2.600%, 06/15/2026 | | | 1,000,000 | | | | 916,894 | |
Westar Energy Inc. | | | | | | | | |
2.550%, 07/01/2026 | | | 1,000,000 | | | | 916,425 | |
KeySpan Gas East Corp. (b) | | | | | | | | |
2.742%, 08/15/2026 | | | 1,000,000 | | | | 914,509 | |
CenterPoint Energy Houston Electric LLC | | | | | | | | |
2.400%, 09/01/2026 | | | 500,000 | | | | 451,431 | |
Public Service Electric and Gas Co. | | | | | | | | |
2.250%, 09/15/2026 | | | 1,000,000 | | | | 898,720 | |
AEP Transmission Company LLC | | | | | | | | |
3.100%, 12/01/2026 | | | 500,000 | | | | 474,208 | |
Consolidated Edison Co. of New York | | | | | | | | |
2.900%, 12/01/2026 | | | 500,000 | | | | 463,866 | |
Duke Energy Carolinas | | | | | | | | |
2.950%, 12/01/2026 | | | 1,000,000 | | | | 942,327 | |
Westar Energy Inc. | | | | | | | | |
3.100%, 04/01/2027 | | | 1,000,000 | | | | 946,098 | |
NSTAR Electric Co. | | | | | | | | |
3.200%, 05/15/2027 | | | 1,000,000 | | | | 947,519 | |
Public Service Electric and Gas Co. | | | | | | | | |
3.000%, 05/15/2027 | | | 500,000 | | | | 469,354 | |
Appalachian Power Co. | | | | | | | | |
3.300%, 06/01/2027 | | | 1,000,000 | | | | 939,636 | |
Rochester Gas & Electric Corp. (b) | | | | | | | | |
3.100%, 06/01/2027 | | | 1,000,000 | | | | 945,171 | |
Atmos Energy Corp. | | | | | | | | |
3.000%, 06/15/2027 | | | 1,000,000 | | | | 939,250 | |
Union Electric Co. | | | | | | | | |
2.950%, 06/15/2027 | | | 1,000,000 | | | | 943,730 | |
Boston Gas Co. (b) | | | | | | | | |
3.150%, 08/01/2027 | | | 500,000 | | | | 465,964 | |
Commonwealth Edison Co. | | | | | | | | |
2.950%, 08/15/2027 | | | 500,000 | | | | 472,657 | |
Wisconsin Power & Light | | | | | | | | |
3.050%, 10/15/2027 | | | 1,000,000 | | | | 943,698 | |
Consolidated Edison Co. of New York | | | | | | | | |
3.125%, 11/15/2027 | | | 1,000,000 | | | | 944,582 | |
Pacific Gas & Electric | | | | | | | | |
3.300%, 12/01/2027 | | | 1,000,000 | | | | 824,677 | |
Southern California Edison Co. | | | | | | | | |
3.650%, 03/01/2028 | | | 1,000,000 | | | | 951,296 | |
Southwest Gas Corp. | | | | | | | | |
3.700%, 04/01/2028 | | | 1,000,000 | | | | 964,520 | |
Virginia Electric & Power Co. | | | | | | | | |
3.800%, 04/01/2028 | | | 1,000,000 | | | | 982,737 | |
Public Service Electric and Gas Co. | | | | | | | | |
3.700%, 05/01/2028 | | | 1,000,000 | | | | 985,642 | |
Ameren Illinois Co. | | | | | | | | |
3.800%, 05/15/2028 | | | 1,000,000 | | | | 1,002,171 | |
| | | | | | | | |
| | | Principal
amount | | | Value | |
Corporate Bonds (Cont.) | |
Utilities & Energy (Cont.) | |
Consolidated Edison Co. of New York | | | | | | | | |
3.800%, 05/15/2028 | | $ | 1,000,000 | | | $ | 995,440 | |
Indiana Michigan Power Co. | | | | | | | | |
3.850%, 05/15/2028 | | | 1,000,000 | | | | 991,126 | |
AEP Texas Inc. (b) | | | | | | | | |
3.950%, 06/01/2028 | | | 1,000,000 | | | | 984,260 | |
| | | | | | | | |
| | | | 79,199,183 | |
| | | | | | | | |
Total Corporate Bonds | | | | | |
(cost $379,721,704) | | | | 365,856,489 | |
| | | | | | | | |
Foreign Government Bonds (0.10%) | | | | | |
Province of Quebec | | | | | | | | |
2.500%, 04/20/2026 | | | 1,000,000 | | | | 946,705 | |
Province of Ontario | | | | | | | | |
2.500%, 04/27/2026 | | | 1,000,000 | | | | 944,282 | |
| | | | | | | | |
Total Foreign Government Bonds | | | | | |
(cost $1,994,901) | | | | 1,890,987 | |
| | | | | | | | |
Government Agency Securities(c) (4.74%) | |
Agency Commercial Mortgage-Backed
Securities (4.63%) | |
Federal Home Loan Mortgage Corp. | | | | | |
Series K018, Class A2 | | | | |
2.789%, 01/25/2022 | | | 10,000,000 | | | | 9,900,896 | |
Series K029, Class A1 | | | | |
2.839%, 10/25/2022 | | | 5,368,087 | | | | 5,325,819 | |
Series KSMC, Class A2 | | | | |
2.615%, 01/25/2023 | | | 2,000,000 | | | | 1,953,320 | |
Series K722, Class A2 | | | | |
2.406%, 03/25/2023 | | | 1,000,000 | | | | 968,586 | |
Series K723, Class A2 | | | | |
2.454%, 08/25/2023 | | | 2,000,000 | | | | 1,931,198 | |
Series K724, Class A2 | | | | |
3.062%, 11/25/2023 | | | 500,000 | | | | 495,219 | |
Series K725, Class A2 | | | | |
3.002%, 01/25/2024 | | | 3,000,000 | | | | 2,960,460 | |
Series K726, Class A2 | | | | |
2.905%, 04/25/2024 | | | 1,500,000 | | | | 1,472,828 | |
Series K044, Class A2 | | | | |
2.811%, 01/25/2025 | | | 2,000,000 | | | | 1,937,424 | |
Series K049, Class A2 | | | | |
3.010%, 07/25/2025 | | | 2,000,000 | | | | 1,955,916 | |
Series K054, Class A2 | | | | |
2.745%, 01/25/2026 | | | 500,000 | | | | 479,080 | |
Series K055, Class A2 | | | | |
2.673%, 03/25/2026 | | | 2,000,000 | | | | 1,904,860 | |
Series K056, Class A2 | | | | |
2.525%, 05/25/2026 | | | 2,000,000 | | | | 1,877,956 | |
Series K057, Class A2 | | | | |
2.570%, 07/25/2026 | | | 2,000,000 | | | | 1,879,468 | |
Series K058, Class A2 | | | | |
2.653%, 08/25/2026 | | | 1,500,000 | | | | 1,413,209 | |
Series K059, Class A2 | | | | |
3.120%, 09/25/2026 | | | 1,500,000 | | | | 1,457,816 | |
Series K060, Class A2 | | | | |
3.300%, 10/25/2026 | | | 1,500,000 | | | | 1,475,237 | |
| | |
| See accompanying notes to financial statements. | | 35 |
STATE FARM ASSOCIATES’ FUNDS TRUST BALANCED FUND
SCHEDULE OF INVESTMENTS (continued)
November 30, 2018
| | | | | | | | |
| | | Principal
amount | | | Value | |
Government Agency Securities (Cont.) | | | | | |
Agency Commercial Mortgage-Backed
Securities (Cont.) | |
Series K061, Class A2 | | | | | | | | |
3.347%, 11/25/2026 | | $ | 2,000,000 | | | $ | 1,973,254 | |
Series K062, Class A2 | | | | | | | | |
3.413%, 12/25/2026 | | | 1,500,000 | | | | 1,486,395 | |
Series K063, Class A2 | | | | | | | | |
3.430%, 01/25/2027 | | | 2,000,000 | | | | 1,980,176 | |
Series K064, Class A2 | | | | | | | | |
3.224%, 03/25/2027 | | | 2,500,000 | | | | 2,441,765 | |
Series K065, Class A2 | | | | | | | | |
3.243%, 04/25/2027 | | | 2,000,000 | | | | 1,950,728 | |
Series K072, Class A2 | | | | | | | | |
3.444%, 12/25/2027 | | | 1,500,000 | | | | 1,478,706 | |
Series K074, Class A2 | | | | | | | | |
3.600%, 01/25/2028 | | | 2,000,000 | | | | 1,993,390 | |
Series K073, Class A2 | | | | | | | | |
3.350%, 01/25/2028 | | | 1,000,000 | | | | 980,700 | |
Series K075, Class A2 | | | | | | | | |
3.650%, 02/25/2028 | | | 1,500,000 | | | | 1,500,666 | |
Series K076, Class A2 | | | | | | | | |
3.900%, 04/25/2028 | | | 2,000,000 | | | | 2,038,158 | |
Federal National Mortgage Association | | | | | |
Series 2012-M5, Class A2 | | | | | | | | |
2.715%, 02/25/2022 | | | 3,348,536 | | | | 3,308,109 | |
Series 2016-M12, Class AV2 | | | | | | | | |
2.308%, 10/25/2023 | | | 1,000,000 | | | | 946,867 | |
Series 2015-M11, Class A2 | | | | | | | | |
2.936%, 04/25/2025 | | | 2,000,000 | | | | 1,941,326 | |
Series 2015-M17, Class A2 | | | | | | | | |
3.035%, 11/25/2025 | | | 1,000,000 | | | | 969,752 | |
Series 2016-M6, Class A2 | | | | | | | | |
2.488%, 05/25/2026 | | | 1,000,000 | | | | 930,815 | |
Series 2016-M9, Class A2 | | | | | | | | |
2.292%, 06/25/2026 | | | 1,000,000 | | | | 914,890 | |
Series 2016-M11, Class A2 | | | | | | | | |
2.369%, 07/25/2026 | | | 2,000,000 | | | | 1,836,968 | |
Series 2016-M12, Class A2 | | | | | | | | |
2.528%, 09/25/2026 | | | 2,000,000 | | | | 1,854,052 | |
Series 2016-M7, Class A2 | | | | | | | | |
2.499%, 09/25/2026 | | | 1,000,000 | | | | 928,581 | |
Series 2016-M13, Class A2 | | | | | | | | |
2.560%, 09/25/2026 | | | 1,000,000 | | | | 926,943 | |
Series 2017-M1, Class A2 | | | | | | | | |
2.496%, 10/25/2026 | | | 2,500,000 | | | | 2,303,520 | |
Series 2017-M4, Class A2 | | | | | | | | |
2.683%, 12/25/2026 | | | 2,500,000 | | | | 2,323,038 | |
Series 2017-M3, Class A2 | | | | | | | | |
2.568%, 12/25/2026 | | | 2,000,000 | | | | 1,844,312 | |
Series 2017-M7, Class A2 | | | | | | | | |
2.961%, 02/25/2027 | | | 2,000,000 | | | | 1,902,734 | |
Series 2017-M2, Class A2 | | | | | | | | |
2.878%, 02/25/2027 | | | 1,000,000 | | | | 942,873 | |
Series 2017-M8, Class A2 | | | | | | | | |
3.061%, 05/25/2027 | | | 2,000,000 | | | | 1,913,358 | |
Series 2018-M1, Class A2 | | | | | | | | |
3.086%, 12/25/2027 | | | 2,000,000 | | | | 1,894,818 | |
Series 2018-M2, Class A2 | | | | | | | | |
2.999%, 01/25/2028 | | | 2,000,000 | | | | 1,897,484 | |
| | | | | | | | |
| | | Principal
amount | | | Value | |
Government Agency Securities (Cont.) | |
Agency Commercial Mortgage-Backed
Securities (Cont.) | |
Series 2018-M7, Class A2 | | | | | | | | |
3.150%, 03/25/2028 | | $ | 1,500,000 | | | $ | 1,436,330 | |
Series 2018-M4, Class A2 | | | | | | | | |
3.144%, 03/25/2028 | | | 1,500,000 | | | | 1,425,380 | |
| | | | | | | | |
| | | | | | | 89,655,380 | |
| | | | | | | | |
Agency Notes & Bonds (0.11%) | |
Tennessee Valley Authority | | | | | | | | |
3.875%, 02/15/2021 | | | 2,000,000 | | | | 2,040,256 | |
| | | | | | | | |
| | | | | | | 2,040,256 | |
| | | | | | | | |
Total Government Agency Securities | | | | | |
(cost $95,400,218) | | | | 91,695,636 | |
| | | | | | | | |
U.S. Treasury Obligations (8.95%) | |
U.S. Treasury Notes | | | | | | | | |
1.625%, 04/30/2019 | | | 10,000,000 | | | | 9,963,280 | |
3.125%, 05/15/2019 | | | 10,000,000 | | | | 10,024,610 | |
3.625%, 08/15/2019 | | | 10,000,000 | | | | 10,064,450 | |
3.375%, 11/15/2019 | | | 10,000,000 | | | | 10,055,470 | |
3.625%, 02/15/2020 | | | 15,000,000 | | | | 15,144,135 | |
3.500%, 05/15/2020 | | | 20,000,000 | | | | 20,196,100 | |
1.375%, 10/31/2020 | | | 5,000,000 | | | | 4,865,235 | |
3.625%, 02/15/2021 | | | 10,000,000 | | | | 10,169,530 | |
2.000%, 02/28/2021 | | | 5,000,000 | | | | 4,910,740 | |
2.000%, 11/15/2021 | | | 25,000,000 | | | | 24,418,950 | |
2.500%, 08/15/2023 | | | 10,000,000 | | | | 9,840,630 | |
2.750%, 11/15/2023 | | | 10,000,000 | | | | 9,947,270 | |
2.500%, 05/15/2024 | | | 5,000,000 | | | | 4,902,345 | |
2.000%, 06/30/2024 | | | 5,000,000 | | | | 4,771,875 | |
2.000%, 02/15/2025 | | | 15,000,000 | | | | 14,218,950 | |
2.750%, 02/15/2028 | | | 10,000,000 | | | | 9,792,970 | |
| | | | | | | | |
Total U.S. Treasury Obligations | |
(cost $174,761,646) | | | | | | | 173,286,540 | |
| | | | | | | | |
| | |
| 36 | | See accompanying notes to financial statements. |
STATE FARM ASSOCIATES’ FUNDS TRUST BALANCED FUND
SCHEDULE OF INVESTMENTS (continued)
November 30, 2018
| | | | | | | | |
| | | Shares | | | Value | |
Short-term Investments (1.70%) | | | | | |
JPMorgan U.S. Government Money Market Fund Capital Shares, 2.11% (d) | | | 32,795,506 | | | $ | 32,795,506 | |
| | | | | | | | |
Total Short-term Investments | | | | | |
(cost $32,795,506) | | | | | | | 32,795,506 | |
| | | | | | | | |
TOTAL INVESTMENTS (99.85%) | | | | | |
(cost $1,125,324,880) | | | | | | | 1,932,445,285 | |
OTHER ASSETS, NET OF LIABILITIES (0.15%) | | | | 2,911,421 | |
| | | | | | | | |
NET ASSETS (100.00%) | | | $ | 1,935,356,706 | |
| | | | | | | | |
| (a) | Non-income producing security. |
| (b) | Securities exempt from registration pursuant to Rule 144A under the Securities Act of 1933. These securities may be resold in transactions exempt from registration, normally to qualified institutional buyers. At November 30, 2018, the value of these securities amounted to $28,081,211 or 1.45% of net assets. |
| (c) | The obligations of these U.S. Government-sponsored entities are neither issued nor guaranteed by the United States Treasury. On September 6, 2008, the Federal Housing Finance Agency placed the Federal National Mortgage Association (“Fannie Mae”) and the Federal Home Loan Mortgage Corp. (“Freddie Mac”) into conservatorship. The United States Treasury has put in place a set of financing agreements to help ensure that these entities continue to meet their obligations to holders of bonds they have issued or guaranteed. |
| (d) | Rate shown is the 7-day yield as of November 30, 2018. |
ADR - American Depositary Receipt
| | |
| See accompanying notes to financial statements. | | 37 |
STATE FARM ASSOCIATES’ FUNDS TRUST INTERIM FUND
SCHEDULE OF INVESTMENTS
November 30, 2018
| | | | | | | | |
| | | Principal
amount | | | Value | |
U.S. Treasury Obligations (98.16%) | | | | | |
U.S. Treasury Notes | | | | | | | | |
1.375%, 12/31/2018 | | $ | 10,000,000 | | | $ | 9,993,410 | |
1.250%, 01/31/2019 | | | 10,000,000 | | | | 9,982,750 | |
1.375%, 02/28/2019 | | | 10,000,000 | | | | 9,975,300 | |
1.500%, 03/31/2019 | | | 10,000,000 | | | | 9,966,800 | |
1.125%, 05/31/2019 | | | 10,000,000 | | | | 9,930,860 | |
1.250%, 10/31/2019 | | | 15,000,000 | | | | 14,803,710 | |
1.375%, 01/31/2020 | | | 10,000,000 | | | | 9,841,410 | |
1.375%, 02/29/2020 | | | 5,000,000 | | | | 4,914,065 | |
1.375%, 03/31/2020 | | | 5,000,000 | | | | 4,907,420 | |
1.125%, 04/30/2020 | | | 5,000,000 | | | | 4,884,960 | |
1.500%, 05/31/2020 | | | 5,000,000 | | | | 4,904,100 | |
1.875%, 06/30/2020 | | | 10,000,000 | | | | 9,855,080 | |
1.625%, 07/31/2020 | | | 5,000,000 | | | | 4,903,125 | |
1.375%, 08/31/2020 | | | 5,000,000 | | | | 4,877,150 | |
2.875%, 10/31/2020 | | | 2,500,000 | | | | 2,502,050 | |
2.625%, 11/15/2020 | | | 3,000,000 | | | | 2,988,516 | |
2.125%, 01/31/2021 | | | 10,000,000 | | | | 9,853,520 | |
1.375%, 04/30/2021 | | | 10,000,000 | | | | 9,664,060 | |
2.000%, 05/31/2021 | | | 10,000,000 | | | | 9,800,390 | |
1.125%, 07/31/2021 | | | 5,000,000 | | | | 4,782,030 | |
2.000%, 08/31/2021 | | | 5,000,000 | | | | 4,890,625 | |
2.750%, 09/15/2021 | | | 2,500,000 | | | | 2,494,533 | |
2.000%, 10/31/2021 | | | 7,500,000 | | | | 7,325,978 | |
1.875%, 11/30/2021 | | | 10,000,000 | | | | 9,729,300 | |
1.500%, 01/31/2022 | | | 10,000,000 | | | | 9,596,880 | |
1.750%, 02/28/2022 | | | 10,000,000 | | | | 9,662,500 | |
1.750%, 03/31/2022 | | | 10,000,000 | | | | 9,653,910 | |
1.750%, 04/30/2022 | | | 5,000,000 | | | | 4,822,070 | |
1.750%, 05/15/2022 | | | 10,000,000 | | | | 9,641,410 | |
1.625%, 08/15/2022 | | | 8,500,000 | | | | 8,133,106 | |
1.750%, 09/30/2022 | | | 5,000,000 | | | | 4,800,195 | |
1.875%, 10/31/2022 | | | 2,000,000 | | | | 1,927,500 | |
2.000%, 11/30/2022 | | | 2,500,000 | | | | 2,419,923 | |
2.000%, 02/15/2023 | | | 5,000,000 | | | | 4,829,100 | |
2.500%, 03/31/2023 | | | 3,000,000 | | | | 2,957,109 | |
1.625%, 04/30/2023 | | | 5,000,000 | | | | 4,744,530 | |
1.625%, 05/31/2023 | | | 10,000,000 | | | | 9,479,690 | |
1.375%, 06/30/2023 | | | 5,000,000 | | | | 4,682,615 | |
1.250%, 07/31/2023 | | | 5,000,000 | | | | 4,649,415 | |
2.500%, 08/15/2023 | | | 5,000,000 | | | | 4,920,315 | |
1.375%, 09/30/2023 | | | 5,000,000 | | | | 4,664,845 | |
1.625%, 10/31/2023 | | | 5,000,000 | | | | 4,716,013 | |
2.875%, 10/31/2023 | | | 2,000,000 | | | | 2,001,875 | |
2.125%, 11/30/2023 | | | 10,000,000 | | | | 9,653,520 | |
2.250%, 01/31/2024 | | | 5,000,000 | | | | 4,850,195 | |
2.750%, 02/15/2024 | | | 5,000,000 | | | | 4,968,165 | |
2.125%, 02/29/2024 | | | 5,000,000 | | | | 4,817,190 | |
2.125%, 03/31/2024 | | | 3,000,000 | | | | 2,888,319 | |
2.000%, 04/30/2024 | | | 5,000,000 | | | | 4,779,490 | |
2.500%, 05/15/2024 | | | 6,500,000 | | | | 6,373,049 | |
2.375%, 08/15/2024 | | | 5,000,000 | | | | 4,862,110 | |
2.250%, 10/31/2024 | | | 2,500,000 | | | | 2,412,013 | |
| | | | | | | | |
Total U.S. Treasury Obligations | | | | | |
(cost $339,756,811) | | | | | | | 331,678,194 | |
| | | | | | | | |
| | | | | | | | |
| | | Shares | | | Value | |
Short-term Investments (2.13%) | | | | | |
JPMorgan U.S. Government Money Market Fund Capital Shares, 2.11% (a) | | | 7,203,035 | | | $ | 7,203,035 | |
| | | | | | | | |
Total Short-term Investments | | | | | |
(cost $ 7,203,035) | | | | | | | 7,203,035 | |
| | | | | | | | |
TOTAL INVESTMENTS (100.29%) | | | | | |
(cost $ 346,959,846) | | | | | | | 338,881,229 | |
LIABILITIES, NET OF CASH AND OTHER ASSETS (-0.29%) | | | | (995,398 | ) |
| | | | | | | | |
NET ASSETS (100.00%) | | | | | | $ | 337,885,831 | |
| | | | | | | | |
| (a) | Rate shown is the 7-day yield as of November 30, 2018. |
| | |
| 38 | | See accompanying notes to financial statements. |
STATE FARM ASSOCIATES’ FUNDS TRUST MUNICIPAL BOND FUND
SCHEDULE OF INVESTMENTS
November 30, 2018
| | | | | | | | | | | | | | | | | | | | |
| | | Coupon
rate | | | Maturity date | | | Rating (a) | | | Principal
amount | | | Value | |
Long-term Municipal Bonds (98.78%) | | | | | | | | | | | | | | | | | | | | |
Alabama (2.29%) | | | | | | | | | | | | | | | | | | | | |
City of Phenix City, General Obligation Warrants, Series 2010-B | | | 5.000 | % | | | 02/01/2019 | | | | AA- | | | $ | 1,030,000 | | | $ | 1,035,119 | |
City of Athens, Alabama, General Obligation Warrants | | | 4.000 | % | | | 09/01/2019 | | | | Aa3 | | | | 1,145,000 | | | | 1,162,599 | |
City of Athens, Alabama, Electric Revenue Warrants, Series 2015 | | | 3.000 | % | | | 06/01/2024 | | | | A+ | | | | 585,000 | | | | 597,507 | |
City of Athens, Alabama, Electric Revenue Warrants, Series 2015 | | | 3.250 | % | | | 06/01/2025 | | | | A+ | | | | 600,000 | | | | 618,288 | |
City of Athens, Alabama, Electric Revenue Warrants, Series 2015 | | | 3.500 | % | | | 06/01/2026 | | | | A+ | | | | 620,000 | | | | 641,948 | |
City of Madison (Alabama), General Obligation School Warrants, Series 2009 | | | 5.250 | % | | | 02/01/2027 | | | | Aa2 | | | | 525,000 | | | | 527,856 | |
City of Madison (Alabama), General Obligation School Warrants, Series 2009 (Prerefunded to 02-01-2019 @ 100) (b) | | | 5.250 | % | | | 02/01/2027 | | | | NR | | | | 2,015,000 | | | | 2,025,800 | |
City of Athens, Alabama, Electric Revenue Warrants, Series 2015 | | | 3.750 | % | | | 06/01/2027 | | | | A+ | | | | 645,000 | | | | 670,981 | |
City of Madison (Alabama), General Obligation School Warrants, Series 2009 | | | 5.250 | % | | | 02/01/2028 | | | | Aa2 | | | | 310,000 | | | | 311,686 | |
City of Madison (Alabama), General Obligation School Warrants, Series 2009 (Prerefunded to 02-01-2019 @ 100) (b) | | | 5.250 | % | | | 02/01/2028 | | | | NR | | | | 1,190,000 | | | | 1,196,378 | |
City of Athens, Alabama, Water and Sewer Revenue Warrants, Series 2017 | | | 3.000 | % | | | 05/01/2028 | | | | A2 | | | | 980,000 | | | | 968,877 | |
City of Athens, Alabama, Electric Revenue Warrants, Series 2015 | | | 4.000 | % | | | 06/01/2028 | | | | A+ | | | | 665,000 | | | | 697,751 | |
The Water and Wastewater Board of the City of Madison Water and Sewer Revenue Bonds, Series 2015 | | | 4.000 | % | | | 12/01/2028 | | | | Aa2 | | | | 2,165,000 | | | | 2,289,228 | |
City of Athens, Alabama, Water and Sewer Revenue Warrants, Series 2017 | | | 3.125 | % | | | 05/01/2029 | | | | A2 | | | | 1,010,000 | | | | 994,517 | |
City of Florence (Alabama), Water and Sewer Revenue Warrants, Series 2011 (Prerefunded to 02-15-2021 @ 100) (b) | | | 5.000 | % | | | 08/15/2029 | | | | A1 | | | | 1,620,000 | | | | 1,722,838 | |
| | | | | | | | | | | | | | | | | | | | |
| | | | | | | | | | | | | | | | | | | 15,461,373 | |
| | | | | | | | | | | | | | | | | | | | |
Alaska (1.76%) | | | | | | | | | | | | | | | | | | | | |
Municipality of Anchorage, Alaska, Senior Lien Electric Revenue Bonds, 2009 Series A (Tax-Exempt) | | | 4.000 | % | | | 12/01/2021 | | | | A+ | | | | 1,955,000 | | | | 1,991,734 | |
Matanuska-Susitna Borough, Alaska, General Obligation School Bonds, 2009 Series A (Prerefunded to 07-01-2019 @ 100) (b) | | | 5.500 | % | | | 07/01/2025 | | | | Aa2 | | | | 1,190,000 | | | | 1,215,121 | |
Municipality of Anchorage, Alaska, 2016 General Obligation Bonds, Series A, (General Purpose) | | | 3.250 | % | | | 09/01/2028 | | | | AAA | | | | 1,095,000 | | | | 1,110,571 | |
Municipality of Anchorage, Alaska, 2016 General Obligation Bonds, Series B, (Schools) | | | 3.250 | % | | | 09/01/2028 | | | | AAA | | | | 1,050,000 | | | | 1,064,931 | |
Municipality of Anchorage, Alaska, 2016 General Obligation Bonds, Series A, (General Purpose) | | | 3.500 | % | | | 09/01/2029 | | | | AAA | | | | 1,390,000 | | | | 1,421,901 | |
Municipality of Anchorage, Alaska, 2016 General Obligation Bonds, Series B, (Schools) | | | 3.500 | % | | | 09/01/2029 | | | | AAA | | | | 1,090,000 | | | | 1,115,016 | |
Municipality of Anchorage, Alaska, 2016 General Obligation Bonds, Series A, (General Purpose) | | | 3.500 | % | | | 09/01/2030 | | | | AAA | | | | 1,440,000 | | | | 1,462,003 | |
Municipality of Anchorage, Alaska, 2016 General Obligation Bonds, Series B, (Schools) | | | 3.500 | % | | | 09/01/2030 | | | | AAA | | | | 1,125,000 | | | | 1,142,190 | |
Matanuska-Susitna Borough, Alaska, General Obligation Transportation System Bonds, 2014 Series A | | | 5.000 | % | | | 08/01/2031 | | | | AA+ | | | | 1,225,000 | | | | 1,348,860 | |
| | | | | | | | | | | | | | | | | | | | |
| | | | | | | | | | | | | | | | | | | 11,872,327 | |
| | | | | | | | | | | | | | | | | | | | |
Arizona (4.36%) | | | | | | | | | | | | | | | | | | | | |
Amphitheater Unified School District No. 10 of Pima County, Arizona, School Improvement Bonds, Project of 2007, Series B (2009), (Bank Qualified) | | | 4.000 | % | | | 07/01/2019 | | | | A+ | | | | 500,000 | | | | 506,055 | |
City of Glendale, Arizona, General Obligation Refunding Bonds, Series 2010 | | | 5.000 | % | | | 07/01/2019 | | | | A1 | | | | 4,180,000 | | | | 4,254,655 | |
Tucson Unified School District No. 1 of Pima County, Arizona, Refunding Bonds, Tax-Exempt Series 2011 | | | 5.000 | % | | | 07/01/2020 | | | | Aa3 | | | | 1,965,000 | | | | 2,055,292 | |
Amphitheater Unified School District No. 10 of Pima County, Arizona, School Improvement Bonds, Project of 2007, Series B (2009), (Bank Qualified) (Economically Defeased to 07-01-2019 @ 100) (b) | | | 5.000 | % | | | 07/01/2021 | | | | A+ | | | | 500,000 | | | | 508,990 | |
Paradise Valley Unified School District No. 69 of Maricopa County, Arizona, School Improvement Bonds, Project of 2011, Series A (2012) | | | 3.000 | % | | | 07/01/2021 | | | | Aa2 | | | | 1,000,000 | | | | 1,023,770 | |
Paradise Valley Unified School District No. 69 of Maricopa County, Arizona, School Improvement Bonds, Project of 2011, Series A (2012) | | | 3.000 | % | | | 07/01/2022 | | | | Aa2 | | | | 570,000 | | | | 586,388 | |
Pima County, Arizona, Sewer System Revenue Obligations, Series 2012A | | | 5.000 | % | | | 07/01/2022 | | | | AA | | | | 500,000 | | | | 548,960 | |
Pima County, Arizona, Sewer System Revenue Obligations, Series 2012A | | | 3.000 | % | | | 07/01/2022 | | | | AA | | | | 495,000 | | | | 509,578 | |
Tucson Unified School District No. 1 of Pima County, Arizona, Refunding Bonds, Tax-Exempt Series 2011 | | | 5.000 | % | | | 07/01/2022 | | | | Aa3 | | | | 1,000,000 | | | | 1,099,010 | |
| | |
| See accompanying notes to financial statements. | | 39 |
STATE FARM ASSOCIATES’ FUNDS TRUST MUNICIPAL BOND FUND
SCHEDULE OF INVESTMENTS (continued)
November 30, 2018
| | | | | | | | | | | | | | | | | | | | |
| | | Coupon
rate | | | Maturity date | | | Rating (a) | | | Principal
amount | | | Value | |
Long-term Municipal Bonds (Cont.) | | | | | | | | | | | | | | | | | | | | |
Arizona (Cont.) | | | | | | | | | | | | | | | | | | | | |
Amphitheater Unified School District No. 10 of Pima County, Arizona, School Improvement Bonds, Project of 2007, Series B (2009), (Bank Qualified) (Economically Defeased to 07-01-2019 @ 100) (b) | | | 5.000 | % | | | 07/01/2023 | | | | A+ | | | $ | 1,000,000 | | | $ | 1,017,980 | |
Litchfield Elementary School District No. 79 of Maricopa County, Arizona, School Improvement Bonds, Project of 2009, Series A (2011) | | | 5.000 | % | | | 07/01/2023 | | | | Aa2 | | | | 1,000,000 | | | | 1,071,600 | |
Paradise Valley Unified School District No. 69 of Maricopa County, Arizona, School Improvement Bonds, Project of 2011, Series A (2012) | | | 3.000 | % | | | 07/01/2023 | | | | Aa2 | | | | 930,000 | | | | 954,468 | |
Paradise Valley Unified School District No. 69 of Maricopa County, Arizona, School Improvement Bonds, Project of 2011, Series B (2013) | | | 3.000 | % | | | 07/01/2023 | | | | Aa2 | | | | 1,255,000 | | | | 1,296,792 | |
Pima County, Arizona, General Obligation Bonds, Series 2009A (Economically Defeased to 07-01-2019 @ 100) (b) | | | 4.000 | % | | | 07/01/2023 | | | | AA | | | | 1,500,000 | | | | 1,517,565 | |
Pima County, Arizona, Sewer System Revenue Obligations, Series 2012A | | | 5.000 | % | | | 07/01/2023 | | | | AA | | | | 1,060,000 | | | | 1,162,269 | |
Pinal County Community College District of Pinal County, Arizona, General Obligation Bonds, Project of 2008, Series B (2012) | | | 4.500 | % | | | 07/01/2023 | | | | AA- | | | | 1,705,000 | | | | 1,802,304 | |
Amphitheater Unified School District No. 10 of Pima County, Arizona, School Improvement Bonds, Project of 2007, Series B (2009), (Bank Qualified) (Economically Defeased to 07-01-2019 @ 100) (b) | | | 5.000 | % | | | 07/01/2024 | | | | A+ | | | | 1,000,000 | | | | 1,017,980 | |
Phoenix Union High School District No. 210 of Maricopa County, Arizona, School Improvement Bonds, Project of 2011, Tax-Exempt Series A (2012) | | | 4.000 | % | | | 07/01/2024 | | | | Aa2 | | | | 1,165,000 | | | | 1,234,655 | |
Amphitheater Unified School District No. 10 of Pima County, Arizona, School Improvement Bonds, Project of 2007, Series D (2013) | | | 5.000 | % | | | 07/01/2026 | | | | A+ | | | | 555,000 | | | | 612,093 | |
Cave Creek Unified School District No. 93 of Maricopa County, Arizona, School Improvement Bonds, Project of 2014, Series A (2015) | | | 4.000 | % | | | 07/01/2026 | | | | AA- | | | | 545,000 | | | | 588,660 | |
Kyrene Elementary School District No. 28 of Maricopa County, Arizona, School Improvement Bonds, Project of 2010, Series C (2015) | | | 4.000 | % | | | 07/01/2026 | | | | AA | | | | 765,000 | | | | 833,513 | |
Pima County, Arizona, General Obligation Bonds, Series 2012A | | | 4.000 | % | | | 07/01/2026 | | | | AA | | | | 2,000,000 | | | | 2,104,780 | |
Amphitheater Unified School District No. 10 of Pima County, Arizona, School Improvement Bonds, Project of 2007, Series D (2013) | | | 5.000 | % | | | 07/01/2027 | | | | A+ | | | | 400,000 | | | | 440,784 | |
Cave Creek Unified School District No. 93 of Maricopa County, Arizona, School Improvement Bonds, Project of 2014, Series A (2015) | | | 4.000 | % | | | 07/01/2027 | | | | AA- | | | | 1,100,000 | | | | 1,178,925 | |
Tempe Union High School District No. 213 of Maricopa County, Arizona, Refunding Bonds, Series 2016 | | | 3.000 | % | | | 07/01/2028 | | | | Aa2 | | | | 1,000,000 | | | | 1,004,860 | |
Salt River Project Agricultural Improvement and Power District, Arizona, Salt River Project Electric System Revenue Bonds, 2009 Series A (Prerefunded to 01-01-2019 @ 100) (b) | | | 5.000 | % | | | 01/01/2032 | | | | AA | | | | 500,000 | | | | 501,205 | |
| | | | | | | | | | | | | | | | | | | | |
| | | | | | | | | | | | | | | | | | | 29,433,131 | |
| | | | | | | | | | | | | | | | | | | | |
Arkansas (2.66%) | | | | | | | | | | | | | | | | | | | | |
State of Arkansas, General Obligation Four-Lane Highway Construction and Improvement Bonds, Series 2013 | | | 3.500 | % | | | 06/15/2023 | | | | AA | | | | 6,000,000 | | | | 6,185,400 | |
Board of Trustees of the University of Arkansas, Various Facility Revenue Bonds (Fayetteville Campus), Refunding Series 2015A | | | 3.000 | % | | | 11/01/2024 | | | | Aa2 | | | | 2,315,000 | | | | 2,389,728 | |
City of Little Rock, Arkansas, Library Construction and Refunding Bonds, Series 2015 | | | 2.750 | % | | | 03/01/2025 | | | | AA | | | | 1,025,000 | | | | 1,018,963 | |
State of Arkansas, Higher Education General Obligation Bonds, Refunding Series 2015 | | | 4.000 | % | | | 06/01/2027 | | | | AA | | | | 3,000,000 | | | | 3,237,360 | |
Board of Trustees of the University of Arkansas, Various Facility Revenue Bonds (Fayetteville Campus), Series 2014A | | | 5.000 | % | | | 11/01/2028 | | | | Aa2 | | | | 365,000 | | | | 412,676 | |
Rogers School District No. 30 of Benton County, Arkansas Refunding Bonds | | | 4.000 | % | | | 02/01/2030 | | | | NR | | | | 1,000,000 | | | | 1,012,550 | |
Rogers School District No. 30 of Benton County, Arkansas, Refunding Bonds | | | 3.125 | % | | | 02/01/2030 | | | | NR | | | | 2,880,000 | | | | 2,839,306 | |
Board of Trustees of the University of Arkansas, Various Facility Revenue Bonds (Fayetteville Campus), Series 2014A | | | 5.000 | % | | | 11/01/2030 | | | | Aa2 | | | | 785,000 | | | | 882,042 | |
| | | | | | | | | | | | | | | | | | | | |
| | | | | | | | | | | | | | | | | | | 17,978,025 | |
| | | | | | | | | | | | | | | | | | | | |
California (4.65%) | | | | | | | | | | | | | | | | | | | | |
City of San Jose, General Obligation Bonds, Series 2007 (Parks and Public Safety Projects) | | | 4.500 | % | | | 09/01/2022 | | | | Aa1 | | | | 2,900,000 | | | | 2,905,945 | |
Atascadero Unified School District, (San Luis Obispo County, California) General Obligation Bonds, 2010 Election, Series B | | | 5.000 | % | | | 08/01/2025 | | | | Aa3 | | | | 225,000 | | | | 258,228 | |
Marin Community College District (Marin County, California), Election of 2004 General Obligation Bonds, Series C (Prerefunded to 08-01-2021 @ 100) (b) | | | 4.000 | % | | | 08/01/2025 | | | | Aaa | | | | 1,115,000 | | | | 1,179,269 | |
| | |
| 40 | | See accompanying notes to financial statements. |
STATE FARM ASSOCIATES’ FUNDS TRUST MUNICIPAL BOND FUND
SCHEDULE OF INVESTMENTS (continued)
November 30, 2018
| | | | | | | | | | | | | | | | | | | | |
| | | Coupon
rate | | | Maturity date | | | Rating (a) | | | Principal
amount | | | Value | |
Long-term Municipal Bonds (Cont.) | | | | | | | | | | | | | | | | | | | | |
California (Cont.) | | | | | | | | | | | | | | | | | | | | |
Marin Community College District (Marin County, California), Election of 2004 General Obligation Bonds, Series C (Prerefunded to 08-01-2021 @ 100) (b) | | | 4.250 | % | | | 08/01/2026 | | | | Aaa | | | $ | 1,275,000 | | | $ | 1,356,728 | |
Atascadero Unified School District, (San Luis Obispo County, California) General Obligation Bonds, 2010 Election, Series B | | | 5.000 | % | | | 08/01/2027 | | | | Aa3 | | | | 1,080,000 | | | | 1,233,932 | |
East Side Union High School District, (Santa Clara County, California), 2015 General Obligation Refunding Bonds | | | 3.500 | % | | | 08/01/2027 | | | | A+ | | | | 1,000,000 | | | | 1,054,450 | |
Newark Unified School District, (Alameda County, California), General Obligation Bonds, Election of 2011, Series C | | | 2.000 | % | | | 08/01/2027 | | | | Aa3 | | | | 875,000 | | | | 827,908 | |
Newark Unified School District, (Alameda County, California), General Obligation Bonds, Election of 2011, Series C | | | 3.000 | % | | | 08/01/2028 | | | | Aa3 | | | | 750,000 | | | | 755,873 | |
Santee School District, (County of San Diego, California), General Obligation Refunding Bonds, Series 2015 | | | 3.500 | % | | | 08/01/2028 | | | | AA- | | | | 1,565,000 | | | | 1,627,710 | |
Campbell Union High School District, (Santa Clara County, California), 2016 General Obligation Refunding Bonds | | | 3.250 | % | | | 08/01/2029 | | | | Aa1 | | | | 1,965,000 | | | | 2,002,905 | |
City of La Mesa, General Obligation Refunding Bonds, Series 2016 (Fire, Police and Emergency Services Measure) | | | 3.500 | % | | | 08/01/2029 | | | | Aa2 | | | | 1,190,000 | | | | 1,245,478 | |
Santee School District, (County of San Diego, California), General Obligation Refunding Bonds, Series 2015 | | | 3.500 | % | | | 08/01/2029 | | | | AA- | | | | 1,725,000 | | | | 1,781,028 | |
Sonoma County Junior College District, (Sonoma, Mendocino and Marin Counties, California), 2016 General Obligation Refunding Bonds | | | 3.250 | % | | | 08/01/2029 | | | | AA- | | | | 2,835,000 | | | | 2,895,102 | |
City of La Mesa, General Obligation Refunding Bonds, Series 2016 (Fire, Police and Emergency Services Measure) | | | 4.000 | % | | | 08/01/2030 | | | | Aa2 | | | | 540,000 | | | | 580,165 | |
Marin Community College District, (Marin County, California), Election of 2016 General Obligation Bonds, Series A, (Federally Tax-Exempt) | | | 4.000 | % | | | 08/01/2030 | | | | Aaa | | | | 1,095,000 | | | | 1,201,675 | |
Sonoma County Junior College District, (Sonoma, Mendocino and Marin Counties, California), Election of 2014 General Obligation Bonds, Series A | | | 4.000 | % | | | 08/01/2030 | | | | AA- | | | | 1,600,000 | | | | 1,728,144 | |
Sequoia Union High School District, (County of San Mateo, State of California), General Obligation Bonds, Election of 2014, Series 2016 | | | 3.000 | % | | | 07/01/2031 | | | | AA | | | | 3,000,000 | | | | 2,945,010 | |
City of La Mesa, General Obligation Refunding Bonds, Series 2016 (Fire, Police and Emergency Services Measure) | | | 4.000 | % | | | 08/01/2031 | | | | Aa2 | | | | 400,000 | | | | 426,844 | |
Redondo Beach Unified School District, (Los Angeles County, California), 2017 General Obligation Refunding Bonds, (Election of 2008, Series D), (2020 Crossover) | | | 3.000 | % | | | 08/01/2031 | | | | Aa2 | | | | 750,000 | | | | 730,515 | |
City of La Mesa, General Obligation Refunding Bonds, Series 2016 (Fire, Police and Emergency Services Measure) | | | 4.000 | % | | | 08/01/2032 | | | | Aa2 | | | | 500,000 | | | | 530,245 | |
Redondo Beach Unified School District, (Los Angeles County, California), 2017 General Obligation Refunding Bonds, (Election of 2008, Series D), (2020 Crossover) | | | 3.000 | % | | | 08/01/2032 | | | | Aa2 | | | | 750,000 | | | | 719,910 | |
Tustin Unified School District - 2017 General Obligation Refunding Bonds of School Facilities Improvement District No. 2002-1 of the Tustin Unified School District, (2020 Crossover), (Orange County, California) | | | 4.000 | % | | | 08/01/2032 | | | | AA | | | | 510,000 | | | | 549,994 | |
Tustin Unified School District - 2017 General Obligation Refunding Bonds of School Facilities Improvement District No. 2002-1 of the Tustin Unified School District, (2020 Crossover), (Orange County, California) | | | 4.000 | % | | | 08/01/2033 | | | | AA | | | | 550,000 | | | | 587,571 | |
Tustin Unified School District - 2017 General Obligation Refunding Bonds of School Facilities Improvement District No. 2008-1 of the Tustin Unified School District, (2020 Crossover), (Orange County, California) | | | 4.000 | % | | | 08/01/2033 | | | | AA | | | | 600,000 | | | | 640,986 | |
Kentfield School District, (Marin County, California), General Obligation Bonds, Election of 2014,
Series B | | | 5.000 | % | | | 08/01/2034 | | | | AA | | | | 200,000 | | | | 227,248 | |
Kentfield School District, (Marin County, California), General Obligation Bonds, Election of 2014,
Series B | | | 5.000 | % | | | 08/01/2035 | | | | AA | | | | 355,000 | | | | 402,236 | |
Kentfield School District, (Marin County, California), General Obligation Bonds, Election of 2014,
Series B | | | 5.000 | % | | | 08/01/2036 | | | | AA | | | | 400,000 | | | | 451,244 | |
Kentfield School District, (Marin County, California), General Obligation Bonds, Election of 2014,
Series B | | | 5.000 | % | | | 08/01/2037 | | | | AA | | | | 500,000 | | | | 563,185 | |
| | | | | | | | | | | | | | | | | | | | |
| | | | | | | | | | | | | | | | | | | 31,409,528 | |
| | | | | | | | | | | | | | | | | | | | |
Colorado (2.04%) | | | | | | | | | | | | | | | | | | | | |
El Paso County School District No. 20 (Academy), El Paso County, Colorado, General Obligation Refunding Bonds, Series 2012 | | | 3.000 | % | | | 12/15/2021 | | | | Aa2 | | | | 205,000 | | | | 210,547 | |
Jefferson County, Colorado, School District No. 1 | | | 5.000 | % | | | 12/15/2021 | | | | Aa2 | | | | 900,000 | | | | 976,959 | |
| | |
| See accompanying notes to financial statements. | | 41 |
STATE FARM ASSOCIATES’ FUNDS TRUST MUNICIPAL BOND FUND
SCHEDULE OF INVESTMENTS (continued)
November 30, 2018
| | | | | | | | | | | | | | | | | | | | |
| | | Coupon
rate | | | Maturity date | | | Rating (a) | | | Principal
amount | | | Value | |
Long-term Municipal Bonds (Cont.) | | | | | | | | | | | | | | | | | | | | |
Colorado (Cont.) | | | | | | | | | | | | | | | | | | | | |
Cherry Creek School District No. 5, (Arapahoe County, Colorado), General Obligation Bonds, Series 2012B | | | 3.000 | % | | | 12/15/2023 | | | | Aa1 | | | $ | 3,300,000 | | | $ | 3,399,429 | |
Adams County School District No. 1, (Mapleton Public Schools), Adams County, Colorado, General Obligation Refunding Bonds, Series 2016 | | | 2.000 | % | | | 12/01/2025 | | | | Aa3 | | | | 375,000 | | | | 357,285 | |
Eagle River Water and Sanitation District, (In Eagle County, Colorado), General Obligation Bonds, Series 2016 | | | 2.500 | % | | | 12/01/2025 | | | | AA- | | | | 210,000 | | | | 210,529 | |
El Paso County School District No. 20 (Academy), El Paso County, Colorado, General Obligation Refunding Bonds, Series 2015 | | | 4.000 | % | | | 12/15/2025 | | | | Aa2 | | | | 1,000,000 | | | | 1,088,530 | |
Eagle River Water and Sanitation District, (In Eagle County, Colorado), General Obligation Bonds, Series 2016 | | | 2.750 | % | | | 12/01/2026 | | | | AA- | | | | 200,000 | | | | 202,380 | |
Roaring Fork School District No. RE-1, In Garfield, Pitkin and Eagle Counties, Colorado, General Obligation Refunding Bonds, Series 2016B | | | 2.500 | % | | | 12/15/2027 | | | | NR | | | | 3,000,000 | | | | 2,935,230 | |
Eagle River Water and Sanitation District, (In Eagle County, Colorado), General Obligation Bonds, Series 2016 | | | 4.000 | % | | | 12/01/2030 | | | | AA- | | | | 465,000 | | | | 491,370 | |
Gunnison Watershed School District RE-1J, (Gunnison and Saguache Counties, Colorado), General Obligation Refunding Bonds, Series 2014 | | | 4.000 | % | | | 12/01/2031 | | | | Aa2 | | | | 1,000,000 | | | | 1,046,780 | |
Adams 12 Five Star Schools, Adams County and the City and County of Broomfield, Colorado, General Obligation Bonds, Series 2016B (c) | | | 5.000 | % | | | 12/15/2034 | | | | AA- | | | | 2,500,000 | | | | 2,847,775 | |
| | | | | | | | | | | | | | | | | | | | |
| | | | | | | | | | | | | | | | | | | 13,766,814 | |
| | | | | | | | | | | | | | | | | | | | |
| | | | | |
Connecticut (3.20%) | | | | | | | | | | | | | | | | | | | | |
Town of Trumbull, Connecticut, General Obligation Refunding Bonds, Issue of 2009 | | | 4.000 | % | | | 09/15/2020 | | | | Aa2 | | | | 525,000 | | | | 533,489 | |
Town of Stonington, Connecticut, General Obligation Bonds, Issue of 2012 | | | 3.000 | % | | | 04/01/2021 | | | | Aa1 | | | | 125,000 | | | | 126,630 | |
Town of Trumbull, Connecticut, General Obligation Refunding Bonds, Issue of 2009 | | | 4.000 | % | | | 09/15/2021 | | | | Aa2 | | | | 500,000 | | | | 507,790 | |
Town of Stonington, Connecticut, General Obligation Bonds, Issue of 2012 | | | 3.000 | % | | | 04/01/2022 | | | | Aa1 | | | | 600,000 | | | | 607,218 | |
Town of Darien, Connecticut, General Obligation Refunding Bonds, Issue of 2012, Series B | | | 2.000 | % | | | 08/01/2022 | | | | Aaa | | | | 1,525,000 | | | | 1,517,238 | |
City of Stamford, Connecticut, General Obligation Bonds, Issue of 2013 | | | 2.250 | % | | | 02/01/2024 | | | | Aa1 | | | | 2,000,000 | | | | 2,001,020 | |
State of Connecticut Health and Educational Facilities Authority, Revenue Bonds, Yale University Issue, Series 2016A (d) | | | 2.000 | % | | | 07/01/2042 | | | | Aaa | | | | 18,000,000 | | | | 16,325,460 | |
| | | | | | | | | | | | | | | | | | | | |
| | | | | | | | | | | | | | | | | | | 21,618,845 | |
| | | | | | | | | | | | | | | | | | | | |
| | | | | |
Florida (2.76%) | | | | | | | | | | | | | | | | | | | | |
Pasco County, Florida, Water and Sewer Refunding Revenue Bonds, Series 2006 | | | 4.500 | % | | | 10/01/2019 | | | | Aa2 | | | | 110,000 | | | | 110,212 | |
Pasco County, Florida, Water and Sewer Revenue Bonds, Series 2009A | | | 5.000 | % | | | 10/01/2020 | | | | Aa2 | | | | 1,390,000 | | | | 1,425,528 | |
Fort Lauderdale, Florida, Water and Sewer Revenue Bonds (Prerefunded to 09-01-2019 @ 100)(b) | | | 4.000 | % | | | 03/01/2021 | | | | Aa1 | | | | 1,170,000 | | | | 1,187,726 | |
City of Titusville, Florida, Water and Sewer Revenue Refunding Bonds, Series 2010 | | | 5.000 | % | | | 10/01/2021 | | | | AA- | | | | 600,000 | | | | 622,284 | |
Pasco County, Florida, Water and Sewer Revenue Bonds, Series 2009A | | | 4.000 | % | | | 10/01/2021 | | | | Aa2 | | | | 1,455,000 | | | | 1,477,000 | |
Fort Lauderdale, Florida, Water and Sewer Revenue Bonds (Prerefunded to 09-01-2019 @ 100) (b) | | | 4.000 | % | | | 03/01/2022 | | | | Aa1 | | | | 1,215,000 | | | | 1,233,407 | |
Tohopekaliga Water Authority, Utility System Revenue Refunding Bonds, Series 2011A (Prerefunded to 10-01-2021 @ 100) (b) | | | 5.000 | % | | | 10/01/2022 | | | | Aa2 | | | | 365,000 | | | | 393,981 | |
Fort Lauderdale, Florida, Water and Sewer Revenue Bonds (Prerefunded to 09-01-2019 @ 100) (b) | | | 4.000 | % | | | 09/01/2023 | | | | Aa1 | | | | 1,290,000 | | | | 1,309,544 | |
Tohopekaliga Water Authority, Utility System Revenue Refunding Bonds, Series 2011A (Prerefunded to 10-01-2021 @ 100) (b) | | | 5.000 | % | | | 10/01/2023 | | | | Aa2 | | | | 200,000 | | | | 215,880 | |
State of Florida, Department of Transportation, Turnpike Revenue Bonds, Series 2010B | | | 5.000 | % | | | 07/01/2024 | | | | Aa2 | | | | 2,000,000 | | | | 2,110,760 | |
State of Florida, Department of Transportation, Turnpike Revenue Bonds, Series 2010B | | | 5.000 | % | | | 07/01/2025 | | | | Aa2 | | | | 2,485,000 | | | | 2,622,619 | |
Lee County, Florida, Water and Sewer Revenue Bonds, Series 2013A | | | 5.000 | % | | | 10/01/2026 | | | | Aa3 | | | | 400,000 | | | | 445,780 | |
City of Pembroke Pines, Florida, General Obligation Bonds, Series 2015 | | | 5.000 | % | | | 09/01/2031 | | | | Aa2 | | | | 2,100,000 | | | | 2,389,590 | |
City of Miami Beach, Florida, Water and Sewer Revenue and Revenue Refunding Bonds, Series 2017 | | | 4.000 | % | | | 09/01/2032 | | | | Aa3 | | | | 540,000 | | | | 567,610 | |
Lee County, Florida, Water and Sewer Revenue Bonds, Series 2013A | | | 5.000 | % | | | 10/01/2032 | | | | Aa3 | | | | 750,000 | | | | 825,083 | |
City of Miami Beach, Florida, Water and Sewer Revenue and Revenue Refunding Bonds, Series 2017 | | | 5.000 | % | | | 09/01/2033 | | | | Aa3 | | | | 750,000 | | | | 854,100 | |
City of Miami Beach, Florida, Water and Sewer Revenue and Revenue Refunding Bonds, Series 2017 | | | 5.000 | % | | | 09/01/2034 | | | | Aa3 | | | | 750,000 | | | | 850,328 | |
| | | | | | | | | | | | | | | | | | | | |
| | | | | | | | | | | | | | | | | | | 18,641,432 | |
| | | | | | | | | | | | | | | | | | | | |
| | |
| 42 | | See accompanying notes to financial statements. |
STATE FARM ASSOCIATES’ FUNDS TRUST MUNICIPAL BOND FUND
SCHEDULE OF INVESTMENTS (continued)
November 30, 2018
| | | | | | | | | | | | | | | | | | | | |
| | | Coupon
rate | | | Maturity date | | | Rating (a) | | | Principal
amount | | | Value | |
Long-term Municipal Bonds (Cont.) | | | | | | | | | | | | | | | | | | | | |
Georgia (1.17%) | | | | | | | | | | | | | | | | | | | | |
Cherokee County Water and Sewerage Authority (Georgia), Water and Sewerage Revenue Refunding Bonds, Series 2010 | | | 3.500 | % | | | 08/01/2020 | | | | Aa2 | | | $ | 200,000 | | | $ | 204,998 | |
Cherokee County Water and Sewerage Authority (Georgia), Water and Sewerage Revenue Refunding Bonds, Series 2010 | | | 4.000 | % | | | 08/01/2021 | | | | Aa2 | | | | 250,000 | | | | 257,985 | |
Fayette County, Georgia, Water Revenue Bonds, Series 2009 | | | 5.000 | % | | | 10/01/2021 | | | | Aa2 | | | | 1,165,000 | | | | 1,193,810 | |
Fayette County, Georgia, Water Revenue Bonds, Series 2009 (Prerefunded to 10-01-2019 @ 100) (b) | | | 5.000 | % | | | 10/01/2021 | | | | NR | | | | 625,000 | | | | 640,563 | |
Henry County and Henry County Water and Sewerage Authority (Georgia), Water and Sewerage Revenue Refunding Bonds, Series 2010 | | | 5.000 | % | | | 02/01/2022 | | | | Aa2 | | | | 1,000,000 | | | | 1,060,850 | |
Fulton County, Georgia, Water and Sewerage Revenue Refunding Bonds, Series 2011 | | | 5.000 | % | | | 01/01/2024 | | | | Aa2 | | | | 1,660,000 | | | | 1,756,529 | |
Fayette County, Georgia, Water Revenue Bond, Series 2009 (Prerefunded to 10-01-2019 @ 100) (b) | | | 4.375 | % | | | 10/01/2024 | | | | Aa2 | | | | 750,000 | | | | 765,165 | |
Unified Government of Athens-Clarke County, Georgia, Water and Sewerage Revenue Bonds, Series 2008 (Prerefunded to 01-01-2019 @ 100) (b) | | | 5.625 | % | | | 01/01/2028 | | | | AA | | | | 1,000,000 | | | | 1,002,920 | |
Forsyth County, Georgia, General Obligation Bonds, Series 2008A (Prerefunded to 03-01-2019 @ 100) (b) | | | 5.000 | % | | | 03/01/2028 | | | | Aaa | | | | 1,000,000 | | | | 1,007,820 | |
| | | | | | | | | | | | | | | | | | | | |
| | | | | | | | | | | | | | | | | | | 7,890,640 | |
| | | | | | | | | | | | | | | | | | | | |
Hawaii (0.39%) | | | | | | | | | | | | | | | | | | | | |
State of Hawaii, Highway Revenue Bonds, Series 2008 (Prerefunded to 01-01-2019 @ 100) (b) | | | 5.750 | % | | | 01/01/2027 | | | | Aa2 | | | | 2,000,000 | | | | 2,006,020 | |
County of Hawaii, General Obligation Bonds, 2013 Series A (Prerefunded to 09-01-2022 @ 100) (b) | | | 5.000 | % | | | 09/01/2031 | | | | AA- | | | | 575,000 | | | | 634,904 | |
| | | | | | | | | | | | | | | | | | | | |
| | | | | | | | | | | | | | | | | | | 2,640,924 | |
| | | | | | | | | | | | | | | | | | | | |
Idaho (0.61%) | | | | | | | | | | | | | | | | | | | | |
Independent School District No. 1 of Nez Perce County, Idaho (Lewiston), General Obligation Bonds, Series 2017B, (Sales Tax and Credit Enhancement Guaranty) | | | 4.000 | % | | | 09/15/2031 | | | | Aa3 | | | | 2,880,000 | | | | 3,061,930 | |
Boise State University, General Revenue Project Bonds, Series 2018A | | | 4.000 | % | | | 04/01/2032 | | | | A+ | | | | 445,000 | | | | 467,014 | |
Boise State University, General Revenue Project Bonds, Series 2018A | | | 5.000 | % | | | 04/01/2034 | | | | A+ | | | | 240,000 | | | | 273,749 | |
Boise State University, General Revenue Project Bonds, Series 2018A | | | 5.000 | % | | | 04/01/2035 | | | | A+ | | | | 250,000 | | | | 284,100 | |
| | | | | | | | | | | | | | | | | | | | |
| | | | | | | | | | | | | | | | | | | 4,086,793 | |
| | | | | | | | | | | | | | | | | | | | |
Illinois (0.49%) | | | | | | | | | | | | | | | | | | | | |
Community Consolidated School District Number 201, Grundy, Kendall and Will Counties, Illinois, (Minooka), General Obligation Refunding School Bonds, Series 2010A | | | 5.250 | % | | | 10/15/2022 | | | | AA- | | | | 1,200,000 | | | | 1,231,896 | |
Community Consolidated School District Number 201, Grundy, Kendall and Will Counties, Illinois, (Minooka), General Obligation Refunding School Bonds, Series 2010A | | | 5.250 | % | | | 10/15/2023 | | | | AA- | | | | 2,000,000 | | | | 2,053,160 | |
| | | | | | | | | | | | | | | | | | | | |
| | | | | | | | | | | | | | | | | | | 3,285,056 | |
| | | | | | | | | | | | | | | | | | | | |
Indiana (4.63%) | | | | | | | | | | | | | | | | | | | | |
Town of Zionsville, Indiana, Sewage Works Revenue Bonds of 2010, Series A | | | 2.800 | % | | | 07/15/2019 | | | | AA- | | | | 130,000 | | | | 130,504 | |
City of Bloomington, Indiana, Waterworks Revenue Bonds of 2011, Series B | | | 3.500 | % | | | 07/01/2020 | | | | A | | | | 910,000 | | | | 927,026 | |
Lebanon Middle School Building Corporation, Lebanon, Indiana, Unlimited Ad Valorem Property Tax First Mortgage Bonds, Series 2011 (Escrowed to maturity) (b) | | | 4.000 | % | | | 07/10/2020 | | | | NR | | | | 2,075,000 | | | | 2,141,981 | |
Town of Zionsville, Indiana, Sewage Works Revenue Bonds of 2010, Series A | | | 3.000 | % | | | 07/15/2020 | | | | AA- | | | | 245,000 | | | | 247,362 | |
City of Fort Wayne, Indiana, Sewage Works Revenue Bonds of 2010 (Escrowed to maturity) (b) | | | 4.500 | % | | | 08/01/2020 | | | | A1 | | | | 2,075,000 | | | | 2,157,772 | |
Ball State University Board of Trustees, Ball State University Student Fee Bonds, Series O (Prerefunded to 01-01-2019 @ 100) (b) | | | 5.250 | % | | | 07/01/2022 | | | | AA- | | | | 500,000 | | | | 501,320 | |
City of Noblesville, Indiana, Sewage Works Revenue Bonds of 2011 | | | 4.000 | % | | | 07/01/2022 | | | | Aa2 | | | | 185,000 | | | | 193,860 | |
Ball State University Board of Trustees, Ball State University Student Fee Bonds, Series O (Prerefunded to 01-01-2019 @ 100) (b) | | | 5.250 | % | | | 07/01/2023 | | | | AA- | | | | 1,060,000 | | | | 1,062,798 | |
| | |
| See accompanying notes to financial statements. | | 43 |
STATE FARM ASSOCIATES’ FUNDS TRUST MUNICIPAL BOND FUND
SCHEDULE OF INVESTMENTS (continued)
November 30, 2018
| | | | | | | | | | | | | | | | | | | | |
| | | Coupon
rate | | | Maturity date | | | Rating (a) | | | Principal
amount | | | Value | |
Long-term Municipal Bonds (Cont.) | | | | | | | | | | | | | | | | | | | | |
Indiana (Cont.) | | | | | | | | | | | | | | | | | | | | |
City of Noblesville, Indiana, Sewage Works Revenue Bonds of 2011 | | | 4.250 | % | | | 07/01/2023 | | | | Aa2 | | | $ | 215,000 | | | $ | 226,692 | |
City of Noblesville, Indiana, Sewage Works Revenue Bonds of 2011 | | | 4.375 | % | | | 07/01/2024 | | | | Aa2 | | | | 210,000 | | | | 221,850 | |
City of Fort Wayne, Indiana, Sewage Works Revenue Bonds of 2010 (Prerefunded to 08-01-2020 @ 100) (b) | | | 4.500 | % | | | 08/01/2025 | | | | A1 | | | | 1,530,000 | | | | 1,591,032 | |
Perry Township Multischool Building Corporation of 1996, Indianapolis, Indiana, Unlimited Ad Valorem Property Tax First Mortgage Bonds, Series 2016 | | | 5.000 | % | | | 01/15/2026 | | | | A+ | | | | 1,190,000 | | | | 1,380,257 | |
East Noble School Building Corporation, Kendallville, Indiana, Unlimited Ad Valorem Property Tax First Mortgage Bonds, Series 2016 | | | 2.000 | % | | | 07/15/2026 | | | | A+ | | | | 1,000,000 | | | | 922,990 | |
Perry Township Multischool Building Corporation of 1996, Indianapolis, Indiana, Unlimited Ad Valorem Property Tax First Mortgage Bonds, Series 2016 | | | 5.000 | % | | | 07/15/2026 | | | | A+ | | | | 1,105,000 | | | | 1,289,878 | |
East Noble School Building Corporation, Kendallville, Indiana, Unlimited Ad Valorem Property Tax First Mortgage Bonds, Series 2016 | | | 2.000 | % | | | 01/15/2027 | | | | A+ | | | | 1,305,000 | | | | 1,189,207 | |
Hamilton Southeastern Consolidated School Building Corporation, Hamilton County, Indiana, Unlimited Ad Valorem Property Tax First Mortgage Bonds, Series 2015G | | | 4.000 | % | | | 07/15/2027 | | | | AA- | | | | 1,190,000 | | | | 1,280,821 | |
Hamilton Southeastern Consolidated School Building Corporation, Hamilton County, Indiana, Unlimited Ad Valorem Property Tax First Mortgage Bonds, Series 2015G | | | 4.500 | % | | | 07/15/2028 | | | | AA- | | | | 500,000 | | | | 548,410 | |
New Albany-Floyd County School Building Corporation, Ad Valorem Property Tax First Mortgage Bonds, Series 2017, (Floyd County, Indiana) | | | 4.000 | % | | | 07/15/2028 | | | | A+ | | | | 500,000 | | | | 541,200 | |
Warsaw Multi-School Building Corporation, Warsaw, Indiana, Unlimited Ad Valorem Property Tax First Mortgage Bonds, Series 2015 | | | 4.000 | % | | | 07/15/2028 | | | | A+ | | | | 1,000,000 | | | | 1,064,840 | |
City of West Lafayette, Indiana, Sewage Works Revenue Bonds, Series 2016 | | | 3.750 | % | | | 07/01/2029 | | | | A+ | | | | 220,000 | | | | 226,140 | |
New Albany-Floyd County School Building Corporation, Ad Valorem Property Tax First Mortgage Bonds, Series 2017, (Floyd County, Indiana) | | | 4.000 | % | | | 07/15/2029 | | | | A+ | | | | 2,000,000 | | | | 2,152,940 | |
Valparaiso Multi-Schools Building Corporation, (Porter County, Indiana), Unlimited Ad Valorem Property Tax First Mortgage Bonds, Series 2015 | | | 5.000 | % | | | 07/15/2029 | | | | AA- | | | | 3,000,000 | | | | 3,394,800 | |
City of West Lafayette, Indiana, Sewage Works Revenue Bonds, Series 2016 | | | 4.000 | % | | | 07/01/2030 | | | | A+ | | | | 750,000 | | | | 781,253 | |
Munster School Building Corporation, Lake County, Indiana, Unlimited Ad Valorem Property Tax First Mortgage Bonds, Series 2018 | | | 3.375 | % | | | 01/15/2031 | | | | AA+ | | | | 1,095,000 | | | | 1,075,575 | |
Munster School Building Corporation, Lake County, Indiana, Unlimited Ad Valorem Property Tax First Mortgage Bonds, Series 2018 | | | 4.000 | % | | | 07/15/2032 | | | | AA+ | | | | 2,285,000 | | | | 2,374,983 | |
City of Lebanon, Indiana, Sewage Works Revenue Bonds of 2018 | | | 4.000 | % | | | 07/01/2034 | | | | AA- | | | | 865,000 | | | | 888,874 | |
Hamilton Southeastern Consolidated School Building Corporation, (Hamilton County, Indiana), Unlimited Ad Valorem Property Tax First Mortgage Bonds, Series 2018 (e) | | | 5.000 | % | | | 07/15/2034 | | | | AA- | | | | 335,000 | | | | 381,826 | |
City of Lebanon, Indiana, Sewage Works Revenue Bonds of 2018 | | | 4.000 | % | | | 07/01/2035 | | | | AA- | | | | 895,000 | | | | 914,475 | |
Hamilton Southeastern Consolidated School Building Corporation, (Hamilton County, Indiana), Unlimited Ad Valorem Property Tax first Mortgage Bonds, Series 2018 (e) | | | 5.000 | % | | | 07/15/2035 | | | | AA- | | | | 600,000 | | | | 680,382 | |
Hamilton Southeastern Consolidated School Building Corporation, (Hamilton County, Indiana), Unlimited Ad Valorem Property Tax First Mortgage Bonds, Series 2018 (e) | | | 5.000 | % | | | 07/15/2036 | | | | AA- | | | | 700,000 | | | | 789,873 | |
| | | | | | | | | | | | | | | | | | | | |
| | | | | | | | | | | | | | | | | | | 31,280,921 | |
| | | | | | | | | | | | | | | | | | | | |
Iowa (3.42%) | | | | | | | | | | | | | | | | | | | | |
City of Des Moines, Iowa, General Obligation Bonds, Series 2016A (c) | | | 2.000 | % | | | 06/01/2025 | | | | Aa2 | | | | 2,095,000 | | | | 1,999,468 | |
Dallas Center-Grimes Community School District, Iowa, General Obligation School Bonds, Series 2015 | | | 3.000 | % | | | 06/01/2025 | | | | Aa2 | | | | 265,000 | | | | 267,610 | |
Johnston Community School District, Iowa, General Obligation School and Refunding Bonds, Series 2015 | | | 3.000 | % | | | 06/01/2025 | | | | AA- | | | | 2,370,000 | | | | 2,399,933 | |
City of Des Moines, Iowa, General Obligation Bonds, Series 2016A | | | 2.000 | % | | | 06/01/2026 | | | | Aa2 | | | | 2,135,000 | | | | 2,009,270 | |
Dallas Center-Grimes Community School District, Iowa, General Obligation School Bonds, Series 2015 | | | 3.000 | % | | | 06/01/2026 | | | | Aa2 | | | | 500,000 | | | | 503,140 | |
Grundy County, Iowa, General Obligation Urban Renewal Refunding Bonds, Series 2015 | | | 3.000 | % | | | 06/01/2026 | | | | A1 | | | | 1,130,000 | | | | 1,141,696 | |
Johnston Community School District, Iowa, General Obligation School and Refunding Bonds, Series 2015 | | | 3.000 | % | | | 06/01/2026 | | | | AA- | | | | 2,445,000 | | | | 2,468,692 | |
City of Des Moines, Iowa, General Obligation Bonds, Series 2016A | | | 2.125 | % | | | 06/01/2027 | | | | Aa2 | | | | 2,180,000 | | | | 2,040,502 | |
Des Moines Metropolitan Wastewater Reclamation Authority, Sewer Revenue Refunding Bonds, Series 2015E | | | 3.000 | % | | | 06/01/2027 | | | | Aa3 | | | | 1,610,000 | | | | 1,620,707 | |
Grundy County, Iowa, General Obligation Urban Renewal Refunding Bonds, Series 2015 | | | 3.000 | % | | | 06/01/2027 | | | | A1 | | | | 1,175,000 | | | | 1,180,382 | |
Waukee Community School District, Dallas County, Iowa, General Obligation School Refunding Bonds, Series 2016B | | | 2.000 | % | | | 06/01/2027 | | | | Aa2 | | | | 3,000,000 | | | | 2,723,160 | |
| | |
| 44 | | See accompanying notes to financial statements. |
STATE FARM ASSOCIATES’ FUNDS TRUST MUNICIPAL BOND FUND
SCHEDULE OF INVESTMENTS (continued)
November 30, 2018
| | | | | | | | | | | | | | | | | | | | |
| | | Coupon
rate | | | Maturity date | | | Rating (a) | | | Principal
amount | | | Value | |
Long-term Municipal Bonds (Cont.) | | | | | | | | | | | | | | | | | | | | |
Iowa (Cont.) | | | | | | | | | | | | | | | | | | | | |
Waukee Community School District, Iowa, General Obligation School Bonds, Series 2009 (Crossover Refunding to 06-01-2019 @ 100) (b) | | | 5.000 | % | | | 06/01/2028 | | | | Aa2 | | | $ | 1,000,000 | | | $ | 1,014,650 | |
City of Cedar Rapids, Iowa, Water Revenue Bonds, Series 2018D | | | 3.000 | % | | | 06/01/2029 | | | | Aa2 | | | | 950,000 | | | | 936,548 | |
City of Council Bluffs, Iowa, General Obligation Bonds, Series 2018A | | | 3.000 | % | | | 06/01/2029 | | | | Aa2 | | | | 1,050,000 | | | | 1,034,208 | |
City of West Des Moines, Iowa, General Obligation Urban Renewal Bonds, Series 2017D | | | 3.000 | % | | | 06/01/2031 | | | | AAA | | | | 1,770,000 | | | | 1,745,663 | |
| | | | | | | | | | | | | | | | | | | | |
| | | | | | | | | | | | | | | | | | | 23,085,629 | |
| | | | | | | | | | | | | | | | | | | | |
Kansas (3.06%) | | | | | | | | | | | | | | | | | | | | |
Unified School District No. 512, Johnson County, Kansas, (Shawnee Mission), General Obligation Refunding Bonds, Series 2012-A | | | 2.000 | % | | | 10/01/2022 | | | | Aaa | | | | 2,010,000 | | | | 2,006,583 | |
City of Wichita, Kansas, Water and Sewer Utility, Revenue Bonds, Series 2009A (Prerefunded to 10-01-2019 @ 100) (b) | | | 5.000 | % | | | 10/01/2024 | | | | AA- | | | | 2,000,000 | | | | 2,050,620 | |
Unified School District No. 233, Johnson County, Kansas (Olathe), General Obligation School Bonds, Series 2016A | | | 3.000 | % | | | 09/01/2026 | | | | Aa2 | | | | 2,740,000 | | | | 2,784,004 | |
Unified School District No. 233, Johnson County, Kansas (Olathe), General Obligation School Bonds, Series 2016A | | | 3.000 | % | | | 09/01/2027 | | | | Aa2 | | | | 1,490,000 | | | | 1,502,531 | |
Unified School District No. 512, Johnson County, Kansas, (Shawnee Mission), General Obligation Refunding and Improvement Bonds, Series 2015-A | | | 3.000 | % | | | 10/01/2027 | | | | Aaa | | | | 1,000,000 | | | | 1,018,190 | |
Unified School District No. 233, Johnson County, Kansas (Olathe), General Obligation School Improvement and Refunding Bonds, Series 2013C (Crossover Refunding to 09-01-2021 @ 100) (b) | | | 4.500 | % | | | 09/01/2028 | | | | Aa2 | | | | 3,000,000 | | | | 3,178,410 | |
Water District No. 1 of Johnson County, Kansas, Water Revenue Refunding Bonds, Series 2017A | | | 3.000 | % | | | 01/01/2032 | | | | Aaa | | | | 2,500,000 | | | | 2,371,875 | |
State of Kansas, Department of Transportation, Highway Revenue Bonds, Series 2017A | | | 5.000 | % | | | 09/01/2033 | | | | Aa2 | | | | 5,000,000 | | | | 5,789,100 | |
| | | | | | | | | | | | | | | | | | | | |
| | | | | | | | | | | | | | | | | | | 20,701,313 | |
| | | | | | | | | | | | | | | | | | | | |
Kentucky (2.38%) | | | | | | | | | | | | | | | | | | | | |
Boone-Florence Water Commission (Kentucky), Water Supply System Refunding Revenue Bonds, Series 2010 | | | 3.250 | % | | | 12/01/2018 | | | | NR | | | | 2,040,000 | | | | 2,040,000 | |
Boone-Florence Water Commission (Kentucky), Water Supply System Refunding Revenue Bonds, Series 2010 | | | 3.250 | % | | | 12/01/2020 | | | | A1 | | | | 1,780,000 | | | | 1,817,967 | |
Northern Kentucky Water District Revenue Bonds, 2013 Series A | | | 4.000 | % | | | 02/01/2028 | | | | Aa3 | | | | 1,110,000 | | | | 1,156,787 | |
City of Owensboro, Kentucky, Water Revenue Refunding and Improvement Bonds, Series 2018 | | | 3.250 | % | | | 09/15/2029 | | | | A1 | | | | 1,735,000 | | | | 1,743,502 | |
Lexington-Fayette Urban County Government (Kentucky), Various Purpose General Obligation Bonds, Series 2018A | | | 3.000 | % | | | 10/01/2029 | | | | Aa2 | | | | 1,060,000 | | | | 1,055,368 | |
City of Owensboro, Kentucky, Water Revenue Refunding and Improvement Bonds, Series 2018 | | | 3.375 | % | | | 09/15/2030 | | | | A1 | | | | 1,800,000 | | | | 1,810,548 | |
Lexington-Fayette Urban County Government (Kentucky), Various Purpose General Obligation Bonds, Series 2018A | | | 3.125 | % | | | 10/01/2030 | | | | Aa2 | | | | 1,095,000 | | | | 1,091,244 | |
Northern Kentucky Water District, Refunding Revenue Bonds, Series 2016 | | | 3.000 | % | | | 02/01/2031 | | | | Aa3 | | | | 3,660,000 | | | | 3,478,720 | |
City of Owensboro, Kentucky, Water Revenue Refunding and Improvement Bonds, Series 2018 | | | 3.500 | % | | | 09/15/2031 | | | | A1 | | | | 1,860,000 | | | | 1,874,285 | |
| | | | | | | | | | | | | | | | | | | | |
| | | | | | | | | | | | | | | | | | | 16,068,421 | |
| | | | | | | | | | | | | | | | | | | | |
Maine (0.43%) | | | | | | | | | | | | | | | | | | | | |
Maine Municipal Bond Bank, 2017 Series D Refunding Bonds | | | 3.000 | % | | | 11/01/2031 | | | | Aa2 | | | | 3,000,000 | | | | 2,918,310 | |
| | | | | | | | | | | | | | | | | | | | |
Maryland (0.84%) | | | | | | | | | | | | | | | | | | | | |
Howard County, Maryland, General Obligation Consolidated Public Improvement Bonds, 2012 Series A (Prerefunded to 02-15-2020 @ 100) (b) | | | 4.000 | % | | | 02/15/2026 | | | | Aaa | | | | 2,075,000 | | | | 2,126,294 | |
The City of Frederick, Maryland, General Obligation Bonds and Notes, Public Improvements Bonds, Tax-Exempt Series 2009A (Prerefunded to 03-01-2019 @ 100) (b) | | | 5.000 | % | | | 03/01/2027 | | | | Aa1 | | | | 1,500,000 | | | | 1,511,805 | |
Montgomery County, Maryland, General Obligation Bonds, Consolidated Public Improvement Bonds of 2015, Series B | | | 3.000 | % | | | 12/01/2028 | | | | Aaa | | | | 2,000,000 | | | | 2,018,520 | |
| | | | | | | | | | | | | | | | | | | | |
| | | | | | | | | | | | | | | | | | | 5,656,619 | |
| | | | | | | | | | | | | | | | | | | | |
| | |
| See accompanying notes to financial statements. | | 45 |
STATE FARM ASSOCIATES’ FUNDS TRUST MUNICIPAL BOND FUND
SCHEDULE OF INVESTMENTS (continued)
November 30, 2018
| | | | | | | | | | | | | | | | | | | | |
| | | Coupon
rate | | | Maturity date | | | Rating (a) | | | Principal
amount | | | Value | |
Long-term Municipal Bonds (Cont.) | | | | | | | | | | | | | | | | | | | | |
Massachusetts (0.64%) | | | | | | | | | | | | | | | | | | | | |
The Commonwealth of Massachusetts, Commonwealth Transportation Fund Revenue Bonds, (Accelerated Bridge Program), 2013 Series A (Prerefunded to 06-01-2021 @ 100) (b) | | | 5.000 | % | | | 06/01/2034 | | | | Aa1 | | | $ | 2,000,000 | | | $ | 2,144,620 | |
The Commonwealth of Massachusetts, General Obligation Bonds, Consolidated Loan of 2014, Series A | | | 5.000 | % | | | 12/01/2034 | | | | AA | | | | 2,000,000 | | | | 2,151,040 | |
| | | | | | | | | | | | | | | | | | | | |
| | | | | | | | | | | | | | | | | | | 4,295,660 | |
| | | | | | | | | | | | | | | | | | | | |
Michigan (4.06%) | | | | | | | | | | | | | | | | | | | | |
Board of Trustees of Northern Michigan University, General Revenue Bonds, Series 2008A | | | 5.000 | % | | | 12/01/2018 | | | | A | | | | 440,000 | | | | 440,000 | |
Traverse City Area Public Schools, Counties of Grand Traverse, Leelanau and Benzie, State of Michigan, 2010 School Building and Site Bonds (General Obligation - Unlimited Tax) | | | 3.500 | % | | | 05/01/2020 | | | | AA- | | | | 1,000,000 | | | | 1,021,420 | |
Plymouth-Canton Community Schools, Counties of Wayne and Washtenaw, State of Michigan, 2012 Refunding Bonds, Series A, (General Obligation - Unlimited Tax) | | | 5.000 | % | | | 05/01/2021 | | | | Aa3 | | | | 425,000 | | | | 453,237 | |
Forest Hills Public Schools, County of Kent, State of Michigan, 2010 School Building and Site Bonds, Series II, (General Obligation - Unlimited Tax) | | | 4.000 | % | | | 05/01/2022 | | | | AA | | | | 700,000 | | | | 718,165 | |
Hudsonville Public Schools, Counties of Ottawa and Allegan, State of Michigan, 2011 School Building and Site Bonds, (General Obligation - Unlimited Tax) (Prerefunded to 05-01-2021 @ 100) (b) | | | 5.000 | % | | | 05/01/2022 | | | | A+ | | | | 275,000 | | | | 294,300 | |
Plymouth-Canton Community Schools, Counties of Wayne and Washtenaw, State of Michigan, 2012 Refunding Bonds, Series A, (General Obligation - Unlimited Tax) | | | 5.000 | % | | | 05/01/2022 | | | | Aa3 | | | | 450,000 | | | | 491,013 | |
East Grand Rapids Public Schools, County of Kent, State of Michigan, 2012 Refunding Bonds, (General Obligation - Unlimited Tax) | | | 4.000 | % | | | 05/01/2023 | | | | A+ | | | | 1,485,000 | | | | 1,521,887 | |
Hudsonville Public Schools, Counties of Ottawa and Allegan, State of Michigan, 2011 School Building and Site Bonds, (General Obligation - Unlimited Tax) (Prerefunded to 05-01-2021 @ 100) (b) | | | 5.000 | % | | | 05/01/2023 | | | | A+ | | | | 400,000 | | | | 428,072 | |
Hudsonville Public Schools, Counties of Ottawa and Allegan, State of Michigan, 2011 School Building and Site Bonds, (General Obligation - Unlimited Tax) (Prerefunded to 05-01-2021 @ 100) (b) | | | 5.000 | % | | | 05/01/2024 | | | | A+ | | | | 600,000 | | | | 642,108 | |
Howell Public Schools, County of Livingston, State of Michigan, 2011 Refunding Bonds, Series B, (General Obligation - Unlimited Tax) | | | 5.000 | % | | | 05/01/2025 | | | | A+ | | | | 1,880,000 | | | | 2,003,084 | |
Hudsonville Public Schools, Counties of Ottawa and Allegan, State of Michigan, 2013 Refunding Bonds, (General Obligation - Unlimited Tax) | | | 4.000 | % | | | 05/01/2025 | | | | A+ | | | | 700,000 | | | | 742,840 | |
Plymouth-Canton Community Schools, Counties of Wayne and Washtenaw, State of Michigan, 2012 Refunding Bonds, Series A, (General Obligation - Unlimited Tax) | | | 5.000 | % | | | 05/01/2025 | | | | Aa3 | | | | 1,260,000 | | | | 1,369,217 | |
Hudsonville Public Schools, Counties of Ottawa and Allegan, State of Michigan, 2013 Refunding Bonds, (General Obligation - Unlimited Tax) | | | 4.000 | % | | | 05/01/2026 | | | | A+ | | | | 1,290,000 | | | | 1,361,363 | |
Plymouth-Canton Community Schools, Counties of Wayne and Washtenaw, State of Michigan, 2012 Refunding Bonds, Series A, (General Obligation - Unlimited Tax) | | | 4.000 | % | | | 05/01/2026 | | | | Aa3 | | | | 2,300,000 | | | | 2,414,218 | |
Plymouth-Canton Community Schools, Counties of Wayne and Washtenaw, State of Michigan, 2013 School Building and Site Bonds, Series A, (General Obligation - Unlimited Tax) | | | 4.000 | % | | | 05/01/2026 | | | | A+ | | | | 3,850,000 | | | | 4,054,782 | |
East Grand Rapids Public Schools, County of Kent, State of Michigan, 2014 Refunding Bonds, Series A, (General Obligation - Unlimited Tax) | | | 5.000 | % | | | 05/01/2027 | | | | A+ | | | | 1,000,000 | | | | 1,123,720 | |
Hamilton Community Schools, County of Allegan, State of Michigan, 2015 Refunding Bonds, (General Obligation - Unlimited Tax) | | | 4.000 | % | | | 05/01/2027 | | | | AA- | | | | 500,000 | | | | 532,395 | |
Mattawan Consolidated School, Counties of Van Buren and Kalamazoo, State of Michigan, 2015 School Building and Site Bonds, Series I, (General Obligation - Unlimited Tax) | | | 5.000 | % | | | 05/01/2027 | | | | A+ | | | | 1,005,000 | | | | 1,139,921 | |
City of Petoskey, County of Emmet, State of Michigan, Water Supply and Sewage Disposal System Revenue and Revenue Refunding Bonds, Series 2011 | | | 4.500 | % | | | 02/01/2028 | | | | AA- | | | | 750,000 | | | | 780,300 | |
East Grand Rapids Public Schools, County of Kent, State of Michigan, 2014 Refunding Bonds, Series A, (General Obligation - Unlimited Tax) | | | 5.000 | % | | | 05/01/2028 | | | | A+ | | | | 765,000 | | | | 857,183 | |
Hamilton Community Schools, County of Allegan, State of Michigan, 2015 Refunding Bonds, (General Obligation - Unlimited Tax) | | | 4.000 | % | | | 05/01/2028 | | | | AA- | | | | 300,000 | | | | 317,658 | |
Mattawan Consolidated School, Counties of Van Buren and Kalamazoo, State of Michigan, 2015 School Building and Site Bonds, Series I, (General Obligation - Unlimited Tax) | | | 5.000 | % | | | 05/01/2028 | | | | A+ | | | | 600,000 | | | | 677,538 | |
| | |
| 46 | | See accompanying notes to financial statements. |
STATE FARM ASSOCIATES’ FUNDS TRUST MUNICIPAL BOND FUND
SCHEDULE OF INVESTMENTS (continued)
November 30, 2018
| | | | | | | | | | | | | | | | | | | | |
| | | Coupon
rate | | | Maturity date | | | Rating (a) | | | Principal
amount | | | Value | |
Long-term Municipal Bonds (Cont.) | | | | | | | | | | | | | | | | | | | | |
Michigan (Cont.) | | | | | | | | | | | | | | | | | | | | |
Zeeland Public Schools, Counties of Ottawa and Allegan, State of Michigan, 2015 School Building and Site Bonds, Series A, (General Obligation - Unlimited Tax) | | | 5.000 | % | | | 05/01/2029 | | | | A | | | $ | 700,000 | | | $ | 786,527 | |
Zeeland Public Schools, Counties of Ottawa and Allegan, State of Michigan, 2015 School Building and Site Bonds, Series A, (General Obligation - Unlimited Tax) | | | 5.000 | % | | | 05/01/2030 | | | | A | | | | 1,100,000 | | | | 1,231,868 | |
City of Grosse Pointe, County of Wayne, State of Michigan, 2018 Unlimited Tax General Obligation Bonds (e) | | | 4.000 | % | | | 10/01/2032 | | | | AAA | | | | 595,000 | | | | 632,467 | |
City of Grosse Pointe, County of Wayne, State of Michigan, 2018 Unlimited Tax General Obligation Bonds (e) | | | 4.000 | % | | | 10/01/2033 | | | | AAA | | | | 630,000 | | | | 666,496 | |
City of Grosse Pointe, County of Wayne, State of Michigan, 2018 Unlimited Tax General Obligation Bonds (e) | | | 4.000 | % | | | 10/01/2034 | | | | AAA | | | | 670,000 | | | | 703,031 | |
| | | | | | | | | | | | | | | | | | | | |
| | | | | | | | | | | | | | | | | | | 27,404,810 | |
| | | | | | | | | | | | | | | | | | | | |
Minnesota (2.04%) | | | | | | | | | | | | | | | | | | | | |
Independent School District No. 194 (Lakeville), Minnesota, General Obligation Refunding Bonds, Series 2012D | | | 5.000 | % | | | 02/01/2022 | | | | Aa3 | | | | 2,720,000 | | | | 2,956,939 | |
State of Minnesota, General Obligation State Various Purpose Bonds, Series 2009H | | | 4.500 | % | | | 11/01/2024 | | | | Aa1 | | | | 185,000 | | | | 189,198 | |
Independent School District No. 276, Minnetonka Public Schools, Minnesota, General Obligation Refunding Bonds, Series 2016I | | | 2.375 | % | | | 02/01/2025 | | | | Aaa | | | | 2,805,000 | | | | 2,810,161 | |
Independent School District No. 276, Minnetonka Public Schools, Minnesota, General Obligation Refunding Bonds, Series 2016I | | | 3.000 | % | | | 02/01/2026 | | | | Aaa | | | | 1,000,000 | | | | 1,015,140 | |
Independent School District No. 720, Shakopee Public Schools, Minnesota, General Obligation School Building Bonds, Series 2015A | | | 3.250 | % | | | 02/01/2026 | | | | Baa1 | | | | 3,860,000 | | | | 3,949,745 | |
Independent School District No. 276, Minnetonka Public Schools, Minnesota, General Obligation Refunding Bonds, Series 2016I | | | 3.000 | % | | | 02/01/2027 | | | | Aaa | | | | 1,590,000 | | | | 1,605,073 | |
City of Eagan, Minnesota, General Obligation Bonds, Series 2018A | | | 3.250 | % | | | 02/01/2032 | | | | Aaa | | | | 1,245,000 | | | | 1,242,709 | |
| | | | | | | | | | | | | | | | | | | | |
| | | | | | | | | | | | | | | | | | | 13,768,965 | |
| | | | | | | | | | | | | | | | | | | | |
Mississippi (1.36%) | | | | | | | | | | | | | | | | | | | | |
Mississippi Development Bank, Special Obligation Bonds, Series 2010A, (City of Jackson, Mississippi General Obligation, Refunding Project) | | | 5.000 | % | | | 03/01/2022 | | | | Baa3 | | | | 1,000,000 | | | | 1,031,580 | |
Madison County School District, Madison County, Mississippi, General Obligation Refunding Bonds, Series 2012 | | | 4.000 | % | | | 04/15/2022 | | | | Aa2 | | | | 2,480,000 | | | | 2,621,434 | |
State of Mississippi, General Obligation Bonds, Series 2015F (Tax-Exempt) | | | 3.000 | % | | | 11/01/2026 | | | | Aa2 | | | | 3,000,000 | | | | 3,041,190 | |
Mississippi Development Bank, Special Obligation Bonds, Series 2015, (Canton Public School District, Madison County, Mississippi, General Obligation Bond Project) | | | 4.250 | % | | | 12/01/2028 | | | | A1 | | | | 2,305,000 | | | | 2,467,479 | |
| | | | | | | | | | | | | | | | | | | | |
| | | | | | | | | | | | | | | | | | | 9,161,683 | |
| | | | | | | | | | | | | | | | | | | | |
Missouri (2.33%) | | | | | | | | | | | | | | | | | | | | |
The School District of Columbia, Boone County, State of Missouri, General Obligation Refunding and Improvement Bonds, Series 2012 | | | 3.500 | % | | | 03/01/2022 | | | | Aa1 | | | | 445,000 | | | | 464,731 | |
The School District of Columbia, Boone County, State of Missouri, General Obligation Refunding and Improvement Bonds, Series 2012 | | | 4.000 | % | | | 03/01/2024 | | | | Aa1 | | | | 2,050,000 | | | | 2,165,948 | |
Parkway C-2 School District, St. Louis County, Missouri, General Obligation Refunding and Improvement Bonds, Series 2009 (Prerefunded to 03-01-2019 @ 100)(b) | | | 4.625 | % | | | 03/01/2025 | | | | AAA | | | | 3,000,000 | | | | 3,020,760 | |
Fort Zumwalt School District of St. Charles County, Missouri, General Obligation Refunding and Improvement Bonds, (Missouri Direct Deposit Program), Series 2015 | | | 4.000 | % | | | 03/01/2027 | | | | Aa2 | | | | 465,000 | | | | 498,987 | |
Fort Zumwalt School District of St. Charles County, Missouri, General Obligation Refunding and Improvement Bonds, (Missouri Direct Deposit Program), Series 2015 | | | 4.000 | % | | | 03/01/2028 | | | | Aa2 | | | | 400,000 | | | | 427,272 | |
Fort Zumwalt School District of St. Charles County, Missouri, General Obligation Refunding and Improvement Bonds, (Missouri Direct Deposit Program), Series 2015 | | | 4.000 | % | | | 03/01/2029 | | | | Aa2 | | | | 425,000 | | | | 451,044 | |
Nixa Public Schools, Christian County, Missouri, General Obligation Refunding and Improvement Bonds, Series 2014, (Missouri Direct Deposit Program) | | | 5.000 | % | | | 03/01/2031 | | | | A+ | | | | 370,000 | | | | 383,065 | |
Nixa Public Schools, Christian County, Missouri, General Obligation Refunding and Improvement Bonds, Series 2014, (Missouri Direct Deposit Program), (Prerefunded to 03-01-2020 @ 100) (b) | | | 5.000 | % | | | 03/01/2031 | | | | NR | | | | 380,000 | | | | 393,851 | |
Liberty Public School District No. 53, Clay County, Missouri, General Obligation School Building Bonds, Series 2018 | | | 4.000 | % | | | 03/01/2033 | | | | AA | | | | 1,000,000 | | | | 1,053,310 | |
| | |
| See accompanying notes to financial statements. | | 47 |
STATE FARM ASSOCIATES’ FUNDS TRUST MUNICIPAL BOND FUND
SCHEDULE OF INVESTMENTS (continued)
November 30, 2018
| | | | | | | | | | | | | | | | | | | | |
| | | Coupon
rate | | | Maturity date | | | Rating (a) | | | Principal
amount | | | Value | |
Long-term Municipal Bonds (Cont.) | | | | | | | | | | | | | | | | | | | | |
Missouri (Cont.) | | | | | | | | | | | | | | | | | | | | |
Liberty Public School District No. 53, Clay County, Missouri, General Obligation School Building Bonds, Series 2018 | | | 4.000 | % | | | 03/01/2034 | | | | AA | | | $ | 2,500,000 | | | $ | 2,612,475 | |
Wentzville R-IV School District, St. Charles County, Missouri, General Obligation Refunding and Improvement Bonds, (Missouri Direct Deposit Program), Series 2018 (e) | | | 4.000 | % | | | 03/01/2034 | | | | Aa2 | | | | 3,000,000 | | | | 3,140,160 | |
Reorganized School District No. 7 of Jackson County, Missouri, (Lee’s Summit R-7), General Obligation School Building Bonds, Series 2016 | | | 5.000 | % | | | 03/01/2036 | | | | AA+ | | | | 1,000,000 | | | | 1,110,510 | |
| | | | | | | | | | | | | | | | | | | | |
| | | | | | | | | | | | | | | | | | | 15,722,113 | |
| | | | | | | | | | | | | | | | | | | | |
Montana (1.76%) | | | | | | | | | | | | | | | | | | | | |
School District No. 4 (Hellgate), Missoula County, Montana, General Obligation School Building Bonds, Series 2017 | | | 3.500 | % | | | 06/15/2025 | | | | A+ | | | | 860,000 | | | | 905,064 | |
High School District No. 44 (Belgrade), Gallatin County, Montana, General Obligation School Building Bonds, Series 2016 | | | 3.000 | % | | | 06/01/2027 | | | | A+ | | | | 525,000 | | | | 524,948 | |
School District No. 4 (Hellgate), Missoula County, Montana, General Obligation School Building Bonds, Series 2017 | | | 5.000 | % | | | 06/15/2032 | | | | A+ | | | | 945,000 | | | | 1,068,937 | |
High School District No. 1 (Missoula), Missoula County, Montana, General Obligation School Building Bonds, Series 2017 | | | 4.000 | % | | | 07/01/2032 | | | | Aa3 | | | | 1,010,000 | | | | 1,072,408 | |
School District No. 4 (Hellgate), Missoula County, Montana, General Obligation School Building Bonds, Series 2017 | | | 5.000 | % | | | 06/15/2033 | | | | A+ | | | | 1,005,000 | | | | 1,135,359 | |
K-12 School District No. 9 (East Helena), Lewis and Clark County, Montana, General Obligation School Building Bonds, Series 2018 | | | 4.500 | % | | | 07/01/2033 | | | | A+ | | | | 560,000 | | | | 623,073 | |
School District No. 44 (Whitefish), Flathead County, Montana, General Obligation School Building Bonds, Series 2017 | | | 4.000 | % | | | 07/01/2033 | | | | A+ | | | | 520,000 | | | | 550,576 | |
High School District No. A (Great Falls), Cascade County, Montana, General Obligation School Building Bonds, Series 2018 | | | 5.000 | % | | | 07/01/2034 | | | | A+ | | | | 725,000 | | | | 833,018 | |
K-12 School District No. 9 (East Helena), Lewis and Clark County, Montana, General Obligation School Building Bonds, Series 2018 | | | 5.000 | % | | | 07/01/2034 | | | | A+ | | | | 805,000 | | | | 921,363 | |
School District No. 44 (Whitefish), Flathead County, Montana, General Obligation School Building Bonds, Series 2017 | | | 4.000 | % | | | 07/01/2034 | | | | A+ | | | | 565,000 | | | | 595,696 | |
K-12 School District No. 9 (East Helena), Lewis and Clark County, Montana, General Obligation School Building Bonds, Series 2018 | | | 5.000 | % | | | 07/01/2035 | | | | A+ | | | | 1,925,000 | | | | 2,193,230 | |
School District No. 44 (Whitefish), Flathead County, Montana, General Obligation School Building Bonds, Series 2017 | | | 4.000 | % | | | 07/01/2035 | | | | A+ | | | | 845,000 | | | | 886,743 | |
School District No. 44 (Whitefish), Flathead County, Montana, General Obligation School Building Bonds, Series 2017 | | | 4.000 | % | | | 07/01/2036 | | | | A+ | | | | 585,000 | | | | 608,710 | |
| | | | | | | | | | | | | | | | | | | | |
| | | | | | | | | | | | | | | | | | | 11,919,125 | |
| | | | | | | | | | | | | | | | | | | | |
Nebraska (2.09%) | | | | | | | | | | | | | | | | | | | | |
Douglas County School District 0010, (Elkhorn Public Schools), General Obligation Refunding Bonds, Series 2011 | | | 4.000 | % | | | 12/15/2022 | | | | AA- | | | | 1,290,000 | | | | 1,354,990 | |
Douglas County School District 0010, (Elkhorn Public Schools), General Obligation Refunding Bonds, Series 2011 | | | 5.000 | % | | | 12/15/2023 | | | | AA- | | | | 1,560,000 | | | | 1,686,703 | |
Douglas County School District 0001, (Omaha, Nebraska, Public Schools), General Obligation Refunding Bonds, Series 2010 | | | 4.000 | % | | | 12/15/2024 | | | | Aa2 | | | | 3,000,000 | | | | 3,078,000 | |
Sarpy County School District 0037, In the State of Nebraska, (Gretna Public Schools), General Obligation School Building and Refunding Bonds, Series 2015 | | | 3.000 | % | | | 12/15/2024 | | | | A+ | | | | 145,000 | | | | 148,054 | |
Sarpy County School District 0037, In the State of Nebraska, (Gretna Public Schools), General Obligation School Building and Refunding Bonds, Series 2015 | | | 4.000 | % | | | 12/15/2025 | | | | A+ | | | | 180,000 | | | | 194,850 | |
Douglas County School District 0010, (Elkhorn Public Schools), General Obligation Refunding Bonds, Series 2011 | | | 5.000 | % | | | 12/15/2026 | | | | AA- | | | | 1,925,000 | | | | 2,075,477 | |
City of Columbus, Nebraska, Combined Revenue and Refunding Bonds, Series 2016 | | | 4.000 | % | | | 12/15/2028 | | | | AA | | | | 150,000 | | | | 162,356 | |
Sarpy County School District 0037, In the State of Nebraska, (Gretna Public Schools), General Obligation School Building and Refunding Bonds, Series 2015 | | | 5.000 | % | | | 12/15/2028 | | | | A+ | | | | 250,000 | | | | 285,845 | |
Douglas County School District 0010, (Elkhorn Public Schools), General Obligation Bonds, Series 2012 B | | | 4.000 | % | | | 01/15/2029 | | | | AA- | | | | 730,000 | | | | 759,485 | |
City of Columbus, Nebraska, Combined Revenue and Refunding Bonds, Series 2016 | | | 4.000 | % | | | 12/15/2029 | | | | AA | | | | 250,000 | | | | 268,298 | |
Sarpy County School District 0037, In the State of Nebraska, (Gretna Public Schools), General Obligation School Building and Refunding Bonds, Series 2015 | | | 5.000 | % | | | 12/15/2029 | | | | A+ | | | | 260,000 | | | | 296,210 | |
City of Columbus, Nebraska, Combined Revenue and Refunding Bonds, Series 2016 | | | 4.000 | % | | | 12/15/2030 | | | | AA | | | | 325,000 | | | | 346,527 | |
| | |
| 48 | | See accompanying notes to financial statements. |
STATE FARM ASSOCIATES’ FUNDS TRUST MUNICIPAL BOND FUND
SCHEDULE OF INVESTMENTS (continued)
November 30, 2018
| | | | | | | | | | | | | | | | | | | | |
| | | Coupon
rate | | | Maturity date | | | Rating (a) | | | Principal
amount | | | Value | |
Long-term Municipal Bonds (Cont.) | | | | | | | | | | | | | | | | | | | | |
Nebraska (Cont.) | | | | | | | | | | | | | | | | | | | | |
Hall County School District 0002, in the State of Nebraska, (Grand Island Public Schools), General Obligation Bonds, Series 2014 | | | 5.000 | % | | | 12/15/2030 | | | | AA- | | | $ | 700,000 | | | $ | 785,309 | |
Nebraska Public Power District, General Revenue Bonds, 2014 Series A | | | 5.000 | % | | | 01/01/2031 | | | | A1 | | | | 1,900,000 | | | | 2,035,242 | |
Hall County School District 0002, In the State of Nebraska, (Grand Island Public Schools), General Obligation Bonds, Series 2014 | | | 5.000 | % | | | 12/15/2032 | | | | AA- | | | | 565,000 | | | | 631,529 | |
| | | | | | | | | | | | | | | | | | | | |
| | | | | | | | | | | | | | | | | | | 14,108,875 | |
| | | | | | | | | | | | | | | | | | | | |
Nevada (0.47%) | | | | | | | | | | | | | | | | | | | | |
Nevada System of Higher Education, Universities Revenue Bonds, Series 2016 A | | | 4.000 | % | | | 07/01/2030 | | | | AA- | | | | 3,045,000 | | | | 3,192,256 | |
| | | | | | | | | | | | | | | | | | | | |
New Jersey (3.01%) | | | | | | | | | | | | | | | | | | | | |
Township of Toms River, County of Ocean, New Jersey, General Improvement Bonds, Series 2010 A | | | 3.000 | % | | | 06/15/2019 | | | | AA | | | | 1,900,000 | | | | 1,901,463 | |
Middlesex County Improvement Authority, (County of Middlesex, State of New Jersey), County-Guaranteed Open Space Trust Fund Revenue Bonds, Series 2009 A | | | 4.000 | % | | | 12/15/2019 | | | | Aa2 | | | | 1,540,000 | | | | 1,573,803 | |
The Board of Education of the Township of Millstone, in the County of Monmouth, New Jersey, School District Refunding Bonds, Series 2011 | | | 5.000 | % | | | 07/15/2020 | | | | AA- | | | | 1,075,000 | | | | 1,126,815 | |
The Board of Education of the Borough of Madison, in the County of Morris, New Jersey, Refunding School Bonds, Series 2012 B | | | 3.000 | % | | | 12/15/2020 | | | | AA+ | | | | 315,000 | | | | 321,615 | |
Middlesex County Improvement Authority, (County of Middlesex, State of New Jersey), County-Guaranteed Open Space Trust Fund Revenue Bonds, Series 2009 A | | | 4.000 | % | | | 12/15/2020 | | | | Aa2 | | | | 750,000 | | | | 766,148 | |
Township of Parsippany-Troy Hills, In the County of Morris, New Jersey, General Obligation Bonds | | | 3.000 | % | | | 11/01/2021 | | | | AA | | | | 1,775,000 | | | | 1,789,200 | |
The Board of Education of the Borough of Madison, in the County of Morris, New Jersey, Refunding School Bonds, Series 2012 B | | | 3.000 | % | | | 12/15/2021 | | | | AA+ | | | | 685,000 | | | | 701,502 | |
The Board of Education of the Township of South Brunswick, in the County of Middlesex, New Jersey, Refunding School Bonds | | | 4.000 | % | | | 12/01/2022 | | | | AA+ | | | | 750,000 | | | | 796,508 | |
The Board of Education of the Borough of Madison, in the County of Morris, New Jersey, Refunding School Bonds, Series 2012 B | | | 3.000 | % | | | 12/15/2022 | | | | AA+ | | | | 600,000 | | | | 617,478 | |
The Board of Education of the Borough of Madison, in the County of Morris, New Jersey, Refunding School Bonds, Series 2012 B | | | 4.000 | % | | | 12/15/2023 | | | | AA+ | | | | 465,000 | | | | 495,923 | |
The Board of Education, of the Somerset Hills School District, in the County of Somerset, New Jersey, Refunding School Bonds, Series 2012 | | | 4.000 | % | | | 03/15/2024 | | | | Aa1 | | | | 2,345,000 | | | | 2,471,700 | |
The Board of Education of the Hopewell Valley Regional School District in the County of Mercer, New Jersey, School Bonds | | | 3.500 | % | | | 01/15/2027 | | | | AA | | | | 3,330,000 | | | | 3,430,832 | |
The Board of Education of the Township of Livingston, In the County of Essex, New Jersey, Refunding School Bonds | | | 4.000 | % | | | 07/15/2029 | | | | AA+ | | | | 1,000,000 | | | | 1,059,180 | |
Township of Moorestown, in the County of Burlington, New Jersey, General Obligation Bonds Consisting of General Improvement Bonds and Water-Sewer Utility Bonds | | | 4.000 | % | | | 01/15/2030 | | | | Aaa | | | | 1,140,000 | | | | 1,193,044 | |
The Board of Education of the Hopewell Valley Regional School District in the County of Mercer, New Jersey, School Bonds | | | 4.000 | % | | | 01/15/2032 | | | | AA | | | | 2,000,000 | | | | 2,056,780 | |
| | | | | | | | | | | | | | | | | | | | |
| | | | | | | | | | | | | | | | | | | 20,301,991 | |
| | | | | | | | | | | | | | | | | | | | |
New Mexico (4.61%) | | | | | | | | | | | | | | | | | | | | |
State Transportation, Refunding Revenue Bonds, (Senior Lien), Series 2010 B | | | 4.000 | % | | | 06/15/2019 | | | | Aa1 | | | | 3,500,000 | | | | 3,540,460 | |
Las Cruces School District No. 2, General Obligation School Bonds, Series 2011 A | | | 4.000 | % | | | 08/01/2021 | | | | Aa3 | | | | 1,500,000 | | | | 1,547,805 | |
Santa Fe Public School District, Santa Fe County, New Mexico, General Obligation Bonds, Series 2012 | | | 3.000 | % | | | 08/01/2022 | | | | Aa2 | | | | 2,000,000 | | | | 2,058,380 | |
City of Albuquerque, New Mexico, General Obligation General Purpose Bonds, Series 2012 A | | | 4.000 | % | | | 07/01/2023 | | | | Aa2 | | | | 2,450,000 | | | | 2,520,340 | |
Bernalillo County, New Mexico, General Obligation Refunding Bonds, Series 2015 A | | | 2.000 | % | | | 08/15/2023 | | | | Aaa | | | | 1,030,000 | | | | 1,021,338 | |
Bernalillo County, New Mexico, General Obligation Refunding Bonds, Series 2015 A | | | 2.250 | % | | | 08/15/2024 | | | | Aaa | | | | 1,050,000 | | | | 1,049,307 | |
Bernalillo County, New Mexico, General Obligation Bonds, Series 2015 | | | 3.000 | % | | | 08/15/2025 | | | | Aaa | | | | 1,235,000 | | | | 1,269,247 | |
City of Santa Fe, New Mexico, General Obligation Bonds, Series 2013 | | | 4.000 | % | | | 08/01/2026 | | | | AA | | | | 675,000 | | | | 708,737 | |
Las Cruces School District No. 2, Dona Ana County, New Mexico, General Obligation School Building Bonds, Series 2016 C | | | 3.000 | % | | | 08/01/2026 | | | | Aa3 | | | | 900,000 | | | | 916,902 | |
City of Santa Fe, New Mexico, General Obligation Bonds, Series 2013 | | | 4.000 | % | | | 08/01/2027 | | | | AA | | | | 700,000 | | | | 731,248 | |
| | |
| See accompanying notes to financial statements. | | 49 |
STATE FARM ASSOCIATES’ FUNDS TRUST MUNICIPAL BOND FUND
SCHEDULE OF INVESTMENTS (continued)
November 30, 2018
| | | | | | | | | | | | | | | | | | | | |
| | | Coupon
rate | | | Maturity date | | | Rating(a) | | | Principal
amount | | | Value | |
Long-term Municipal Bonds (Cont.) | | | | | | | | | | | | | | | | | | | | |
New Mexico (Cont.) | | | | | | | | | | | | | | | | | | | | |
Las Cruces School District No. 2, Dona Ana County, New Mexico, General Obligation School Building Bonds, Series 2016C | | | 3.250 | % | | | 08/01/2027 | | | | Aa3 | | | $ | 900,000 | | | $ | 922,572 | |
Rio Rancho Public School District No. 94, Sandoval County, New Mexico, General Obligation School Building Bonds, Series 2016A | | | 3.000 | % | | | 08/01/2027 | | | | A2 | | | | 1,515,000 | | | | 1,531,998 | |
City of Santa Fe, New Mexico, General Obligation Bonds, Series 2013 | | | 4.000 | % | | | 08/01/2028 | | | | AA | | | | 725,000 | | | | 753,522 | |
Las Cruces School District No. 2, Dona Ana County, New Mexico, General Obligation School Building Bonds, Series 2016C | | | 3.500 | % | | | 08/01/2028 | | | | Aa3 | | | | 900,000 | | | | 930,537 | |
Rio Rancho Public School District No. 94, Sandoval County, New Mexico, General Obligation School Building Bonds, Series 2016A | | | 3.125 | % | | | 08/01/2028 | | | | A2 | | | | 1,515,000 | | �� | | 1,523,136 | |
City of Santa Fe, New Mexico, General Obligation Bonds, Series 2013 | | | 4.000 | % | | | 08/01/2029 | | | | AA | | | | 750,000 | | | | 775,545 | |
Santa Fe Public School District, Santa Fe County, New Mexico, General Obligation School Building Bonds, Series 2018 | | | 3.625 | % | | | 08/01/2029 | | | | AA | | | | 3,075,000 | | | | 3,178,166 | |
Santa Fe Public School District, Santa Fe County, New Mexico, General Obligation School Building Bonds, Series 2018 | | | 4.000 | % | | | 08/01/2030 | | | | AA | | | | 1,000,000 | | | | 1,055,380 | |
Albuquerque Municipal School District No. 12, Bernalillo and Sandoval Counties, New Mexico, General Obligation School Building Bonds, Series 2018 (c) | | | 5.000 | % | | | 08/01/2034 | | | | Aa2 | | | | 1,800,000 | | | | 2,102,076 | |
Albuquerque Municipal School District No. 12, Bernalillo and Sandoval Counties, New Mexico, General Obligation School Building Bonds, Series 2018 | | | 5.000 | % | | | 08/01/2035 | | | | Aa2 | | | | 2,600,000 | | | | 3,024,762 | |
| | | | | | | | | | | | | | | | | | | | |
| | | | | | | | | | | | | | | | | | | 31,161,458 | |
| | | | | | | | | | | | | | | | | | | | |
New York (1.42%) | | | | | | | | | | | | | | | | | | | | |
County of Suffolk, New York, Public Improvement Serial Bonds - 2009 Series C (Economically Defeased to 10-15-2019 @ 100) (b) | | | 4.000 | % | | | 10/15/2021 | | | | Baa1 | | | | 3,000,000 | | | | 3,056,010 | |
Miller Place Union Free School District, In the Town of Brookhaven, Suffolk County, New York, School District Serial Bonds - 2010 | | | 4.000 | % | | | 02/15/2026 | | | | Aa2 | | | | 460,000 | | | | 460,552 | |
The Port Authority of New York and New Jersey Consolidated Bonds, One Hundred Seventy-Ninth Series | | | 5.000 | % | | | 12/01/2032 | | | | Aa3 | | | | 3,000,000 | | | | 3,333,540 | |
New York City, Municipal Water Finance Authority, Water and Sewer System Second General Resolution Revenue Bonds, Fiscal 2014 Series DD | | | 5.000 | % | | | 06/15/2035 | | | | Aa1 | | | | 2,500,000 | | | | 2,765,125 | |
| | | | | | | | | | | | | | | | | | | | |
| | | | | | | | | | | | | | | | | | | 9,615,227 | |
| | | | | | | | | | | | | | | | | | | | |
North Carolina (1.51%) | | | | | | | | | | | | | | | | | | | | |
County of Orange, North Carolina, General Obligation Refunding Bonds, Series 2011 | | | 3.000 | % | | | 02/01/2019 | | | | Aaa | | | | 1,000,000 | | | | 1,001,950 | |
City of Fayetteville, North Carolina, Public Works Commission, Revenue Bonds, Series 2009B (Prerefunded to 03-01-2019 @ 100) (b) | | | 5.000 | % | | | 03/01/2022 | | | | Aa2 | | | | 1,000,000 | | | | 1,007,720 | |
County of Wake, North Carolina, General Obligation Public Improvement Bonds, Series 2011 | | | 4.000 | % | | | 04/01/2024 | | | | Aaa | | | | 1,000,000 | | | | 1,042,180 | |
City of Charlotte, North Carolina, General Obligation Refunding Bonds, Series 2009B | | | 4.000 | % | | | 06/01/2024 | | | | Aaa | | | | 1,000,000 | | | | 1,009,590 | |
State of North Carolina, General Obligation Public Improvement Bonds, Series 2010A (Prerefunded to 05-01-2020 @ 100) (b) | | | 4.000 | % | | | 05/01/2026 | | | | Aaa | | | | 1,000,000 | | | | 1,027,900 | |
Metropolitan Sewerage District of Buncombe County, North Carolina, Sewerage System Revenue Refunding Bonds, Series 2013 | | | 4.000 | % | | | 07/01/2027 | | | | AA+ | | | | 1,210,000 | | | | 1,271,928 | |
City of Gastonia, North Carolina, Combined Utilities System Revenue Bonds, Series 2015 | | | 5.000 | % | | | 05/01/2028 | | | | AA- | | | | 700,000 | | | | 793,261 | |
City of Gastonia, North Carolina, Combined Utilities System Revenue Bonds, Series 2015 | | | 5.000 | % | | | 05/01/2029 | | | | AA- | | | | 265,000 | | | | 298,811 | |
County of Union, North Carolina, Enterprise Systems Revenue Bonds, Series 2017 | | | 3.000 | % | | | 06/01/2031 | | | | Aa1 | | | | 2,850,000 | | | | 2,771,597 | |
| | | | | | | | | �� | | | | | | | | | | | |
| | | | | | | | | | | | | | | | | | | 10,224,937 | |
| | | | | | | | | | | | | | | | | | | | |
North Dakota (1.08%) | | | | | | | | | | | | | | | | | | | | |
West Fargo Public School District No. 6, Cass County, North Dakota, General Obligation School Building Bonds, Series 2011 | | | 4.000 | % | | | 05/01/2026 | | | | Aa3 | | | | 1,000,000 | | | | 1,034,750 | |
City of Bismarck, Burleigh County, North Dakota, Refunding Improvement Bonds of 2016, Series L | | | 3.000 | % | | | 05/01/2027 | | | | Aa1 | | | | 860,000 | | | | 869,391 | |
City of Bismarck, Burleigh County, North Dakota, Refunding Improvement Bonds of 2016, Series L | | | 3.125 | % | | | 05/01/2028 | | | | Aa1 | | | | 845,000 | | | | 853,374 | |
City of Bismarck, Burleigh County, North Dakota, Refunding Improvement Bonds of 2016, Series L | | | 3.250 | % | | | 05/01/2029 | | | | Aa1 | | | | 835,000 | | | | 841,989 | |
Bismarck Public School District No. 1, Burleigh County, North Dakota, General Obligation School Building Bonds, Series 2017 | | | 3.125 | % | | | 05/01/2030 | | | | Aa2 | | | | 1,695,000 | | | | 1,671,236 | |
City of Bismarck, Burleigh County, North Dakota, Refunding Improvement Bonds of 2017, Series M | | | 3.125 | % | | | 05/01/2031 | | | | Aa1 | | | | 1,015,000 | | | | 999,054 | |
City of Bismarck, Burleigh County, North Dakota, Refunding Improvement Bonds of 2017, Series M | | | 3.125 | % | | | 05/01/2032 | | | | Aa1 | | | | 1,060,000 | | | | 1,031,984 | |
| | | | | | | | | | | | | | | | | | | | |
| | | | | | | | | | | | | | | | | | | 7,301,778 | |
| | | | | | | | | | | | | | | | | | | | |
| | |
| 50 | | See accompanying notes to financial statements. |
STATE FARM ASSOCIATES’ FUNDS TRUST MUNICIPAL BOND FUND
SCHEDULE OF INVESTMENTS (continued)
November 30, 2018
| | | | | | | | | | | | | | | | | | | | |
| | | Coupon
rate | | | Maturity date | | | Rating (a) | | | Principal
amount | | | Value | |
Long-term Municipal Bonds (Cont.) | | | | | | | | | | | | | | | | | | | | |
Ohio (4.02%) | | | | | | | | | | | | | | | | | | | | |
Board of Education, City School District of the City of Cincinnati, County of Hamilton, Ohio, Classroom Facilities Construction and Improvement Refunding Bonds, Series 2006 (Voted General Obligation Unlimited Tax) | | | 5.250 | % | | | 12/01/2022 | | | | AA- | | | $ | 1,000,000 | | | $ | 1,116,750 | |
Plain Local School District, County of Stark, Ohio, General Obligation (Unlimited Tax), School Improvement Refunding Bonds, Series 2011A (Prerefunded to 11-01-2021 @ 100) (b) | | | 4.300 | % | | | 11/01/2023 | | | | AA- | | | | 2,840,000 | | | | 3,020,312 | |
City of Cincinnati, Ohio, Water System Revenue Bonds, Series 2012A (Prerefunded to 12-01-2021 @ 100) (b) | | | 4.000 | % | | | 12/01/2024 | | | | Aaa | | | | 2,155,000 | | | | 2,276,973 | |
Lake County Community College District, Ohio, (Lakeland Community College), Facilities Construction and Improvement Bonds, Series 2016A, (General Obligation - Unlimited Tax) | | | 3.000 | % | | | 12/01/2025 | | | | Aa2 | | | | 660,000 | | | | 675,503 | |
Lake Local School District, Stark and Portage Counties, Ohio, General Obligation (Unlimited Tax), School Facilities Improvement Bonds, Series 2015 | | | 3.000 | % | | | 12/01/2025 | | | | AA- | | | | 525,000 | | | | 529,730 | |
Miami University, (A State University of Ohio), General Receipts Revenue and Refunding Bonds, Series 2011 | | | 5.000 | % | | | 09/01/2026 | | | | Aa3 | | | | 1,430,000 | | | | 1,528,813 | |
Lake County Community College District, Ohio, (Lakeland Community College), Facilities Construction and Improvement Bonds, Series 2016A, (General Obligation - Unlimited Tax) | | | 3.000 | % | | | 12/01/2026 | | | | Aa2 | | | | 865,000 | | | | 879,800 | |
Bellbrook-Sugarcreek Local School District, Counties of Greene and Warren, Ohio, School Improvement Unlimited Tax General Obligation Refunding Bonds, Series 2016 | | | 3.000 | % | | | 12/01/2027 | | | | Aa2 | | | | 1,000,000 | | | | 1,013,890 | |
Board of Education of the Northwest Local School District, (Counties of Hamilton and Butler, Ohio), School Improvement, Unlimited Tax General Obligation Bonds, Series 2015, (Non-Bank Qualified) | | | 5.000 | % | | | 12/01/2027 | | | | Aa2 | | | | 175,000 | | | | 195,673 | |
Perrysburg Exempted Village School District, Wood County, Ohio, School Facilities Construction and Improvement Bonds, Series 2015 (General Obligation - Unlimited Tax) | | | 4.000 | % | | | 12/01/2027 | | | | Aa3 | | | | 1,250,000 | | | | 1,333,638 | |
Lakewood City School District, Ohio, General Obligation (Unlimited Tax), School Facilities Improvement Bonds, Series 2014A (Prerefunded to 11-01-2022 @ 100) (b) | | | 5.000 | % | | | 11/01/2028 | | | | Aa2 | | | | 1,000,000 | | | | 1,107,850 | |
Bellbrook-Sugarcreek Local School District, Counties of Greene and Warren, Ohio, School Improvement Unlimited Tax General Obligation Refunding Bonds, Series 2016 | | | 4.000 | % | | | 12/01/2028 | | | | Aa2 | | | | 1,565,000 | | | | 1,690,732 | |
Board of Education of the Northwest Local School District, (Counties of Hamilton and | | | | | | | | | | | | | | | | | | | | |
Butler, Ohio), School Improvement, Unlimited Tax General Obligation Bonds, Series 2015, (Non-Bank Qualified) | | | 5.000 | % | | | 12/01/2028 | | | | Aa2 | | | | 225,000 | | | | 251,132 | |
Fairfield City School District, County of Butler, Ohio, School Improvement Unlimited Tax, General Obligation Bonds, Series 2014 | | | 5.000 | % | | | 11/01/2029 | | | | Aa3 | | | | 800,000 | | | | 889,480 | |
Board of Education of the Northwest Local School District, (Counties of Hamilton and Butler, Ohio), School Improvement, Unlimited Tax General Obligation Bonds, Series 2015, (Non-Bank Qualified) | | | 5.000 | % | | | 12/01/2029 | | | | Aa2 | | | | 200,000 | | | | 222,830 | |
Fairfield City School District, County of Butler, Ohio, School Improvement Unlimited Tax, General Obligation Bonds, Series 2014 | | | 5.000 | % | | | 11/01/2030 | | | | Aa3 | | | | 1,335,000 | | | | 1,481,062 | |
Lakewood City School District, Ohio, General Obligation (Unlimited Tax), School Facilities Improvement Refunding Bonds, Series 2017B | | | 4.000 | % | | | 11/01/2030 | | | | Aa2 | | | | 235,000 | | | | 248,905 | |
Board of Education of the Northwest Local School District, (Counties of Hamilton and Butler, Ohio), School Improvement, Unlimited Tax General Obligation Bonds, Series 2015, (Non-Bank Qualified) | | | 4.000 | % | | | 12/01/2030 | | | | Aa2 | | | | 365,000 | | | | 378,713 | |
Hudson City School District, Ohio, General Obligation (Unlimited Tax), School Improvement Bonds, Series 2018 | | | 4.000 | % | | | 12/01/2030 | | | | Aa1 | | | | 750,000 | | | | 794,303 | |
Lakewood City School District, Ohio, General Obligation (Unlimited Tax), School Facilities Improvement Refunding Bonds, Series 2017B | | | 4.000 | % | | | 11/01/2031 | | | | Aa2 | | | | 220,000 | | | | 231,970 | |
Hudson City School District, Ohio, General Obligation (Unlimited Tax), School Improvement Bonds, Series 2018 | | | 4.000 | % | | | 12/01/2031 | | | | Aa1 | | | | 350,000 | | | | 368,998 | |
Lakewood City School District, Ohio, General Obligation (Unlimited Tax), School Facilities Improvement Bonds, Series 2014A (Prerefunded to 11-01-2022 @ 100) (b) | | | 5.000 | % | | | 11/01/2032 | | | | Aa2 | | | | 1,500,000 | | | | 1,661,775 | |
| | |
| See accompanying notes to financial statements. | | 51 |
STATE FARM ASSOCIATES’ FUNDS TRUST MUNICIPAL BOND FUND
SCHEDULE OF INVESTMENTS (continued)
November 30, 2018
| | | | | | | | | | | | | | | | | | | | |
| | | Coupon
rate | | | Maturity date | | | Rating (a) | | | Principal
amount | | | Value | |
Long-term Municipal Bonds (Cont.) | | | | | | | | | | | | | | | | | | | | |
Ohio (Cont.) | | | | | | | | | | | | | | | | | | | | |
Lakewood City School District, Ohio, General Obligation (Unlimited Tax), School Facilities Improvement Refunding Bonds, Series 2017B | | | 4.000 | % | | | 11/01/2032 | | | | Aa2 | | | $ | 220,000 | | | $ | 231,103 | |
Cuyahoga Community College District, Ohio, Facilities Construction and Improvement Bonds, Series 2018, (General Obligation - Unlimited Tax) | | | 4.000 | % | | | 12/01/2032 | | | | AA | | | | 1,750,000 | | | | 1,840,213 | |
Hudson City School District, Ohio, General Obligation (Unlimited Tax), School Improvement Bonds, Series 2018 | | | 4.000 | % | | | 12/01/2032 | | | | Aa1 | | | | 375,000 | | | | 394,076 | |
Lakewood City School District, Ohio, General Obligation (Unlimited Tax), School Facilities Improvement Refunding Bonds, Series 2017B | | | 4.000 | % | | | 11/01/2033 | | | | Aa2 | | | | 370,000 | | | | 386,639 | |
Hudson City School District, Ohio, General Obligation (Unlimited Tax), School Improvement Bonds, Series 2018 | | | 4.000 | % | | | 12/01/2033 | | | | Aa1 | | | | 400,000 | | | | 418,180 | |
Cuyahoga Community College District, Ohio, Facilities Construction and Improvement Bonds, Series 2018, (General Obligation - Unlimited Tax) | | | 4.000 | % | | | 12/01/2034 | | | | AA | | | | 1,000,000 | | | | 1,044,100 | |
Hudson City School District, Ohio, General Obligation (Unlimited Tax), School Improvement Bonds, Series 2018 | | | 4.000 | % | | | 12/01/2034 | | | | Aa1 | | | | 875,000 | | | | 910,053 | |
| | | | | | | | | | | | | | | | | | | | |
| | | | | | | | | | | | | | | | | | | 27,123,196 | |
| | | | | | | | | | | | | | | | | | | | |
Oklahoma (1.38%) | | | | | | | | | | | | | | | | | | | | |
City of Tulsa, Oklahoma, General Obligation Bonds, Series 2013 | | | 4.000 | % | | | 03/01/2023 | | | | AA | | | | 2,500,000 | | | | 2,560,775 | |
City of Tulsa, Oklahoma, General Obligation Bonds, Series 2016 | | | 3.000 | % | | | 04/01/2028 | | | | AA | | | | 3,000,000 | | | | 3,013,650 | |
Grand River Dam Authority, Revenue Bonds, Series 2014A | | | 5.000 | % | | | 06/01/2031 | | | | A1 | | | | 1,835,000 | | | | 2,049,640 | |
The Edmond Public Works Authority, (Edmond, Oklahoma), Sales Tax and Utility System Revenue Bonds, Series 2017 | | | 5.000 | % | | | 07/01/2032 | | | | AA- | | | | 1,500,000 | | | | 1,727,625 | |
| | | | | | | | | | | | | | | | | | | | |
| | | | | | | | | | | | | | | | | | | 9,351,690 | |
| | | | | | | | | | | | | | | | | | | | |
Oregon (1.55%) | | | | | | | | | | | | | | | | | | | | |
City of Portland, Oregon, First Lien Water System Revenue and Refunding Bonds, 2010 Series A (Tax Exempt) | | | 4.000 | % | | | 05/01/2021 | | | | Aaa | | | | 1,000,000 | | | | 1,027,780 | |
Central Lincoln People’s Utility District, Oregon, Electric System Revenue Bonds, Series 2016 | | | 2.250 | % | | | 12/01/2024 | | | | AA- | | | | 400,000 | | | | 396,060 | |
City of Portland, Oregon, First Lien Water System Revenue Bonds, 2011 Series A | | | 4.000 | % | | | 05/01/2025 | | | | Aaa | | | | 1,330,000 | | | | 1,380,008 | |
State of Oregon, General Obligation Bonds, 2016 Series J, (Veterans’ Welfare Bonds Series 97A) (Refunding) | | | 2.800 | % | | | 06/01/2025 | | | | Aa1 | | | | 655,000 | | | | 670,268 | |
Central Lincoln People’s Utility District, Oregon, Electric System Revenue Bonds, Series 2016 | | | 2.500 | % | | | 12/01/2025 | | | | AA- | | | | 400,000 | | | | 398,456 | |
State of Oregon, General Obligation Bonds, 2016 Series J, (Veterans’ Welfare Bonds Series 97A), (Refunding) | | | 2.850 | % | | | 12/01/2025 | | | | Aa1 | | | | 385,000 | | | | 394,340 | |
Tualatin Hills Park & Recreation District, Washington County, Oregon, General Obligation Bonds, Series 2009 (Prerefunded to 06-01-2019 @ 100) (b) | | | 4.625 | % | | | 06/01/2028 | | | | AA | | | | 1,335,000 | | | | 1,353,503 | |
North Clackamas School District No. 12, Clackamas County, Oregon, General Obligation Refunding Bonds, Series 2014 | | | 5.000 | % | | | 06/15/2028 | | | | A+ | | | | 2,500,000 | | | | 2,822,625 | |
Portland Community College District, Multnomah, Washington, Yamhill, Clackamas and Columbia Counties, Oregon, General Obligation Bonds, Series 2009 (Prerefunded to 06-15-2019 @ 100) (b) | | | 5.000 | % | | | 06/15/2029 | | | | Aa1 | | | | 2,000,000 | | | | 2,033,840 | |
| | | | | | | | | | | | | | | | | | | | |
| | | | | | | | | | | | | | | | | | | 10,476,880 | |
| | | | | | | | | | | | | | | | | | | | |
Pennsylvania (1.62%) | | | | | | | | | | | | | | | | | | | | |
Township of Cranberry, Butler County, Pennsylvania, General Obligation Bonds, Series of 2011 | | | 4.500 | % | | | 03/01/2025 | | | | Aaa | | | | 1,605,000 | | | | 1,684,191 | |
Township of Upper St. Clair, (Allegheny County, Pennsylvania), General Obligation Bonds, Series A of 2016 | | | 3.000 | % | | | 06/01/2026 | | | | AA+ | | | | 430,000 | | | | 438,991 | |
Township of Cranberry, Butler County, Pennsylvania, General Obligation Bonds, Series of 2011 | | | 4.500 | % | | | 03/01/2027 | | | | Aaa | | | | 2,505,000 | | | | 2,621,307 | |
Township of Hampden, (Cumberland County, Pennsylvania), General Obligation Bonds, Series of 2012 | | | 5.000 | % | | | 05/15/2027 | | | | AA | | | | 1,825,000 | | | | 1,925,448 | |
Township of Hampden, (Cumberland County, Pennsylvania), General Obligation Bonds, Series of 2012 (Prerefunded to 11-15-2020 @ 100) (b) | | | 5.000 | % | | | 05/15/2027 | | | | NR | | | | 375,000 | | | | 396,008 | |
Township of Upper St. Clair, (Allegheny County, Pennsylvania), General Obligation Bonds, Series A of 2016 | | | 4.000 | % | | | 06/01/2028 | | | | AA+ | | | | 340,000 | | | | 363,603 | |
| | |
| 52 | | See accompanying notes to financial statements. |
STATE FARM ASSOCIATES’ FUNDS TRUST MUNICIPAL BOND FUND
SCHEDULE OF INVESTMENTS (continued)
November 30, 2018
| | | | | | | | | | | | | | | | | | | | |
| | | Coupon
rate | | | Maturity date | | | Rating (a) | | | Principal
amount | | | Value | |
Long-term Municipal Bonds (Cont.) | | | | | | | | | | | | | | | | | | | | |
Pennsylvania (Cont.) | | | | | | | | | | | | | | | | | | | | |
Township of Upper St. Clair, (Allegheny County, Pennsylvania), General Obligation Bonds, Series A of 2016 | | | 4.000 | % | | | 06/01/2029 | | | | AA+ | | | $ | 305,000 | | | $ | 323,645 | |
County of Northampton, Commonwealth of Pennsylvania, General Obligation Bonds, Series B of 2012 (Tax-Exempt) | | | 5.000 | % | | | 10/01/2030 | | | | AA | | | | 1,500,000 | | | | 1,634,220 | |
The Municipal Authority of the Borough of West View, (Allegheny County, Pennsylvania), Water Revenue Bonds, Series of 2014 (Prerefunded to 11-15-2024 @ 100) (b) | | | 5.000 | % | | | 11/15/2031 | | | | AA | | | | 1,365,000 | | | | 1,572,849 | |
| | | | | | | | | | | | | | | | | | | | |
| | | | | | | | | | | | | | | | | | | 10,960,262 | |
| | | | | | | | | | | | | | | | | | | | |
South Carolina (1.47%) | | | | | | | | | | | | | | | | | | | | |
Fort Mill School District No. 4 of York County, South Carolina, General Obligation Advanced Refunding Bonds, Series 2012A | | | 4.000 | % | | | 03/01/2023 | | | | Aa2 | | | | 2,315,000 | | | | 2,463,831 | |
School District No. 1 of Richland County, South Carolina, General Obligation Refunding Bonds, Series 2011A | | | 4.000 | % | | | 03/01/2023 | | | | AA- | | | | 1,675,000 | | | | 1,752,469 | |
Town of Fort Mill, South Carolina, Waterworks and Sewer System, Improvement Revenue Bonds, Series 2015 | | | 3.000 | % | | | 12/01/2025 | | | | AA- | | | | 355,000 | | | | 361,106 | |
Town of Fort Mill, South Carolina, Waterworks and Sewer System, Improvement Revenue Bonds, Series 2015 | | | 3.500 | % | | | 12/01/2026 | | | | AA- | | | | 370,000 | | | | 381,814 | |
Town of Fort Mill, South Carolina, Waterworks and Sewer System, Improvement Revenue Bonds, Series 2015 | | | 3.500 | % | | | 12/01/2027 | | | | AA- | | | | 380,000 | | | | 389,990 | |
Town of Fort Mill, South Carolina, Waterworks and Sewer System, Improvement Revenue Bonds, Series 2015 | | | 4.000 | % | | | 12/01/2028 | | | | AA- | | | | 520,000 | | | | 542,714 | |
City of Columbia, South Carolina, Waterworks and Sewer System Refunding Revenue Bonds, Series 2016B | | | 4.000 | % | | | 02/01/2029 | | | | Aa1 | | | | 1,045,000 | | | | 1,134,274 | |
Spartanburg Sanitary Sewer District, South Carolina, Sewer System Refunding Convertible Bonds, Series 2013B | | | 5.000 | % | | | 03/01/2030 | | | | A1 | | | | 2,160,000 | | | | 2,359,562 | |
Town of Fort Mill, South Carolina, Waterworks and Sewer System, Improvement Revenue Bonds, Series 2015 | | | 4.000 | % | | | 12/01/2030 | | | | AA- | | | | 535,000 | | | | 554,100 | |
| | | | | | | | | | | | | | | | | | | | |
| | | | | | | | | | | | | | | | | | | 9,939,860 | |
| | | | | | | | | | | | | | | | | | | | |
South Dakota (0.04%) | | | | | | | | | | | | | | | | | | | | |
Harrisburg School District 41-2, South Dakota, General Obligation Bonds, Series 2012 (Prerefunded to 01-15-2022 @ 100) (b) | | | 3.000 | % | | | 07/15/2022 | | | | AA- | | | | 250,000 | | | | 256,060 | |
| | | | | | | | | | | | | | | | | | | | |
Tennessee (2.05%) | | | | | | | | | | | | | | | | | | | | |
City of Knoxville, Tennessee, Water System Revenue Bonds, Series U-2009 (Prerefunded to 03-01-2019 @ 100) (b) | | | 4.000 | % | | | 03/01/2021 | | | | Aa1 | | | | 1,050,000 | | | | 1,055,691 | |
City of Knoxville, Tennessee, Water System Revenue Refunding Bonds, Series X-2012 | | | 3.000 | % | | | 03/01/2022 | | | | Aa1 | | | | 655,000 | | | | 667,687 | |
The Metropolitan Government of Nashville and Davidson County (Tennessee), Electric System Revenue Bonds, 2011 Series A (Prerefunded to 05-15-2021 @ 100) (b) | | | 4.500 | % | | | 05/15/2022 | | | | AA+ | | | | 2,760,000 | | | | 2,923,972 | |
City of Knoxville, Tennessee, Water System Revenue Refunding Bonds, Series X-2012 | | | 3.000 | % | | | 03/01/2023 | | | | Aa1 | | | | 670,000 | | | | 680,914 | |
The Metropolitan Government of Nashville and Davidson County (Tennessee), General Obligation Improvement and Refunding Bonds, Series 2010A (Prerefunded to 07-01-2020 @ 100) (b) | | | 4.000 | % | | | 07/01/2023 | | | | NR | | | | 1,105,000 | | | | 1,140,128 | |
The Metropolitan Government of Nashville and Davidson County (Tennessee), General Obligation Improvement and Refunding Bonds, Series 2010A | | | 4.000 | % | | | 07/01/2023 | | | | Aa2 | | | | 895,000 | | | | 919,648 | |
City of Knoxville, Tennessee, Water System Revenue Refunding Bonds, Series BB-2015 | | | 3.000 | % | | | 03/01/2025 | | | | Aa1 | | | | 1,170,000 | | | | 1,193,856 | |
City of Knoxville, Tennessee, Wastewater System Revenue Bonds, Series 2014A | | | 4.000 | % | | | 04/01/2028 | | | | Aa2 | | | | 725,000 | | | | 752,398 | |
City of Knoxville, Tennessee, Wastewater System Revenue Bonds, Series 2014A | | | 4.000 | % | | | 04/01/2029 | | | | Aa2 | | | | 750,000 | | | | 777,128 | |
City of Knoxville, Tennessee, Wastewater System Revenue Bonds, Series 2014A | | | 4.000 | % | | | 04/01/2030 | | | | Aa2 | | | | 775,000 | | | | 800,009 | |
Washington County, Tennessee, General Obligation School and Improvement Bonds, Series 2017B | | | 3.000 | % | | | 06/01/2030 | | | | Aa2 | | | | 850,000 | | | | 832,958 | |
Washington County, Tennessee, General Obligation School Bonds, Series 2017A | | | 3.000 | % | | | 06/01/2030 | | | | Aa2 | | | | 935,000 | | | | 916,253 | |
Harpeth Valley Utilities District of Davidson and Williamson Counties, Tennessee, Utilities Revenue Bonds, Series 2014 | | | 5.000 | % | | | 09/01/2031 | | | | AA | | | | 1,065,000 | | | | 1,193,833 | |
| | | | | | | | | | | | | | | | | | | | |
| | | | | | | | | | | | | | | | | | | 13,854,475 | |
| | | | | | | | | | | | | | | | | | | | |
| | |
| See accompanying notes to financial statements. | | 53 |
STATE FARM ASSOCIATES’ FUNDS TRUST MUNICIPAL BOND FUND
SCHEDULE OF INVESTMENTS (continued)
November 30, 2018
| | | | | | | | | | | | | | | | | | | | |
| | | Coupon
rate | | | Maturity date | | | Rating (a) | | | Principal
amount | | | Value | |
Long-term Municipal Bonds (Cont.) | | | | | | | | | | | | | | | | | | | | |
Texas (3.31%) | | | | | | | | | | | | | | | | | | | | |
City of Plano, Texas, (Collin and Denton Counties), General Obligation Refunding and Improvement Bonds, Series 2011 | | | 5.000 | % | | | 09/01/2019 | | | | Aaa | | | $ | 1,000,000 | | | $ | 1,023,590 | |
Fort Worth Independent School District, (Tarrant County, Texas), Unlimited Tax School Building Bonds, Series 2010 | | | 4.000 | % | | | 02/15/2021 | | | | AA | | | | 1,000,000 | | | | 1,023,800 | |
City of Austin, Texas (Travis, Williamson and Hays Counties), Water and Wastewater System Refunding Bonds, Series 2010A | | | 5.000 | % | | | 11/15/2025 | | | | Aa2 | | | | 2,345,000 | | | | 2,475,218 | |
City of Austin, Texas, (Travis and Williamson Counties), Water and Wastewater System Revenue Refunding Bonds, Series 2009A (Prerefunded to 11-15-2019 @ 100) (b) | | | 5.000 | % | | | 11/15/2025 | | | | Aa2 | | | | 2,000,000 | | | | 2,058,480 | |
Hays County, Texas, Pass-Through Toll Revenue and Unlimited Tax Bonds, Series 2011 (Prerefunded to 02-15-2020 @ 100) (b) | | | 4.750 | % | | | 02/15/2026 | | | | AA | | | | 1,620,000 | | | | 1,673,379 | |
Eanes Independent School District, (A political subdivision of the State of Texas located in Travis County, Texas), Unlimited Tax School Building Bonds, Series 2015A | | | 3.500 | % | | | 08/01/2026 | | | | AA+ | | | | 1,670,000 | | | | 1,738,771 | |
State of Texas, General Obligation Bonds, Water Financial Assistance Bonds, Series 2016A (Economically Distressed Areas Program) | | | 2.250 | % | | | 08/01/2026 | | | | Aaa | | | | 960,000 | | | | 946,675 | |
City of Austin, Texas (Travis, Williamson and Hays Counties), Water and Wastewater System Refunding Bonds, Series 2010A | | | 5.000 | % | | | 11/15/2026 | | | | Aa2 | | | | 2,465,000 | | | | 2,601,881 | |
Parker County, Texas, Unlimited Tax Road Bonds, Series 2009 (Prerefunded to 02-15-2019 @ 100) (b) | | | 5.000 | % | | | 02/15/2027 | | | | AA | | | | 1,000,000 | | | | 1,006,460 | |
State of Texas, General Obligation Bonds, Water Financial Assistance Bonds, Series 2016A (Economically Distressed Areas Program) | | | 3.000 | % | | | 08/01/2027 | | | | Aaa | | | | 2,325,000 | | | | 2,360,991 | |
Lake Travis Independent School District, (A political subdivision of the State of Texas located in Travis County, Texas), Unlimited Tax Refunding Bonds, Series 2017 | | | 4.000 | % | | | 02/15/2033 | | | | AA+ | | | | 1,000,000 | | | | 1,057,430 | |
Gregory-Portland Independent School District, (San Patricio County, Texas), Unlimited Tax School Building Bonds, Series 2018A | | | 4.000 | % | | | 02/15/2034 | | | | Aa2 | | | | 1,565,000 | | | | 1,610,401 | |
Gregory-Portland Independent School District, (San Patricio County, Texas), Unlimited Tax School Building Bonds, Series 2018A | | | 4.000 | % | | | 02/15/2035 | | | | Aa2 | | | | 2,710,000 | | | | 2,779,078 | |
| | | | | | | | | | | | | | | | | | | | |
| | | | | | | | | | | | | | | | | | | 22,356,154 | |
| | | | | | | | | | | | | | | | | | | | |
Utah (1.05%) | | | | | | | | | | | | | | | | | | | | |
Park City, Utah, Water Revenue Bonds, Series 2010, (Bank Qualified) | | | 4.000 | % | | | 12/15/2020 | | | | Aa2 | | | | 410,000 | | | | 418,405 | |
Park City, Utah, Water Revenue Bonds, Series 2010, (Bank Qualified) | | | 4.000 | % | | | 12/15/2021 | | | | Aa2 | | | | 600,000 | | | | 611,934 | |
Snyderville Basin Special Recreation District, Summit County, Utah, General Obligation Bonds, Series 2015A | | | 3.000 | % | | | 12/15/2025 | | | | Aa1 | | | | 1,260,000 | | | | 1,294,096 | |
The Central Utah Water Conservancy District, Water Revenue Refunding Bonds, Series 2017B, (Crossover Refunding) | | | 4.000 | % | | | 10/01/2033 | | | | AA+ | | | | 2,500,000 | | | | 2,657,800 | |
Jordan Valley Water Conservancy District, Water Revenue Refunding Bonds, Series 2017B | | | 4.000 | % | | | 10/01/2033 | | | | AA+ | | | | 1,000,000 | | | | 1,055,230 | |
Jordan Valley Water Conservancy District, Water Revenue Refunding Bonds, Series 2017B | | | 4.000 | % | | | 10/01/2034 | | | | AA+ | | | | 1,000,000 | | | | 1,050,470 | |
| | | | | | | | | | | | | | | | | | | | |
| | | | | | | | | | | | | | | | | | | 7,087,935 | |
| | | | | | | | | | | | | | | | | | | | |
Vermont (0.51%) | | | | | | | | | | | | | | | | | | | | |
City of Burlington, Vermont, General Obligation Public Improvement Bonds, Series 2018A | | | 5.000 | % | | | 11/01/2032 | | | | A2 | | | | 175,000 | | | | 197,752 | |
City of Burlington, Vermont, General Obligation Public Improvement Bonds, Series 2018A | | | 5.000 | % | | | 11/01/2033 | | | | A2 | | | | 190,000 | | | | 213,684 | |
City of Burlington, Vermont, General Obligation Public Improvement Bonds, Series 2018A | | | 5.000 | % | | | 11/01/2034 | | | | A2 | | | | 255,000 | | | | 285,200 | |
City of Burlington, Vermont, General Obligation Public Improvement Bonds, Series 2018B | | | 5.000 | % | | | 11/01/2034 | | | | A2 | | | | 410,000 | | | | 458,556 | |
City of Burlington, Vermont, General Obligation Public Improvement Bonds, Series 2018A | | | 5.000 | % | | | 11/01/2035 | | | | A2 | | | | 265,000 | | | | 294,979 | |
City of Burlington, Vermont, General Obligation Public Improvement Bonds, Series 2018B | | | 5.000 | % | | | 11/01/2035 | | | | A2 | | | | 435,000 | | | | 484,212 | |
City of Burlington, Vermont, General Obligation Public Improvement Bonds, Series 2018B | | | 5.000 | % | | | 11/01/2036 | | | | A2 | | | | 910,000 | | | | 1,008,153 | |
City of Burlington, Vermont, General Obligation Public Improvement Bonds, Series 2018A | | | 5.000 | % | | | 11/01/2037 | | | | A2 | | | | 440,000 | | | | 486,306 | |
| | | | | | | | | | | | | | | | | | | | |
| | | | | | | | | | | | | | | | | | | 3,428,842 | |
| | | | | | | | | | | | | | | | | | | | |
Virginia (1.34%) | | | | | | | | | | | | | | | | | | | | |
Virginia Public School Authority, School Financing Bonds (1997 Resolution), Refunding Series 2009 C | | | 4.000 | % | | | 08/01/2021 | | | | Aa1 | | | | 1,500,000 | | | | 1,520,640 | |
Loudon County, Virginia, General Obligation Public Improvement Bonds, Series 2011A | | | 4.000 | % | | | 12/01/2025 | | | | Aaa | | | | 1,070,000 | | | | 1,109,012 | |
Loudon County, Virginia, General Obligation Public Improvement Bonds, Series 2011A (Prerefunded to 12-01-2020 @ 100) (b) | | | 4.000 | % | | | 12/01/2025 | | | | NR | | | | 330,000 | | | | 342,494 | |
| | |
| 54 | | See accompanying notes to financial statements. |
STATE FARM ASSOCIATES’ FUNDS TRUST MUNICIPAL BOND FUND
SCHEDULE OF INVESTMENTS (continued)
November 30, 2018
| | | | | | | | | | | | | | | | | | | | |
| | | Coupon
rate | | | Maturity date | | | Rating (a) | | | Principal
amount | | | Value | |
Long-term Municipal Bonds (Cont.) | | | | | | | | | | | | | | | | | | | | |
Virginia (Cont.) | | | | | | | | | | | | | | | | | | | | |
Virginia Public School Authority, Special Obligation School Financing Bonds, Fluvanna County, Series 2008 (Prerefunded to 12-01-2018 @ 100) (b) | | | 6.250 | % | | | 12/01/2026 | | | | Aa2 | | | $ | 2,000,000 | | | $ | 2,000,000 | |
Loudoun County Sanitation Authority (Virginia), Water and Sewer System Revenue and Refunding Bonds, Series 2013 | | | 4.000 | % | | | 01/01/2027 | | | | Aaa | | | | 650,000 | | | | 691,685 | |
County of Stafford, Virginia, General Obligation Public Improvement Bonds, Series 2013 | | | 4.000 | % | | | 07/01/2030 | | | | Aaa | | | | 1,205,000 | | | | 1,269,648 | |
Virginia Public School Authority, School Financing Bonds (1997 Resolution), Series 2012 D | | | 4.000 | % | | | 08/01/2030 | | | | Aa1 | | | | 2,000,000 | | | | 2,092,840 | |
| | | | | | | | | | | | | | | | | | | | |
| | | | | | | | | | | | | | | | | | | 9,026,319 | |
| | | | | | | | | | | | | | | | | | | | |
Washington (6.59%) | | | | | | | | | | | | | | | | | | | | |
Issaquah School District No. 411, King County, Washington, Unlimited Tax General Obligation and Refunding Bonds, 2012 | | | 2.500 | % | | | 12/01/2022 | | | | AA+ | | | | 340,000 | | | | 344,695 | |
Public Utility District No. 1 of Douglas County, Washington, Electric Distribution System Revenue and Refunding Bonds, Series 2012 | | | 3.000 | % | | | 12/01/2022 | | | | Aa3 | | | | 620,000 | | | | 636,771 | |
Public Utility District No. 1 of Douglas County, Washington, Electric Distribution System Revenue and Refunding Bonds, Series 2012 | | | 5.000 | % | | | 12/01/2023 | | | | Aa3 | | | | 505,000 | | | | 555,763 | |
College Place School District No. 250, Walla Walla County, Washington, Unlimited Tax General Obligation Bonds, Series 2012 | | | 4.000 | % | | | 12/01/2024 | | | | A1 | | | | 1,875,000 | | | | 1,983,019 | |
Yakima School District No. 7, Yakima County, Washington, Unlimited Tax General Obligation Refunding Bonds, 2016 | | | 4.625 | % | | | 12/01/2024 | | | | Aa3 | | | | 235,000 | | | | 240,967 | |
Yakima School District No. 7, Yakima County, Washington, Unlimited Tax General Obligation Refunding Bonds, 2016 (Prerefunded to 12-01-2019 @ 100) (b) | | | 4.625 | % | | | 12/01/2024 | | | | NR | | | | 3,765,000 | | | | 3,863,041 | |
The City of Seattle, Washington, Municipal Light and Power Improvement and Refunding Revenue Bonds, 2008 (Prerefunded to 04-01-2019 @ 100) (b) | | | 6.000 | % | | | 04/01/2025 | | | | Aa2 | | | | 1,325,000 | | | | 1,342,861 | |
City of Spokane, Washington, Unlimited Tax General Obligation Bonds, 2015 | | | 3.000 | % | | | 12/01/2025 | | | | Aa2 | | | | 1,295,000 | | | | 1,330,056 | |
Lake Washington School District No. 414, King County, Washington, Unlimited Tax General Obligation Bonds, 2008 (Prerefunded to 12-01-2018 @ 100) (b) | | | 5.000 | % | | | 12/01/2025 | | | | AA+ | | | | 2,000,000 | | | | 2,000,000 | |
Lake Washington School District No. 414, King County, Washington, Unlimited Tax General Obligation Refunding Bonds, 2015 | | | 3.500 | % | | | 12/01/2025 | | | | AA+ | | | | 2,000,000 | | | | 2,132,780 | |
State of Washington, Various Purpose General Obligation Refunding Bonds, Series R-2013C | | | 4.000 | % | | | 07/01/2026 | | | | Aa1 | | | | 2,500,000 | | | | 2,665,200 | |
City of Tacoma, Washington, Sewer Revenue Refunding Bonds, 2016A | | | 3.000 | % | | | 12/01/2026 | | | | Aa2 | | | | 350,000 | | | | 358,652 | |
City of Tacoma, Washington, Sewer Revenue Refunding Bonds, 2016A | | | 3.250 | % | | | 12/01/2027 | | | | Aa2 | | | | 400,000 | | | | 411,588 | |
Hockinson School District No. 98, Clark County, Washington, Unlimited Tax General Obligation Bonds, 2015 | | | 4.000 | % | | | 12/01/2027 | | | | A+ | | | | 1,090,000 | | | | 1,172,622 | |
City of Camas, Washington, Water and Sewer Revenue and Refunding Bonds, 2015 | | | 4.000 | % | | | 12/01/2028 | | | | Aa3 | | | | 1,050,000 | | | | 1,115,573 | |
City of Tacoma, Washington, Sewer Revenue Refunding Bonds, 2016A | | | 3.250 | % | | | 12/01/2028 | | | | Aa2 | | | | 350,000 | | | | 355,758 | |
Lake Washington School District No. 414, King County, Washington, Unlimited Tax General Obligation and Refunding Bonds, 2016 | | | 4.000 | % | | | 12/01/2028 | | | | AA+ | | | | 1,000,000 | | | | 1,083,890 | |
Public Utility District No. 1 of Cowlitz County, Washington, Production System Revenue Refunding Bonds, 2014 | | | 5.000 | % | | | 09/01/2029 | | | | A1 | | | | 1,000,000 | | | | 1,105,880 | |
City of Everett, Washington, Water and Sewer Revenue Refunding Bonds, 2016 | | | 3.125 | % | | | 12/01/2029 | | | | AA+ | | | | 2,000,000 | | | | 2,001,220 | |
City of Tacoma, Washington, Solid Waste Revenue Refunding Bonds, 2016B | | | 5.000 | % | | | 12/01/2029 | | | | A1 | | | | 1,525,000 | | | | 1,737,463 | |
Public Utility District No. 1 of Clark County, Washington, Water System Revenue Bonds, Series 2014 | | | 5.000 | % | | | 01/01/2030 | | | | AA- | | | | 985,000 | | | | 1,094,325 | |
Energy Northwest, Columbia Generating Station Electric Revenue and Refunding Bonds, Series 2015-A | | | 5.000 | % | | | 07/01/2030 | | | | AA- | | | | 5,000,000 | | | | 5,700,000 | |
Public Utility District No. 1 of Cowlitz County, Washington, Production System Revenue Refunding Bonds, 2014 | | | 5.000 | % | | | 09/01/2030 | | | | A1 | | | | 2,100,000 | | | | 2,318,043 | |
Bainbridge Island School District No. 303, Kitsap County, Washington, Unlimited Tax General Obligation Bonds, 2017A | | | 4.000 | % | | | 12/01/2033 | | | | Aa2 | | | | 840,000 | | | | 884,276 | |
Lake Washington School District No. 414, King County, Washington, Unlimited Tax General Obligation Bonds, 2017 | | | 4.000 | % | | | 12/01/2033 | | | | AA+ | | | | 5,000,000 | | | | 5,282,550 | |
Public Utility District No. 1 of Clark County, Washington, Water System Revenue and Refunding Bonds, Series 2017 | | | 5.000 | % | | | 01/01/2034 | | | | AA- | | | | 1,010,000 | | | | 1,143,997 | |
Bainbridge Island School District No. 303, Kitsap County, Washington, Unlimited Tax General Obligation Bonds, 2017A | | | 4.000 | % | | | 12/01/2034 | | | | Aa2 | | | | 510,000 | | | | 534,597 | |
Selah School District No. 119, Yakima and Kittitas Counties, Washington, Unlimited Tax General Obligation Bonds, 2018 | | | 4.375 | % | | | 12/01/2034 | | | | A1 | | | | 1,040,000 | | | | 1,117,927 | |
| | | | | | | | | | | | | | | | | | | | |
| | | | | | | | | | | | | | | | 44,513,514 | |
| | | | | | | | | | | | | | | | | | | | |
| | |
| See accompanying notes to financial statements. | | 55 |
STATE FARM ASSOCIATES’ FUNDS TRUST MUNICIPAL BOND FUND
SCHEDULE OF INVESTMENTS (continued)
November 30, 2018
| | | | | | | | | | | | | | | | | | | | |
| | | Coupon
rate | | | Maturity date | | | Rating (a) | | | Principal
amount | | | Value | |
Long-term Municipal Bonds (Cont.) | | | | | | | | | | | | | | | | | | | | |
West Virginia (1.58%) | | | | | | | | | | | | | | | | | |
West Virginia University Board of Governors, University Improvement Revenue Bonds (West Virginia University Projects), 2011 Series B | | | 5.000 | % | | | 10/01/2023 | | | | A | | | $ | 2,510,000 | | | $ | 2,695,840 | |
West Virginia University Board of Governors, University Improvement Revenue Bonds (West Virginia University Projects), 2011 Series B | | | 5.000 | % | | | 10/01/2024 | | | | A | | | | 3,200,000 | | | | 3,434,208 | |
The Board of Education of the County of Manongalia (West Virginia), Public School Refunding Bonds, Series 2012 | | | 4.000 | % | | | 05/01/2025 | | | | AA- | | | | 1,105,000 | | | | 1,165,344 | |
The Board of Education of the County of Braxton (West Virginia), Public School Refunding Bonds, Series 2016 | | | 4.000 | % | | | 05/01/2026 | | | | AA- | | | | 350,000 | | | | 379,351 | |
The Board of Education of the County of Braxton (West Virginia), Public School Refunding Bonds, Series 2016 | | | 2.250 | % | | | 05/01/2026 | | | | AA- | | | | 125,000 | | | | 120,471 | |
The Board of Education of the County of Manongalia (West Virginia), Public School Refunding Bonds, Series 2012 | | | 4.000 | % | | | 05/01/2026 | | | | AA- | | | | 2,180,000 | | | | 2,291,180 | |
The Board of Education of the County of Braxton (West Virginia), Public School Refunding Bonds, Series 2016 | | | 5.000 | % | | | 05/01/2027 | | | | AA- | | | | 515,000 | | | | 587,538 | |
| | | | | | | | | | | | | | | | | | | | |
| | | | | | | | | | | | | | | | 10,673,932 | |
| | | | | | | | | | | | | | | | | | | | |
Wisconsin (4.75%) | | | | | | | | | | | | | | | | | |
Village of Whitefish Bay, Wisconsin (Milwaukee County), General Obligation Corporate Purpose Bonds, Series 2013A | | | 2.500 | % | | | 04/01/2022 | | | | Aa1 | | | | 175,000 | | | | 176,129 | |
City of Sheboygan, Sheboygan County, Wisconsin, General Obligation Corporate Purpose Bonds, Series 2007B | | | 4.750 | % | | | 10/01/2022 | | | | AA- | | | | 800,000 | | | | 836,392 | |
Village of Whitefish Bay, Wisconsin (Milwaukee County), General Obligation Corporate Purpose Bonds, Series 2013A | | | 2.500 | % | | | 04/01/2023 | | | | Aa1 | | | | 285,000 | | | | 287,041 | |
City of Sheboygan, Sheboygan County, Wisconsin, General Obligation Corporate Purpose Bonds, Series 2007B | | | 4.750 | % | | | 10/01/2023 | | | | AA- | | | | 300,000 | | | | 313,536 | |
Milwaukee Metropolitan Sewerage District, General Obligation Sewerage System Refunding Bonds, Series 2015C | | | 2.500 | % | | | 10/01/2024 | | | | Aa1 | | | | 2,000,000 | | | | 2,014,780 | |
City of Fond Du Lac, Fond Du Lac County, Wisconsin, Waterworks System Revenue Bonds, Series 2010 | | | 5.000 | % | | | 09/01/2025 | | | | A+ | | | | 1,000,000 | | | | 1,045,740 | |
City of Oshkosh, Wisconsin, (Winnebago County), Water System Revenue Refunding Bonds, Series 2016G | | | 2.000 | % | | | 01/01/2026 | | | | Aa3 | | | | 955,000 | | | | 902,150 | |
Muskego-Norway School District, Waukesha and Racine Counties, Wisconsin, General Obligation School Building and Improvement Bonds | | | 3.000 | % | | | 04/01/2026 | | | | AA | | | | 2,495,000 | | | | 2,538,538 | |
City of Oshkosh, Wisconsin, (Winnebago County), General Obligation Refunding Bonds, Series 2016H | | | 2.000 | % | | | 08/01/2026 | | | | Aa3 | | | | 1,090,000 | | | | 1,021,243 | |
Ellsworth Community School District, Pierce County, Wisconsin, General Obligation Refunding Bonds | | | 4.000 | % | | | 04/01/2027 | | | | Aa3 | | | | 340,000 | | | | 361,794 | |
Ellsworth Community School District, Pierce County, Wisconsin, General Obligation Refunding Bonds | | | 4.000 | % | | | 04/01/2028 | | | | Aa3 | | | | 275,000 | | | | 290,840 | |
Ellsworth Community School District, Pierce County, Wisconsin, General Obligation Refunding Bonds | | | 4.000 | % | | | 04/01/2029 | | | | Aa3 | | | | 400,000 | | | | 420,728 | |
Western Technical College District, Wisconsin, General Obligation Refunding Bonds, Series 2013C (Prerefunded to04-01-2020 @ 100) (b) | | | 5.000 | % | | | 04/01/2029 | | | | AA+ | | | | 3,000,000 | | | | 3,119,820 | |
Central Brown County Water Authority, Wisconsin, Water System Revenue Refunding Bonds, Series 2014A | | | 5.000 | % | | | 11/01/2029 | | | | A | | | | 1,000,000 | | | | 1,116,680 | |
Central Brown County Water Authority, Wisconsin, Water System Revenue Refunding Bonds, Series 2014A | | | 5.000 | % | | | 11/01/2030 | | | | A | | | | 2,000,000 | | | | 2,226,460 | |
Waupaca County, Wisconsin, General Obligation Highway Facility Building Bonds, Series 2018A | | | 3.250 | % | | | 03/01/2031 | | | | Aa2 | | | | 1,160,000 | | | | 1,163,956 | |
D.C. Everest Area School District, Marathon County, Wisconsin, General Obligation School Building and Improvement Bonds, Series 2018 | | | 3.375 | % | | | 04/01/2031 | | | | AA | | | | 3,900,000 | | | | 3,883,854 | |
City of Muskego, Waukesha County, Wisconsin, General Obligation Refunding Bonds, Series 2018A | | | 4.000 | % | | | 06/01/2031 | | | | Aa2 | | | | 300,000 | | | | 316,719 | |
| | |
| 56 | | See accompanying notes to financial statements. |
STATE FARM ASSOCIATES’ FUNDS TRUST MUNICIPAL BOND FUND
SCHEDULE OF INVESTMENTS (continued)
November 30, 2018
| | | | | | | | | | | | | | | | | | | | |
| | | Coupon
rate | | | Maturity date | | | Rating (a) | | | Principal
amount | | | Value | |
Long-term Municipal Bonds (Cont.) | | | | | | | | | | | | | | | | | | | | |
Wisconsin (Cont.) | | | | | | | | | | | | | | | | | | | | |
Central Brown County Water Authority, Wisconsin, Water System Revenue Refunding Bonds, Series 2014A | | | 5.000 | % | | | 11/01/2031 | | | | A | | | $ | 2,200,000 | | | $ | 2,444,046 | |
Hamilton School District, Waukesha County, Wisconsin, General Obligation School Building and Improvement Bonds | | | 3.250 | % | | | 04/01/2032 | | | | Aa1 | | | | 3,390,000 | | | | 3,395,017 | |
Western Technical College District, Wisconsin, General Obligation Refunding Bonds, Series 2017F | | | 3.000 | % | | | 04/01/2032 | | | | AA+ | | | | 2,240,000 | | | | 2,072,426 | |
City of Muskego, Waukesha County, Wisconsin, General Obligation Refunding Bonds, Series 2018A | | | 4.000 | % | | | 06/01/2032 | | | | Aa2 | | | | 675,000 | | | | 709,931 | |
City of Muskego, Waukesha County, Wisconsin, General Obligation Refunding Bonds, Series 2018A | | | 4.000 | % | | | 06/01/2034 | | | | Aa2 | | | | 1,390,000 | | | | 1,450,201 | |
| | | | | | | | | | | | | | | | | | | | |
| | | | | | | | | | | | | | | | | | | 32,108,021 | |
| | | | | | | | | | | | | | | | | | | | |
Total Long-term Municipal Bonds | | | | | | | | | | | | | | | | | | | | |
(cost $665,013,084) | | | | | | | | | | | | | | | | | | | 667,132,119 | |
| | | | | | | | | | | | | | | | | | | | |
Short-term Municipal Variable Rate Demand Notes (0.81%) | | | | | | | | | | | | | | | | | |
Maryland (0.44%) | | | | | | | | | | | | | | | | | | | | |
Montgomery County, Maryland, General Obligation Bonds, Consolidated Public Improvement Variable Rate Bonds of 2017, Series E (f) | | | 1.720 | % | | | 11/01/2037 | | | | Aaa | | | | 3,000,000 | | | | 3,000,000 | |
| | | | | | | | | | | | | | | | | | | | |
New York (0.37%) | | | | | | | | | | | | | | | | | | | | |
New York City, Municipal Water Finance Authority, Water and Sewer System Second General Resolution Revenue Bonds, Adjustable Rate Fiscal 2011 Series FF, Fiscal 2011 SubseriesFF-1 Bonds (f) | | | 1.730 | % | | | 06/15/2044 | | | | Aa1 | | | | 2,500,000 | | | | 2,500,000 | |
| | | | | | | | | | | | | | | | | | | | |
Total Short-term Municipal Variable Rate Demand Notes | | | | | | | | | | | | | | | | | |
(cost $5,500,000) | | | | | | | | | | | | | | | | | | | 5,500,000 | |
| | | | | | | | | | | | | | | | | | | | |
| | | | | |
| | | | | | | | | | | | Shares | | | Value | |
Short-term Investments (0.22%) | | | | | | | | | | | | | | | | | | | | |
JPMorgan U.S. Government Money Market Fund Capital Shares, 2.11% (g) | | | | | | | | | | | | | | | 1,469,032 | | | $ | 1,469,032 | |
| | | | | | | | | | | | | | | | | | | | |
Total Short-term Investments | | | | | | | | | | | | | | | | | | | | |
(cost $1,469,032) | | | | | | | | | | | | | | | | | | | 1,469,032 | |
| | | | | | | | | | | | | | | | | | | | |
TOTAL INVESTMENTS (99.81%) | | | | | | | | | | | | | | | | | | | | |
(cost $671,982,116) | | | | | | | | | | | | | | | | | | | 674,101,151 | |
OTHER ASSETS, NET OF LIABILITIES (0.19%) | | | | | | | | | | | | | | | | | | | 1,291,150 | |
| | | | | | | | | | | | | | | | | | | | |
NET ASSETS (100.00%) | | | | | | | | | | | | | | | | | | $ | 675,392,301 | |
| | | | | | | | | | | | | | | | | | | | |
| (a) | Ratings are not audited and represent the lower of Moody’s or S&P issuer specific ratings. |
| (b) | Advanced Refunded Bonds are backed by an escrow or trust containing U.S. Government, U.S. Government Agency or other securities to support the timely payment of principal and interest. |
| (c) | This security has been segregated to cover when-issued purchase commitments. |
| (d) | Rate shown is fixed until mandatory tender date of July 1, 2026. |
| (e) | Security purchased on a “when-issued” basis. |
| (f) | Rate shown is as of November 30, 2018. |
| (g) | Rate shown is the7-day yield as of November 30, 2018. |
NR - Not Rated
| | |
| See accompanying notes to financial statements. | | 57 |
STATE FARM ASSOCIATES’ FUNDS TRUST
STATEMENTS OF ASSETS AND LIABILITIES
November 30, 2018
| | | | | | | | | | | | | | | | |
| | | Growth Fund | | | Balanced Fund | | | Interim Fund | | | Municipal
Bond
Fund | |
Assets | | | | | | | | | | | | | | | | |
Investments in securities at identified cost | | $ | 1,679,284,183 | | | | 1,125,324,880 | | | | 346,959,846 | | | | 671,982,116 | |
| | | | | | | | | | | | | | | | |
Investments in securities at market value | | $ | 4,974,210,552 | | | | 1,932,445,285 | | | | 338,881,229 | | | | 674,101,151 | |
Receivables: | | | | | | | | | | | | | | | | |
Dividends and interest | | | 17,007,268 | | | | 8,004,256 | | | | 1,085,553 | | | | 8,115,322 | |
Shares of the Fund sold | | | 2,344,146 | | | | 632,145 | | | | 114,482 | | | | 551,722 | |
Prepaid expenses | | | 23,736 | | | | 8,951 | | | | 6,112 | | | | 2,590 | |
| | | | | | | | | | | | | | | | |
Total assets | | | 4,993,585,702 | | | | 1,941,090,637 | | | | 340,087,376 | | | | 682,770,785 | |
| | | | | | | | | | | | | | | | |
Liabilities and Net Assets | | | | | | | | | | | | | | | | |
Distributions to shareholders | | | — | | | | — | | | | 4,059 | | | | 268,230 | |
Payables: | | | | | | | | | | | | | | | | |
Shares of the Fund redeemed | | | 409,972 | | | | 625,514 | | | | 77,098 | | | | 31,192 | |
Securities purchased | | | — | | | | 4,815,633 | | | | 2,007,820 | | | | 6,918,133 | |
Trustees’ fees and expenses | | | 12,475 | | | | 4,999 | | | | 968 | | | | 1,848 | |
Due to affiliates | | | 456,549 | | | | 201,166 | | | | 59,013 | | | | 85,850 | |
Accrued liabilities | | | 120,201 | | | | 86,619 | | | | 52,587 | | | | 73,231 | |
| | | | | | | | | | | | | | | | |
Total liabilities | | | 999,197 | | | | 5,733,931 | | | | 2,201,545 | | | | 7,378,484 | |
| | | | | | | | | | | | | | | | |
Net assets applicable to shares outstanding of common stock | | $ | 4,992,586,505 | | | | 1,935,356,706 | | | | 337,885,831 | | | | 675,392,301 | |
| | | | | | | | | | | | | | | | |
Fund shares outstanding (no par value, unlimited number of shares authorized) | | | 61,594,838 | | | | 28,244,541 | | | | 34,631,028 | | | | 80,020,329 | |
Net asset value, offering price and redemption price per share | | $ | 81.06 | | | | 68.52 | | | | 9.76 | | | | 8.44 | |
| | | | | | | | | | | | | | | | |
Analysis of Net Assets | | | | | | | | | | | | | | | | |
Paid-in-capital | | $ | 1,577,493,023 | | | | 1,092,024,916 | | | | 346,311,363 | | | | 673,068,982 | |
Total distributable earnings (loss) | | | 3,415,093,482 | | | | 843,331,790 | | | | (8,425,532 | ) | | | 2,323,319 | |
| | | | | | | | | | | | | | | | |
Net assets applicable to shares outstanding | | $ | 4,992,586,505 | | | | 1,935,356,706 | | | | 337,885,831 | | | | 675,392,301 | |
| | | | | | | | | | | | | | | | |
| | |
| 58 | | See accompanying notes to financial statements. |
STATE FARM ASSOCIATES’ FUNDS TRUST
STATEMENTS OF OPERATIONS
Year ended November 30, 2018
| | | | | | | | | | | | | | | | |
| | | Growth Fund | | | Balanced Fund | | | Interim Fund | | | Municipal
Bond Fund | |
Investment Income: | | | | | | | | | | | | | | | | |
Dividends | | $ | 126,551,083 | | | | 31,854,904 | | | | — | | | | — | |
Interest | | | 662,153 | | | | 19,526,274 | | | | 5,514,722 | | | | 83,227 | |
Tax-exempt interest | | | — | | | | — | | | | — | | | | 21,175,632 | |
| | | | | | | | | | | | | | | | |
| | | 127,213,236 | | | | 51,381,178 | | | | 5,514,722 | | | | 21,258,859 | |
Less: foreign withholding taxes | | | (1,217,491 | ) | | | (443,978 | ) | | | — | | | | — | |
| | | | | | | | | | | | | | | | |
Total investment income | | | 125,995,745 | | | | 50,937,200 | | | | 5,514,722 | | | | 21,258,859 | |
Expenses: | | | | | | | | | | | | | | | | |
Investment advisory and management fees | | | 5,111,469 | | | | 2,089,709 | | | | 416,209 | | | | 762,384 | |
Trustees’ fees and expenses | | | 175,220 | | | | 69,079 | | | | 12,410 | | | | 24,673 | |
Reports to shareholders | | | 120,532 | | | | 63,351 | | | | 19,437 | | | | 18,104 | |
Professional fees | | | 69,979 | | | | 27,518 | | | | 12,388 | | | | 15,655 | |
Audit fees | | | 60,164 | | | | 60,145 | | | | 60,097 | | | | 60,019 | |
Errors and omissions insurance | | | 57,009 | | | | 22,626 | | | | 4,147 | | | | 8,200 | |
Custodian fees | | | 129,453 | | | | 43,736 | | | | 4,249 | | | | 10,959 | |
ICI dues | | | 41,507 | | | | 16,477 | | | | 3,336 | | | | 6,104 | |
Regulatory Fees | | | 40,876 | | | | 34,559 | | | | 25,850 | | | | 30,913 | |
Fidelity bond expense | | | 5,909 | | | | 2,332 | | | | 427 | | | | 836 | |
Securities valuation fees | | | 2,433 | | | | 59,896 | | | | 5,760 | | | | 156,096 | |
| | | | | | | | | | | | | | | | |
Total expenses | | | 5,814,551 | | | | 2,489,428 | | | | 564,310 | | | | 1,093,943 | |
Less: expense reimbursement from SFIMC | | | — | | | | — | | | | — | | | | (198 | ) |
| | | | | | | | | | | | | | | | |
Net expenses | | | 5,814,551 | | | | 2,489,428 | | | | 564,310 | | | | 1,093,745 | |
| | | | | | | | | | | | | | | | |
Net investment income | | | 120,181,194 | | | | 48,447,772 | | | | 4,950,412 | | | | 20,165,114 | |
Realized and unrealized gain (loss): | | | | | | | | | | | | | | | | |
Net realized gain (loss) on sales of investments | | | 63,216,447 | | | | 13,878,453 | | | | (8,815 | ) | | | 204,284 | |
Net realized gain (loss) on foreign currency transactions | | | 69,190 | | | | 13,408 | | | | — | | | | — | |
Change in net unrealized appreciation (depreciation) on investments and foreign currency transactions | | | 30,175,253 | | | | (14,694,943 | ) | | | (4,059,164 | ) | | | (13,750,136 | ) |
| | | | | | | | | | | | | | | | |
Net realized and unrealized gain (loss) on investments | | | 93,460,890 | | | | (803,082 | ) | | | (4,067,979 | ) | | | (13,545,852 | ) |
| | | | | | | | | | | | | | | | |
Net change in net assets resulting from operations | | $ | 213,642,084 | | | | 47,644,690 | | | | 882,433 | | | | 6,619,262 | |
| | | | | | | | | | | | | | | | |
| | |
| See accompanying notes to financial statements. | | 59 |
STATE FARM ASSOCIATES’ FUNDS TRUST
STATEMENTS OF CHANGES IN NET ASSETS
| | | | | | | | |
| | | Growth Fund | |
Years ended November 30, | | 2018 | | | 2017 | |
From operations: | | | | | | | | |
Net investment income | | $ | 120,181,194 | | | | 113,751,665 | |
Net realized gain (loss) | | | 63,285,637 | | | | 54,748,371 | |
Change in net unrealized appreciation or depreciation | | | 30,175,253 | | | | 593,984,904 | |
| | | | | | | | |
Net change in net assets resulting from operations | | | 213,642,084 | | | | 762,484,940 | |
Distributions to shareholders from and in excess of: | | | | | | | | |
Distributions (Net investment income, Net realized gain) | | | (171,921,534 | ) | | | | |
Net investment income | | | | | | | (109,465,633 | ) |
Net realized gain | | | | | | | (34,371,546 | ) |
| | | | | | | | |
Total distributions to shareholders | | | (171,921,534 | ) | | | (143,837,179 | ) |
From Fund share transactions: | | | | | | | | |
Proceeds from shares sold | | | 244,898,568 | | | | 251,333,568 | |
Reinvestment of distributions | | | 162,502,171 | | | | 135,964,842 | |
| | | | | | | | |
| | | 407,400,739 | | | | 387,298,410 | |
Less payments for shares redeemed | | | (417,024,684 | ) | | | (342,023,738 | ) |
| | | | | | | | |
Net increase (decrease) in net assets from Fund share transactions | | | (9,623,945 | ) | | | 45,274,672 | |
| | | | | | | | |
Total increase (decrease) in net assets | | | 32,096,605 | | | | 663,922,433 | |
| | | | | | | | |
Net assets: | | | | | | | | |
Beginning of period | | | 4,960,489,900 | | | | 4,296,567,467 | |
| | | | | | | | |
End of period | | $ | 4,992,586,505 | | | | 4,960,489,900 | (a) |
| | | | | | | | |
Share Information | | | | | | | | |
Sold | | | 3,064,526 | | | | 3,380,005 | |
Issued in reinvestment of distributions | | | 2,063,834 | | | | 1,870,158 | |
Redeemed | | | (5,226,707 | ) | | | (4,583,240 | ) |
| | | | | | | | |
Net increase (decrease) | | | (98,347 | ) | | | 666,923 | |
| | | | | | | | |
| (a) | Net assets - End of period includes undistributed net investment income (loss) of $53,961,535 in 2017. |
| (b) | Net assets - End of period includes undistributed net investment income (loss) of $21,488,601 in 2017. |
| (c) | Net assets - End of period includes undistributed net investment income (loss) of $0 in 2017. |
| | |
| 60 | | See accompanying notes to financial statements. |
| | | | | | | | | | | | | | | | | | | | | | |
| Balanced Fund | | | Interim Fund | | | Municipal Bond Fund | |
| 2018 | | | 2017 | | | 2018 | | | 2017 | | | 2018 | | | 2017 | |
| | | | | | | | | | | | | | | | | | | | | | |
| | 48,447,772 | | | | 46,926,623 | | | | 4,950,412 | | | | 4,504,531 | | | | 20,165,114 | | | | 21,050,241 | |
| | 13,891,861 | | | | 8,760,631 | | | | (8,815 | ) | | | 44,576 | | | | 204,284 | | | | 680,914 | |
| | (14,694,943 | ) | | | 153,931,558 | | | | (4,059,164 | ) | | | (1,872,252 | ) | | | (13,750,136 | ) | | | 5,901,584 | |
| | | | | | | | | | | | | | | | | | | | | | |
| | 47,644,690 | | | | 209,618,812 | | | | 882,433 | | | | 2,676,855 | | | | 6,619,262 | | | | 27,632,739 | |
| | | | | | | | | | | | | | | | | | | | | | |
| | (56,359,140 | ) | | | | | | | (4,950,412 | ) | | | | | | | (20,518,044 | ) | | | | |
| | | | | (45,910,993 | ) | | | | | | | (4,504,531 | ) | | | | | | | (21,050,241 | ) |
| | | | | (3,463,102 | ) | | | | | | | — | | | | | | | | — | |
| | | | | | | | | | | | | | | | | | | | | | |
| | (56,359,140 | ) | | | (49,374,095 | ) | | | (4,950,412 | ) | | | (4,504,531 | ) | | | (20,518,044 | ) | | | (21,050,241 | ) |
| | | | | | | | | | | | | | | | | | | | | | |
| | 117,441,765 | | | | 126,957,290 | | | | 72,744,672 | | | | 51,535,971 | | | | 53,792,884 | | | | 49,387,881 | |
| | 53,882,238 | | | | 47,280,819 | | | | 4,857,145 | | | | 4,428,696 | | | | 17,089,538 | | | | 17,588,396 | |
| | | | | | | | | | | | | | | | | | | | | | |
| | 171,324,003 | | | | 174,238,109 | | | | 77,601,817 | | | | 55,964,667 | | | | 70,882,422 | | | | 66,976,277 | |
| | (178,326,070 | ) | | | (149,730,862 | ) | | | (96,078,359 | ) | | | (89,957,689 | ) | | | (80,227,693 | ) | | | (79,017,729 | ) |
| | | | | | | | | | | | | | | | | | | | | | |
| | (7,002,067 | ) | | | 24,507,247 | | | | (18,476,542 | ) | | | (33,993,022 | ) | | | (9,345,271 | ) | | | (12,041,452 | ) |
| | | | | | | | | | | | | | | | | | | | | | |
| | (15,716,517 | ) | | | 184,751,964 | | | | (22,544,521 | ) | | | (35,820,698 | ) | | | (23,244,053 | ) | | | (5,458,954 | ) |
| | | | | | | | | | | | | | | | | | | | | | |
| | | | | | | | | | | | | | | | | | | | | | |
| | 1,951,073,223 | | | | 1,766,321,259 | | | | 360,430,352 | | | | 396,251,050 | | | | 698,636,354 | | | | 704,095,308 | |
| | | | | | | | | | | | | | | | | | | | | | |
| | 1,935,356,706 | | | | 1,951,073,223 | (b) | | | 337,885,831 | | | | 360,430,352 | (c) | | | 675,392,301 | | | | 698,636,354 | (c) |
| | | | | | | | | | | | | | | | | | | | | | |
| | | | | | | | | | | | | | | | | | | | | | |
| | 1,722,308 | | | | 1,934,863 | | | | 7,453,195 | | | | 5,193,467 | | | | 6,307,569 | | | | 5,694,060 | |
| | 796,715 | | | | 732,753 | | | | 497,573 | | | | 446,227 | | | | 2,010,782 | | | | 2,029,540 | |
| | (2,615,954 | ) | | | (2,277,314 | ) | | | (9,831,988 | ) | | | (9,069,201 | ) | | | (9,428,096 | ) | | | (9,130,000 | ) |
| | | | | | | | | | | | | | | | | | | | | | |
| | (96,931 | ) | | | 390,302 | | | | (1,881,220 | ) | | | (3,429,507 | ) | | | (1,109,745 | ) | | | (1,406,400 | ) |
| | | | | | | | | | | | | | | | | | | | | | |
| | |
| See accompanying notes to financial statements. | | 61 |
STATE FARM ASSOCIATES’ FUNDS TRUST
NOTES TO FINANCIAL STATEMENTS
The State Farm Associates’ Funds Trust (the “Trust”) has four separate investment portfolios (each a “Fund” and together, the “Funds”). The Trust is registered under the Investment Company Act of 1940 as anopen-end, management investment company. Each Fund has its own investment objective, investment policies, restrictions, and attendant risks and is diversified as defined in the Investment Company Act of 1940. Each Fund follows the accounting and reporting guidance in Financial Accounting Standards Board (“FASB”) Accounting Standards Codification 946, “Financial Services-Investment Companies.” State Farm Investment Management Corp. (“SFIMC”) is the Trust’s investment adviser.
TheState Farm Growth Fund(the “Growth Fund”) seeks long-term growth of capital which may be supplemented by income. The Growth Fund seeks to achieve this objective by investing under normal circumstances at least 80% of its assets in common stocks and other income producing equity securities.
TheState Farm Balanced Fund(the “Balanced Fund”) seeks long-term growth of principal while providing some current income. The Balanced Fund seeks to achieve its objective by investing under normal market conditions approximately 60% of its total assets in common stocks, and ordinarily limits its common stock investments to no more than 75% of its total assets. The Balanced Fund ordinarily invests at least 25% of its total assets in fixed income securities. The Balanced Fund invests in bonds to provide relative stability of principal and income.
TheState Farm Interim Fund(the “Interim Fund”) seeks the realization over a period of years of the highest yield consistent with relatively low price volatility. The Interim Fund seeks to achieve its investment objective through investment in high quality debt securities with short and intermediate-term maturities.
TheState Farm Municipal Bond Fund(the “Municipal Bond Fund”) seeks as high a rate of income exempt from federal income taxes as is consistent with prudent investment management. The Municipal Bond Fund seeks to achieve its investment objective through investment primarily in a diversified selection of municipal bonds (for example, general obligation bonds of a state or bonds financing a specific project) with maturities of one to seventeen years, although from time to time SFIMC may purchase issues with longer maturities. The Municipal Bond Fund normally invests so that either (1) at least 80% of the Fund’s net investment income is exempt from regular federal income tax or (2) at least 80% of the Fund’s net assets are invested in securities that produce income exempt from regular federal income tax.
| 2. | Significant Accounting Policies |
The following is a summary of significant accounting policies followed by the Funds in the preparation of their financial statements in accordance with U.S. generally accepted accounting principles (“GAAP”).
Fund Share Valuation
Fund shares are sold and redeemed on a continuous basis at net asset value. The net asset value per share is determined daily on each day the New York Stock Exchange is open. The net asset value for each Fund is determined as of the close of regular session trading on the New York Stock Exchange (usually 3:00 p.m. Central Time). The net asset value per share is computed by dividing the total value of a Fund’s investments and other assets, less liabilities, by the number of Fund shares outstanding.
Securities Valuation
All investments in securities are recorded at their fair value. For more information see Note 3 Securities Valuation.
Securities Transactions and Investment Income
For financial reporting purposes, security transactions are accounted for on trade date (date the order to buy or sell is executed) and dividend incomeis recorded on theex-dividend date. Interest income is recorded on the accrual basis, and includes amortization of premiums and discounts on fixed income securities. Realized gains and losses from security transactions are reported on an identified cost basis.
Expenses
Expenses arising in connection with a specific Fund are allocated to that Fund. Common Trust expenses are allocated between the Funds in proportion to each Fund’s relative net assets.
Income Taxes and Distributions to Shareholders
Each Fund is a separate taxpayer for federal income tax purposes. It is the Funds’ policy to comply with the provisions of Subchapter M of the Internal Revenue Code applicable to regulated investment companies and, in the manner provided therein, to distribute substantially all of their taxable income, including any net realized gain on sales of investments, reportable for federal income tax purposes.
For more information refer to Note 4 Income Taxes and Distributions to Shareholders.
62
STATE FARM ASSOCIATES’ FUNDS TRUST
NOTES TO FINANCIAL STATEMENTS (continued)
Foreign Currency Translation
Investment securities and other assets and liabilities denominated in a foreign currency are translated into U.S. dollars at the prevailing foreign exchange rates at November 30, 2018. Purchases and sales of investment securities and income and expense items denominated in foreign currencies are translated into U.S. dollars at the prevailing foreign exchange rates on the respective dates of transactions. That portion of realized and unrealized gains and losses on investments that results from fluctuations in foreign currency exchange rates is not separately disclosed, but is included with realized and unrealized gains and losses on investment securities.
Use of Estimates
The preparation of financial statements in conformity with GAAP requires management to make estimates and assumptions that affect the amounts reported in the financial statements and accompanying notes. Actual results could differ from those estimates.
Commitments and Contingencies
In the normal course of business, the Trust enters into contracts on behalf of the Funds that may contain provisions for general indemnifications. Each Fund’s maximum exposure under these indemnification provisions is unknown, as this would involve future claims that may be made against each Fund that are not known at this time. However, based on experience, the Funds believe the risk of loss from these indemnification provisions is remote.
Securities Purchased on a “When-Issued” Basis
The Municipal Bond Fund may purchase municipal bonds on a “when-issued” basis. Delivery and payment for these securities may be a month or more after the purchase date, during which time such securities are subject to market fluctuations. The Municipal Bond Fund identifies and holds specific liquid assets with a market value at least equal to the amount of the when-issued purchase commitments in order to ensure that it can meet those commitments. It is possible that the securities will never be issued and the commitment cancelled. At November 30, 2018, the Municipal Bond Fund had commitments of $6,918,133 (representing 1.02% of net assets) for when-issued securities. These commitments are included within the Securities Purchased line on the Statements of Assets and Liabilities.
New Accounting Pronouncements
In March 2017, FASB issued Accounting Standards UpdateNo. 2017-08 “Premium Amortization on Purchased Callable Debt Securities”, which amends the amortization period for certain purchased callable debt securities. This update requires certain premiums on callable debt securities to be amortized to the earliest call date. The amendments will be applied on a modified-retrospective basis and are effective for fiscal years, and interim periods within those fiscal years, beginning after December 15, 2018. At this time, the Trust’s management is evaluating the impact this pronouncement may have on the Trust’s financial statements, if any.
In August 2018, FASB issued Accounting Standards UpdateNo. 2018-13 “Fair Value Measurement (Topic 820): Disclosure Framework - Changes to the Disclosure Requirements for Fair Value Measurement”, which removes, modifies, and adds certain fair value disclosure requirements. The amendments are effective for fiscal years, and interim periods within those fiscal years, beginning after December 15, 2019. At this time, the Trust’s management is evaluating the impact this pronouncement may have on the Trust’s financial statements, if any.
Investments are valued at fair value pursuant to valuation procedures approved by the Trust’s Board of Trustees (the “Board”). The valuation procedures assign to SFIMC the responsibility for determining fair value using the processes and factors as outlined in the valuation procedures. If SFIMC cannot determine fair value based on the valuation procedures, the Board or the Executive Committee of the Board will determine fair value.
Fair value is defined as the price that the Funds would receive to sell an asset or pay to transfer a liability in an orderly transaction between market participants at the measurement date. A three-tier hierarchy is used to classify fair value measurements for disclosure purposes. The three-tier hierarchy of inputs is summarized in three broad levels as follows:
| | • | | Level 1 - Unadjusted quoted prices in active markets that are accessible to the Funds for identical assets or liabilities. |
| | • | | Level 2 - Inputs other than quoted prices included within Level 1 that are observable for the asset or liability, either directly or indirectly. These inputs may include quoted prices for the identical instrument on an inactive market, quoted prices for similar instruments in active markets, interest rates, yield curves and credit spreads. For assets or liabilities with a specified (contractual) term, a Level 2 input must be observable for substantially the full term of the asset or liability. |
| | • | | Level 3 - Unobservable inputs for the asset or liability to the extent that relevant observable inputs are not available. These inputs, based on the best information available in the circumstances, would include reasonably available information about the assumptions that a market participant would use in valuing the asset or liability and might include SFIMC’s own data. |
To the extent that valuation is based on models or inputs that are less observable or unobservable in the market, the determination of fair value requires more judgment. Accordingly, the degree of judgment exercised in determining fair value is greatest for instruments categorized in Level 3.
63
STATE FARM ASSOCIATES’ FUNDS TRUST
NOTES TO FINANCIAL STATEMENTS (continued)
The inputs used to measure the fair value of an asset or liability might be categorized within different levels of the fair value hierarchy. In those cases, the fair value measurement is categorized in its entirety in the same level of the fair value hierarchy as the lowest level input that is significant to the entire measurement. Changes in valuation techniques may result in transfers into or out of an assigned level within the fair value hierarchy. The end of the reporting period method is used for determining when transfers between levels of the fair value hierarchy are deemed to have occurred.
Stocks,closed-end registered investment companies and exchange-traded funds (“ETFs”) traded on securities exchanges, or in anover-the-counter (“OTC”) market in which transaction prices are reported, are valued at the last sales price on the day of valuation or, if there are no reported sales on that day, at the last reported bid price for the day. Stocks traded on NASDAQ are valued at the NASDAQ Official Closing Price. Long-term debt securities, U.S. Treasury bills, and short-term municipal variable rate demand notes are generally valued using quotations provided by an independent pricing service. Short-term debt securities with remaining maturities of 60 days or less (other than U.S. Treasury bills) are generally valued on an amortized cost basis, which approximates market value. Investments inopen-end investment companies are valued each day based on the closing net asset value of the respective fund.
Portfolio securities that are primarily traded on foreign securities exchanges (“foreign securities”) are valued at the closing values of such securities on the respective exchange where each security is primarily traded. SFIMC may determine that a market quotation for a foreign security held by a Fund is not reliable because of events or circumstances that have occurred between the time of the market quotation and the time the net asset value of the Fund is calculated (“subsequent event”). A subsequent event might include company-specific developments, a development that might affect an entire market or region, a potential global development or a significant change in one or more U.S. securities indexes. If SFIMC determines that the market quotation for a foreign security is not reliable, SFIMC may determine the foreign security’s value in SFIMC’s reasonable judgment.
For securities other than foreign securities, for which market prices are not readily available or are considered unreliable, SFIMC is required to obtain bid price quotations from brokers or dealers in the securities. If SFIMC cannot obtain a quotation for the security or if SFIMC believes the quotation does not represent the security’s fair value, then SFIMC will determine the security’s value in SFIMC’s reasonable judgment.
In determining a value based on reasonable judgment, SFIMC may use different methodologies, including multiple of earnings, multiple of book value, discount from market of a similar freely traded security or, for debt securities, yield to maturity. Other factors SFIMC may consider in determining value for a security include, but are not limited to, fundamental analytical data relating to the security, the nature and duration of any restrictions on disposition of the security, the last traded price of the security, significant global or regional events such as political unrest, natural disasters, and war, and significant movements in major market indices, ETFs, index futures or other financial instruments in the U.S. or other markets. All securities valued based on SFIMC’s reasonable judgment are subsequently reported to the Board on a quarterly basis.
SFIMC reviews the pricing methodologies of the Funds’ approved pricing vendors, including understanding a vendor’s key inputs and assumptions in valuing securities. SFIMC also engages in transaction back-testing with respect to portfolio securities sold by the Funds to compare unrealized gains and losses to realized gains and losses.
64
STATE FARM ASSOCIATES’ FUNDS TRUST
NOTES TO FINANCIAL STATEMENTS (continued)
The inputs or methodology used for valuing securities are not necessarily an indication of the risk associated with investing in those securities. The following is a summary of the Fund’s fair value measurements as of the end of the reporting period:
| | | | | | | | | | | | | | | | |
| | | | | |
| | | | | | Investments in Securities | | | | | |
| | | | | | |
Fund | | Level 1 | | | Level 2 | | | Level 3 | | | Total | | |
Growth Fund | | | | | | | | | | | | | | | | |
| | | | | | |
Common Stocks (a) | | $ | 4,901,713,404 | | | $ | — | | | $ | — | | | $4,901,713,404 | | |
| | | | | | |
Short-term Investments | | | 72,497,148 | | | | — | | | | — | | | 72,497,148 | | |
Balanced Fund | | | | | | | | | | | | | | | | |
| | | | | | |
Common Stocks (a) | | | 1,266,920,127 | | | | — | | | | — | | | 1,266,920,127 | | |
| | | | | | |
Corporate Bonds (a) | | | — | | | | 365,856,489 | | | | — | | | 365,856,489 | | |
| | | | | | |
Foreign Government Bonds | | | — | | | | 1,890,987 | | | | — | | | 1,890,987 | | |
| | | | | | |
Agency Commercial Mortgage-Backed Securities | | | — | | | | 89,655,380 | | | | — | | | 89,655,380 | | |
| | | | | | |
Agency Notes & Bonds | | | — | | | | 2,040,256 | | | | — | | | 2,040,256 | | |
| | | | | | |
U.S. Treasury Obligations | | | — | | | | 173,286,540 | | | | — | | | 173,286,540 | | |
| | | | | | |
Short-term Investments | | | 32,795,506 | | | | — | | | | — | | | 32,795,506 | | |
Interim Fund | | | | | | | | | | | | | | | | |
| | | | | | |
U.S. Treasury Obligations | | | — | | | | 331,678,194 | | | | — | | | 331,678,194 | | |
| | | | | | |
Short-term Investments | | | 7,203,035 | | | | — | | | | — | | | 7,203,035 | | |
| | | | | | |
Municipal Bond Fund | | | | | | | | | | | | | | | | |
| | | | | | |
Long-term Municipal Bonds | | | — | | | | 667,132,119 | | | | — | | | 667,132,119 | | |
| | | | | | |
Short-term Municipal Variable Rate Demand Notes | | | — | | | | 5,500,000 | | | | — | | | 5,500,000 | | |
| | | | | | |
Short-term Investments | | | 1,469,032 | | | | — | | | | — | | | 1,469,032 | | |
| | | | |
(a) Industry classification is disclosed in the Schedules of Investments. | | | | | | | | | |
The Funds did not hold any Level 3 securities or derivative instruments as of November 30, 2017 or for the year ended November 30, 2018. There were no transfers of securities between Level 1 and Level 2 as of November 30, 2018 as compared to November 30, 2017.
| 4. | Income Taxes and Distributions to Shareholders |
As of November 30, 2018, the Trust’s management completed a review of uncertain tax positions taken by the Funds, if any, and determined that no tax liability was required for unrecognized tax benefits, and no additional disclosures were needed. Generally, the tax authorities can initiate examinations of tax returns within the three year period beginning on the date such returns are filed. As a result, some tax returns are still open and subject to examination. In addition, as of November 30, 2018, management is not aware of any tax positions for which it is reasonably possible that the total amounts of unrecognized tax benefits will significantly change in the next twelve months.
As of November 30, 2018, each Fund’s aggregate unrealized gains and losses for all investments based on cost for federal income tax purposes were as follows:
| | | | | | | | | | | | | | | | |
Fund | | Cost of
Investments
for Federal
Tax Purposes | | | Gross
Unrealized
Appreciation | | | Gross
Unrealized
(Depreciation) | | | Net
Unrealized
Appreciation
(Depreciation) | |
Growth Fund | | $ | 1,679,284,183 | | | $ | 3,380,526,735 | | | $ | (85,600,366 | ) | | $ | 3,294,926,369 | |
Balanced Fund | | | 1,125,324,880 | | | | 852,105,710 | | | | (44,985,305 | ) | | | 807,120,405 | |
Interim Fund | | | 346,959,846 | | | | 24,578 | | | | (8,103,195 | ) | | | (8,078,617 | ) |
Municipal Bond Fund | | | 671,982,116 | | | | 8,144,518 | | | | (6,025,483 | ) | | | 2,119,035 | |
| |
| For each Fund, the cost of investments for federal income tax purposes was the same as the cost of investments reflected on the Statemens of Assets and Liabilities and Schedules of Investments. | |
65
STATE FARM ASSOCIATES’ FUNDS TRUST
NOTES TO FINANCIAL STATEMENTS (continued)
The Growth Fund and Balanced Fund declare and pay income dividends, if any, at least annually. The Interim Fund and Municipal Bond Fund declare dividends daily equal to each Fund’s respective net investment income, and distributions of such amounts are made on the last business day of each month.
Net realized gains on sales of investments, if any, are distributed annually after the close of the Fund’s fiscal year. Dividends and distributions payable to shareholders are recorded by the respective Fund on theex-dividend date.
On December 21, 2018, the Growth Fund declared an ordinary income dividend of $1.00717 per share and a capital gain dividend of $1.02980 per share to shareholders of record on December 20, 2018 (reinvestment date December 21, 2018).
On December 21, 2018, the Balanced Fund declared an ordinary income dividend of $0.88952 per share and a capital gain dividend of $0.49293 per share to shareholders of record on December 20, 2018 (reinvestment date December 21, 2018).
On December 21, 2018, the Municipal Bond Fund declared a capital gain dividend of $0.00256 per share to shareholders of record on December 20, 2018 (reinvestment date December 21, 2018).
After utilizing capital loss carryforwards to offset realized capital gains during the year ended November 30, 2018, the following Funds had unused capital loss carryforwards available for federal income tax purposes to be applied against future capital gains realized after November 30, 2018, if any. Future capital loss carryforward utilization in any given year may be subject to Internal Revenue Code limitations. If not applied, the capital losses will carryforward indefinitely as follows:
| | | | | | | | | | | | | | | | |
| | | | | | Unused Non Expiring Capital Loss Carryforwards | |
Fund | | Loss Carryforwards Utilized in 2018 | | | Short-term | | | Long-term | | | Total | |
Interim Fund | | $ | — | | | $ | — | | | $ | 346,915 | | | $ | 346,915 | |
As of November 30, 2018, in accordance with federal tax regulations, the components of distributable earnings on a tax basis were as follows:
| | | | | | | | | | | | | | | | | | | | |
| | | Undistributed | | | Undistributed | | | Unrealized | | | Accumulated | | | | |
Fund | | Ordinary
Income | | | Long-term
Gain | | | Appreciation
(Depreciation) | | | Capital and
Other Losses | | | Total | |
Growth Fund | | $ | 56,956,284 | | | $ | 63,216,446 | | | $ | 3,294,920,752 | | | $ | — | | | $ | 3,415,093,482 | |
Balanced Fund | | | 22,345,713 | | | | 13,866,844 | | | | 807,119,233 | | | | — | | | | 843,331,790 | |
Interim Fund | | | — | | | | — | | | | (8,078,617 | ) | | | (346,915 | ) | | | (8,425,532 | ) |
Municipal Bond Fund | | | — | | | | 204,284 | | | | 2,119,035 | | | | — | | | | 2,323,319 | |
The timing and characterization of certain income and capital gain distributions are determined annually in accordance with federal income tax regulations, which may differ from GAAP. These differences are primarily due to the recognition of net realized losses, the timing of Fund distributions, and foreign currency transactions. As a result, net investment income and net realized gain or loss on investment transactions for a reporting period may differ from distributions during such period. Accordingly, each Fund may periodically make reclassifications for permanent differences among certain capital accounts without impacting its net asset value.
As of November 30, 2018, these reclassifications were as follows:
| | | | | | | | | | | | |
Fund | | Paid in
Capital | | | Accumulated
Net Realized
Gain (Loss) (a) | | | Accumulated
Undistributed
Net Investment
Income (Loss) (a) | |
Growth Fund | | $ | — | | | $ | (69,190 | ) | | $ | 69,190 | |
Balanced Fund | | | — | | | | (13,408 | ) | | | 13,408 | |
| | | | | | | | | | | | | |
(a) These components are each included as part of total distributable earnings (loss) within the Statements of Assets and Liabilities. | |
66
STATE FARM ASSOCIATES’ FUNDS TRUST
NOTES TO FINANCIAL STATEMENTS (continued)
The tax character of distributions was designated as follows for the years ended November 30, 2018 and November 30, 2017.
| | | | | | | | | | | | | | | | |
2018 | | Tax-Exempt
Income | | | Ordinary
Income | | | Long-term
Capital Gain | | | Total | |
Growth Fund | | $ | — | | | $ | 117,372,975 | | | $ | 54,548,559 | | | $ | 171,921,534 | |
Balanced Fund | | | — | | | | 47,630,449 | | | | 8,728,691 | | | | 56,359,140 | |
Interim Fund | | | — | | | | 4,950,412 | | | | — | | | | 4,950,412 | |
Municipal Bond Fund | | | 20,076,742 | | | | 88,372 | | | | 352,930 | | | | 20,518,044 | |
| | | | | | | | | | | | | | | | |
2017 | | Tax-Exempt
Income | | | Ordinary
Income | | | Long-term
Capital Gain | | | Total | |
Municipal Bond Fund | | $ | 20,900,123 | | | $ | 150,118 | | | $ | — | | | $ | 21,050,241 | |
For the remaining Funds, the tax distributions of ordinary income and long-term capital gains were the same as the distributions from net investment income and capital gains reflected in the Statements of Changes in Net Assets for the year ended November 30, 2017.
| 5. | Transactions with Affiliates |
The Trust has entered into an investment advisory and management services agreement with SFIMC pursuant to which each Fund pays SFIMC an annual fee (computed on a daily basis and paid monthly) at the following annual rates:
| | |
| Growth Fund | | 0.20% of the first $100 million of average net assets |
| | | 0.15% of the next $100 million of average net assets |
| | | 0.10% of the average net assets in excess of $200 million |
| | |
| Balanced Fund | | 0.20% of the first $100 million of average net assets |
| | | 0.15% of the next $100 million of average net assets |
| | | 0.10% of the average net assets in excess of $200 million |
| | |
| Interim Fund | | 0.20% of the first $50 million of average net assets |
| | | 0.15% of the next $50 million of average net assets |
| | | 0.10% of the average net assets in excess of $100 million |
| | |
| Municipal Bond Fund | | 0.20% of the first $50 million of average net assets |
| | | 0.15% of the next $50 million of average net assets |
| | | 0.10% of the average net assets in excess of $100 million |
Other than the account fee imposed on certain shareholders of the Trust which is paid by redeeming shares from the shareholder’s account, the Funds do not pay any direct or indirect discount, commission or other compensation for transfer agent services provided by SFIMC or for distribution and underwriting services provided by State Farm VP Management Corp.
Certain officers and/or trustees of the Trust are also officers and/or directors of SFIMC. The Trust made no payments to its officers or trustees except for trustees’ fees paid to or accrued for the Trust’s independent trustees.
Expense Reduction Agreement
SFIMC has agreed to reimburse a Fund if, and to the extent, a Fund’s total annual operating expenses (excluding taxes, interest, extraordinary litigation expenses, brokerage commissions and other portfolio transaction costs) exceed 0.40% of the Fund’s average net assets. Prior-year reimbursements, if any, are not subject to recapture.
Line of Credit
State Farm Mutual Automobile Insurance Company (“Auto Company”), the parent company of SFIMC, has entered into a Line of Credit Agreement with the Trust. Under that agreement, a Fund may request and Auto Company, in its complete discretion, may lend money to a Fund for up to 30 days on an unsecured basis. Auto Company will not lend more than $50 million at any one time to the Funds and to the other mutual funds advised by SFIMC. Under the agreement, a Fund will pay interest to Auto Company on any outstanding loan at a benchmark interest rate that approximates the rate that creditworthy corporate issuers pay on short-term commercial paper. The Funds did not borrow under the Line of Credit Agreement during the year ended November 30, 2018.
67
STATE FARM ASSOCIATES’ FUNDS TRUST
NOTES TO FINANCIAL STATEMENTS (continued)
| 6. | Investment Transactions |
For the year ended November 30, 2018, investment transactions (exclusive of short-term instruments) were as follows:
| | | | | | | | | | | | | | | | |
Fund | | Purchases
(excluding U.S.
Government
Obligations) | | | Sales/Maturities
(excluding U.S.
Government
Obligations) | | | Purchases of U.S.
Government
Obligations | | | Sales/Maturities of U.S.
Government
Obligations | |
Growth Fund | | $ | 6,667,889 | | | $ | 107,087,887 | | | $ | — | | | $ | — | |
Balanced Fund | | | 74,305,041 | | | | 102,022,196 | | | | 29,638,867 | | | | 25,000,000 | |
Interim Fund | | | — | | | | — | | | | 54,041,348 | | | | 70,550,325 | |
Municipal Bond Fund | | | 78,130,531 | | | | 78,254,281 | | | | — | | | | — | |
68
FINANCIAL HIGHLIGHTS
The financial highlights table is intended to help you understand the financial performance of each Fund for the past five years. Certain information reflects financial results for a single Fund share. The total returns within each table represent the rate that an investor would have earned (or lost) on an investment in the Fund (assuming reinvestment of all dividends and distributions).
STATE FARM ASSOCIATES’ FUNDS TRUST GROWTH FUND
(For a share outstanding throughout each period)
| | | | | | | | | | | | | | | | | | | | |
| | | Year ended November 30, | |
| | | 2018 | | | 2017 | | | 2016 | | | 2015 | | | 2014 | |
Net asset value, beginning of period | | $ | 80.41 | | | | 70.41 | | | | 73.38 | | | | 76.68 | | | | 67.42 | |
Income from Investment Operations | | | | | | | | | | | | | | | | | | | | |
Net investment income (a) | | | 1.93 | | | | 1.84 | | | | 1.75 | | | | 1.79 | | | | 1.60 | |
Net gain (loss) on investments (both realized and unrealized) | | | 1.51 | | | | 10.50 | | | | 4.15 | | | | (3.38 | ) | | | 9.21 | |
| | | | | | | | | | | | | | | | | | | | |
Total from investment operations | | | 3.44 | | | | 12.34 | | | | 5.90 | | | | (1.59 | ) | | | 10.81 | |
| | | | | | | | | | | | | | | | | | | | |
Less Distributions | | | | | | | | | | | | | | | | | | | | |
Net investment income | | | (1.90 | ) | | | (1.78 | ) | | | (1.76 | ) | | | (1.71 | ) | | | (1.55 | ) |
Net realized gain | | | (0.89 | ) | | | (0.56 | ) | | | (7.11 | ) | | | — | | | | — | |
| | | | | | | | | | | | | | | | | | | | |
Total distributions | | | (2.79 | ) | | | (2.34 | ) | | | (8.87 | ) | | | (1.71 | ) | | | (1.55 | ) |
| | | | | | | | | | | | | | | | | | | | |
Net asset value, end of period | | $ | 81.06 | | | | 80.41 | | | | 70.41 | | | | 73.38 | | | | 76.68 | |
| | | | | | | | | | | | | | | | | | | | |
Total Return | | | 4.41 | % | | | 17.91 | % | | | 9.54 | % | | | (2.13 | )% | | | 16.26 | % |
Ratios/Supplemental Data | | | | | | | | | | | | | | | | | | | | |
Net assets, end of period (millions) | | $ | 4,992.6 | | | | 4,960.5 | | | | 4,296.6 | | | | 4,095.7 | | | | 4,283.5 | |
Average net asset ratios | | | | | | | | | | | | | | | | | | | | |
Expenses | | | 0.12 | % | | | 0.12 | % | | | 0.12 | % | | | 0.12 | % | | | 0.12 | % |
Net investment income | | | 2.42 | % | | | 2.46 | % | | | 2.59 | % | | | 2.40 | % | | | 2.25 | % |
Portfolio turnover rate (b) | | | 0 | % | | | 1 | % | | | 0 | % | | | 11 | % | | | 1 | % |
| (a) | Average shares outstanding for the period were used to calculate net investment income per share. |
| (b) | Portfolio turnover rate rounds to less than 1% for the year ended November 30, 2018. |
| | |
| See accompanying notes to financial statements. | | 69 |
STATE FARM ASSOCIATES’ FUNDS TRUST BALANCED FUND
(For a share outstanding throughout each period)
| | | | | | | | | | | | | | | | | | | | |
| | | Year ended November 30, | |
| | | 2018 | | | 2017 | | | 2016 | | | 2015 | | | 2014 | |
Net asset value, beginning of period | | $ | 68.84 | | | | 63.19 | | | | 66.38 | | | | 68.23 | | | | 62.01 | |
Income from Investment Operations | | | | | | | | | | | | | | | | | | | | |
Net investment income (a) | | | 1.70 | | | | 1.65 | | | | 1.63 | | | | 1.73 | | | | 1.72 | |
Net gain (loss) on investments (both realized and unrealized) | | | (0.03 | ) | | | 5.75 | | | | 1.76 | | | | (1.85 | ) | | | 6.17 | |
| | | | | | | | | | | | | | | | | | | | |
Total from investment operations | | | 1.67 | | | | 7.40 | | | | 3.39 | | | | (0.12 | ) | | | 7.89 | |
| | | | | | | | | | | | | | | | | | | | |
Less Distributions | | | | | | | | | | | | | | | | | | | | |
Net investment income | | | (1.68 | ) | | | (1.63 | ) | | | (1.69 | ) | | | (1.73 | ) | | | (1.67 | ) |
Net realized gain | | | (0.31 | ) | | | (0.12 | ) | | | (4.89 | ) | | | — | | | | — | |
| | | | | | | | | | | | | | | | | | | | |
Total distributions | | | (1.99 | ) | | | (1.75 | ) | | | (6.58 | ) | | | (1.73 | ) | | | (1.67 | ) |
| | | | | | | | | | | | | | | | | | | | |
Net asset value, end of period | | $ | 68.52 | | | | 68.84 | | | | 63.19 | | | | 66.38 | | | | 68.23 | |
| | | | | | | | | | | | | | | | | | | | |
Total Return | | | 2.49 | % | | | 11.93 | % | | | 5.83 | % | | | (0.18 | )% | | | 12.95 | % |
Ratios/Supplemental Data | | | | | | | | | | | | | | | | | | | | |
Net assets, end of period (millions) | | $ | 1,935.4 | | | | 1,951.1 | | | | 1,766.3 | | | | 1,689.0 | | | | 1,709.2 | |
Average net asset ratios | | | | | | | | | | | | | | | | | | | | |
Expenses | | | 0.13 | % | | | 0.13 | % | | | 0.13 | % | | | 0.13 | % | | | 0.13 | % |
Net investment income | | | 2.50 | % | | | 2.52 | % | | | 2.63 | % | | | 2.58 | % | | | 2.66 | % |
Portfolio turnover rate | | | 5 | % | | | 4 | % | | | 4 | % | | | 11 | % | | | 4 | % |
| (a) | Average shares outstanding for the period were used to calculate net investment income per share. |
| | |
| 70 | | See accompanying notes to financial statements. |
STATE FARM ASSOCIATES’ FUNDS TRUST INTERIM FUND
(For a share outstanding throughout each period)
| | | | | | | | | | | | | | | | | | | | |
| | | Year ended November 30, | |
| | | 2018 | | | 2017 | | | 2016 | | | 2015 | | | 2014 | |
Net asset value, beginning of period | | $ | 9.87 | | | | 9.92 | | | | 9.99 | | | | 10.03 | | | | 10.06 | |
Income from Investment Operations | | | | | | | | | | | | | | | | | | | | |
Net investment income | | | 0.14 | | | | 0.12 | | | | 0.12 | | | | 0.12 | | | | 0.13 | |
Net gain (loss) on investments (both realized and unrealized) | | | (0.11 | ) | | | (0.05 | ) | | | (0.07 | ) | | | (0.04 | ) | | | (0.03 | ) |
| | | | | | | | | | | | | | | | | | | | |
Total from investment operations | | | 0.03 | | | | 0.07 | | | | 0.05 | | | | 0.08 | | | | 0.10 | |
| | | | | | | | | | | | | | | | | | | | |
Less Distributions | | | | | | | | | | | | | | | | | | | | |
Net investment income | | | (0.14 | ) | | | (0.12 | ) | | | (0.12 | ) | | | (0.12 | ) | | | (0.13 | ) |
Net realized gain | | | — | | | | — | | | | — | | | | — | | | | — | |
| | | | | | | | | | | | | | | | | | | | |
Total distributions | | | (0.14 | ) | | | (0.12 | ) | | | (0.12 | ) | | | (0.12 | ) | | | (0.13 | ) |
| | | | | | | | | | | | | | | | | | | | |
Net asset value, end of period | | $ | 9.76 | | | | 9.87 | | | | 9.92 | | | | 9.99 | | | | 10.03 | |
| | | | | | | | | | | | | | | | | | | | |
Total Return | | | 0.33 | % | | | 0.71 | % | | | 0.45 | % | | | 0.77 | % | | | 1.01 | % |
Ratios/Supplemental Data | | | | | | | | | | | | | | | | | | | | |
Net assets, end of period (millions) | | $ | 337.9 | | | | 360.4 | | | | 396.3 | | | | 363.9 | | | | 366.5 | |
Average net asset ratios | | | | | | | | | | | | | | | | | | | | |
Expenses | | | 0.17 | % | | | 0.16 | % | | | 0.16 | % | | | 0.16 | % | | | 0.16 | % |
Net investment income | | | 1.45 | % | | | 1.21 | % | | | 1.15 | % | | | 1.17 | % | | | 1.31 | % |
Portfolio turnover rate | | | 16 | % | | | 13 | % | | | 13 | % | | | 12 | % | | | 7 | % |
| | |
| See accompanying notes to financial statements. | | 71 |
STATE FARM ASSOCIATES’ FUNDS TRUST MUNICIPAL BOND FUND
(For a share outstanding throughout each period)
| | | | | | | | | | | | | | | | | | | | |
| | | Year ended November 30, | |
| | | 2018 | | | 2017 | | | 2016 | | | 2015 | | | 2014 | |
Net asset value, beginning of period | | $ | 8.61 | | | | 8.53 | | | | 8.80 | | | | 8.85 | | | | 8.62 | |
Income from Investment Operations | | | | | | | | | | | | | | | | | | | | |
Net investment income | | | 0.25 | | | | 0.26 | | | | 0.26 | | | | 0.28 | | | | 0.30 | |
Net gain (loss) on investments (both realized and unrealized) | | | (0.17 | ) | | | 0.08 | | | | (0.27 | ) | | | (0.05 | ) | | | 0.24 | |
| | | | | | | | | | | | | | | | | | | | |
Total from investment operations | | | 0.08 | | | | 0.34 | | | | (0.01 | ) | | | 0.23 | | | | 0.54 | |
| | | | | | | | | | | | | | | | | | | | |
Less Distributions | | | | | | | | | | | | | | | | | | | | |
Net investment income | | | (0.25 | ) | | | (0.26 | ) | | | (0.26 | ) | | | (0.28 | ) | | | (0.30 | ) |
Net realized gain (a) | | | 0.00 | | | | — | | | | — | | | | — | | | | (0.01 | ) |
| | | | | | | | | | | | | | | | | | | | |
Total distributions | | | (0.25 | ) | | | (0.26 | ) | | | (0.26 | ) | | | (0.28 | ) | | | (0.31 | ) |
| | | | | | | | | | | | | | | | | | | | |
Net asset value, end of period | | $ | 8.44 | | | | 8.61 | | | | 8.53 | | | | 8.80 | | | | 8.85 | |
| | | | | | | | | | | | | | | | | | | | |
Total Return | | | 0.99 | % | | | 3.99 | % | | | (0.16 | )% | | | 2.65 | % | | | 6.37 | % |
Ratios/Supplemental Data | | | | | | | | | | | | | | | | | | | | |
Net assets, end of period (millions) | | $ | 675.4 | | | | 698.6 | | | | 704.1 | | | | 677.3 | | | | 658.7 | |
Average net asset ratios | | | | | | | | | | | | | | | | | | | | |
Expenses | | | 0.16 | % | | | 0.15 | % | | | 0.16 | % | | | 0.16 | % | | | 0.15 | % |
Net investment income | | | 2.93 | % | | | 2.98 | % | | | 2.95 | % | | | 3.19 | % | | | 3.46 | % |
Portfolio turnover rate | | | 12 | % | | | 9 | % | | | 7 | % | | | 10 | % | | | 6 | % |
| (a) | Net realized gain distributions represent less than $0.01 per share for the year ended November 30, 2018. |
| | |
| 72 | | See accompanying notes to financial statements. |
REPORT OF INDEPENDENT REGISTERED PUBLIC ACCOUNTING FIRM
To the Board of Trustees of the State Farm Associates’ Funds Trust and Shareholders of the State Farm Growth Fund, State Farm Balanced Fund, State Farm Interim Fund and State Farm Municipal Bond Fund:
Opinions on the Financial Statements
We have audited the accompanying statements of assets and liabilities, including the schedules of investments, of State Farm Growth Fund, State Farm Balanced Fund, State Farm Interim Fund and State Farm Municipal Bond Fund (constituting State Farm Associates’ Funds Trust, hereafter collectively referred to as the “Funds”) as of November 30, 2018, the related statements of operations for the year ended November 30, 2018, the statements of changes in net assets for each of the two years in the period ended November 30, 2018, including the related notes, and the financial highlights for each of the five years in the period ended November 30, 2018 (collectively referred to as the “financial statements”). In our opinion, the financial statements present fairly, in all material respects, the financial position of each of the Funds as of November 30, 2018, the results of each of their operations for the year then ended, the changes in each of their net assets for each of the two years in the period ended November 30, 2018, and each of the financial highlights for each of the five years in the period ended November 30, 2018 in conformity with accounting principles generally accepted in the United States of America.
Basis for Opinions
These financial statements are the responsibility of the Funds’ management. Our responsibility is to express an opinion on the Funds’ financial statements based on our audits. We are a public accounting firm registered with the Public Company Accounting Oversight Board (United States) (PCAOB) and are required to be independent with respect to the Funds in accordance with the U.S. federal securities laws and the applicable rules and regulations of the Securities and Exchange Commission and the PCAOB.
We conducted our audits of these financial statements in accordance with the standards of the PCAOB. Those standards require that we plan and perform the audit to obtain reasonable assurance about whether the financial statements are free of material misstatement, whether due to error or fraud.
Our audits included performing procedures to assess the risks of material misstatement of the financial statements, whether due to error or fraud, and performing procedures that respond to those risks. Such procedures included examining, on a test basis, evidence regarding the amounts and disclosures in the financial statements. Our audits also included evaluating the accounting principles used and significant estimates made by management, as well as evaluating the overall presentation of the financial statements. Our procedures included confirmation of securities owned as of November 30, 2018 by correspondence with the custodian, transfer agent and brokers. We believe that our audits provide a reasonable basis for our opinions.
PricewaterhouseCoopers LLP
Chicago, Illinois
January 28, 2019
We have served as the auditor of one or more investment companies in State Farm Associates’ Funds Trust since 2011.
73
FEDERAL INCOME TAX INFORMATION (unaudited)
The following information is provided as required by the Internal Revenue Code for dividends paid by each Fund during the year ended November 30, 2018.
| | | | | | | | | | | | | | | | |
Fund | | Total
Capital Gain
Distributed | | | Total Qualified
Dividend Income
Distributed | | | Total Distributions
Qualifying for the
Dividends- Received
Deduction | | | Total
Exempt
Interest Distributed | |
Growth | | $ | 54,548,559 | | | $ | 117,372,975 | | | $ | 105,624,523 | | | $ | — | |
Balanced | | | 8,728,691 | | | | 30,910,574 | | | | 25,796,253 | | | | — | |
Interim | | | — | | | | — | | | | — | | | | — | |
Municipal Bond | | | 352,930 | | | | — | | | | — | | | | 20,076,742 | |
Shareholders are advised to consult their own tax advisor with respect to the tax consequences of their investment in the Funds. Individual shareholders should refer to their Form 1099 to determine the amounts to be included on their federal income tax return.
74
Management Information – State Farm Associates’ Funds Trust, November 30, 2018 (unaudited)
I. Information aboutNon-Interested (Independent) Trustees of State Farm Associates’ Funds Trust
| | | | | | | | | | |
Name, Address, and Age | | Position Held with Fund | | Length of Time Served and Term of Office | | Principal Occupation(s) During the Past 5 years | | Number of
Portfolios
in Fund
Complex
Overseen
by Trustee | | Other Directorships Held by Trustee |
| | | | | |
Thomas M. Mengler One State Farm Plaza Bloomington, Illinois 61710 Age 65 | | Trustee | | Began service in 1998 to the predecessor of the Trust and serves until successor is elected or appointed. | | PRESIDENT – St. Mary’s University; TRUSTEE – State Farm Variable Product Trust, State Farm Mutual Fund Trust. | | 4 | | None |
| | | | | |
Victor J. Boschini One State Farm Plaza Bloomington, Illinois 61710 Age 62 | | Trustee | | Began service in 2001 and serves until successor is elected or appointed. | | CHANCELLOR – Texas Christian University; TRUSTEE – State Farm Variable Product Trust, State Farm Mutual Fund Trust. | | 4 | | None |
| | | | | |
David L. Vance One State Farm Plaza Bloomington, Illinois 61710 Age 66 | | Trustee | | Began service in 2001 and serves until successor is elected or appointed. | | EXECUTIVE DIRECTOR – Center for Talent Reporting, Inc. (nonprofit dedicated to improving the management of human capital); PRESIDENT/OWNER – Poudre River Press LLC (book publisher); CONSULTANT/PRESIDENT/OWNER – Manage Learning LLC (consults with organizations on learning strategy, governance, measurement and evaluation); ADJUNCT FACULTY – Bellevue University and University of Southern Miississippi; TRUSTEE – State Farm Variable Product Trust, State Farm Mutual Fund Trust. | | 4 | | None |
| | | | | |
Alan R. Latshaw One State Farm Plaza Bloomington, Illinois 61710 Age 67 | | Trustee | | Began service in 2005 and serves until successor is elected or appointed. | | RETIRED; TRUSTEE – State Farm Variable Product Trust, State Farm Mutual Fund Trust. | | 4 | | TRUSTEE – MainStay Funds (88 portfolios) |
| | | | | |
Anita M. Nagler One State Farm Plaza Bloomington, Illinois 61710 Age 62 | | Trustee | | Began service in 2006 and serves until successor is elected or appointed. | | DIRECTOR – Baron Capital Group, Inc. (investment adviser and distributor of mutual funds); PRIVATE INVESTOR; TRUSTEE – State Farm Variable Product Trust, State Farm Mutual Fund Trust. | | 4 | | None |
75
Management Information – State Farm Associates’ Funds Trust, November 30, 2018 (unaudited)
II. Information about Interested Trustees/Officers of State Farm Associates’ Funds Trust
| | | | | | | | | | |
Name, Address, and Age | | Position(s)
Held with
Fund | | Length of Time Served and Term of Office | | Principal Occupation(s) During the Past 5 years | | Number of
Portfolios
in Fund
Complex
Overseen
by Trustee | | Other
Directorships
Held by
Trustee |
| | | | | |
Joe R.Monk,Jr.* One State Farm Plaza Bloomington, Illinois 61710 Age 55 | | Trustee,
President
and
Chairperson
of the
Board | | Began service as Trustee in 2015 and serves until successor is elected or appointed. Began service as President and Chairperson of the Board in 2015 and serves until removed. | | SENIOR VICE PRESIDENT, FINANCIAL SERVICES – State Farm Mutual Automobile Insurance Company; PRESIDENT AND CHIEF EXECUTIVE OFFICER – State Farm Bank, F.S.B., Bloomington, Illinois; DIRECTOR and SENIOR VICE PRESIDENT – State Farm Investment Management Corp., State Farm VP Management Corp.; TRUSTEE, PRESIDENT and CHAIRPERSON OF THE BOARD (since 6/2015) and SENIOR VICE PRESIDENT (3/2011 – 6/2015) – State Farm Mutual Fund Trust, State Farm Variable Product Trust. | | 4 | | None |
| | | | | |
Paul J. Smith* One State Farm Plaza Bloomington, Illinois 61710 Age 55 | | Trustee,
Senior
Vice
President,
and
Treasurer | | Began service as Trustee in 2015 and serves until successor is elected or appointed. Began service in June 2011 as Senior Vice President and in December 2012 as Treasurer and serves until removed. | | EXECUTIVE VICE PRESIDENT, PROPERTY AND CASUALTY – State Farm Mutual Automobile Insurance Company; DIRECTOR and SENIOR VICE PRESIDENT — State Farm Investment Management Corp., State Farm VP Management Corp.; TRUSTEE (since 1/2015), SENIOR VICE PRESIDENT and TREASURER — State Farm Variable Product Trust, State Farm Mutual Fund Trust. | | 4 | | None |
| * | Messrs. Monk and Smith are “interested” Trustees as defined by the Investment Company Act of 1940 because of their respective positions with State Farm Associates’ Funds Trust, State Farm VP Management Corp., State Farm Investment Management Corp., and with the affiliates of these companies. |
76
Management Information – State Farm Associates’ Funds Trust, November 30, 2018 (unaudited)
III. Information about Officers of State Farm Associates’ Fund Trust
| | | | | | |
Name, Address, and Age | | Position(s)
Held with
Fund | | Length of Time Served and Term of Office | | Principal Occupation(s) During the Past 5 years |
| | | |
Paul N. Eckley One State Farm Plaza Bloomington, Illinois 61710 Age 64 | | Senior Vice
President | | Began service in 1999 to the predecessor of the Trust and serves until removed. | | SENIOR VICE PRESIDENT – INVESTMENTS – State Farm Mutual Automobile Insurance Company. |
| | | |
Joseph P. Young One State Farm Plaza Bloomington, Illinois 61710 Age 55 | | Vice
President | | Began service in December 2011 and serves until removed. | | VICE PRESIDENT – FIXED INCOME – State Farm Mutual Automobile Insurance Company; VICE PRESIDENT – State Farm Investment Management Corp.; VICE PRESIDENT – State Farm Variable Product Trust, State Farm Mutual Fund Trust. |
| | | |
Terrence M. Ludwig One State Farm Plaza Bloomington, Illinois 61710 Age 50 | | Chief
Compliance
Officer,
Assistant
Secretary-
Treasurer,
and Anti-
Money
Laundering
and Office
of Foreign
Assets
Control
Compliance
Officer | | Began service as Chief Compliance Officer and Assistant Secretary- Treasurer in 2/2018 and as Anti-Money Laundering and Office of Foreign Assets Control Compliance Officer in 3/2016, and serves until removed. | | CHIEF COMPLIANCE OFFICER (since 2/2018), ASSISTANT SECRETARY-TREASURER (since 2/2018), and ANTI- MONEY LAUNDERING AND OFFICE OF FOREIGN ASSETS CONTROL COMPLIANCE OFFICER (since 3/2016) – State Farm Mutual Fund Trust, State Farm Variable Product Trust; CHIEF COMPLIANCE OFFICER (since 2/2018), TREASURER (since 2/2018) and ANTI- MONEY LAUNDERING AND OFFICE OF FOREIGN ASSETS CONTROL COMPLIANCE OFFICER (since 3/2016) – State Farm Investment Management Corp.; CHIEF COMPLIANCE OFFICER, TREASURER (since 2/2018) and ANTI-MONEY LAUNDERING AND OFFICE OF FOREIGN ASSETS CONTROL COMPLIANCE OFFICER – State Farm VP Management Corp.; INVESTMENT PLANNING SERVICES DIRECTOR – State Farm Mutual Automobile Insurance Company. |
| | | |
Lisa Stewart One State Farm Plaza Bloomington, Illinois 61710 Age 49 | | Vice
President | | Began service in December 2015 and serves until removed. | | VICE PRESIDENT – LIFE/HEALTH and INVESTMENT PLANNING SERVICES (since 10/2015), VICE PRESIDENT – AGENCY (1/2014 – 10/2015), and VICE PRESIDENT AGENCY – CUSTOMER CARE CENTER (1/2013 – 1/2014) – State Farm Mutual Automobile Insurance Company; VICE PRESIDENT (since 12/2015) – State Farm Investment Management Corp., State Farm VP Management Corp.; VICE PRESIDENT (since 12/2015) – State Farm Variable Product Trust, State Farm Mutual Fund Trust. |
| | | |
Mark D. Mikel One State Farm Plaza Bloomington, Illinois 61710 Age 48 | | Vice
President
and
Secretary | | Began service in 2012 and serves until removed. | | ASSISTANT VICE PRESIDENT – INVESTMENT PLANNING SERVICES – State Farm Mutual Automobile Insurance Company; ASSISTANT VICE PRESIDENT – BANK OPERATIONS OFFICER (since 2/2018) – State Farm Bank, F.S.B., Bloomington, Illinois; VICE PRESIDENT – FINANCIAL AND SECRETARY – State Farm Investment Management Corp., State Farm VP Management Corp.; VICE PRESIDENT AND SECRETARY – State Farm Variable Product Trust, State Farm Mutual Fund Trust. |
The Trust’s Statement of Additional Information (“SAI”) includes additional information about the Trustees of the Trust, and the SAI is available without charge upon request. Call toll-free1-800-447-0740 to request a copy of the SAI.
77
As of the end of the period covered by this report, the registrant has adopted a code of ethics that applies to the registrants’ principal executive officer, principal financial officer, principal accounting officer or controller, or persons performing similar functions (each a “covered person”). During the period covered by this FormN-CSR, registrant did not make any amendment to any provisions of such code of ethics that applies to a covered person and that relates to any element of such code set forth in paragraph (b) of Item 2 of FormN-CSR, and registrant did not grant any waiver from such code of ethics provisions. Registrant hereby undertakes to provide a copy of such code of ethics to any person upon request, without charge. To request a copy of the code of ethics, contact the registrant at1-800-447-0740.
| ITEM 3. | AUDIT COMMITTEE FINANCIAL EXPERT. |
Registrant’s board of trustees has determined that Alan Latshaw and Anita Nagler, members of the registrant’s Audit Committee, each have all of the attributes to be deemed an “audit committee financial expert,” as such term is defined in paragraph (b) to Item 3 of FormN-CSR. Mr. Latshaw and Ms. Nagler are “independent” as such term is defined in paragraph (a)(2) of Item 3 of FormN-CSR.
As indicated in paragraph (d) to Item 3 of FormN-CSR, a person who is determined to be an audit committee financial expert will not be deemed an “expert” for any purpose, including without limitation for the purposes of Section 11 of the Securities Act of 1933, as a result of being designated or identified as an audit committee financial expert pursuant to this Item 3 of FormN-CSR. The designation or identification of a person as an audit committee financial expert pursuant to this Item 3 of FormN-CSR does not impose on such person any duties, obligations, or liability that are greater than the duties, obligations, and liability imposed on such person as a member of the Audit Committee and board of trustees in the absence of such designation or identification. The designation or identification of a person as an audit committee financial expert pursuant to this Item 3 of FormN-CSR does not affect the duties, obligations, or liability of any other member of the Audit Committee or board of trustees.
| ITEM 4. | PRINCIPAL ACCOUNTANT FEES AND SERVICES. |
| | | | | | | | |
| (a) | | Audit Fees | | | | | | |
| | Billed to registrant for fiscal year ending November 30, 2018: | | | $265,000 | | | |
| | Billed to registrant for fiscal year ending November 30, 2017: | | | $159,222 | | | |
The audit fees for November 30, 2018 are based on estimated amounts expected to be billed to registrant by the registrant’s independent registered public accountant and include an estimated amount from the registrant’s independent registered public accountant for theout-of-pocket expenses it expects to bill to registrant for that time period.
| | | | | | | | |
| | | |
| (b) | | Audit-Related Fees | | | | | | |
| | Billed to registrant in fiscal year ending November 30, 2018: | | | $0 | | | |
| | Billed to registrant in fiscal year ending November 30, 2017: | | | $0 | | | |
The nature of the services comprising the fees disclosed under this category: not applicable
Fees required to be approved pursuant to paragraph (c)(7)(ii) of Rule2-01 of Reg.S-X:
| | | | | | | | |
| | | Billed in fiscal year ending November 30, 2018: | | | $0 | | | |
| | Billed in fiscal year ending November 30, 2017: | | | $0 | | | |
The nature of the services comprising the fees disclosed under this category: not applicable
| | | | | | | | |
| | | |
| (c) | | Tax Fees | | | | | | |
| | Billed to registrant in fiscal year ending November 30, 2018: | | | $23,400 | | | |
| | Billed to registrant in fiscal year ending November 30, 2017: | | | $21,550 | | | |
The nature of the services comprising the fees disclosed under this category:
For each fiscal year, the nature of the services includes fees for reviewing the registrant’s compliance with tax qualification tests relating to asset diversification, gross income, and distribution requirements to maintain the registrant’s status as a Regulated Investment Company under current provisions of the Internal Revenue Code. For each fiscal year, the nature of the services also includes fees for reviewing the registrant’s tax returns (federal, state, and excise) and a review of income tax and excise tax positions, issues and tax accounting methods with respect to the registrant.
Fees required to be approved pursuant to paragraph (c)(7)(ii) of Rule2-01 of Reg.S-X:
| | | | | | | | |
| | | Billed in fiscal year ending November 30, 2018: | | | $0 | | | |
| | Billed in fiscal year ending November 30, 2017: | | | $0 | | | |
The nature of the services comprising the fees disclosed under this category: not applicable
| | | | | | | | |
| | | |
| (d) | | All Other Fees | | | | | | |
| | Billed to registrant in fiscal year ending November 30, 2018: | | | $0 | | | |
| | Billed to registrant in fiscal year ending November 30, 2017: | | | $0 | | | |
The nature of the services comprising the fees disclosed under this category include: not applicable
Fees required to be approved pursuant to paragraph (c)(7)(ii) of Rule2-01 of Reg.S-X:
| | | | | | | | |
| | | Billed in fiscal year ending November 30, 2018: | | | $0 | | | |
| | Billed in fiscal year ending November 30, 2017: | | | $0 | | | |
The nature of the services comprising the fees disclosed under this category: not applicable
| (e)(1) | The Audit Committee’spre-approval policies and procedures described in paragraph (c)(7) of Rule2-01 of RegulationS-X are as follows: |
The Audit Committee (the “Committee”) will approve and recommend to the Board, the selection, retention or termination of the independent registered public accountants of the Trust, and review the independent registered public accountant’s fees to determine whether those fees appear to be appropriate for the services rendered.
| | a. | Any engagement shall be pursuant to a written engagement letter approved by the Committee, which shall provide, among other things, that: |
| | - | the Committee shall be directly responsible for the appointment, compensation and oversight of the independent registered public accountants; and |
| | - | the independent registered public accountants shall report directly to the Committee. |
| | b. | Pre-approve any engagement of the independent registered public accountants to provide any services (other than the prohibitednon-audit services specified in section c. below) to the Trust, or to SFIMC [State Farm Investment Management Corp.] and any entity controlling, controlled by, or under common control with SFIMC that provides ongoing services to the Trust (if the engagement relates directly to the operations and financial reporting of the Trust), including the fees and other compensation to be paid to the independent registered public accountants. The Chairman of the Committee may grant suchpre-approval provided the amount in question does not exceed $10,000. Any such delegatedpre-approval shall be presented to the Committee by the Chairman at the next meeting of the Committee. |
| | (1) | Pre-approval ofnon-audit services for the Trust is waived, if: |
| | a. | the aggregate amount of allnon-audit services provided to the Trust is less than 5% of the total fees paid by the Trust to its independent registered public accountants during the fiscal year in which thenon-audit services are provided; |
| | b. | the services were not recognized by management at the time of the engagement asnon-audit services; and |
| | c. | such services are promptly brought to the attention of the Committee by management and the Committee approves them (which may be by delegation as provided for above) prior to the completion of the audit. |
| | (2) | Pre-approval ofnon-audit services for SFIMC or any entity controlling, controlled by, or under common control with SFIMC that provides ongoing services to the Trust is waived, if: |
| | a. | the aggregate amount of allnon-audit services provided is less than 5% of the total fees paid by the Trust, SFIMC and any entity controlling, controlled by, or under common control with SFIMC that provides ongoing services to the Trust to its independent registered public accountants during the fiscal year in which thenon-audit services are provided that would have to bepre-approved; |
| | b. | the services were not recognized by management at the time of the engagement asnon-audit services; and |
| | c. | such services are promptly brought to the attention of the Committee by management and the Committee approves them (which may be by delegation) prior to the completion of the audit. |
| | c. | The independent registered public accountants shall not perform any of the followingnon-audit services for the Trust: |
| | (1) | bookkeeping or other services related to the accounting records or financial statements of the Trust; |
| | (2) | financial information systems design and implementation; |
| | (3) | appraisal or valuation services, fairness opinions, orcontribution-in-kind reports; |
| | (5) | internal audit outsourcing services; |
| | (6) | management functions or human resources; |
| | (7) | broker or dealer, investment adviser, or investment banking services; |
| | (8) | legal services and expert services unrelated to the audit; and |
| | (9) | any other services that the Public Company Accounting Oversight Board determines are impermissible. |
| (e)(2) | The percentage of services described in each of paragraphs (b) through (d) of this Item that were rendered to the registrant and approved by the Committee pursuant to paragraph (c)(7)(i)(C) of Rule2-01 of RegulationS-X: |
| | | | | | |
| | Paragraph (b) | | Paragraph (c) | | Paragraph (d) |
| Fiscal year ending November 30, 2018: | | not applicable | | 0% | | not applicable |
| Fiscal year ending November 30, 2017: | | not applicable | | 0% | | not applicable |
The percentage of services described in each of paragraphs (b) through (d) of this Item that were approved by the Committee pursuant to paragraph (c)(7)(ii) of Rule2-01 of RegulationS-X:
| | | | | | |
| | | Paragraph (b) | | Paragraph (c) | | Paragraph (d) |
| Fiscal year ending November 30, 2018: | | not applicable | | not applicable | | not applicable |
| Fiscal year ending November 30, 2017: | | not applicable | | not applicable | | not applicable |
| (g) | Aggregatenon-audit fees billed by the registrant’s accountant for services rendered to registrant: |
Fiscal year ending November 30, 2018: $ 23,400
Fiscal year ending November 30, 2017: $ 21,550
Aggregatenon-audit fees billed by the registrant’s accountant for services rendered to registrant’s investment adviser (not including anysub-adviser whose role is primarily portfolio management and is subcontracted with or overseen by another investment adviser):
Fiscal year ending November 30, 2018: $ 0
Fiscal year ending November 30, 2017: $ 0
Aggregatenon-audit fees billed by the registrant’s accountant for services rendered to any entity controlling, controlled by, or under common control with the adviser that provides ongoing services to the registrant:
Fiscal year ending November 30, 2018: $ 150,919.94
Fiscal year ending November 30, 2017: $ 0
An affiliate of the registrant’s accountant performednon-audit services unrelated to the operations and financial reporting of the registrant with respect to State Farm VP Management Corp., registrant’s distributor and a wholly owned subsidiary of the registrant’s investment adviser, State Farm Investment Management Corp.
(h) Thenon-audit services performed by an affiliate of the registrant’s accountant with respect to State Farm VP Management Corp. were not required to bepre-approved pursuant to paragraph (c)(7)(ii) of Rule2-01 of RegulationS-X by the Audit Committee and were not considered by the Audit Committee with respect to the independence of the registrant’s accountant.
| ITEM 5. | AUDIT COMMITTEE OF LISTED REGISTRANTS. |
Not applicable.
(a) The information required by this Item 6 is included as part of the report to shareholders under Item 1 of this FormN-CSR.
(b) Not applicable.
| ITEM 7. | DISCLOSURE OF PROXY VOTING POLICIES AND PROCEDURES FORCLOSED-END MANAGEMENT INVESTMENT COMPANIES. |
Not applicable.
| ITEM 8. | PORTFOLIO MANAGERS OFCLOSED-END MANAGEMENT INVESTMENT COMPANIES. |
Not applicable.
| ITEM 9. | PURCHASES OF EQUITY SECURITIES BYCLOSED-END MANAGEMENT INVESTMENT COMPANY AND AFFILIATED PURCHASERS. |
Not applicable.
| ITEM 10. | SUBMISSION OF MATTERS TO A VOTE OF SECURITY HOLDERS. |
There were no material changes to the procedures by which shareholders may recommend nominees to the State Farm Associates’ Funds Trust Board of Trustees.
| ITEM 11. | CONTROLS AND PROCEDURES. |
(a) The registrant’s principal executive officer and principal financial officer evaluated the effectiveness of the registrant’s disclosure controls and procedures (as defined in Rule30a-3(c) under the Investment Company Act of 1940 (the “Act”) (17 CFR270.30a-3(c))) as of a date within 90 days of the filing date of this report (the “Evaluation Date”), and based on their evaluation as of the Evaluation Date of these controls and procedures as required by Rule30a-3(b) under the Act (17 CFR270.30a-3(b)) and Rules13a-15(b) or15d-15(b) under the Securities Exchange Act of 1934 (17 CFR240.13a-15(b) or240.15d-15(b)) (as applicable), concluded that the registrant’s disclosure controls and procedures are effective.
(b) No change in the registrant’s internal control over financial reporting (as defined in Rule30a-3(d) under the Act (17 CFR270.30a-3(d))) occurred during the registrant’s last fiscal quarter that has materially affected, or is reasonably likely to materially affect, the registrant’s internal control over financial reporting.
| ITEM 12. | DISCLOSURE OF SECURITIES LENDING ACTIVITIES FORCLOSED-END MANAGEMENT INVESTMENT COMPANIES. |
Not applicable.
(a)(1) Not applicable.
(a)(2) A separate certification for each principal executive officer and principal financial officer of the registrant as required by Rule30a-2(a) under the Act (17 CFR270.30a-2(a)): Attached hereto as EX-99.CERT.
(a)(3) Not applicable.
(a)(4) Not applicable.
(b) Certification of principal executive officer and principal financial officer as required by Rule30a-2(b) under the Act (17 CFR270.30a-2(b)), Rule13a-14(b) or Rule15d-14(b) under the Securities Exchange Act of 1934 (17 CFR240.13a-14(b) or240.15d-14(b))(as applicable), and Section 1350 of Chapter 63 of Title 18 of the United States Code (18 U.S.C. 1350): Attached hereto asEX-99.906CERT.
SIGNATURES
Pursuant to the requirements of the Securities Exchange Act of 1934 and the Investment Company Act of 1940, the registrant has duly caused this report to be signed on its behalf by the undersigned, thereunto duly authorized.
State Farm Associates’ Funds Trust
| | |
| By | | /s/ Joe R. Monk Jr. |
| | Joe R. Monk Jr. |
| | President |
Pursuant to the requirements of the Securities Exchange Act of 1934 and the Investment Company Act of 1940, this report has been signed below by the following persons on behalf of the registrant and in the capacities and on the dates indicated.
| | |
| By | | /s/ Joe R. Monk Jr. |
| | Joe R. Monk Jr. |
| | President |
| | |
| By | | /s/ Paul J. Smith |
| | Paul J. Smith |
| | Senior Vice President and Treasurer |