UNITED STATES
SECURITIES AND EXCHANGE COMMISSION
Washington, D.C. 20549
FORM N-CSR
CERTIFIED SHAREHOLDER REPORT OF REGISTERED
MANAGEMENT INVESTMENT COMPANIES
Investment Company Act file number 811-01519
STATE FARM ASSOCIATES’ FUNDS TRUST
(Exact name of registrant as specified in charter)
| | |
One State Farm Plaza Bloomington, IL | | 61710-0001 |
| (Address of principal executive offices) | | (Zip code) |
| | |
| | Mark Greer |
| Paul J. Smith | | Stradley Ronon Stevens & Young |
| One State Farm Plaza | | 191 North Wacker Dr., Suite 1601 |
| Bloomington, Illinois 61710-0001 | | Chicago, Illinois 60606 |
| (Names and addresses of agents for service) |
Registrant’s telephone number, including area code: 1-800-447-0740
Date of fiscal year end: 11/30/2021
Date of reporting period: 05/31/2021
| ITEM 1. | REPORTS TO STOCKHOLDERS. |
(a) [Report]
(b) Not applicable.
May 31,2021
State Farm Associates’ Funds Trust
SEMI-ANNUAL REPORT
State Farm Growth Fund
State Farm Balanced Fund
State Farm Interim Fund
State Farm Municipal Bond Fund
Before investing, consider the Funds’ investment objectives, risks, charges and expenses. Contact State Farm VP Management Corp. (1-800-447-0740) for a prospectus or summary prospectus containing this and other information. Read it carefully.
A description of the policies and procedures that the Funds use to determine how to vote proxies relating to portfolio securities, and information regarding how the Funds voted proxies relating to portfolio securities during the most recent 12-month period ended June 30, are available without charge upon request at 1-800-447-0740 and at sec.gov.
The Funds file complete schedules of portfolio holdings for each Fund with the Securities and Exchange Commission (the “Commission”) for the first and third quarters of each fiscal year and as an exhibit to its report on Form N-PORT. The Funds’ Forms N-PORT are available on the Commission’s website at sec.gov. The Funds make the information on Form N-PORT available to shareholders upon request without charge at 1-800-447-0740.
Any website referenced in this report is an inactive textual reference only, and information contained in or otherwise accessible through that website does not form a part of, and is not incorporated by reference into, this report.
SEMI-ANNUAL REPORT
Electronic Delivery
As a State Farm Mutual Funds shareholder, we wish to remind you that you can elect to have future Annual Reports, Semi-Annual Reports, Prospectuses, statements and tax forms delivered electronically rather than receiving large, bulky paper reports through the mail. This is a great way to help reduce internal fund costs related to printing and mailing these materials as well as a way to be environmentally friendly. Please consider signing up for electronic delivery today by going on statefarm.com or by calling 1-800-447-0740.
Compensation Deduction or Automatic Investment Plan (AlP)1
State Farm Mutual Funds allow you to make regular investments in a Fund with compensation deduction (agent/employee only) or an Automatic Investment Plan through an electronic transfer of funds from your bank/credit union account. If you wish to begin compensation deduction or an Automatic Investment Plan, the minimum amount required for both initial and subsequent investments is $50. Please consider signing up today for compensation deduction by going on the State Farm intranet or signing up for AIP by calling 1-800-447-0740 for assistance.
State Farm VP Management Corp.
(Underwriter and Distributor of Securities Products)
One State Farm Plaza
Bloomington, Illinois 61710-0001
1-800-447-0740
statefarm.com
| 1 | Automatic investment plans do not assure a profit or protect against loss. |
Message to Shareholders of State Farm Associates’ Funds Trust
Dear Shareholders,
Thank you for investing with State Farm Mutual Funds®. Enclosed is the Semi-Annual Report for the 6-month period ended May 31, 2021, for the State Farm Associates’ Funds Trust (“the Trust”). We encourage your review and consideration of the entire report.
State Farm Investment Management Corp. has consistently maintained a long-term, disciplined approach to managing investment risk and providing competitive investment products that can help you, our valued shareholder, with your investment goals.1 We believe that remaining focused on your long-term goals and maintaining an appropriate asset allocation mix are important elements in pursuing investment success.2
On June 17, 2021, AFT shareholders approved the reorganization of the mutual funds within AFT into similar new mutual funds offered by Advisers Investment Trust (AIT). The reorganization is planned for late August 2021. The AIT funds will continue to be advised by State Farm Investment Management Corp. with Northern Trust Investments, Inc. providing day-to-day portfolio management and shareholder servicing. The AIT funds have the same or substantially similar investment objectives, principal investment strategies, risks, and fees as the AFT funds.
Market Review
During the 6-month period ended May 31, 2021, the U.S. equity market experienced a positive total return while the U.S. fixed income market was mixed.
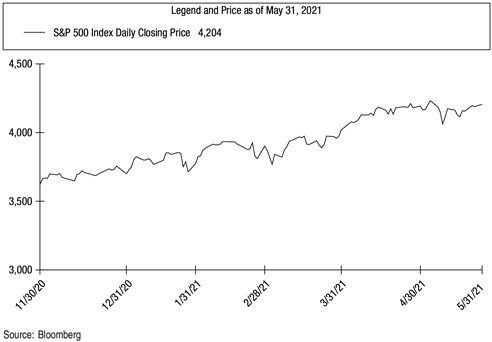
As represented by the S&P 500 Index (the “Index”) in the chart below, U.S. equities rose to several record closing prices throughout the period, including crossing the 4,000-point threshold for the first time on April 1.3 The historic mark was followed by the Index continuing to set new highs during the remainder of April and into May, ultimately reaching its peak record close of 4,232 on May 7. The Index finished the period at 4,204 – a sizeable increase from where it had started (3,621) – while posting a 16.43% total return, including dividends.
| 1 | Investing involves risk, including potential for loss. |
| 2 | Asset allocation does not assure a profit or protect against loss. |
| 3 | Source: Standard & Poor’s. The S&P 500 Index is a capitalization-weighted measure of the common stocks of 500 large U.S. companies. It is not possible to invest directly in an index. Past performance does not guarantee future results. |
1
Message to Shareholders of State Farm Associates’ Funds Trust (continued)
The time period began with encouraging COVID-19 vaccine news in combination with another round of stimulus packages and continued loose monetary policy, which helped the U.S. equity market finish the calendar year with a positive return. News of more fiscal support helped maintain positive sentiment early in January, as President Biden proposed his $1.9 trillion coronavirus relief package that included among other things, up to $1,400 in additional direct payments, increased federal unemployment benefits, aid to state and local governments, and funding for vaccine distribution. However, stocks subsequently experienced a slight pullback as the S&P 500 fell by -1.0% in January. The retreat, which occurred late in the month shortly after the Index had reached a new all-time high on January 26, saw U.S. equities decline by -3.5% in the last three trading days of the month, on fears of extended market valuations.
Despite the slight downturn in January, the U.S. equity market rebounded swiftly in February and March to help the Index rise 6.2% during the first calendar quarter of 2021, finishing those three months at an all-time high. The expanding rollout of vaccines and the steady decline in COVID-19 related cases, hospitalizations and deaths enabled more states and municipalities to ease restrictions, thereby allowing the U.S. economic recovery to gain traction. As a result, shares of companies most sensitive to changing economic conditions led U.S. stock gains during the quarter. The rotation into these cyclical sectors more than offset weakness in the handful of stay-at-home stocks, primarily large-cap technology companies that benefited during most of 2020 as people sheltered in place and worked from home.
In April, the U.S. equity market spent much of the month grappling with two competing dynamics: signs of a strong economic rebound – particularly in the U.S. – and worsening COVID-19 cases elsewhere in the world that threatened to hamper the global recovery. Robust corporate earnings as well as improved U.S. economic data helped push the Index to record levels throughout the month, finishing ahead 5.3%. The 6-month period ended with the S&P 500 setting several more all-time highs in the first half of May, while experiencing some volatility during the second half of the month due to inflationary concerns, rising input costs and a tight labor market. Ultimately, the Index closed higher, up 0.7% in May, while finishing with a positive total return in five of the six months during the time period.
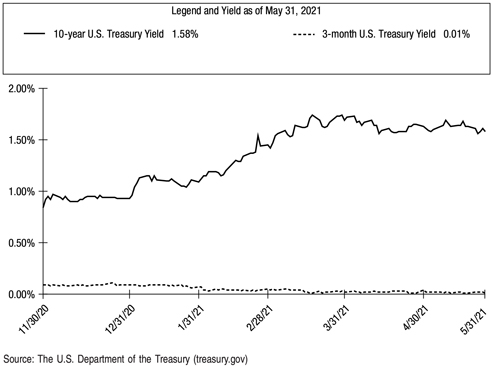
Among the major fixed income indices, the Bloomberg Barclays 1 -5 Year Treasury Index4 and the Bloomberg Barclays 7-Year Municipal Bond Index5 posted total returns of -0.15% and 0.60%, respectively, as price declines ate into coupon returns. To start the period, longer-term government bond yields trended higher as the market seemed to be looking forward to better economic growth on the back of positive corporate earnings, improving coronavirus developments, vaccination momentum and continued monetary and fiscal tailwinds. While the 10-year Treasury yield saw a rise in February and March – closing the first calendar quarter at 1.74% – short-term (3-month) yields continued to remain flat and hover near 0%. Inflationary concerns and doubt around the Fed’s ability to maintain low interest rates prompted some fixed income investors to sell off longer-dated bonds in exchange for short-term paper.
Uncertainty over the timing of recovery in both the domestic and global economies stoked some volatility in the bond market in April and May. Also, the Federal Reserve reiterated its commitment to near-zero interest rates as the economy continued to rebound, with Chairman Powell stressing that transitory inflationary concerns would not warrant a rate hike. Ultimately, short-term yields finished the period at 0.01%, while longer-term Treasuries pulled back slightly from their March highs but still remained higher than the 0.84% where they started the fiscal year, closing at 1.58%.6
| 4 | Source: Bloomberg Barclays Inc. The Bloomberg Barclays 1-5 Year U.S. Treasury Index measures the performance of short-term U.S. Treasury Securities maturing within one to five years. It is not possible to invest directly in an index. Past performance does not guarantee future results. |
| 5 | Source: Bloomberg Barclays Inc. The Bloomberg Barclays 7-year Municipal Bond Index is an unmanaged index comprised of investment grade municipal bonds with maturities of six to eight years. It is not possible to invest directly in an index. Past performance does not guarantee future results. |
| 6 | Source: The U.S. Department of the Treasury. A 3-month U.S. Treasury Bill is a debt obligation issued by the U.S. Treasury that has a term of 92 days or less. A 10-year U.S. Treasury Note is a debt obligation issued by the U.S. Treasury with a maturity of 10 years and that pays interest every six months. U.S. Treasury securities are backed by the full faith and credit of the U.S. government and are guaranteed only as to the prompt payment of principal and interest, and are subject to market risks if sold prior to maturity. Bonds have historically been less volatile than stocks, but are sensitive to changes in interest rates. Past performance does not guarantee future results. |
2
Message to Shareholders of State Farm Associates’ Funds Trust (continued)
In the municipal bond market, early period expectations of higher taxes as well as more fiscal stimulus coming from a Democratic-controlled White House and Congress helped boost investor appetite for municipal bonds and further eroded the historically close correlation between U.S. Treasury yields and those on municipal bonds. Strong demand continued into February, and coupled with relatively low issuance, helped to push municipal yields lower while credit spreads continued to tighten. While nominally down for the calendar first quarter, municipal bonds outperformed counterparts given the fiscal boost the American Rescue Plan Act was expected to provide to state and local governments, while also benefitting from the improved outlook for rising tax revenues as the U.S. economy continued to reopen. That momentum carried into the last couple months of the 6-month period, as municipals went on to finish strong, posting positive total returns for April and May.
On behalf of the entire State Farm Mutual Funds team, thank you for your business and allowing us to help serve your investment needs.
|
| Sincerely, |
|
 |
Joe R. Monk Jr. Senior Vice President |
| State Farm Investment Management Corp. |
3
Portfolio Summary
State Farm Growth Fund
Fund Composition*
(unaudited)
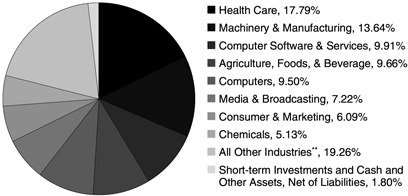
| * | Illustrated by Industry and based on total net assets as of May 31, 2021. Please refer to the Schedule of Investments later in this report for details concerning Fund holdings. |
| ** | Represents 9 other industries, each of which represents less than 5% of total net assets. |
State Farm Balanced Fund
Fund Composition*
(unaudited)
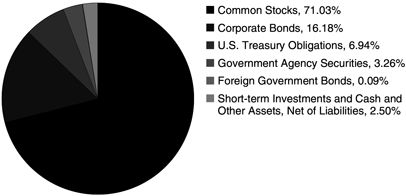
| * | Illustrated by Type of Security and based on total net assets as of May 31, 2021. Please refer to the Schedule of Investments later in this report for details concerning Fund holdings. |
4
Portfolio Summary (continued)
State Farm Interim Fund
Fund Composition*
(unaudited)
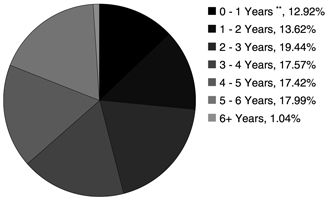
| * | Illustrated by Maturity and based on total investments as of May 31, 2021. Please refer to the Schedule of Investments later in this report for details concerning Fund holdings. |
| ** | Includes a 1.10% allocation to the JPMorgan US Government Money Market Fund Capital Shares. |
State Farm Municipal Bond Fund
Fund Composition*
(unaudited)
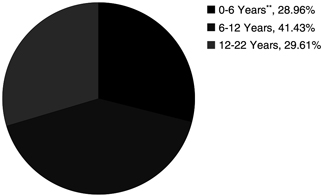
| * | Illustrated by Maturity and based on total investments as of May 31, 2021. Please refer to the Schedule of Investments later in this report for details concerning Fund holdings. |
| ** | Includes a 2.21% allocation to the JPMorgan US Government Money Market Fund Capital Shares. |
5
Expense Example (unaudited)
As a shareholder of a Fund, you incur ongoing costs, including management fees and other Fund expenses. The Example in the following table is intended to help you understand your ongoing costs (in dollars) of investing in a Fund and to compare these costs with the ongoing costs of investing in other mutual funds.
The Example is based on an investment of $1,000 invested at the beginning of the period and held for the entire period as stated in the table below.
Actual Expenses
The first line under each Fund name in the table below provides information about actual account values and actual expenses. You may use the information in this line, together with the amount you invested, to estimate the expenses that you paid over the period. Simply divide your account value for a Fund by $1,000 (for example, an $8,600 account value divided by $1,000 = 8.6), then multiply the result by the number in the first line under the heading entitled “Expenses Paid During Period” for the applicable Fund to estimate the expenses you paid on your account for that Fund during this period. If your account has multiple Fund positions, add up the results calculated for each Fund position within your account to estimate the expenses you paid on your total account value. A potential account fee of $10 per calendar quarter is not included in the expenses shown in the table. This fee will be charged to an account (other than a SEP IRA, SIMPLE IRA, Archer Medical Savings Account, Tax Sheltered Account under §403(b)(7) of the Internal Revenue Code or an account held under other employer-sponsored qualified retirement plans) if the balance in the account falls below $5,000 at the close of business on the second business day of the last month of the calendar quarter, unless the account has been open for less than a year as of the second business day of the last month of the calendar quarter. You should consider any account fee you incurred when estimating the total ongoing expenses paid over the period and the impact of this fee on your ending account value. This additional fee has the effect of reducing investment returns.
Hypothetical Example for Comparison Purposes
The second line under each Fund name in the table below provides information about hypothetical account values and hypothetical expenses based on the Fund’s actual expense ratio and an assumed rate of return of 5% per year before expenses, which is not the Fund’s actual return. The hypothetical account values and expenses may not be used to estimate the actual ending account balance or expenses you paid for the period. You may use this information to compare the ongoing costs of investing in the Fund and other funds. To do so, compare this 5% hypothetical example with the 5% hypothetical examples that appear in the shareholder reports of the other funds. A potential account fee of $10 per calendar quarter is not included in the expenses shown in the table. This fee will be charged to an account (other than a SEP IRA, SIMPLE IRA, Archer Medical Savings Account, Tax Sheltered Account under §403(b)(7) of the Internal Revenue Code or an account held under other employer-sponsored qualified retirement plans) if the balance in the account falls below $5,000 at the close of business on the second business day of the last month of the calendar quarter, unless the account has been open for less than a year as of the second business day of the last month of the calendar quarter. You should consider any account fee that you incurred when estimating the total ongoing expenses paid over the period and the impact of this fee on your ending account value. This additional fee has the effect of increasing the costs of investing.
Please note that the expenses shown in the table are meant to highlight your ongoing costs only. Therefore, the second line under each Fund name in the table is useful in comparing ongoing costs only, and will not help you determine the relative total costs of owning different funds, including those that have transactional costs, such as sales charges (loads), redemption fees, or exchange fees.
| | | | | | | | | | | | | | | | |
| | | | | | | | | Annualized Expense | | | | |
| | | | | | | | | Ratio Based | | | Expenses Paid | |
| | | Beginning | | | Ending | | | on the Period | | | During Period | |
| | | Account Value | | | Account Value | | | December 1, 2020 to | | | December 1, 2020 to | |
| | | December 1, 2020 | | | May 31, 2021 | | | May 31, 2021 | | | May 31, 2021* | |
State Farm Growth Fund | | | | | | | | | | | | | | | | |
Actual | | $ | 1,000.00 | | | $ | 1,188.50 | | | | 0.12 | % | | $ | 0.65 | |
Hypothetical (5% return before expenses) | | $ | 1,000.00 | | | $ | 1,024.33 | | | | 0.12 | % | | $ | 0.61 | |
| | | | | | | | | | | | | | | | |
State Farm Balanced Fund | | | | | | | | | | | | | | | | |
Actual | | $ | 1,000.00 | | | $ | 1,136.39 | | | | 0.13 | % | | $ | 0.69 | |
Hypothetical (5% return before expenses) | | $ | 1,000.00 | | | $ | 1,024.28 | | | | 0.13 | % | | $ | 0.66 | |
| | | | | | | | | | | | | | | | |
State Farm Interim Fund | | | | | | | | | | | | | | | | |
Actual | | $ | 1,000.00 | | | $ | 994.46 | | | | 0.16 | % | | $ | 0.80 | |
Hypothetical (5% return before expenses) | | $ | 1,000.00 | | | $ | 1,024.13 | | | | 0.16 | % | | $ | 0.81 | |
| | | | | | | | | | | | | | | | |
State Farm Municipal Bond Fund | | | | | | | | | | | | | | | | |
Actual | | $ | 1,000.00 | | | $ | 1,003.41 | | | | 0.16 | % | | $ | 0.80 | |
Hypothetical (5% return before expenses) | | $ | 1,000.00 | | | $ | 1,024.13 | | | | 0.16 | % | | $ | 0.81 | |
| | | | | | | | | | | | | | | | |
| * | Expenses are equal to the applicable Fund’s annualized expense ratio (provided in the table), multiplied by the average account value over the period, multiplied by 182/365 (to reflect the one-half year period). |
6
STATE FARM ASSOCIATES’ FUNDS TRUST GROWTH FUND
SCHEDULE OF INVESTMENTS
May 31, 2021
(Unaudited)
| | | | | | | | |
| | | Shares | | | Value | |
Common Stocks (98.20%) | |
Agriculture, Foods, & Beverage (9.66%) | |
Archer-Daniels-Midland Co. | | | 3,477,500 | | | $ | 231,358,075 | |
Coca-Cola Co., The | | | 2,054,600 | | | | 113,598,834 | |
Kellogg Co. | | | 930,000 | | | | 60,905,700 | |
McCormick & Company Inc. | | | 857,200 | | | | 76,342,232 | |
Nestle SA ADR | | | 609,147 | | | | 75,333,210 | |
PepsiCo Inc. | | | 641,400 | | | | 94,888,716 | |
| | | | | | | | |
| | | | | | | 652,426,767 | |
| | | | | | | | |
Banks (3.74%) | | | | | | | | |
M&T Bank Corp. | | | 213,400 | | | | 34,291,246 | |
Northern Trust Corp. | | | 422,700 | | | | 51,227,013 | |
U.S. Bancorp | | | 710,821 | | | | 43,203,700 | |
Wells Fargo & Co. | | | 2,643,100 | | | | 123,485,632 | |
| | | | | | | | |
| | | | | | | 252,207,591 | |
| | | | | | | | |
Building Materials & Construction (2.82%) | |
Vulcan Materials Co. | | | 1,039,200 | | | | 190,506,144 | |
| | | | | | | | |
Chemicals (5.13%) | | | | | | | | |
Air Products & Chemicals Inc. | | | 830,000 | | | | 248,717,800 | |
Corteva Inc. | | | 97,944 | | | | 4,456,452 | |
Dow Inc. | | | 97,944 | | | | 6,701,328 | |
DuPont de Nemours Inc. | | | 46,493 | | | | 3,932,843 | |
International Flavors & Fragrances Inc. | | | 561,941 | | | | 79,610,182 | |
Novozymes A/S B Shares | | | 39,188 | | | | 2,863,391 | |
| | | | | | | | |
| | | | | | | 346,281,996 | |
| | | | | | | | |
Computer Software & Services (9.91%) | |
Alphabet Inc. Class A (a) | | | 112,635 | | | | 265,463,800 | |
Alphabet Inc. Class C (a) | | | 5,916 | | | | 14,266,789 | |
Automatic Data Processing Inc. | | | 109,900 | | | | 21,542,598 | |
Facebook Inc. Class A (a) | | | 82,675 | | | | 27,177,753 | |
Microsoft Corp. | | | 1,129,669 | | | | 282,055,756 | |
SAP SE | | | 83,800 | | | | 11,760,726 | |
Texas Instruments Inc. | | | 245,807 | | | | 46,659,084 | |
| | | | | | | | |
| | | | | | | 668,926,506 | |
| | | | | | | | |
Computers (9.50%) | | | | | | | | |
Apple Inc. | | | 5,148,868 | | | | 641,600,441 | |
| | | | | | | | |
Consumer & Marketing (6.09%) | | | | | | | | |
AptarGroup Inc. | | | 677,405 | | | | 99,788,530 | |
Colgate-Palmolive Co. | | | 872,600 | | | | 73,106,428 | |
Procter & Gamble Co., The | | | 1,765,155 | | | | 238,031,152 | |
| | | | | | | | |
| | | | | | | 410,926,110 | |
| | | | | | | | |
Electronic/Electrical Manufacturing (0.96%) | |
Emerson Electric Co. | | | 126,400 | | | | 12,095,216 | |
General Electric Co. | | | 3,744,419 | | | | 52,646,531 | |
| | | | | | | | |
| | | | | | | 64,741,747 | |
| | | | | | | | |
Health Care (17.79%) | | | | | | | | |
Abbott Laboratories | | | 847,500 | | | | 98,860,875 | |
AbbVie Inc. | | | 847,500 | | | | 95,937,000 | |
Agilent Technologies Inc. | | | 548,071 | | | | 75,705,047 | |
Amgen Inc. | | | 190,085 | | | | 45,228,825 | |
| | | | | | | | |
| | | Shares | | | Value | |
Common Stocks (Cont.) | | | | | | | | |
Health Care (Cont.) | | | | | | | | |
Eli Lilly and Co. | | | 997,000 | | | $ | 199,140,780 | |
Johnson & Johnson | | | 2,481,600 | | | | 420,010,800 | |
Merck & Co. Inc. | | | 296,750 | | | | 22,520,357 | |
Pfizer Inc. | | | 2,239,031 | | | | 86,717,671 | |
Roche Holding AG Sponsored ADR | | | 732,281 | | | | 32,044,617 | |
Zoetis Inc. | | | 705,696 | | | | 124,682,369 | |
| | | | | | | | |
| | | | | | | 1,200,848,341 | |
| | | | | | | | |
Machinery & Manufacturing (13.64%) | |
3M Co. | | | 564,000 | | | | 114,514,560 | |
ASML Holding NV NY Reg. Shares | | | 364,933 | | | | 246,501,293 | |
Caterpillar Inc. | | | 1,162,621 | | | | 280,284,671 | |
Deere & Co. | | | 42,900 | | | | 15,491,190 | |
Donaldson Company Inc. | | | 765,513 | | | | 47,147,946 | |
HNI Corp. | | | 1,439,200 | | | | 65,656,304 | |
Illinois Tool Works Inc. | | | 652,500 | | | | 151,223,400 | |
| | | | | | | | |
| | | | | | | 920,819,364 | |
| | | | | | | | |
Media & Broadcasting (7.22%) | |
Walt Disney Co., The(a) | | | 2,728,640 | | | | 487,471,536 | |
| | | | | | | | |
Mining & Metals (1.98%) | | | | | | | | |
Nucor Corp. | | | 531,200 | | | | 54,469,248 | |
Rio Tinto PLC ADR | | | 907,200 | | | | 79,316,496 | |
| | | | | | | | |
| | | | | | | 133,785,744 | |
| | | | | | | | |
Oil & Gas (3.89%) | |
Chevron Corp. | | | 1,060,000 | | | | 110,017,400 | |
Exxon Mobil Corp. | | | 2,615,200 | | | | 152,649,224 | |
| | | | | | | | |
| | | | | | | 262,666,624 | |
| | | | | | | | |
Retailers (2.82%) | |
Walmart Inc. | | | 1,339,100 | | | | 190,192,373 | |
| | | | | | | | |
Telecom & Telecom Equipment (2.29%) | |
AT&T Inc. | | | 2,140,534 | | | | 62,995,916 | |
Corning Inc. | | | 1,284,600 | | | | 56,047,098 | |
Verizon Communications Inc. | | | 624,900 | | | | 35,300,601 | |
| | | | | | | | |
| | | | | | | 154,343,615 | |
| | | | | | | | |
Transportation (0.30%) | | | | | | | | |
GATX Corp. | | | 190,700 | | | | 18,814,462 | |
Wabtec Corp. | | | 20,111 | | | | 1,664,386 | |
| | | | | | | | |
| | | | | | | 20,478,848 | |
| | | | | | | | |
Utilities & Energy (0.46%) | | | | | | | | |
Duke Energy Corp. | | | 306,966 | | | | 30,764,133 | |
| | | | | | | | |
Total Common Stocks | | | | | | | | |
(cost $1,355,567,197) | | | | | | | 6,628,987,880 | |
| | | | | | | | |
| | |
| See accompanying notes to financial statements. | | 7 |
STATE FARM ASSOCIATES’ FUNDS TRUST GROWTH FUND
SCHEDULE OF INVESTMENTS (continued)
May 31, 2021
(Unaudited)
| | | | | | | | |
| | | Shares | | | Value | |
Short-term Investments (1.53%) | |
JPMorgan U.S. Government Money Market Fund Capital Shares, 0.03% (b) | | | 102,993,983 | | | $ | 102,993,983 | |
| | | | | | | | |
Total Short-term Investments | |
(cost $102,993,983) | | | | | | | 102,993,983 | |
| | | | | | | | |
TOTAL INVESTMENTS (99.73%) | |
(cost $1,458,561,180) | | | | | | | 6,731,981,863 | |
CASH AND OTHER ASSETS, NET OF LIABILITIES (0.27%) | | | | 18,258,581 | |
| | | | | | | | |
NET ASSETS (100.00%) | | | $ | 6,750,240,444 | |
| | | | | | | | |
| (a) | Non-income producing security. |
| (b) | Rate shown is the 7-day yield as of May 31, 2021. |
ADR - American Depositary Deposit
| | |
| 8 | | See accompanying notes to financial statements. |
STATE FARM ASSOCIATES’ FUNDS TRUST BALANCED FUND
SCHEDULE OF INVESTMENTS
May 31, 2021
(Unaudited)
| | | | | | | | |
| | | Shares | | | Value | |
Common Stocks (71.03%) | |
Agriculture, Foods, & Beverage (6.72%) | |
Archer-Daniels-Midland Co. | | | 940,561 | | | $ | 62,575,523 | |
Campbell Soup Co. | | | 26,000 | | | | 1,265,420 | |
Coca-Cola Co., The | | | 410,000 | | | | 22,668,900 | |
Kellogg Co. | | | 310,000 | | | | 20,301,900 | |
Nestle SA ADR | | | 319,174 | | | | 39,472,249 | |
PepsiCo Inc. | | | 110,100 | | | | 16,288,194 | |
| | | | | | | | |
| | | | | | | 162,572,186 | |
| | | | | | | | |
Banks (2.91%) | | | | | | | | |
M&T Bank Corp. | | | 58,300 | | | | 9,368,227 | |
Northern Trust Corp. | | | 104,700 | | | | 12,688,593 | |
U.S. Bancorp | | | 218,145 | | | | 13,258,853 | |
Wells Fargo & Co. | | | 747,600 | | | | 34,927,872 | |
| | | | | | | | |
| | | | | | | 70,243,545 | |
| | | | | | | | |
Building Materials & Construction (1.21%) | |
Vulcan Materials Co. | | | 160,200 | | | | 29,367,864 | |
| | | | | | | | |
Chemicals (4.25%) | | | | | | | | |
Air Products & Chemicals Inc. | | | 230,000 | | | | 68,921,800 | |
Corteva Inc. | | | 79,452 | | | | 3,615,066 | |
Dow Inc. | | | 79,452 | | | | 5,436,106 | |
DuPont de Nemours Inc. | | | 37,715 | | | | 3,190,312 | |
International Flavors & Fragrances Inc. | | | 131,488 | | | | 18,627,905 | |
Novozymes A/S B Shares | | | 39,191 | | | | 2,863,610 | |
| | | | | | | | |
| | | | | | | 102,654,799 | |
| | | | | | | | |
Computer Software & Services (8.34%) | |
Alphabet Inc. Class A (a) | | | 36,687 | | | | 86,465,756 | |
Alphabet Inc. Class C (a) | | | 3,559 | | | | 8,582,742 | |
Automatic Data Processing Inc. | | | 47,400 | | | | 9,291,348 | |
Facebook Inc. Class A (a) | | | 49,575 | | | | 16,296,790 | |
Microsoft Corp. | | | 276,321 | | | | 68,991,827 | |
SAP SE | | | 52,800 | | | | 7,410,099 | |
Texas Instruments Inc. | | | 24,373 | | | | 4,626,483 | |
| | | | | | | | |
| | | | | | | 201,665,045 | |
| | | | | | | | |
Computers (6.56%) | |
Apple Inc. | | | 1,272,704 | | | | 158,591,645 | |
| | | | | |
Consumer & Marketing (4.25%) | | | | | |
AptarGroup Inc. | | | 134,100 | | | | 19,754,271 | |
Colgate-Palmolive Co. | | | 80,000 | | | | 6,702,400 | |
Procter & Gamble Co., The | | | 477,700 | | | | 64,417,845 | |
Unilever PLC | | | 198,705 | | | | 11,916,339 | |
| | | | | | | | |
| | | | | | | 102,790,855 | |
| | | | | | | | |
Electronic/Electrical Manufacturing (0.85%) | |
Emerson Electric Co. | | | 98,600 | | | | 9,435,034 | |
General Electric Co. | | | 796,300 | | | | 11,195,978 | |
| | | | | | | | |
| | | | | | | 20,631,012 | |
| | | | | | | | |
Health Care (10.94%) | | | | | | | | |
Abbott Laboratories | | | 146,675 | | | | 17,109,639 | |
AbbVie Inc. | | | 92,000 | | | | 10,414,401 | |
Agilent Technologies Inc. | | | 143,787 | | | | 19,861,298 | |
| | | | | | | | |
| | | Shares | | | Value | |
Common Stocks (Cont.) | | | | | | | | |
Health Care (Cont.) | | | | | | | | |
Amgen Inc. | | | 70,750 | | | $ | 16,834,255 | |
Eli Lilly and Co. | | | 212,000 | | | | 42,344,880 | |
Johnson & Johnson | | | 417,700 | | | | 70,695,725 | |
Medtronic PLC | | | 21,600 | | | | 2,734,344 | |
Merck & Co. Inc. | | | 103,200 | | | | 7,831,848 | |
Pfizer Inc. | | | 728,140 | | | | 28,200,862 | |
Roche Holding AG Sponsored ADR | | | 179,815 | | | | 7,868,704 | |
Zoetis Inc. | | | 229,495 | | | | 40,547,177 | |
| | | | | | | | |
| | | | | | | 264,443,133 | |
| | | | | | | | |
Machinery & Manufacturing (7.43%) | |
3M Co. | | | 124,600 | | | | 25,298,784 | |
ASML Holding NV NY Reg. Shares | | | 15,321 | | | | 10,348,876 | |
Caterpillar Inc. | | | 262,400 | | | | 63,259,392 | |
Deere & Co. | | | 72,202 | | | | 26,072,142 | |
Donaldson Company Inc. | | | 279,017 | | | | 17,184,657 | |
HNI Corp. | | | 160,000 | | | | 7,299,200 | |
Illinois Tool Works Inc. | | | 130,600 | | | | 30,267,856 | |
| | | | | | | | |
| | | | | | | 179,730,907 | |
| | | | | | | | |
Media & Broadcasting (7.88%) | | | | | | | | |
Walt Disney Co., The(a) | | | 1,065,995 | | | | 190,440,007 | |
| | | | | |
Mining & Metals (2.91%) | | | | | | | | |
Nucor Corp. | | | 436,800 | | | | 44,789,472 | |
Rio Tinto PLC ADR | | | 293,000 | | | | 25,616,990 | |
| | | | | | | | |
| | | | | | | 70,406,462 | |
| | | | | | | | |
Oil & Gas (2.86%) | | | | | | | | |
Chevron Corp. | | | 288,000 | | | | 29,891,520 | |
Enbridge Inc. | | | 78,375 | | | | 3,015,870 | |
Exxon Mobil Corp. | | | 512,400 | | | | 29,908,788 | |
Schlumberger Ltd. | | | 201,727 | | | | 6,320,107 | |
| | | | | | | | |
| | | | | | | 69,136,285 | |
| | | | | | | | |
Retailers (1.63%) | | | | | | | | |
Walmart Inc. | | | 276,700 | | | | 39,299,701 | |
| | | | | | | | |
Telecom & Telecom Equipment (1.58%) | |
AT&T Inc. | | | 533,359 | | | | 15,696,756 | |
Corning Inc. | | | 372,300 | | | | 16,243,449 | |
Verizon Communications Inc. | | | 112,490 | | | | 6,354,560 | |
| | | | | | | | |
| | | | | | | 38,294,765 | |
| | | | | | | | |
Transportation (0.41%) | | | | | | | | |
GATX Corp. | | | 68,200 | | | | 6,728,612 | |
Union Pacific Corp. | | | 12,066 | | | | 2,711,592 | |
Wabtec Corp. | | | 4,276 | | | | 353,882 | |
| | | | | | | | |
| | | | | | | 9,794,086 | |
| | | | | | | | |
Utilities & Energy (0.30%) | | | | | | | | |
Duke Energy Corp. | | | 72,333 | | | | 7,249,213 | |
| | | | | | | | |
Total Common Stocks | | | | | | | | |
(cost $372,722,517) | | | | | | | 1,717,311,510 | |
| | | | | | | | |
| | |
| See accompanying notes to financial statements. | | 9 |
STATE FARM ASSOCIATES’ FUNDS TRUST BALANCED FUND
SCHEDULE OF INVESTMENTS (continued)
May 31, 2021
(Unaudited)
| | | | | | | | |
| | | Principal
amount | | | Value | |
Corporate Bonds (16.18%) | |
Aerospace/Defense (0.64%) | |
Lockheed Martin Corp. | | | | | | | | |
3.350%, 09/15/2021 | | $ | 556,000 | | | $ | 560,978 | |
Boeing Co. | | | | | | | | |
2.850%, 10/30/2024 | | | 1,000,000 | | | | 1,053,679 | |
General Dynamics Corp. | | | | | | | | |
2.375%, 11/15/2024 | | | 500,000 | | | | 529,783 | |
Raytheon Technologies Corp. | | | | | | | | |
3.150%, 12/15/2024 | | | 1,000,000 | | | | 1,077,974 | |
Northrop Grumman Corp. | | | | | | | | |
2.930%, 01/15/2025 | | | 1,000,000 | | | | 1,070,017 | |
Lockheed Martin Corp. | | | | | | | | |
2.900%, 03/01/2025 | | | 1,000,000 | | | | 1,077,461 | |
Precision Castparts Corp. | | | | | | | | |
3.250%, 06/15/2025 | | | 1,000,000 | | | | 1,089,519 | |
Rolls-Royce PLC (b) | | | | | | | | |
3.625%, 10/14/2025 | | | 1,000,000 | | | | 1,005,000 | |
Boeing Co. | | | | | | | | |
2.250%, 06/15/2026 | | | 500,000 | | | | 509,081 | |
General Dynamics Corp. | | | | | | | | |
2.125%, 08/15/2026 | | | 500,000 | | | | 524,889 | |
Airbus SE (b) | | | | | | | | |
3.150%, 04/10/2027 | | | 1,000,000 | | | | 1,076,762 | |
United Technologies Corp. | | | | | | | | |
3.125%, 05/04/2027 | | | 1,000,000 | | | | 1,083,867 | |
General Dynamics Corp. | | | | | | | | |
2.625%, 11/15/2027 | | | 500,000 | | | | 538,806 | |
Northrop Grumman Corp. | | | | | | | | |
3.250%, 01/15/2028 | | | 1,000,000 | | | | 1,083,120 | |
General Dynamics Corp. | | | | | | | | |
3.750%, 05/15/2028 | | | 1,200,000 | | | | 1,355,110 | |
Raytheon Technologies Corp. | | | | | | | | |
2.250%, 07/01/2030 | | | 1,500,000 | | | | 1,497,805 | |
Bae Systems PLC (b) | | | | | | | | |
1.900%, 02/15/2031 | | | 500,000 | | | | 474,182 | |
| | | | | | | | |
| | | | | | | 15,608,033 | |
| | | | | | | | |
Agriculture, Foods, & Beverage (1.58%) | |
JM Smucker Co. | | | | | | | | |
3.000%, 03/15/2022 | | | 1,000,000 | | | | 1,021,162 | |
Sysco Corp. | | | | | | | | |
2.600%, 06/12/2022 | | | 1,000,000 | | | | 1,022,389 | |
Campbell Soup Co. | | | | | | | | |
2.500%, 08/02/2022 | | | 1,000,000 | | | | 1,025,253 | |
Kellogg Co. | | | | | | | | |
2.750%, 03/01/2023 | | | 1,000,000 | | | | 1,040,343 | |
Hershey Co. | | | | | | | | |
2.625%, 05/01/2023 | | | 1,300,000 | | | | 1,349,679 | |
General Mills Inc. | | | | | | | | |
3.650%, 02/15/2024 | | | 1,000,000 | | | | 1,080,320 | |
PepsiCo Inc. | | | | | | | | |
3.600%, 03/01/2024 | | | 1,000,000 | | | | 1,080,555 | |
JM Smucker Co. | | | | | | | | |
3.500%, 03/15/2025 | | | 1,000,000 | | | | 1,092,613 | |
PepsiCo Inc. | | | | | | | | |
3.500%, 07/17/2025 | | | 1,000,000 | | | | 1,104,202 | |
| | | | | | | | |
| | | Principal
amount | | | Value | |
Corporate Bonds (Cont.) | |
Agriculture, Foods, & Beverage (Cont.) | |
Hershey Co. | | | | | | | | |
3.200%, 08/21/2025 | | $ | 1,000,000 | | | $ | 1,087,379 | |
PepsiCo Inc. | | | | | | | | |
2.850%, 02/24/2026 | | | 1,000,000 | | | | 1,089,010 | |
Sysco Corp. | | | | | | | | |
3.300%, 07/15/2026 | | | 1,000,000 | | | | 1,092,529 | |
Hershey Co. | | | | | | | | |
2.300%, 08/15/2026 | | | 1,000,000 | | | | 1,063,535 | |
Danone SA(b) | | | | | | | | |
2.947%, 11/02/2026 | | | 1,000,000 | | | | 1,076,285 | |
General Mills Inc. | | | | | | | | |
3.200%, 02/10/2027 | | | 1,000,000 | | | | 1,093,897 | |
Coca-Cola Co., The | | | | | | | | |
2.900%, 05/25/2027 | | | 500,000 | | | | 546,034 | |
Sysco Corp. | | | | | | | | |
3.250%, 07/15/2027 | | | 500,000 | | | | 543,979 | |
PepsiCo Inc. | | | | | | | | |
3.000%, 10/15/2027 | | | 1,500,000 | | | | 1,653,177 | |
Kellogg Co. | | | | | | | | |
3.400%, 11/15/2027 | | | 1,000,000 | | | | 1,094,415 | |
JM Smucker Co. | | | | | | | | |
3.375%, 12/15/2027 | | | 1,500,000 | | | | 1,656,213 | |
Campbell Soup Co. | | | | | | | | |
4.150%, 03/15/2028 | | | 1,000,000 | | | | 1,130,827 | |
General Mills Inc. | | | | | | | | |
4.200%, 04/17/2028 | | | 1,000,000 | | | | 1,145,486 | |
Mondelez International Inc. | | | | | | | | |
4.125%, 05/07/2028 | | | 2,000,000 | | | | 2,289,998 | |
Kellogg Co. | | | | | | | | |
4.300%, 05/15/2028 | | | 1,000,000 | | | | 1,148,097 | |
Coca-Cola Co., The | | | | | | | | |
2.125%, 09/06/2029 | | | 1,000,000 | | | | 1,016,881 | |
Kellogg Co. | | | | | | | | |
2.100%, 06/01/2030 | | | 500,000 | | | | 492,898 | |
Nestle Holdings Co. (b) | | | | | | | | |
1.250%, 09/15/2030 | | | 4,000,000 | | | | 3,773,596 | |
PepsiCo Inc. | | | | | | | | |
1.400%, 02/25/2031 | | | 1,500,000 | | | | 1,428,585 | |
Coca-Cola Co., The | | | | | | | | |
2.000%, 03/05/2031 | | | 3,000,000 | | | | 2,977,296 | |
1.375%, 03/15/2031 | | | 1,000,000 | | | | 937,403 | |
| | | | | | | | |
| | | | | | | 38,154,036 | |
| | | | | | | | |
Automotive (0.49%) | |
Daimler Finance NA LLC (b) | | | | | | | | |
2.000%, 07/06/2021 | | | 1,000,000 | | | | 1,001,711 | |
American Honda Finance Corp. | | | | | | | | |
1.650%, 07/12/2021 | | | 500,000 | | | | 500,787 | |
Toyota Motor Credit Corp. | | | | | | | | |
2.900%, 04/17/2024 | | | 1,000,000 | | | | 1,068,192 | |
BMW US Capital LLC (b) | | | | | | | | |
2.800%, 04/11/2026 | | | 500,000 | | | | 534,058 | |
American Honda Finance Corp. | | | | | | | | |
2.300%, 09/09/2026 | | | 1,000,000 | | | | 1,055,269 | |
BMW US Capital LLC (b) | | | | | | | | |
3.300%, 04/06/2027 | | | 1,000,000 | | | | 1,099,017 | |
| | |
| 10 | | See accompanying notes to financial statements. |
STATE FARM ASSOCIATES’ FUNDS TRUST BALANCED FUND
SCHEDULE OF INVESTMENTS (continued)
May 31, 2021
(Unaudited)
| | | | | | | | |
| | | Principal
amount | | | Value | |
Corporate Bonds (Cont.) | | | | | | | | |
Automotive (Cont.) | | | | | | | | |
Toyota Motor Credit Corp. | | | | | | | | |
3.050%, 01/11/2028 | | $ | 1,000,000 | | | $ | 1,085,182 | |
American Honda Finance Corp. | | | | | | | | |
3.500%, 02/15/2028 | | | 1,000,000 | | | | 1,109,695 | |
Daimler Finance NA LLC (b) | | | | | | | | |
3.750%, 02/22/2028 | | | 1,000,000 | | | | 1,108,716 | |
Toyota Motor Credit Corp. | | | | | | | | |
3.650%, 01/08/2029 | | | 1,000,000 | | | | 1,129,530 | |
Daimler Finance NA LLC (b) | | | | | | | | |
4.300%, 02/22/2029 | | | 1,000,000 | | | | 1,144,064 | |
2.450%, 03/02/2031 | | | 1,000,000 | | | | 1,009,310 | |
| | | | | | | | |
| | | | | | | 11,845,531 | |
| | | | | | | | |
Banks (0.77%) | | | | | | | | |
U.S. Bancorp | | | | | | | | |
3.000%, 03/15/2022 | | | 1,000,000 | | | | 1,020,576 | |
3.700%, 01/30/2024 | | | 500,000 | | | | 541,607 | |
Bank of New York Mellon Corp. | | | | | | | | |
3.650%, 02/04/2024 | | | 1,000,000 | | | | 1,083,321 | |
State Street Corp. | | | | | | | | |
3.300%, 12/16/2024 | | | 1,000,000 | | | | 1,097,060 | |
PNC Bank NA | | | | | | | | |
3.250%, 06/01/2025 | | | 500,000 | | | | 545,477 | |
State Street Corp. | | | | | | | | |
3.550%, 08/18/2025 | | | 500,000 | | | | 557,366 | |
Wells Fargo & Co. | | | | | | | | |
3.000%, 04/22/2026 | | | 1,000,000 | | | | 1,083,590 | |
Bank of New York Mellon Corp. | | | | | | | | |
2.800%, 05/04/2026 | | | 500,000 | | | | 540,633 | |
State Street Corp. | | | | | | | | |
2.650%, 05/19/2026 | | | 1,000,000 | | | | 1,079,040 | |
U.S. Bancorp | | | | | | | | |
2.375%, 07/22/2026 | | | 1,000,000 | | | | 1,059,171 | |
Bank of New York Mellon Corp. | | | | | | | | |
2.450%, 08/17/2026 | | | 500,000 | | | | 530,697 | |
Wells Fargo & Co. | | | | | | | | |
3.000%, 10/23/2026 | | | 1,500,000 | | | | 1,626,577 | |
U.S. Bancorp | | | | | | | | |
3.150%, 04/27/2027 | | | 1,000,000 | | | | 1,094,383 | |
PNC Bank NA | | | | | | | | |
3.100%, 10/25/2027 | | | 1,000,000 | | | | 1,097,254 | |
Bank of New York Mellon Corp. | | | | | | | | |
3.400%, 01/29/2028 | | | 2,000,000 | | | | 2,206,338 | |
U.S. Bancorp | | | | | | | | |
3.900%, 04/26/2028 | | | 1,000,000 | | | | 1,145,995 | |
Wells Fargo & Co. | | | | | | | | |
4.150%, 01/24/2029 | | | 1,000,000 | | | | 1,142,893 | |
Bank of America Corp. (c) | | | | | | | | |
3.974%, 02/07/2030 | | | 1,000,000 | | | | 1,122,303 | |
| | | | | | | | |
| | | | | | | 18,574,281 | |
| | | | | | | | |
Chemicals (0.50%) | | | | | | | | |
| | | | | | | | |
Praxair Inc. | | | | | | | | |
2.450%, 02/15/2022 | | | 1,000,000 | | | | 1,010,174 | |
2.700%, 02/21/2023 | | | 1,000,000 | | | | 1,034,867 | |
3.200%, 01/30/2026 | | | 1,000,000 | | | | 1,096,746 | |
| | | | | | | | |
| | | Principal
amount | | | Value | |
Corporate Bonds (Cont.) | | | | | | | | |
Chemicals (Cont.) | | | | | | | | |
Air Liquide Finance (b) | | | | | | | | |
2.500%, 09/27/2026 | | $ | 1,000,000 | | | $ | 1,064,331 | |
Ecolab Inc. | | | | | | | | |
2.700%, 11/01/2026 | | | 1,000,000 | | | | 1,074,927 | |
3.250%, 12/01/2027 | | | 1,500,000 | | | | 1,658,346 | |
PPG Industries Inc. | | | | | | | | |
3.750%, 03/15/2028 | | | 2,000,000 | | | | 2,255,280 | |
E.l. du Pont de Nemours and Co. | | | | | | | | |
2.300%, 07/15/2030 | | | 1,000,000 | | | | 1,011,928 | |
Ecolab Inc. | | | | | | | | |
1.300%, 01/30/2031 | | | 2,000,000 | | | | 1,851,750 | |
| | | | | | | | |
| | | | | | | 12,058,349 | |
| | | | | | | | |
Commercial Service/Supply (0.08%) | |
Cintas Corp. No. 2 | | | | | | | | |
3.250%, 06/01/2022 | | | 2,000,000 | | | | 2,043,438 | |
| | | | | | | | |
Computer Software & Services (0.68%) | |
Microsoft Corp. | | | | | | | | |
2.125%, 11/15/2022 | | | 2,000,000 | | | | 2,054,840 | |
Intel Corp. | | | | | | | | |
2.700%, 12/15/2022 | | | 1,000,000 | | | | 1,038,024 | |
Texas Instruments Inc. | | | | | | | | |
2.250%, 05/01/2023 | | | 3,000,000 | | | | 3,099,978 | |
Alphabet Inc. | | | | | | | | |
3.375%, 02/25/2024 | | | 1,000,000 | | | | 1,086,128 | |
Intel Corp. | | | | | | | | |
3.700%, 07/29/2025 | | | 1,000,000 | | | | 1,109,878 | |
Automatic Data Processing Inc. | | | | | | | | |
3.375%, 09/15/2025 | | | 1,000,000 | | | | 1,103,673 | |
Intel Corp. | | | | | | | | |
2.600%, 05/19/2026 | | | 1,000,000 | | | | 1,072,266 | |
Oracle Corp. | | | | | | | | |
2.650%, 07/15/2026 | | | 1,000,000 | | | | 1,059,904 | |
Microsoft Corp. | | | | | | | | |
2.400%, 08/08/2026 | | | 500,000 | | | | 533,492 | |
Alphabet Inc. | | | | | | | | |
1.998%, 08/15/2026 | | | 1,000,000 | | | | 1,049,240 | |
Microsoft Corp. | | | | | | | | |
3.300%, 02/06/2027 | | | 500,000 | | | | 556,800 | |
QUALCOMM Inc. | | | | | | | | |
3.250%, 05/20/2027 | | | 1,000,000 | | | | 1,106,096 | |
Texas Instruments Inc. | | | | | | | | |
2.900%, 11/03/2027 | | | 500,000 | | | | 545,431 | |
Oracle Corp. | | | | | | | | |
3.250%, 11/15/2027 | | | 1,000,000 | | | | 1,087,872 | |
| | | | | | | | |
| | | | | | | 16,503,622 | |
| | | | | | | | |
Computers (0.04%) | | | | | | | | |
International Business Machines Corp. | | | | | | | | |
1.950%, 05/15/2030 | | | 1,000,000 | | | | 985,964 | |
| | | | | | | | |
| | |
| See accompanying notes to financial statements. | | 11 |
STATE FARM ASSOCIATES’ FUNDS TRUST BALANCED FUND
SCHEDULE OF INVESTMENTS (continued)
May 31, 2021
(Unaudited)
| | | | | | | | |
| | | Principal
amount | | | Value | |
Corporate Bonds (Cont.) | | | | |
Consumer & Marketing (0.70%) | | | | | |
Procter & Gamble Co., The | | | | |
2.300%, 02/06/2022 | | $ | 1,000,000 | | | $ | 1,014,876 | |
Colgate-Palmolive Co. | | | | | | | | |
2.100%, 05/01/2023 | | | 2,000,000 | | | | 2,069,832 | |
NIKE Inc. | | | | | | | | |
2.250%, 05/01/2023 | | | 500,000 | | | | 516,874 | |
Reckitt Benckiser Treasury Services PLC (b) | | | | | | | | |
2.750%, 06/26/2024 | | | 1,000,000 | | | | 1,060,794 | |
Unilever Capital Corp. | | | | | | | | |
3.100%, 07/30/2025 | | | 1,000,000 | | | | 1,092,178 | |
Kimberly-Clark Corp. | | | | | | | | |
3.050%, 08/15/2025 | | | 1,000,000 | | | | 1,085,488 | |
Procter & Gamble Co., The | | | | | | | | |
2.700%, 02/02/2026 | | | 500,000 | | | | 541,837 | |
Kimberly-Clark Corp. | | | | | | | | |
2.750%, 02/15/2026 | | | 1,000,000 | | | | 1,081,108 | |
Unilever Capital Corp. | | | | | | | | |
2.000%, 07/28/2026 | | | 500,000 | | | | 522,037 | |
NIKE Inc. | | | | | | | | |
2.375%, 11/01/2026 | | | 1,000,000 | | | | 1,065,290 | |
Unilever Capital Corp. | | | | | | | | |
2.900%, 05/05/2027 | | | 500,000 | | | | 543,246 | |
Reckitt Benckiser Treasury Services PLC(b) | | | | | | | | |
3.000%, 06/26/2027 | | | 1,000,000 | | | | 1,087,314 | |
Clorox Co. | | | | | | | | |
3.100%, 10/01/2027 | | | 500,000 | | | | 544,380 | |
Unilever Capital Corp. | | | | | | | | |
3.500%, 03/22/2028 | | | 1,000,000 | | | | 1,114,430 | |
Clorox Co. | | | | | | | | |
3.900%, 05/15/2028 | | | 1,000,000 | | | | 1,129,458 | |
Estee Lauder Companies Inc., The | | | | | | | | |
2.375%, 12/01/2029 | | | 1,000,000 | | | | 1,031,913 | |
Unilever Capital Corp. | | | | | | | | |
1.375%, 09/14/2030 | | | 500,000 | | | | 475,545 | |
Estee Lauder Companies Inc., The | | | | | | | | |
1.950%, 03/15/2031 | | | 1,000,000 | | | | 982,471 | |
| | | | | | | | |
| | | | | | | 16,959,071 | |
| | | | | | | | |
Consumer Discretionary (0.07%) | | | | |
RELX Capital Inc. | | | | |
4.000%, 03/18/2029 | | | 1,000,000 | | | | 1,121,924 | |
3.000%, 05/22/2030 | | | 500,000 | | | | 524,523 | |
| | | | | | | | |
| | | | | | | 1,646,447 | |
| | | | | | | | |
Electronic/Electrical Manufacturing (0.57%) | |
Emerson Electric Co. | | | | |
2.625%, 12/01/2021 | | | 1,000,000 | | | | 1,010,107 | |
Siemens Financieringsmaatschappij NV (b) | | | | | | | | |
2.900%, 05/27/2022 | | | 500,000 | | | | 513,162 | |
Emerson Electric Co. | | | | | | | | |
2.625%, 02/15/2023 | | | 1,000,000 | | | | 1,035,047 | |
General Electric Co. | | | | | | | | |
3.375%, 03/11/2024 | | | 1,000,000 | | | | 1,075,556 | |
| | | | | | | | |
| | | Principal
amount | | | Value | |
Corporate Bonds (Cont.) | | | | |
Electronic/Electrical Manufacturing (Cont.) | |
Siemens Financieringsmaatschappij NV (b) | | | | |
3.250%, 05/27/2025 | | $ | 1,000,000 | | | $ | 1,088,020 | |
Emerson Electric Co. | | | | | | | | |
3.150%, 06/01/2025 | | | 1,000,000 | | | | 1,085,651 | |
Siemens Financieringsmaatschappij NV (b) | | | | | | | | |
2.350%, 10/15/2026 | | | 1,000,000 | | | | 1,049,371 | |
Honeywell International Inc. | | | | | | | | |
2.500%, 11/01/2026 | | | 2,000,000 | | | | 2,137,672 | |
ABB Finance (USA) Inc. | | | | | | | | |
3.800%, 04/03/2028 | | | 1,000,000 | | | | 1,134,063 | |
Rockwell Automation Inc. | | | | | | | | |
3.500%, 03/01/2029 | | | 1,000,000 | | | | 1,116,087 | |
Honeywell International Inc. | | | | | | | | |
1.950%, 06/01/2030 | | | 500,000 | | | | 500,771 | |
Emerson Electric Co. | | | | | | | | |
1.950%, 10/15/2030 | | | 1,000,000 | | | | 991,444 | |
Siemens Financieringsmaatschappij NV (b) | | | | | | | | |
2.150%, 03/11/2031 | | | 1,000,000 | | | | 991,884 | |
| | | | | | | | |
| | | | 13,728,835 | |
| | | | | | | | |
Financial Services (0.40%) | | | | |
Mastercard Inc. | | | | | | | | |
2.000%, 11/21/2021 | | | 500,000 | | | | 503,632 | |
Visa Inc. | | | | | | | | |
2.800%, 12/14/2022 | | | 1,000,000 | | | | 1,035,738 | |
JPMorgan Chase & Co. | | | | | | | | |
3.200%, 01/25/2023 | | | 1,000,000 | | | | 1,049,005 | |
3.625%, 05/13/2024 | | | 500,000 | | | | 545,678 | |
3.125%, 01/23/2025 | | | 1,000,000 | | | | 1,078,437 | |
GE Capital International Funding Co. | | | | | | | | |
3.373%, 11/15/2025 | | | 747,000 | | | | 816,493 | |
Visa Inc. | | | | | | | | |
3.150%, 12/14/2025 | | | 1,000,000 | | | | 1,096,878 | |
JPMorgan Chase & Co. | | | | | | | | |
3.300%, 04/01/2026 | | | 1,000,000 | | | | 1,098,186 | |
Mastercard Inc. | | | | | | | | |
2.950%, 11/21/2026 | | | 500,000 | | | | 545,448 | |
Visa Inc. | | | | | | | | |
1.100%, 02/15/2031 | | | 1,000,000 | | | | 929,846 | |
NTT Finance Corp.(b) | | | | | | | | |
2.065%, 04/03/2031 | | | 1,000,000 | | | | 995,620 | |
| | | | | | | | |
| | | | 9,694,961 | |
| | | | | | | | |
Health Care (1.91%) | | | | | | | | |
Abbott Laboratories | | | | | | | | |
2.550%, 03/15/2022 | | | 1,000,000 | | | | 1,018,711 | |
EMD Finance LLC (b) | | | | |
2.950%, 03/19/2022 | | | 1,000,000 | | | | 1,016,812 | |
Bayer US Finance II LLC (b) | | | | |
2.200%, 07/15/2022 | | | 1,300,000 | | | | 1,317,308 | |
Bristol-Myers Squibb Co. | | | | |
2.000%, 08/01/2022 | | | 1,500,000 | | | | 1,531,503 | |
| | |
| 12 | | See accompanying notes to financial statements. |
STATE FARM ASSOCIATES’ FUNDS TRUST BALANCED FUND
SCHEDULE OF INVESTMENTS (continued)
May 31, 2021
(Unaudited)
| | | | | | | | |
| | | Principal
amount | | | Value | |
Corporate Bonds (Cont.) | | | | | | | | |
Health Care (Cont.) | | | | | | | | |
Merck & Co. Inc. | | | | | | | | |
2.400%, 09/15/2022 | | $ | 1,000,000 | | | $ | 1,022,830 | |
Novartis Capital Corp. | | | | | | | | |
2.400%, 09/21/2022 | | | 1,000,000 | | | | 1,029,356 | |
GlaxoSmithKline Capital Inc. | | | | | | | | |
2.800%, 03/18/2023 | | | 1,000,000 | | | | 1,045,276 | |
Merck & Co. Inc. | | | | | | | | |
2.800%, 05/18/2023 | | | 2,000,000 | | | | 2,098,310 | |
Novartis Capital Corp. | | | | | | | | |
3.400%, 05/06/2024 | | | 1,500,000 | | | | 1,633,176 | |
Stryker Corp. | | | | | | | | |
3.375%, 05/15/2024 | | | 1,000,000 | | | | 1,080,616 | |
Pfizer Inc. | | | | | | | | |
3.400%, 05/15/2024 | | | 1,000,000 | | | | 1,091,325 | |
Amgen Inc. | | | | | | | | |
3.625%, 05/22/2024 | | | 1,000,000 | | | | 1,085,240 | |
Bayer U.S. Finance LLC (b) | | | | | | | | |
3.375%, 10/08/2024 | | | 1,000,000 | | | | 1,082,057 | |
Abbott Laboratories | | | | | | | | |
2.950%, 03/15/2025 | | | 1,000,000 | | | | 1,078,710 | |
EMD Finance LLC(b) | | | | | | | | |
3.250%, 03/19/2025 | | | 1,000,000 | | | | 1,080,657 | |
Bayer US Finance II LLC (b) | | | | | | | | |
2.850%, 04/15/2025 | | | 1,000,000 | | | | 1,041,125 | |
Eli Lilly and Co. | | | | | | | | |
2.750%, 06/01/2025 | | | 472,000 | | | | 506,455 | |
AstraZeneca PLC | | | | | | | | |
3.375%, 11/16/2025 | | | 1,000,000 | | | | 1,099,409 | |
Novartis Capital Corp. | | | | | | | | |
3.000%, 11/20/2025 | | | 1,000,000 | | | | 1,089,494 | |
Johnson & Johnson | | | | | | | | |
2.450%, 03/01/2026 | | | 500,000 | | | | 535,465 | |
Stryker Corp. | | | | | | | | |
3.500%, 03/15/2026 | | | 1,000,000 | | | | 1,103,432 | |
Roche Holdings lnc. (b) | | | | | | | | |
2.625%, 05/15/2026 | | | 500,000 | | | | 536,733 | |
Amgen Inc. | | | | | | | | |
2.600%, 08/19/2026 | | | 1,000,000 | | | | 1,063,635 | |
Roche Holdings lnc.(b) | | | | | | | | |
2.375%, 01/28/2027 | | | 1,000,000 | | | | 1,058,610 | |
Eli Lilly and Co. | | | | | | | | |
3.100%, 05/15/2027 | | | 500,000 | | | | 546,988 | |
AstraZeneca PLC | | | | | | | | |
3.125%, 06/12/2027 | | | 1,000,000 | | | | 1,093,029 | |
Amgen Inc. | | | | | | | | |
3.200%, 11/02/2027 | | | 1,000,000 | | | | 1,096,435 | |
Johnson & Johnson | | | | | | | | |
2.900%, 01/15/2028 | | | 2,000,000 | | | | 2,187,042 | |
Stryker Corp. | | | | | | | | |
3.650%, 03/07/2028 | | | 1,000,000 | | | | 1,111,212 | |
GlaxoSmithKline Capital Inc. | | | | | | | | |
3.875%, 05/15/2028 | | | 2,000,000 | | | | 2,272,146 | |
Sanofi | | | | | | | | |
3.625%, 06/19/2028 | | | 1,500,000 | | | | 1,688,250 | |
Merck & Co. Inc. | | | | | | | | |
3.400%, 03/07/2029 | | | 1,000,000 | | | | 1,112,469 | |
| | | | | | | | |
| | | Principal
amount | | | Value | |
Corporate Bonds (Cont.) | | | | | | | | |
Health Care (Cont.) | | | | | | | | |
Eli Lilly and Co. | | | | | | | | |
3.375%, 03/15/2029 | | $ | 1,000,000 | | | $ | 1,108,239 | |
Pfizer Inc. | | | | | | | | |
3.450%, 03/15/2029 | | | 1,000,000 | | | | 1,112,582 | |
Bristol-Myers Squibb Co. | | | | | | | | |
3.400%, 07/26/2029 | | | 2,000,000 | | | | 2,217,916 | |
Thermo Fisher Scientific Inc. | | | | | | | | |
2.600%, 10/01/2029 | | | 1,000,000 | | | | 1,036,287 | |
Merck & Co. Inc. | | | | | | | | |
1.450%, 06/24/2030 | | | 500,000 | | | | 480,949 | |
AstraZeneca PLC | | | | | | | | |
1.375%, 08/06/2030 | | | 1,000,000 | | | | 939,108 | |
Johnson & Johnson | | | | | | | | |
1.300%, 09/01/2030 | | | 2,000,000 | | | | 1,916,042 | |
| | | | | | | | |
| | | | | | | 46,164,939 | |
| | | | | | | | |
Machinery & Manufacturing (0.62%) | |
John Deere Capital Corp. | | | | | | | | |
2.750%, 03/15/2022 | | | 500,000 | | | | 509,938 | |
Deere & Co. | | | | | | | | |
2.600%, 06/08/2022 | | | 1,000,000 | | | | 1,018,879 | |
Caterpillar Financial Services Corp. | | | | | | | | |
2.625%, 03/01/2023 | | | 1,000,000 | | | | 1,041,586 | |
Caterpillar Inc. | | | | | | | | |
3.400%, 05/15/2024 | | | 1,000,000 | | | | 1,082,265 | |
John Deere Capital Corp. | | | | | | | | |
3.350%, 06/12/2024 | | | 1,500,000 | | | | 1,627,519 | |
Caterpillar Financial Services Corp. | | | | | | | | |
3.250%, 12/01/2024 | | | 1,000,000 | | | | 1,091,908 | |
3M Co. | | | | | | | | |
3.000%, 08/07/2025 | | | 1,000,000 | | | | 1,092,811 | |
Dover Corp. | | | | | | | | |
3.150%, 11/15/2025 | | | 1,000,000 | | | | 1,079,188 | |
3M Co. | | | | | | | | |
2.250%, 09/19/2026 | | | 500,000 | | | | 531,184 | |
Eaton Corp. | | | | | | | | |
3.103%, 09/15/2027 | | | 1,000,000 | | | | 1,090,140 | |
John Deere Capital Corp. | | | | | | | | |
3.050%, 01/06/2028 | | | 1,000,000 | | | | 1,085,327 | |
3M Co. | | | | | | | | |
3.375%, 03/01/2029 | | | 1,000,000 | | | | 1,109,590 | |
Caterpillar Inc. | | | | | | | | |
2.600%, 09/19/2029 | | | 1,000,000 | | | | 1,056,525 | |
John Deere Capital Corp. | | | | | | | | |
2.450%, 01/09/2030 | | | 1,000,000 | | | | 1,037,485 | |
Equinor ASA | | | | | | | | |
2.375%, 05/22/2030 | | | 500,000 | | | | 509,361 | |
| | | | | | | | |
| | | | | | | 14,963,706 | |
| | | | | | | | |
Media & Broadcasting (0.21%) | |
Comcast Corp. | | | | | | | | |
3.600%, 03/01/2024 | | | 1,000,000 | | | | 1,087,096 | |
2.350%, 01/15/2027 | | | 1,000,000 | | | | 1,049,159 | |
S&P Global Inc. | | | | | | | | |
2.500%, 12/01/2029 | | | 1,000,000 | | | | 1,032,840 | |
| | |
| See accompanying notes to financial statements. | | 13 |
STATE FARM ASSOCIATES’ FUNDS TRUST BALANCED FUND
SCHEDULE OF INVESTMENTS (continued)
May 31, 2021
(Unaudited)
| | | | | | | | |
| | | Principal
amount | | | Value | |
Corporate Bonds (Cont.) | | | | | | | | |
Media & Broadcasting (Cont.) | | | | | |
1.250%, 08/15/2030 | | $ | 1,000,000 | | | $ | 925,978 | |
Comcast Corp. | | | | | | | | |
1.500%, 02/15/2031 | | | 1,000,000 | | | | 930,259 | |
| | | | | | | | |
| | | | | | | 5,025,332 | |
| | | | | | | | |
Mining & Metals (0.09%) | | | | | |
BHP Billiton Finance USA Ltd. | | | | | | | | |
3.250%, 11/21/2021 | | | 1,000,000 | | | | 1,014,394 | |
Rio Tinto Finance USA Ltd. | | | | | | | | |
3.750%, 06/15/2025 | | | 1,000,000 | | | | 1,109,671 | |
| | | | | | | | |
| | | | | | | 2,124,065 | |
| | | | | | | | |
Oil & Gas (1.06%) | | | | | |
Total Capital International SA | | | | | |
2.750%, 06/19/2021 | | | 1,000,000 | | | | 1,001,233 | |
TransCanada PipeLines Ltd. | | | | | | | | |
2.500%, 08/01/2022 | | | 2,000,000 | | | | 2,051,272 | |
Shell International Finance | | | | | | | | |
2.375%, 08/21/2022 | | | 1,000,000 | | | | 1,026,419 | |
Total Capital International SA | | | | | | | | |
2.700%, 01/25/2023 | | | 1,000,000 | | | | 1,040,229 | |
Occidental Petroleum Corp. | | | | | | | | |
2.700%, 02/15/2023 | | | 2,000,000 | | | | 2,010,000 | |
Chevron Corp. | | | | | | | | |
3.191%, 06/24/2023 | | | 1,000,000 | | | | 1,051,323 | |
Total Capital Canada Ltd. | | | | | | | | |
2.750%, 07/15/2023 | | | 500,000 | | | | 526,053 | |
Schlumberger Investment SA | | | | | | | | |
3.650%, 12/01/2023 | | | 1,000,000 | | | | 1,071,610 | |
Exxon Mobil Corp. | | | | | | | | |
3.176%, 03/15/2024 | | | 2,000,000 | | | | 2,142,248 | |
2.709%, 03/06/2025 | | | 1,000,000 | | | | 1,070,748 | |
Shell International Finance | | | | | | | | |
3.250%, 05/11/2025 | | | 1,000,000 | | | | 1,092,049 | |
Occidental Petroleum Corp. | | | | | | | | |
3.500%, 06/15/2025 | | | 500,000 | | | | 499,760 | |
Chevron Corp. | | | | | | | | |
3.326%, 11/17/2025 | | | 1,000,000 | | | | 1,105,587 | |
TransCanada PipeLines Ltd. | | | | | | | | |
4.875%, 01/15/2026 | | | 1,000,000 | | | | 1,155,251 | |
Shell International Finance | | | | | | | | |
2.875%, 05/10/2026 | | | 1,000,000 | | | | 1,085,900 | |
Baker Hughes, a GE Co., LLC / Baker Hughes Co-Obligor, Inc. | | | | | | | | |
3.337%, 12/15/2027 | | | 1,000,000 | | | | 1,096,524 | |
Sabal Trail Transmission
LLC(b) | | | | | | | | |
4.246%, 05/01/2028 | | | 1,000,000 | | | | 1,121,619 | |
TransCanada PipeLines Ltd. | | | | | | | | |
4.250%, 05/15/2028 | | | 1,000,000 | | | | 1,140,579 | |
Total Capital International SA | | | | | | | | |
3.455%, 02/19/2029 | | | 1,000,000 | | | | 1,100,985 | |
Exxon Mobil Corp. | | | | | | | | |
3.482%, 03/19/2030 | | | 1,000,000 | | | | 1,106,078 | |
| | | | | | | | |
| | | Principal
amount | | | Value | |
Corporate Bonds (Cont.) | | | | | | | | |
Oil & Gas (Cont.) | | | | | |
Shell International Finance | | | | | | | | |
2.750%, 04/06/2030 | | $ | 1,000,000 | | | $ | 1,050,931 | |
Schlumberger Investment SA | | | | | | | | |
2.650%, 06/26/2030 | | | 1,000,000 | | | | 1,030,571 | |
| | | | | | | | |
| | | | | | | 25,576,969 | |
| | | | | | | | |
Retailers (0.67%) | | | | | |
Home Depot Inc. | | | | | | | | |
2.625%, 06/01/2022 | | | 500,000 | | | | 511,335 | |
CVS Health Corp. | | | | | | | | |
3.500%, 07/20/2022 | | | 1,000,000 | | | | 1,031,280 | |
Wal-Mart Stores Inc. | | | | | | | | |
2.550%, 04/11/2023 | | | 1,000,000 | | | | 1,038,859 | |
3.300%, 04/22/2024 | | | 500,000 | | | | 538,781 | |
Costco Wholesale Corp. | | | | | | | | |
2.750%, 05/18/2024 | | | 1,000,000 | | | | 1,066,420 | |
McDonald’s Corp. | | | | | | | | |
3.250%, 06/10/2024 | | | 1,000,000 | | | | 1,078,423 | |
Target Corp. | | | | | | | | |
3.500%, 07/01/2024 | | | 1,000,000 | | | | 1,089,738 | |
Home Depot Inc. | | | | | | | | |
3.350%, 09/15/2025 | | | 1,000,000 | | | | 1,100,784 | |
Lowe’s Companies Inc. | | | | | | | | |
3.375%, 09/15/2025 | | | 1,000,000 | | | | 1,097,222 | |
Home Depot Inc. | | | | | | | | |
3.000%, 04/01/2026 | | | 1,000,000 | | | | 1,091,010 | |
Lowe’s Companies Inc. | | | | | | | | |
2.500%, 04/15/2026 | | | 1,000,000 | | | | 1,062,045 | |
Target Corp. | | | | | | | | |
2.500%, 04/15/2026 | | | 1,000,000 | | | | 1,073,213 | |
TJX Companies Inc., The | | | | | | | | |
2.250%, 09/15/2026 | | | 1,000,000 | | | | 1,057,376 | |
Costco Wholesale Corp. | | | | | | | | |
3.000%, 05/18/2027 | | | 1,000,000 | | | | 1,097,906 | |
Amazon.com Inc. | | | | | | | | |
3.150%, 08/22/2027 | | | 1,000,000 | | | | 1,103,625 | |
McDonald’s Corp. | | | | | | | | |
3.800%, 04/01/2028 | | | 1,000,000 | | | | 1,121,036 | |
| | | | | | | | |
| | | | | | | 16,159,053 | |
| | | | | | | | |
Telecom & Telecom Equipment (0.42%) | | | | | |
Cisco Systems Inc. | | | | | | | | |
3.625%, 03/04/2024 | | | 1,000,000 | | | | 1,089,326 | |
Verizon Communications Inc. | | | | | | | | |
4.150%, 03/15/2024 | | | 1,000,000 | | | | 1,090,992 | |
Cisco Systems Inc. | | | | | | | | |
3.500%, 06/15/2025 | | | 500,000 | | | | 553,889 | |
2.950%, 02/28/2026 | | | 500,000 | | | | 545,932 | |
Verizon Communications Inc. | | | | | | | | |
2.625%, 08/15/2026 | | | 1,000,000 | | | | 1,062,889 | |
AT&T Inc. | | | | | | | | |
1.650%, 02/01/2028 | | | 2,000,000 | | | | 1,974,054 | |
Vodafone Group PLC | | | | | | | | |
4.375%, 05/30/2028 | | | 1,000,000 | | | | 1,151,886 | |
Verizon Communications Inc. | | | | | | | | |
4.329%, 09/21/2028 | | | 1,012,000 | | | | 1,163,903 | |
| | |
| 14 | | See accompanying notes to financial statements. |
STATE FARM ASSOCIATES’ FUNDS TRUST BALANCED FUND
SCHEDULE OF INVESTMENTS (continued)
May 31, 2021
(Unaudited)
| | | | | | | | |
| | | Principal
amount | | | Value | |
Corporate Bonds (Cont.) | | | | | | | | |
Telecom & Telecom Equipment (Cont.) | | | | | |
3.875%, 02/08/2029 | | $ | 1,000,000 | | | $ | 1,128,594 | |
AT&T Inc. | | | | | | | | |
4.350%, 03/01/2029 | | | 500,000 | | | | 572,277 | |
| | | | | | | | |
| | | | | | | 10,333,742 | |
| | | | | | | | |
Transportation (0.71%) | |
Burlington Northern Santa Fe | | | | | | | | |
3.050%, 09/01/2022 | | | 500,000 | | | | 513,961 | |
United Parcel Service Inc. | | | | | | | | |
2.450%, 10/01/2022 | | | 1,000,000 | | | | 1,029,836 | |
Burlington Northern Santa Fe | | | | | | | | |
3.000%, 03/15/2023 | | | 1,500,000 | | | | 1,562,452 | |
Union Pacific Corp. | | | | | | | | |
2.750%, 04/15/2023 | | | 500,000 | | | | 519,623 | |
Norfolk Southern Corp. | | | | | | | | |
3.850%, 01/15/2024 | | | 1,000,000 | | | | 1,077,842 | |
Burlington Northern Santa Fe | | | | | | | | |
3.750%, 04/01/2024 | | | 1,000,000 | | | | 1,085,282 | |
Union Pacific Corp. | | | | | | | | |
3.250%, 08/15/2025 | | | 500,000 | | | | 543,904 | |
Canadian National Railway Co. | | | | | | | | |
2.750%, 03/01/2026 | | | 2,000,000 | | | | 2,141,064 | |
Union Pacific Corp. | | | | | | | | |
2.750%, 03/01/2026 | | | 1,000,000 | | | | 1,071,293 | |
Norfolk Southern Corp. | | | | | | | | |
2.900%, 06/15/2026 | | | 500,000 | | | | 539,653 | |
United Parcel Service Inc. | | | | | | | | |
2.400%, 11/15/2026 | | | 500,000 | | | | 534,024 | |
Union Pacific Corp. | | | | | | | | |
3.000%, 04/15/2027 | | | 1,000,000 | | | | 1,083,463 | |
Norfolk Southern Corp. | | | | | | | | |
3.150%, 06/01/2027 | | | 500,000 | | | | 544,650 | |
United Parcel Service Inc. | | | | | | | | |
3.050%, 11/15/2027 | | | 2,000,000 | | | | 2,220,938 | |
Union Pacific Corp. | | | | | | | | |
3.950%, 09/10/2028 | | | 1,000,000 | | | | 1,138,199 | |
3.700%, 03/01/2029 | | | 500,000 | | | | 557,095 | |
United Parcel Service Inc. | | | | | | | | |
2.500%, 09/01/2029 | | | 1,000,000 | | | | 1,045,570 | |
| | | | | | | | |
| | | | | | | 17,208,849 | |
| | | | | | | | |
Utilities & Energy (3.97%) | |
Southern California Edison Co. | | | | | | | | |
3.875%, 06/01/2021 | | | 2,000,000 | | | | 2,000,000 | |
San Diego Gas & Electric Co. | | | | | | | | |
3.000%, 08/15/2021 | | | 500,000 | | | | 502,879 | |
Southern California Edison Co. | | | | | | | | |
2.400%, 02/01/2022 | | | 1,000,000 | | | | 1,010,474 | |
Carolina Power & Light Co. | | | | | | | | |
2.800%, 05/15/2022 | | | 1,000,000 | | | | 1,018,183 | |
Georgia Power Co. | | | | | | | | |
2.850%, 05/15/2022 | | | 1,000,000 | | | | 1,024,971 | |
Detroit Edison Co. | | | | | | | | |
2.650%, 06/15/2022 | | | 500,000 | | | | 509,537 | |
CenterPoint Energy Houston LLC | | | | | | | | |
2.250%, 08/01/2022 | | | 1,000,000 | | | | 1,017,573 | |
| | | | | | | | |
| | | Principal
amount | | | Value | |
Corporate Bonds (Cont.) | | | | | | | | |
Utilities & Energy (Cont.) | | | | | | | | |
Northern States Power Co. | | | | | | | | |
2.150%, 08/15/2022 | | $ | 500,000 | | | $ | 506,566 | |
Baltimore Gas & Electric Co. | | | | | | | | |
2.800%, 08/15/2022 | | | 1,000,000 | | | | 1,023,464 | |
PPL Electric Utilities | | | | | | | | |
2.500%, 09/01/2022 | | | 1,000,000 | | | | 1,020,782 | |
Ameren Illinois Co. | | | | | | | | |
2.700%, 09/01/2022 | | | 1,000,000 | | | | 1,024,458 | |
Public Service Company of Colorado | | | | | | | | |
2.250%, 09/15/2022 | | | 1,000,000 | | | | 1,015,699 | |
Tampa Electric Co. | | | | | | | | |
2.600%, 09/15/2022 | | | 500,000 | | | | 510,891 | |
NSTAR Electric Co. | | | | | | | | |
2.375%, 10/15/2022 | | | 500,000 | | | | 511,461 | |
Public Service Company of Colorado | | | | | | | | |
2.500%, 03/15/2023 | | | 1,000,000 | | | | 1,028,381 | |
Virginia Electric & Power Co. | | | | | | | | |
2.750%, 03/15/2023 | | | 1,000,000 | | | | 1,038,383 | |
Public Service Electric and Gas Co. | | | | | | | | |
2.375%, 05/15/2023 | | | 2,000,000 | | | | 2,074,348 | |
Florida Power & Light Co. | | | | | | | | |
2.750%, 06/01/2023 | | | 2,000,000 | | | | 2,077,452 | |
Pacificorp | | | | | | | | |
2.950%, 06/01/2023 | | | 1,000,000 | | | | 1,043,828 | |
Pacific Gas & Electric | | | | | | | | |
3.250%, 06/15/2023 | | | 1,000,000 | | | | 1,035,007 | |
Consumers Energy Co. | | | | | | | | |
3.375%, 08/15/2023 | | | 1,000,000 | | | | 1,057,942 | |
Laclede Gas Co. | | | | | | | | |
3.400%, 08/15/2023 | | | 1,000,000 | | | | 1,058,067 | |
San Diego Gas & Electric Co. | | | | | | | | |
3.600%, 09/01/2023 | | | 2,000,000 | | | | 2,122,130 | |
Duke Energy Ohio Inc. | | | | | | | | |
3.800%, 09/01/2023 | | | 1,000,000 | | | | 1,066,762 | |
Public Service Company of New Hampshire | | | | | | | | |
3.500%, 11/01/2023 | | | 500,000 | | | | 533,406 | |
Delmarva Power & Light Co. | | | | | | | | |
3.500%, 11/15/2023 | | | 1,000,000 | | | | 1,069,447 | |
Alabama Power Co. | | | | | | | | |
3.550%, 12/01/2023 | | | 1,000,000 | | | | 1,076,653 | |
Virginia Electric & Power Co. | | | | | | | | |
3.450%, 02/15/2024 | | | 1,000,000 | | | | 1,071,484 | |
Potomac Electric Power Co. | | | | | | | | |
3.600%, 03/15/2024 | | | 1,000,000 | | | | 1,075,406 | |
DTE Electric Co. | | | | | | | | |
3.650%, 03/15/2024 | | | 2,000,000 | | | | 2,154,804 | |
Florida Power & Light Co. | | | | | | | | |
3.250%, 06/01/2024 | | | 1,000,000 | | | | 1,070,474 | |
Interstate Power & Light Co. | | | | | | | | |
3.250%, 12/01/2024 | | | 1,000,000 | | | | 1,079,001 | |
DTE Electric Co. | | | | | | | | |
3.375%, 03/01/2025 | | | 1,000,000 | | | | 1,088,691 | |
Alabama Power Co. | | | | | | | | |
2.800%, 04/01/2025 | | | 1,000,000 | | | | 1,057,692 | |
| | |
| See accompanying notes to financial statements. | | 15 |
STATE FARM ASSOCIATES’ FUNDS TRUST BALANCED FUND
SCHEDULE OF INVESTMENTS (continued)
May 31, 2021
(Unaudited)
| | | | | | | | |
| | | Principal
amount | | | Value | |
Corporate Bonds (Cont.) | | | | | | | | |
Utilities & Energy (Cont.) | | | | | | | | |
Public Service Company of Colorado | | | | | | | | |
2.900%, 05/15/2025 | | $ | 1,000,000 | | | $ | 1,062,925 | |
Arizona Public Service Co. | | | | | | | | |
3.150%, 05/15/2025 | | | 500,000 | | | | 538,363 | |
Wisconsin Electric Power | | | | | | | | |
3.100%, 06/01/2025 | | | 1,000,000 | | | | 1,074,729 | |
Southern California Gas Co. | | | | | | | | |
3.200%, 06/15/2025 | | | 500,000 | | | | 540,921 | |
Pacific Gas & Electric | | | | | | | | |
3.500%, 06/15/2025 | | | 1,000,000 | | | | 1,054,147 | |
3.450%, 07/01/2025 | | | 500,000 | | | | 524,201 | |
Duke Energy Progress LLC | | | | | | | | |
3.250%, 08/15/2025 | | | 1,000,000 | | | | 1,092,855 | |
Interstate Power & Light Co. | | | | | | | | |
3.400%, 08/15/2025 | | | 1,000,000 | | | | 1,083,055 | |
Kentucky Utilities Co. | | | | | | | | |
3.300%, 10/01/2025 | | | 500,000 | | | | 543,133 | |
Louisville Gas & Electric Co. | | | | | | | | |
3.300%, 10/01/2025 | | | 1,000,000 | | | | 1,085,431 | |
PECO Energy Co. | | | | | | | | |
3.150%, 10/15/2025 | | | 1,000,000 | | | | 1,079,306 | |
NSTAR Electric Co. | | | | | | | | |
3.250%, 11/15/2025 | | | 1,000,000 | | | | 1,083,046 | |
Florida Power & Light Co. | | | | | | | | |
3.125%, 12/01/2025 | | | 1,000,000 | | | | 1,091,667 | |
Virginia Electric & Power Co. | | | | | | | | |
3.150%, 01/15/2026 | | | 1,000,000 | | | | 1,093,333 | |
Brooklyn Union Gas Co.,
The (b) | | | | | | | | |
3.407%, 03/10/2026 | | | 1,000,000 | | | | 1,081,799 | |
Georgia Power Co. | | | | | | | | |
3.250%, 04/01/2026 | | | 1,000,000 | | | | 1,081,230 | |
San Diego Gas & Electric Co. | | | | | | | | |
2.500%, 05/15/2026 | | | 1,000,000 | | | | 1,059,666 | |
NSTAR Electric Co. | | | | | | | | |
2.700%, 06/01/2026 | | | 1,000,000 | | | | 1,060,329 | |
Commonwealth Edison Co. | | | | | | | | |
2.550%, 06/15/2026 | | | 1,000,000 | | | | 1,063,705 | |
Southern California Gas Co. | | | | | | | | |
2.600%, 06/15/2026 | | | 1,000,000 | | | | 1,059,952 | |
Westar Energy Inc. | | | | | | | | |
2.550%, 07/01/2026 | | | 1,000,000 | | | | 1,060,803 | |
KeySpan Gas East Corp. (b) | | | | | | | | |
2.742%, 08/15/2026 | | | 1,000,000 | | | | 1,057,394 | |
CenterPoint Energy Houston Electric LLC | | | | | | | | |
2.400%, 09/01/2026 | | | 500,000 | | | | 527,770 | |
Public Service Electric and Gas Co. | | | | | | | | |
2.250%, 09/15/2026 | | | 1,000,000 | | | | 1,053,113 | |
Consolidated Edison Co. of New York | | | | | | | | |
2.900%, 12/01/2026 | | | 500,000 | | | | 537,882 | |
Duke Energy Carolinas | | | | | | | | |
2.950%, 12/01/2026 | | | 1,000,000 | | | | 1,087,210 | |
AEP Transmission Company LLC | | | | | | | | |
3.100%, 12/01/2026 | | | 500,000 | | | | 544,510 | |
Westar Energy Inc. | | | | | | | | |
3.100%, 04/01/2027 | | | 1,000,000 | | | | 1,085,238 | |
| | | | | | | | |
| | | Principal
amount | | | Value | |
Corporate Bonds (Cont.) | | | | | | | | |
Utilities & Energy (Cont.) | | | | | | | | |
Public Service Electric and Gas Co. | | | | | | | | |
3.000%, 05/15/2027 | | $ | 500,000 | | | $ | 542,008 | |
NSTAR Electric Co. | | | | | | | | |
3.200%, 05/15/2027 | | | 1,000,000 | | | | 1,096,578 | |
Rochester Gas & Electric Corp. (b) | | | | | | | | |
3.100%, 06/01/2027 | | | 1,000,000 | | | | 1,085,412 | |
Appalachian Power Co. | | | | | | | | |
3.300%, 06/01/2027 | | | 1,000,000 | | | | 1,087,975 | |
Union Electric Co. | | | | | | | | |
2.950%, 06/15/2027 | | | 1,000,000 | | | | 1,078,594 | |
Atmos Energy Corp. | | | | | | | | |
3.000%, 06/15/2027 | | | 1,000,000 | | | | 1,083,966 | |
Boston Gas Co. (b) | | | | | | | | |
3.150%, 08/01/2027 | | | 500,000 | | | | 537,734 | |
Commonwealth Edison Co. | | | | | | | | |
2.950%, 08/15/2027 | | | 500,000 | | | | 542,437 | |
Wisconsin Power & Light | | | | | | | | |
3.050%, 10/15/2027 | | | 1,000,000 | | | | 1,084,356 | |
Consolidated Edison Co. of New York | | | | | | | | |
3.125%, 11/15/2027 | | | 1,000,000 | | | | 1,085,716 | |
Pacific Gas & Electric | | | | | | | | |
3.300%, 12/01/2027 | | | 1,000,000 | | | | 1,030,211 | |
Southern California Edison Co. | | | | | | | | |
3.650%, 03/01/2028 | | | 1,000,000 | | | | 1,086,785 | |
Southwest Gas Corp. | | | | | | | | |
3.700%, 04/01/2028 | | | 1,000,000 | | | | 1,095,004 | |
Virginia Electric & Power Co. | | | | | | | | |
3.800%, 04/01/2028 | | | 1,000,000 | | | | 1,122,006 | |
Public Service Electric and Gas Co. | | | | | | | | |
3.700%, 05/01/2028 | | | 1,000,000 | | | | 1,122,645 | |
Ameren Illinois Co. | | | | | | | | |
3.800%, 05/15/2028 | | | 1,000,000 | | | | 1,120,489 | |
Consolidated Edison Co. of New York | | | | | | | | |
3.800%, 05/15/2028 | | | 1,000,000 | | | | 1,116,967 | |
Indiana Michigan Power Co. | | | | | | | | |
3.850%, 05/15/2028 | | | 1,000,000 | | | | 1,115,073 | |
AEP Texas Central Co. | | | | | | | | |
3.950%, 06/01/2028 | | | 1,000,000 | | | | 1,115,816 | |
Pacific Gas & Electric | | | | | | | | |
3.750%, 07/01/2028 | | | 500,000 | | | | 520,486 | |
Duke Energy Ohio Inc. | | | | | | | | |
3.650%, 02/01/2029 | | | 1,000,000 | | | | 1,099,900 | |
Brooklyn Union Gas Co., The(b) | | | | | | | | |
3.865%, 03/04/2029 | | | 1,000,000 | | | | 1,102,932 | |
Union Electric Co. | | | | | | | | |
3.500%, 03/15/2029 | | | 1,000,000 | | | | 1,098,988 | |
MidAmerican Energy Co. | | | | | | | | |
3.650%, 04/15/2029 | | | 2,000,000 | | | | 2,244,342 | |
Atmos Energy Corp. | | | | | | | | |
2.625%, 09/15/2029 | | | 1,000,000 | | | | 1,032,317 | |
EVERGY METRO | | | | | | | | |
2.250%, 06/01/2030 | | | 500,000 | | | | 501,264 | |
Interstate Power & Light Co. | | | | | | | | |
2.300%, 06/01/2030 | | | 500,000 | | | | 500,063 | |
Southwest Gas Corp. | | | | | | | | |
2.200%, 06/15/2030 | | | 500,000 | | | | 492,592 | |
| | |
| 16 | | See accompanying notes to financial statements. |
STATE FARM ASSOCIATES’ FUNDS TRUST BALANCED FUND
SCHEDULE OF INVESTMENTS (continued)
May 31, 2021
(Unaudited)
| | | | | | | | |
| | | Principal
amount | | | Value | |
Corporate Bonds (Cont.) | |
Utilities & Energy (Cont.) | |
Alabama Power Co. | | | | | | | | |
1.450%, 09/15/2030 | | $ | 1,500,000 | | | $ | 1,407,108 | |
Public Service Company of Colorado | | | | | | | | |
1.875%, 06/15/2031 | | | 3,000,000 | | | | 2,925,066 | |
| | | | | | | | |
| | | | | | | 95,958,839 | |
| | | | | | | | |
Total Corporate Bonds | | | | | | | | |
(cost $368,056,929) | | | | | | | 391,318,062 | |
| | | | | | | | |
Foreign Government Bonds (0.09%) | |
Province of Ontario | | | | | |
2.500%, 04/27/2026 | | | 1,000,000 | | | | 1,072,440 | |
Province of Quebec | | | | | | | | |
2.500%, 04/20/2026 | | | 1,000,000 | | | | 1,074,880 | |
| | | | | | | | |
Total Foreign Government Bonds | |
(cost $1,996,514) | | | | | | | 2,147,320 | |
| | | | | | | | |
Agency Commercial Mortgage-Backed
Securities (d) (3.26%) | |
Federal Home Loan Mortgage Corp. | |
Series K018, Class A2, | |
2.789%, 01/25/2022 | | | 8,301,802 | | | | 8,404,553 | |
Series KSMC, Class A2, | | | | | | | | |
2.615%, 01/25/2023 | | | 2,000,000 | | | | 2,076,442 | |
Series K029, Class A1, | | | | | | | | |
2.839%, 10/25/2022 | | | 1,124,957 | | | | 1,135,866 | |
Series K044, Class A2, | | | | | | | | |
2.811%, 01/25/2025 | | | 2,000,000 | | | | 2,148,464 | |
Series K049, Class A2, | | | | | | | | |
3.010%, 07/25/2025 | | | 2,000,000 | | | | 2,173,898 | |
Series K054, Class A2, | | | | | | | | |
2.745%, 01/25/2026 | | | 500,000 | | | | 540,626 | |
Series K055, Class A2, | | | | | | | | |
2.673%, 03/25/2026 | | | 2,000,000 | | | | 2,158,846 | |
Series K722, Class A2, | | | | | | | | |
2.406%, 03/25/2023 | | | 1,000,000 | | | | 1,031,985 | |
Series K056, Class A2, | | | | | | | | |
2.525%, 05/25/2026 | | | 2,000,000 | | | | 2,150,482 | |
Series K057, Class A2, | | | | | | | | |
2.570%, 07/25/2026 | | | 2,000,000 | | | | 2,152,770 | |
Series K058, Class A2, | | | | | | | | |
2.653%, 08/25/2026 | | | 1,500,000 | | | | 1,622,547 | |
Series K723, Class A2, | | | | | | | | |
2.454%, 08/25/2023 | | | 2,000,000 | | | | 2,078,994 | |
Series K059, Class A2, | | | | | | | | |
3.120%, 09/25/2026 | | | 1,500,000 | | | | 1,655,586 | |
Series K724, Class A2, | | | | | | | | |
3.062%, 11/25/2023 | | | 500,000 | | | | 527,542 | |
Series K063, Class A2, | | | | | | | | |
3.430%, 01/25/2027 | | | 2,000,000 | | | | 2,245,110 | |
Series K725, Class A2, | | | | | | | | |
3.002%, 01/25/2024 | | | 3,000,000 | | | | 3,183,564 | |
Series K064, Class A2, | | | | | | | | |
3.224%, 03/25/2027 | | | 2,500,000 | | | | 2,783,777 | |
Series K726, Class A2, | | | | | | | | |
2.905%, 04/25/2024 | | | 1,349,619 | | | | 1,427,532 | |
| | | | | | | | |
| | | Principal
amount | | | Value | |
Agency Commercial Mortgage-Backed Securities (Cont.) | |
Series K065, Class A2, | | | | | | | | |
3.243%, 04/25/2027 | | $ | 2,000,000 | | | $ | 2,231,774 | |
Series K074, Class A2, | | | | | | | | |
3.600%, 01/25/2028 | | | 2,000,000 | | | | 2,285,606 | |
Series K075, Class A2, | | | | | | | | |
3.650%, 02/25/2028 | | | 1,500,000 | | | | 1,719,040 | |
Series K072, Class A2, | | | | | | | | |
3.444%, 12/25/2027 | | | 1,500,000 | | | | 1,697,761 | |
Series K073, Class A2, | | | | | | | | |
3.350%, 01/25/2028 | | | 1,000,000 | | | | 1,127,228 | |
Series K076, Class A2, | | | | | | | | |
3.900%, 04/25/2028 | | | 2,000,000 | | | | 2,327,668 | |
Federal National Mortgage Association | | | | | |
Series 2012-M5, Class A2, | | | | | | | | |
2.715%, 02/25/2022 | | | 705,977 | | | | 710,823 | |
Series 2015-M11, Class A2, | | | | | | | | |
2.824%, 04/25/2025 | | | 2,000,000 | | | | 2,146,504 | |
Series 2015-M17, Class A2, | | | | | | | | |
2.887%, 11/25/2025 | | | 790,582 | | | | 853,804 | |
Series 2016-M7, Class A2, | | | | | | | | |
2.499%, 09/25/2026 | | | 933,223 | | | | 975,703 | |
Series 2016-M6, Class A2, | | | | | | | | |
2.488%, 05/25/2026 | | | 1,000,000 | | | | 1,067,987 | |
Series 2016-M11, Class A2, | | | | | | | | |
2.369%, 07/25/2026 | | | 2,000,000 | | | | 2,111,994 | |
Series 2016-M9, Class A2, | | | | | | | | |
2.292%, 06/25/2026 | | | 1,000,000 | | | | 1,059,608 | |
Series 2016-M12, Class AV2, | | | | | | | | |
2.308%, 10/25/2023 | | | 987,464 | | | | 1,014,056 | |
Series 2016-M12, Class A2, | | | | | | | | |
2.446%, 09/25/2026 | | | 2,000,000 | | | | 2,126,500 | |
Series 2017-M7, Class A2, | | | | | | | | |
2.961%, 02/25/2027 | | | 2,000,000 | | | | 2,184,772 | |
Series 2017-M2, Class A2, | | | | | | | | |
2.797%, 02/25/2027 | | | 986,103 | | | | 1,074,122 | |
Series 2017-M4, Class A2, | | | | | | | | |
2.574%, 12/25/2026 | | | 2,421,890 | | | | 2,603,725 | |
Series 2017-M8, Class A2, | | | | | | | | |
3.061%, 05/25/2027 | | | 2,000,000 | | | | 2,201,004 | |
Series 2018-M1, Class A2, | | | | | | | | |
2.985%, 12/25/2027 | | | 2,000,000 | | | | 2,207,300 | |
Series 2018-M2, Class A2, | | | | | | | | |
2.902%, 01/25/2028 | | | 2,000,000 | | | | 2,198,286 | |
Series 2018-M7, Class A2, | | | | | | | | |
3.052%, 03/25/2028 | | | 1,500,000 | | | | 1,664,000 | |
Series 2018-M4, Class A2, | | | | | | | | |
3.045%, 03/25/2028 | | | 1,500,000 | | | | 1,665,647 | |
| | | | | | | | |
Total Agency Commercial Mortgage-Backed Securities | | | | | |
(cost $73,497,805) | | | | | | | 78,753,496 | |
| | | | | | | | |
U.S. Treasury Obligations (6.94%) | | | | | |
U.S. Treasury Notes | | | | | | | | |
2.000%, 11/15/2021 | | | 25,000,000 | | | | 25,219,725 | |
2.500%, 08/15/2023 | | | 10,000,000 | | | | 10,510,160 | |
2.750%, 11/15/2023 | | | 10,000,000 | | | | 10,621,090 | |
| | |
| See accompanying notes to financial statements. | | 17 |
STATE FARM ASSOCIATES’ FUNDS TRUST BALANCED FUND
SCHEDULE OF INVESTMENTS (continued)
May 31, 2021
(Unaudited)
| | | | | | | | |
| | | Principal
amount | | | Value | |
U.S. Treasury Obligations (Cont.) | |
U.S. Treasury Notes (Cont.) | |
2.500%, 05/15/2024 | | $ | 5,000,000 | | | $ | 5,325,195 | |
2.000%, 06/30/2024 | | | 5,000,000 | | | | 5,255,860 | |
2.000%, 02/15/2025 | | | 15,000,000 | | | | 15,835,545 | |
2.750%, 02/15/2028 | | | 10,000,000 | | | | 11,007,420 | |
2.375%, 05/15/2029 | | | 28,000,000 | | | | 30,058,448 | |
1.625%, 08/15/2029 | | | 18,000,000 | | | | 18,276,336 | |
1.500%, 02/15/2030 | | | 26,000,000 | | | | 26,019,292 | |
1.125%, 02/15/2031 | | | 10,000,000 | | | | 9,582,810 | |
| | | | | | | | |
Total U.S. Treasury Obligations | | | | | |
(cost $162,959,187) | | | | | | | 167,711,881 | |
| | | | | | | | |
| | | | | | | | |
| | | Shares | | | Value | |
Short-term Investments (2.12%) | |
JPMorgan U.S. Government Money Market Fund Capital Shares, 0.03% (e) | | | 51,309,841 | | | | 51,309,841 | |
| | | | | | | | |
Total Short-term Investments | |
(cost $51,309,841) | | | | | | | 51,309,841 | |
| | | | | | | | |
TOTAL INVESTMENTS (99.62%) | | | | | |
(cost $1,030,542,793) | | | | | | | 2,408,552,110 | |
CASH AND OTHER ASSETS, NET OF LIABILITIES (0.38%) | | | | 9,135,465 | |
| | | | | | | | |
NET ASSETS (100.00%) | | | | | | $ | 2,417,687,575 | |
| | | | | | | | |
| (a) | Non-income producing security. |
| (b) | Securities exempt from registration pursuant to Rule 144A under the Securities Act of 1933. These securities may be resold in transactions exempt from registration, normally to qualified institutional buyers. At May 31, 2021, the value of these securities amounted to $34,273,389 or 1.42% of net assets. |
| (c) | Rate is fixed from February 7, 2019 to, but excluding, February 7, 2029 and floating from February 7, 2029 to, but excluding, the maturity date. |
| (d) | The obligations of these U.S. Government-sponsored entities are neither issued nor guaranteed by the United States Treasury. On September 6, 2008, the Federal Housing Finance Agency placed the Federal National Mortgage Association (“Fannie Mae”) and the Federal Home Loan Mortgage Corp. (“Freddie Mac”) into conservatorship. The United States Treasury has put in place a set of financing agreements to help ensure that these entities continue to meet their obligations to holders of bonds they have issued or guaranteed. |
| (e) | Rate shown is the 7-day yield as of May 31, 2021. |
ADR - American Depositary Deposit
| | |
| 18 | | See accompanying notes to financial statements. |
STATE FARM ASSOCIATES’ FUNDS TRUST INTERIM FUND
SCHEDULE OF INVESTMENTS
May 31, 2021
(Unaudited)
| | | | | | | | |
| | | Principal
amount | | | Value | |
U.S. Treasury Obligations (98.53%) | |
U.S. Treasury Notes | | | | | | | | |
1.125%, 07/31/2021 | | $ | 5,000,000 | | | $ | 5,009,130 | |
2.750%, 09/15/2021 | | | 2,500,000 | | | | 2,519,563 | |
2.000%, 10/31/2021 | | | 5,000,000 | | | | 5,040,235 | |
1.875%, 11/30/2021 | | | 5,000,000 | | | | 5,045,315 | |
1.625%, 12/31/2021 | | | 1,000,000 | | | | 1,009,063 | |
1.500%, 01/31/2022 | | | 10,000,000 | | | | 10,095,700 | |
1.750%, 02/28/2022 | | | 10,000,000 | | | | 10,126,170 | |
1.750%, 03/31/2022 | | | 10,000,000 | | | | 10,140,630 | |
1.750%, 04/30/2022 | | | 5,000,000 | | | | 5,076,760 | |
1.875%, 04/30/2022 | | | 1,000,000 | | | | 1,016,445 | |
1.750%, 05/15/2022 | | | 10,000,000 | | | | 10,160,160 | |
1.750%, 06/15/2022 | | | 2,000,000 | | | | 2,034,454 | |
1.750%, 06/30/2022 | | | 2,000,000 | | | | 2,035,704 | |
1.875%, 07/31/2022 | | | 2,000,000 | | | | 2,041,640 | |
1.625%, 08/15/2022 | | | 8,500,000 | | | | 8,658,712 | |
1.750%, 09/30/2022 | | | 5,000,000 | | | | 5,109,375 | |
2.000%, 10/31/2022 | | | 2,000,000 | | | | 2,053,204 | |
1.875%, 10/31/2022 | | | 2,000,000 | | | | 2,049,766 | |
1.625%, 11/15/2022 | | | 2,000,000 | | | | 2,043,906 | |
2.000%, 11/30/2022 | | | 2,500,000 | | | | 2,570,508 | |
1.625%, 12/15/2022 | | | 6,000,000 | | | | 6,138,984 | |
1.500%, 01/15/2023 | | | 1,000,000 | | | | 1,022,266 | |
1.750%, 01/31/2023 | | | 2,000,000 | | | | 2,053,906 | |
2.000%, 02/15/2023 | | | 5,000,000 | | | | 5,158,595 | |
2.500%, 03/31/2023 | | | 3,000,000 | | | | 3,129,375 | |
1.500%, 03/31/2023 | | | 2,000,000 | | | | 2,049,766 | |
1.625%, 04/30/2023 | | | 5,000,000 | | | | 5,141,015 | |
1.625%, 05/31/2023 | | | 10,000,000 | | | | 10,293,360 | |
1.375%, 06/30/2023 | | | 9,000,000 | | | | 9,226,404 | |
1.250%, 07/31/2023 | | | 6,000,000 | | | | 6,140,154 | |
2.500%, 08/15/2023 | | | 5,000,000 | | | | 5,255,080 | |
1.375%, 08/31/2023 | | | 4,000,000 | | | | 4,107,032 | |
1.375%, 09/30/2023 | | | 7,000,000 | | | | 7,192,500 | |
1.625%, 10/31/2023 | | | 5,000,000 | | | | 5,171,290 | |
2.875%, 10/31/2023 | | | 2,000,000 | | | | 2,128,828 | |
2.125%, 11/30/2023 | | | 11,000,000 | | | | 11,524,216 | |
2.250%, 12/31/2023 | | | 3,000,000 | | | | 3,155,976 | |
2.250%, 01/31/2024 | | | 5,000,000 | | | | 5,266,795 | |
2.750%, 02/15/2024 | | | 5,000,000 | | | | 5,337,500 | |
2.125%, 02/29/2024 | | | 5,000,000 | | | | 5,255,470 | |
2.125%, 03/31/2024 | | | 3,000,000 | | | | 3,156,798 | |
2.000%, 04/30/2024 | | | 7,000,000 | | | | 7,346,717 | |
2.500%, 05/15/2024 | | | 6,500,000 | | | | 6,922,753 | |
2.000%, 06/30/2024 | | | 2,500,000 | | | | 2,627,930 | |
1.750%, 06/30/2024 | | | 2,000,000 | | | | 2,087,422 | |
1.750%, 07/31/2024 | | | 4,000,000 | | | | 4,177,188 | |
2.375%, 08/15/2024 | | | 7,000,000 | | | | 7,450,625 | |
1.500%, 09/30/2024 | | | 5,000,000 | | | | 5,183,985 | |
1.500%, 10/31/2024 | | | 3,500,000 | | | | 3,628,790 | |
2.250%, 10/31/2024 | | | 2,500,000 | | | | 2,655,763 | |
2.250%, 11/15/2024 | | | 8,000,000 | | | | 8,501,560 | |
1.500%, 11/30/2024 | | | 3,000,000 | | | | 3,110,859 | |
2.125%, 11/30/2024 | | | 1,000,000 | | | | 1,058,750 | |
2.250%, 12/31/2024 | | | 8,000,000 | | | | 8,511,872 | |
1.750%, 12/31/2024 | | | 2,000,000 | | | | 2,091,954 | |
1.375%, 01/31/2025 | | | 8,000,000 | | | | 8,261,248 | |
2.000%, 02/15/2025 | | | 8,000,000 | | | | 8,445,624 | |
| | | | | | | | |
| | | Principal
amount | | | Value | |
U.S. Treasury Obligations (Cont.) | |
U.S. Treasury Notes (Cont.) | |
1.125%, 02/28/2025 | | $ | 7,000,000 | | | $ | 7,162,421 | |
2.125%, 05/15/2025 | | | 10,000,000 | | | | 10,618,360 | |
2.750%, 06/30/2025 | | | 3,000,000 | | | | 3,264,141 | |
2.000%, 08/15/2025 | | | 20,500,000 | | | | 21,689,164 | |
2.250%, 11/15/2025 | | | 13,500,000 | | | | 14,437,615 | |
2.625%, 12/31/2025 | | | 10,000,000 | | | | 10,867,970 | |
2.625%, 01/31/2026 | | | 7,000,000 | | | | 7,611,408 | |
1.625%, 02/15/2026 | | | 6,000,000 | | | | 6,245,388 | |
2.250%, 03/31/2026 | | | 5,000,000 | | | | 5,354,100 | |
2.375%, 04/30/2026 | | | 1,000,000 | | | | 1,077,070 | |
1.625%, 05/15/2026 | | | 9,000,000 | | | | 9,362,106 | |
1.875%, 06/30/2026 | | | 7,000,000 | | | | 7,366,954 | |
1.875%, 07/31/2026 | | | 7,000,000 | | | | 7,367,500 | |
1.375%, 08/31/2026 | | | 8,000,000 | | | | 8,210,000 | |
1.625%, 09/30/2026 | | | 7,500,000 | | | | 7,789,455 | |
1.625%, 10/31/2026 | | | 8,000,000 | | | | 8,303,440 | |
1.625%, 11/30/2026 | | | 7,000,000 | | | | 7,263,865 | |
1.750%, 12/31/2026 | | | 6,500,000 | | | | 6,788,437 | |
1.500%, 01/31/2027 | | | 10,000,000 | | | | 10,297,270 | |
1.125%, 02/28/2027 | | | 11,000,000 | | | | 11,086,372 | |
2.375%, 05/15/2027 | | | 4,500,000 | | | | 4,849,627 | |
| | | | | | | | |
Total U.S. Treasury Obligations | | | | | |
(cost $454,061,428) | | | | | | | 460,817,453 | |
| | | | | | | | |
| | |
| | | Shares | | | Value | |
Short-term Investments (1.09%) | | | | | |
JPMorgan U.S. Government Money Market Fund Capital Shares, 0.03% (a) | | | 5,102,627 | | | | 5,102,627 | |
| | | | | | | | |
Total Short-term Investments | | | | | |
(cost $5,102,627) | | | | | | | 5,102,627 | |
| | | | | | | | |
TOTAL INVESTMENTS (99.62%) | |
(cost $459,164,055) | | | | | | | 465,920,080 | |
OTHER ASSETS, NET OF LIABILITIES (0.38%) | | | | 1,784,654 | |
| | | | | | | | |
NET ASSETS (100.00%) | | | $ | 467,704,734 | |
| | | | | | | | |
| (a) | Rate shown is the 7-day yield as of May 31, 2021. |
| | |
| See accompanying notes to financial statements. | | 19 |
STATE FARM ASSOCIATES’ FUNDS TRUST MUNICIPAL BOND FUND
SCHEDULE OF INVESTMENTS
May 31, 2021
(Unaudited)
| | | | | | | | | | | | | | | | | | | | |
| | | Coupon
rate | | | Maturity date | | | Rating (a) | | | Principal
amount | | | Value | |
Long-term Municipal Bonds (96.85%) | | | | | | | | | | | | | | | | | | | | |
Alabama (1.74%) | | | | | | | | | | | | | | | | | | | | |
City of Athens, Alabama, Electric Revenue Warrants, Series 2015 | | | 3.000 | % | | | 06/01/2024 | | | | A+ | | | $ | 585,000 | | | $ | 629,513 | |
City of Athens, Alabama, Electric Revenue Warrants, Series 2015 | | | 3.250 | % | | | 06/01/2025 | | | | A+ | | | | 600,000 | | | | 646,788 | |
City of Athens, Alabama, Electric Revenue Warrants, Series 2015 | | | 3.500 | % | | | 06/01/2026 | | | | A+ | | | | 220,000 | | | | 238,753 | |
City of Athens, Alabama, Electric Revenue Warrants, Series 2015 | | | 3.750 | % | | | 06/01/2027 | | | | A+ | | | | 645,000 | | | | 703,437 | |
City of Athens, Alabama, Water and Sewer Revenue Warrants, Series 2017 | | | 3.000 | % | | | 05/01/2028 | | | | A1 | | | | 980,000 | | | | 1,092,249 | |
City of Athens, Alabama, Electric Revenue Warrants, Series 2015 | | | 4.000 | % | | | 06/01/2028 | | | | A+ | | | | 665,000 | | | | 728,927 | |
The Water and Wastewater Board of the City of Madison, Water and Sewer Revenue Bonds, Series 2015 | | | 4.000 | % | | | 12/01/2028 | | | | Aa2 | | | | 2,165,000 | | | | 2,451,624 | |
City of Athens, Alabama, Water and Sewer Revenue Warrants, Series 2017 | | | 3.125 | % | | | 05/01/2029 | | | | A1 | | | | 1,010,000 | | | | 1,030,264 | |
Mountain Brook City Board of Education (Alabama), Special Tax School Warrants, (20.6 Mill Tax), Series 2021-A | | | 4.000 | % | | | 03/01/2033 | | | | Aa1 | | | | 350,000 | | | | 434,711 | |
Mountain Brook City Board of Education (Alabama), Special Tax School Warrants, (20.6 Mill Tax), Series 2021-A | | | 4.000 | % | | | 03/01/2034 | | | | Aa1 | | | | 300,000 | | | | 371,655 | |
Mountain Brook City Board of Education (Alabama), Special Tax School Warrants, (20.6 Mill Tax), Series 2021-A | | | 4.000 | % | | | 03/01/2035 | | | | Aa1 | | | | 350,000 | | | | 432,282 | |
The Water and Wastewater Board of the City of Madison, Water and Sewer Revenue Bonds, Series 2020 | | | 4.000 | % | | | 12/01/2035 | | | | Aa2 | | | | 215,000 | | | | 259,367 | |
Mountain Brook City Board of Education (Alabama), Special Tax School Warrants, (20.6 Mill Tax), Series 2021-A | | | 4.000 | % | | | 03/01/2036 | | | | Aa1 | | | | 500,000 | | | | 616,350 | |
The Water and Wastewater Board of the City of Madison, Water and Sewer Revenue Bonds, Series 2020 | | | 4.000 | % | | | 12/01/2036 | | | | Aa2 | | | | 310,000 | | | | 372,911 | |
Mountain Brook City Board of Education (Alabama), Special Tax School Warrants, (20.6 Mill Tax), Series 2021-A | | | 3.000 | % | | | 03/01/2037 | | | | Aa1 | | | | 505,000 | | | | 567,953 | |
The Water and Wastewater Board of the City of Madison, Water and Sewer Revenue Bonds, Series 2020 | | | 4.000 | % | | | 12/01/2037 | | | | Aa2 | | | | 270,000 | | | | 323,935 | |
Mountain Brook City Board of Education (Alabama), Special Tax School Warrants, (20.6 Mill Tax), Series 2021-A | | | 3.000 | % | | | 03/01/2038 | | | | Aa1 | | | | 600,000 | | | | 672,846 | |
The Water and Wastewater Board of the City of Madison, Water and Sewer Revenue Bonds, Series 2020 | | | 4.000 | % | | | 12/01/2038 | | | | Aa2 | | | | 265,000 | | | | 317,173 | |
Mountain Brook City Board of Education (Alabama), Special Tax School Warrants, (20.6 Mill Tax), Series 2021-A | | | 3.000 | % | | | 03/01/2039 | | | | Aa1 | | | | 500,000 | | | | 559,125 | |
| | | | | | | | | | | | | | | | | | | | |
| | | | | | | | | | | | | | | | | | | 12,449,863 | |
| | | | | | | | | | | | | | | | | | | | |
Alaska (1.31%) | | | | | | | | | | | | | | | | | | | | |
Municipality of Anchorage, Alaska, 2016 General Obligation Bonds, Series A, (General Purpose) | | | 3.250 | % | | | 09/01/2028 | | | | AAA | | | | 1,095,000 | | | | 1,230,167 | |
Municipality of Anchorage, Alaska, 2016 General Obligation Bonds, Series B, (Schools) | | | 3.250 | % | | | 09/01/2028 | | | | AAA | | | | 1,050,000 | | | | 1,179,612 | |
Municipality of Anchorage, Alaska, 2016 General Obligation Bonds, Series A, (General Purpose) | | | 3.500 | % | | | 09/01/2029 | | | | AAA | | | | 1,390,000 | | | | 1,566,641 | |
Municipality of Anchorage, Alaska, 2016 General Obligation Bonds, Series B, (Schools) | | | 3.500 | % | | | 09/01/2029 | | | | AAA | | | | 1,090,000 | | | | 1,228,517 | |
Municipality of Anchorage, Alaska, 2016 General Obligation Bonds, Series A, (General Purpose) | | | 3.500 | % | | | 09/01/2030 | | | | AAA | | | | 1,440,000 | | | | 1,615,291 | |
Municipality of Anchorage, Alaska, 2016 General Obligation Bonds, Series B, (Schools) | | | 3.500 | % | | | 09/01/2030 | | | | AAA | | | | 1,125,000 | | | | 1,261,946 | |
Matanuska-Susitna Borough, Alaska, General Obligation Transportation System Bonds, 2014 Series A | | | 5.000 | % | | | 08/01/2031 | | | | AA+ | | | | 1,225,000 | | | | 1,347,035 | |
| | | | | | | | | | | | | | | | | | | | |
| | | | | | | | | | | | | | | | | | | 9,429,209 | |
| | | | | | | | | | | | | | | | | | | | |
Arizona (1.99%) | | | | | | | | | | | | | | | | | | | | |
Paradise Valley Unified School District No. 69 of Maricopa County, Arizona, School Improvement Bonds, Project of 2011, Series A (2012) | | | 3.000 | % | | | 07/01/2021 | | | | Aa1 | | | | 1,000,000 | | | | 1,002,360 | |
Tucson Unified School District No. 1 of Pima County, Arizona, Refunding Bonds, Tax-Exempt Series 2011 | | | 5.000 | % | | | 07/01/2022 | | | | Aa3 | | | | 1,000,000 | | | | 1,051,370 | |
Litchfield Elementary School District No. 79 of Maricopa County, Arizona, School Improvement Bonds, Project of 2009, Series A (2011) | | | 5.000 | % | | | 07/01/2023 | | | | Aa1 | | | | 1,000,000 | | | | 1,003,880 | |
Paradise Valley Unified School District No. 69 of Maricopa County, Arizona, School Improvement Bonds, Project of 2011, Series B (2013) | | | 3.000 | % | | | 07/01/2023 | | | | Aa1 | | | | 1,255,000 | | | | 1,328,079 | |
| | |
| 20 | | See accompanying notes to financial statements. |
STATE FARM ASSOCIATES’ FUNDS TRUST MUNICIPAL BOND FUND
SCHEDULE OF INVESTMENTS (continued)
May 31, 2021
(Unaudited)
| | | | | | | | | | | | | | | | | | | | |
| | | Coupon
rate | | | Maturity date | | | Rating (a) | | | Principal
amount | | | Value | |
Long-term Municipal Bonds (Cont.) | | | | | | | | | | | | | | | | | | | | |
Arizona (Cont.) | | | | | | | | | | | | | | | | | | | | |
Pima County, Arizona, Sewer System Revenue Obligations, Series 2012A | | | 5.000 | % | | | 07/01/2023 | | | | AA | | | $ | 1,060,000 | | | $ | 1,115,523 | |
Pinal County Community College District of Pinal County, Arizona, General Obligation Bonds, Project of 2008, Series B (2012) (Currently Refunded to 07-01-2021 @ 100) (b) | | | 4.500 | % | | | 07/01/2023 | | | | AA- | | | | 1,705,000 | | | | 1,711,018 | |
Phoenix Union High School District No. 210 of Maricopa County, Arizona, School Improvement Bonds, Project of 2011, Tax-Exempt Series A (2012) | | | 4.000 | % | | | 07/01/2024 | | | | AA | | | | 1,165,000 | | | | 1,212,206 | |
Amphitheater Unified School District No. 10 of Pima County, Arizona, School Improvement Bonds, Project of 2007, Series D (2013) | | | 5.000 | % | | | 07/01/2026 | | | | A+ | | | | 555,000 | | | | 609,495 | |
Cave Creek Unified School District No. 93 of Maricopa County, Arizona, School Improvement Bonds, Project of 2014, Series A (2015) | | | 4.000 | % | | | 07/01/2026 | | | | AA- | | | | 295,000 | | | | 336,852 | |
Pima County, Arizona, General Obligation Bonds, Series 2012A | | | 4.000 | % | | | 07/01/2026 | | | | AA | | | | 2,000,000 | | | | 2,079,000 | |
Amphitheater Unified School District No. 10 of Pima County, Arizona, School Improvement Bonds, Project of 2007, Series D (2013) | | | 5.000 | % | | | 07/01/2027 | | | | A+ | | | | 400,000 | | | | 438,224 | |
Cave Creek Unified School District No. 93 of Maricopa County, Arizona, School Improvement Bonds, Project of 2014, Series A (2015) | | | 4.000 | % | | | 07/01/2027 | | | | AA- | | | | 1,100,000 | | | | 1,252,416 | |
Tempe Union High School District No. 213 of Maricopa County, Arizona, Refunding Bonds, Series 2016 | | | 3.000 | % | | | 07/01/2028 | | | | AA | | | | 1,000,000 | | | | 1,100,370 | |
| | | | | | | | | | | | | | | | | | | | |
| | | | | | | | | | | | | | | | | | | 14,240,793 | |
| | | | | | | | | | | | | | | | | | | | |
Arkansas (3.28%) | | | | | | | | | | | | | | | | | | | | |
State of Arkansas, General Obligation Four-Lane Highway Construction and Improvement Bonds, Series 2013 (Currently Refunded to 06-15-2021 @ 100) (b) | | | 3.500 | % | | | 06/15/2023 | | | | AA | | | | 6,000,000 | | | | 6,007,260 | |
Board of Trustees of the University of Arkansas, Various Facility Revenue Bonds (Fayetteville Campus), Refunding Series 2015A | | | 3.000 | % | | | 11/01/2024 | | | | Aa2 | | | | 2,315,000 | | | | 2,511,868 | |
City of Little Rock, Arkansas, Library Construction and Refunding Bonds, Series 2015 | | | 2.750 | % | | | 03/01/2025 | | | | AA | | | | 185,000 | | | | 185,254 | |
State of Arkansas, Higher Education General Obligation Bonds, Refunding Series 2015 | | | 4.000 | % | | | 06/01/2027 | | | | AA | | | | 3,000,000 | | | | 3,313,830 | |
Board of Trustees of the University of Arkansas, Various Facility Revenue Bonds (Fayetteville Campus), Series 2014A | | | 5.000 | % | | | 11/01/2028 | | | | Aa2 | | | | 365,000 | | | | 418,119 | |
Board of Trustees of Arkansas Tech University, Student Fee Refunding Revenue Bonds, Series 2021A | | | 3.000 | % | | | 05/01/2029 | | | | A1 | | | | 190,000 | | | | 207,539 | |
Rogers School District No. 30 of Benton County, Arkansas, Refunding Bonds | | | 3.125 | % | | | 02/01/2030 | | | | NR | | | | 2,880,000 | | | | 2,941,718 | |
Board of Trustees of the University of Arkansas, Various Facility Revenue Bonds (Fayetteville Campus), Series 2014A | | | 5.000 | % | | | 11/01/2030 | | | | Aa2 | | | | 785,000 | | | | 899,649 | |
Board of Trustees of Arkansas Tech University, Student Fee Refunding Revenue Bonds, Series 2021A | | | 3.000 | % | | | 05/01/2031 | | | | A1 | | | | 200,000 | | | | 215,428 | |
Board of Trustees of Arkansas Tech University, Student Fee Refunding Revenue Bonds, Series 2021A | | | 3.000 | % | | | 05/01/2032 | | | | A1 | | | | 110,000 | | | | 118,033 | |
Rogers School District No. 30 of Benton County, Arkansas Refunding Bonds | | | 3.000 | % | | | 02/01/2033 | | | | Aa2 | | | | 5,115,000 | | | | 5,377,297 | |
Board of Trustees of Arkansas Tech University, Student Fee Refunding Revenue Bonds, Series 2021A | | | 3.000 | % | | | 05/01/2033 | | | | A1 | | | | 110,000 | | | | 117,887 | |
City of Heber Springs, Arkansas, Water and Sewer Revenue Ronds, Series 2019 | | | 3.000 | % | | | 11/01/2033 | | | | NR | | | | 660,000 | | | | 689,231 | |
City of Heber Springs, Arkansas, Water and Sewer Revenue Ronds, Series 2019 | | | 3.000 | % | | | 11/01/2035 | | | | NR | | | | 300,000 | | | | 312,462 | |
Board of Trustees of Arkansas Tech University, Student Fee Refunding Revenue Bonds, Series 2021A | | | 3.000 | % | | | 05/01/2036 | | | | A1 | | | | 200,000 | | | | 212,716 | |
| | | | | | | | | | | | | | | | | | | | |
| | | | | | | | | | | | | | | | | | | 23,528,291 | |
| | | | | | | | | | | | | | | | | | | | |
California (6.27%) | | | | | | | | | | | | | | | | | | | | |
Atascadero Unified School District, (San Luis Obispo County, California) General Obligation Bonds, 2010 Election, Series B | | | 5.000 | % | | | 08/01/2025 | | | | Aa3 | | | | 225,000 | | | | 258,021 | |
Marin Community College District (Marin County, California), Election of 2004 General Obligation Bonds, Series C (Prerefunded to 08-01-2021 @ 100) (b) | | | 4.250 | % | | | 08/01/2026 | | | | Aaa | | | | 1,275,000 | | | | 1,283,772 | |
Atascadero Unified School District, (San Luis Obispo County, California) General Obligation Bonds, 2010 Election, Series B | | | 5.000 | % | | | 08/01/2027 | | | | Aa3 | | | | 1,080,000 | | | | 1,233,349 | |
| | |
| See accompanying notes to financial statements. | | 21 |
STATE FARM ASSOCIATES’ FUNDS TRUST MUNICIPAL BOND FUND
SCHEDULE OF INVESTMENTS (continued)
May 31, 2021
(Unaudited)
| | | | | | | | | | | | | | | | | | | | |
| | | Coupon
rate | | | Maturity date | | | Rating (a) | | | Principal
amount | | | Value | |
Long-term Municipal Bonds (Cont.) | | | | | | | | | | | | | | | | | | | | |
California (Cont.) | | | | | | | | | | | | | | | | | | | | |
East Side Union High School District, (Santa Clara County, California), 2015 General Obligation Refunding Bonds | | | 3.500 | % | | | 08/01/2027 | | | | A+ | | | $ | 1,000,000 | | | $ | 1,113,370 | |
Newark Unified School District, (Alameda County, California), General Obligation Bonds, Election of 2011, Series C | | | 3.000 | % | | | 08/01/2028 | | | | Aa3 | | | | 750,000 | | | | 830,078 | |
Santee School District, (County of San Diego, California), General Obligation Refunding Bonds, Series 2015 | | | 3.500 | % | | | 08/01/2028 | | | | AA- | | | | 1,565,000 | | | | 1,732,252 | |
Campbell Union High School District, (Santa Clara County, California), 2016 General Obligation Refunding Bonds | | | 3.250 | % | | | 08/01/2029 | | | | Aa1 | | | | 1,965,000 | | | | 2,149,238 | |
City of La Mesa, General Obligation Refunding Bonds, Series 2016 (Fire, Police and Emergency Services Measure) | | | 3.500 | % | | | 08/01/2029 | | | | Aa2 | | | | 1,190,000 | | | | 1,336,287 | |
Santee School District, (County of San Diego, California), General Obligation Refunding Bonds, Series 2015 | | | 3.500 | % | | | 08/01/2029 | | | | AA- | | | | 1,725,000 | | | | 1,896,879 | |
Sonoma County Junior College District, (Sonoma, Mendocino and Marin Counties, California), 2016 General Obligation Refunding Bonds | | | 3.250 | % | | | 08/01/2029 | | | | Aa2 | | | | 2,835,000 | | | | 3,147,984 | |
City of La Mesa, General Obligation Refunding Bonds, Series 2016 (Fire, Police and Emergency Services Measure) | | | 4.000 | % | | | 08/01/2030 | | | | Aa2 | | | | 540,000 | | | | 626,627 | |
Marin Community College District, (Marin County, California), Election of 2016 General Obligation Bonds, Series A, (Federally Tax-Exempt) | | | 4.000 | % | | | 08/01/2030 | | | | Aaa | | | | 1,095,000 | | | | 1,273,682 | |
Sonoma County Junior College District, (Sonoma, Mendocino and Marin Counties, California), Election of 2014 General Obligation Bonds, Series A | | | 4.000 | % | | | 08/01/2030 | | | | Aa2 | | | | 1,600,000 | | | | 1,856,672 | |
Sequoia Union High School District, (County of San Mateo, State of California), General Obligation Bonds, Election of 2014, Series 2016 | | | 3.000 | % | | | 07/01/2031 | | | | AA | | | | 3,000,000 | | | | 3,277,050 | |
City of La Mesa, General Obligation Refunding Bonds, Series 2016 (Fire, Police and Emergency Services Measure) | | | 4.000 | % | | | 08/01/2031 | | | | Aa2 | | | | 400,000 | | | | 463,572 | |
Redondo Beach Unified School District, (Los Angeles County, California), 2017 General Obligation Refunding Bonds, (Election of 2008, Series D), (2020 Crossover) | | | 3.000 | % | | | 08/01/2031 | | | | Aa2 | | | | 750,000 | | | | 829,605 | |
City of La Mesa, General Obligation Refunding Bonds, Series 2016 (Fire, Police and Emergency Services Measure) | | | 4.000 | % | | | 08/01/2032 | | | | Aa2 | | | | 500,000 | | | | 578,935 | |
Redondo Beach Unified School District, (Los Angeles County, California), 2017 General Obligation Refunding Bonds, (Election of 2008, Series D), (2020 Crossover) | | | 3.000 | % | | | 08/01/2032 | | | | Aa2 | | | | 750,000 | | | | 827,760 | |
Tustin Unified School District - 2017 General Obligation Refunding Bonds of School Facilities Improvement District No. 2002-1 of the Tustin Unified School District, (2020 Crossover), (Orange County, California) | | | 4.000 | % | | | 08/01/2032 | | | | AA | | | | 510,000 | | | | 597,664 | |
Antioch Unified School District, (Contra Costa County, California), School Facilities Improvement District No. 1, General Obligation Bonds, Election of 2008, Series E (2020) | | | 4.000 | % | | | 08/01/2033 | | | | A+ | | | | 385,000 | | | | 455,016 | |
Tustin Unified School District - 2017 General Obligation Refunding Bonds of School Facilities Improvement District No. 2002-1 of the Tustin Unified School District, (2020 Crossover), (Orange County, California) | | | 4.000 | % | | | 08/01/2033 | | | | AA | | | | 550,000 | | | | 642,301 | |
Tustin Unified School District - 2017 General Obligation Refunding Bonds of School Facilities Improvement District No. 2008-1 of the Tustin Unified School District, (2020 Crossover), (Orange County, California) | | | 4.000 | % | | | 08/01/2033 | | | | AA | | | | 600,000 | | | | 700,692 | |
Antioch Unified School District, (Contra Costa County, California), School Facilities Improvement District No. 1, General Obligation Bonds, Election of 2008, Series E (2020) | | | 3.000 | % | | | 08/01/2034 | | | | A+ | | | | 2,000,000 | | | | 2,142,940 | |
Central Unified School District, (Fresno County, California), General Obligation Bonds, 2016 Election, Series C, (GO Reauthorization Bonds) | | | 3.000 | % | | | 08/01/2034 | | | | Aa3 | | | | 380,000 | | | | 432,923 | |
Kentfield School District, (Marin County, California), General Obligation Bonds, Election of 2014, Series B | | | 5.000 | % | | | 08/01/2034 | | | | AA | | | | 200,000 | | | | 235,164 | |
Antioch Unified School District, (Contra Costa County, California), School Facilities Improvement District No. 1, General Obligation Bonds, Election of 2008, Series E (2020) | | | 3.000 | % | | | 08/01/2035 | | | | A+ | | | | 1,150,000 | | | | 1,230,213 | |
Central Unified School District, (Fresno County, California), General Obligation Bonds, 2016 Election, Series C, (GO Reauthorization Bonds) | | | 3.000 | % | | | 08/01/2035 | | | | Aa3 | | | | 300,000 | | | | 341,094 | |
| | |
| 22 | | See accompanying notes to financial statements. |
STATE FARM ASSOCIATES’ FUNDS TRUST MUNICIPAL BOND FUND
SCHEDULE OF INVESTMENTS (continued)
May 31, 2021
(Unaudited)
| | | | | | | | | | | | | | | | | | | | |
| | | Coupon
rate | | | Maturity date | | | Rating (a) | | | Principal
amount | | | Value | |
Long-term Municipal Bonds (Cont.) | | | | | | | | | | | | | | | | | | | | |
California (Cont.) | | | | | | | | | | | | | | | | | | | | |
Gavilan Joint Community College District, (Santa Clara and San Benito Counties, California), Election of 2018 General Obligation Bonds, Series B, (Federally Tax-Exempt) | | | 3.000 | % | | | 08/01/2035 | | | | Aa3 | | | $ | 1,000,000 | | | $ | 1,127,810 | |
Kentfield School District, (Marin County, California), General Obligation Bonds, Election of 2014, Series B | | | 5.000 | % | | | 08/01/2035 | | | | AA | | | | 355,000 | | | | 416,617 | |
Antioch Unified School District, (Contra Costa County, California), School Facilities Improvement District No. 1, General Obligation Bonds, Election of 2008, Series E (2020) | | | 3.000 | % | | | 08/01/2036 | | | | A+ | | | | 600,000 | | | | 640,296 | |
Contra Costa Community College District, (Contra Costa County, California), General Obligation Bonds, Election of 2014, 2020 Series C | | | 3.000 | % | | | 08/01/2036 | | | | Aa1 | | | | 1,875,000 | | | | 2,134,012 | |
Gavilan Joint Community College District, (Santa Clara and San Benito Counties, California), Election of 2018 General Obligation Bonds, Series B, (Federally Tax-Exempt) | | | 3.000 | % | | | 08/01/2036 | | | | Aa3 | | | | 1,000,000 | | | | 1,124,390 | |
Kentfield School District, (Marin County, California), General Obligation Bonds, Election of 2014, Series B | | | 5.000 | % | | | 08/01/2036 | | | | AA | | | | 400,000 | | | | 468,528 | |
San Francisco Bay Area Rapid Transit District, General Obligation Bonds, (Election of 2016), 2020 Series C-1 Bonds (Green Bonds) | | | 3.000 | % | | | 08/01/2036 | | | | AA | | | | 2,250,000 | | | | 2,506,702 | |
Central Unified School District, (Fresno County, California), General Obligation Bonds, 2016 Election, Series C, (GO Reauthorization Bonds) | | | 3.000 | % | | | 08/01/2037 | | | | Aa3 | | | | 755,000 | | | | 849,692 | |
Kentfield School District, (Marin County, California), General Obligation Bonds, Election of 2014, Series B | | | 5.000 | % | | | 08/01/2037 | | | | AA | | | | 500,000 | | | | 584,540 | |
San Francisco Bay Area Rapid Transit District, General Obligation Bonds, (Election of 2016), 2020 Series C-1 Bonds (Green Bonds) | | | 3.000 | % | | | 08/01/2037 | | | | AA | | | | 3,250,000 | | | | 3,602,690 | |
| | | | | | | | | | | | | | | | | | | | |
| | | | | | | | | | | | | | | | | | | 44,948,417 | |
| | | | | | | | | | | | | | | | | | | | |
Colorado (4.27%) | | | | | | | | | | | | | | | | | | | | |
Jefferson County, Colorado, School District No. 1 | | | 5.000 | % | | | 12/15/2021 | | | | AA | | | | 900,000 | | | | 923,715 | |
Cherry Creek School District No. 5, (Arapahoe County, Colorado), General Obligation Bonds, Series 2012B | | | 3.000 | % | | | 12/15/2023 | | | | Aa1 | | | | 3,300,000 | | | | 3,442,032 | |
El Paso County School District No. 20 (Academy), El Paso County, Colorado, General Obligation Refunding Bonds, Series 2015 | | | 4.000 | % | | | 12/15/2025 | | | | Aa1 | | | | 1,000,000 | | | | 1,127,530 | |
Roaring Fork School District No. RE-1, In Garfield, Pitkin and Eagle Counties, Colorado, General Obligation Refunding Bonds, Series 2016B | | | 2.500 | % | | | 12/15/2027 | | | | NR | | | | 3,000,000 | | | | 3,225,990 | |
Eagle River Water and Sanitation District, (In Eagle County, Colorado), General Obligation Bonds, Series 2016 | | | 4.000 | % | | | 12/01/2030 | | | | AA- | | | | 465,000 | | | | 542,390 | |
Gunnison Watershed School District RE-1 J, (Gunnison and Saguache Counties, Colorado), General Obligation Refunding Bonds, Series 2014 (Prerefunded to 12-01-2024 @ 100) (b) | | | 4.000 | % | | | 12/01/2031 | | | | Aa1 | | | | 1,000,000 | | | | 1,130,120 | |
Town of Estes Park, Colorado, Refunding and Improvement Power and Communications Revenue Bonds, Series 2019A | | | 4.000 | % | | | 11/01/2034 | | | | A+ | | | | 1,805,000 | | | | 2,147,463 | |
Adams 12 Five Star Schools, Adams County and the City and County of Broomfield, Colorado, General Obligation Bonds, Series 2016B | | | 5.000 | % | | | 12/15/2034 | | | | AA- | | | | 2,500,000 | | | | 3,131,410 | |
Town of Estes Park, Colorado, Refunding and Improvement Power and Communications Revenue Bonds, Series 2019A | | | 4.000 | % | | | 11/01/2035 | | | | A+ | | | | 980,000 | | | | 1,163,525 | |
Aspen School District No. 1 (RE), Pitkin County, Colorado, General Obligation Bonds, Series 2021 | | | 3.000 | % | | | 12/01/2035 | | | | Aaa | | | | 1,290,000 | | | | 1,483,590 | |
Town of Estes Park, Colorado, Refunding and Improvement Power and Communications Revenue Bonds, Series 2019A | | | 4.000 | % | | | 11/01/2036 | | | | A+ | | | | 1,000,000 | | | | 1,183,960 | |
Aspen School District No. 1 (RE), Pitkin County, Colorado, General Obligation Bonds, Series 2021 | | | 3.000 | % | | | 12/01/2036 | | | | Aaa | | | | 1,280,000 | | | | 1,467,341 | |
City of Westminister, Colorado, Water and Wastewater Utility Enterprise, Water and Wastewater Revenue Bonds, Series 2019 | | | 4.000 | % | | | 12/01/2036 | | | | AAA | | | | 1,000,000 | | | | 1,211,830 | |
| | |
| See accompanying notes to financial statements. | | 23 |
STATE FARM ASSOCIATES’ FUNDS TRUST MUNICIPAL BOND FUND
SCHEDULE OF INVESTMENTS (continued)
May 31, 2021
(Unaudited)
| | | | | | | | | | | | | | | | | | | | |
| | | Coupon
rate | | | Maturity date | | | Rating (a) | | | Principal
amount | | | Value | |
Long-term Municipal Bonds (Cont.) | | | | | | | | | | | | | | | | | | | | |
Colorado (Cont.) | | | | | | | | | | | | | | | | | | | | |
Aspen School District No. 1 (RE), Pitkin County, Colorado, General Obligation Bonds, Series 2021 | | | 3.000 | % | | | 12/01/2037 | | | | Aaa | | | $ | 1,995,000 | | | $ | 2,280,125 | |
Durango School District 9-R, (La Plata County, Colorado), General Obligation Bonds, Series 2021 | | | 4.000 | % | | | 11/01/2038 | | | | Aa2 | | | | 5,000,000 | | | | 6,188,300 | |
| | | | | | | | | | | | | | | | | | | | |
| | | | | | | | | | | | | | | | | | | 30,649,321 | |
| | | | | | | | | | | | | | | | | | | | |
Connecticut (0.85%) | | | | | | | | | | | | | | | | | | | | |
State of Connecticut Health and Educational Facilities Authority, Revenue Bonds, Yale University Issue, Series 2016A (c) | | | 2.000 | % | | | 07/01/2042 | | | | Aaa | | | | 5,700,000 | | | | 6,088,512 | |
| | | | | | | | | | | | | | | | | | | | |
Florida (3.71%) | | | | | | | | | | | | | | | | | | | | |
Tohopekaliga Water Authority, Utility System Revenue Refunding Bonds, Series 2011A (Prerefunded to 10-01-2021 @ 100) (b) | | | 5.000 | % | | | 10/01/2022 | | | | Aa2 | | | | 365,000 | | | | 370,946 | |
Tohopekaliga Water Authority, Utility System Revenue Refunding Bonds, Series 2011A (Prerefunded to 10-01-2021 @ 100) (b) | | | 5.000 | % | | | 10/01/2023 | | | | Aa2 | | | | 200,000 | | | | 203,258 | |
Lee County, Florida, Water and Sewer Revenue Bonds, Series 2013A (Prerefunded to 10-01-2023 @100) (b) | | | 5.000 | % | | | 10/01/2026 | | | | Aa2 | | | | 400,000 | | | | 445,216 | |
City of Pembroke Pines, Florida, General Obligation Bonds, Series 2015 | | | 5.000 | % | | | 09/01/2031 | | | | Aa2 | | | | 2,100,000 | | | | 2,490,180 | |
Florida Municipal Loan Council, Revenue Bonds, Series 2019A | | | 3.000 | % | | | 08/01/2032 | | | | AA+ | | | | 520,000 | | | | 568,490 | |
City of Miami Beach, Florida, Water and Sewer Revenue and Revenue Refunding Bonds, Series 2017 | | | 4.000 | % | | | 09/01/2032 | | | | Aa3 | | | | 540,000 | | | | 630,002 | |
Lee County, Florida, Water and Sewer Revenue Bonds, Series 2013A (Prerefunded to 10-01-2023 @100) (b) | | | 5.000 | % | | | 10/01/2032 | | | | Aa2 | | | | 750,000 | | | | 834,780 | |
Collier County Water-Sewer District, (Florida), Water Sewer Revenue Bonds, Series 2019 | | | 3.000 | % | | | 07/01/2033 | | | | Aaa | | | | 5,080,000 | | | | 5,622,493 | |
Florida Municipal Loan Council, Revenue Bonds, Series 2019A | | | 3.250 | % | | | 08/01/2033 | | | | AA+ | | | | 535,000 | | | | 592,721 | |
City of Miami Beach, Florida, Water and Sewer Revenue and Revenue Refunding Bonds, Series 2017 | | | 5.000 | % | | | 09/01/2033 | | | | Aa3 | | | | 750,000 | | | | 932,092 | |
Florida Municipal Loan Council, Revenue Bonds, Series 2019A | | | 4.000 | % | | | 08/01/2034 | | | | AA+ | | | | 555,000 | | | | 653,024 | |
City of Miami Beach, Florida, Water and Sewer Revenue and Revenue Refunding Bonds, Series 2017 | | | 5.000 | % | | | 09/01/2034 | | | | Aa3 | | | | 750,000 | | | | 931,298 | |
City of Tampa, Florida, Revenue and Revenue Refunding Bonds, (The University of Tampa Project), Series 2020A | | | 5.000 | % | | | 04/01/2035 | | | | A- | | | | 1,000,000 | | | | 1,270,280 | |
City of Tampa, Florida, Revenue and Revenue Refunding Bonds, (The University of Tampa Project), Series 2020A | | | 5.000 | % | | | 04/01/2036 | | | | A- | | | | 1,600,000 | | | | 2,027,248 | |
JEA Florida, Water and Sewer System Revenue Bonds, 2020 Series A | | | 3.000 | % | | | 10/01/2036 | | | | Aa3 | | | | 8,295,000 | | | | 9,022,223 | |
| | | | | | | | | | | | | | | | | | | | |
| | | | | | | | | | | | | | | | | | | 26,594,251 | |
| | | | | | | | | | | | | | | | | | | | |
Georgia (0.55%) | | | | | | | | | | | | | | | | | | | | |
Fayette County, Georgia, Water Revenue Bonds, Series 2009 | | | 5.000 | % | | | 10/01/2021 | | | | Aa2 | | | | 1,165,000 | | | | 1,169,136 | |
Harris County School District (Georgia), General Obligation Bonds, Series 2020 | | | 3.000 | % | | | 03/01/2034 | | | | NR | | | | 500,000 | | | | 571,245 | |
Harris County School District (Georgia), General Obligation Bonds, Series 2020 | | | 3.000 | % | | | 03/01/2035 | | | | NR | | | | 250,000 | | | | 284,145 | |
Forsyth County Water and Sewerage Authority (Georgia), Refunding and Improvement Revenue Bonds, Series 2019 | | | 3.000 | % | | | 04/01/2035 | | | | Aaa | | | | 1,000,000 | | | | 1,126,820 | |
Harris County School District (Georgia), General Obligation Bonds, Series 2020 | | | 3.000 | % | | | 03/01/2036 | | | | NR | | | | 700,000 | | | | 793,541 | |
| | | | | | | | | | | | | | | | | | | | |
| | | | | | | | | | | | | | | | | | | 3,944,887 | |
| | | | | | | | | | | | | | | | | | | | |
Hawaii (0.09%) | | | | | | | | | | | | | | | | | | | | |
County of Hawaii, General Obligation Bonds, 2013 Series A (Prerefunded to 09-01-2022 @ 100) (b) | | | 5.000 | % | | | 09/01/2031 | | | | Aa2 | | | | 575,000 | | | | 610,109 | |
| | | | | | | | | | | | | | | | | | | | |
Idaho (1.34%) | | | | | | | | | | | | | | | | | | | | |
Independent School District No. 1 of Nez Perce County, Idaho (Lewiston), General Obligation Bonds, Series 2017B, (Sales Tax and Credit Enhancement Guaranty) | | | 4.000 | % | | | 09/15/2031 | | | | Aa3 | | | | 2,880,000 | | | | 3,371,126 | |
Boise State University, General Revenue Project Bonds, Series 2018A | | | 4.000 | % | | | 04/01/2032 | | | | A+ | | | | 445,000 | | | | 522,221 | |
Idaho State University, General Revenue Bonds, Series 2019 | | | 4.000 | % | | | 04/01/2032 | | | | A1 | | | | 265,000 | | | | 314,126 | |
Boise State University, General Revenue Refunding Bonds, Series 2020A (Tax Exempt) | | | 3.000 | % | | | 04/01/2033 | | | | A+ | | | | 545,000 | | | | 591,390 | |
| | |
| 24 | | See accompanying notes to financial statements. |
STATE FARM ASSOCIATES’ FUNDS TRUST MUNICIPAL BOND FUND
SCHEDULE OF INVESTMENTS (continued)
May 31, 2021
(Unaudited)
| | | | | | | | | | | | | | | | | | | | |
| | | Coupon
rate | | | Maturity date | | | Rating (a) | | | Principal
amount | | | Value | |
Long-term Municipal Bonds (Cont.) | | | | | | | | | | | | | | | | | | | | |
Idaho (Cont.) | | | | | | | | | | | | | | | | | | | | |
Idaho State University, General Revenue Bonds, Series 2019 | | | 4.000 | % | | | 04/01/2033 | | | | A1 | | | $ | 180,000 | | | $ | 212,747 | |
Boise State University, General Revenue Project Bonds, Series 2018A | | | 5.000 | % | | | 04/01/2034 | | | | A+ | | | | 240,000 | | | | 295,798 | |
Boise State University, General Revenue Refunding Bonds, Series 2020A (Tax Exempt) | | | 3.000 | % | | | 04/01/2034 | | | | A+ | | | | 310,000 | | | | 335,321 | |
Idaho State University, General Revenue Bonds, Series 2019 | | | 4.000 | % | | | 04/01/2034 | | | | A1 | | | | 255,000 | | | | 300,553 | |
Boise State University, General Revenue Project Bonds, Series 2018A | | | 5.000 | % | | | 04/01/2035 | | | | A+ | | | | 250,000 | | | | 307,663 | |
Boise State University, General Revenue Refunding Bonds, Series 2020A (Tax Exempt) | | | 3.000 | % | | | 04/01/2035 | | | | A+ | | | | 300,000 | | | | 323,115 | |
Idaho State University, General Revenue Bonds, Series 2019 | | | 4.000 | % | | | 04/01/2035 | | | | A1 | | | | 175,000 | | | | 205,207 | |
The Regents of The University of Idaho, General Revenue Refunding Bonds, Series 2021A | | | 5.000 | % | | | 04/01/2035 | | | | A1 | | | | 420,000 | | | | 558,776 | |
Boise State University, General Revenue Refunding Bonds, Series 2020A (Tax Exempt) | | | 3.000 | % | | | 04/01/2036 | | | | A+ | | | | 300,000 | | | | 322,245 | |
Idaho State University, General Revenue Bonds, Series 2019 | | | 4.000 | % | | | 04/01/2036 | | | | A1 | | | | 200,000 | | | | 233,966 | |
The Regents of The University of Idaho, General Revenue Refunding Bonds, Series 2021A | | | 5.000 | % | | | 04/01/2036 | | | | A1 | | | | 400,000 | | | | 530,672 | |
Boise State University, General Revenue Refunding Bonds, Series 2020A (Tax Exempt) | | | 3.000 | % | | | 04/01/2037 | | | | A+ | | | | 310,000 | | | | 331,963 | |
The Regents of The University of Idaho, General Revenue Refunding Bonds, Series 2021A | | | 5.000 | % | | | 04/01/2037 | | | | A1 | | | | 385,000 | | | | 509,132 | |
The Regents of The University of Idaho, General Revenue Refunding Bonds, Series 2021A | | | 5.000 | % | | | 04/01/2038 | | | | A1 | | | | 275,000 | | | | 363,278 | |
| | | | | | | | | | | | | | | | | | | | |
| | | | | | | | | | | | | | | | | | | 9,629,299 | |
| | | | | | | | | | | | | | | | | | | | |
Indiana (3.49%) | | | | | | | | | | | | | | | | | | | | |
City of Noblesville, Indiana, Sewage Works Revenue Bonds of 2011 (Currently Refunded to 07-01-2021 @ 100) (b) | | | 4.250 | % | | | 07/01/2023 | | | | Aa2 | | | | 215,000 | | | | 215,714 | |
Perry Township Multischool Building Corporation of 1996, Indianapolis, Indiana, Unlimited Ad Valorem Property Tax First Mortgage Bonds, Series 2016 | | | 5.000 | % | | | 01/15/2026 | | | | A+ | | | | 1,190,000 | | | | 1,411,138 | |
Perry Township Multischool Building Corporation of 1996, Indianapolis, Indiana, Unlimited Ad Valorem Property Tax First Mortgage Bonds, Series 2016 | | | 5.000 | % | | | 07/15/2026 | | | | A+ | | | | 1,105,000 | | | | 1,328,762 | |
East Noble School Building Corporation, Kendallville, Indiana, Unlimited Ad Valorem Property Tax First Mortgage Bonds, Series 2016 | | | 2.000 | % | | | 01/15/2027 | | | | A+ | | | | 1,205,000 | | | | 1,246,633 | |
Hamilton Southeastern Consolidated School Building Corporation, Hamilton County, Indiana, Unlimited Ad Valorem Property Tax First Mortgage Bonds, Series 2015G | | | 4.000 | % | | | 07/15/2027 | | | | AA | | | | 1,190,000 | | | | 1,350,460 | |
Hamilton Southeastern Consolidated School Building Corporation, Hamilton County, Indiana, Unlimited Ad Valorem Property Tax First Mortgage Bonds, Series 2015G | | | 4.500 | % | | | 07/15/2028 | | | | AA | | | | 500,000 | | | | 576,460 | |
New Albany-Floyd County School Building Corporation, Ad Valorem Property Tax First Mortgage Bonds, Series 2017, (Floyd County, Indiana) | | | 4.000 | % | | | 07/15/2028 | | | | A+ | | | | 500,000 | | | | 592,565 | |
Warsaw Multi-School Building Corporation, Warsaw, Indiana, Unlimited Ad Valorem Property Tax First Mortgage Bonds, Series 2015 | | | 4.000 | % | | | 07/15/2028 | | | | A+ | | | | 1,000,000 | | | | 1,142,620 | |
City of West Lafayette, Indiana, Sewage Works Revenue Bonds, Series 2016 | | | 3.750 | % | | | 07/01/2029 | | | | A+ | | | | 220,000 | | | | 241,844 | |
New Albany-Floyd County School Building Corporation, Ad Valorem Property Tax First Mortgage Bonds, Series 2017, (Floyd County, Indiana) | | | 4.000 | % | | | 07/15/2029 | | | | A+ | | | | 2,000,000 | | | | 2,357,460 | |
Valparaiso Multi-Schools Building Corporation, (Porter County, Indiana), Unlimited Ad Valorem Property Tax First Mortgage Bonds, Series 2015 | | | 5.000 | % | | | 07/15/2029 | | | | AA- | | | | 3,000,000 | | | | 3,566,790 | |
City of West Lafayette, Indiana, Sewage Works Revenue Bonds, Series 2016 | | | 4.000 | % | | | 07/01/2030 | | | | A+ | | | | 750,000 | | | | 855,352 | |
Munster School Building Corporation, Lake County, Indiana, Unlimited Ad Valorem Property Tax First Mortgage Bonds, Series 2018 | | | 3.375 | % | | | 01/15/2031 | | | | AA+ | | | | 1,095,000 | | | | 1,230,889 | |
Munster School Building Corporation, Lake County, Indiana, Unlimited Ad Valorem Property Tax First Mortgage Bonds, Series 2018 | | | 4.000 | % | | | 07/15/2032 | | | | AA+ | | | | 2,285,000 | | | | 2,698,905 | |
City of Fort Wayne, Allen County, Indiana, Waterworks Revenue Bonds of 2019, Series A | | | 3.000 | % | | | 12/01/2033 | | | | Aa3 | | | | 650,000 | | | | 699,589 | |
City of Lebanon, Indiana, Sewage Works Revenue Bonds of 2018 | | | 4.000 | % | | | 07/01/2034 | | | | AA- | | | | 865,000 | | | | 999,741 | |
Hamilton Southeastern Consolidated School Building Corporation, (Hamilton County, Indiana), Unlimited Ad Valorem Property Tax First Mortgage Bonds, Series 2018 | | | 5.000 | % | | | 07/15/2034 | | | | AA | | | | 335,000 | | | | 414,663 | |
City of Fort Wayne, Allen County, Indiana, Waterworks Revenue Bonds of 2019, Series A | | | 3.000 | % | | | 12/01/2034 | | | | Aa3 | | | | 675,000 | | | | 729,878 | |
City of Lebanon, Indiana, Sewage Works Revenue Bonds of 2018 | | | 4.000 | % | | | 07/01/2035 | | | | AA- | | | | 895,000 | | | | 1,025,759 | |
| | |
| See accompanying notes to financial statements. | | 25 |
STATE FARM ASSOCIATES’ FUNDS TRUST MUNICIPAL BOND FUND
SCHEDULE OF INVESTMENTS (continued)
May 31, 2021
(Unaudited)
| | | | | | | | | | | | | | | | | | | | |
| | | Coupon
rate | | | Maturity date | | | Rating (a) | | | Principal
amount | | | Value | |
| | | | | | | | | | | | | | | | | | | | |
Long-term Municipal Bonds (Cont.) | | | | | | | | | | | | | | | | | | | | |
Indiana (Cont.) | | | | | | | | | | | | | | | | | | | | |
Hamilton Southeastern Consolidated School Building Corporation, (Hamilton County, Indiana), Unlimited Ad Valorem Property Tax first Mortgage Bonds, Series 2018 | | | 5.000 | % | | | 07/15/2035 | | | | AA | | | $ | 600,000 | | | $ | 739,926 | |
City of Fort Wayne, Allen County, Indiana, Waterworks Revenue Bonds of 2019, Series A | | | 3.000 | % | | | 12/01/2035 | | | | Aa3 | | | | 700,000 | | | | 753,872 | |
Hamilton Southeastern Consolidated School Building Corporation, (Hamilton County, Indiana), Unlimited Ad Valorem Property Tax First Mortgage Bonds, Series 2018 | | | 5.000 | % | | | 07/15/2036 | | | | AA | | | | 700,000 | | | | 860,384 | |
| | | | | | | | | | | | | | | | | | | | |
| | | | | | | | | | | | | | | | | | | 25,039,404 | |
| | | | | | | | | | | | | | | | | | | | |
lowa (2.23%) | | | | | | | | | | | | | | | | | | | | |
Dallas Center-Grimes Community School District, lowa, General Obligation School Bonds, Series 2015 (Currently Refunded to 06-01-2021 @ 100) (b) | | | 3.000 | % | | | 06/01/2025 | | | | Aa2 | | | | 265,000 | | | | 265,000 | |
Johnston Community School District, Iowa, General Obligation School and Refunding Bonds, Series 2015 | | | 3.000 | % | | | 06/01/2025 | | | | AA- | | | | 2,370,000 | | | | 2,423,349 | |
Dallas Center-Grimes Community School District, Iowa, General Obligation School Bonds, Series 2015 (Currently Refunded to 06-01-2021 @ 100) (b) | | | 3.000 | % | | | 06/01/2026 | | | | Aa2 | | | | 500,000 | | | | 500,000 | |
Grundy County, Iowa, General Obligation Urban Renewal Refunding Bonds, Series 2015 | | | 3.000 | % | | | 06/01/2026 | | | | A1 | | | | 1,130,000 | | | | 1,154,589 | |
Johnston Community School District, Iowa, General Obligation School and Refunding Bonds, Series 2015 | | | 3.000 | % | | | 06/01/2026 | | | | AA- | | | | 2,445,000 | | | | 2,496,223 | |
Des Moines Metropolitan Wastewater Reclamation Authority, Sewer Revenue Refunding Bonds, Series 2015E | | | 3.000 | % | | | 06/01/2027 | | | | Aa3 | | | | 1,610,000 | | | | 1,686,250 | |
Grundy County, Iowa, General Obligation Urban Renewal Refunding Bonds, Series 2015 | | | 3.000 | % | | | 06/01/2027 | | | | A1 | | | | 1,175,000 | | | | 1,198,253 | |
Waukee Community School District, Dallas County, Iowa, General Obligation School Refunding Bonds, Series 2016B | | | 2.000 | % | | | 06/01/2027 | | | | Aa2 | | | | 2,100,000 | | | | 2,161,824 | |
City of Cedar Rapids, Iowa, Water Revenue Bonds, Series 2018D | | | 3.000 | % | | | 06/01/2029 | | | | Aa2 | | | | 950,000 | | | | 1,040,468 | |
City of Council Bluffs, Iowa, General Obligation Bonds, Series 2018A | | | 3.000 | % | | | 06/01/2029 | | | | Aa2 | | | | 1,050,000 | | | | 1,138,242 | |
City of West Des Moines, Iowa, General Obligation Urban Renewal Bonds, Series 2017 D | | | 3.000 | % | | | 06/01/2031 | | | | AAA | | | | 1,770,000 | | | | 1,891,032 | |
| | | | | | | | | | | | | | | | | | | | |
| | | | | | | | | | | | | | | | | | | 15,955,230 | |
| | | | | | | | | | | | | | | | | | | | |
Kansas (2.89%) | | | | | | | | | | | | | | | | | | | | |
Unified School District No. 512, Johnson County, Kansas, (Shawnee Mission), General Obligation Refunding Bonds, Series 2012-A (Currently Refunded to 06-04-2021 @ 100) (b) | | | 2.000 | % | | | 10/01/2022 | | | | Aaa | | | | 1,475,000 | | | | 1,475,147 | |
Unified School District No. 233, Johnson County, Kansas (Olathe), General Obligation School Bonds, Series 2016A (Prerefunded to 09-01-2024 @ 100) (b) | | | 3.000 | % | | | 09/01/2026 | | | | Aa2 | | | | 2,740,000 | | | | 2,979,805 | |
Unified School District No. 233, Johnson County, Kansas (Olathe), General Obligation School Bonds, Series 2016A (Prerefunded to 09-01-2024 @ 100) (b) | | | 3.000 | % | | | 09/01/2027 | | | | Aa2 | | | | 1,490,000 | | | | 1,620,405 | |
Unified School District No. 512, Johnson County, Kansas, (Shawnee Mission), General | | | 3.000 | % | | | 10/01/2027 | | | | Aaa | | | | 1,000,000 | | | | 1,097,460 | |
Obligation Refunding and Improvement Bonds, Series 2015-A Unified School District No. 233, Johnson County, Kansas (Olathe), General Obligation School Improvement and Refunding Bonds, Series 2013C (Crossover Refunding to 09-01-2021 @100) (b) | | | 4.500 | % | | | 09/01/2028 | | | | Aa2 | | | | 3,000,000 | | | | 3,031,860 | |
Water District No. 1 of Johnson County, Kansas, Water Revenue Refunding Bonds, Series 2017A | | | 3.000 | % | | | 01/01/2032 | | | | Aaa | | | | 2,500,000 | | | | 2,686,100 | |
State of Kansas, Department of Transportation, Highway Revenue Bonds, Series 2017A | | | 5.000 | % | | | 09/01/2033 | | | | Aa2 | | | | 5,000,000 | | | | 6,220,800 | |
City of Manhattan, Kansas, General Obligation Refunding and Improvement Bonds, Series 2019-A | | | 4.000 | % | | | 11/01/2033 | | | | Aa2 | | | | 440,000 | | | | 532,444 | |
City of Manhattan, Kansas, General Obligation Refunding and Improvement Bonds, Series 2019-A | | | 4.000 | % | | | 11/01/2034 | | | | Aa2 | | | | 455,000 | | | | 547,283 | |
City of Manhattan, Kansas, General Obligation Refunding and Improvement Bonds, Series 2019-A | | | 3.000 | % | | | 11/01/2035 | | | | Aa2 | | | | 475,000 | | | | 512,720 | |
| | | | | | | | | | | | | | | | | | | | |
| | | | | | | | | | | | | | | | | | | 20,704,024 | |
| | | | | | | | | | | | | | | | | | | | |
| | |
| 26 | | See accompanying notes to financial statements. |
STATE FARM ASSOCIATES’ FUNDS TRUST MUNICIPAL BOND FUND
SCHEDULE OF INVESTMENTS (continued)
May 31, 2021
(Unaudited)
| | | | | | | | | | | | | | | | | | | | |
| | | Coupon
rate | | | Maturity date | | | Rating (a) | | | Principal
amount | | | Value | |
Long-term Municipal Bonds (Cont.) | | | | | | | | | | | | | | | | | | | | |
Kentucky (2.33%) | | | | | | | | | | | | | | | | | | | | |
Northern Kentucky Water District Revenue Bonds, 2013 Series A | | | 4.000 | % | | | 02/01/2028 | | | | Aa2 | | | $ | 1,110,000 | | | $ | 1,196,491 | |
City of Owensboro, Kentucky, Water Revenue Refunding and Improvement Bonds, Series 2018 | | | 3.250 | % | | | 09/15/2029 | | | | A1 | | | | 1,735,000 | | | | 1,916,255 | |
Lexington-Fayette Urban County Government (Kentucky), Various Purpose General Obligation Bonds, Series 2018A | | | 3.000 | % | | | 10/01/2029 | | | | Aa2 | | | | 1,060,000 | | | | 1,140,899 | |
City of Owensboro, Kentucky, Water Revenue Refunding and Improvement Bonds, Series 2018 | | | 3.375 | % | | | 09/15/2030 | | | | A1 | | | | 1,800,000 | | | | 1,991,664 | |
Lexington-Fayette Urban County Government (Kentucky), Various Purpose General Obligation Bonds, Series 2018A | | | 3.125 | % | | | 10/01/2030 | | | | Aa2 | | | | 1,095,000 | | | | 1,179,315 | |
Northern Kentucky Water District, Refunding Revenue Bonds, Series 2016 | | | 3.000 | % | | | 02/01/2031 | | | | Aa2 | | | | 3,660,000 | | | | 3,939,112 | |
City of Owensboro, Kentucky, Water Revenue Refunding and Improvement Bonds, Series 2018 | | | 3.500 | % | | | 09/15/2031 | | | | A1 | | | | 1,860,000 | | | | 2,044,475 | |
City of Bowling Green, Kentucky, Water and Sewer Revenue Bonds, Series 2019 | | | 3.000 | % | | | 06/01/2033 | | | | Aa3 | | | | 3,115,000 | | | | 3,287,789 | |
| | | | | | | | | | | | | | | | | | | | |
| | | | | | | | | | | | | | | | | | | 16,696,000 | |
| | | | | | | | | | | | | | | | | | | | |
Maine (0.46%) | | | | | | | | | | | | | | | | | | | | |
Maine Municipal Bond Bank, 2017 Series D Refunding Bonds | | | 3.000 | % | | | 11/01/2031 | | | | Aa2 | | | | 3,000,000 | | | | 3,309,450 | |
| | | | | | | | | | | | | | | | | | | | |
Maryland (0.47%) | | | | | | | | | | | | | | | | | | | | |
Montgomery County, Maryland, General Obligation Bonds, Consolidated Public Improvement Bonds of 2015, Series B | | | 3.000 | % | | | 12/01/2028 | | | | Aaa | | | | 2,000,000 | | | | 2,123,940 | |
Caroline County, Maryland, (County Commissioners of Caroline County), Consolidated Public Improvement and Refunding Bonds of 2019 | | | 3.000 | % | | | 01/15/2032 | | | | Aa3 | | | | 1,150,000 | | | | 1,275,913 | |
| | | | | | | | | | | | | | | | | | | | |
| | | | | | | | | | | | | | | | | | | 3,399,853 | |
| | | | | | | | | | | | | | | | | | | | |
Massachusetts (0.72%) | | | | | | | | | | | | | | | | | | | | |
Town of Northbridge, Massachusetts, General Obligation School Project Loan, Chapter 70B Bonds, Unlimited Tax | | | 3.000 | % | | | 06/01/2032 | | | | AA | | | | 1,000,000 | | | | 1,101,430 | |
The Commonwealth of Massachusetts, Commonwealth Transportation Fund Revenue Bonds, (Accelerated Bridge Program), 2013 Series A (Prerefunded to 06-01-2021 @ 100) (b) | | | 5.000 | % | | | 06/01/2034 | | | | Aa1 | | | | 2,000,000 | | | | 2,000,000 | |
The Commonwealth of Massachusetts, General Obligation Bonds, Consolidated Loan of 2014, Series A (Prerefunded to 12-01-2021 @ 100) (b) | | | 5.000 | % | | | 12/01/2034 | | | | AA | | | | 2,000,000 | | | | 2,049,000 | |
| | | | | | | | | | | | | | | | | | | | |
| | | | | | | | | | | | | | | | | | | 5,150,430 | |
| | | | | | | | | | | | | | | | | | | | |
Michigan (4.49%) | | | | | | | | | | | | | | | | | | | | |
Plymouth-Canton Community Schools, Counties of Wayne and Washtenaw, State of Michigan, 2012 Refunding Bonds, Series A, (General Obligation - Unlimited Tax) | | | 5.000 | % | | | 05/01/2022 | | | | Aa2 | | | | 450,000 | | | | 470,124 | |
Plymouth-Canton Community Schools, Counties of Wayne and Washtenaw, State of Michigan, 2012 Refunding Bonds, Series A, (General Obligation - Unlimited Tax) | | | 5.000 | % | | | 05/01/2025 | | | | Aa2 | | | | 1,260,000 | | | | 1,315,742 | |
Hudsonville Public Schools, Counties of Ottawa and Allegan, State of Michigan, 2013 Refunding Bonds, (General Obligation - Unlimited Tax) | | | 4.000 | % | | | 05/01/2026 | | | | A+ | | | | 1,290,000 | | | | 1,380,610 | |
Plymouth-Canton Community Schools, Counties of Wayne and Washtenaw, State of Michigan, 2012 Refunding Bonds, Series A, (General Obligation - Unlimited Tax) | | | 4.000 | % | | | 05/01/2026 | | | | Aa2 | | | | 2,300,000 | | | | 2,376,820 | |
Plymouth-Canton Community Schools, Counties of Wayne and Washtenaw, State of Michigan, 2013 School Building and Site Bonds, Series A, (General Obligation - Unlimited Tax) | | | 4.000 | % | | | 05/01/2026 | | | | Aa2 | | | | 3,850,000 | | | | 4,116,574 | |
East Grand Rapids Public Schools, County of Kent, State of Michigan, 2014 Refunding Bonds, Series A, (General Obligation - Unlimited Tax) | | | 5.000 | % | | | 05/01/2027 | | | | A+ | | | | 1,000,000 | | | | 1,136,800 | |
Hamilton Community Schools, County of Allegan, State of Michigan, 2015 Refunding Bonds, (General Obligation - Unlimited Tax) | | | 4.000 | % | | | 05/01/2027 | | | | AA- | | | | 500,000 | | | | 566,890 | |
Mattawan Consolidated School, Counties of Van Buren and Kalamazoo, State of Michigan, 2015 School Building and Site Bonds, Series I, (General Obligation - Unlimited Tax) | | | 5.000 | % | | | 05/01/2027 | | | | A+ | | | | 1,005,000 | | | | 1,185,237 | |
East Grand Rapids Public Schools, County of Kent, State of Michigan, 2014 Refunding Bonds, Series A, (General Obligation - Unlimited Tax) | | | 5.000 | % | | | 05/01/2028 | | | | A+ | | | | 765,000 | | | | 868,214 | |
| | |
| See accompanying notes to financial statements. | | 27 |
STATE FARM ASSOCIATES’ FUNDS TRUST MUNICIPAL BOND FUND
SCHEDULE OF INVESTMENTS (continued)
May 31, 2021
(Unaudited)
| | | | | | | | | | | | | | | | | | | | |
| | | Coupon
rate | | | Maturity date | | | Rating (a) | | | Principal
amount | | | Value | |
Long-term Municipal Bonds (Cont.) | | | | | | | | | | | | | | | | | | | | |
Michigan (Cont.) | | | | | | | | | | | | | | | | | | | | |
Hamilton Community Schools, County of Allegan, State of Michigan, 2015 Refunding Bonds, (General Obligation - Unlimited Tax) | | | 4.000 | % | | | 05/01/2028 | | | | AA- | | | $ | 300,000 | | | $ | 339,516 | |
Mattawan Consolidated School, Counties of Van Buren and Kalamazoo, State of Michigan, 2015 School Building and Site Bonds, Series I, (General Obligation - Unlimited Tax) | | | 5.000 | % | | | 05/01/2028 | | | | A+ | | | | 600,000 | | | | 706,062 | |
Zeeland Public Schools, Counties of Ottawa and Allegan, State of Michigan, 2015 School Building and Site Bonds, Series A, (General Obligation - Unlimited Tax) | | | 5.000 | % | | | 05/01/2029 | | | | A | | | | 700,000 | | | | 816,025 | |
Zeeland Public Schools, Counties of Ottawa and Allegan, State of Michigan, 2015 School Building and Site Bonds, Series A, (General Obligation - Unlimited Tax) | | | 5.000 | % | | | 05/01/2030 | | | | A | | | | 1,100,000 | | | | 1,284,173 | |
City of Grosse Pointe, County of Wayne, State of Michigan, 2018 Unlimited Tax General Obligation Bonds | | | 4.000 | % | | | 10/01/2032 | | | | AAA | | | | 595,000 | | | | 701,309 | |
City of Grosse Pointe, County of Wayne, State of Michigan, 2018 Unlimited Tax General Obligation Bonds | | | 4.000 | % | | | 10/01/2033 | | | | AAA | | | | 630,000 | | | | 740,534 | |
Forest Hills Public Schools, County of Kent, State of Michigan, 2021 School Building and Site Bonds, Series II, (General Obligation - Unlimited Tax) | | | 3.000 | % | | | 05/01/2034 | | | | Aa2 | | | | 1,425,000 | | | | 1,622,619 | |
City of Grosse Pointe, County of Wayne, State of Michigan, 2018 Unlimited Tax General Obligation Bonds | | | 4.000 | % | | | 10/01/2034 | | | | AAA | | | | 670,000 | | | | 785,823 | |
Forest Hills Public Schools, County of Kent, State of Michigan, 2021 School Building and Site Bonds, Series II, (General Obligation - Unlimited Tax) | | | 3.000 | % | | | 05/01/2035 | | | | Aa2 | | | | 915,000 | | | | 1,038,854 | |
Lowell Area Schools, Counties of Kent and Ionia, State of Michigan, 2019 School Building and Site Bonds, Series I, (General Obligation - Unlimited Tax) | | | 4.000 | % | | | 05/01/2035 | | | | A+ | | | | 400,000 | | | | 480,512 | |
Rockford Public Schools, County of Kent, State of Michigan, 2019 School Building and Site Bonds, Series I, (General Obligation - Unlimited Tax) | | | 4.000 | % | | | 05/01/2035 | | | | A | | | | 1,755,000 | | | | 2,093,715 | |
Forest Hills Public Schools, County of Kent, State of Michigan, 2021 School Building and Site Bonds, Series II, (General Obligation - Unlimited Tax) | | | 3.000 | % | | | 05/01/2036 | | | | Aa2 | | | | 720,000 | | | | 813,506 | |
Grosse Pointe Public School System, County of Wayne, State of Michigan, 2019 School Building and Site and Refunding Bonds, (Unlimited Tax General Obligation) | | | 5.000 | % | | | 05/01/2036 | | | | Aa3 | | | | 1,635,000 | | | | 2,090,021 | |
Lowell Area Schools, Counties of Kent and Ionia, State of Michigan, 2019 School Building and Site Bonds, Series I, (General Obligation - Unlimited Tax) | | | 4.000 | % | | | 05/01/2036 | | | | A+ | | | | 865,000 | | | | 1,037,247 | |
West Bloomfield School District, County of Oakland, State of Michigan, 2020 School Building and Site Bonds, (General Obligation - Unlimited Tax) | | | 3.000 | % | | | 05/01/2036 | | | | A1 | | | | 3,825,000 | | | | 4,238,176 | |
| | | | | | | | | | | | | | | | | | | | |
| | | | | | | | | | | | | | | | | | | 32,205,103 | |
| | | | | | | | | | | | | | | | | | | | |
Minnesota (3.06%) | | | | | | | | | | | | | | | | | | | | |
Independent School District No. 194 (Lakeville), Minnesota, General Obligation Refunding Bonds, Series 2012D | | | 5.000 | % | | | 02/01/2022 | | | | Aa2 | | | | 2,720,000 | | | | 2,808,373 | |
Independent School District No. 276, Minnetonka Public Schools, Minnesota, General Obligation Refunding Bonds, Series 2016I | | | 2.375 | % | | | 02/01/2025 | | | | Aaa | | | | 2,805,000 | | | | 2,893,582 | |
Independent School District No. 276, Minnetonka Public Schools, Minnesota, General Obligation Refunding Bonds, Series 2016I | | | 3.000 | % | | | 02/01/2026 | | | | Aaa | | | | 1,000,000 | | | | 1,041,540 | |
Independent School District No. 720, Shakopee Public Schools, Minnesota, General Obligation School Building Bonds, Series 2015A (Crossover Refunding to 02-01-2024 @ 100) (b) | | | 3.250 | % | | | 02/01/2026 | | | | A3 | | | | 3,860,000 | | | | 4,156,525 | |
Independent School District No. 276, Minnetonka Public Schools, Minnesota, General Obligation Refunding Bonds, Series 2016I | | | 3.000 | % | | | 02/01/2027 | | | | Aaa | | | | 1,590,000 | | | | 1,653,027 | |
City of Eagan, Minnesota, General Obligation Bonds, Series 2018A | | | 3.250 | % | | | 02/01/2032 | | | | Aaa | | | | 1,245,000 | | | | 1,358,818 | |
Independent School District No. 622, (North St. Paul-Maplewood-Oakdale), Minnesota, (Ramsey and Washington Counties), General Obligation Facilities Maintenance Bonds, Series 2019B | | | 3.000 | % | | | 02/01/2034 | | | | A1 | | | | 3,300,000 | | | | 3,648,084 | |
City of Minneapolis, Minnesota, General Obligation Bonds (Green Bonds), Series 2019 | | | 3.000 | % | | | 12/01/2035 | | | | AAA | | | | 2,000,000 | | | | 2,183,820 | |
Minnesota Higher Education Facilities Authority, Revenue Bonds, Series 2021, (St. Olaf College) | | | 3.000 | % | | | 10/01/2038 | | | | A1 | | | | 2,000,000 | | | | 2,220,580 | |
| | | | | | | | | | | | | | | | | | | | |
| | | | | | | | | | | | | | | | | | | 21,964,349 | |
| | | | | | | | | | | | | | | | | | | | |
| | |
| 28 | | See accompanying notes to financial statements. |
STATE FARM ASSOCIATES’ FUNDS TRUST MUNICIPAL BOND FUND
SCHEDULE OF INVESTMENTS (continued)
May 31, 2021
(Unaudited)
| | | | | | | | | | | | | | | | | | | | |
| | | Coupon
rate | | | Maturity date | | | Rating (a) | | | Principal
amount | | | Value | |
Long-term Municipal Bonds (Cont.) | | | | | | | | | | | | | | | | | | | | |
Mississippi (1.19%) | | | | | | | | | | | | | | | | | | | | |
Madison County School District, Madison County, Mississippi, General Obligation Refunding Bonds, Series 2012 | | | 4.000 | % | | | 04/15/2022 | | | | Aa2 | | | $ | 2,480,000 | | | $ | 2,563,725 | |
State of Mississippi, General Obligation Bonds, Series 2015F (Tax-Exempt) | | | 3.000 | % | | | 11/01/2026 | | | | Aa2 | | | | 3,000,000 | | | | 3,308,580 | |
Mississippi Development Bank, Special Obligation Bonds, Series 2015, (Canton Public School District, Madison County, Mississippi, General Obligation Bond Project) | | | 4.250 | % | | | 12/01/2028 | | | | A1 | | | | 2,305,000 | | | | 2,650,081 | |
| | | | | | | | | | | | | | | | | | | | |
| | | | | | | | | | | | | | | | | | | 8,522,386 | |
| | | | | | | | | | | | | | | | | | | | |
Missouri (2.99%) | | | | | | | | | | | | | | | | | | | | |
| | | | | | | | | | | | | | | | | | | | |
The School District of Columbia, Boone County, State of Missouri, General Obligation Refunding and Improvement Bonds, Series 2012 | | | 3.500 | % | | | 03/01/2022 | | | | Aa1 | | | | 295,000 | | | | 302,549 | |
The School District of Columbia, Boone County, State of Missouri, General Obligation Refunding and Improvement Bonds, Series 2012 | | | 4.000 | % | | | 03/01/2024 | | | | Aa1 | | | | 2,050,000 | | | | 2,107,584 | |
Fort Zumwalt School District of St. Charles County, Missouri, General Obligation Refunding and Improvement Bonds, (Missouri Direct Deposit Program), Series 2015 | | | 4.000 | % | | | 03/01/2027 | | | | A2 | | | | 465,000 | | | | 509,594 | |
Fort Zumwalt School District of St. Charles County, Missouri, General Obligation Refunding and Improvement Bonds, (Missouri Direct Deposit Program), Series 2015 | | | 4.000 | % | | | 03/01/2028 | | | | A2 | | | | 400,000 | | | | 438,028 | |
Fort Zumwalt School District of St. Charles County, Missouri, General Obligation Refunding and Improvement Bonds, (Missouri Direct Deposit Program), Series 2015 | | | 4.000 | % | | | 03/01/2029 | | | | A2 | | | | 425,000 | | | | 465,537 | |
Liberty Public School District No. 53, Clay County, Missouri, General Obligation School Building Bonds, Series 2018 | | | 4.000 | % | | | 03/01/2033 | | | | AA | | | | 1,000,000 | | | | 1,143,620 | |
Liberty Public School District No. 53, Clay County, Missouri, General Obligation School Building Bonds, Series 2018 | | | 4.000 | % | | | 03/01/2034 | | | | AA | | | | 2,500,000 | | | | 2,853,925 | |
Wentzville R-IV School District, St. Charles County, Missouri, General Obligation Refunding and Improvement Bonds, (Missouri Direct Deposit Program), Series 2018 | | | 4.000 | % | | | 03/01/2034 | | | | Aa3 | | | | 3,000,000 | | | | 3,502,620 | |
Francis Howell R-lll School District, St. Charles County, Missouri, General Obligation Bonds, Series 2020 | | | 3.000 | % | | | 03/01/2035 | | | | AA | | | | 3,750,000 | | | | 4,109,662 | |
City of Columbia, Missouri, Water and Electric System Refunding Revenue Bonds, Series 2019B | | | 3.000 | % | | | 10/01/2035 | | | | A+ | | | | 3,520,000 | | | | 3,769,885 | |
Carthage R-IX School District of Jasper County, Missouri, General Obligation Bonds, (Missouri Direct Deposit Program), Series 2020A | | | 3.000 | % | | | 03/01/2036 | | | | A+ | | | | 500,000 | | | | 543,815 | |
Reorganized School District No. 7 of Jackson County, Missouri, (Lee’s Summit R-7), General Obligation School Building Bonds, Series 2016 | | | 5.000 | % | | | 03/01/2036 | | | | AA+ | | | | 1,000,000 | | | | 1,119,890 | |
Carthage R-IX School District of Jasper County, Missouri, General Obligation Bonds, (Missouri Direct Deposit Program), Series 2020A | | | 3.000 | % | | | 03/01/2037 | | | | A+ | | | | 550,000 | | | | 596,755 | |
| | | | | | | | | | | | | | | | | | | | |
| | | | | | | | | | | | | | | | | | | 21,463,464 | |
| | | | | | | | | | | | | | | | | | | | |
Montana (3.96%) | | | | | | | | | | | | | | | | | | | | |
School District No. 4 (Hellgate), Missoula County, Montana, General Obligation School Building Bonds, Series 2017 | | | 3.500 | % | | | 06/15/2025 | | | | A+ | | | | 860,000 | | | | 956,595 | |
High School District No. 44 (Belgrade), Gallatin County, Montana, General Obligation School Building Bonds, Series 2016 | | | 3.000 | % | | | 06/01/2027 | | | | A+ | | | | 525,000 | | | | 577,658 | |
School District No. 4 (Hellgate), Missoula County, Montana, General Obligation School Building Bonds, Series 2017 | | | 5.000 | % | | | 06/15/2032 | | | | A+ | | | | 945,000 | | | | 1,141,749 | |
High School District No. 1 (Missoula), Missoula County, Montana, General Obligation School Building Bonds, Series 2017 | | | 4.000 | % | | | 07/01/2032 | | | | Aa3 | | | | 1,010,000 | | | | 1,166,146 | |
City of Forsythe, Montana, Pollution Control Revenue Refunding Bonds, (Portland General Electric Company Project), Series 1998A (Non-AMT) | | | 2.125 | % | | | 05/01/2033 | | | | A | | | | 5,000,000 | | | | 5,218,600 | |
School District No. 4 (Hellgate), Missoula County, Montana, General Obligation School Building Bonds, Series 2017 | | | 5.000 | % | | | 06/15/2033 | | | | A+ | | | | 1,005,000 | | | | 1,211,457 | |
K-12 School District No. 9 (East Helena), Lewis and Clark County, Montana, General Obligation School Building Bonds, Series 2018 | | | 4.500 | % | | | 07/01/2033 | | | | A+ | | | | 560,000 | | | | 670,930 | |
| | |
| See accompanying notes to financial statements. | | 29 |
STATE FARM ASSOCIATES’ FUNDS TRUST MUNICIPAL BOND FUND
SCHEDULE OF INVESTMENTS (continued)
May 31, 2021
(Unaudited)
| | | | | | | | | | | | | | | | | | | | |
| | | Coupon
rate | | | Maturity date | | | Rating (a) | | | Principal
amount | | | Value | |
Long-term Municipal Bonds (Cont.) | | | | | | | | | | | | | | | | | | | | |
Montana (Cont.) | | | | | | | | | | | | | | | | | | | | |
School District No. 44 (Whitefish), Flathead County, Montana, General Obligation School Building Bonds, Series 2017 | | | 4.000 | % | | | 07/01/2033 | | | | A+ | | | $ | 520,000 | | | $ | 603,730 | |
School District No. 4 (Hellgate), Missoula County, Montana, General Obligation School Building Bonds, Series 2017 | | | 5.000 | % | | | 06/15/2034 | | | | A+ | | | | 505,000 | | | | 607,470 | |
High School District No. A (Great Falls), Cascade County, Montana, General Obligation School Building Bonds, Series 2018 | | | 5.000 | % | | | 07/01/2034 | | | | A+ | | | | 725,000 | | | | 896,209 | |
K-12 School District No. 9 (East Helena), Lewis and Clark County, Montana, General Obligation School Building Bonds, Series 2018 | | | 5.000 | % | | | 07/01/2034 | | | | A+ | | | | 805,000 | | | | 995,101 | |
School District No. 44 (Whitefish), Flathead County, Montana, General Obligation School Building Bonds, Series 2017 | | | 4.000 | % | | | 07/01/2034 | | | | A+ | | | | 565,000 | | | | 654,400 | |
School District No. 6 (Columbia Falls), Flathead County, Montana, General Obligation School Building Bonds, Series 2019 | | | 4.000 | % | | | 07/01/2034 | | | | A+ | | | | 1,000,000 | | | | 1,199,730 | |
School District No. 4 (Hellgate), Missoula County, Montana, General Obligation School Building Bonds, Series 2017 | | | 5.250 | % | | | 06/15/2035 | | | | A+ | | | | 880,000 | | | | 1,069,922 | |
K-12 School District No. 9 (East Helena), Lewis and Clark County, Montana, General Obligation School Building Bonds, Series 2018 | | | 5.000 | % | | | 07/01/2035 | | | | A+ | | | | 1,925,000 | | | | 2,376,162 | |
School District No. 44 (Whitefish), Flathead County, Montana, General Obligation School Building Bonds, Series 2017 | | | 4.000 | % | | | 07/01/2035 | | | | A+ | | | | 845,000 | | | | 977,259 | |
School District No. 6 (Columbia Falls), Flathead County, Montana, General Obligation School Building Bonds, Series 2019 | | | 4.000 | % | | | 07/01/2035 | | | | A+ | | | | 750,000 | | | | 898,155 | |
State of Montana, The Board of Regents of Higher Education, The University of Montana, General Revenue Bonds, Series 2019B | | | 3.000 | % | | | 11/15/2035 | | | | Aa3 | | | | 3,660,000 | | | | 4,002,173 | |
K-12 School District No. 1 (Townsend), Broadwater County, Montana, General Obligation School Building Bonds, Series 2020 | | | 3.000 | % | | | 07/01/2036 | | | | A+ | | | | 750,000 | | | | 832,650 | |
School District No. 44 (Whitefish), Flathead County, Montana, General Obligation School Building Bonds, Series 2017 | | | 4.000 | % | | | 07/01/2036 | | | | A+ | | | | 585,000 | | | | 674,991 | |
School District No. 6 (Columbia Falls), Flathead County, Montana, General Obligation School Building Bonds, Series 2019 | | | 4.000 | % | | | 07/01/2036 | | | | A+ | | | | 965,000 | | | | 1,152,278 | |
K-12 School District No. 1 (Townsend), Broadwater County, Montana, General Obligation School Building Bonds, Series 2020 | | | 3.000 | % | | | 07/01/2037 | | | | A+ | | | | 465,000 | | | | 514,620 | |
| | | | | | | | | | | | | | | | | | | | |
| | | | | | | | | | | | | | | | | | | 28,397,985 | |
| | | | | | | | | | | | | | | | | | | | |
Nebraska (1.77%) | | | | | | | | | | | | | | | | | | | | |
Douglas County School District 0010, (Elkhorn Public Schools), General Obligation Refunding Bonds, Series 2011 | | | 4.000 | % | | | 12/15/2022 | | | | AA- | | | | 1,290,000 | | | | 1,317,167 | |
Douglas County School District 0010, (Elkhorn Public Schools), General Obligation Refunding Bonds, Series 2011 (Prerefunded to 12-15-2021 @ 100) (b) | | | 5.000 | % | | | 12/15/2023 | | | | AA- | | | | 1,560,000 | | | | 1,601,215 | |
Sarpy County School District 0037, In the State of Nebraska, (Gretna Public Schools), General Obligation School Building and Refunding Bonds, Series 2015 | | | 3.000 | % | | | 12/15/2024 | | | | AA- | | | | 145,000 | | | | 157,951 | |
Sarpy County School District 0037, In the State of Nebraska, (Gretna Public Schools), General Obligation School Building and Refunding Bonds, Series 2015 | | | 4.000 | % | | | 12/15/2025 | | | | AA- | | | | 180,000 | | | | 207,900 | |
Douglas County School District 0010, (Elkhorn Public Schools), General Obligation Refunding Bonds, Series 2011 (Prerefunded to 12-15-2021 @ 100) (b) | | | 5.000 | % | | | 12/15/2026 | | | | AA- | | | | 1,925,000 | | | | 1,975,859 | |
City of Columbus, Nebraska, Combined Revenue and Refunding Bonds, Series 2016 | | | 4.000 | % | | | 12/15/2028 | | | | AA | | | | 150,000 | | | | 176,790 | |
Sarpy County School District 0037, In the State of Nebraska, (Gretna Public Schools), General Obligation School Building and Refunding Bonds, Series 2015 | | | 5.000 | % | | | 12/15/2028 | | | | AA- | | | | 250,000 | | | | 298,845 | |
City of Columbus, Nebraska, Combined Revenue and Refunding Bonds, Series 2016 | | | 4.000 | % | | | 12/15/2029 | | | | AA | | | | 250,000 | | | | 293,393 | |
Sarpy County School District 0037, In the State of Nebraska, (Gretna Public Schools), General Obligation School Building and Refunding Bonds, Series 2015 (Prerefunded to 12-15-2025 @ 100) (b) | | | 5.000 | % | | | 12/15/2029 | | | | AA- | | | | 260,000 | | | | 313,448 | |
City of Columbus, Nebraska, Combined Revenue and Refunding Bonds, Series 2016 | | | 4.000 | % | | | 12/15/2030 | | | | AA | | | | 325,000 | | | | 380,952 | |
Hall County School District 0002, in the State of Nebraska, (Grand Island Public Schools), General Obligation Bonds, Series 2014 (Prerefunded to 12-15-2024 @ 100) (b) | | | 5.000 | % | | | 12/15/2030 | | | | AA- | | | | 700,000 | | | | 816,711 | |
Nebraska Public Power District, General Revenue Bonds, 2014 Series A (Foward Refunding to 01-01-2022 @ 100) (b) | | | 5.000 | % | | | 01/01/2031 | | | | A1 | | | | 1,900,000 | | | | 1,953,789 | |
| | |
| 30 | | See accompanying notes to financial statements. |
STATE FARM ASSOCIATES’ FUNDS TRUST MUNICIPAL BOND FUND
SCHEDULE OF INVESTMENTS (continued)
May 31, 2021
(Unaudited)
| | | | | | | | | | | | | | | | | | | | |
| | | Coupon
rate | | | Maturity date | | | Rating (a) | | | Principal
amount | | | Value | |
Long-term Municipal Bonds (Cont.) | | | | | | | | | | | | | | | | | | | | |
Nebraska (Cont.) | | | | | | | | | | | | | | | | | | | | |
Hall County School District 0002, In the State of Nebraska, (Grand Island Public Schools), General Obligation Bonds, Series 2014 (Prerefunded to 12-15-2024 @ 100) (b) | | | 5.000 | % | | | 12/15/2032 | | | | AA- | | | $ | 565,000 | | | $ | 659,202 | |
The City of Lincoln, Nebraska, Sanitary Sewer Revenue Bonds, Series 2019 | | | 3.000 | % | | | 06/15/2034 | | | | Aa1 | | | | 1,105,000 | | | | 1,243,037 | |
The City of Lincoln, Nebraska, Sanitary Sewer Revenue Bonds, Series 2019 | | | 3.000 | % | | | 06/15/2035 | | | | Aa1 | | | | 1,140,000 | | | | 1,275,683 | |
| | | | | | | | | | | | | | | | | | | | |
| | | | | | | | | | | | | | | | | | | 12,671,942 | |
| | | | | | | | | | | | | | | | | | | | |
Nevada (0.49%) | | | | | | | | | | | | | | | | | | | | |
Nevada System of Higher Education, Universities Revenue Bonds, Series 2016A | | | 4.000 | % | | | 07/01/2030 | | | | AA- | | | | 3,045,000 | | | | 3,480,892 | |
| | | | | | | | | | | | | | | | | | | | |
New Jersey (2.00%) | | | | | | | | | | | | | | | | | | | | |
Township of Parsippany-Troy Hills, In the County of Morris, New Jersey, General Obligation Bonds | | | 3.000 | % | | | 11/01/2021 | | | | AA | | | | 1,775,000 | | | | 1,778,497 | |
The Board of Education of the Township of South Brunswick, in the County of Middlesex, New Jersey, Refunding School Bonds | | | 4.000 | % | | | 12/01/2022 | | | | AA+ | | | | 750,000 | | | | 779,040 | |
The Board of Education of the Borough of Madison, in the County of Morris, New Jersey, Refunding School Bonds, Series 2012 B | | | 3.000 | % | | | 12/15/2022 | | | | AA+ | | | | 600,000 | | | | 626,550 | |
The Board of Education of the Borough of Madison, in the County of Morris, New Jersey, Refunding School Bonds, Series 2012 B (Prerefunded to 12-15-2022 @ 100) (b) | | | 4.000 | % | | | 12/15/2023 | | | | AA+ | | | | 465,000 | | | | 492,830 | |
The Board of Education, of the Somerset Hills School District, in the County of Somerset, New Jersey, Refunding School Bonds, Series 2012 | | | 4.000 | % | | | 03/15/2024 | | | | Aa1 | | | | 2,345,000 | | | | 2,414,599 | |
The Board of Education of the Hopewell Valley Regional School District in the County of Mercer, New Jersey, School Bonds | | | 3.500 | % | | | 01/15/2027 | | | | AA | | | | 3,330,000 | | | | 3,710,153 | |
The Board of Education of the Township of Livingston, In the County of Essex, New Jersey, Refunding School Bonds | | | 4.000 | % | | | 07/15/2029 | | | | AA+ | | | | 1,000,000 | | | | 1,129,710 | |
Township of Moorestown, in the County of Burlington, New Jersey, General Obligation Bonds Consisting of General Improvement Bonds and Water-Sewer Utility Bonds | | | 4.000 | % | | | 01/15/2030 | | | | Aaa | | | | 1,140,000 | | | | 1,196,704 | |
The Board of Education of the Hopewell Valley Regional School District in the County of Mercer, New Jersey, School Bonds | | | 4.000 | % | | | 01/15/2032 | | | | AA | | | | 2,000,000 | | | | 2,234,140 | |
| | | | | | | | | | | | | | | | | | | | |
| | | | | | | | | | | | | | | | | | | 14,362,223 | |
| | | | | | | | | | | | | | | | | | | | |
New Mexico (3.29%) | | | | | | | | | | | | | | | | | | | | |
Santa Fe Public School District, Santa Fe County, New Mexico, General Obligation Bonds, Series 2012 | | | 3.000 | % | | | 08/01/2022 | | | | Aa3 | | | | 2,000,000 | | | | 2,066,000 | |
Bernalillo County, New Mexico, General Obligation Refunding Bonds, Series 2015A | | | 2.000 | % | | | 08/15/2023 | | | | Aaa | | | | 1,030,000 | | | | 1,071,715 | |
Bernalillo County, New Mexico, General Obligation Refunding Bonds, Series 2015A | | | 2.250 | % | | | 08/15/2024 | | | | Aaa | | | | 1,050,000 | | | | 1,095,675 | |
Bernalillo County, New Mexico, General Obligation Bonds, Series 2015 | | | 3.000 | % | | | 08/15/2025 | | | | Aaa | | | | 1,235,000 | | | | 1,306,988 | |
City of Santa Fe, New Mexico, General Obligation Bonds, Series 2013 | | | 4.000 | % | | | 08/01/2026 | | | | AA | | | | 225,000 | | | | 242,615 | |
City of Santa Fe, New Mexico, General Obligation Bonds, Series 2013 | | | 4.000 | % | | | 08/01/2027 | | | | AA | | | | 700,000 | | | | 754,068 | |
Las Cruces School District No. 2, Dona Ana County, New Mexico, General Obligation School Building Bonds, Series 2016C | | | 3.250 | % | | | 08/01/2027 | | | | A1 | | | | 900,000 | | | | 993,600 | |
Rio Rancho Public School District No. 94, Sandoval County, New Mexico, General Obligation School Building Bonds, Series 2016A | | | 3.000 | % | | | 08/01/2027 | | | | A2 | | | | 1,515,000 | | | | 1,644,048 | |
City of Santa Fe, New Mexico, General Obligation Bonds, Series 2013 | | | 4.000 | % | | | 08/01/2028 | | | | AA | | | | 725,000 | | | | 781,006 | |
Las Cruces School District No. 2, Dona Ana County, New Mexico, General Obligation School Building Bonds, Series 2016C | | | 3.500 | % | | | 08/01/2028 | | | | A1 | | | | 900,000 | | | | 996,183 | |
Rio Rancho Public School District No. 94, Sandoval County, New Mexico, General Obligation School Building Bonds, Series 2016A | | | 3.125 | % | | | 08/01/2028 | | | | A2 | | | | 1,515,000 | | | | 1,634,352 | |
City of Santa Fe, New Mexico, General Obligation Bonds, Series 2013 | | | 4.000 | % | | | 08/01/2029 | | | | AA | | | | 750,000 | | | | 807,810 | |
Santa Fe Public School District, Santa Fe County, New Mexico, General Obligation School Building Bonds, Series 2018 | | | 3.625 | % | | | 08/01/2029 | | | | AA | | | | 3,075,000 | | | | 3,480,562 | |
Santa Fe Public School District, Santa Fe County, New Mexico, General Obligation School Building Bonds, Series 2018 | | | 4.000 | % | | | 08/01/2030 | | | | AA | | | | 1,000,000 | | | | 1,156,580 | |
| | |
| See accompanying notes to financial statements. | | 31 |
STATE FARM ASSOCIATES’ FUNDS TRUST MUNICIPAL BOND FUND
SCHEDULE OF INVESTMENTS (continued)
May 31, 2021
(Unaudited)
| | | | | | | | | | | | | | | | | | | | |
| | | Coupon
rate | | | Maturity date | | | Rating (a) | | | Principal
amount | | | Value | |
Long-term Municipal Bonds (Cont.) | | | | | | | | | | | | | | | | | | | | |
New Mexico (Cont.) | | | | | | | | | | | | | | | | | | | | |
Albuquerque Municipal School District No. 12, Bernalillo and Sandoval Counties, New Mexico, General Obligation School Building Bonds, Series 2018 | | | 5.000 | % | | | 08/01/2034 | | | | A1 | | | $ | 1,800,000 | | | $ | 2,264,382 | |
Albuquerque Municipal School District No. 12, Bernalillo and Sandoval Counties, New Mexico, General Obligation School Building Bonds, Series 2018 | | | 5.000 | % | | | 08/01/2035 | | | | A1 | | | | 2,600,000 | | | | 3,265,730 | |
| | | | | | | | | | | | | | | | | | | | |
| | | | | | | | | | | | | | | | | | | 23,561,314 | |
| | | | | | | | | | | | | | | | | | | | |
New York (0.86%) | | | | | | | | | | | | | | | | | | | | |
The Port Authority of New York and New Jersey Consolidated Bonds, One Hundred Seventy-Ninth Series | | | 5.000 | % | | | 12/01/2032 | | | | A+ | | | | 3,000,000 | | | | 3,348,270 | |
New York City, Municipal Water Finance Authority, Water and Sewer System Second General Resolution Revenue Bonds, Fiscal 2014 Series DD | | | 5.000 | % | | | 06/15/2035 | | | | Aa1 | | | | 2,500,000 | | | | 2,844,500 | |
| | | | | | | | | | | | | | | | | | | | |
| | | | | | | | | | | | | | | | | | | 6,192,770 | |
| | | | | | | | | | | | | | | | | | | | |
North Carolina (2.28%) | | | | | | | | | | | | | | | | | | | | |
City of Salisbury, North Carolina, Combined Enterprise System Revenue Bonds, Series 2020 | | | 5.000 | % | | | 02/01/2026 | | | | AA- | | | | 1,960,000 | | | | 2,362,074 | |
Metropolitan Sewerage District of Buncombe County, North Carolina, Sewerage System Revenue Refunding Bonds, Series 2013 | | | 4.000 | % | | | 07/01/2027 | | | | AA+ | | | | 1,210,000 | | | | 1,301,718 | |
City of Salisbury, North Carolina, Combined Enterprise System Revenue Bonds, Series 2020 | | | 5.000 | % | | | 02/01/2028 | | | | AA- | | | | 890,000 | | | | 1,134,047 | |
City of Gastonia, North Carolina, Combined Utilities System Revenue Bonds, Series 2015 | | | 5.000 | % | | | 05/01/2028 | | | | AA- | | | | 700,000 | | | | 813,337 | |
City of Salisbury, North Carolina, Combined Enterprise System Revenue Bonds, Series 2020 | | | 5.000 | % | | | 02/01/2029 | | | | AA- | | | | 935,000 | | | | 1,216,669 | |
City of Gastonia, North Carolina, Combined Utilities System Revenue Bonds, Series 2015 | | | 5.000 | % | | | 05/01/2029 | | | | AA- | | | | 265,000 | | | | 307,917 | |
City of Salisbury, North Carolina, Combined Enterprise System Revenue Bonds, Series 2020 | | | 5.000 | % | | | 02/01/2030 | | | | AA- | | | | 500,000 | | | | 663,940 | |
City of Salisbury, North Carolina, Combined Enterprise System Revenue Bonds, Series 2020 | | | 5.000 | % | | | 02/01/2031 | | | | AA- | | | | 500,000 | | | | 660,180 | |
County of Union, North Carolina, Enterprise Systems Revenue Bonds, Series 2017 | | | 3.000 | % | | | 06/01/2031 | | | | Aa2 | | | | 2,850,000 | | | | 3,154,465 | |
County of Forsyth, North Carolina, General Obligation, Public Improvement Bonds, Series 2019B | | | 3.000 | % | | | 03/01/2032 | | | | Aaa | | | | 1,000,000 | | | | 1,138,310 | |
City of Salisbury, North Carolina, Combined Enterprise System Revenue Bonds, Series 2020 | | | 5.000 | % | | | 02/01/2033 | | | | AA- | | | | 750,000 | | | | 983,925 | |
City of Salisbury, North Carolina, Combined Enterprise System Revenue Bonds, Series 2020 | | | 5.000 | % | | | 02/01/2035 | | | | AA- | | | | 1,000,000 | | | | 1,305,270 | |
City of Salisbury, North Carolina, Combined Enterprise System Revenue Bonds, Series 2020 | | | 5.000 | % | | | 02/01/2037 | | | | AA- | | | | 1,000,000 | | | | 1,298,490 | |
| | | | | | | | | | | | | | | | | | | | |
| | | | | | | | | | | | | | | | | | | 16,340,342 | |
| | | | | | | | | | | | | | | | | | | | |
North Dakota (1.38%) | | | | | | | | | | | | | | | | | | | | |
City of Bismarck, Burleigh County, North Dakota, Refunding Improvement Bonds of 2016, Series L | | | 3.000 | % | | | 05/01/2027 | | | | Aa1 | | | | 860,000 | | | | 897,857 | |
City of Bismarck, Burleigh County, North Dakota, Refunding Improvement Bonds of 2016, Series L | | | 3.125 | % | | | 05/01/2028 | | | | Aa1 | | | | 845,000 | | | | 882,231 | |
City of Bismarck, Burleigh County, North Dakota, Refunding Improvement Bonds of 2016, Series L | | | 3.250 | % | | | 05/01/2029 | | | | Aa1 | | | | 835,000 | | | | 871,832 | |
Bismarck Public School District No. 1, Burleigh County, North Dakota, General Obligation School Building Bonds, Series 2017 | | | 3.125 | % | | | 05/01/2030 | | | | Aa2 | | | | 1,695,000 | | | | 1,856,059 | |
City of Bismarck, Burleigh County, North Dakota, Refunding Improvement Bonds of 2017, Series M | | | 3.125 | % | | | 05/01/2031 | | | | Aa1 | | | | 1,015,000 | | | | 1,095,530 | |
City of Bismarck, Burleigh County, North Dakota, Refunding Improvement Bonds of 2017, Series M | | | 3.125 | % | | | 05/01/2032 | | | | Aa1 | | | | 1,060,000 | | | | 1,141,991 | |
| | |
| 32 | | See accompanying notes to financial statements. |
STATE FARM ASSOCIATES’ FUNDS TRUST MUNICIPAL BOND FUND
SCHEDULE OF INVESTMENTS (continued)
May 31, 2021
(Unaudited)
| | | | | | | | | | | | | | | | | | | | |
| | | Coupon
rate | | | Maturity date | | | Rating (a) | | | Principal
amount | | | Value | |
Long-term Municipal Bonds (Cont.) | | | | | | | | | | | | | | | | | | | | |
North Dakota (Cont.) | | | | | | | | | | | | | | | | | | | | |
City of Fargo, North Dakota, Refunding Improvement Bonds, Series 2019A | | | 3.000 | % | | | 05/01/2033 | | | | Aa2 | | | $ | 1,350,000 | | | $ | 1,479,748 | |
City of Fargo, North Dakota, Refunding Improvement Bonds, Series 2019A | | | 3.000 | % | | | 05/01/2034 | | | | Aa2 | | | | 1,550,000 | | | | 1,705,341 | |
| | | | | | | | | | | | | | | | | | | | |
| | | | | | | | | | | | | | | | | | | 9,930,589 | |
| | | | | | | | | | | | | | | | | | | | |
Ohio (6.09%) | | | | | | | | | | | | | | | | | | | | |
Board of Education, City School District of the City of Cincinnati, County of Hamilton, Ohio, Classroom Facilities Construction and Improvement Refunding Bonds, Series 2006 (Voted General Obligation Unlimited Tax) | | | 5.250 | % | | | 12/01/2022 | | | | AA- | | | | 1,000,000 | | | | 1,076,810 | |
Plain Local School District, County of Stark, Ohio, General Obligation (Unlimited Tax), School Improvement Refunding Bonds, Series 2011A (Prerefunded to 11-01-2021 @ 100) (b) | | | 4.300 | % | | | 11/01/2023 | | | | AA- | | | | 2,840,000 | | | | 2,889,700 | |
Lake County Community College District, Ohio, (Lakeland Community College), Facilities Construction and Improvement Bonds, Series 2016A, (General Obligation - Unlimited Tax) | | | 3.000 | % | | | 12/01/2025 | | | | Aa3 | | | | 660,000 | | | | 727,940 | |
Lake Local School District, Stark and Portage Counties, Ohio, General Obligation (Unlimited Tax), School Facilities Improvement Bonds, Series 2015 | | | 3.000 | % | | | 12/01/2025 | | | | AA- | | | | 190,000 | | | | 196,578 | |
Miami University, (A State University of Ohio), General Receipts Revenue and Refunding Bonds, Series 2011 | | | 5.000 | % | | | 09/01/2026 | | | | Aa3 | | | | 1,430,000 | | | | 1,447,246 | |
Lake County Community College District, Ohio, (Lakeland Community College), Facilities Construction and Improvement Bonds, Series 2016A, (General Obligation - Unlimited Tax) | | | 3.000 | % | | | 12/01/2026 | | | | Aa3 | | | | 865,000 | | | | 968,004 | |
Bellbrook-Sugarcreek Local School District, Counties of Greene and Warren, Ohio, School Improvement Unlimited Tax General Obligation Refunding Bonds, Series 2016 | | | 3.000 | % | | | 12/01/2027 | | | | Aa2 | | | | 1,000,000 | | | | 1,099,290 | |
Board of Education of the Northwest Local School District, (Counties of Hamilton and Butler, Ohio), School Improvement, Unlimited Tax General Obligation Bonds, Series 2015, (Non-Bank Qualified) | | | 5.000 | % | | | 12/01/2027 | | | | Aa2 | | | | 175,000 | | | | 195,083 | |
Perrysburg Exempted Village School District, Wood County, Ohio, School Facilities Construction and Improvement Bonds, Series 2015 (General Obligation - Unlimited Tax) | | | 4.000 | % | | | 12/01/2027 | | | | A1 | | | | 1,250,000 | | | | 1,376,275 | |
Lakewood City School District, Ohio, General Obligation (Unlimited Tax), School Facilities Improvement Bonds, Series 2014A (Prerefunded to 11-01-2022 @ 100) (b) | | | 5.000 | % | | | 11/01/2028 | | | | Aa2 | | | | 1,000,000 | | | | 1,069,210 | |
Bellbrook-Sugarcreek Local School District, Counties of Greene and Warren, Ohio, School Improvement Unlimited Tax General Obligation Refunding Bonds, Series 2016 | | | 4.000 | % | | | 12/01/2028 | | | | Aa2 | | | | 1,565,000 | | | | 1,801,503 | |
Board of Education of the Northwest Local School District, (Counties of Hamilton and Butler, Ohio), School Improvement, Unlimited Tax General Obligation Bonds, Series 2015, (Non-Bank Qualified) (Prerefunded to 12-01-2023 @ 100) (b) | | | 5.000 | % | | | 12/01/2028 | | | | Aa2 | | | | 225,000 | | | | 251,829 | |
Fairfield City School District, County of Butler, Ohio, School Improvement Unlimited Tax, General Obligation Bonds, Series 2014 (Prerefunded to 11-01-2023 @ 100) (b) | | | 5.000 | % | | | 11/01/2029 | | | | Aa2 | | | | 800,000 | | | | 893,656 | |
Board of Education of the Northwest Local School District, (Counties of Hamilton and Butler, Ohio), School Improvement, Unlimited Tax General Obligation Bonds, Series 2015, (Non-Bank Qualified) (Prerefunded to 12-01-2023 @ 100) (b) | | | 5.000 | % | | | 12/01/2029 | | | | Aa2 | | | | 200,000 | | | | 223,848 | |
Fairfield City School District, County of Butler, Ohio, School Improvement Unlimited Tax, General Obligation Bonds, Series 2014 (Prerefunded to 11-01-2023 @ 100) (b) | | | 5.000 | % | | | 11/01/2030 | | | | Aa2 | | | | 1,335,000 | | | | 1,491,288 | |
Lakewood City School District, Ohio, General Obligation (Unlimited Tax), School Facilities Improvement Refunding Bonds, Series 2017B | | | 4.000 | % | | | 11/01/2030 | | | | Aa2 | | | | 235,000 | | | | 276,043 | |
Board of Education of the Northwest Local School District, (Counties of Hamilton and Butler, Ohio), School Improvement, Unlimited Tax General Obligation Bonds, Series 2015, (Non-Bank Qualified) | | | 4.000 | % | | | 12/01/2030 | | | | Aa2 | | | | 365,000 | | | | 397,226 | |
Hudson City School District, Ohio, General Obligation (Unlimited Tax), School Improvement Bonds, Series 2018 | | | 4.000 | % | | | 12/01/2030 | | | | Aa1 | | | | 750,000 | | | | 864,915 | |
Lakewood City School District, Ohio, General Obligation (Unlimited Tax), School Facilities Improvement Refunding Bonds, Series 2017B | | | 4.000 | % | | | 11/01/2031 | | | | Aa2 | | | | 220,000 | | | | 257,657 | |
| | |
| See accompanying notes to financial statements. | | 33 |
STATE FARM ASSOCIATES’ FUNDS TRUST MUNICIPAL BOND FUND
SCHEDULE OF INVESTMENTS (continued)
May 31, 2021
(Unaudited)
| | | | | | | | | | | | | | | | | | | | |
| | | Coupon
rate | | | Maturity date | | | Rating (a) | | | Principal
amount | | | Value | |
Long-term Municipal Bonds (Cont.) | | | | | | | | | | | | | | | | | | | | |
Ohio (Cont.) | | | | | | | | | | | | | | | | | | | | |
Hudson City School District, Ohio, General Obligation (Unlimited Tax), School Improvement Bonds, Series 2018 | | | 4.000 | % | | | 12/01/2031 | | | | Aa1 | | | $ | 350,000 | | | $ | 403,263 | |
Lakewood City School District, Ohio, General Obligation (Unlimited Tax), School Facilities Improvement Bonds, Series 2014A (Prerefunded to 11-01-2022 @ 100) (b) | | | 5.000 | % | | | 11/01/2032 | | | | Aa2 | | | | 1,500,000 | | | | 1,603,815 | |
Lakewood City School District, Ohio, General Obligation (Unlimited Tax), School Facilities Improvement Refunding Bonds, Series 2017B | | | 4.000 | % | | | 11/01/2032 | | | | Aa2 | | | | 220,000 | | | | 257,059 | |
City of Marysville, Ohio, Water System Mortgage Revenue Bonds, Series 2020 | | | 4.000 | % | | | 12/01/2032 | | | | Aa3 | | | | 315,000 | | | | 355,219 | |
Cuyahoga Community College District, Ohio, Facilities Construction and Improvement Bonds, Series 2018, (General Obligation -Unlimited Tax) | | | 4.000 | % | | | 12/01/2032 | | | | AA | | | | 1,750,000 | | | | 2,014,373 | |
Hudson City School District, Ohio, General Obligation (Unlimited Tax), School Improvement Bonds, Series 2018 | | | 4.000 | % | | | 12/01/2032 | | | | Aa1 | | | | 375,000 | | | | 431,254 | |
Lakewood City School District, Ohio, General Obligation (Unlimited Tax), School Facilities Improvement Refunding Bonds, Series 2017B | | | 4.000 | % | | | 11/01/2033 | | | | Aa2 | | | | 370,000 | | | | 431,283 | |
City of Marysville, Ohio, Water System Mortgage Revenue Bonds, Series 2020 | | | 4.000 | % | | | 12/01/2033 | | | | Aa3 | | | | 235,000 | | | | 264,690 | |
Dublin City School District, Franklin, Delaware, and Union Counties, Ohio, School Facilities Construction and Improvement Bonds, Series 2019A, (General Obligation - Unlimited Tax) | | | 4.000 | % | | | 12/01/2033 | | | | Aa1 | | | | 500,000 | | | | 601,945 | |
Hudson City School District, Ohio, General Obligation (Unlimited Tax), School Improvement Bonds, Series 2018 | | | 4.000 | % | | | 12/01/2033 | | | | Aa1 | | | | 400,000 | | | | 459,124 | |
Worthington City School District, Franklin County, Ohio, School Facilities Construction and Improvement Bonds, Series 2019A, (General Obligation - Unlimited Tax) | | | 4.000 | % | | | 12/01/2033 | | | | Aa1 | | | | 790,000 | | | | 938,591 | |
North Canton City School District, Ohio, General Obligation (Unlimited Tax), School Facilities Improvement Bonds, Series 2020 | | | 3.000 | % | | | 11/01/2034 | | | | Aa3 | | | | 1,065,000 | | | | 1,172,703 | |
Cuyahoga Community College District, Ohio, Facilities Construction and Improvement Bonds, Series 2018, (General Obligation -Unlimited Tax) | | | 4.000 | % | | | 12/01/2034 | | | | AA | | | | 1,000,000 | | | | 1,145,650 | |
Dublin City School District, Franklin, Delaware, and Union Counties, Ohio, School Facilities Construction and Improvement Bonds, Series 2019A, (General Obligation - Unlimited Tax) | | | 4.000 | % | | | 12/01/2034 | | | | Aa1 | | | | 500,000 | | | | 600,715 | |
Gahanna-Jefferson City School District, Franklin County, Ohio, School Facilities Construction and Improvement Bonds, Series 2021, (General Obligation - Unlimited Tax) | | | 3.000 | % | | | 12/01/2034 | | | | Aa3 | | | | 750,000 | | | | 850,350 | |
Hudson City School District, Ohio, General Obligation (Unlimited Tax), School Improvement Bonds, Series 2018 | | | 4.000 | % | | | 12/01/2034 | | | | Aa1 | | | | 875,000 | | | | 1,001,525 | |
City of Marysville, Ohio, Water System Mortgage Revenue Bonds, Series 2020 | | | 4.000 | % | | | 12/01/2035 | | | | Aa3 | | | | 1,870,000 | | | | 2,095,990 | |
Dublin City School District, Franklin, Delaware, and Union Counties, Ohio, School Facilities Construction and Improvement Bonds, Series 2019A, (General Obligation - Unlimited Tax) | | | 4.000 | % | | | 12/01/2035 | | | | Aa1 | | | | 500,000 | | | | 599,535 | |
Gahanna-Jefferson City School District, Franklin County, Ohio, School Facilities Construction and Improvement Bonds, Series 2021, (General Obligation - Unlimited Tax) | | | 3.000 | % | | | 12/01/2035 | | | | Aa3 | | | | 1,000,000 | | | | 1,130,980 | |
Worthington City School District, Franklin County, Ohio, School Facilities Construction and Improvement Bonds, Series 2019A, (General Obligation - Unlimited Tax) | | | 4.000 | % | | | 12/01/2035 | | | | Aa1 | | | | 475,000 | | | | 560,234 | |
Miami University, (A State University of Ohio), General Receipts Revenue and Refunding Bonds, Series 2020A | | | 4.000 | % | | | 09/01/2036 | | | | Aa3 | | | | 3,000,000 | | | | 3,661,890 | |
North Canton City School District, Ohio, General Obligation (Unlimited Tax), School Facilities Improvement Bonds, Series 2020 | | | 3.000 | % | | | 11/01/2036 | | | | Aa3 | | | | 685,000 | | | | 750,712 | |
Dublin City School District, Franklin, Delaware, and Union Counties, Ohio, School Facilities Construction and Improvement Bonds, Series 2019A, (General Obligation - Unlimited Tax) | | | 4.000 | % | | | 12/01/2036 | | | | Aa1 | | | | 1,000,000 | | | | 1,197,600 | |
Gahanna-Jefferson City School District, Franklin County, Ohio, School Facilities Construction and Improvement Bonds, Series 2021, (General Obligation - Unlimited Tax) | | | 3.000 | % | | | 12/01/2036 | | | | Aa3 | | | | 800,000 | | | | 901,880 | |
| | |
| 34 | | See accompanying notes to financial statements. |
STATE FARM ASSOCIATES’ FUNDS TRUST MUNICIPAL BOND FUND
SCHEDULE OF INVESTMENTS (continued)
May 31, 2021
(Unaudited)
| | | | | | | | | | | | | | | | | | | | |
| | | Coupon
rate | | | Maturity date | | | Rating (a) | | | Principal
amount | | | Value | |
Long-term Municipal Bonds (Cont.) | | | | | | | | | | | | | | | | | | | | |
Ohio (Cont.) | | | | | | | | | | | | | | | | | | | | |
North Canton City School District, Ohio, General Obligation (Unlimited Tax), School Facilities Improvement Bonds, Series 2020 | | | 3.000 | % | | | 11/01/2037 | | | | Aa3 | | | $ | 955,000 | | | $ | 1,043,901 | |
Gahanna-Jefferson City School District, Franklin County, Ohio, School Facilities Construction and Improvement Bonds, Series 2021, (General Obligation - Unlimited Tax) | | | 3.000 | % | | | 12/01/2037 | | | | Aa3 | | | | 1,500,000 | | | | 1,685,955 | |
| | | | | | | | | | | | | | | | | | | | |
| | | | | | | | | | | | | | | | | | | 43,664,337 | |
| | | | | | | | | | | | | | | | | | | | |
Oklahoma (1.33%) | | | | | | | | | | | | | | | | | | | | |
City of Tulsa, Oklahoma, General Obligation Bonds, Series 2013 | | | 4.000 | % | | | 03/01/2023 | | | | AA | | | | 2,500,000 | | | | 2,507,250 | |
City of Tulsa, Oklahoma, General Obligation Bonds, Series 2016 | | | 3.000 | % | | | 04/01/2028 | | | | AA | | | | 3,000,000 | | | | 3,109,080 | |
Grand River Dam Authority, Revenue Bonds, Series 2014A | | | 5.000 | % | | | 06/01/2031 | | | | A1 | | | | 1,835,000 | | | | 2,076,743 | |
The Edmond Public Works Authority, (Edmond, Oklahoma), Sales Tax and Utility System Revenue Bonds, Series 2017 | | | 5.000 | % | | | 07/01/2032 | | | | AA- | | | | 1,500,000 | | | | 1,855,740 | |
| | | | | | | | | | | | | | | | | | | | |
| | | | | | | | | | | | | | | | | | | 9,548,563 | |
| | | | | | | | | | | | | | | | | | | | |
Oregon (0.92%) | | | | | | | | | | | | | | | | | | | | |
Central Lincoln People’s Utility District, Oregon, Electric System Revenue Bonds, Series 2016 | | | 2.250 | % | | | 12/01/2024 | | | | AA- | | | | 400,000 | | | | 424,872 | |
State of Oregon, General Obligation Bonds, 2016 Series J, (Veterans’ Welfare Bonds Series 97A) (Refunding) | | | 2.800 | % | | | 06/01/2025 | | | | Aa1 | | | | 155,000 | | | | 167,617 | |
North Clackamas School District No. 12, Clackamas County, Oregon, General Obligation Refunding Bonds, Series 2014 (Prerefunded to 06-15-2024 @ 100) (b) | | | 5.000 | % | | | 06/15/2028 | | | | A+ | | | | 2,500,000 | | | | 2,859,775 | |
Administrative School District No. 1 (Bend-La Pine), Deschutes County, Oregon, General Obligation Bonds, Series 2019 | | | 3.000 | % | | | 06/15/2035 | | | | Aa2 | | | | 2,865,000 | | | | 3,178,402 | |
| | | | | | | | | | | | | | | | | | | | |
| | | | | | | | | | | | | | | | | | | 6,630,666 | |
| | | | | | | | | | | | | | | | | | | | |
Pennsylvania (0.86%) | | | | | | | | | | | | | | | | | | | | |
Township of Upper St. Clair, (Allegheny County, Pennsylvania), General Obligation Bonds, Series A of 2016 | | | 4.000 | % | | | 06/01/2028 | | | | AA+ | | | | 340,000 | | | | 394,815 | |
Township of Upper St. Clair, (Allegheny County, Pennsylvania), General Obligation Bonds, Series A of 2016 | | | 4.000 | % | | | 06/01/2029 | | | | AA+ | | | | 305,000 | | | | 352,888 | |
County of Northampton, Commonwealth of Pennsylvania, General Obligation Bonds, Series B of 2012 (Tax-Exempt) (Prerefunded to 10-01-2022 @ 100) (b) | | | 5.000 | % | | | 10/01/2030 | | | | AA | | | | 1,500,000 | | | | 1,597,710 | |
The Municipal Authority of the Borough of West View, (Allegheny County, Pennsylvania), Water Revenue Bonds, Series of 2014 (Prerefunded to 11-15-2024 @ 100) (b) | | | 5.000 | % | | | 11/15/2031 | | | | AA | | | | 1,365,000 | | | | 1,587,249 | |
County of Jefferson, (Commonwealth of Pennsylvania), General Obligation Bonds, Series of 2021 | | | 3.000 | % | | | 12/15/2033 | | | | A+ | | | | 400,000 | | | | 449,912 | |
County of Jefferson, (Commonwealth of Pennsylvania), General Obligation Bonds, Series of 2021 | | | 3.000 | % | | | 12/15/2035 | | | | A+ | | | | 800,000 | | | | 895,264 | |
County of Jefferson, (Commonwealth of Pennsylvania), General Obligation Bonds, Series of 2021 | | | 3.000 | % | | | 12/15/2037 | | | | A+ | | | | 770,000 | | | | 856,356 | |
| | | | | | | | | | | | | | | | | | | | |
| | | | | | | | | | | | | | | | | | | 6,134,194 | |
| | | | | | | | | | | | | | | | | | | | |
South Carolina (1.56%) | | | | | | | | | | | | | | | | | | | | |
Fort Mill School District No. 4 of York County, South Carolina, General Obligation Advanced Refunding Bonds, Series 2012A | | | 4.000 | % | | | 03/01/2023 | | | | Aa2 | | | | 2,315,000 | | | | 2,425,227 | |
School District No. 1 of Richland County, South Carolina, General Obligation Refunding Bonds, Series 2011A (Prerefunded to 09-01-2021 @ 100) (b) | | | 4.000 | % | | | 03/01/2023 | | | | Aa3 | | | | 1,675,000 | | | | 1,691,264 | |
Town of Fort Mill, South Carolina, Waterworks and Sewer System, Improvement Revenue Bonds, Series 2015 | | | 3.500 | % | | | 12/01/2027 | | | | AA | | | | 380,000 | | | | 408,154 | |
Town of Fort Mill, South Carolina, Waterworks and Sewer System, Improvement Revenue Bonds, Series 2015 | | | 4.000 | % | | | 12/01/2028 | | | | AA | | | | 520,000 | | | | 566,743 | |
City of Columbia, South Carolina, Waterworks and Sewer System Refunding Revenue Bonds, Series 2016B | | | 4.000 | % | | | 02/01/2029 | | | | Aa1 | | | | 1,045,000 | | | | 1,227,279 | |
| | |
| See accompanying notes to financial statements. | | 35 |
STATE FARM ASSOCIATES’ FUNDS TRUST MUNICIPAL BOND FUND
SCHEDULE OF INVESTMENTS (continued)
May 31, 2021
(Unaudited)
| | | | | | | | | | | | | | | | | | | | |
| | | Coupon
rate | | | Maturity date | | | Rating (a) | | | Principal
amount | | | Value | |
Long-term Municipal Bonds (Cont.) | | | | | | | | | | | | | | | | | | | | |
South Carolina (Cont.) | | | | | | | | | | | | | | | | | | | | |
Spartanburg Sanitary Sewer District, South Carolina, Sewer System Refunding Convertible Bonds, Series 2013B (Prerefunded to 03-01-2023 @ 100) (b) | | | 5.000 | % | | | 03/01/2030 | | | | Aa3 | | | $ | 2,160,000 | | | $ | 2,344,313 | |
Town of Fort Mill, South Carolina, Waterworks and Sewer System, Improvement Revenue Bonds, Series 2015 | | | 4.000 | % | | | 12/01/2030 | | | | AA | | | | 535,000 | | | | 582,797 | |
City of Columbia, South Carolina, Waterworks and Sewer System Revenue Bonds, Series 2019A | | | 3.000 | % | | | 02/01/2035 | | | | Aa1 | | | | 1,750,000 | | | | 1,961,155 | |
| | | | | | | | | | | | | | | | | | | | |
| | | | | | | | | | | | | | | | | | | 11,206,992 | |
| | | | | | | | | | | | | | | | | | | | |
South Dakota (0.04%) | | | | | | | | | | | | | | | | | | | | |
Harrisburg School District 41-2, South Dakota, General Obligation Bonds, Series 2012 (Prerefunded to 01-15-2022 @ 100) (b) | | | 3.000 | % | | | 07/15/2022 | | | | AA- | | | | 250,000 | | | | 254,488 | |
| | | | | | | | | | | | | | | | | | | | |
Tennessee (1.23%) | | | | | | | | | | | | | | | | | | | | |
City of Knoxville, Tennessee, Water System Revenue Refunding Bonds, Series BB-2015 | | | 3.000 | % | | | 03/01/2025 | | | | Aa1 | | | | 1,170,000 | | | | 1,225,470 | |
Washington County, Tennessee, General Obligation School and Improvement Bonds, Series 2017B | | | 3.000 | % | | | 06/01/2030 | | | | Aa2 | | | | 850,000 | | | | 941,384 | |
Washington County, Tennessee, General Obligation School Bonds, Series 2017A | | | 3.000 | % | | | 06/01/2030 | | | | Aa2 | | | | 935,000 | | | | 1,035,522 | |
Harpeth Valley Utilities District of Davidson and Williamson Counties, Tennessee, Utilities Revenue Bonds, Series 2014 | | | 5.000 | % | | | 09/01/2031 | | | | AA+ | | | | 1,065,000 | | | | 1,213,844 | |
The City of Portland, Tennessee, Water and Sewer System Revenue Bonds, Series 2020 | | | 4.000 | % | | | 04/01/2035 | | | | A | | | | 1,225,000 | | | | 1,450,498 | |
City of Memphis, Tennessee Memphis Light, Gas and Water Division, Electric System Revenue Bonds, Series 2020A | | | 3.000 | % | | | 12/01/2035 | | | | A+ | | | | 1,000,000 | | | | 1,133,820 | |
City of Memphis, Tennessee Memphis Light, Gas and Water Division, Electric System Revenue Bonds, Series 2020A | | | 3.000 | % | | | 12/01/2036 | | | | A+ | | | | 1,640,000 | | | | 1,853,495 | |
| | | | | | | | | | | | | | | | | | | | |
| | | | | | | | | | | | | | | | | | | 8,854,033 | |
| | | | | | | | | | | | | | | | | | | | |
Texas (2.75%) | | | | | | | | | | | | | | | | | | | | |
Eanes Independent School District, (A political subdivision of the State of Texas located in Travis County, Texas), Unlimited Tax School Building Bonds, Series 2015A | | | 3.500 | % | | | 08/01/2026 | | | | AA+ | | | | 1,670,000 | | | | 1,824,625 | |
State of Texas, General Obligation Bonds, Water Financial Assistance Bonds, Series 2016A (Economically Distressed Areas Program) | | | 3.000 | % | | | 08/01/2027 | | | | Aaa | | | | 2,325,000 | | | | 2,545,015 | |
City of Laredo, Texas, Waterworks and Sewer System Revenue Bonds, New Series 2019 | | | 5.000 | % | | | 03/01/2032 | | | | Aa3 | | | | 250,000 | | | | 311,388 | |
Lake Travis Independent School District, (A political subdivision of the State of Texas located in Travis County, Texas), Unlimited Tax Refunding Bonds, Series 2017 | | | 4.000 | % | | | 02/15/2033 | | | | AA+ | | | | 1,000,000 | | | | 1,158,020 | |
City of Laredo, Texas, Waterworks and Sewer System Revenue Bonds, New Series 2019 | | | 5.000 | % | | | 03/01/2033 | | | | Aa3 | | | | 200,000 | | | | 249,078 | |
Gregory-Portland Independent School District, (San Patricio County, Texas), Unlimited Tax School Building Bonds, Series 2018A | | | 4.000 | % | | | 02/15/2034 | | | | AA | | | | 1,565,000 | | | | 1,655,473 | |
City of Laredo, Texas, Waterworks and Sewer System Revenue Bonds, New Series 2019 | | | 4.000 | % | | | 03/01/2034 | | | | Aa3 | | | | 280,000 | | | | 328,418 | |
Gregory-Portland Independent School District, (San Patricio County, Texas), Unlimited Tax School Building Bonds, Series 2018A | | | 4.000 | % | | | 02/15/2035 | | | | AA | | | | 2,710,000 | | | | 2,863,792 | |
City of Laredo, Texas, Waterworks and Sewer System Revenue Bonds, New Series 2019 | | | 4.000 | % | | | 03/01/2035 | | | | Aa3 | | | | 200,000 | | | | 234,210 | |
Harris County, Texas, Toll Road First Lien Revenue and Refunding Bonds, Series 2021 | | | 4.000 | % | | | 08/15/2035 | | | | Aa2 | | | | 1,000,000 | | | | 1,233,140 | |
City Of Beaumont, Texas, (A political subdivision of the State of Texas located within Jefferson County, Texas), Waterworks and Sewer System Revenue and Refunding Bonds, Series 2020A | | | 4.000 | % | | | 09/01/2035 | | | | A1 | | | | 1,515,000 | | | | 1,834,347 | |
City of Laredo, Texas, Waterworks and Sewer System Revenue Bonds, New Series 2019 | | | 4.000 | % | | | 03/01/2036 | | | | Aa3 | | | | 325,000 | | | | 379,828 | |
Waco Education Finance Corporation, Revenue Refunding Bonds, Baylor University Issue, Series 2020A, (Tax-Exempt Fixed Rate Bonds) | | | 4.000 | % | | | 03/01/2036 | | | | A+ | | | | 750,000 | | | | 898,177 | |
Harris County, Texas, Toll Road First Lien Revenue and Refunding Bonds, Series 2021 | | | 4.000 | % | | | 08/15/2036 | | | | Aa2 | | | | 1,000,000 | | | | 1,229,480 | |
| | |
| 36 | | See accompanying notes to financial statements. |
STATE FARM ASSOCIATES’ FUNDS TRUST MUNICIPAL BOND FUND
SCHEDULE OF INVESTMENTS (continued)
May 31, 2021
(Unaudited)
| | | | | | | | | | | | | | | | | | | | |
| | | Coupon
rate | | | Maturity date | | | Rating (a) | | | Principal
amount | | | Value | |
Long-term Municipal Bonds (Cont.) | | | | | | | | | | | | | | | | | | | | |
Texas (Cont.) | | | | | | | | | | | | | | | | | | | | |
City Of Beaumont, Texas, (A political subdivision of the State of Texas located within Jefferson County, Texas), Waterworks and Sewer System Revenue and Refunding Bonds, Series 2020A | | | 4.000 | % | | | 09/01/2036 | | | | A1 | | | $ | 1,720,000 | | | $ | 2,076,332 | |
Waco Education Finance Corporation, Revenue Refunding Bonds, Baylor University Issue, Series 2020A, (Tax-Exempt Fixed Rate Bonds) | | | 4.000 | % | | | 03/01/2037 | | | | A+ | | | | 725,000 | | | | 865,664 | |
| | | | | | | | | | | | | | | | | | | | |
| | | | | | | | | | | | | | | | | | | 19,686,987 | |
| | | | | | | | | | | | | | | | | | | | |
Utah (0.93%) | | | | | | | | | | | | | | | | | | | | |
Snyderville Basin Special Recreation District, Summit County, Utah, General Obligation Bonds, Series 2015A | | | 3.000 | % | | | 12/15/2025 | | | | Aa1 | | | | 1,260,000 | | | | 1,369,507 | |
Jordan Valley Water Conservancy District, Water Revenue Refunding Bonds, Series 2017B | | | 4.000 | % | | | 10/01/2033 | | | | AA+ | | | | 1,000,000 | | | | 1,170,410 | |
The Central Utah Water Conservancy District, Water Revenue Refunding Bonds, Series 2017B, (Crossover Refunding) | | | 4.000 | % | | | 10/01/2033 | | | | AA+ | | | | 2,500,000 | | | | 2,951,100 | |
Jordan Valley Water Conservancy District, Water Revenue Refunding Bonds, Series 2017B | | | 4.000 | % | | | 10/01/2034 | | | | AA+ | | | | 1,000,000 | | | | 1,168,150 | |
| | | | | | | | | | | | | | | | | | | | |
| | | | | | | | | | | | | | | | | | | 6,659,167 | |
| | | | | | | | | | | | | | | | | | | | |
Vermont (0.54%) | | | | | | | | | | | | | | | | | | | | |
City of Burlington, Vermont, General Obligation Public Improvement Bonds, Series 2018A | | | 5.000 | % | | | 11/01/2032 | | | | Aa3 | | | | 175,000 | | | | 223,206 | |
City of Burlington, Vermont, General Obligation Public Improvement Bonds, Series 2018A | | | 5.000 | % | | | 11/01/2033 | | | | Aa3 | | | | 190,000 | | | | 241,841 | |
City of Burlington, Vermont, General Obligation Public Improvement Bonds, Series 2018A | | | 5.000 | % | | | 11/01/2034 | | | | Aa3 | | | | 255,000 | | | | 324,108 | |
City of Burlington, Vermont, General Obligation Public Improvement Bonds, Series 2018B | | | 5.000 | % | | | 11/01/2034 | | | | Aa3 | | | | 410,000 | | | | 521,114 | |
City of Burlington, Vermont, General Obligation Public Improvement Bonds, Series 2018A | | | 5.000 | % | | | 11/01/2035 | | | | Aa3 | | | | 265,000 | | | | 336,205 | |
City of Burlington, Vermont, General Obligation Public Improvement Bonds, Series 2018B | | | 5.000 | % | | | 11/01/2035 | | | | Aa3 | | | | 435,000 | | | | 551,884 | |
City of Burlington, Vermont, General Obligation Public Improvement Bonds, Series 2018B | | | 5.000 | % | | | 11/01/2036 | | | | Aa3 | | | | 910,000 | | | | 1,151,687 | |
City of Burlington, Vermont, General Obligation Public Improvement Bonds, Series 2018A | | | 5.000 | % | | | 11/01/2037 | | | | Aa3 | | | | 440,000 | | | | 555,562 | |
| | | | | | | | | | | | | | | | | | | | |
| | | | | | | | | | | | | | | | | | | 3,905,607 | |
| | | | | | | | | | | | | | | | | | | | |
Virginia (0.57%) | | | | | | | | | | | | | | | | | | | | |
Loudoun County Sanitation Authority (Virginia), Water and Sewer System Revenue and Refunding Bonds, Series 2013 | | | 4.000 | % | | | 01/01/2027 | | | | Aaa | | | | 650,000 | | | | 687,655 | |
County of Stafford, Virginia, General Obligation Public Improvement Bonds, Series 2013 | | | 4.000 | % | | | 07/01/2030 | | | | Aaa | | | | 1,205,000 | | | | 1,296,218 | |
Virginia Public School Authority, School Financing Bonds (1997 Resolution), Series 2012 D (Prerefunded to 08-01-2022 @ 100) (b) | | | 4.000 | % | | | 08/01/2030 | | | | Aa1 | | | | 2,000,000 | | | | 2,090,700 | |
| | | | | | | | | | | | | | | | | | | | |
| | | | | | | | | | | | | | | | | | | 4,074,573 | |
| | | | | | | | | | | | | | | | | | | | |
Washington (6.66%) | | | | | | | | | | | | | | | | | | | | |
College Place School District No. 250, Walla Walla County, Washington, Unlimited Tax General Obligation Bonds, Series 2012 | | | 4.000 | % | | | 12/01/2024 | | | | A1 | | | | 1,875,000 | | | | 1,947,187 | |
City of Spokane, Washington, Unlimited Tax General Obligation Bonds, 2015 | | | 3.000 | % | | | 12/01/2025 | | | | Aa2 | | | | 1,295,000 | | | | 1,406,046 | |
Lake Washington School District No. 414, King County, Washington, Unlimited Tax General Obligation Refunding Bonds, 2015 | | | 3.500 | % | | | 12/01/2025 | | | | AA+ | | | | 2,000,000 | | | | 2,270,080 | |
State of Washington, Various Purpose General Obligation Refunding Bonds, Series R-2013C | | | 4.000 | % | | | 07/01/2026 | | | | AA+ | | | | 2,500,000 | | | | 2,688,200 | |
City of Tacoma, Washington, Sewer Revenue Refunding Bonds, 2016A | | | 3.250 | % | | | 12/01/2027 | | | | Aa2 | | | | 400,000 | | | | 448,948 | |
| | |
| See accompanying notes to financial statements. | | 37 |
STATE FARM ASSOCIATES’ FUNDS TRUST MUNICIPAL BOND FUND
SCHEDULE OF INVESTMENTS (continued)
May 31, 2021
(Unaudited)
| | | | | | | | | | | | | | | | | | | | |
| | | Coupon
rate | | | Maturity date | | | Rating (a) | | | Principal
amount | | | Value | |
Long-term Municipal Bonds (Cont.) | | | | | | | | | | | | | | | | | | | | |
Washington (Cont.) | | | | | | | | | | | | | | | | | | | | |
Hockinson School District No. 98, Clark County, Washington, Unlimited Tax General Obligation Bonds, 2015 | | | 4.000 | % | | | 12/01/2027 | | | | A+ | | | $ | 1,090,000 | | | $ | 1,242,164 | |
City of Camas, Washington, Water and Sewer Revenue and Refunding Bonds, 2015 | | | 4.000 | % | | | 12/01/2028 | | | | Aa3 | | | | 1,050,000 | | | | 1,206,660 | |
City of Tacoma, Washington, Sewer Revenue Refunding Bonds, 2016A | | | 3.250 | % | | | 12/01/2028 | | | | Aa2 | | | | 350,000 | | | | 390,649 | |
Lake Washington School District No. 414, King County, Washington, Unlimited Tax General Obligation and Refunding Bonds, 2016 | | | 4.000 | % | | | 12/01/2028 | | | | AA+ | | | | 1,000,000 | | | | 1,158,050 | |
Public Utility District No. 1 of Pend Oreille County, Washington, Electric Revenue Refunding Bonds, 2019 | | | 3.000 | % | | | 01/01/2029 | | | | Baa2 | | | | 895,000 | | | | 956,361 | |
Public Utility District No. 1 of Cowlitz County, Washington, Production System Revenue Refunding Bonds, 2014 | | | 5.000 | % | | | 09/01/2029 | | | | A1 | | | | 1,000,000 | | | | 1,116,940 | |
City of Everett, Washington, Water and Sewer Revenue Refunding Bonds, 2016 | | | 3.125 | % | | | 12/01/2029 | | | | AA+ | | | | 2,000,000 | | | | 2,222,800 | |
City of Tacoma, Washington, Solid Waste Revenue Refunding Bonds, 2016B | | | 5.000 | % | | | 12/01/2029 | | | | A1 | | | | 1,525,000 | | | | 1,833,584 | |
Public Utility District No. 1 of Clark County, Washington, Water System Revenue Bonds, Series 2014 | | | 5.000 | % | | | 01/01/2030 | | | | AA- | | | | 985,000 | | | | 1,096,689 | |
Public Utility District No. 1 Of Pend Oreille County, Washington, Electric Revenue Refunding Bonds, 2019 | | | 3.000 | % | | | 01/01/2030 | | | | Baa2 | | | | 920,000 | | | | 974,133 | |
Energy Northwest, Columbia Generating Station Electric Revenue and Refunding Bonds, Series 2015-A | | | 5.000 | % | | | 07/01/2030 | | | | AA- | | | | 5,000,000 | | | | 5,872,500 | |
Public Utility District No. 1 of Cowlitz County, Washington, Production System Revenue Refunding Bonds, 2014 | | | 5.000 | % | | | 09/01/2030 | | | | A1 | | | | 2,100,000 | | | | 2,344,356 | |
Public Utility District No. 1 Of Pend Oreille County, Washington, Electric Revenue Refunding Bonds, 2019 | | | 3.000 | % | | | 01/01/2031 | | | | Baa2 | | | | 945,000 | | | | 991,702 | |
Bainbridge Island School District No. 303, Kitsap County, Washington, Unlimited Tax General Obligation Bonds, 2017A | | | 4.000 | % | | | 12/01/2033 | | | | Aa2 | | | | 840,000 | | | | 983,489 | |
Bellevue School District No 405, King County, Washington, Unlimited Tax General Obligation Bonds, 2019 | | | 3.000 | % | | | 12/01/2033 | | | | AA+ | | | | 5,095,000 | | | | 5,627,122 | |
Lake Washington School District No. 414, King County, Washington, Unlimited Tax General Obligation Bonds, 2017 | | | 4.000 | % | | | 12/01/2033 | | | | AA+ | | | | 5,000,000 | | | | 5,854,100 | |
Public Utility District No. 1 of Clark County, Washington, Water System Revenue and Refunding Bonds, Series 2017 | | | 5.000 | % | | | 01/01/2034 | | | | AA- | | | | 1,010,000 | | | | 1,210,121 | |
Bainbridge Island School District No. 303, Kitsap County, Washington, Unlimited Tax General Obligation Bonds, 2017A | | | 4.000 | % | | | 12/01/2034 | | | | Aa2 | | | | 510,000 | | | | 596,114 | |
Selah School District No. 119, Yakima and Kittitas Counties, Washington, Unlimited Tax General Obligation Bonds, 2018 | | | 4.375 | % | | | 12/01/2034 | | | | A1 | | | | 1,040,000 | | | | 1,250,590 | |
Public Utility District No. 1 of Okanogan County, Washington, Electric System Revenue Bonds, 2020 Series A | | | 4.000 | % | | | 12/01/2035 | | | | A1 | | | | 500,000 | | | | 602,210 | |
Public Utility District No. 1 of Okanogan County, Washington, Electric System Revenue Bonds, 2020 Series A | | | 4.000 | % | | | 12/01/2036 | | | | A1 | | | | 400,000 | | | | 480,268 | |
Public Utility District No. 1 of Okanogan County, Washington, Electric System Revenue Bonds, 2020 Series A | | | 4.000 | % | | | 12/01/2037 | | | | A1 | | | | 800,000 | | | | 957,760 | |
| | | | | | | | | | | | | | | | | | | | |
| | | | | | | | | | | | | | | | | | | 47,728,823 | |
| | | | | | | | | | | | | | | | | | | | |
West Virginia (1.43%) | | | | | | | | | | | | | | | | | | | | |
West Virginia University Board of Governors, University Improvement Revenue Bonds (West Virginia University Projects), 2011 Series B (Prererfunded to 10-01-2021 @ 100) (b) | | | 5.000 | % | | | 10/01/2023 | | | | A3 | | | | 2,510,000 | | | | 2,550,888 | |
West Virginia University Board of Governors, University Improvement Revenue Bonds (West Virginia University Projects), 2011 Series B (Prerefunded to 10-01-2021 @ 100) (b) | | | 5.000 | % | | | 10/01/2024 | | | | Aa3 | | | | 3,200,000 | | | | 3,252,128 | |
The Board of Education of the County of Manongalia (West Virginia), Public School Refunding Bonds, Series 2012 (Prerefunded to 05-01-2022 @ 100) (b) | | | 4.000 | % | | | 05/01/2025 | | | | AA- | | | | 1,105,000 | | | | 1,144,040 | |
The Board of Education of the County of Braxton (West Virginia), Public School Refunding Bonds, Series 2016 | | | 4.000 | % | | | 05/01/2026 | | | | AA- | | | | 250,000 | | | | 288,132 | |
The Board of Education of the County of Braxton (West Virginia), Public School Refunding Bonds, Series 2016 | | | 2.250 | % | | | 05/01/2026 | | | | AA- | | | | 125,000 | | | | 135,566 | |
| | |
| 38 | | See accompanying notes to financial statements. |
STATE FARM ASSOCIATES’ FUNDS TRUST MUNICIPAL BOND FUND
SCHEDULE OF INVESTMENTS (continued)
May 31, 2021
(Unaudited)
| | | | | | | | | | | | | | | | | | | | |
| | | Coupon
rate | | | Maturity date | | | Rating (a) | | | Principal
amount | | | Value | |
Long-term Municipal Bonds (Cont.) | | | | | | | | | | | | | | | | | | | | |
West Virginia (Cont.) | | | | | | | | | | | | | | | | | | | | |
The Board of Education of the County of Manongalia (West Virginia), Public School Refunding Bonds, Series 2012 (Prerefunded to 05-01-2022 @ 100) (b) | | | 4.000 | % | | | 05/01/2026 | | | | AA- | | | $ | 2,180,000 | | | $ | 2,257,019 | |
The Board of Education of the County of Braxton (West Virginia), Public School Refunding Bonds, Series 2016 | | | 5.000 | % | | | 05/01/2027 | | | | AA- | | | | 515,000 | | | | 625,782 | |
| | | | | | | | | | | | | | | | | | | | |
| | | | | | | | | | | | | | | | | | | 10,253,555 | |
| | | | | | | | | | | | | | | | | | | | |
Wisconsin (6.19%) | | | | | | | | | | | | | | | | | | | | |
Milwaukee Metropolitan Sewerage District, General Obligation Sewerage System Refunding Bonds, Series 2015C | | | 2.500 | % | | | 10/01/2024 | | | | Aa1 | | | | 2,000,000 | | | | 2,144,020 | |
City of Fond Du Lac, Fond Du Lac County, Wisconsin, Waterworks System Revenue Bonds, Series 2010 | | | 5.000 | % | | | 09/01/2025 | | | | A | | | | 1,000,000 | | | | 1,003,440 | |
Muskego-Norway School District, Waukesha and Racine Counties, Wisconsin, General Obligation School Building and Improvement Bonds | | | 3.000 | % | | | 04/01/2026 | | | | AA | | | | 2,495,000 | | | | 2,754,904 | |
City of Oshkosh, Wisconsin, (Winnebago County), General Obligation Refunding Bonds, Series 2016H | | | 2.000 | % | | | 08/01/2026 | | | | Aa3 | | | | 1,090,000 | | | | 1,132,717 | |
Ellsworth Community School District, Pierce County, Wisconsin, General Obligation Refunding Bonds (Prerefunded to 04-01-2024 @ 100) (b) | | | 4.000 | % | | | 04/01/2027 | | | | Aa3 | | | | 340,000 | | | | 376,244 | |
Ellsworth Community School District, Pierce County, Wisconsin, General Obligation Refunding Bonds (Prerefunded to 04-01-2024 @ 100) (b) | | | 4.000 | % | | | 04/01/2028 | | | | Aa3 | | | | 275,000 | | | | 304,315 | |
Ellsworth Community School District, Pierce County, Wisconsin, General Obligation Refunding Bonds (Prerefunded to 04-01-2024 @ 100) (b) | | | 4.000 | % | | | 04/01/2029 | | | | Aa3 | | | | 400,000 | | | | 442,640 | |
Central Brown County Water Authority, Wisconsin, Water System Revenue Refunding Bonds, Series 2014A | | | 5.000 | % | | | 11/01/2029 | | | | A | | | | 1,000,000 | | | | 1,149,740 | |
School District of Wisconsin Dells, Adams, Columbia, Juneau, Marquette and Sauk Counties, Wisconsin, General Obligation Refunding Bonds | | | 3.125 | % | | | 03/01/2030 | | | | AA- | | | | 1,595,000 | | | | 1,734,164 | |
Central Brown County Water Authority, Wisconsin, Water System Revenue Refunding Bonds, Series 2014A | | | 5.000 | % | | | 11/01/2030 | | | | A | | | | 2,000,000 | | | | 2,299,480 | |
School District of Wisconsin Dells, Adams, Columbia, Juneau, Marquette and Sauk Counties, Wisconsin, General Obligation Refunding Bonds | | | 3.250 | % | | | 03/01/2031 | | | | AA- | | | | 1,395,000 | | | | 1,522,796 | |
Waupaca County, Wisconsin, General Obligation Highway Facility Building Bonds, Series 2018A | | | 3.250 | % | | | 03/01/2031 | | | | Aa2 | | | | 1,160,000 | | | | 1,281,046 | |
Burlington Area School District, Racine, Walworth and Kenosha Counties, Wisconsin, General Obligation Refunding Bonds | | | 3.125 | % | | | 04/01/2031 | | | | A+ | | | | 1,000,000 | | | | 1,086,810 | |
D.C. Everest Area School District, Marathon County, Wisconsin, General Obligation School Building and Improvement Bonds, Series 2018 | | | 3.375 | % | | | 04/01/2031 | | | | AA | | | | 3,900,000 | | | | 4,292,691 | |
School District of Poynette, Dane and Columbia Counties, Wisconsin, General Obligation Refunding Bonds | | | 3.000 | % | | | 04/01/2031 | | | | AA | | | | 850,000 | | | | 922,837 | |
City of Muskego, Waukesha County, Wisconsin, General Obligation Refunding Bonds, Series 2018A | | | 4.000 | % | | | 06/01/2031 | | | | Aa2 | | | | 300,000 | | | | 350,904 | |
Central Brown County Water Authority, Wisconsin, Water System Revenue Refunding Bonds, Series 2014A | | | 5.000 | % | | | 11/01/2031 | | | | A | | | | 2,200,000 | | | | 2,528,614 | |
Calumet County, Wisconsin, General Obligation County Building Bonds | | | 3.000 | % | | | 12/01/2031 | | | | AA+ | | | | 1,300,000 | | | | 1,472,705 | |
Burlington Area School District, Racine, Walworth and Kenosha Counties, Wisconsin, General Obligation Refunding Bonds | | | 3.250 | % | | | 04/01/2032 | | | | A+ | | | | 1,120,000 | | | | 1,222,245 | |
Hamilton School District, Waukesha County, Wisconsin, General Obligation School Building and Improvement Bonds | | | 3.250 | % | | | 04/01/2032 | | | | Aa1 | | | | 3,390,000 | | | | 3,696,253 | |
School District of Poynette, Dane and Columbia Counties, Wisconsin, General Obligation Refunding Bonds | | | 3.125 | % | | | 04/01/2032 | | | | AA | | | | 1,520,000 | | | | 1,652,650 | |
Western Technical College District, Wisconsin, General Obligation Refunding Bonds, Series 2017F | | | 3.000 | % | | | 04/01/2032 | | | | AA+ | | | | 2,240,000 | | | | 2,385,846 | |
City of Muskego, Waukesha County, Wisconsin, General Obligation Refunding Bonds, Series 2018A | | | 4.000 | % | | | 06/01/2032 | | | | Aa2 | | | | 675,000 | | | | 786,179 | |
Calumet County, Wisconsin, General Obligation County Building Bonds | | | 3.000 | % | | | 12/01/2032 | | | | AA+ | | | | 1,325,000 | | | | 1,496,375 | |
Calumet County, Wisconsin, General Obligation County Building Bonds | | | 3.000 | % | | | 12/01/2033 | | | | AA+ | | | | 1,375,000 | | | | 1,547,934 | |
City of Muskego, Waukesha County, Wisconsin, General Obligation Refunding Bonds, Series 2018A | | | 4.000 | % | | | 06/01/2034 | | | | Aa2 | | | | 1,390,000 | | | | 1,609,050 | |
| | |
| See accompanying notes to financial statements. | | 39 |
STATE FARM ASSOCIATES’ FUNDS TRUST MUNICIPAL BOND FUND
SCHEDULE OF INVESTMENTS (continued)
May 31, 2021
(Unaudited)
| | | | | | | | | | | | | | | | | | | | |
| | | Coupon
rate | | | Maturity date | | | Rating (a) | | | Principal
amount | | | Value | |
Long-term Municipal Bonds (Cont.) | | | | | | | | | | | | | | | | | | | | |
Wisconsin (Cont.) | | | | | | | | | | | | | | | | | | | | |
Sun Prarie Area School District, Dane and Columbia Counties, Wisconsin, General Obligation Refunding Bonds | | | 3.000 | % | | | 03/01/2035 | | | | AA | | | $ | 1,405,000 | | | $ | 1,529,385 | |
Sun Prarie Area School District, Dane and Columbia Counties, Wisconsin, General Obligation Refunding Bonds | | | 3.000 | % | | | 03/01/2036 | | | | AA | | | | 1,535,000 | | | | 1,667,470 | |
| | | | | | | | | | | | | | | | | | | | |
| | | | | | | | | | | | | | | | | | | 44,393,454 | |
| | | | | | | | | | | | | | | | | | | | |
Total Long-term Municipal Bonds | | | | | | | | | | | | | | | | | | | | |
(cost $651,823,636) | | | | | | | | | | | | | | | | | | | 694,456,141 | |
| | | | | | | | | | | | | | | | | | | | |
| | | | | |
| | | | | | | | | | | | Shares | | | Value | |
Short-term Investments (2.19%) | | | | | | | | | | | | | | | | | | | | |
JPMorgan U.S. Government Money Market Fund Capital Shares, 0.03% (d) | | | | | | | | 15,677,224 | | | | 15,677,224 | |
| | | | | | | | | | | | | | | | | | | | |
Total Short-term Investments | | | | | | | | | | | | | | | | | | | | |
(cost $15,677,224) | | | | | | | | | | | | | | | | | | | 15,677,224 | |
| | | | | | | | | | | | | | | | | | | | |
TOTAL INVESTMENTS (99.04%) | | | | | | | | | | | | | | | | | | | | |
(cost $667,500,860) | | | | | | | | | | | | | | | | | | | 710,133,365 | |
OTHER ASSETS, NET OF LIABILITIES (0.96%) | | | | | | | | | | | | | | | | | | | 6,872,815 | |
| | | | | | | | | | | | | | | | | | | | |
NET ASSETS (100.00%) | | | | | | | | | | | | | | | | | | $ | 717,006,180 | |
| | | | | | | | | | | | | | | | | | | | |
| (a) | Ratings are not audited and represent the lower of Moody’s or S&P issuer specific ratings. |
| (b) | Advanced Refunded Bonds are backed by an escrow or trust containing U.S. Government, U.S. Government Agency or other securities to support the timely payment of principal and interest. |
| (c) | Rate shown is fixed until mandatory tender date of July 1, 2026. |
| (d) | Rate shown is the 7-day yield as of May 31, 2021. |
NR - Not Rated
| | |
| 40 | | See accompanying notes to financial statements. |
(This page intentionally left blank.)
41
STATE FARM ASSOCIATES’ FUNDS TRUST
STATEMENTS OF ASSETS AND LIABILITIES
May 31, 2021
(Unaudited)
| | | | | | | | | | | | | | | | |
| | | Growth
Fund | | | Balanced
Fund | | | Interim
Fund | | | Municipal
Bond
Fund | |
Assets | | | | | | | | | | | | | | | | |
Investments in securities at identified cost | | $ | 1,458,561,180 | | | | 1,030,542,793 | | | | 459,164,055 | | | | 667,500,860 | |
| | | | | | | | | | | | | | | | |
Investments in securities at market value | | $ | 6,731,981,863 | | | | 2,408,552,110 | | | | 465,920,080 | | | | 710,133,365 | |
Cash | | | 1,915,607 | | | | 1,915,682 | | | | — | | | | — | |
Receivables: | | | | | | | | | | | | | | | | |
Dividends and interest | | | 15,967,306 | | | | 7,470,308 | | | | 2,059,403 | | | | 7,096,240 | |
Shares of the Fund sold | | | 2,689,948 | | | | 1,296,660 | | | | 98,761 | | | | 265,263 | |
SFIMC | | | 35,333 | | | | 13,506 | | | | 2,875 | | | | 4,287 | |
Due from bank | | | 0 | | | | 150 | | | | 0 | | | | 0 | |
Prepaid expenses | | | 98,168 | | | | 47,155 | | | | 12,428 | | | | 17,519 | |
| | | | | | | | | | | | | | | | |
Total assets | | | 6,752,688,225 | | | | 2,419,295,571 | | | | 468,093,547 | | | | 717,516,674 | |
| | | | | | | | | | | | | | | | |
Liabilities and Net Assets | | | | | | | | | | | | | | | | |
Distributions to shareholders | | | — | | | | — | | | | 39,586 | | | | 356,774 | |
Payables: | | | | | | | | | | | | | | | | |
Shares of the Fund redeemed | | | 1,708,705 | | | | 1,271,316 | | | | 239,496 | | | | 8,806 | |
Trustees’ fees and expenses | | | 20,083 | | | | 8,087 | | | | 1,748 | | | | 2,634 | |
Due to bank | | | 150 | | | | 0 | | | | 0 | | | | 0 | |
Due to affiliates | | | 561,715 | | | | 226,459 | | | | 51,349 | | | | 86,639 | |
Accrued liabilities | | | 157,128 | | | | 102,134 | | | | 56,634 | | | | 55,641 | |
| | | | | | | | | | | | | | | | |
Total liabilities | | | 2,447,781 | | | | 1,607,996 | | | | 388,813 | | | | 510,494 | |
| | | | | | | | | | | | | | | | |
Net assets applicable to shares outstanding of common stock | | $ | 6,750,240,444 | | | | 2,417,687,575 | | | | 467,704,734 | | | | 717,006,180 | |
| | | | | | | | | | | | | | | | |
Fund shares outstanding (no par value, unlimited number of shares authorized) | | | 59,240,928 | | | | 26,508,009 | | | | 45,636,928 | | | | 80,012,581 | |
Net asset value, offering price and redemption price per share | | $ | 113.95 | | | | 91.21 | | | | 10.25 | | | | 8.96 | |
| | | | | | | | | | | | | | | | |
Analysis of Net Assets | | | | | | | | | | | | | | | | |
Paid-in-capital | | $ | 1,342,422,223 | | | | 940,816,316 | | | | 461,221,443 | | | | 674,054,129 | |
Total distributable earnings (loss) | | | 5,407,818,221 | | | | 1,476,871,259 | | | | 6,483,291 | | | | 42,952,051 | |
| | | | | | | | | | | | | | | | |
Net assets applicable to shares outstanding | | $ | 6,750,240,444 | | | | 2,417,687,575 | | | | 467,704,734 | | | | 717,006,180 | |
| | | | | | | | | | | | | | | | |
| | |
| 42 | | See accompanying notes to financial statements. |
STATE FARM ASSOCIATES’ FUNDS TRUST
STATEMENTS OF OPERATIONS
May 31, 2021
(Unaudited)
| | | | | | | | | | | | | | | | |
| | | Growth
Fund | | | Balanced
Fund | | | Interim
Fund | | | Municipal
Bond
Fund | |
Investment Income: | | | | | | | | | | | | | | | | |
Dividends | | $ | 66,075,475 | | | | 17,400,669 | | | | — | | | | — | |
Interest | | | 4,638 | | | | 8,219,847 | | | | 2,947,035 | | | | 11,444 | |
Tax-exempt interest | | | — | | | | — | | | | — | | | | 9,211,086 | |
| | | | | | | | | | | | | | | | |
| | | 66,080,113 | | | | 25,620,516 | | | | 2,947,035 | | | | 9,222,530 | |
Less: foreign withholding taxes | | | (554,428 | ) | | | (248,971 | ) | | | — | | | | — | |
| | | | | | | | | | | | | | | | |
Total investment income | | | 65,525,685 | | | | 25,371,545 | | | | 2,947,035 | | | | 9,222,530 | |
Expenses: | | | | | | | | | | | | | | | | |
Investment advisory and management fees | | | 3,188,030 | | | | 1,246,002 | | | | 278,954 | | | | 400,015 | |
Trustees’ fees and expenses | | | 164,206 | | | | 63,567 | | | | 14,733 | | | | 20,056 | |
Reports to shareholders | | | 76,162 | | | | 16,754 | | | | 9,619 | | | | 8,766 | |
Professional fees | | | 48,740 | | | | 27,266 | | | | 3,694 | | | | 5,774 | |
Audit fees | | | 40,594 | | | | 40,194 | | | | 40,360 | | | | 40,205 | |
Errors and omissions insurance | | | 32,050 | | | | 15,570 | | | | 6,159 | | | | 7,114 | |
Custodian fees | | | 73,854 | | | | 38,582 | | | | 7,359 | | | | 5,564 | |
ICI dues | | | 40,048 | | | | 15,631 | | | | 3,462 | | | | 5,291 | |
Regulatory Fees | | | 18,813 | | | | 12,719 | | | | 16,035 | | | | 12,367 | |
Fidelity bond expense | | | 1,351 | | | | 620 | | | | 141 | | | | 213 | |
Securities valuation fees | | | 5,026 | | | | 84,350 | | | | 13,846 | | | | 88,002 | |
| | | | | | | | | | | | | | | | |
Total expenses | | | 3,688,874 | | | | 1,561,255 | | | | 394,362 | | | | 593,367 | |
Less: expense reimbursement from SFIMC | | | (35,631 | ) | | | (13,506 | ) | | | (2,875 | ) | | | (4,287 | ) |
| | | | | | | | | | | | | | | | |
Net expenses | | | 3,653,243 | | | | 1,547,749 | | | | 391,487 | | | | 589,080 | |
| | | | | | | | | | | | | | | | |
Net investment income | | | 61,872,442 | | | | 23,823,796 | | | | 2,555,548 | | | | 8,633,450 | |
Realized and unrealized gain (loss): | | | | | | | | | | | | | | | | |
Net realized gain (loss) on sales of investments | | | 75,128,604 | | | | 76,700,685 | | | | 118,270 | | | | 274,004 | |
Net realized gain (loss) on foreign currency transactions | | | (12,366 | ) | | | (4,088 | ) | | | — | | | | — | |
Change in net unrealized appreciation (depreciation) on investments and foreign currency transactions | | | 946,525,776 | | | | 204,825,149 | | | | (5,819,117 | ) | | | (6,211,222 | ) |
| | | | | | | | | | | | | | | | |
Net realized and unrealized gain (loss) on investments | | | 1,021,642,014 | | | | 281,521,746 | | | | (5,700,847 | ) | | | (5,937,218 | ) |
| | | | | | | | | | | | | | | | |
Net change in net assets resulting from operations | | $ | 1,083,514,456 | | | | 305,345,542 | | | | (3,145,299 | ) | | | 2,696,232 | |
| | | | | | | | | | | | | | | | |
| | |
| See accompanying notes to financial statements. | | 43 |
STATE FARM ASSOCIATES’ FUNDS TRUST
STATEMENTS OF CHANGES IN NET ASSETS
| | | | | | | | |
| | | Growth
Fund | |
Six months ended May 31, 2021 (Unaudited) and the year ended November 30, 2020 | | 2021 | | | 2020 | |
From operations: | | | | | | | | |
Net investment income | | $ | 61,872,442 | | | | 122,110,348 | |
Net realized gain (loss) | | | 75,116,238 | | | | 50,580,861 | |
Change in net unrealized appreciation or depreciation | | | 946,525,776 | | | | 495,954,432 | |
| | | | | | | | |
Net change in net assets resulting from operations | | | 1,083,514,456 | | | | 668,645,641 | |
Distributions to shareholders from and in excess of: | | | | | | | | |
Distributions (Net investment income, Net realized gain) | | | (107,166,262 | ) | | | (181,531,414 | ) |
| | | | | | | | |
Total distributions to shareholders | | | (107,166,262 | ) | | | (181,531,414 | ) |
From Fund share transactions: | | | | | | | | |
Proceeds from shares sold | | | 159,554,690 | | | | 245,052,230 | |
Reinvestment of distributions | | | 100,311,561 | | | | 170,226,604 | |
| | | | | | | | |
| | | 259,866,251 | | | | 415,278,834 | |
Less payments for shares redeemed | | | (305,737,138 | ) | | | (585,160,917 | ) |
| | | | | | | | |
Net increase (decrease) in net assets from Fund share transactions | | | (45,870,887 | ) | | | (169,882,083 | ) |
| | | | | | | | |
Total increase (decrease) in net assets | | | 930,477,307 | | | | 317,232,144 | |
| | | | | | | | |
Net assets: | | | | | | | | |
Beginning of period | | | 5,819,763,137 | | | | 5,502,530,993 | |
| | | | | | | | |
End of period | | $ | 6,750,240,444 | | | | 5,819,763,137 | |
| | | | | | | | |
Share Information | | | | | | | | |
Sold | | | 1,498,724 | | | | 2,888,825 | |
Issued in reinvestment of distributions | | | 1,009,985 | | | | 1,943,120 | |
Redeemed | | | (2,881,858 | ) | | | (6,785,766 | ) |
| | | | | | | | |
Net increase (decrease) | | | (373,149 | ) | | | (1,953,821 | ) |
| | | | | | | | |
| | |
| 44 | | See accompanying notes to financial statements. |
| | | | | | | | | | | | | | | | | | | | | | |
Balanced
Fund | | | Interim
Fund | | | Municipal
Bond
Fund | |
| 2021 | | | 2020 | | | 2021 | | | 2020 | | | 2021 | | | 2020 | |
| | | | | | | | | | | | | | | | | | | | | | |
| | 23,823,796 | | | | 47,326,599 | | | | 2,555,548 | | | | 5,811,934 | | | | 8,633,450 | | | | 18,120,053 | |
| | 76,696,597 | | | | 17,222,752 | | | | 118,270 | | | | (4,405 | ) | | | 274,004 | | | | 671,779 | |
| | 204,825,149 | | | | 163,695,182 | | | | (5,819,117 | ) | | | 9,183,914 | | | | (6,211,222 | ) | | | 18,059,864 | |
| | | | | | | | | | | | | | | | | | | | | | |
| | 305,345,542 | | | | 228,244,533 | | | | (3,145,299 | ) | | | 14,991,443 | | | | 2,696,232 | | | | 36,851,696 | |
| | | | | | | | | | | | | | | | | | | | | | |
| | (39,455,571 | ) | | | (55,983,773 | ) | | | (2,555,548 | ) | | | (5,811,934 | ) | | | (9,259,687 | ) | | | (18,438,528 | ) |
| | | | | | | | | | | | | | | | | | | | | | |
| | (39,455,571 | ) | | | (55,983,773 | ) | | | (2,555,548 | ) | | | (5,811,934 | ) | | | (9,259,687 | ) | | | (18,438,528 | ) |
| | | | | | | | | | | | | | | | | | | | | | |
| | 77,432,247 | | | | 133,601,946 | | | | 73,754,040 | | | | 272,566,071 | | | | 38,962,061 | | | | 78,430,037 | |
| | 37,548,870 | | | | 53,290,330 | | | | 2,108,204 | | | | 5,716,538 | | | | 6,582,023 | | | | 15,338,456 | |
| | | | | | | | | | | | | | | | | | | | | | |
| | 114,981,117 | | | | 186,892,276 | | | | 75,862,244 | | | | 278,282,609 | | | | 45,544,084 | | | | 93,768,493 | |
| | (214,244,550 | ) | | | (229,868,707 | ) | | | (97,629,539 | ) | | | (142,990,378 | ) | | | (62,984,478 | ) | | | (82,077,036 | ) |
| | | | | | | | | | | | | | | | | | | | | | |
| | (99,263,433 | ) | | | (42,976,431 | ) | | | (21,767,295 | ) | | | 135,292,231 | | | | (17,440,394 | ) | | | 11,691,457 | |
| | | | | | | | | | | | | | | | | | | | | | |
| | 166,626,538 | | | | 129,284,329 | | | | (27,468,142 | ) | | | 144,471,740 | | | | (24,003,849 | ) | | | 30,104,625 | |
| | | | | | | | | | | | | | | | | | | | | | |
| | | | | | | | | | | | | | | | | | | | | | |
| | 2,251,061,037 | | | | 2,121,776,708 | | | | 495,172,876 | | | | 350,701,136 | | | | 741,010,029 | | | | 710,905,404 | |
| | | | | | | | | | | | | | | | | | | | | | |
| | 2,417,687,575 | | | | 2,251,061,037 | | | | 467,704,734 | | | | 495,172,876 | | | | 717,006,180 | | | | 741,010,029 | |
| | | | | | | | | | | | | | | | | | | | | | |
| | | | | | | | | | | | | | | | | | | | | | |
| | 893,323 | | | | 1,807,747 | | | | 7,115,629 | | | | 26,310,110 | | | | 4,209,678 | | | | 8,786,824 | |
| | 455,635 | | | | 717,928 | | | | 239,890 | | | | 552,545 | | | | 848,750 | | | | 1,714,383 | |
| | (2,406,652 | ) | | | (3,118,768 | ) | | | (9,496,361 | ) | | | (13,820,577 | ) | | | (7,020,507 | ) | | | (9,318,579 | ) |
| | | | | | | | | | | | | | | | | | | | | | |
| | (1,057,694 | ) | | | (593,093 | ) | | | (2,140,842 | ) | | | 13,042,078 | | | | (1,962,079 | ) | | | 1,182,628 | |
| | | | | | | | | | | | | | | | | | | | | | |
| | |
| See accompanying notes to financial statements. | | 45 |
STATE FARM ASSOCIATES’ FUNDS TRUST
NOTES TO FINANCIAL STATEMENTS
(Unaudited)
The State Farm Associates’ Funds Trust (the “Trust”) has four separate investment portfolios (each a “Fund” and together, the “Funds”). The Trust is registered under the Investment Company Act of 1940 as an open-end, management investment company. Each Fund has its own investment objective, investment policies, restrictions, and attendant risks and is diversified as defined in the Investment Company Act of 1940. Each Fund follows the accounting and reporting guidance in Financial Accounting Standards Board (“FASB”) Accounting Standards Codification 946, “Financial Services-Investment Companies.” State Farm Investment Management Corp. (“SFIMC”) is the Trust’s investment adviser.
The State Farm Growth Fund (the “Growth Fund”) seeks long-term growth of capital which may be supplemented by income. The Growth Fund seeks to achieve this objective by investing under normal circumstances at least 80% of its assets in common stocks and other income producing equity securities.
The State Farm Balanced Fund (the “Balanced Fund”) seeks long-term growth of principal while providing some current income. The Balanced Fund seeks to achieve its objective by investing under normal market conditions approximately 60% of its total assets in common stocks, and ordinarily limits its common stock investments to no more than 75% of its total assets. The Balanced Fund ordinarily invests at least 25% of its total assets in fixed income securities. The Balanced Fund invests in bonds to provide relative stability of principal and income.
The State Farm Interim Fund (the “Interim Fund”) seeks the realization over a period of years of the highest yield consistent with relatively low price volatility. The Interim Fund seeks to achieve its investment objective through investment in high quality debt securities with short and intermediate-term maturities.
The State Farm Municipal Bond Fund (the “Municipal Bond Fund”) seeks as high a rate of income exempt from federal income taxes as is consistent with prudent investment management. The Municipal Bond Fund seeks to achieve its investment objective through investment primarily in a diversified selection of municipal bonds (for example, general obligation bonds of a state or bonds financing a specific project) with maturities of one to seventeen years, although from time to time SFIMC may purchase issues with longer maturities. The Municipal Bond Fund normally invests so that either (1) at least 80% of the Fund’s net investment income is exempt from regular federal income tax or (2) at least 80% of the Fund’s net assets are invested in securities that produce income exempt from regular federal income tax.
| 2. | Significant Accounting Policies |
The following is a summary of significant accounting policies followed by the Funds in the preparation of their financial statements in accordance with U.S. generally accepted accounting principles (“GAAP”).
Fund Share Valuation
Fund shares are sold and redeemed on a continuous basis at net asset value. The net asset value per share is determined daily on each day the New York Stock Exchange is open. The net asset value for each Fund is determined as of the close of regular session trading on the New York Stock Exchange (usually 3:00 p.m. Central Time). The net asset value per share is computed by dividing the total value of a Fund’s investments and other assets, less liabilities, by the number of Fund shares outstanding.
Securities Valuation
All investments in securities are recorded at their fair value. For more information see Note 3 Securities Valuation.
Securities Transactions and Investment Income
For financial reporting purposes, security transactions are accounted for on trade date (date the order to buy or sell is executed) and dividend income is recorded on the ex-dividend date. Interest income is recorded on the accrual basis, and includes amortization of premiums and discounts on fixed income securities. Realized gains and losses from security transactions are reported on an identified cost basis.
Expenses
Expenses arising in connection with a specific Fund are allocated to that Fund. Common Trust expenses are allocated between the Funds in proportion to each Fund’s relative net assets.
Income Taxes and Distributions to Shareholders
Each Fund is a separate taxpayer for federal income tax purposes. It is the Funds’ policy to comply with the provisions of Subchapter M of the Internal Revenue Code applicable to regulated investment companies and, in the manner provided therein, to distribute substantially all of their taxable income, including any net realized gain on sales of investments, reportable for federal income tax purposes.
For more information refer to Note 4 Income Taxes and Distributions to Shareholders.
46
STATE FARM ASSOCIATES’ FUNDS TRUST
NOTES TO FINANCIAL STATEMENTS (continued)
(Unaudited)
Foreign Currency Translation
Investment securities and other assets and liabilities denominated in a foreign currency are translated into U.S. dollars at the prevailing foreign exchange rates at May 31, 2021. Purchases and sales of investment securities and income and expense items denominated in foreign currencies are translated into U.S. dollars at the prevailing foreign exchange rates on the respective dates of transactions. That portion of realized and unrealized gains and losses on investments that results from fluctuations in foreign currency exchange rates is not separately disclosed, but is included with realized and unrealized gains and losses on investment securities.
Use of Estimates
The preparation of financial statements in conformity with GAAP requires management to make estimates and assumptions that affect the amounts reported in the financial statements and accompanying notes. Actual results could differ from those estimates.
Commitments and Contingencies
In the normal course of business, the Trust enters into contracts on behalf of the Funds that may contain provisions for general indemnifications. Each Fund’s maximum exposure under these indemnification provisions is unknown, as this would involve future claims that may be made against each Fund that are not known at this time. However, based on experience, the Funds believe the risk of loss from these indemnification provisions is remote.
Securities Purchased on a “When-Issued” Basis
The Municipal Bond Fund may purchase municipal bonds on a “when-issued” basis. Delivery and payment for these securities may be a month or more after the purchase date, during which time such securities are subject to market fluctuations. The Municipal Bond Fund identifies and holds specific liquid assets with a market value at least equal to the amount of the when-issued purchase commitments in order to ensure that it can meet those commitments. It is possible that the securities will never be issued and the commitment cancelled. At May 31, 2021, the Municipal Bond Fund did not have any when-issued securities.
New Accounting Pronouncements
In August 2018, FASB issued Accounting Standards Update No. 2018-13 “Fair Value Measurement (Topic 820): Disclosure Framework—Changes to the Disclosure Requirements for Fair Value Measurement”, which removes, modifies, and adds certain fair value disclosure requirements. The amendments are effective for fiscal years, and interim periods within those fiscal years, beginning after December 15, 2019. The Funds applied the amendments beginning with the fiscal period ended November 30, 2021. This change had no impact on the Trust’s financial statements.
Investments are valued at fair value pursuant to valuation procedures approved by the Trust’s Board of Trustees (the “Board”). The Board assigns to SFIMC the responsibility for determining fair value using the processes and factors as outlined in the valuation procedures. If SFIMC cannot determine fair value based on the valuation procedures, the Board or the Executive Committee of the Board will determine fair value.
Fair value is defined as the price that the Funds would receive to sell an asset or pay to transfer a liability in an orderly transaction between market participants at the measurement date. A three-tier hierarchy is used to classify fair value measurements for disclosure purposes. The three-tier hierarchy of inputs is summarized in three broad levels as follows:
| | • | | Level 1 - Unadjusted quoted prices in active markets that are accessible to the Funds for identical assets or liabilities. |
| | • | | Level 2 - Inputs other than quoted prices included within Level 1 that are observable for the asset or liability, either directly or indirectly. These inputs may include quoted prices for the identical instrument on an inactive market, quoted prices for similar instruments in active markets, interest rates, yield curves and credit spreads. For assets or liabilities with a specified (contractual) term, a Level 2 input must be observable for substantially the full term of the asset or liability. |
| | • | | Level 3 - Unobservable inputs for the asset or liability to the extent that relevant observable inputs are not available. These inputs, based on the best information available in the circumstances, would include reasonably available information about the assumptions that a market participant would use in valuing the asset or liability and might include SFIMC’s own data. |
To the extent that valuation is based on models or inputs that are less observable or unobservable in the market, the determination of fair value requires more judgment. Accordingly, the degree of judgment exercised in determining fair value is greatest for instruments categorized in Level 3.
The inputs used to measure the fair value of an asset or liability might be categorized within different levels of the fair value hierarchy. In those cases, the fair value measurement is categorized in its entirety in the same level of the fair value hierarchy as the lowest level input that is significant to the entire measurement. Changes in valuation techniques may result in transfers into or out of an assigned level within the fair value hierarchy.
47
STATE FARM ASSOCIATES’ FUNDS TRUST
NOTES TO FINANCIAL STATEMENTS (continued)
(Unaudited)
Stocks, closed-end registered investment companies and exchange-traded funds (“ETFs”) traded on securities exchanges, or in an over-the-counter (“OTC”) market in which transaction prices are reported, are valued at the last sales price on the day of valuation or, if there are no reported sales on that day, at the last reported bid price for the day. Stocks traded on NASDAQ are valued at the NASDAQ Official Closing Price. Long-term debt securities, U.S. Treasury bills, and short-term municipal variable rate demand notes are generally valued using quotations provided by an independent pricing service. Short-term debt securities with remaining maturities of 60 days or less (other than U.S. Treasury bills) are generally valued on an amortized cost basis, which approximates market value. Investments in open-end investment companies are valued each day based on the closing net asset value of the respective fund.
Portfolio securities that are primarily traded on foreign securities exchanges (“foreign securities”) are valued at the closing values of such securities on the respective exchange where each security is primarily traded. SFIMC may determine that a market quotation for a foreign security held by a Fund is not reliable because of events or circumstances that have occurred between the time of the market quotation and the time the net asset value of the Fund is calculated (“subsequent event”). A subsequent event might include company-specific developments, a development that might affect an entire market or region, a potential global development or a significant change in one or more U.S. securities indexes. If SFIMC determines that the market quotation for a foreign security is not reliable, SFIMC may determine the foreign security’s value in SFIMC’s reasonable judgment.
For securities other than foreign securities, for which market prices are not readily available or are considered unreliable, SFIMC is required to obtain bid price quotations from brokers or dealers in the securities. If SFIMC cannot obtain a quotation for the security or if SFIMC believes the quotation does not represent the security’s fair value, then SFIMC will determine the security’s value in SFIMC’s reasonable judgment.
In determining a value based on reasonable judgment, SFIMC may use different methodologies, including multiple of earnings, multiple of book value, discount from market of a similar freely traded security or, for debt securities, yield to maturity. Other factors SFIMC may consider in determining value for a security include, but are not limited to, fundamental analytical data relating to the security, the nature and duration of any restrictions on disposition of the security, the last traded price of the security, significant global or regional events such as political unrest, natural disasters, and war, and significant movements in major market indices, ETFs, index futures or other financial instruments in the U.S. or other markets. All securities valued based on SFIMC’s reasonable judgment are subsequently reported to the Board on a quarterly basis.
SFIMC reviews the pricing methodologies of the Funds’ approved pricing vendors, including understanding a vendor’s key inputs and assumptions in valuing securities. SFIMC also engages in transaction back-testing with respect to portfolio securities sold by the Funds to compare unrealized gains and losses to realized gains and losses.
The inputs or methodology used for valuing securities are not necessarily an indication of the risk associated with investing in those securities. The following is a summary of the Fund’s fair value measurements as of the end of the reporting period:
| | | | | | | | | | | | | | | | |
| | |
| | | Investments in Securities | |
| | | | | |
Fund | | Level 1 | | | Level 2 | | | Level 3 | | | Total | |
Growth Fund | | | | | | | | | | | | | | | | |
| | | | | |
Common Stocks (a) | | $ | 6,628,987,880 | | | $ | — | | | $ | — | | | $ | 6,628,987,880 | |
| | | | | |
Short-term Investments | | | 102,993,983 | | | | — | | | | — | | | | 102,993,983 | |
Balanced Fund | | | | | | | | | | | | | | | | |
| | | | | |
Common Stocks (a) | | | 1,717,311,510 | | | | — | | | | — | | | | 1,717,311,510 | |
| | | | | |
Corporate Bonds | | | — | | | | 391,318,062 | | | | — | | | | 391,318,062 | |
| | | | | |
Foreign Government Bonds | | | — | | | | 2,147,320 | | | | — | | | | 2,147,320 | |
| | | | | |
Agency Commercial Mortgage-Backed | | | | | | | | | | | | | | | | |
| | | | | |
Securities | | | — | | | | 78,753,496 | | | | — | | | | 78,753,496 | |
| | | | | |
U.S. Treasury Obligations | | | — | | | | 167,711,881 | | | | — | | | | 167,711,881 | |
| | | | | |
Short-term Investments | | | 51,309,841 | | | | — | | | | — | | | | 51,309,841 | |
Interim Fund | | | | | | | | | | | | | | | | |
| | | | | |
U.S. Treasury Obligations | | | — | | | | 460,817,453 | | | | — | | | | 460,817,453 | |
| | | | | |
Short-term Investments | | | 5,102,627 | | | | — | | | | — | | | | 5,102,627 | |
Municipal Bond Fund | | | | | | | | | | | | | | | | |
| | | | | |
Long-term Municipal Bonds | | | — | | | | 694,456,141 | | | | — | | | | 694,456,141 | |
| | | | | |
Short-term Investments | | | 15,677,224 | | | | — | | | | — | | | | 15,677,224 | |
| | | | |
(a) Industry classification is disclosed in the Schedules of Investments. | | | | | | | | | | | | | |
| | | | | | | | | | | | | | | | | |
The Funds did not hold any Level 3 securities or derivative instruments as of November 30, 2020 or for the six months ended May 31, 2021.
48
STATE FARM ASSOCIATES’ FUNDS TRUST
NOTES TO FINANCIAL STATEMENTS (continued)
(Unaudited)
| 4. | Proposed Reorganizations with Advisers Investment Trust |
At a special meeting held on March 11, 2021, the Board of Trustees of State Farm Associates’ Funds Trust approved an Agreement and Plan of Reorganization for each of the funds of State Farm Associates’ Funds Trust pursuant to which each fund (each, a “Target Fund” and collectively, the “Target Funds”) would be reorganized (each, a “Reorganization” and collectively, the “Reorganizations”) into newly created corresponding series (each, an “Acquiring Fund”) of Advisers Investment Trust, a Delaware statutory trust (the “AIT Trust”). At a special joint meeting held on June 17, 2021, the shareholders of each Target Fund approved the Agreement and Plan of Reorganization. The Reorganizations are subject to the completion of certain conditions.
| | |
Target Funds (each a series of State Farm Associates’ Funds Trust) | | Acquiring Funds (each a series of Advisers Investment Trust) |
State Farm Growth Fund | | State Farm Growth Fund |
State Farm Balanced Fund | | State Farm Balanced Fund |
State Farm Interim Fund | | State Farm Interim Fund |
State Farm Municipal Bond Fund | | State Farm Municipal Bond Fund |
With respect to each Target Fund, the Agreement and Plan of Reorganization provides for: (i) the acquisition by AIT Trust, on behalf of each of its series, of all of the assets of a corresponding Target Fund, in exchange for shares of the corresponding Acquiring Fund (“Acquiring Fund Shares”), and the assumption by the AIT Trust, on behalf of each Acquiring Fund, of the liabilities of each corresponding Target Fund; (ii) the distribution of Acquiring Fund Shares to the shareholders of each corresponding Target Fund according to their respective interests in the Target Fund in complete liquidation of the Target Funds; and (iii) the dissolution of each Target Fund as soon as practicable after the closing of the Reorganizations.
It is anticipated that the closing date for the Reorganizations will be during the third calendar quarter of 2021. Each Reorganization is proposed to be conducted separately from the others, and a Fund that is not a party to a Reorganization will incur no obligations, duties or liabilities with respect to such Reorganization by reason of being a party to the Plan. If any one or more Reorganizations should fail to be consummated, such failure will not affect the other Reorganizations in any way. No Reorganization of any Target Fund is conditioned upon the Reorganization of any other Target Fund.
| 5. | Income Taxes and Distributions to Shareholders |
As of May 31, 2021, the Trust’s management completed a review of uncertain tax positions taken by the Funds, if any, and determined that no tax liability was required for unrecognized tax benefits, and no additional disclosures were needed. Generally, the tax authorities can initiate examinations of tax returns within the three year period beginning on the date such returns are filed. As a result, some tax returns are still open and subject to examination. In addition, as of November 30, 2020, management is not aware of any tax positions for which it is reasonably possible that the total amounts of unrecognized tax benefits will significantly change for the period ending November 30, 2020.
As of May 31, 2021, each Fund’s aggregate unrealized gains and losses for all investments based on cost for federal income tax purposes were as follows:
| | | | | | | | | | | | | | | | |
Fund | | Cost of
Investments for
Federal Tax
Purposes | | | Gross
Unrealized
Appreciation | | | Gross
Unrealized
(Depreciation) | | | Net Unrealized
Appreciation
(Depreciation) | |
Growth Fund | | $ | 1,458,561,180 | | | $ | 5,311,870,394 | | | $ | (38,449,711 | ) | | $ | 5,273,420,683 | |
Balanced Fund | | | 1,030,542,793 | | | | 1,398,949,905 | | | | (20,940,588 | ) | | | 1,378,009,317 | |
Interim Fund | | | 459,164,055 | | | | 9,194,875 | | | | (2,438,850 | ) | | | 6,756,025 | |
Municipal Bond Fund | | | 667,500,860 | | | | 42,726,041 | | | | (93,536 | ) | | | 42,632,505 | |
The Growth Fund and Balanced Fund declare and pay income dividends, if any, at least annually. The Interim Fund and Municipal Bond Fund declare dividends daily equal to each Fund’s respective net investment income, and distributions of such amounts are made on the last business day of each month.
Net realized gains on sales of investments, if any, are distributed annually after the close of the Fund’s fiscal year. Dividends and distributions payable to shareholders are recorded by the respective Fund on the ex-dividend date.
49
STATE FARM ASSOCIATES’ FUNDS TRUST
NOTES TO FINANCIAL STATEMENTS (continued)
(Unaudited)
On June 24, 2021, the Growth Fund declared an ordinary income dividend of $1.02 per share to shareholders of record on June 23, 2021 (reinvestment date June 24, 2021).
On June 24, 2021, the Balanced Fund declared an ordinary income dividend of $0.87 per share to shareholders of record on June 23, 2021 (reinvestment date June 24, 2021).
For the year ended November 30, 2020, the following Fund had unused capital loss carryforwards available for federal income tax purposes to be applied against future capital gains realized after November 30, 2020, if any. Future capital loss carryforward utilization in any given year may be subject to Internal Revenue Code limitations. If not applied, the capital losses will carryforward indefinitely as follows:
| | | | | | | | | | | | | | | | |
| | | | | | Unused Non Expiring Capital Loss Carryforwards | |
Fund | | Loss Carryforwards Utilized in 2020 | | | Short-term | | | Long-term | | | Total | |
Interim Fund | | $ | — | | | $ | 6,148 | | | $ | 384,855 | | | $ | 391,003 | |
As of November 30, 2020, in accordance with federal tax regulations, the components of distributable earnings on a tax basis were as follows:
| | | | | | | | | | | | | | | | | | | | |
Fund | | Undistributed
Ordinary
Income | | | Undistributed
Long-term
Gain | | | Unrealized
Appreciation
(Depreciation) | | | Accumulated
Capital and
Other Losses | | | Total | |
Growth Fund | | $ | 53,683,961 | | | $ | 50,874,602 | | | $ | 4,326,911,464 | | | $ | — | | | $ | 4,431,470,027 | |
Balanced Fund | | | 20,512,978 | | | | 17,279,057 | | | | 1,173,189,253 | | | | — | | | | 1,210,981,288 | |
Interim Fund | | | — | | | | — | | | | 12,575,142 | | | | (391,003 | ) | | | 12,184,139 | |
Municipal Bond Fund | | | — | | | | 671,779 | | | | 48,705,924 | | | | — | | | | 49,377,703 | |
The timing and characterization of certain income and capital gain distributions are determined annually in accordance with federal income tax regulations, which may differ from GAAP. These differences are primarily due to the recognition of net realized losses, the timing of Fund distributions, and foreign currency transactions. As a result, net investment income and net realized gain or loss on investment transactions for a reporting period may differ from distributions during such period. Accordingly, each Fund may periodically make reclassifications for permanent differences among certain capital accounts without impacting its net asset value.
As of November 30, 2020, these reclassifications were as follows:
| | | | | | | | | | | | |
Fund | | Paid in
Capital | | | Accumulated
Net Realized
Gain (Loss) (a) | | | Accumulated
Undistributed
Net Investment
Income (Loss) (a) | |
Growth Fund | | $ | — | | | $ | 293,741 | | | $ | (293,741 | ) |
Balanced Fund | | | — | | | | 56,305 | | | | (56,305 | ) |
| |
(a) These components are each included as part of total distributable earnings (loss) within the Statements of Assets and Liabilities. | |
The tax character of distributions was designated as follows for the year ended November 30,2020.
| | | | | | | | | | | | | | | | |
2020 | | Tax-Exempt
Income | | | Ordinary
Income | | | Long-term
Capital Gain | | | Total | |
Growth Fund | | $ | — | | | $ | 129,137,348 | | | $ | 52,394,066 | | | $ | 181,531,414 | |
Balanced Fund | | | — | | | | 49,929,057 | | | | 6,054,716 | | | | 55,983,773 | |
Interim Fund | | | — | | | | 5,811,934 | | | | — | | | | 5,811,934 | |
Municipal Bond Fund | | | 18,201,882 | | | | 56,101 | | | | 180,545 | | | | 18,438,528 | |
50
STATE FARM ASSOCIATES’ FUNDS TRUST
NOTES TO FINANCIAL STATEMENTS (continued)
(Unaudited)
| 6. | Transactions with Affiliates |
The Trust has entered into an investment advisory and management services agreement with SFIMC pursuant to which each Fund pays SFIMC an annual fee (computed on a daily basis and paid monthly) at the following annual rates:
| | |
Growth Fund | | 0.20% of the first $100 million of average net assets |
| | | 0.15% of the next $100 million of average net assets |
| | | 0.10% of the average net assets in excess of $200 million |
Balanced Fund | | 0.20% of the first $100 million of average net assets |
| | | 0.15% of the next $100 million of average net assets |
| | | 0.10% of the average net assets in excess of $200 million |
Interim Fund | | 0.20% of the first $50 million of average net assets |
| | | 0.15% of the next $50 million of average net assets |
| | | 0.10% of the average net assets in excess of $100 million |
Municipal Bond Fund | | 0.20% of the first $50 million of average net assets |
| | | 0.15% of the next $50 million of average net assets |
| | | 0.10% of the average net assets in excess of $100 million |
Other than the account fee imposed on certain shareholders of the Trust which is paid by redeeming shares from the shareholder’s account, the Funds do not pay any direct or indirect discount, commission or other compensation for transfer agent services provided by SFIMC or for distribution and underwriting services provided by State Farm VP Management Corp.
Certain officers and/or trustees of the Trust are also officers and/or directors of SFIMC. The Trust made no payments to its officers or trustees except for trustees’ fees paid to or accrued for the Trust’s independent trustees.
Expense Reduction Agreement
SFIMC has agreed to reimburse a Fund if, and to the extent, a Fund’s total annual operating expenses (excluding taxes, interest, extraordinary litigation expenses, brokerage commissions and other portfolio transaction costs) exceed 0.40% of the Fund’s average net assets. Prior-year reimbursements, if any, are not subject to recapture.
Line of Credit
State Farm Mutual Automobile Insurance Company (“Auto Company”), the parent company of SFIMC, has entered into a Line of Credit Agreement with the Trust. Under that agreement, a Fund may request and Auto Company, in its complete discretion, may lend money to a Fund for up to 30 days on an unsecured basis. Auto Company will not lend more than $25 million at any one time to the Funds. Under the agreement, a Fund will pay interest to Auto Company on any outstanding loan at a benchmark interest rate that approximates the rate that creditworthy corporate issuers pay on short-term commercial paper. The Funds did not borrow under the Line of Credit Agreement during the six months ended May 31, 2021.
| 7. | Investment Transactions |
For the six months ended May 31, 2021, investment transactions (exclusive of short-term instruments) were as follows:
| | | | | | | | | | | | | | | | |
Fund | | Purchases
(excluding U.S.
Government
Obligations) | | | Sales/Maturities
(excluding U.S.
Government
Obligations) | | | Purchases of U.S.
Government
Obligations | | | Sales/Maturities of U.S.
Government
Obligations | |
Growth Fund | | $ | — | | | $ | 178,461,093 | | | $ | — | | | $ | — | |
Balanced Fund | | | 9,958,392 | | | | 155,413,520 | | | | 9,765,234 | | | | 15,000,000 | |
Interim Fund | | | — | | | | — | | | | 28,129,844 | | | | 49,669,883 | |
Municipal Bond Fund | | | 34,326,199 | | | | 42,915,760 | | | | — | | | | — | |
51
STATE FARM ASSOCIATES’ FUNDS TRUST
NOTES TO FINANCIAL STATEMENTS (continued)
(Unaudited)
Investing in a Fund may involve certain risks including, but not limited to, those described below. Please refer to the Funds’ prospectus and statement of additional information for more information on risks associated with investing in the Funds.
Management Risk
The assessment by the Funds’ investment adviser of the securities to be purchased or sold by a Fund may prove incorrect, resulting in losses or poor performance, even in a rising market.
Market Risk
Stock prices may fluctuate widely over short or even extended periods in response to company, market, or economic news. Stock markets also tend to move in cycles, with periods of rising stock prices and periods of falling stock prices.
Interest Rate Risk and Call Risk
The risk that the bonds a Fund holds may decline in value due to an increase in interest rates. All bonds, including those issued by the U.S. Government, are subject to interest rate risk. Bonds with longer maturities are affected more by interest rate movements than bonds with shorter maturities. Another risk associated with interest rate changes is call risk. Call risk is the risk that during periods of falling interest rates, a bond issuer will “call” or repay a higher yielding bond before the maturity date of the bond. Under these circumstances, a Fund may have to reinvest the proceeds in an investment that provides a lower yield than the called bond.
Credit Risk
The risk that a bond issuer fails to make principal or interest payments when due to a Fund, or that the credit quality of the issuer falls. Corporate bonds are subject to greater credit risk than U.S. Government bonds.
Municipal Bond Risk
Municipal securities can be significantly affected by political changes as well as uncertainties related to taxation, legislative changes or the rights of municipal security holders.
Inflation Risk
The risk that the value of the assets or income from an investment will be worth less in the future as inflation decreases the value of money.
Liquidity Risk
The investment adviser to the Funds may have difficulty selling securities a Fund holds at the time it would like to sell, and at the value a Fund has placed on those securities.
Tax Risk
The Growth Fund’s and Balanced Fund’s long-term ownership strategies historically has resulted in a low rate of turnover in their portfolios. Therefore, these Funds have accumulated a large amount of unrealized capital gains, and distribution of such gains to shareholders may be larger than the capital gain distributions made by other similar mutual funds. Should the Manager sell any appreciated assets, shareholders generally will receive their proportional share of the resulting realized capital gains regardless of how long they owned such shares. As a result, unless you are purchasing shares of the Growth Fund or Balanced Fund through a tax-advantaged account (such as an IRA), buying such shares at a time when the Growth Fund or Balanced Fund has unrealized gains might eventually cost you money in taxes.
Long-term Ownership Strategy Risk
The investment approach for the Growth Fund and the Balanced Fund generally emphasizes buying and holding securities over long periods. As such, the Growth Fund or the Balanced Fund could continue to hold certain securities through adverse cycles for those securities rather than selling them, which could cause such Fund to under perform compared to a fund that has invested in similar securities but actively shifts its portfolio assets to take advantage of market opportunities and that does not seek reduced portfolio turnover. In determining which portfolio securities to sell, the Manager considers, and seeks to mitigate, the amount of capital gains that may be realized by such sale.
Income Risk
The risk that the income from the bonds a Fund holds will decline. This risk applies when a Fund invests the proceeds from new share sales, or from matured or called bonds, at market interest rates that are below the portfolio’s current earnings rate.
52
STATE FARM ASSOCIATES’ FUNDS TRUST
NOTES TO FINANCIAL STATEMENTS (continued)
(Unaudited)
| 9. | Coronavirus Disease 2019 |
The outbreak of the novel coronavirus (“COVID-19”) and subsequent global pandemic began significantly impacting the U.S. and global financial markets and economies during the calendar quarter ended March 31, 2020. The worldwide spread of COVID-19 has created significant uncertainty in the global economy. The duration and extent of COVID-19 over the long-term cannot be reasonably estimated at this time. The ultimate impact of COVID-19 and the extent to which COVID-19 impacts the Funds’ normal course of business, results of operations, investments, and cash flows will depend on future developments, which are highly uncertain and difficult to predict. Management continues to monitor and evaluate this situation.
53
FINANCIAL HIGHLIGHTS
The financial highlights table is intended to help you understand the financial performance of each Fund for the past five years. Certain information reflects financial results for a single Fund share. The total returns within each table represent the rate that an investor would have earned (or lost) on an investment in the Fund (assuming reinvestment of all dividends and distributions).
STATE FARM ASSOCIATES’ FUNDS TRUST GROWTH FUND
(For a share outstanding throughout each period)
| | | | | | | | | | | | | | | | | | | | | | | | |
| | | | | | Year ended November 30, | |
| | | Six months ended
May 31, 2021
(Unaudited) | | | 2020 | | | 2019 | | | 2018 | | | 2017 | | | 2016 | |
Net asset value, beginning of period | | $ | 97.62 | | | | 89.37 | | | | 81.06 | | | | 80.41 | | | | 70.41 | | | | 73.38 | |
Income from Investment Operations | | | | | | | | | | | | | | | | | | | | | | | | |
Net investment income (a) | | | 1.04 | | | | 1.99 | | | | 2.13 | | | | 1.93 | | | | 1.84 | | | | 1.75 | |
Net gain (loss) on investments (both realized and unrealized) | | | 17.10 | | | | 9.22 | | | | 9.30 | | | | 1.51 | | | | 10.50 | | | | 4.15 | |
| | | | | | | | | | | | | | | | | | | | | | | | |
Total from investment operations | | | 18.14 | | | | 11.21 | | | | 11.43 | | | | 3.44 | | | | 12.34 | | | | 5.90 | |
| | | | | | | | | | | | | | | | | | | | | | | | |
Less Distributions | | | | | | | | | | | | | | | | | | | | | | | | |
Net investment income | | | (0.95 | ) | | | (2.11 | ) | | | (2.09 | ) | | | (1.90 | ) | | | (1.78 | ) | | | (1.76 | ) |
Net realized gain | | | (0.86 | ) | | | (0.85 | ) | | | (1.03 | ) | | | (0.89 | ) | | | (0.56 | )�� | | | (7.11 | ) |
| | | | | | | | | | | | | | | | | | | | | | | | |
Total distributions | | | (1.81 | ) | | | (2.96 | ) | | | (3.12 | ) | | | (2.79 | ) | | | (2.34 | ) | | | (8.87 | ) |
| | | | | | | | | | | | | | | | | | | | | | | | |
Net asset value, end of period | | $ | 113.95 | | | | 97.62 | | | | 89.37 | | | | 81.06 | | | | 80.41 | | | | 70.41 | |
| | | | | | | | | | | | | | | | | | | | | | | | |
Total Return | | | 18.85 | %(b) | | | 12.96 | % | | | 14.91 | % | | | 4.41 | % | | | 17.91 | % | | | 9.54 | % |
Ratios/Supplemental Data | | | | | | | | | | | | | | | | | | | | | | | | |
Net assets, end of period (millions) | | $ | 6,750.2 | | | | 5,819.8 | | | | 5,502.5 | | | | 4,992.6 | | | | 4,960.5 | | | | 4,296.6 | |
Average net asset ratios | | | | | | | | | | | | | | | | | | | | | | | | |
Expenses | | | 0.12 | %(c) | | | 0.12 | % | | | 0.12 | % | | | 0.12 | % | | | 0.12 | % | | | 0.12 | % |
Net investment income | | | 1.99 | %(c) | | | 2.29 | % | | | 2.62 | % | | | 2.42 | % | | | 2.46 | % | | | 2.59 | % |
Portfolio turnover rate (d) | | | 0 | %(c) | | | 0 | % | | | 1 | % | | | 0 | % | | | 1 | % | | | 0 | % |
| (a) | Average shares outstanding for the period were used to calculate net investment income per share. |
| (b) | Total return is not annualized for periods that are less than a full year. |
| (c) | Determined on an annualized basis. |
| (d) | Portfolio turnover rate rounds to less than 1 % for the year ended November 30, 2018. |
| | |
| 54 | | See accompanying notes to financial statements. |
STATE FARM ASSOCIATES’ FUNDS TRUST BALANCED FUND
(For a share outstanding throughout each period)
| | | | | | | | | | | | | | | | | | | | | | | | |
| | | | | | Year ended November 30, | |
| | | Six months ended
May 31, 2021
(Unaudited) | | | 2020 | | | 2019 | | | 2018 | | | 2017 | | | 2016 | |
Net asset value, beginning of period | | $ | 81.66 | | | | 75.35 | | | | 68.52 | | | | 68.84 | | | | 63.19 | | | | 66.38 | |
Income from Investment Operations | | | | | | | | | | | | | | | | | | | | | | | | |
Net investment income (a) | | | 0.86 | | | | 1.69 | | | | 1.81 | | | | 1.70 | | | | 1.65 | | | | 1.63 | |
Net gain (loss) on investments (both realized and unrealized) | | | 10.13 | | | | 6.62 | | | | 7.30 | | | | (0.03 | ) | | | 5.75 | | | | 1.76 | |
| | | | | | | | | | | | | | | | | | | | | | | | |
Total from investment operations | | | 10.99 | | | | 8.31 | | | | 9.11 | | | | 1.67 | | | | 7.40 | | | | 3.39 | |
| | | | | | | | | | | | | | | | | | | | | | | | |
Less Distributions | | | | | | | | | | | | | | | | | | | | | | | | |
Net investment income | | | (0.81 | ) | | | (1.78 | ) | | | (1.79 | ) | | | (1.68 | ) | | | (1.63 | ) | | | (1.69 | ) |
Net realized gain | | | (0.63 | ) | | | (0.22 | ) | | | (0.49 | ) | | | (0.31 | ) | | | (0.12 | ) | | | (4.89 | ) |
| | | | | | | | | | | | | | | | | | | | | | | | |
Total distributions | | | (1.44 | ) | | | (2.00 | ) | | | (2.28 | ) | | | (1.99 | ) | | | (1.75 | ) | | | (6.58 | ) |
| | | | | | | | | | | | | | | | | | | | | | | | |
Net asset value, end of period | | $ | 91.21 | | | | 81.66 | | | | 75.35 | | | | 68.52 | | | | 68.84 | | | | 63.19 | |
| | | | | | | | | | | | | | | | | | | | | | | | |
Total Return | | | 13.64 | %(b) | | | 11.31 | % | | | 13.82 | % | | | 2.49 | % | | | 11.93 | % | | | 5.83 | % |
Ratios/Supplemental Data | | | | | | | | | | | | | | | | | | | | | | | | |
Net assets, end of period (millions) | | $ | 2,417.7 | | | | 2,251.1 | | | | 2,121.8 | | | | 1,935.4 | | | | 1,951.1 | | | | 1,766.3 | |
Average net asset ratios | | | | | | | | | | | | | | | | | | | | | | | | |
Expenses | | | 0.13 | %(c) | | | 0.14 | % | | | 0.13 | % | | | 0.13 | % | | | 0.13 | % | | | 0.13 | % |
Net investment income | | | 2.03 | %(c) | | | 2.27 | % | | | 2.59 | % | | | 2.50 | % | | | 2.52 | % | | | 2.63 | % |
Portfolio turnover rate | | | 2 | %(c) | | | 3 | % | | | 4 | % | | | 5 | % | | | 4 | % | | | 4 | % |
| (a) | Average shares outstanding for the period were used to calculate net investment income per share. |
| (b) | Total return is not annualized for periods that are less than a full year. |
| (c) | Determined on an annualized basis. |
| | |
| See accompanying notes to financial statements. | | 55 |
STATE FARM ASSOCIATES’ FUNDS TRUST INTERIM FUND
(For a share outstanding throughout each period)
| | | | | | | | | | | | | | | | | | | | | | | | |
| | | | | | Year ended November 30, | |
| | | Six months ended
May 31, 2021
(Unaudited) | | | 2020 | | | 2019 | | | 2018 | | | 2017 | | | 2016 | |
Net asset value, beginning of period | | $ | 10.36 | | | | 10.10 | | | | 9.76 | | | | 9.87 | | | | 9.92 | | | | 9.99 | |
Income from Investment Operations | | | | | | | | | | | | | | | | | | | | | | | | |
Net investment income | | | 0.05 | | | | 0.14 | | |
| 0.17
|
| | | 0.14 | | | | 0.12 | | | | 0.12 | |
Net gain (loss) on investments (both realized and unrealized) | | | (0.11 | ) | | | 0.26 | | |
| 0.34
|
| | | (0.11 | ) | | | (0.05 | ) | | | (0.07 | ) |
| | | | | | | | | | | | | | | | | | | | | | | | |
Total from investment operations | | | (0.06 | ) | | | 0.40 | | | | 0.51 | | | | 0.03 | | | | 0.07 | | | | 0.05 | |
| | | | | | | | | | | | | | | | | | | | | | | | |
Less Distributions | | | | | | | | | | | | | | | | | | | | | | | | |
Net investment income | |
| (0.05
| )
| |
| (0.14
| )
| |
| (0.17
| )
| | | (0.14 | ) | |
| (0.12
| )
| | | (0.12 | ) |
Net realized gain | |
| —
|
| | | — | | | | — | | | | — | | | | — | | | | — | |
| | | | | | | | | | | | | | | | | | | | | | | | |
Total distributions | | | (0.05 | ) | | | (0.14 | ) | | | (0.17 | ) | | | (0.14 | ) | | | (0.12 | ) | | | (0.12 | ) |
| | | | | | | | | | | | | | | | | | | | | | | | |
Net asset value, end of period | | $ | 10.25 | | | | 10.36 | | | | 10.10 | | | | 9.76 | | | | 9.87 | | | | 9.92 | |
| | | | | | | | | | | | | | | | | | | | | | | | |
Total Return | | | (0.55 | )%(a) | | | 4.02 | % | | | 5.26 | % | | | 0.33 | % | | | 0.71 | % | | | 0.45 | % |
Ratios/Supplemental Data | | | | | | | | | | | | | | | | | | | | | | | | |
Net assets, end of period (millions) | | $ | 467.7 | | | | 495.2 | | | | 350.7 | | | | 337.9 | | | | 360.4 | | | | 396.3 | |
Average net asset ratios | | | | | | | | | | | | | | | | | | | | | | | | |
Expenses | | | 0.16 | %(b) | | | 0.16 | % | | | 0.17 | % | | | 0.17 | % | | | 0.16 | % | | | 0.16 | % |
Net investment income | | | 1.06 | %(b) | | | 1.38 | % | | | 1.71 | % | | | 1.45 | % | | | 1.21 | % | | | 1.15 | % |
Portfolio turnover rate | | | 12 | %(b) | | | 20 | % | | | 20 | % | | | 16 | % | | | 13 | % | | | 13 | % |
| (a) | Total return is not annualized for periods that are less than a full year. |
| (b) | Determined on an annualized basis. |
| | |
| 56 | | See accompanying notes to financial statements. |
STATE FARM ASSOCIATES’ FUNDS TRUST MUNICIPAL BOND FUND
(For a share outstanding throughout each period)
| | | | | | | | | | | | | | | | | | | | | | | | |
| | | | | | Year ended November 30, | |
| | | Six months ended
May 31, 2021
(Unaudited) | | | 2020 | | | 2019 | | | 2018 | | | 2017 | | | 2016 | |
Net asset value, beginning of period | | $ | 9.04 | | | | 8.80 | | | | 8.44 | | | | 8.61 | | | | 8.53 | | | | 8.80 | |
Income from Investment Operations | | | | | | | | | | | | | | | | | | | | | | | | |
Net investment income | | | 0.10 | | | | 0.23 | | | | 0.24 | | | | 0.25 | | | | 0.26 | | | | 0.26 | |
Net gain (loss) on investments (both realized and unrealized) | | | (0.07 | ) | | | 0.24 | | | | 0.36 | | | | (0.17 | ) | | | 0.08 | | | | (0.27 | ) |
| | | | | | | | | | | | | | | | | | | | | | | | |
Total from investment operations | | | 0.03 | | | | 0.47 | | | | 0.60 | | | | 0.08 | | | | 0.34 | | | | (0.01 | ) |
| | | | | | | | | | | | | | | | | | | | | | | | |
Less Distributions | | | | | | | | | | | | | | | | | | | | | | | | |
Net investment income | |
| (0.10
| )
| | | (0.23 | ) | | | (0.24 | ) | | | (0.25 | ) | | | (0.26 | ) | | | (0.26 | ) |
Net realized gain(a) | | | (0.01 | ) | | | — | | | | — | | | | — | | | | — | | | | — | |
| | | | | | | | | | | | | | | | | | | | | | | | |
Total distributions | | | (0.11 | ) | | | (0.23 | ) | | | (0.24 | ) | | | (0.25 | ) | | | (0.26 | ) | | | (0.26 | ) |
| | | | | | | | | | | | | | | | | | | | | | | | |
Net asset value, end of period | | $ | 8.96 | | | | 9.04 | | | | 8.80 | | | | 8.44 | | | | 8.61 | | | | 8.53 | |
| | | | | | | | | | | | | | | | | | | | | | | | |
Total Return | | | 0.34 | %(b) | | | 5.40 | % | | | 7.19 | % | | | 0.99 | % | | | 3.99 | % | | | (0.16 | )% |
Ratios/Supplemental Data | | | | | | | | | | | | | | | | | | | | | | | | |
Net assets, end of period (millions) | | $ | 717.0 | | | | 741.0 | | | | 710.9 | | | | 675.4 | | | | 698.6 | | | | 704.1 | |
Average net asset ratios | | | | | | | | | | | | | | | | | | | | | | | | |
Expenses | | | 0.16 | %(c) | | | 0.16 | % | | | 0.16 | % | | | 0.16 | % | | | 0.15 | % | | | 0.16 | % |
Net investment income | | | 2.38 | %(c) | | | 2.53 | % | | | 2.74 | % | | | 2.93 | % | | | 2.98 | % | | | 2.95 | % |
Portfolio turnover rate | | | 10 | %(c) | | | 10 | % | | | 14 | % | | | 12 | % | | | 9 | % | | | 7 | % |
| (a) | Net realized gain distributions represent less than $0.01 per share for the years ended November 30, 2020, 2019 and 2018. |
| (b) | Total return is not annualized for periods that are less than a full year. |
| (c) | Determined on an annualized basis. |
| | |
| See accompanying notes to financial statements. | | 57 |
Disclosure information pursuant to Item 2 is not applicable.
Registrant hereby undertakes to provide a copy of the code of ethics that applies to the registrants’ principal executive officer, principal financial officer, principal accounting officer or controller, or persons performing similar functions to any person upon request, without charge. To request a copy of the code of ethics, contact the registrant at 1-800-447-0740.
| ITEM 3. | AUDIT COMMITTEE FINANCIAL EXPERT. |
Not applicable.
| ITEM 4. | PRINCIPAL ACCOUNTANT FEES AND SERVICES. |
Not applicable.
| ITEM 5. | AUDIT COMMITTEE OF LISTED REGISTRANTS. |
Not applicable.
(a) The information required by this Item 6(a) is included as part of the report to shareholders under Item 1 of this Form N-CSR.
(b) Not applicable.
| ITEM 7. | DISCLOSURE OF PROXY VOTING POLICIES AND PROCEDURES FOR CLOSED-END MANAGEMENT INVESTMENT COMPANIES. |
Not applicable.
| ITEM 8. | PORTFOLIO MANAGERS OF CLOSED-END MANAGEMENT INVESTMENT COMPANIES. |
Not applicable.
| ITEM 9. | PURCHASES OF EQUITY SECURITIES BY CLOSED-END MANAGEMENT INVESTMENT COMPANY AND AFFILIATED PURCHASERS. |
Not applicable.
| ITEM 10. | SUBMISSION OF MATTERS TO A VOTE OF SECURITY HOLDERS. |
There were no material changes to the procedures by which shareholders may recommend nominees to the State Farm Associates’ Funds Trust Board of Trustees.
| ITEM 11. | CONTROLS AND PROCEDURES. |
(a) The registrant’s principal executive officer and principal financial officer evaluated the effectiveness of the registrant’s disclosure controls and procedures (as defined in Rule 30a-3(c) under the Investment Company Act of 1940 (the “Act”) (17 CFR 270.30a-3(c))) as of a date within 90 days of the filing date of this report (the “Evaluation Date”), and based on their evaluation as of the Evaluation Date of these controls and procedures as required by Rule 30a-3(b) under the Act (17 CFR 270.30a-3(b)) and Rules 13a-15(b) or 15d-15(b) under the Securities Exchange Act of 1934 (17 CFR 240.13a-15(b) or 240.15d-15(b)) (as applicable), concluded that the registrant’s disclosure controls and procedures are effective. (b) No change in the registrant’s internal control over financial reporting (as defined in Rule 30a-3(d) under the Act (17 CFR 270.30a-3(d))) occurred during the period covered by this report that has materially affected, or is reasonably likely to materially affect, the registrant’s internal control over financial reporting.
| ITEM 12. | DISCLOSURE OF SECURITIES LENDING ACTIVITIES FOR CLOSED-END MANAGEMENT INVESTMENT COMPANIES. |
Not applicable.
(a)(1) Not applicable.
(a)(2) A separate certification for each principal executive officer and principal financial officer of the registrant as required by Rule 30a-2(a) under the Act (17 CFR 270.30a-2(a)): Attached hereto as EX-99.CERT.
(a)(3) Not applicable.
(a)(4) Not applicable.
(b) Certification of principal executive officer and principal financial officer as required by Rule 30a-2(b) under the Act (17 CFR 270.30a-2(b)), Rule 13a-14(b) or Rule 15d-14(b) under the Securities Exchange Act of 1934 (17 CFR 240.13a-14(b) or 240.15d-14(b))(as applicable), and Section 1350 of Chapter 63 of Title 18 of the United States Code (18 U.S.C. 1350): Attached hereto as EX-99.906CERT.
SIGNATURES
Pursuant to the requirements of the Securities Exchange Act of 1934 and the Investment Company Act of 1940, the registrant has duly caused this report to be signed on its behalf by the undersigned, thereunto duly authorized.
State Farm Associates’ Funds Trust
| | |
| By | | /s/ Joe R. Monk Jr. |
| | Joe R. Monk Jr. |
| | President |
Pursuant to the requirements of the Securities Exchange Act of 1934 and the Investment Company Act of 1940, this report has been signed below by the following persons on behalf of the registrant and in the capacities and on the dates indicated.
| | |
| By | | /s/ Joe R. Monk Jr. |
| | Joe R. Monk Jr. |
| | President |
| | |
| By | | /s/ Paul J. Smith |
| | Paul J. Smith |
| | Senior Vice President and Treasurer |