UNITED STATES
SECURITIES AND EXCHANGE COMMISSION
Washington, D.C. 20549
FORM N-CSR
CERTIFIED SHAREHOLDER REPORT OF REGISTERED
MANAGEMENT INVESTMENT COMPANIES
Investment Company Act file number 811-02338
Allmerica Securities Trust
(Name of Registrant)
440 Lincoln Street
Worcester, Massachusetts 01653
(Address of principal executive offices) (Zip code)
George M. Boyd, Secretary
Allmerica Financial
440 Lincoln Street
Worcester, MA 01653
(Name and address of agent for service)
Registrant’s telephone number, including area code: (508) 855-1000
Date of fiscal year end: December 31
Date of reporting period: December 31, 2003
| Item 1. | Reports to Stockholders |
The following is a copy of the report transmitted to stockholders pursuant to Rule 30e-1 under the Investment Company Act of 1940:
Allmerica Securities Trust
Annual Report
December 31, 2003
Allmerica Financial
December 31, 2003
[GRAPHIC]
Annual Report
· Allmerica Securities Trust
[GRAPHIC]
[GRAPHIC]
Table of Contents
| 2 | ||
| 3 | ||
| 4 | ||
| F-1 | ||
| F-15 | ||
Board of Trustees
John P. Kavanaugh, Chairman
P. Kevin Condron*
Jocelyn S. Davis*
Cynthia A. Hargadon*
T. Britton Harris, IV*
Gordon Holmes*
Mark A. Hug
Attiat F. Ott*
Ranne P. Warner*
Officers
John P. Kavanaugh, President
Richard J. Litchfield, Vice President
Ann K. Tripp, Vice President
Donald P. Wayman, Vice President
Paul T. Kane, Treasurer
George M. Boyd, Secretary
Investment Manager
Opus Investment Management, Inc.
440 Lincoln Street, Worcester, MA 01653
Registrar and Transfer, Dividend Disbursing and Reinvestment Agent
The Bank of New York
P.O. Box 11258
Church Street Station, New York, NY 10286
Administrator and Custodian
Investors Bank & Trust Company
200 Clarendon Street, Boston, MA 02116
*Independent Trustees
Independent Accountants
PricewaterhouseCoopers LLP
160 Federal Street, Boston, MA 02110
Legal Counsel
Ropes & Gray LLP
One International Place, Boston, MA 02110
Shareholder Inquiries May Be Directed To:
The Bank of New York Shareholder Relations Dept.-11E
P.O. Box 11258
Church Street Station, New York, NY 10286
1-800-432-8224
2
Dear Client:
We will remember 2003 as a year of broad-based economic recovery and above average investment returns across nearly all asset classes. Outside the United States, economic growth was tempered by growing worries over the decline in value of the U.S. dollar and concern that this could constrain the emerging global recovery. Still, stock markets around the world generally performed well. Japan’s Nikkei Average finished the period up 24.45%, Hong Kong’s Hang Seng Index was higher by 34.92%, Germany’s DAX Index rose 37.08%, England’s FTSE Index gained 13.62% and France’s CAC 40 Index was up 16.12%.
The United States economy displayed impressive strength in 2003. Early in the year, growth was hindered by major fighting in Iraq, a sluggish manufacturing sector and a lack of capital spending by businesses. The Federal Reserve Board cut the target federal funds rate to 1.00% and Congress passed a large tax cut, setting the stage for a rebound in economic activity. During the second half of the year, GDP rose sharply, productivity increased, corporate profits jumped, manufacturing gained strength and unemployment edged down. The consumer remained the primary source of spending, and business investment finally emerged. A full year of solid GDP growth provided the most compelling evidence yet that the growth engine of the world was back on track. U.S. securities markets reacted enthusiastically to the strong economic news. For the year, the S&P 500® Index gained 28.69% and the Nasdaq Composite Index rose 50.01%. Bonds also generated positive returns for the year, evidenced by the Lehman Brothers Aggregate Bond Index, which increased 4.11%.
During this period of historically low interest rates, the Allmerica Securities Trust portfolio generated income supporting aggregate dividends of 56.5 cents per share in 2003. This translated to an annualized dividend yield of 5.79%, based on Allmerica Securities Trust’s December 31, 2003 closing price of $9.75 per share.
On behalf of the Board of Trustees,

John P. Kavanaugh
Chairman of the Board
Allmerica Securities Trust
3
Allmerica Securities Trust
The Allmerica Securities Trust returned 6.15% for 2003, underperforming its benchmark, the Lehman Brothers U.S. Credit Index, which returned 7.70%.
The Trust’s investment focus was turned toward providing stable income despite a historically low interest rate and spread environment. Throughout the year, as the economy and credit fundamentals continued to improve, the investment manager added more exposure to the “Baa” and “Ba” sectors, in order to add yield. The Trust remained overweight in the more conservative sectors, such as consumer non-cyclical, banking and finance, although more consumer cyclical names were introduced as the year progressed. The Trust’s underperformance was a result of the portfolio generally being positioned higher in quality relative to the benchmark, as a defensive posture. The underweight in the riskier names hurt performance. The lower quality sectors, in particular “Baa”, significantly outperformed the higher quality sectors.
The investment manager feels that economic growth will start strongly in 2004, as both the corporate sector and consumers appear ready to spend. The Federal Reserve Board has conveyed its inclination to keep interest rates steady, as long as inflation remains contained and slack remains in the labor and manufacturing segments. The investment manager believes that the Federal Reserve Board may raise interest rates in the mid to latter half of 2004 and that interest rates may be pressured up modestly as economic growth accelerates and the risk of inflation increases.
The investment manager thinks that geopolitical risk, terrorism risk, and dollar risk could alter this outlook. Should the dollar begin to free-fall, U.S. interest rates may be forced up dramatically, causing stock prices to drop, eroding consumer confidence and squashing capital spending.
Average Annual Total Returns
| 1 Year | 5 Year | 10 Year | |||||||
Allmerica Securities Trust | 6.15 | % | 4.29 | % | 6.15 | % | |||
Lehman Brothers U.S. Credit Index | 7.70 | % | 7.11 | % | 7.42 | % | |||
Lipper Corporate Debt Funds BBB-Rated Average | 8.23 | % | 6.11 | % | 6.49 | % | |||
Historical Performance
| Total Return on Net Asset Value | Total Return on Market Value | |||
1999 | (1.42)% | (13.75)% | ||
2000 | 6.76% | 23.76% | ||
2001 | 4.41% | 6.00% | ||
2002 | 5.54% | 2.11% | ||
2003 | 6.15% | 9.38% | ||
The Lehman Brothers U.S. Credit Index is an unmanaged index of all publicly issued, fixed-rate, non-convertible investment grade corporate debt. The Lipper Corporate Debt Funds BBB-Rated Average is a non-weighted index of funds within the Corporate Debt Funds BBB-Rated category.
Portfolio composition is subject to change.
Investment Manager
Opus Investment Management, Inc.
About the Trust
Seeks to generate a high rate of current income for distribution to shareholders.
Portfolio Composition
As of December 31, 2003, the sector allocation of net assets was:
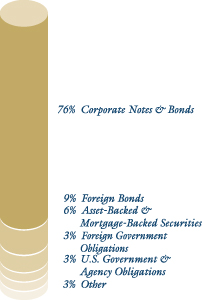
4
Financials
[THIS PAGE INTENTIONALLY LEFT BLANK]
ALLMERICA SECURITIES TRUST
PORTFOLIO OF INVESTMENTS • December 31, 2003
Par Value | Moody’s Ratings (Unaudited) | Value (Note 2) | |||||
U.S. GOVERNMENT AGENCY MORTGAGE-BACKED OBLIGATIONS (h) - 0.4% | |||||||
| Freddie Mac - 0.4% | |||||||
| $ 154,899 | 5.00%, 05/15/21 | NR | $ | 159,648 | |||
| 189,393 | 6.00%, 10/15/07 | NR | 198,724 | ||||
| 358,372 | |||||||
Total U.S. Government Agency | |||||||
Mortgage-Backed Obligations | 358,372 | ||||||
(Cost $ 357,828) | |||||||
U.S. GOVERNMENT AND AGENCY OBLIGATIONS - 2.8% | |||||||
Fannie Mae - 1.2% | |||||||
| 275,000 | 3.70%, 11/01/07 | Aaa | 279,512 | ||||
| 850,000 | 4.63%, 05/01/13 | Aa2 | 827,232 | ||||
| 1,106,744 | |||||||
Federal Home Loan Bank - 0.6% | |||||||
| 550,000 | 2.25%, 05/15/06 | Aaa | 550,124 | ||||
U.S. Treasury Bond - 1.0% | |||||||
| 120,000 | 5.25%, 02/15/29 | NR | 121,059 | ||||
| 225,000 | 6.00%, 02/15/26 | NR | 249,513 | ||||
| 450,000 | 6.25%, 05/15/30 | NR | 519,293 | ||||
| 889,865 | |||||||
Total U.S. Government and | |||||||
Agency Obligations | 2,546,733 | ||||||
(Cost $ 2,590,464) | |||||||
CORPORATE NOTES AND BONDS - 76.3% | |||||||
Aerospace & Defense - 1.1% | |||||||
| 450,000 | Northrop Grumman Corp. | ||||||
7.13%, 02/15/11 | Baa3 | 520,464 | |||||
| 450,000 | Raytheon Co. | ||||||
5.38%, 04/01/13 | Baa3 | 450,772 | |||||
| 971,236 | |||||||
Automotive - 2.4% | |||||||
| 460,000 | DaimlerChrysler North America | ||||||
Holding Corp. | |||||||
6.90%, 09/01/04 | A3 | 474,523 | |||||
| 500,000 | DaimlerChrysler North America | ||||||
Holding Corp. | |||||||
8.50%, 01/18/31 | A3 | 597,392 | |||||
| 500,000 | General Motors Corp. (a) | ||||||
7.20%, 01/15/11 | Baa1 | 549,743 | |||||
| 460,000 | Lear Corp. | ||||||
8.11%, 05/15/09 | Ba1 | 541,075 | |||||
| 2,162,733 | |||||||
Banking - 12.9% | |||||||
| 880,000 | Bank of America Corp. | ||||||
4.88%, 09/15/12 | Aa2 | 884,506 | |||||
| 450,000 | Bank of New York Co., Inc. | ||||||
3.75%, 02/15/08 | Aa3 | 455,267 | |||||
| $1,000,000 | Bank of New York Co., Inc. | ||||||
6.38%, 04/01/12 | A1 | $ | 1,108,522 | ||||
| 450,000 | BB&T Corp. (b) | ||||||
6.38%, 06/30/05 | A2 | 478,897 | |||||
| 725,000 | Capital One Bank | ||||||
4.88%, 05/15/08 | Baa2 | 746,136 | |||||
| 470,000 | Capital One Bank | ||||||
5.75%, 09/15/10 | Baa2 | 497,180 | |||||
| 500,000 | Citifinancial | ||||||
6.75%, 07/01/07 | Aa1 | 559,348 | |||||
| 655,000 | Fifth Third Bank | ||||||
4.50%, 06/01/18 | Aa3 | 608,076 | |||||
| 500,000 | Firstar Corp. | ||||||
7.13%, 12/01/09 | Aa3 | 576,215 | |||||
| 350,000 | MBNA Corp., MTN | ||||||
6.25%, 01/17/07 | Baa2 | 381,042 | |||||
| 85,000 | MBNA Corp., MTN | ||||||
7.50%, 03/15/12 | Baa2 | 98,756 | |||||
| 420,000 | National City Bank of Indiana | ||||||
4.88%, 07/20/07 | Aa3 | 442,136 | |||||
| 250,000 | Northern Trust Co. | ||||||
6.65%, 11/09/04 | Aa3 | 260,522 | |||||
| 450,000 | Regions Bank | ||||||
2.90%, 12/15/06 | Aa3 | 456,717 | |||||
| 200,000 | Suntrust Banks, Inc. | ||||||
6.38%, 04/01/11 | Aa3 | 223,908 | |||||
| 125,000 | Suntrust Banks, Inc. | ||||||
7.75%, 05/01/10 | A1 | 149,705 | |||||
| 500,000 | U.S. Bancorp, MTN | ||||||
5.10%, 07/15/07 | Aa3 | 533,122 | |||||
| 455,000 | US Bank National Cincinnati | ||||||
6.50%, 02/01/08 | Aa3 | 506,428 | |||||
| 475,000 | Wachovia Bank N.A. | ||||||
4.85%, 07/30/07 | Aa2 | 512,123 | |||||
| 450,000 | Wachovia Corp. | ||||||
4.95%, 11/01/06 | Aa3 | 477,774 | |||||
| 455,000 | Washington Mutual Bank FA | ||||||
5.50%, 01/15/13 | A3 | 469,355 | |||||
| 450,000 | Washington Mutual, Inc. | ||||||
4.38%, 01/15/08 | A3 | 462,615 | |||||
| 450,000 | Wells Fargo & Co. | ||||||
5.13%, 02/15/07 | Aa1 | 480,086 | |||||
| 450,000 | Wells Fargo & Co. | ||||||
5.13%, 09/01/12 | Aa2 | 459,795 | |||||
| 11,828,231 | |||||||
Beverages, Food & | |||||||
Tobacco - 4.1% | |||||||
| 450,000 | Anheuser-Busch Cos., Inc. | ||||||
4.63%, 02/01/15 | A1 | 439,133 | |||||
| 500,000 | Bottling Group LLC | ||||||
4.63%, 11/15/12 | A3 | 497,281 | |||||
| 460,000 | Cadbury Schweppes US Finance LLC (c) | ||||||
3.88%, 10/01/08 | Baa2 | 457,911 | |||||
| 525,000 | Conagra Foods, Inc. | ||||||
7.50%, 09/15/05 | Baa1 | 570,389 | |||||
See Notes to Financial Statements.
F-1
ALLMERICA SECURITIES TRUST
PORTFOLIO OF INVESTMENTS, Continued • December 31, 2003
Par Value | Moody’s Ratings (Unaudited) | Value (Note 2) | |||||
| Beverages, Food & Tobacco (continued) | |||||||
| $ 450,000 | Diageo Capital, Plc | ||||||
3.50%, 11/19/07 | A2 | $ | 453,879 | ||||
| 460,000 | General Mills, Inc. | ||||||
6.00%, 02/15/12 | Baa2 | 491,909 | |||||
| 830,000 | Unilever Capital Corp. | ||||||
5.90%, 11/15/32 | A1 | 831,991 | |||||
| 3,742,493 | |||||||
Chemicals - 1.1% | |||||||
| 200,000 | Du Pont (E.I.) De Nemours and Co. | ||||||
8.25%, 09/15/06 | Aa3 | 229,718 | |||||
| 500,000 | Praxair, Inc. | ||||||
6.63%, 10/15/07 | A3 | 556,549 | |||||
| 210,000 | Sealed Air Corp. (a) (c) | ||||||
5.63%, 07/15/13 | Baa3 | 214,891 | |||||
| 1,001,158 | |||||||
Commercial Services - 2.5% | |||||||
| 450,000 | Allied Waste North America (c) | ||||||
6.50%, 11/15/10 | Ba3 | 461,250 | |||||
| 500,000 | Allied Waste North America | ||||||
8.50%, 12/01/08 | Ba3 | 556,250 | |||||
| 750,000 | Pitney Bowes, Inc. | ||||||
4.75%, 05/15/18 | Aa3 | 715,376 | |||||
| 490,000 | Waste Management, Inc. | ||||||
7.00%, 10/01/04 | Baa3 | 507,089 | |||||
| 2,239,965 | |||||||
Cosmetics & Personal Care - 1.7% | |||||||
| 300,000 | Procter & Gamble Co. | ||||||
4.75%, 06/15/07 | Aa3 | 317,578 | |||||
| 1,000,000 | Procter & Gamble Co. | ||||||
8.50%, 08/10/09 | Aa3 | 1,234,326 | |||||
| 1,551,904 | |||||||
Electric Utilities - 7.6% | |||||||
| 550,000 | AmerenEnergy Generating | ||||||
7.75%, 11/01/05 | A3 | 603,087 | |||||
| 500,000 | Baltimore Gas & Electric Co. | ||||||
5.20%, 06/15/33 | A2 | 454,302 | |||||
| 505,000 | CenterPoint Energy, Inc. (a) (c) | ||||||
5.88%, 06/01/08 | Ba1 | 526,085 | |||||
| 600,000 | Dayton Power & Light Co. (c) | ||||||
5.13%, 10/01/13 | Baa1 | 598,812 | |||||
| 425,000 | Detroit Edison Co. | ||||||
6.13%, 10/01/10 | A3 | 466,253 | |||||
| 580,000 | Dominion Resources, Inc. | ||||||
5.25%, 08/01/33 | Baa1 | 574,380 | |||||
| 500,000 | Duke Energy Corp. | ||||||
7.50%, 08/16/05 | Baa2 | 537,231 | |||||
| 563,466 | East Coast Power LLC | ||||||
7.07%, 03/31/12 | Baa3 | 569,101 | |||||
| 250,000 | Entergy Gulf States, Inc. (c) | ||||||
3.60%, 06/01/08 | Baa3 | 240,979 | |||||
| $ 450,000 | FirstEnergy Corp. | ||||||
6.45%, 11/15/11 | Baa2 | $ | 466,402 | ||||
| 225,000 | Florida Power & Light | ||||||
6.88%, 12/01/05 | Aa3 | 244,781 | |||||
| 600,000 | Gulf States Utilities (d) | ||||||
8.25%, 04/01/04 | BBB- | 609,422 | |||||
| 500,000 | Pinnacle Partners (c) | ||||||
8.83%, 08/15/04 | Ba2 | 518,125 | |||||
| 450,000 | TXU Energy Co. | ||||||
7.00%, 03/15/13 | Baa2 | 497,698 | |||||
| 6,906,658 | |||||||
Entertainment & Leisure - 1.9% | |||||||
| 450,000 | AOL Time Warner, Inc. | ||||||
6.15%, 05/01/07 | Baa1 | 489,616 | |||||
| 500,000 | Harrah’s Operating Co., Inc. | ||||||
7.13%, 06/01/07 | Baa3 | 556,795 | |||||
| 350,000 | Park Place Entertainment Corp. (a) | ||||||
8.13%, 05/15/11 | Ba2 | 392,437 | |||||
| 300,000 | Time Warner Cos., Inc. | ||||||
7.57%, 02/01/24 | Baa1 | 339,259 | |||||
| 1,778,107 | |||||||
Financial Services - 8.3% | |||||||
| 500,000 | American Express Co. | ||||||
3.75%, 11/20/07 | A1 | 509,322 | |||||
| 525,000 | American Express Credit Corp. | ||||||
3.00%, 05/16/08 | Aa3 | 513,803 | |||||
| 460,000 | Ford Motor Credit Co. (a) | ||||||
6.50%, 01/25/07 | A3 | 490,003 | |||||
| 400,000 | Ford Motor Credit Co. | ||||||
6.88%, 02/01/06 | A3 | 426,923 | |||||
| 825,000 | Ford Motor Credit Co. | ||||||
7.25%, 10/25/11 | A3 | 894,765 | |||||
| 500,000 | General Electric Capital Corp. | ||||||
8.75%, 05/21/07 | Aaa | 592,711 | |||||
| 500,000 | General Electric Capital Corp., MTN | ||||||
4.25%, 01/15/08 | Aaa | 517,091 | |||||
| 380,000 | General Motors | ||||||
Acceptance Corp., MTN (b) | |||||||
2.41%, 10/20/05 | A3 | 382,853 | |||||
| 500,000 | Household Finance Corp. | ||||||
8.00%, 07/15/10 | A1 | 598,791 | |||||
| 450,000 | International Lease Finance Corp. | ||||||
4.35%, 09/15/08 | A1 | 459,236 | |||||
| 425,000 | J. Paul Getty Trust | ||||||
5.88%, 10/01/33 | Aaa | 420,681 | |||||
| 100,000 | KFW International Finance, Inc. | ||||||
4.25%, 04/18/05 | Aaa | 103,435 | |||||
| 500,000 | Mellon Funding Corp. | ||||||
5.00%, 12/01/14 | A2 | 501,261 | |||||
| 550,000 | Pitney Bowes Credit Corp. | ||||||
8.55%, 09/15/09 | Aa3 | 670,916 | |||||
| 500,000 | Toyota Motor Credit Corp. | ||||||
5.50%, 12/15/08 | Aaa | 547,175 | |||||
| 7,628,966 | |||||||
See Notes to Financial Statements.
F-2
ALLMERICA SECURITIES TRUST
PORTFOLIO OF INVESTMENTS, Continued • December 31, 2003
Par Value | Moody’s Ratings (Unaudited) | Value (Note 2) | |||||
Food Retailers - 2.5% | |||||||
| $ 675,000 | Delhaize America, Inc. | ||||||
8.13%, 04/15/11 | Ba1 | $ | 776,250 | ||||
| 470,000 | Kroger Co. | ||||||
5.50%, 02/01/13 | Baa3 | 478,034 | |||||
| 450,000 | Safeway, Inc. | ||||||
6.50%, 03/01/11 | Baa2 | 491,231 | |||||
| 500,000 | Safeway, Inc. | ||||||
9.65%, 01/15/04 | Baa3 | 500,793 | |||||
| 2,246,308 | |||||||
Forest Products & Paper - 3.5% | |||||||
| 500,000 | International Paper Co. | ||||||
5.30%, 04/01/15 | Baa2 | 488,791 | |||||
| 350,000 | International Paper Co. | ||||||
7.50%, 05/15/04 | Baa2 | 356,990 | |||||
| 500,000 | Kimberly-Clark Corp. | ||||||
7.10%, 08/01/07 | Aa2 | 570,635 | |||||
| 750,000 | Rock-Tenn Co. | ||||||
5.63%, 03/15/13 | Baa3 | 754,475 | |||||
| 450,000 | Weyerhaeuser Co. | ||||||
5.25%, 12/15/09 | Baa2 | 467,326 | |||||
| 500,000 | Weyerhaeuser Co. | ||||||
6.75%, 03/15/12 | Baa2 | 545,470 | |||||
| 3,183,687 | |||||||
Health Care Providers - 0.6% | |||||||
| 550,000 | HCA, Inc. | ||||||
6.75%, 07/15/13 | Ba1 | 583,274 | |||||
Home Construction, | |||||||
Furnishings & Appliances - 0.6% | |||||||
| 500,000 | Pulte Corp. | ||||||
8.13%, 03/01/11 | Baa3 | 593,698 | |||||
Industrial - Diversified - 0.9% | |||||||
| 750,000 | Illinois Tool Works, Inc. | ||||||
6.88%, 11/15/08 | Aa3 | 859,621 | |||||
Insurance - 1.9% | |||||||
| 450,000 | Marsh & McLennan Cos., Inc. | ||||||
4.85%, 02/15/13 | A2 | 443,065 | |||||
| 710,000 | Medco Health Solutions, Inc. | ||||||
7.25%, 08/15/13 | Ba1 | 774,575 | |||||
| 450,000 | UnitedHealth Group, Inc. | ||||||
7.50%, 11/15/05 | A3 | 494,019 | |||||
| 1,711,659 | |||||||
Media - Broadcasting & | |||||||
Publishing - 4.0% | |||||||
| 270,000 | Belo Corp. | ||||||
8.00%, 11/01/08 | Baa3 | 315,089 | |||||
| 450,000 | Continental Cablevision, Inc., Senior Notes | ||||||
8.30%, 05/15/06 | Baa3 | 504,531 | |||||
| 505,000 | Cox Communications, Inc. | ||||||
7.13%, 10/01/12 | Baa2 | 582,474 | |||||
| $ 225,000 | Cox Enterprises, Inc. (c) | ||||||
4.38%, 05/01/08 | Baa1 | $ | 228,573 | ||||
| 700,000 | Echostar DBS Corp. (c) | ||||||
5.75%, 10/01/08 | Ba3 | 707,875 | |||||
| 500,000 | News America Holdings, Inc. | ||||||
7.38%, 10/17/08 | Baa3 | 570,462 | |||||
| 180,000 | Viacom, Inc. | ||||||
5.50%, 05/15/33 | A3 | 167,630 | |||||
| 450,000 | Viacom, Inc. | ||||||
7.88%, 07/30/30 | A3 | 559,769 | |||||
| 3,636,403 | |||||||
Oil & Gas - 7.6% | |||||||
| 500,000 | ANR Pipeline Co., Debenture | ||||||
9.63%, 11/01/21 | B1 | 594,375 | |||||
| 375,000 | Burlington Resources, Inc. | ||||||
7.40%, 12/01/31 | Baa1 | 443,930 | |||||
| 580,000 | Conoco Funding Co. | ||||||
5.45%, 10/15/06 | A3 | 622,280 | |||||
| 500,000 | Conoco Funding Co. | ||||||
7.25%, 10/15/31 | A3 | 590,045 | |||||
| 230,000 | Enterprise Products | ||||||
7.50%, 02/01/11 | Baa2 | 257,028 | |||||
| 350,000 | Enterprise Products | ||||||
8.25%, 03/15/05 | Baa2 | 373,937 | |||||
| 300,000 | Marathon Oil Corp. | ||||||
6.13%, 03/15/12 | Baa1 | 324,434 | |||||
| 110,000 | Occidental Petroleum Corp. | ||||||
5.88%, 01/15/07 | Baa1 | 119,336 | |||||
| 500,000 | Occidental Petroleum Corp. | ||||||
6.50%, 04/01/05 | Baa1 | 528,482 | |||||
| 625,000 | Phillips Petroleum | ||||||
8.50%, 05/25/05 | A3 | 681,326 | |||||
| 690,000 | Pioneer Natural Resource Co. | ||||||
7.50%, 04/15/12 | Ba1 | 793,042 | |||||
| 600,000 | Texaco Capital, Inc. | ||||||
8.25%, 10/01/06 | Aa3 | 695,657 | |||||
| 435,000 | Valero Energy Corp. | ||||||
6.13%, 04/15/07 | Baa3 | 472,259 | |||||
| 400,000 | XTO Energy, Inc. | ||||||
7.50%, 04/15/12 | Ba2 | 452,000 | |||||
| 6,948,131 | |||||||
Pharmaceuticals - 2.3% | |||||||
| 700,000 | Bergen Brunswig Corp. (d) | ||||||
7.25%, 06/01/05 | BB | 731,500 | |||||
| 120,000 | Johnson & Johnson | ||||||
6.73%, 11/15/23 | Aaa | 136,743 | |||||
| 750,000 | Lilly (Eli) & Co. | ||||||
7.13%, 06/01/25 | Aa3 | 886,586 | |||||
| 330,000 | Zeneca Wilmington | ||||||
7.00%, 11/15/23 | Aa2 | 382,305 | |||||
| 2,137,134 | |||||||
See Notes to Financial Statements.
F-3
ALLMERICA SECURITIES TRUST
PORTFOLIO OF INVESTMENTS, Continued • December 31, 2003
Par Value | Moody’s | Value (Note 2) | |||||
Retailers - 2.8% | |||||||
| $ 500,000 | J.C. Penney Co., Inc. | ||||||
7.38%, 08/15/08 | Ba3 | $ | 555,625 | ||||
| 500,000 | Kohls Corp. | ||||||
6.00%, 01/15/33 | A3 | 501,360 | |||||
| 890,000 | Target Corp. | ||||||
6.35%, 11/01/32 | A2 | 934,892 | |||||
| 450,000 | Wal-Mart Stores, Inc. | ||||||
7.55%, 02/15/30 | Aa2 | 553,809 | |||||
| 2,545,686 | |||||||
Securities Broker - 2.7% | |||||||
| 580,000 | Bear Stearns Cos., Inc. | ||||||
4.00%, 01/31/08 | A1 | 590,749 | |||||
| 450,000 | Goldman Sachs Group, Inc. | ||||||
5.70%, 09/01/12 | Aa3 | 472,928 | |||||
| 333,153 | Jones (Edward D.) & Co., LP (e) (f) | ||||||
7.95%, 04/15/06 | NR | 355,683 | |||||
| 500,000 | Lehman Brothers Holdings, Inc. | ||||||
4.00%, 01/22/08 | A1 | 509,972 | |||||
| 495,000 | Morgan Stanley Dean Witter & Co. | ||||||
6.60%, 04/01/12 | Aa3 | 552,835 | |||||
| 2,482,167 | |||||||
Telephone Systems - 2.1% | |||||||
| 500,000 | BellSouth Corp. | ||||||
6.88%, 10/15/31 | A1 | 547,069 | |||||
| 680,000 | Sprint Capital Corp. | ||||||
6.13%, 11/15/08 | Baa3 | 724,796 | |||||
| 120,000 | Sprint Capital Corp. | ||||||
7.90%, 03/15/05 | Baa3 | 127,832 | |||||
| 450,000 | Verizon Florida, Inc. | ||||||
6.13%, 01/15/13 | A1 | 481,580 | |||||
| 1,881,277 | |||||||
Transportation - 1.2% | |||||||
| 450,000 | Consolidated Rail Corp. | ||||||
9.75%, 06/15/20 | Baa2 | 620,017 | |||||
| 255,000 | Union Pacific Corp. | ||||||
5.38%, 06/01/33 | Baa2 | 232,439 | |||||
| 250,000 | Union Pacific Corp. | ||||||
6.63%, 02/01/08 | Baa2 | 277,509 | |||||
| 1,129,965 | |||||||
Total Corporate Notes and Bonds | 69,750,461 | ||||||
(Cost $67,312,087) | |||||||
ASSET-BACKED AND MORTGAGE-BACKED SECURITIES (h) - 6.3% | |||||||
| 1,000,000 | American Airlines, Inc., | ||||||
Pass-Through Trust, | |||||||
Series 1991 - C2 | |||||||
9.73%, 09/29/14 | Caa2 | 725,450 | |||||
| 570,000 | Bear Stearns Commercial Mortgage | ||||||
Securities, Inc., Series 2002-PBW1, | |||||||
Class A2 | |||||||
4.72%, 11/11/35 | Aaa | 573,475 | |||||
| $ 250,000 | Bear Stearns Mortgage | ||||||
Securities, Inc., Series 1999-WF2, | |||||||
Class A2, CMO | |||||||
7.08%, 06/15/09 | Aaa | $ | 284,324 | ||||
| 300,000 | Citibank Credit Card Issuance | ||||||
Trust, Series 2000-Cl, CMO | |||||||
6.88%, 11/16/09 | Aaa | 341,611 | |||||
| 500,000 | General Electric Capital | ||||||
Commercial Mortgage Corp., | |||||||
Series 2002-1A, Class A3 | |||||||
6.27%, 12/10/35 | Aaa | 553,198 | |||||
| 70,246 | Green Tree Recreation | ||||||
Equipment & Consumer Trust, | |||||||
Series 1997-B, Class A1, CMO (d) | |||||||
6.55%, 07/15/28 | AAA | 70,347 | |||||
| 500,000 | GS Mortgage Securities Corp II, | ||||||
Series 1997-GL, Class A2D | |||||||
6.94%, 07/13/30 | Aaa | 558,178 | |||||
| 250,000 | MBNA Master Credit Card Trust, | ||||||
Series 1995-C, Class A | |||||||
6.45%, 02/15/08 | Aaa | 266,531 | |||||
| 250,000 | Morgan Stanley Dean Witter Capital I, | ||||||
Series 2002-TOP7, Class B, CMO | |||||||
6.08%, 01/15/39 | Aa2 | 272,741 | |||||
| 750,000 | Morgan Stanley Dean Witter Capital I, | ||||||
Series 2003-T0P9, Class A2, CMO (d) | |||||||
4.74%, 11/13/36 | AAA | 751,353 | |||||
| 184,769 | Toyota Auto Receivables Owner Trust, | ||||||
Series 2002-B, Class A3 | |||||||
3.76%, 06/15/06 | Aaa | 187,126 | |||||
| 1,000,000 | Union Acceptance Corp., | ||||||
Series 2000-B, Class B | |||||||
7.73%, 01/08/08 | Aaa | 1,043,977 | |||||
| 189,892 | USAA Auto Owner Trust, | ||||||
Series 2000-1, Class A4 | |||||||
6.98%, 06/15/05 | Aaa | 191,800 | |||||
Total Asset-Backed and | |||||||
Mortgage-Backed Securities | 5,820,111 | ||||||
(Cost $6,065,722) | |||||||
FOREIGN GOVERNMENT OBLIGATIONS (i) - 2.9% | |||||||
| 450,000 | Province of British Columbia | ||||||
5.38%, 10/29/08 | Aa2 | 486,540 | |||||
| 550,000 | Province of Manitoba | ||||||
4.25%, 11/20/06 | Aa2 | 572,542 | |||||
| 500,000 | Province of Ontario | ||||||
2.63%, 12/15/05 | Aa2 | 503,435 | |||||
| 500,000 | Province of Quebec | ||||||
6.13%, 01/22/11 | A1 | 557,351 | |||||
| 450,000 | Province of Quebec | ||||||
7.00%, 01/30/07 | A1 | 505,089 | |||||
Total Foreign Government Obligations | 2,624,957 | ||||||
| (Cost $2,472,866) | |||||||
See Notes to Financial Statements.
F-4
ALLMERICA SECURITIES TRUST
PORTFOLIO OF INVESTMENTS, Continued • December 31, 2003
Par Value | Moody’s (Unaudited) | Value (Note 2) | |||||
FOREIGN BONDS (i) - 8.8% | |||||||
| $ 500,000 | Alberta Energy Co., Ltd. | ||||||
7.38%, 11/01/31 | Baa1 | $ | 593,779 | ||||
| 700,000 | British Sky Broadcasting Group, Plc | ||||||
7.30%, 10/15/06 | Baa3 | 779,428 | |||||
| 450,000 | British Telecom, Plc (g) | ||||||
8.13%, 12/15/10 | Baa1 | 547,594 | |||||
| 500,000 | Calpine Canada Energy Finance | ||||||
8.50%, 05/01/08 | Caa1 | 398,750 | |||||
| 355,000 | Canadian Pacific, Ltd. | ||||||
9.45%, 08/01/21 | Baa2 | 483,893 | |||||
| 450,000 | Canadian Pacific Railroad | ||||||
5.75%, 03/15/33 | Baa2 | 435,626 | |||||
| 790,000 | Royal Bank of Scotland Group, Plc | ||||||
4.70%, 07/03/18 | Aa3 | 728,888 | |||||
| 450,000 | Sappi Papier Holding AG (c) | ||||||
6.75%, 06/15/12 | Baa2 | 491,912 | |||||
| 1,000,000 | St. George Bank, Ltd., Yankee Debenture (c) | ||||||
7.15%, 10/15/05 | A3 | 1,084,355 | |||||
| 435,000 | Stora Enso Oyj | ||||||
7.38%, 05/15/11 | Baa1 | 503,336 | |||||
| 500,000 | Telus Corp. | ||||||
7.50%, 06/01/07 | Ba1 | 559,572 | |||||
| 490,000 | Tyco International Group S.A. | ||||||
6.38%, 10/15/11 | Ba2 | 523,688 | |||||
| 450,000 | Vodafone Group, Plc | ||||||
5.38%, 01/30/15 | A2 | 454,169 | |||||
| 500,000 | Vodafone Group, Plc | ||||||
6.25%, 11/30/32 | A2 | 509,955 | |||||
Total Foreign Bonds | 8,094,945 | ||||||
(Cost $7,829,340) | |||||||
MUNICIPAL OBLIGATIONS - 0.8% | |||||||
| 750,000 | Illinois State General Obligation | ||||||
3.85%, 06/01/13 | Aa3 | 700,342 | |||||
Total Municipal Obligations | 700,342 | ||||||
(Cost $748,583) | |||||||
Shares | |||||||
INVESTMENT COMPANY - 1.0% | |||||||
| 929,365 | Marshall Money Market Fund | NR | 929,365 | ||||
Total Investment Company | 929,365 | ||||||
(Cost $929,365) | |||||||
Total Investments - 99.3% | 90,825,286 | ||||||
(Cost $88,306,255) | |||||||
Net Other Assets and Liabilities - 0.7% | 632,939 | ||||||
Total Net Assets - 100.0% | $ | 91,458,225 | |||||
| (a) | All or a portion of this security is out on loan at December 31, 2003; the value of the securities loaned amounted to $1,891,692 The value of collateral amounted to $1,939,350 which consisted of cash equivalents. |
| (b) | Variable rate security. The rate shown reflects rate in effect at period end. |
| (c) | Security exempt from registration under Rule 144A of the Securities Act of 1933. This security may be resold in transactions exempt from registration, to qualified institutional buyers. At December 31, 2003 these securities amounted to $5,530,768 or 6.0% of net assets. |
| (d) | Standard & Poor’s (S&P) credit ratings are used in the absence of a rating by Moody’s Investors, Inc. |
| (e) | Security is valued by management (Note 2). |
| (f) | Restricted Security - Represents ownership in a private placement investment which has not been registered with the Securities and Exchange Commission under the Securities Act of 1933. At December 31, 2003, these securities amounted to $355,683 or 0.4% of net assets. |
| (g) | Debt obligation initially issued in coupon form which converts to a higher coupon form at a specified date and rate. The rate shown is the rate at period end. The maturity date shown is the ultimate maturity. |
| (h) | Pass Through Certificates. |
| (i) | U.S. currency denominated. |
| CMO | Collateralized Mortgage Obligation. |
| MTN | Medium Term Note. |
| NR | Not Rated. |
FEDERAL INCOME TAX INFORMATION (SEE NOTE 2)
At December 31, 2003, the aggregate cost of investment securities for tax purposes was $88,935,555. Net unrealized appreciation (depreciation) aggregated $1,889,731, of which $3,069,973 related to appreciated investment securities and $(1,180,242) related to depreciated investment securities.
As of December 31, 2003, the components of distributable earnings (excluding unrealized appreciation disclosed above) on a tax basis consisted of $6,241,075 of capital loss carryforwards.
For the year ended December 31, 2003, the Portfolio has elected to defer $872,122 of capital losses attributable to Post-October losses.
During the year ended December 31, 2003, the tax character of distributions paid for ordinary income was $4,854,653.
At December 31, 2003, the Portfolio had capital loss carryforwards which expire as follows: $1,365,128 in 2008; $2,362,884 in 2009; $2,513,063 in 2010.
See Notes to Financial Statements.
F-5
ALLMERICA SECURITIES TRUST
PORTFOLIO OF INVESTMENTS, Continued • December 31, 2003
OTHER INFORMATION
For the year ended December 31, 2003, the aggregate cost of purchases and the proceeds of sales, other than from short-term investments, included $50,749,143 and $30,059,726 of non-governmental issuers, respectively, and $39,431,542 and $57,748,767 of U.S Government and Agency issuers, respectively.
The composition of ratings of both long-term and short-term debt holdings as a percentage of total value of investments in securities is as follows:
Moody’s Rating
(Unaudited)
Aaa | 7.9 | % | |
Aa | 22.5 | % | |
A | 24.8 | % | |
Baa | 28.1 | % | |
Ba | 9.6 | % | |
B | 0.7 | % | |
Caa | 1.2 | % | |
NR (Not Rated) | 2.8 | % | |
| 97.6 | % | ||
S&P Ratings
(Unaudited)
AAA | 0.9 | % | |
BBB | 0.7 | % | |
BB | 0.8 | % | |
| 2.4 | % | ||
See Notes to Financial Statements.
F-6
ALLMERICA SECURITIES TRUST
STATEMENT OF ASSETS AND LIABILITIES • December 31, 2003
ASSETS: | ||||
Investments: | ||||
Investments at cost | $ | 88,306,255 | ||
Net unrealized appreciation | 2,519,031 | |||
Total investments at value† | 90,825,286 | |||
Cash | 12,094 | |||
Short-term investments held as collateral for securities loaned | 1,939,350 | |||
Interest receivable | 1,278,150 | |||
Total Assets | 94,054,880 | |||
LIABILITIES: | ||||
Payable for investments purchased | 523,002 | |||
Collateral for securities loaned | 1,939,350 | |||
Management fee payable | 36,691 | |||
Trustees’ fees and expenses payable | 5,177 | |||
Accrued expenses and other payables | 92,435 | |||
Total Liabilities | 2,596,655 | |||
NET ASSETS | $ | 91,458,225 | ||
NET ASSETS consist of: | ||||
Par Value | $ | 8,592,306 | ||
Paid-in capital | 88,089,385 | |||
Distribution in excess of net investment income | (629,300 | ) | ||
Accumulated net realized loss | (7,113,197 | ) | ||
Net unrealized appreciation | 2,519,031 | |||
TOTAL NET ASSETS | $ | 91,458,225 | ||
Shares of beneficial interest outstanding (10,000,000 authorized shares with par value of $1.00) | 8,592,306 | |||
NET ASSET VALUE | ||||
Per share | $ | 10.644 | ||
MARKET VALUE (closing price on New York Stock Exchange) | ||||
Per share | $ | 9.75 | ||
†Total value of securities on loan | $ | 1,891,692 | ||
See Notes to Financial Statements.
F-7
ALLMERICA SECURITIES TRUST
STATEMENT OF OPERATIONS • For the Year Ended December 31, 2003
INVESTMENT INCOME | |||
Interest | $ | 4,795,582 | |
Securities lending income | 6,248 | ||
Total investment income | 4,801,830 | ||
EXPENSES | |||
Management fees | 407,059 | ||
Custodian and Fund accounting fees | 64,348 | ||
Transfer agent fees | 63,191 | ||
Legal fees | 2,726 | ||
Audit fees | 21,887 | ||
Trustees’ fees and expenses | 14,772 | ||
Reports to shareholders | 16,868 | ||
New York Stock Exchange fees | 22,874 | ||
Miscellaneous | 8,730 | ||
Total expenses | 622,455 | ||
NET INVESTMENT INCOME | 4,179,375 | ||
NET REALIZED AND UNREALIZED GAIN (LOSS) ON INVESTMENTS: | |||
Net realized gain on investments sold | 863,113 | ||
Net change in unrealized appreciation (depreciation) of investments | 436,219 | ||
NET GAIN ON INVESTMENTS | 1,299,332 | ||
NET INCREASE IN NET ASSETS RESULTING FROM OPERATIONS | $ | 5,478,707 | |
STATEMENTS OF CHANGES IN NET ASSETS
| Years Ended December 31, | ||||||||
| 2003 | 2002 | |||||||
NET ASSETS at beginning of year | $ | 90,834,171 | $ | 90,773,702 | ||||
INCREASE (DECREASE) IN NET ASSETS RESULTING FROM OPERATIONS: | ||||||||
Net investment income | 4,179,375 | 4,857,694 | ||||||
Net realized gain (loss) on investments sold | 863,113 | (2,344,097 | ) | |||||
Net change in unrealized appreciation (depreciation) of investments | 436,219 | 2,573,374 | ||||||
Net increase in net assets resulting from operations | 5,478,707 | 5,086,971 | ||||||
Distributions To Shareholders From Net Investment Income | (4,854,653 | ) | (5,026,502 | ) | ||||
Total increase in net assets | 624,054 | 60,469 | ||||||
NET ASSETS at end of year | $ | 91,458,225 | $ | 90,834,171 | ||||
Distribution in excess of net investment income | $ | (629,300 | ) | $ | (376,040 | ) | ||
See Notes to Financial Statements.
F-8
ALLMERICA SECURITIES TRUST
FINANCIAL HIGHLIGHTS - For a Share Outstanding Throughout Each Year
| Year ended December 31, | ||||||||||||||||||||
| 2003 | 2002 | 2001(1) | 2000 | 1999 | ||||||||||||||||
Net Asset Value, beginning of year | $ | 10.572 | $ | 10.565 | $ | 10.866 | $ | 10.958 | $ | 11.961 | ||||||||||
Income from Investment Operations: | ||||||||||||||||||||
Net investment income | 0.486 | 0.565 | 0.673 | (2) | 0.802 | 0.802 | ||||||||||||||
Net realized and unrealized gain (loss) on investments | 0.151 | 0.027 | (0.209 | ) | (0.084 | ) | (0.965 | ) | ||||||||||||
Total from investment operations | 0.637 | 0.592 | 0.464 | 0.718 | (0.163 | ) | ||||||||||||||
Less Distributions: | ||||||||||||||||||||
Dividends from net investment income | (0.565 | ) | (0.585 | ) | (0.729 | ) | (0.800 | ) | (0.800 | ) | ||||||||||
Distributions from net realized capital gains | — | — | — | (0.010 | ) | (0.040 | ) | |||||||||||||
Return of capital | — | — | (0.036 | ) | — | — | ||||||||||||||
Total distributions | (0.565 | ) | (0.585 | ) | (0.765 | ) | (0.810 | ) | (10.840 | ) | ||||||||||
Net increase (decrease) in net asset value | 0.072 | 0.007 | (0.301 | ) | (0.092 | ) | (1.003 | ) | ||||||||||||
Net Asset Value, end of year | $ | 10.644 | $ | 10.572 | $ | 10.565 | $ | 10.866 | $ | 10.958 | ||||||||||
Market Value, end of year | $ | 9.75 | $ | 9.45 | $ | 9.83 | $ | 10.00 | $ | 8.81 | ||||||||||
Total Return on Market Value, end of year | 9.38 | % | 2.11 | % | 6.00 | % | 23.76 | % | (13.75 | )% | ||||||||||
Ratios/Supplemental Data | ||||||||||||||||||||
Net assets, end of year (000’s) | $ | 91,458 | $ | 90,834 | $ | 90,774 | $ | 93,362 | $ | 94,157 | ||||||||||
Ratios to average net assets: | ||||||||||||||||||||
Net investment income | 4.56 | % | 5.38 | % | 6.23 | % | 7.38 | % | 7.00 | % | ||||||||||
Operating expenses | 0.68 | % | 0.86 | % | 0.79 | % | 0.74 | % | 0.77 | % | ||||||||||
Management fee | 0.44 | % | 0.45 | % | 0.50 | % | 0.50 | % | 0.49 | % | ||||||||||
Portfolio turnover rate | 98 | % | 79 | % | 128 | % | 58 | % | 24 | % | ||||||||||
| (1) | Effective January 1, 2001, the Trust adopted the provisions of the AICPA Audit and Accounting Guide for Investment Companies and is amortizing premium and market discount on debt securities using the daily effective yield method. The effect of this change for the year ended December 31, 2001 was a decrease in net investment income per share of $0.022, an increase in net realized and unrealized gains and losses per share of $0.022 and a decrease in the ratio of net investment income to average net assets from 6.36% to 6.23%. Per share data and ratio/supplemental data for periods prior to January 1, 2001 have not been restated to reflect this change in presentation. |
| (2) | Computed using average shares throughout the period. |
See Notes to Financial Statements.
F-9
ALLMERICA SECURITIES TRUST
NOTES TO FINANCIAL STATEMENTS
| 1. | ORGANIZATION |
Allmerica Securities Trust (the “Trust”) was organized as a Massachusetts business trust on June 30, 1986, and is registered under the Investment Company Act of 1940, as amended, as a diversified, closed-end management investment company.
| 2. | SIGNIFICANT ACCOUNTING POLICIES |
The preparation of financial statements in conformity with accounting principles generally accepted in the United States of America requires management to make estimates and assumptions at the date of the financial statements. Actual results could differ from those estimates.
The following is a summary of significant accounting policies followed by the Trust in the preparation of its financial statements:
Security Valuation: Corporate debt securities and debt securities of the U.S. Government and its agencies (other than short-term investments) are valued using an independent pricing service approved by the Board of Trustees which utilizes market quotations and transactions, quotations from dealers and various relationships among securities in determining value. If not valued by a pricing service, such securities are valued at prices obtained from independent brokers. Investments with prices that cannot be readily obtained are carried at fair value as determined in good faith under consistently applied procedures established by and under the supervision of the Board of Trustees. Short-term investments that mature in 60 days or less are valued at amortized cost. This method involves valuing a portfolio security initially at its cost and thereafter assumes a constant amortization to maturity of any discount or premium.
At December 31, 2003, one security with a value of $355,683 or 0.4% of net assets was valued by management under the direction of the Board of Trustees.
Security Transactions and Investment Income: Security transactions are recorded as of the trade date. Realized gains and losses from security transactions are determined on the basis of identified cost. Interest income, including amortization of premium and accretion of discount on securities, is accrued daily. Income distributions earned by the Trust from investments in certain investment companies are recorded as interest income in the accompanying financial statements.
Federal Taxes: The Trust intends to continue to qualify as a “regulated investment company” under Subchapter M of the Internal Revenue Code of 1986, as amended. By so qualifying, the Trust will not be subject to Federal income taxes to the extent it distributes all of its taxable income and net realized gains, if any, for its fiscal year. In addition, by distributing during each calendar year substantially all of its net investment income, capital gains and certain other amounts, if any, the Trust will not be subject to Federal excise tax. Therefore, no Federal income tax provision is required.
Distributions to Shareholders: Dividends to shareholders resulting from net investment income are recorded on the ex-dividend date and paid quarterly Net realized capital gains, if any, are distributed at least annually. Income and capital gains distributions are determined in accordance with income tax regulations. Differences between book basis and tax basis amounts are primarily due to differing book and tax treatments in both the timing of the recognition of losses deferred due to wash sales and differing treatments for the amortization of premium and market discount. Permanent book and tax basis differences relating to shareholder distributions will result in reclassifications to paid in capital. Permanent book-tax differences, if any, are not included in ending undistributed net investment income for the purpose of calculating net investment income per share in the Financial Highlights.
Securities Lending: The Trust, using Investors Bank & Trust Company (“IBT”) as its lending agent, may loan securities to brokers and dealers in exchange for negotiated lenders’ fees. These fees are disclosed as “Securities lending income” in the Statement of Operations. The Trust receives collateral against the loaned securities, which must be maintained at not less than 102% of the market value of the loaned securities during the period of the loan. Collateral received is generally
F-10
ALLMERICA SECURITIES TRUST
NOTES TO FINANCIAL STATEMENTS (Continued)
cash, and is invested in short term investments. Lending portfolio securities involves possible delays in receiving additional collateral or in the recovery of the securities or possible loss of rights in the collateral. Information regarding the value of the securities loaned and the value of the collateral at period end is included in a footnote at the end of the Trust’s Portfolio of Investments.
Expenses: Most expenses of the Trust can be directly attributable to the Trust. Expenses which cannot be directly attributable to the Trust are allocated based upon relative net assets among the Trust and one other affiliated registered investment company, Allmerica Investment Trust (comprised of nine separate portfolios).
| 3. | INVESTMENT MANAGEMENT AND OTHER RELATED PARTY TRANSACTIONS |
Opus Investment Management, Inc., a direct, wholly-owned subsidiary of Allmerica Financial Corporation (“Allmerica Financial”) serves as Investment Manager to the Trust. For these services, the Trust pays Opus an aggregate monthly compensation at the annual rate of (a) 3/10 of 1% of average net assets plus (b) 2-1/2% of the amount of interest income.
To the extent that normal operating expenses of the Trust, excluding taxes, interest, brokerage commissions and extraordinary expenses, but including the investment management fee, exceed 1.50% of the first $30,000,000 of the Trust’s average weekly net assets, and 1.00% of any excess of such value over $30,000,000, Opus will bear such excess expenses.
IBT performs fund administration, custodian and fund accounting services for the Trust. IBT is entitled to receive a fee for these services, in addition to certain out-of-pocket expenses. Opus is solely responsible for the payment of the administration fee and the Trust pays the fees for the fund accounting and custodian services to IBT.
The Trust pays no salaries or compensation to any of its officers. Trustees who are not directors, officers or employees of the Trust or the Investment Manager are reimbursed for their travel expenses in attending meetings of the Trustees and receive fees for their services. Such amounts are paid by the Trust.
| 4. | SHARES OF BENEFICIAL INTEREST |
There are 10,000,000 shares of $1.00 par value common stock authorized. At December 31, 2003, First Allmerica Financial Life Insurance Company, an indirect, wholly-owned subsidiary of Allmerica Financial, the Trustees and the officers of the Trust owned in the aggregate 121,553 shares of beneficial interest.
| 5. | RESTRICTED SECURITIES |
At December 31, 2003, the Trust owned the following restricted security constituting 0.4% of net assets, which may not be publicly sold without registration under the Securities Act of 1933. The Trust would bear the registration costs in connection with the disposition of restricted securities held in the portfolio. The Trust does not have the right to demand that such securities be registered. The value of restricted securities is determined by valuations supplied by a pricing service or brokers or, if not available, in good faith by or at the direction of the Board of Trustees. Additional information on the restricted security is as follows:
Issuer | Date of Acquisition | Par Amount | Cost at Acquisition | Value | |||||||
Jones (Edward D.) & Co., LP | 05/06/94 | $ | 333,153 | $ | 333,153 | $ | 355,683 | ||||
F-11
ALLMERICA SECURITIES TRUST
REPORT OF INDEPENDENT AUDITORS
To the Board of Trustees and Shareholders of Allmerica Securities Trust
In our opinion, the accompanying statement of assets and liabilities, including the portfolio of investments (except for Moody’s and S&P Ratings), and the related statements of operations and of changes in net assets and the financial highlights present fairly, in all material respects, the financial position of the Allmerica Securities Trust (hereafter referred to as the “Trust”) at December 31, 2003, the results of its operations, the changes in its net assets, and the financial highlights for the periods indicated, in conformity with accounting principles generally accepted in the United States of America .These financial statements and financial highlights (hereafter referred to as “financial statements”) are the responsibility of the Trust’s management; our responsibility is to express an opinion on these financial statements based on our audits. We conducted our audits of these financial statements in accordance with auditing standards generally accepted in the United States of America, which require that we plan and perform the audit to obtain reasonable assurance about whether the financial statements are free of material misstatement. An audit includes examining, on a test basis, evidence supporting the amounts and disclosures in the financial statements, assessing the accounting principles used and significant estimates made by management, and evaluating the overall financial statement presentation. We believe that our audits, which included confirmation of securities at December 31, 2003 by correspondence with the custodian and brokers, provide a reasonable basis for our opinion.
PricewaterhouseCoopers LLP
Boston, Massachusetts
February 2, 2004
F-12
ALLMERICA SECURITIES TRUST
BOARD OF TRUSTEES (Unaudited)
Name, Address and Age(1) | Position(s) Held with Trust | Term of | Principal Occupation(s) During | Number of Portfolios in Fund Complex Overseen by Trustee | Other Directorships Held | |||||
| P. Kevin Condron (58) | Trustee, Member of the Audit Committee and Fund Operations Committee | 1 Year Term
Served Since 1998 | President and Chief Executive Officer, The Granite Group (wholesale plumbing and heating), 1997-present. | 10 | Director, Banknorth Group. | |||||
| Jocelyn S. Davis (50) | Trustee, Member of the Audit Committee and Fund Operations Committee | 1 Year Term
Served Since 2001 | President, Nelson Hart, LLC (consulting), 2002-present; Beers & Cutler (professional services), 2001-2002; Chief Financial Officer, AARP (non-profit), 1996-2001. | 10 | None | |||||
| Cynthia A. Hargadon (49) | Trustee, Member of the Fund Operations Committee, Investment Operations Committee and Governance Committee | 1 Year Term
Served Since 1997 | President and Chief Investment Officer, PlanTools, LLC (consulting), 2003-present; Managing Director, McHenry Group, 2003-present; President, Hargadon Associates (asset management consulting), 2002-2003; President, Potomac Asset Management, Inc., 2000-2002; Director of Investments, National Automobile Dealers Association, 1999-2000; President, Stable Value Investment Association (investment trade group), 1996-1999. | 10 | Director, Wilshire Target Funds, 2001-present. | |||||
| T. Britton Harris, IV (45) | Trustee, Member of the Investment Operations Committee, Governance Committee and Fund Operations Committee | 1 Year Term
Served Since 2001 | President, Verizon Investment Management Corporation, 1990-present. | 10 | None | |||||
| Gordon Holmes (65) | Trustee, Chairman of the Audit Committee and Member of the Fund Operations Committee | 1 Year Term
Served Since 1991 | Instructor at Bentley College, 1998-present; Certified Public Accountant; Retired Partner, Tofias, Fleishman, Shapiro & Co., P.C. (Accountants). | 10 | None | |||||
| Attiat F. Ott (68) | Trustee, Chairman of the Fund Operations Committee and Member of the Audit Committee | 1 Year Term
Served Since 1982 | Professor of Economics and Director of the Institute for Economic Studies, Clark University, 940 Main Street, Worcester, MA. | 10 | None | |||||
| Ranne P. Warner (59) | Trustee, Chairman of the Governance Committee, Member of the Fund Operations Committee and Investment Operations Committee | 1 Year Term
Served Since 1991 | President, Centros Properties, USA; Owner, Ranne P. Warner and Company; Blackstone Exchange LLC (real estate) 2001-present. | 10 | Director, Wainwright Bank & Trust Co. (commercial bank). | |||||
| *Mark A. Hug (46) | Trustee, Member of the Investment Operations Committee | 1 Year Term
Served Since 2003 | President and CEO, First Allmerica Financial Life Insurance Company (“First Allmerica”) and Allmerica Financial Life Insurance and Annuity Company (“Allmerica Financial Life”), 2000-present; Senior Vice President, Equitable Life (product and marketing) prior to 1999. | 10 | None | |||||
F-13
ALLMERICA SECURITIES TRUST
BOARD OF TRUSTEES (Unaudited) (Continued)
Name, Address and Age(1) | Position(s) Held with Trust | Term of | Principal Occupation(s) During | Number of Portfolios in Fund Complex Overseen by Trustee | Other Directorships Held | |||||
| *John P. Kavanaugh (49) | Chairman, Trustee and President, Chairman of the Investment Operations Committee | 1 Year Term
Served Since 1995 | President, Opus Investment Management, Inc.; Vice President, Director, Chief Investment Officer, First Allmerica and Allmerica Financial Life. | 10 | None |
| * | Messrs. Hug and Kavanaugh are “interested persons”, as defined in the Investment Company Act of 1940 as amended, of the Trust and of Allmerica Financial Corporation (“AFC”) because of their affiliations with AFC. |
| (1) | The business address of each person is 440 Lincoln Street, Worcester, Massachusetts 01653. |
| (2) | Except as otherwise noted, each individual has held the office indicated or other offices in the same organization for the last five years. |
F-14
ALLMERICA SECURITIES TRUST
REGULATORY DISCLOSURES (Unaudited)
The performance data quoted represents past performance and the investment return and principal value of an investment will fluctuate so that an investor’s shares, when redeemed, may be worth more or less than their original cost.
This report is authorized for distribution to existing shareholders of Allmerica Securities Trust.
SHAREHOLDER TAX INFORMATION (Unaudited)
The portion of the Trust dividends that was derived from U.S. Government obligations in 2003 and may be exempt from state income taxation is 10.65%. The states of California, Connecticut, New York, and New Jersey have exclusionary provisions; however, each of these states has a threshold requirement that must be met before the exclusion applies. During 2003, the level of exempt income did not meet these thresholds and the exclusions did not apply. All other states and the District of Columbia do not tax dividends attributable to U.S. Government obligations within the Trust.
Certain states also require, for intangible tax reporting purposes, the reporting of the percentage of assets invested in either state specific or state specific and federal obligations. The percentage applicable to the states of Florida and Kansas is 3.09%. The percentage applicable to the state of West Virginia, which is only for amounts invested in West Virginia obligations, is 0%.
SHAREHOLDER INFORMATION (Unaudited)
Automatic Dividend Investment Plan: As a shareholder, you may participate in the Trust’s Automatic Dividend Investment Plan. Under the plan, dividends and other distributions are automatically invested in additional full and fractional shares of the Trust to be held on deposit in your account. Such dividends and other distributions are invested at the net asset value if lower than market price plus brokerage commission or, if higher, at the market price plus brokerage commission. You will receive a statement after each payment date for a dividend or other distribution that will show the details of the transaction and the status of your account. You may terminate or rejoin at any time.
Cash Investment Plan: The cash investment plan provides a systematic, convenient and inexpensive means to increase your investment in the Trust by putting your cash to work .The plan permits you to invest amounts ranging from $25 to $1,000 in any one month to purchase additional shares of the Trust. Regular monthly investment is not required.
Your funds are consolidated with funds of other participants to purchase shares. Shares are purchased in bulk and you realize the commission savings. You pay only a service charge of $1.00 per transaction and your proportionate share of the brokerage commission.
Your account will be credited with full and fractional shares purchased. Following each investment, you will receive a statement showing the details of the transaction and the current status of the account. The plan is voluntary and you may terminate at any time.
Investment Manager: Opus Investment Management, Inc.
Portfolio Management: All investment decisions for the Trust will be made by an investment management team.
Investment Objectives: The Trust’s primary investment objective is to provide a high rate of current income, with capital appreciation as a secondary objective.
(There is no guarantee that the Trust will achieve its investment objectives and an investor in the Trust could lose money.)
F-15
ALLMERICA SECURITIES TRUST
SHAREHOLDER INFORMATION (Unaudited) (Continued)
Principal Investment Policies: The Trust seeks to achieve its objectives by investing in various types of fixed income securities with an emphasis on corporate debt obligations. Examples of the types of securities in which the Trust invests are corporate bonds, notes and debentures; mortgage-backed and asset-backed securities; obligations issued or guaranteed by the U.S. Government, its agencies and instrumentalities; and money market instruments. The Trust may invest up to 30% of its assets in high yield securities or “junk bonds” rated below investment grade but at least B- or higher by Moody’s Investors Services or Standard & Poor’s Rating Services or similar rating organizations, and in unrated securities determined by the Investment Manager to be of comparable quality. The Trust may invest up to 25% of its assets in U.S. dollar denominated foreign debt securities. The Trust may invest in securities with relatively long maturities as well as securities with shorter maturities.
Securities issued by some U.S. Government-sponsored entities, such as the Federal Home Loan Mortgage Corporation (Freddie Mac) and the Federal National Mortgage Association (Fannie Mae), are not backed by the full faith and credit of the U.S. Government. No assurances can be given that the U.S. Government would provide financial support to a U.S. Government-sponsored instrumentality if not obligated to do so.
Principal Risks of investing in the Trust:
| • | Company Risk means that investments in a company often fluctuate based on factors such as earnings, changes in management or products or potential for takeovers or acquisition. |
| • | Credit Risk is the risk that a fixed income security will not be able to pay interest and principal. “Junk bonds,” for example, have a high level of credit risk. |
| • | Foreign Investment Risk involves risks relating to political, social and economic developments abroad. |
| • | Interest Rate Risk means that, when interest rates rise, the prices of fixed income securities will generally fall and, when interest rates fall, the prices of fixed income securities will generally rise. |
| • | Investment Management Risk is the risk that a fund does not achieve its investment objective despite the investment strategies used by the investment managers. |
| • | Liquidity Risk is the risk that a fund will not be able to sell a security at a reasonable price because the security is not traded on a regular basis. |
| • | Market Risk is the risk that the price of a security will fall due to changes in economic, political or market conditions. |
| • | Prepayment Risk means that a fund may lose future interest income when a decline in interest rates causes homeowners to prepay their mortgage loans. |
F-16
[GRAPHIC]
THE ALLMERICA FINANCIAL COMPANIES
The Hanover Insurance Company Citizens Insurance Company of America Citizens Management Inc.
Opus Investment Management, Inc. AMGRO, Inc. Financial Profiles, Inc.
First Allmerica Financial Life Insurance Company Allmerica Financial Life Insurance and Annuity Company (all states except NY)
440 Lincoln Street, Worcester, Massachusetts 01653
| 10605 NS (12/03) | 04-003 |
| Item 2. | Code of Ethics |
As of the end of the period covered by this report, the registrant has adopted a code of ethics that applies to the registrant’s principal executive officer and principal financial/principal accounting officer.
| Item 3. | Audit Committee Financial Expert |
The registrant’s Board of Trustees has determined that Gordon Holmes, who is an “independent” Trustee, qualifies as an “audit committee financial expert” (as such term has been defined by SEC regulations).
The SEC has stated that the designation or identification of a person as an audit committee financial expert pursuant to this Item 3 of Form N-CSR does not impose on such person any duties, obligations or liability that are greater than the duties, obligations and liability imposed on such person as a member of the Audit Committee and the Board of Trustees in the absence of such designation or identification.
| Item 4. | Principal Accountant Fees and Services |
Audit Fees | Types of Services | Percentage of Services Approved by the Audit Committee under | ||||
2003 | $25,850 | 100% | ||||
2002 | $23,620 | 100% | ||||
Audit-Related Fees | ||||||
2003 | $0 | |||||
2002 | $0 | |||||
Tax Fees | ||||||
| $3,300 | Tax return review | |||||
2003 | $3,200 | 100% | ||||
2002 | 100% | |||||
All Other Fees | ||||||
2003 | $0 | |||||
2002 | $0 | |||||
All fees disclosed above under the captions “Audit-Related Fees,” “Tax Fees,” and “All Other Fees” represent fees billed for services that were required to be pre-approved, and which were so pre-approved, by the registrant’s Audit Committee in accordance with the Audit Committee’s Policy for Pre-Approval of Services Provided by Independent Auditors.
% of the hours expended on the independent accountants’ engagement on behalf of the registrant for the fiscal year ended December 31, 2003, were attributable to work performed by persons other than the independent accountants’ full-time, permanent employees. Not applicable
For the last two fiscal years of the registrant, the independent accountants billed aggregate non-audit fees in the following amounts to the registrant and Opus Investment Management, Inc. (“Opus”), the Trust’s investment adviser:
| 2002 | $0 | |
| 2003 | $0 | |
The registrant’s Audit Committee has determined that the provision by the registrant’s independent accountants of non-audit services that were rendered to Opus and that were not pre-approved by the Audit Committee were compatible with maintaining the independence of such accountants.
The Audit Committee has adopted certain policies and procedures for pre-approval of services provided by the independent accountants. On an annual basis, certain types of recurring audit, audit-related and other services are pre-approved by the Committee, including, among other things, the list of required audits and projects presented by the independent accountants; consultation and advisory services related to accounting/reporting and risk management/control matters provided in the normal course of business; and assistance with SEC and other regulatory filings and tax services incurred in the normal course of business. This pre-approval will occur concurrently with the approval of the annual audit fees and will apply to all individual projects meeting the criteria discussed above and which are expected to result in total fees less than $400,000. For individual projects outside the scope of the fiscal year audits and tax return filings expected to be $25,000 or greater, specific pre-approval will be necessary.
Pre-approvals for all other services will occur if and when the need for any such services arises. This pre-approval will be initiated by AFIMS and will be requested from the Chairman or, in the event the Chairman is unavailable, any other member of the Audit Committee. Any services approved by the Chairman, or other Audit Committee member, at any time other than during an Audit Committee meeting will be reported to the full Audit Committee at the next regularly scheduled meeting. Expenses permitted under Rule 2-01(c)(7)(i)(C) of Regulation S-X (the “De Minimis Exception”) will not require pre-approval.
The percentages of expenses that were approved by the Audit Committee in accordance with the De Minimis Exception were as follows: Not applicable
| 2003 | 2002 | |||
Audit-Related Fees | ||||
Tax Fees | ||||
All Other Fees |
| Item 5. | Audit Committee of Listed Registrants |
The registrant has a separately-designated standing audit committee established in accordance with Section 3(a)(58)(A) of the Securities Exchange Act of 1934, as amended. The members of the Audit Committee are Gordon Holmes (Chairman), P. Kevin Condron, Jocelyn S. Davis and Attiat F. Ott.
| Item 6. | Reserved. |
| Item 7. | Disclosure of Proxy Voting Policies and Procedures for Closed-End Management Investment Companies. |
Not Applicable. (The registrant invests exclusively in non-voting securities.)
| Item 8. | Reserved. |
| Item 9. | Controls and Procedures |
| (a) | The registrant’s principal executive and principal financial officers have concluded that, based on their evaluation of the effectiveness of the registrant’s disclosure controls and procedures (as defined in Rule 30a-3(c) under the Investment Company Act of 1940) as of the date within 90 days of the filing date of this report on Form N-CSR, such disclosure controls and procedures provide reasonable assurances that material information relating to the registrant is made known to them by the appropriate persons. |
| (b) | Changes to internal control over financial reporting: Not Applicable |
| Item 10. | Exhibits |
| (a) | Code of ethics that applies to the registrant’s principal executive officer and principal financial/principal accounting officer is attached as Exhibit 99.CODE. |
| (b)(1) | Separate certifications by the registrant’s principal executive officer and principal financial officer, pursuant to Section 302 of the Sarbanes-Oxley Act of 2002 and as required by Rule 30a-2(a) under the Investment Company Act of 1940, are attached hereto as Exhibit 99.CERT. |
| (2) | A certification by the registrant’s principal executive officer and principal financial officer, pursuant to Section 906 of the Sarbanes-Oxley Act of 2002 and as required by Rule 30a-2(b) under the Investment Company Act of 1940 is attached hereto as Exhibit 99.906CERT. |
Signatures
Pursuant to the requirements of the Securities Exchange Act of 1934 and the Investment Company Act of 1940, the registrant has duly caused this report to be signed on its behalf by the undersigned, thereunto duly authorized.
| Allmerica Securities Trust | ||
| By: | /s/ John P. Kavanaugh | |
John P. Kavanaugh President and Chairman | ||
Date: February 23, 2004
Pursuant to the requirements of the Securities Exchange Act of 1934 and the Investment Company Act of 1940, this report has been signed below by the following persons on behalf of the registrant and in the capacities and on the dates indicated.
| By: | /s/ John P. Kavanaugh | |
John P. Kavanaugh President and Chairman | ||
Date: February 23, 2004
| By: | /s/ Paul T. Kane | |
Paul T. Kane Assistant Vice President and Treasurer (Principal Accounting Officer and Principal Financial Officer) | ||
Date: February 23, 2004