Free signup for more
- Track your favorite companies
- Receive email alerts for new filings
- Personalized dashboard of news and more
- Access all data and search results
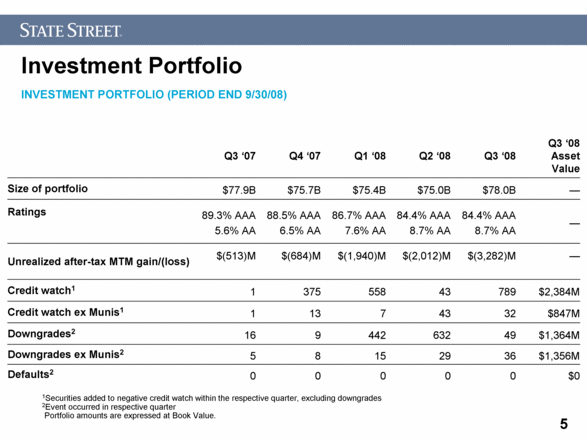
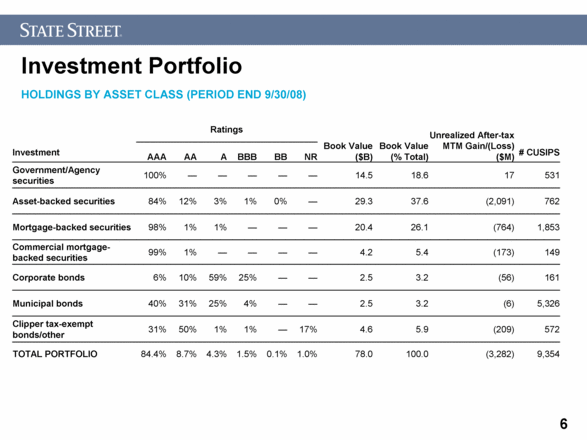
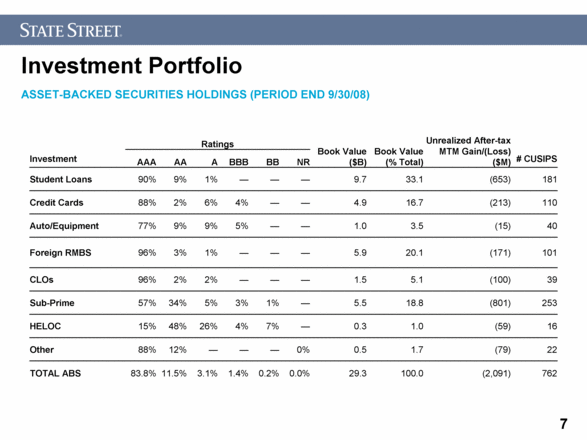
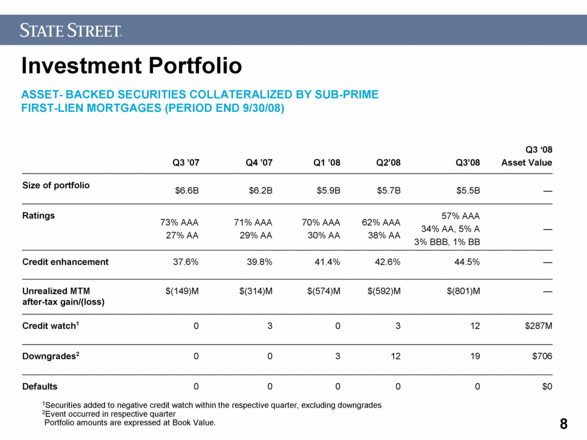
Filing tables
Filing exhibits
Related financial report
STT similar filings
- 10 Nov 08 Regulation FD Disclosure
- 31 Oct 08 Entry into a Material Definitive Agreement
- 17 Oct 08 Entry into a Material Definitive Agreement
- 15 Oct 08 Results of Operations and Financial Condition
- 19 Sep 08 Departure of Directors or Principal Officers
- 15 Jul 08 State Street Corporation Achieves Record Revenue of $2.7 Billion in the Second Quarter, Up 39% From A Year Ago
- 20 Jun 08 Departure of Directors or Principal Officers
Filing view
External links