Exhibit 99.1
Form of supporting exhibits outlining the presentations made on February 7, 2006.
We prepare our consolidated statement of income in accordance with accounting principles generally accepted in the United States, or “GAAP.” In order to provide information on a comparable basis from period to period and assist shareholders, analysts and other external parties and management in analyzing financial results and trends of ongoing businesses and operations, we present supplemental information on an “operating” basis. Operating-basis results are based on GAAP results, excluding the impact of significant, non-recurring transactions and activities, presented on a taxable-equivalent basis. We believe that such supplemental non-GAAP financial information facilitates an understanding and analysis of our ongoing activities and provides financial information in a format the presents comparable financial trends.
The presentation made to analysts and investors on February 7, 2006, provides information on our operating-basis results for the years ended December 31, 2005 and 2004. Following is a reconciliation of GAAP results to operating-basis results of operations.
| | | | | | | | | | | | Diluted | |
| | | | | | Income | | | | Income | | Earnings Per | |
| | | | Total | | Before | | Income | | From | | Share From | |
| | Total | | Operating | | Income Tax | | Tax | | Continuing | | Continuing | |
(Dollars in millions, except per share data) | | Revenue | | Expenses | | Expense | | Expense | | Operations | | Operations | |
| | | | | | | | | | | | | |
Year Ended December 31, 2005: | | | | | | | | | | | | | |
| | | | | | | | | | | | | |
Results in accordance with GAAP | | $ | 5,473 | | $ | 4,041 | | $ | 1,432 | | $ | 487 | | $ | 945 | | $ | 2.82 | |
| | | | | | | | | | | | | |
Taxable-equivalent adjustment (1) | | 42 | | — | | 42 | | 42 | | — | | — | |
| | | | | | | | | | | | | |
Operating results | | $ | 5,515 | | $ | 4,041 | | $ | 1,474 | | $ | 529 | | $ | 945 | | $ | 2.82 | |
| | | | | | | | | | | | | |
Year Ended December 31, 2004: | | | | | | | | | | | | | |
| | | | | | | | | | | | | |
Results in accordance with GAAP | | $ | 4,951 | | $ | 3,759 | | $ | 1,192 | | $ | 394 | | $ | 798 | | $ | 2.35 | |
| | | | | | | | | | | | | |
Taxable-equivalent adjustment (1) | | 45 | | — | | 45 | | 45 | | — | | — | |
| | | | | | | | | | | | | |
Merger and integration costs (2) | | — | | (62 | ) | 62 | | 21 | | 41 | | .12 | |
| | | | | | | | | | | | | |
Operating results | | $ | 4,996 | | $ | 3,697 | | $ | 1,299 | | $ | 460 | | $ | 839 | | $ | 2.47 | |
(1) Taxable-equivalent adjusted revenue is a method of presentation in which the tax savings achieved by investing in tax-exempt securities are included in interest income with a corresponding charge to income tax expense. This method provides better comparability between the performance of tax-exempt and taxable securities. The adjustment is computed using a federal income tax rate of 35%, adjusted for applicable state income taxes, net of the related federal tax benefit.
(2) Merger and integration costs related to the acquisition of a substantial portion of the Global Securities Services business of Deutsche Bank AG.
Searchable text section of graphics shown above
INVESTOR AND ANALYST MEETING
07 February 2006
[LOGO]
[GRAPHIC]
SETTING STATE STREET APART
Ronald E. Logue Chairman and Chief Executive Officer
[LOGO]
[LOGO]
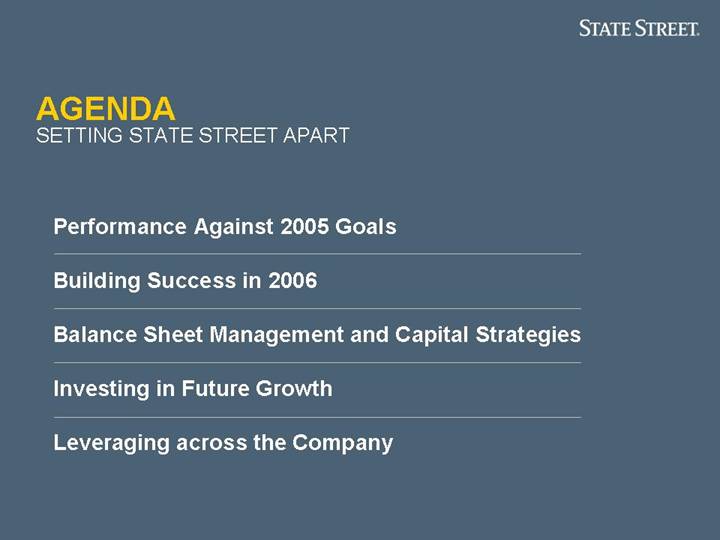
AGENDA
SETTING STATE STREET APART
Performance Against 2005 Goals
Building Success in 2006
Balance Sheet Management and Capital Strategies
Investing in Future Growth
Leveraging across the Company
2
REMINDER
This presentation includes discussion of State Street Corporation’s financial and business goals and strategies, which may be perceived as “forward-looking statements” as defined by federal securities laws. Actual results could differ materially, and there can be no assurance that goals will be achieved. For a discussion of some of the factors that may affect State Street’s results, please see the Corporation’s 2004 Annual Report on Form 10-K, especially the section captioned “Financial Goals and Factors That May Affect Them,” and any subsequent Securities and Exchange Commission filings. Those statements are based on current expectations and involve a number of risks and uncertainties, including those related to the pace at which State Street adds new clients or at which existing clients use additional services, the value of global and regional financial markets, the pace of cross-border investment activity, changes in interest rates, the pace of worldwide economic growth and rates of inflation, the extent of volatility in currency markets, consolidations among clients and competitors, State Street’s business mix, the dynamics of markets State Street serves, and State Street’s success at integrating and converting acquisitions into its business. Presentations used today are based upon the Corporation’s “operating basis” results. For a reconciliation of the Corporation’s results on an operating basis with results of operations in accordance with accounting principles generally accepted in the United States, please refer to http://investorrelations.statestreet.com.
3
[GRAPHIC]
PERFORMANCE AGAINST 2005 GOALS
Setting State Street Apart Investor and Analyst Meeting, 7 February 2006
SETTING STATE STREET APART
PERFORMANCE AGAINST 2005 GOALS
| | Annual Goals | | 2005 Actual | |
| | | | | |
A Consistent Earner | | Operating EPS growth of 10%–15% | | Operating EPS growth from continuing operations of 14.2% | |
| | | | | |
A Top-line Revenue Generator | | Operating revenue growth of 8%–12% | | Operating revenue growth of 10.4% | |
| | | | | |
A Prudent Allocator of Capital | | Operating ROE of 14%–17% | | Operating ROE from continuing operations of 15.3% | |
5
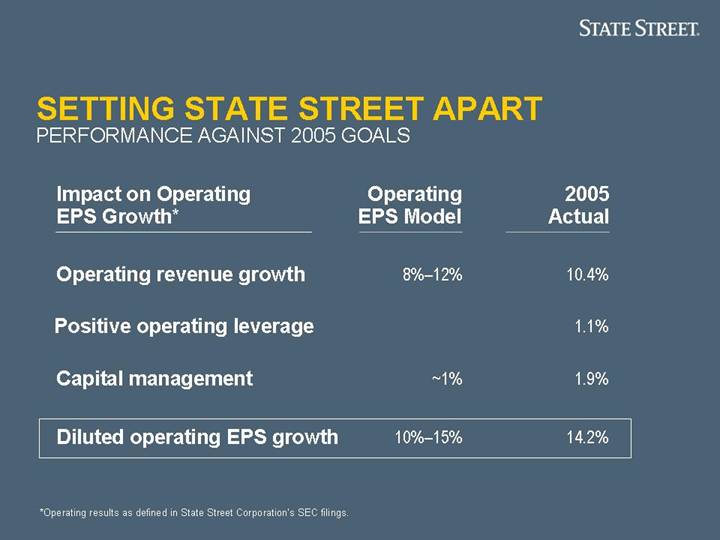
Impact on Operating | | Operating | | 2005 | |
EPS Growth* | | EPS Model | | Actual | |
| | | | | |
Operating revenue growth | | 8%–12 | % | 10.4 | % |
| | | | | |
Positive operating leverage | | | | 1.1 | % |
| | | | | |
Capital management | | ~1 | % | 1.9 | % |
| | | | | |
Diluted operating EPS growth | | 10%–15 | % | 14.2 | % |
*Operating results as defined in State Street Corporation’s SEC filings.
6
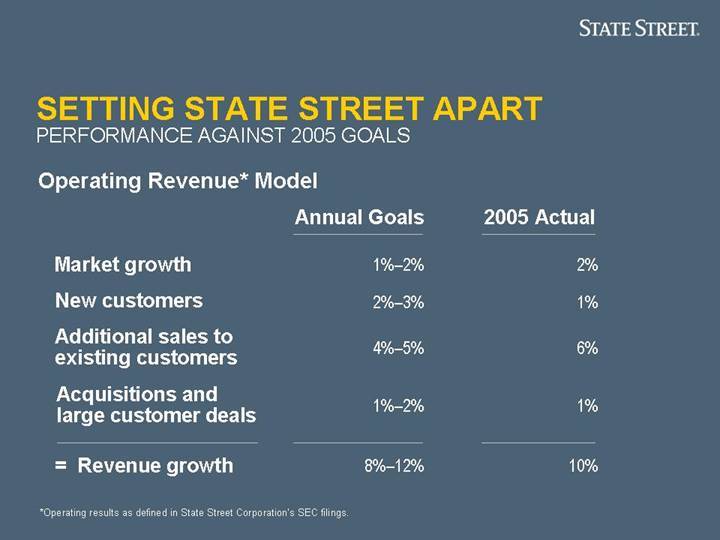
Operating Revenue* Model
| | Annual Goals | | 2005 Actual | |
| | | | | |
Market growth | | 1%–2 | % | 2 | % |
New customers | | 2%–3 | % | 1 | % |
Additional sales to existing customers | | 4%–5 | % | 6 | % |
Acquisitions and large customer deals | | 1%–2 | % | 1 | % |
| | | | | |
= Revenue growth | | 8%–12 | % | 10 | % |
*Operating results as defined in State Street Corporation’s SEC filings. | | | | | |
7
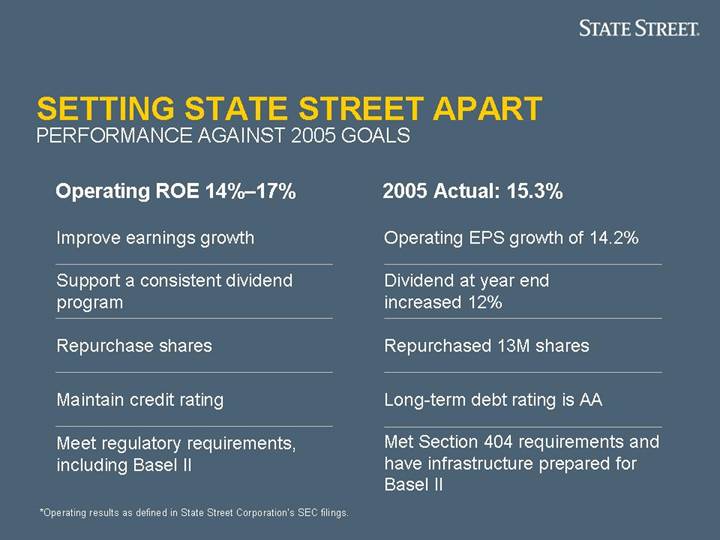
Operating ROE 14%–17% | | 2005 Actual: 15.3% |
| | |
Improve earnings growth | | Operating EPS growth of 14.2% |
| | |
Support a consistent dividend program | | Dividend at year end increased 12% |
| | |
Repurchase shares | | Repurchased 13M shares |
| | |
Maintain credit rating | | Long-term debt rating is AA |
| | |
Meet regulatory requirements, including Basel II | | Met Section 404 requirements and have infrastructure prepared for Basel II |
*Operating results as defined in State Street Corporation’s SEC filings.
8
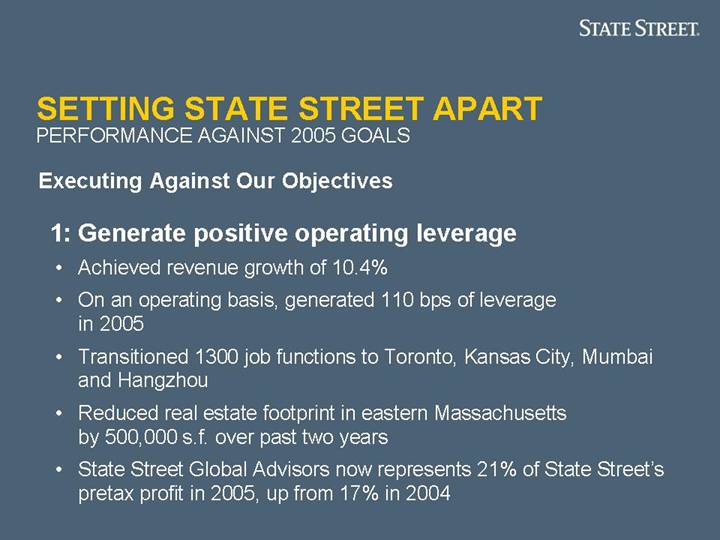
Executing Against Our Objectives
1: Generate positive operating leverage
• Achieved revenue growth of 10.4%
• On an operating basis, generated 110 bps of leverage in 2005
• Transitioned 1300 job functions to Toronto, Kansas City, Mumbai and Hangzhou
• Reduced real estate footprint in eastern Massachusetts by 500,000 s.f. over past two years
• State Street Global Advisors now represents 21% of State Street’s pretax profit in 2005, up from 17% in 2004
9
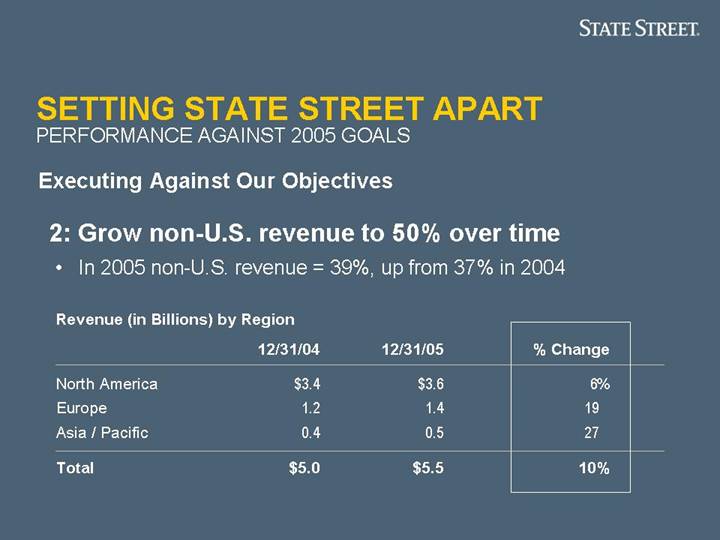
2: Grow non-U.S. revenue to 50% over time
• In 2005 non-U.S. revenue = 39%, up from 37% in 2004
Revenue (in Billions) by Region
| | 12/31/04 | | 12/31/05 | | % Change | |
North America | | $ | 3.4 | | $ | 3.6 | | 6 | % |
Europe | | 1.2 | | 1.4 | | 19 | |
Asia / Pacific | | 0.4 | | 0.5 | | 27 | |
Total | | $ | 5.0 | | $ | 5.5 | | 10 | % |
10
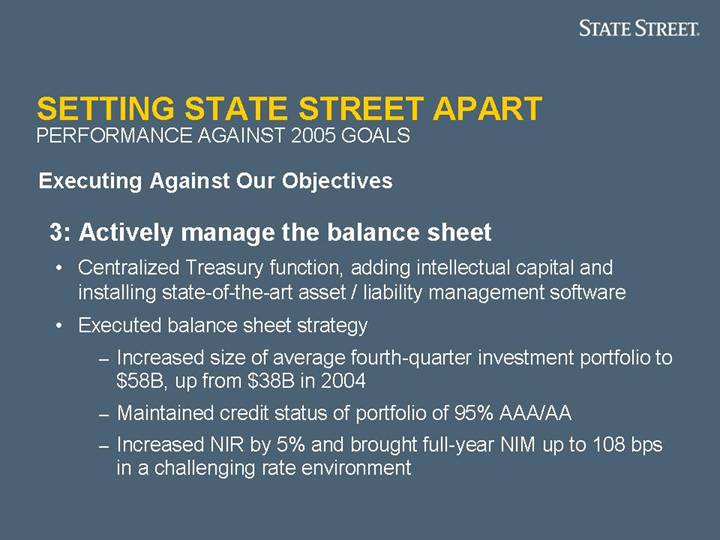
3: Actively manage the balance sheet
• Centralized Treasury function, adding intellectual capital and installing state-of-the-art asset / liability management software
• Executed balance sheet strategy
• Increased size of average fourth-quarter investment portfolio to $58B, up from $38B in 2004
• Maintained credit status of portfolio of 95% AAA/AA
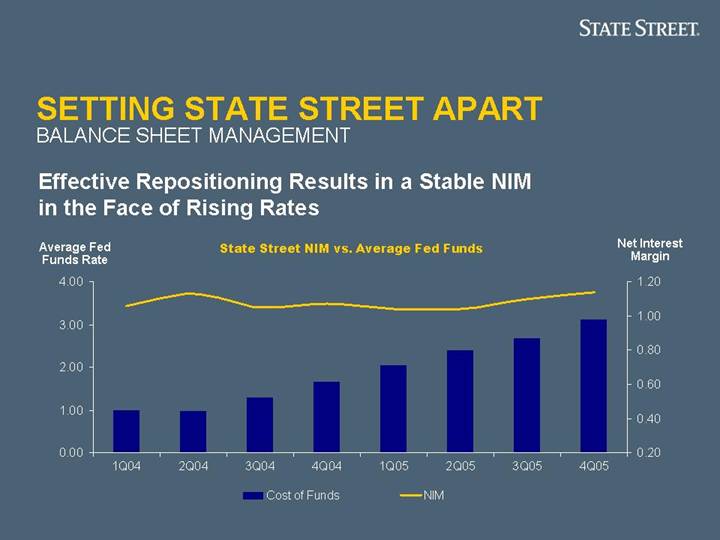
• Increased NIR by 5% and brought full-year NIM up to 108 bps in a challenging rate environment
11
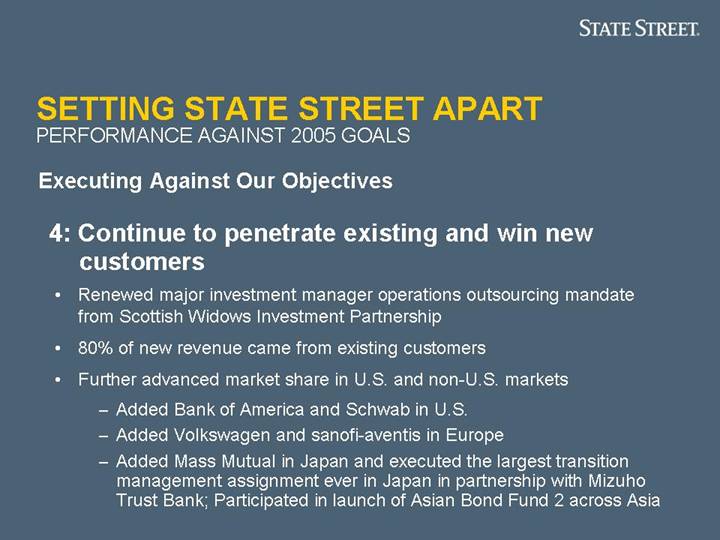
4: Continue to penetrate existing and win new customers
• Renewed major investment manager operations outsourcing mandate from Scottish Widows Investment Partnership
• 80% of new revenue came from existing customers
• Further advanced market share in U.S. and non-U.S. markets
• Added Bank of America and Schwab in U.S.
• Added Volkswagen and sanofi-aventis in Europe
• Added Mass Mutual in Japan and executed the largest transition management assignment ever in Japan in partnership with Mizuho Trust Bank; Participated in launch of Asian Bond Fund 2 across Asia
12
[GRAPHIC]
BUILDING SUCCESS IN 2006
Setting State Street Apart Investor and Analyst Meeting, 7 February 2006
SETTING STATE STREET APART
BUILDING SUCCESS IN 2006
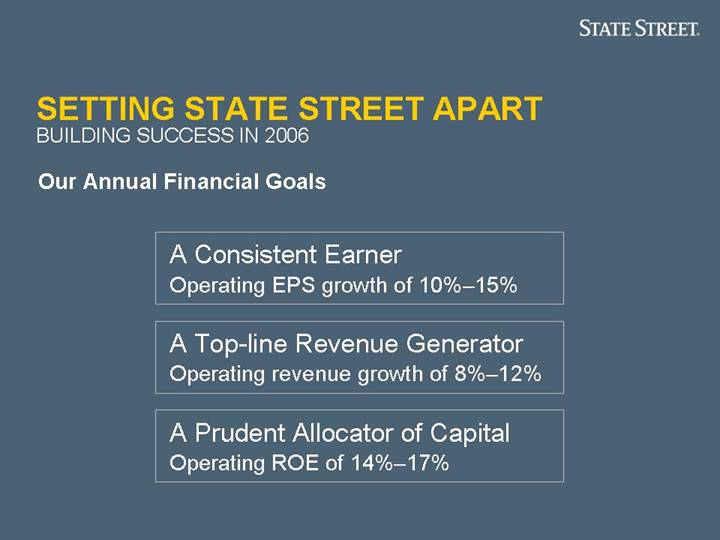
Our Annual Financial Goals
A Consistent Earner
Operating EPS growth of 10%–15%
A Top-line Revenue Generator
Operating revenue growth of 8%–12%
A Prudent Allocator of Capital
Operating ROE of 14%–17%
14
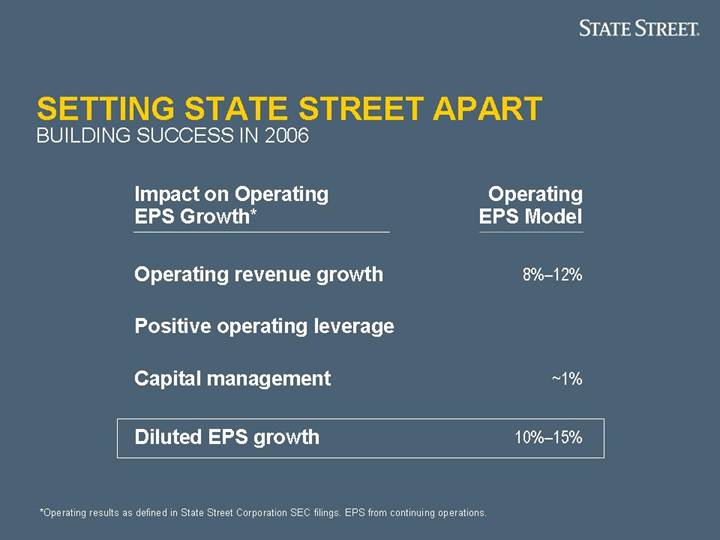
Impact on Operating | | Operating | |
EPS Growth* | | EPS Model | |
| | | |
Operating revenue growth | | 8%–12 | % |
| | | |
Positive operating leverage | | | |
| | | |
Capital management | | ~1 | % |
| | | |
Diluted EPS growth | | 10%–15 | % |
*Operating results as defined in State Street Corporation SEC filings. EPS from continuing operations.
15
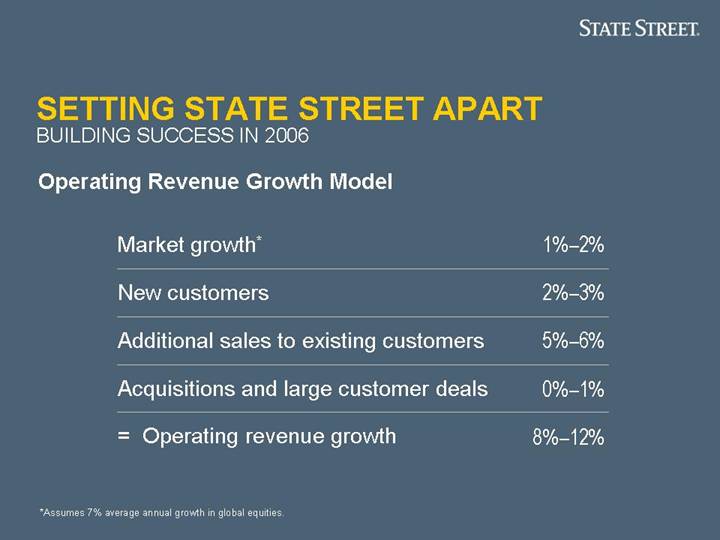
Operating Revenue Growth Model
Market growth* | | 1%–2% | |
New customers | | 2%–3% | |
Additional sales to existing customers | | 5%–6% | |
Acquisitions and large customer deals | | 0%–1% | |
= Operating revenue growth | | 8%–12% | |
*Assumes 7% average annual growth in global equities.
16
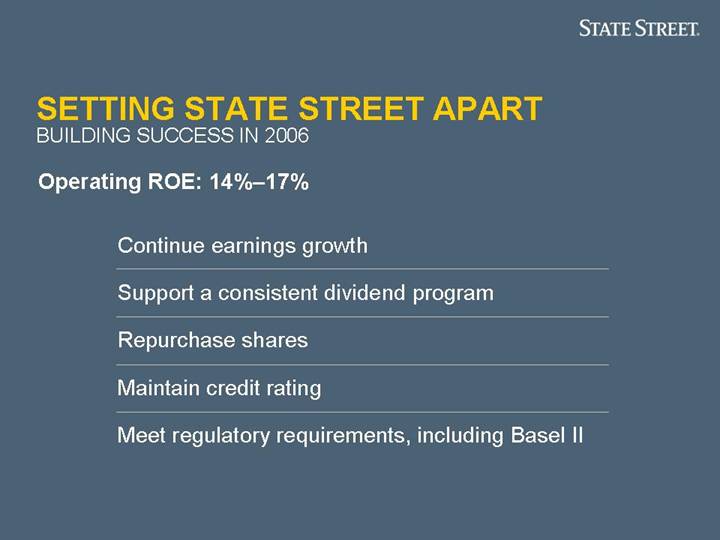
Operating ROE: 14%–17%
Continue earnings growth |
|
Support a consistent dividend program |
|
Repurchase shares |
|
Maintain credit rating |
|
Meet regulatory requirements, including Basel II |
17
[GRAPHIC]
BALANCE SHEET MANAGEMENT AND CAPITAL STRATEGIES
Edward J. Resch Executive Vice President and Chief Financial Officer
SETTING STATE STREET APART
BALANCE SHEET MANAGEMENT
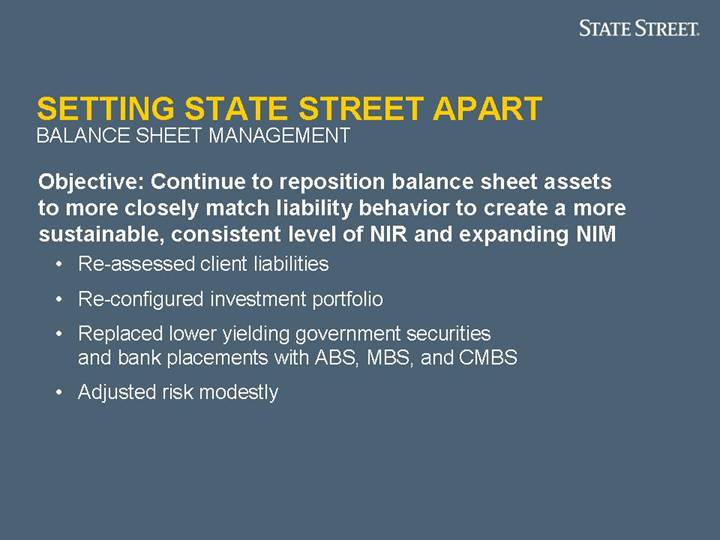
Objective: Continue to reposition balance sheet assets to more closely match liability behavior to create a more sustainable, consistent level of NIR and expanding NIM
• Re-assessed client liabilities
• Re-configured investment portfolio
• Replaced lower yielding government securities and bank placements with ABS, MBS, and CMBS
• Adjusted risk modestly
19
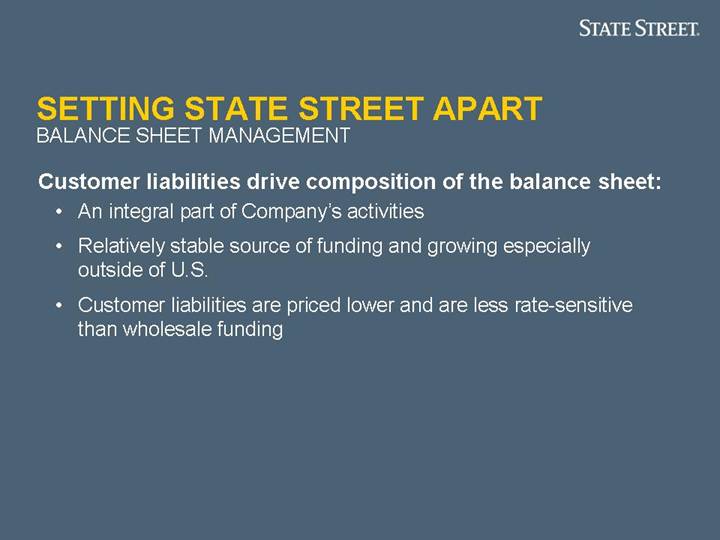
Customer liabilities drive composition of the balance sheet:
• An integral part of Company’s activities
• Relatively stable source of funding and growing especially outside of U.S.
• Customer liabilities are priced lower and are less rate-sensitive than wholesale funding
20
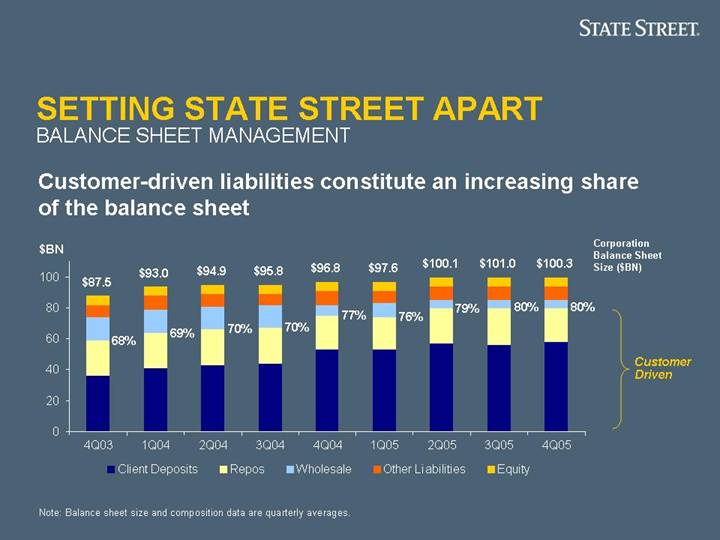
Customer-driven liabilities constitute an increasing share of the balance sheet
[CHART]
Note: Balance sheet size and composition data are quarterly averages.
21
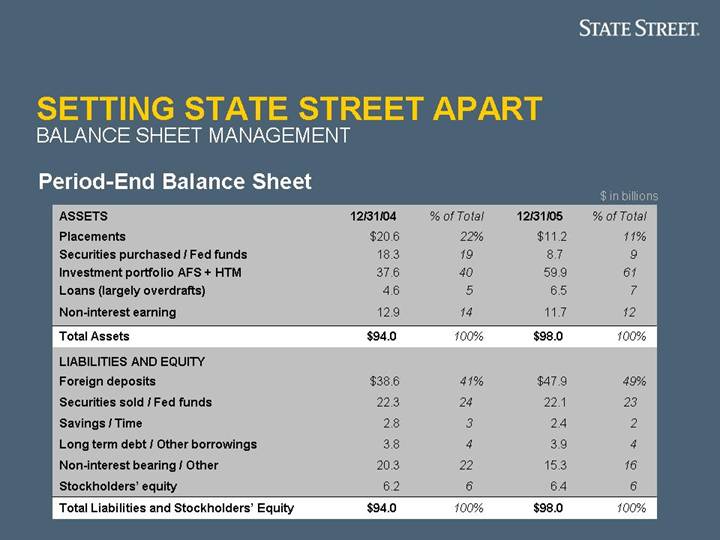
Period-End Balance Sheet
$ in billions
| | 12/31/04 | | % of Total | | 12/31/05 | | % of Total | |
ASSETS | | | | | | | | | |
Placements | | $ | 20.6 | | 22 | % | $ | 11.2 | | 11 | % |
Securities purchased / Fed funds | | 18.3 | | 19 | | 8.7 | | 9 | |
Investment portfolio AFS + HTM | | 37.6 | | 40 | | 59.9 | | 61 | |
Loans (largely overdrafts) | | 4.6 | | 5 | | 6.5 | | 7 | |
Non-interest earning | | 12.9 | | 14 | | 11.7 | | 12 | |
Total Assets | | $ | 94.0 | | 100 | % | $ | 98.0 | | 100 | % |
LIABILITIES AND EQUITY | | | | | | | | | |
Foreign deposits | | $ | 38.6 | | 41 | % | $ | 47.9 | | 49 | % |
Securities sold / Fed funds | | 22.3 | | 24 | | 22.1 | | 23 | |
Savings / Time | | 2.8 | | 3 | | 2.4 | | 2 | |
Long term debt / Other borrowings | | 3.8 | | 4 | | 3.9 | | 4 | |
Non-interest bearing / Other | | 20.3 | | 22 | | 15.3 | | 16 | |
Stockholders’ equity | | 6.2 | | 6 | | 6.4 | | 6 | |
Total Liabilities and Stockholders’ Equity | | $ | 94.0 | | 100 | % | $ | 98.0 | | 100 | % |
22
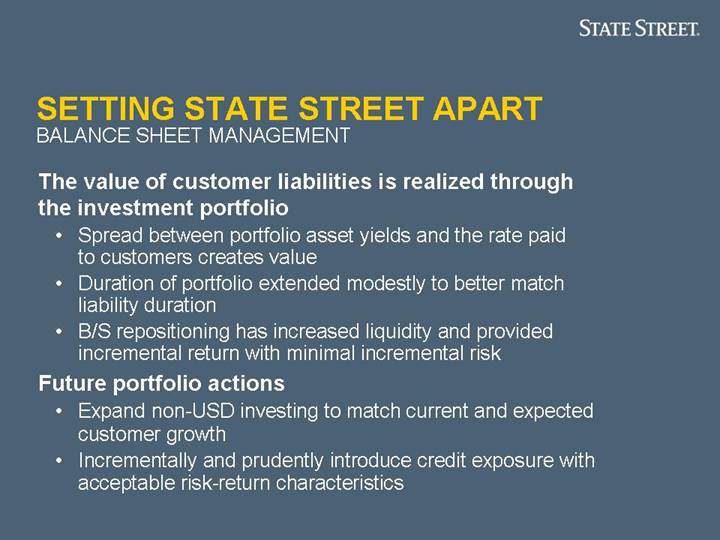
The value of customer liabilities is realized through the investment portfolio
• Spread between portfolio asset yields and the rate paid to customers creates value
• Duration of portfolio extended modestly to better match liability duration
• B/S repositioning has increased liquidity and provided incremental return with minimal incremental risk
Future portfolio actions
• Expand non-USD investing to match current and expected customer growth
• Incrementally and prudently introduce credit exposure with acceptable risk-return characteristics
23
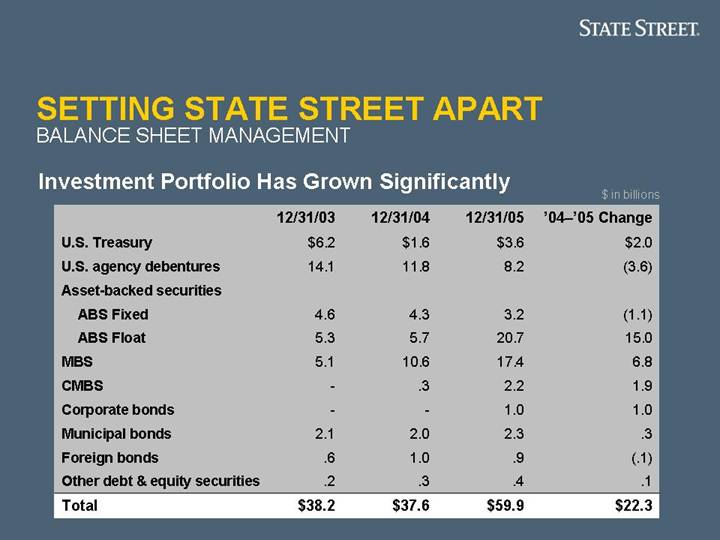
Investment Portfolio Has Grown Significantly
$ in billions
| | 12/31/03 | | 12/31/04 | | 12/31/05 | | ’04–’05 Change | |
U.S. Treasury | | $ | 6.2 | | $ | 1.6 | | $ | 3.6 | | $ | 2.0 | |
U.S. agency debentures | | 14.1 | | 11.8 | | 8.2 | | (3.6 | ) |
Asset-backed securities | | | | | | | | | |
ABS Fixed | | 4.6 | | 4.3 | | 3.2 | | (1.1 | ) |
ABS Float | | 5.3 | | 5.7 | | 20.7 | | 15.0 | |
MBS | | 5.1 | | 10.6 | | 17.4 | | 6.8 | |
CMBS | | — | | .3 | | 2.2 | | 1.9 | |
Corporate bonds | | — | | — | | 1.0 | | 1.0 | |
Municipal bonds | | 2.1 | | 2.0 | | 2.3 | | .3 | |
Foreign bonds | | .6 | | 1.0 | | .9 | | (.1 | ) |
Other debt & equity securities | | .2 | | .3 | | .4 | | .1 | |
Total | | $ | 38.2 | | $ | 37.6 | | $ | 59.9 | | $ | 22.3 | |
24
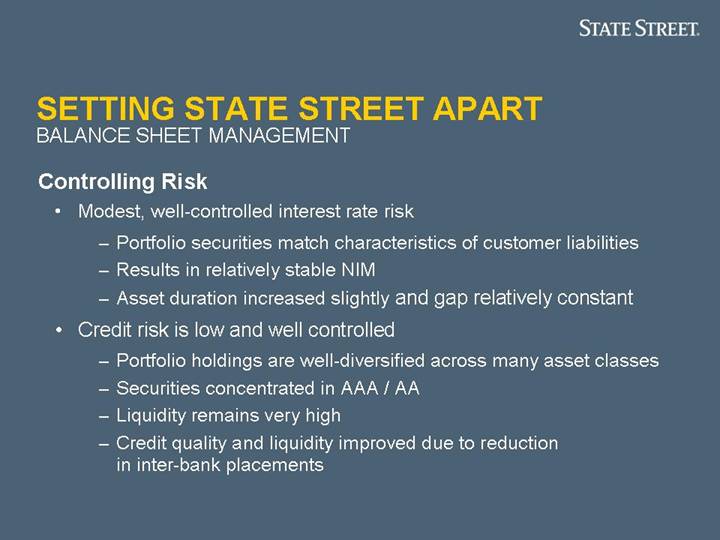
Controlling Risk
• Modest, well-controlled interest rate risk
• Portfolio securities match characteristics of customer liabilities
• Results in relatively stable NIM
• Asset duration increased slightly and gap relatively constant
• Credit risk is low and well controlled
• Portfolio holdings are well-diversified across many asset classes
• Securities concentrated in AAA / AA
• Liquidity remains very high
• Credit quality and liquidity improved due to reduction in inter-bank placements
25
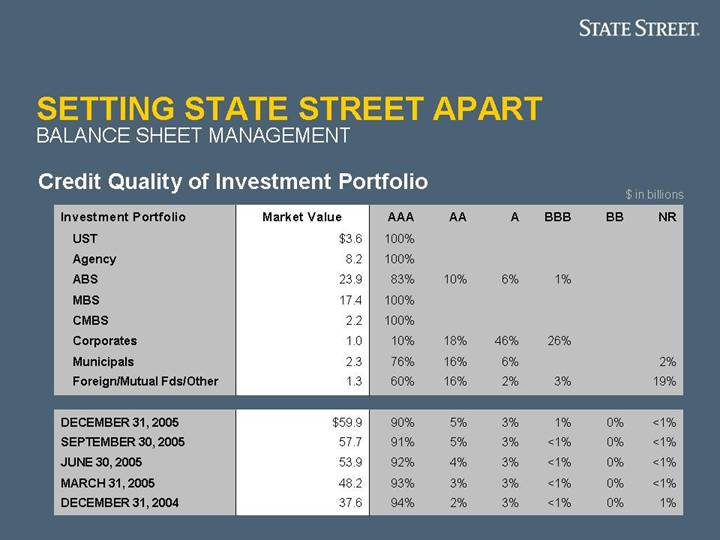
Credit Quality of Investment Portfolio
$ in billions
Investment Portfolio | | Market Value | | AAA | | AA | | A | | BBB | | BB | | NR | |
| | | | | | | | | | | | | | | |
UST | | $ | 3.6 | | 100 | % | | | | | | | | | | |
Agency | | 8.2 | | 100 | % | | | | | | | | | | |
ABS | | 23.9 | | 83 | % | 10 | % | 6 | % | 1 | % | | | | |
MBS | | 17.4 | | 100 | % | | | | | | | | | | |
CMBS | | 2.2 | | 100 | % | | | | | | | | | | |
Corporates | | 1.0 | | 10 | % | 18 | % | 46 | % | 26 | % | | | | |
Municipals | | 2.3 | | 76 | % | 16 | % | 6 | % | | | | | 2 | % |
Foreign/Mutual Fds/Other | | 1.3 | | 60 | % | 16 | % | 2 | % | 3 | % | | | 19 | % |
| | | | | | | | | | | | | | | |
DECEMBER 31, 2005 | | $ | 59.9 | | 90 | % | 5 | % | 3 | % | 1 | % | 0 | % | <1 | % |
SEPTEMBER 30, 2005 | | 57.7 | | 91 | % | 5 | % | 3 | % | <1 | % | 0 | % | <1 | % |
JUNE 30, 2005 | | 53.9 | | 92 | % | 4 | % | 3 | % | <1 | % | 0 | % | <1 | % |
MARCH 31, 2005 | | 48.2 | | 93 | % | 3 | % | 3 | % | <1 | % | 0 | % | <1 | % |
DECEMBER 31, 2004 | | 37.6 | | 94 | % | 2 | % | 3 | % | <1 | % | 0 | % | 1 | % |
26
Effective Repositioning Results in a Stable NIM in the Face of Rising Rates
[CHART]
27
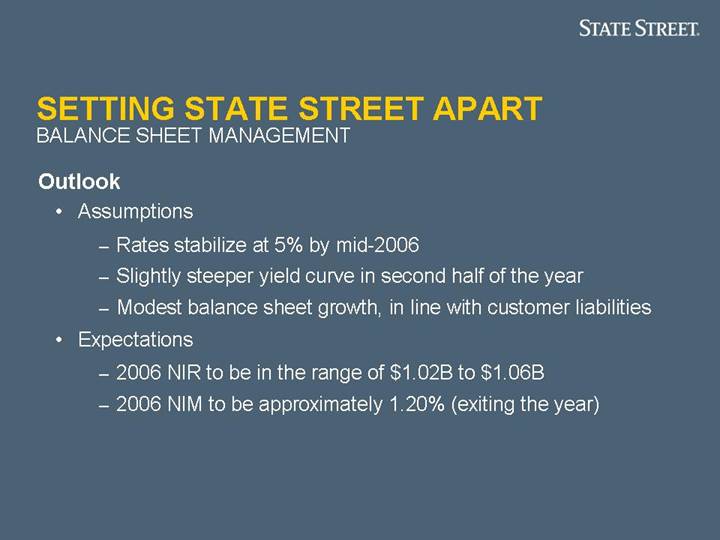
Outlook
• Assumptions
• Rates stabilize at 5% by mid-2006
• Slightly steeper yield curve in second half of the year
• Modest balance sheet growth, in line with customer liabilities
• Expectations
• 2006 NIR to be in the range of $1.02B to $1.06B
• 2006 NIM to be approximately 1.20% (exiting the year)
28
SETTING STATE STREET APART
CAPITAL STRATEGIES
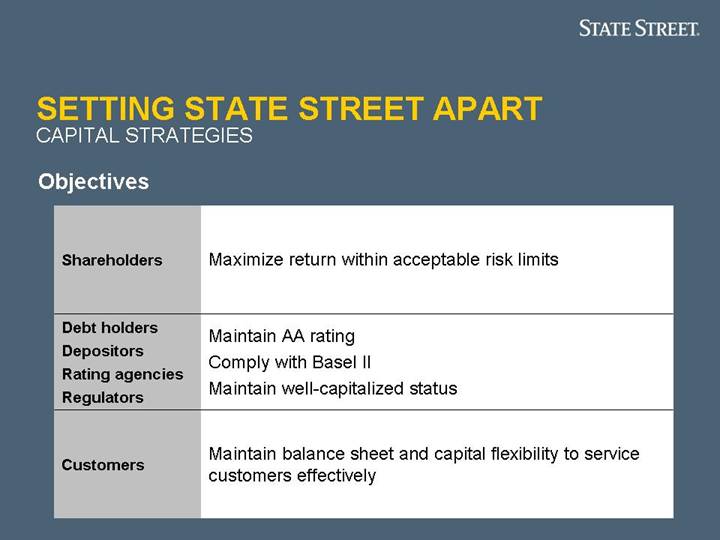
Objectives
Shareholders | Maximize return within acceptable risk limits |
| |
Debt holders
Depositors
Rating agencies
Regulators | Maintain AA rating
Comply with Basel II
Maintain well-capitalized status |
| |
Customers | Maintain balance sheet and capital flexibility to service customers effectively |
29
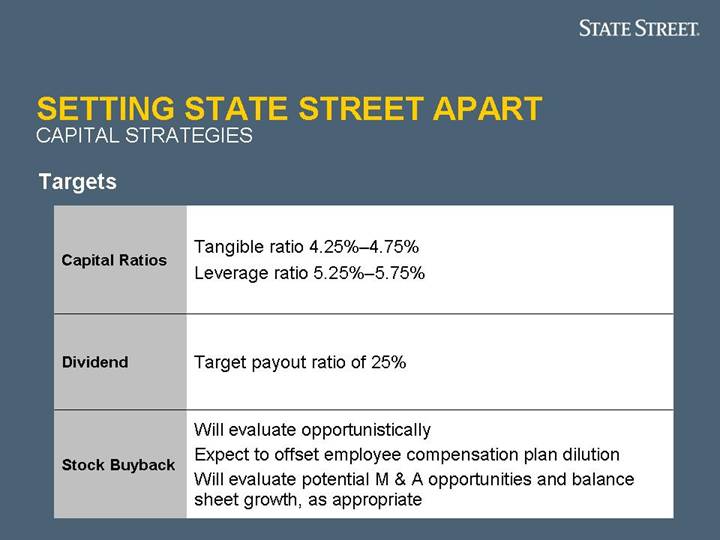
Targets
Capital Ratios | Tangible ratio 4.25%–4.75% |
Leverage ratio 5.25%–5.75% |
| |
Dividend | Target payout ratio of 25% |
| |
Stock Buyback | Will evaluate opportunistically |
Expect to offset employee compensation plan dilution |
Will evaluate potential M & A opportunities and balance |
sheet growth, as appropriate |
30
SETTING STATE STREET APART
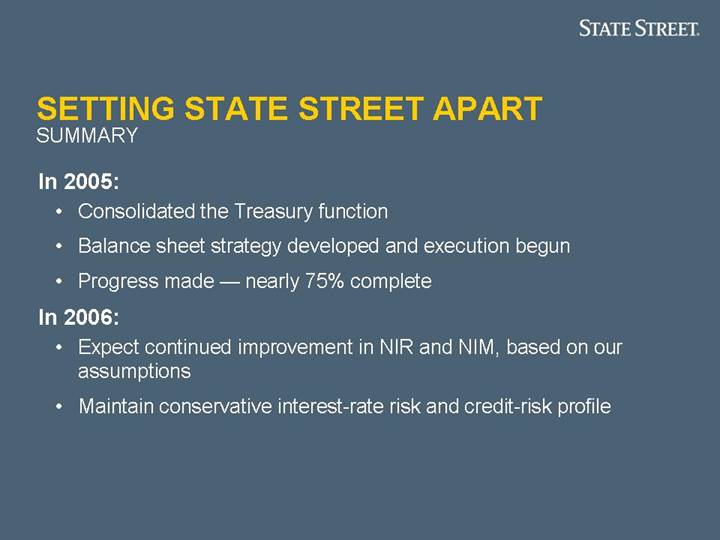
SUMMARY
In 2005:
• Consolidated the Treasury function
• Balance sheet strategy developed and execution begun
• Progress made — nearly 75% complete
In 2006:
• Expect continued improvement in NIR and NIM, based on our assumptions
• Maintain conservative interest-rate risk and credit-risk profile
31
[GRAPHIC]
BALANCING CURRENT RETURNS AND FUTURE GROWTH
Setting State Street Apart Investor and Analyst Meeting, 7 February 2006
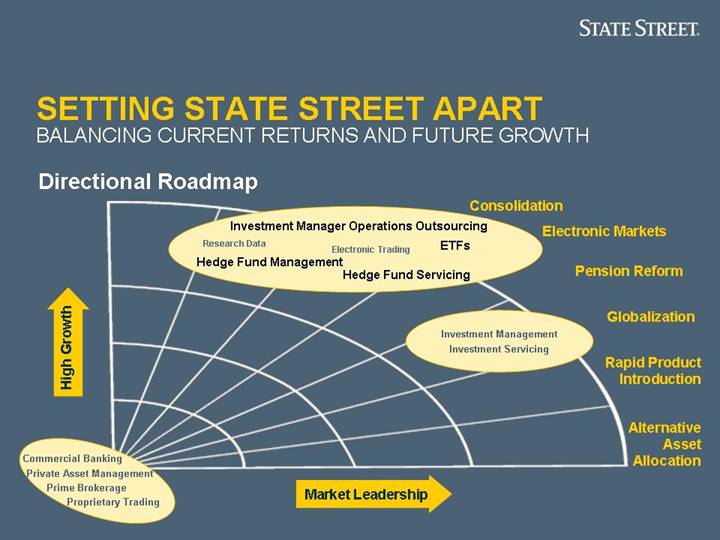
SETTING STATE STREET APART
BALANCING CURRENT RETURNS AND FUTURE GROWTH
Directional Roadmap
[GRAPHIC]
33
[GRAPHIC]
LEVERAGING ACROSS THE COMPANY
Jay L. Hooley Global Head of Investor Services
William W. Hunt Chief Executive Officer, SSgA
SETTING STATE STREET APART
LEVERAGING ACROSS THE COMPANY
Strategic Initiatives
Investor Services
$10.1T AUC | | • Hedge Funds • Exchange Traded Funds • Investment Manager Operations Outsourcing | | State Street
Global Advisors
$1.4T AUM |
35
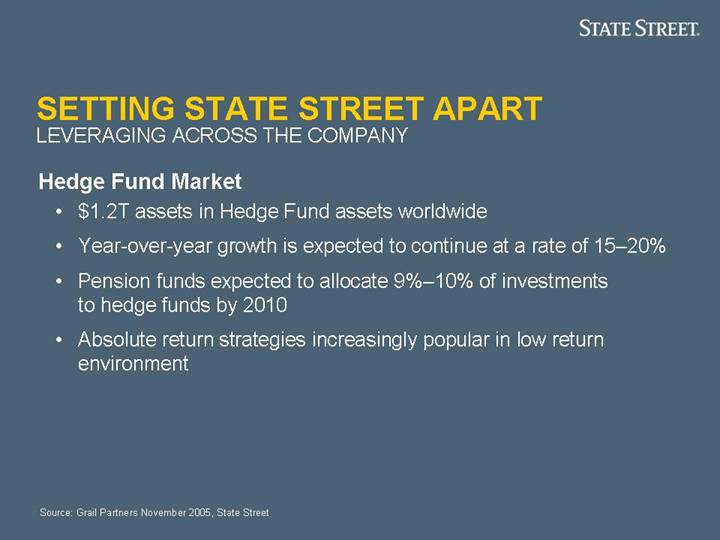
Hedge Fund Market
• $1.2T assets in Hedge Fund assets worldwide
• Year-over-year growth is expected to continue at a rate of 15–20%
• Pension funds expected to allocate 9%–10% of investments to hedge funds by 2010
• Absolute return strategies increasingly popular in low return environment
Source: Grail Partners November 2005, State Street
36
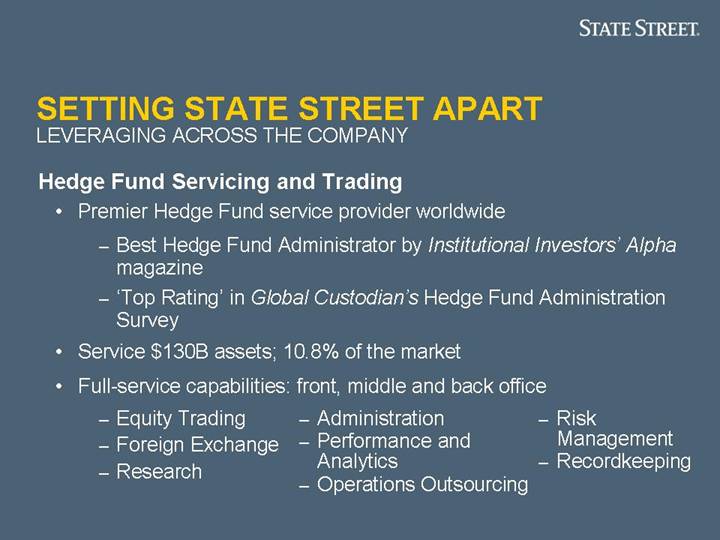
Hedge Fund Servicing and Trading
• Premier Hedge Fund service provider worldwide
• Best Hedge Fund Administrator by Institutional Investors’ Alpha magazine
• ‘Top Rating’ in Global Custodian’s Hedge Fund Administration Survey
• Service $130B assets; 10.8% of the market
• Full-service capabilities: front, middle and back office
• Equity Trading
• Foreign Exchange
• Research
• Administration
• Performance and Analytics
• Operations Outsourcing
• Risk Management
• Recordkeeping
37
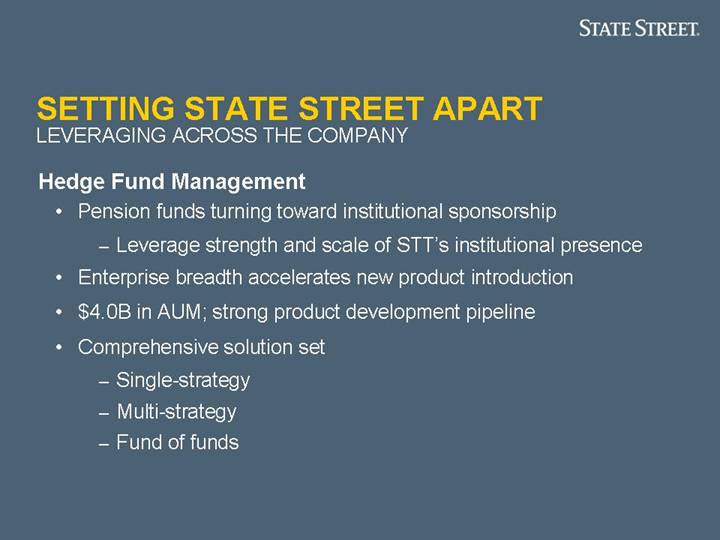
Hedge Fund Management
• �� Pension funds turning toward institutional sponsorship
• Leverage strength and scale of STT’s institutional presence
• Enterprise breadth accelerates new product introduction
• $4.0B in AUM; strong product development pipeline
• Comprehensive solution set
• Single-strategy
• Multi-strategy
• Fund of funds
38
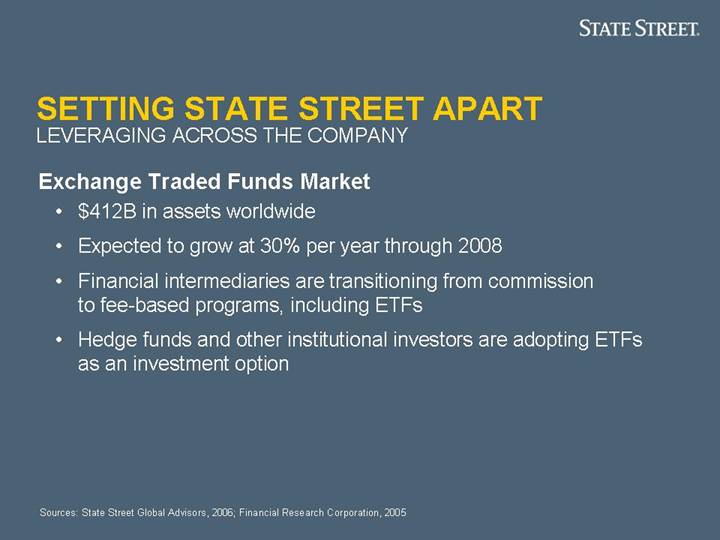
Exchange Traded Funds Market
• $412B in assets worldwide
• Expected to grow at 30% per year through 2008
• Financial intermediaries are transitioning from commission to fee-based programs, including ETFs
• Hedge funds and other institutional investors are adopting ETFs as an investment option
Sources: State Street Global Advisors, 2006; Financial Research Corporation, 2005
39
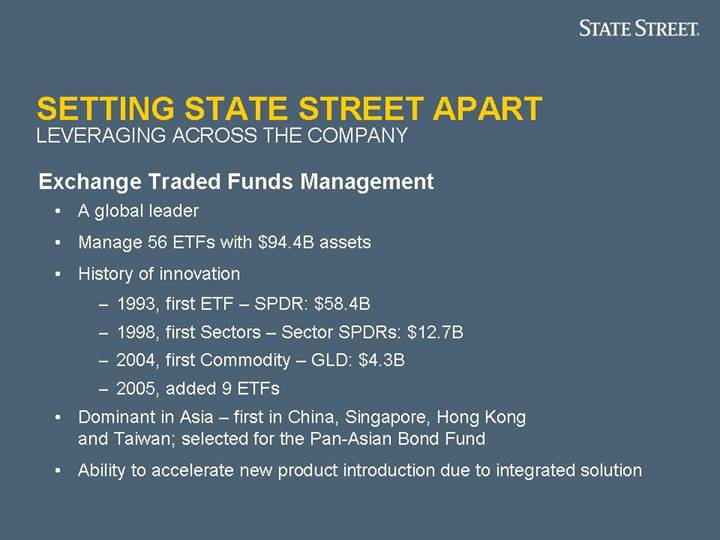
Exchange Traded Funds Management
• A global leader
• Manage 56 ETFs with $94.4B assets
• History of innovation
• 1993, first ETF – SPDR: $58.4B
• 1998, first Sectors – Sector SPDRs: $12.7B
• 2004, first Commodity – GLD: $4.3B
• 2005, added 9 ETFs
• Dominant in Asia – first in China, Singapore, Hong Kong and Taiwan; selected for the Pan-Asian Bond Fund
• Ability to accelerate new product introduction due to integrated solution
40
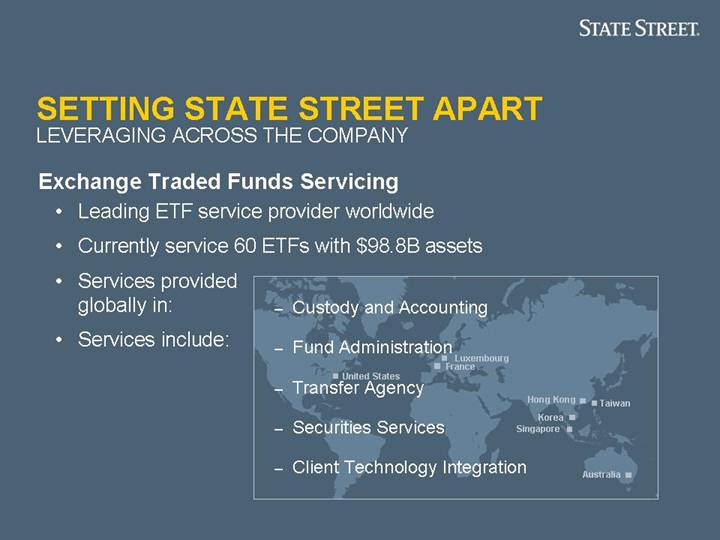
Exchange Traded Funds Servicing
• Leading ETF service provider worldwide
• Currently service 60 ETFs with $98.8B assets
• Services provided globally in:
• Services include:
[GRAPHIC]
• Custody and Accounting
• Fund Administration
• Transfer Agency
• Securities Services
• Client Technology Integration
41
Investment Manager Operations Outsourcing Market
• The top 500 investment managers worldwide manage $48.8T in assets, over $38T concentrated with the top 100 managers*
• Demand in Europe is for servicing solutions covering the back- and middle-office while in the U.S. servicing needs are incremental
• Industry trends facing investment managers continue to drive demand
• Focus on cost reduction and efficiency in operations
• Increased regulations
• Need to enhance risk controls and business continuity
• Introduction of new products
*Source: P&I / Watson Wyatt World 500, September 5, 2005
42
Investment Manager Operations Outsourcing
• Largest provider servicing $2.8T assets
• The only fully global service provider
• Building scale: servicing 10 customers in 14 countries
• Delivering global middle and back office services through an integrated platform
• Controlling growth through selective partnerships
• Achieving cross-sell success; $45M in annualized revenues to date
43
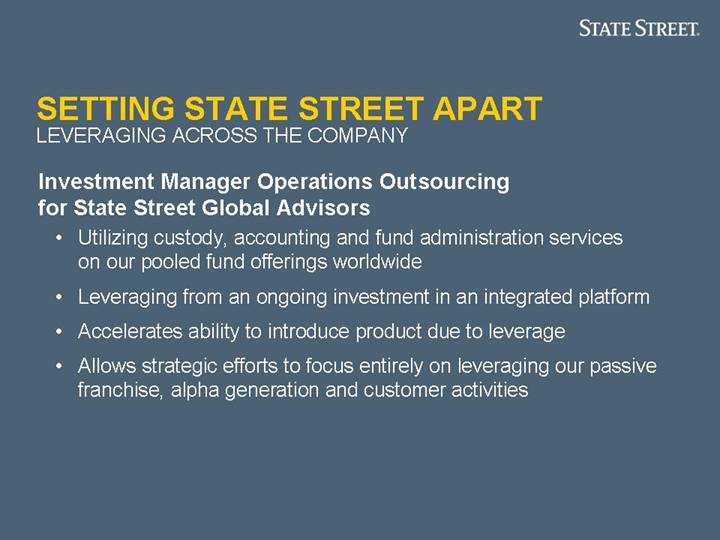
Investment Manager Operations Outsourcing for State Street Global Advisors
• Utilizing custody, accounting and fund administration services on our pooled fund offerings worldwide
• Leveraging from an ongoing investment in an integrated platform
• Accelerates ability to introduce product due to leverage
• Allows strategic efforts to focus entirely on leveraging our passive franchise, alpha generation and customer activities
44
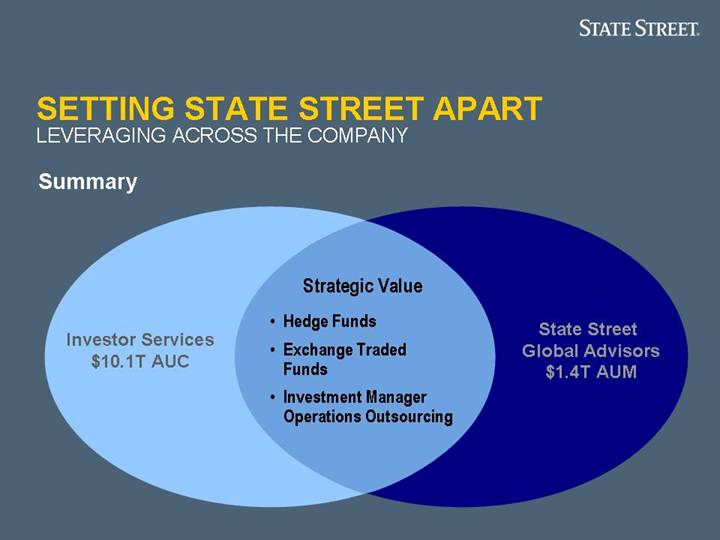
Summary
Investor Services
$10.1T AUC | | Strategic Value • Hedge Funds • Exchange Traded Funds • Investment Manager Operations Outsourcing | | State Street
Global Advisors
$1.4T AUM |
45
SETTING STATE STREET APART
BUILDING ON SUCCESS
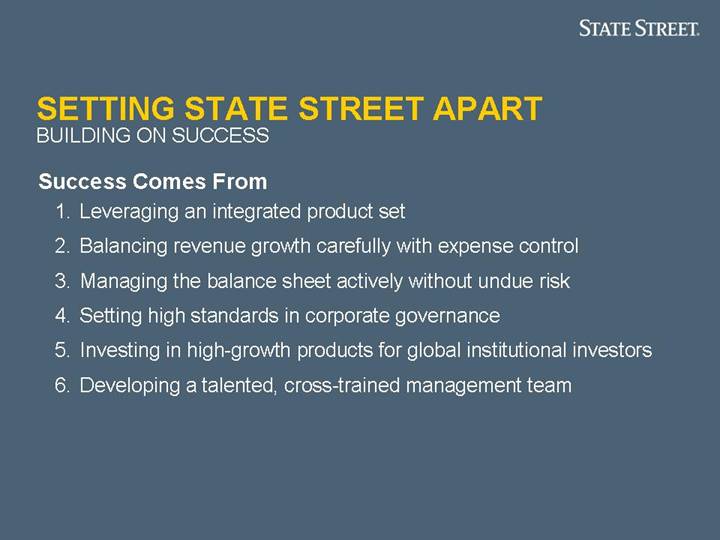
Success Comes From
1. Leveraging an integrated product set
2. Balancing revenue growth carefully with expense control
3. Managing the balance sheet actively without undue risk
4. Setting high standards in corporate governance
5. Investing in high-growth products for global institutional investors
6. Developing a talented, cross-trained management team
46