Exhibit 99.1
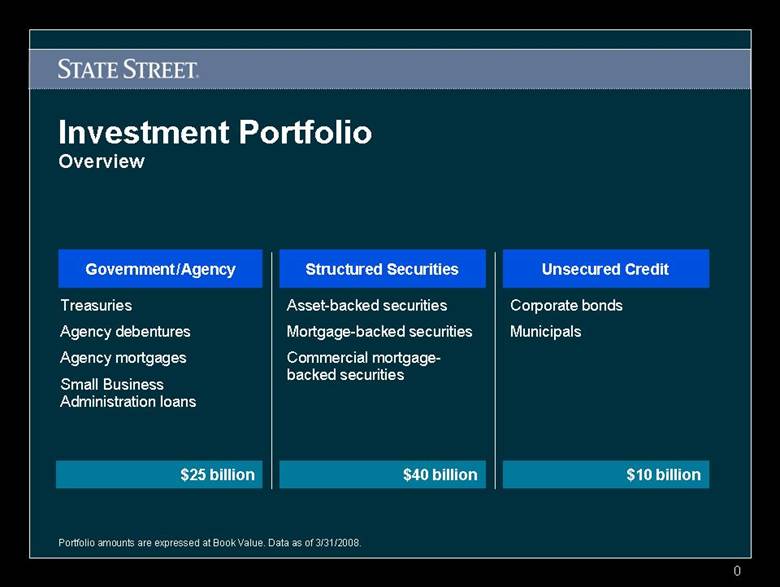
| 0 Asset-backed securities Mortgage-backed securities Commercial mortgage-backed securities $25 billion $40 billion $10 billion Corporate bonds Municipals Treasuries Agency debentures Agency mortgages Small Business Administration loans Investment Portfolio Overview Government/Agency Structured Securities Unsecured Credit Portfolio amounts are expressed at Book Value. Data as of 3/31/2008. |
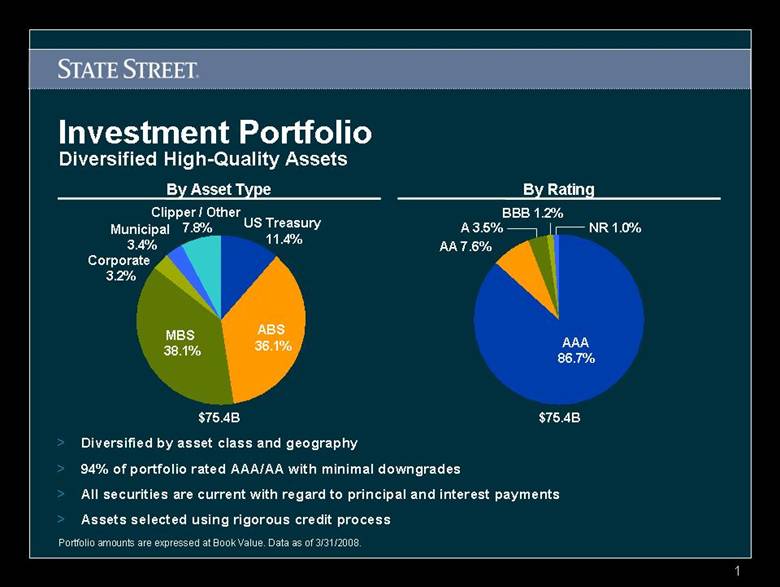
| 1 Investment Portfolio Diversified High-Quality Assets > Diversified by asset class and geography > 94% of portfolio rated AAA/AA with minimal downgrades > All securities are current with regard to principal and interest payments > Assets selected using rigorous credit process By Asset Type By Rating Corporate 3.2% AAA 86.7% NR 1.0% A 3.5% BBB 1.2% AA 7.6% $75.4B $75.4B ABS 36.1% MBS 38.1% Municipal 3.4% US Treasury 11.4% Clipper / Other 7.8% Portfolio amounts are expressed at Book Value. Data as of 3/31/2008. |
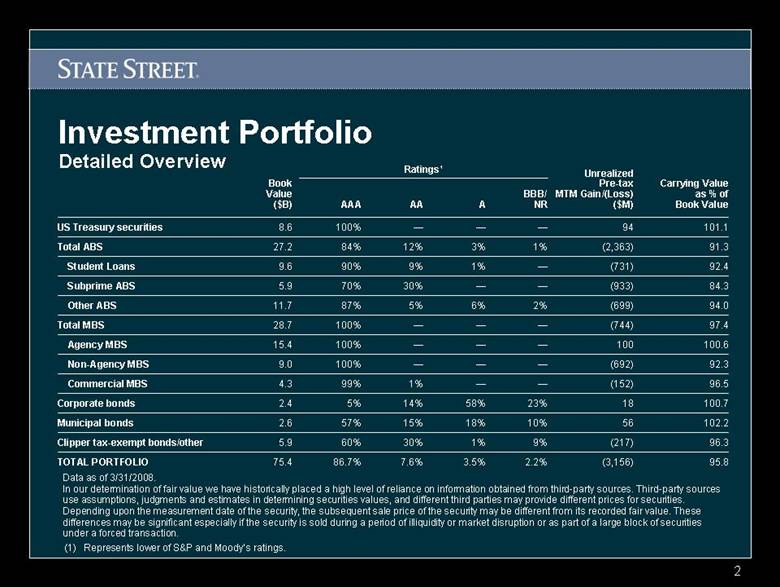
| 2 Investment Portfolio Detailed Overview TOTAL PORTFOLIO Clipper tax-exempt bonds/other Municipal bonds Corporate bonds Commercial MBS Non-Agency MBS Agency MBS Total MBS Other ABS Subprime ABS Student Loans Total ABS US Treasury securities 75.4 5.9 2.6 2.4 4.3 9.0 15.4 28.7 11.7 5.9 9.6 27.2 8.6 Book Value ($B) 97.4 (744) — — — 100% 91.3 (2,363) 1% 3% 12% 84% 100.6 100 — — — 100% 92.4 (731) — 1% 9% 90% 84.3 (933) — — 30% 70% 92.3 (692) — — — 100% 95.8 (3,156) 2.2% 3.5% 7.6% 86.7% 96.3 (217) 9% 1% 30% 60% 102.2 56 10% 18% 15% 57% 100.7 18 23% 58% 14% 5% AAA BBB/ NR A AA — 2% — — 6% — 1% 5% — 99% 87% 100% Ratings¹ 96.5 (152) 94.0 (699) 101.1 94 Carrying Value as % of Book Value Unrealized Pre-tax MTM Gain/(Loss) ($M) (1) Represents lower of S&P and Moody ’s ratings. Data as of 3/31/2008. In our determination of fair value we have historically placed a high level of reliance on information obtained from third-party sources. Third-party sources use assumptions, judgments and estimates in determining securities values, and different third parties may provide different prices for securities. Depending upon the measurement date of the security, the subsequent sale price of the security may be different from its recorded fair value. These differences may be significant especially if the security is sold during a period of illiquidity or market disruption or as part of a large block of securities under a forced transaction. |
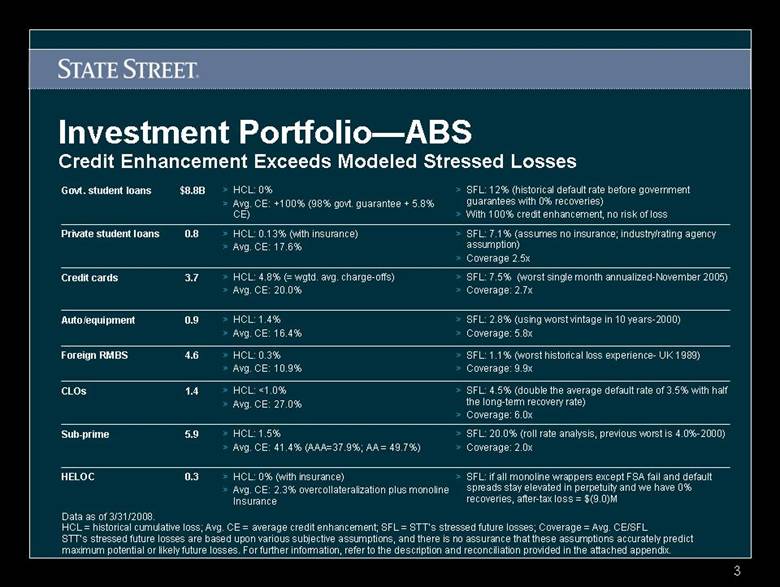
| 3 Investment Portfolio—ABS HELOC Sub-prime CLOs Foreign RMBS Auto/equipment Credit cards Private student loans Govt. student loans > SFL: 1.1% (worst historical loss experience- UK 1989) > Coverage: 9.9x > HCL: 0.3% > Avg. CE: 10.9% 4.6 > SFL: 7.5% (worst single month annualized-November 2005) > Coverage: 2.7x > HCL: 4.8% (= wgtd. avg. charge-offs) > Avg. CE: 20.0% 3.7 > SFL: 7.1% (assumes no insurance; industry/rating agency assumption) > Coverage 2.5x > HCL: 0.13% (with insurance) > Avg. CE: 17.6% 0.8 > SFL: if all monoline wrappers except FSA fail and default spreads stay elevated in perpetuity and we have 0% recoveries, after-tax loss = $(9.0)M > SFL: 20.0% (roll rate analysis, previous worst is 4.0%-2000) > Coverage: 2.0x > SFL: 4.5% (double the average default rate of 3.5% with half the long-term recovery rate) > Coverage: 6.0x > SFL: 2.8% (using worst vintage in 10 y ears-2000) > Coverage: 5.8x > SFL: 12% (historical default rate before government guarantees with 0% recoveries) > With 100% credit enhancement, no risk of loss > HCL: 0% (with insurance) > Avg. CE: 2.3% overcollateralization plus monoline Insurance 0.3 > HCL: 1.5% > Avg. CE: 41.4% (AAA=37.9%; AA = 49.7%) 5.9 > HCL: <1.0% > Avg. CE: 27.0% 1.4 > HCL: 1.4% > Avg. CE: 16.4% 0.9 > HCL: 0% > Avg. CE: +100% (98% govt. guarantee + 5.8% CE) $8.8B Data as of 3/31/2008. HCL = historical cumulative loss; Avg. CE = average credit enhancement; SFL = STT’s stressed future losses; Coverage = Avg. CE/SFL STT’s stressed future losses are based upon various subjective assumptions, and there is no assurance that these assumptions accurately predict maximum potential or likely future losses. For further information, refer to the description and reconciliation provided in the attached appendix. Credit Enhancement Exceeds Modeled Stressed Losses |
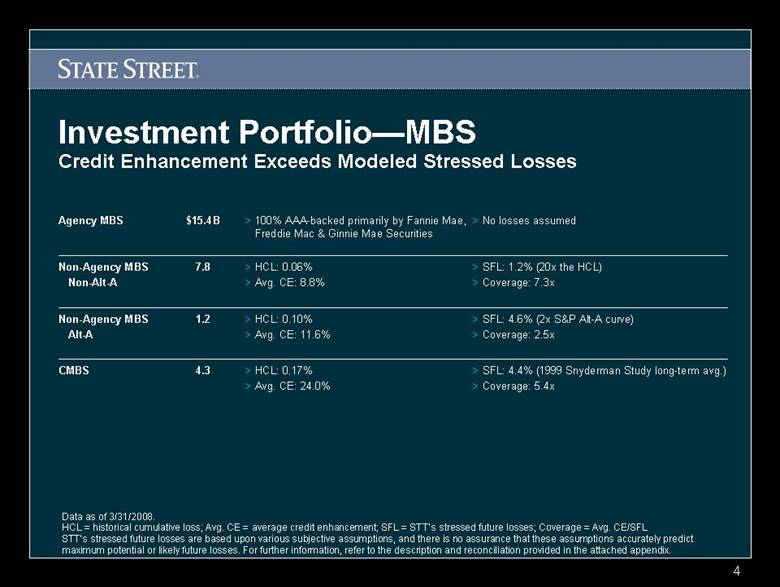
| 4 Investment Portfolio—MBS CMBS Non-Agency MBS Alt-A Non-Agency MBS Non-Alt-A Agency MBS > SFL: 4.6% (2x S&P Alt-A curve) > Coverage: 2.5x > HCL: 0.10% > Avg. CE: 11.6% 1.2 > SFL: 4.4% (1999 Snyderman Study long-term avg.) > Coverage: 5.4x > SFL: 1.2% (20x the HCL) > Coverage: 7.3x > No losses assumed > HCL: 0.17% > Avg. CE: 24.0% 4.3 > HCL: 0.06% > Avg. CE: 8.8% 7.8 > 100% AAA-backed primarily by Fannie Mae, Freddie Mac & Ginnie Mae Securities $15.4B Credit Enhancement Exceeds Modeled Stressed Losses Data as of 3/31/2008. HCL = historical cumulative loss; Avg. CE = average credit enhancement; SFL = STT’s stressed future losses; Coverage = Avg. CE/SFL STT’s stressed future losses are based upon various subjective assumptions, and there is no assurance that these assumptions accurately predict maximum potential or likely future losses. For further information, refer to the description and reconciliation provided in the attached appendix. |
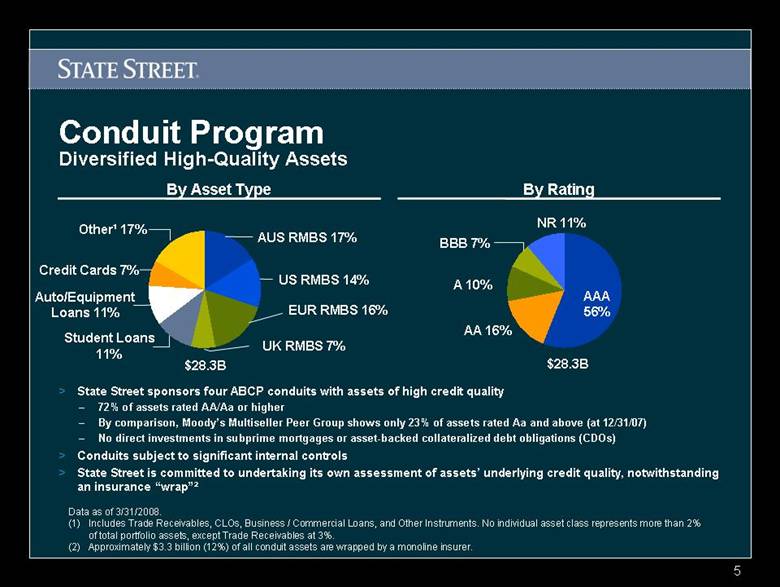
| 5 Conduit Program Diversified High-Quality Assets By Asset Type By Rating AAA 56% NR 11% A 10% BBB 7% AA 16% AUS RMBS 17% US RMBS 14% EUR RMBS 16% Auto/Equipment Loans 11% Credit Cards 7% Other¹ 17% Student Loans 11% UK RMBS 7% > State Street sponsors four ABCP conduits with assets of high credit quality – 72% of assets rated AA/Aa or higher – By comparison, Moody’s Multiseller Peer Group shows only 23% of assets rated Aa and above (at 12/31/07) – No direct investments in subprime mortgages or asset-backed collateralized debt obligations (CDOs) > Conduits subject to significant internal controls > State Street is committed to undertaking its own assessment of assets’ underlying credit quality, notwithstanding an insurance “wrap”² Data as of 3/31/2008. (1) Includes Trade Receivables, CLOs, Business / Commercial Loans, and Other Instruments. No individual asset class represents more than 2% of total portfolio assets, except Trade Receivables at 3%. (2) Approximately $3.3 billion (12%) of all conduit assets are wrapped by a monoline insurer. $28.3B $28.3B |
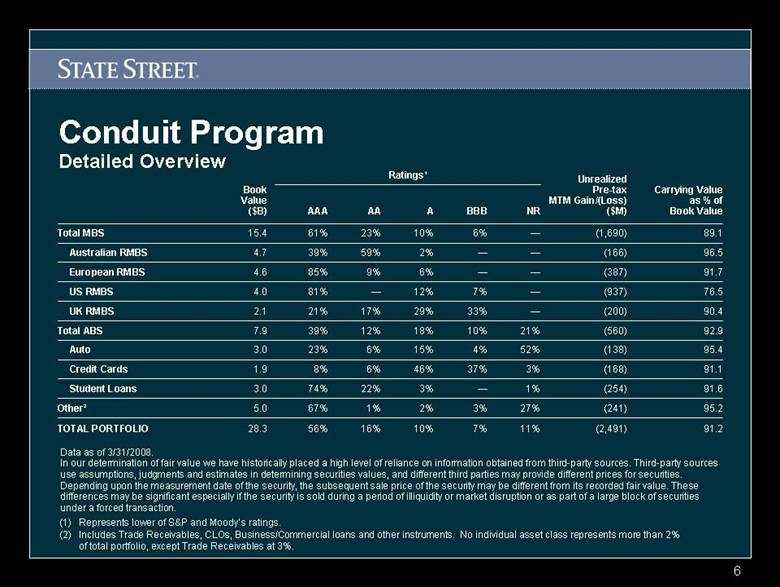
| 6 Conduit Program Detailed Overview TOTAL PORTFOLIO Other² Student Loans Credit Cards Auto Total ABS UK RMBS US RMBS European RMBS Australian RMBS Total MBS 7% 3% — 37% 4% 10% 33% 7% — — 6% BBB 28.3 5.0 3.0 1.9 3.0 7.9 2.1 4.0 4.6 4.7 15.4 Book Value ($B) 76.5 (937) — 12% — 81% 96.5 (166) — 2% 59% 39% 90.4 (200) — 29% 17% 21% 92.9 (560) 21% 18% 12% 39% 91.2 (2,491) 11% 10% 16% 56% 95.2 (241) 27% 2% 1% 67% 91.6 (254) 1% 3% 22% 74% 91.1 (168) 3% 46% 6% 8% AAA NR A AA 52% — — 15% 6% 10% 6% 9% 23% 23% 85% 61% Ratings¹ 95.4 (138) 91.7 (387) 89.1 (1,690) Carrying Value as % of Book Value Unrealized Pre-tax MTM Gain/(Loss) ($M) (1) Represents lower of S&P and Moody ’s ratings. (2) Includes Trade Receivables, CLOs, Business/Commercial loans and other instruments. No individual asset class represents more than 2% of total portfolio, except Trade Receivables at 3%. Data as of 3/31/2008. In our determination of fair value we have historically placed a high level of reliance on information obtained from third-party sources. Third-party sources use assumptions, judgments and estimates in determining securities values, and different third parties may provide different prices for securities. Depending upon the measurement date of the security, the subsequent sale price of the security may be different from its recorded fair value. These differences may be significant especially if the security is sold during a period of illiquidity or market disruption or as part of a large block of securities under a forced transaction. |

| 7 Conduit Program—ABS Credit Enhancement Exceeds Modeled Stressed Losses Private student Loans Govt. Student Loans Non-US Credit Cards US Credit Cards Autos > SFL: 12.0% (historical default rate with 0% recoveries) > Coverage: 8.3x > HCL: 0% > Avg. CE: 99.6% 2.5 > SFL: 7.1% (assumes no insurance) > Coverage: 9.3x > HCL: .14% (with insurance) > Avg. CE: 66.0% (with insurance) 0.5 > SFL: 8.0% (high range expectation of ratings agencies) > Coverage: 2.1x > HCL: 6.0% (weighted avg. charge-offs) > Avg. CE: 16.7% 0.4 > SFL: 7.5% (worst single month annualized) > Coverage: 2.1x > SFL: 2.8% (using worst vintage in 10 years) > Coverage: 2.9x > HCL: 4.3% (weighted avg. charge-offs) > Avg. CE: 15.9% 1.5 > HCL: 1.0% > Avg. CE: 8.2% $3.0B Data as of 3/31/2008. HCL = historical cumulative loss; Avg. CE = average credit enhancement; SFL = STT’s stressed future losses; Coverage = Avg. CE/SFL STT’s stressed future losses are based upon various subjective assumptions, and there is no assurance that these assumptions accurately predict maximum potential or likely future losses. For further information, refer to the description and reconciliation provided in the attached appendix. |
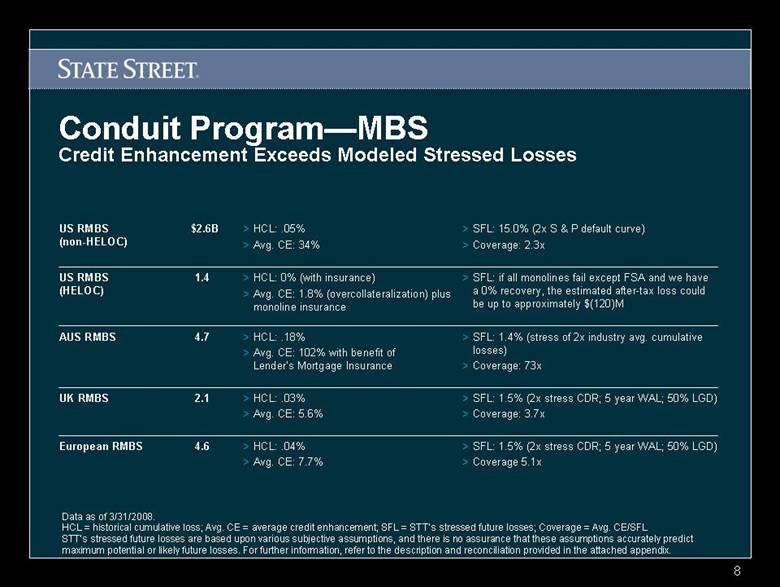
| 8 Conduit Program—MBS Credit Enhancement Exceeds Modeled Stressed Losses European RMBS UK RMBS AUS RMBS US RMBS (HELOC) US RMBS (non-HELOC) > SFL: 1.5% (2x stress CDR; 5 year WAL; 50% LGD) > Coverage 5.1x > SFL: 1.5% (2x stress CDR; 5 year WAL; 50% LGD) > Coverage: 3.7x > SFL: 1.4% (stress of 2x industry avg. cumulative losses) > Coverage: 73x > SFL: if all monolines fail except FSA and we have a 0% recovery, the estimated after-tax loss could be up to approximately $(120)M > SFL: 15.0% (2x S & P default curve) > Coverage: 2.3x > HCL: 0% (with insurance) > Avg. CE: 1.8% (overcollateralization) plus monoline insurance 1.4 > HCL: .03% > Avg. CE: 5.6% 2.1 > HCL: .04% > Avg. CE: 7.7% 4.6 > HCL: .18% > Avg. CE: 102% with benefit of Lender’s Mortgage Insurance 4.7 > HCL: .05% > Avg. CE: 34% $2.6B Data as of 3/31/2008. HCL = historical cumulative loss; Avg. CE = average credit enhancement; SFL = STT’s stressed future losses; Coverage = Avg. CE/SFL STT’s stressed future losses are based upon various subjective assumptions, and there is no assurance that these assumptions accurately predict maximum potential or likely future losses. For further information, refer to the description and reconciliation provided in the attached appendix. |
STATE STREET CORPORATION
INFORMATION CONCERNING OUR INVESTMENT PORTFOLIO AND ASSET-BACKED COMMERCIAL PAPER CONDUIT PROGRAM
The following is intended to provide a general overview of the terms, analysis and our monthly surveillance process used in the foregoing slides that discuss State Street Corporation’s (“State Street”) investment portfolio and asset-backed commercial paper conduit program. As a general matter, the preceding slides summarize key performance statistics including credit enhancement and the stress analysis, as determined by State Street for each asset position. It should be noted that slides represent a point in time depiction and that results can fluctuate each month.
We place our securities into asset classes using industry standard nomenclature. Some of the asset classes detailed in the slides include government student loans (“Govt. student loans”), private student loans, credit cards, automobile and equipment (“Auto/equipment”), foreign residential mortgage-backed security (“Foreign RMBS”), collateralized loan obligations (“CLOs”), sub-prime mortgages (“Sub-prime”), Home Equity Line of Credit (“HELOC”), agency mortgage-backed security (“Agency MBS”), non-agency mortgage-backed security, non-alternative A (“Non-Agency MBS, Non-Alt-A”), non-agency mortgage-backed security, alternative A (“Non-Agency MBS, Alt-A”), and commercial mortgage-backed securities (“CMBS”).
As noted in the slides, State Street’s investment portfolio and asset-backed commercial paper conduit program contain asset-backed securities (“ABS”) and mortgage-backed securities (“MBS”). ABS represent a secured interest in a pool of assets, while MBS represent ownership of an undivided interest in a group of mortgages. In evaluating each asset position for potential stressed future losses (“SFL”), State Street considers a number of factors including historical cumulative loss (“HCL”), average credit enhancement (“Avg. CE”), and State Street’s coverage amount (“Coverage”). The calculation of each of these factors is discussed in greater detail and with more specificity below.
SFL
Stressed future losses are State Street’s estimate of potential future losses under a stressed economic scenario. We can not provide a generic calculation applicable across all asset classes as our estimates for each asset class are unique and in many cases are not a calculation, but a figure based upon our subjective assessment of relevant worst case historical performance. In the cases where we calculate a projected loss ourselves we describe the calculation in the slides. As SFL can be based upon historical worst case scenarios, SFL will vary among the asset classes, which we describe in our slides. Certain assumptions made by State Street in estimating SFL for various asset classes are set forth below:
Investment Portfolio
• Government Student Loans: Based on the average Sallie Mae Non-consolidation FFELP vintages 2001-2006.
• Private Student Loans: Based on forecasted private student loan gross default rates of 14%-15% with a recovery rate of approximately 50%.
• Credit Cards: Based on the worst single month’s annualized loss rate (November 2005) going back to 1991.
• Auto/Equipment: Based on the worst annual cumulative net loss vintage (2000) going back to 1997 using 80% Lehman Prime Auto Index and 20% Lehman Near Prime Auto Index, generally consistent with the split of the portfolio’s prime and near prime auto holdings.
• Foreign RMBS: Based on the worst annual cumulative net loss experience in the UK (1989).
• CLOs: Based on double the average annual speculative grade default rate of 3.5% with half of the long-term recovery rate on senior secured bank loans of 70%. The annual average default rate is from data covering security issuances from 1970-2005, and the average recover rate of 70% is from data covering issues from 1982-2005.
• Subprime: Calculated by applying projected loss assumptions to the remaining pool of mortgages based upon the stage within the delinquency pipeline, (i.e. current to foreclosure), to obtain a projected future gross loss. A 50% severity rate then applied to obtain the stressed future net loss.
• HELOC: Main assumptions include – 100% loss severity, projected loss rate of current 3-month average loss rate and projected payment rates at current 3-month average payment rates.
• Agency MBS: No losses are assumed due to implied (Fannie Mae and Freddie Mac) or explicit (Ginnie Mae) government guarantee.
• Non-Agency MBS (Non-Alt-A): Calculated by applying projected loss assumptions to the remaining pool of mortgages based upon the stage within the delinquency pipeline, (i.e. current to foreclosure), to obtain a projected future gross loss. A 50% severity rate then applied to obtain the stressed future net loss.
• Non-Agency MBS (Alt-A): Cumulative loss projections of 4.6%.
• CMBS: Based on the 1999 Snyderman, et. al. study estimating long-term losses on commercial mortgages.
Asset Backed Commercial Paper Conduit Program
• Autos: Based on the worst annual cumulative net loss vintage (2000) going back to 1997 using 80% Lehman Prime Auto Index and 20% Lehman Near Prime Auto Index
• U.S. Credit Cards: Based on the worst single month’s annualized loss rate (November 2005) going back to 1991.
• Non-U.S. Credit Cards: Based on Fitch’s published expectations of stress performance for major European credit card master trusts.
• Government Student Loans: Based on the average Sallie Mae Non-consolidation FFELP vintages 2001-2006.
• Private Student Loans: Based on forecasted private student loan gross default rates of 14%-15% with a recovery rate of approximately 50%.
• U.S. RMBS: Cumulative loss projections of 15%.
• U.S. RMBS-HELOC: Main assumptions include – 100% loss severity, projected loss rate of current 3-month average loss rate and projected payment rates at current 3-month average payment rates.
• AUS RMBS: Based on average cumulative mortgage insurance claims frequency of 0.72%, which was then doubled.
• UK RMBS: Based on the highest annual repossession rates in the total UK mortgage market including non-conforming mortgages. This amount was then multiplied by a projected average life of the mortgage securities of 5 years. A 50% loss severity was then applied.
• European RMBS: Based on the UK RMBS SFL as a proxy of the European market as a whole.
HCL
Historical cumulative loss is determined by State Street based upon data obtained from third party providers.
Avg. CE
Credit enhancement is determined by State Street based upon data obtained from third party providers. CE can include excess spread for the most recent year, over-collateralization, cash reserves, and subordination.
Coverage
Coverage is calculated by dividing CE by SFL, which results in the coverage multiple. Coverage is provided as a measure of excess enhancement above our projected future losses under a stressed economic scenario.
As noted above and in the slides, in performing these calculations we collect and use information provided by third party providers. The information we used to create these slides included information from the March surveillance reports that included data from servicer reports received during the month of March. Third party sources use assumptions, judgments and estimates in determining data, and different third parties may provide different data. It should be noted that certain securities report on a quarterly vs. monthly basis. For those securities, the most recent available information was used. It should be noted that industry information, rather than portfolio experience was used in certain instances where industry information resulted in a more conservative approach. State Street does not independently verify the data obtained from third party providers that is used in determining and estimating SFL, HCL, Avg. CE and Coverage and the information is subject to the risk of inaccuracy. As noted above and in the slides, State Street’s estimates are based upon various subjective assumptions, and there is no assurance that these assumptions accurately predict maximum potential or likely future losses.