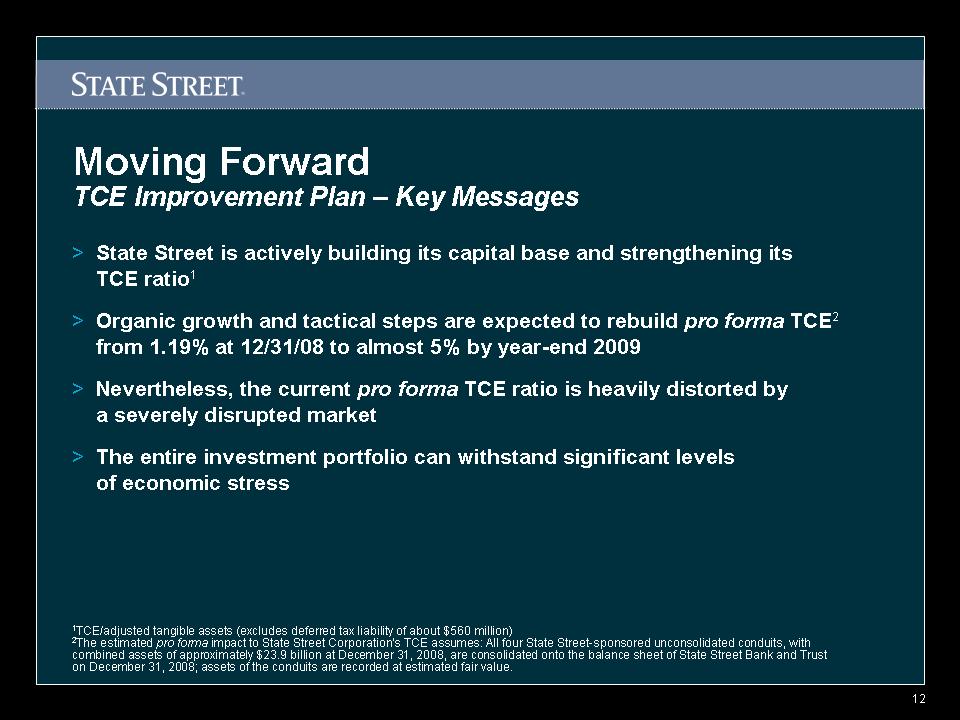
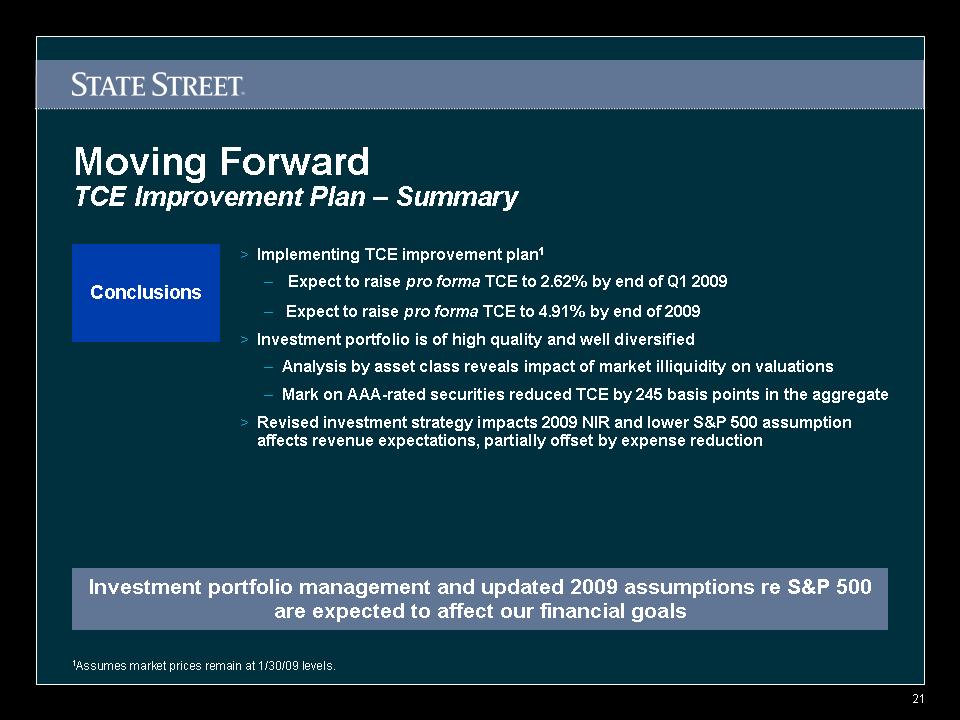
Appendix
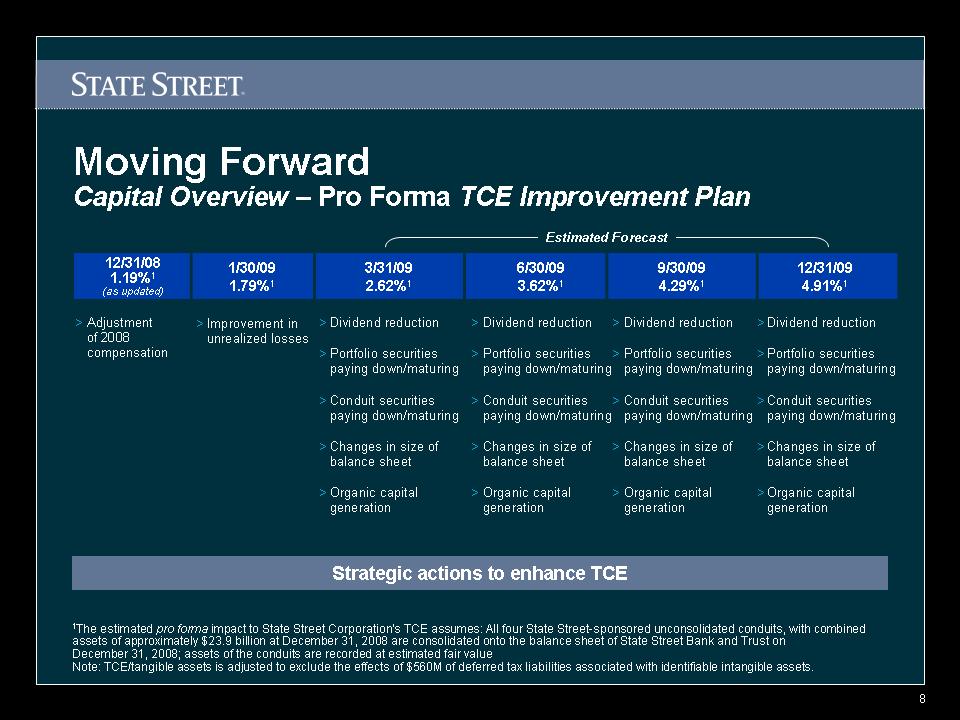
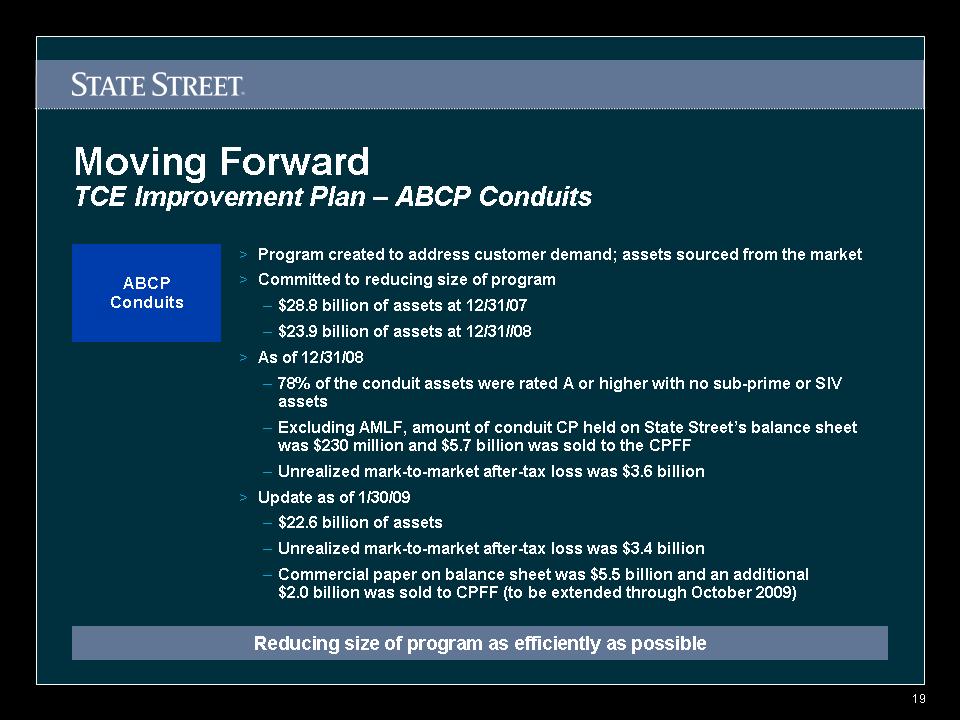
Moving Forward > Program created to address customer requests; assets sourced from the market > Committed to reducing size of program – $28.8 billion of assets at 12/31/07 – $23.9 billion of assets at 12/31//08 > As of 12/31/08 – 78% of the conduit assets were rated A or higher with no sub-prime or SIV assets – Excluding AMLF, amount of conduit CP held on State Street’s balance sheet was $230 million and $5.7 billion was sold to the CPFF – Unrealized mark-to-market after-tax loss was $3.6 billion > Update as of 1/30/09 – $22.6 billion of assets – Unrealized mark-to-market after-tax loss was $3.4 billion – Commercial paper on balance sheet was $5.5 billion and an additional $2.0 billion was sold to CPFF (to be extended through October 2009) ABCP Conduits TCE Improvement Plan – ABCP Conduits Reducing size of program as efficiently as possible
Slide: 0 Moving Forward Program created to address customer requests; assets sourced from the market Committed to reducing size of program $28.8 billion of assets at 12/31/07 $23.9 billion of assets at 12/31//08 As of 12/31/08 78% of the conduit assets were rated A or higher with no sub-prime or SIV assets Excluding AMLF, amount of conduit CP held on State Street’s balance sheet was $230 million and $5.7 billion was sold to the CPFF Unrealized mark-to-market after-tax loss was $3.6 billion Update as of 1/30/09 $22.6 billion of assets Unrealized mark-to-market after-tax loss was $3.4 billion Commercial paper on balance sheet was $5.5 billion and an additional $2.0 billion was sold to CPFF ABCP Conduits TCE Improvement Plan – ABCP Conduits Reducing size of program as efficiently as possible

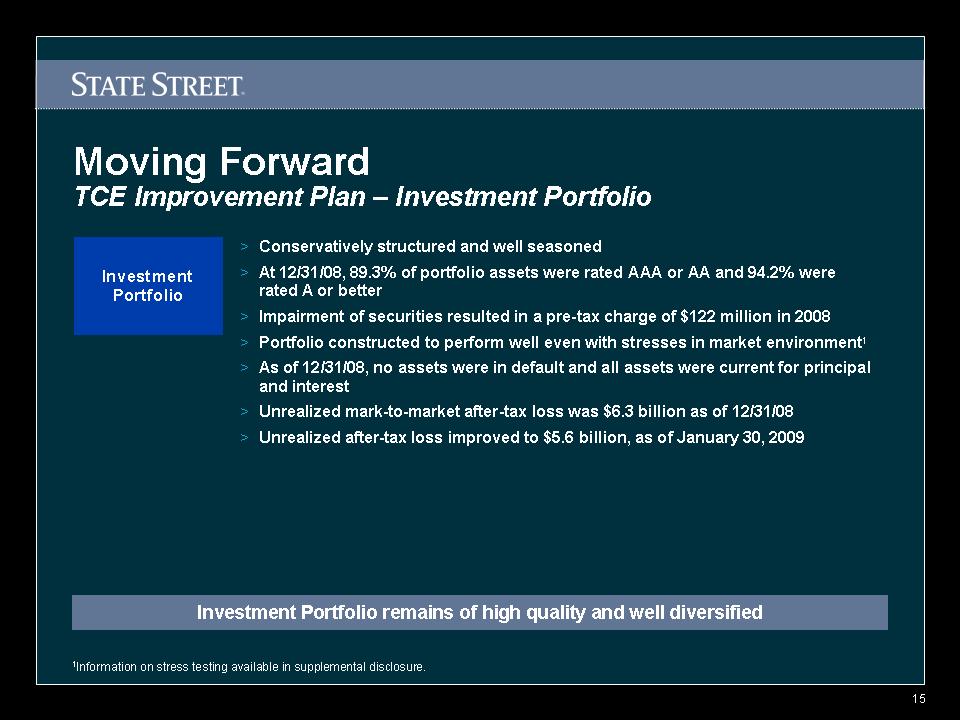
Moving Forward > Conservatively structured and well seasoned > At 12/31/08, 89.3% of portfolio assets were rated AAA or AA and 94.2% were rated A or better > Impairment of securities resulted in a pre-tax charge of $122 million in 2008 > Portfolio constructed to perform well even with stresses in market environment1 > As of 12/31/08, no assets were in default and all assets were current for principal and interest > Unrealized mark-to-market after-tax loss was $6.3 billion as of 12/31/08 > Unrealized after-tax loss improved to $5.6 billion, as of January 30, 2009 Investment Portfolio TCE Improvement Plan – Investment Portfolio Investment Portfolio remains of high quality and well diversified 1Information on stress testing available in supplemental disclosure.
Slide: 1 Moving Forward Conservatively structured and well seasoned At 12/31/08, 89.4% of portfolio assets were rated AAA or AA and 94.3% were rated A or better Impaired $122 million in 2008 Portfolio constructed to perform well even with stresses in market environment1 As of 12/31/08, no assets were in default and all assets were current for principal and interest Unrealized mark-to-market after-tax loss was $6.3 billion as of 12/31/08 Unrealized after-tax loss improved to $5.6 billion, as of January 30, 2009 Investment Portfolio TCE Improvement Plan – Investment Portfolio Investment Portfolio remains of high quality and well diversified 1Information on stress testing available in supplemental disclosure.
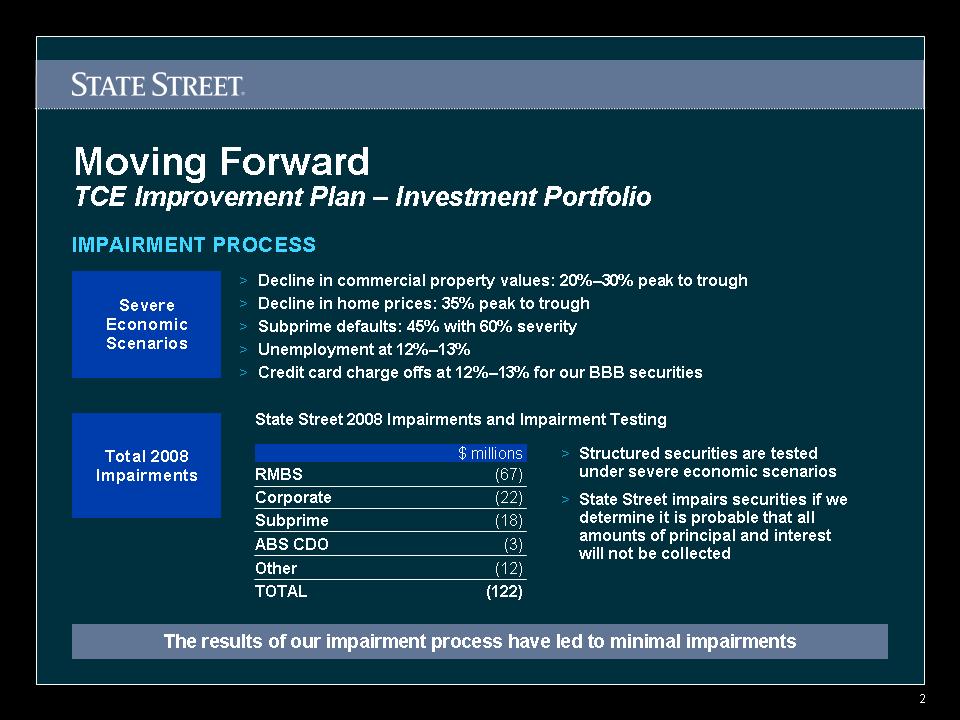
Slide: 2 Moving Forward Decline in commercial property values: 20%–30% peak to trough Decline in home prices: 35% peak to trough Subprime defaults: 45% with 60% severity Unemployment at 12%–13% Credit card charge offs at 12%–13% for our BBB securities Severe Economic Scenarios Total 2008 Impairments State Street 2008 Impairments and Impairment Testing Structured securities are tested under severe economic scenarios State Street impairs securities if we determine it is probable that all amounts of principal and interest will not be collected TCE Improvement Plan – Investment Portfolio IMPAIRMENT PROCESS The results of our impairment process have led to minimal impairments $ millions RMBS (67) Corporate (22) Subprime (18) ABS CDO (3) Other (12) TOTAL (122)
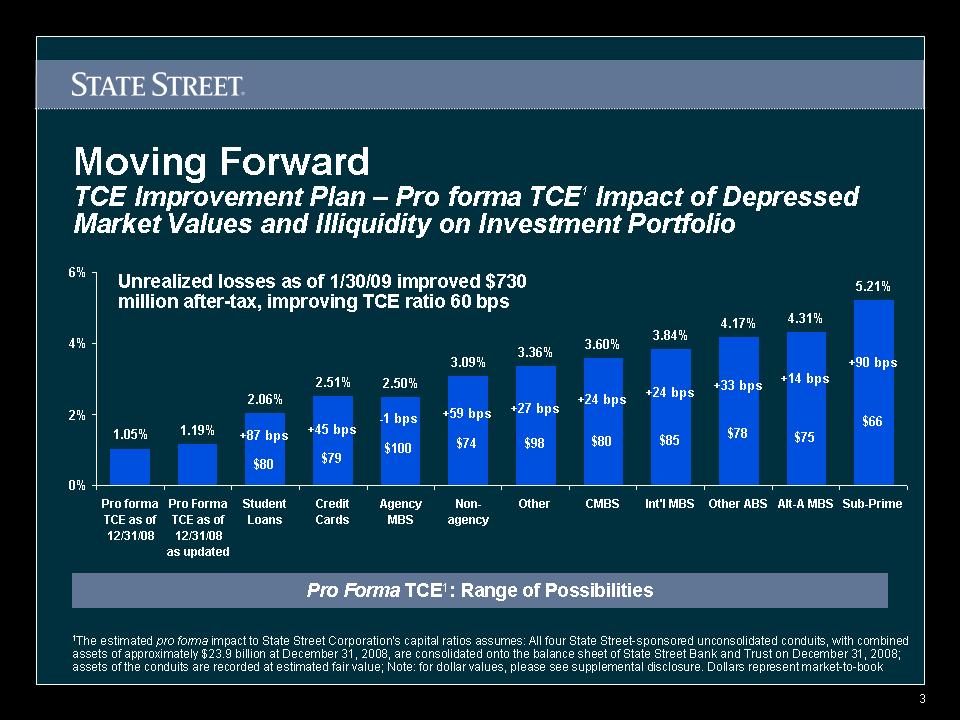
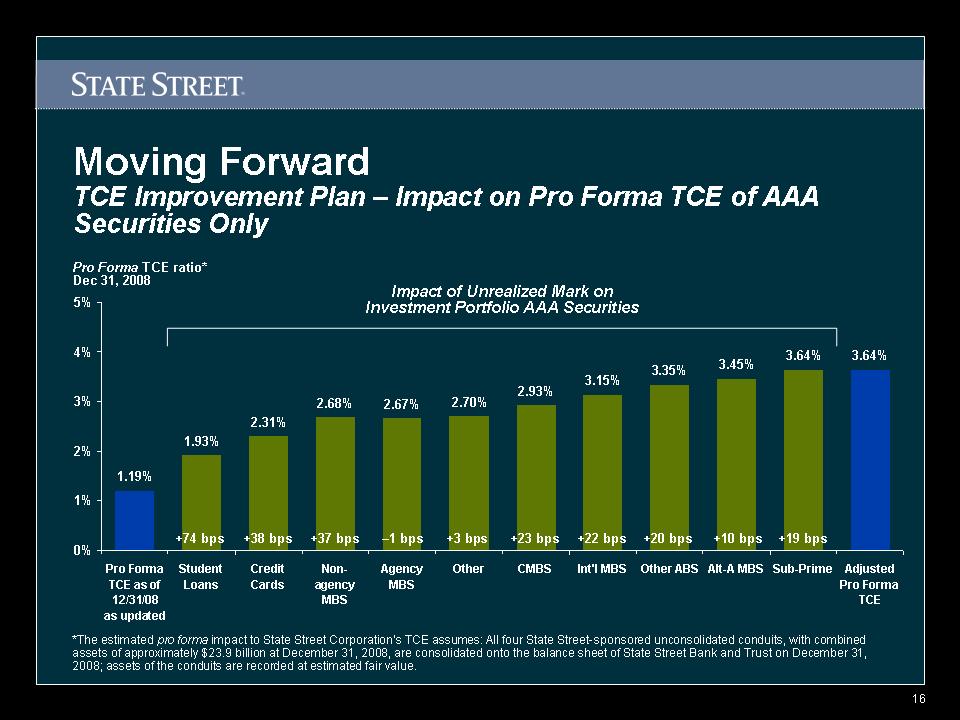
Slide: 3 TCE Improvement Plan – Pro forma TCE1 Impact of Depressed Market Values and Illiquidity on Investment Portfolio Moving Forward Pro Forma TCE1: Range of Possibilities 1The estimated pro forma impact to State Street Corporation’s capital ratios assumes: All four State Street-sponsored unconsolidated conduits, with combined assets of approximately $23.9 billion at December 31, 2008, are consolidated onto the balance sheet of State Street Bank and Trust on December 31, 2008; assets of the conduits are recorded at estimated fair value; Note: for dollar values, please see supplemental disclosure. Dollars represent market-to-book +87 bps $80 +45 bps $79 -1 bps $100 +27 bps $98 +24 bps $80 +24 bps $85 +33 bps $78 +14 bps $75 Unrealized losses as of 1/30/09 improved $730 million after-tax, improving TCE ratio 60 bps +90 bps $66 +59 bps $74 Pro forma TCE as of 12/31/08 Pro Forma TCE as of 12/31/08 as updated Student Loans Credit Cards Agency MBS Non-agency Other CMBS Int'l MBS Other ABS Alt-A MBS Sub-Prime East 1.05% 1.19% 2.06% 2.51% 2.50% 3.09% 3.36% 3.60% 3.84% 4.17% 4.31% 5.21%
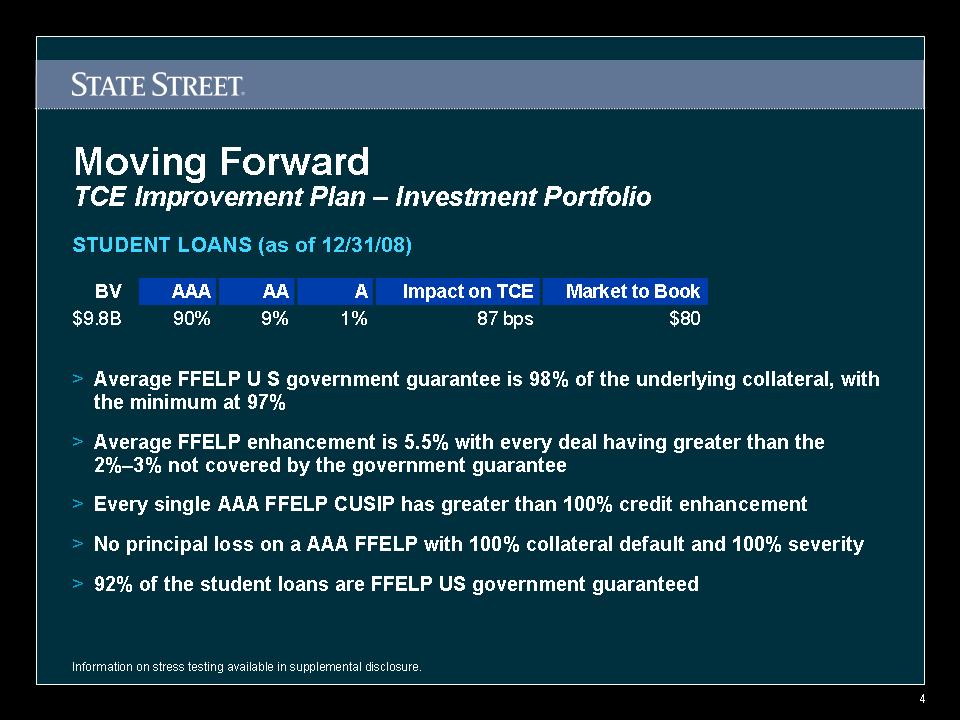
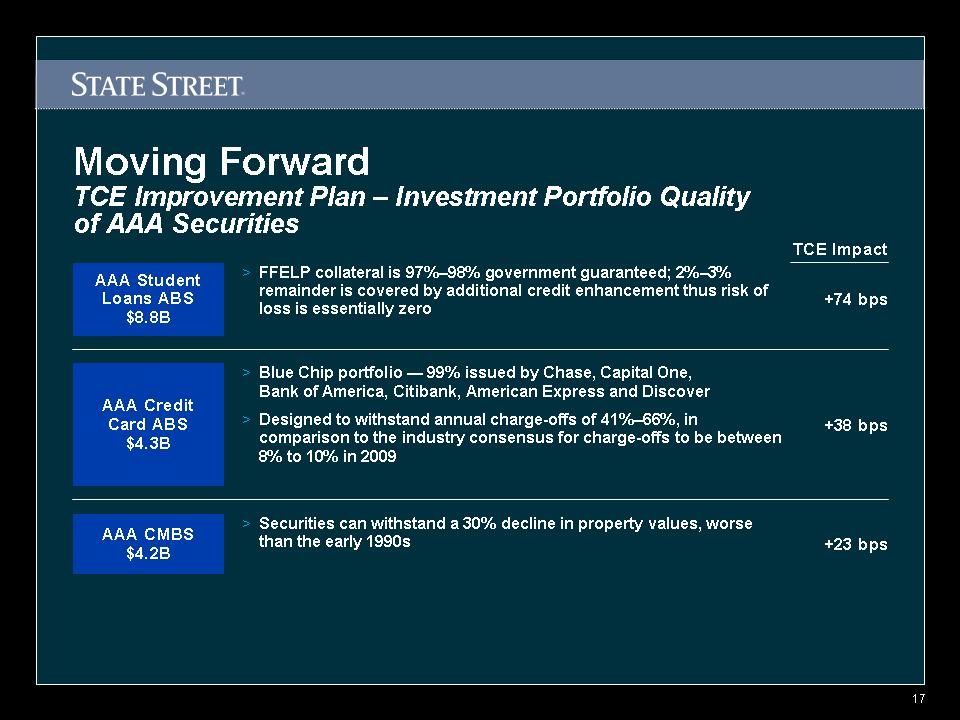
Slide: 4 Moving Forward TCE Improvement Plan – Investment Portfolio Average FFELP U S government guarantee is 98% of the underlying collateral, with the minimum at 97% Average FFELP enhancement is 5.5% with every deal having greater than the 2%–3% not covered by the government guarantee Every single AAA FFELP CUSIP has greater than 100% credit enhancement No principal loss on a AAA FFELP with 100% collateral default and 100% severity 92% of the student loans are FFELP US government guaranteed Information on stress testing available in supplemental disclosure. STUDENT LOANS (as of 12/31/08) BV AAA AA A Impact on TCE Market to Book $9.8B 90% 9% 1% 87 bps $80
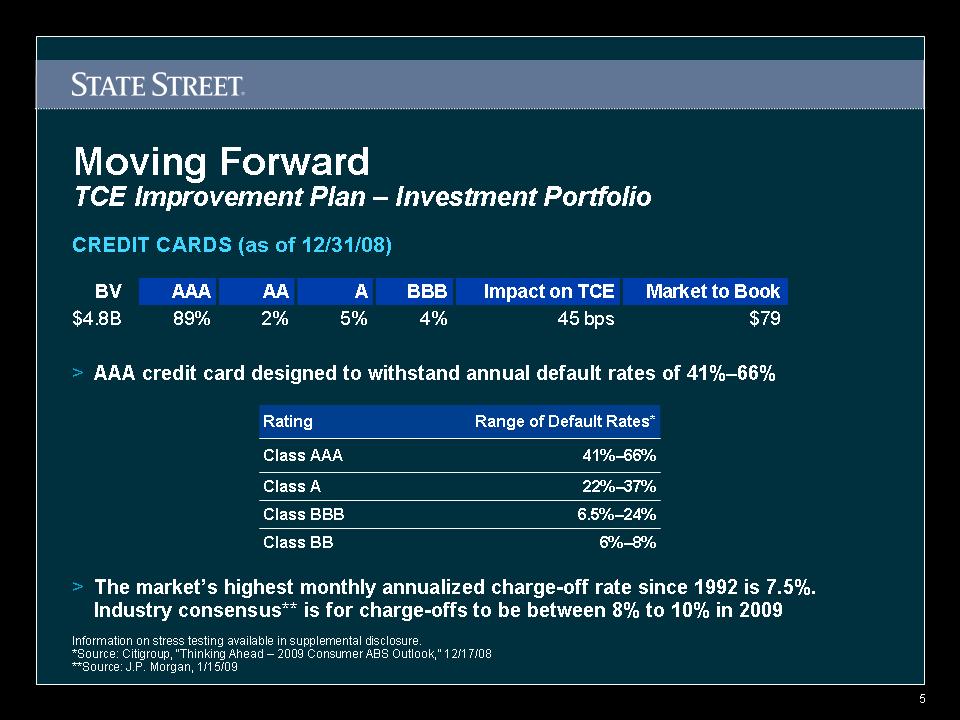
Slide: 5 Moving Forward The market’s highest monthly annualized charge-off rate since 1992 is 7.5%. Industry consensus** is for charge-offs to be between 8% to 10% in 2009 Information on stress testing available in supplemental disclosure. *Source: Citigroup, “Thinking Ahead – 2009 Consumer ABS Outlook,” 12/17/08 **Source: J.P. Morgan, 1/15/09 BV AAA AA A BBB Impact on TCE Market to Book $4.8B 89% 2% 5% 4% 45 bps $79 AAA credit card designed to withstand annual default rates of 41%–66% Rating Range of Default Rates* Class AAA 41%–66% Class A 22%–37% Class BBB 6.5%–24% Class BB 6%–8% CREDIT CARDS (as of 12/31/08)
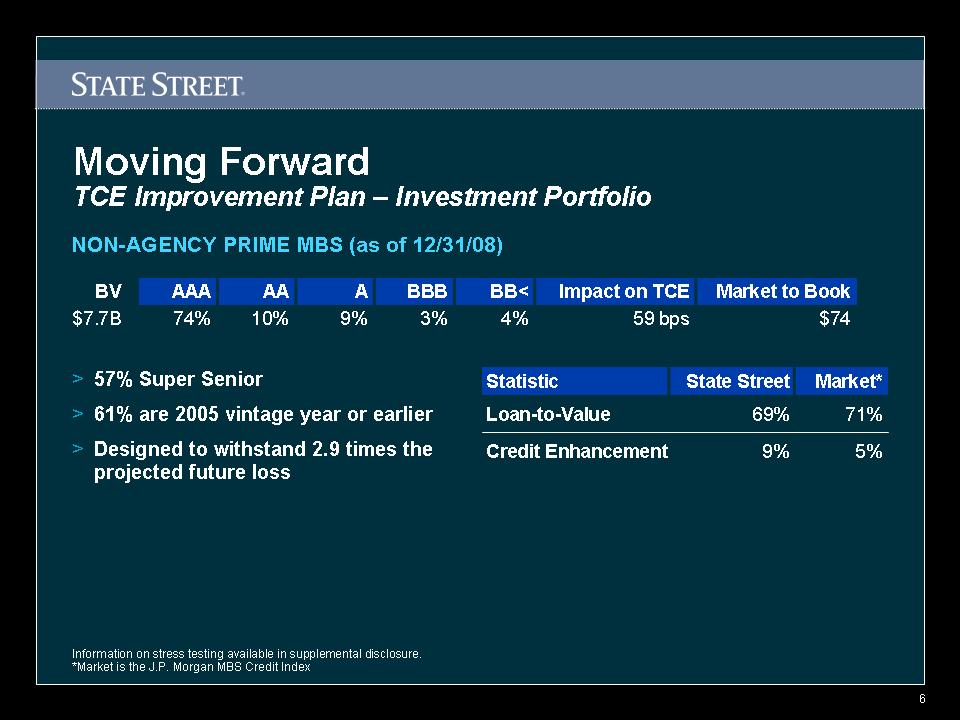
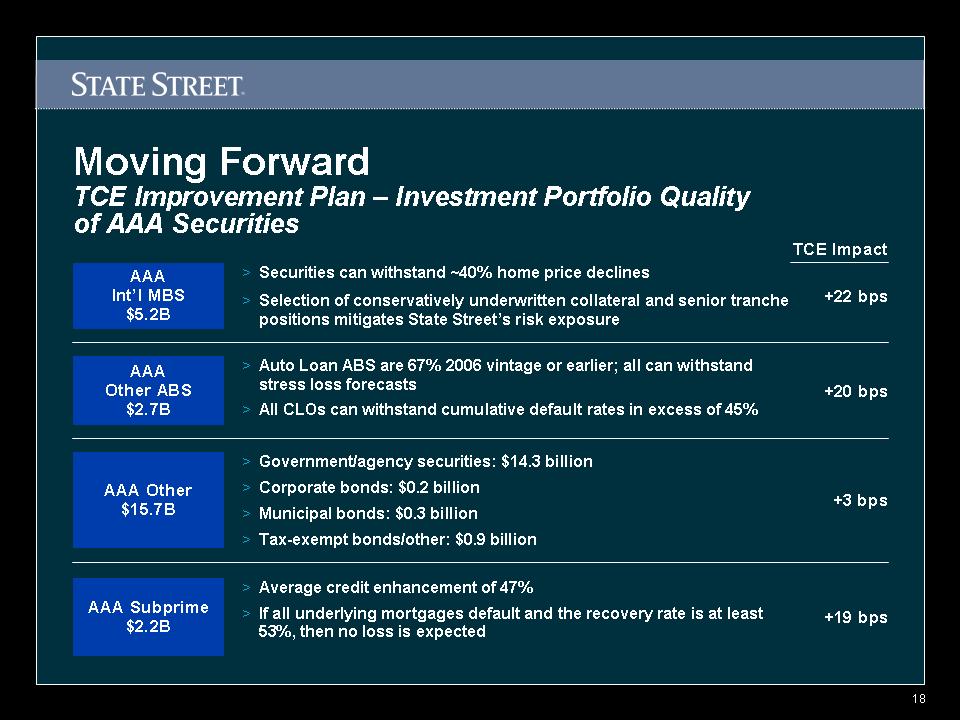
Slide: 6 Moving Forward Information on stress testing available in supplemental disclosure. *Market is the J.P. Morgan MBS Credit Index NON-AGENCY PRIME MBS (as of 12/31/08) TCE Improvement Plan – Investment Portfolio 57% Super Senior 61% are 2005 vintage year or earlier Designed to withstand 2.9 times the projected future loss BV AAA AA A BBB BB< Impact on TCE Market to Book $7.7B 74% 10% 9% 3% 4% 59 bps $74 Statistic State Street Market* Loan-to-Value 69% 71% Credit Enhancement 9% 5%
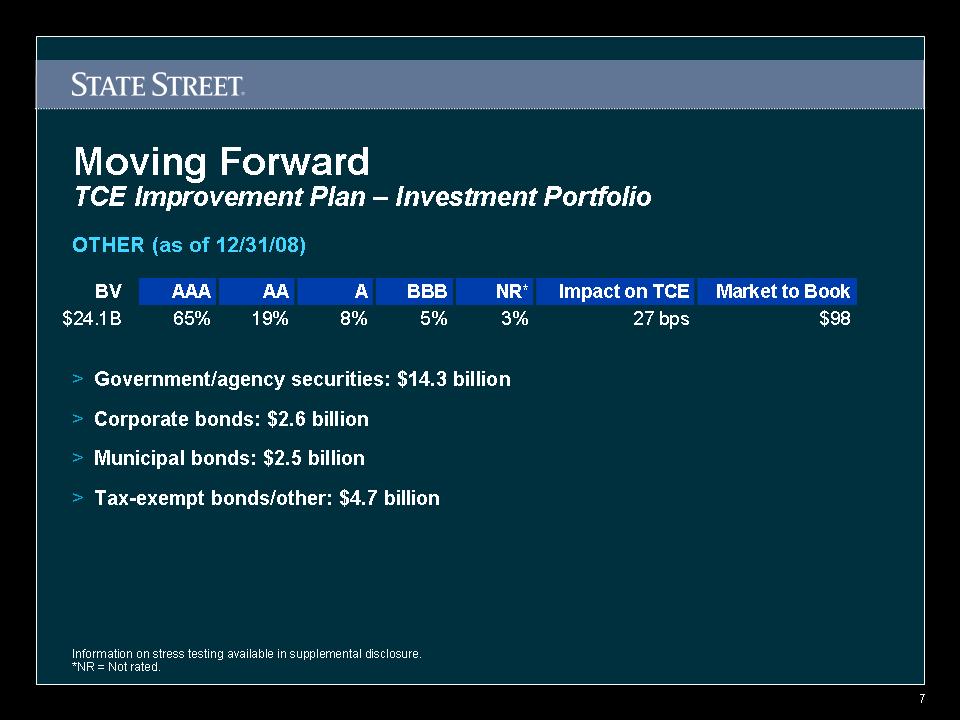
Slide: 7 Moving Forward OTHER (as of 12/31/08) TCE Improvement Plan – Investment Portfolio Government/agency securities: $14.3 billion Corporate bonds: $2.6 billion Municipal bonds: $2.5 billion Tax-exempt bonds/other: $4.7 billion Information on stress testing available in supplemental disclosure. *NR = Not rated. BV AAA AA A BBB NR* Impact on TCE Market to Book $24.1B 65% 19% 8% 5% 3% 27 bps $98
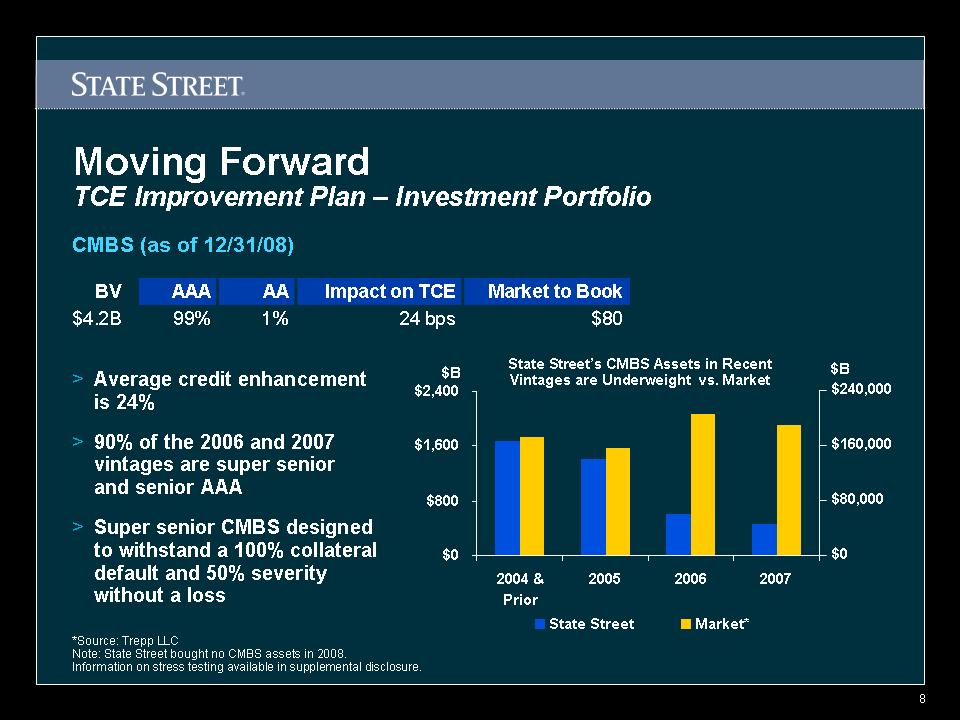
Slide: 8 Moving Forward *Source: Trepp LLC Note: State Street bought no CMBS assets in 2008. Information on stress testing available in supplemental disclosure. TCE Improvement Plan – Investment Portfolio Average credit enhancement is 24% 90% of the 2006 and 2007 vintages are super senior and senior AAA Super senior CMBS designed to withstand a 100% collateral default and 50% severity without a loss $240,000 $160,000 $80,000 $0 $B $B State Street’s CMBS Assets in Recent Vintages are Underweight vs. Market CMBS (as of 12/31/08) BV AAA AA Impact on TCE Market to Book $4.2B 99% 1% 24 bps $80 2004 & Prior 2005 2006 2007 State Street $1,683 $1,410 $611 $465 Market* $1,741 $1,571 $2,072 $1,907
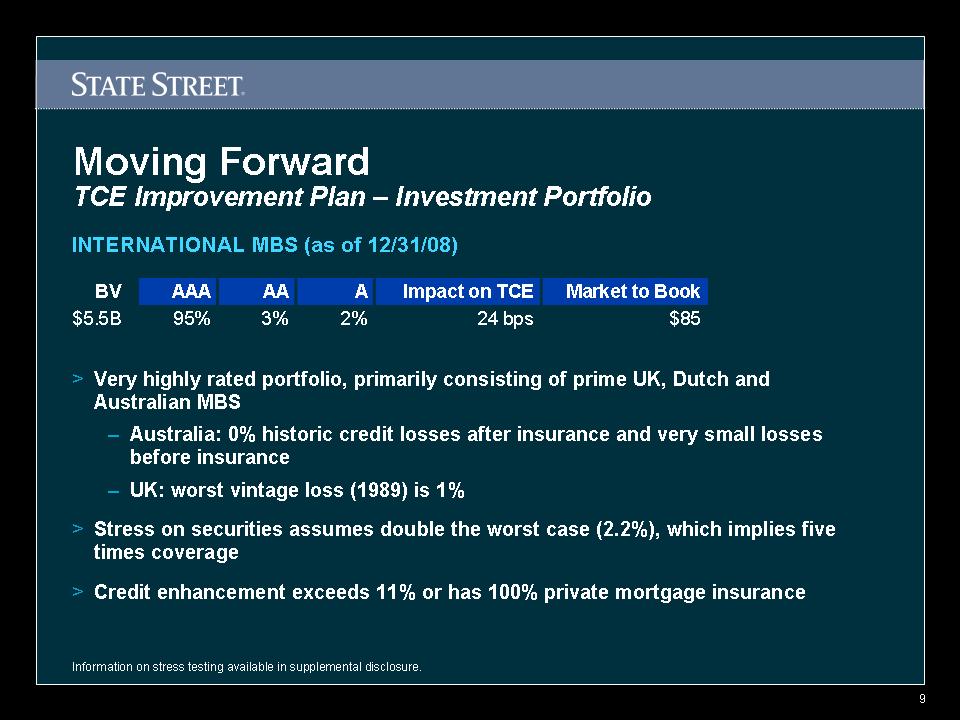
Slide: 9 Moving Forward INTERNATIONAL MBS (as of 12/31/08) TCE Improvement Plan – Investment Portfolio Very highly rated portfolio, primarily consisting of prime UK, Dutch and Australian MBS Australia: 0% historic credit losses after insurance and very small losses before insurance UK: worst vintage loss (1989) is 1% Stress on securities assumes double the worst case (2.2%), which implies five times coverage Credit enhancement exceeds 11% or has 100% private mortgage insurance Information on stress testing available in supplemental disclosure. BV AAA AA A Impact on TCE Market to Book $5.5B 95% 3% 2% 24 bps $85
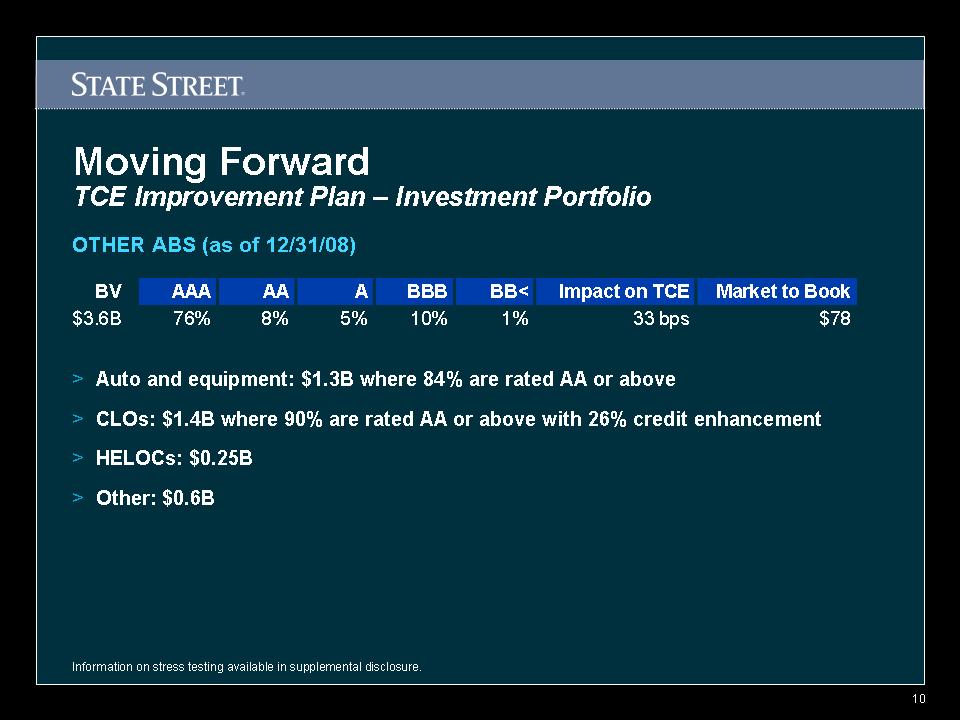
Slide: 10 Moving Forward OTHER ABS (as of 12/31/08) TCE Improvement Plan – Investment Portfolio Auto and equipment: $1.3B where 84% are rated AA or above CLOs: $1.4B where 90% are rated AA or above with 26% credit enhancement HELOCs: $0.25B Other: $0.6B Information on stress testing available in supplemental disclosure. BV AAA AA A BBB BB< Impact on TCE Market to Book $3.6B 76% 8% 5% 10% 1% 33 bps $78
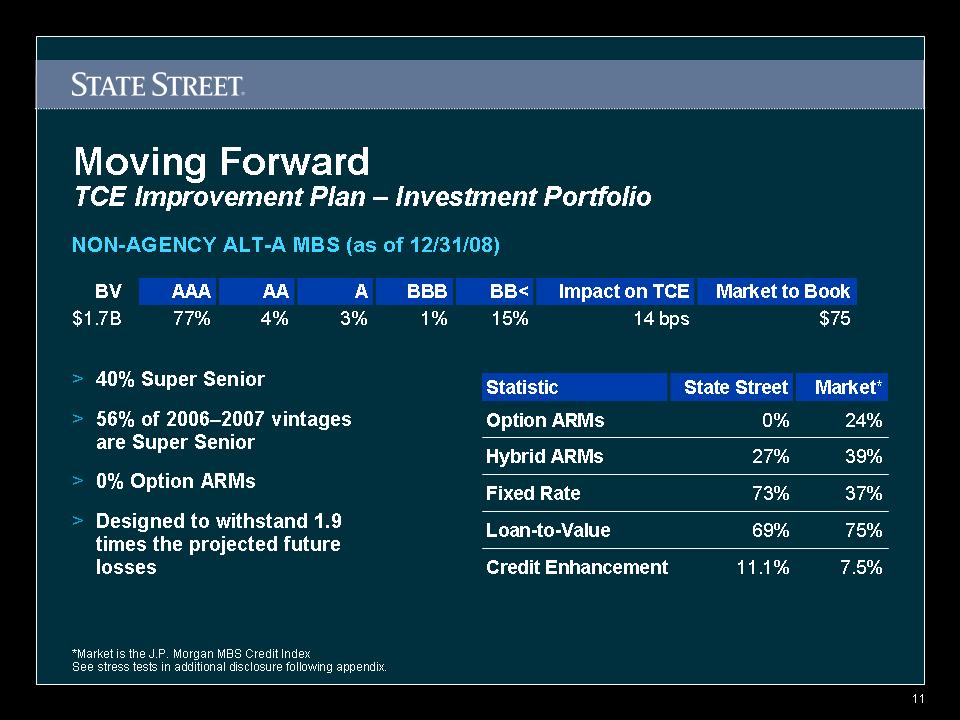
Slide: 11 Moving Forward *Market is the J.P. Morgan MBS Credit Index See stress tests in additional disclosure following appendix. TCE Improvement Plan – Investment Portfolio NON-AGENCY ALT-A MBS (as of 12/31/08) 40% Super Senior 56% of 2006–2007 vintages are Super Senior 0% Option ARMs Designed to withstand 1.9 times the projected future losses BV AAA AA A BBB BB< Impact on TCE Market to Book $1.7B 77% 4% 3% 1% 15% 14 bps $75 Statistic State Street Market* Option ARMs 0% 24% Hybrid ARMs 27% 39% Fixed Rate 73% 37% Loan-to-Value 69% 75% Credit Enhancement 11.1% 7.5%
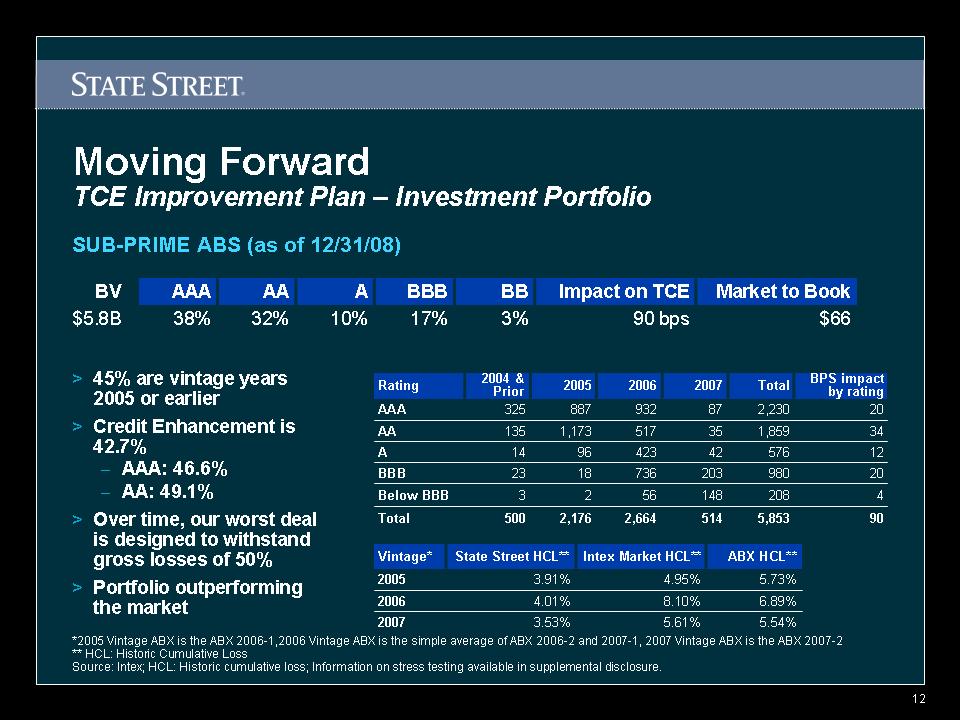
Slide: 12 Moving Forward *2005 Vintage ABX is the ABX 2006-1,2006 Vintage ABX is the simple average of ABX 2006-2 and 2007-1, 2007 Vintage ABX is the ABX 2007-2 ** HCL: Historic Cumulative Loss Source: Intex; HCL: Historic cumulative loss; Information on stress testing available in supplemental disclosure. SUB-PRIME ABS (as of 12/31/08) TCE Improvement Plan – Investment Portfolio 45% are vintage years 2005 or earlier Credit Enhancement is 42.7% AAA: 46.6% AA: 49.1% Over time, our worst deal is designed to withstand gross losses of 50% Portfolio outperforming the market BV AAA AA A BBB BB Impact on TCE Market to Book $5.8B 38% 32% 10% 17% 3% 90 bps $66 Rating 2004 & Prior 2005 2006 2007 Total BPS impact by rating AAA 325 887 932 87 2,230 20 AA 135 1,173 517 35 1,859 34 A 14 96 423 42 576 12 BBB 23 18 736 203 980 20 Below BBB 3 2 56 148 208 4 Total 500 2,176 2,664 514 5,853 90 Vintage* State Street HCL** Intex Market HCL** ABX HCL** 2005 3.91% 4.95% 5.73% 2006 4.01% 8.10% 6.89% 2007 3.53% 5.61% 5.54%