Fueling State Street’s Growth
Ronald E. Logue
President and Chief Operating Officer
| |
| [LOGO] | | STATE STREET. |
| | | For Everything You Invest InTM |
STATE STREET.
Reminder
This presentation includes discussion of State Street Corporation’s financial and business goals and strategies, which may be perceived as “forward-looking statements” as defined by Federal Securities Laws. Actual results could differ materially, and there can be no assurance that goals will be achieved. For a discussion of some of the factors that may affect State Street’s goals, please see the 2002 annual report and subsequent SEC filings, especially the sections captioned “Financial Goals and Factors That May Affect Them,” and any subsequent Securities and Exchange Commission filings.

STATE STREET.
Agenda
Building on a Solid Foundation of Growth | | Continuing to Grow Core Business | | Integrating GSS | | Investing in Strategic Opportunities |
|
| Fueling State Street’s Growth |
STATE STREET.
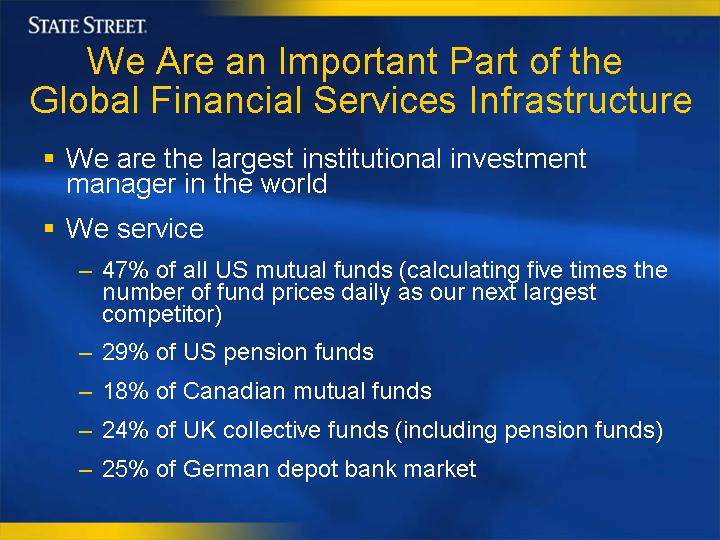
We Are an Important Part of the
Global Financial Services Infrastructure
| n | | We are the largest institutional investment manager in the world |
| | – | | 47% of all US mutual funds (calculating five times the number of fund prices daily as our next largest competitor) |
| | – | | 29% of US pension funds |
| | – | | 18% of Canadian mutual funds |
| | – | | 24% of UK collective funds (including pension funds) |
| | – | | 25% of German depot bank market |
STATE STREET.
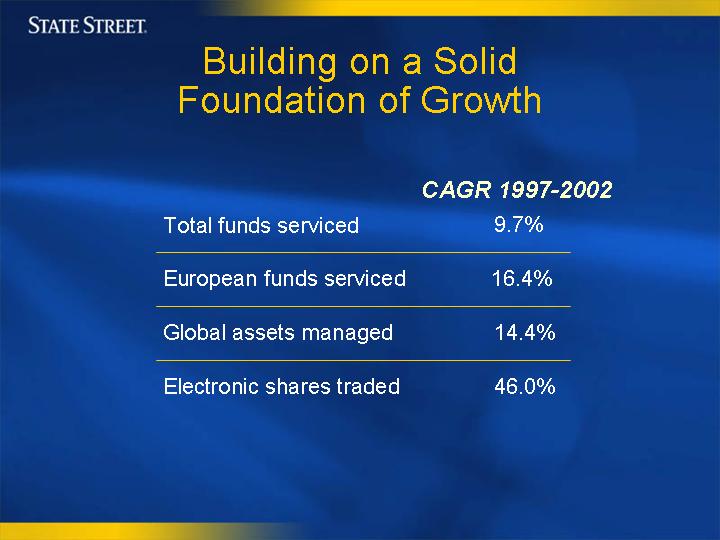
Building on a Solid
Foundation of Growth
| | | CAGR 1997-2002
| |
Total funds serviced | | 9.7 | % |
European funds serviced | | 16.4 | % |
Global assets managed | | 14.4 | % |
Electronic shares traded | | 46.0 | % |
STATE STREET.
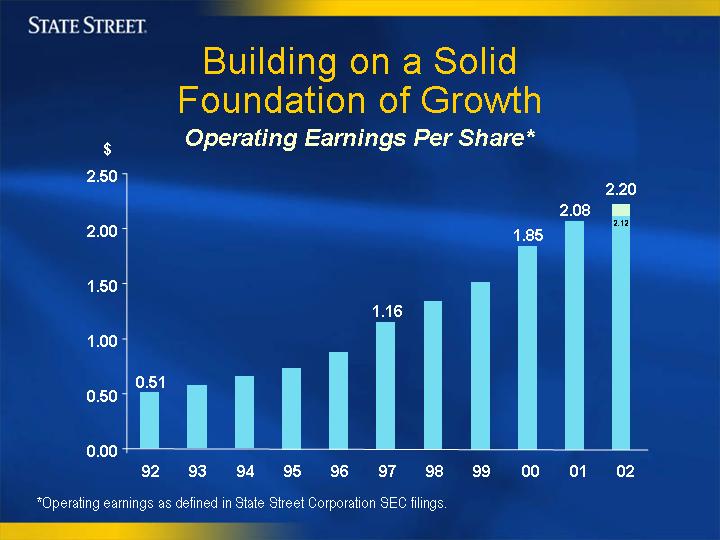
Building on a Solid
Foundation of Growth
Operating Earnings Per Share*
[Graphic]
| * | | Operating earnings as defined in State Street Corporation SEC filings. |
STATE STREET.
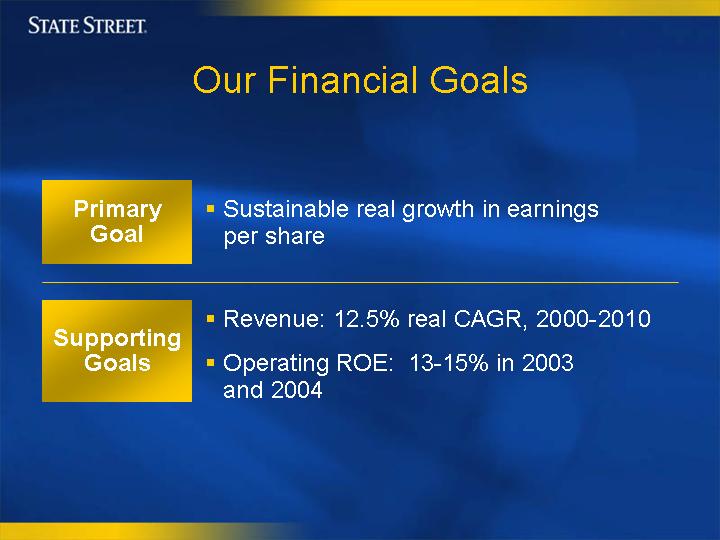
Our Financial Goals
Primary
Goal | | n Sustainable real growth in earnings per share |
| |
Supporting
Goals | | n Revenue: 12.5% real CAGR, 2000-2010 n Operating ROE: 13-15% in 2003 and 2004 |
STATE STREET.
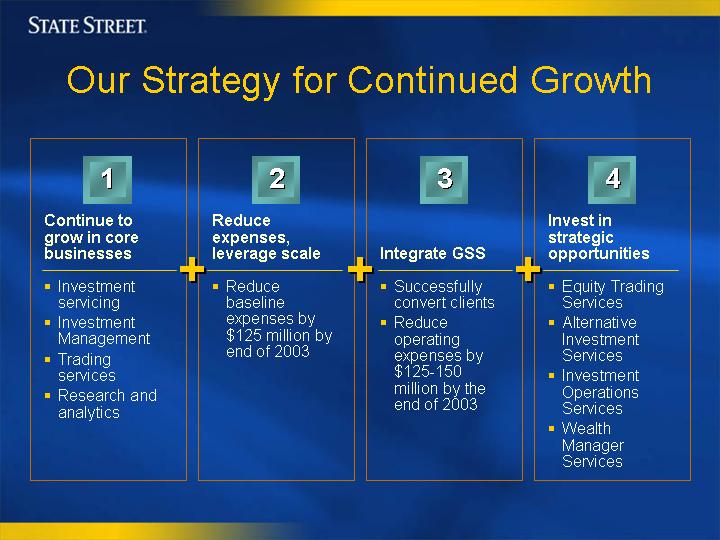
Our Strategy for Continued Growth
| 1 | | 2 | | 3 | | 4 | | |
Continue to grow in core businesses | | Reduce expenses, leverage scale | | Integrate GSS | | Invest in strategic opportunities | | |
| | | | |
n Investment servicing | | n Reduce baseline expenses by $125 million by end of 2003 | | n Successfully convert clients | | n Equity Trading Services | | |
| | | | |
n Investment Management | | | | n Reduce operating expenses by $125-150 million by the end of 2003 | | n Alternative Investment Services | | |
| | | | |
n Trading services | | | | | | n Investment Operations Services | | |
| | | | |
n Research and analytics | | | | | | n Wealth Manager Services | | |

STATE STREET.
Continuing to Grow
Core Business
STATE STREET.
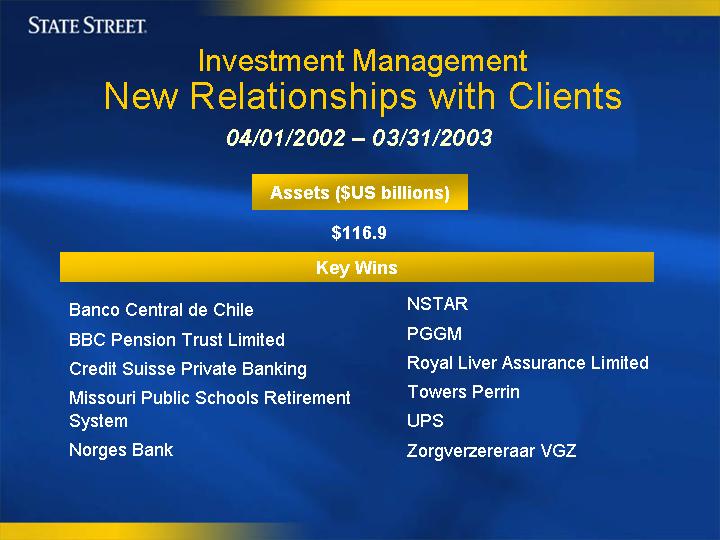
Investment Management
New Relationships with Clients
04/01/2002 – 03/31/2003
Assets ($US billions)
$116.9
Key Wins
Banco Central de Chile | | NSTAR |
BBC Pension Trust Limited | | PGGM |
Credit Suisse Private Banking | | Royal Liver Assurance Limited |
Missouri Public Schools Retirement | | Towers Perrin |
System | | UPS |
Norges Bank | | Zorgverzereraar VGZ |
STATE STREET.
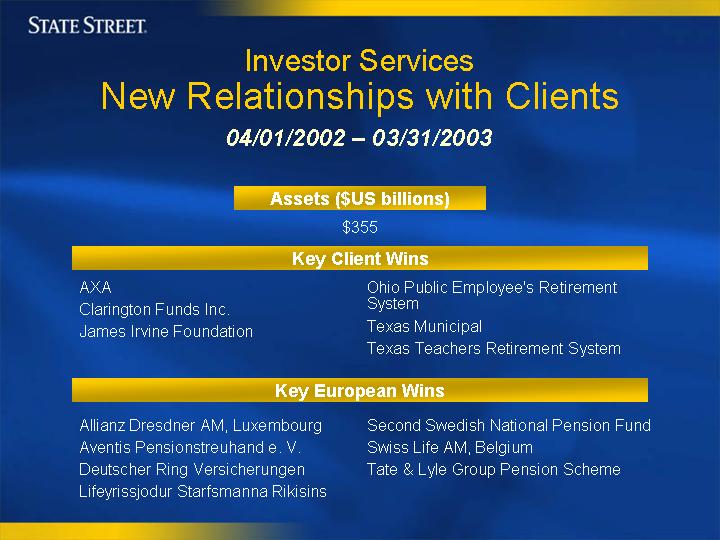
Investor Services
New Relationships with Clients
04/01/2002 – 03/31/2003
Assets ($US billions)
$355
Key Client Wins
AXA | | Ohio Public Employee’s Retirement |
Clarington Funds Inc. | | System |
James Irvine Foundation | | Texas Municipal |
| | | Texas Teachers Retirement System |
Key European Wins
Allianz Dresdner AM, Luxembourg | | Second Swedish National Pension Fund |
Aventis Pensionstreuhand e. V. | | Swiss Life AM, Belgium |
Deutscher Ring Versicherungen | | Tate & Lyle Group Pension Scheme |
Lifeyrissjodur Starfsmanna Rikisins | | |
STATE STREET.
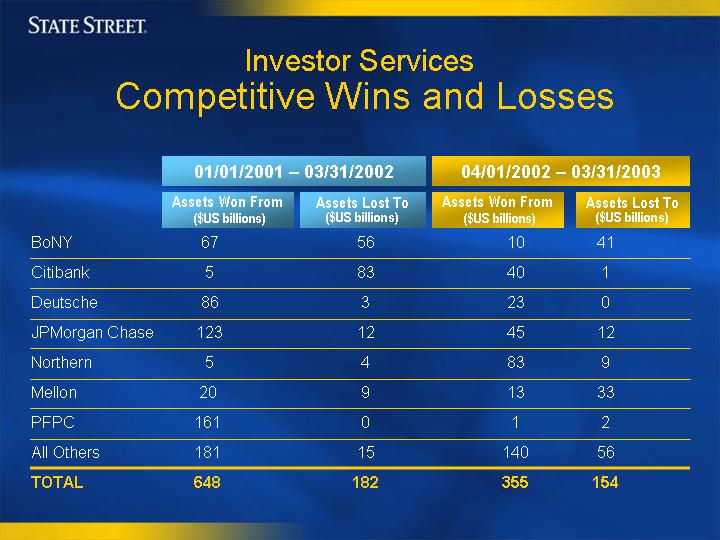
Investor Services
Competitive Wins and Losses
| | | 01/01/2001 – 03/31/2002
| | 04/01/2002 – 03/31/2003
|
| | | Assets Won From ($US billions)
| | Assets Lost To ($US billions)
| | Assets Won From ($US billions)
| | Assets Lost To ($US billions)
|
BoNY | | 67 | | 56 | | 10 | | 41 |
Citibank | | 5 | | 83 | | 40 | | 1 |
Deutsche | | 86 | | 3 | | 23 | | 0 |
JPMorgan Chase | | 123 | | 12 | | 45 | | 12 |
Northern | | 5 | | 4 | | 83 | | 9 |
Mellon | | 20 | | 9 | | 13 | | 33 |
PFPC | | 161 | | 0 | | 1 | | 2 |
All Others | | 181 | | 15 | | 140 | | 56 |
| | |
| |
| |
| |
|
TOTAL | | 648 | | 182 | | 355 | | 154 |
| | |
| |
| |
| |
|
STATE STREET.
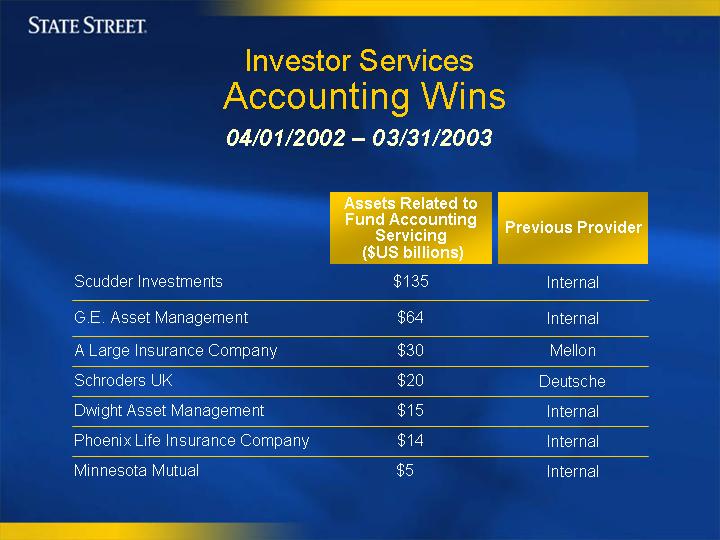
Investor Services
Accounting Wins
04/01/2002 – 03/31/2003
| | | Assets Related to
Fund Accounting
Servicing ($US billions)
| | Previous Provider
|
Scudder Investments | | $ | 135 | | Internal |
G.E. Asset Management | | $ | 64 | | Internal |
A Large Insurance Company | | $ | 30 | | Mellon |
Schroders UK | | $ | 20 | | Deutsche |
Dwight Asset Management | | $ | 15 | | Internal |
Phoenix Life Insurance Company | | $ | 14 | | Internal |
Minnesota Mutual | | $ | 5 | | Internal |
STATE STREET.
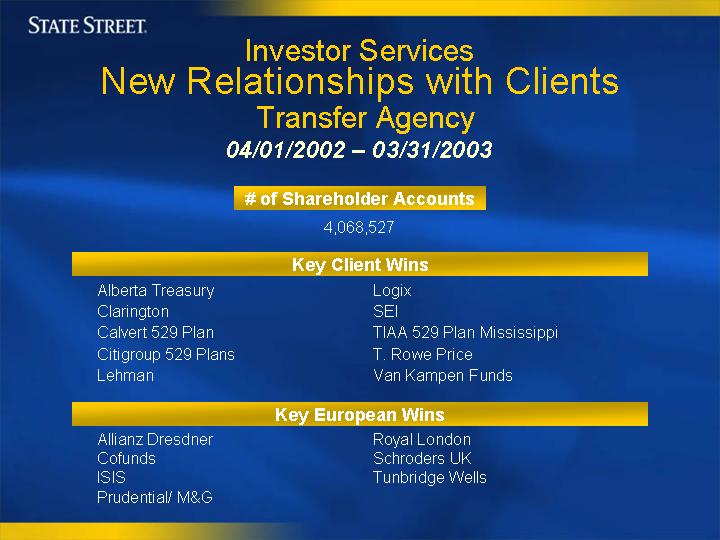
Investor Services
New Relationships with Clients
Transfer Agency
04/01/2002 – 03/31/2003
# of Shareholder Accounts
4,068,527
Key Client Wins
Alberta Treasury | | Logix |
Clarington | | SEI |
Calvert 529 Plan | | TIAA 529 Plan Mississippi |
Citigroup 529 Plans | | T. Rowe Price |
Lehman | | Van Kampen Funds |
Key European Wins
Allianz Dresdner | | Royal London |
Cofunds | | Schroders UK |
ISIS | | Tunbridge Wells |
Prudential/ M&G | | |

STATE STREET.
Reducing Expenses
Leveraging Scale
STATE STREET.
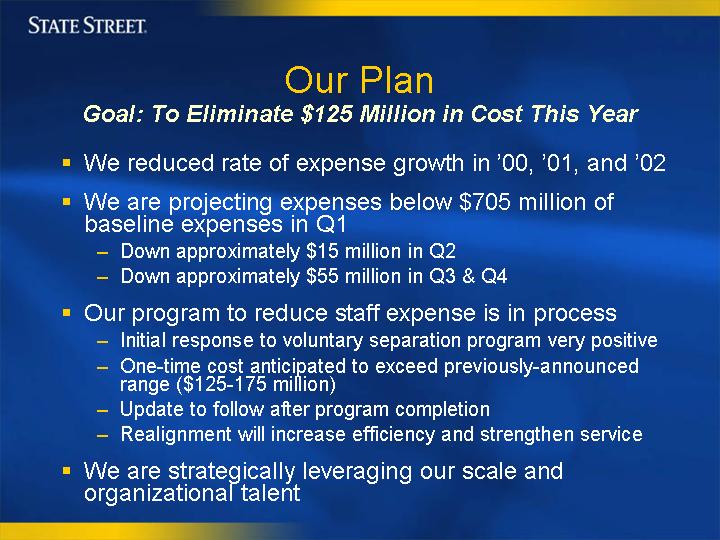
Our Plan
Goal: To Eliminate $125 Million in Cost This Year
| n | | We reduced rate of expense growth in ‘00, ‘01, and ‘02 |
| n | | We are projecting expenses below $705 million of baseline expenses in Q1 |
| | – | | Down approximately $15 million in Q2 |
| | – | | Down approximately $55 million in Q3 & Q4 |
| n | | Our program to reduce staff expense is in process |
| | – | | Initial response to voluntary separation program very positive |
| | – | | One-time cost anticipated to exceed previously-announced range ($125-175 million) |
| | – | | Update to follow after program completion |
| | – | | Realignment will increase efficiency and strengthen service |
| n | | We are strategically leveraging our scale and organizational talent |

STATE STREET.
Integrating GSS
STATE STREET.
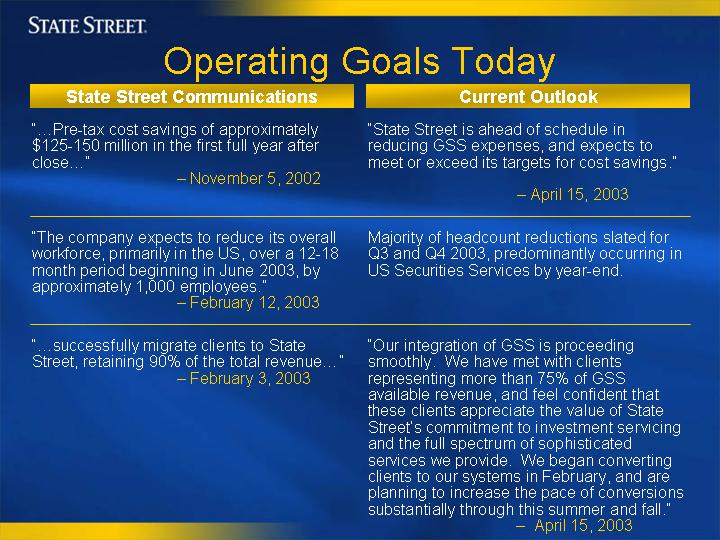
Operating Goals Today
State Street Communications
| | Current Outlook
|
“…Pre-tax cost savings of approximately $125-150 million in the first full year after close…” – November 5, 2002 | | “State Street is ahead of schedule in reducing GSS expenses, and expects to meet or exceed its targets for cost savings.” – Apil 15, 2003 |
| |
“The company expects to reduce its overall workforce, primarily in the US, over a 12-18 month period beginning in June 2003, by approximately 1,000 employees.” – February 12, 2003 | | Majority of headcount reductions slated for Q3 and Q4 2003, predominantly occurring in US Securities Services by year-end. |
| |
“…successfully migrate clients to State Street, retaining 90% of the total revenue…” – February 3, 2003 | | “Our integration of GSS is proceeding smoothly. We have met with clients representing more than 75% of GSS available revenue, and feel confident that these clients appreciate the value of State Street’s commitment to investment servicing and the full spectrum of sophisticated services we provide. We began converting clients to our systems in February, and are planning to increase the pace of conversions substantially through this summer and fall.” – April 15, 2003 |

STATE STREET.
GSS Client Composition
% of Total Revenue
As of March 31, 2003
1,320 Total Clients
$1.9T Total AUC
$575M Total Revenue
[PIE CHART]
| n | | Top 100 clients plus DeAM represent 71% of total revenue |
| n | | 10-year contract for DeAM business |
STATE STREET.
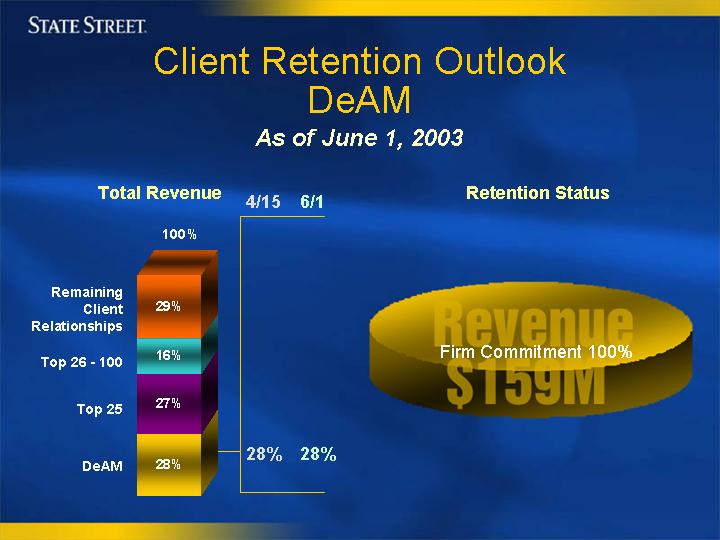
Client Retention Outlook
DeAM
As of June 1, 2003
| Total Revenue | | Retention Status |
[GRAPHIC] | | [PIE CHART] |
STATE STREET.
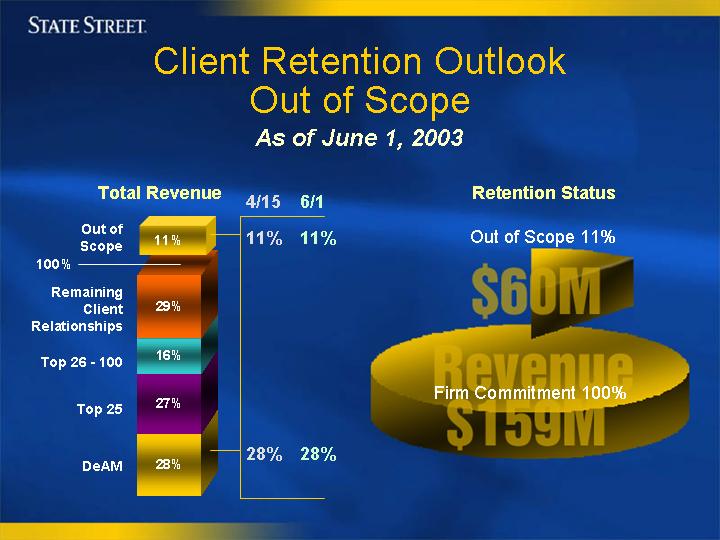
Client Retention Outlook
Out of Scope
As of June 1, 2003
| Total Revenue | | Retention Status |
[GRAPHIC] | | [PIE CHART] |
STATE STREET.
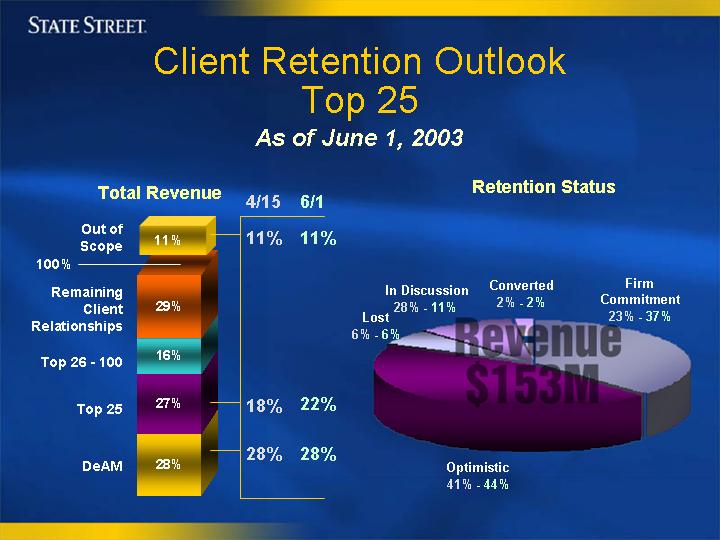
Client Retention Outlook
Top 25
As of June 1, 2003
| Total Revenue | | Retention Status |
[GRAPHIC] | | [PIE CHART] |
STATE STREET.
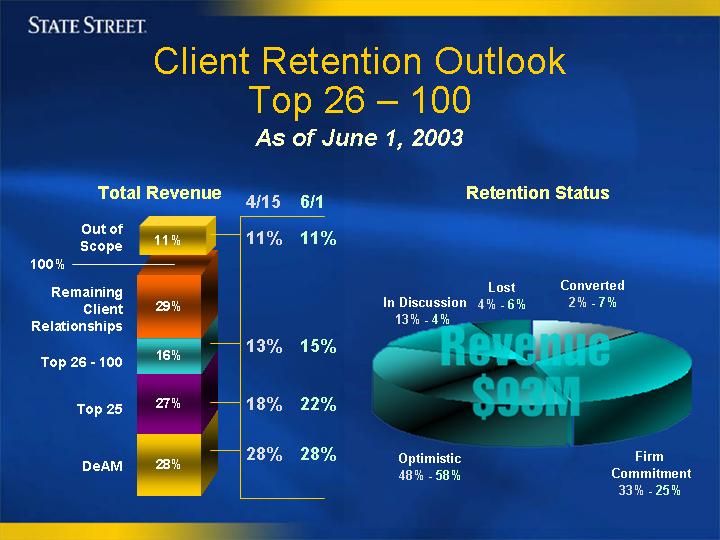
Client Retention Outlook
Top 26 – 100
As of June 1, 2003
| Total Revenue | | Retention Status |
[GRAPHIC] | | [PIE CHART] |
STATE STREET.
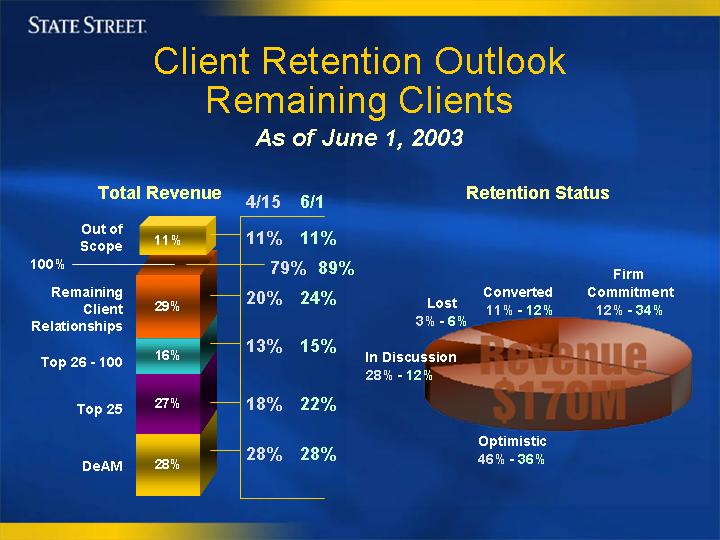
Client Retention Outlook
Remaining Clients
As of June 1, 2003
| Total Revenue | | Retention Status |
[GRAPHIC] | | [PIE CHART] |
STATE STREET.
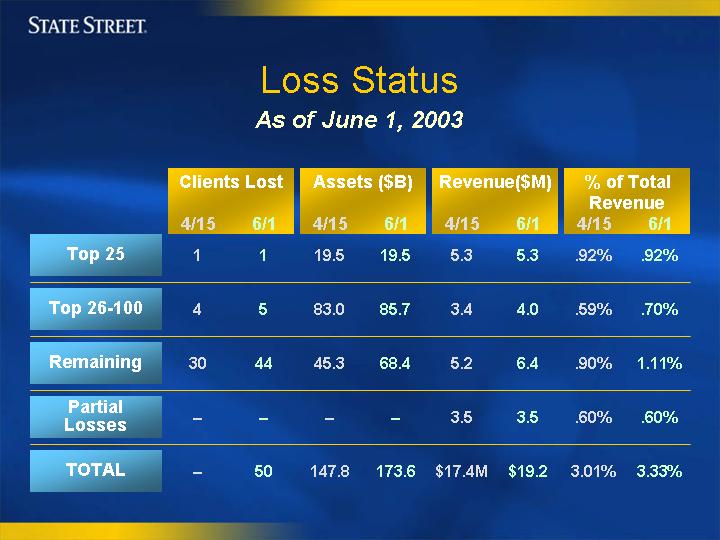
Loss Status
As of June 1, 2003
| | | Clients Lost
| | Assets ($B)
| | Revenue($M)
| | % of Total
Revenue
| |
| | | 4/15
| | 6/1
| | 4/15
| | 6/1
| | 4/15
| | 6/1
| | 4/15
| | | 6/1
| |
Top 25 | | 1 | | 1 | | 19.5 | | 19.5 | | | 5.3 | | | 5.3 | | .92 | % | | .92 | % |
Top 26-100 | | 4 | | 5 | | 83.0 | | 85.7 | | | 3.4 | | | 4.0 | | .59 | % | | .70 | % |
Remaining | | 30 | | 44 | | 45.3 | | 68.4 | | | 5.2 | | | 6.4 | | .90 | % | | 1.11 | % |
Partial Losses | | — | | — | | — | | — | | | 3.5 | | | 3.5 | | .60 | % | | .60 | % |
| | |
| |
| |
| |
| |
|
| |
|
| |
|
| |
|
|
TOTAL | | — | | 50 | | 147.8 | | 173.6 | | $ | 17.4M | | $ | 19.2 | | 3.01 | % | | 3.33 | % |
| | |
| |
| |
| |
| |
|
| |
|
| |
|
| |
|
|
STATE STREET.
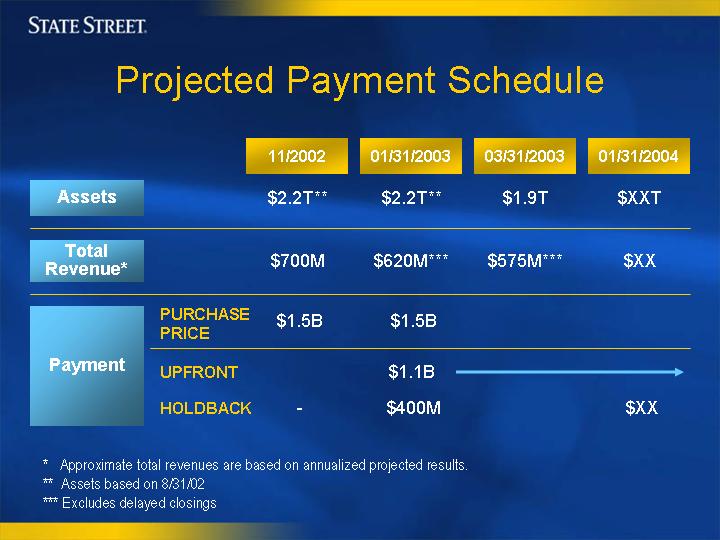
Projected Payment Schedule
| | | | | 11/2002
| | | 01/31/2003
| | | 03/31/2003
| | | 01/31/2004
|
Assets | | | | $ | 2.2T | ** | | $ | 2.2T | ** | | $ | 1.9T | | | $ | XXT |
Total Revenue* | | | | $ | 700M | | | $ | 620M | *** | | $ | 575M | *** | | $ | XX |
| | | PURCHASE
PRICE | | $ | 1.5B | | | $ | 1.5B | | | | | | | | |
Payment | | UPFRONT | | | | | | $ | 1.1B | | | | | | | | |
| | | HOLDBACK | | | — | | | $ | 400M | | | | | | | $ | XX |
| * | | Approximate total revenues are based on annualized projected results. |
| ** | | Assets based on 8/31/02 |
| *** | | Excludes delayed closings |
STATE STREET.
Investing in Strategic
Opportunities
Equity Trading Services
Alternative Investment Servicing
Investment Operations Services
Wealth Manager Services

STATE STREET.
Investing in Strategic Opportunities
Equity Trading Services
| | | n Net Equity Trading Revenue up 41%* |
Business | | n Transition Management Revenue up 58%* |
Growth | | n Electronic Equity Trading Volumes (shares traded) up75%* |
| |
| | | n Our top 100 clients control over 50% of the world’s AUM** |
Client | | n 19 of the world’s 20 largest asset managers are our clients |
Relationships | | n State Street has managed transitions for over 50% of ensions & Investments Top 100 plan sponsors |
| | | n Over the past four years, 89% of our clients returned to perform another transition |
| | | n In 2002 we added and/or enhanced over 200 trading relationships and completed 700 transitions |
| * | | Year- over- year growth 12 months ending 03/31/03 |
| ** | | P&I Watson Wyatt World’s Top 500 Money Managers as of 12/31/01 |
STATE STREET.
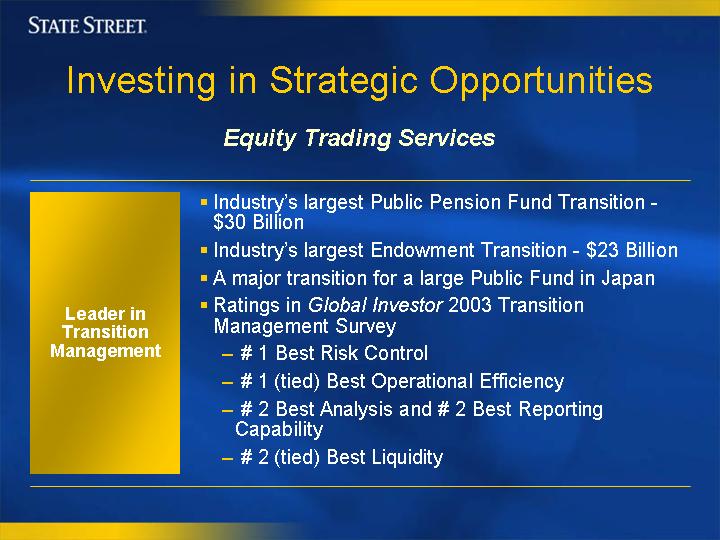
Investing in Strategic Opportunities
Equity Trading Services
| | | n Industry’s largest Public Pension Fund Transition – $30 Billion |
| | | n Industry’s largest Endowment Transition – $23 Billion |
| | | n A major transition for a large Public Fund in Japan |
Leader in | | n Ratings inGlobal Investor 2003 Transition Management Survey |
Transition | | – # 1 Best Risk Control |
Management | | – # 1 (tied) Best Operational Efficiency |
| | | – # 2 Best Analysis and # 2 Best Reporting Capability |
| | | – # 2 (tied) Best Liquidity |
STATE STREET.
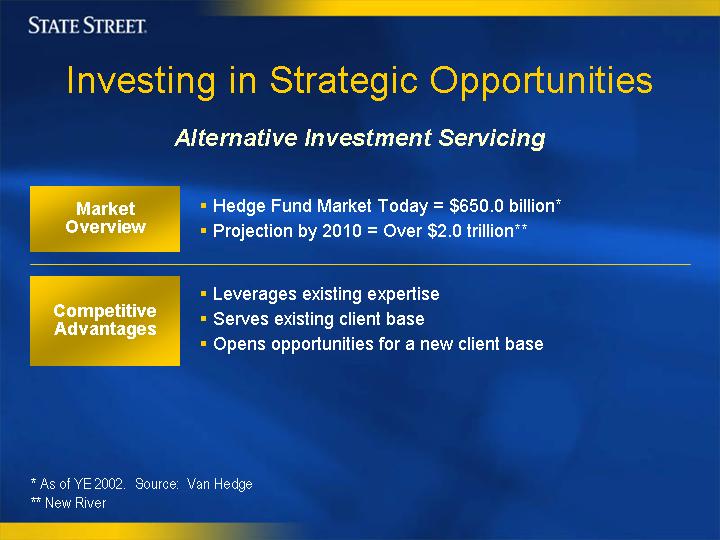
Investing in Strategic Opportunities
Alternative Investment Servicing
Market | | n Hedge Fund Market Today = $650.0 billion* |
Overview | | n Projection by 2010 = Over $2.0 trillion** |
| |
| | | n Leverages existing expertise |
Competitive | | n Serves existing client base |
Advantages | | n Opens opportunities for a new client base |
| * | | As of YE 2002. Source: Van Hedge |
STATE STREET.
Investing in Strategic Opportunities
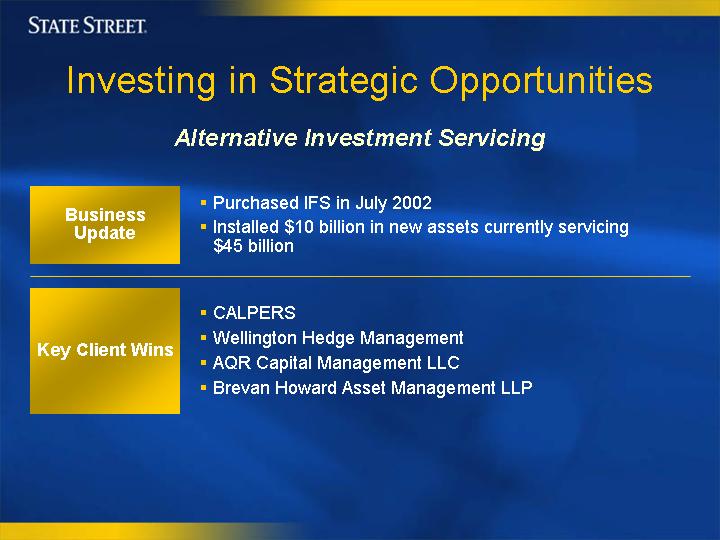
Alternative Investment Servicing
Business Update | | n Purchased IFS in July 2002 |
| | n Installed $10 billion in new assets currently servicing $45 billion |
| |
Key Client Wins | | n CALPERS |
| | n Wellington Hedge Management |
| | n AQR Capital Management LLC |
| | n Brevan Howard Asset Management LLP |
STATE STREET.
Investing in Strategic Opportunities
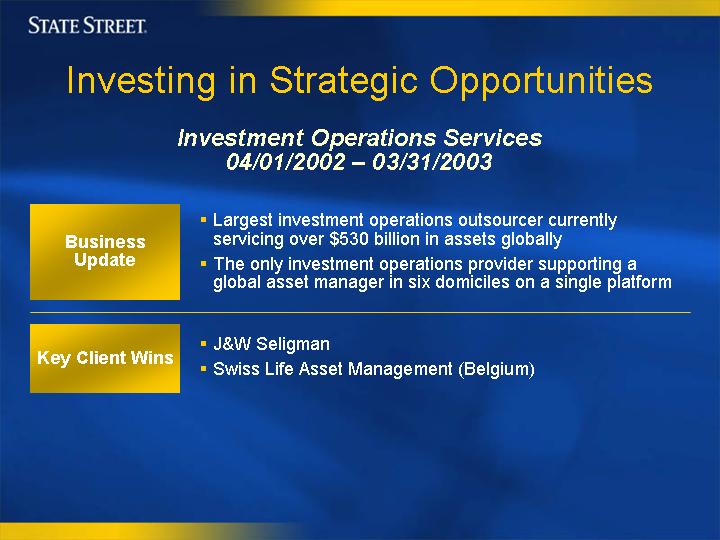
Investment Operations Services
04/01/2002 – 03/31/2003
Business Update | | n Largest investment operations outsourcer currently servicing over $530 billion in assets globally |
| | n The only investment operations provider supporting a global asset manager in six domiciles on a single platform |
| |
Key Client Wins | | n J&W Seligman |
| | n Swiss Life Asset Management (Belgium) |
STATE STREET.
Investing in Strategic Opportunities
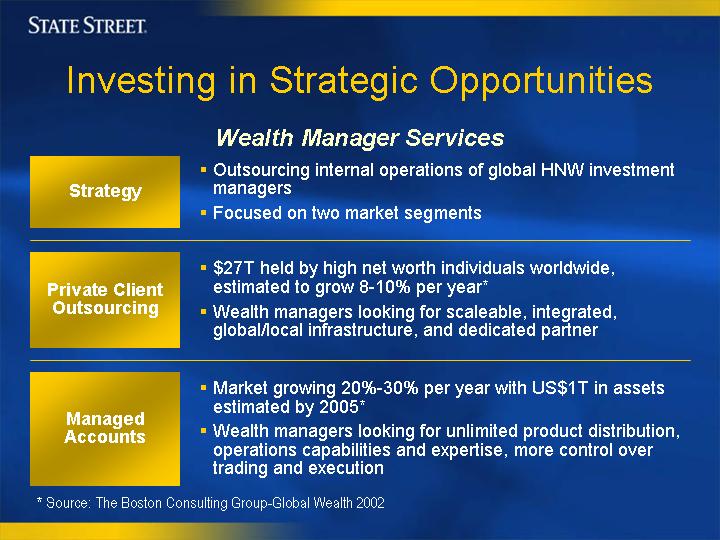
Wealth Manager Services
Strategy | | n Outsourcing internal operations of global HNW investment managers |
| | n Focused on two market segments |
| |
Private Client Outsourcing | | n $27T held by high net worth individuals worldwide, estimated to grow 8-10% per year* |
| | n Wealth managers looking for scaleable, integrated, global/local infrastructure, and dedicated partner |
| |
Managed Accounts | | n Market growing 20%-30% per year with US$1T in assets estimated by 2005* |
| | n Wealth managers looking for unlimited product distribution, operations capabilities and expertise, more control over trading and execution |
| * | | Source: The Boston Consulting Group-Global Wealth 2002 |

STATE STREET.
Investing in Strategic Opportunities
Wealth Manager Services
04/01/2002 – 03/31/2003
Business Update | | n Grown assets serviced from $0 to $94 billion in 12 months |
| |
Key Client Wins | | n 16 new clients, including J & W Seligman |
| | n Broad based success across all segments |
| | – 12 Private Clients |
| | n 8 US |
| | n 3 European |
| | n 1 Canadian |
| | – 4 Managed Accounts |
STATE STREET.
Fueling State Street’s Growth
Summing Up
Our core business is rock-solid.
We’re continuing to win business worldwide.
We are meeting our GSS revenue retention targets and cost reduction goals.
Our new strategic businesses are growing rapidly.

Thank You
| |
| [LOGO] | | STATE STREET. |
| | | For Everything You Invest InTM |