1 Well Positioned for the Future Joseph L. Hooley Chief Executive Officer Edward J. Resch Chief Financial Officer INVESTOR AND ANALYST FORUM 5 May 2010 Exhibit 99.1 |
2 Reminder This presentation contains forward-looking statements as defined by United States securities laws, including statements about our goals and expectations regarding our business, financial condition, results of operations and strategies, the financial and market outlook, governmental and regulatory initiatives and developments, and the business environment. Forward-looking statements are often identified by such forward-looking terminology as "plan," "expect," "look," "believe," "anticipate," "estimate," "seek," "may," "will," "trend," "target,” “scenario,” and "goal," or similar statements or variations of such terms. These statements are not guarantees of future performance, are inherently uncertain, are based on current assumptions that are difficult to predict and involve a number of risks and uncertainties. Therefore, actual outcomes and results may differ materially from what is expressed in those statements, and those statements should not be relied upon as representing our expectations or beliefs as of any date subsequent to May 5, 2010. Important factors that may affect future results and outcomes include, but are not limited to: financial market disruptions and the economic recession, whether in the U.S. or internationally, and monetary and other governmental actions, including regulation, taxes and fees, designed to address or otherwise be responsive to such disruptions and recession, including actions taken in the U.S. and internationally to address the financial and economic disruptions that began in 2007; increases in the volatility of, or declines in the levels of, our net interest revenue or other revenue influenced by market factors, changes in the composition of the assets on our consolidated balance sheet and the possibility that we may be required to change the manner in which we fund those assets; the financial strength and continuing viability of the counterparties with which we or our customers do business and to which we have investment, credit or financial exposure; the liquidity of the U.S. and international securities markets, particularly the markets for fixed-income securities, and the liquidity requirements of our customers; the credit quality, credit agency ratings, and fair values of the securities in our investment securities portfolio, a deterioration or downgrade of which could lead to other-than-temporary impairment of the respective securities and the recognition of an impairment loss in our consolidated statement of income; the maintenance of credit agency ratings for our debt and depository obligations as well as the level of credibility of credit agency ratings; the ability to complete our announced and pending acquisitions, as well as future acquisitions, divestitures and joint ventures, including the ability to obtain regulatory approvals, the ability to arrange financing as required, and the ability to satisfy other closing conditions; the risks that acquired businesses will not be integrated successfully, or that the integration will take longer than anticipated, that expected synergies will not be achieved or unexpected disynergies will be experienced, that customer and deposit retention goals will not be met, that other regulatory or operational challenges will be experienced and that disruptions from the transaction will harm relationships with customers, employees or regulators; the possibility of our customers incurring substantial losses in investment pools where we act as agent, and the possibility of further general reductions in the valuation of assets; our ability to attract deposits and other low-cost, short-term funding; potential changes to the competitive environment, including changes due to the effects of consolidation and perceptions of State Street as a suitable service provider or counterparty; the level and volatility of interest rates and the performance and volatility of securities, credit, currency and other markets in the U.S. and internationally; our ability to measure the fair value of the investment securities on our consolidated balance sheet; the results of litigation, government investigations and similar disputes or proceedings; the enactment of new legislation and changes in governmental regulation and enforcement that affect us or our customers, and which may increase our costs and expose us to risk related to compliance; adverse publicity or other reputational harm; the performance and demand for the products and services we offer, including the level and timing of withdrawals from our collective investment products; our ability to grow revenue, attract and/or retain and compensate highly skilled people, control expenses and attract the capital necessary to achieve our business goals and comply with regulatory requirements; our ability to control operating risks, information technology systems risks and outsourcing risks, and our ability to protect our intellectual property rights, the possibility of errors in the quantitative models we use to manage our business and the possibility that our controls will fail or be circumvented; the potential for new products and services to impose additional costs on us and expose us to increased operational risk; changes in accounting standards and practices; and changes in tax legislation and in the interpretation of existing tax laws by U.S. and non-U.S. tax authorities that impact the amount of taxes due. Other important factors that could cause actual results to differ materially from those indicated by any forward-looking statements are set forth in our 2009 Annual Report on Form 10-K, and our subsequent SEC filings. We encourage investors to read these filings, particularly the sections on Risk Factors, for additional information with respect to any forward-looking statements and prior to making any investment decision. The forward-looking statements contained in this presentation speak only as of the date hereof, May 5, 2010, and we do not undertake efforts to revise those forward-looking statements to reflect events after that date. |
3 Well Positioned for the Future Agenda Key Trends Competitive Positioning Financial Review Strategic Direction |
4 Well Positioned for the Future Agenda Key Trends Competitive Positioning Financial Review Strategic Direction |
5 Worldwide Trends Support Our Strategy Well Positioned for the Future Key Trends STRENGTH IN CORE BUSINESSES DRIVEN BY • Globalization • Retirement / Savings • Outsourcing • Consolidation • Increased Regulatory Oversight / Reform |
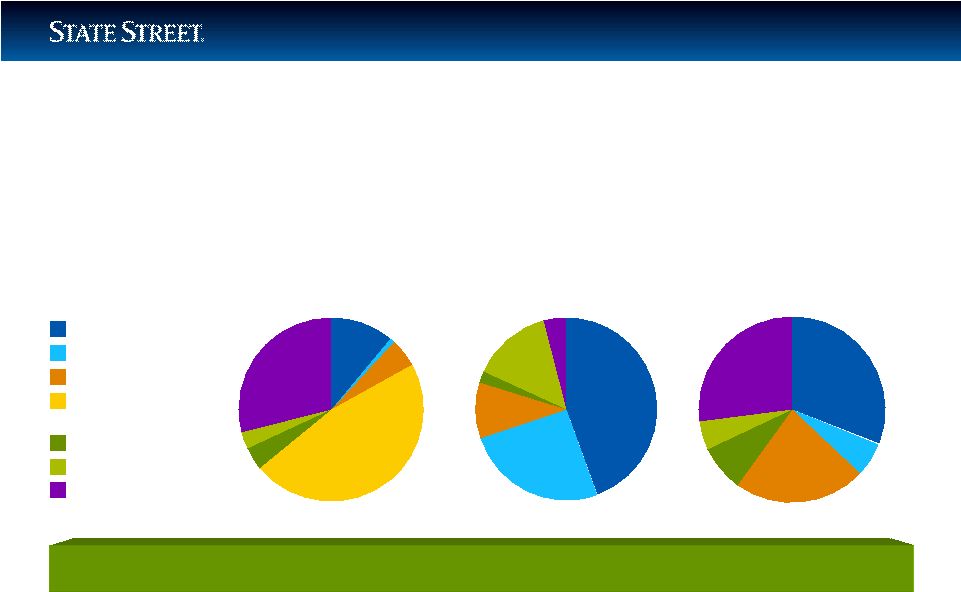
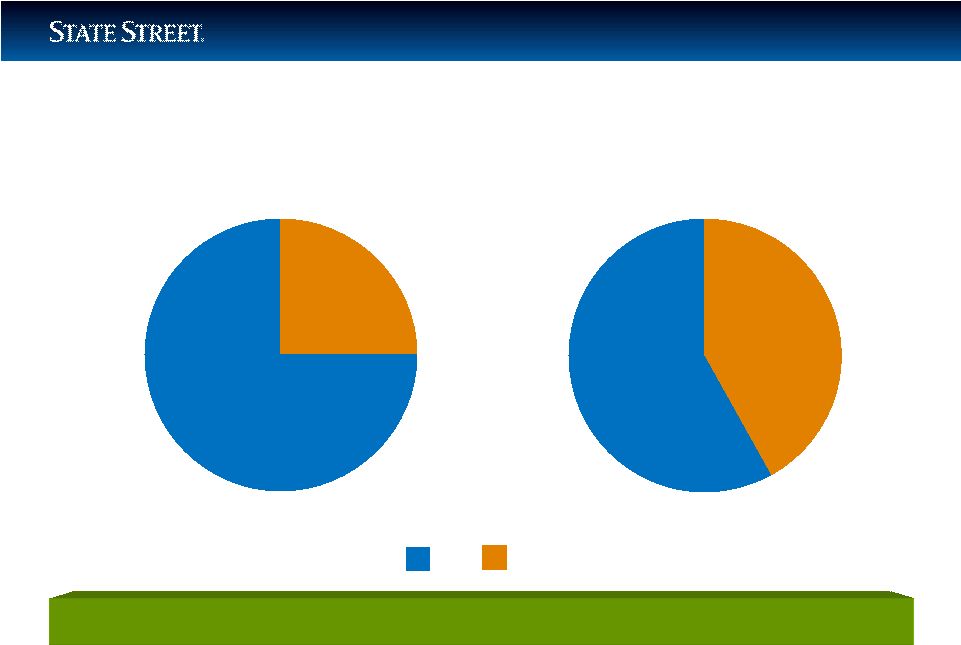
6 Well Positioned for the Future Key Trends — Globalization 1 Total assets include seven key European markets: UK, Netherlands, Germany, Ireland/Luxembourg offshore assets, Italy, Switzerland and France. 2 ICI, 9/09 3 For Germany , France, UK, Netherlands, Switzerland, Towers Watson, 12/09; for Italy, OECD data as of 12/08, applied 8.8% growth rate (Allianz International Pensions Studies Western 4 CEA European Insurance, applied 8% growth rate (STT estimate) to 2008 figures Insurance assets: Applied 8% growth rate to 2008 figures, to be updated 5 Source: BCG, 4/10 UK Netherlands Germany Offshore (Ireland/Lux.) Italy Switzerland France Pensions: $4.0T Insurance: $8.3T Collectives: $6.5T European Collective, Pension, Insurance markets: $18.8 trillion European Market Forecast to Grow 5.9% over next 3 years 5 11% 1% 5% 47% 4% 3% 29% 45% 25% 10% 2% 14% 4% 31% 6% 23% 8% 5% 27% 1 2 3 4 |
7 Well Positioned for the Future Key Trends — Globalization $14.6T 2004 $18.8T 2009 $709.5B 2004 European Collective, Pension and Insurance Market Growth 2004–2009 CAGR: 5.2% State Street European AUC Growth 2004–2009 CAGR: 21.4% $1,867.9B 2009 1 2 1 Total assets include seven key European markets: UK, Netherlands, Germany, Ireland/Lux offshore assets, Italy, Switzerland and France. Sources: ICI( 9/09), CEA 12/08), Watson Wyatt (12/09), and State Street estimates. 2 AUC represents all European assets under custody. |
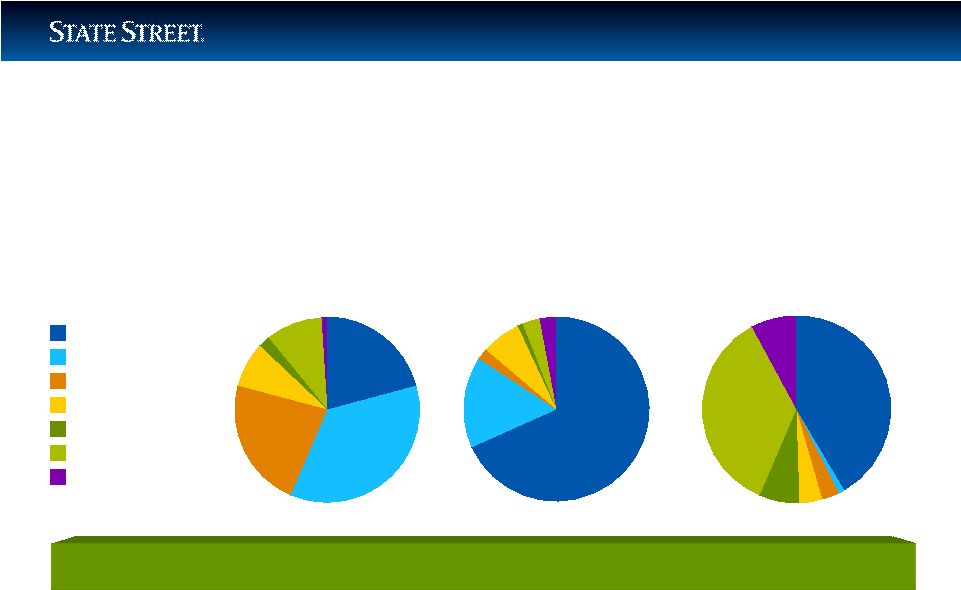
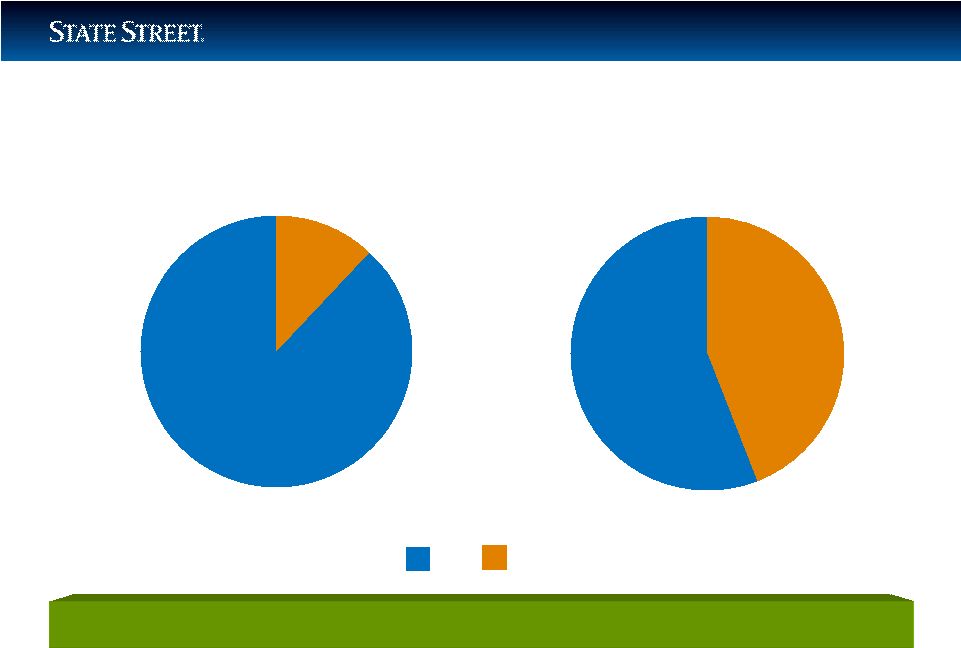
8 21% 35% 23% 8% 2% 10% 1% Well Positioned for the Future Key Trends — Globalization Asia-Pacific Collective, Pension and Government-related Markets: $15.1 trillion Pensions: $4.5T Government Related: $7.4T Collectives: $3.2T Japan Australia Hong Kong South Korea Taiwan China Singapore 68% 16% 2% 7% 1% 3% 3% 41% 1% 3% 4% 7% 36% 8% Asia-Pacific Market Forecast to Grow 9.4% over next 3 years 4 2 3 1 1 Total assets include seven key markets: Japan, Australia, Hong Kong, South Korea, Taiwan, China and Singapore. 2 Collectives as of September 2009 3 Government related: Japan includes Japan Post; Taiwan includes Chunghwa Post, formerly Taiwan Post 4 Source: BCG, 4/10 Sources: ICI (9/09), IMF (12/09), Cerulli Associates (12/08), Watson Wyatt (12/09), Monetary Authority of Singapore MAS Survey, Singapore Central Provident Fund Board (12/08), Temasek Holdings, HKSFC's Fund Management Activities Survey (12/08), Rainmaker (12/09), Korea National Pension Service, Korea Teacher Pension Fund; The Bank of Korea, Korea Government Employee Pension Service (12/08); China National Council for Social Security Fund (12/09), Central Bank of Republic of China (Taiwan) (9/09), Japan Post Bank (12/09); State Street estimates |
9 Well Positioned for the Future Key Trends — Globalization $8.8T 2004 $15.1T 2009 $294.4B 2004 Asia-Pacific Collective, Pension and Government Market Growth 2004–2009 CAGR: 11.4% State Street Asia/Pacific AUC Growth 2004–2009 CAGR: 17.1% $648.1B 2009 1 2 1 Total assets include seven key markets: Japan, Australia, Hong Kong, South Korea, Taiwan, China and Singapore. Sources: ICI (9/09), IMF (12/09), Cerulli Associates (12/08), Watson Wyatt (12/09), Monetary Authority of Singapore MAS Survey, Singapore Central Provident Fund Board (12/08), Temasek Holdings, HKSFC's Fund Management Activities Survey (12/08), Rainmaker (12/09), Korea National Pension Service, Korea Teacher Pension Fund; The Bank of Korea, Korea Government Employee Pension Service (12/08); China National Council for Social Security Fund (12/09), Central Bank of Republic of China (Taiwan) (9/09), Japan Post Bank (12/09); State Street estimates 2 AUC represents all Asia/Pacific assets under custody. |
10 Well Positioned for the Future Key Trends — Globalization at State Street Expect to Double Non-US Revenue over 5 Years 2 23% 77% 41% 59% Revenue 1999 Pro Forma 2009 US Non-US 1 1 Excludes impact of discount accretion ($621 million); reported 2009 non-US revenue for State Street was $2.878 billion (36%); pro forma 2009 is adjusted for estimated impact of ISPSS and Mourant 2 Assumes F/X rates stay constant. |
11 Well Positioned for the Future Key Trends — Globalization at State Street 1 39% of State Street’s employees worked outside of the US as of December 31, 2009; pro forma 2009 is adjusted for 1,425 employees from ISPSS and Mourant. State Street has Strong Presence in Non-US Locations Employees 12% 88% 44% 56% 1999 Pro Forma 2009 US Non-US 1 |
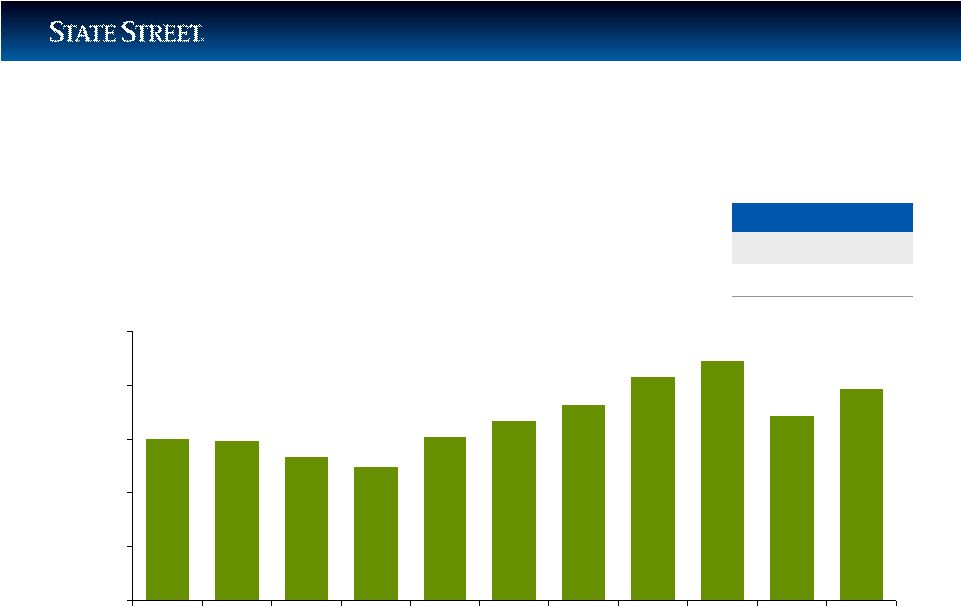
12 Well Positioned for the Future Key Trends — Retirement Savings • DC Plans are a Growing Segment for US Retirement Savings US Defined Contribution Assets include 401(K), 403(b) and 457 plans; Source ICI, as of 9/30/09. 0 1,000 2,000 3,000 4,000 5,000 '99 '00 '01 '02 '03 '04 '05 '06 '07 '08 '09 CAGR ’02–’07 ’08 vs. ‘09 12% 15% US Defined Contribution Assets $M USD |
13 Well Positioned for the Future Key Trends — Outsourcing 1 Pension & Investment,/Watson Wyatt World 500, 12/28/09. 2 As of 4/01/10 3 Preqin, 6/09 4 Hedge Fund Research, 3/31/10 5 McKinsey, 7/09 INVESTMENT MANAGER OPERATIONS OUTSOURCING • State Street is leading provider with more than $7 trillion of AUA in this market that is sized at approximately $53 trillion PRIVATE EQUITY ADMINISTRATION • With the Mourant acquisition, State Street is the largest servicer of private equity in the world with $255 billion of AUA in a market sized at $2.3 trillion HEDGE FUND SERVICING • State Street services more than $300 billion of AUA in hedge fund assets — the second largest servicer in the world in a $1.7 trillion market 4 growing at an estimated 19% CAGR over the next 4 years 5 FUND ACCOUNTING AND ADMINISTRATION • Market-leading position • Integrated, global, multi-currency system 1 3 2 |
14 Well Positioned for the Future Key Trends — Outsourcing INVESTMENT MANAGEMENT SOLUTIONS • Customized strategic and tactical asset allocation solutions through flexible and efficient portfolio implementation across and within global asset classes TRANSITION MANAGEMENT • Provide transparent, efficient transitions and allocation management for pension plans; managed transitions with total assets of $173 billion in 1,006 transitions in 2009 ELECTRONIC TRADING • Continued growth expected • Acquired Currenex, a fast-paced, high-speed trading solution to compliment FX Connect |
15 Well Positioned for the Future Key Trends — Consolidation 11 of the Top 20 Custodians Each Have Less Than $3 Trillion in Assets 1 GlobalCustody.net, adjusted for acquisition of ISPSS and BHF. FACTORS • Global footprint and scale essential • Ongoing need for investment in technology • Competing demands for capital • Distribution: Access to global clients Industry Will Consolidate With Major Providers 1 |
16 Well Positioned for the Future Key Trends — Consolidation DEUTSCHE BANK’S GSS Established State Street’s leadership position in Europe IFS Added hedge fund servicing capability CURRENEX Expanded electronic high-speed trading capability PALMERI Accelerated State Street’s leadership in private equity servicing INVESTORS FINANCIAL Expanded share of mutual fund and hedge fund servicing markets Excellent Track Record in Executing Accretive Acquisitions |
17 Well Positioned for the Future Key Trends — Consolidation INTESA SANPAOLO’S SECURITIES SERVICES 1 • Enhances European servicing capability • Acquiring custody, fund administration, depository bank and banca corrispondente • Paying €1.28B 2 in cash • Goal to retain 90% of revenue of ~€293M • ~€343 in custody assets 3 • ~€11B in cash deposits 4 • Removing ~€60M in costs over 5 years • Incurring ~€80M (pre-tax) in merger and integrations costs • Expect to be modestly accretive (excluding M & I costs) • Will have capital ratios at closing approximately at the levels as of 9/30/09 1 Expected to close in Q2 2010 subject to regulatory approvals and other closing conditions. 2 State Street expects to support the acquired ISPSS balance sheet with approximately €560 million of additional capital at the closing. 3 Average for first half of 2009. 4 At 6/30/09. |
18 Well Positioned for the Future Key Trends — Consolidation MOURANT INTERNATIONAL FINANCE ADMINISTRATION • State Street is now 1 : – No.1 in alternative asset servicing globally – No.1 in private equity servicing globally – No.1 in real estate asset servicing globally – No. 2 in hedge fund servicing globally • Cash purchase • Annualized revenue of about $100 million • Mostly non-US assets • Provides cross-sell opportunities • Expected to be slightly accretive in 2010 (excluding M & I costs) 1 Incorporating Mourant data with data from HFM Week, April 2009; ICFA Alternative Fund Administration Survey, April/May 2009 |
19 Well Positioned for the Future Agenda Key Trends Competitive Positioning Financial Review Strategic Direction |
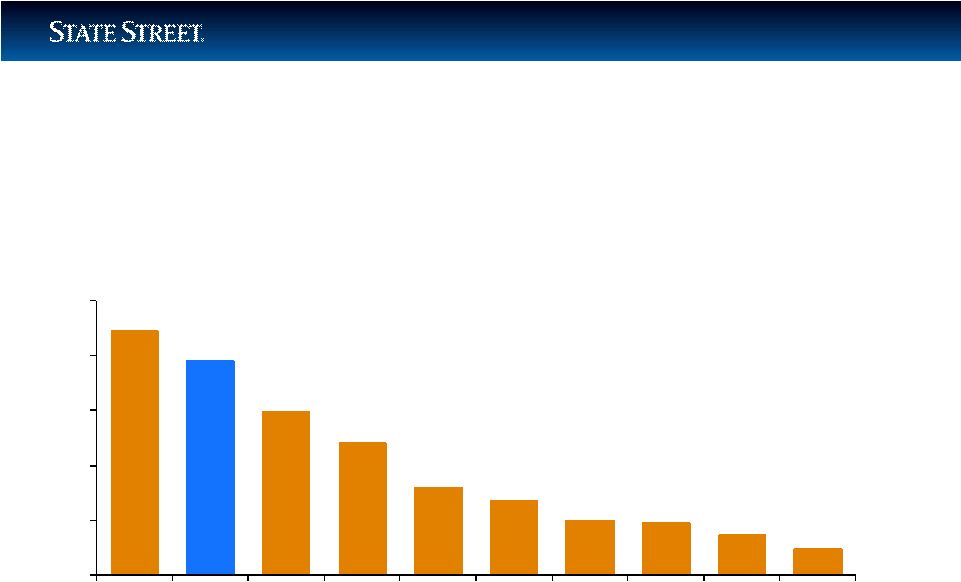
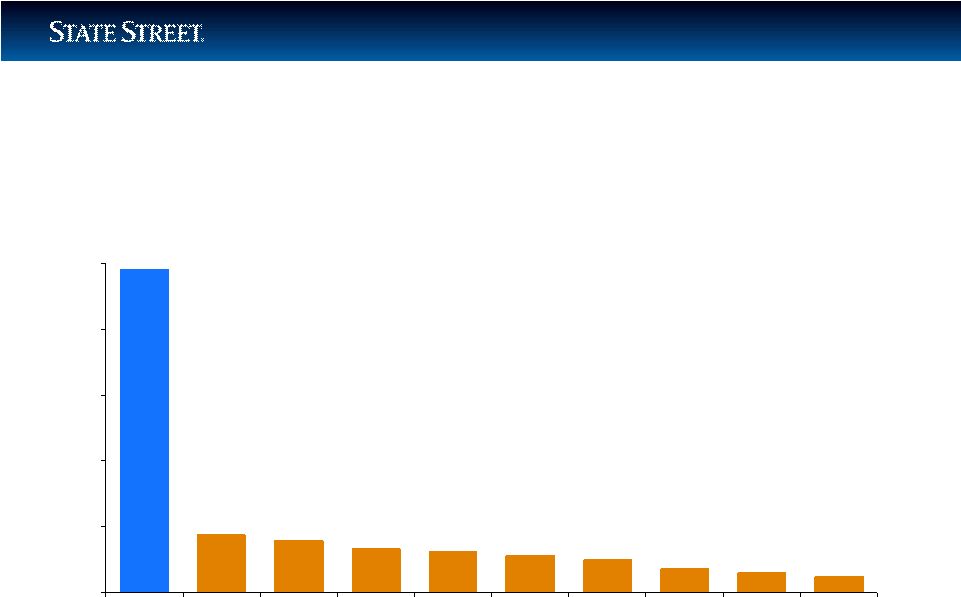
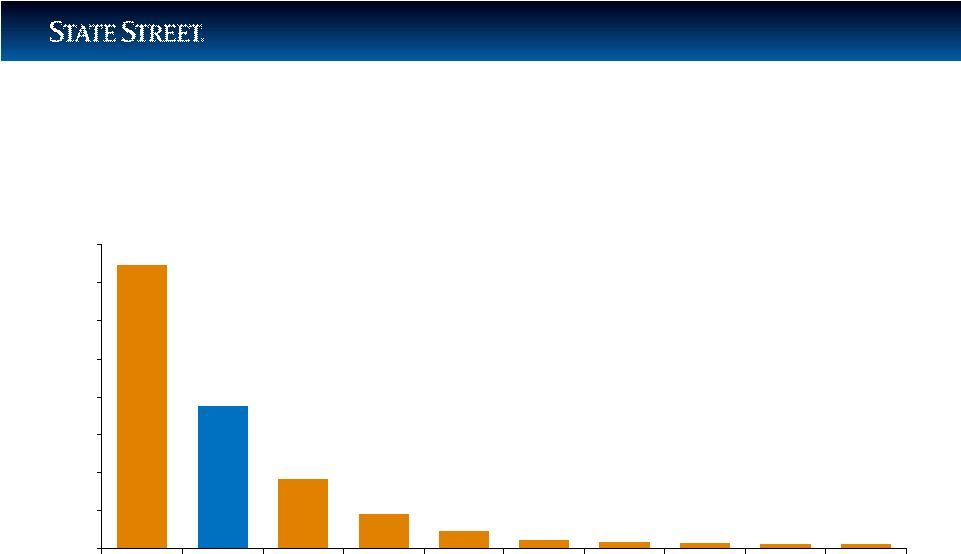
20 (USD $T) 1 Source: Global Custody.net, 12/31/2009 2 Includes assets of approximately $670 billion in assets from ISPSS and Mourant 3 AUC Only Source: Company filings, as of 12/31/09; globalcustody.net Well Positioned for the Future Competitive Positioning — Assets Under Custody/Administration 22.3 19.5 14.9 12.1 8.0 6.8 5.0 4.8 3.7 2.4 $0 $5 $10 $15 $20 $25 BK STT JPM Citi HSBC BNP Soc Gen CACEIS NTRS RBCD 3 3 3 Total Worldwide Custody Assets: $104 trillion 1 2 |
21 1 Data also includes UIT Accounting. Source: The NASDAQ Stock Market Inc., Data Products, as of 2/1/10 Well Positioned for the Future Competitive Positioning — US Mutual Funds Number of Funds Priced Daily 0 2,000 4,000 6,000 8,000 10,000 STT BK PFPC JPM First Trust Citi Fidelity US Bancorp Van Kampen Princor 41% 6% 5% 5% 4% 4% 4% 3% 2% 2% 1 |
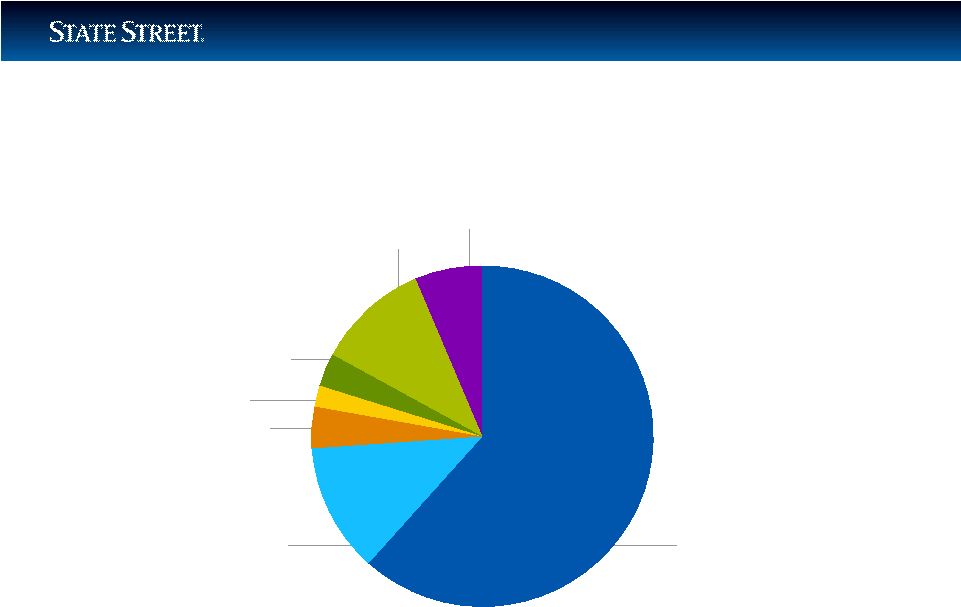
22 Well Positioned for the Future Competitive Positioning — Investment Manager Operations Outsourcing STT 62% BK 12% JPM 4% HSBC 2% NTRS 3% RBCD 11% BBH 6% Source: Scrip Issue Global Report, (3/10) |
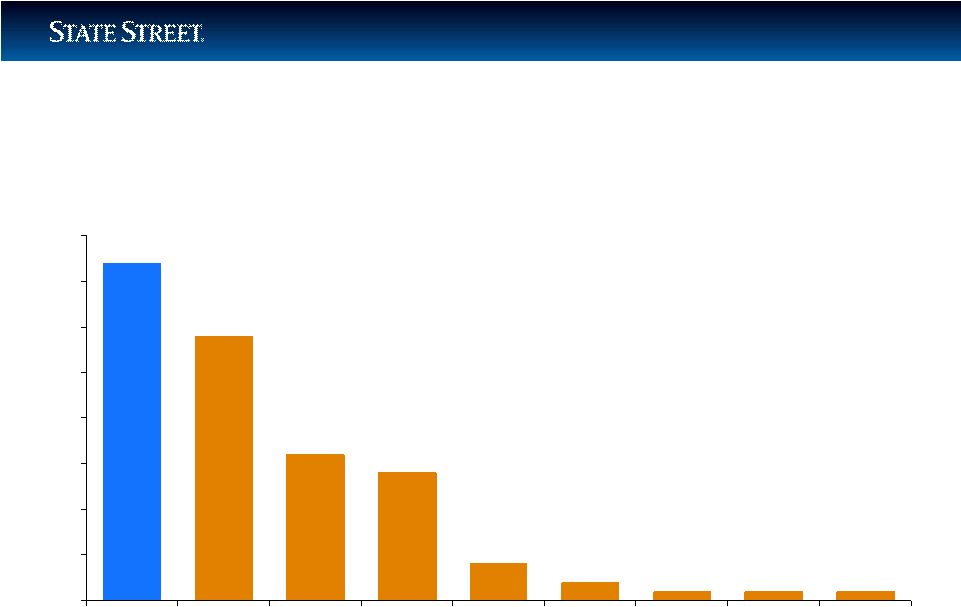
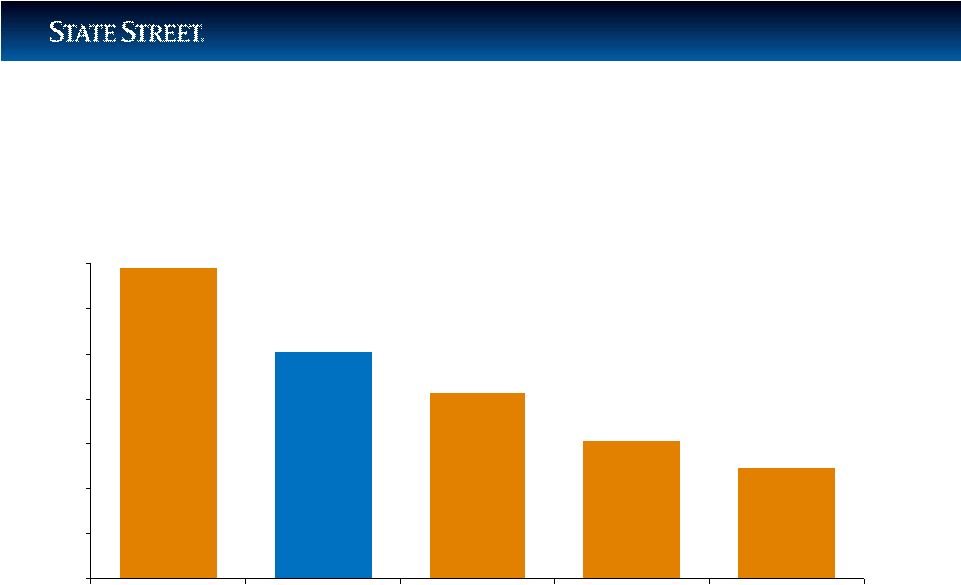
23 3.7 2.9 1.6 1.4 0.4 0.2 0.1 0.1 0.1 0.0 0.5 1.0 1.5 2.0 2.5 3.0 3.5 4.0 STT BNY NTRS JPM RBCD Citi SocGen HSBC BBH (USD $T) Well Positioned for the Future Competitive Positioning — Pension Fund Assets 1 Data is self reported to Scrip Issue Global Report (3/10) 1 |
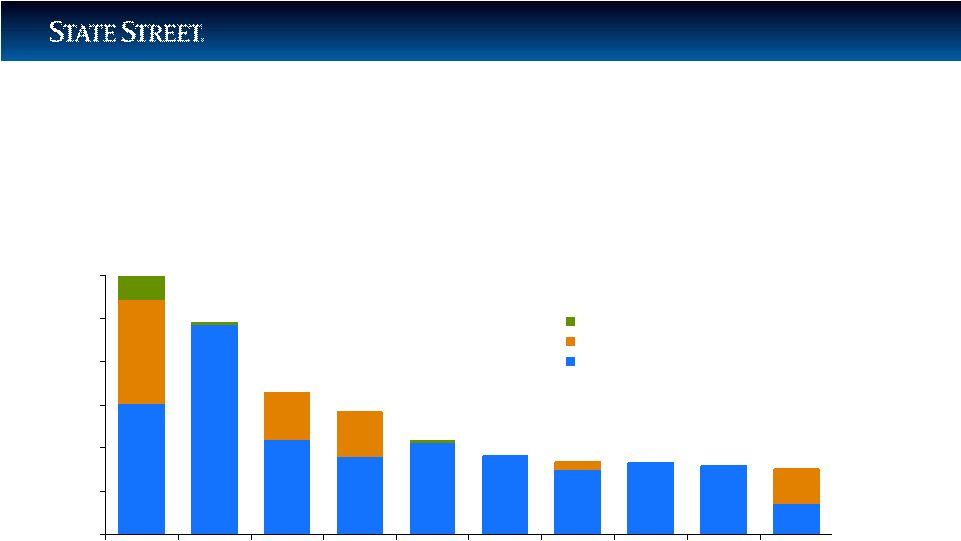
24 Well Positioned for the Future Competitive Positioning — Alternative Assets Under Administration USD $B $0 $100 $200 $300 $400 $500 $600 STT Citco Citi HSBC BK Fortis SEI GS UBS JPM Real Estate Private Equity Assets Hedge Fund Assets 596 491 329 283 217 182 168 164 159 151 Sources: HFM Week 13th Biannual Assets Under Administration Survey, November 2009; STT AUA as of 12/31/09, adjusted for Mourant; ICFA Alternative Fund Administration Survey April/May 2009; 2009 Global Custodian Private Equity Fund Administrators Survey; Prequin 12/31/08. |
25 Well Positioned for the Future Competitive Positioning — US ETF Assets Under Management 373 189 92 46 24 12 9 8 6 6 $0 $50 $100 $150 $200 $250 $300 $350 $400 BLK SSgA Vanguard Invesco ProShares Van Eck BK US Comm Funds Wisdom Tree Rydex USD $B Source: National Stock Exchange as of 12/31/09 |
26 (USD $B) 345 253 206 152 122. $0 $50 $100 $150 $200 $250 $300 $350 BLK SSgA Northern Trust Vanguard BNY Mellon Source: Pensions & Investments as of December 31, 2008 Includes US Institutional, tax-exempt assets managed internally (assets managed passively on behalf of non-US entities are not represented) Well Positioned for the Future Competitive Positioning — Top Managers of US-Domiciled Indexed Equities and Fixed Income |
27 Well Positioned for the Future Competitive Positioning — Recent Recognition No. 1 Manager of Worldwide Institutional Assets Pensions & Investments, 2009 Money Managers Survey Custodian of the Year 2010 Global Pensions Awards Top Rated in Pre-Trade, Post-Trade, Organization and Support Plansponsor, 2009 Transition Management Survey No. 1 Global Custodian for Clients with $10B+ in Assets Global Custodian 2009 Global Custody Survey No. 1 Global Mutual Fund Administrator Global Custodian 2009 Mutual Fund Administration Survey Most Recognized ETF Brand exchangetradedfunds.com 2009 Global ETF Awards Global Private Equity Fund Administrator of the Year International Custody and Fund Administration 2009 Global Awards Global Securities Lender of the Year International Custody and Fund Administration 2009 Global Awards No. 1 in Flow Research Euromoney 2009 FX Survey |
28 Well Positioned for Growth Competitive Positioning — Strength in Winning New Business • $1.1 trillion in assets to be serviced won in 2009 • In 2009 top 100 clients used 13.8 products • $319 billion in assets to be serviced won YTD (4/15/10) • Strong pipeline in both asset management and asset servicing • More than 200 of 300 of the largest investment managers in the world are our clients 70% Win Ratio on Competitive Bids in 2009 1 As measured by Assets Under Management 1 |
29 Well Positioned for the Future Long-Term Operating-Basis Financial Goals Key Trends and Competitive Position Support Long-term Goals 1 For a description of operating-basis presentation, see Appendix. Operating-basis EPS Growth of 10% – 15% Operating-basis ROE of 14% – 17% Operating-basis Revenue Growth of 8% – 12% 1 |
30 Well Positioned for the Future Long-Term Financial Goals — Operating-basis Revenue Growth Model 1 For a description of operating-basis presentation, see Appendix. 2 Assumes 7% average annual growth in global equities. Market growth 1% – 2% New clients 2% – 3% Additional sales to existing clients 4% – 5% Acquisitions 1% – 2% 8% – 12% 1 2 |
31 Edward J. Resch Chief Financial Officer FINANCIAL REVIEW |
32 Well Positioned for the Future Financial Review Balance Sheet and Capital Position: A Strong Foundation Market-driven Revenue: NIR/NIM, Securities Finance, Foreign Exchange Operating Performance in 2010: Growth in a Challenging Environment |
33 Well Positioned for the Future Financial Review Balance Sheet and Capital Position: A Strong Foundation Market-driven Revenue: NIR/NIM, Securities Finance, Foreign Exchange Operating Performance in 2010: Growth in a Challenging Environment |
34 Well Positioned for the Future Financial Review — Balance Sheet and Capital Position: A Strong Foundation Currently Well Positioned BALANCE SHEET AS OF 3/31/10 • Total Balance Sheet: $154 billion – “Normalized” Balance Sheet: $135 billion – Duration gap: approximately 0.31 years • Investment Portfolio of $93 billion – Duration: approximately 1.27 years – Solid credit profile – Unrealized after-tax loss: $1.4 billion, down 77% from 12/31/08 • Liabilities – Customer driven – Integral to custody relationship • Strong Capital Ratios |
35 Well Positioned for the Future Financial Review — Balance Sheet and Capital Position: A Strong Foundation Maintaining Flexibility Pending Regulatory Guidance 1 For a description of the capital ratios, including certain related reconciliations, please see Appendix. CAPITAL MANAGEMENT • Successfully executed TCE improvement plan in 2009 • Capital ratios are well in excess of regulatory requirements for “well capitalized” • State Street’s target ratios 1 : – Leverage: 5.25% to 5.75% – TCE: 4.25% to 4.75% • Sources of capital – Net earnings – Equity from employee compensation programs • Uses of capital – Reinstating dividend a priority – Organic growth opportunities – Repurchase of shares |
36 1 Except as noted in note 4 below, minimum “Well Capitalized” as defined by Federal regulators. 2 Estimated including acquisition of ISPSS; earnings based on First Call analyst consensus estimate and estimated impact on earnings of discount accretion. 3 Minimum “Well Capitalized,” as defined by Federal regulators, applies to State Street Bank and Trust only. 4 Target ratio as defined by State Street. 5 Ratio as defined by Moody’s Investors Service, Inc. For a description of the capital ratios, including certain related reconciliations, please see Appendix. Well Positioned for the Future Financial Review — Balance Sheet and Capital Position: A Strong Foundation Strong Capital Generation and Strategic Deployment “Well State Street Corp. Capitalized” 1 Q2 ’10 E 2 Q1 ’10 Q4 ’09 Tier 1 Leverage 5% 3 7.2% 9.0% 8.5% Tier 1 Capital 6% 15.6% 18.1% 17.7% Tier 1 Common Ratio 13.6% 15.9% 15.6% Total Capital 10% 17.0% 19.5% 19.1% Tangible Common Equity 4.25% – 4.75% 4 5.5% 7.5% 6.6% TCE/RWA 5 11.7% 14.1% 12.8% |
37 Well Positioned for the Future Financial Review Balance Sheet and Capital Position: A Strong Foundation Market-driven Revenue: NIR/NIM, Securities Finance, Foreign Exchange Operating Performance in 2010: Solid Growth in a Challenging Environment • 2010 Scenarios for Net Interest Margin: – Flatter Curve – Most Likely – Higher Rates • A View of Structural NIM • Securities Finance • Foreign Exchange |
38 Well Positioned for the Future Financial Review — Market-driven Revenue: NIR/NIM, Securities Finance, Foreign Exchange ASSUMPTIONS (INCLUDING ISPSS) • Balance sheet about $150 billion • Duration gap about 0.50 years MOST LIKELY ECONOMIC SCENARIO • Slow, steady recovery • House price stabilization • Slow improvement in unemployment • S & P 500 at 1125 on average for the year 2010 SCENARIOS FOR NET INTEREST MARGIN 1 1 Excluding discount accretion and related tax-equivalent adjustments; for a reconciliation to GAAP, see Appendix. 2 Federal Funds Flatter Curve Most Likely Higher Rates FF² 2010 (avg.) 0.25% 0.25% 0.60% FF² year-end 0.25% 0.25% 1.00% Yield curve Flattens Steep Steep FF² to 2-year (avg.) 0.50% 1.25% 1.20% FF² to 10-year (avg.) 2.75% 3.80% 3.75% 2010 NIM (in bps) (avg.) 140–150 150–160 150–160 |
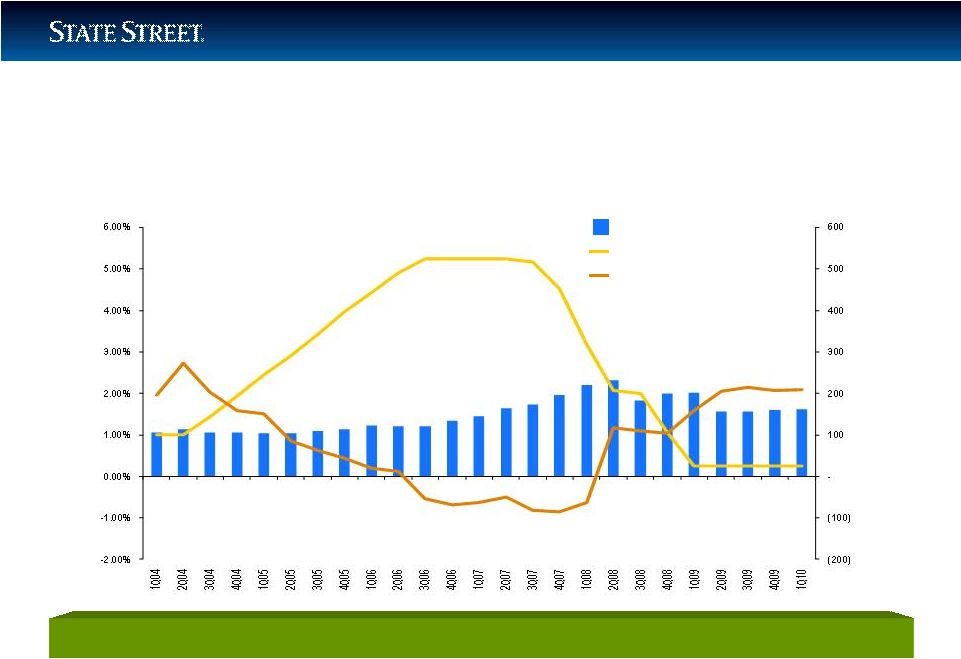
39 Well Positioned for the Future Financial Review — Market-driven Revenue: NIR/NIM, Securities Finance, Foreign Exchange 1 Excludes discount accretion Yield in % NIM in bps Historical Trends in Yield Curve, FF Rate and STT’s NIM NIM ¹ Fed Funds FF to 5-Year Treasury Spread |
40 Well Positioned for the Future Financial Review — Market-driven Revenue: NIR/NIM, Securities Finance, Foreign Exchange MARKET FACTORS • Level of rates — FF to 3% • Shape of the curve — FF to 5-year is 100-125 bps • Asset spreads — Not to widen from current level • Pace of rate change — Measured pace of increase CONTROLLABLE FACTORS • Credit quality — Continue AAA/AA focus • Interest –rate risk — Approximate duration of 0.5 years • Asset strategy — Maintain current investment strategy • Capital — Maintain current capital level OUTLOOK FOR NORMALIZED NET INTEREST MARGIN Expect Normalized NIM to Settle in Range of 1.75% – 1.85% 1 Federal Funds 1 1 |
41 Well Positioned for the Future Financial Review — Market-driven Revenue: NIR, Securities Finance, Foreign Exchange REVENUE TRENDS IN SECURITIES FINANCE 1 Based on data from Data Explorers Universe as of period end. REVENUE DRIVEN BY COMBINATION OF VOLUMES, SPREAD, AND DURATION OF PORTFOLIO VOLUMES • Assets on loan at about $400B for past 5 quarters with NYSE short interest below historic levels – Believe volumes are at or near a trough for this cycle • Expect volumes to improve as economic recovery continues • From Q1 ’07 to Q1 ’10 our market share increased from 21% to more than 28% 1 SPREAD • 3-month LIBOR to FF spread widened (Q4 ’08) to unprecedented levels and then tightened (Q1 ’10) • Expect modest improvement in spreads in 2H ’10 PORTFOLIO DURATION • Reduced to 21 days (Q1 ’10) from 35 days (Q1 ’07) as asset owners sought higher levels of liquidity • Expect duration to increase as liquidity requirements lessen |
42 Well Positioned for the Future Financial Review — Market-driven Revenue: NIR, Securities Finance, Foreign Exchange REVENUE TRENDS IN FOREIGN EXCHANGE April Volumes Increased Above Q1 Monthly Average 1 STT’s customer-weighted volatilities. REVENUE DRIVEN BY COMBINATION OF VOLUMES AND VOLATILITY VOLUMES • Q1 ’10 volumes annualized ($2.9TN) tracking above 2009 level, but not at level of 2007 and 2008 ($3.4 TN on avg.) • Expect increased cross-border flows to drive improvement in F/X environment and volumes VOLATILITY • Average annual volatility in ’08 and ’09 (1.36% avg.)¹ significantly above level of Q1 ’10 (0.99%)¹ • Expect Q1 ’10 level to be maintained or improved slightly as Central Banks respond to levels of economic activity globally |
43 Well Positioned for the Future Financial Review • Q1 2010 Performance • Core Business Strength • Expense Initiatives Balance Sheet and Capital Position: A Strong Foundation Market-driven Revenue: NIR/NIM, Securities Finance, Foreign Exchange Operating Performance in 2010: Growth in a Challenging Environment |
44 Continuing to Perform in Challenging Times Well Positioned for the Future Financial Review — Operating Performance in 2010: Growth in a Challenging Environment Results¹ for 3 Months Ended $ in millions, except per share data 3/31/10 12/31/09 % Change Operating-basis revenue $2,116 $2,082 1.6% Operating-basis expenses $1,566 $1,556 0.6% Operating-basis EPS $0.75 $0.71 5.6% Operating-basis ROE 10.0% 9.9% Positive operating leverage² 100 bps 1 Results presented on an operating basis, including fully taxable-equivalent revenue; for a description of operating-basis presentation and related reconciliations, please see Appendix. 2 Positive operating leverage is defined as the excess rate of growth of total revenue over the rate of growth of total expenses, each determined on an operating basis. |
45 Well Positioned for the Future Financial Review — Operating Performance in 2010: Growth in a Challenging Environment OPERATING MODEL IMPROVEMENT • Aggressively managing expenses in response to current environment • Restructured workforce in 2009 • Implementing LEAN (begun in 2009) • Utilizing operations in Poland, China and India • Advancing technology to decrease unit cost factors • Optimizing global real estate footprint |
46 Well Positioned for the Future Agenda Key Trends Competitive Positioning Financial Review Strategic Direction |
47 Well Positioned for the Future Strategic Direction FOCUSED ON • Doubling non-US revenues over the next five years • Accelerating market share globally through organic growth and acquisition • Driving industry innovation for clients by maintaining technology investment at 20% – 25% of operating expenses • Strengthening industry-leading operating model • Achieving positive operating leverage on annual basis • Enhancing risk management capabilities across organization |
48 Well Positioned for the Future Summary — Expectations Fueling Confidence in 2010 Outlook • Strength in servicing fee revenue • Successful integration of acquisitions • Modest improvement in management fee revenue • NIM in range of 150–160 bps • Gradual improvement in F/X and Securities Finance in 2H • Expense control commitments • No further net securities gains, OTTI, or LLP budgeted Expect Operating-Basis EPS to be Slightly Above 2009 Level of $3.32 |
49 Well Positioned for the Future Summary • Well positioned against global growth trends • Excellent competitive position • Worldwide client relationships • Strong capital position Committed to Delivering Shareholder Value Committed to Long-Term Financial Goals • Expanding core business • Proven track record integrating acquisitions • Talented global employee base • Disciplined expense management |
STATE STREET CORPORATION
TANGIBLE COMMON EQUITY AND TIER 1 COMMON RATIOS
As of Period End
The ratio of tangible common equity to adjusted tangible assets, or TCE ratio, is calculated by dividing consolidated total common shareholders’ equity by consolidated total assets, after reducing both amounts by goodwill and other intangible assets net of related deferred taxes. Total assets reflected in the TCE ratio also exclude cash balances on deposit at the Federal Reserve Bank and other central banks in excess of required reserves. The TCE ratio is not required by GAAP or by bank regulations, but is a metric used by management to evaluate the adequacy of State Street’s capital levels. Since there is no authoritative requirement to calculate the TCE ratio, our TCE ratio is not necessarily comparable to similar capital measures disclosed or used by other companies in the financial services industry. Tangible common equity and adjusted tangible assets are non-GAAP financial measures and should be considered in addition to, not as a substitute for or superior to, financial measures determined in accordance with GAAP.
The tier 1 risk-based common, or tier 1 common, ratio is calculated by dividing tier 1 capital less non-common elements, including qualifying trust preferred securities, by total risk-weighted assets, which assets are calculated in accordance with applicable bank regulatory requirements. The tier 1 common ratio is not required by GAAP or on a recurring basis by bank regulations. However, this ratio was used by the Federal Reserve in connection with its stress test administered to the 19 largest U.S. bank holding companies under the Supervisory Capital Assessment Program, the results of which were announced in May 2009. Although we understand that the Federal Reserve does not intend to prospectively require calculation of the tier 1 common ratio, due to the recent timing of the Supervisory Capital Assessment Program, management is currently monitoring this ratio, along with the other capital ratios, in evaluating State Street’s capital levels and believes that, at this time, the ratio may be of interest to investors.
The table set forth below presents the calculations of State Street's ratios of tangible common equity to total tangible assets and tier 1 common capital to total risk-weighted assets.
| | | | | | | | | | | | | | |
(Dollars in millions) | | | | March 31,
2010 | | | December 31,
2009 | | | September 30,
2009 | |
Consolidated Total Assets | | | | $ | 153,971 | | | $ | 157,946 | | | $ | 163,277 | |
Less: | | | | | | | | | | | | | | |
Goodwill | | | | | 4,515 | | | | 4,550 | | | | 4,554 | |
Other intangible assets | | | | | 1,768 | | | | 1,810 | | | | 1,845 | |
Excess reserves held at central banks | | | | | 19,235 | | | | 21,731 | | | | 22,125 | |
| | | | | | | | | | | | | | |
Adjusted assets | | | | | 128,453 | | | | 129,855 | | | | 134,753 | |
Plus: | | | | | | | | | | | | | | |
Deferred tax liability | | | | | 515 | | | | 521 | | | | 524 | |
| | | | | | | | | | | | | | |
Total tangible assets | | A | | $ | 128,968 | | | $ | 130,376 | | | $ | 135,277 | |
| | | | | | | | | | | | | | |
Consolidated Total Common Shareholders' Equity | | | | $ | 15,410 | | | $ | 14,491 | | | $ | 13,440 | |
Less: | | | | | | | | | | | | | | |
Goodwill | | | | | 4,515 | | | | 4,550 | | | | 4,554 | |
Intangible assets | | | | | 1,768 | | | | 1,810 | | | | 1,845 | |
| | | | | | | | | | | | | | |
Adjusted equity | | | | | 9,127 | | | | 8,131 | | | | 7,041 | |
Plus deferred tax liability | | | | | 515 | | | | 521 | | | | 524 | |
| | | | | | | | | | | | | | |
Total tangible common equity | | B | | $ | 9,642 | | | $ | 8,652 | | | $ | 7,565 | |
| | | | | | | | | | | | | | |
Tangible common equity ratio | | B/A | | | 7.5 | % | | | 6.6 | % | | | 5.6 | % |
Ratio of tangible common equity to total risk-weighted assets | | B/D | | | 14.1 | % | | | 12.8 | % | | | 10.2 | % |
Tier 1 capital | | | | $ | 12,335 | | | $ | 12,005 | | | $ | 11,271 | |
Less trust preferred securities | | | | | 1,450 | | | | 1,450 | | | | 1,450 | |
| | | | | | | | | | | | | | |
Tier 1 common capital | | C | | $ | 10,885 | | | $ | 10,555 | | | $ | 9,821 | |
| | | | | | | | | | | | | | |
Total risk-weighted assets | | D | | | 68,247 | | | | 67,691 | | | | 73,823 | |
Ratio of tier 1 common capital to total risk-weighted assets | | C/D | | | 15.9 | % | | | 15.6 | % | | | 13.3 | % |
STATE STREET CORPORATION
RECONCILIATION OF REPORTED RESULTS TO OPERATING-BASIS RESULTS
We measure and compare certain financial information on a non-GAAP, or “operating” basis because we believe that such information supports meaningful comparisons from period to period and the analysis of comparable financial trends with respect to our normal ongoing business operations. We believe that operating-basis financial information, which reports revenue from non-taxable sources on a fully taxable-equivalent basis and excludes the impact of revenue and expenses outside of the normal course of our business, facilitates an investor’s understanding and analysis of State Street’s underlying performance and trends in addition to reported financial information, which is prepared in accordance with GAAP. The following table reconciles financial information prepared in accordance with GAAP to operating-basis financial information.
| | | | | | | | | | | | | | | | | | | | | | | | | | | |
(Dollars in millions, except per share amounts) | | Quarter Ended December 31, 2009 | | | Quarter Ended March 31, 2010 | | | % Change | |
| | | Reported
Results | | | Adjustments | | | Operating
Results | | | Reported
Results | | | Adjustments | | | Operating
Results | | | Q4 2009
vs Q1
2010 | |
Total fee revenue | | $ | 1,526 | | | | | | | $ | 1,526 | | | $ | 1,540 | | | | | | | $ | 1,540 | | | 0.9 | |
Net interest revenue | | | 697 | | | $ | (198 | )(1) | | | 499 | | | | 661 | | | $ | (180 | )(4) | | | 481 | | | (3.6 | ) |
Gains related to investment securities, net | | | 57 | | | | — | | | | 57 | | | | 95 | | | | — | | | | 95 | | | | |
| | | | | | | | | | | | | | | | | | | | | | | | | | | |
Total revenue | | | 2,280 | | | | (198 | ) | | | 2,082 | | | | 2,296 | | | | (180 | ) | | | 2,116 | | | 1.6 | |
Provision for loan losses | | | 35 | | | | — | | | | 35 | | | | 15 | | | | — | | | | 15 | | | | |
Total expenses | | | 1,565 | | | | (9 | )(2) | | | 1,556 | | | | 1,579 | | | | (13 | )(2) | | | 1,566 | | | 0.6 | |
| | | | | | | | | | | | | | | | | | | | | | | | | | | |
Income before income tax expense | | | 680 | | | | (189 | ) | | | 491 | | | | 702 | | | | (167 | ) | | | 535 | | | | |
Income tax expense | | | 182 | | | | (76 | )(3) | | | 106 | | | | 207 | | | | (75 | )(6) | | | 132 | | | | |
Tax-equivalent adjustment | | | — | | | | 32 | (5) | | | 32 | | | | — | | | | 32 | (5) | | | 32 | | | | |
| | | | | | | | | | | | | | | | | | | | | | | | | | | |
Net income available to common shareholders | | $ | 498 | | | $ | (145 | ) | | $ | 353 | | | $ | 495 | | | $ | (124 | ) | | $ | 371 | | | 5.1 | |
| | | | | | | | | | | | | | | | | | | | | | | | | | | |
Diluted earnings per common share | | $ | 1.00 | | | $ | (.29 | ) | | $ | .71 | | | $ | .99 | | | $ | (.24 | )$ | | | .75 | | | 5.6 | |
Average diluted common shares outstanding (in thousands) | | | 497,615 | | | | 497,615 | | | | 497,615 | | | | 498,056 | | | | 498,056 | | | | 498,056 | | | | |
Return on common equity | | | 14.0 | % | | | (4.1 | )% | | | 9.9 | % | | | 13.4 | % | | | (3.4 | )% | | | 10.0 | % | | | |
| (1) | Represents tax-equivalent adjustment of $32 million, which is not included in reported results, net of $230 million of discount accretion for the period, related to a portion of the aggregate difference between the fair value and the par value of the asset-backed commercial paper conduits' investment securities on the date of consolidation of the conduits onto the balance sheet. |
| (2) | Represents merger and integration costs recorded in connection with acquisitions. |
| (3) | Represents $15 million of aggregate income tax benefit related to merger and integration costs and the provision for legal exposure associated with certain fixed-income strategies managed by SSgA, net of $91 million of income tax expense related to discount accretion. |
| (4) | Represents tax-equivalent adjustment of $32 million, which is not included in reported results, net of $212 million of discount accretion for the period, primarily related to a portion of the aggregate difference between the fair value and the par value of the asset-backed commercial paper conduits' investment securities on the date of consolidation of the conduits onto the balance sheet. |
| (5) | Represents tax-equivalent adjustment, which is not included in reported results. |
| (6) | Represents $8 million of income tax benefit related to the merger and integration costs net of $83 million of income tax expense related to discount accretion. |