|
9 February 2012 Investor and Analyst Forum Building from Strength Exhibit 99.1 |
|
2 2011 Performance and Strategic Direction JOSEPH L. HOOLEY Chairman, President and Chief Executive Officer Globalization SCOTT POWERS Chief Executive Officer, State Street Global Advisors JOSEPH C. ANTONELLIS Vice Chairman PETER O’NEILL Executive Vice President, International Business Operations and Information Technology Transformation Program JAMES S. PHALEN Executive Vice President CHRISTOPHER PERRETTA Chief Information Officer Financial Update EDWARD J. RESCH Executive Vice President and Chief Financial Officer Building from Strength Topics for Discussion |
|
3 This presentation contains forward-looking statements as defined by United States securities laws, including statements relating to our goals and expectations regarding our business, financial and capital condition, results of operations, investment portfolio performance and strategies, the financial and market outlook, governmental and regulatory initiatives and developments, and the business environment. Forward-looking statements are often, but not always, identified by such forward-looking terminology as "plan," “program,” "expect," "look," "believe," "anticipate," "estimate," "seek," "may," "will," "trend," "target,” and "goal," or similar statements or variations of such terms. These statements are not guarantees of future performance, are inherently uncertain, are based on current assumptions that are difficult to predict and involve a number of risks and uncertainties. Therefore, actual outcomes and results may differ materially from what is expressed in those statements, and those statements should not be relied upon as representing our expectations or beliefs as of any date subsequent to February 9, 2012. Important factors that may affect future results and outcomes include, but are not limited to: the manner in which the Federal Reserve and other regulators implement the Dodd-Frank Act, Basel III and other regulatory initiatives in the U.S. and internationally, including any increases in the minimum regulatory capital ratios applicable to us and regulatory developments that result in changes to our operating model or other changes to the provision of our services in order to comply with or respond to such regulations; required regulatory capital ratios under Basel II and Basel III, in each case as fully implemented by State Street and State Street Bank (and in the case of Basel III, when finally adopted by the Federal Reserve), which may result in the need for substantial additional capital or increased levels of liquidity in the future; approvals required by the Federal Reserve or other regulators for the use, allocation or distribution of our capital or other specific capital actions or programs, including equity repurchases, which approvals may restrict or limit our growth plans, distributions to shareholders, equity repurchase programs or other capital initiatives; changes in law or regulation that may adversely affect our, our clients’ or our counterparties’ business activities and the products or services that we sell, including additional or increased taxes or assessments thereon, capital adequacy requirements and changes that expose us to risks related to compliance; financial market disruptions and the economic recession, whether in the U.S., Europe or other regions internationally; the liquidity of the U.S. and international securities markets, particularly the markets for fixed-income securities, and the liquidity requirements of our clients; increases in the volatility of, or declines in the levels of, our net interest revenue, changes in the composition of the assets on our consolidated balance sheet and the possibility that we may be required to change the manner in which we fund those assets; the financial strength and continuing viability of the counterparties with which we or our clients do business and to which we have investment, credit or financial exposure including, for example, the direct and indirect effects on counterparties of the pending sovereign debt risks in Europe; the credit quality, credit agency ratings, and fair values of the securities in our investment securities portfolio, a deterioration or downgrade of which could lead to other-than-temporary impairment of the respective securities and the recognition of an impairment loss in our consolidated statement of income; delays or difficulties in the execution of our previously announced business operations and information technology transformation program, which could lead to changes in our estimates of the charges, expenses or savings associated with the planned program, resulting in increased volatility of our earnings; the maintenance of credit agency ratings for our debt and depository obligations as well as the level of credibility of credit agency ratings; the results of, and costs associated with, government investigations, litigation, and similar claims, disputes, or proceedings; the risks that acquired businesses and joint ventures will not be integrated successfully, or that the integration will take longer than anticipated, that expected synergies will not be achieved or unexpected disynergies will be experienced, that client and deposit retention goals will not be met, that other regulatory or operational challenges will be experienced and that disruptions from the transaction will harm relationships with clients, employees or regulators; the ability to complete acquisitions, divestitures and joint ventures, including the ability to obtain regulatory approvals, the ability to arrange financing as required and the ability to satisfy closing conditions; the performance of and demand for the products and services we offer, including the level and timing of redemptions and withdrawals from our collateral pools and other collective investment products; the possibility that our clients will incur substantial losses in investment pools where we act as agent, and the possibility of significant reductions in the valuation of assets; our ability to attract deposits and other low-cost, short-term funding; potential changes to the competitive environment, including changes due to the effects of consolidation, and perceptions of State Street as a suitable service provider or counterparty; the level and volatility of interest rates and the performance and volatility of securities, credit, currency and other markets in the U.S. and internationally; our ability to measure the fair value of the investment securities on our consolidated balance sheet; our ability to control operating risks, data security breach risks, information technology systems risks and outsourcing risks, and our ability to protect our intellectual property rights, the possibility of errors in the quantitative models we use to manage our business and the possibility that our controls will prove insufficient, fail or be circumvented; adverse publicity or other reputational harm; our ability to grow revenue, attract and/or retain and compensate highly skilled people, control expenses and attract the capital necessary to achieve our business goals and comply with regulatory requirements; the potential for new products and services to impose additional costs on us and expose us to increased operational risk; changes in accounting standards and practices; and changes in tax legislation and in the interpretation of existing tax laws by U.S. and non-U.S. tax authorities that affect the amount of taxes due. Other important factors that could cause actual results to differ materially from those indicated by any forward-looking statements are set forth in our 2010 Annual Report on Form 10-K and our subsequent SEC filings. We encourage investors to read these filings, particularly the sections on risk factors, for additional information with respect to any forward-looking statements and prior to making any investment decision. The forward-looking statements contained in this presentation speak only as of the date hereof, February 9, 2012, and we do not undertake efforts to revise those forward-looking statements to reflect events after that date. Building from Strength Reminder |
|
4 Building from Strength Agenda 2011 Performance Strategic Direction Globalization Business Operations and Information Technology Transformation Program Financial Update Summary |
|
Building from Strength Agenda 2011 Performance – Jay Hooley Strategic Direction Globalization Business Operations and Information Technology Transformation Program Financial Update Summary 5 |
|
6 2011 Performance Resilience in a Challenging Environment $ in millions 12/31/11 1 12/31/10 1 % Change Revenue $9,502 $8,714 +9.0% Expenses $6,789 $6,176 + 9.9% EPS $3.73 $3.40 +9.7% ROE 9.9% 10.4% -50 bps OPERATING-BASIS RESULTS FOR THE TWELVE MONTHS ENDED¹ • Strengthened capital position; re-initiated common stock buyback and increased common stock dividend • Deepened client relationships • Continued market leadership • Effectively managed expenses, including Business Operations and Information Technology Transformation Program • Outperformed peers 1 Financial information presented on an operating, or non-GAAP, basis (which is adjusted to exclude, among other things, conduit-related discount accretion). For a description of GAAP and operating-basis results, and related reconciliations, please see the Appendix. 6 |
|
7 2011 Performance Strengthened Capital Position State Street Corporation “Well Capitalized”¹ 12/31/11 Actual under Basel I 12/31/11 Adjusted to Reflect Basel III Proposal² Tier 1 Capital 6.0% 18.9% 13.3% Tier 1 Common Ratio³ — 16.9% 12.1% Tier 1 Leverage 5.0% 4 7.3% 5.6% Total Capital 10.0% 20.5% 14.9% Tangible Common Equity 5 — 7.3% 7.3% 1 Except as noted in note 4 below, minimum ratios for “Well Capitalized” are defined by Federal regulators under Basel I. 2 Calculated based on State Street’s estimates, based upon published statements of the Basel Committee and the Federal Reserve, of the effects of the requirements under Basel III affecting capital. See Appendix for a description of the specified capital ratios and related reconciliations of these ratios to ratios calculated under current regulations. 3 The tier 1 common ratio is not required by GAAP or on a recurring basis by bank regulations. See Appendix for a description of this ratio and related reconciliations. 4 Minimum ratio for “Well Capitalized,” as defined by Federal regulators, applies to State Street Bank and Trust only and is therefore stated only as a reference point. 5 As defined by State Street. The Tangible Common Equity ratio is not required by GAAP or on a recurring basis by bank regulations. See Appendix for a description of this ratio and related reconciliations. |
|
8 Average Number of Products Used Average Length of Relationship Top 100 Clients 14.2 Products 20.3 Years Top 1,000 Clients 8.5 Products 11.4 Years 2011 Performance Deepened Client Relationships Growing Momentum in Core Businesses Asset Servicing Fee Revenue +11% 1 • Deepened client relationships: 80% of new revenue growth came from existing clients • Differentiated solutions • Flight to quality Asset Management Fee Revenue +11% 1 • Improved performance (68% of funds outperformed their one- year benchmarks) 2 • New products: introduced 32 new ETFs • Enhanced distribution 1 Compared to 2010. 2 As of December 31, 2011. |
|
9 2011 Performance Deepened Client Relationships Business 2011 New Wins 1 ($BN) % Installed through Q4 ($BN) To be Installed ($BN) US Asset Servicing $820.8 58.3% $736.1 $84.7 Non-US Asset Servicing $587.1 41.7% $401.6 $185.5 Total Asset Servicing $1,407.9 $1,137.7 $270.2 US Asset Management $468.1 61.8% $455.1 $13.0 Non-US Asset Management $289.1 38.2% $282.1 $7.0 Total Asset Management $757.2 $737.2 $20.0 1 Assets as of 12/31/11. |
|
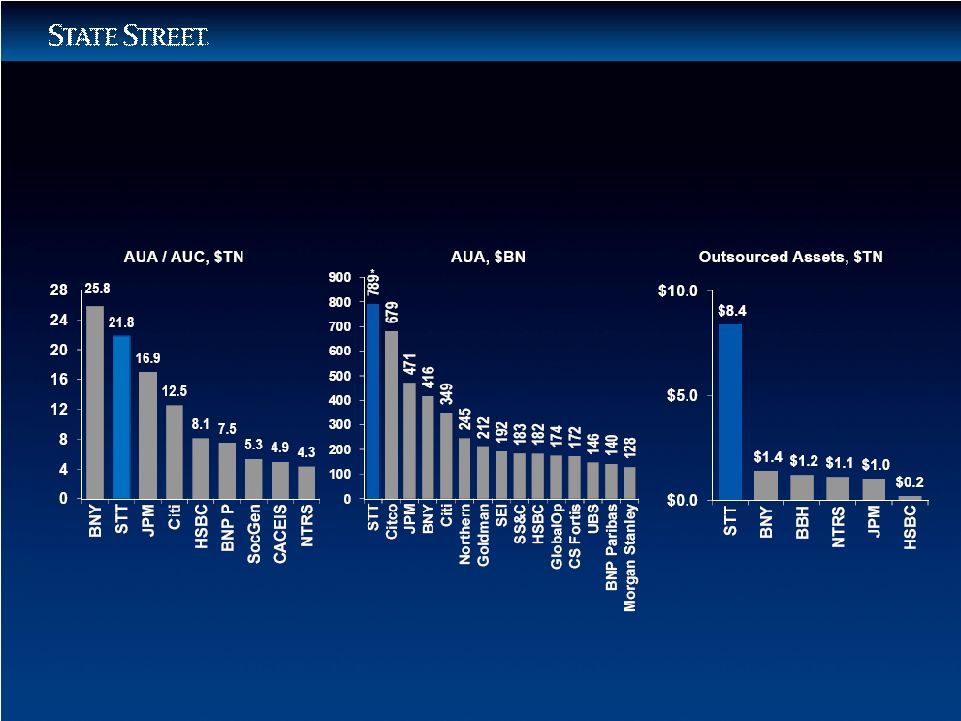
10 Alternative Assets Under Administration as of 6/30/11 Custody Assets Held by Global Custodians as of 12/31/11 Global Middle Office Outsourcing as of 6/30/11 2011 Performance Continued Market Leadership Source: ICFA Annual Fund Admin Survey 2011. *STT AuA at 12/31/2011 was $816BN. Source: Scrip Issue Global Report (9/2011). Source: Company reports and Globalcustody.net Data for BNY, State Street, reflect AUA as of 12/31/2011; as of 9/30/11 for BNP Paribas and Societe Generale; as of 12/31/10 for HSBC; all others reflect AUC data: JP Morgan, Citi, & Northern Trust, as of 12/31/11; CACEIS as of 3/31/11. |
|
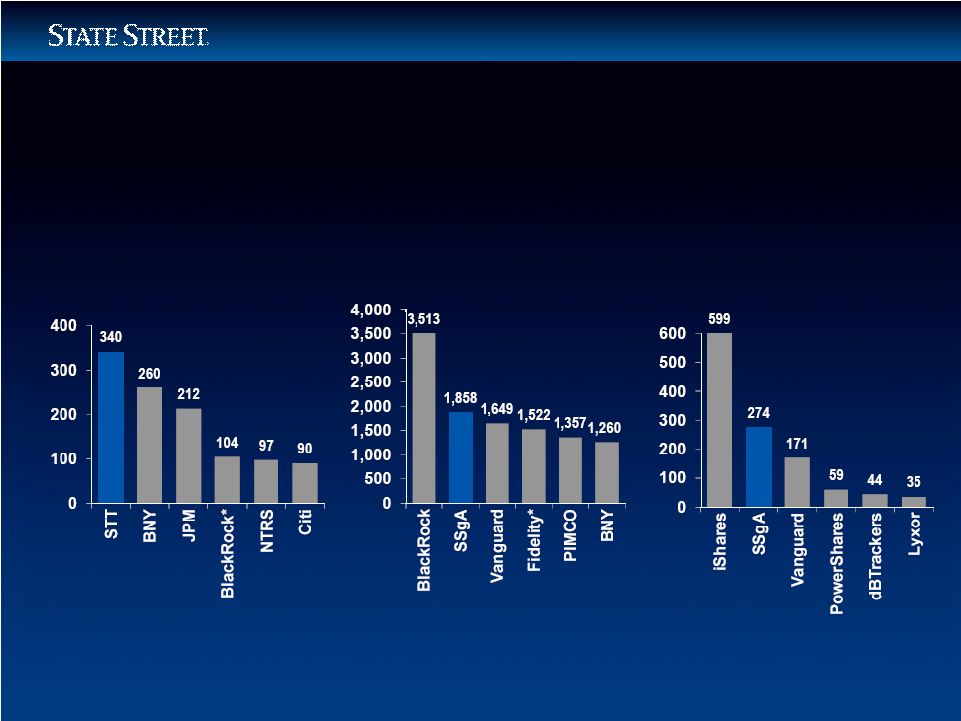
11 AUM, $BN Global Assets Managed as of 12/31/11 $BN Global Securities Lending Q4 2011 Average Assets on Loan Global ETF Assets Managed as of 12/31/11 2011 Performance Continued Market Leadership AUM, $BN Source: Company reports *BlackRock as of 12/31/10. Source: Company reports/websites; Strategic Insight for Vanguard. *Fidelity as of 11/2011. Source: ETF Landscape Report (12/2011). |
|
12 Progress in 2011 • Effectively balanced need for investment and expense control • Reduced full-year ratio of compensation to revenue to 40.2% • Implemented targeted staff reductions • Accelerated Business Operations and Information Technology Transformation Program in view of environment – Achieved $86 million in annual pre-tax, run- rate expense savings 1 2011 Performance Effectively Managed Expenses 1 Excluded restructuring charges; compared to 2010, all else being equal. Annual pre-tax, run-rate expense savings related only to the Business Operations and Information Technology Transformation program; actual operating expenses of the Company may increase or decrease due to other factors. |
|
13 2011 Performance Outperformed Peers Operating / Adjusted-Basis Results Full-Year 2011 vs. 2010 STT BK NTRS Revenue Growth 9.0% 6.3% 3.3% EPS Growth 9.7% (7.0)% (9.1)% Pre-tax Margin 28.6% 25.0% 23.6% Return on Equity 9.9% 8.6% 8.5% Net Interest Margin 1.52% 2 1.36% 1.27% Tier 1 Common 16.9% 13.4% 12.1% Tier 1 Common (under Basel III) 12.1% 7.1% 12.3% 1 Tier 1 common and Tier 1 common (under Basel III) data stated as of 12/31/11. Each company’s operating/adjusted (non-GAAP) presentation may be calculated differently and therefore may not be comparable to other companies’ operating/adjusted (non-GAAP) presentations. Please review each company’s public filings and earnings reports for a description, to the extent contained therein, of their respective operating/adjusted presentations (including capital ratios). For STT, financial data is presented on an operating, (non-GAAP) basis, and tier 1 common ratios include non-GAAP data in their calculation (in addition to Basel III ratios based upon various estimates). For a description of this operating-basis presentation, as well as a description of referenced ratios and related reconciliations, see the Appendix. 2 Includes excess client deposits. 1 |
|
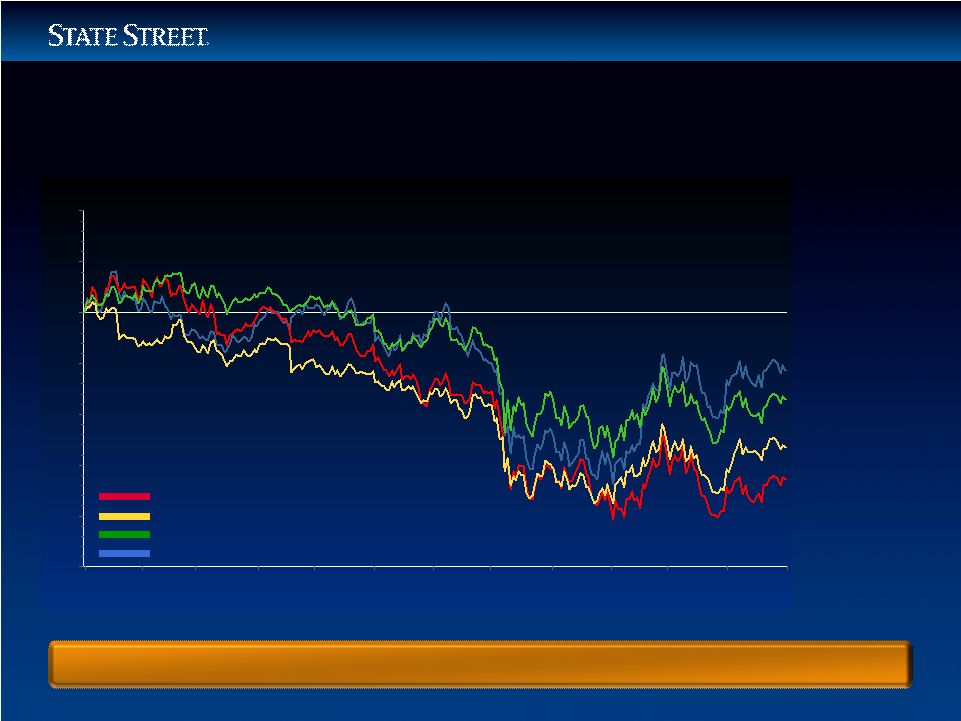
14 Jan Feb Mar Apr May Jun Jul Aug Sep Oct Nov Dec -50% -40% -30% -20% -10% 0% 10% 20% 1-Year Total Return: 12/31/2010 - 12/31/2011 2011 Performance Outperformed Peers Bank of New York Mellon Corp. Northern Trust Corp. S&P 500 / Financials State Street Corp. STT -11.5% S & P Fin. -17.1% NTRS -26.6% BK -32.3% Source: FactSet STT Total Return Significantly Outperformed Primary Peers and Broader Financial Index |
|
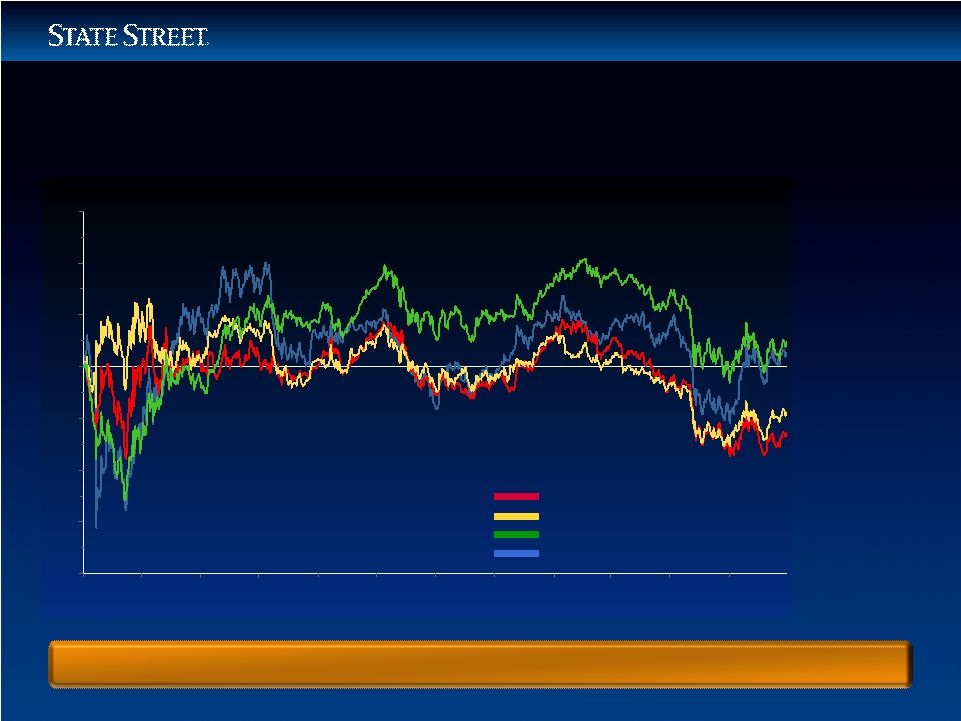
15 1/09 4/09 7/09 10/09 1/10 4/10 7/10 10/10 1/11 4/11 7/11 10/11 -80% -60% -40% -20% 0% 20% 40% 60% 3-Year Total Return: 12/31/2008 - 12/31/2011 2011 Performance Outperformed Peers Bank of New York Mellon Corp. Northern Trust Corp. S&P 500 / Financials State Street Corp. STT 4.5% S & P Fin. 9.0% NTRS -18.5% BK -26.0% Source: FactSet STT Total Return Significantly Outperformed Primary Peers 12/11 |
|
16 Building from Strength Agenda 2011 Performance Strategic Direction – Jay Hooley Globalization Business Operations and Information Technology Transformation Program Financial Update Summary |
|
17 Strategic Direction • Expand market share and share of wallet • Aggressively manage client profitability • Double non-US revenue by 2014, compared to 2009 • Develop client-driven solutions • Accelerate new product development • Driven by technology and business process transformation • Complemented by a flexible workforce • Invest in deep local market expertise • Increase dividends / share purchases • Pursue attractive acquisitions Drive Profitable Growth Develop and Attract Top Talent Transform Operating Model Invest in Innovation Leverage Capital Strength |
|
18 Strategic Direction Long-Term Trends Support Growth • Ongoing globalization of investment and distribution channels • Driven by demographics, especially in Europe and Asia • Evolution of retirement / savings schemes • Driving growth in outsourcing • Growth in alternative assets globally • Solutions orientation within asset management • Fostered by regulatory requirements • Increasing requirement for global capabilities Globalization Retirement Savings Complexity Consolidation |
|
19 Year ended 12/31/01 2 Year ended 12/31/11 % Change Revenue 3 $3.8BN $9.5BN +150% Non-US Revenue 3 $1.0BN $3.9BN +290% Employees 4 18,840 29,740 +58% Non-US Employees 4 4,200 13,350 +218% Strategic Direction Globalization 1 Based on AUA; Company data as of 12/31/11. 2 Data exclude the revenue and employees associated with the Corporate Trust and Private Asset Management businesses divested in 2002 and 2003, respectively. 3 Financial information presented on an operating, or non-GAAP, basis (which is adjusted to exclude, among other things, conduit-related discount accretion). For a description of GAAP and operating-basis revenue, and related reconciliations, please see the Appendix. 4 At period end. • Globalization of asset pools continues to accelerate • Europe 10-year asset growth = 1024% 1 • Asia Pacific 10-year asset growth = 403% 1 |
|
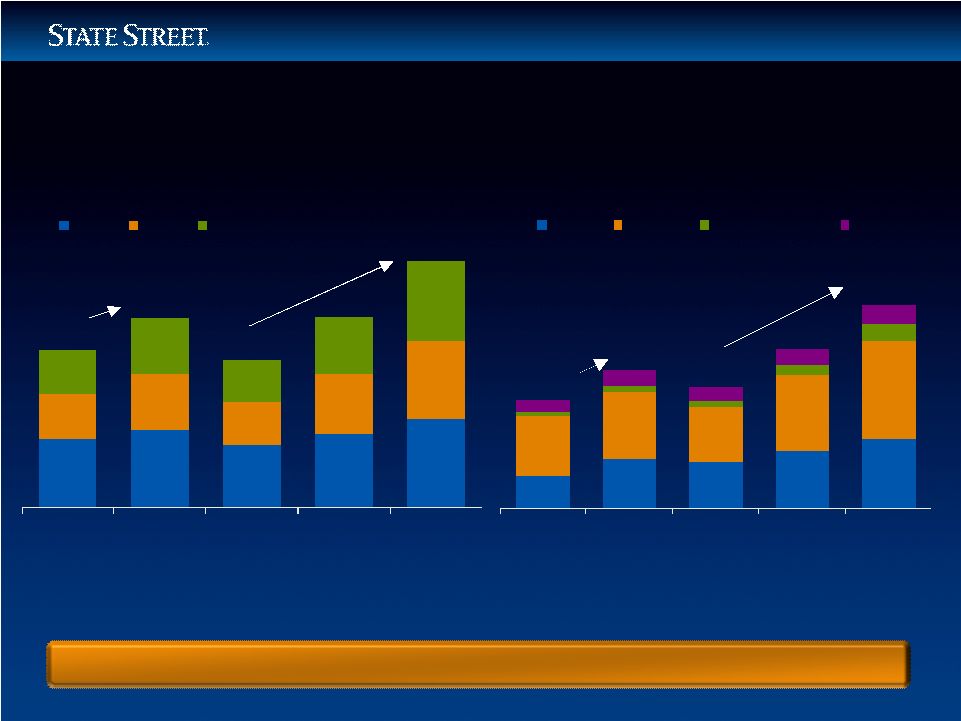
20 Strategic Direction Retirement Savings 2005 2007 2008 2011E 2015E APAC Europe Latin America Other Non-US Retirement Growth US Retirement Growth 2005 2007 2008 2011E 2015E DB DC IRA $13.2T $16.0T $12.4T $16.0T $20.7T 10.1% CAGR 7.6% CAGR $6.6T $8.5T $7.4T $9.8T $13.6T 13.5% CAGR 9.1% CAGR Almost 50% of non-US retirement asset growth (2011 – 2015) expected to come from Europe Source: Cerulli Associates , Global Markets 2011. DC and IRA assets expected to lead US retirement growth, with 8.7% and 9.3% expected CAGRs (2008 – 2015), respectively Global Retirement Assets Are Expected to Grow at a CAGR of 7.4% from 2011 through 2015 |
|
21 • Globalization • Regulation • Need for transparency around risk management • Enhanced data reporting Hedge Fund Servicing • Largest servicer in the world 1 in a market sized at $1.98TN 2 and growing at an estimated 12% CAGR from 2010 through 2014 3 Investment Manager Operations Outsourcing • No. 1 provider 4 in a market of about $65TN 5 Investment Management Solutions • Offer customized strategic and tactical asset allocation solutions globally Strategic Direction Complexity DRIVEN BY 1 ICFA Annual Fund Administration Survey, 2011. 2 Hedge Fund Research, 9/30/11. 3 BCG, Global Asset Management Report, 7/2011. 4 Scrip Issue Global Report, 9/2011. 5 Data as of 12/31/10 in Pensions & Investment/Wyatt Watson, 10/31/11. |
|
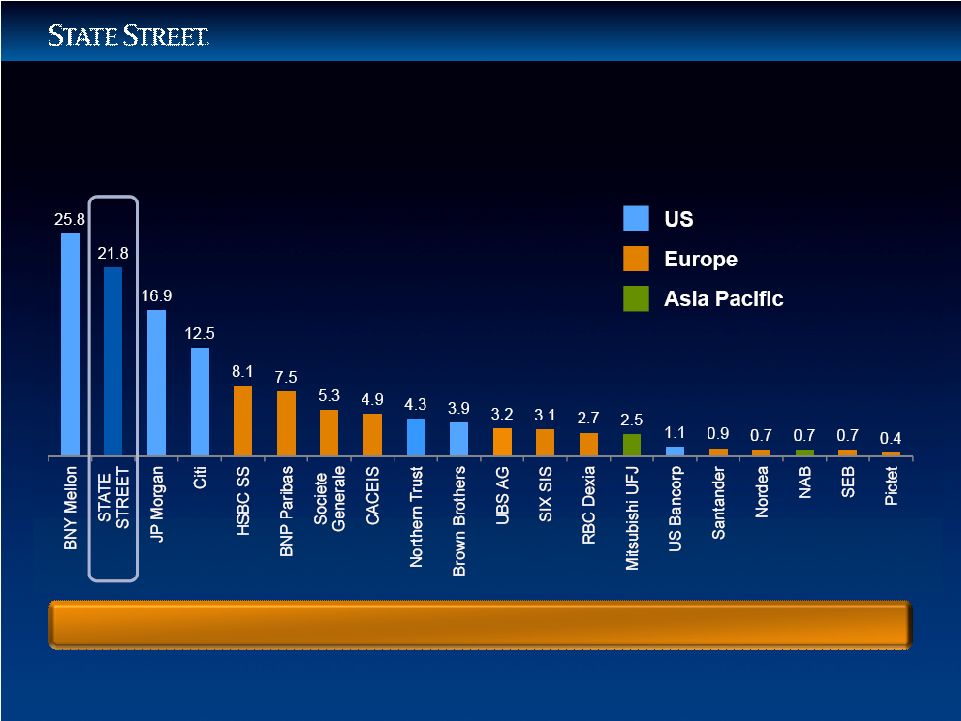
22 Strategic Direction Consolidation: Top 20 Companies by AUC / AUA 1 ($TN) Source: Company reports, Global Custody.net. 1 Data for BNY, State Street, reflect AUA as of 12/31/2011; as of 9/30/11 for BNP Paribas, Societe Generale, RBC Dexia; as of 12/31/10 for HSBC; all others reflect AUC data: JP Morgan, Citi, & Northern Trust, as of 12/31/11; UBS, Nordea, Pictet as of 9/30/11; CACEIS as of 3/31/11; SEB as of 1/31/11; Brown Brothers, SIX SIS, Santander, NAB as of 12/31/10. Driven by Global Scale and Capital Requirements |
|
23 Building from Strength Agenda 2011 Performance Strategic Direction Globalization – Scott Powers, Joseph C. Antonellis, Peter O’Neill Business Operations and Information Technology Transformation Program Financial Update Summary |
|
24 Globalization Competitive Advantage MIDDLE OFFICE BACK OFFICE Key Opportunities • Client focus on core competencies heightening demand for outsourced solutions • Need for greater transparency and data management driving demand for value added solutions • Separation of Alpha and Beta fueling opportunities in asset management Integrated Solutions Across Investment Spectrum FRONT OFFICE • Investment Management • Investment Solutions • Investment Research • Trade Execution and Implementation • Investment Valuation • Performance and Risk Reporting • Regulatory Reporting • Trade Clearing and Settlement • Cash and Collateral Management • Reconciliation and Position Reporting • Data Management • Fund Accounting • Fund Administration • Custody • Transfer Agency |
|
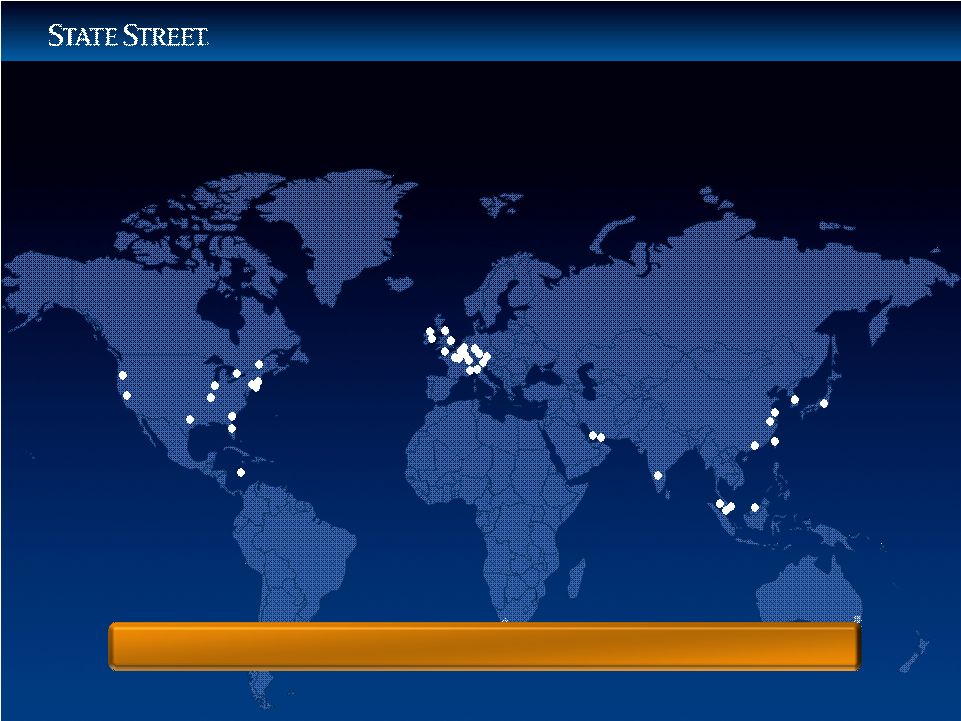
25 1 As of December 31, 2011. NORTH AMERICA $1,328BN AUM $16,367BN AUC / A EUROPE, MIDDLE EAST, AFRICA $320BN AUM $4,400BN AUC / A ASIA PACIFIC $210BN AUM $1,040BN AUC / A 10-year Revenue CAGRs (2001 – 2011): US = 7.5% and non-US = 14.1% Spanning the Globe with Investment Servicing and Investment Management Globalization Strong Global Footprint 1 |
|
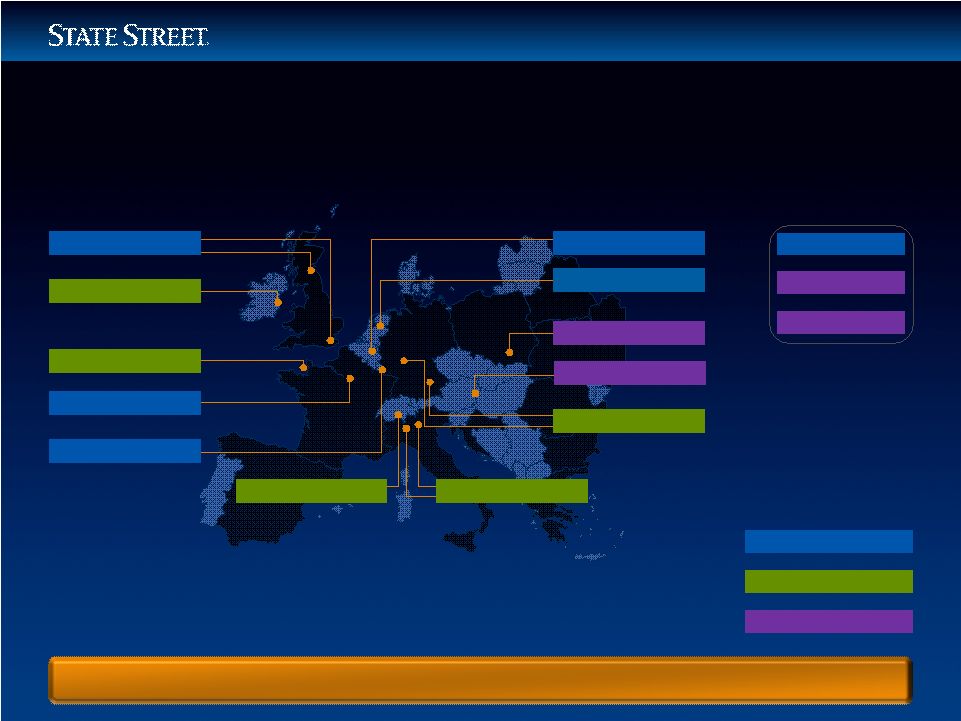
26 Globalization Strong Global Footprint – Europe, Middle East, and Africa 10-Year View (2001 – 2011) 14 Countries, 9,000 Employees SWITZERLAND LUXEMBOURG IRELAND CHANNEL ISLANDS GREAT BRITAIN BELGIUM GERMANY FRANCE ITALY POLAND THE NETHERLANDS UAE QATAR SOUTH AFRICA Major Acquisition New Office Opened Existing Office AUSTRIA |
|
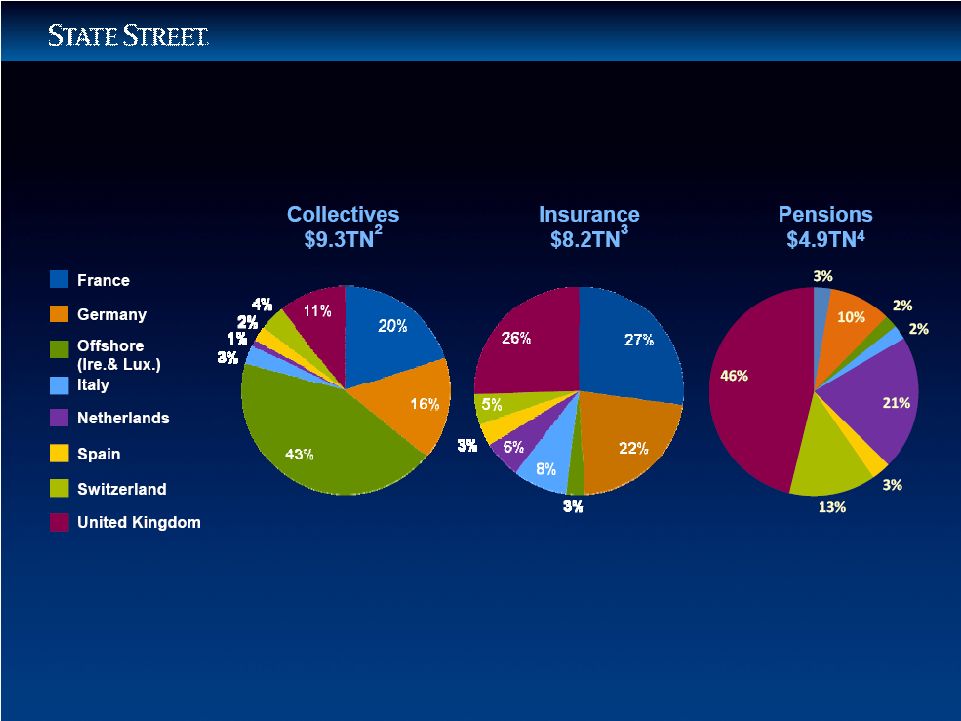
27 Globalization European Collectives, Pension, Insurance Markets: $22.4TN 1 1 Total Market size includes STT key European markets serviced: UK, Netherlands, Germany, Ireland / Luxembourg (Offshore Assets), Italy, Spain, Switzerland and France. 2 EFAMA Quarterly Statistical Release, 3rd Quarter, November 2011, No.47, Combined UCITS & Non-UCITS. 3 CEA Insurance YE 2010 Report; 2010 and 2001 total insurers’ investment portfolio assets. 4 Cerulli, Quantitative Update, Global Markets, YE 2005 & June 2011; Towers Watson, Global Pension Asset Study Feb 2011 & Watson Wyatt 2007 Global Pension Asset Study. |
|
28 Globalization Growing Faster Than the Market European Collective, Pension and Insurance Market 2001 – 2011 1 CAGR: 8.7% $9.7TN 2001 $22.4TN 2011 1 Total assets include seven key European markets: UK, Netherlands, Germany, Ireland / Luxembourg offshore assets, Italy, Spain, Switzerland and France. Sources: efama, Quarterly Statistical Release, Fourth Quarter 2001, Combined UCITS & Non UCITS; CEA Statistics, European Insurance In Figures December 2010; Table 9 total insurers investment portfolio; Cerulli, Quantitative Update, Global Markets, June 2011 & Watson Wyatt 2001 & 2007 Global Pension Asset Study. 2 AUA represents all European assets under custody / administration. |
|
29 Globalization Strong Global Footprint – Asia Pacific 10-Year View (2001 – 2011) 10 Countries, 6,900 Employees 1 SOUTH KOREA SINGAPORE HONG KONG BRUNEI TAIWAN CHINA JAPAN New Office Opened / Underway Existing Office MALAYSIA INDIA AUSTRALIA 1 Includes JV employees in India. |
|
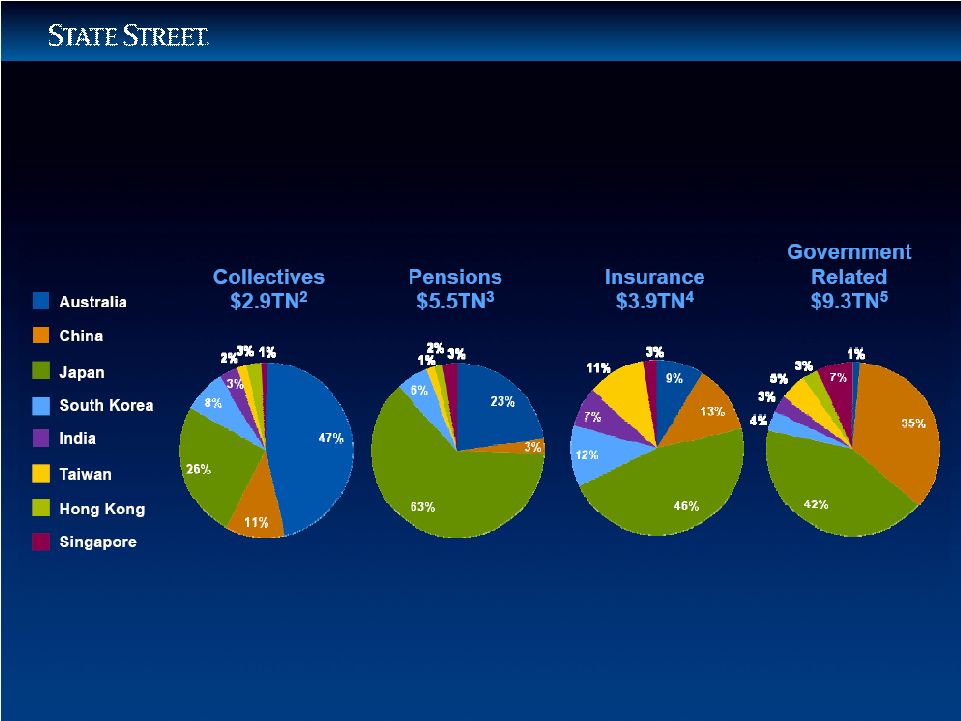
30 Globalization Asia Pacific Collectives, Pension, Insurance and Government-related Overall Market Size and Market Share: $21.6TN 1 Total assets include eight key markets: Japan, Australia, Hong Kong, South Korea, Taiwan, China, India and Singapore. 2 ICI (9/11). 3 Towers Watson Global Pension Study 2011; Cerulli Quantitative Updates: Global Markets, 2011. 4 National insurancewebsites (12/10); STT Estimates. 5 Government websites, World Bank country international reserves statistics, and State Street estimates; Japan includes Japan Post (9/10); Taiwan includes Chunghwa Post, formerly Taiwan Post (9/10). 1 |
|
31 Globalization Growing Faster Than the Market Asia Pacific Collective, Insurance, Pension, and Government Market Growth 2001 – 2011 1 CAGR: 11.5% $7.3TN 2001 $21.6TN 2011 State Street APAC AUM Growth 2001 – 2011 CAGR: 20.0% $34BN 2001 $210BN 2011 State Street APAC / AUA 2 Growth 2001 – 2011 CAGR: 17.5% $207BN 2001 $1,040BN 2011 1 Total assets include eight key markets: Japan, Australia, Hong Kong, South Korea, Taiwan, China, India and Singapore. Sources: ICI (9/11):Towers Watson Global Pension Study 2011; Cerulli Quantitative Updates: Global Markets, 2011; National insurance websites (12/10); Government websites, World Bank country international reserves statistics, Japan includes Japan Post (9/10); Taiwan includes Chunghwa Post, formerly Taiwan Post (9/10) and STT estimates. 2 AUA represents assets from Asia Pacific under custody /administration. |
|
32 Globalization Growth Strategies New Sources of Value Innovation Increased Business Complexity Regulation & Compliance Data Integration and Complexity Operational Efficiency Trends Fueling Growth Client Challenges Growth Priorities Globalization Retirement Savings Complexity Consolidation Expand Local Market Capabilities and Footprint Integrate Solutions across Investment Management Servicing and Trading Accelerate New Product Development Grow Through Acquisitions and JVs Deepen Client Relationships |
|
33 Building from Strength Agenda 2011 Performance Strategic Direction Globalization Business Operations and Information Technology Transformation Program – James S. Phalen, Christopher Perretta Financial Update Summary |
|
34 Goals • Position the company for accelerated growth • Achieve estimated annual pre-tax, run-rate expense savings of $575MN to $625MN by the end of 2014 for full effect in 2015 1 • Achieve, by the end of 2015, a 400bp improvement in operating-basis pre-tax margin, compared to 2010 operating- basis pre-tax margin, assuming all else being equal Business Operations and Information Technology Transformation Program Overview 1 Compared to 2010, all else being equal, estimated annual pre-tax, run-rate expense savings and operating-basis pre-tax margin improvement relate only to the Business Operations and Information Technology Transformation program; actual operating expenses and operating margin of the Company may increase or decrease due to other factors. Includes operating-basis information. Operating-basis information is a non-GAAP presentation. See Appendix for a description of operating-basis information. 1 |
|
35 Business Operations and Information Technology Transformation Program Estimated Annual Pre-tax, Run-rate Expense Savings $MN 2011 2012 2013 2014 2015 Business Operations Transformation $158 $260 $370 $430 $440 Information Technology Transformation 6 20 100 150 160 Net Benefits Before Non-recurring Project-related Expenses 164 280 470 580 600 Less: Non-recurring Project-related Operating Expenses 78 100 70 40 0 Annual Pre-tax, Run-rate Expense Savings $86 $180 $400 $540 $600 1 Compared to 2010, all else being equal. The full effect of the annual pre-tax, run-rate savings is not expected to be experienced until 2015. Chart data based on the approximate mid-point of the range of the estimated annual pre-tax, run-rate expense savings of $575MN-$625MN at the end of 2014, for full effect in 2015; estimated savings for individual years may vary up or down based on the execution of the Business Operations and Information Technology Transformation program. Annual pre-tax, run-rate expense savings relate only to the Business Operations and Information Technology Transformation program; actual operating expenses of the Company may increase or decrease due to other factors. 1 |
|
36 Business Operations and Information Technology Transformation Program Operations Plan 14 Core Business 14 Core Business Operations Operations Processes are Processes are in Scope in Scope 2012 Milestones • Four key operations transformation levers – Process transformation – Automation – Consolidation – Workforce optimization • Operations transformation portfolio includes 160+ initiatives • Initiatives have been sequenced into master plan through 2014 • Establish two additional global Centers of Excellence for a total of seven overall • Achieve 20% targeted automation benefits • Establish two new low-cost locations to balance our global footprint |
|
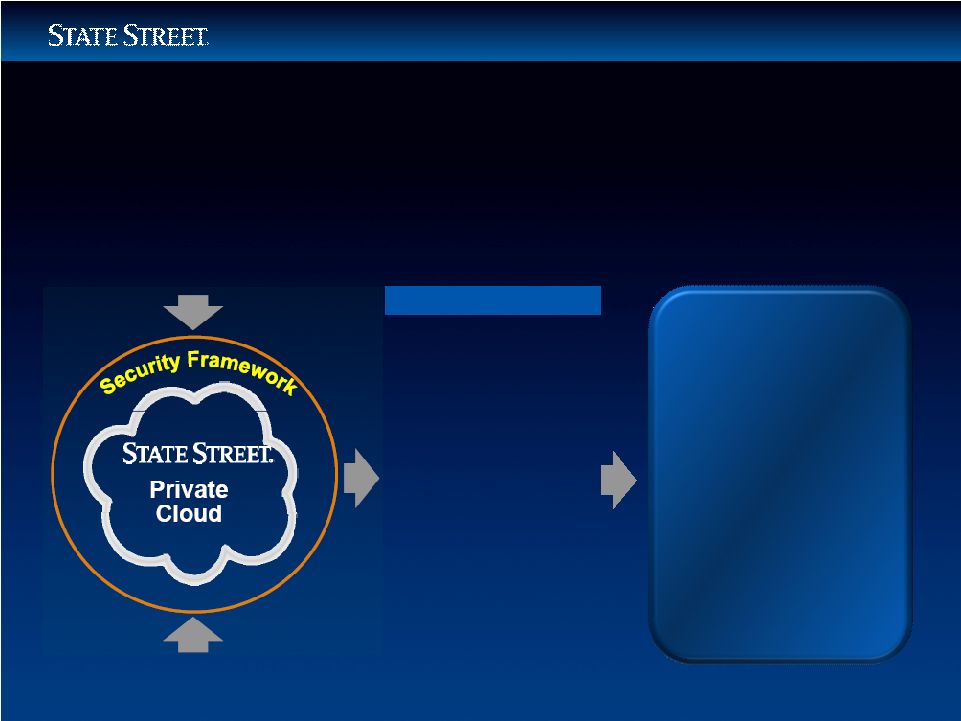
37 Business Operations and Information Technology Transformation Program IT Plan Industrial-strength Application Development Key Program Benefits Proprietary Real-time Information • Automation / capacity on demand • Accelerated time to market • Integrated security environment • Real-time data infrastructure • Advanced platform for product innovation • Strengthened client service 2012 Milestones • Scale cloud computing platform to enable major migrations in 2013 and 2014 • Realize 20% of the expected benefits from our IT application portfolio rationalization • Substantially complete transition to previously announced strategic servicing relationships |
|
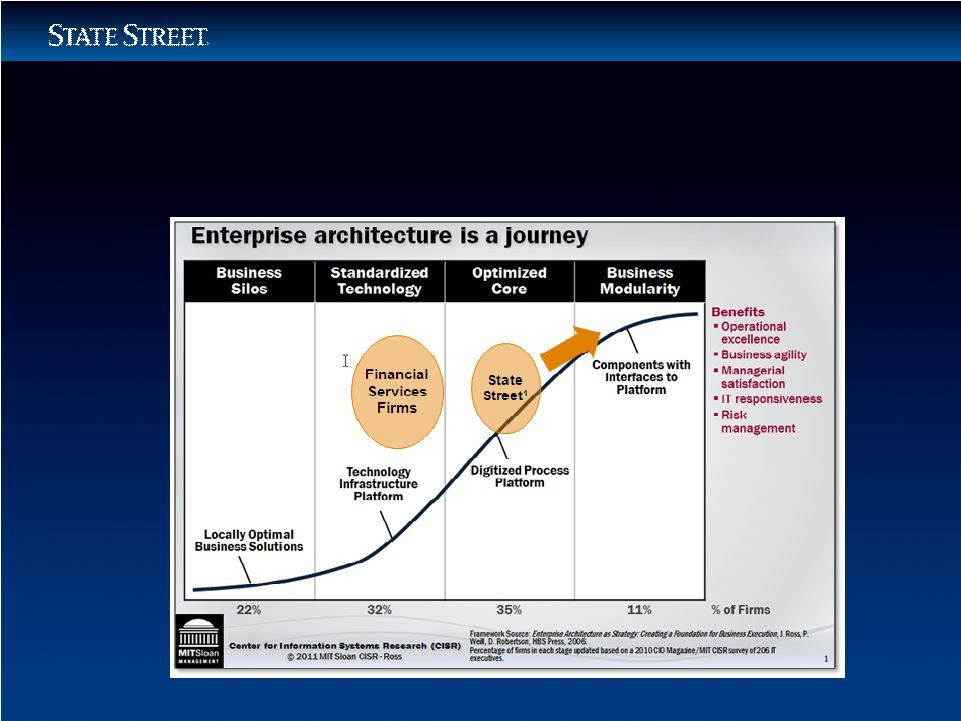
38 Business Operations and Information Technology Transformation Program Industry View 1 Relative position for “State Street” represents State Street estimates. |
|
39 Business Operations and Information Technology Transformation Program Competitive Advantage Speed • Cloud cuts new product development time by 30% • Automated provisioning/compute on demand • More client value, delivered faster – 20% onboarding improvement Agility • Powerful, proprietary real-time data analytics • Any device, any time, any where • Core operating model leverages global footprint • Business scalability supports organic and M&A growth Efficiency • Automation to reduce client risk and increase efficiency • Global operating model implementing straight-through processing in core systems • Become industry’s best AND lowest cost provider |
|
40 Building from Strength Agenda 2011 Performance Strategic Direction Globalization Business Operations and Information Technology Transformation Program Financial Update – Edward J. Resch Summary |
|
41 Financial Update 2012 Environment Fourth-Quarter Drivers Environmental Factors in 2012 Expectations for 2012 Investment Portfolio Management Capital |
|
42 Financial Update Fourth-Quarter Drivers Revenue • Clients moved away from international and emerging markets, reducing servicing and asset management fees • Weak capital markets lowered foreign exchange revenue • Excess client deposits increased net interest revenue, but reduced NIM • Impact of the stronger US dollar • Solid new business wins continued Expense • Accelerated Business Operations and Information Technology Transformation program • Targeted staff reductions • Reduced incentive compensation • Controlled headcount and compensation • Withdrew from our fixed-income trading initiative |
|
43 Financial Update Economic and Market Factors in 2012 • US GDP growth expected to slow to about 2% • Eurozone uncertainty expected to continue with GDP in 2012 to decline about (0.5)% • Worldwide administered rates expected to remain low • Consumer confidence expected to remain muted • Expect S & P 500 to increase on average 5% to 1328 and MSCI EAFE® to decline on average 7% to 1494 • Strong dollar expected to continue • Continued regulatory uncertainty |
|
44 Financial Update Expectations for 2012 Revenue • Execute effective cross-sell strategy • Attract new business in fast-growing product areas • Increase rigor in pricing • Prudently manage the investment portfolio Expense • Execute Business Operations and Information Technology Transformation program • Reduce compensation-to-revenue ratio by about 100 basis points, assuming modest revenue growth • Expect increased regulatory and compliance costs • Continue to invest in technology through the cycle |
|
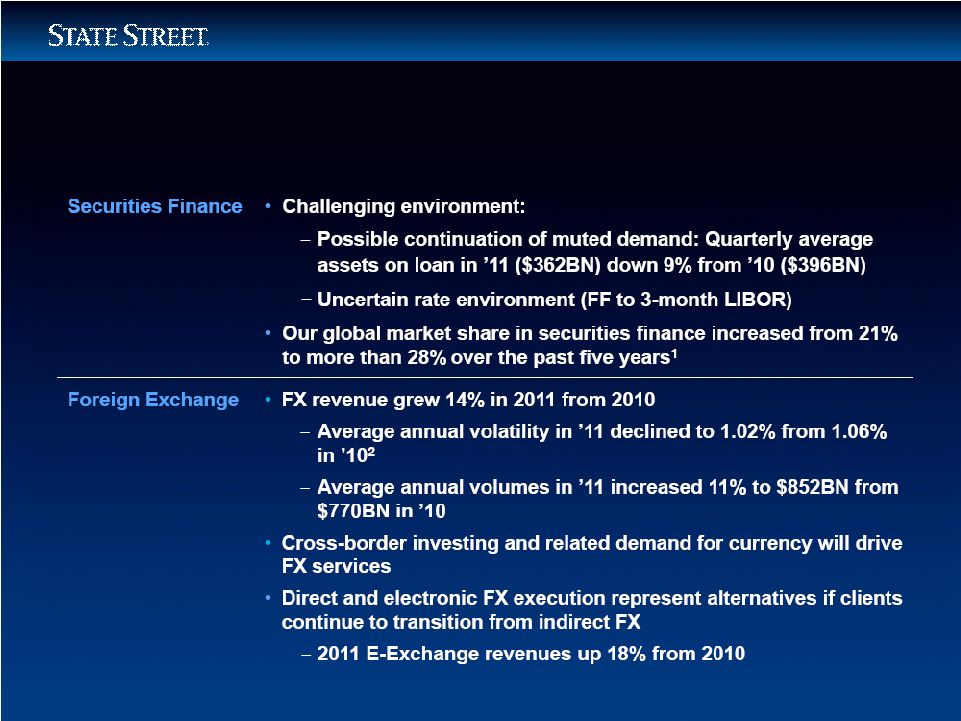
45 Financial Update Expectations for 2012: Market-Driven Revenues 1 Based on data from Data Explorers Universe as of period end. 2 Based on STT’s customer-weighted volumes. |
|
46 Interest-rate Assumptions for 2012 • Worldwide administered rates on hold through 2012 • Yield curves retain current shape Investment Portfolio • Duration: 1.49 years driving balance sheet gap of 0.36 years • 89% AAA / AA rated; fixed / floating ratio: 41% / 59% • Growth in 2012 to be consistent with growth of underlying business Reinvestment Strategy • Expect about $20BN to mature or pay down in 2012 • Expect to purchase primarily AAA- and AA-rated Agency mortgage-backed securities and asset-backed securities Peripheral Country Exposure 1 • No sovereign exposure • $1.2BN in securities, primarily RMBS – performing well Financial Update Investment Portfolio Management 1 Portugal, Ireland, Italy, Greece and Spain. 2 Information stated on an operating, or non-GAAP, basis (which is adjusted to exclude, among other things, discount accretion). For a description of operating-basis information, please see the Appendix. 2012 Operating-Basis NIM Expected to be in Range of 145 to 155 bps 2 |
|
47 Financial Update Capital: Deployment CCAR in Process • Response expected by mid-March Dividend • Payout ratio target: 20% – 25% Share Purchase Program • Expect to return as much capital to shareholders as allowed Acquisitions • Expect to be opportunistic and disciplined • Criteria: – Aligned with our strategy – Expect accretion within the first full year of operation – Projected return to be higher than our WACC |
|
48 Financial Update Capital: Return on Equity Target 1 Improved Operating Margin • Successful execution of Business Operations and Information Technology Transformation program Interest Rates • A more normalized rate environment (3% FF; 5% 10-year U.S. Treasury) Capital Management • Migrate from earnings-based to capital-ratio distribution model Tier 1 Common Ratio 1 • Manage to 10% ratio, assuming a 1% G-SIB buffer Realization of These Drivers is Expected to Result in a Long-Term ROE 2 Target Range of 12% to 15% 1 Estimated under Basel III regulations, as understood, at fully phased-in levels. 2 Stated on an operating, or non-GAAP, basis (which is adjusted to exclude, among other things, conduit-related discount accretion). For a description of operating-basis information, please see the Appendix. |
|
49 Building from Strength Agenda 2011 Performance Strategic Direction Globalization Business Operations and Information Technology Transformation Program Financial Update Summary – Jay Hooley |
|
Summary Building from Strength Resilience Amid Challenges Focused Strategy Fueled by Macro Trends Leading Global Footprint Rigorous Expense and Balance Sheet Management Strong Capital Driving Long-term Shareholder Value 50 |
STATE STREET CORPORATION
RECONCILIATION OF OPERATING-BASIS RESULTS
State Street prepares its consolidated statement of income in accordance with accounting principles generally accepted in the U.S., or GAAP. In addition, State Street presents financial information on a non-GAAP basis, referred to as “operating” basis. Management measures and compares certain financial information on an operating basis, as it believes that this presentation supports meaningful comparisons from period to period and the analysis of comparable financial trends with respect to State Street’s normal ongoing business operations. Management believes that operating-basis financial information, which reports revenue from non-taxable sources on a fully taxable-equivalent basis and excludes the impact of revenue and expenses outside of the normal course of business, facilitates an investor’s understanding and analysis of State Street’s underlying financial performance and trends in addition to financial information prepared in accordance with GAAP. The tables presented below reconcile financial information prepared on an operating basis to financial information prepared and reported in accordance with GAAP.
| | | | | | | | | | | | | | | | | | | | | | | | | | | | |
(Dollars in millions, except per share amounts) | | Year Ended December 31, 2010 | | | Year Ended December 31, 2011 | | | % Change | |
| | | Reported
Results | | | Adjustments | | | Operating-Basis
Results | | | Reported
Results | | | Adjustments | | | Operating-Basis
Results | | | 2011 vs.
2010 | |
Total fee revenue | | $ | 6,540 | | | | | | | $ | 6,540 | | | $ | 7,194 | | | | | | | $ | 7,194 | | | | | |
Net interest revenue | | | 2,699 | | | $ | (583 | )(1) | | | 2,116 | | | | 2,333 | | | $ | (92 | )(7) | | | 2,241 | | | | | |
Gains (Losses) related to investment securities, net: | | | (286 | ) | | | 344 | (2) | | | 58 | | | | 67 | | | | — | | | | 67 | | | | | |
| | | | | | | | | | | | | | | | | | | | | | | | | | | | |
Total revenue | | | 8,953 | | | | (239 | ) | | | 8,714 | | | | 9,594 | | | | (92 | ) | | | 9,502 | | | | 9.0 | % |
Provision for loan losses | | | 25 | | | | — | | | | 25 | | | | — | | | | — | | | | — | | | | | |
Total expenses | | | 6,842 | | | | (666 | )(3) | | | 6,176 | | | | 7,058 | | | | (269 | )(8) | | | 6,789 | | | | 9.9 | % |
| | | | | | | | | | | | | | | | | | | | | | | | | | | | |
Income before income tax expense | | | 2,086 | | | | 427 | | | | 2,513 | | | | 2,536 | | | | 177 | | | | 2,713 | | | | | |
Income tax expense | | | 530 | | | | 146 | (4) | | | 676 | | | | 616 | | | | 79 | (9) | | | 695 | | | | | |
Tax-equivalent adjustment | | | — | | | | 129 | (5) | | | 129 | | | | — | | | | 128 | (5) | | | 128 | | | | | |
| | | | | | | | | | | | | | | | | | | | | | | | | | | | |
Net income | | $ | 1,556 | | | $ | 152 | | | $ | 1,708 | | | $ | 1,920 | | | $ | (30 | ) | | $ | 1,890 | | | | | |
| | | | | | | | | | | | | | | | | | | | | | | | | | | | |
Adjustments to net income: | | | | | | | | | | | | | | | | | | | | | | | | | | | | |
Dividend on preferred stock | | $ | — | | | $ | — | | | $ | — | | | $ | (20 | ) | | $ | — | | | $ | (20 | ) | | | | |
Earnings allocated to participating securities | | | (16 | ) | | | (2 | )(6) | | | (18 | ) | | | (18 | ) | | | — | | | | (18 | ) | | | | |
| | | | | | | | | | | | | | | | | | | | | | | | | | | | |
Net income available to common shareholders | | $ | 1,540 | | | $ | 150 | | | $ | 1,690 | | | $ | 1,882 | | | $ | (30 | ) | | $ | 1,852 | | | | | |
| | | | | | | | | | | | | | | | | | | | | | | | | | | | |
Diluted earnings per common share | | $ | 3.09 | | | $ | .31 | | | $ | 3.40 | | | $ | 3.79 | | | $ | (.06 | ) | | $ | 3.73 | | | | 9.7 | % |
Average diluted common shares outstanding (in thousands) | | | 497,924 | | | | 497,924 | | | | 497,924 | | | | 496,072 | | | | 496,072 | | | | 496,072 | | | | | |
Return on common equity | | | 9.5 | % | | | 0.9 | % | | | 10.4 | % | | | 10.0 | % | | | (0.1 | )% | | | 9.9 | % | | | (50 | )bps |
Net interest margin(10) | | | 2.24 | % | | | (0.56 | )% | | | 1.68 | % | | | 1.67 | % | | | (0.15 | )% | | | 1.52 | % | | | | |
Pre-tax margin(11) | | | 23.3 | % | | | 5.5 | % | | | 28.8 | % | | | 26.4 | % | | | 2.2 | % | | | 28.6 | % | | | | |
| (1) | Represents tax-equivalent adjustment of $129 million, not included in reported results, net of $712 million of discount accretion related to former conduit securities. |
| (2) | Represents a net loss related to a repositioning of the investment portfolio. |
| (3) | Represents $89 million of integration costs; $156 million of restructuring charges related to the business operations and information technology transformation program; a charge, composed of $330 million to provide for a one-time cash contribution to the SSgA lending fund collateral pools and liquidating trusts and $9 million of associated costs; $75 million to establish a reserve to address potential inconsistencies in the application of redemption policy for agency lending collateral pools; and $7 million of tax on bonus payments to employees in the U.K. |
| (4) | Represents a discrete tax benefit of $180 million related to former conduit assets and the net tax effect of non-operating adjustments. |
| (5) | Represents tax-equivalent adjustment, not included in reported results. |
| (6) | Represents effect of the difference between reported and operating-basis earnings on allocation to participating securities. |
| (7) | Represents tax-equivalent adjustment of $128 million, not included in reported results, net of $220 million of discount accretion related to former conduit securities. |
| (8) | Represents $71 million of integration costs related to previous acquisitions; a $55 million indemnification benefit for an income tax claim related to the 2010 acquisition of the Italian securities services business; $133 million of restructuring charges related to the business operations and information technology transformation program; and $120 million of restructuring charges mainly related to our withdrawal from our fixed-income trading initiative. |
| (9) | Represents a discrete tax benefit of $103 million related to former conduit assets, income tax expense of $55 million related to the indemnification benefit described in note (8), and the net tax effect of non-operating adjustments. |
| (10) | Reported margin for the year ended December 31, 2010 represents fully taxable-equivalent net interest revenue of $2.83 billion (reported net interest revenue of $2.70 billion plus a tax-equivalent adjustment of $129 million) as a percentage of reported average interest-earning assets for the period. Reported margin for the year ended December 31, 2011 represents fully taxable-equivalent net interest revenue of $2.46 billion (reported net interest revenue of $2.33 billion plus a tax-equivalent adjustment of $128 million) as a percentage of reported average interest-earning assets for the period. |
| (11) | Represents income before income tax expense as a percentage of total revenue. |
STATE STREET CORPORATION
Reconciliations of Tangible Common Equity and Tier 1 Common Ratios
December 31, 2011
The ratio of tangible common equity to adjusted tangible assets, or TCE ratio, is calculated by dividing consolidated total common shareholders’ equity by consolidated total assets, after reducing both amounts by goodwill and other intangible assets net of related deferred taxes. Total assets reflected in the TCE ratio also exclude cash balances on deposit at the Federal Reserve Bank and other central banks in excess of required reserves. The TCE ratio is not required by GAAP or by bank regulations, but is a metric used by management to evaluate the adequacy of State Street’s capital levels. Since there is no authoritative requirement to calculate the TCE ratio, our TCE ratio is not necessarily comparable to similar capital measures disclosed or used by other companies in the financial services industry. Tangible common equity and adjusted tangible assets are non-GAAP financial measures and should be considered in addition to, not as a substitute for or superior to, financial measures determined in accordance with GAAP.
The tier 1 risk-based common, or tier 1 common, ratio is calculated by dividing tier 1 capital, which is calculated in accordance with applicable bank regulatory requirements, less non-common elements, including preferred stock and qualifying trust preferred securities, by total risk-weighted assets, which assets are also calculated in accordance with applicable bank regulatory requirements. The tier 1 common ratio is not required by GAAP or on a recurring basis by bank regulations. However, this ratio has been used by the Federal Reserve in connection with its evaluation of the capital adequacy of certain large U.S. bank holding companies. In addition, management is currently monitoring this ratio, along with the other capital ratios, in evaluating State Street’s capital levels and believes that, at this time, the ratio may be of interest to investors.
The table set forth below presents the calculations of State Street’s ratios of tangible common equity to total tangible assets, and tier 1 common capital to total risk-weighted assets.
| | | | | | |
(Dollars in millions) | | | | December 31,
2011 | |
Consolidated Total Assets | | | | $ | 216,302 | |
Less: | | | | | | |
Goodwill | | | | | 5,645 | |
Other intangible assets | | | | | 2,459 | |
Excess reserves held at central banks | | | | | 50,094 | |
| | | | | | |
Adjusted assets | | | | | 158,104 | |
Plus deferred tax liabilities | | | | | 757 | |
| | | | | | |
Total tangible assets | | A | | $ | 158,861 | |
| | | | | | |
Consolidated Total Common Shareholders’ Equity | | | | $ | 18,898 | |
Less: | | | | | | |
Goodwill | | | | | 5,645 | |
Other intangible assets | | | | | 2,459 | |
| | | | | | |
Adjusted equity | | | | | 10,794 | |
Plus deferred tax liabilities | | | | | 757 | |
| | | | | | |
Total tangible common equity | | B | | $ | 11,551 | |
| | | | | | |
Tangible common equity ratio | | B/A | | | 7.3 | % |
Tier 1 Capital | | | | $ | 13,625 | |
Less: | | | | | | |
Trust preferred securities | | | | | 950 | |
Preferred stock | | | | | 500 | |
| | | | | | |
Tier 1 common capital | | C | | $ | 12,175 | |
| | | | | | |
Total risk-weighted assets | | D | | $ | 72,234 | |
Ratio of tier 1 common capital to total risk-weighted assets | | C/D | | | 16.9 | % |
STATE STREET CORPORATION
BASEL III CAPITAL RECONCILIATION
December 31, 2011
The table set forth below reconciles State Street’s capital ratios calculated in accordance with currently applicable bank regulatory requirements, as well as the tier 1 common ratio, to estimated ratios calculated in accordance with Basel III as State Street currently understands the impact of the Basel III requirements.
| | | | | | | | | | |
(Dollars in millions) | | Current
Requirements (1) | | | | | Basel III
Requirements (2) | |
Tier 1 capital | | $ | 13,625 | | | A | | $ | 13,030 | |
Less: | | | | | | | | | | |
Trust preferred securities | | | 950 | | | | | | 637 | |
Preferred stock | | | 500 | | | | | | 500 | |
| | | | | | | | | | |
Tier 1 common capital | | | 12,175 | | | B | | | 11,893 | |
Total capital | | | 14,823 | | | C | | | 14,682 | |
Total risk-weighted assets | | | 72,234 | | | D | | | 98,335 | |
Adjusted quarterly average assets | | | 186,021 | | | E | | | 231,924 | |
Tier 1 capital ratio | | | 18.9 | % | | A/D | | | 13.3 | % |
Total capital ratio | | | 20.5 | % | | C/D | | | 14.9 | % |
Tier 1 common ratio | | | 16.9 | % | | B/D | | | 12.1 | % |
Tier 1 leverage ratio | | | 7.3 | % | | A/E | | | 5.6 | % |
| (1) | Actual (unaudited) total capital, tier 1 capital and tier 1 leverage ratios were calculated in accordance with currently applicable bank regulatory requirements. Tier 1 common ratio was calculated by dividing (a) tier 1 capital less non-common elements including qualifying perpetual preferred stock, qualifying minority interest in subsidiaries and qualifying trust preferred securities (tier 1 common capital), by (b) total risk-weighted assets, which were calculated in accordance with currently applicable bank regulatory requirements. |
| (2) | For purposes of the calculations in accordance with Basel III (see below), total capital, tier 1 capital and tier 1 leverage ratios, total risk-weighted assets and adjusted quarterly average assets were calculated based on State Street’s estimates, based on published statements of the Basel Committee and the Federal Reserve, of the effects of the requirements under Basel III affecting capital. The tier 1 common ratio was calculated by dividing (a) tier 1 common capital (as described in footnote (1)), but with tier 1 capital calculated in accordance with Basel III by, (b) total risk-weighted assets, which are calculated in accordance with Basel III. State Street calculates its capital ratios in accordance with the requirements of the Board of Governors of the Federal Reserve System, which has not yet adopted Basel III. There remains considerable uncertainty concerning the timing for adoption and implementation of Basel III by the Federal Reserve. When adopted, the Federal Reserve may implement Basel III with some or more modifications or adjustments. Therefore, State Street’s current understanding of Basel III, as reflected in the table above, may be different from the ultimate application of Basel III by the Federal Reserve to State Street. |
| | • | | Tier 1 capital used in the calculation of the tier 1 capital and tier 1 leverage ratios decreased by $595 million, as a result of applying estimated Basel III requirements to tier 1 capital of $13.625 billion as of December 31, 2011. Total capital used in the calculation of the total capital ratio decreased by $141 million, as a result of applying estimated Basel III requirements to total capital of $14.823 billion as of December 31, 2011. |
| | • | | Tier 1 common capital used in the calculation of the tier 1 common ratio was $11.893 billion, reflecting the adjustments to tier 1 capital described in the first bullet above. Tier 1 common capital used in the calculation is therefore calculated as adjusted tier 1 capital of $13.030 billion less non-common elements of capital, composed of trust preferred securities of $637 million and preferred stock of $500 million as of December 31, 2011, resulting in tier 1 common capital of $11.893 billion. At December 31, 2011, there was no qualifying minority interest in subsidiaries. |
| | • | | Total risk-weighted assets used in the calculation of the total capital, tier 1 capital and tier 1 common ratios increased by $26.101 billion as a result of applying estimated Basel III requirements to total risk-weighted assets of $72.234 billion as of December 31, 2011. |
| | • | | Consolidated adjusted quarterly average assets used in the calculation of the leverage ratio increased by $45.903 billion as a result of applying estimated Basel III requirements to the actual consolidated adjusted quarterly average assets of $186.021 billion as of December 31, 2011. |
STATE STREET CORPORATION
RECONCILIATION OF OPERATING-BASIS RESULTS
State Street prepares its consolidated statement of income in accordance with accounting principles generally accepted in the U.S., or GAAP. In addition, State Street presents financial information on a non-GAAP basis, referred to as “operating” basis. Management measures and compares certain financial information on an operating basis, as it believes that this presentation supports meaningful comparisons from period to period and the analysis of comparable financial trends with respect to State Street’s normal ongoing business operations. Management believes that operating-basis financial information, which reports revenue from non-taxable sources on a fully taxable-equivalent basis and excludes the impact of revenue and expenses outside of the normal course of business, facilitates an investor’s understanding and analysis of State Street’s underlying financial performance and trends in addition to financial information prepared in accordance with GAAP. The tables presented below reconcile financial information prepared on an operating basis to financial information prepared in accordance with GAAP.
| | | | | | | | | | | | | | | | | | | | | | | | | | | | |
| | | Year Ended December 31, 2001 | | | Year Ended December 31, 2011 | | | | |
(Dollars in millions) | | Reported
Results | | | Adjustments | | | Operating-Basis
Results | | | Reported
Results | | | Adjustments | | | Operating-Basis
Results | | | % Change
2001 - 2011 | |
Total fee revenue | | $ | 2,769 | | | $ | (122 | )(1) | | $ | 2,647 | | | $ | 7,194 | | | | | | | $ | 7,194 | | | | | |
Net interest revenue | | | 1,025 | | | | 42 | (2) | | | 1,067 | | | | 2,333 | | | $ | (92 | )(3) | | | 2,241 | | | | | |
Gains related to investment securities, net: | | | 43 | | | | — | | | | 43 | | | | 67 | | | | — | | | | 67 | | | | | |
| | | | | | | | | | | | | | | | | | | | | | | | | | | | |
Total revenue | | $ | 3,837 | | | $ | (80 | ) | | $ | 3,757 | | | $ | 9,594 | | | $ | (92 | ) | | $ | 9,502 | | | | 152.9 | % |
| (1) | Represents revenue associated with the Corporate Trust and Private Management businesses divested in 2002 and 2003, respectively. |
| (2) | Represents tax-equivalent adjustment of $42 million, not included in reported results. |
| (3) | Represents tax-equivalent adjustment of $128 million, not included in reported results, net of $220 million of discount accretion related to former conduit securities. |