Fourth Quarter and Full Year 2024 Earnings February 25, 2025 1

146 26 31 73 74 76 246 208 209 165 209 164 197 36 42 148 149 152 Safe Harbor Statement Forward-Looking Statements: This presentation contains forward-looking statements within the meaning of federal securities laws, including, among others, statements about our expectations, plans, strategies or prospects. We generally use the words “may,” “will,” “expect,” “believe,” “anticipate,” “plan,” “estimate,” “project,” “assume,” “guide,” “target,” “forecast,” “see,” “seek,” “can,” “should,” “could,” “would,” “intend,” “predict,” “potential,” “strategy,” “is confident that,” “future,” “opportunity,” “work toward,” and similar expressions to identify forward-looking statements. All statements other than statements of historical or current fact are, or may be deemed to be, forward-looking statements. Such statements are based upon the current beliefs, expectations and assumptions of management and are subject to significant risks, uncertainties and changes in circumstances that could cause actual results to differ materially from the forward-looking statements. Forward-looking statements speak only as of the date they are made, and we disclaim any intention or obligation to update or revise any forward-looking statements, whether as a result of new information, future events or otherwise. Readers of this presentation are cautioned not to rely on these forward-looking statements, since there can be no assurance that these forward-looking statements will prove to be accurate. This cautionary statement is applicable to all forward-looking statements contained in this presentation. The risks and uncertainties that may cause actual results to differ materially from Masimo’s current expectations are more fully described in Masimo’s reports filed with the U.S. Securities and Exchange Commission (SEC), including our most recent Form 10-K and Form 10-Q. Copies of these filings, as well as subsequent filings, are available online at www.sec.gov, www.masimo.com or upon request. Non-GAAP Financial Measures: The non-GAAP financial measures contained herein are a supplement to the corresponding financial measures prepared in accordance with U.S. GAAP. The non-GAAP financial measures presented exclude certain items that are more fully described in the Appendix. Management believes that adjustments for these items assist investors in making comparisons of period-to-period operating results. Furthermore, management also believes that these items are not indicative of the Company’s on-going core operating performance. These non-GAAP financial measures have certain limitations in that they do not reflect all of the costs associated with the operations of the Company’s business as determined in accordance with GAAP. Therefore, investors should consider non-GAAP financial measures in addition to, and not as a substitute for, or as superior to, measures of financial performance prepared in accordance with GAAP. The non-GAAP financial measures presented by the Company may be different from the non-GAAP financial measures used by other companies. The Company has presented the following non-GAAP financial measures to assist investors in understanding the Company’s core net operating results on an on-going basis: non-GAAP revenue (constant currency), pro-forma non-GAAP revenue (constant currency), pro-forma non-GAAP revenue growth (constant currency), non-GAAP gross profit/margin %, non-GAAP SG&A expense (prior definition and updated definition), non-GAAP R&D expense, non-GAAP litigation settlements and awards, non-GAAP impairment charge, non-GAAP operating expense % (prior definition and updated definition), non-GAAP operating profit/margin % (prior definition and updated definition), non-GAAP non-operating income (expense), non-GAAP provision for income taxes (prior definition and updated definition), non-GAAP net income (loss) (prior definition and updated definition), non-GAAP net income (loss) per share (prior definition and updated definition). These non-GAAP financial measures may also assist investors in making comparisons of the company’s core operating results with those of other companies. Management believes these non-GAAP financial measures are important in the evaluation of the Company’s performance and uses these measures to better understand and evaluate our business. For additional financial details, including GAAP to non-GAAP reconciliations, please visit the Investor Relations section of the Company’s website at www.investor.masimo.com to access Supplementary Financial Information. Forward-Looking Non-GAAP Financial Measures: This presentation also includes certain forward-looking non-GAAP financial measures. We calculate forward-looking non-GAAP financial measures based on internal forecasts that omit certain amounts that would be included in GAAP financial measures. For instance, we exclude the impact of certain charges related to acquisitions, integrations, divestitures and related costs; business transition and related costs; litigation related expenses and settlements; realized and unrealized gains or losses; tax related adjustments; and other adjustments. We have not provided quantitative reconciliations of these forward-looking non-GAAP financial measures to the most directly comparable forward-looking GAAP financial measures because the excluded items are not available on a prospective basis without unreasonable efforts. For example, the timing of certain transactions is difficult to predict because management's plans may change. In addition, the Company believes such reconciliations would imply a degree of precision and certainty that could be confusing to investors. It is probable that these forward-looking non-GAAP financial measures may be materially different from the corresponding GAAP financial measures. 2
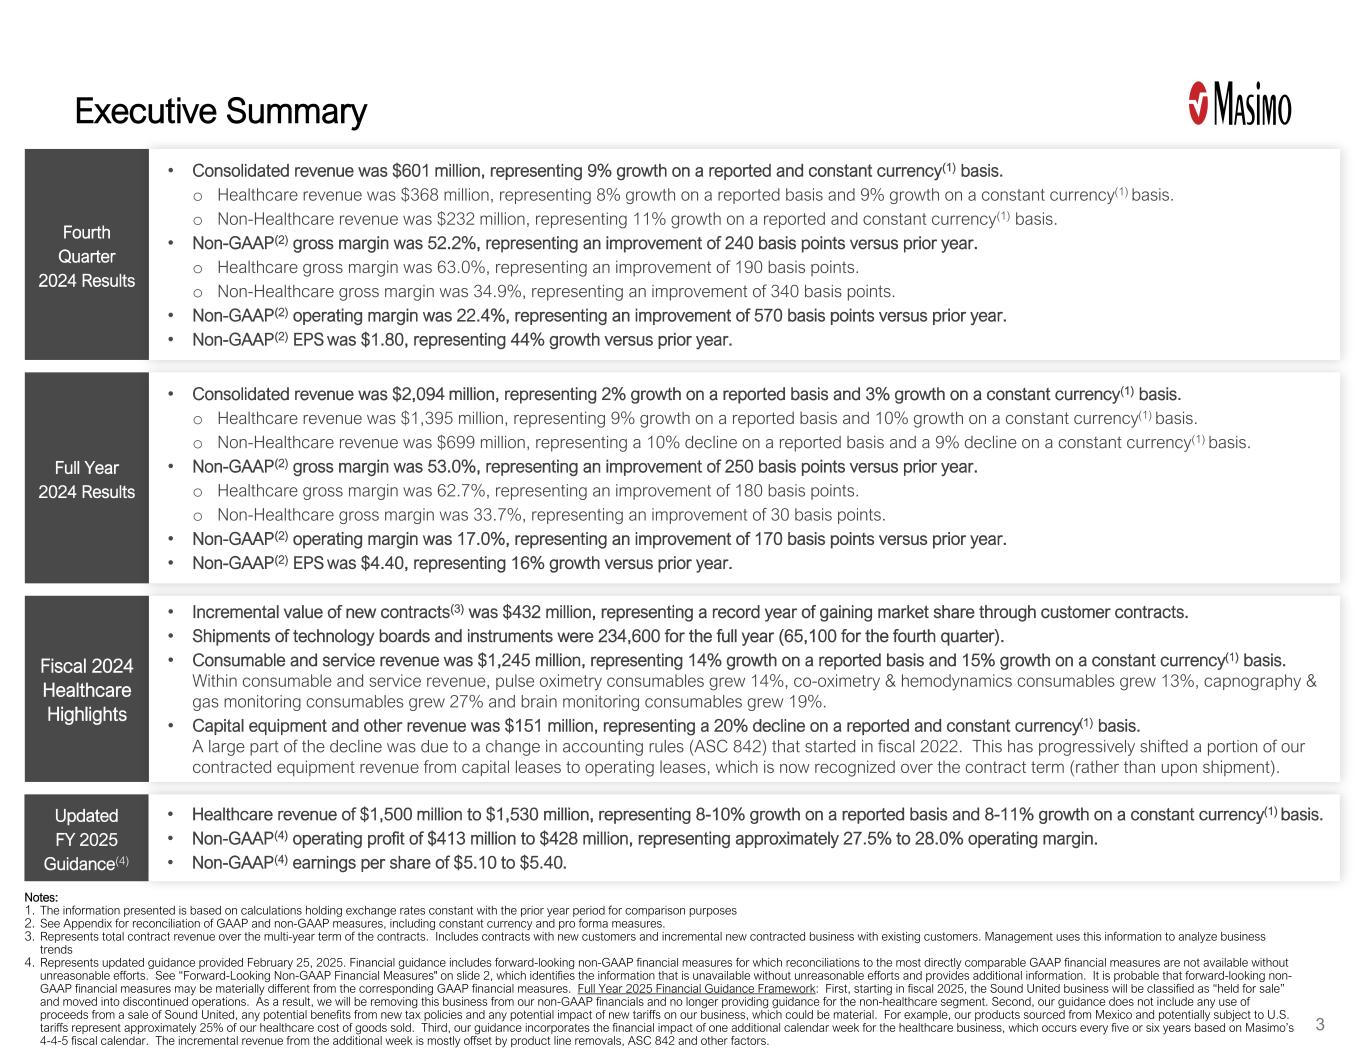
146 26 31 73 74 76 246 208 209 165 209 164 197 36 42 148 149 152 Executive Summary Fourth Quarter 2024 Results • Consolidated revenue was $601 million, representing 9% growth on a reported and constant currency(1) basis. o Healthcare revenue was $368 million, representing 8% growth on a reported basis and 9% growth on a constant currency(1) basis. o Non-Healthcare revenue was $232 million, representing 11% growth on a reported and constant currency(1) basis. • Non-GAAP(2) gross margin was 52.2%, representing an improvement of 240 basis points versus prior year. o Healthcare gross margin was 63.0%, representing an improvement of 190 basis points. o Non-Healthcare gross margin was 34.9%, representing an improvement of 340 basis points. • Non-GAAP(2) operating margin was 22.4%, representing an improvement of 570 basis points versus prior year. • Non-GAAP(2) EPS was $1.80, representing 44% growth versus prior year. Full Year 2024 Results • Consolidated revenue was $2,094 million, representing 2% growth on a reported basis and 3% growth on a constant currency(1) basis. o Healthcare revenue was $1,395 million, representing 9% growth on a reported basis and 10% growth on a constant currency(1) basis. o Non-Healthcare revenue was $699 million, representing a 10% decline on a reported basis and a 9% decline on a constant currency(1) basis. • Non-GAAP(2) gross margin was 53.0%, representing an improvement of 250 basis points versus prior year. o Healthcare gross margin was 62.7%, representing an improvement of 180 basis points. o Non-Healthcare gross margin was 33.7%, representing an improvement of 30 basis points. • Non-GAAP(2) operating margin was 17.0%, representing an improvement of 170 basis points versus prior year. • Non-GAAP(2) EPS was $4.40, representing 16% growth versus prior year. Updated FY 2025 Guidance(4) • Healthcare revenue of $1,500 million to $1,530 million, representing 8-10% growth on a reported basis and 8-11% growth on a constant currency(1) basis. • Non-GAAP(4) operating profit of $413 million to $428 million, representing approximately 27.5% to 28.0% operating margin. • Non-GAAP(4) earnings per share of $5.10 to $5.40. Notes: 1. The information presented is based on calculations holding exchange rates constant with the prior year period for comparison purposes 2. See Appendix for reconciliation of GAAP and non-GAAP measures, including constant currency and pro forma measures. 3. Represents total contract revenue over the multi-year term of the contracts. Includes contracts with new customers and incremental new contracted business with existing customers. Management uses this information to analyze business trends 4. Represents updated guidance provided February 25, 2025. Financial guidance includes forward-looking non-GAAP financial measures for which reconciliations to the most directly comparable GAAP financial measures are not available without unreasonable efforts. See “Forward-Looking Non-GAAP Financial Measures" on slide 2, which identifies the information that is unavailable without unreasonable efforts and provides additional information. It is probable that forward-looking non- GAAP financial measures may be materially different from the corresponding GAAP financial measures. Full Year 2025 Financial Guidance Framework: First, starting in fiscal 2025, the Sound United business will be classified as “held for sale” and moved into discontinued operations. As a result, we will be removing this business from our non-GAAP financials and no longer providing guidance for the non-healthcare segment. Second, our guidance does not include any use of proceeds from a sale of Sound United, any potential benefits from new tax policies and any potential impact of new tariffs on our business, which could be material. For example, our products sourced from Mexico and potentially subject to U.S. tariffs represent approximately 25% of our healthcare cost of goods sold. Third, our guidance incorporates the financial impact of one additional calendar week for the healthcare business, which occurs every five or six years based on Masimo’s 4-4-5 fiscal calendar. The incremental revenue from the additional week is mostly offset by product line removals, ASC 842 and other factors. Fiscal 2024 Healthcare Highlights • Incremental value of new contracts(3) was $432 million, representing a record year of gaining market share through customer contracts. • Shipments of technology boards and instruments were 234,600 for the full year (65,100 for the fourth quarter). • Consumable and service revenue was $1,245 million, representing 14% growth on a reported basis and 15% growth on a constant currency(1) basis. Within consumable and service revenue, pulse oximetry consumables grew 14%, co-oximetry & hemodynamics consumables grew 13%, capnography & gas monitoring consumables grew 27% and brain monitoring consumables grew 19%. • Capital equipment and other revenue was $151 million, representing a 20% decline on a reported and constant currency(1) basis. A large part of the decline was due to a change in accounting rules (ASC 842) that started in fiscal 2022. This has progressively shifted a portion of our contracted equipment revenue from capital leases to operating leases, which is now recognized over the contract term (rather than upon shipment). 3
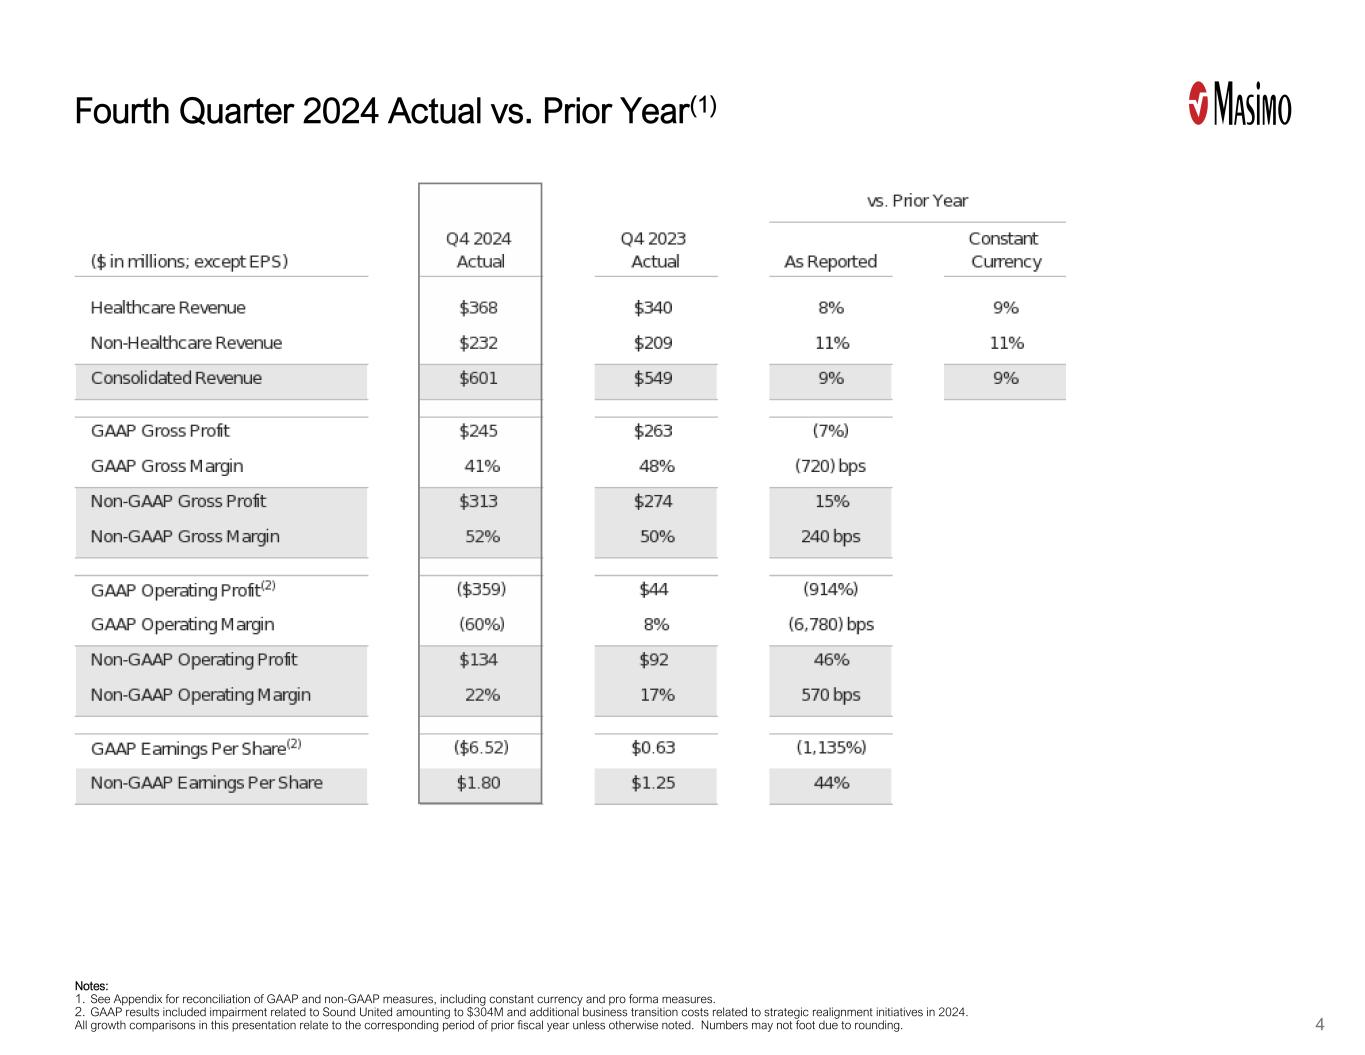
146 26 31 73 74 76 246 208 209 165 209 164 197 36 42 148 149 152 Fourth Quarter 2024 Actual vs. Prior Year(1) Notes: 1. See Appendix for reconciliation of GAAP and non-GAAP measures, including constant currency and pro forma measures. 2. GAAP results included impairment related to Sound United amounting to $304M and additional business transition costs related to strategic realignment initiatives in 2024. All growth comparisons in this presentation relate to the corresponding period of prior fiscal year unless otherwise noted. Numbers may not foot due to rounding. 4
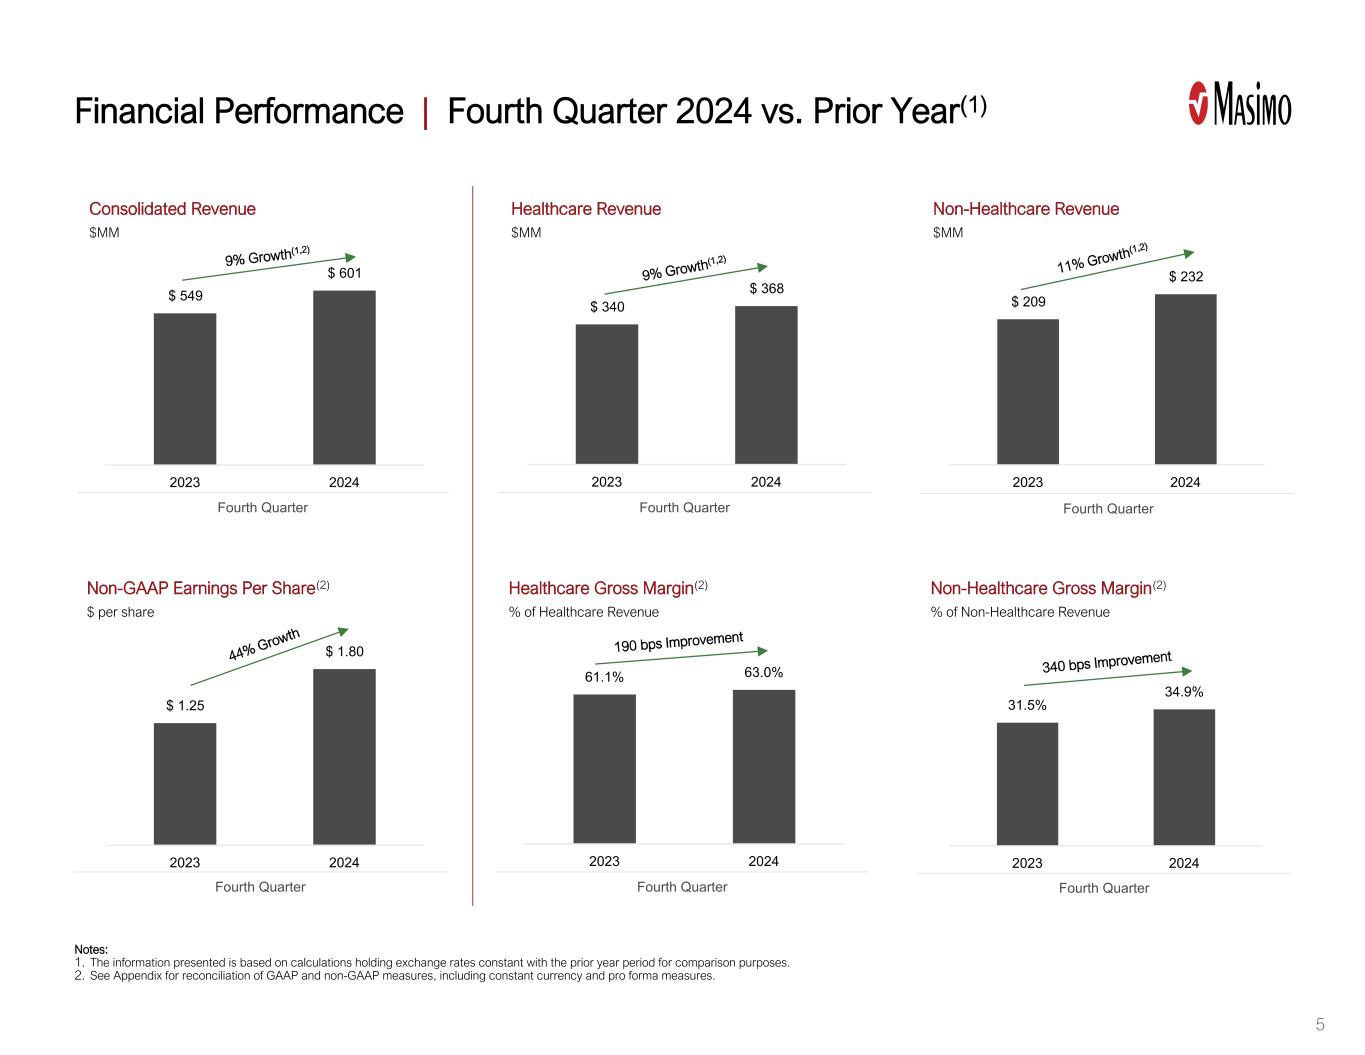
146 26 31 73 74 76 246 208 209 165 209 164 197 36 42 148 149 152 2023 2024 31.5% 34.9% Financial Performance | Fourth Quarter 2024 vs. Prior Year(1) 2023 2024 61.1% 63.0% Fourth Quarter Healthcare Gross Margin(2) % of Healthcare Revenue Fourth Quarter Non-Healthcare Gross Margin(2) % of Non-Healthcare Revenue Fourth Quarter Non-GAAP Earnings Per Share(2) $ per share 190 bps Improvement 340 bps Improvement 2023 2024 $ 340 $ 368 Fourth Quarter Healthcare Revenue $MM 2023 2024 $ 209 $ 232 Fourth Quarter Non-Healthcare Revenue $MM Fourth Quarter Consolidated Revenue $MM 2023 2024 $ 549 $ 601 9% Growth(1,2) 2023 2024 $ 1.25 $ 1.8044% Growth Notes: 1. The information presented is based on calculations holding exchange rates constant with the prior year period for comparison purposes. 2. See Appendix for reconciliation of GAAP and non-GAAP measures, including constant currency and pro forma measures. 9% Growth(1,2) 11% Growth(1,2) 5
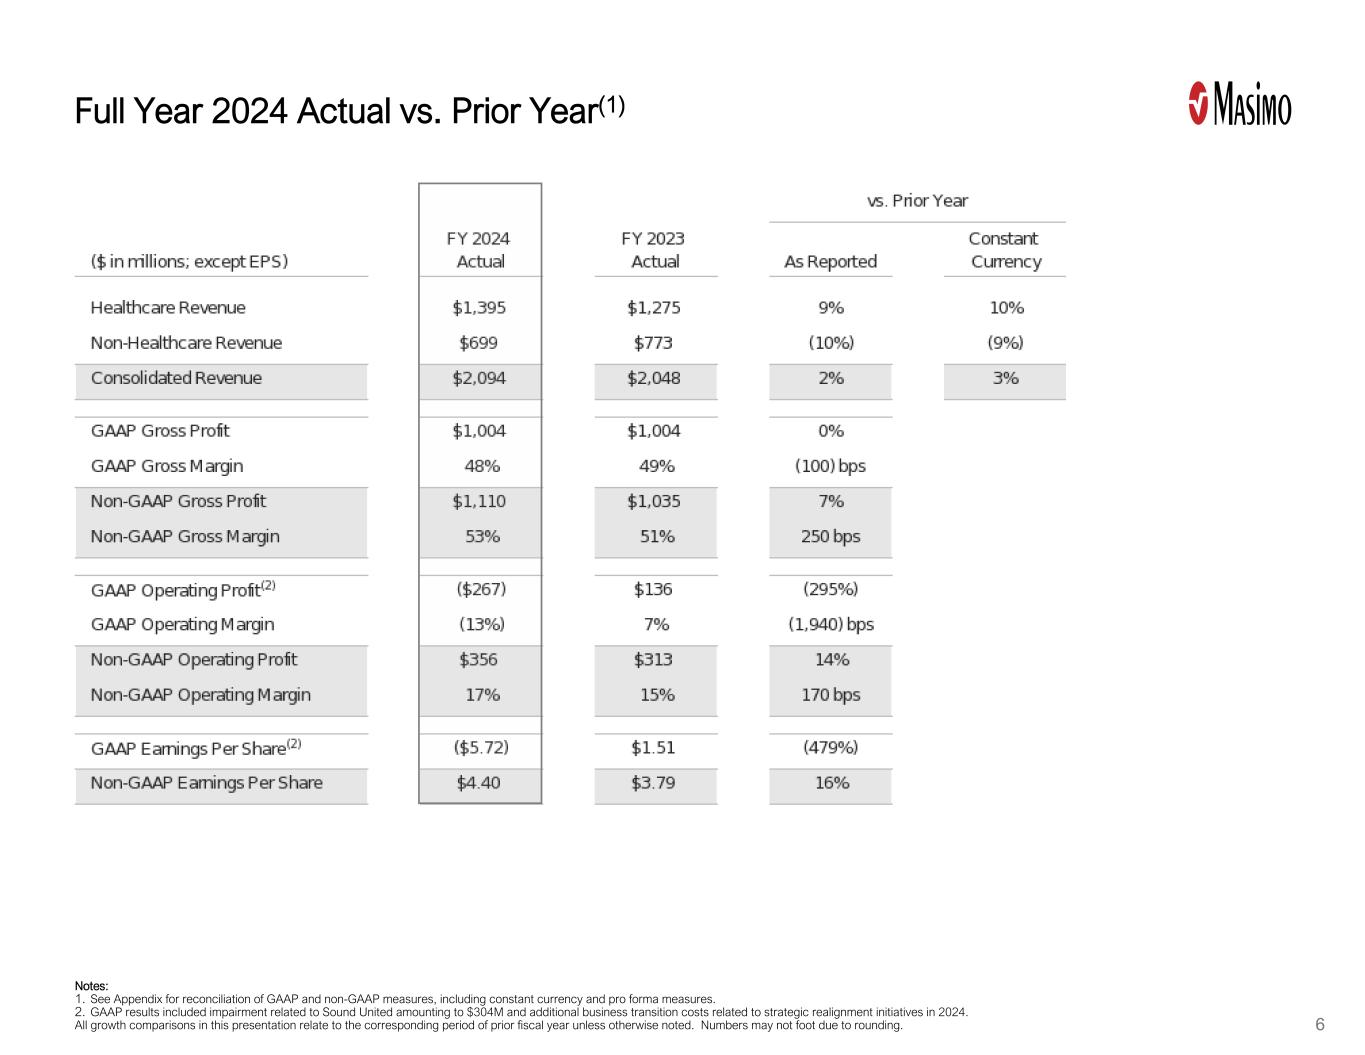
146 26 31 73 74 76 246 208 209 165 209 164 197 36 42 148 149 152 Full Year 2024 Actual vs. Prior Year(1) 6 Notes: 1. See Appendix for reconciliation of GAAP and non-GAAP measures, including constant currency and pro forma measures. 2. GAAP results included impairment related to Sound United amounting to $304M and additional business transition costs related to strategic realignment initiatives in 2024. All growth comparisons in this presentation relate to the corresponding period of prior fiscal year unless otherwise noted. Numbers may not foot due to rounding.
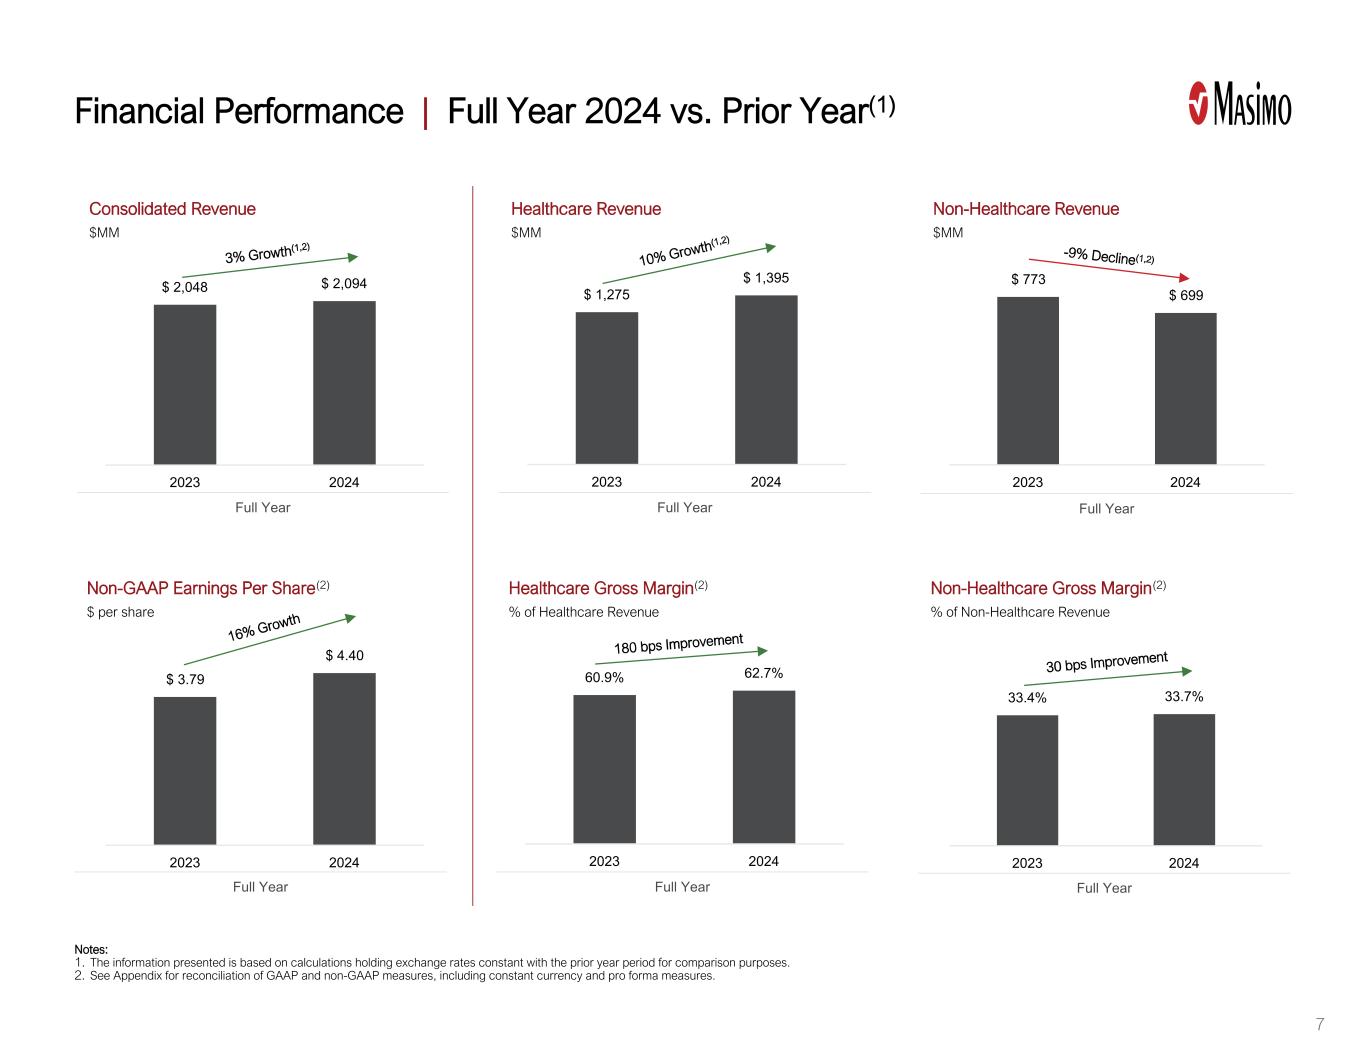
146 26 31 73 74 76 246 208 209 165 209 164 197 36 42 148 149 152 2023 2024 33.4% 33.7% Financial Performance | Full Year 2024 vs. Prior Year(1) 2023 2024 60.9% 62.7% Full Year Healthcare Gross Margin(2) % of Healthcare Revenue Full Year Non-Healthcare Gross Margin(2) % of Non-Healthcare Revenue Full Year Non-GAAP Earnings Per Share(2) $ per share 180 bps Improvement 30 bps Improvement 2023 2024 $ 1,275 $ 1,395 Full Year Healthcare Revenue $MM 2023 2024 $ 773 $ 699 Full Year Non-Healthcare Revenue $MM Full Year Consolidated Revenue $MM 10% Growth(1,2) -9% Decline(1,2) 2023 2024 $ 2,048 $ 2,094 3% Growth(1,2) 2023 2024 $ 3.79 $ 4.40 16% Growth Notes: 1. The information presented is based on calculations holding exchange rates constant with the prior year period for comparison purposes. 2. See Appendix for reconciliation of GAAP and non-GAAP measures, including constant currency and pro forma measures. 7
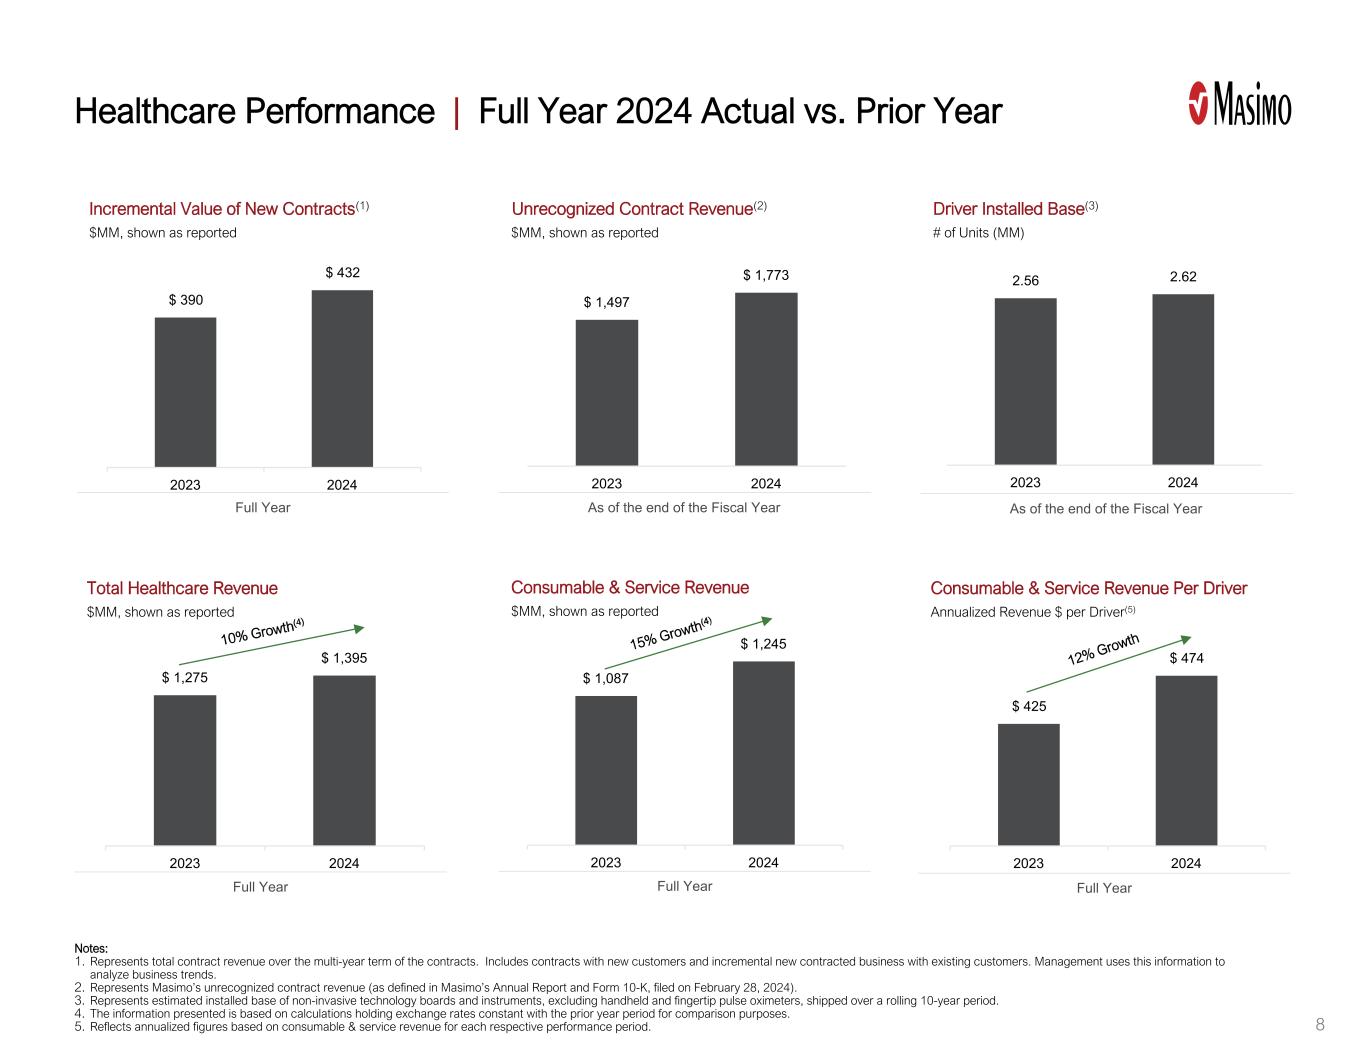
146 26 31 73 74 76 246 208 209 165 209 164 197 36 42 148 149 152 2023 2024 $ 1,497 $ 1,773 Healthcare Performance | Full Year 2024 Actual vs. Prior Year Full Year Total Healthcare Revenue $MM, shown as reported As of the end of the Fiscal Year Unrecognized Contract Revenue(2) $MM, shown as reported As of the end of the Fiscal Year Driver Installed Base(3) # of Units (MM) Full Year Incremental Value of New Contracts(1) $MM, shown as reported Full Year Consumable & Service Revenue $MM, shown as reported Full Year Notes: 1. Represents total contract revenue over the multi-year term of the contracts. Includes contracts with new customers and incremental new contracted business with existing customers. Management uses this information to analyze business trends. 2. Represents Masimo’s unrecognized contract revenue (as defined in Masimo’s Annual Report and Form 10-K, filed on February 28, 2024). 3. Represents estimated installed base of non-invasive technology boards and instruments, excluding handheld and fingertip pulse oximeters, shipped over a rolling 10-year period. 4. The information presented is based on calculations holding exchange rates constant with the prior year period for comparison purposes. 5. Reflects annualized figures based on consumable & service revenue for each respective performance period. 2023 2024 $ 1,275 $ 1,395 10% Growth(4) 2023 2024 $ 1,087 $ 1,24515% Growth(4) Consumable & Service Revenue Per Driver Annualized Revenue $ per Driver(5) 2023 2024 $ 390 $ 432 2023 2024 $ 425 $ 474 2023 2024 2.56 2.62 12% Growth 8
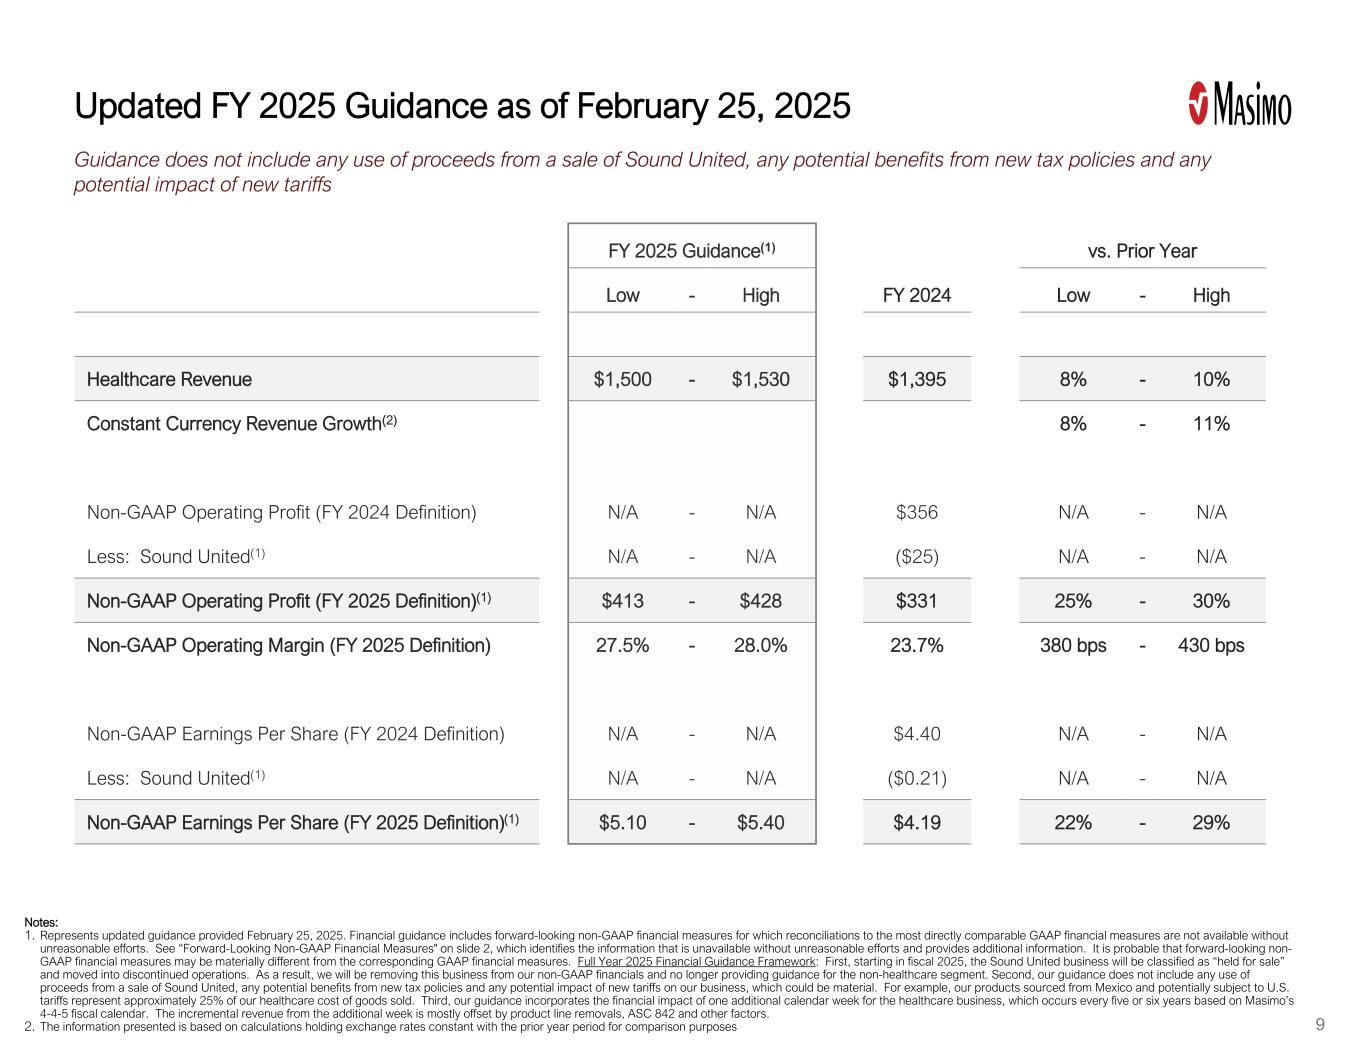
146 26 31 73 74 76 246 208 209 165 209 164 197 36 42 148 149 152 Notes: 1. Represents updated guidance provided February 25, 2025. Financial guidance includes forward-looking non-GAAP financial measures for which reconciliations to the most directly comparable GAAP financial measures are not available without unreasonable efforts. See “Forward-Looking Non-GAAP Financial Measures" on slide 2, which identifies the information that is unavailable without unreasonable efforts and provides additional information. It is probable that forward-looking non- GAAP financial measures may be materially different from the corresponding GAAP financial measures. Full Year 2025 Financial Guidance Framework: First, starting in fiscal 2025, the Sound United business will be classified as “held for sale” and moved into discontinued operations. As a result, we will be removing this business from our non-GAAP financials and no longer providing guidance for the non-healthcare segment. Second, our guidance does not include any use of proceeds from a sale of Sound United, any potential benefits from new tax policies and any potential impact of new tariffs on our business, which could be material. For example, our products sourced from Mexico and potentially subject to U.S. tariffs represent approximately 25% of our healthcare cost of goods sold. Third, our guidance incorporates the financial impact of one additional calendar week for the healthcare business, which occurs every five or six years based on Masimo’s 4-4-5 fiscal calendar. The incremental revenue from the additional week is mostly offset by product line removals, ASC 842 and other factors. 2. The information presented is based on calculations holding exchange rates constant with the prior year period for comparison purposes Guidance does not include any use of proceeds from a sale of Sound United, any potential benefits from new tax policies and any potential impact of new tariffs Updated FY 2025 Guidance as of February 25, 2025 9 FY 2025 Guidance(1) FY 2024 vs. Prior Year Low - High Low - High Healthcare Revenue $1,500 - $1,530 $1,395 8% - 10% Constant Currency Revenue Growth(2) 8% - 11% Non-GAAP Operating Profit (FY 2024 Definition) N/A - N/A $356 N/A - N/A Less: Sound United(1) N/A - N/A ($25) N/A - N/A Non-GAAP Operating Profit (FY 2025 Definition)(1) $413 - $428 $331 25% - 30% Non-GAAP Operating Margin (FY 2025 Definition) 27.5% - 28.0% 23.7% 380 bps - 430 bps Non-GAAP Earnings Per Share (FY 2024 Definition) N/A - N/A $4.40 N/A - N/A Less: Sound United(1) N/A - N/A ($0.21) N/A - N/A Non-GAAP Earnings Per Share (FY 2025 Definition)(1) $5.10 - $5.40 $4.19 22% - 29%
Appendix GAAP to Non-GAAP Reconciliations 10
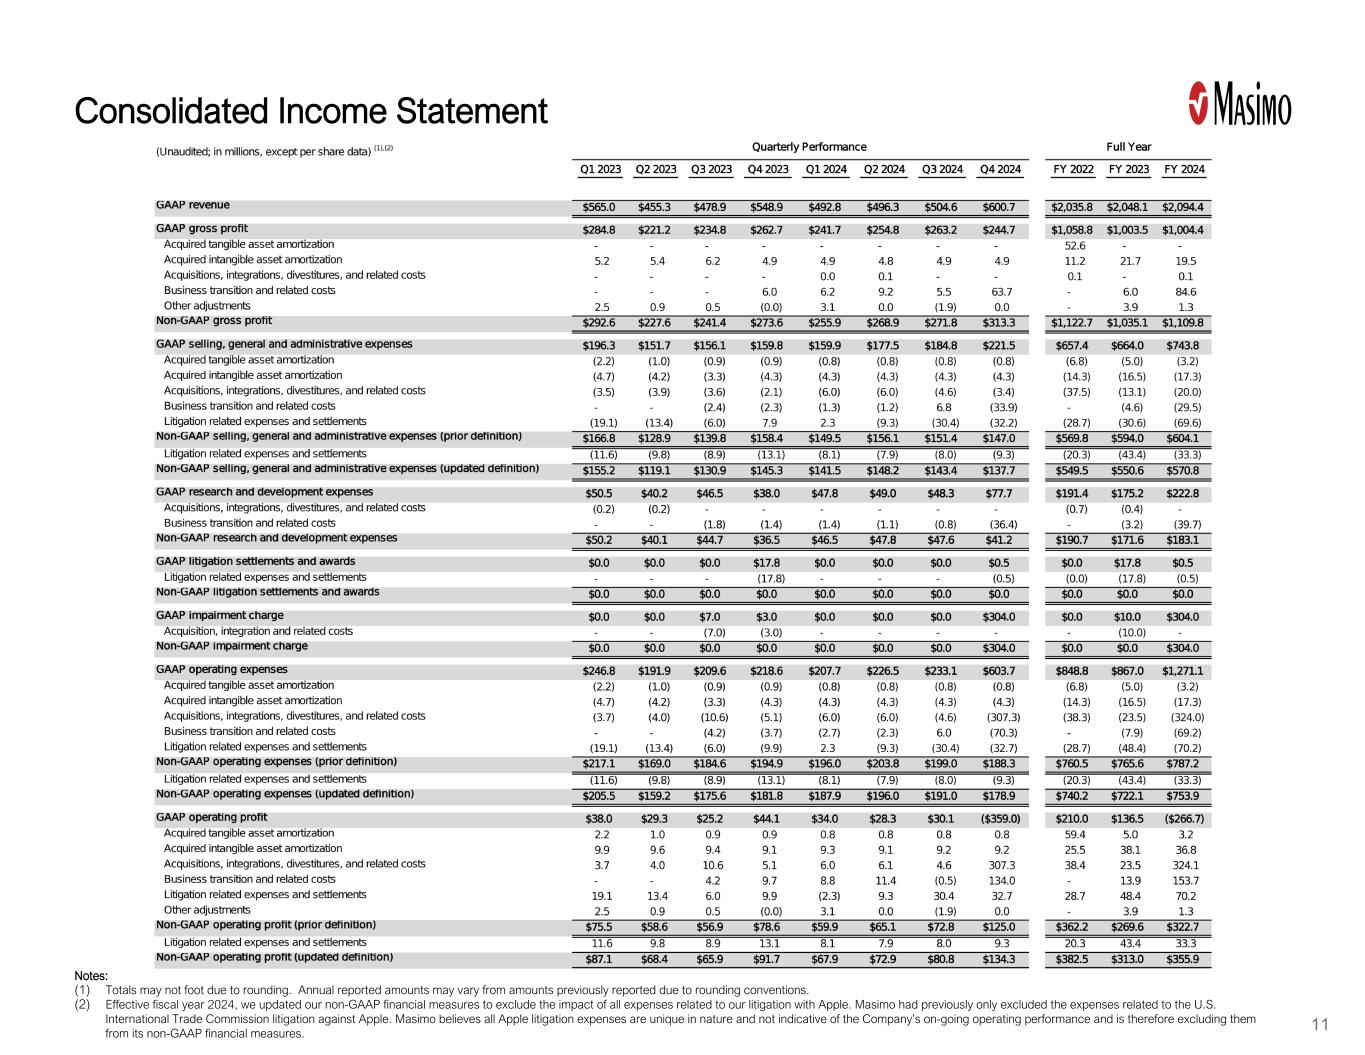
146 26 31 73 74 76 246 208 209 165 209 164 197 36 42 148 149 152 Consolidated Income Statement Notes: (1) Totals may not foot due to rounding. Annual reported amounts may vary from amounts previously reported due to rounding conventions. (2) Effective fiscal year 2024, we updated our non-GAAP financial measures to exclude the impact of all expenses related to our litigation with Apple. Masimo had previously only excluded the expenses related to the U.S. International Trade Commission litigation against Apple. Masimo believes all Apple litigation expenses are unique in nature and not indicative of the Company’s on-going operating performance and is therefore excluding them from its non-GAAP financial measures. 11
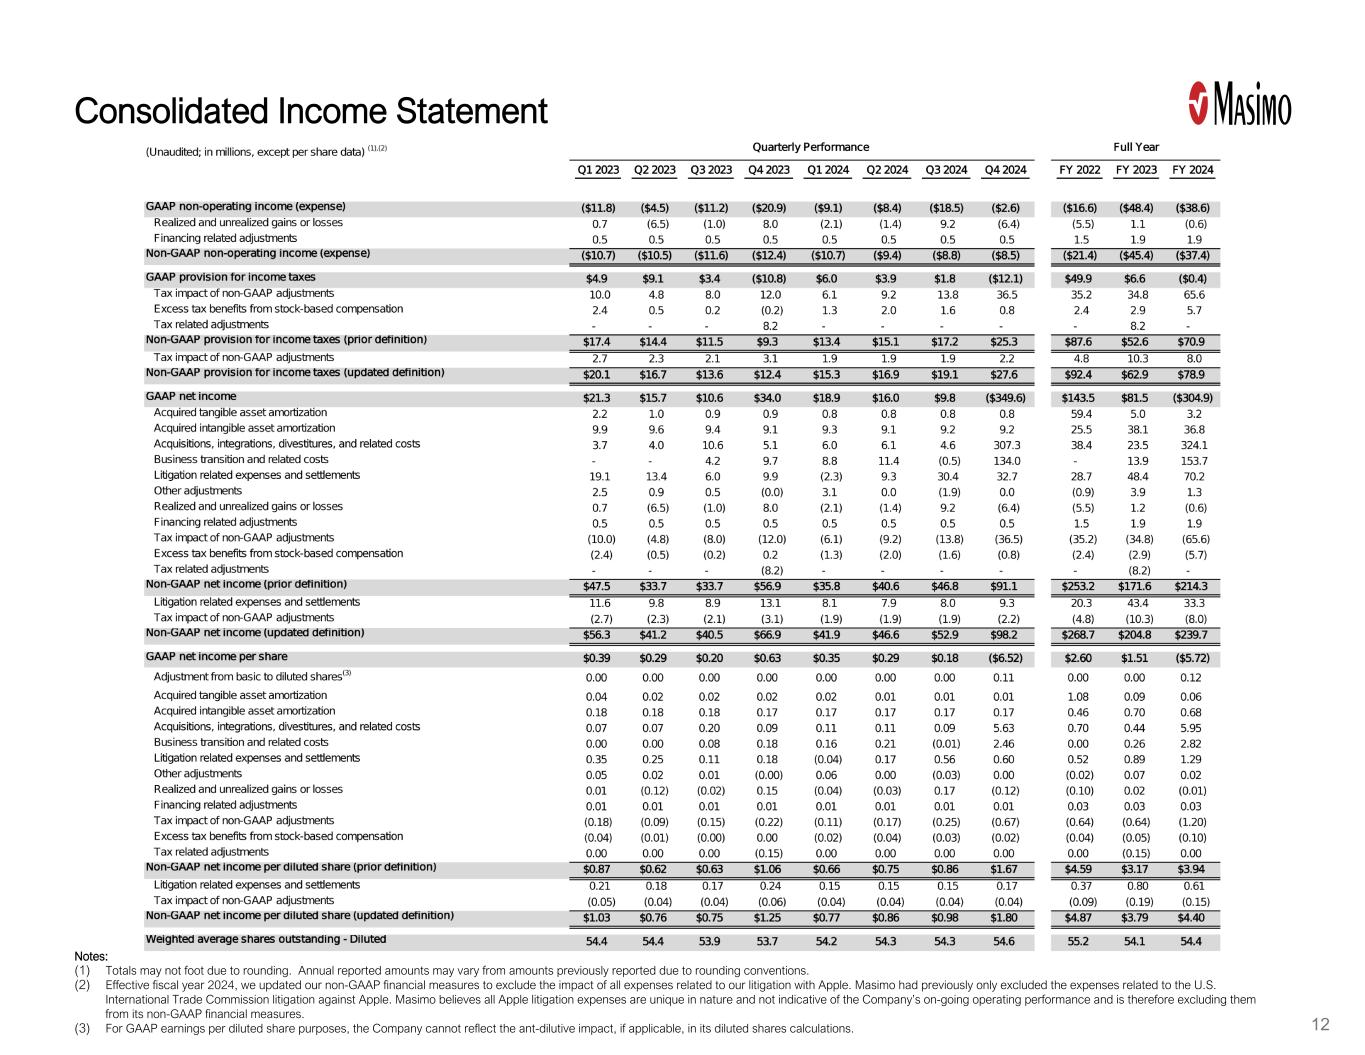
146 26 31 73 74 76 246 208 209 165 209 164 197 36 42 148 149 152 Consolidated Income Statement Notes: (1) Totals may not foot due to rounding. Annual reported amounts may vary from amounts previously reported due to rounding conventions. (2) Effective fiscal year 2024, we updated our non-GAAP financial measures to exclude the impact of all expenses related to our litigation with Apple. Masimo had previously only excluded the expenses related to the U.S. International Trade Commission litigation against Apple. Masimo believes all Apple litigation expenses are unique in nature and not indicative of the Company’s on-going operating performance and is therefore excluding them from its non-GAAP financial measures. (3) For GAAP earnings per diluted share purposes, the Company cannot reflect the ant-dilutive impact, if applicable, in its diluted shares calculations. 12
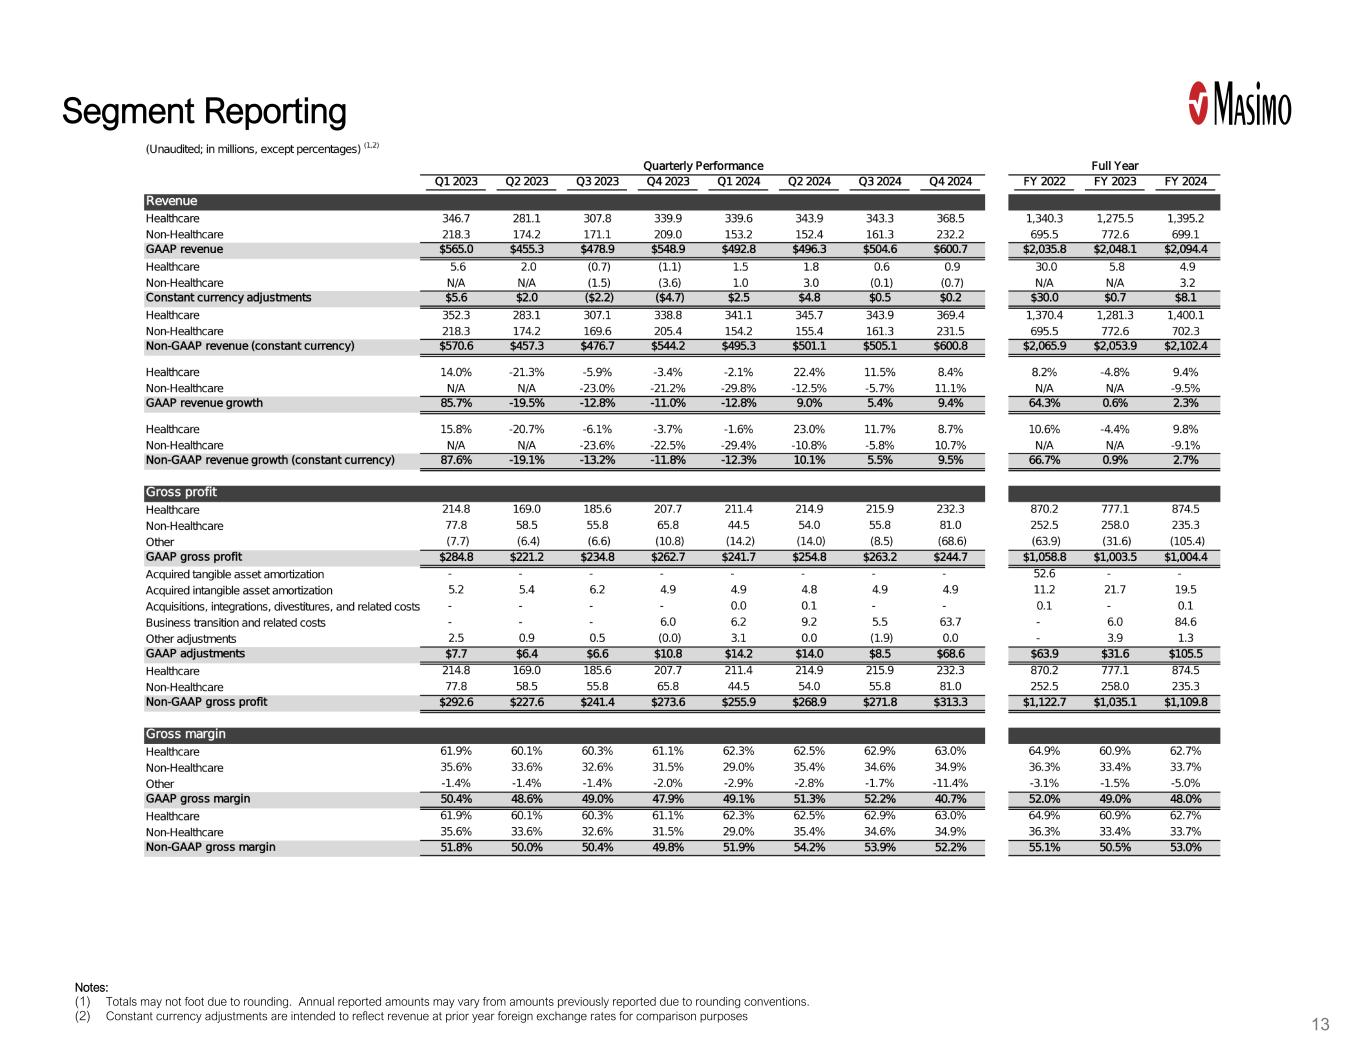
146 26 31 73 74 76 246 208 209 165 209 164 197 36 42 148 149 152 Segment Reporting Notes: (1) Totals may not foot due to rounding. Annual reported amounts may vary from amounts previously reported due to rounding conventions. (2) Constant currency adjustments are intended to reflect revenue at prior year foreign exchange rates for comparison purposes 13
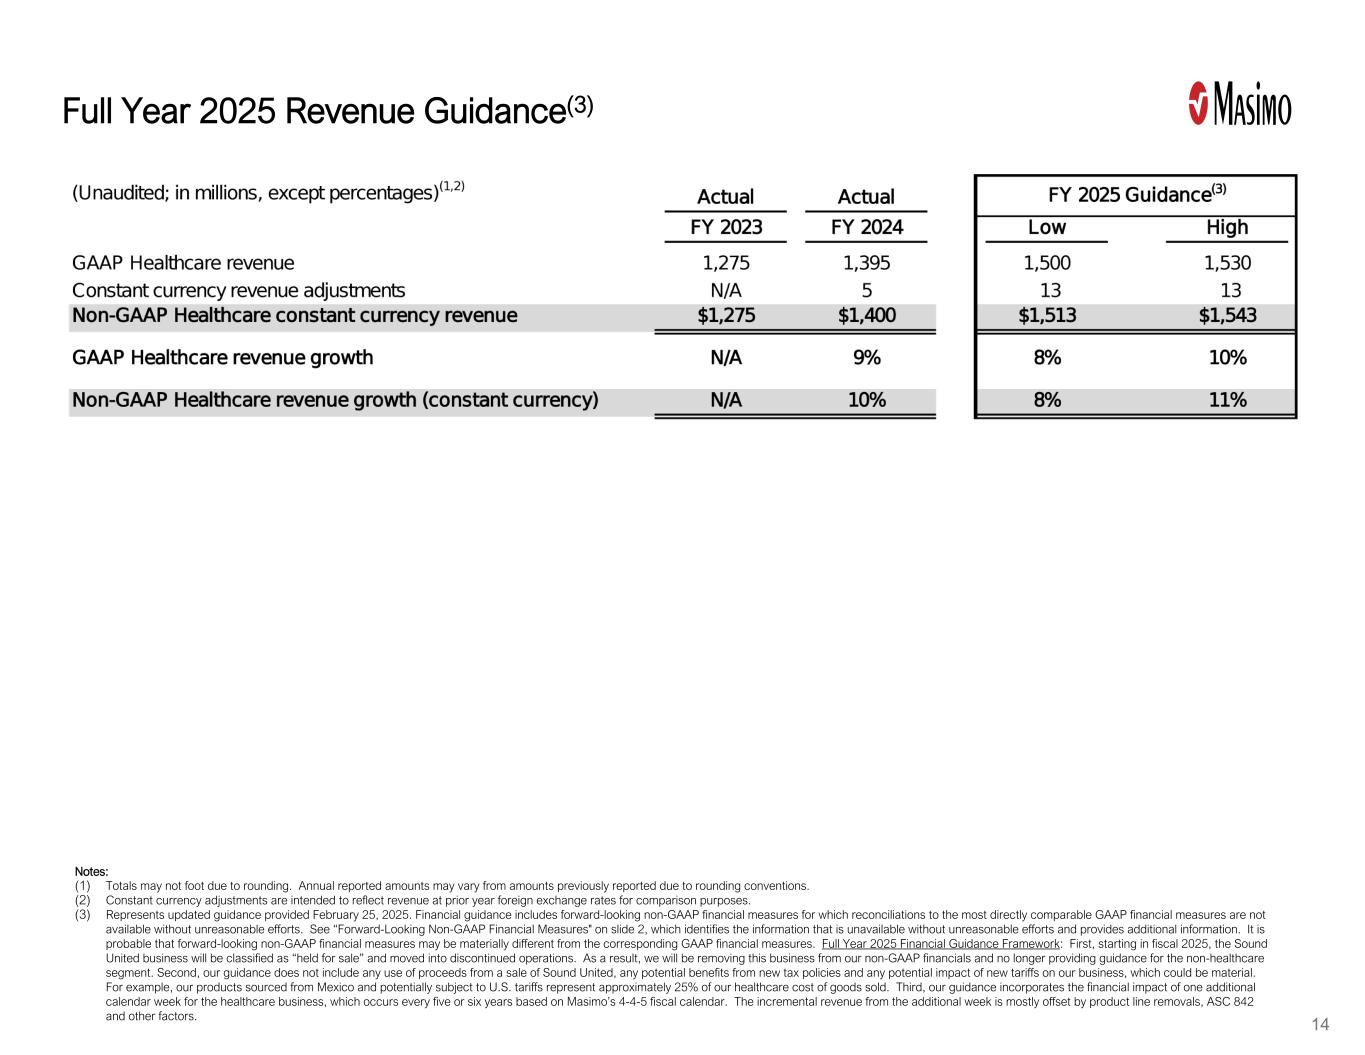
146 26 31 73 74 76 246 208 209 165 209 164 197 36 42 148 149 152 Full Year 2025 Revenue Guidance(3) Notes: (1) Totals may not foot due to rounding. Annual reported amounts may vary from amounts previously reported due to rounding conventions. (2) Constant currency adjustments are intended to reflect revenue at prior year foreign exchange rates for comparison purposes. (3) Represents updated guidance provided February 25, 2025. Financial guidance includes forward-looking non-GAAP financial measures for which reconciliations to the most directly comparable GAAP financial measures are not available without unreasonable efforts. See “Forward-Looking Non-GAAP Financial Measures" on slide 2, which identifies the information that is unavailable without unreasonable efforts and provides additional information. It is probable that forward-looking non-GAAP financial measures may be materially different from the corresponding GAAP financial measures. Full Year 2025 Financial Guidance Framework: First, starting in fiscal 2025, the Sound United business will be classified as “held for sale” and moved into discontinued operations. As a result, we will be removing this business from our non-GAAP financials and no longer providing guidance for the non-healthcare segment. Second, our guidance does not include any use of proceeds from a sale of Sound United, any potential benefits from new tax policies and any potential impact of new tariffs on our business, which could be material. For example, our products sourced from Mexico and potentially subject to U.S. tariffs represent approximately 25% of our healthcare cost of goods sold. Third, our guidance incorporates the financial impact of one additional calendar week for the healthcare business, which occurs every five or six years based on Masimo’s 4-4-5 fiscal calendar. The incremental revenue from the additional week is mostly offset by product line removals, ASC 842 and other factors. 14


