
Public ASML reports € 10.9 billion net sales and € 2.6 billion net income in 2018 Sales growth expected in 2019 despite challenging environment Proposes to raise dividend by 50% ASML 2018 Fourth-Quarter and Full Year Results Veldhoven, the Netherlands January 23, 2019
Public Slide 2 January 23, 2019 Agenda • Investor key messages • Business highlights • Outlook • Product highlights • Financial statements
Public Slide 3 January 23, 2019 Investor key messages

Public Investor key messages Slide 4 January 23, 2019 • Healthy semiconductor end market growth driven by major innovation in semiconductor enabled computing provides long term growth opportunity • Shrink is a key industry driver supporting innovation and providing long term industry growth • Holistic Lithography enables affordable shrink and therefore delivers compelling value for our customers • DUV, EUV and Application products are highly differentiated solutions that provide unique value drivers for our customers and ASML • EUV will enable continuation of Moore’s Law and will drive long term value for ASML well into the next decade • ASML models an annual revenue opportunity of € 13 billion in 2020 and an annual revenue between € 15 – 24 billion through 2025 • We expect to continue to return significant amounts of cash to our shareholders through a combination of share buybacks and growing dividends

Public Slide 5 January 23, 2019 Business highlights
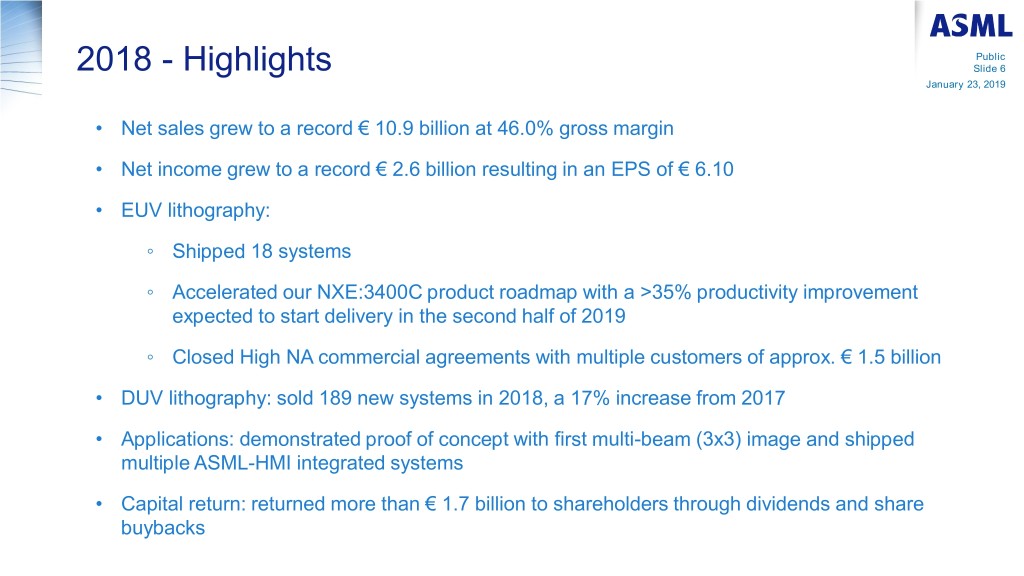
Public 2018 - Highlights Slide 6 January 23, 2019 • Net sales grew to a record € 10.9 billion at 46.0% gross margin • Net income grew to a record € 2.6 billion resulting in an EPS of € 6.10 • EUV lithography: ◦ Shipped 18 systems ◦ Accelerated our NXE:3400C product roadmap with a >35% productivity improvement expected to start delivery in the second half of 2019 ◦ Closed High NA commercial agreements with multiple customers of approx. € 1.5 billion • DUV lithography: sold 189 new systems in 2018, a 17% increase from 2017 • Applications: demonstrated proof of concept with first multi-beam (3x3) image and shipped multiple ASML-HMI integrated systems • Capital return: returned more than € 1.7 billion to shareholders through dividends and share buybacks
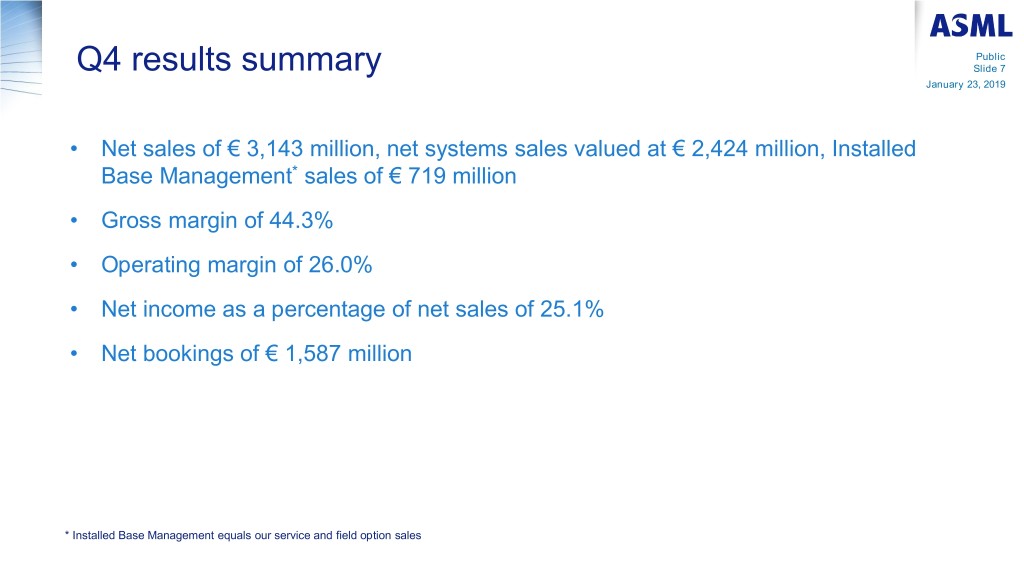
Public Q4 results summary Slide 7 January 23, 2019 • Net sales of € 3,143 million, net systems sales valued at € 2,424 million, Installed Base Management* sales of € 719 million • Gross margin of 44.3% • Operating margin of 26.0% • Net income as a percentage of net sales of 25.1% • Net bookings of € 1,587 million * Installed Base Management equals our service and field option sales

Public Net system sales breakdown in value (Quarterly) Slide 8 January 23, 2019 Q4’18 total value € 2,424 million Q3’18 total value € 2,081 million
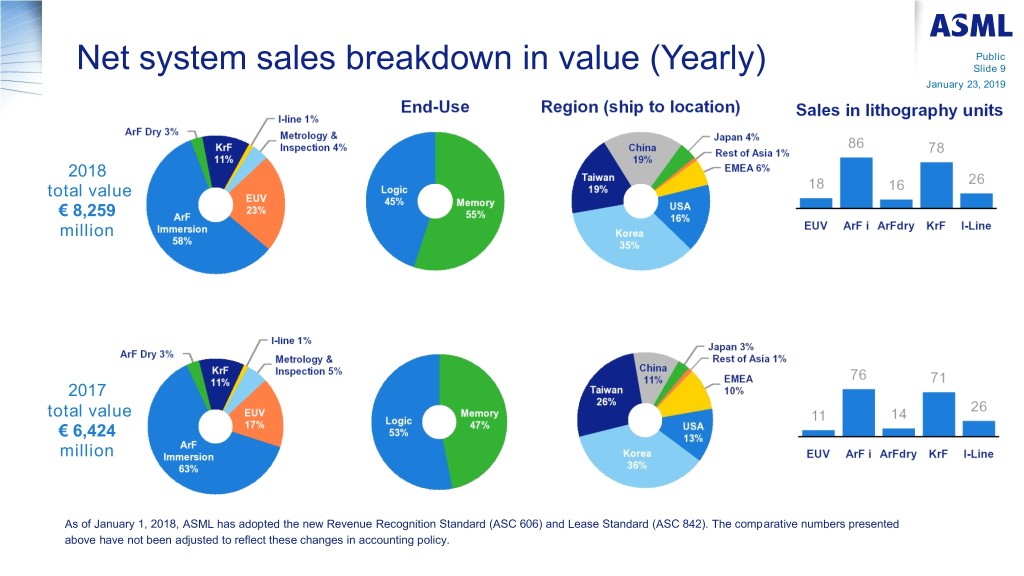
Public Net system sales breakdown in value (Yearly) Slide 9 January 23, 2019 2018 total value € 8,259 million 2017 total value € 6,424 million As of January 1, 2018, ASML has adopted the new Revenue Recognition Standard (ASC 606) and Lease Standard (ASC 842). The comparative numbers presented above have not been adjusted to reflect these changes in accounting policy.
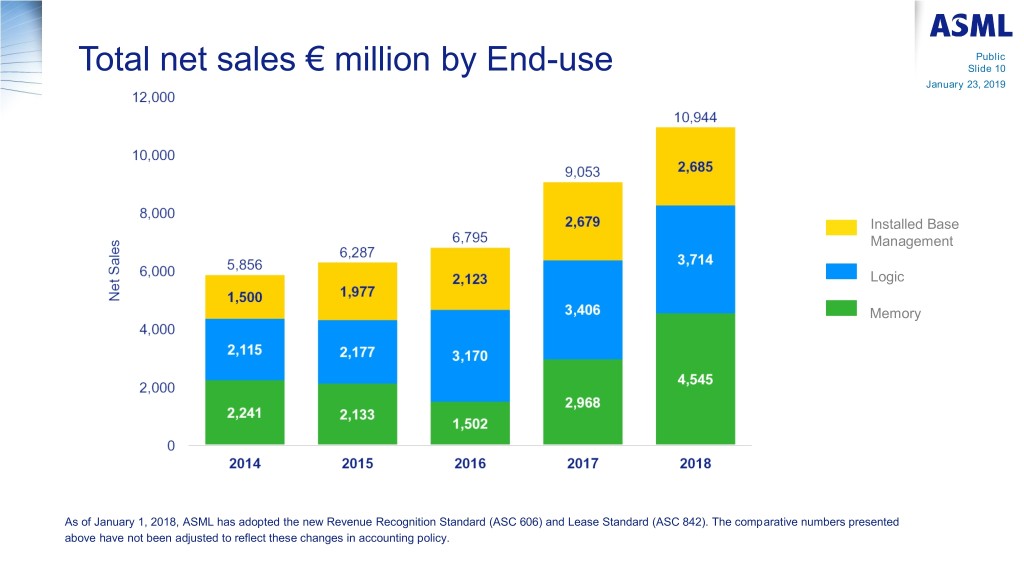
Public Total net sales € million by End-use Slide 10 January 23, 2019 Installed Base Management Logic Memory As of January 1, 2018, ASML has adopted the new Revenue Recognition Standard (ASC 606) and Lease Standard (ASC 842). The comparative numbers presented above have not been adjusted to reflect these changes in accounting policy.
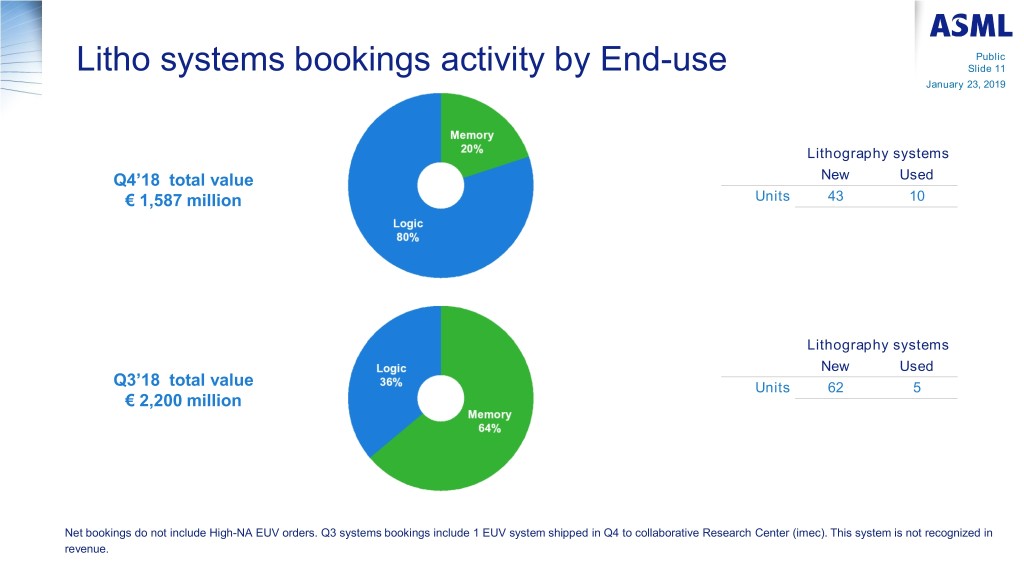
Public Litho systems bookings activity by End-use Slide 11 January 23, 2019 Lithography systems Q4’18 total value New Used € 1,587 million Units 43 10 Lithography systems New Used Q3’18 total value Units 62 5 € 2,200 million Net bookings do not include High-NA EUV orders. Q3 systems bookings include 1 EUV system shipped in Q4 to collaborative Research Center (imec). This system is not recognized in revenue.

Public Capital return to shareholders Slide 12 January 23, 2019 • Paid € 597 million dividend and purchased € 1.15 billion worth of shares in 2018 • Propose to declare a 50 percent dividend increase to € 2.10 per ordinary share at the 2019 Annual General Meeting of Shareholders • Around € 1.35 billion of the 2018/2019 share buyback program remaining Dividend Share buyback proposed 2009 The dividend for a year is paid in the subsequent year Capital return is cumulative share buyback + dividend

Public Slide 13 January 23, 2019 Outlook

Public Q1 Outlook Slide 14 January 23, 2019 • Q1 2019 net sales of around € 2.1 billion ◦ including EUV system revenue of around € 300 million ◦ around € 300 million negatively impacted due to fire at one of our suppliers • Gross margin around 40% • R&D costs of around € 480 million • SG&A costs of around € 130 million • Effective annualized tax rate around 14%

Public Slide 15 January 23, 2019 Product highlights
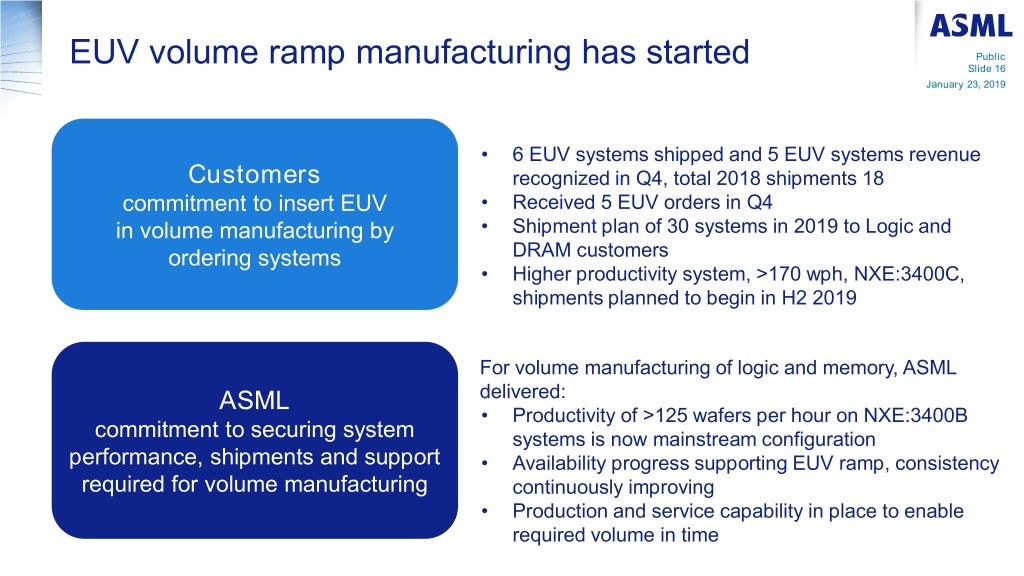
EUV volume ramp manufacturing has started Public Slide 16 January 23, 2019 • 6 EUV systems shipped and 5 EUV systems revenue Customers recognized in Q4, total 2018 shipments 18 commitment to insert EUV • Received 5 EUV orders in Q4 in volume manufacturing by • Shipment plan of 30 systems in 2019 to Logic and ordering systems DRAM customers • Higher productivity system, >170 wph, NXE:3400C, shipments planned to begin in H2 2019 For volume manufacturing of logic and memory, ASML ASML delivered: • Productivity of >125 wafers per hour on NXE:3400B commitment to securing system systems is now mainstream configuration performance, shipments and support • Availability progress supporting EUV ramp, consistency required for volume manufacturing continuously improving • Production and service capability in place to enable required volume in time

Public Slide 17 January 23, 2019 Financial statements

Public Consolidated statements of operations € million Slide 18 January 23, 2019 2014 2015 20161 20171 2018 Net sales 5,856 6,287 6,875 8,963 10,944 Gross profit 2,596 2,896 3,145 4,020 5,029 Gross margin % 44.3 46.1 45.7 44.9 46.0 Other income 2 81 83 94 96 — R&D costs (1,074) (1,068) (1,106) (1,260) (1,576) SG&A costs (321) (346) (375) (417) (488) Income from operations 1,282 1,565 1,758 2,440 2,965 Operating income as a % of net sales 21.9 24.9 25.6 27.2 27.1 Net income 1,197 1,387 1,558 2,067 2,592 Net income as a % of net sales 20.4 22.1 22.7 23.1 23.7 Earnings per share (basic) € 2.74 3.22 3.66 4.81 6.10 Earnings per share (diluted) € 2.72 3.21 3.64 4.79 6.08 Lithography systems sold (units) 3 136 169 154 197 224 Net booking value 4 4,902 4,639 5,396 9,358 8,181 1 As of January 1, 2018, ASML has adopted the new Revenue Recognition Standard (ASC 606) and Lease Standard (ASC 842). The comparative numbers have been adjusted to reflect these changes in accounting policy, except for our systems net booking values. The comparative numbers for our systems net booking values have not been adjusted. 2 Customer Co-Investment Program (CCIP). 3 Lithography systems do not include metrology and inspection systems. 4 Our systems net bookings include all system sales orders for which written authorizations have been accepted (for EUV starting with the NXE:3350B and excluding the High NA systems). Our 2018 systems net bookings include 1 EUV system shipped in Q4 to collaborative Research Center (imec). This system is not recognized in revenue. These numbers have been prepared in accordance with US GAAP. Numbers have been rounded for readers' convenience.

Public Consolidated statements of operations € million Slide 19 January 23, 2019 Q4 2017 1 Q1 2018 Q2 2018 Q3 2018 Q4 2018 Net sales 2,561 2,285 2,740 2,776 3,143 Gross profit 1,156 1,113 1,187 1,336 1,393 Gross margin % 45.2 48.7 43.3 48.1 44.3 Other income 2 24 — — — — R&D costs (317) (357) (380) (397) (442) SG&A costs (113) (114) (117) (122) (135) Income from operations 750 642 690 817 816 Operating income as a % of net sales 29.3 28.1 25.2 29.5 26.0 Net income 644 540 584 680 788 Net income as a % of net sales 25.1 23.6 21.3 24.5 25.1 Earnings per share (basic) € 1.50 1.26 1.37 1.60 1.87 Earnings per share (diluted) € 1.49 1.26 1.37 1.60 1.86 Lithography systems sold (units) 3 57 49 58 53 64 Net booking value 4 2,935 2,442 1,952 2,200 1,587 1 As of January 1, 2018, ASML has adopted the new Revenue Recognition Standard (ASC 606) and Lease Standard (ASC 842). The quarterly comparative numbers have not been adjusted to reflect these changes in accounting policy. 2 Customer Co-Investment Program (CCIP). 3 Lithography systems do not include metrology and inspection systems. 4 Our systems net bookings include all system sales orders for which written authorizations have been accepted (for EUV starting with the NXE:3350B and excluding the High NA systems). Our Q3 2018 systems net bookings include 1 EUV system shipped in Q4 to collaborative Research Center (imec). This system is not recognized in revenue. These numbers have been prepared in accordance with US GAAP. Numbers have been rounded for readers' convenience.
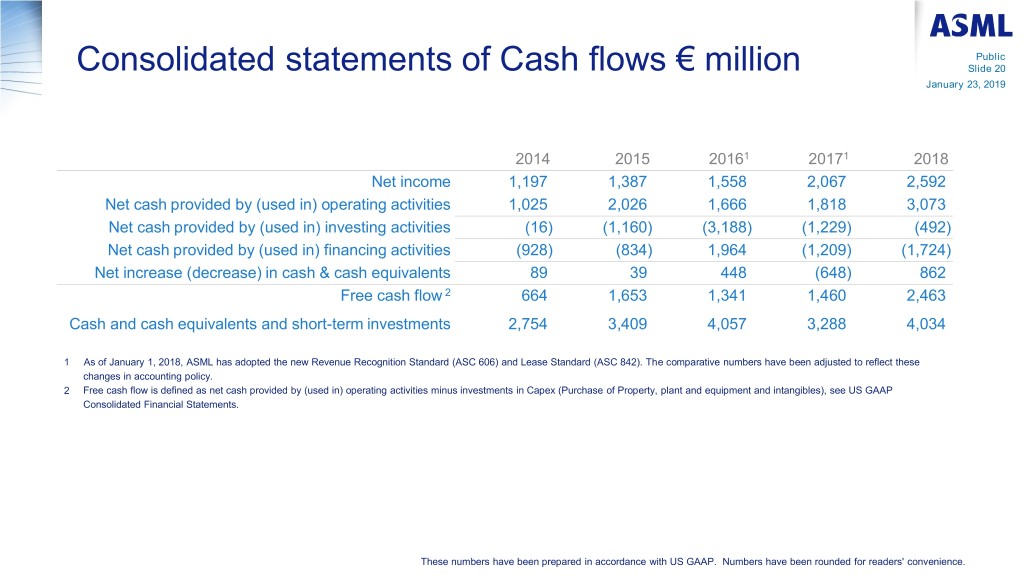
Public Consolidated statements of Cash flows € million Slide 20 January 23, 2019 2014 2015 20161 20171 2018 Net income 1,197 1,387 1,558 2,067 2,592 Net cash provided by (used in) operating activities 1,025 2,026 1,666 1,818 3,073 Net cash provided by (used in) investing activities (16) (1,160) (3,188) (1,229) (492) Net cash provided by (used in) financing activities (928) (834) 1,964 (1,209) (1,724) Net increase (decrease) in cash & cash equivalents 89 39 448 (648) 862 Free cash flow 2 664 1,653 1,341 1,460 2,463 Cash and cash equivalents and short-term investments 2,754 3,409 4,057 3,288 4,034 1 As of January 1, 2018, ASML has adopted the new Revenue Recognition Standard (ASC 606) and Lease Standard (ASC 842). The comparative numbers have been adjusted to reflect these changes in accounting policy. 2 Free cash flow is defined as net cash provided by (used in) operating activities minus investments in Capex (Purchase of Property, plant and equipment and intangibles), see US GAAP Consolidated Financial Statements. These numbers have been prepared in accordance with US GAAP. Numbers have been rounded for readers' convenience.
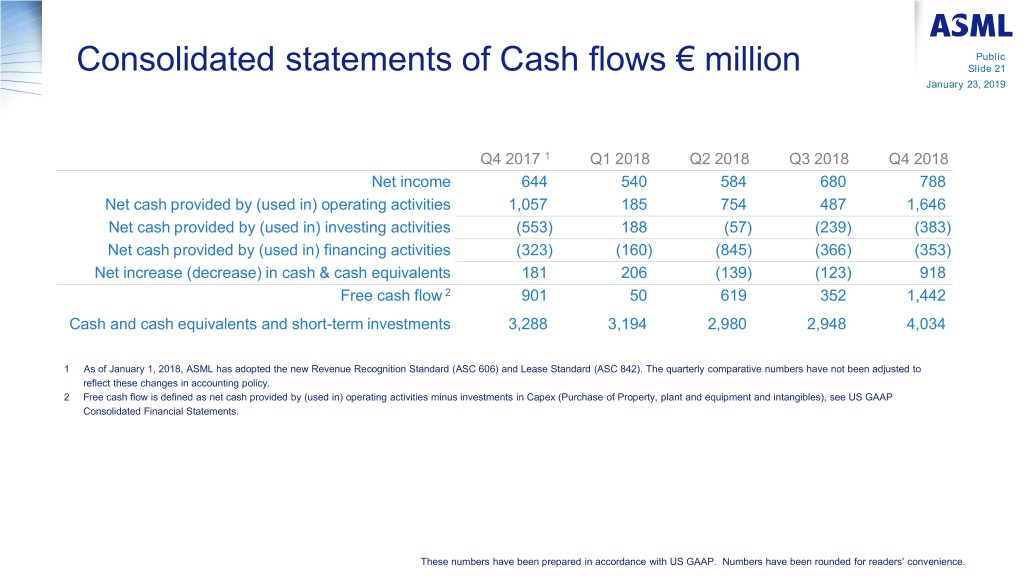
Public Consolidated statements of Cash flows € million Slide 21 January 23, 2019 Q4 2017 1 Q1 2018 Q2 2018 Q3 2018 Q4 2018 Net income 644 540 584 680 788 Net cash provided by (used in) operating activities 1,057 185 754 487 1,646 Net cash provided by (used in) investing activities (553) 188 (57) (239) (383) Net cash provided by (used in) financing activities (323) (160) (845) (366) (353) Net increase (decrease) in cash & cash equivalents 181 206 (139) (123) 918 Free cash flow 2 901 50 619 352 1,442 Cash and cash equivalents and short-term investments 3,288 3,194 2,980 2,948 4,034 1 As of January 1, 2018, ASML has adopted the new Revenue Recognition Standard (ASC 606) and Lease Standard (ASC 842). The quarterly comparative numbers have not been adjusted to reflect these changes in accounting policy. 2 Free cash flow is defined as net cash provided by (used in) operating activities minus investments in Capex (Purchase of Property, plant and equipment and intangibles), see US GAAP Consolidated Financial Statements. These numbers have been prepared in accordance with US GAAP. Numbers have been rounded for readers' convenience.
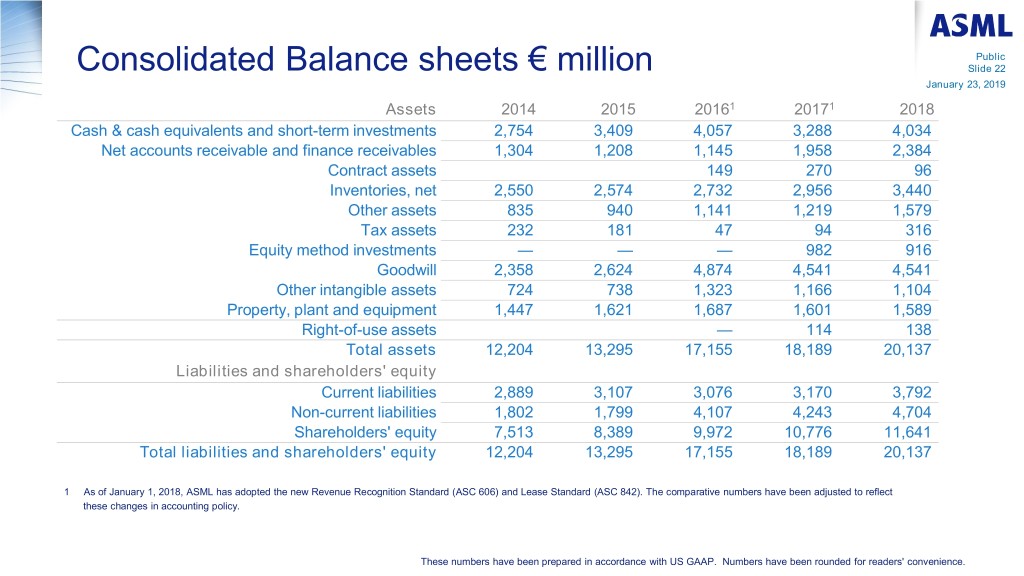
Public Consolidated Balance sheets € million Slide 22 January 23, 2019 Assets 2014 2015 20161 20171 2018 Cash & cash equivalents and short-term investments 2,754 3,409 4,057 3,288 4,034 Net accounts receivable and finance receivables 1,304 1,208 1,145 1,958 2,384 Contract assets 149 270 96 Inventories, net 2,550 2,574 2,732 2,956 3,440 Other assets 835 940 1,141 1,219 1,579 Tax assets 232 181 47 94 316 Equity method investments — — — 982 916 Goodwill 2,358 2,624 4,874 4,541 4,541 Other intangible assets 724 738 1,323 1,166 1,104 Property, plant and equipment 1,447 1,621 1,687 1,601 1,589 Right-of-use assets — 114 138 Total assets 12,204 13,295 17,155 18,189 20,137 Liabilities and shareholders' equity Current liabilities 2,889 3,107 3,076 3,170 3,792 Non-current liabilities 1,802 1,799 4,107 4,243 4,704 Shareholders' equity 7,513 8,389 9,972 10,776 11,641 Total liabilities and shareholders' equity 12,204 13,295 17,155 18,189 20,137 1 As of January 1, 2018, ASML has adopted the new Revenue Recognition Standard (ASC 606) and Lease Standard (ASC 842). The comparative numbers have been adjusted to reflect these changes in accounting policy. These numbers have been prepared in accordance with US GAAP. Numbers have been rounded for readers' convenience.
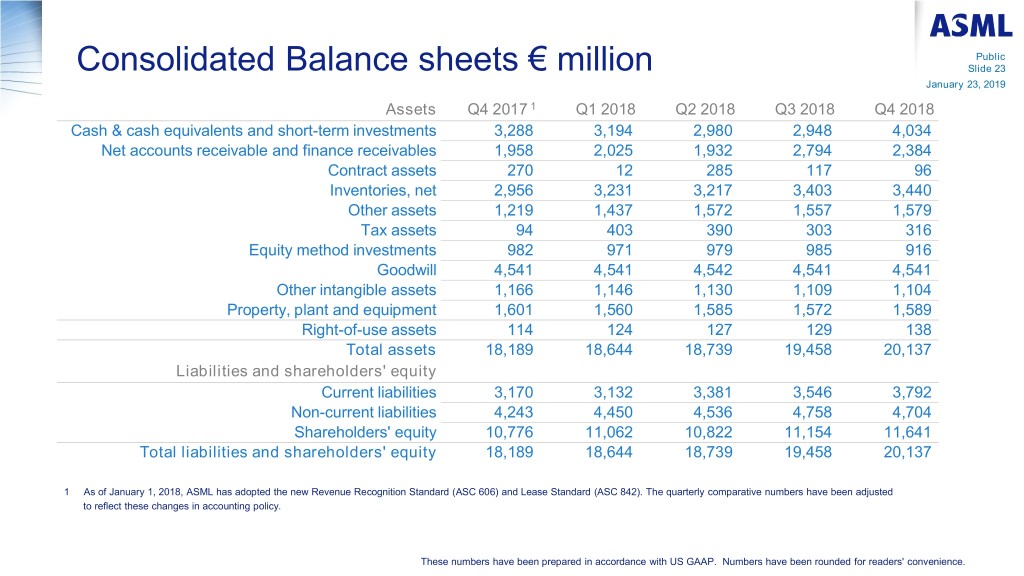
Public Consolidated Balance sheets € million Slide 23 January 23, 2019 Assets Q4 2017 1 Q1 2018 Q2 2018 Q3 2018 Q4 2018 Cash & cash equivalents and short-term investments 3,288 3,194 2,980 2,948 4,034 Net accounts receivable and finance receivables 1,958 2,025 1,932 2,794 2,384 Contract assets 270 12 285 117 96 Inventories, net 2,956 3,231 3,217 3,403 3,440 Other assets 1,219 1,437 1,572 1,557 1,579 Tax assets 94 403 390 303 316 Equity method investments 982 971 979 985 916 Goodwill 4,541 4,541 4,542 4,541 4,541 Other intangible assets 1,166 1,146 1,130 1,109 1,104 Property, plant and equipment 1,601 1,560 1,585 1,572 1,589 Right-of-use assets 114 124 127 129 138 Total assets 18,189 18,644 18,739 19,458 20,137 Liabilities and shareholders' equity Current liabilities 3,170 3,132 3,381 3,546 3,792 Non-current liabilities 4,243 4,450 4,536 4,758 4,704 Shareholders' equity 10,776 11,062 10,822 11,154 11,641 Total liabilities and shareholders' equity 18,189 18,644 18,739 19,458 20,137 1 As of January 1, 2018, ASML has adopted the new Revenue Recognition Standard (ASC 606) and Lease Standard (ASC 842). The quarterly comparative numbers have been adjusted to reflect these changes in accounting policy. These numbers have been prepared in accordance with US GAAP. Numbers have been rounded for readers' convenience.

Public Forward looking statements Slide 24 January 23, 2019 This document contains statements relating to certain projections, business trends and other matters that are forward-looking, including statements with respect to expected trends and outlook, bookings, expected financial results and trends, including expected sales, EUV and DUV revenue, gross margin, R&D and SG&A expenses, and target effective annualized tax rate for the first quarter of 2019, and expected financial results and trends for the full year 2019, including the expectation for continued growth in sales in 2019, with a stronger second half versus the first half, annual revenue opportunity in 2020 and growth potential through 2025, sales and profit targets for 2020, trends in DUV systems revenue and Holistic Lithography and installed based management revenues, expected industry trends and expected trends in the business environment, including continued solid demand for shipments to China, expectations with respect to margins in 2019, including the expected recovery to historic levels by year end statements with respect to the commitment of customers to insert EUV into volume manufacturing by ordering systems, statements with respect to roadmap acceleration, including the introduction of higher productivity systems in 2019 (including the expected shipment of NXE:3400C and expected timing thereof) and the expected benefits, statements with respect to the logic segment expected to be a growth driver, including its expected investment in technology transitions and production capacity for advanced nodes, ASML’s commitment to volume manufacturing and secure system performance, shipments, and support for volume manufacturing, including availability, progress supporting EUV ramp and improving consistency, productivity, and production and service capability enabling required volume as planned, including expected shipments (including expected EUV shipments in 2019 and expected availability of chips produced by EUV scanners to customers in 2019), statements with respect to the expected benefits of the introduction of the new DUV system and expected demand for such system, the expected benefits of the introduction of technologies from ASML’s Brion and HMI product groups, the expected benefits of the new options for the TWINSCAN XT:860M KrF scanner and of the Advanced Wafer Clamping System (AWACS), the expected negative impact of the fire at one of ASML’s suppliers on sales, including the expected recovery timeline, shrink being a key industry driver supporting innovation and providing long-term industry growth, technology innovation driving growth in the next years, Holistic Lithography enabling affordable shrink and delivering value to customers, DUV, EUV and Application products providing unique value drivers for ASML and its customers, the expected continuation of Moore’s law and that EUV will continue to enable Moore’s law and drive long term value for ASML well into the next decade, the intention to continue to return excess cash to shareholders through growing dividends and regularly timed share buybacks in line with ASML’s policy, statements with respect to the proposed dividend for the 2019 Annual General Meeting of Shareholders and the share repurchase plan for 2018-2019, including the intention to use certain shares to cover employee share plans and cancel the rest of the shares upon repurchase, and statements with respect to the expected impact of accounting standards. You can generally identify these statements by the use of words like "may", "will", "could", "should", "project", "believe", "anticipate", "expect", "plan", "estimate", "forecast", "potential", "intend", "continue", "targets", "commits to secure" and variations of these words or comparable words. These statements are not historical facts, but rather are based on current expectations, estimates, assumptions and projections about the business and our future financial results and readers should not place undue reliance on them. Forward-looking statements do not guarantee future performance and involve risks and uncertainties. These risks and uncertainties include, without limitation, economic conditions, product demand and semiconductor equipment industry capacity, worldwide demand and manufacturing capacity utilization for semiconductors, including the impact of general economic conditions on consumer confidence and demand for our customers’ products, competitive products and pricing, the impact of any manufacturing efficiencies and capacity constraints, performance of our systems, the continuing success of technology advances and the related pace of new product development and customer acceptance of and demand for new products including EUV and DUV, the number and timing of EUV and DUV systems shipped and recognized in revenue, timing of EUV orders and the risk of order cancellation or push out, EUV production capacity, delays in EUV systems production and development and volume production by customers, including meeting development requirements for volume production, demand for EUV systems being sufficient to result in utilization of EUV facilities in which ASML has made significant investments, potential inability to recover as planned or at all from the negative sales impact of the fire at one of our suppliers, potential inability to successfully integrate acquired businesses to create value for our customers, our ability to enforce patents and protect intellectual property rights, the outcome of intellectual property litigation, availability of raw materials, critical manufacturing equipment and qualified employees, trade environment, changes in exchange rates, changes in tax rates, available cash and liquidity, our ability to refinance our indebtedness, distributable reserves for dividend payments and share repurchases, results of the share repurchase plan and other risks indicated in the risk factors included in ASML’s Annual Report on Form 20-F and other filings with the US Securities and Exchange Commission. These forward-looking statements are made only as of the date of this document. We do not undertake to update or revise the forward-looking statements, whether as a result of new information, future events or otherwise.


