- ASML Dashboard
- Financials
- Filings
-
Holdings
- Transcripts
- ETFs
-
Insider
- Institutional
- Shorts
-
6-K Filing
ASML Holding (ASML) 6-KCurrent report (foreign)
Filed: 10 Mar 10, 12:00am
| Leadership Through Innovation Craig DeYoung VP Investor Relations and Corporate Communications March 10, 2010 |
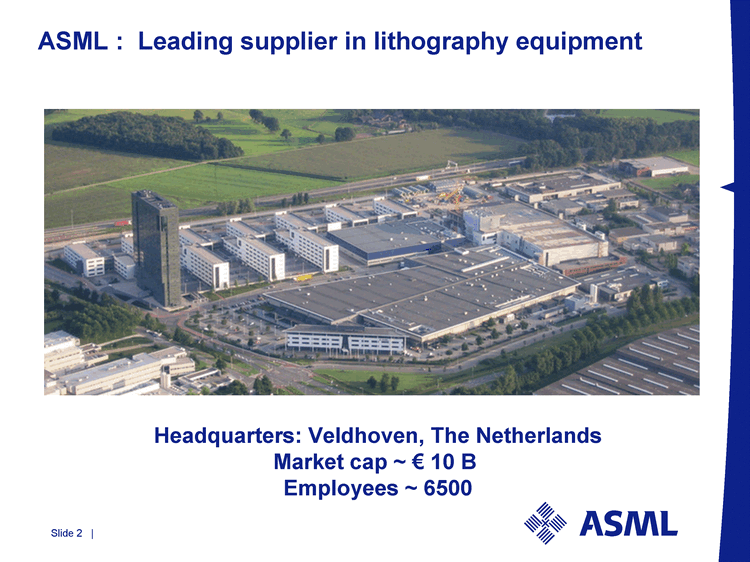
| ASML : Leading supplier in lithography equipment Headquarters: Veldhoven, The Netherlands Market cap ~ € 10 B Employees ~ 6500 |
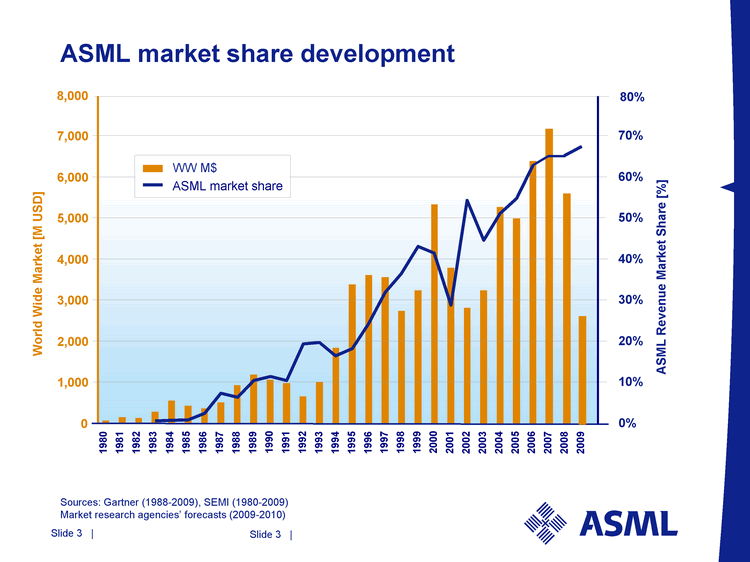
| Slide 3 | ASML market share development Sources: Gartner (1988-2009), SEMI (1980-2009) Market research agencies' forecasts (2009-2010) 1,000 2,000 3,000 4,000 5,000 6,000 7,000 1980 2005 2007 World Wide Market [M USD] 2009 1982 1990 1997 1986 1993 1995 1999 2001 2003 2006 2008 1984 1992 1998 1988 1994 1996 2000 2002 2004 1981 1983 1991 1987 1985 1989 WW M$ ASML market share 0 0% 10% 20% 30% 40% 50% 60% 70% ASML Revenue Market Share [%] 8,000 80% |
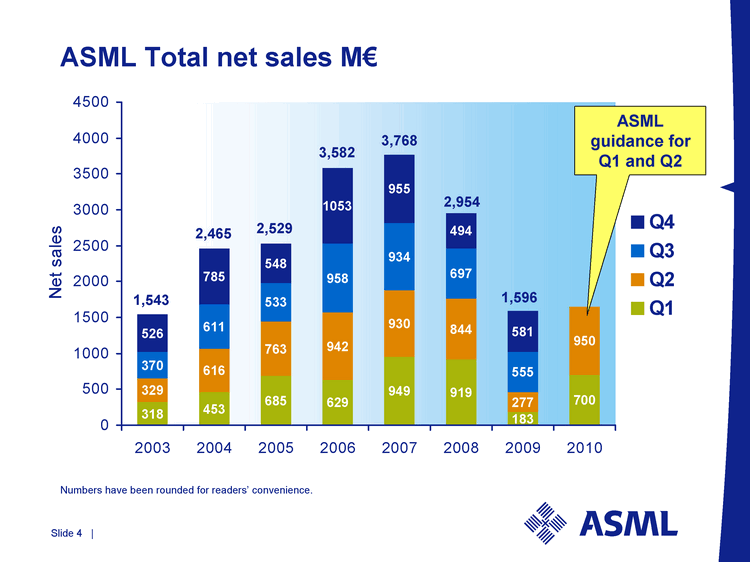
| 2003 2004 2005 2006 2007 2008 2009 2010 Q1 318 453 685 629 949 919 183 700 Q2 329 616 763 942 930 844 277 950 Q3 370 611 533 958 934 697 555 Q4 526 785 548 1053 955 494 581 ASML Total net sales M€ 1,543 2,465 2,529 3,582 3,768 Numbers have been rounded for readers' convenience. 2,954 1,596 ASML guidance for Q1 and Q2 |
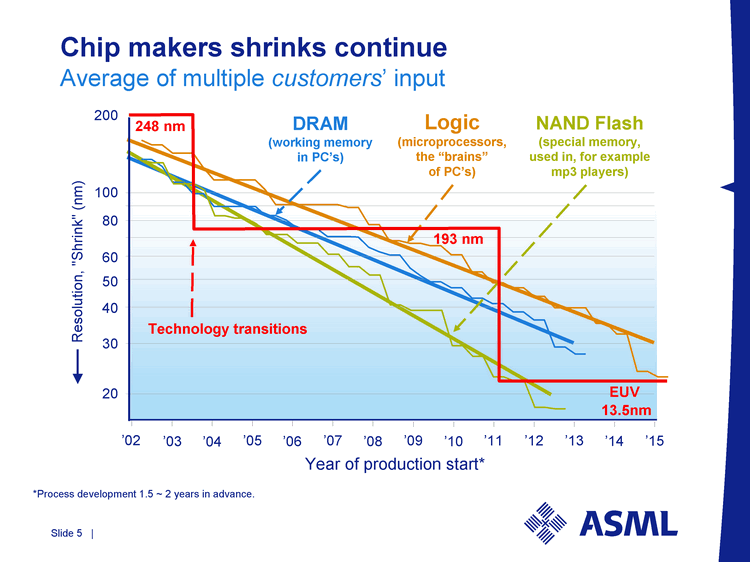
| Resolution, "Shrink" (nm) 100 80 60 40 30 20 50 200 DRAM (working memory in PC's) '02 '03 '04 '05 '06 '07 '08 '09 '10 '11 '12 '13 '14 Year of production start* *Process development 1.5 ~ 2 years in advance. '15 Logic (microprocessors, the "brains" of PC's) NAND Flash (special memory, used in, for example mp3 players) Chip makers shrinks continue Average of multiple customers' input EUV 193 nm 248 nm Technology transitions 13.5nm |
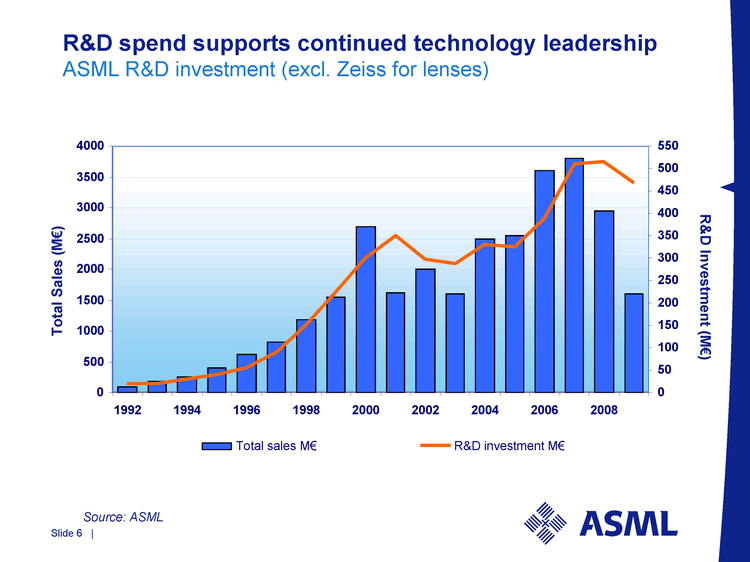
| R&D spend supports continued technology leadership ASML R&D investment (excl. Zeiss for lenses) Source: ASML Total Sales (M€) R&D Investment (M€) 0 500 1000 1500 2000 2500 3000 3500 4000 1992 1994 1996 1998 2000 2002 2004 2006 2008 0 50 100 150 200 250 300 350 400 450 500 550 Total sales M€ R&D investment M€ |
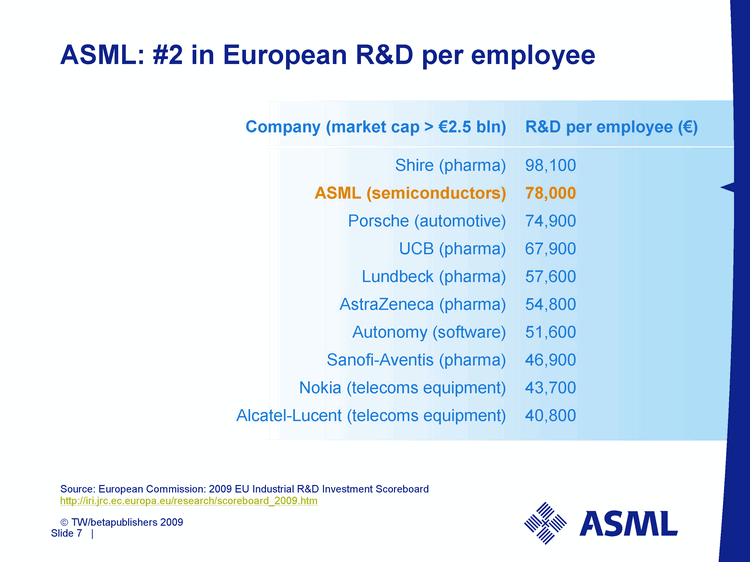
| ASML: #2 in European R&D per employee ? TW/betapublishers 2009 Company (market cap > €2.5 bln) R&D per employee (€) Shire (pharma) 98,100 ASML (semiconductors) 78,000 Porsche (automotive) 74,900 UCB (pharma) 67,900 Lundbeck (pharma) 57,600 AstraZeneca (pharma) 54,800 Autonomy (software) 51,600 Sanofi-Aventis (pharma) 46,900 Nokia (telecoms equipment) 43,700 Alcatel-Lucent (telecoms equipment) 40,800 Source: European Commission: 2009 EU Industrial R&D Investment Scoreboard http://iri.jrc.ec.europa.eu/research/scoreboard_2009.htm |
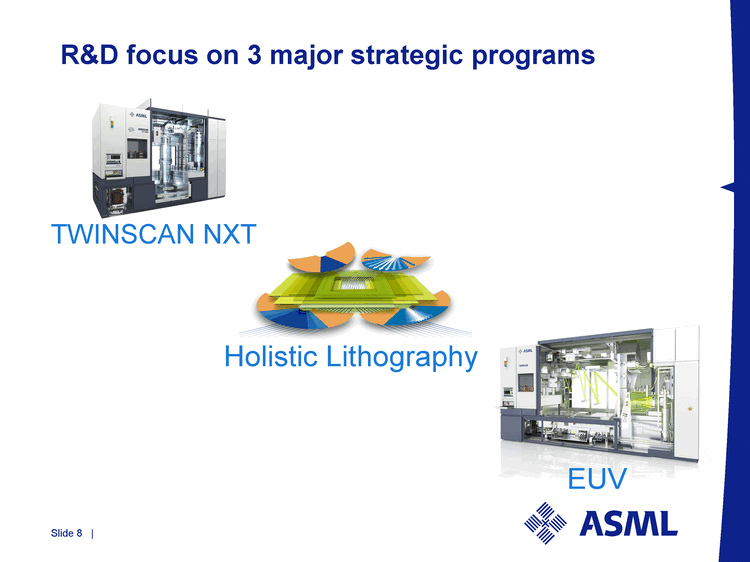
| R&D focus on 3 major strategic programs TWINSCAN NXT EUV Holistic Lithography |
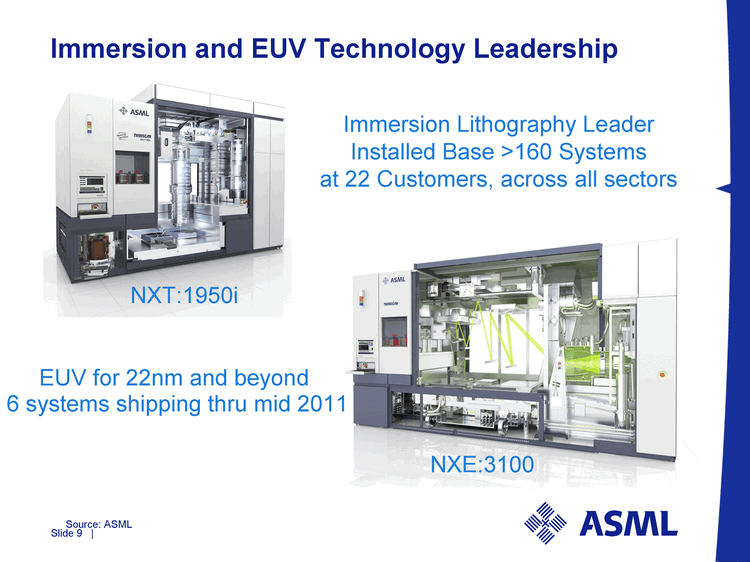
| Immersion and EUV Technology Leadership Source: ASML Immersion Lithography Leader Installed Base >160 Systems at 22 Customers, across all sectors EUV for 22nm and beyond 6 systems shipping thru mid 2011 NXT:1950i NXE:3100 |
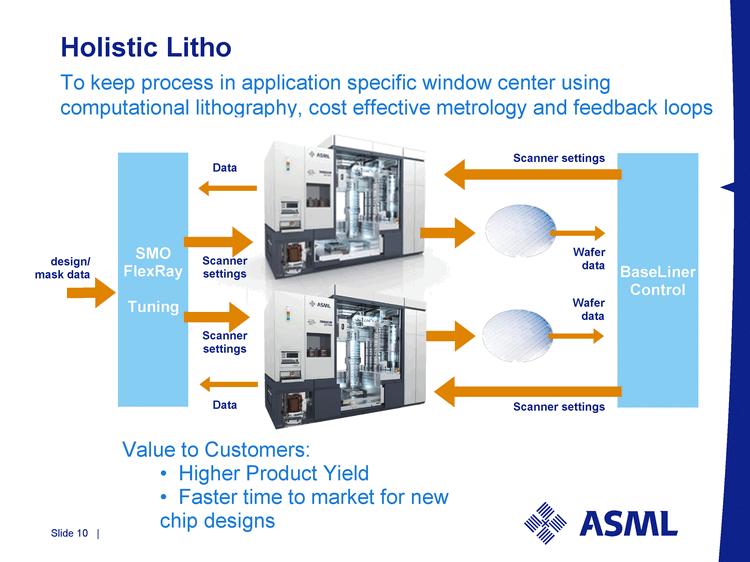
| SMO FlexRay Tuning Holistic Litho To keep process in application specific window center using computational lithography, cost effective metrology and feedback loops BaseLiner Control Data Data design/ mask data Scanner settings Scanner settings Scanner settings Scanner settings Wafer data Wafer data Value to Customers: Higher Product Yield Faster time to market for new chip designs |
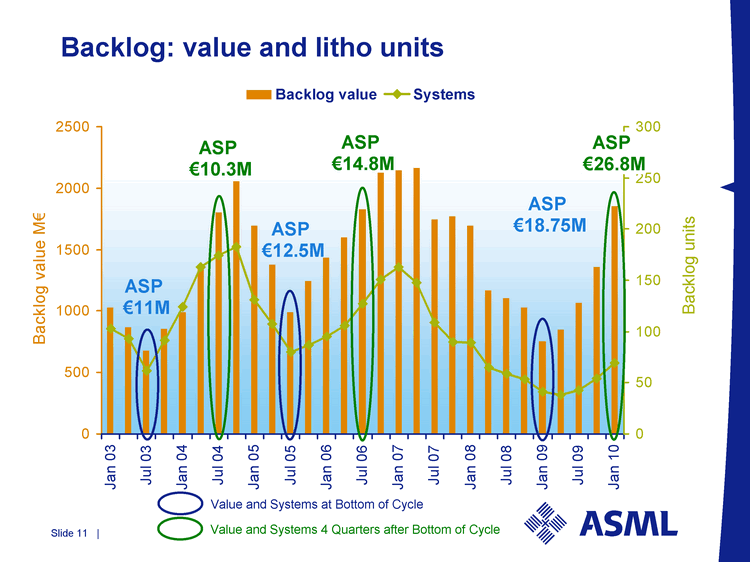
| Backlog: value and litho units Backlog Jan 03 39541 Jul 03 Oct 03 Jan 04 Apr 04 Jul 04 Oct 04 Jan 05 Apr 05 Jul 05 Oct 05 Jan 06 Apr 06 Jul 06 Oct 06 Jan 07 Apr 07 Jul 07 Oct 07 Jan 08 Apr 08 Jul 08 Oct 08 Jan 09 4/9/2009 Jul 09 Oct 09 Jan 10 Backlog value 1030 870 678 859 993 1357 1800 2053 1691 1377 987 1245 1434 1596 1830 2126 2146 2163 1745 1769 1697 1167 1106 1028 755 853 1064 1356 1853 Systems 103 93 62 91 124 163 174 183 131 107 80 87 95 106 127 151 163 148 109 90 89 65 59 53 41 38 43 54 69 Backlog units ASP €18.75M ASP €12.5M ASP €11M ASP €10.3M ASP €14.8M ASP €26.8M Value and Systems at Bottom of Cycle Value and Systems 4 Quarters after Bottom of Cycle |
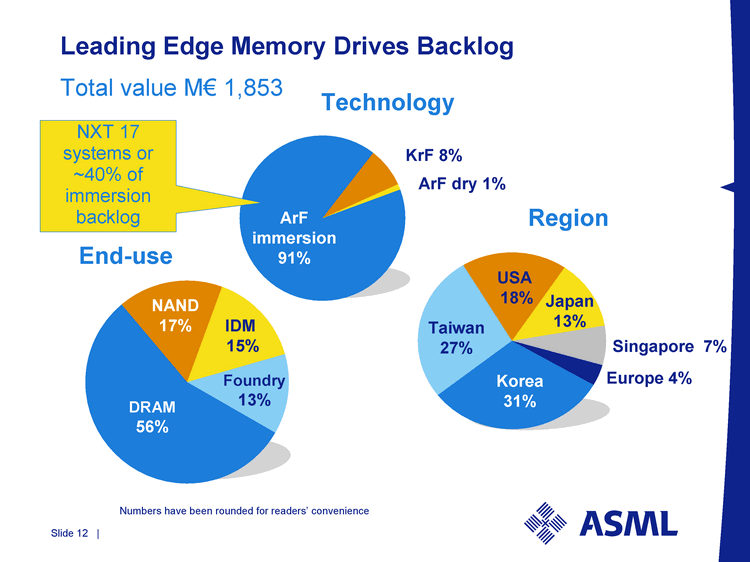
| Korea Taiwan USA Japan Singapore Europe China 31 27 18 13 7 4 DRAM NAND IDM Foundry 56 17 15 13 0 immersion KrF 1-line ArF dry 91 8 1 Leading Edge Memory Drives Backlog Total value M€ 1,853 Technology ArF immersion 91% KrF 8% ArF dry 1% Region USA 18% Taiwan 27% Korea 31% Europe 4% Japan 13% End-use NAND 17% IDM 15% Foundry 13% Numbers have been rounded for readers' convenience Singapore 7% NXT 17 systems or ~40% of immersion backlog DRAM 56% |
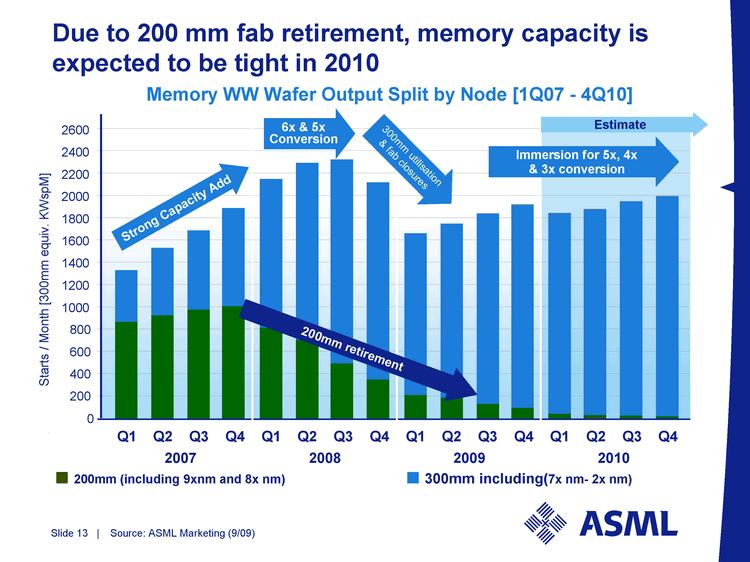
| 0 200 400 600 800 1000 1200 1400 1600 1800 2000 2200 2400 2600 Q1 Q2 Q3 Q4 Q1 Q2 Q3 Q4 Q1 Q2 Q3 Q4 Q1 Q2 Q3 Q4 2007 2008 2009 2010 Wafer Output [300 mm equiv. KWSM] Memory WW Wafer Output Split by Node [1Q07 - 4Q10] Due to 200 mm fab retirement, memory capacity is expected to be tight in 2010 Starts / Month [300mm equiv. KWspM] Source: ASML Marketing (9/09) Strong Capacity Add 6x & 5x Conversion 300mm utilisation & fab closures 200mm retirement ^ 200mm (including 9xnm and 8x nm) ^ 300mm including(7x nm- 2x nm) Immersion for 5x, 4x & 3x conversion Estimate |
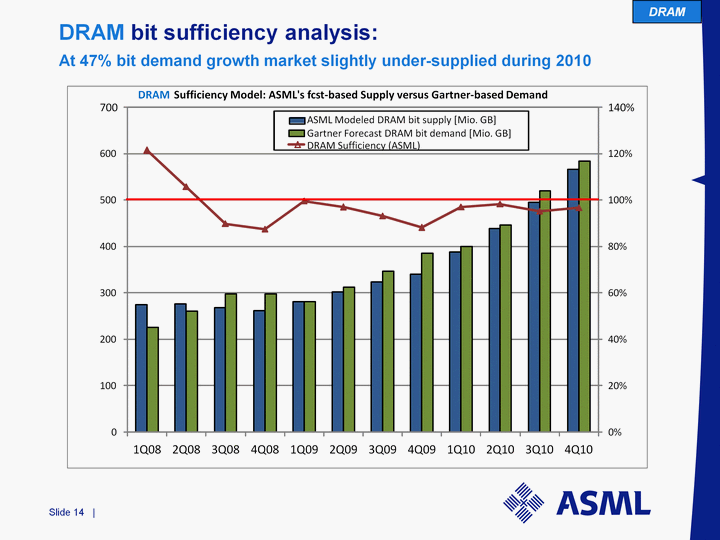
| DRAM bit sufficiency analysis: At 47% bit demand growth market slightly under-supplied during 2010 DRAM DRAM Sufficiency [%] DRAM demand & supply [Mio. GB] 0% 20% 40% 60% 80% 100% 120% 140% 0 100 200 300 400 500 600 700 1Q08 2Q08 3Q08 4Q08 1Q09 2Q09 3Q09 4Q09 1Q10 2Q10 3Q10 4Q10 DRAM Sufficiency Model: ASML's fcst - - based Supply versus Gartner - - based Demand ASML Modeled DRAM bit supply [Mio. GB] Gartner Forecast DRAM bit demand [Mio. GB] DRAM Sufficiency (ASML) |
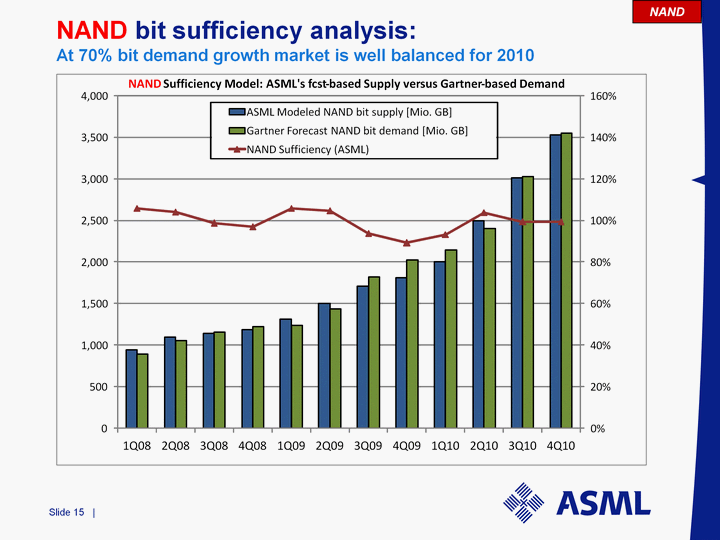
| NAND bit sufficiency analysis: At 70% bit demand growth market is well balanced for 2010 NAND NAND Sufficiency [%] NAND demand & supply [Mio. GB] 0% 20% 40% 60% 80% 100% 120% 140% 160% 0 500 1,000 1,500 2,000 2,500 3,000 3,500 4,000 1Q08 2Q08 3Q08 4Q08 1Q09 2Q09 3Q09 4Q09 1Q10 2Q10 3Q10 4Q10 NAND Sufficiency Model: ASML's fcst - - based Supply versus Gartner - - based Demand ASML Modeled NAND bit supply [Mio. GB] Gartner Forecast NAND bit demand [Mio. GB] NAND Sufficiency (ASML) |
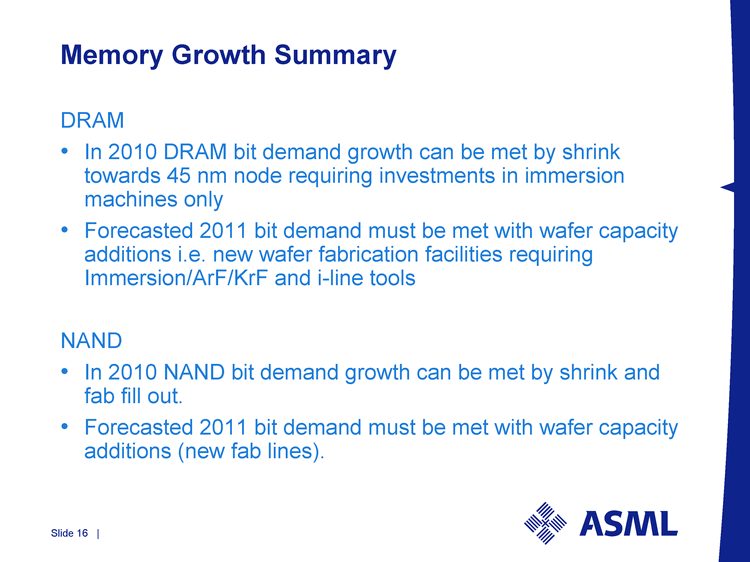
| Memory Growth Summary DRAM In 2010 DRAM bit demand growth can be met by shrink towards 45 nm node requiring investments in immersion machines only Forecasted 2011 bit demand must be met with wafer capacity additions i.e. new wafer fabrication facilities requiring Immersion/ArF/KrF and i-line tools NAND In 2010 NAND bit demand growth can be met by shrink and fab fill out. Forecasted 2011 bit demand must be met with wafer capacity additions (new fab lines). |
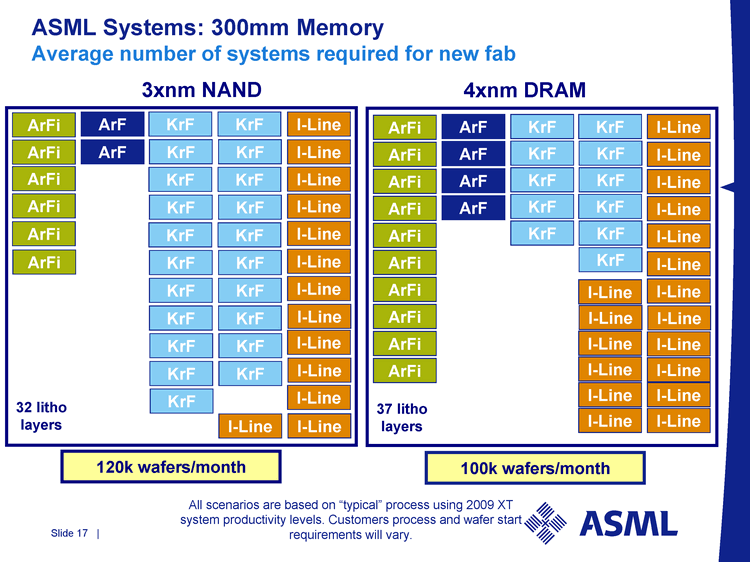
| ASML Systems: 300mm Memory Average number of systems required for new fab 120k wafers/month 100k wafers/month 3xnm NAND 32 litho layers ArFi ArF KrF KrF ArF I-Line I-Line KrF KrF I-Line I-Line KrF I-Line I-Line I-Line ArFi ArFi ArFi ArFi I-Line I-Line I-Line KrF KrF KrF ArFi KrF KrF KrF KrF KrF KrF KrF KrF KrF KrF KrF KrF KrF I-Line I-Line I-Line 4xnm DRAM ArFi 37 litho layers ArF ArF KrF KrF I-Line I-Line ArF KrF KrF I-Line I-Line KrF KrF I-Line I-Line I-Line ArFi ArFi ArFi ArFi ArFi I-Line ArFi I-Line I-Line I-Line I-Line ArF KrF KrF ArFi ArFi ArFi KrF KrF KrF I-Line I-Line I-Line I-Line I-Line I-Line All scenarios are based on "typical" process using 2009 XT system productivity levels. Customers process and wafer start requirements will vary. |
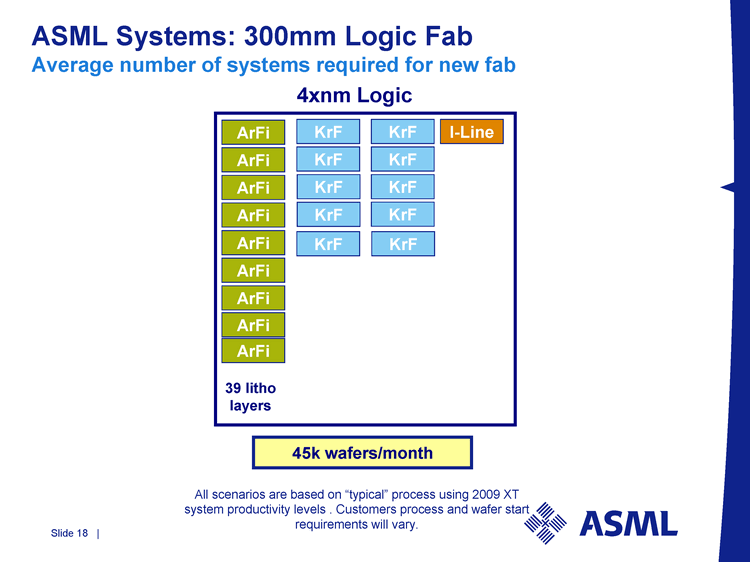
| ASML Systems: 300mm Logic Fab Average number of systems required for new fab 45k wafers/month 4xnm Logic ArFi 39 litho layers KrF KrF I-Line KrF KrF KrF KrF ArFi ArFi ArFi ArFi ArFi ArFi KrF KrF ArFi KrF ArFi KrF All scenarios are based on "typical" process using 2009 XT system productivity levels . Customers process and wafer start requirements will vary. |
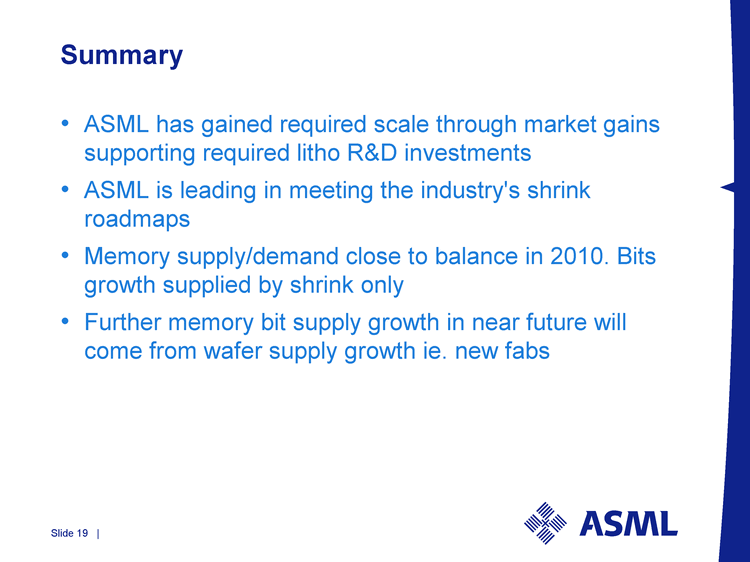
| Summary ASML has gained required scale through market gains supporting required litho R&D investments ASML is leading in meeting the industry's shrink roadmaps Memory supply/demand close to balance in 2010. Bits growth supplied by shrink only Further memory bit supply growth in near future will come from wafer supply growth ie. new fabs |