- ASML Dashboard
- Financials
- Filings
-
Holdings
- Transcripts
- ETFs
-
Insider
- Institutional
- Shorts
-
6-K Filing
ASML Holding (ASML) 6-KCurrent report (foreign)
Filed: 15 Jan 09, 12:00am
| ASML 2008 Annual and Fourth Quarter Results ASML drives key technology developments and implements a more effective cost structure during downturn January 15, 2009 |
| Safe Harbor "Safe Harbor" Statement under the US Private Securities Litigation Reform Act of 1995: the matters discussed in this document may include forward-looking statements, including statements made about our outlook, realization of backlog, IC unit demand, financial results, average sales price, gross margin and expenses. These forward looking statements are subject to risks and uncertainties including, but not limited to: economic conditions, product demand and semiconductor equipment industry capacity, worldwide demand and manufacturing capacity utilization for semiconductors (the principal product of our customer base), including the impact of credit market deterioration on consumer confidence and demand for our customers' products, competitive products and pricing, manufacturing efficiencies, new product development and customer acceptance of new products, ability to enforce patents and protect intellectual property rights, the outcome of intellectual property litigation, availability of raw materials and critical manufacturing equipment, trade environment, changes in exchange rates and other risks indicated in the risk factors included in ASML's Annual Report on Form 20-F and other filings with the US Securities and Exchange Commission. / Slide 2 |
| Agenda Market Driving technology priorities and a more effective cost structure Business summary Outlook and summary / Slide 3 |
| Market / Slide 4 |

| Dramatic year-end decline, year-on-year IC unit growth falls to lowest level since 2001 Source: WSTS, ASML, Last data point: November 2008 IC unit sales comparison 0 20 40 60 80 100 120 140 160 Jan Feb Mar Apr May Jun Jul Aug Sep Oct Nov Dec Units [B] - -6% - -4% - -2% 0% 2% 4% 6% 8% 10% 12% 14% 16% Growth [%] 2007 Cumm 2008 Cumm Growth YTD YoY-3mma / Slide 5 |

| IC inventories are high but swift production cut backs result in acceptable inventory levels Source: VLSI Research, ASML, December 2008 IC unit sales and inventory 0 5 10 15 20 25 Jan-00 Jul-00 Jan-01 Jul-01 Jan-02 Jul-02 Jan-03 Jul-03 Jan-04 Jul-04 Jan-05 Jul-05 Jan-06 Jul-06 Jan-07 Jul-07 Jan-08 Jul-08 IC unit sales [B] 0 20 40 60 80 100 120 IC inventory [days] IC inventory 3mma IC unit sales corrected for inventory 3mma IC unit sales 3mma IC # Inventory-sales ratio / Slide 6 |

| Macro and sector trends NAND Investments stop with 20% capacity reductions expected in Q1 First signs of chip price recovery Continued ramp of 4x nm and slow 3x nm ramp DRAM Capacity reductions will result in a 30% cut since Q1 '08 matching falling demand First signs of chip price recovery Investments stop at customers awaiting Taiwanese manufacturers consolidation Slow 5x nm transition by tier 2 manufacturers, cash limitations Foundry Utilization falling sharply in line with demand Slow 4x nm transition Litho market visibility remains very low, as customers are implementing severe production cut-backs to avoid large inventories and stabilize chip prices during reduced end demand. Technology transitions are impeded by lack of demand and tight financing / Slide 7 |

| Driving technology priorities and a more effective cost structure / Slide 8 |
| Downturn strategy Keep strategic R&D programs intact and in line with customer roadmaps with focus on high level of product differentiation Maintain a level of production capacity which allows us to meet changing customer needs without lengthy lead times Manage for positive cash generation at very low quarterly revenue levels Drive improvement in long term cost structure during current slow business environment / Slide 9 |
| Product roadmap strengthening and holistic litho introduction supports customers low cost manufacturing drive Developments continue to support customer road maps TWINSCAN XTIV lower cost platform transition by end of 2009 Double patterning supported by TWINSCAN NXT multipurpose platform with substantially higher speed and overlay accuracy at 32 nm resolution and beyond High throughput EUV to support resolution of 22 nm and beyond Holistic lithography to enable continued aggressive scaling and optimize customer cost of ownership / Slide 10 |

| Product pipeline Resolution: 32 nm Productivity to 200 wph Shipping 2009 Double patterning TWINSCAN NXT:1950 EUV TWINSCAN NXE:3100 Resolution: 22 nm and beyond Productivity to 140 wh Shipping 2010 TWINSCAN XT:1950Hi (body IV) Resolution: 38 nm Productivity to 148 wph Shipping 2009 / Slide 11 |
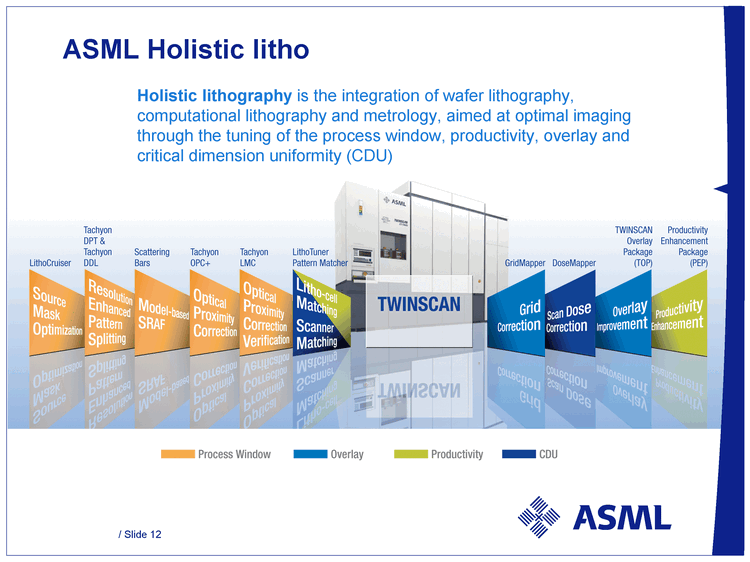
| ASML Holistic litho ASML Holistic litho Holistic lithography is the integration of wafer lithography, computational lithography and metrology, aimed at optimal imaging through the tuning of the process window, productivity, overlay and critical dimension uniformity (CDU) / Slide 12 |
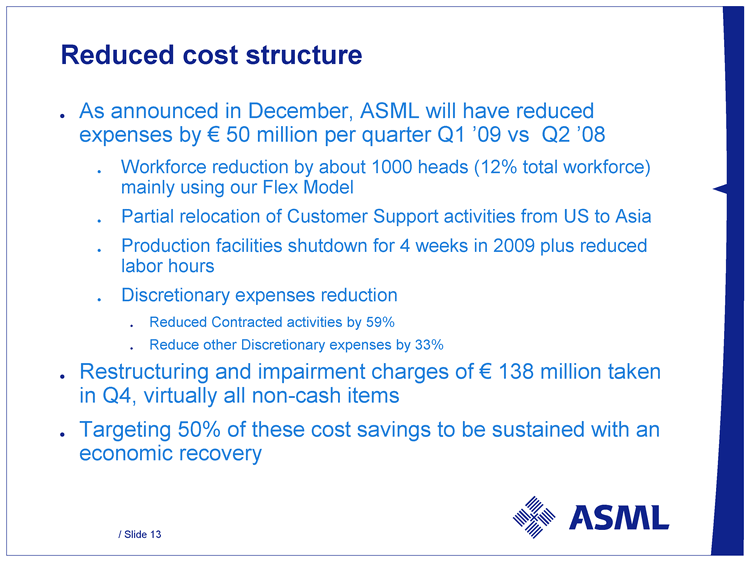
| Reduced cost structure As announced in December, ASML will have reduced expenses by € 50 million per quarter Q1 '09 vs Q2 '08 Workforce reduction by about 1000 heads (12% total workforce) mainly using our Flex Model Partial relocation of Customer Support activities from US to Asia Production facilities shutdown for 4 weeks in 2009 plus reduced labor hours Discretionary expenses reduction Reduced Contracted activities by 59% Reduce other Discretionary expenses by 33% Restructuring and impairment charges of € 138 million taken in Q4, virtually all non-cash items Targeting 50% of these cost savings to be sustained with an economic recovery / Slide 13 |

| Maximized cash at low revenues Q4 net cash outflow € 204 million mainly due to sudden revenue drop Supplier payments made on inventory not shipped in Q4 due to customer delivery push-outs Back-end loaded shipments for which receivables are due in Q1 Income tax paid for prior years Investment in the new EUV factory Q1 cash flow expected positive, at sales level of € 180 - 200 million Working capital release due to significantly reduced component purchasing and usage of components already in inventory Working capital release due to receipt of outstanding accounts Cash benefit from lowered cost of operations Reduced Capex in H2 '09 with completion of EUV production facility / Slide 14 |

| Solid financial position Strong liquidity Cash & cash equivalents € 1.1 billion Standby facility € 500 million due 2012 Conservatively financed Debt € 600 million 5.75% Notes due 2017 / Slide 15 |
| Business summary / Slide 16 |
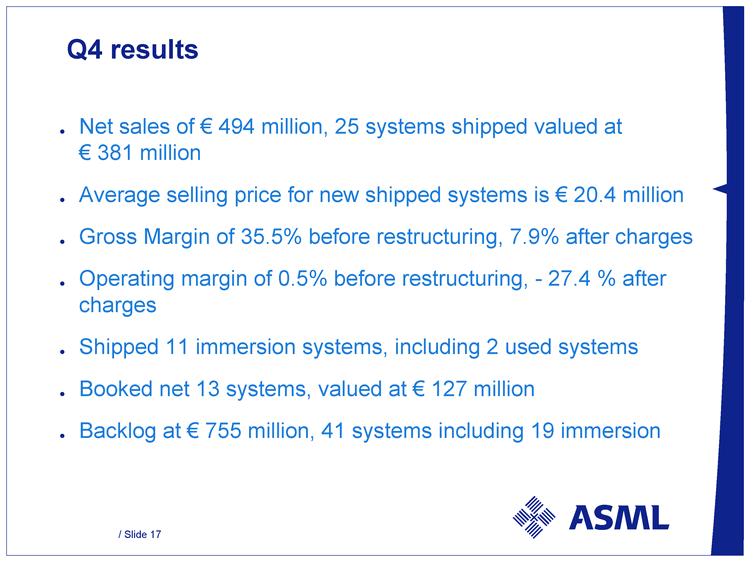
| Q4 results Net sales of € 494 million, 25 systems shipped valued at € 381 million Average selling price for new shipped systems is € 20.4 million Gross Margin of 35.5% before restructuring, 7.9% after charges Operating margin of 0.5% before restructuring, - 27.4 % after charges Shipped 11 immersion systems, including 2 used systems Booked net 13 systems, valued at € 127 million Backlog at € 755 million, 41 systems including 19 immersion / Slide 17 |
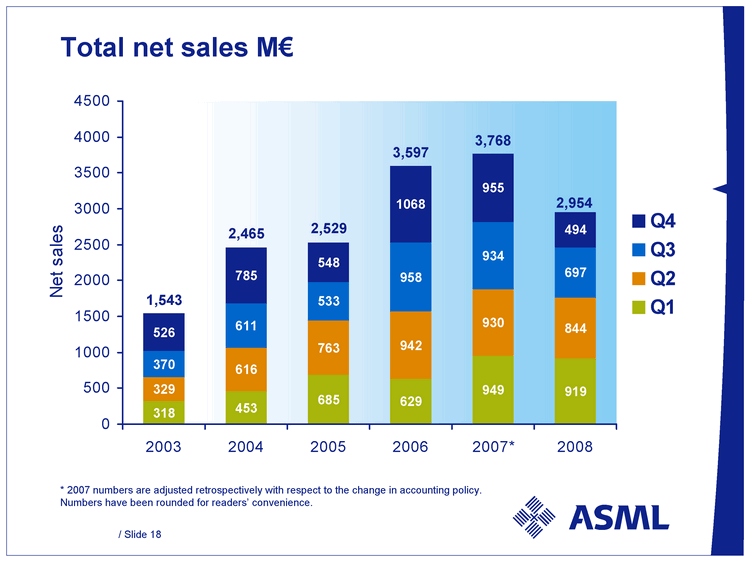
| Total net sales M€ 1,543 2,465 2,529 3,597 3,768 * 2007 numbers are adjusted retrospectively with respect to the change in accounting policy. Numbers have been rounded for readers' convenience. 2,954 318 453 685 629 949 919 329 616 763 942 930 844 370 611 533 958 934 697 526 785 548 1068 955 494 0 500 1000 1500 2000 2500 3000 3500 4000 4500 2003 2004 2005 2006 2007* 2008 Net sales Q4 Q3 Q2 Q1 / Slide 18 |
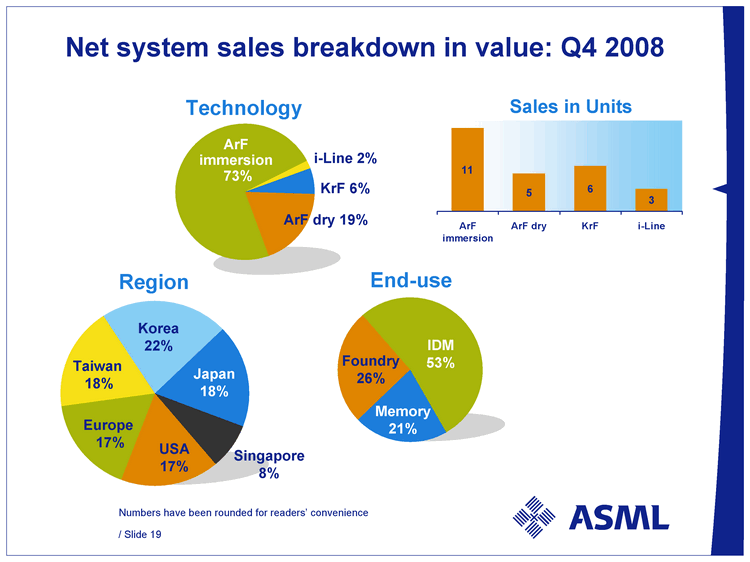
| Net system sales breakdown in value: Q4 2008 Memory Foundry IDM R&D East 21 26 53 West North End-use Foundry 26% Memory 21% IDM 53% Numbers have been rounded for readers' convenience Technology KrF ArF dry ArF immersion I line East 6 19 73 2 West North KrF 6% i-Line 2% ArF immersion 73% ArF dry 19% ROW U.S.A Europe Taiwan Korea China Japan ROW Stp 17 17 18 22 18 8 West North USA 17% Taiwan 18% Korea 22% Japan 18% Europe 17% Sales in Units Region Singapore 8% 5 6 3 11 ArF immersion ArF dry KrF i-Line / Slide 19 |
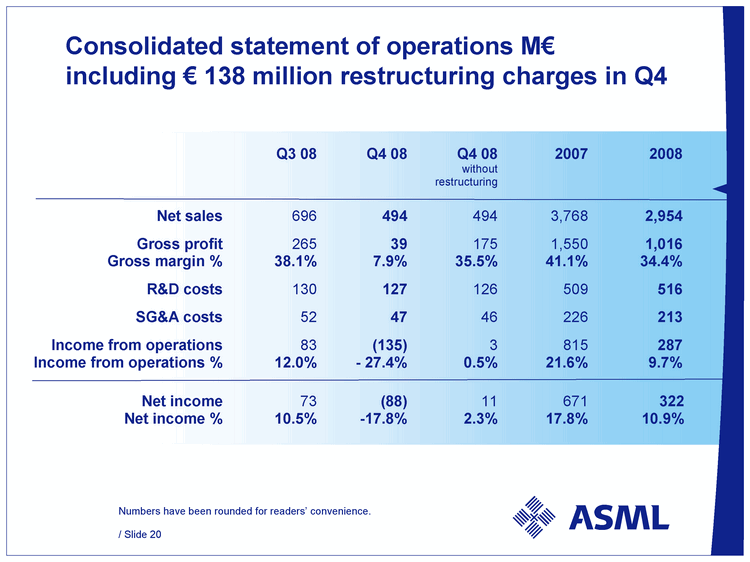
| Numbers have been rounded for readers' convenience. Consolidated statement of operations M€ including € 138 million restructuring charges in Q4 Q3 08 Q4 08 Q4 08 without restructuring 2007 20 08 Net sales 696 494 494 3,768 2,954 Gross profit Gross margin % 265 38.1% 39 7.9 % 175 35.5% 1,550 41.1 % 1,016 34.4 % R&D costs 130 12 7 126 509 516 SG&A costs 52 4 7 46 226 213 I ncome from operations I ncome from operations % 83 12.0% (135) - - 27.4 % 3 0.5 % 815 21.6 % 287 9.7% Net income Net income % 73 10.5% (88) - - 17.8 % 11 2.3% 671 17.8 % 322 10.9 % / Slide 20 |

| Key financial trends 2007 - 2008 Consolidated statement of operations M€ * 2007 numbers are adjusted retrospectively with respect to the change in accounting policy. Numbers have been rounded for readers' convenience. Q4 07 * Q1 0 8 Q2 08 Q3 08 Q4 08 Net Sales 955 919 844 696 494 Gross profit Gross margin % 390 40.8% 374 40.6% 337 40.0% 265 38.1% 39 7.9 % R&D 130 129 130 130 127 SG&A 57 57 56 52 47 Income from operations Income from operations % 203 21.3 % 18 8 20.5 % 151 17.9% 83 12.0% (135) - - 27.4 % Net income Net income % 193 20.2 % 145 15.8% 192 22.7% 73 10.5% (88 ) - - 17.8 % Units shipped 55 50 39 37 25 ASP New Systems 16.2 18.7 21.7 21.6 20.4 Net Bookings Units 54 26 33 31 13 / Slide 21 |
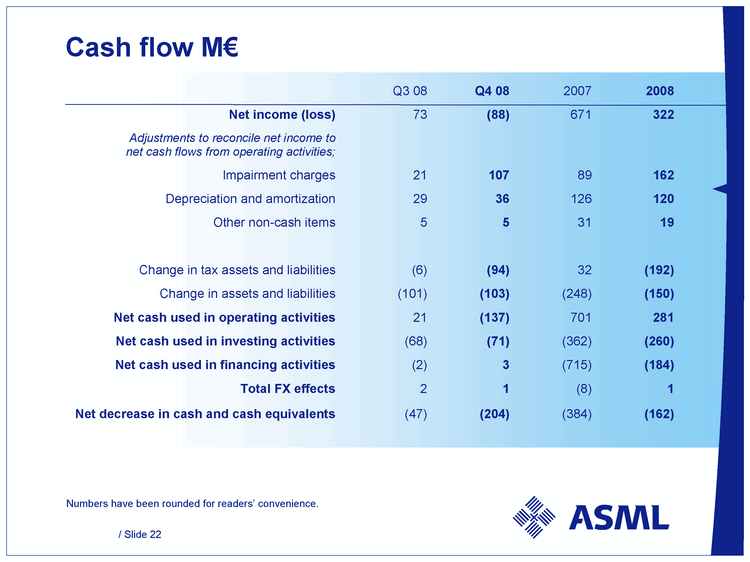
| Cash flow M€ Numbers have been rounded for readers' convenience. Q3 08 Q4 08 2007 20 08 Net income (loss) 73 (88) 671 322 Adjustments to reconcile net income to net cash flows from operating activities; I mpairment charges 21 107 89 162 Depreciation and amortization 29 36 126 120 Other non - - cash items 5 5 31 19 Change in tax assets and liabilities (6) (94) 32 (192) Change in assets and liabilities (101) (103 ) (248) (150) Net cash used in operating activities 21 (137) 701 281 Net cash used in investing activities (68) (71) (362) (260) Net cas h used in financing activities (2) 3 (715) (184) Total FX effects 2 1 (8) 1 Net decrease in cash and cash equivalents (47) (204) (384) (162) / Slide 22 |
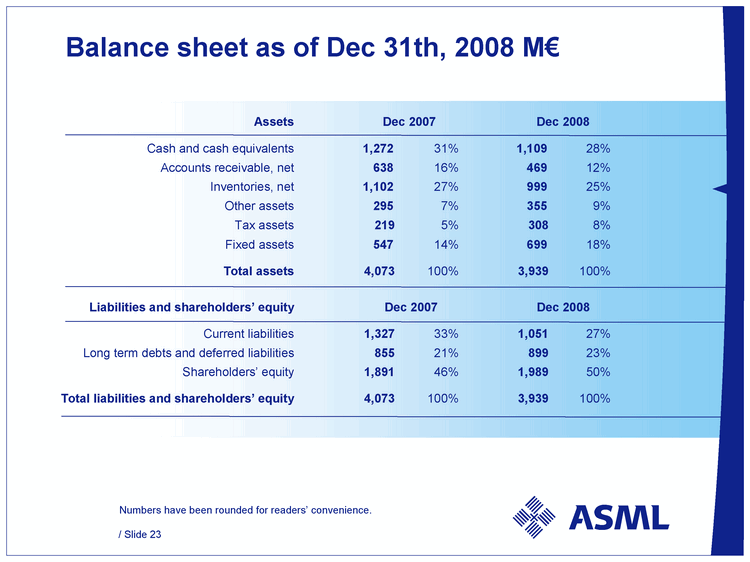
| Balance sheet as of Dec 31th, 2008 M€ Numbers have been rounded for readers' convenience. A ssets Dec 2007 Dec 2008 Cash and cash equivalents 1, 272 31 % 1, 109 28 % Accounts receivable, net 638 16 % 469 12 % Inventories, net 1,1 02 27 % 999 25 % Other assets 2 95 7 % 3 55 9 % Tax assets 2 19 5 % 308 8 % Fixed assets 547 14 % 6 99 18 % Total assets 4, 0 73 100% 3, 9 39 100% Liabilities and shareholders' equity Dec 200 7 Dec 2008 Current liabilities 1, 3 27 33 % 1, 0 51 27 % Long term debts and deferred liabilities 855 21 % 899 23 % Shareholders' equity 1, 891 46 % 1,9 89 50 % Total liabilities and shareholders' equity 4, 0 73 100% 3, 9 39 100% / Slide 23 |

| New systems Backlog Used systems Backlog Total systems Backlog Units 3 3 8 41 Value M€ 7 19 M€ 36 M€ 755 ASP M€ 21. 8 M€ 4.5 M€ 18 ..4 41% of backlog or € 313 million system sales carry H1 '09 shipment dates Q4 net bookings of 13 systems with a value of € 127 million including 5 new tools with an ASP of € 24.7 million Note: Due to possible customer changes in delivery schedules and to cancellation of orders, our backlog at any particular date is not necessarily indicative of actual sales for any succeeding period Numbers have been rounded for readers' convenience Backlog as of Dec 31th, 2008 / Slide 24 |
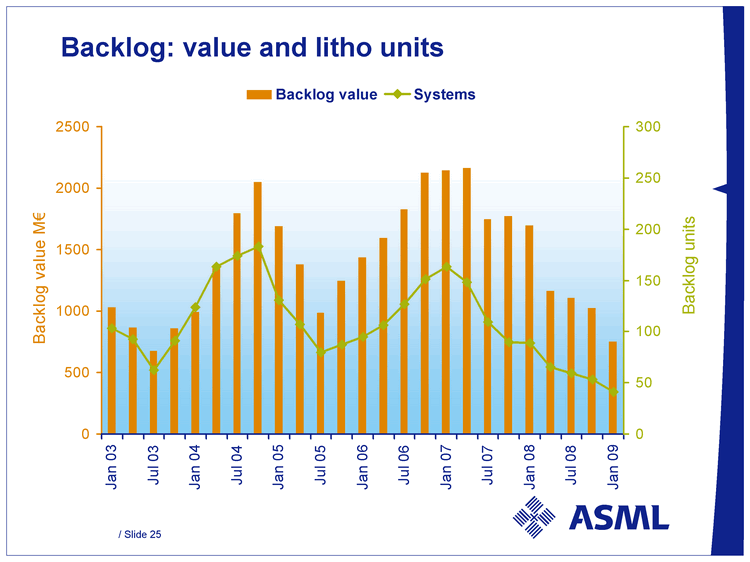
| Backlog: value and litho units Backlog units 0 500 1000 1500 2000 2500 Jan 03 Jul 03 Jan 04 Jul 04 Jan 05 Jul 05 Jan 06 Jul 06 Jan 07 Jul 07 Jan 08 Jul 08 Jan 09 Backlog value M€ 0 50 100 150 200 250 300 Backlog value Systems / Slide 25 |

| Taiwan Europe USA Korea Other Japan China 11 7 38 11 3 20 10 memory IDM Foundry 42 43 15 0 0 0 immersion KrF 1-line ArF dry 73 8 3 16 Backlog lithography in value per Dec 31th, 2008 Total value M€ 755 Technology i-Line 3% ArF immersion 73% KrF 8% ArF dry 16% Region USA 38% Taiwan 11% Korea 11% Other 3% Europe 7% Japan 20% End-use Memory 49% IDM 41% Foundry 10% Numbers have been rounded for readers' convenience China 10% / Slide 26 |

| Dividend ASML will submit a proposal to the 2009 General Meeting of Shareholders to declare a dividend of € 0.20 per share, compared to € 0.25 per share paid in 2008 Balanced decision given Economic and industry environment Cost measures Interests of all stakeholders / Slide 27 |
| Outlook and summary / Slide 28 |

| Q1 2009 outlook ASML expects net sales between € 180 - 200 million Gross margin expected at about 8% reflecting very low coverage of fixed costs R&D is expected at € 117 million net of credit SG&A is expected to decrease to € 44 million Breakeven point after restructuring is approx. € 450 million / Slide 29 |

| Summary No IC production capacity added due to virtual capex freeze Semiconductor equipment market pickup currently impossible to predict ASML can ramp production fast with short lead times when market recovers ASML continues to invest in strategic product development programs Working capital releases and adjusted cost structure will allow ASML to generate a positive operating cash flow at low sales levels anticipated in Q1 Improved cost structure will make ASML leaner resulting in earlier and greater profitability / Slide 30 |

| Outlook The severity of the global economic downturn has caused semiconductor manufacturers to delay their investment plans. The uncertainty as to the timing of a semiconductor end-product demand pick up and the time needed to complete the current consolidation and restructuring activities in the memory sector, makes a semiconductor equipment market pick-up prediction impossible. We have therefore taken decisive actions to adjust our cost structure to cope with these exceptional economic circumstances so we can generate cash at a low level of sales, while not impacting our current aggressive technology development roadmap. In addition, we plan to maintain a level of manufacturing capacity to ramp production to customer needs without lengthy lead times, as the lithography market may pick up quickly once end-product demand recovers. ASML expects Q1 2009 net sales between EUR 180 million to EUR 200 million, and gross margin in Q1 2009 of about 8 percent. R&D expenditures are expected to be at EUR 117 million net of credits and SG&A costs are expected at EUR 44 million. ASML will submit a proposal to the 2009 General Meeting of Shareholders to declare a dividend of EUR 0.20 per share (approximately EUR 86 million), compared with a dividend of EUR 0.25 per share paid in 2008. ASML has reduced costs through a comprehensive company-wide efficiency program, while not impacting key research and development projects. We have been able to react quickly by using the flexibility of our business model, including significant use of contract and flexible labor. ASML still has an extensive pool of flexible contracts and we intend to avoid forced redundancies. By Q1 2009 we expect to have cut our operational expenses by EUR 50 million per quarter. We expect that these savings, in combination with reduced components purchasing and the assembly of components already in inventory, will help us generate a positive Q1 operating cash flow. Also, about half of our quarterly cost savings will be sustainable when the economy recovers, making ASML a much leaner and more profitable company. We will continue investing in our new Double Patterning and EUV lithography platforms to address the 32 nanometer node and beyond, in order to lead the semiconductor industry to the next generations of chip manufacturing technologies. Our EUV production system roadmap supports cost-effective chip manufacturing to 22 nanometers and smaller; we will start deliveries of five production systems already in 2010. In addition, ASML has developed a range of resolution enhancement techniques which leading vendors are implementing to reduce cost per chip. These techniques, from advanced illumination shaping to radical mask pattern enhancements, require powerful computational modeling and intimate knowledge of the scanner systems. This is a unique combination of capabilities in which ASML has established a leading role thanks to the know-how acquired through our Brion division. / Slide 31 |
