Exhibit 99.2
Exhibit 99.2
ASML
ASML Q1 2014 sales in line with guidance gross margin above guidance
ASML 2014 First Quarter Results
Veldhoven, the Netherlands
April 16, 2014
ASML
Public
Slide 2
16 April 2014
Forward looking statements
“Safe Harbor” Statement under the US Private Securities Litigation Reform Act of 1995: the matters discussed in this document may include forward-looking statements, including statements made about our outlook, expected sales levels, systems backlog, IC unit demand, expected financial results, gross margin and expenses, and intention to repurchase shares.
These forward looking statements are subject to risks and uncertainties including: economic conditions, product demand and semiconductor equipment industry capacity, worldwide demand and manufacturing capacity utilization for semiconductors (the principal product of our customer base), including the impact of general economic conditions on consumer confidence and demand for our customers’ products, competitive products and pricing, the impact of manufacturing efficiencies and capacity constraints, the continuing success of technology advances and the related pace of new product development and customer acceptance of new products, the number and timing of EUV systems expected to be shipped, our ability to enforce patents and protect intellectual property rights, the risk of intellectual property litigation, availability of raw materials and critical manufacturing equipment, trade environment, changes in exchange rates, available cash, distributable reserves for dividend payments and share repurchases, our ability to successfully integrate Cymer, and other risks indicated in the risk factors included in ASML’s Annual Report on Form 20-F and other filings with the US Securities and Exchange Commission
ASML
Public
Slide 3
16 April 2014
Business summary
Business environment
Outlook
ASML technology status
ASML
Public
Slide 4
16 April 2014
Business summary
ASML
Public
Slide 5
16 April 2014
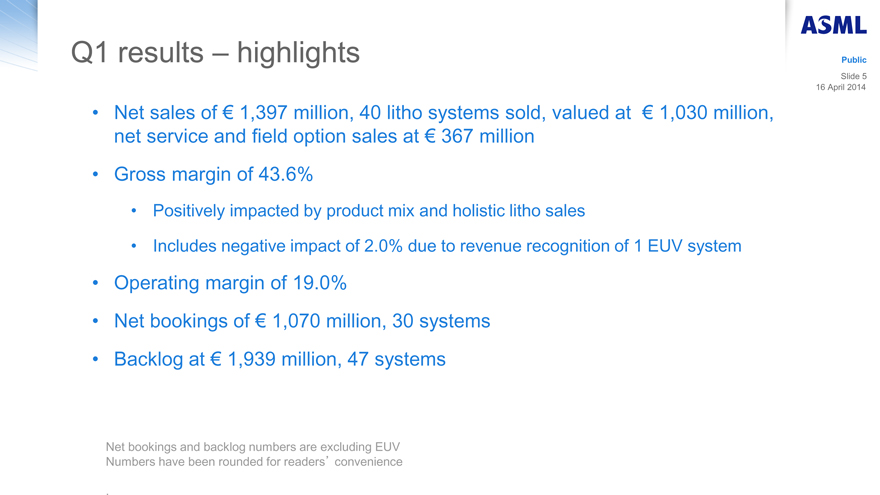
Q1 results – highlights
Net sales of € 1,397 million, 40 litho systems sold, valued at € 1,030 million, net service and field option sales at € 367 million
Gross margin of 43.6%
Positively impacted by product mix and holistic litho sales
Includes negative impact of 2.0% due to revenue recognition of 1 EUV system
Operating margin of 19.0%
Net bookings of € 1,070 million, 30 systems
Backlog at € 1,939 million, 47 systems
Net bookings and backlog numbers are excluding EUV Numbers have been rounded for readers’ convenience
ASML
Public
Slide 6
16 April 2014
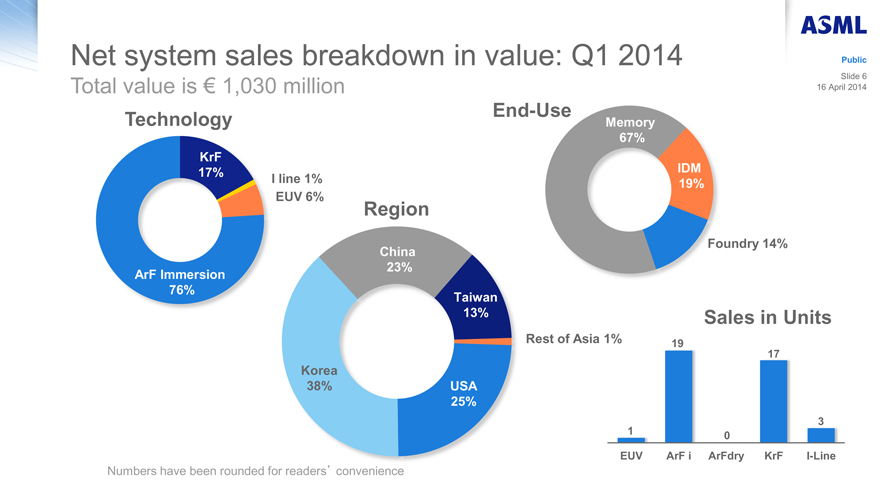
Net system sales breakdown in value: Q1 2014
Total value is € 1,030 million
Technology KrF 17% ArF Immersion 76% I line 1% EUV 6%
Korea 38% Region China 23% Taiwan 13% USA 25% Rest of Asia 1%
End-Use Memory 67% IDM 19% Foundry 14%
1 EUV Sales in Units 19 17 3 0 ArF i ArFdry KrF I-Line
Numbers have been rounded for readers’ convenience
ASML
Public
Slide 7
16 April 2014
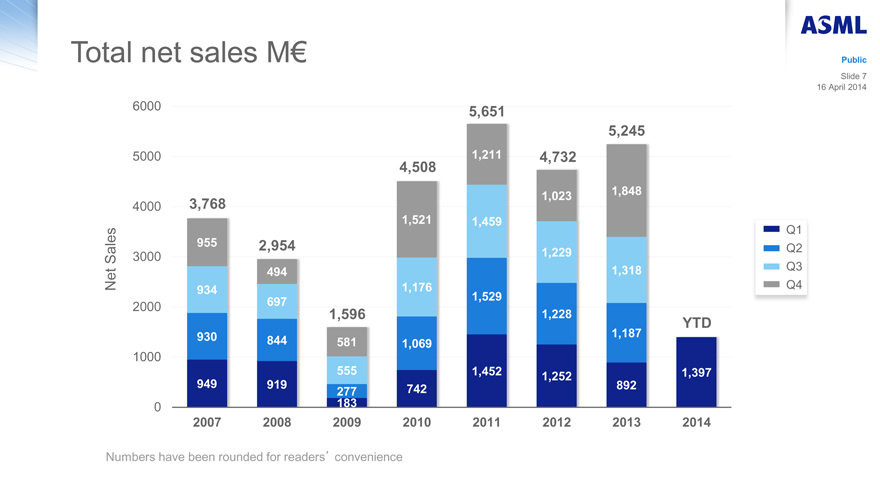
Total net sales M€
6000 3,768 2,954 1,596 4,508 5,651 4,732 5,245 YTD
5000 955 494 1,521 1,176 1,459 1,229 1,318 1,211 1,023 1,848
4000 3000 2000 1000
Q1 Q2 Q3 Q4
Net Sales
934 1,529 697
1,228 930 844 581 1,069 1,187 555
949 919 277 742 1,452 1,252 892 1,397 183
0 2007 2008 2009 2010 2011 2012 2013 2014
Numbers have been rounded for readers’ convenience
ASML
Public
Slide 8
16 April 2014
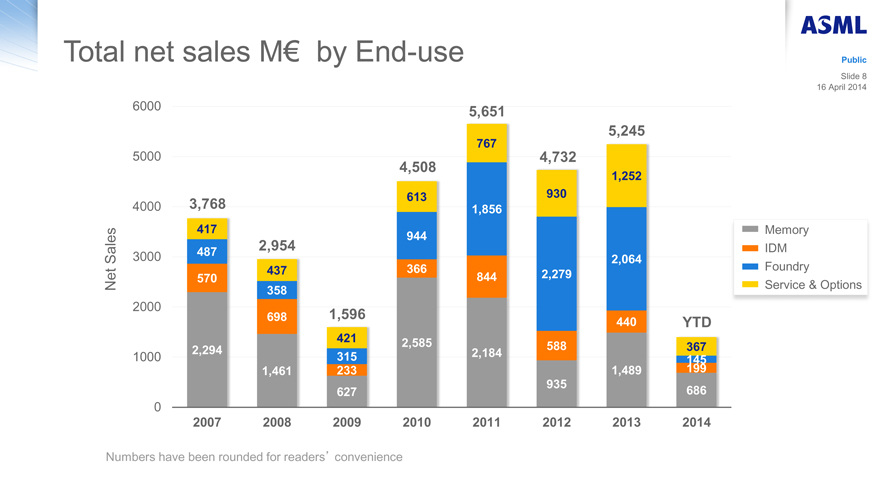
Total net sales M€ by End-use
Net Sales
6000 5000 4000 3000 2000 1000 0
3,768 417 487 570 2,294 2007
2,954 437 358 698 1,461 2008
1,596 421 315 233 627 2009
4,508 613 944 366 2,585 2010
5,651 767 1,856 844 2,184 2011
4,732 930 2,279 588 935 2012
5,245 1,252 2,064 440 1,489 2013
YTD 145 367 199 686 2014
Memory IDM Foundry Service & Options
Numbers have been rounded for readers’ convenience
ASML
Public
Slide 9
16 April 2014
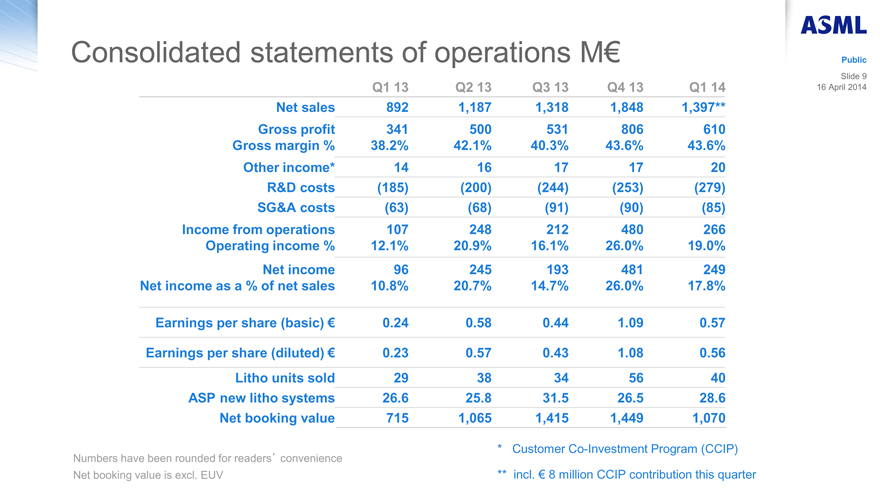
Consolidated statements of operations M€
Q1 13 Q2 13 Q3 13 Q4 13 Q1 14
Net sales 892 1,187 1,318 1,848 1,397**
Gross profit 341 500 531 806 610
Gross margin % 38.2% 42.1% 40.3% 43.6% 43.6%
Other income* 14 16 17 17 20
R&D costs (185) (200) (244) (253) (279)
SG&A costs (63) (68) (91) (90) (85)
Income from operations 107 248 212 480 266
Operating income % 12.1% 20.9% 16.1% 26.0% 19.0%
Net income 96 245 193 481 249
Net income as a % of net sales 10.8% 20.7% 14.7% 26.0% 17.8%
Earnings per share (basic) € 0.24 0.58 0.44 1.09 0.57
Earnings per share (diluted) € 0.23 0.57 0.43 1.08 0.56
Litho units sold 29 38 34 56 40
ASP new litho systems 26.6 25.8 31.5 26.5 28.6
Net booking value 715 1,065 1,415 1,449 1,070
Numbers have been rounded for readers’ convenience Net booking value is excl. EUV
* Customer Co-Investment Program (CCIP)
** incl. € 8 million CCIP contribution this quarter
ASML
Public
Slide 10
16 April 2014
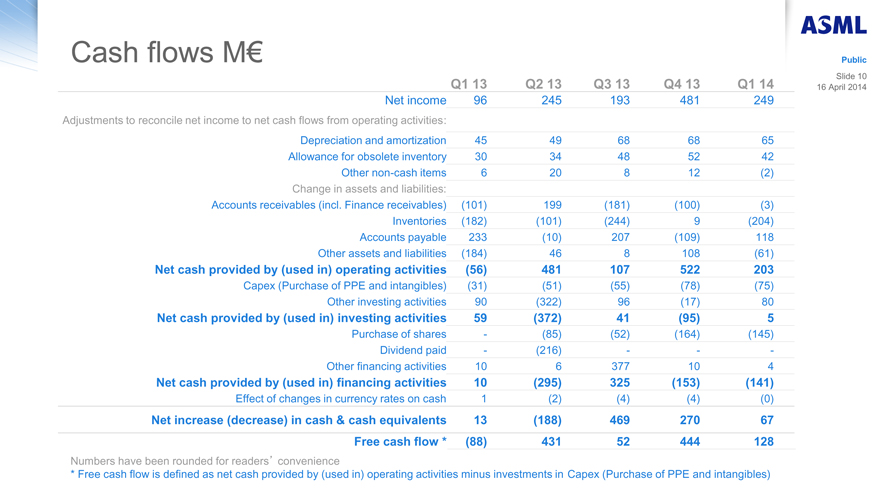
Cash flows M€
Q1 13 Q2 13 Q3 13 Q4 13 Q1 14
Net income 96 245 193 481 249
Adjustments to reconcile net income to net cash flows from operating activities:
Depreciation and amortization 45 49 68 68 65
Allowance for obsolete inventory 30 34 48 52 42
Other non-cash items 6 20 8 12 (2)
Change in assets and liabilities:
Accounts receivables (incl. Finance receivables) (101) 199 (181) (100) (3)
Inventories (182) (101) (244) 9 (204)
Accounts payable 233 (10) 207 (109) 118
Other assets and liabilities (184) 46 8 108 (61)
Net cash provided by (used in) operating activities (56) 481 107 522 203
Capex (Purchase of PPE and intangibles) (31) (51) (55) (78) (75)
Other investing activities 90 (322) 96 (17) 80
Net cash provided by (used in) investing activities 59 (372) 41 (95) 5
Purchase of shares — (85) (52) (164) (145)
Dividend paid — (216) — — —
Other financing activities 10 6 377 10 4
Net cash provided by (used in) financing activities 10 (295) 325 (153) (141)
Effect of changes in currency rates on cash 1 (2) (4) (4) (0)
Net increase (decrease) in cash & cash equivalents 13 (188) 469 270 67
Free cash flow * (88) 431 52 444 128
Numbers have been rounded for readers’ convenience
* Free cash flow is defined as net cash provided by (used in) operating activities minus investments in Capex (Purchase of PPE and intangibles)
ASML
Public
Slide 11
16 April 2014
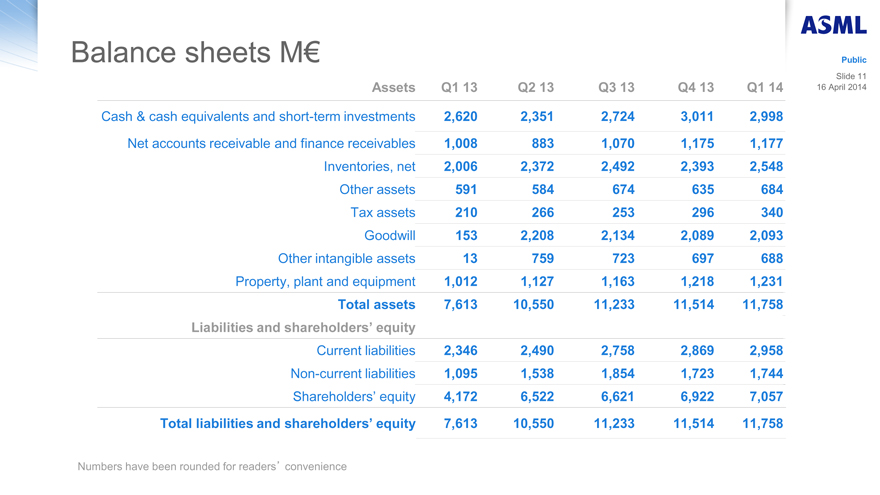
Balance sheets M€
Assets Q1 13 Q2 13 Q3 13 Q4 13 Q1 14
Cash & cash equivalents and short-term investments 2,620 2,351 2,724 3,011 2,998
Net accounts receivable and finance receivables 1,008 883 1,070 1,175 1,177
Inventories, net 2,006 2,372 2,492 2,393 2,548
Other assets 591 584 674 635 684
Tax assets 210 266 253 296 340
Goodwill 153 2,208 2,134 2,089 2,093
Other intangible assets 13 759 723 697 688
Property, plant and equipment 1,012 1,127 1,163 1,218 1,231
Total assets 7,613 10,550 11,233 11,514 11,758
Liabilities and shareholders’ equity
Current liabilities 2,346 2,490 2,758 2,869 2,958
Non-current liabilities 1,095 1,538 1,854 1,723 1,744
Shareholders’ equity 4,172 6,522 6,621 6,922 7,057
Total liabilities and shareholders’ equity 7,613 10,550 11,233 11,514 11,758
Numbers have been rounded for readers’ convenience
ASML
Public
Slide 12
16 April 2014
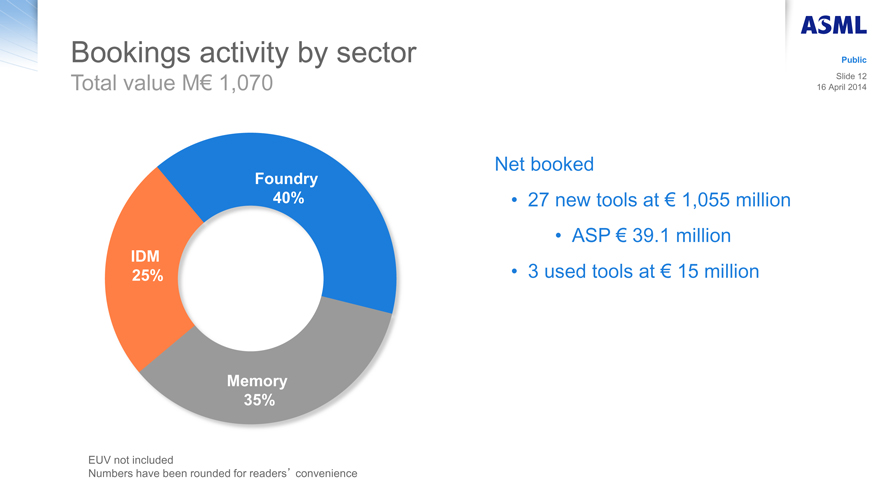
Bookings activity by sector
Total value M€ 1,070
Foundry
40%
IDM
25%
Memory
35%
EUV not included
Numbers have been rounded for readers’ convenience
Net booked
27 new tools at € 1,055 million
ASP € 39.1 million
3 used tools at € 15 million
ASML
Public
Slide 13
16 April 2014
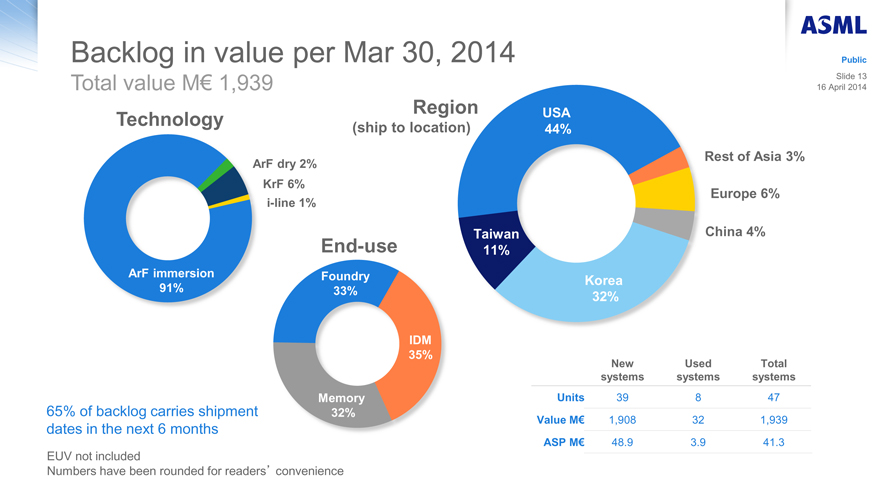
Backlog in value per Mar 30, 2014
Total value M€ 1,939
Technology
ArF dry 2%
KrF 6%
i-line 1%
ArF immersion
91%
End-use
Foundry
33%
IDM
35%
Memory
32%
Region USA 44%
(ship to location)
Rest of Asia 3%
Europe 6%
Taiwan 11% China 4%
Korea
32%
65% of backlog carries shipment dates in the next 6 months
EUV not included
Numbers have been rounded for readers’ convenience
New systems Used systems Total systems
Units 39 8 47
Value M€ 1,908 32 1,939
ASP M€ 48.9 3.9 41.3
ASML
Public
Slide 14
16 April 2014
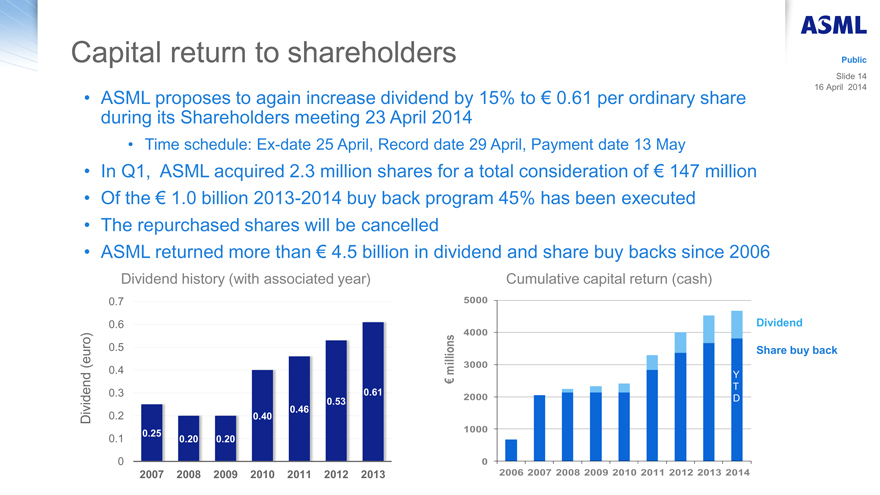
Capital return to shareholders
ASML proposes to again increase dividend by 15% to € 0.61 per ordinary share during its Shareholders meeting 23 April 2014
Time schedule: Ex-date 25 April, Record date 29 April, Payment date 13 May
In Q1, ASML acquired 2.3 million shares for a total consideration of € 147 million
Of the € 1.0 billion 2013-2014 buy back program 45% has been executed
The repurchased shares will be cancelled
ASML returned more than € 4.5 billion in dividend and share buy backs since 2006
Dividend history (with associated year)
Dividend (euro)
0.7
0.6
0.5
0.4
0.3
0.2
0.1
0
0.25
0.20
0.20
0.40
0.46
0.53
0.61
2007 2008 2009 2010 2011 2012 2013
Cumulative capital return (cash)
€ millions
5000
4000
3000
2000
1000
0
2006 2007 2008 2009 2010 2011 2012 2013 2014
Dividend
Share buy back
Y
T
D
ASML
Public
Slide 15
16 April 2014
Business environment
ASML
Public
Slide 16
16 April 2014
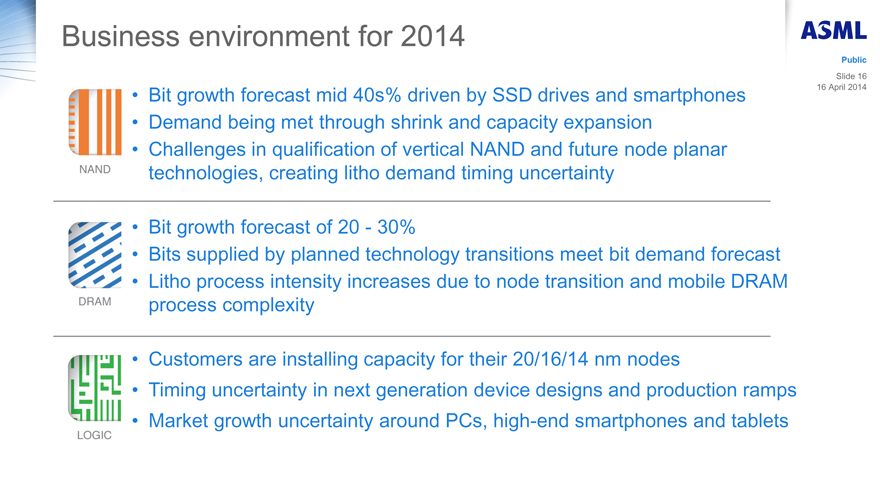
Business environment for 2014
Bit growth forecast mid 40s% driven by SSD drives and smartphones
Demand being met through shrink and capacity expansion
Challenges in qualification of vertical NAND and future node planar technologies, creating litho demand timing uncertainty
NAND
Bit growth forecast of 20 - 30%
Bits supplied by planned technology transitions meet bit demand forecast
Litho process intensity increases due to node transition and mobile DRAM process complexity
DRAM
Customers are installing capacity for their 20/16/14 nm nodes
Timing uncertainty in next generation device designs and production ramps
Market growth uncertainty around PCs, high-end smartphones and tablets
LOGIC
ASML
Public
Slide 17
16 April 2014
ASML business status
Net sales in Q2 is expected to be affected by:
Adjustment for system demand from some Logic customers
This means H1 2014 net sales will be around € 3 billion including EUV
ASML
Public
Slide 18
16 April 2014
Outlook
ASML
Public
Slide 19
16 April 2014
Outlook
Q2 net sales around € 1.6 billion, including EUV
Gross margin around 44 - 45%, including EUV
R&D costs of about € 270 million
SG&A costs of about € 85 million
Other income (Customer Co-Investment Program) of about € 20 million
Q3 net sales around € 1.4 billion, including EUV
3 EUV systems to be revenue recognized in Q2 + Q3 combined
ASML
Public
Slide 20
16 April 2014
ASML technology status
ASML
Public
Slide 21
16 April 2014
EUV – progress toward production insertion
Multiple customers are qualifying EUV for insertion at the 10 nm logic node
For process development, customers typically require 100 wafers per day, increasing to 500 wafers per day on average for production qualification
We have provided customers with process development capability
In 2016 we will provide our customers with the productivity needed for volume production
Our target is to recognize a total of 8 EUV systems in revenue this year
ASML
Public
Slide 22
16 April 2014
Product highlights
We shipped our fourth NXE:3300B EUV system to the fourth customer and recognized 1 EUV system in Q1 sales
Shipments of our TWINSCAN NXT:1970Ci immersion system continue to ramp, with 24 systems in the backlog at the end of Q1, underscoring the rapid customer adoption
We have expanded our TWINSCAN NXT portfolio to include the NXT:1965Ci, which will provide the optimum cost of ownership on a common platform and which will be upgradeable to the performance of the NXT:1970Ci and its successor
Adoption of YieldStar as well as the associated Holistic Lithography products is broadening in 20 nm logic manufacturing and is now also expanding to memory manufacturers

ASML