|
Exhibit 99.2 
|
Public
ASML confirms full-year sales guidance, supported by solid backlog
ASML 2014 Third Quarter Results
Veldhoven, the Netherlands
October 15, 2014
Forward looking statements
Public
Slide 2
15 October 2014
This document contains statements relating to certain projections and business trends that are forward-looking, including statements with respect to our outlook, expected customer demand in specified market segments, expected sales levels and trends, systems backlog, IC unit demand, expected financial results, gross margin and expenses, expected shipment of tools, productivity of our tools and systems performance, including EUV system performance (such as endurance tests), the development of EUV technology and the number of EUV systems expected to be shipped and timing of shipments, dividend policy and intention to repurchase shares.
You can generally identify these statements by the use of words like “may”, “will”, “could”, “should”, “project”, “believe”, “anticipate”, “expect”, “plan”, “estimate”, “forecast”, “potential”, “intend”, “continue” and variations of these words or comparable words. These statements are not historical facts, but rather are based on current expectations, estimates, assumptions and projections about the business and our future financial results and readers should not place undue reliance on them. Forward-looking statements do not guarantee future performance and involve risks and uncertainties. These risks and uncertainties include, without limitation, economic conditions, product demand and semiconductor equipment industry capacity, worldwide demand and manufacturing capacity utilization for semiconductors (the principal product of our customer base), including the impact of general economic conditions on consumer confidence and demand for our customers’ products, competitive products and pricing, the impact of manufacturing efficiencies and capacity constraints, performance of our systems, the continuing success of technology advances and the related pace of new product development and customer acceptance of new products, the number and timing of EUV systems expected to be shipped, our ability to enforce patents and protect intellectual property rights, the risk of intellectual property litigation, availability of raw materials and critical manufacturing equipment, trade environment, changes in exchange rates, available cash, distributable reserves for dividend payments and share repurchases, risks associated with the Cymer acquisition and other risks indicated in the risk factors included in ASML’s Annual Report on Form 20-F and other filings with the US Securities and Exchange Commission. These forward-looking statements are made only as of the date of this document. We do not undertake to update or revise the forward-looking statements, whether as a result of new information, future events or otherwise.
|
|
Public
Slide 3
15 October 2014
Agenda
Public
Slide 4
15 October 2014
Business summary
Q3 results – highlights
Public
Slide 5
15 October 2014
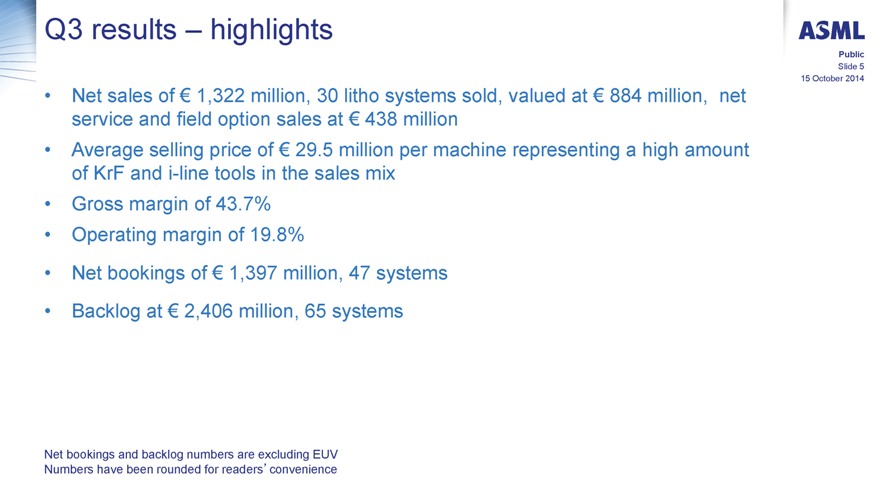
• | | Net sales of € 1,322 million, 30 litho systems sold, valued at € 884 million, net service and field option sales at € 438 million |
• | | Average selling price of € 29.5 million per machine representing a high amount of KrF and i-line tools in the sales mix |
• | | Operating margin of 19.8% |
• | | Net bookings of € 1,397 million, 47 systems |
• | | Backlog at € 2,406 million, 65 systems |
Net bookings and backlog numbers are excluding EUV Numbers have been rounded for readers’convenience
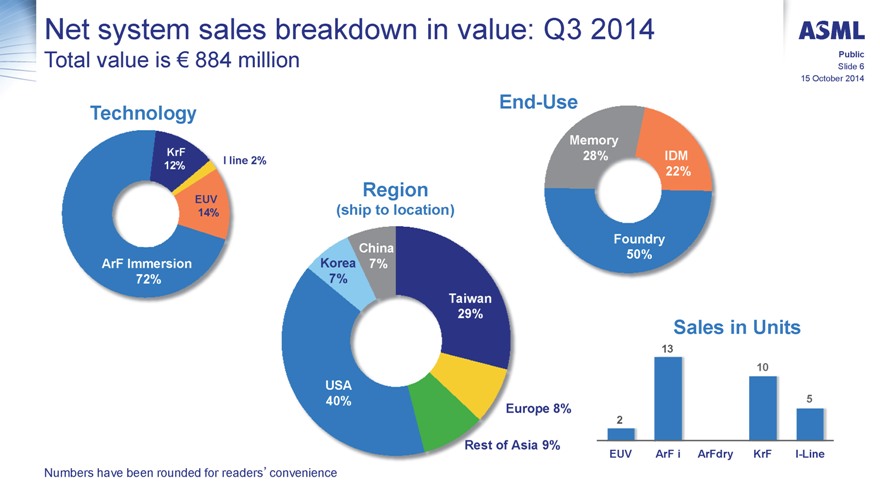
Net system sales breakdown in value: Q3 2014
Total value is € 884 million
Public
Slide 6
15 October 2014
Technology End-Use
Memory
KrF I line 2% 28% IDM
12% 22%
EUV Region
14%(ship to location)
Foundry
China 50%
ArF Immersion Korea 7%
72% 7%
Taiwan
29%
Sales in Units
USA
40% 5
Europe 8%
Rest of Asia 9%
EUV ArF i ArFdry KrF I-Line
Numbers have been rounded for readers’convenience
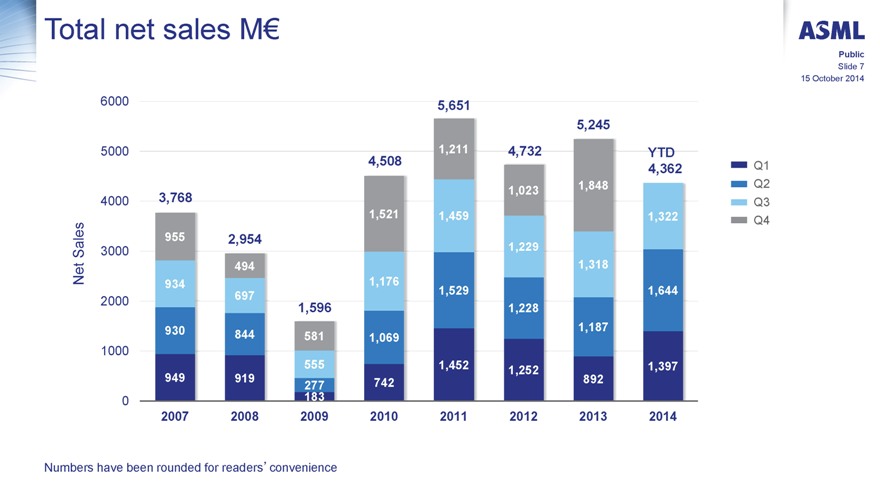
Total net sales M€
Public
Slide 7
15 October 2014
6000 5,651
5,245
5000 1,211 4,732 YTD
4,508 4,362 Q1
1,023 1,848 Q2
4000 3,768 Q3
1,521 1,459 1,322 Q4
ales 955 2,954
S 3000 1,229
494 1,318
Net 934 1,176
2000 697 1,529 1,644
1,596 1,228
930 844 581 1,069 1,187,
1000
555 1,452 1,252 1,397
949 919 277 742 892
0 183
2007 2008 2009 2010 2011 2012 2013 2014
Numbers have been rounded for readers’convenience
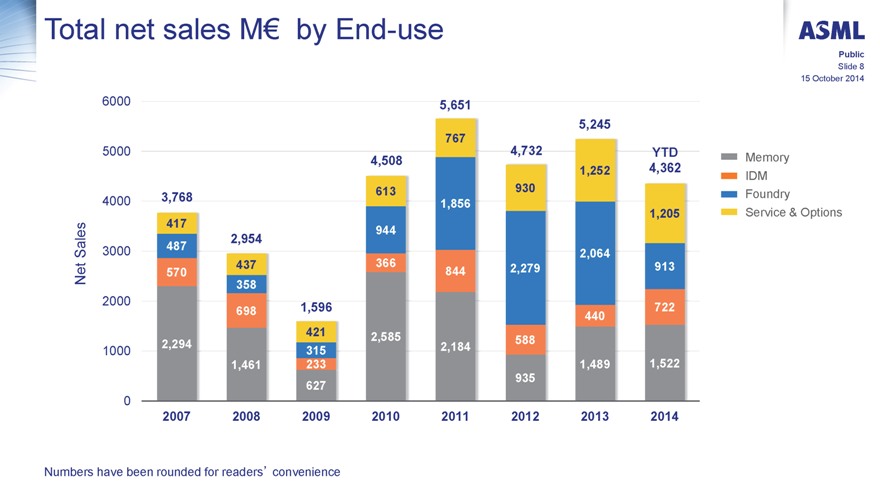
Total net sales M€ by End-use
Public
Slide 8
15 October 2014
15 October
6000 5,651
5,245
767
5000 4,732 YTD
4,508 Memory
1,252 4,362 IDM
4000 3,768 613 1,856 930 Foundry
1,205 Service & Options
417 944
ales 2,954
S 3000 487 2,064
570 437 366 844 2,279 913
Net 358
2000 698 1,596 722
440
421 2,585 588
1000 2,294 315 2,184
1,461 233 1,489 1,522
627 935
0
2007 2008 2009 2010 2011 2012 2013 2014
Numbers have been rounded for readers’convenience
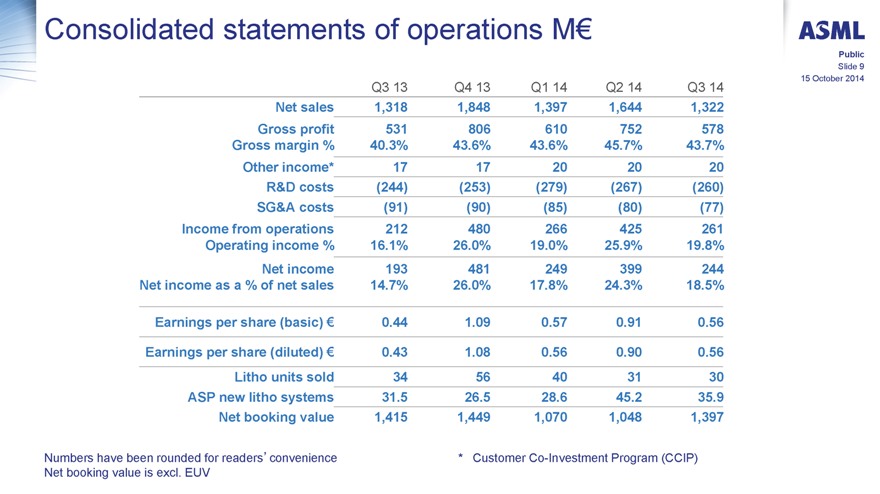
Consolidated statements of operations M€
Public
Slide 9
15 October 2014
Q3 13 Q4 13 Q1 14 Q2 14 Q3 14
Net sales 1,318 1,848 1,397 1,644 1,322
Gross profit 531 806 610 752 578
Gross margin % 40.3% 43.6% 43.6% 45.7% 43.7%
Other income* 17 17 20 20 20
R&D costs (244) (253) (279) (267) (260)
SG&A costs (91) (90) (85) (80) (77)
Income from operations 212 480 266 425 261
Operating income % 16.1% 26.0% 19.0% 25.9% 19.8%
Net income 193 481 249 399 244
Net income as a % of net sales 14.7% 26.0% 17.8% 24.3% 18.5%
Earnings per share (basic) € 0.44 1.09 0.57 0.91 0.56
Earnings per share (diluted) € 0.43 1.08 0.56 0.90 0.56
Litho units sold 34 56 40 31 30
ASP new litho systems 31.5 26.5 28.6 45.2 35.9
Net booking value 1,415 1,449 1,070 1,048 1,397
Numbers have been rounded for readers’convenience Net booking value is excl. EUV
* | | Customer Co-Investment Program (CCIP) |
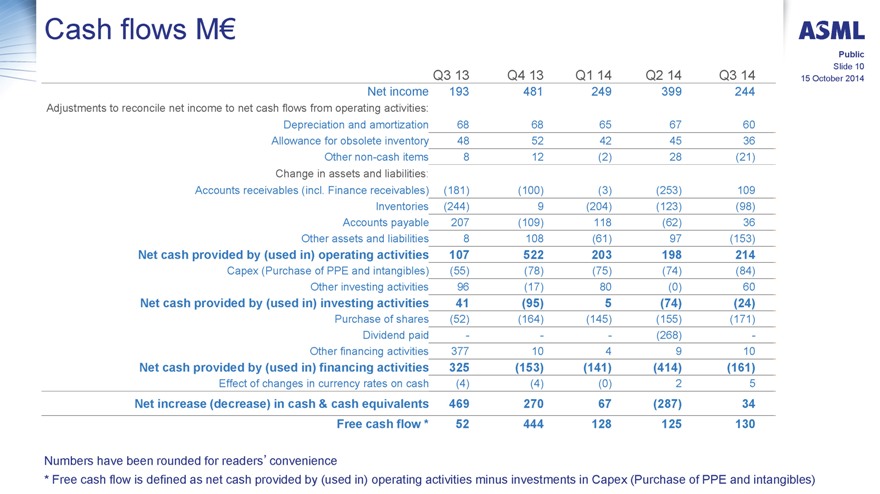
Cash flows M€
Public
Slide 10
15 October 2014
Q3 13 Q4 13 Q1 14 Q2 14 Q3 14
Net income 193 481 249 399 244
Adjustments to reconcile net income to net cash flows from operating activities:
Depreciation and amortization 68 68 65 67 60
Allowance for obsolete inventory 48 52 42 45 36
Other non-cash items 8 12 (2) 28 (21)
Change in assets and liabilities:
Accounts receivables (incl. Finance receivables) (181) (100) (3) (253) 109
Inventories (244) 9 (204) (123) (98)
Accounts payable 207 (109) 118 (62) 36
Other assets and liabilities 8 108 (61) 97 (153)
Net cash provided by (used in) operating activities 107 522 203 198 214
Capex (Purchase of PPE and intangibles) (55) (78) (75) (74) (84)
Other investing activities 96 (17) 80 (0) 60
Net cash provided by (used in) investing activities 41 (95) 5 (74) (24)
Purchase of shares (52) (164) (145) (155) (171)
Dividend paid ——— (268) -
Other financing activities 377 10 4 9 10
Net cash provided by (used in) financing activities 325 (153) (141) (414) (161)
Effect of changes in currency rates on cash (4) (4) (0) 2 5
Net increase (decrease) in cash & cash equivalents 469 270 67 (287) 34
Free cash flow * 52 444 128 125 130
Numbers have been rounded for readers’convenience
* Free cash flow is defined as net cash provided by (used in) operating activities minus investments in Capex (Purchase of PPE and intangibles)
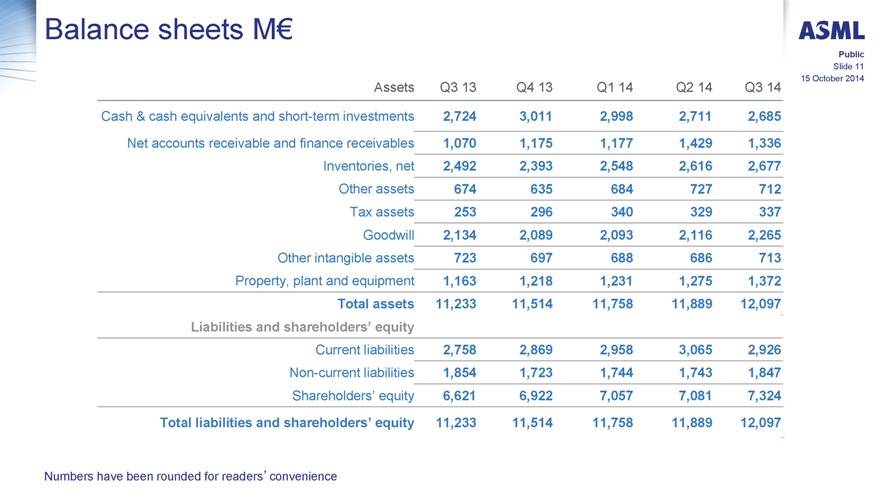
Balance sheets M€
Public
Slide 11
15 October 2014
Assets Q3 13 Q4 13 Q1 14 Q2 14 Q3 14
Cash & cash equivalents and short-term investments 2,724 3,011 2,998 2,711 2,685
Net accounts receivable and finance receivables 1,070 1,175 1,177 1,429 1,336
Inventories, net 2,492 2,393 2,548 2,616 2,677
Other assets 674 635 684 727 712
Tax assets 253 296 340 329 337
Goodwill 2,134 2,089 2,093 2,116 2,265
Other intangible assets 723 697 688 686 713
Property, plant and equipment 1,163 1,218 1,231 1,275 1,372
Total assets 11,233 11,514 11,758 11,889 12,097
Liabilities and shareholders’ equity
Current liabilities 2,758 2,869 2,958 3,065 2,926
Non-current liabilities 1,854 1,723 1,744 1,743 1,847
Shareholders’ equity 6,621 6,922 7,057 7,081 7,324
Total liabilities and shareholders’ equity 11,233 11,514 11,758 11,889 12,097
Numbers have been rounded for readers’convenience
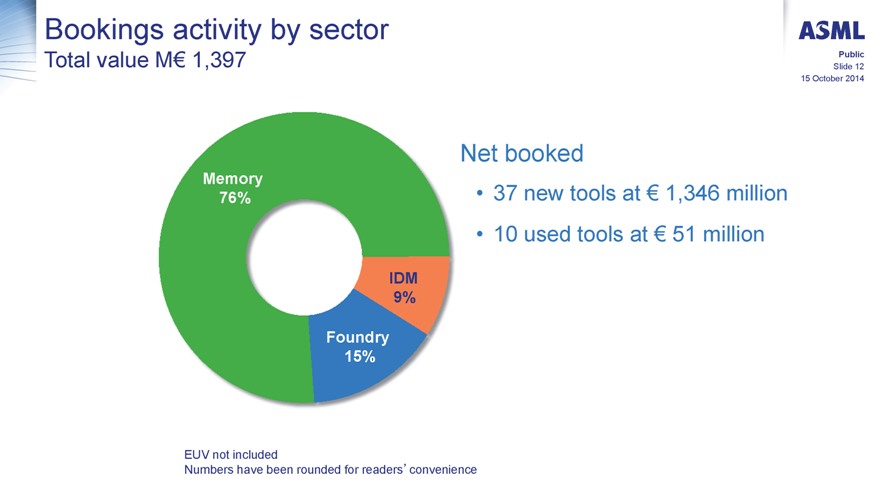
Bookings activity by sector
Total value M€ 1,397
Public
Slide 12
15 October 2014
Net booked
37 new tools at € 1,346 million
10 used tools at € 51 million
Memory 76%
IDM 9%
Foundry 15%EUV not included
Numbers have been rounded for readers’convenience
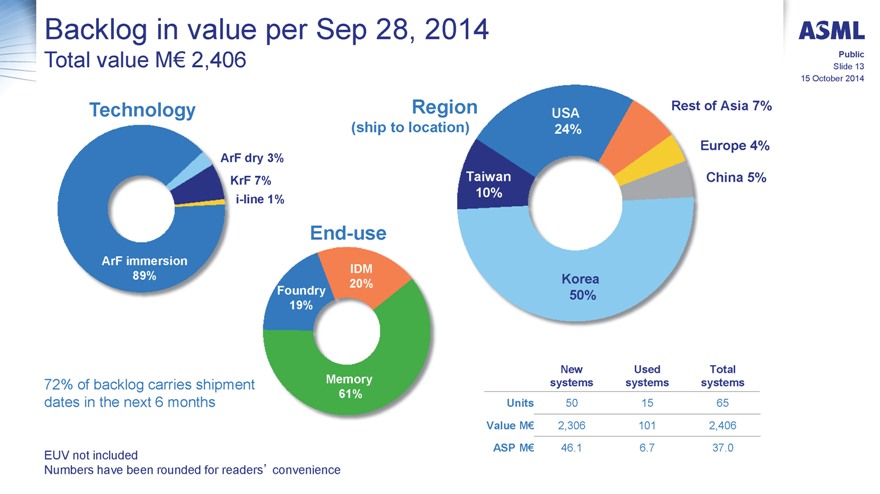
Backlog in value per Sep 28, 2014
Total value M€ 2,406
Public
Slide 13
15 October 2014
Technology Region USA Rest of Asia 7%
(ship to location) 24%
Europe 4%
ArF dry 3%
KrF 7% Taiwan China 5%
i-line 1% 10%
End-use
ArF immersion IDM
89% 20% Korea
Foundry 50%
19%
New Used Total
72% of backlog carries shipment Memory systems systems systems
61%
dates in the next 6 months Units 50 15 65
Value M€ 2,306 101 2,406
EUV not included ASP M€ 46.1 6.7 37.0
Numbers have been rounded for readers’ convenience
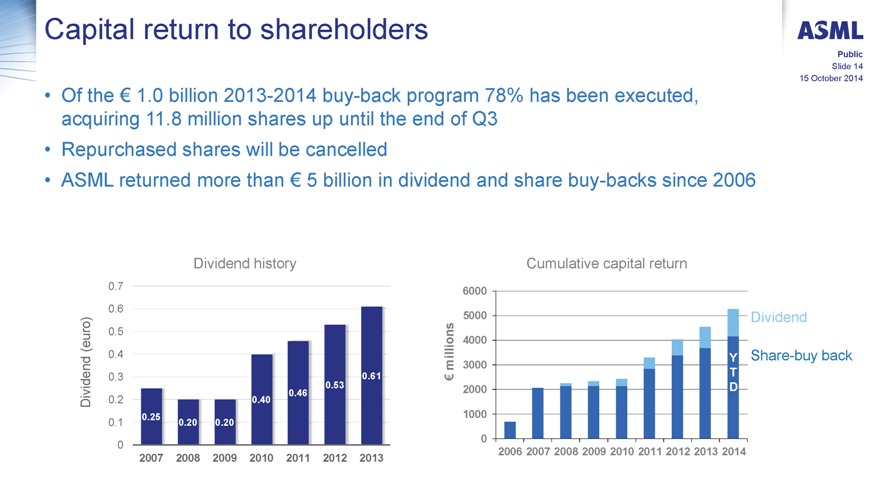
Capital return to shareholders
Of the € 1.0 billion 2013-2014 buy-back program 78% has been executed, acquiring 11.8 million shares up until the end of Q3
Repurchased shares will be cancelled
ASML returned more than € 5 billion in dividend and share buy-backs since 2006
Public
Slide 14
15 October 2014
Dividend history Cumulative capital return
0.7 6000
0.6
o) s 5000 Dividend
0.5
(eur 4000
0.4 Y Share-buy back
million 3000
0.3 0.61 € T
0.46 0.53 2000 D
Dividend 0.2 0.40
0.25 1000
0.1 0.20 0.20
0 0
2007 2008 2009 2010 2011 2012 2013 2006 2007 2008 2009 2010 2011 2012 2013 2014
Public
Slide 15
15 October 2014
Business environment
Business environment
Public
Slide 16
15 October 2014
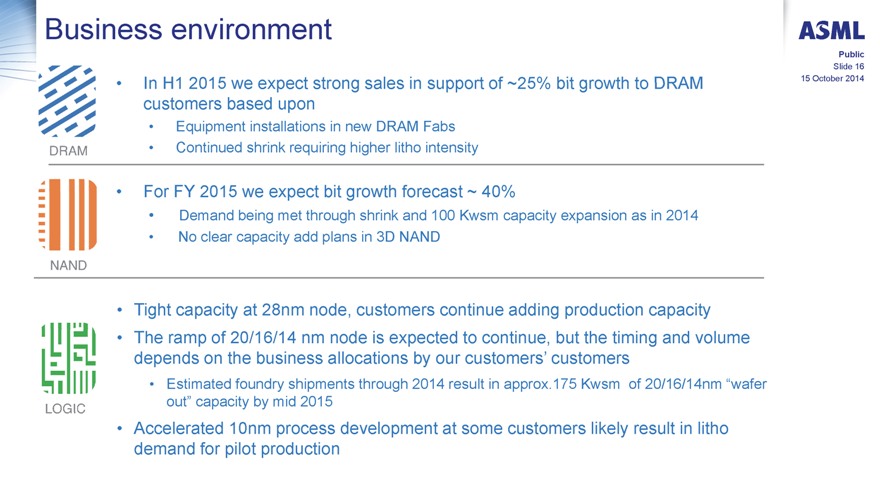
In H1 2015 we expect strong sales in support of ~25% bit growth to DRAM
customers based upon
Equipment installations in new DRAM Fabs
Continued shrink requiring higher litho intensity
For FY 2015 we expect bit growth forecast ~ 40%
Demand being met through shrink and 100 Kwsm capacity expansion as in 2014
No clear capacity add plans in 3D NAND
Tight capacity at 28nm node, customers continue adding production capacity
The ramp of 20/16/14 nm node is expected to continue, but the timing and volume
depends on the business allocations by our customers’ customers
Estimated foundry shipments through 2014 result in approx.175 Kwsm of 20/16/14nm “wafer
out” capacity by mid 2015
Accelerated 10nm process development at some customers likely result in litho
demand for pilot production
Public
Slide 17
15 October 2014
Outlook
Outlook
Public
Slide 18
15 October 2014
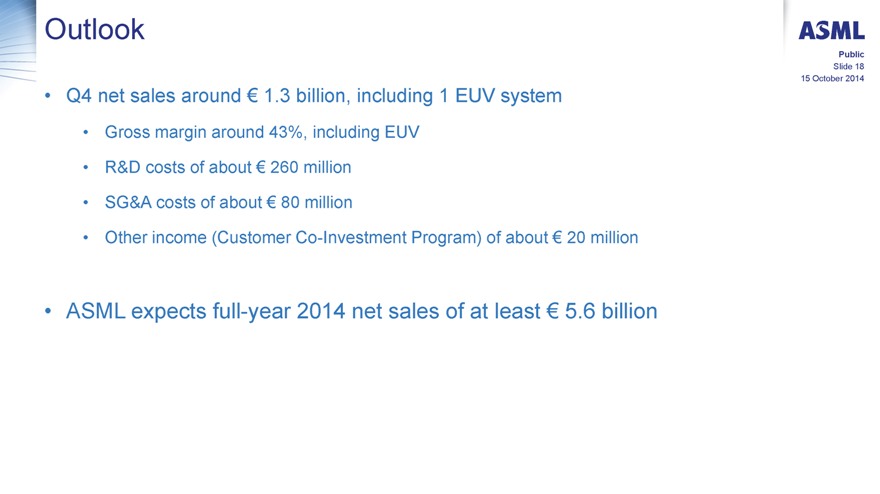
Q4 net sales around € 1.3 billion, including 1 EUV system
Gross margin around 43%, including EUV
R&D costs of about € 260 million
SG&A costs of about € 80 million
Other income (Customer Co-Investment Program) of about € 20 million
ASML expects full-year 2014 net sales of at least € 5.6 billion
Public
Slide 19
15 October 2014
ASML technology status
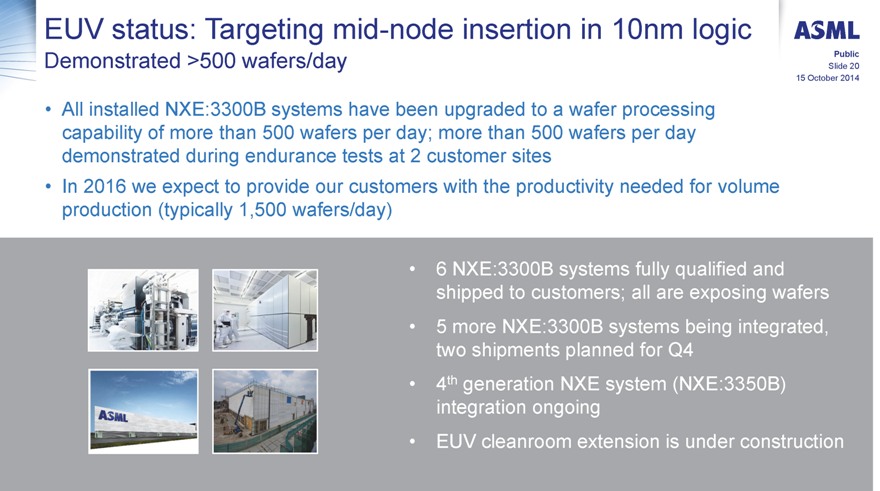
EUV status: Targeting mid-node insertion in 10nm logic
Demonstrated >500 wafers/day
All installed NXE:3300B systems have been upgraded to a wafer processing capability of more than 500 wafers per day; more than 500 wafers per day demonstrated during endurance tests at 2 customer sites
In 2016 we expect to provide our customers with the productivity needed for volume production (typically 1,500 wafers/day)
Public
Slide 20
15 October 2014
6 NXE:3300B systems fully qualified and shipped to customers; all are exposing wafers
5 more NXE:3300B systems being integrated, two shipments planned for Q4
4th generation NXE system (NXE:3350B) integration ongoing
EUV cleanroom extension is under construction
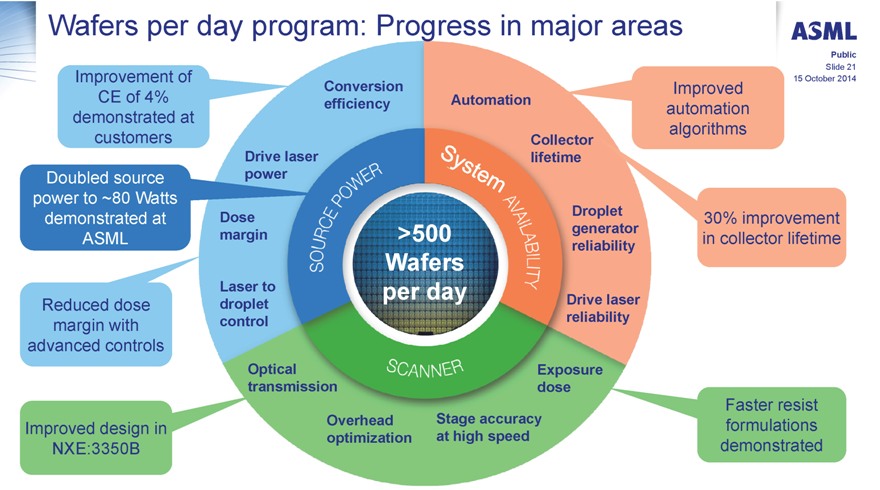
Wafers per day program: Progress in major areas
Public
Slide 21
15 October 2014
Improvement of
Conversion Improved
CE of 4% efficiency Automation automation
demonstrated at
customers Collector algorithms
Drive laser lifetime
Doubled source power
power to ~80 Watts
demonstrated at Dose Droplet 30% improvement
ASML margin >500 generator in collector lifetime
reliability
Wafers
Laser to per day
Reduced dose droplet Drive laser
margin with control reliability
advanced controls
Optical Exposure
transmission dose
Faster resist
Improved design in Overhead Stage accuracy formulations
optimization at high speed
NXE:3350B demonstrated
EUV towards production insertion
Public
Slide 22
15 October 2014
We are working with a customer towards a mid-node insertion of EUV at the 10nm logic node in late 2016
Other customers are preparing for initial learning in a manufacturing environment with expected shipments also starting in 2015
In this scenario we expect to ship around 6 NXE:3350B systems starting mid 2015 on top of the 3 NXE:3300B systems that will be converted to NXE:3350B configuration
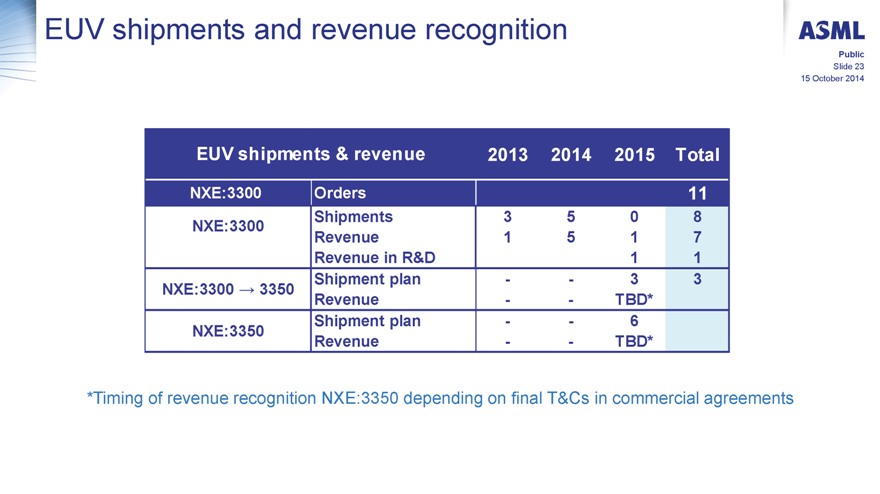
EUV shipments and revenue recognition
Public
Slide 23
15 October 2014
EUV shipments & revenue 2013 2014 2015 Total
NXE:3300 Orders 11
NXE:3300 Shipments 3 5 0 8
Revenue 1 5 1 7
Revenue in R&D 1 1
NXE:3300 ? 3350 Shipment plan — 3 3
Revenue — TBD*
Shipment plan — 6
NXE:3350 Revenue — TBD*
*Timing of revenue recognition NXE:3350 depending on final T&Cs in commercial agreements
Product highlights
Public
Slide 24
15 October 2014
We shipped 12 of our most advanced immersion lithography systems, the
TWINSCAN NXT:1970Ci, bringing the total to 42 and marking our fastest ramp of
any new major product and customer recognition of the value offered by the
scanner
A TWINSCAN system in operation at a memory manufacturer imaged more than
1.5 million wafers within one year, making it the second system to achieve that
milestone
With 11 shipments in Q3, the YieldStar 250D is now in operation at all key logic
and memory customers
Our integrated metrology solution, which substantially shortens metrology cycle
time and enhances manufacturing yield through feedback loops, was released to
high-volume manufacturing at a large foundry customer
ASML