Exhibit 99.9
Public Business Model and Capital Allocation Strategy Roger Dassen Executive Vice President & Chief Financial Officer
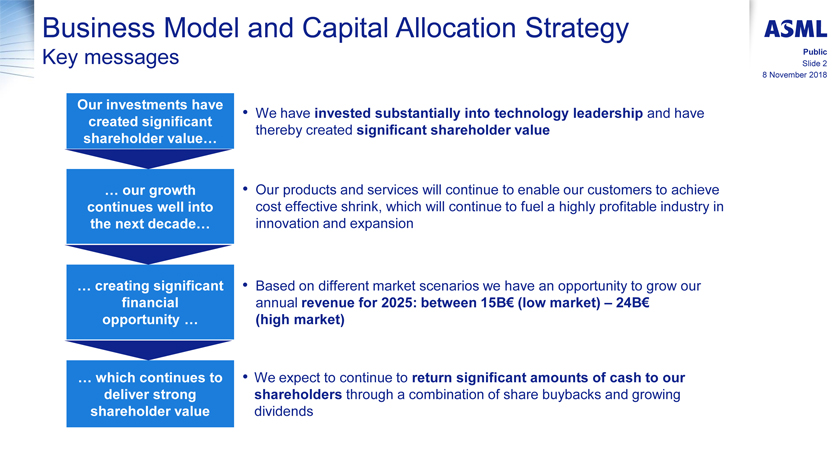
Business Model and Capital Allocation Strategy Key messages Public Slide 2 8 November 2018 Our investments have • We have invested substantially into technology leadership and have created significant thereby created significant shareholder value shareholder value… … our growth • Our products and services will continue to enable our customers to achieve continues well into cost effective shrink, which will continue to fuel a highly profitable industry in the next decade… innovation and expansion … creating significant • Based on different market scenarios we have an opportunity to grow our financial annual revenue for 2025: between 15B€ (low market) – 24B€ opportunity … (high market) … which continues to • We expect to continue to return significant amounts of cash to our deliver strong shareholders through a combination of share buybacks and growing shareholder value dividends

Public Slide 3 8 November 2018 Historical Shareholder value creation
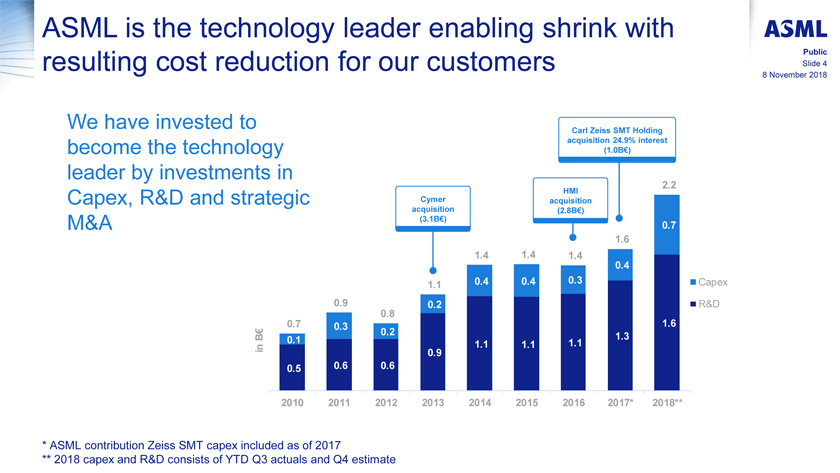
ASML is the technology leader enabling shrink with resulting cost reduction for our customers Public Slide 4 8 November 2018 We have invested to Carl Zeiss SMT Holding acquisition 24.9% interest become the technology (1.0B€) leader by investments in 2.2 HMI Capex, R&D and strategic Cymer acquisition acquisition (2.8B€) (3.1B€) M&A 0.7 1.6 1.4 1.4 1.4 0.4 0.4 0.4 0.3 Capex 1.1 0.9 0.2 R&D 0.8 0.7 0.3 1.6 B € 0.1 0.2 1.3 in 1.1 1.1 1.1 0.9 0.5 0.6 0.6 2010 2011 2012 2013 2014 2015 2016 2017* 2018** * ASML contribution Zeiss SMT capex included as of 2017 ** 2018 capex and R&D consists of YTD Q3 actuals and Q4 estimate
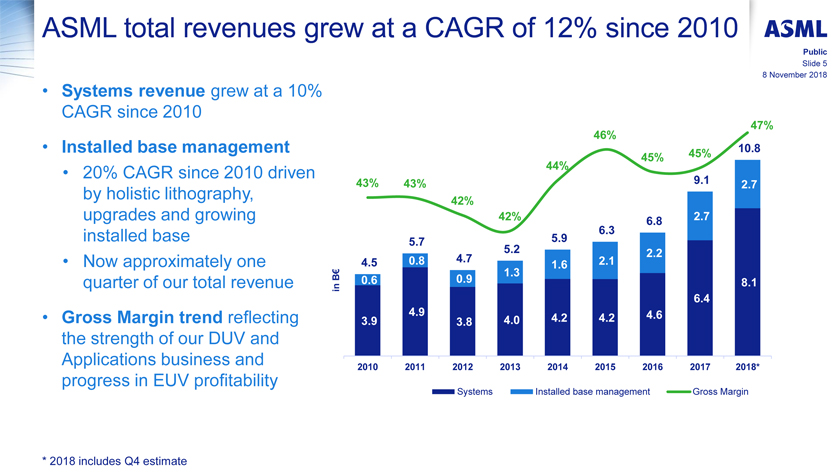
ASML total revenues grew at a CAGR of 12% since 2010 Public Slide 5 8 November 2018 • Systems revenue grew at a 10% CAGR since 2010 12.5 46% 47% • Installed base management 45% 10.8 45% • 20% CAGR since 2010 driven 10.5 44% by holistic lithography, 43% 43% 9.1 2.7 8.5 42% upgrades and growing 42% 6.8 2.7 installed base 6.3 6.5 5.7 5.9 5.2 2.2 • Now approximately one 4.5 0.8 4.7 2.1 € 1.6 4.5 1.3 quarter of our total revenue B 0.6 0.9 8.1 in 6.4 2.5 4.9 4.6 • Gross Margin trend reflecting 3.9 3.8 4.0 4.2 4.2 the strength of our DUV and 0.5 Applications business and 2010 2011 2012 2013 2014 2015 2016 2017 2018* progress in EUV profitability (1.5) Systems Installed base management Gross Margin * 2018 includes Q4 estimate
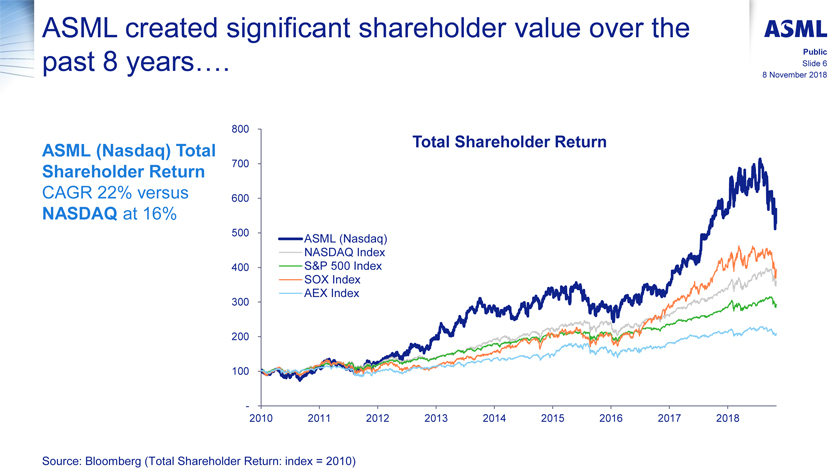
ASML created significant shareholder value over the past 8 years…. Public Slide 6 8 November 2018 800 Total Shareholder Return ASML (Nasdaq) Total Shareholder Return 700 CAGR 22% versus 600 NASDAQ at 16% 500 ASML (Nasdaq) NASDAQ Index 400 S&P 500 Index SOX Index AEX Index 300 200 100 - 2010 2011 2012 2013 2014 2015 2016 2017 2018 Source: Bloomberg (Total Shareholder Return: index = 2010)

Public Slide 7 8 November 2018 Continuing growth
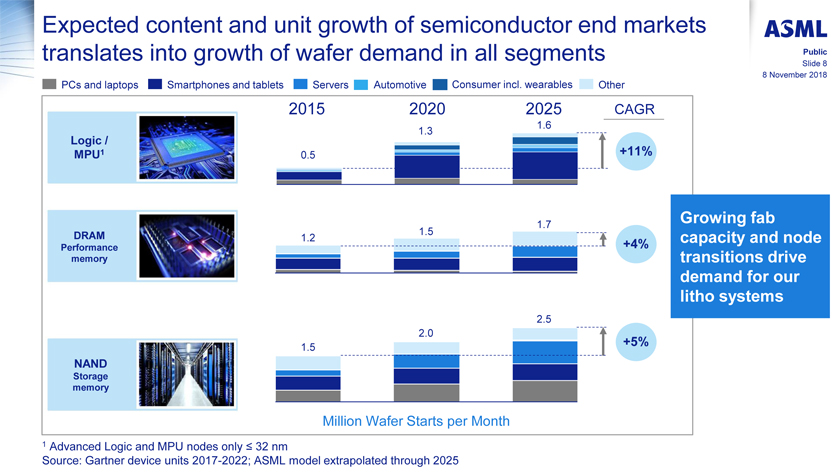
Expected content and unit growth of semiconductor end markets translates into growth of wafer demand in all segments Public Slide 8 8 November 2018 PCs and laptops Smartphones and tablets Servers Automotive Consumer incl. wearables Other 2015 2020 2025 CAGR 1.6 Logic / 1.3 MPU1 0.5 +11% Growing fab 1.7 DRAM 1.5 1.2 capacity and node Performance +4% memory transitions drive demand for our litho systems 2.5 2.0 +5% 1.5 NAND Storage memory Million Wafer Starts per Month 1 Advanced Logic and MPU nodes only£ 32 nm Source: Gartner device units 2017-2022; ASML model extrapolated through 2025
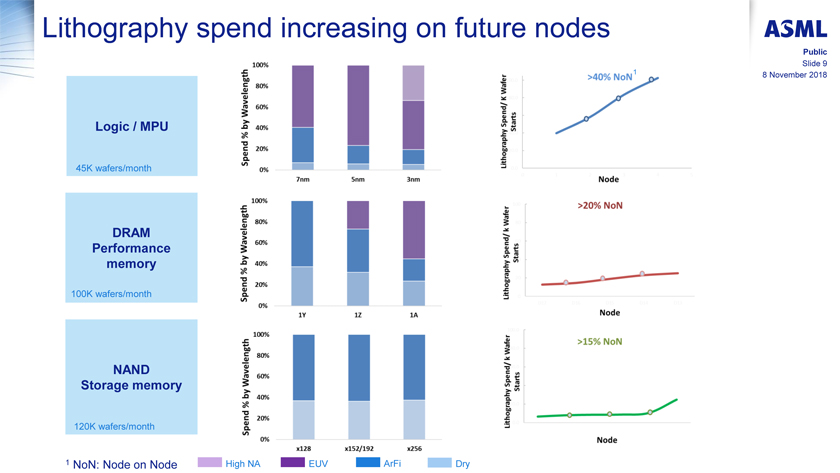
Lithography spend increasing on future nodes Public Slide 9 8 November 2018 1 Logic / MPU 45K wafers/month DRAM Performance memory 100K wafers/month NAND Storage memory 120K wafers/month 1 NoN: Node on Node High NA EUV ArFi Dry
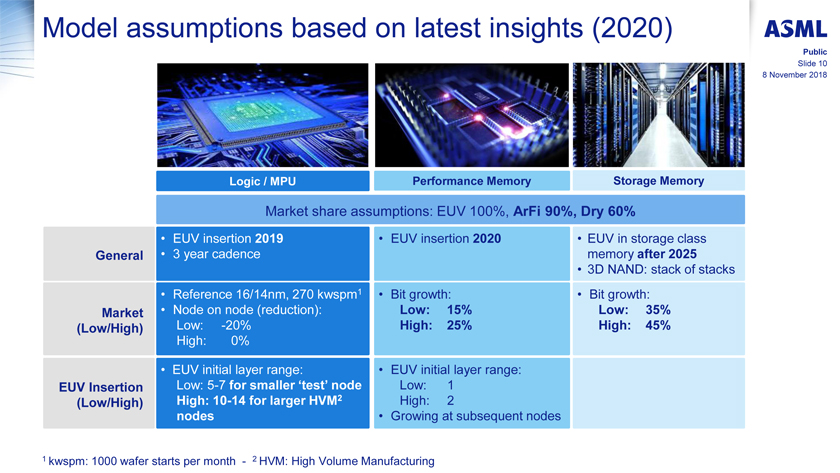
Model assumptions based on latest insights (2020) Public Slide 10 8 November 2018 Logic / MPU Performance Memory Storage Memory Market share assumptions: EUV 100%, ArFi 90%, Dry 60% • EUV insertion 2019 • EUV insertion 2020 • EUV in storage class General • 3 year cadence memory after 2025 • 3D NAND: stack of stacks • Reference 16/14nm, 270 kwspm1 • Bit growth: • Bit growth: Market • Node on node (reduction): Low: 15% Low: 35% (Low/High) Low:-20% High: 25% High: 45% High: 0% • EUV initial layer range: • EUV initial layer range: EUV Insertion Low:5-7 for smaller ‘test’ node Low: 1 (Low/High) High:10-14 for larger HVM2 High: 2 nodes • Growing at subsequent nodes 1 kwspm: 1000 wafer starts per month —2 HVM: High Volume Manufacturing
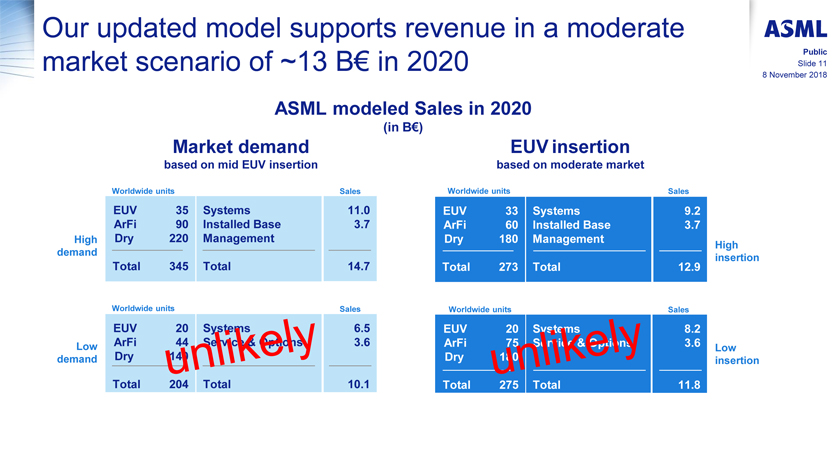
Our updated model supports revenue in a moderate market scenario of ~13 B€ in 2020 Public Slide 11 8 November 2018 ASML modeled Sales in 2020 (in B€) Market demand EUV insertion based on mid EUV insertion based on moderate market Worldwide units Sales Worldwide units Sales EUV 35 Systems 11.0 EUV 33 Systems 9.2 ArFi 90 Installed Base 3.7 ArFi 60 Installed Base 3.7 High Dry 220 Management Dry 180 Management High demand insertion Total 345 Total 14.7 Total 273 Total 12.9 Worldwide units Sales Worldwide units Sales EUV 20 Systems 6.5 EUV 20 Systems 8.2 Low ArFi 44 Service & Options 3.6 ArFi 75 Service & Options 3.6 Low demand Dry 140 Dry 180 insertion Total 204 Total 10.1 Total 275 Total 11.8
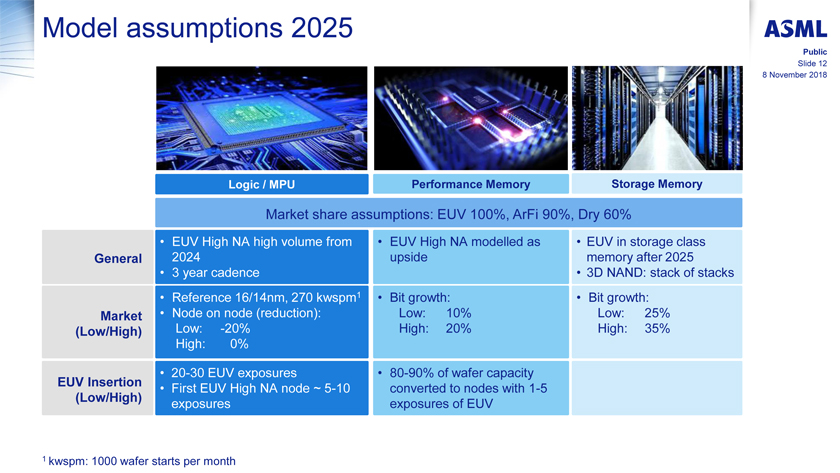
Model assumptions 2025 Public Slide 12 8 November 2018 Logic / MPU Performance Memory Storage Memory Market share assumptions: EUV 100%, ArFi 90%, Dry 60% • EUV High NA high volume from • EUV High NA modelled as • EUV in storage class General 2024 upside memory after 2025 • 3 year cadence • 3D NAND: stack of stacks • Reference 16/14nm, 270 kwspm1 • Bit growth: • Bit growth: Market • Node on node (reduction): Low: 10% Low: 25% (Low/High) Low:-20% High: 20% High: 35% High: 0% •20-30 EUV exposures •80-90% of wafer capacity EUV Insertion • First EUV High NA node ~5-10 converted to nodes with1-5 (Low/High) exposures exposures of EUV 1 kwspm: 1000 wafer starts per month
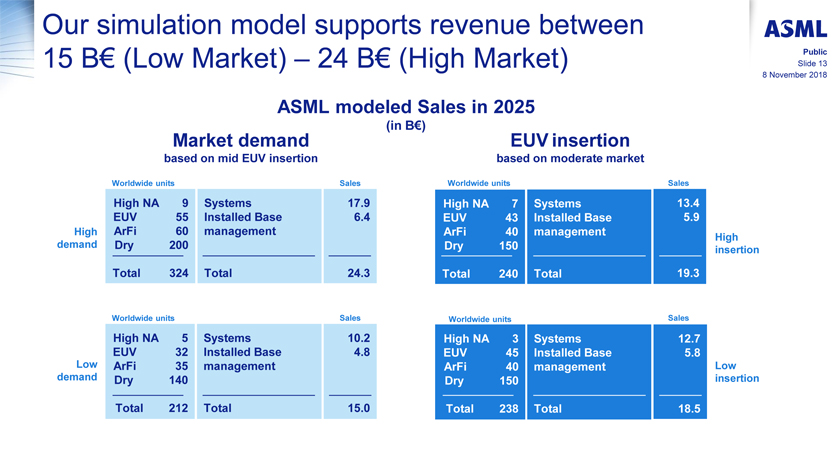
Our simulation model supports revenue between 15 B€ (Low Market) – 24 B€ (High Market) Public Slide 13 8 November 2018 ASML modeled Sales in 2025 Market demand (in B€) EUV insertion based on mid EUV insertion based on moderate market Worldwide units Sales Worldwide units Sales High NA 9 Systems 17.9 High NA 7 Systems 13.4 EUV 55 Installed Base 6.4 EUV 43 Installed Base 5.9 High ArFi 60 management ArFi 40 management High demand Dry 200 Dry 150 insertion Total 324 Total 24.3 Total 240 Total 19.3 Worldwide units Sales Worldwide units Sales High NA 5 Systems 10.2 High NA 3 Systems 12.7 EUV 32 Installed Base 4.8 EUV 45 Installed Base 5.8 Low ArFi 35 management ArFi 40 management Low demand Dry 140 Dry 150 insertion Total 212 Total 15.0 Total 238 Total 18.5
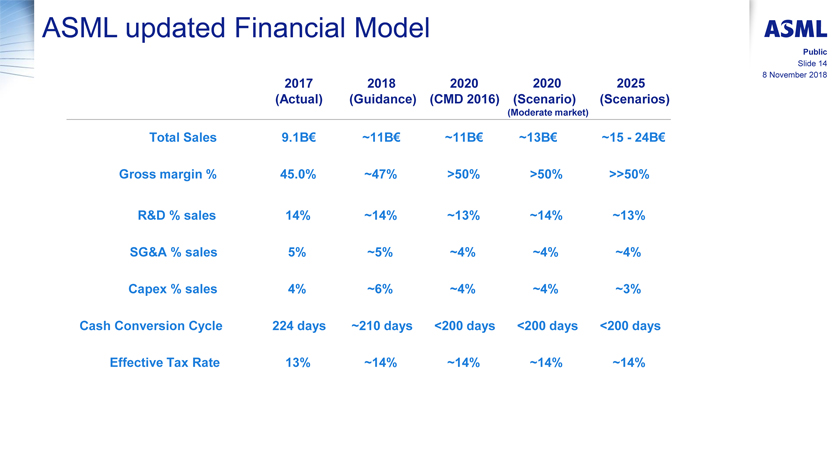
ASML updated Financial Model Public Slide 14 8 November 2018 2017 2018 2020 2020 2025 (Actual) (Guidance) (CMD 2016) (Scenario) (Scenarios) (Moderate market) Total Sales 9.1B€ ~11B€ ~11B€ ~13B€ ~15—24B€ Gross margin % 45.0% ~47% >50% >50% >>50% R&D % sales 14% ~14% ~13% ~14% ~13% SG&A % sales 5% ~5% ~4% ~4% ~4% Capex % sales 4% ~6% ~4% ~4% ~3% Cash Conversion Cycle 224 days ~210 days <200 days <200 days <200 days Effective Tax Rate 13% ~14% ~14% ~14% ~14%
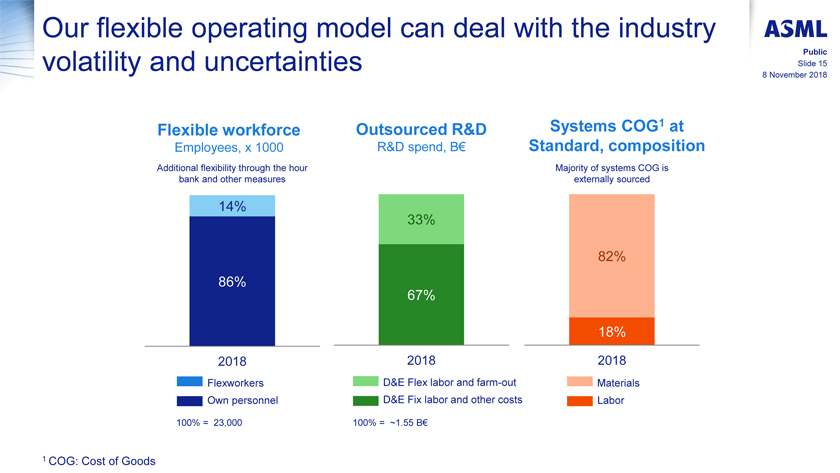
Our flexible operating model can deal with the industry volatility and uncertainties Public Slide 15 8 November 2018 Flexible workforce Outsourced R&D Systems COG1 at Employees, x 1000 R&D spend, B€ Standard, composition Additional flexibility through the hour Majority of systems COG is bank and other measures externally sourced 14% 33% 82% 86% 67% 18% 2018 2018 2018 Flexworkers D&E Flex labor andfarm-out Materials Own personnel D&E Fix labor and other costs Labor 100% = 23,000 100% = ~1.55 B€ 1 COG: Cost of Goods
Public Slide 16 8 November 2018 Continued shareholder value creation
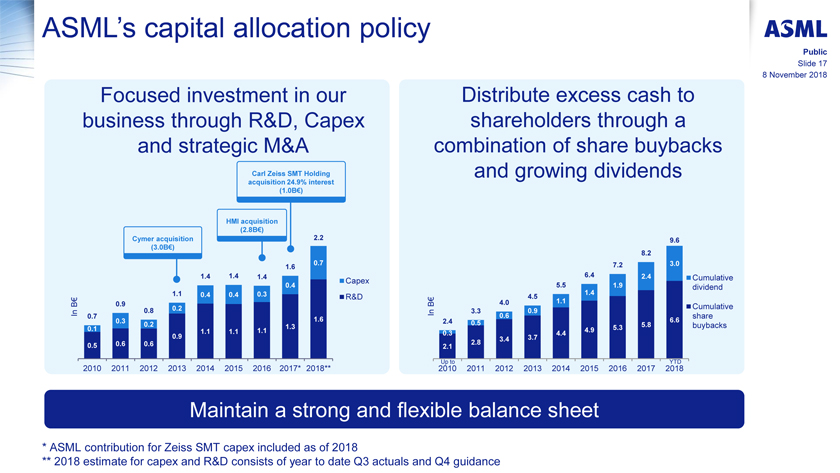
ASML’s capital allocation policy Public Slide 17 8 November 2018 Focused investment in our business through R&D, Capex and strategic M&A Carl Zeiss SMT Holding acquisition 24.9% interest (1.0B€) HMI acquisition (2.8B€) Cymer acquisition 2.2 (3.0B€) 0.7 1.6 1.4 1.4 1.4 Capex 0.4 1.1 0.4 0.4 0.3 R&D € B 0.9 In 0.8 0.2 0.7 1.6 0.3 0.2 1.3 0.1 1.1 1.1 1.1 0.9 0.5 0.6 0.6 2010 2011 2012 2013 2014 2015 2016 2017* 2018** Distribute excess cash to shareholders through a combination of share buybacks and growing dividends 9.6 8.2 7.2 3.0 6.4 2.4 Cumulative 5.5 1.9 dividend 1.4 4.5 B € 4.0 1.1 Cumulative In 3.3 0.9 0.6 share 2.4 0.5 6.6 5.3 5.8 buybacks 4.9 0.3 4.4 3.4 3.7 2.8 2.1 2010 Up to 2011 2012 2013 2014 2015 2016 2017 2018 YTD Maintain a strong and flexible balance sheet * ASML contribution for Zeiss SMT capex included as of 2018 ** 2018 estimate for capex and R&D consists of year to date Q3 actuals and Q4 guidance
Business Model and Capital Allocation Strategy Summary Public Slide 18 8 November 2018 Our investments have • We have invested substantially into technology leadership and have created significant thereby created significant shareholder value shareholder value… … our growth • Our products and services will continue to enable our customers to achieve continues well into cost effective shrink, which will continue to fuel a highly profitable industry in the next decade… innovation and expansion … creating significant • Based on different market scenarios we have an opportunity to grow our financial annual revenue for 2025: between 15B€ (low market) – 24B€ (high market) opportunity … … which continues to • We expect to continue to return significant amounts of cash to our deliver strong shareholders through a combination of share buybacks and growing dividends shareholder value
Forward Looking Statements Public Slide 19 8 November 2018 This document contains statements relating to certain projections, business trends and other matters that are forward-looking, including statements with respect to expected trends and outlook, 8 strategy, bookings, expected financial results and trends, including expected sales, EUV revenue, gross margin, capital expenditures, R&D and SG&A expenses, cash conversion cycle, and target effective annualized tax rate, and expected financial results and trends for the rest of 2018 and 2019, expected revenue growth and demand for ASML’s products in logic and memory, expected annual revenue opportunity in 2020 and for 2025 and expected EPS potential in 2020 with significant growth in 2025, expected trends in the lithography system market, fab capacity by segment, the automotive and artificial intelligence industries, connectivity, semiconductor end markets and new semiconductor nodes, expected acceleration of chipmakers’ performance for the next decade, expected EUV insertion and transistor density growth, trends in DUV systems revenue and Holistic Lithography and installed based management revenues, statements with respect to expectations regarding future DUV sales, including composition, margins, improvement of operations and performance, DUV product roadmaps, expected benefits of the holistic productivity approach, including in terms of wafers per year, expected industry trends and expected trends in the business environment, statements with respect to customer demand and the commitment of customers to High NA machines and to insert EUV into volume manufacturing by ordering systems, expected future operation of the High NA joint lab, statements with respect to holistic lithography roadmaps and roadmap acceleration, including the introduction of higher productivity systems in 2019 (including the expected shipment of NXE:3400C and expected timing thereof) and the expected benefits, ASML’s commitment to volume manufacturing and related expected plans until 2030, ASML’s commitment to secure system performance, shipments, and support for volume manufacturing, including availability, timing of and progress supporting EUV ramp and improving consistency, productivity, throughput, and production and service capability enabling required volume as planned, including expected shipments, statements with respect to growth of fab capacity driving demand in lithography systems, planned customer fabs for 200 systems and expected first output in 2019, expected EUV value increase and increase in EUV margins and ASML’s expectation of EUV profitability at the DUV level, expected installed base of EUV systems, expected customer buildout of capacity for EUV systems, EUV estimated demand by market, expected increase in lithography intensity, statements with respect to the expected benefits of EUV, includingyear-on-year cost reduction and system performance, and of the introduction of the new DUV system and expected demand for such system, the expected benefits of HMI’se-beam metrology capabilities, including the expansion of ASML’s integrated Holistic Lithography solutions through the introduction of a new class of pattern fidelity control, the extension of EUV to enable cost effective single patterning shrink with EUV, statements with respect to ASML’s applications business, including statements with respect to expected results in 2018, expected growth of the applications business and expected drivers of growth, expected growth in margins, continued shrink and drivers, and expected accuracy, defect control and performance improvements, shrink being a key driver supporting innovation and providing long-term industry growth, lithography enabling affordable shrink and delivering value to customers, DUV, Holistic Lithography and EUV providing unique value drivers for ASML and its customers, expected industry innovation, the expected continuation of Moore’s law and that EUV will continue to enable Moore’s law and drive long term value for ASML beyond the next decade, intention to return excess cash to shareholders through stable or growing dividends and regularly timed share buybacks in line with ASML’s policy, statements with respect to the expectation to continue to return cash to shareholders through dividends and share buybacks, and statements with respect to the expected impact of accounting standards. You can generally identify these statements by the use of words like “may”, “will”, “could”, “should”, “project”, “believe”, “anticipate”, “expect”, “plan”, “estimate”, “forecast”, “potential”, “intend”, “continue”, “targets”, “commits to secure” and variations of these words or comparable words. These statements are not historical facts, but rather are based on current expectations, estimates, assumptions and projections about the business and our future financial results and readers should not place undue reliance on them. Forward-looking statements do not guarantee future performance and involve risks and uncertainties. These risks and uncertainties include, without limitation, economic conditions, product demand and semiconductor equipment industry capacity, worldwide demand and manufacturing capacity utilization for semiconductors, including the impact of general economic conditions on consumer confidence and demand for our customers’ products, competitive products and pricing, the impact of any manufacturing efficiencies and capacity constraints, performance of our systems, the continuing success of technology advances and the related pace of new product development and customer acceptance of and demand for new products including EUV and DUV, the number and timing of EUV and DUV systems shipped and recognized in revenue, timing of EUV orders and the risk of order cancellation or push out, EUV production capacity, delays in EUV systems production and development and volume production by customers, including meeting development requirements for volume production, demand for EUV systems being sufficient to result in utilization of EUV facilities in which ASML has made significant investments, potential inability to successfully integrate acquired businesses to create value for our customers, our ability to enforce patents and protect intellectual property rights, the outcome of intellectual property litigation, availability of raw materials, critical manufacturing equipment and qualified employees, trade environment, changes in exchange rates, changes in tax rates, available cash and liquidity, our ability to refinance our indebtedness, distributable reserves for dividend payments and share repurchases, results of the share repurchase plan and other risks indicated in the risk factors included in ASML’s Annual Report on Form20-F and other filings with the US Securities and Exchange Commission. These forward-looking statements are made only as of the date of this document. We do not undertake to update or revise the forward-looking statements, whether as a result of new information, future events or otherwise.
Public INVESTOR DAY ASML SMALL TALK 2018 VELDHOVEN