Q3 2005 Results
October 12, 2005
Safe Harbor
“Safe Harbor” Statement under the U.S. Private Securities
Litigation Reform Act of 1995: the matters discussed in this
document may include forward-looking statements that are
subject to risks and uncertainties including, but not limited to:
economic conditions, product demand and semiconductor
equipment industry capacity, worldwide demand and
manufacturing capacity utilization for semiconductors (the
principal product of our customer base), competitive products
and pricing, manufacturing efficiencies, new product
development, ability to enforce patents, the outcome of
intellectual property litigation, availability of raw materials and
critical manufacturing equipment, trade environment, and
other risks indicated in the risk factors included in ASML’s
Annual Report on Form 20-F and other filings with the U.S.
Securities and Exchange Commission.
/ Slide 2

Agenda
Accomplishments Q3 2005
Financial summary
Q4 outlook
Company focus
First glance at 2006
/ Slide 3

Accomplishments Q3 2005
/ Slide 4
Financial accomplishments Q3 2005
Solid execution in a light shipment quarter
Revenue of € 533 million
Shipped 39 systems (28 new systems)
Net profit of € 48 million
Gross margin 37%
Operating profit 13%
Cash generation of € 156 million
/ Slide 5

Technology/market accomplishments Q3 2005
Technology
Continued strong ramp of TWINSCANTM XT:1400 for 65-nm
volume manufacturing as we shipped 28 units in 9 months,
strengthening our leadership position in ArF
Significant progress in immersion technology as we delivered 9
units to date and have 10 systems in backlog
First orders taken for new non-critical layer i-line and KrF tools
Market
Strengthened our position in the Memory/Flash sector through
strong shipments, bookings and significant evaluation orders
from new customers
First immersion tool in Japan ordered by a fifth customer
/ Slide 6

Financial summary
/ Slide 7

Total revenues M€
2673
1589
1959
318
1180
830
179
0
500
1000
1500
2000
2500
3000
2000
2001
2002
2003
759
609
351
820
H2
H1
Q1
Q2
Q3
Q4
1493
329
370
526
1543
2004
453
616
2465
785
2005
685
763
1981
611
533
/ Slide 8
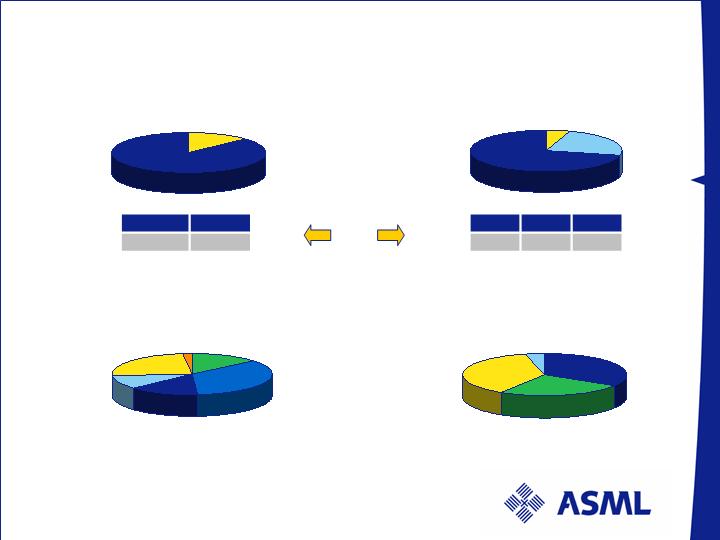
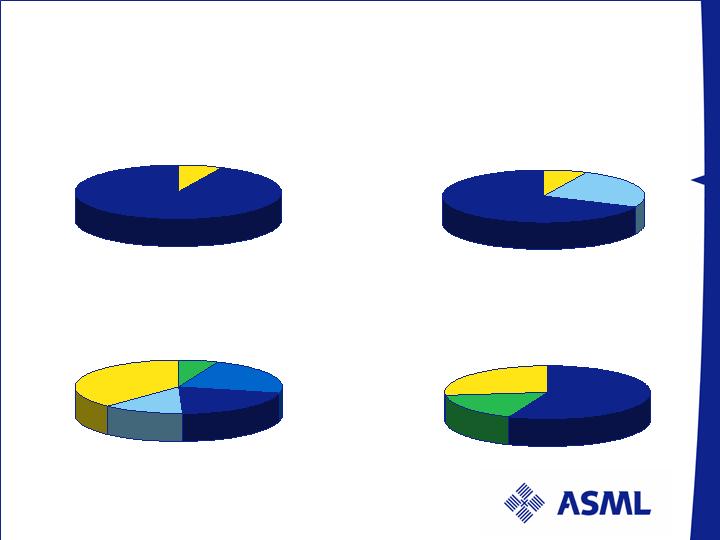
Revenue breakdown: Q3 2005
Value per type
Value per technology
TWINSCAN
87%
Others
13%
Value per region
Value per end-use
Foundry
25%
Memory
34%
IDM
37%
KrF
24%
ArF
71%
i-line
5%
U.S.
35%
Taiwan
14%
Korea
24%
China
14%
Europe
11%
ROW
2%
Numbers have been rounded for readers’ convenience
units
Units
14
25
Others
TWINSCAN
10
12
17
i-line
KrF
ArF
R&D
4%
/ Slide 9

Profit & Loss statement M€
/ Slide 10
1 ASML, Nikon Corporation and Carl Zeiss SMT AG agreed to a comprehensive settlement
of legal proceedings and cross-license of patents related to lithography equipment. This
agreement resulted in:
an increase of M€ 49 in our R&D costs and consequently a decrease in operating
income from continuing operations.
a decrease of M€ 33 in our total net income.
Numbers have been rounded for readers’ convenience
Q2 05
Q3 05
YTD 04
YTD
05
Net sales
763
533
1680
1981
Gross margin
Gross margin %
299
39.1
%
197
37.0%
598
35.6
%
770
38.9%
R&D costs
82
80
256
1
242
SG&A costs
55
48
144
154
Operating income
Operating income %
162
21.2
%
69
12.9%
198
1
11.8
%
375
18.9%
Net income
Net income %
112
14.6%
48
9.0
%
127
1
7.5
%
260
13.1
%
Cash flow M€
/ Slide 11
Numbers have been rounded for readers’ convenience
Q
2
05
Q3
05
YTD
04
YTD
05
Net income
112
48
127
260
Depreciation and amortization
25
22
72
69
Effects of changes in assets and liabilities
88
103
100
173
Cash flow from recurring operations
225
173
299
502
Cash flow from investing activities
(16)
(9
)
(33)
(46)
Cash flow from financing activities
4
(8
)
18
(2)
Effect of changes in exchange rates on cash
11
0
4
18
Net cash flow
224
156
288
472
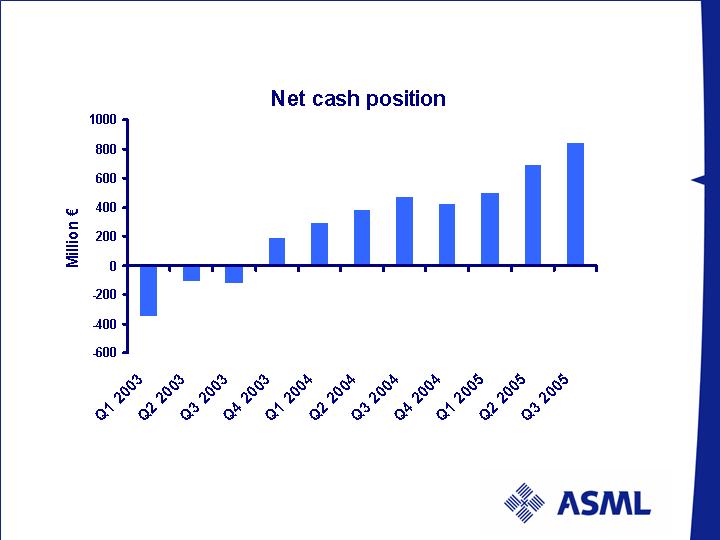
Strong cash generation performance
Net cash = Cash and cash equivalents minus Convertible subordinated bonds
/ Slide 12

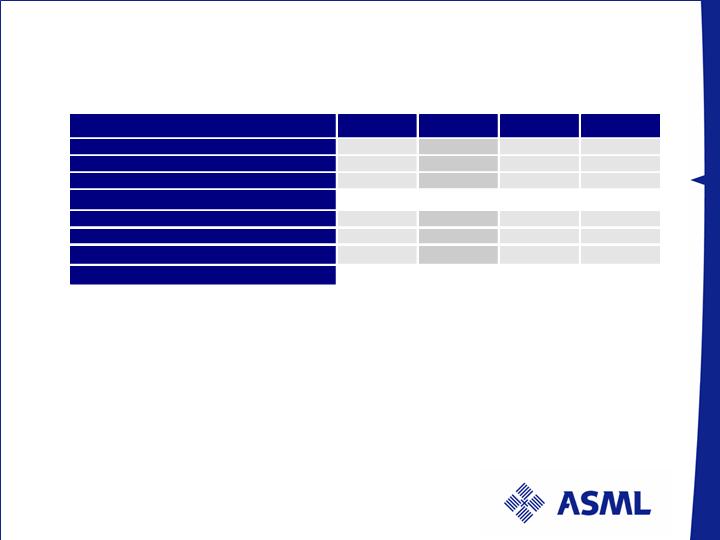
Balance sheet as of September 25, 2005 M€
/ Slide 13
1 ASML has re-evaluated its tax presentation reported in its earnings release of Q2 2005 and has
concluded that this presentation was not consistent with prior quarters and the current quarter.
The effect of this reclassification on tax assets and liabilities in the aggregate is zero.
Numbers have been rounded for readers’ convenience
ASSETS
June 2005
Sep
2005
Cash and cash equivalents
1544
43.9
%
1700
48
.2
%
Accounts receivable, net
485
13.8
%
403
11.4
%
Inventories, net
695
19.8
%
653
18.5
%
Other assets
193
5.4
%
198
5.6
%
Tax assets
26
7
1
7.6
%
255
7.3
%
Fixed assets
335
9.5
%
318
9.0
%
T
OTAL ASSETS
3519
100%
3527
100%
LIABILITIES and SHAREHOLDERS’ EQUITY
Current liabilities
768
21.8
%
729
20.7
%
Tax liability
275
1
7.8
%
279
7.9
%
Long term debts
885
25.2
%
882
25.0
%
Shareholders’ equity
1591
45.2
%
1637
46.4
%
TOTAL LIABILITIES &
SHAREHOLDERS’ EQUITY
3519
100%
3527
100%
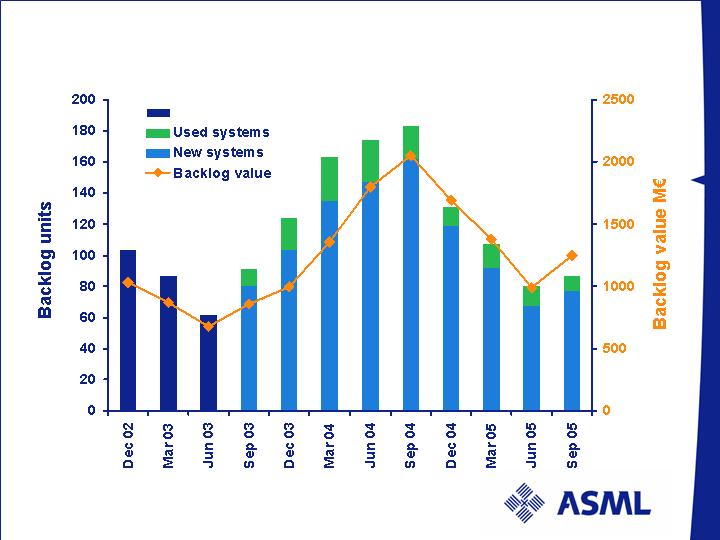
Backlog: litho units vs. value
New and used systems
/ Slide 14
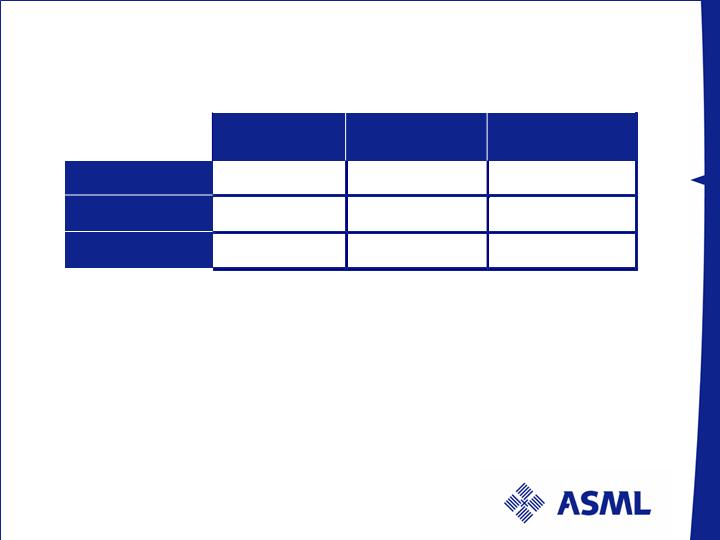
Backlog as of September 25, 2005
New Systems
Used Systems
Total Backlog
Units
Value
M€ 1,216
M€ 29
M€ 1,245
ASP
M€ 15.8
M€ 2.9
M€ 14.3
Numbers have been rounded for readers’ convenience
Backlog
Backlog
83% of unit backlog carry Q4 05 + Q1 06 shipment dates
Q3 net bookings of 46 systems (38 new) with record ASP of M€ 15.8
Note: Due to possible customer changes in delivery schedules and to cancellation of orders, our
backlog at any particular date is not necessarily indicative of actual sales for any succeeding period.
77
10
87
/ Slide 15
Backlog lithography per September 25, 2005
Total value M€ 1,245
Value per type
Value per technology
TWINSCAN
93%
Others
7%
I-line
7%
ArF
68 %
Value per region
Value per end-use
U.S.
22%
Foundry
17%
Memory
56%
Taiwan
20%
IDM
27%
Korea
37%
KrF
25%
ROW
9%
Europe
12%
Numbers have been rounded for readers’ convenience
/ Slide 16

Q4 outlook
ASML expects to ship 40 systems in Q4 2005
Backlog supports new tool ASP of M€ 13.0 as product mix
favors 300-mm KrF systems. New plus refurbished tool ASP is
M€ 10.0
Backlog supports gross margin of 36-38% for Q4
Q4 bookings at about the same level as Q3 assuming foundry
customers re-start ordering for 2006 capacity additions
/ Slide 17

Company focus 2005
Technology leadership
Increase R&D budget to M€ 85 level, net of credit, early in 2006
to support ASML’s commitment to technology leadership
Deliver 4th generation immersion TWINSCAN XT:1700i starting
Q1 2006 for ramp in Q2
Ramp non-critical layer tools for delivery in Q4 2005
Lead-time reduction
Reduce lead times by 30% on volume manufacturing tools
Cost control programs
Bring Q4 2005 SG&A costs lower than Q3 level
Achieve 10% cost of goods reduction on improved generation
TWINSCAN XT platform
/ Slide 18

First glance at 2006
Market trends
Single digit growth of semiconductor revenue expected
by industry analysts in 2006
Current booking trend confirms:
Foundry: Cautious ordering awaiting improved visibility
Memory: Strong ordering to support shrink roadmap (45 nm
for Flash) and production capacity ramps
IDM: Good ordering of leading-edge equipment for advanced
process development and sub 100-nm production
/ Slide 19

First glance at 2006 - continued
Opportunities for ASML
Immersion technology implementation at 45-nm volume
manufacturing with TWINSCAN XT:1700i
Market share gains through realization of production
ramps at new customers
Semiconductor growth above the base case scenario
ASML 2006 baseline revenues at same level as 2005 with
expected upside from above mentioned opportunities
/ Slide 20

Commitment