
2005 Annual and 4th Q uarter Results
January 18, 2006

Safe Harbor
“Safe Harbor” Statement under the U.S. Private Securities
Litigation Reform Act of 1995: the matters discussed in this
document may include forward-looking statements that are
subject to risks and uncertainties including, but not limited to:
economic conditions, product demand and semiconductor
equipment industry capacity, worldwide demand and
manufacturing capacity utilization for semiconductors (the
principal product of our customer base), competitive products
and pricing, manufacturing efficiencies, new product
development, ability to enforce patents, the outcome of
intellectual property litigation, availability of raw materials and
critical manufacturing equipment, trade environment, and
other risks indicated in the risk factors included in ASML’s
Annual Report on Form 20-F and other filings with the U.S.
Securities and Exchange Commission.
/ Slide 2

Agenda
Accomplishments
Financial summary
Q1 outlook
Company focus 2006
/ Slide 3
Accomplishments
/ Slide 4

Accomplishments 2005
Net sales increased 3% y-o-y while
Net profit improved by 32% to € 311 million
Shipping 30% fewer but higher priced systems (196 units)
Operating profit increased 2.4% to 17.8%
Net cash from operations nearly tripled to € 711 million
Improved our market position
Added our 6th customer in Japan in Q4
Gained 12 new customers in 2005
Delivered 13th immersion system, have 13 in backlog and
8 pending orders for delivery in 2006
/ Slide 5

Financial accomplishments Q4 2005
Solid execution
Revenue of € 548 million
Shipped 47 systems (34 new systems)
Net profit of € 52 million (9.4% of sales)
Gross margin 37%
Operating profit 14%
Cash generation of € 205 million
/ Slide 6

Financial summary
/ Slide 7

453
616
2465
785
611
1589
830
759
1959
179
609
351
820
2673
1180
1493
318
329
370
526
1543
685
763
2529
533
548
Total revenues M€
0
500
1000
1500
2000
2500
3000
2000
2001
2002
2003
2004
2005
Q1
Q2
Q3
Q4
H1
H2
/ Slide 8

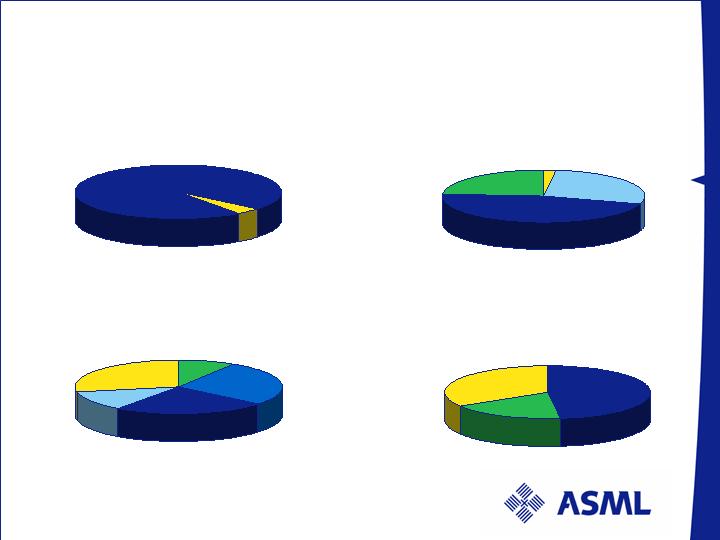
Revenue breakdown: Q4 2005
Value per type
Value per technology
TWINSCAN
85%
Others
15%
Value per region
Value per end-use
Foundry
37%
Memory
43%
IDM
15%
KrF
45%
ArF
48%
i-line
7%
U.S.
8%
Taiwan
26%
Korea
40%
China
5%
Europe
9%
ROW
4%
Numbers have been rounded for readers’ convenience
units
Units
19
28
Others
TWINSCAN
12
24
11
i-line
KrF
ArF
R&D
5%
Singapore
8%
/ Slide 9
Profit & Loss statement M€
/ Slide 10
Numbers have been rounded for readers’ convenience
1 ASML, Nikon Corporation and Carl Zeiss SMT AG agreed to a comprehensive settlement of legal
proceedings and cross-license of patents related to lithography equipment. This agreement resulted in:
an increase of M€ 49 in our R&D costs and consequently a decrease in operating income from
continuing operations.
a decrease of M€ 33 in our total net income.
2 SG&A costs include a positive adjustment of M € 6 for restructuring expenses.
Q3
0
5
Q4
05
20
04
20
05
Net sales
533
548
2465
2529
Gross margin
Gross margin %
197
37.0
%
204
37.3%
906
36.7
%
974
38.5
%
R&D costs
80
82
331
1
324
SG&A costs
48
47
196
2
201
Operating income
Operating income %
69
1
2.9
%
75
13.6%
379
15.4
%
449
17.8
%
Net income
Net income %
48
9.0
%
52
9.4
%
235
1
9.6
%
311
12.3
%

Key financial trends 2005
/ Slide 11
Numbers have been rounded for readers’ convenience
Profit & Loss Statement
M€
Q1 0
5
Q2 0
5
Q3 0
5
Q4 0
5
200
5
Units
59
51
39
47
196
Sales
685
763
533
548
2529
Gross margin
Gross margin %
274
40.0
%
299
39.1
%
197
37.0
%
204
37.3
%
974
38.5
%
R&D
79
82
80
82
324
SG&A
51
55
48
47
201
O
pe
rating income
Operating income %
144
21.0
%
162
21.2
%
69
12.9
%
75
13.6
%
449
17.8
%
Net income
Net income %
100
14.6
%
112
14.6
%
48
9.0
%
52
9.4
%
311
12.3
%
Cash flow M€
/ Slide 12
Numbers have been rounded for readers’ convenience
Q
3
05
Q4
05
20
04
20
05
Net income
48
5
2
235
311
Depreciation and amortization
22
30
93
99
Effects of changes in assets and liabilities
103
12
8
(77)
30
1
Cash flow from recurring operations
173
210
251
711
Cash flow from investing activities
(9)
(15)
(60)
(61
)
Cash flow from financing activities
(8)
5
19
3
Effect of changes in exchange rates on cash
0
5
(9)
23
Net cash flow
156
205
200
676

Current liabilities include as of December 31, 2005 USD 575 million principal amount of ASML’s 5.75 percent
Convertible Subordinated Notes due October 15, 2006. In previous period ends, this was presented under
convertible subordinated bonds.
Balance sheet as of December 31, 2005 M€
/ Slide 13
1
Numbers have been rounded for readers’ convenience
ASSETS
December
200
4
December
2005
Cash and cash equivalents
1228
38
%
1
90
5
51
%
Accounts receivable, net
503
16
%
30
3
8
%
Inventories, net
718
22
%
7
77
21
%
Other assets
203
6
%
164
4
%
Tax assets
2
56
8
%
303
8
%
Fixed assets
3
36
10
%
304
8
%
TOTAL
ASSETS
3
244
100%
3
75
6
100%
LIABILITIES and SHAREHOLDERS’ EQUITY
Current liabilities
8
13
25
%
1420
1
38
%
Convertible subordinated bonds
803
25
%
380
1
10
%
Long term debts
and deferred liabilities
236
7
%
244
6
%
Shareholders’ equity
1392
43
%
1
7
12
46
%
TOTAL LIABILITIES & SHAREHOLDERS’ EQUITY
3
244
100%
3
75
6
100%
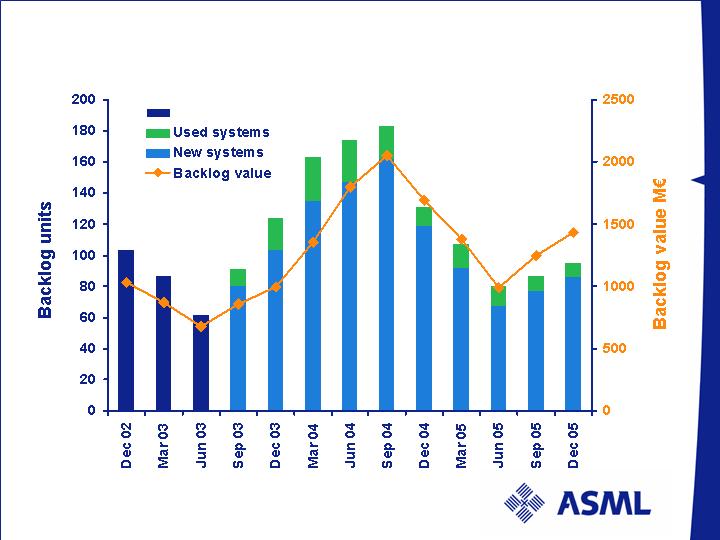
Backlog: litho units vs. value
New and used systems
/ Slide 14

Backlog as of December 31, 2005
80 % of unit backlog carry Q1 + Q2 2006 shipment dates
Q4 net bookings of 55 systems of which 43 are new with an ASP of M€ 14.5
Note: Due to possible customer changes in delivery schedules and to cancellation of orders, our backlog at any
particular date is not necessarily indicative of actual sales for any succeeding period
Numbers have been rounded for readers’ convenience
New Systems
Used Systems
Total Backlog
M€ 1,411
M€ 23
M€ 1,434
M€ 16.4
M€ 2.6
M€ 15.1
Backlog
Backlog
86
9
95
Units
Value
ASP
/ Slide 15
Backlog lithography per December 31, 2005
Total value M€ 1,434
Value per type
Value per technology
TWINSCAN
96%
Others
4%
I-line
2%
ArF dry
46 %
Value per region
Value per end-use
U.S.
27%
Foundry
18%
Memory
48%
Taiwan
24%
IDM
34%
Korea
28%
KrF
28%
ROW
9%
Europe
12%
ArF immersion
24 %
Numbers have been rounded for readers’ convenience
/ Slide 16
Q1 outlook
Bookings are expected to be at least at the same level as Q4 2005
(55 bookings)
ASML expects to ship 48 systems in Q1 2006 with upside potential
for a few additional systems
ASP for new systems is € 14.1 million, new + used is € 12.0 million
Gross margin of 38 - 39%
R&D expenditures in Q1 are expected to increase to € 85 million
SG&A will be approximately € 51 million
Reduced cash generation in H1 due to increased system output
and working capital, completion of 2 EUV tools and tax payments
Prepare a potential share buy back program, subject to investment
alternatives, as our strategic net cash target level of € 1 billion has
been achieved
/ Slide 17

Company focus 2006
Continue execution of 2005 focus points
Execute on volume production ramp of the TWINSCAN
XT:1700i, hyper NA tool for 45 nm node, in Q2 2006
Execute on cost of goods reduction
Execute on lead time reduction
Accelerate the technology leadership gap
Prepare 2 EUV tools for shipment
Finalize development of the 1.3< NA immersion tool for
shipment in H1 2007
Develop alternative architectures for cost effective
lithography at 32 nm resolution and beyond
/ Slide 18
Commitment