Exhibit 99.1

2006 1st Quarter Results
April 19, 2006

Safe Harbor
“Safe Harbor” Statement under the U.S. Private Securities
Litigation Reform Act of 1995: the matters discussed in this
document may include forward-looking statements that are
subject to risks and uncertainties including, but not limited to:
economic conditions, product demand and semiconductor
equipment industry capacity, worldwide demand and
manufacturing capacity utilization for semiconductors (the
principal product of our customer base), competitive products
and pricing, manufacturing efficiencies, new product
development, ability to enforce patents, the outcome of
intellectual property litigation, availability of raw materials and
critical manufacturing equipment, trade environment, and
other risks indicated in the risk factors included in ASML’s
Annual Report on Form 20-F and other filings with the U.S.
Securities and Exchange Commission.
/ Slide 2
Agenda
Accomplishments
Financial summary
Q2 outlook
Company focus 2006
/ Slide 3

Accomplishments
/ Slide 4

Accomplishments Q1 2006
Solid execution
Gross margin increased to 40.0%
Operating margin grew to 18.2%
Improved our market position
Gained 7th customer in Japan – will use ASML immersion tools
Net bookings of 62 systems (47 new) with a value of € 710 million
Immersion
Backlog increased to 18 immersion systems with 5 pending orders for
shipment in 2006
First TWINSCAN XT:1700i product qualification completed end of March,
shipped early April to Asia
Produced 42 nm resolution half pitch images on the TWINSCAN XT:1700i
Customers demonstrate low defect immersion processes
/ Slide 5

Financial accomplishments Q1 2006
Robust financial performance
Revenue of € 629 million, 15% increase over Q4 ‘05
Shipped 51 systems (39 new systems)
ASP new systems is € 13.5 million
Net profit of € 80 million (12.7% of sales)
In preparation for major Q2 growth, ASML invested € 219
million cash in operations including a one time tax
payment of € 79 million for prior years
/ Slide 6

Financial summary
/ Slide 7
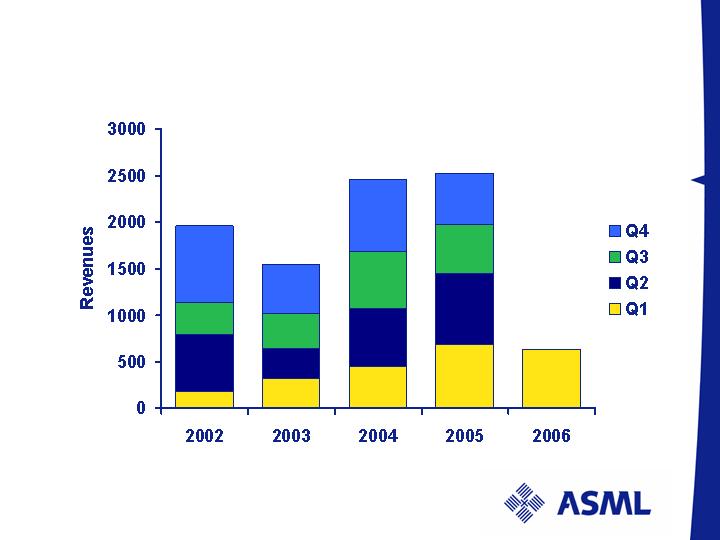
Total revenues M€
179
609
351
820
526
370
329
318
785
611
616
453
548
533
763
685
629
1959
1543
2465
2529
/ Slide 8
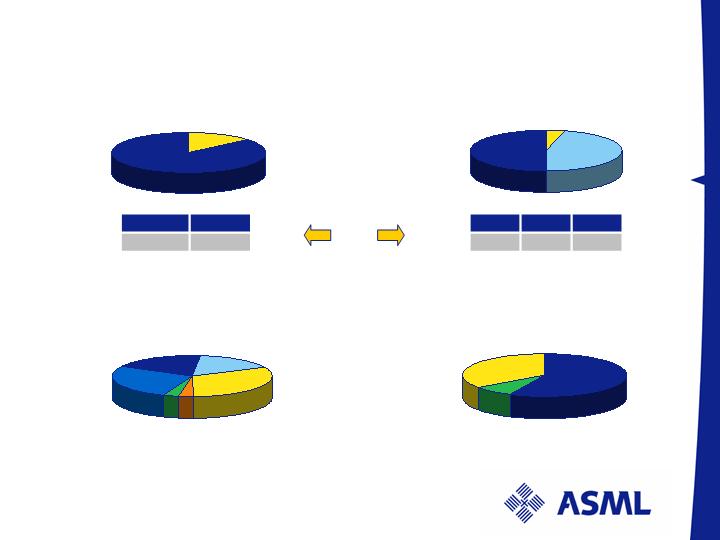
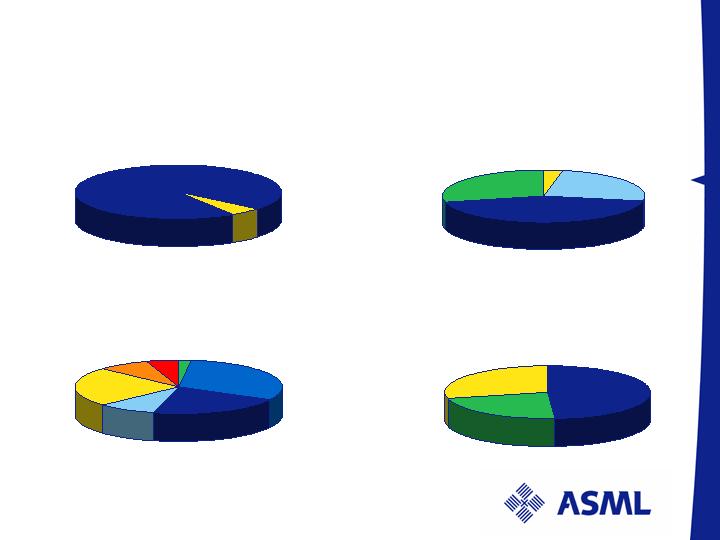
Revenue breakdown: Q1 2006
Value per type
Value per technology
TWINSCAN
86%
Others
14%
Value per region
Value per end-use
Foundry
8%
Memory
57%
IDM
35%
KrF
46%
ArF
50%
i-line
4%
U.S.
27%
Taiwan
19%
Korea
32%
China
3%
Europe
16%
ROW
3%
Numbers have been rounded for readers’ convenience
units
Units
18
33
Others
TWINSCAN
12
25
14
i-line
KrF
ArF
/ Slide 9
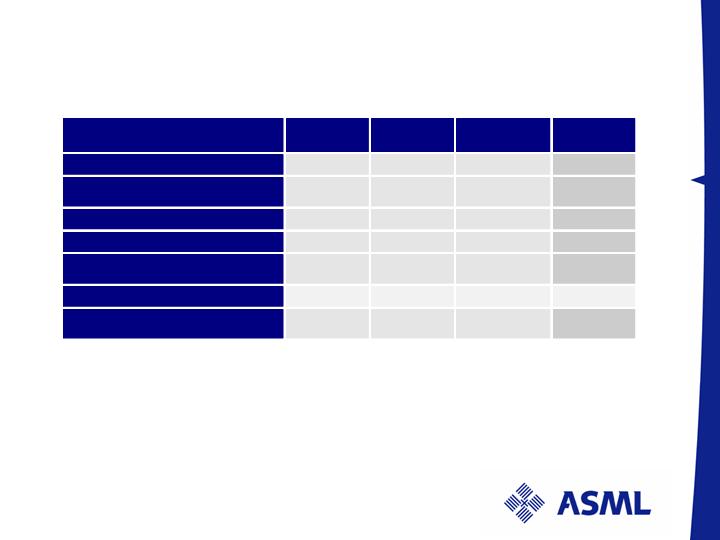
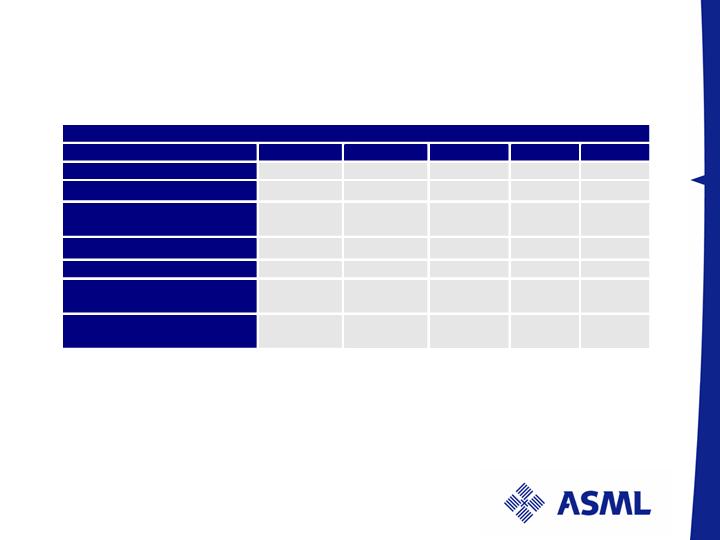
Profit & Loss statement M€
/ Slide 10
Numbers have been rounded for readers’ convenience
20
0
5
Q
1
05
Q
4
05
Q1
0
6
Net sales
2529
685
548
62
9
Gross margin
Gross margin %
974
38.5
%
274
40.0
%
204
37.3
%
251
40.0
%
R&D costs
324
79
82
87
SG&A costs
201
51
47
50
Operating income
Operating income %
449
1
7.8
%
144
21.0
%
75
13.6
%
114
18.2
%
Net income
Net income %
311
12.3
%
100
14.6
%
52
9.4
%
80
12.7
%
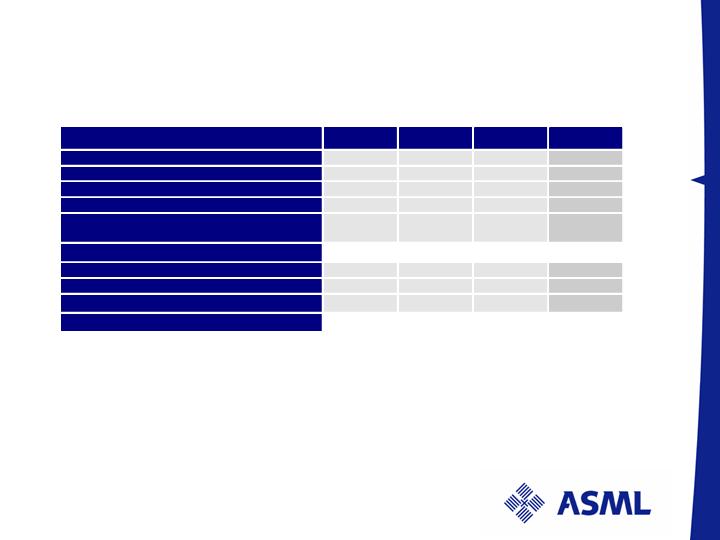
Key financial trends 2005 - 2006
/ Slide 11
Numbers have been rounded for readers’ convenience
Profit & Loss Statement
M€
Q1 0
5
Q2 0
5
Q3 0
5
Q4 0
5
Q1
0
6
Units
59
51
39
47
51
Sales
685
763
533
548
62
9
Gross margin
Gross margin %
274
40.0
%
299
39.1
%
197
37.0
%
204
37.3
%
251
40.0
%
R&D
79
82
80
82
87
SG&A
51
55
48
47
50
O
perating income
Operating
income %
144
21.0
%
162
21.2
%
69
12.9
%
75
13.6
%
114
18.2
%
Net income
Net income %
100
14.6
%
112
14.6
%
48
9.0
%
52
9.4
%
80
12.7
%
Cash flow M€
/ Slide 12
Including payment of Euro 79 Million for prior year taxes
1
Numbers have been rounded for readers’ convenience
20
05
Q
1
05
Q4
05
Q1
0
6
Net income
311
100
52
80
Depreciation and amortization
99
22
30
22
Changes in tax assets and liabilities
98
38
1
(54
)
1
Effects of changes in inventories
(30)
(9
)
(126)
(16
5
)
Effects of changes in
other
assets
and
liabilit
ies
233
(4
7
)
253
(102
)
Cash flow from recurring operations
711
104
210
(219)
Cash flow from investing activities
(61
)
(21)
(
15
)
(16)
Cash flow from financing activities
3
2
5
7
Effect of changes in exchange rates on cash
23
7
5
(6)
Net cash flow
676
9
2
205
(234)
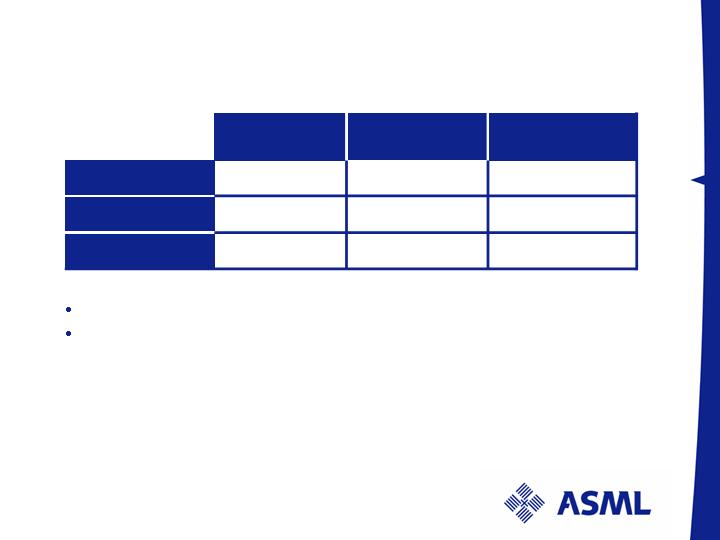
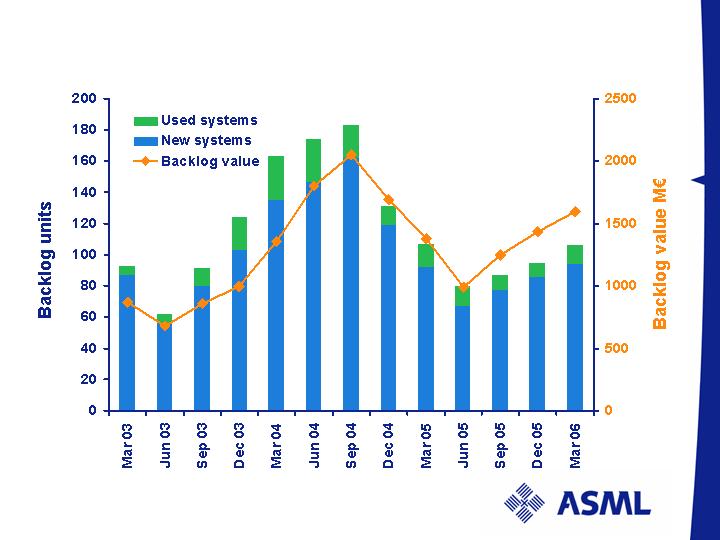
Backlog as of April 2, 2006
85 % of unit backlog carry Q2 + Q3 2006 shipment dates
Q1 net bookings of 62 systems with a value M€ 710 including
47 new tools with an ASP of M€ 14.3
Note: Due to possible customer changes in delivery schedules and to cancellation of orders, our backlog at any
particular date is not necessarily indicative of actual sales for any succeeding period
Numbers have been rounded for readers’ convenience
New Systems
Used Systems
Total Backlog
M€ 1.560
M€ 36
M€ 1.596
M€ 16.6
M€ 3.0
M€ 15.1
Backlog
Backlog
94
12
106
Units
Value
ASP
/ Slide 13
Current liabilities include as of December 31, 2005 USD 575 million principal amount of ASML’s 5.75 percent
Convertible Subordinated Notes due October 15, 2006. In previous period ends, this was presented under
convertible subordinated bonds.
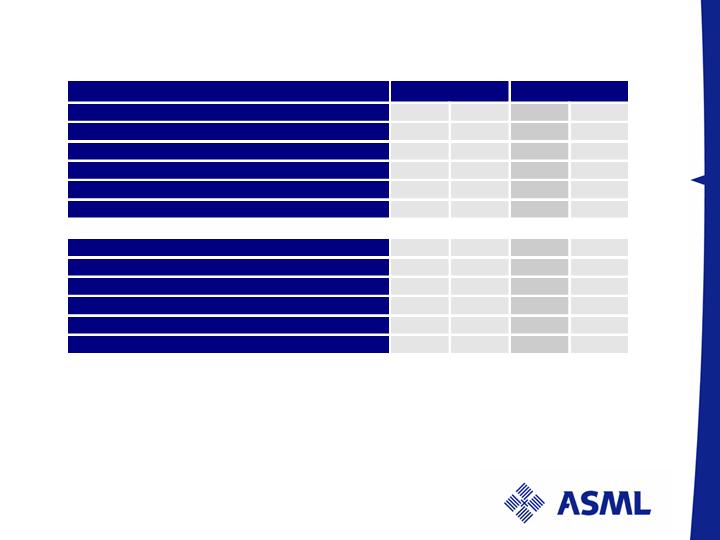
Balance sheet as of April 2, 2006 M€
/ Slide 14
1
Numbers have been rounded for readers’ convenience
ASSETS
December
2005
March
200
6
Cash and cash equivalents
1905
51
%
1671
44
%
Accounts receivable, net
303
8
%
447
12
%
Inventories, net
7
77
21
%
9
40
25
%
Other assets
164
4
%
1
53
4
%
Tax assets
303
8
%
2
97
7
%
Fixed assets
3
04
8
%
301
8
%
TOTA
L ASSETS
3
756
100%
380
9
100%
LIABILITIES and SHAREHOLDERS’ EQUITY
Current liabilities
1420
1
38
%
13
85
36
%
Convertible subordinated bonds
380
1
10
%
380
10
%
Long term debts
and
deferred liabilities
2
44
6
%
243
7
%
Shareholders’ equity
1
712
46
%
1
801
47
%
TOTAL LIABILITIES & SHAREHOLDERS’ EQUITY
3756
100%
380
9
100%
Backlog: litho units and value
/ Slide 15
Backlog lithography per April 2, 2006
Total value M€ 1,596
Value per type
Value per technology
TWINSCAN
95%
Others
5%
I-line
3%
ArF dry
43 %
Value per region
Value per end-use
U.S.
31%
Foundry
22%
Memory
49%
Taiwan
21%
IDM
29%
Korea
24%
KrF
25%
ROW
2%
Europe
9%
ArF immersion
29 %
Numbers have been rounded for readers’ convenience
China
8%
Japan
5%
/ Slide 16

Q2 outlook
Shipment of 64 systems expected
ASP for new system shipments expected to be € 14.5 million for
new systems and € 12.3 million for new + refurbished systems
Gross margin expected at 39 – 40%
R&D and SG&A are expected to be € 87 million net of credit and
€ 51 million respectively
ASML expects a sustained level of unit bookings in Q2 similar to
that of Q1, with a Q2 order mix favoring capacity additions in KrF
and i-line systems and shorter order leadtimes
Planning to ship the first EUV Alpha demo tools by mid 2006
Reiterating shipment forecast of 20-25 immersion systems in
2006
/ Slide 17

Share Buyback Program
ASML confirms its intention to execute a share buyback
program in 2006
Company will repurchase up to the equivalent of € 400
million of its own shares over the next 12 months
Purpose of the program is to return excess cash to
shareholders through reduction of the number of issued
shares
/ Slide 18

Company focus 2006
Continue execution of 2005 focus points
Execute on volume production ramp of the TWINSCAN
XT:1700i, hyper NA tool for 45 nm node
Execute on cost of goods reduction
Execute on lead time reduction
Accelerate the technology leadership gap
Ship 2 EUV Alpha demo tools
Finalize development of the >1.3 NA immersion tool for
shipment in H1 2007
Develop alternative architectures for cost effective
lithography at 32 nm resolution and beyond
/ Slide 19
Commitment