UNITED STATES
SECURITIES AND EXCHANGE COMMISSION
WASHINGTON, D.C. 20549
FORM N-CSR
CERTIFIED SHAREHOLDER REPORT OF REGISTERED
MANAGEMENT INVESTMENT COMPANIES
Investment Company Act file number 811-07255
Oppenheimer International Bond Fund
(Exact name of registrant as specified in charter)
6803 South Tucson Way, Centennial, Colorado 80112-3924
(Address of principal executive offices) (Zip code)
Arthur S. Gabinet
OFI Global Asset Management, Inc.
Two World Financial Center, New York, New York 10281-1008
(Name and address of agent for service)
Registrant’s telephone number, including area code: (303) 768-3200
Date of fiscal year end: September 30
Date of reporting period: 9/30/2013
Item 1. Reports to Stockholders.
ANNUAL REPORT 9.30.2013 OPPENEIMER INTERNATIOL BOND FUND OPPENHEIMER FUND THE RIGHT WAY TO INVEST
Table of Contents
Class A Shares
AVERAGE ANNUAL TOTAL RETURNS AT 9/30/13
| | | | | | | | | | | | | | | | | | | | | | | | |
| | | Class A Shares of the
Fund | | | | | | | | | | | | | |
| | | | | | | | | | | | JPMorgan | | | | | | | |
| | | | | | | | | Citigroup | | | Government | | | JPMorgan | | | | |
| | | Without | | | With | | | Non-U.S. | | | Bond Index- | | | Emerging | | | | |
| | | Sales | | | Sales | | | Dollar World | | | Emerging | | | Markets Bond | | | Reference | |
| | | Charge | | | Charge | | | Government | | | Markets | | | Index Global | | | Index | |
| | | | | | | | | Bond Index | | | Global | | | Diversified | | | | |
| | | | | | | | | | | | Diversified | | | | | | | |
| 1-Year | | | -2.77 % | | | | -7.39 % | | | | -5.65 % | | | | -3.74 % | | | | -4.06 % | | | | -4.67 % | |
| 5-Year | | | 5.68 | | | | 4.66 | | | | 4.27 | | | | 7.28 | | | | 9.75 | | | | 6.01 | |
| 10-Year | | | 7.28 | | | | 6.76 | | | | 4.91 | | | | 10.05 | | | | 8.46 | | | | 6.62 | |
Performance data quoted represents past performance, which does not guarantee future results. The investment return and principal value of an investment in the Fund will fluctuate so that an investor’s shares, when redeemed, may be worth more or less than their original cost. Fund returns include changes in share price, reinvested distributions, and a 4.75% maximum applicable sales charge except where “without sales charge” is indicated. Current performance may be lower or higher than the performance quoted. Returns do not consider capital gains or income taxes on an individual’s investment. For performance data current to the most recent month-end, visit oppenheimerfunds.com or call 1.800.CALL OPP (225.5677).
2 OPPENHEIMER INTERNATIONAL BOND FUND
Fund Performance Discussion
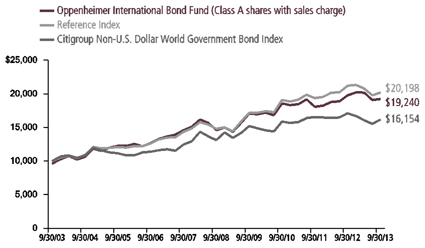
The Fund’s Class A shares (without sales charge) produced a total return of -2.77% during the 12-month reporting period. On a relative basis, the Fund outperformed its Reference Index, a customized weighted index currently comprised of 50% of the Citigroup Non-U.S. Dollar World Government Bond Index, 30% of the JPMorgan Government Bond Index - Emerging Markets Global Diversified, and 20% of the JPMorgan Emerging Markets Bond Index Global Diversified, which returned -4.67%.
MARKET OVERVIEW
Global economic sentiment was undermined early in the reporting period by a number of concerns, most notably lingering, yet diminished, debt concerns in Europe, economic slowdowns in China and other emerging markets, and high unemployment and muted housing recovery in the United States. However, investor optimism was boosted when central banks throughout the globe announced new accommodative policy measures intended to stimulate greater economic growth. The Federal Reserve (the “Fed”) continued open-ended quantitative
easing involving monthly purchases of mortgage-backed securities issued by U.S. government agencies, and the European Central Bank (the “ECB”) signaled its intention to purchase massive amounts of debt from troubled members of the European Union. In China, a new government was widely expected to adopt less restrictive monetary and fiscal policies. Even in Japan, which had been mired in economic weakness for years, new government leadership adopted economic policies and the central bank announced massive quantitative easing.
COMPARISON OF CHANGE IN VALUE OF $10,000 HYPOTHETICAL INVESTMENTS IN:
3 OPPENHEIMER INTERNATIONAL BOND FUND
In this environment, emerging market bonds performed well over the first half of the reporting period as economic concerns about a China slowdown abated, and as quantitative easing globally pushed investors into products that can potentially provide more yield. For U.S. residents, U.S. dollar-denominated securities outperformed their local currency-denominated counterparts as governments in Japan and Europe took steps to reduce the value of the yen and euro, respectively, relative to the U.S. dollar.
At the end of May, market volatility picked up measurably as comments from Fed Chairman Ben Bernanke at a Congressional hearing surprised the market when he indicated a possible slowdown of the central bank’s asset purchase program if the economy continued to show improvement. Fears about a possible slowdown in the word’s emerging economies were exacerbated by the prospect of quantitative easing, which has been a steady source of liquidity, coming to an end. As a result, risk assets sold off across the board, with Japanese stocks and emerging market debt absorbing the brunt of the selling, although investment grade credit was certainly not immune. Simultaneously, the intermediate and long-end of the U.S. Treasury curve steepened quite dramatically as investors began to price in the likelihood of higher interest rates in the future.
The final quarter of the reporting period marked a transition from expectations of tapering “very soon” to “tapering sometime later”, and this presented varying outcomes
for fixed-rate, duration-sensitive debt markets. U.S ten-year Treasury yields, which had risen to about 3.00%, rallied back closer to 2.60% as the prospects for Fed tapering abated when the Federal Open Market Committee (FOMC) decided to maintain its quantitative easing measures. A combination of Fed jaw-boning and the ascent of dovish Janet Yellen as a likely successor to Ben Bernanke were among the factors leading to lower U.S. yields. Not all debt markets recovered as strongly, however. Emerging market debt and high yield bonds did improve from their second quarter 2013 tail-spin, but neither has recovered fully yet.
FUND REVIEW
The Fund’s outperformance this reporting period was driven by its developed market debt strategies. In particular, we maintained a near zero allocation to the Japanese yen and favored the U.S. dollar. Our underweight position in the yen benefited the Fund as the introduction of quantitative easing in Japan pushed the yen lower along with yields on the longer term debt of that nation. A very low euro exposure benefited the Fund over the first half of the period amid ongoing turmoil in the Eurozone, though it hindered performance later in the period. While these underweight positions benefited performance, we also increased our developed market allocation to roughly 51%. This helped performance later in the period when developed markets generally outperformed emerging markets. Much of our re-allocation from emerging markets (particularly emerging market high yield
4 OPPENHEIMER INTERNATIONAL BOND FUND
sovereigns and local currency bonds) to developed markets was redeployed in European corporate debt and securitized assets. We have added banks and financials, transportation, energy, and BBB- and BB-rated industrials, primarily – but not exclusively – from core Europe. Among the names added were Deutsche Bank, Lloyds TSB Bank, Koninklijke KPN (a Dutch telecom company), and Portugal Telecom International Finance.
The performance of the emerging market sleeve presented varied results during a volatile period. Emerging market debt had a rough time after the initial rate rise in U. S. Treasuries. While emerging market countries linked to a modestly improving European economy fared better, those in Latin America and Asia that harbor high current account deficits, slackening economies, or that face political unrest, continued to swoon but at a more gradual rate than previously. Many of the nations that appeared to benefit from the Fed’s extraordinarily accommodative stance performed poorly when tapering fears peaked, and then rebounded somewhat in terms of the prices of their debt and currencies as tapering talk abated. Nevertheless, valuations in many cases now seem cheap, broadly speaking.
For the Fund, emerging market debt denominated in local currency was the most significant detractor from relative performance during the one-year reporting period, whereas U.S-dollar denominated emerging market debt outperformed. The
greatest detractor from performance was Turkey, where civil unrest broke out during the period. Venezuela and Ukraine U.S.- dollar denominated debt also hurt performance this period. Our limited exposure to Indonesia helped performance relative to the Reference Index. As mentioned earlier, we decreased our allocation to emerging markets debt during the reporting period, and increased our exposure to developed markets.
STRATEGY & OUTLOOK
Spikes in market volatility may be difficult to stomach although such potential “value creation events” do seem to be more common since 2008. The second quarter sell-off of international bonds was acute, and its repercussions did not fully dissipate as the third quarter progressed. While we continue to believe that the U.S. dollar is likely to remain relatively strong in the near term, the outsized spike in emerging market debt yields is not fully justified, in our view. To the extent that fast money has pushed the less liquid emerging market debt and domestic high yield bonds around in this “duration aversion shock”, we expect fundamentals to reassert themselves as 2013 comes to a close. The abrupt change in market sentiment did lay bare some fundamental challenges to countries with high current account deficits – challenges that a prolonged period of easy money in the U.S. may have masked to some degree. Washington’s debt ceiling imbroglio and posturing over the Affordable Care Act (often referred to as Obamacare) does not provide for calmer markets as we enter the fourth quarter.
5 OPPENHEIMER INTERNATIONAL BOND FUND
During periods of underperformance it is good to ask what has changed and what has not changed. Clearly, the Fed is closer but not quite ready to reduce its stimulative measures as the domestic economy expands; yet, the amount of liquidity injected by Japan into global capital markets would be expected to replenish much of what the Fed may remove. We expect Japan to be a source of meaningful liquidity for some time, and we note that both the Bank of England’s and the ECB’s forward guidance, if you will, will remain dovish. Australia is in easing mode, and only Brazil, and a few emerging market countries are in true tightening mode. China’s clamp-down on credit expansion is warranted, in our view, and unlikely to lead to an unreasonable contraction. While most emerging market economies are below trend growth, GDP is positive and likely to improve with the recovery in the U.S. and Europe. Moreover, we are witnessing signs that the recession in Europe has ended as the troubled continental economy may continue its moderate expansion. The outcome of the recession in Europe has ended as the troubled


1. Hemant Baijal became Portfolio Manager on January 28, 2013.
continental economy may continue its moderate expansion. The outcome of the upcoming U.S. debt ceiling debate could potentially cause a disruption in world economic growth should there be a prolonged period of time before a resolution.
At period end, the Fund had a roughly 51.2% allocation to developed markets, 24.5% to emerging markets denominated in U.S. dollars and 19.9% to emerging markets denominated in local currencies. After hedging, the Fund had a roughly 55% allocation to U.S. dollar exposure. We added high-grade emerging market sovereign debt at the expense of high-yield sovereign debt, and we look to add to European credit and securitized assets up to about 5%. The Fund’s overall duration remained shorter than its Reference Index. Our aversion to the yen is intact, but at period end we now have a roughly 1.2% exposure, and we remain underweight the euro with an approximate 13.3% allocation. Overall, the Fund is focused on diversified sources of risk-adjusted carry, or additional yield, by maintaining positions that boost income above that of the Reference Index – a strategy that will reap rewards in a low or moderate volatility environment in our view.

6 OPPENHEIMER INTERNATIONAL BOND FUND
Top Holdings and Allocations
TOP TEN GEOGRAPHICAL HOLDINGS
| | | | | | |
United States | | | 11 .8 | % | | |
Japan | | | 9 .3 | | | |
Mexico | | | 8 .7 | | | |
Russia | | | 7 .2 | | | |
Brazil | | | 7 .1 | | | |
United Kingdom | | | 6 .1 | | | |
Italy | | | 4 .9 | | | |
Germany | | | 4 .8 | | | |
France | | | 4 .4 | | | |
Australia | | | 3 .8 | | | |
| |
| Portfolio holdings and allocation are subject to change. Percentages are as of September 30, 2013, and are based on total market value of investments. | | | |
REGIONAL ALLOCATION
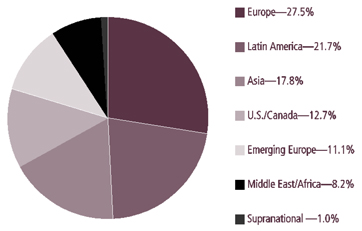
Portfolio holdings and allocations are subject to change. Percentages are as of September 30, 2013, and are based on the total market value of investments. Portfolio holdings and allocations are subject to change. Percentages are as of September 30, 2013, and are based on the total market value of investments.
7 OPPENHEIMER INTERNATIONAL BOND FUND
Share Class Performance
AVERAGE ANNUAL TOTAL RETURNS WITHOUT SALES CHARGE AS OF 9/30/13
| | | | | | | | | | |
| | | Inception Date | | 1-Year | | 5-Year | | | | 10-Year |
| Class A (OIBAX) | | 6/15/95 | | -2.77% | | 5.68% | | | | 7.28% |
| Class B (OIBBX) | | 6/15/95 | | -3.46% | | 4.78% | | | | 6.76% |
| Class C (OIBCX) | | 6/15/95 | | -3.30% | | 4.95% | | | | 6.53% |
| Class I (OIBIX) | | 1/27/12 | | -2.31% | | 1.93% | | * | | N/A |
| Class N (OIBNX) | | 3/1/01 | | -3.16% | | 5.24% | | | | 6.85% |
| Class Y (OIBYX) | | 9/27/04 | | -2.36% | | 5.99% | | | | 7.28% * |
|
AVERAGE ANNUAL TOTAL RETURNS WITH SALES CHARGE AS OF 9/30/13 |
| | | Inception Date | | 1-Year | | 5-Year | | | | 10-Year |
| Class A (OIBAX) | | 6/15/95 | | -7.39% | | 4.66% | | | | 6.76% |
| Class B (OIBBX) | | 6/15/95 | | -8.12% | | 4.45% | | | | 6.76% |
| Class C (OIBCX) | | 6/15/95 | | -4.23% | | 4.95% | | | | 6.53% |
| Class I (OIBIX) | | 1/27/12 | | -2.31% | | 1.93% | | * | | N/A |
| Class N (OIBNX) | | 3/1/01 | | -4.09% | | 5.24% | | | | 6.85% |
| Class Y (OIBYX) | | 9/27/04 | | -2.36% | | 5.99% | | | | 7.28% * |
* Shows performance since inception. | | | | | | | | |
STANDARDIZED YIELDS
| | | | | | |
| |
| For the 30 Days Ended 9/30/13 | | | |
| Class A | | | 3 .47 | % | | |
| Class B | | | 2 .81 | % | | |
| Class C | | | 2 .98 | % | | |
| Class I | | | 4 .11 | % | | |
| Class N | | | 3 .79 | % | | |
| Class Y | | | 3 .90 | % | | |
Performance data quoted represents past performance, which does not guarantee future results. The investment return and principal value of an investment in the Fund will fluctuate so that an investor’s shares, when redeemed, may be worth more or less than their original cost. Current performance may be lower or higher than the performance quoted. Returns do not consider capital gains or income taxes on an individual’s investment. For performance data current to the most recent month-end, visit oppenheimerfunds.com or call 1.800.CALL OPP (225.5677). Fund returns include changes in share price, reinvested distributions, and the applicable sales charge (unless otherwise indicated): for Class A shares, the current maximum initial sales charge of 4.75%; for Class B shares, the contingent deferred sales charge of 5% (1-year) and 2% (5-year); and for Class C and N shares, the contingent deferred sales charge of 1% for the 1-year period. There is no sales charge for Class I and Class Y shares. Because Class B shares convert to Class A shares
8 OPPENHEIMER INTERNATIONAL BOND FUND
72 months after purchase, the 10-year return for Class B shares uses Class A performance for the period after conversion. Returns for periods of less than one year are cumulative and not annualized.
Standardized yield is based on net investment income for the 30-day period ended 9/30/13 and the maximum offering price at the end of the period for Class A shares and the net asset value for Class B, Class C, Class I, Class N and Class Y shares. Each result is compounded semiannually and then annualized. Falling share prices will tend to artificially raise yields.
The Fund’s performance is compared to the Citigroup Non-U.S. Dollar World Government Bond Index, JPMorgan Government Bond Index - Emerging Markets Global Diversified, the JPMorgan Emerging Markets Bond Index Global Diversified, and the Fund’s Reference Index. The Citigroup Non-U.S. Dollar World Government Bond Index is an index of fixed rate government bonds with maturities of one year or longer. The JPMorgan Government Bond Index - Emerging Markets Global Diversified is a comprehensive, global local Emerging Markets Index, and consists of regularly traded, liquid fixed-rate, domestic currency government bonds to which international investors can gain exposure. The JPMorgan Emerging Markets Bond Index Global Diversified tracks total returns for U.S. dollar-denominated debt instruments issued by emerging market sovereign and quasi-sovereign entities: Brady bonds, loans, Eurobonds. The Fund’s Reference Index is a customized weighted index currently comprised of 50% of the Citigroup Non-U.S. Dollar World Government Bond Index, 30% of the JPMorgan Government Bond Index - Emerging Markets Global Diversified, and 20% of the JPMorgan Emerging Markets Bond Index Global Diversified. The indices are unmanaged and cannot be purchased directly by investors. Index performance includes reinvestment of income, but does not reflect transaction costs, fees, expenses or taxes. Index performance is shown for illustrative purposes only as a benchmark for the Fund’s performance, and does not predict or depict performance of the Fund. The Fund’s performance reflects the effects of the Fund’s business and operating expenses.
The Fund’s investment strategy and focus can change over time. The mention of specific fund holdings does not constitute a recommendation by OppenheimerFunds, Inc. or its affiliates.
Before investing in any of the Oppenheimer funds, investors should carefully consider a fund’s investment objectives, risks, charges and expenses. Fund prospectuses and summary prospectuses contain this and other information about the funds, and may be obtained by asking your financial advisor, visiting oppenheimerfunds.com, or calling 1.800.CALL OPP (225.5677). Read prospectuses and summary prospectuses carefully before investing.
Shares of Oppenheimer funds are not deposits or obligations of any bank, are not guaranteed by any bank, are not insured by the FDIC or any other agency, and involve investment risks, including the possible loss of the principal amount invested.
9 OPPENHEIMER INTERNATIONAL BOND FUND
Fund Expenses
Fund Expenses. As a shareholder of the Fund, you incur two types of costs: (1) transaction costs, which may include sales charges (loads) on purchase payments, contingent deferred sales charges on redemptions; and (2) ongoing costs, including management fees; distribution and service fees; and other Fund expenses. These examples are intended to help you understand your ongoing costs (in dollars) of investing in the Fund and to compare these costs with the ongoing costs of investing in other mutual funds.
The examples are based on an investment of $1,000.00 invested at the beginning of the period and held for the entire 6-month period ended September 30, 2013.
Actual Expenses. The first section of the table provides information about actual account values and actual expenses. You may use the information in this section for the class of shares you hold, together with the amount you invested, to estimate the expense that you paid over the period. Simply divide your account value by $1,000.00 (for example, an $8,600.00 account value divided by $1,000.00 = 8.60), then multiply the result by the number in the first section under the heading entitled “Expenses Paid During Period” to estimate the expenses you paid on your account during this period.
Hypothetical Example for Comparison Purposes. The second section of the table provides information about hypothetical account values and hypothetical expenses based on the Fund’s actual expense ratio for each class of shares, and an assumed rate of return of 5% per year for each class before expenses, which is not the actual return. The hypothetical account values and expenses may not be used to estimate the actual ending account balance or expenses you paid for the period. You may use this information to compare the ongoing costs of investing in the Fund and other funds. To do so, compare this 5% hypothetical example for the class of shares you hold with the 5% hypothetical examples that appear in the shareholder reports of the other funds.
Please note that the expenses shown in the table are meant to highlight your ongoing costs only and do not reflect any transactional costs, such as front-end or contingent deferred sales charges (loads), or a $12.00 fee imposed annually on accounts valued at less than $500.00 (subject to exceptions described in the Statement of Additional Information). Therefore, the “hypothetical” section of the table is useful in comparing ongoing costs only, and will not help you determine the relative total costs of owning different funds. In addition, if these transactional costs were included, your costs would have been higher.
10 OPPENHEIMER INTERNATIONAL BOND FUND
| | | | | | | | | | | | | | | | | | | | | |
| Actual | | Beginning
Account Value
April 1, 2013 | | Ending Account Value September 30, 2013 | | Expenses Paid During 6 Months Ended
September 30, 2013 |
Class A | | $ | | | | 1,000.00 | | | $ 952.90 | | | $ 4.96 | |
Class B | | | | | | 1,000.00 | | | | | | | 950.10 | | | | | | | 9.14 | |
Class C | | | | | | 1,000.00 | | | | | | | 950.90 | | | | | | | 8.35 | |
Class I | | | | | | 1,000.00 | | | | | | | 954.90 | | | | | | | 2.80 | |
Class N | | | | | | 1,000.00 | | | | | | | 951.20 | | | | | | | 6.87 | |
Class Y | | | | | | 1,000.00 | | | | | | | 955.60 | | | | | | | 3.63 | |
| | | | | | |
Hypothetical | | | | | | | | | | | | | | | | | | | | | |
| (5% return before expenses) | | | | | | | | | | | | | | | | | | | | | |
Class A | | | | | | 1,000.00 | | | | | | | 1,020.00 | | | | | | | 5.13 | |
Class B | | | | | | 1,000.00 | | | | | | | 1,015.74 | | | | | | | 9.44 | |
Class C | | | | | | 1,000.00 | | | | | | | 1,016.55 | | | | | | | 8.63 | |
Class I | | | | | | 1,000.00 | | | | | | | 1,022.21 | | | | | | | 2.89 | |
Class N | | | | | | 1,000.00 | | | | | | | 1,018.05 | | | | | | | 7.11 | |
Class Y | | | | | | 1,000.00 | | | | | | | 1,021.36 | | | | | | | 3.76 | |
Expenses are equal to the Fund’s annualized expense ratio for that class, multiplied by the average account value over the period, multiplied by 183/365 (to reflect the one-half year period). Those annualized expense ratios, excluding indirect expenses from affiliated funds, based on the 6-month period ended September 30, 2013 are as follows:
| | | | | | | |
| Class | | Expense Ratios | | |
Class A | | | | 1.01 | % | | |
Class B | | | | 1.86 | | | |
Class C | | | | 1.70 | | | |
Class I | | | | 0.57 | | | |
Class N | | | | 1.40 | | | |
Class Y | | | | 0.74 | | | |
The expense ratios reflect voluntary waivers and/or reimbursements of expenses by the Fund’s Manager and Transfer Agent. Some of these undertakings may be modified or terminated at any time, as indicated in the Fund’s prospectus. The “Financial Highlights” tables in the Fund’s financial statements, included in this report, also show the gross expense ratios, without such waivers or reimbursements and reduction to custodian expenses, if applicable.
11 OPPENHEIMER INTERNATIONAL BOND FUND
| | | | |
| | |
| | STATEMENTOF INVESTMENTS September 30, 2013 | | |
| | | | | | | | | | |
| | | |
| Principal
Amount |
| | | Valu | e |
| Asset-Backed Securities—0.2% | | | | | | | | | | |
| Axius Europe CLO SA, Series 2007-1X, Cl. E, 4.803%, 11/15/231 | | | | $ | 6,972,613 | | | $ | 8,716,340 | |
| Halcyon Structured Asset Management European CLO BV, Series 2006-IIX, Cl. E, 4.19%, 1/25/231 | | | | | 6,470,000 | | | | 7,561,665 | |
| Stichting Halcyon Structured Asset Management European, Series 2007-IX, Cl. E, 4.134%, 7/24/231 | | | | | 1,654,222 | | | | 1,987,570 | |
| Theseus European CLO SA, Series 2006-1X, Cl. E, 4.343%, 8/27/221 | | | | | 3,505,000 | | | | 4,446,634 | |
| Total Asset-Backed Securities (Cost $21,260,339) | | | | | | | | | 22,712,209 | |
| U.S. Government Obligations—7.2% | | | | | | | | | | |
| U.S. Treasury Bills: | | | | | | | | | | |
| 0.003%, 12/12/133 | | | | | 246,070,000 | | | | 246,053,229 | |
| 0.029%, 11/14/133 | | | | | 175,000,000 | | | | 174,995,275 | |
| 0.029%, 11/7/13 | | | | | 148,890,000 | | | | 148,886,724 | |
| 0.053%, 10/31/133,4 | | | | | 133,810,000 | | | | 133,806,655 | |
| U.S. Treasury Nts., 0.625%, 8/15/16 | | | | | 85,000,000 | | | | 85,076,330 | |
| Total U.S. Government Obligations (Cost $788,637,907) | | | | | | | | | 788,818,213 | |
| Foreign Government Obligations—60.7% | | | | | | | | | | |
| Angola—0.2% | | | | | | | | | | |
| Republic of Angola Via Northern Lights III BV Sr. Unsec. Nts., 7%, 8/16/19 | | USD | | | 24,225,000 | | | | 26,072,156 | |
| Australia—2.8% | | | | | | | | | | |
| New South Wales Treasury Corp. Sr. Unsec. Nts., 6%, Series 19, 4/1/19 | | AUD | | | 15,520,000 | | | | 16,139,419 | |
| Queensland Treasury Corp. Sr. Unsec. Nts.: | | | | | | | | | | |
| Series 19, 6.25%, 6/14/19 | | AUD | | | 19,590,000 | | | | 20,606,332 | |
| Series 21, 6.00%, 6/14/21 | | AUD | | | 134,010,000 | | | | 140,246,482 | |
| Series 22, 6.00%, 7/21/22 | | AUD | | | 6,565,000 | | | | 6,742,982 | |
Victoria Treasury Corp. Sr. Unsec. Nts.: 5.50%, 11/17/26 | | AUD | | | 85,540,000 | | | | 85,194,201 | |
| Series 1224, 5.50%, 12/17/24 | | AUD | | | 18,415,000 | | | | 18,502,403 | |
| Western Australia Treasury Corp. Unsec. Nts., 7%, Series 19, 10/15/19 | | AUD | | | 7,500,000 | | | | 8,111,752 | |
| | | | | | | | | | 295,543,571 | |
| Belgium—1.5% | | | | | | | | | | |
| Kingdom of Belgium Unsec. Bonds, 4.25%, Series 60, 3/28/415 | | EUR | | | 5,055,000 | | | | 7,665,655 | |
| Kingdom of Belgium Bonds, 3.75%, Series 58, 9/28/20 | | EUR | | | 100,000,000 | | | | 151,636,896 | |
| | | | | | | | | | 159,302,551 | |
| Bolivia—0.0% | | | | | | | | | | |
| Plurinational State of Bolivia Sr. Unsec. Nts., 4.875%, 10/29/225 | | USD | | | 2,445,000 | | | | 2,221,894 | |
| Brazil—4.2% | | | | | | | | | | |
| Brazil Minas SPE via State of Minas Gerais Sec. Bonds, 5.333%, 2/15/285 | | USD | | | 12,675,000 | | | | 12,263,062 | |
| Federative Republic of Brazil Letra Tesouro Nacional Sr. Unsec. Nts., 9.029%, 1/1/142 | | BRL | | | 243,910,000 | | | | 107,542,487 | |
| Federative Republic of Brazil Letra Tesouro Nacional Unsec. Nts., 8.897%, 7/1/142 | | BRL | | | 122,850,000 | | | | 51,698,160 | |
12 OPPENHEIMER INTERNATIONAL BOND FUND
| | | | | | | | | | |
| | | | |
| Principal
Amount |
| | | Valu | e |
| Brazil Continued | | | | | | | | | | |
| Federative Republic of Brazil Nota Do Tesouro Nacional Sr. Unsec. Nts., 9.762%, 1/1/17 | | BRL | | | 121,585,000 | | | $ | 53,041,358 | |
| Federative Republic of Brazil Nota Do Tesouro Nacional Unsec. Nts.: | | | | | | | | | | |
| 9.762%, 1/1/14 | | BRL | | | 128,625,000 | | | | 58,048,135 | |
| 9.762%, 1/1/18 | | BRL | | | 76,680,000 | | | | 33,046,438 | |
| 9.762%, 1/1/21 | | BRL | | | 203,440,000 | | | | 85,223,415 | |
| 13.288%, 8/15/506 | | BRL | | | 19,290,000 | | | | 20,322,403 | |
| 13.505%, 5/15/456 | | BRL | | | 21,060,000 | | | | 22,309,716 | |
| Federative Republic of Brazil Sr. Unsec. Nts., 4.875%, 1/22/21 | | USD | | | 12,573,000 | | | | 13,563,124 | |
| | | | | | | | | | 457,058,298 | |
| Canada—1.0% | | | | | | | | | | |
| Canada Treasury Bills, 1.037%, 12/5/132 | | CAD | | | 32,835,000 | | | | 31,821,627 | |
| Canada Unsec. Bonds, 3.75%, 6/1/19 | | CAD | | | 73,380,000 | | | | 77,863,799 | |
| | | | | | | | | | 109,685,426 | |
| Colombia—0.4% | | | | | | | | | | |
| Republic of Colombia Sr. Unsec. Bonds, 6.125%, 1/18/41 | | USD | | | 3,135,000 | | | | 3,440,662 | |
| Republic of Colombia Sr. Unsec. Nts.: | | | | | | | | | | |
| 4.00%, 2/26/24 | | USD | | | 11,010,000 | | | | 10,817,325 | |
| 7.375%, 1/27/17 | | USD | | | 4,470,000 | | | | 5,225,430 | |
| 7.375%, 3/18/19 | | USD | | | 19,585,000 | | | | 23,815,360 | |
| 8.125%, 5/21/24 | | USD | | | 6,980,000 | | | | 9,047,825 | |
| Series B, 10.00%, 7/24/24 | | COP | | | 5,474,000,000 | | | | 3,573,927 | |
| | | | | | | | | | 55,920,529 | |
| Costa Rica—0.0% | | | | | | | | | | |
| Republic of Costa Rica Sr. Unsec. Bonds, 4.375%, 4/30/255 | | USD | | | 1,760,000 | | | | 1,544,400 | |
| Croatia—0.3% | | | | | | | | | | |
| Republic of Croatia Sr. Unsec. Nts.: | | | | | | | | | | |
| 5.50%, 4/4/235 | | USD | | | 18,975,000 | | | | 18,263,437 | |
| 6.25%, 4/27/175 | | USD | | | 9,450,000 | | | | 9,953,874 | |
| 6.375%, 3/24/215 | | USD | | | 4,635,000 | | | | 4,809,971 | |
| 6.75%, 11/5/195 | | USD | | | 4,535,000 | | | | 4,858,119 | |
| | | | | | | | | | 37,885,401 | |
| Denmark—0.4% | | | | | | | | | | |
| Kingdom of Denmark Unsec. Nts., 4%, 11/15/19 | | DKK | | | 220,720,000 | | | | 46,764,767 | |
| Dominican Republic—0.2% | | | | | | | | | | |
| Banco de Reservas de la Republica Dominicana Sub. Nts., 7%, 2/1/235 | | USD | | | 7,305,000 | | | | 6,976,275 | |
| Dominican Republic Sr. Unsec. Bonds, 5.875%, 4/18/245 | | USD | | | 8,080,000 | | | | 7,534,600 | |
| | | | | | | | | | 14,510,875 | |
| Finland—0.6% | | | | | | | | | | |
| Republic of Finland Sr. Unsec. Nts.: | | | | | | | | | | |
| 1.50%, 4/15/235 | | EUR | | | 29,645,000 | | | | 38,371,849 | |
| 1.625%, 9/15/225 | | EUR | | | 20,300,000 | | | | 26,854,360 | |
| | | | | | | | | | 65,226,209 | |
| France—2.7% | | | | | | | | | | |
| Government of France Unsec. Bonds: | | | | | | | | | | |
| 2.75%, 10/25/27 | | EUR | | | 25,245,000 | | | | 33,571,624 | |
13 OPPENHEIMER INTERNATIONAL BOND FUND
| | | | |
| | |
| | STATEMENTOF INVESTMENTS Continued | | |
| | | | | | | | | | |
| | | | |
| Principal
Amount |
| | | Valu | e |
| France Continued | | | | | | | | | | |
| Government of France Unsec. Bonds: Continued | | | | | | | | | | |
| 4.50%, 4/25/41 | | EUR | | | 58,950,000 | | | $ | 95,708,025 | |
| Government of France Unsec. Nts.: | | | | | | | | | | |
| 2.25%, 10/25/22 | | EUR | | | 64,835,000 | | | | 88,052,527 | |
| 3.75%, 10/25/19 | | EUR | | | 46,690,000 | �� | | | 71,741,935 | |
| | | | | | | | | | 289,074,111 | |
| Germany—4.4% | | | | | | | | | | |
| Federal Republic of Germany Unsec. Bonds, 2.50%, 7/4/44 | | EUR | | | 36,120,000 | | | | 47,880,313 | |
| Federal Republic of Germany Unsec. Nts.: | | | | | | | | | | |
| 0.25%, 4/13/18 | | EUR | | | 97,970,000 | | | | 130,041,816 | |
| 1.50%, 5/15/23 | | EUR | | | 120,045,000 | | | | 159,040,325 | |
| 4.00%, 10/11/13 | | EUR | | | 104,110,000 | | | | 140,947,465 | |
| | | | | | | | | | 477,909,919 | |
| Guatemala—0.1% | | | | | | | | | | |
| Republic of Guatemala Sr. Unsec. Bonds, 4.875%, 2/13/285 | | USD | | | 7,935,000 | | | | 7,300,200 | |
| Hungary—1.5% | | | | | | | | | | |
| Hungary Sr. Unsec. Bonds, 7.625%, 3/29/41 | | USD | | | 925,000 | | | | 994,375 | |
| Hungary Sr. Unsec. Nts.: | | | | | | | | | | |
| 5.375%, 2/21/23 | | USD | | | 15,750,000 | | | | 15,395,625 | |
| 5.75%, 6/11/18 | | EUR | | | 2,220,000 | | | | 3,153,493 | |
| 6.375%, 3/29/21 | | USD | | | 21,340,000 | | | | 22,807,125 | |
| Hungary Unsec. Bonds: | | | | | | | | | | |
| Series 17/A, 6.75%, 11/24/17 | | HUF | | | 3,634,000,000 | | | | 17,681,151 | |
| Series 19/A, 6.50%, 6/24/19 | | HUF | | | 3,733,000,000 | | | | 18,052,970 | |
| Series 20/A, 7.50%, 11/12/20 | | HUF | | | 2,065,000,000 | | | | 10,539,982 | |
| Series 23/A, 6.00%, 11/24/23 | | HUF | | | 4,296,900,000 | | | | 19,842,356 | |
| Hungary Unsec. Nts.: | | | | | | | | | | |
| Series 16/D, 5.50%, 12/22/16 | | HUF | | | 3,416,000,000 | | | | 16,046,574 | |
| Series 18/A, 5.50%, 12/20/18 | | HUF | | | 9,208,000,000 | | | | 42,679,937 | |
| | | | | | | | | | 167,193,588 | |
| Indonesia—0.5% | | | | | | | | | | |
| Perusahaan Penerbit SBSN Indonesia Sr. Unsec. Bonds, 4%, 11/21/185 | | USD | | | 15,790,000 | | | | 15,355,775 | |
| Perusahaan Penerbit SBSN Indonesia Unsec. Nts., 6.125%, 3/15/195 | | USD | | | 9,685,000 | | | | 10,145,037 | |
| Republic of Indonesia Sr. Unsec. Nts.: | | | | | | | | | | |
| 4.875%, 5/5/215 | | USD | | | 14,755,000 | | | | 14,681,225 | |
| 5.375%, 10/17/235 | | USD | | | 16,640,000 | | | | 16,640,000 | |
| 11.625%, 3/4/195 | | USD | | | 3,265,000 | | | | 4,371,019 | |
| | | | | | | | | | 61,193,056 | |
| Italy—4.7% | | | | | | | | | | |
| Republic of Italy Buoni Ordinari del Tesoro BOT, 0.427%, 10/31/132 | | EUR | | | 15,545,000 | | | | 21,022,712 | |
| Republic of Italy Buoni Poliennali del Tesoro Unsec. Bonds: | | | | | | | | | | |
| 3.50%, 11/1/17 | | EUR | | | 21,770,000 | | | | 29,945,270 | |
| 4.00%, 9/1/20 | | EUR | | | 54,165,000 | | | | 74,478,864 | |
| 4.50%, 3/1/19 | | EUR | | | 126,305,000 | | | | 179,483,652 | |
| 4.75%, 9/1/445 | | EUR | | | 20,230,000 | | | | 25,823,360 | |
| 5.00%, 3/1/22 | | EUR | | | 10,125,000 | | | | 14,503,025 | |
| 5.00%, 9/1/40 | | EUR | | | 40,540,000 | | | | 54,361,906 | |
14 OPPENHEIMER INTERNATIONAL BOND FUND
| | | | | | | | | | |
| | | | |
| Principal
Amount |
| | | Valu | e |
| Italy Continued | | | | | | | | | | |
| Republic of Italy Buoni Poliennali del Tesoro Unsec. Nts., 4.75%, 5/1/17 | | EUR | | | 27,240,000 | | | $ | 39,154,124 | |
| Republic of Italy Certificati di Credito del Tesoro Unsec. Nts., 1.129%, 10/15/171 | | EUR | | | 22,685,000 | | | | 29,081,952 | |
| Republic of Italy International Sr. Unsec. Bonds, 4.50%, 6/8/15 | | JPY | | | 4,391,000,000 | | | | 46,729,943 | |
| | | | | | | | | | 514,584,808 | |
| Ivory Coast—0.3% | | | | | | | | | | |
| Republic of Cote d’Ivoire Sr. Unsec. Bonds, 5.75%, 12/31/321 | | USD | | | 37,205,000 | | | | 33,019,438 | |
| Japan—8.8% | | | | | | | | | | |
| Japan Bank for International Cooperation Sr. Unsec. Nts., 2.30%, 3/19/18 | | CAD | | | 13,205,000 | | | | 12,726,182 | |
| Japan Sr. Unsec. Bonds: | | | | | | | | | | |
| Series 112, 2.10%, 6/20/29 | | JPY | | | 14,243,000,000 | | | | 162,893,146 | |
| Series 134, 1.80%, 3/20/32 | | JPY | | | 9,053,000,000 | | | | 96,632,935 | |
| Series 143, 1.60%, 3/20/33 | | JPY | | | 13,914,000,000 | | | | 142,656,755 | |
| Series 314, 1.10%, 3/20/21 | | JPY | | | 16,614,000,000 | | | | 176,746,964 | |
| Series 328, 0.60%, 3/20/23 | | JPY | | | 10,115,000,000 | | | | 102,415,726 | |
| Series 329, 0.80%, 6/20/23 | | JPY | | | 3,029,000,000 | | | | 31,194,401 | |
| Series 36, 2.00%, 3/20/42 | | JPY | | | 17,678,000,000 | | | | 192,121,796 | |
| Series 38, 1.80%, 3/20/43 | | JPY | | | 3,031,000,000 | | | | 31,485,798 | |
| Series 39, 1.90%, 6/20/43 | | JPY | | | 1,010,000,000 | | | | 10,724,382 | |
| | | | | | | | | | 959,598,085 | |
| Kazakhstan—0.1% | | | | | | | | | | |
| Development Bank of Kazakhstan JSC Sr. Unsec. Bonds, 4.125%, 12/10/225 | | USD | | | 5,645,000 | | | | 5,235,737 | |
| Latvia—0.1% | | | | | | | | | | |
| Republic of Latvia Sr. Unsec. Nts., 5.25%, 6/16/215 | | USD | | | 6,855,000 | | | | 7,446,244 | |
| Lithuania—0.3% | | | | | | | | | | |
| Republic of Lithuania Sr. Unsec. Bonds: | | | | | | | | | | |
| 6.125%, 3/9/215 | | USD | | | 14,430,000 | | | | 16,540,387 | |
| 6.625%, 2/1/225 | | USD | | | 13,255,000 | | | | 15,591,194 | |
| | | | | | | | | | 32,131,581 | |
| Malaysia—0.9% | | | | | | | | | | |
| Bank Negara Malaysia Treasury Bills: | | | | | | | | | | |
| Series 0213, 2.975%, 1/9/142 | | MYR | | | 64,245,000 | | | | 19,548,042 | |
| Series 0413, 2.974%, 1/16/142 | | MYR | | | 128,495,000 | | | | 39,074,937 | |
| Series 2513, 2.953%, 12/5/132 | | MYR | | | 32,125,000 | | | | 9,804,576 | |
| Federation of Malaysia Sr. Unsec. Bonds, 4.262%, 9/15/16 | | MYR | | | 83,350,000 | | | | 26,171,235 | |
| | | | | | | | | | 94,598,790 | |
| Mexico—5.7% | | | | | | | | | | |
| United Mexican States Sr. Unsec. Bonds: | | | | | | | | | | |
| 6.75%, 9/27/34 | | USD | | | 6,275,000 | | | | 7,467,250 | |
| 7.50%, 4/8/33 | | USD | | | 2,375,000 | | | | 3,028,125 | |
| United Mexican States Treasury Bills: | | | | | | | | | | |
| 3.692%, 3/6/14 | | MXN | | | 355,340,000 | | | | 26,722,643 | |
| 3.761%, 10/31/13 | | MXN | | | 362,070,000 | | | | 27,575,630 | |
| 3.796%, 11/14/132 | | MXN | | | 751,065,000 | | | | 57,122,138 | |
| 3.807%, 10/3/13 | | MXN | | | 388,000,000 | | | | 29,633,187 | |
| 3.945%, 12/11/13 | | MXN | | | 318,600,000 | | | | 24,168,522 | |
15 OPPENHEIMER INTERNATIONAL BOND FUND
| | | | |
| | |
| | STATEMENTOF INVESTMENTS Continued | | |
| | | | | | | | | | |
| | | | |
| Principal
Amount |
| | | Valu | e |
| Mexico Continued | | | | | | | | | | |
| United Mexican States Treasury Bills: Continued | | | | | | | | | | |
| 3.982%, 11/7/13 | | MXN | | | 513,700,000 | | | $ | 39,057,604 | |
| 3.99%, 2/6/14 | | MXN | | | 318,600,000 | | | | 24,030,027 | |
| 3.993%, 1/23/14 | | MXN | | | 253,500,000 | | | | 19,147,631 | |
| United Mexican States Unsec. Bonds: | | | | | | | | | | |
| Series M, 5.00%, 6/15/17 | | MXN | | | 284,215,000 | | | | 22,146,601 | |
| Series M, 6.50%, 6/9/22 | | MXN | | | 607,450,000 | | | | 48,165,478 | |
| Series M, 7.00%, 6/19/14 | | MXN | | | 258,550,000 | | | | 20,302,343 | |
| Series M, 8.00%, 12/19/13 | | MXN | | | 1,969,200,000 | | | | 152,000,968 | |
| Series M10, 7.75%, 12/14/17 | | MXN | | | 751,940,000 | | | | 64,272,243 | |
| Series M20, 7.50%, 6/3/27 | | MXN | | | 376,370,000 | | | | 31,536,065 | |
| Series M20, 8.50%, 5/31/29 | | MXN | | | 297,480,000 | | | | 26,587,705 | |
| | | | | | | | | | 622,964,160 | |
| Morocco—0.1% | | | | | | | | | | |
| Kingdom of Morocco Sr. Unsec. Nts., 4.25%, 12/11/225 | | USD | | | 10,365,000 | | | | 9,486,048 | |
| Netherlands—0.7% | | | | | | | | | | |
| Kingdom of the Netherlands Unsec. Bonds: | | | | | | | | | | |
| 4.00%, 7/15/195 | | EUR | | | 37,870,000 | | | | 58,943,012 | |
| 4.00%, 1/15/375 | | EUR | | | 13,535,000 | | | | 22,214,582 | |
| | | | | | | | | | 81,157,594 | |
| Nigeria—0.5% | | | | | | | | | | |
| Federal Republic of Nigeria Treasury Bills: | | | | | | | | | | |
| 11.235%, 1/23/142 | | NGN | | | 1,426,000,000 | | | | 8,537,909 | |
| 11.835%, 10/24/132 | | NGN | | | 354,000,000 | | | | 2,179,508 | |
| 11.851%, 10/10/132 | | NGN | | | 269,000,000 | | | | 1,663,329 | |
| Federal Republic of Nigeria Unsec. Bonds: | | | | | | | | | | |
| 7.00%, 10/23/19 | | NGN | | | 1,658,000,000 | | | | 7,707,348 | |
| 16.00%, 6/29/19 | | NGN | | | 1,690,000,000 | | | | 11,629,589 | |
| 16.39%, 1/27/22 | | NGN | | | 1,786,000,000 | | | | 12,816,232 | |
| Republic of Nigeria Sr. Unsec. Bonds, 5.125%, 7/12/185 | | USD | | | 5,755,000 | | | | 5,855,712 | |
| | | | | | | | | | 50,389,627 | |
| Panama—0.1% | | | | | | | | | | |
| Republic of Panama Sr. Unsec. Bonds: | | | | | | | | | | |
| 6.70%, 1/26/36 | | USD | | | 8,115,000 | | | | 9,311,962 | |
| 8.875%, 9/30/27 | | USD | | | 3,530,000 | | | | 4,880,225 | |
| 9.375%, 4/1/29 | | USD | | | 3,515,000 | | | | 5,035,237 | |
| | | | | | | | | | 19,227,424 | |
| Paraguay—0.0% | | | | | | | | | | |
| Republic of Paraguay Sr. Unsec. Bonds, 4.625%, 1/25/235 | | USD | | | 2,560,000 | | | | 2,348,800 | |
| Peru—0.5% | | | | | | | | | | |
| El Fondo MIVIVIENDA SA Unsec. Nts., 3.50%, 1/31/235 | | USD | | | 8,095,000 | | | | 7,062,888 | |
| Republic of Peru Sr. Unsec. Bonds: | | | | | | | | | | |
| 6.55%, 3/14/37 | | USD | | | 6,435,000 | | | | 7,641,562 | |
| 7.84%, 8/12/205 | | PEN | | | 46,865,000 | | | | 19,521,586 | |
| 8.20%, 8/12/265 | | PEN | | | 50,410,000 | | | | 22,067,091 | |
| | | | | | | | | 56,293,127 | |
16 OPPENHEIMER INTERNATIONAL BOND FUND
| | | | | | | | | | | | |
| | | | |
| Principal
Amount |
| | | | | Value | |
| Philippines—0.2% | | | | | | | | | | | | |
| Republic of the Philippines Sr. Unsec. Bonds: | | | | | | | | | | | | |
| 6.375%, 1/15/32 | | USD | | | $ 11,750,000 | | | $ | | | 13,806,250 | |
| 6.375%, 10/23/34 | | USD | | | 11,680,000 | | | 13,797,000 | |
| | | | | | | | | | | | 27,603,250 | |
| Poland—1.0% | | | | | | | | | | | | |
| Republic of Poland Sr. Unsec. Bonds: | | | | | | | | | | | | |
| 3.00%, 3/17/23 | | USD | | | 8,160,000 | | | | | | 7,494,960 | |
| 5.00%, 3/23/22 | | USD | | | 7,970,000 | | | | | | 8,591,660 | |
| 5.125%, 4/21/21 | | USD | | | 13,800,000 | | | | | | 15,042,000 | |
| Republic of Poland Unsec. Bonds: | | | | | | | | | | | | |
| 5.25%, 10/25/17 | | PLN | | | 103,545,000 | | | | | | 35,080,496 | |
| 5.50%, 4/25/15 | | PLN | | | 74,715,000 | | | | | | 24,819,802 | |
| 5.75%, 4/25/29 | | PLN | | | 69,995,000 | | | | | | 24,896,375 | |
| | | | | | | | | | | | 115,925,293 | |
| Portugal—1.2% | | | | | | | | | | | | |
| Republic of Portugal Obrigacoes do Tesouro OT: | | | | | | | | | | | | |
| 4.10%, 4/15/37 | | EUR | | | 23,735,000 | | | | | | 22,195,643 | |
| 4.35%, 10/16/175 | | EUR | | | 78,070,000 | | | | | | 100,072,634 | |
| 4.75%, 6/14/19 | | EUR | | | 4,390,000 | | | | | | 5,493,407 | |
| | | | | | | | | | | | 127,761,684 | |
| Romania—0.2% | | | | | | | | | | | | |
| Romania Sr. Unsec. Bonds, 6.75%, 2/7/225 | | USD | | | 14,425,000 | | | | | | 16,501,479 | |
| Russia—3.0% | | | | | | | | | | | | |
| AHML Via AHML Finance Ltd. Unsec. Nts., 7.75%, 2/13/185 | | RUB | | | 346,100,000 | | | | | | 10,445,541 | |
| Russian Federation Sr. Unsec. Bonds: | | | | | | | | | | | | |
| 4.875%, 9/16/235 | | USD | | | 9,765,000 | | | | | | 10,009,125 | |
| 5.875%, 9/16/435 | | USD | | | 6,655,000 | | | | | | 6,904,562 | |
| Series 6211, 7.00%, 1/25/23 | | RUB | | | 2,365,300,000 | | | | | | 72,269,710 | |
| Russian Federation Unsec. Bonds: | | | | | | | | | | | | |
| Series 6204, 7.50%, 3/15/18 | | RUB | | | 1,022,600,000 | | | | | | 32,656,987 | |
| Series 6205, 7.60%, 4/14/21 | | RUB | | | 1,467,700,000 | | | | | | 46,837,393 | |
| Series 6208, 7.50%, 2/27/19 | | RUB | | | 1,349,700,000 | | | | | | 43,019,696 | |
| Series 6209, 7.60%, 7/20/22 | | RUB | | | 1,040,300,000 | | | | | | 33,021,575 | |
| Vnesheconombank Sr. Unsec. Bonds, Series 18, 8.55%, 9/17/321 | | RUB | | | 279,000,000 | | | | | | 8,800,148 | |
| Vnesheconombank Sr. Unsec. Bonds, Series 9, 7.90%, 3/18/211 | | RUB | | | 256,800,000 | | | | | | 7,969,150 | |
| Vnesheconombank Via VEB Finance plc Sr. Unsec. Bonds: | | | | | | | | | | | | |
| 5.375%, 2/13/175 | | USD | | | 9,910,000 | | | | | | 10,514,510 | |
| 5.45%, 11/22/175 | | USD | | | 11,295,000 | | | | | | 12,041,600 | |
| 6.902%, 7/9/205 | | USD | | | 21,205,000 | | | | | | 23,326,560 | |
| | | | | | | | | | | | 317,816,557 | |
| Rwanda—0.1% | | | | | | | | | | | | |
| Republic of Rwanda Sr. Unsec. Bonds, 6.625%, 5/2/235 | | USD | | | 10,815,000 | | | | | | 9,544,237 | |
| Serbia—0.2% | | | | | | | | | | | | |
| Republic of Serbia Sr. Unsec. Bonds, 5.25%, 11/21/175 | | USD | | | 7,160,000 | | | | | | 7,142,100 | |
| Republic of Serbia Treasury Bills: | | | | | | | | | | | | |
| 9.824%, 1/30/142 | | RSD | | | 317,000,000 | | | | | | 3,641,612 | |
| 10.004%, 6/12/142 | | RSD | | | 1,287,000,000 | | | | | | 14,220,495 | |
| | | | | | | | | | | 25,004,207 | |
17 OPPENHEIMER INTERNATIONAL BOND FUND
| | | | |
| | |
| | STATEMENTOF INVESTMENTS Continued | | |
| | | | | | | | | | | | |
| | | | |
| Principal
Amount |
| | | | | Value | |
| Singapore—0.2% | | | | | | | | | | | | |
| Republic of Singapore Sr. Unsec. Bonds, 2.375%, 4/1/17 | | SGD | | | 25,130,000 | | | $ | | | 21,246,133 | |
| South Africa—2.0% | | | | | | | | | | | | |
| Republic of South Africa Sr. Unsec. Bonds: | | | | | | | | | | | | |
| 5.875%, 5/30/22 | | USD | | | 2,200,000 | | | | | | 2,387,000 | |
| 5.875%, 9/16/25 | | USD | | | 9,810,000 | | | | | | 10,342,192 | |
| Series R207, 7.25%, 1/15/20 | | ZAR | | | 678,740,000 | | | | | | 67,582,636 | |
| Series R208, 6.75%, 3/31/21 | | ZAR | | | 995,785,000 | | | | | | 95,631,660 | |
| Republic of South Africa Unsec. Bonds: | | | | | | | | | | | | |
| Series 2023, 7.75%, 2/28/23 | | ZAR | | | 176,270,000 | | | | | | 17,683,444 | |
| Series R213, 7.00%, 2/28/31 | | ZAR | | | 227,086,000 | | | | | | 19,470,534 | |
| | | | | | | | | | | | 213,097,466 | |
| South Korea—0.2% | | | | | | | | | | | | |
| Korea Housing Finance Corp. Sec. Nts., 1.625%, 9/15/185 | | USD | | | 26,200,000 | | | | | | 24,753,026 | |
| Spain—0.9% | | | | | | | | | | | | |
| Autonomous Community of Madrid Spain Sr. Unsec. Bonds, 4.30%, 9/15/26 | | EUR | | | 49,775,000 | | | | | | 59,965,124 | |
| Instituto de Credito Oficial Sr. Unsec. Nts., 5%, 5/15/15 | | NOK | | | 75,000,000 | | | | | | 12,563,580 | |
| Kingdom of Spain Sr. Unsec. Bonds, 4.50%, 1/31/18 | | EUR | | | 18,675,000 | | | | | | 26,959,821 | |
| | | | | | | | | | | | 99,488,525 | |
| Sri Lanka—0.3% | | | | | | | | | | | | |
| Democratic Socialist Republic of Sri Lanka Sr. Unsec. Bonds: | | | | | | | | | | | | |
| 5.875%, 7/25/225 | | USD | | | 5,970,000 | | | | | | 5,522,250 | |
| 6.25%, 10/4/205 | | USD | | | 6,570,000 | | | | | | 6,430,388 | |
| 6.25%, 7/27/215 | | USD | | | 12,385,000 | | | | | | 11,920,563 | |
| | | | | | | | | | | | 23,873,201 | |
| Tanzania—0.1% | | | | | | | | | | | | |
| United Republic of Tanzania Sr. Unsec. Nts., 6.392%, 3/9/201 | | USD | | | 9,950,000 | | | | | | 10,323,125 | |
| Thailand—0.8% | | | | | | | | | | | | |
| Kingdom of Thailand Sr. Unsec. Bonds: | | | | | | | | | | | | |
| 3.58%, 12/17/27 | | THB | | | 1,085,000,000 | | | | | | 32,729,573 | |
| 3.625%, 6/16/23 | | THB | | | 1,062,300,000 | | | | | | 33,298,350 | |
| 3.65%, 12/17/21 | | THB | | | 684,300,000 | | | | | | 21,691,938 | |
| | | | | | | | | | | | 87,719,861 | |
| Turkey—2.2% | | | | | | | | | | | | |
| Republic of Turkey Sr. Unsec. Bonds: | | | | | | | | | | | | |
| 5.625%, 3/30/21 | | USD | | | 8,165,000 | | | | | | 8,524,260 | |
| 6.25%, 9/26/22 | | USD | | | 12,810,000 | | | | | | 13,805,978 | |
| 6.875%, 3/17/36 | | USD | | | 4,565,000 | | | | | | 4,868,573 | |
| Republic of Turkey Unsec. Bonds: | | | | | | | | | | | | |
| 5.00%, 5/13/15 | | TRY | | | 115,520,000 | | | | | | 54,184,401 | |
| 5.828%, 2/11/156 | | TRY | | | 20,680,000 | | | | | | 13,868,247 | |
| 6.30%, 2/14/18 | | TRY | | | 32,695,000 | | | | | | 14,752,849 | |
| 7.10%, 3/8/23 | | TRY | | | 42,330,000 | | | | | | 18,492,723 | |
| 9.00%, 3/5/14 | | TRY | | | 139,610,000 | | | | | | 69,665,048 | |
| 9.00%, 3/8/17 | | TRY | | | 105,795,000 | | | | | | 53,027,122 | |
| | | | | | | | | | | 251,189,201 | |
18 OPPENHEIMER INTERNATIONAL BOND FUND
| | | | | | | | | | |
| | | | |
| Principal
Amount |
| | | Valu | e |
| United Arab Emirates—0.1% | | | | | | | | | | |
| Emirate of Dubai Government Sr. Unsec. International Bonds, 5.591%, 6/22/21 | | USD | | $ | 13,320,000 | | | $ | 14,418,900 | |
| United Kingdom—3.4% | | | | | | | | | | |
| United Kingdom Unsec. Treasury Bonds: | | | | | | | | | | |
| 3.75%, 9/7/21 | | GBP | | | 104,275,000 | | | | 186,938,205 | |
| 4.00%, 9/7/16 | | GBP | | | 41,200,000 | | | | 72,922,533 | |
| 4.25%, 12/7/55 | | GBP | | | 15,155,000 | | | | 28,744,856 | |
| 4.75%, 12/7/38 | | GBP | | | 37,875,000 | | | | 75,239,743 | |
| | | | | | | | | 363,845,337 | |
| Uruguay—0.2% | | | | | | | | | | |
| Oriental Republic of Uruguay Sr. Unsec. Bonds, 4.50%, 8/14/24 | | USD | | | 18,330,000 | | | | 18,650,775 | |
| Venezuela—0.8% | | | | | | | | | | |
| Bolivarian Republic of Venezuela Sr. Unsec. Bonds: | | | | | | | | | | |
| 7.00%, 3/31/38 | | USD | | | 13,855,000 | | | | 9,109,663 | |
| 7.65%, 4/21/25 | | USD | | | 18,795,000 | | | | 13,626,375 | |
| 8.25%, 10/13/24 | | USD | | | 19,375,000 | | | | 14,676,563 | |
| 9.00%, 5/7/23 | | USD | | | 26,520,000 | | | | 21,653,580 | |
| 12.75%, 8/23/22 | | USD | | | 8,895,000 | | | | 8,903,895 | |
| 13.625%, 8/15/185 | | USD | | | 23,620,000 | | | | 24,801,000 | |
| | | | | | | | | 92,771,076 | |
Total Foreign Government Obligations (Cost $6,814,614,004) | | | | | | | | | 6,624,421,747 | |
| Corporate Loan—0.1% | | | | | | | | | | |
Hallertau SPC, Sr. Sec. Credit Facilities Term Loan, 7.94%, 8/15/1410 (Cost $5,543,125) | | | | | 15,837,500 | | | | 7,411,950 | |
| Corporate Bonds and Notes—26.7% | | | | | | | | | | |
| Consumer Discretionary—0.2% | | | | | | | | | | |
| Auto Components—0.0% | | | | | | | | | | |
| GKN Holdings plc, 6.75% Sr. Unsec. Nts., 10/28/19 | | GBP | | | 2,635,000 | | | | 4,853,309 | |
| Servus Luxembourg Holding SCA, 7.75% Sr. Sec. Nts., 6/15/185 | | EUR | | | 3,110,000 | | | | 4,292,352 | |
| | | | | | | | | 9,145,661 | |
| Automobiles—0.1% | | | | | | | | | | |
Jaguar Land Rover Automotive plc, 8.25% Sr. Unsec. Nts., 3/15/205 | | GBP | | | 8,855,000 | | | | 16,005,429 | |
| Household Durables—0.0% | | | | | | | | | | |
Arcelik AS, 5% Sr. Unsec. Nts., 4/3/235 | | | | | 4,795,000 | | | | 4,141,681 | |
| Media—0.1% | | | | | | | | | | |
| Globo Comunicacao e Participacoes SA, 5.307% Sr. Unsec. Nts., 5/11/221,5 | | | | | 3,710,000 | | | | 3,747,100 | |
| Myriad International Holdings BV, 6% Sr. Unsec. Nts., 7/18/205 | | | | | 5,225,000 | | | | 5,512,375 | |
| | | | | | | | | 9,259,475 | |
| Textiles, Apparel & Luxury Goods—0.0% | | | | | | | | | | |
| Levi Strauss & Co., 7.75% Sr. Unsec. Nts., 5/15/18 | | EUR | | | 350,000 | | | | 506,169 | |
| Consumer Staples—0.2% | | | | | | | | | | |
| Beverages—0.1% | | | | | | | | | | |
| Coca-Cola Icecek AS, 4.75% Sr. Unsec. Nts., 10/1/185,8 | | | | | 6,245,000 | | | | 6,313,558 | |
19 OPPENHEIMER INTERNATIONAL BOND FUND
| | | | |
| | |
| | STATEMENTOF INVESTMENTS Continued | | |
| | | | | | | | | | |
| | | | |
| Principal
Amount |
| | | Valu | e |
| Food Products—0.1% | | | | | | | | | | |
| BFF International Ltd., 7.25% Sr. Unsec. Nts., 1/28/205 | | | | $ | 1,120,000 | | | $ | 1,243,200 | |
| BRF SA, 5.875% Sr. Unsec. Nts., 6/6/225 | | | | | 2,775,000 | | | | 2,768,062 | |
| MHP SA, 8.25% Sr. Unsec. Nts., 4/2/205 | | | | | 12,885,000 | | | | 10,310,577 | |
| | | | | | | | | 14,321,839 | |
| Energy—4.8% | | | | | | | | | | |
| Energy Equipment & Services—0.3% | | | | | | | | | | |
| Drill Rigs Holdings, Inc., 6.50% Sr. Sec. Nts., 10/1/175 | | | | | 4,580,000 | | | | 4,751,750 | |
| Odebrecht Offshore Drilling Finance Ltd., 6.75% Sr. Sec. Nts., 10/1/225 | | | | | 13,270,000 | | | | 13,634,925 | |
| QGOG Constellation SA, 6.25% Sr. Unsec. Nts., 11/9/195 | | | | | 10,455,000 | | | | 9,958,388 | |
| Seadrill Ltd., 5.625% Sr. Unsec. Nts., 9/15/175 | | | | | 5,045,000 | | | | 5,120,675 | |
| | | | | | | | | 33,465,738 | |
| Oil, Gas & Consumable Fuels—4.5% | | | | | | | | | | |
| Alliance Oil Co. Ltd., 9.875% Sr. Unsec. Nts., 3/11/155 | | | | | 17,565,000 | | | | 18,838,462 | |
| CNOOC Curtis Funding No 1 Pty Ltd., 4.50% Sr. Unsec. Nts., 10/3/237,8 | | | | | 9,430,000 | | | | 9,516,002 | |
| Ecopetrol SA, 7.625% Sr. Unsec. Nts., 7/23/19 | | | | | 2,255,000 | | | | 2,677,813 | |
| Empresa Nacional del Petroleo, 4.75% Sr. Unsec. Nts., 12/6/215 | | | | | 8,575,000 | | | | 8,479,526 | |
| Gazprom OAO Via Gaz Capital SA: | | | | | | | | | | |
| 4.95% Sr. Unsec. Nts., 7/19/225 | | | | | 35,355,000 | | | | 34,250,156 | |
| 5.999% Sr. Unsec. Nts., 1/23/215 | | | | | 4,165,000 | | | | 4,378,456 | |
| 8.146% Sr. Unsec. Nts., 4/11/185 | | | | | 21,855,000 | | | | 25,434,849 | |
| 8.625% Sr. Unsec. Nts., 4/28/345 | | | | | 16,825,000 | | | | 20,190,000 | |
| 9.25% Sr. Unsec. Nts., 4/23/195 | | | | | 33,200,000 | | | | 41,008,640 | |
| KazMunayGas National Co. JSC, 9.125% Sr. Unsec. Nts., 7/2/185 | | | | | 6,655,000 | | | | 8,177,331 | |
| Lukoil International Finance BV: | | | | | | | | | | |
| 4.563% Sr. Unsec. Unsub. Nts., 4/24/235 | | | | | 4,325,000 | | | | 4,034,144 | |
| 7.25% Sr. Unsec. Nts., 11/5/195 | | | | | 9,535,000 | | | | 10,882,296 | |
| MEG Energy Corp.: | | | | | | | | | | |
| 6.50% Sr. Unsec. Nts., 3/15/215 | | | | | 4,115,000 | | | | 4,166,438 | |
| 7.00% Sr. Unsec. Nts., 3/31/245 | | | | | 2,550,000 | | | | 2,569,125 | |
| Novatek OAO via Novatek Finance Ltd.: | | | | | | | | | | |
| 4.422% Sr. Unsec. Nts., 12/13/225 | | | | | 24,040,000 | | | | 22,116,800 | |
| 7.75% Sr. Unsec. Nts., 2/21/175 | | RUB | | | 156,720,000 | | | | 4,823,415 | |
| Odebrecht Drilling Norbe VIII/IX Ltd., 6.35% Sr. Sec. Nts., 6/30/215 | | | | | 1,726,050 | | | | 1,764,886 | |
| Pacific Rubiales Energy Corp., 5.125% Sr. Unsec. Nts., 3/28/235 | | | | | 9,795,000 | | | | 8,827,744 | |
| Pemex Project Funding Master Trust: | | | | | | | | | | |
| 5.75% Sr. Unsec. Nts., 3/1/18 | | | | | 5,590,000 | | | | 6,218,875 | |
| 6.625% Sr. Unsec. Nts., 6/15/35 | | | | | 24,335,000 | | | | 25,819,678 | |
| Pertamina Persero PT, 4.875% Sr. Unsec. Nts., 5/3/225 | | | | | 7,835,000 | | | | 7,110,263 | |
| Petroleos de Venezuela SA: | | | | | | | | | | |
| 5.125% Sr. Unsec. Nts., 10/28/16 | | | | | 6,630,000 | | | | 5,353,725 | |
| 8.50% Sr. Unsec. Nts., 11/2/175 | | | | | 27,690,000 | | | | 25,156,365 | |
| 12.75% Sr. Unsec. Nts., 2/17/225 | | | | | 15,405,000 | | | | 15,096,900 | |
| Petroleos Mexicanos: | | | | | | | | | | |
| 3.50% Sr. Unsec. Nts., 1/30/23 | | | | | 21,265,000 | | | | 19,382,452 | |
| 4.875% Sr. Unsec. Nts., 1/18/24 | | | | | 28,860,000 | | | | 28,932,150 | |
20 OPPENHEIMER INTERNATIONAL BOND FUND
| | | | | | | | | | | | |
| | | | | | |
| Principal
Amount |
| | | Value | |
| Oil, Gas & Consumable Fuels Continued | | | | | | | | | | | | |
| Petroleos Mexicanos: Continued | | | | | | | | | | | | |
| 5.50% Sr. Unsec. Nts., 6/27/44 | | | | | | $ | 6,020,000 | | | $ | 5,494,544 | |
| 6.00% Sr. Unsec. Nts., 3/5/20 | | | | | | | 26,750,000 | | | | 29,826,250 | |
| 6.50% Sr. Unsec. Nts., 6/2/41 | | | | | | | 10,855,000 | | | | 11,302,736 | |
| 8.00% Sr. Unsec. Nts., 5/3/19 | | | | | | | 15,635,000 | | | | 18,957,438 | |
| Petroleum Co. of Trinidad & Tobago Ltd.: | | | | | | | | | | | | |
| 6.00% Sr. Unsec. Nts., 5/8/225 | | | | | | | 1,410,000 | | | | 1,512,225 | |
| 9.75% Sr. Unsec. Nts., 8/14/195 | | | | | | | 3,760,000 | | | | 4,850,400 | |
| Petronas Capital Ltd., 7.875%, 5/22/225 | | | | | | | 7,595,000 | | | | 9,679,774 | |
| Reliance Industries Ltd., 5.875% Sr. Unsec. Perpetual Bonds5,9 | | | | | | | 21,245,000 | | | | 17,420,900 | |
| Schahin II Finance Co. SPV Ltd., 5.875% Sr. Sec. Nts., 9/25/225 | | | | | | | 16,673,990 | | | | 15,965,345 | |
| Sibur Securities Ltd., 3.914% Sr. Unsec. Nts., 1/31/185 | | | | | | | 11,075,000 | | | | 10,576,625 | |
| Tengizchevroil Finance Co. Sarl, 6.124% Sr. Sec. Nts., 11/15/145 | | | | | | | 2,997,100 | | | | 3,072,028 | |
| | | | | | | | | | | | 493,864,756 | |
| Financials—12.1% | | | | | | | | | | | | |
| Capital Markets—0.8% | | | | | | | | | | | | |
| Deutsche Bank AG, 4.296% Jr. Sub. Nts., 5/24/281 | | | | | | | 21,980,000 | | | | 19,897,901 | |
| Deutsche Bank Capital Trust V, 4.901% Jr. Sub. Perpetual Bonds1,5,9 | | | | | | | 20,330,000 | | | | 18,042,875 | |
| UBS AG (Jersey Branch): | | | | | | | | | | | | |
| 4.28% Jr. Sub. Perpetual Bonds1,9 | | EUR | | | | | 6,195,000 | | | | 8,474,604 | |
| 7.152% Jr. Sub. Perpetual Bonds1,9 | | EUR | | | | | 4,420,000 | | | | 6,614,929 | |
| 7.25% Sub. Nts., 2/22/221 | | | | | | | 19,375,000 | | | | 20,857,672 | |
| | | | | | | | | | | 73,887,981 | |
| Commercial Banks—8.4% | | | | | | | | | | | | |
| Akbank TAS, 7.50% Sr. Unsec. Nts., 2/5/185 | | TRY | | | | | 33,370,000 | | | | 15,102,029 | |
| Alfa Bank OJSC Via Alfa Bond Issuance plc, 7.875% Sr. Unsec. Nts., 9/25/175 | | | | | | | 13,165,000 | | | | 14,556,804 | |
| Banco ABC Brasil SA, 8.50% Sr. Unsec. Nts., 3/28/167 | | BRL | | | | | 8,360,000 | | | | 3,385,417 | |
| Banco Bilbao Vizcaya Argentaria SA, 9% Jr. Sub. Perpetual Bonds1,9 | | | | | | | 1,785,000 | | | | 1,770,988 | |
| Banco BMG SA: | | | | | | | | | | | | |
| 8.875% Sub. Nts., 8/5/205 | | | | | | | 3,945,000 | | | | 3,728,025 | |
| 9.15% Sr. Unsec. Nts., 1/15/165 | | | | | | | 6,915,000 | | | | 7,191,600 | |
| 9.95% Sub. Nts., 11/5/195 | | | | | | | 9,060,000 | | | | 8,969,400 | |
| Banco de Costa Rica, 5.25% Sr. Unsec. Nts., 8/12/185 | | | | | | | 8,105,000 | | | | 8,230,627 | |
| Banco del Estado de Chile: | | | | | | | | | | | | |
| 3.875% Sr. Unsec. Nts., 2/8/225 | | | | | | | 5,150,000 | | | | 5,008,699 | |
| 4.125% Sr. Unsec. Nts., 10/7/205 | | | | | | | 8,765,000 | | | | 8,922,419 | |
| Banco do Brasil SA (Cayman), 9.25% Jr. Sub. Perpetual Bonds1,5,9 | | | | | | | 35,685,000 | | | | 38,004,525 | |
| Banco do Estado do Rio Grande do Sul SA, 7.375% Sub. Nts., 2/2/225 | | | | | | | 32,780,000 | | | | 32,575,125 | |
| Banco Santander Brasil SA (Cayman Islands), 8% Sr. Unsec. Unsub. Nts., 3/18/165 | | BRL | | | | | 14,290,000 | | | | 5,996,345 | |
| Banco Santander Mexico SA, 4.125% Sr. Unsec. Nts., 11/9/225 | | | | | | | 19,400,000 | | | | 17,848,000 | |
| Bancolombia SA, 5.125% Unsec. Sub. Nts., 9/11/22 | | | | | | | 20,280,000 | | | | 18,606,900 | |
| Bank of Scotland plc, 4.875% Sr. Sec. Nts., 12/20/24 | | GBP | | | | | 7,625,000 | | | | 13,971,683 | |
| Bank of Scotland plc, 4.875% Sr. Sec. Unsub. Nts., 11/8/16 | | GBP | | | | | 4,535,000 | | | | 8,113,854 | |
21 OPPENHEIMER INTERNATIONAL BOND FUND
| | | | |
| | |
| | STATEMENTOF INVESTMENTS Continued | | |
| | | | | | | | | | | | |
| | | | | | |
| Principal
Amount |
| | | Value | |
| Commercial Banks Continued | | | | | | | | | | | | |
| Barclays Bank plc: | | | | | | | | | | | | |
| 4.75% Jr. Sub. Perpetual Bonds1,9 | | EUR | | | | $ | 12,320,000 | | | $ | 13,266,521 | |
| 6.00% Jr. Sub. Perpetual Bonds1,9 | | GBP | | | | | 7,115,000 | | | | 10,395,422 | |
| 14.00% Jr. Sub. Perpetual Bonds1,9 | | GBP | | | | | 27,645,000 | | | | 60,189,418 | |
| BBVA Banco Continental SA, 5% Sr. Unsec. Nts., 8/26/225 | | | | | | | 8,075,000 | | | | 7,772,187 | |
| BNP Paribas SA: | | | | | | | | | | | | |
| 5.945% Jr. Sub. Perpetual Bonds1,9 | | GBP | | | | | 7,005,000 | | | | 11,199,773 | |
| 7.195% Jr. Sub. Perpetual Bonds1,5,9 | | | | | | | 13,195,000 | | | | 13,310,456 | |
| BPCE SA, 9% Jr. Sub. Perpetual Bonds1,9 | | EUR | | | | | 24,160,000 | | | | 34,773,418 | |
| Caixa Economica Federal, 4.50% Sr. Unsec. Nts., 10/3/185,8 | | | | | | | 12,505,000 | | | | 12,407,461 | |
| Commerzbank AG, 8.125% Sub. Nts., 9/19/235 | | | | | | | 3,560,000 | | | | 3,640,100 | |
| Corp. Financiera de Desarrollo SA, 4.75% Sr. Unsec. Nts., 2/8/225 | | | | | | | 8,700,000 | | | | 8,460,750 | |
| CorpGroup Banking SA, 6.75% Sr. Unsec. Nts., 3/15/235 | | | | | | | 13,035,000 | | | | 11,144,925 | |
| Credit Agricole SA, 8.375% Jr. Sub. Perpetual Bonds1,5,9 | | | | | | | 36,265,000 | | | | 39,846,169 | |
| Danske Bank, 5.684% Jr. Sub. Perpetual Bonds1,9 | | GBP | | | | | 6,405,000 | | | | 10,369,054 | |
| EUROFIMA, 6.25% Sr. Unsec. Nts., 12/28/18 | | AUD | | | | | 31,010,000 | | | | 31,382,108 | |
| European Investment Bank: | | | | | | | | | | | | |
| 6.00% Sr. Unsec. Nts., 8/6/20 | | AUD | | | | | 35,115,000 | | | | 35,220,768 | |
| 6.50% Sr. Unsec. Nts., 8/7/19 | | AUD | | | | | 17,550,000 | | | | 18,089,154 | |
| Export-Import Bank of India, 4% Sr. Unsec. Nts., 1/14/23 | | | | | | | 3,395,000 | | | | 2,909,176 | |
| Grupo Aval Ltd., 4.75% Sr. Unsec. Nts., 9/26/225 | | | | | | | 10,935,000 | | | | 9,841,500 | |
| ICICI Bank Ltd., 6.375% Jr. Sub. Nts., 4/30/221,5 | | | | | | | 7,120,000 | | | | 6,657,200 | |
| LBG Capital No.1 plc: | | | | | | | | | | | | |
| 7.869% Sub. Nts., 8/25/20 | | GBP | | | | | 8,795,000 | | | | 15,120,767 | |
| 11.04% Sub. Nts., 3/19/20 | | GBP | | | | | 39,781,000 | | | | 75,002,005 | |
| Lloyds TSB Bank plc, 6% Sec. Nts., 2/8/29 | | GBP | | | | | 13,525,000 | | | | 27,426,544 | |
| Rabobank Capital Funding Trust IV, 5.556% Jr. Sub. Perpetual Bonds1,5,9 | | GBP | | | | | 7,380,000 | | | | 11,985,702 | |
| RBS Capital Trust III, 5.512% Jr. Sub. Perpetual Bonds1,9 | | | | | | | 11,112,000 | | | | 10,306,380 | |
| Royal Bank of Scotland NV: | | | | | | | | | | | | |
| 3.37% Sub. Nts., 5/17/181 | | AUD | | | | | 8,795,000 | | | | 7,191,227 | |
| 7.577% Sub. Nts., 5/17/181 | | AUD | | | | | 10,618,000 | | | | 8,681,802 | |
| Royal Bank of Scotland plc (The): | | | | | | | | | | | | |
| 2.375% Sub. Nts., 11/2/15 | | CHF | | | | | 2,650,000 | | | | 2,931,454 | |
| 13.125% Sub. Nts., 3/19/221 | | AUD | | | | | 11,457,000 | | | | 12,772,697 | |
| Sberbank of Russia Via SB Capital SA: | | | | | | | | | | | | |
| 5.125% Sub. Nts., 10/29/225 | | | | | | | 9,790,000 | | | | 9,180,083 | |
| 5.40% Sr. Unsec. Nts., 3/24/17 | | | | | | | 5,670,000 | | | | 6,052,725 | |
| 6.125% Sr. Unsec. Nts., 2/7/225 | | | | | | | 15,050,000 | | | | 15,802,500 | |
| Scottish Widows plc, 5.125% Jr. Sub. Perpetual Bonds1,9 | | GBP | | | | | 2,175,000 | | | | 3,406,671 | |
| Societe Generale SA, 5.922% Jr. Sub. Perpetual Bonds1,5,9 | | | | | | | 10,050,000 | | | | 10,302,818 | |
| Stadshypotek AB, 6% Sec. Nts., 6/21/17 | | SEK | | | | | 169,680,000 | | | | 29,938,763 | |
| Standard Chartered plc, 5.20% Sub. Nts., 1/26/245 | | | | | | | 8,890,000 | | | | 8,953,510 | |
| Turkiye Halk Bankasi AS, 4.875% Sr. Unsec. Nts., 7/19/175 | | | | | | | 10,690,000 | | | | 10,743,450 | |
| Turkiye Is Bankasi: | | | | | | | | | | | | |
| 3.875% Sr. Unsec. Nts., 11/7/175 | | | | | | | 4,225,000 | | | | 4,071,844 | |
| 6.00% Sub. Nts., 10/24/225 | | | | | | | 12,700,000 | | | | 11,652,250 | |
| 7.293% Unsec. Nts., 10/9/132 | | TRY | | | | | 32,125,000 | | | | 15,874,764 | |
| Turkiye Sise ve Cam Fabrikalari AS, 4.25% Sr. Unsec. Nts., 5/9/205 | | | | | | | 4,575,000 | | | | 3,975,675 | |
22 OPPENHEIMER INTERNATIONAL BOND FUND
| | | | | | | | | | | | |
| | | | | | |
| Principal
Amount |
| | | Value | |
| Commercial Banks Continued | | | | | | | | | | | | |
| Turkiye Vakiflar Bankasi Tao, 3.75% Sr. Unsec. Nts., 4/15/185 | | | | | | $ | 14,535,000 | | | $ | 13,590,225 | |
| VTB Bank OJSC Via VTB Capital SA: | | | | | | | | | | | | |
| 6.00% Sr. Unsec. Nts., 4/12/175 | | | | | | | 6,440,000 | | | | 6,794,200 | |
| 6.465% Sr. Unsec. Nts., 3/4/155 | | | | | | | 4,525,000 | | | | 4,785,550 | |
| 6.875% Sr. Unsec. Nts., 5/29/185 | | | | | | | 11,360,000 | | | | 12,240,400 | |
| Yapi ve Kredi Bankasi AS: | | | | | | | | | | | | |
| 5.50% Unsec. Sub. Nts., 12/6/225 | | | | | | | 16,235,000 | | | | 13,962,100 | |
| 6.75% Sr. Unsec. Nts., 2/8/175 | | | | | | | 8,940,000 | | | | 9,389,235 | |
| | | | | | | | | | | | 914,993,341 | |
| Consumer Finance—0.0% | | | | | | | | | | | | |
Astana Finance JSC, 9.16% Sr. Unsec. Nts., 3/14/1210 | | | | | | | 14,000,000 | | | | 796,250 | |
| Diversified Financial Services—2.1% | | | | | | | | | | | | |
| AG Spring Finance Ltd., 7.50% Sr. Sec. Nts., 6/1/185 | | EUR | | | | | 665,000 | | | | 917,638 | |
| Autopistas del Nordeste Cayman Ltd., 9.39% Unsec. Nts., 4/15/245 | | | | | | | 18,302,772 | | | | 17,804,937 | |
| AyT Cedulas Cajas X Fondo de Titulizacion, 3.75% Sec. Nts., 6/30/25 | | EUR | | | | | 4,390,000 | | | | 4,815,742 | |
| Banco BTG Pactual SA (Cayman Islands): | | | | | | | | | | | | |
| 4.00% Sr. Unsec. Nts., 1/16/205 | | | | | | | 17,065,000 | | | | 15,315,837 | |
| 5.75% Sub. Nts., 9/28/225 | | | | | | | 9,105,000 | | | | 8,240,025 | |
| Banco Invex SA, 31.938% Mtg.-Backed Certificates, Series 062U, 3/13/3410 | | MXN | | | | | 27,602,566 | | | | 1,395,657 | |
| Brazil Loan Trust 1, 5.477% Sec. Nts., 7/24/235 | | | | | | | 10,265,000 | | | | 10,470,300 | |
| Cedulas TDA 6 Fondo de Titulizacion de Activos, 3.875% Sec. Nts., 5/23/25 | | EUR | | | | | 4,390,000 | | | | 4,849,654 | |
| European Investment Bank, 5% Sr. Unsec. Nts., 8/22/22 | | AUD | | | | | 21,955,000 | | | | 20,513,955 | |
| Export Credit Bank of Turkey, 5.875% Sr. Unsec. Nts., 4/24/195 | | | | | | | 23,865,000 | | | | 24,551,119 | |
| ING Verzekeringen NV, 6.375% Sub. Nts., 5/7/271 | | EUR | | | | | 7,460,000 | | | | 10,486,414 | |
| JPMorgan Hipotecaria su Casita: | | | | | | | | | | | | |
| 6.10% Sec. Nts., 9/25/35 | | MXN | | | | | 8,139,550 | | | | 992,730 | |
| 6.47% Sec. Nts., 8/26/357 | | MXN | | | | | 34,101,099 | | | | 233,074 | |
| Magyar Export-Import Bank RT, 5.50% Sr. Unsec. Nts., 2/12/185 | | | | | | | 8,250,000 | | | | 8,342,813 | |
| National Savings Bank, 8.875% Sr. Unsec. Nts., 9/18/185 | | | | | | | 6,080,000 | | | | 6,251,000 | |
| Queensland Treasury Corp. Sr. Unsec. Nts., 6.50%, Series 33, 3/14/33 | | AUD | | | | | 93,705,000 | | | | 98,431,108 | |
| | | | | | | | | | | | 233,612,003 | |
| Insurance—0.4% | | | | | | | | | | | | |
| Assicurazioni Generali SpA, 7.75% Sr. Sub. Nts., 12/12/421 | | EUR | | | | | 1,755,000 | | | | 2,573,095 | |
| Aviva plc, 6.125% Jr. Sub. Perpetual Bonds1,9 | | GBP | | | | | 6,360,000 | | | | 10,249,871 | |
| AXA SA, 6.379% Jr. Sub. Perpetual Bonds1,5,9 | | | | | | | 17,595,000 | | | | 17,001,169 | |
| Swiss Re Capital I LP, 6.854% Jr. Sub. Perpetual Bonds1,5,9 | | | | | | | 9,935,000 | | | | 10,433,677 | |
| Swiss Reinsurance Co. via ELM BV: | | | | | | | | | | | | |
| 3.96% Jr. Sub. Perpetual Bonds1,9 | | AUD | | | | | 4,405,000 | | | | 3,756,704 | |
| 7.635% Jr. Sub. Perpetual Bonds1,9 | | AUD | | | | | 1,755,000 | | | | 1,683,360 | |
| | | | | | | | | | | | 45,697,876 | |
| Real Estate Management & Development—0.4% | | | | | | | | | | | | |
| BR Malls International Finance Ltd., 8.50% Perpetual Bonds5,9 | | | | | | | 7,475,000 | | | | 7,432,953 | |
23 OPPENHEIMER INTERNATIONAL BOND FUND
| | | | |
| | |
| | STATEMENTOF INVESTMENTS Continued | | |
| | | | | | | | | | | | |
| | | | | | |
| Principal
Amount |
| | | Value | |
| Real Estate Management & Development Continued | | | | | | | | | | | | |
| Country Garden Holdings Co. Ltd., 7.50% Sr. Unsec. Unsub. Nts., 1/10/235 | | | | | | $ | 17,235,000 | | | $ | 16,674,862 | |
| Techem GmbH, 6.125% Sr. Sec. Nts., 10/1/195 | | EUR | | | | | 3,310,000 | | | | 4,836,168 | |
| | | | | | | | | | | 28,943,983 | |
| Health Care—0.0% | | | | | | | | | | | | |
| Health Care Equipment & Supplies—0.0% | | | | | | | | | | | | |
| ConvaTec Healthcare D Sarl, 10.875% Sr. Unsec. Nts., 12/15/185 | | EUR | | | | | 2,385,000 | | | $ | 3,654,065 | |
| Industrials—1.2% | | | | | | | | | | | | |
| Aerospace & Defense—0.0% | | | | | | | | | | | | |
Embraer SA, 5.15% Sr. Unsec. Nts., 6/15/22 | | | | | | | 5,160,000 | | | | 5,018,100 | |
| Airlines—0.2% | | | | | | | | | | | | |
Emirates Airline, 4.50% Sr. Unsec. Nts., 2/6/255 | | | | | | | 21,415,000 | | | | 19,273,500 | |
| Construction & Engineering—0.3% | | | | | | | | | | | | |
| Andrade Gutierrez International SA, 4% Sr. Unsec. Nts., 4/30/185 | | | | | | | 8,555,000 | | | | 8,063,087 | |
| IIRSA Norte Finance Ltd., 8.75% Sr. Sec. Nts., 5/30/247 | | | | | | | 13,535,430 | | | | 15,836,453 | |
| OAS Investments GmbH, 8.25% Sr. Nts., 10/19/195 | | | | | | | 6,285,000 | | | | 6,363,563 | |
| Odebrecht Finance Ltd., 8.25% Sr. Unsec. Nts., 4/25/185 | | BRL | | | | | 9,645,000 | | | | 3,625,524 | |
| | | | | | | | | | | | 33,888,627 | |
| Electrical Equipment—0.0% | | | | | | | | | | | | |
Orion Engineered Carbons Bondco GmbH, 10% Nts., 6/15/187 | | EUR | | | | | 3,325,500 | | | | 5,016,726 | |
| Industrial Conglomerates—0.3% | | | | | | | | | | | | |
| General Electric Capital Australia Funding Pty Ltd., 7% Sr. Unsec. Nts., 10/8/15 | | AUD | | | | | 20,805,000 | | | | 20,712,239 | |
| Hutchison Whampoa Ltd., 3.75% Perpetual Bonds1,9 | | EUR | | | | | 3,510,000 | | | | 4,517,014 | |
| KOC Holding AS, 3.50% Sr. Unsec. Nts., 4/24/205 | | | | | | | 13,425,000 | | | | 11,532,075 | |
| | | | | | | | | | | | 36,761,328 | |
| Road & Rail—0.4% | | | | | | | | | | | | |
| Kazakhstan Temir Zholy Finance BV, 6.375% Sr. Unsec. Nts., 10/6/205 | | | | | | | 6,215,000 | | | | 6,836,500 | |
| Red de Carreteras de Occidente SAPIB de CV, 9% Sr. Sec. Nts., 6/10/285 | | MXN | | | | | 200,900,000 | | | | 13,690,085 | |
| REFER-Rede Ferroviaria Nacional, 4% Sr. Unsec. Nts., 3/16/15 | | EUR | | | | | 17,945,000 | | | | 23,305,817 | |
| Transnet SOC Ltd., 4% Sr. Unsec. Nts., 7/26/225 | | | | | | | 3,940,000 | | | | 3,496,750 | |
| Ukraine Railways via Shortline plc, 9.50% Sec. Nts., 5/21/185 | | | | | | | 2,155,000 | | | | 1,734,775 | |
| | | | | | | | | | | 49,063,927 | |
| Information Technology—0.0% | | | | | | | | | | | | |
| Internet Software & Services—0.0% | | | | | | | | | | | | |
| Cerved Group SpA, 6.375% Sr. Sec. Nts., 1/15/205 | | EUR | | | | | 3,485,000 | | | | 4,832,549 | |
| Materials—2.5% | | | | | | | | | | | | |
| Chemicals—0.3% | | | | | | | | | | | | |
| Braskem Finance Ltd.: | | | | | | | | | | | | |
| 5.375% Sr. Unsec. Nts., 5/2/225 | | | | | | | 14,565,000 | | | | 13,654,687 | |
| 5.75% Sr. Unsec. Nts., 4/15/215 | | | | | | | 11,690,000 | | | | 11,514,650 | |
| Mexichem SAB de CV, 4.875% Sr. Unsec. Nts., 9/19/225 | | | | | | | 9,800,000 | | | | 9,530,500 | |
| | | | | | | | | | | 34,699,837 | |
24 OPPENHEIMER INTERNATIONAL BOND FUND
| | | | | | | | | | | | |
| | | | | | |
| Principal
Amount |
| | | Value | |
| Construction Materials—0.8% | | | | | | | | | | | | |
| Cemex Espana Luxembourg: | | | | | | | | | | | | |
| 9.25% Sr. Sec. Nts., 5/12/205 | | | | | | $ | 24,830,000 | | | $ | 26,816,400 | |
| 9.875% Sr. Sec. Nts., 4/30/195 | | | | | | | 22,730,000 | | | | 25,571,250 | |
| Cemex Finance LLC, 9.375% Sr. Sec. Nts., 10/12/225 | | | | | | | 15,115,000 | | | | 16,626,500 | |
| Cemex SAB de CV: | | | | | | | | | | | | |
| 6.50% Sec. Nts., 12/10/195 | | | | | | | 11,815,000 | | | | 11,667,312 | |
| 7.25% Sr. Sec. Nts., 1/15/215,8 | | | | | | | 12,705,000 | | | | 12,689,119 | |
| HeidelbergCement Finance BV, 8% Sr. Unsec. Nts., 1/31/17 | | EUR | | | | | 1,610,000 | | | | 2,543,136 | |
| Lafarge SA, 5.375% Sr. Unsec. Nts., 6/26/17 | | EUR | | | | | 1,775,000 | | | | 2,590,916 | |
| | | | | | | | | | | 98,504,633 | |
| Containers & Packaging—0.1% | | | | | | | | | | | | |
| Smurfit Kappa Acquisitions, 7.75% Sr. Sec. Nts., 11/15/195 | | EUR | | | | | 3,540,000 | | | | 5,217,904 | |
| Metals & Mining—1.3% | | | | | | | | | | | | |
| ALROSA Finance SA, 7.75% Nts., 11/3/205 | | | | | | | 27,135,000 | | | | 30,260,952 | |
| Consolidated Minerals Ltd., 8.875% Sr. Sec. Nts., 5/1/165 | | | | | | | 7,360,000 | | | | 7,488,800 | |
| CSN Islands XI Corp., 6.875% Sr. Unsec. Nts., 9/21/195 | | | | | | | 5,530,000 | | | | 5,751,200 | |
| Evraz Group SA, 6.50% Sr. Unsec. Nts., 4/22/205 | | | | | | | 11,455,000 | | | | 10,588,773 | |
| Ferrexpo Finance plc, 7.875% Sr. Unsec. Nts., 4/7/165 | | | | | | | 12,720,000 | | | | 11,575,200 | |
| FMG Resources August 2006 Pty Ltd., 6.875% Sr. Unsec. Nts., 2/1/185 | | | | | | | 4,685,000 | | | | 4,913,394 | |
| Gerdau Holdings, Inc., 7% Sr. Unsec. Nts., 1/20/205 | | | | | | | 2,195,000 | | | | 2,348,650 | |
| Gerdau Trade, Inc., 5.75% Sr. Unsec. Nts., 1/30/215 | | | | | | | 5,840,000 | | | | 5,752,400 | |
| Metalloinvest Finance Ltd., 5.625% Unsec. Nts., 4/17/205 | | | | | | | 8,600,000 | | | | 8,352,750 | |
| Mexico Generadora de Energia S de RL, 5.50% Sr. Sec. Nts., 12/6/325 | | | | | | | 9,120,000 | | | | 8,230,800 | |
| Samarco Mineracao SA, 4.125% Sr. Unsec. Nts., 11/1/225 | | | | | | | 6,875,000 | | | | 5,998,438 | |
| Severstal OAO Via Steel Capital SA, 4.45% Sr. Unsec. Nts., 3/19/185 | | | | | | | 5,730,000 | | | | 5,622,563 | |
| Vedanta Resources plc, 6% Sr. Nts., 1/31/195 | | | | | | | 9,640,000 | | | | 9,206,200 | |
| | | | | | | | | | | 116,090,120 | |
| Telecommunication Services—3.0% | | | | | | | | | | | | |
| Diversified Telecommunication Services—0.9% | | | | | | | | | | | | |
| Colombia Telecomunicaciones SA ESP, 5.375% Sr. Unsec. Nts., 9/27/225 | | | | | | | 4,270,000 | | | | 3,939,075 | |
| Koninklijke KPN NV, 6.125% Sr. Sub. Perpetual Bonds1,9 | | EUR | | | | | 3,960,000 | | | | 5,492,557 | |
| Oi SA: | | | | | | | | | | | | |
| 5.75% Sr. Unsec. Nts., 2/10/225 | | | | | | | 15,500,000 | | | | 13,717,500 | |
| 9.75% Sr. Unsec. Nts., 9/15/165 | | BRL | | | | | 19,740,000 | | | | 7,845,053 | |
| Portugal Telecom International Finance BV, 5.625% Sr. Unsec. Nts., 2/8/16 | | EUR | | | | | 2,425,000 | | | | 3,444,694 | |
| Telecom Italia SpA, 7.75% Sub. Nts., 3/20/731 | | EUR | | | | | 14,495,000 | | | | 19,595,246 | |
| Telefonica Chile SA, 3.875% Sr. Unsec. Nts., 10/12/225 | | | | | | | 7,735,000 | | | | 6,908,152 | |
| Telefonica Emisiones SAU, 3.987% Sr. Unsec. Nts., 1/23/23 | | EUR | | | | | 2,565,000 | | | | 3,380,866 | |
| Telemar Norte Leste SA, 5.50% Sr. Unsec. Nts., 10/23/205 | | | | | | | 30,520,000 | | | | 27,162,800 | |
| Verizon Communications, Inc., 6.55% Sr. Unsec. Nts., 9/15/43 | | | | | | | 4,440,000 | | | | 5,029,348 | |
| | | | | | | | | | | 96,515,291 | |
| Wireless Telecommunication Services—2.1% | | | | | | | | | | | | |
| America Movil SAB de CV: | | | | | | | | | | | | |
| 6.45% Sr. Unsec. Nts., 12/5/22 | | MXN | | | | | 167,530,000 | | | | 12,045,611 | |
25 OPPENHEIMER INTERNATIONAL BOND FUND
| | | | |
| | |
| | STATEMENTOF INVESTMENTS Continued | | |
| | | | | | | | | | | | |
| | | | | | | | Principal Amount | | | | Value | |
| Wireless Telecommunication Services Continued | | | | | | | | | | | | |
| America Movil SAB de CV: Continued | | | | | | | | | | | | |
| 8.46%, 12/18/36 | | MXN | | | | $ | 140,800,000 | | | $ | 10,530,166 | |
| Digicel Group Ltd., 8.25% Sr. Unsec. Nts., 9/30/205 | | | | | | | 4,610,000 | | | | 4,794,400 | |
| Digicel Ltd., 6% Sr. Unsec. Nts., 4/15/215 | | | | | | | 8,800,000 | | | | 8,294,000 | |
| Millicom International Cellular SA, 4.75% Sr. Unsec. Nts., 5/22/205 | | | | | | | 6,600,000 | | | | 6,154,500 | |
| MTS International Funding Ltd.: | | | | | | | | | | | | |
| 5.00% Sr. Unsec. Nts., 5/30/235 | | | | | | | 8,570,000 | | | | 7,905,825 | |
| 8.625% Sr. Unsec. Nts., 6/22/205 | | | | | | | 14,110,000 | | | | 16,561,613 | |
| Vimpel Communications Via VIP Finance Ireland Ltd. OJSC: | | | | | | | | | | | | |
| 7.748% Sr. Unsec. Nts., 2/2/215 | | | | | | | 16,210,000 | | | | 17,506,800 | |
| 9.125% Sr. Unsec. Nts., 4/30/185 | | | | | | | 34,205,000 | | | | 39,763,313 | |
| VimpelCom Holdings BV: | | | | | | | | | | | | |
| 5.95% Sr. Unsec. Unsub. Nts., 2/13/235 | | | | | | | 18,150,000 | | | | 17,254,479 | |
| 7.504% Sr. Unsec. Nts., 3/1/225 | | | | | | | 37,285,000 | | | | 39,382,281 | |
| 9.00% Sr. Unsec. Nts., 2/13/185 | | RUB | | | | | 364,000,000 | | | | 11,301,452 | |
| Vimpel-Communications OJSC, 8.85% Sr. Unsec. Nts., 3/8/221 | | RUB | | | | | 201,200,000 | | | | 6,321,983 | |
| | | | | | | | | | | 197,816,423 | |
| Utilities—2.7% | | | | | | | | | | | | |
| Electric Utilities—1.9% | | | | | | | | | | | | |
| Dubai Electricity & Water Authority, 7.375% Sr. Unsec. Nts., 10/21/205,8 | | | | | | | 37,670,000 | | | | 44,262,250 | |
| EDP Finance BV, 6% Sr. Unsec. Nts., 2/2/185 | | | | | | | 4,855,000 | | | | 5,037,063 | |
| Electricite de France SA, 5.25% Jr. Sub. Perpetual Bonds1,5,9 | | | | | | | 36,205,000 | | | | 34,308,148 | |
| Empresas Publicas de Medellin ESP, 8.375% Sr. Unsec. Nts., 2/1/215 | | COP | | | | | 19,156,190,000 | | | | 10,542,341 | |
| Enel SpA, 8.75% Sub. Nts., 9/24/731,5 | | | | | | | 2,550,000 | | | | 2,613,750 | |
| Eskom Holdings SOC Ltd., 5.75%, 1/26/215 | | | | | | | 4,175,000 | | | | 4,175,000 | |
| Iberdrola International BV, 5.75% Perpetual Bonds1,9 | | EUR | | | | | 3,830,000 | | | | 5,233,230 | |
| Israel Electric Corp. Ltd.: | | | | | | | | | | | | |
| 6.70% Sr. Sec. Nts., 2/10/175 | | | | | | | 13,675,000 | | | | 14,696,728 | |
| 7.25% Sr. Sec. Nts., 1/15/195 | | | | | | | 63,540,000 | | | | 69,588,500 | |
| 9.375% Sr. Sec. Nts., 1/28/205 | | | | | | | 3,030,000 | | | | 3,633,858 | |
| National Power Corp., 5.875% Sr. Unsec. Nts., 12/19/16 | | PHP | | | | | 665,100,000 | | | | 16,483,909 | |
| Perusahaan Listrik Negara PT, 5.50% Sr. Unsec. Nts., 11/22/215 | | | | | | | 7,780,000 | | | | 7,468,800 | |
| | | | | | | | | | | 218,043,577 | |
| Energy Traders—0.3% | | | | | | | | | | | | |
| Colbun SA, 6% Sr. Unsec. Nts., 1/21/205 | | | | | | | 15,410,000 | | | | 16,548,414 | |
| Instituto Costarricense de Electricidad, 6.95% Sr. Unsec. Nts., 11/10/215 | | | | | | | 1,380,000 | | | | 1,424,850 | |
| Perusahaan Listrik Negara PT, 5.25% Sr. Unsec. Nts., 10/24/425 | | | | | | | 10,565,000 | | | | 7,923,750 | |
| Power Sector Assets & Liabilities Management Corp., 7.39% Sr. Unsec. Nts., 12/2/245 | | | | | | | 2,450,000 | | | | 2,952,250 | |
| | | | | | | | | | | 28,849,264 | |
| Gas Utilities—0.1% | | | | | | | | | | | | |
| Empresa de Energia de Bogota SA, 6.125% Sr. Unsec. Nts., 11/10/215 | | | | | | | 8,195,000 | | | | 8,420,363 | |
| Gas Natural de Lima y Callao SA, 4.375% Sr. Unsec. Nts., 4/1/235 | | | | | | | 5,100,000 | | | | 4,628,250 | |
26 OPPENHEIMER INTERNATIONAL BOND FUND
| | | | | | | | | | |
| | | | |
| Principal
Amount |
| | | Valu | e |
| Gas Utilities Continued | | | | | | | | | | |
| Transportadora de Gas Internacional SA ESP, 5.70% Sr. Unsec. Nts., 3/20/225 | | | | $ | 4,180,000 | | | $ | 4,211,35 | 0 |
| | | | | | | | | 17,259,96 | 3 |
| Multi-Utilities—0.4% | | | | | | | | | | |
| Eskom Holdings SOC Ltd., 6.75% Sr. Unsec. Nts., 8/6/235 | | | | | 13,495,000 | | | | 13,936,28 | 7 |
| Veolia Environnement SA, 4.45% Jr. Sub. Perpetual Bonds1,9 | | EUR | | | 28,160,000 | | | | 37,286,71 | 0 |
| | | | | | | | | 51,222,99 | 7 |
| Total Corporate Bonds and Notes (Cost $2,988,812,979) | | | | | | | | | 2,906,684,57 | 1 |
| | | | | | | | | | | | | | | | | | | | | | | | | | | | |
| | | Counterparty | | | Buy/Sell
Protection | | | Reference
Asset | | | Fixed
Rate | | | Expiration
Date | | | Notional
Amount
(000’s) | | | | |
| Over-the-Counter Credit Default Swaptions Purchased—0.0% | | | | | | | | | | | | | |
| Credit Default Swap maturing 6/20/18 Call11 | | | BOFA | | | | Sell | | |
| iTraxx Europe
Senior
Financials
Series 19
Version 1 |
| | | 1.000% | | | | 10/16/13 | | | | EUR 60,430 | | | | 339,64 | 2 |
| Credit Default Swap maturing 6/20/18 Call11 | | | JPM | | | | Sell | | | | CDX.NA.HY.20 | | | | 5.000 | | | | 12/18/13 | | | | USD 46,945 | | | | 231,60 | 3 |
| Total Over-the-Counter Credit Default Swaptions Purchased (Cost $1,676,795) | | | | 571,24 | 5 |
| | | | | | | |
| | | Counterparty | | | Pay/Receive
Floating Rate | | | Floating Rate | | | Fixed
Rate | | | Expiration
Date | | | Notional
Amount
(000’s) | | | | |
| Over-the-Counter Interest Rate Swaptions Purchased—0.6% | | | | | | | | | | | | | |
| Interest Rate Swap maturing 1/16/16 Call11 | | | GSCO | | | | Receive | | |
| Three-Month
USD BBA
LIBOR |
| | | 1.750% | | | | 3/13/14 | | | | USD 1,017,000 | | | | 186,72 | 1 |
| Interest Rate Swap maturing 1/22/44 Call11 | | | GSCO | | | | Receive | | |
| Three-Month
USD BBA
LIBOR |
| | | 4.320 | | | | 1/16/14 | | | | USD 45,675 | | | | 1,079,37 | 9 |
| Interest Rate Swap maturing 1/25/46 Call11 | | | BAC | | | | Receive | | |
| Six-Month
GBP BBA
LIBOR |
| | | 3.537 | | | | 1/25/16 | | | | GBP 43,960 | | | | 5,575,31 | 9 |
| Interest Rate Swap maturing 1/26/19 Call11 | | | UBS | | | | Pay | | |
| Six-Month
EUR
EURIBOR |
| | | 1.545 | | | | 1/24/17 | | | | EUR 369,325 | | | | 3,216,60 | 6 |
27 OPPENHEIMER INTERNATIONAL BOND FUND
| | | | |
| | |
| | STATEMENTOF INVESTMENTS Continued | | |
| | | | | | | | | | | | | | | | | | | | | | | | | | | | |
| | | Counterparty | | | Pay/Receive
Floating Rate | | | Floating
Rate | | | Fixed
Rate | | | Expiration
Date | | | Notional Amount
(000’s) | | | Value | |
| Over-the-Counter Interest Rate Swaptions Purchased Continued | | | | | | | | | | | | | |
| Interest Rate Swap maturing 10/11/17 Call11 | | | JPM | | | | Pay | | |
| Three-Month
USD BBA
LIBOR |
| | | 2.014% | | | | 10/9/13 | | | | USD 68,825 | | | $ | 185,24 | 1 |
| Interest Rate Swap maturing 10/21/18 Call11 | | | JPM | | | | Pay | | |
| Three-Month
USD BBA
LIBOR |
| | | 1.395 | | | | 10/17/13 | | | | USD 129,850 | | | | 49,00 | 4 |
| Interest Rate Swap maturing 10/21/18 Call11 | | | BOFA | | | | Pay | | |
| Three-Month
USD BBA
LIBOR |
| | | 1.398 | | | | 10/17/13 | | | | USD 389,550 | | | | 154,19 | 2 |
| Interest Rate Swap maturing 10/8/23 Call11 | | | BOFA | | | | Pay | | |
| Three-Month
CAD BA
CDOR |
| | | 2.083 | | | | 10/8/13 | | | | CAD 78,525 | | | | — | |
| Interest Rate Swap maturing 11/19/23 Call11 | | | JPM | | | | Receive | | |
| Three-Month
USD BBA
LIBOR |
| | | 2.256 | | | | 11/15/13 | | | | USD 13,060 | | | | 675,70 | 1 |
| Interest Rate Swap maturing 11/20/23 Call11 | | | BAC | | | | Receive | | |
| Three-Month
USD BBA
LIBOR |
| | | 2.183 | | | | 11/18/13 | | | | USD 14,110 | | | | 822,91 | 0 |
| Interest Rate Swap maturing 12/4/45 Call11 | | | GSCO | | | | Receive | | |
| Six-Month
GBP BBA
LIBOR |
| | | 3.275 | | | | 12/4/15 | | | | GBP 43,925 | | | | 7,144,71 | 3 |
| Interest Rate Swap maturing 12/5/22 Call11 | | | BOFA | | | | Pay | | |
| Six-Month
AUD BBR
BBSW |
| | | 4.373 | | | | 12/4/17 | | | | AUD 100,000 | | | | 1,450,39 | 8 |
| Interest Rate Swap maturing 2/12/18 Call11 | | | BAC | | | | Pay | | |
| Three-Month
USD BBA
LIBOR |
| | | 2.362 | | | | 2/6/14 | | | | USD 155,670 | | | | 1,029,30 | 9 |
| Interest Rate Swap maturing 2/5/19 Call11 | | | BOFA | | | | Pay | | |
| Three-Month
USD BBA
LIBOR |
| | | 1.858 | | | | 2/3/14 | | | | USD 103,775 | | | | 1,265,36 | 1 |
28 OPPENHEIMER INTERNATIONAL BOND FUND
| | | | | | | | | | | | | | | | | | | | | | | | | | |
| | | Counterparty | | | Pay/Receive
Floating Rate | | | Floating
Rate | | Fixed
Rate | | | Expiration
Date | | | Notional Amount
(000’s) | | | Value | |
| Over-the-Counter Interest Rate Swaptions Purchased Continued | |
| Interest Rate Swap maturing 3/7/16 Call11 | | | JPM | | | | Receive | | | Three-Month
USD BBA
LIBOR | | | 1.160% | | | | 3/5/14 | | | | USD 308,310 | | | $ | 199,588 | |
| Interest Rate Swap maturing 4/27/47 Call11 | | | BAC | | | | Receive | | | Three-Month
USD BBA
LIBOR | | | 3.480 | | | | 4/25/17 | | | | USD 76,880 | | | | 14,027,491 | |
| Interest Rate Swap maturing 5/30/33 Call11 | | | BAC | | | | Receive | | | Six-Month
GBP BBA
LIBOR | | | 3.990 | | | | 5/30/23 | | | | GBP 40,415 | | | | 3,423,545 | |
| Interest Rate Swap maturing 6/20/21 Call11 | | | BAC | | | | Pay | | | Six-Month
GBP BBA
LIBOR | | | 2.618 | | | | 6/20/16 | | | | GBP 175,715 | | | | 4,166,459 | |
| Interest Rate swap maturing 7/20/20 Call11 | | | BAC | | | | Pay | | | Six-Month
GBP BBA
LIBOR | | | 2.270 | | | | 7/20/15 | | | | GBP 131,725 | | | | 2,566,917 | |
| Interest Rate Swap maturing 7/27/46 Call11 | | | BOFA | | | | Receive | | | Three-Month
USD BBA
LIBOR | | | 3.890 | | | | 7/25/16 | | | | USD 69,880 | | | | 8,304,234 | |
| Interest Rate Swap maturing 8/4/46 Call11 | | | BOFA | | | | Receive | | | Three-Month
USD BBA
LIBOR | | | 4.860 | | | | 8/2/16 | | | | USD 43,895 | | | | 2,158,752 | |
| Interest Rate Swap maturing 9/23/45 Call11 | | | UBS | | | | Receive | | | Six-Month
EUR
EURIBOR | | | 3.220 | | | | 9/21/15 | | | | EUR 100,000 | | | | 7,227,531 | |
| | | | | | | | | | | | | | | | | | | | | | | | | | |
| Total Over-the-Counter Interest Rate Swaptions Purchased (Cost $74,334,019) | | | | 64,909,371 | |
| | | | | | | | | | | | |
| | | | | | | Principal Amount | | | | |
| Structured Securities—1.2% | | | | | | | | | | | | |
| Citigroup Global Markets Holdings, Inc., Colombia (Republic of) Credit Linked Nts., Series 2, 10%, 7/25/24 | | COP | | | | | 13,239,000,000 | | | | 8,643,627 | |
| Credit Suisse First Boston International, Moitk Total Return Linked Nts., 21%, 3/30/1110 | | RUB | | | | | 220,242,600 | | | | — | |
| Credit Suisse First Boston, Inc. (Nassau Branch), Russian Specialized Construction & Installation Administration Total Return Linked Nts., 13%, 5/24/1010 | | RUB | | | | | 64,600,000 | | | | — | |
29 OPPENHEIMER INTERNATIONAL BOND FUND
| | | | |
| | |
| | STATEMENTOF INVESTMENTS Continued | | |
| | | | | | | | | | |
| | | |
| Principal
Amount |
| | | Value | |
| Structured Securities Continued | | | | | | | | | | |
| Deutche Bank AG, Opic Reforma I Credit Linked Nts.: | | | | | | | | | | |
| Cl. 2A, 7.455%, 5/22/157 | | MXN | | | 1,273,571 | | | $ | 91,644 | |
| Cl. 2B, 7.455%, 5/22/157 | | MXN | | | 2,228,143 | | | | 160,334 | |
| Cl. 2C, 7.455%, 5/22/157 | | MXN | | | 33,594,990 | | | | 2,417,443 | |
| Cl. 2D, 7.455%, 5/22/157 | | MXN | | | 2,448,356 | | | | 176,180 | |
| Cl. 2E, 7.455%, 5/22/157 | | MXN | | | 1,778,777 | | | | 127,998 | |
| Cl. 2F, 7.455%, 5/22/157 | | MXN | | | 1,136,016 | | | | 81,746 | |
| Cl. 2G, 7.455%, 5/22/157 | | MXN | | | 209,207 | | | | 15,054 | |
| Deutsche Bank AG, Coriolanus Ltd. Sec. Credit Linked Bonds: | | | | | | | | | | |
| 3.01%, 5/6/252,5 | | | | | 3,964,485 | | | | 2,946,066 | |
| 3.061%, 5/6/252,5 | | | | | 5,051,363 | | | | 3,753,742 | |
| 3.10%, 5/6/251,5 | | | | | 4,361,043 | | | | 3,240,755 | |
| 3.138%, 5/6/252,5 | | | | | 3,898,223 | | | | 2,896,827 | |
| 3.191%, 5/6/252,5 | | | | | 4,853,604 | | | | 3,606,784 | |
| 3.242%, 5/6/252,5 | | | | | 5,539,652 | | | | 4,116,596 | |
| 3.269%, 5/6/252,5 | | | | | 4,425,534 | | | | 3,288,679 | |
| 3.346%, 5/6/252,5 | | | | | 4,159,814 | | | | 3,091,218 | |
| Goldman Sachs Capital Markets LP, Republic of Colombia Credit Linked Nts., Cl. B, 10%, 7/30/245 | | COP | | | 17,940,000,000 | | | | 11,712,868 | |
| Goldman Sachs Group, Inc. (The) United Mexican States Credit Linked Nts., 9.05%, 2/8/377 | | MXN | | | 2,839,000,000 | | | | 19,541,915 | |
| JPMorgan Chase & Co., Republic of Colombia Credit Linked Nts.: | | | | | | | | | | |
| 10.19%, 1/5/165 | | COP | | | 68,635,000,000 | | | | 32,415,800 | |
| 10.218%, 10/31/165 | | COP | | | 45,697,000,000 | | | | 20,475,079 | |
| LB Perus Trust II Certificates, Series 1998-A, 3.795%, 2/28/1610 | | | | | 11,734 | | | | 11,751 | |
| Morgan Stanley, Russian Federation Total Return Linked Bonds, Series 007, Cl. | | | | | | | | | | |
| VR, 5%, 8/22/34 | | RUB | | | 224,909,480 | | | | 3,479,281 | |
| Total Structured Securities (Cost $120,013,016) | | | | | | | | | 126,291,387 | |
| | | | | | | | | | | | | | | | | | | | | | | | |
| | | Counterparty | | | | | Exercise
Price | | | Expiration
Date | | | | | Contracts | | | | |
| Over-the-Counter Options Purchased—0.7% | |
| AUD Currency Call11 | | | GSCO | | | JPY | | | 102.000 | | | | 9/10/14 | | | AUD | | | 141,580,000 | | | | 837,686 | |
| AUD Currency Call11 | | | BOFA | | | JPY | | | 95.500 | | | | 8/4/14 | | | AUD | | | 93,890,000 | | | | 1,553,203 | |
| BRL Currency Call11 | | | CITI | | | BRL | | | 2.200 | | | | 10/15/13 | | | BRL | | | 110,000,000 | | | | 394,680 | |
| BRL Currency Call11 | | | CITI | | | BRL | | | 2.230 | | | | 10/11/13 | | | BRL | | | 111,500,000 | | | | 667,997 | |
| CAD Currency Put11 | | | JPM | | | JPY | | | 84.500 | | | | 12/12/13 | | | CAD | | | 150,000,000 | | | | 124,782 | |
| CAD Currency Put11 | | | MSCO | | | JPY | | | 84.300 | | | | 12/12/13 | | | CAD | | | 100,000,000 | | | | 97,810 | |
30 OPPENHEIMER INTERNATIONAL BOND FUND
| | | | | | | | | | | | | | | | | | | | | | | | | | | | |
Counterparty | | | Exercise
Price | | | Expiration
Date | | | | | | Contracts | | | Value | |
| Over-the-Counter Options Purchased Continued | |
| CHF Currency Put11 | | | BAC | | | | CHF | | | | 1.000 | | | | 2/20/14 | | | | CHF | | | | 125,000,000 | | | $ | 289,000 | |
| CHF Currency Put11 | | | BAC | | | | CHF | | | | 0.970 | | | | 6/10/14 | | | | CHF | | | | 194,000,000 | | | | 2,105,676 | |
| EUR Currency Call11 | | | BOFA | | | | EUR | | | | 1.398 | | | | 12/18/13 | | | | EUR | | | | 225,000,000 | | | | 812,250 | |
| EUR Currency Put11 | | | GSCO | | | | TRY | | | | 2.540 | | | | 10/31/13 | | | | EUR | | | | 100,000,000 | | | | 8,942 | |
| EUR Currency Call11 | | | GSCO | | | | EUR | | | | 1.373 | | | | 12/19/13 | | | | EUR | | | | 300,000,000 | | | | 2,914,500 | |
| EUR Currency Call11 | | | BAC | | | | EUR | | | | 1.350 | | | | 1/13/14 | | | | EUR | | | | 100,000,000 | | | | 2,340,000 | |
| EUR Currency Call11 | | | BOFA | | | | EUR | | | | 1.265 | | | | 9/30/14 | | | | EUR | | | | 100,000,000 | | | | 1,393,435 | |
| EUR Currency Call11,14 | | | BOFA | | | | EUR | | | | 1.290 | | | | 1/17/14 | | | | EUR | | | | 73,500,000 | | | | 154,130 | |
| INR Currency Call11 | | | GSCO | | | | INR | | | | 65.000 | | | | 9/2/14 | | | | INR | | | | 2,895,800,000 | | | | 1,201,757 | |
| INR Currency Call11 | | | GSCO | | | | INR | | | | 65.250 | | | | 9/3/14 | | | | INR | | | | 2,908,000,000 | | | | 1,279,520 | |
| JPY Currency Put11 | | | GSCO | | | | JPY | | | | 105.000 | | | | 4/8/15 | | | | JPY | | | | 10,500,000,000 | | | | 2,614,500 | |
| JPY Currency Put11 | | | BAC | | | | JPY | | | | 101.500 | | | | 4/7/15 | | | | JPY | | | | 10,150,000,000 | | | | 3,735,200 | |
| JPY Currency Put11 | | | GSCO | | | | JPY | | | | 103.000 | | | | 4/15/15 | | | | JPY | | | | 12,875,000,000 | | | | 4,042,750 | |
| JPY Currency Put11 | | | GSCO | | | | JPY | | | | 104.000 | | | | 9/7/15 | | | | JPY | | | | 20,800,000,000 | | | | 6,572,800 | |
| JPY Currency Call11 | | | NOM | | | | JPY | | |
| 96
.000 |
| | | 10/25/13 | | | | JPY | | | | 24,000,000,000 | | | | 1,008,000 | |
| JPY Currency Call11 | | | BAC | | | | JPY | | |
| 95
.500 |
| | | 10/28/13 | | | | JPY | | | | 9,550,000,000 | | | | 458,400 | |
| JPY Currency Call11 | | | GSCO | | | | JPY | | |
| 95
.500 |
| | | 10/18/13 | | | | JPY | | | | 37,401,500,000 | | | | 785,432 | |
31 OPPENHEIMER INTERNATIONAL BOND FUND
| | | | |
| | |
| | STATEMENTOF INVESTMENTS Continued | | |
| | | | | | | | | | | | | | | | | | | | | | | | | | | | |
Counterparty | | | Exercise
Price | | | Expiration Date | | | | | | Contracts | | | Value | |
| Over-the-Counter Options Purchased Continued | |
| JPY Currency Put11 | | | GSCO | | | | JPY | | | | 103.500 | | | | 4/10/14 | | | | JPY | | | | 12,937,500,000 | | | $ | 1,552,500 | |
| JPY Currency Put11 | | | BOFA | | | | JPY | | | | 103.500 | | | | 4/9/15 | | | | JPY | | | | 25,875,000,000 | | | | 7,607,250 | |
| JPY Currency Put11 | | | RBSC | | | | JPY | | | | 101.500 | | | | 4/7/15 | | | | JPY | | | | 10,150,000,000 | | | | 3,735,200 | |
| JPY Currency Put11 | | | BOFA | | | | KRW | | | | 9.900 | | | | 5/7/15 | | | | JPY | | | | 5,000,000,000 | | | | 937,511 | |
| JPY Currency Put11 | | | GSCO | | | | JPY | | | | 101.000 | | | | 5/7/15 | | | | JPY | | | | 12,625,000,000 | | | | 5,037,375 | |
| JPY Currency Put11 | | | GSCO | | | | JPY | | | | 104.000 | | | | 5/11/15 | | | | JPY | | | | 20,800,000,000 | | | | 5,969,600 | |
| JPY Currency Put11 | | | GSCO | | | | JPY | | | | 108.000 | | | | 5/22/15 | | | | JPY | | | | 21,365,000,000 | | | | 4,016,620 | |
| JPY Currency Put11 | | | GSCO | | | | KRW | | | | 10.425 | | | | 5/7/15 | | | | JPY | | | | 5,000,000,000 | | | | 1,476,854 | |
| JPY Currency Put11 | | | BAC | | | | JPY | | | | 105.000 | | | | 5/23/14 | | | | JPY | | | | 15,750,000,000 | | | | 1,748,250 | |
| JPY Currency Put11 | | | JPM | | | | KRW | | | | 10.100 | | | | 5/7/15 | | | | JPY | | | | 5,000,000,000 | | | | 1,166,447 | |
| JPY Currency Put11 | | | BOFA | | | | KRW | | | | 10.195 | | | | 4/30/15 | | | | JPY | | | | 5,000,000,000 | | | | 1,336,521 | |
| JPY Currency Put11 | | | GSCO | | | | JPY | | | | 105.000 | | | | 5/23/14 | | | | JPY | | | | 15,750,000,000 | | | | 1,748,250 | |
| MXN Currency Call11 | | | GSCO | | | | MXN | | | | 13.000 | | | | 9/29/14 | | | | MXN | | | | 2,527,500,000 | | | | 6,953,153 | |
| MXN Currency Call11 | | | GSCO | | | | MXN | | | | 12.680 | | | | 12/23/13 | | | | MXN | | | | 790,300,000 | | | | 574,548 | |
| MXN Currency Call11 | | | DEU | | | | MXN | | | | 12.650 | | | | 10/15/13 | | | | MXN | | | | 815,100,000 | | | | 83,140 | |
| MXN Currency Call11 | | | GSCO | | | | MXN | | | | 12.425 | | | | 10/18/13 | | | | MXN | | | | 1,201,550,000 | | | | 42,054 | |
| MXN Currency Call11 | | | MSCO | | | | MXN | | | | 12.425 | | | | 10/18/13 | | | | MXN | | | | 1,201,550,000 | | | | 42,054 | |
32 OPPENHEIMER INTERNATIONAL BOND FUND
| | | | | | | | | | | | | | | | | | | | | | | | | | |
| Counterparty | | | | | | | Exercise
Price | | | Expiration
Date | | | | | | Contracts | | | Value | |
| Over-the-Counter Options Purchased Continued | | | | | | | | | | | | | | | | | |
| TRY Currency Call11 | | | GSCO | | | TRY | | | 1.905 | | | | 10/9/13 | | | | TRY | | | | 61,380,000 | | | $ | 92 | 1 |
| TRY Currency Call11 | | | GSCO | | | TRY | | | 1.887 | | | | 10/22/13 | | | | TRY | | | | 60,790,000 | | | | 5,16 | 7 |
| ZAR Currency Call11 | | | BOFA | | | ZAR | | | 9.310 | | | | 11/29/13 | | | | ZAR | | | | 582,000,000 | | | | 130,36 | 8 |
| Total Over-the-Counter Options Purchased (Cost $132,552,901) | | | | 79,556,23 | 3 |
| | | | | | | | | | | | |
| | | Shares | | | | | |
| Investment Company—4.2% | | | | | | | | | | | | |
Oppenheimer Institutional Money Market Fund, Cl. E, 0.09%12,13 (Cost $454,741,805) | | | 454,741,805 | | | 454,741,805 | | | |
Total Investments, at Value (Cost $11,402,186,890) | | | 101.6 | % | | | | | 11,076,118,731 | | | |
| Liabilities in Excess of Other Assets | | | (1.6 | ) | | | | | (171,956,266) | | | |
| | | |
| Net Assets | | | 100.0 | % | | | | $ | 10,904,162,465 | | | |
| | | |
Footnotes to Statement of Investments
1. Represents the current interest rate for a variable or increasing rate security.
2. Zero coupon bond reflects effective yield on the date of purchase.
3. All or a portion of the security position is held in segregated accounts and pledged to cover margin requirements under certain derivative contracts. The aggregate market value of such securities is $123,467,326. See Note 6 of the accompanying Notes.
4. All or a portion of the security position is held in accounts at a futures clearing merchant and pledged to cover margin requirements on open futures contracts and written options on futures, if applicable. The aggregate market value of such securities is $29,399,265. See Note 6 of the accompanying Notes.
5. Represents securities sold under Rule 144A, which are exempt from registration under the Securities Act of 1933, as amended. These securities have been determined to be liquid under guidelines established by the Board of Trustees. These securities amount to $2,627,907,918 or 24.10% of the Fund’s net assets as of September 30, 2013.
6. Denotes an inflation-indexed security: coupon or principal are indexed to a consumer price index.
7. Restricted security. The aggregate value of restricted securities as of September 30, 2013 was $56,599,986, which represents 0.52% of the Fund’s net assets. See Note 7 of the accompanying Notes. Information concerning restricted securities is as follows:
| | | | | | | | | | | | | | | | |
| Security | | Acquisition
Dates | | | Cost | | | Value | | | Unrealized
Appreciation/
(Depreciation) | |
| Banco ABC Brasil SA, 8.50% Sr. Unsec. Nts., 3/28/16 | | | 3/22/13 | | | $ | 4,158,687 | | | $ | 3,385,417 | | | $ | (773,270 | ) |
| CNOOC Curtis Funding No 1 Pty Ltd., 4.50% Sr. Unsec. Nts., 10/3/23 | | | 9/26/13 | | | | 9,430,000 | | | | 9,516,002 | | | | 86,002 | |
| Deutche Bank AG, Opic Reforma I Credit Linked Nts., Cl. 2A, 7.455%, 5/22/15 | | | 5/21/08 | | | | 122,792 | | | | 91,644 | | | | (31,148 | ) |
33 OPPENHEIMER INTERNATIONAL BOND FUND
| | | | |
| | |
| | STATEMENTOF INVESTMENTS Continued | | |
Footnotes to Statement of Investments Continued
| | | | | | | | | | | | | | | | |
| Security | | Acquisition
Dates | | | Cost | | | Value | | | Unrealized
Appreciation/
(Depreciation) | |
| Deutche Bank AG, Opic Reforma I Credit Linked Nts., Cl. 2B, 7.455%, 5/22/15 | | | 6/12/08 | | | $ | 214,813 | | | $ | 160,334 | | | $ | (54,479) | |
| Deutche Bank AG, Opic Reforma I Credit Linked Nts., Cl. 2C, 7.455%, 5/22/15 | | | 6/18/08 | | | | 3,259,229 | | | | 2,417,443 | | | | (841,786) | |
| Deutche Bank AG, Opic Reforma I Credit Linked Nts., Cl. 2D, 7.455%, 5/22/15 | | | 7/8/08 | | | | 237,353 | | | | 176,180 | | | | (61,173) | |
| Deutche Bank AG, Opic Reforma I Credit Linked Nts., Cl. 2E, 7.455%, 5/22/15 | | | 7/15/08 | | | | 172,730 | | | | 127,998 | | | | (44,732) | |
| Deutche Bank AG, Opic Reforma I Credit Linked Nts., Cl. 2F, 7.455%, 5/22/15 | | | 8/8/08 | | | | 111,830 | | | | 81,746 | | | | (30,084) | |
| Deutche Bank AG, Opic Reforma I Credit Linked Nts., Cl. 2G, 7.455%, 5/22/15 | | | 8/22/08 | | | | 20,634 | | | | 15,054 | | | | (5,580) | |
| Goldman Sachs Group, Inc. (The) United Mexican States Credit Linked Nts., 9.05%, 2/8/37 | | | 9/12/12 | | | | 33,299,544 | | | | 19,541,915 | | | | (13,757,629) | |
| IIRSA Norte Finance Ltd., 8.75% Sr. Sec. Nts., 5/30/24 | | | 8/3/06-11/18/09 | | | | 13,629,486 | | | | 15,836,453 | | | | 2,206,967 | |
| JPMorgan Hipotecaria su Casita, 6.47% Sr. Sec. Nts., 8/26/35 | | | 3/21/07 | | | | 3,092,229 | | | | 233,074 | | | | (2,859,155) | |
| Orion Engineered Carbons Bondco GmbH, 10% Nts., 6/15/18 | | | 8/8/13-9/13/13 | | | | 4,962,377 | | | | 5,016,726 | | | | 54,349 | |
| | | | | | | | |
| | | | | | $ | 72,711,704 | | | $ | 56,599,986 | | | $ | (16,111,718) | |
| | | | | | | | |
8. All or a portion of the security position is when-issued or delayed delivery to be delivered and settled after September 30, 2013. See Note 1 of the accompanying Notes.
9. This bond has no contractual maturity date, is not redeemable and contractually pays an indefinite stream of interest. Rate reported represents the current interest rate for this variable rate security.
10. This security is not accruing income because the issuer has missed an interest payment on it and/or is not anticipated to make future interest and/or principal payments. The rate shown is the original contractual interest rate. See Note 1 of the accompanying Notes.
11. Non-income producing security.
12. Is or was an affiliate, as defined in the Investment Company Act of 1940, at or during the period ended September 30, 2013, by virtue of the Fund owning at least 5% of the voting securities of the issuer or as a result of the Fund and the issuer having the same investment adviser. Transactions during the period in which the issuer was an affiliate are as follows:
| | | | | | | | | | | | | | | | |
| | | Shares
September 28,
2012a | | | Gross
Additions | | | Gross
Reductions | | | Shares
September 30,
2013 | |
| Oppenheimer Institutional Money Market Fund, Cl. E | | | 342,147,098 | | | | 6,303,801,230 | | | | 6,191,206,523 | | | | 454,741,805 | |
34 OPPENHEIMER INTERNATIONAL BOND FUND
Footnotes to Statement of Investments Continued
| | | | | | | | |
| | | Value | | | Income | |
| Oppenheimer Institutional Money Market Fund, Cl. E | | $ | 454,741,805 | | | $ | 475,255 | |
a. September 28, 2012 represents the last business day of the Fund’s 2012 fiscal year. See Note 1 of the accompanying Notes.
13. Rate shown is the 7-day yield as of September 30, 2013.
14. Knock-in option becomes eligible for exercise if at any time prior to expiration spot rates are less than or equal to 1.27USD per 1EUR.
Distribution of investments representing geographic holdings, as a percentage of total investments at value, is as follows:
| | | | | | |
| Geographic Holdings | | Value | | | Percent |
| United States | | $ | 1,312,162,962 | | | 11.8% |
| Japan | | | 1,015,147,545 | | | 9.3 |
| Mexico | | | 967,072,750 | | | 8.7 |
| Russia | | | 798,064,727 | | | 7.2 |
| Brazil | | | 785,147,496 | | | 7.1 |
| United Kingdom | | | 679,687,825 | | | 6.1 |
| Italy | | | 544,199,448 | | | 4.9 |
| Germany | | | 531,886,825 | | | 4.8 |
| France | | | 489,693,688 | | | 4.4 |
| Australia | | | 410,218,160 | | | 3.8 |
| Turkey | | | 396,095,294 | | | 3.6 |
| South Africa | | | 240,348,246 | | | 2.2 |
| Colombia | | | 202,389,489 | | | 1.8 |
| Hungary | | | 175,536,401 | | | 1.6 |
| Portugal | | | 159,549,258 | | | 1.4 |
| Belgium | | | 159,302,551 | | | 1.4 |
| Venezuela | | | 138,378,066 | | | 1.2 |
| Netherlands | | | 122,558,829 | | | 1.2 |
| Spain | | | 120,456,643 | | | 1.1 |
| Peru | | | 119,943,185 | | | 1.1 |
| Canada | | | 116,643,581 | | | 1.1 |
| Poland | | | 115,925,293 | | | 1.0 |
| Supranational | | | 105,205,985 | | | 1.0 |
| Malaysia | | | 104,278,564 | | | 0.9 |
| Israel | | | 87,919,086 | | | 0.8 |
| Thailand | | | 87,719,861 | | | 0.8 |
| Indonesia | | | 83,695,869 | | | 0.8 |
| United Arab Emirates | | | 77,954,650 | | | 0.7 |
| Finland | | | 65,226,209 | | | 0.6 |
| Denmark | | | 57,133,821 | | | 0.5 |
| Chile | | | 57,012,135 | | | 0.5 |
| Switzerland | | | 54,215,622 | | | 0.5 |
| Nigeria | | | 50,389,627 | | | 0.5 |
| Philippines | | | 47,039,409 | | | 0.4 |
| India | | | 38,674,753 | | | 0.3 |
| Croatia | | | 37,885,401 | | | 0.3 |
| Ivory Coast | | | 33,019,438 | | | 0.3 |
| Dominican Republic | | | 32,315,812 | | | 0.3 |
| Lithuania | | | 32,131,581 | | | 0.3 |
| Sri Lanka | | | 30,124,201 | | | 0.3 |
| Sweden | | | 29,938,763 | | | 0.3 |
| China | | | 26,190,864 | | | 0.2 |
35 OPPENHEIMER INTERNATIONAL BOND FUND
| | | | |
| | |
| | STATEMENTOF INVESTMENTS Continued | | |
Footnotes to Statement of Investments Continued
| | | | | | |
| Geographic Holdings Continued | | Value | | | Percent |
| Angola | | $ | 26,072,156 | | | 0.2% |
| Serbia | | | 25,004,207 | | | 0.2 |
| South Korea | | | 24,753,026 | | | 0.2 |
| Kazakhstan | | | 24,117,846 | | | 0.2 |
| Ukraine | | | 23,620,552 | | | 0.2 |
| Singapore | | | 21,246,133 | | | 0.2 |
| Luxembourg | | | 21,109,391 | | | 0.2 |
| Panama | | | 19,227,424 | | | 0.2 |
| Uruguay | | | 18,650,775 | | | 0.2 |
| European Union | | | 18,407,036 | | | 0.2 |
| Romania | | | 16,501,479 | | | 0.1 |
| Jamaica | | | 13,088,400 | | | 0.1 |
| Costa Rica | | | 11,199,877 | | | 0.1 |
| Tanzania | | | 10,323,125 | | | 0.1 |
| Rwanda | | | 9,544,237 | | | 0.1 |
| Morocco | | | 9,486,048 | | | 0.1 |
| Latvia | | | 7,446,244 | | | 0.1 |
| Guatemala | | | 7,300,200 | | | 0.1 |
| Trinidad | | | 6,362,625 | | | 0.1 |
| Ireland | | | 5,217,904 | | | 0.0 |
| Norway | | | 5,120,675 | | | 0.0 |
| Greece | | | 4,751,750 | | | 0.0 |
| Hong Kong | | | 4,517,014 | | | 0.0 |
| Paraguay | | | 2,348,800 | | | 0.0 |
| Bolivia | | | 2,221,894 | | | 0.0 |
| | | |
| Total | | $ | 11,076,118,731 | | | 100.0% |
| | | |
| | | | | | | | | | | | | | | | | | | | | | | | |
| Forward Currency Exchange Contracts as of September 30, 2013 | |
| Counterparty | | Settlement Month(s) | | | Currency
Purchased (000’s) | | | Currency Sold (000’s) | | | Unrealized
Appreciation | | | Unrealized
Depreciation | |
| BAC | | | 10/2013 | | | BRL | | | 44,380 | | | USD | | | 20,000 | | | $ | 24,365 | | | $ | – | |
| BAC | | | 10/2013 | | | COP | | | 20,433,000 | | | USD | | | 10,659 | | | | 55,431 | | | | – | |
| BAC | | | 11/2013 | | | EUR | | | 850,285 | | | USD | | | 1,120,320 | | | | 30,203,415 | | | | 42,931 | |
| BAC | | | 10/2013 | | | MYR | | | 64,885 | | | USD | | | 20,340 | | | | – | | | | 456,878 | |
| BAC | | | 11/2013 | | | PLN | | | 65,990 | | | USD | | | 21,056 | | | | 4,933 | | | | – | |
| BAC | | | 10/2013 | | | RUB | | | 496,700 | | | USD | | | 15,321 | | | | 6,129 | | | | – | |
| BAC | | | 12/2013 | | | TRY | | | 4,140 | | | USD | | | 2,004 | | | | 22,779 | | | | – | |
| BAC | | | 10/2013 - 01/2014 | | | USD | | | 74,897 | | | BRL | | | 169,110 | | | | – | | | | 228,290 | |
| BAC | | | 11/2013 | | | USD | | | 965,558 | | | EUR | | | 728,355 | | | | – | | | | 19,939,499 | |
| BAC | | | 11/2013 - 12/2013 | | | USD | | | 416,946 | | | JPY | | | 41,454,000 | | | | 398,411 | | | | 5,370,745 | |
| BAC | | | 11/2013 | | | USD | | | 20,935 | | | MXN | | | 277,450 | | | | – | | | | 196,427 | |
| BAC | | | 10/2013 | | | USD | | | 41,138 | | | MYR | | | 134,070 | | | | 88,128 | | | | 37,682 | |
| BAC | | | 12/2013 | | | USD | | | 15,156 | | | RUB | | | 496,700 | | | | 7,974 | | | | – | |
| BAC | | | 12/2013 | | | USD | | | 71,288 | | | TRY | | | 147,730 | | | | – | | | | 1,026,422 | |
| BAC | | | 10/2013 - 11/2013 | | | USD | | | 253,024 | | | ZAR | | | 2,466,590 | | | | 11,163,904 | | | | 2,832,750 | |
| BAC | | | 10/2013 - 12/2013 | | | ZAR | | | 1,022,900 | | | USD | | | 100,656 | | | | 1,553,352 | | | | 658,918 | |
| BNP | | | 11/2013 | | | GBP | | | 5,110 | | | USD | | | 7,769 | | | | 500,197 | | | | – | |
| BNP | | | 12/2013 | | | TRY | | | 147,100 | | | USD | | | 69,854 | | | | 2,151,621 | | | | – | |
| BNP | | | 11/2013 | | | USD | | | 139,750 | | | GBP | | | 91,425 | | | | – | | | | 8,192,298 | |
| BNP | | | 01/2014 | | | USD | | | 19,794 | | | MXN | | | 253,500 | | | | 603,139 | | | | – | |
| BNP | | | 12/2013 | | | USD | | | 59,910 | | | TRY | | | 124,820 | | | | 159,178 | | | | 1,349,335 | |
| BOFA | | | 10/2013 - 12/2013 | | | IDR | | | 532,215,000 | | | USD | | | 48,319 | | | | – | | | | 2,805,499 | |
36 OPPENHEIMER INTERNATIONAL BOND FUND
| | | | | | | | | | | | | | | | | | | | | | | | | | |
| Footnotes to Statement of Investments Continued | |
| Forward Currency Exchange Contracts: Continued | |
| Counterparty | | Settlement Month(s) | | | Currency
Purchased (000’s) | | | | | | Currency Sold
(000’s) | | | Unrealized
Appreciation | | | Unrealized
Depreciation | |
| BOFA | | | 11/2013 | | | JPY | | | 76,097,000 | | | | USD | | | | 763,351 | | | $ | 12,832,205 | | | $ | 1,757,677 | |
| BOFA | | | 11/2013 - 12/2013 | | | KRW | | | 190,668,000 | | | | USD | | | | 176,169 | | | | 435,157 | | | | 18,895 | |
| BOFA | | | 11/2013 | | | MXN | | | 969,180 | | | | USD | | | | 74,804 | | | | – | | | | 1,038,900 | |
| BOFA | | | 10/2013 | | | MYR | | | 186,345 | | | | USD | | | | 57,420 | | | | – | | | | 306,364 | |
| BOFA | | | 10/2013 | | | PEN | | | 43,100 | | | | USD | | | | 15,724 | | | | – | | | | 303,282 | |
| BOFA | | | 11/2013 | | | THB | | | 2,817,000 | | | | USD | | | | 90,551 | | | | – | | | | 769,978 | |
| BOFA | | | 11/2013 | | | USD | | | 20,804 | | | | AUD | | | | 23,470 | | | | – | | | | 1,039,987 | |
| BOFA | | | 01/2014 | | | USD | | | 59,812 | | | | BRL | | | | 138,210 | | | | – | | | | 1,244,136 | |
| BOFA | | | 10/2013 | | | USD | | | 4,903 | | | | CLP | | | | 2,556,000 | | | | – | | | | 139,797 | |
| BOFA | | | 11/2013 | | | USD | | | 13,629 | | | | IDR | | | | 156,695,000 | | | | 196,289 | | | | – | |
| BOFA | | | 11/2013 | | | USD | | | 547,611 | | | | JPY | | | | 53,372,000 | | | | 4,466,069 | | | | – | |
| BOFA | | | 10/2013 - 06/2014 | | | USD | | | 366,292 | | | | MXN | | | | 4,747,730 | | | | 6,389,660 | | | | 728,297 | |
| BOFA | | | 10/2013 | | | USD | | | 21,625 | | | | MYR | | | | 70,360 | | | | 59,650 | | | | – | |
| BOFA | | | 10/2013 | | | USD | | | 48,105 | | | | PEN | | | | 127,400 | | | | 2,521,950 | | | | – | |
| BOFA | | | 10/2013 | | | USD | | | 18,525 | | | | PHP | | | | 746,000 | | | | 1,378,628 | | | | – | |
| BOFA | | | 11/2013 | | | USD | | | 17,753 | | | | THB | | | | 565,000 | | | | – | | | | 253,836 | |
| BOFA | | | 12/2013 | | | USD | | | 15,736 | | | | ZAR | | | | 155,500 | | | | 388,423 | | | | – | |
| BOFA | | | 10/2013 - 12/2013 | | | ZAR | | | 346,955 | | | | USD | | | | 35,726 | | | | 8,389 | | | | 1,462,166 | |
| CITI | | | 11/2013 | | | AUD | | | 27,795 | | | | USD | | | | 25,392 | | | | 438,277 | | | | – | |
| CITI | | | 11/2013 | | | CAD | | | 42,695 | | | | USD | | | | 41,531 | | | | 64,097 | | | | 207,143 | |
| CITI | | | 10/2013 | | | CLP | | | 875,000 | | | | USD | | | | 1,732 | | | | – | | | | 5,640 | |
| CITI | | | 12/2013 | | | COP | | | 2,135,000 | | | | USD | | | | 1,119 | | | | – | | | | 6,881 | |
| CITI | | | 11/2013 | | | GBP | | | 59,550 | | | | USD | | | | 92,694 | | | | 3,668,756 | | | | – | |
| CITI | | | 12/2013 | | | KRW | | | 23,108,000 | | | | USD | | | | 21,421 | | | | – | | | | 2,846 | |
| CITI | | | 11/2013 | | | MXN | | | 463,200 | | | | USD | | | | 35,430 | | | | 10,037 | | | | 173,840 | |
| CITI | | | 11/2013 | | | USD | | | 515,464 | | | | AUD | | | | 541,895 | | | | 11,874,604 | | | | – | |
| CITI | | | 11/2013 | | | USD | | | 11,431 | | | | CAD | | | | 11,775 | | | | 71,301 | | | | 54,575 | |
| CITI | | | 01/2014 | | | USD | | | 100,442 | | | | EUR | | | | 75,560 | | | | 1,923 | | | | 1,809,770 | |
| CITI | | | 11/2013 - 01/2014 | | | USD | | | 131,053 | | | | GBP | | | | 84,930 | | | | – | | | | 6,359,920 | |
| CITI | | | 11/2013 - 12/2013 | | | USD | | | 158,459 | | | | MXN | | | | 2,100,300 | | | | 502,115 | | | | 1,668,074 | |
| CITI | | | 11/2013 | | | ZAR | | | 429,940 | | | | USD | | | | 41,483 | | | | 1,056,384 | | | | – | |
| CSS | | | 11/2013 | | | CHF | | | 1,670 | | | | USD | | | | 1,785 | | | | 62,969 | | | | – | |
| CSS | | | 11/2013 | | | PLN | | | 399,995 | | | | USD | | | | 125,025 | | | | 2,634,735 | | | | – | |
| CSS | | | 11/2013 | | | USD | | | 21,447 | | | | CAD | | | | 22,560 | | | | – | | | | 422,156 | |
| DEU | | | 02/2014 | | | EUR | | | 12,230 | | | | USD | | | | 16,303 | | | | 249,949 | | | | – | |
| DEU | | | 10/2013 | | | PEN | | | 23,720 | | | | USD | | | | 8,393 | | | | 106,279 | | | | 12,883 | |
| DEU | | | 02/2014 | | | USD | | | 89,147 | | | | EUR | | | | 66,060 | | | | – | | | | 261,192 | |
| DEU | | | 11/2013 | | | USD | | | 24,122 | | | | PLN | | | | 79,380 | | | | – | | | | 1,208,001 | |
| DEU | | | 11/2013 | | | USD | | | 2,783 | | | | ZAR | | | | 27,740 | | | | 43,042 | | | | – | |
| DEU | | | 11/2013 | | | ZAR | | | 58,400 | | | | USD | | | | 5,807 | | | | – | | | | 39,808 | |
| GSCO | | | 11/2013 | | | AUD | | | 212,385 | | | | USD | | | | 190,738 | | | | 6,642,013 | | | | 8,298 | |
| GSCO | | | 10/2013 - 01/2015 | | | BRL | | | 783,298 | | | | USD | | | | 340,251 | | | | 10,342,730 | | | | 8,266,929 | |
| GSCO | | | 10/2013 | | | CLP | | | 3,660,000 | | | | USD | | | | 7,064 | | | | 157,219 | | | | – | |
| GSCO | | | 11/2013 | | | EUR | | | 50,000 | | | | USD | | | | 66,368 | | | | 1,280,239 | | | | – | |
| GSCO | | | 11/2013 | | | JPY | | | 18,543,000 | | | | USD | | | | 186,564 | | | | 2,160,081 | | | | 15,260 | |
| GSCO | | | 11/2013 - 09/2014 | | | USD | | | 225,021 | | | | AUD | | | | 249,725 | | | | 2,820 | | | | 6,932,821 | |
| GSCO | | | 10/2013 - 01/2015 | | | USD | | | 380,214 | | | | BRL | | | | 891,448 | | | | 3,530,150 | | | | 13,419,917 | |
| GSCO | | | 11/2013 - 12/2013 | | | USD | | | 572,727 | | | | EUR | | | | 429,000 | | | | – | | | | 7,736,189 | |
| GSCO | | | 09/2014 | | | USD | | | 43,605 | | | | INR | | | | 3,127,000 | | | | – | | | | 2,483,000 | |
| GSCO | | | 11/2013 | | | USD | | | 144,572 | | | | JPY | | | | 14,172,000 | | | | 1,407,297 | | | | 1,060,796 | |
37 OPPENHEIMER INTERNATIONAL BOND FUND
| | | | |
| | |
| | STATEMENTOF INVESTMENTS Continued | | |
| | | | | | | | | | | | | | | | | | | | | | | | | | | | |
| Footnotes to Statement of Investments Continued | |
| Forward Currency Exchange Contracts: Continued | |
| Counterparty | | Settlement Month(s) | | | Currency
Purchased (000’s) | | | | | | Currency Sold
(000’s) | | | Unrealized
Appreciation | | | Unrealized
Depreciation | |
| GSCO | | | 10/2014 | | | | USD | | | | 68,046 | | | | MXN | | | | 920,260 | | | $ | – | | | $ | 252,652 | |
| GSCO | | | 11/2013 | | | | USD | | | | 66,367 | | | | TRY | | | | 131,175 | | | | 1,782,018 | | | | – | |
| HSBC | | | 03/2014 | | | | USD | | | | 67,904 | | | | TRY | | | | 139,610 | | | | 726,177 | | | | – | |
| JPM | | | 10/2013 | | | | BRL | | | | 41,800 | | | | USD | | | | 18,661 | | | | 199,548 | | | | – | |
| JPM | | | 10/2013 | | | | COP | | | | 33,046,000 | | | | USD | | | | 16,997 | | | | 331,089 | | | | – | |
| JPM | | | 12/2013 | | | | IDR | | | | 171,848,000 | | | | USD | | | | 15,433 | | | | – | | | | 949,125 | |
| JPM | | | 11/2013 | | | | KRW | | | | 23,071,000 | | | | USD | | | | 21,422 | | | | 497 | | | | – | |
| JPM | | | 10/2013 | | | | MYR | | | | 69,030 | | | | USD | | | | 21,572 | | | | – | | | | 418,441 | |
| JPM | | | 12/2013 | | | | PLN | | | | 102,830 | | | | USD | | | | 33,283 | | | | – | | | | 477,038 | |
| JPM | | | 11/2013 | | | | THB | | | | 642,000 | | | | USD | | | | 20,081 | | | | 379,923 | | | | – | |
| JPM | | | 12/2013 | | | | TRY | | | | 102,320 | | | | USD | | | | 52,118 | | | | – | | | | 2,031,656 | |
| JPM | | | 10/2013 - 11/2013 | | | | USD | | | | 37,268 | | | | BRL | | | | 83,600 | | | | – | | | | 293,974 | |
| JPM | | | 10/2013 | | | | USD | | | | 60,412 | | | | COP | | | | 111,490,000 | | | | 1,950,777 | | | | – | |
| JPM | | | 01/2014 | | | | USD | | | | 13,629 | | | | IDR | | | | 160,142,000 | | | | 183,973 | | | | – | |
| JPM | | | 11/2013 | | | | USD | | | | 62,367 | | | | JPY | | | | 6,159,000 | | | | 144,464 | | | | 456,768 | |
| JPM | | | 10/2013 - 12/2013 | | | | USD | | | | 62,997 | | | | RUB | | | | 2,114,195 | | | | – | | | | 1,620,176 | |
| JPM | | | 05/2014 | | | | USD | | | | 32,283 | | | | THB | | | | 977,200 | | | | 1,417,359 | | | | – | |
| JPM | | | 10/2013 - 12/2013 | | | | USD | | | | 66,810 | | | | TRY | | | | 132,255 | | | | 1,912,122 | | | | – | |
| MSCO | | | 11/2013 | | | | EUR | | | | 218,975 | | | | USD | | | | 289,710 | | | | 6,575,337 | | | | – | |
| MSCO | | | 11/2013 | | | | GBP | | | | 2,740 | | | | USD | | | | 4,418 | | | | 15,502 | | | | – | |
| MSCO | | | 11/2013 | | | | MXN | | | | 2,962,190 | | | | USD | | | | 234,584 | | | | 377,411 | | | | 9,369,486 | |
| MSCO | | | 10/2013 | | | | PEN | | | | 53,175 | | | | USD | | | | 19,231 | | | | – | | | | 205,787 | |
| MSCO | | | 07/2014 | | | | USD | | | | 48,494 | | | | BRL | | | | 112,070 | | | | 960,948 | | | | – | |
| MSCO | | | 11/2013 | | | | USD | | | | 412,096 | | | | EUR | | | | 311,280 | | | | 9,246 | | | | 9,093,204 | |
| MSCO | | | 11/2013 | | | | USD | | | | 65,675 | | | | GBP | | | | 42,115 | | | | – | | | | 2,475,261 | |
| MSCO | | | 11/2013 - 12/2013 | | | | USD | | | | 173,204 | | | | MXN | | | | 2,256,630 | | | | 1,716,236 | | | | 306,301 | |
| MSCO | | | 11/2013 | | | | USD | | | | 4,294 | | | | SEK | | | | 27,780 | | | | – | | | | 22,223 | |
| MSCO | | | 10/2013 | | | | ZAR | | | | 840,280 | | | | USD | | | | 81,598 | | | | 2,035,751 | | | | – | |
| NOM | | | 12/2013 | | | | EUR | | | | 7,810 | | | | USD | | | | 10,572 | | | | – | | | | 4,587 | |
| NOM | | | 10/2013 - 11/2013 | | | | JPY | | | | 59,245,000 | | | | USD | | | | 590,192 | | | | 13,168,852 | | | | 450,119 | |
| NOM | | | 11/2013 | | | | MYR | | | | 375,150 | | | | USD | | | | 116,825 | | | | – | | | | 2,097,207 | |
| NOM | | | 11/2013 | | | | THB | | | | 560,500 | | | | USD | | | | 18,237 | | | | 19,827 | | | | 392,888 | |
| NOM | | | 10/2013 - 11/2013 | | | | USD | | | | 500,298 | | | | JPY | | | | 49,642,000 | | | | 1,354,040 | | | | 6,184,202 | |
| NOM | | | 11/2013 | | | | USD | | | | 68,670 | | | | MYR | | | | 225,775 | | | | 418,759 | | | | 794,789 | |
| RBSC | | | 11/2013 | | | | CHF | | | | 17,245 | | | | USD | | | | 17,943 | | | | 1,135,285 | | | | – | |
| RBSC | | | 10/2013 - 11/2013 | | | | KRW | | | | 270,802,000 | | | | USD | | | | 242,215 | | | | 9,171,783 | | | | – | |
| RBSC | | | 11/2013 | | | | NOK | | | | 20,930 | | | | USD | | | | 3,538 | | | | – | | | | 65,153 | |
| RBSC | | | 11/2013 | | | | PLN | | | | 119,790 | | | | USD | | | | 37,456 | | | | 773,919 | | | | – | |
| RBSC | | | 11/2013 | | | | SEK | | | | 18,670 | | | | USD | | | | 2,824 | | | | 76,839 | | | | – | |
| RBSC | | | 11/2013 | | | | USD | | | | 3,308 | | | | CHF | | | | 3,040 | | | | – | | | | 55,441 | |
| RBSC | | | 11/2013 | | | | USD | | | | 2,790 | | | | DKK | | | | 15,785 | | | | – | | | | 74,223 | |
| RBSC | | | 11/2013 | | | | USD | | | | 133,590 | | | | EUR | | | | 100,000 | | | | – | | | | 1,705,479 | |
| RBSC | | | 12/2013 | | | | USD | | | | 5,466 | | | | HUF | | | | 1,248,000 | | | | – | | | | 179,932 | |
| RBSC | | | 11/2013 | | | | USD | | | | 67,618 | | | | KRW | | | | 76,070,000 | | | | – | | | | 2,970,485 | |
| RBSC | | | 11/2013 | | | | USD | | | | 1,942 | | | | PLN | | | | 6,120 | | | | – | | | | 10,956 | |
| RBSC | | | 10/2013 | | | | USD | | | | 116,924 | | | | ZAR | | | | 1,105,390 | | | | 6,903,507 | | | | – | |
| RBSC | | | 10/2013 | | | | ZAR | | | | 887,820 | | | | USD | | | | 89,053 | | | | – | | | | 687,331 | |
| | | | | | | | | | | | | | | | | | | | | | | | |
| Total unrealized appreciation and depreciation | | | $ | 175,667,582 | | | $ | 148,001,812 | |
| | | | | | | | | | | | | | | | | | | | | | | | |
38 OPPENHEIMER INTERNATIONAL BOND FUND
Footnotes to Statement of Investments Continued
|
| Futures Contracts as of September 30, 2013: |
| | | | | | | | | | | | | | | | | | | | |
| Description | | Exchange | | | Buy/Sell | | | Expiration
Date | | | Number of
Contracts | | | Unrealized
Appreciation
(Depreciation) | |
| Australian Treasury Bonds, 10 yr. | | | SFE | | | | Sell | | | | 12/16/13 | | | | 2,844 | | | $ | (6,311,271) | |
| Euro-Bundesobligations | | | EUX | | | | Sell | | | | 12/06/13 | | | | 607 | | | | (1,924,845) | |
| U.S. Treasury Long Bonds | | | CBT | | | | Sell | | | | 12/19/13 | | | | 2,643 | | | | (6,885,242) | |
| U.S. Treasury Nts., 5 yr. | | | CBT | | | | Buy | | | | 12/31/13 | | | | 1,434 | | | | 475,328 | |
| U.S. Treasury Nts., 5 yr. | | | CBT | | | | Sell | | | | 12/31/13 | | | | 1,500 | | | | (2,593,545) | |
| U.S. Treasury Nts., 10 yr. | | | CBT | | | | Sell | | | | 12/19/13 | | | | 1,000 | | | | (2,751,110) | |
| United Kingdom Long Gilt, 10 yr. | | | LIF | | | | Sell | | | | 12/27/13 | | | | 790 | | | | (1,802,840) | |
| | | | | | | | | | | | | | | | | | | | |
| | | | | | | | | | | | | | | | | | $ | (21,793,525) | |
| | | | | | | | | | | | | | | | | | | | |
|
| Over-the-Counter Options Written at September 30, 2013 |
| | | | | | | | | | | | | | | | | | | | | | | | | | | | | | | | |
| Description | | Counterparty | | | | | | Exercise
Price | | | Expiration
Date | | | | | | Number of
Contracts | | | Premiums
Received | | | Value | |
AUD Currency Put | | | GSCO | | | | JPY | | | | 70.080 | | | | 9/10/14 | | | | AUD | | | | (141,580,000 | ) | | $ | 1,270,951 | | | | $ (1,225,203) | |
AUD Currency Put | | | BOFA | | | | JPY | | | | 70.000 | | | | 8/4/14 | | | | AUD | | | | (93,890,000 | ) | | | 1,056,017 | | | | (640,530) | |
BRL Currency Put | | | CITI | | | | BRL | | | | 2.460 | | | | 10/15/13 | | | | BRL | | | | (123,000,000 | ) | | | 408,500 | | | | (1,476) | |
BRL Currency Put | | | CITI | | | | BRL | | | | 2.490 | | | | 10/11/13 | | | | BRL | | | | (124,500,000 | ) | | | 476,250 | | | | — | |
EUR Currency Call | | | GSCO | | | | EUR | | | | 1.404 | | | | 12/19/13 | | | | EUR | | | | (300,000,000 | ) | | | 1,069,848 | | | | (852,300) | |
EUR Currency Call | | | GSCO | | | | TRY | | | | 2.738 | | | | 10/31/13 | | | | EUR | | | | (100,000,000 | ) | | | 1,261,458 | | | | (2,616,081) | |
| France (Republic of) Bonds, 2.75%, 10/25/27 Put | | | GSCO | | | | JPM | | | | 98.875 | | | | 10/22/13 | | | | EUR | | | | (43,950,000 | ) | | | 1,638,855 | | | | (752,445) | |
INR Currency Put | | | GSCO | | | | INR | | | | 98.320 | | | | 9/2/14 | | | | INR | | | | (4,380,200,000 | ) | | | 878,016 | | | | (162,067) | |
INR Currency Put | | | GSCO | | | | INR | | | | 100.000 | | | | 9/3/14 | | | | INR | | | | (4,456,500,000 | ) | | | 806,627 | | | | (142,608) | |
JPY Currency Call1 | | | BAC | | | | JPY | | | | 90.000 | | | | 4/7/15 | | | | JPY | | | | (9,000,000,000 | ) | | | 2,000,000 | | | | (2,295,000) | |
JPY Currency Call2 | | | BAC | | | | JPY | | | | 85.000 | | | | 5/22/15 | | | | JPY | | | | (12,750,000,000 | ) | | | 3,495,001 | | | | (2,970,750) | |
JPY Currency Put | | | BAC | | | | JPY | | | | 112.000 | | | | 4/7/15 | | | | JPY | | | | (11,200,000,000 | ) | | | 2,280,000 | | | | (1,276,800) | |
JPY Currency Call | | | BOFA | | | | KRW | | | | 13.695 | | | | 4/30/15 | | | | JPY | | | | (5,000,000,000 | ) | | | 1,980,818 | | | | (1,364,719) | |
JPY Currency Put | | | BOFA | | | | JPY | | | | 114.000 | | | | 4/9/15 | | | | JPY | | | | (28,500,000,000 | ) | | | 6,221,000 | | | | (2,650,500) | |
JPY Currency Call | | | BOFA | | | | KRW | | | | 13.540 | | | | 5/7/15 | | | | JPY | | | | (5,000,000,000 | ) | | | 1,647,213 | | | | (1,467,099) | |
JPY Currency Call1 | | | BOFA | | | | JPY | | | | 90.000 | | | | 4/9/15 | | | | JPY | | | | (22,500,000,000 | ) | | | 4,924,999 | | | | (6,300,000) | |
JPY Currency Call | | | GSCO | | | | KRW | | | | 13.600 | | | | 5/7/15 | | | | JPY | | | | (5,000,000,000 | ) | | | 1,902,857 | | | | (1,359,390) | |
JPY Currency Call3 | | | GSCO | | | | JPY | | | | 87.000 | | | | 4/15/15 | | | | JPY | | | | (10,875,000,000 | ) | | | 1,797,500 | | | | (2,457,750) | |
JPY Currency Call1 | | | GSCO | | | | JPY | | | | 90.000 | | | | 5/11/15 | | | | JPY | | | | (18,000,000,000 | ) | | | 4,585,999 | | | | (5,310,000) | |
JPY Currency Put | | | GSCO | | | | JPY | | | | 117.000 | | | | 5/11/15 | | | | JPY | | | | (23,400,000,000 | ) | | | 4,194,001 | | | | (1,638,000) | |
JPY Currency Put | | | GSCO | | | | JPY | | | | 115.000 | | | | 4/15/15 | | | | JPY | | | | (14,375,000,000 | ) | | | 2,584,999 | | | | (1,207,500) | |
JPY Currency Call4 | | | GSCO | | | | JPY | | | | 87.000 | | | | 4/8/15 | | | | JPY | | | | (8,700,000,000 | ) | | | 1,520,000 | | | | (1,218,000) | |
JPY Currency Call | | | GSCO | | | | JPY | | | | 87.800 | | | | 9/7/15 | | | | JPY | | | | (17,560,000,000 | ) | | | 6,271,999 | | | | (6,023,080) | |
JPY Currency Call5 | | | GSCO | | | | JPY | | | | 87.000 | | | | 4/8/15 | | | | JPY | | | | (8,700,000,000 | ) | | | 1,909,998 | | | | (1,774,800) | |
JPY Currency Put | | | GSCO | | | | JPY | | | | 100.000 | | | | 10/18/13 | | | | JPY | | | | (39,163,500,000 | ) | | | 994,753 | | | | (1,370,722) | |
JPY Currency Call | | | GSCO | | | | JPY | | | | 90.000 | | | | 5/22/15 | | | | JPY | | | | (17,804,000,000 | ) | | | 3,362,977 | | | | (5,323,396) | |
JPY Currency Call6 | | | GSCO | | | | JPY | | | | 89.000 | | | | 5/22/15 | | | | JPY | | | | (13,350,000,000 | ) | | | 4,305,002 | | | | (3,244,050) | |
JPY Currency Put | | | GSCO | | | | JPY | | | | 112.000 | | | | 5/7/15 | | | | JPY | | | | (14,000,000,000 | ) | | | 2,937,499 | | | | (1,680,000) | |
JPY Currency Call7 | | | GSCO | | | | JPY | | | | 87.000 | | | | 5/7/15 | | | | JPY | | | | (10,875,000,000 | ) | | | 2,656,249 | | | | (2,794,875) | |
JPY Currency Put | | | GSCO | | | | JPY | | | | 120.000 | | | | 5/22/15 | | | | JPY | | | | (23,739,000,000 | ) | | | 4,015,846 | | | | (1,186,950) | |
JPY Currency Call8 | | | GSCO | | | | JPY | | | | 88.000 | | | | 4/10/15 | | | | JPY | | | | (11,000,000,000 | ) | | | 2,125,001 | | | | (1,694,000) | |
JPY Currency Call | | | JPM | | | | KRW | | | | 13.180 | | | | 5/7/15 | | | | JPY | | | | (5,000,000,000 | ) | | | 1,783,639 | | | | (1,715,674) | |
JPY Currency Put | | | RBSC | | | | JPY | | | | 112.000 | | | | 4/7/15 | | | | JPY | | | | (11,200,000,000 | ) | | | 2,250,000 | | | | (1,276,800) | |
39 OPPENHEIMER INTERNATIONAL BOND FUND
| | | | |
| | |
| | STATEMENTOF INVESTMENTS Continued | | |
Footnotes to Statement of Investments Continued
|
| Over-the-Counter Options Written: Continued |
| | | | | | | | | | | | | | | | | | | | | | | | | | | | | | | | |
| Description | | Counterparty | | | | | | Exercise
Price | | | Expiration
Date | | | | | | Number of
Contracts | | | Premiums
Received | | | Value | |
| |
JPY Currency Call1 | | | RBSC | | | | JPY | | | | 90.000 | | | | 4/7/15 | | | | JPY | | | | (9,000,000,000 | ) | | $ | 1,907,500 | | | $ | (2,277,000) | |
| |
MXN Currency Call | | | GSCO | | | | MXN | | | | 12.250 | | | | 9/29/14 | | | | MXN | | | | (2,381,700,000 | ) | | | 2,692,779 | | | | (2,791,352) | |
| |
MXN Currency Put | | | GSCO | | | | MXN | | | | 13.310 | | | | 10/18/13 | | | | MXN | | | | (1,287,000,000 | ) | | | 975,645 | | | | (763,191) | |
| |
MXN Currency Put | | | GSCO | | | | MXN | | | | 15.750 | | | | 9/29/14 | | | | MXN | | | | (3,062,200,000 | ) | | | 4,096,543 | | | | (3,925,741) | |
| |
MXN Currency Call | | | GSCO | | | | MXN | | | | 12.275 | | | | 12/23/13 | | | | MXN | | | | (765,100,000 | ) | | | 375,226 | | | | (185,919) | |
| |
MXN Currency Put | | | MSCO | | | | MXN | | | | 13.310 | | | | 10/18/13 | | | | MXN | | | | (1,287,150,000 | ) | | | 998,481 | | | | (763,280) | |
| |
TRY Currency Put9 | | | GSCO | | | | TRY | | | | 2.115 | | | | 10/9/13 | | | | TRY | | | | (68,130,000 | ) | | | 277,417 | | | | (37,880) | |
| |
TRY Currency Put | | | GSCO | | | | TRY | | | | 2.058 | | | | 10/22/13 | | | | TRY | | | | (66,280,000 | ) | | | 243,859 | | | | (226,280) | |
| | | | | | | | | | | | | | | | | | | | | | | | | | | | |
Total of Over-the-Counter Options Written | | | | | | | | | | | | | | | $ | 92,181,322 | | | $ | (76,963,208) | |
| | | | | | | | | | | | | | | | | | | | | | | | | | | | |
1. Knock-in option becomes eligible for exercise if at any time prior to expiration spot rates are less than or equal to 80JPY per 1USD.
2. Knock-in option becomes eligible for exercise if at any time prior to expiration spot rates are less than or equal to 79.2JPY per 1USD.
3. Knock-in option becomes eligible for exercise if at any time prior to expiration spot rates are less than or equal to 78.50JPY per 1USD.
4. Knock-in option becomes eligible for exercise if at any time prior to expiration spot rates are less than or equal to 71.75JPY per 1USD.
5. Knock-in option becomes eligible for exercise if at any time prior to expiration spot rates are less than or equal to 79.5JPY per 1USD.
6. Knock-in option becomes eligible for exercise if at any time prior to expiration spot rates are less than or equal to 79JPY per 1USD.
7. Knock-in option becomes eligible for exercise if at any time prior to expiration spot rates are less than or equal to 85JPY per 1USD.
8. Knock-in option becomes eligible for exercise if at any time prior to expiration spot rates are less than or equal to 72.75JPY per 1USD.
9. Knock-in option becomes eligible for exercise if at any time prior to expiration spot rates are greater than or equal to 2.1645 TRY per 1USD.
|
| Over-the-Counter Credit Default Swaps at September 30, 2013 |
| | | | | | | | | | | | | | | | | | | | | | | | | | | | | | | | |
| Reference Asset | | Counterparty | | | Buy/Sell
Protection | | | Fixed Rate | | | Maturity
Date | | | | | | Notional
Amount
(000’s) | | | Premiums
Received/
(Paid) | | | Value | |
| Banco Bilbao Vizcaya Argentaria Senior Finance SAU | | | UBS | | | | Sell | | | | 3.000% | | | | 12/20/17 | | | | EUR | | | | 4,405 | | | $ | 171,759 | | | $ | 195,391 | |
| Banco Bilbao Vizcaya Argentaria Senior Finance SAU | | | UBS | | | | Sell | | | | 3.000 | | | | 12/20/17 | | | | EUR | | | | 4,405 | | | | 171,758 | | | | 195,391 | |
| Banco Santander SA | | | BAC | | | | Sell | | | | 3.000 | | | | 9/20/17 | | | | EUR | | | | 20,000 | | | | (72,103) | | | | 1,056,258 | |
| Republic of Ireland | | | GSCO | | | | Buy | | | | 1.000 | | | | 3/20/18 | | | | EUR | | | | 19,335 | | | | (715,358) | | | | (364,234 | ) |
| Republic of Ireland | | | GSCO | | | | Buy | | | | 1.000 | | | | 3/20/18 | | | | USD | | | | 21,975 | | | | (923,121) | | | | 287,932 | |
| Republic of Italy | | | GSCO | | | | Sell | | | | 1.000 | | | | 3/20/23 | | | | USD | | | | 22,000 | | | | 3,517,302 | | | | (3,253,954 | ) |
| Santander International Debt SAU | | | BOFA | | | | Sell | | | | 3.000 | | | | 12/20/17 | | | | EUR | | | | 5,000 | | | | (106,114) | | | | 257,897 | |
| Santander International Debt SAU | | | UBS | | | | Sell | | | | 3.000 | | | | 9/20/17 | | | | EUR | | | | 8,850 | | | | (31,906) | | | | 467,394 | |
40 OPPENHEIMER INTERNATIONAL BOND FUND
|
| Footnotes to Statement of Investments Continued |
| Over-the-Counter Credit Default Swaps: Continued |
|
| | | | | | | | | | | | | | | | | | | | | | | | | | | | | | |
| Reference Asset | | Counterparty | | | Buy/Sell
Protection | | | Fixed
Rate | | | Maturity
Date | | | | | Notional
Amount
(000’s) | | | Premiums
Received/
(Paid) | | | Value | |
| Telefonica Emisiones SAU | | | UBS | | | | Sell | | | | 1.000% | | | | 9/20/17 | | | EUR | | | 5,000 | | | $ | 627,078 | | | $ | (232,055 | ) |
| Ukraine | | | JPM | | | | Buy | | | | 5.000 | | | | 12/20/18 | | | USD | | | 6,325 | | | | (1,276,493 | ) | | | 1,400,545 | |
| Ukraine | | | JPM | | | | Buy | | | | 5.000 | | | | 12/20/18 | | | USD | | | 6,325 | | | | (1,285,810 | ) | | | 1,400,545 | |
| | | | | | | | | | | | | | | | | | | | | | | | | | |
| Total of Over-the-Counter Credit Default Swaps | | | | | | | | | | | | | | | | | $ | 76,992 | | | $ | 1,411,110 | |
| | | | | | | | | | | | | | | | | | | | | | | | | | |
The table that follows shows the undiscounted maximum potential payment by the Fund related to selling credit protection in credit default swaps:
| | | | | | | | | | | | | | | | | | | | |
Type of Reference Asset on which the Fund Sold Protection | | Total Maximum
Potential Payments
for Selling Credit
Protection
(Undiscounted) | | | | | | Amount
Recoverable* | | | | | | Reference
Asset Rating
Range** | |
| Investment Grade Single Name | | | | | | | | | | | | | | | | | | | | |
| Corporate Debt (EUR) | | | 47,660,000 | | | | EUR | | | | — | | | | EUR | | | | BBB to BBB- | |
| Investment Grade Sovereign Debt | | $ | 22,000,000 | | | | | | | $ | — | | | | | | | | BBB+ | |
| | | | | | | | | | | | | | | | | | | | |
| Total EUR | | | 47,660,000 | | | | EUR | | | | — | | | | EUR | | | | | |
| | | | | | | | | | | | | | | | | | | | |
| Total USD | | $ | 22,000,000 | | | | | | | $ | — | | | | | | | | | |
| | | | | | | | | | | | | | | | | | | | |
*The Fund has no amounts recoverable from related purchased protection. In addition, the Fund has no recourse provisions under the credit derivatives and holds no collateral which can offset or reduce potential payments under a triggering event.
**The period end reference asset security ratings, as rated by any rating organization, are included in the equivalent Standard & Poor’s rating category. The reference asset rating represents the likelihood of a potential credit event on the reference asset which would result in a related payment by the Fund.
| | | | | | | | | | | | | | | | | | | | | | | | | | |
| Cleared Interest Rate Swaps at September 30, 2013 | | | | | | | | | | | | | | | |
| Exchange | | Pay/Receive
Floating
Rate | | | Floating
Rate | | | Fixed Rate | | | Maturity
Date | | | Notional Amount
(000’s) | | | Value | |
JPM | | | Receive | | |
| Six-Month
EUR
EURIBOR |
| | | 2.253% | | | | 9/6/23 | | | EUR | | | 63,385 | | | $ | (1,601,368) | |
JPM | | | Receive | | |
| Three-
Month USD
BBA LIBOR |
| | | 1.859 | | | | 3/6/17 | | | USD | | | 323,525 | | | | (3,317,121) | |
JPM | | | Receive | | |
| Three-
Month USD
BBA LIBOR |
| | | 2.543 | | | | 9/9/17 | | | USD | | | 520,000 | | | | (7,354,189) | |
CITI | | | Receive | | |
| Three-
Month USD
BBA LIBOR |
| | | 2.855 | | | | 9/20/23 | | | USD | | | 101,005 | | | | (862,201) | |
JPM | | | Receive | | |
| Six-Month
EUR
EURIBOR |
| | | 1.435 | | | | 9/5/18 | | | EUR | | | 100,760 | | | | (1,561,618) | |
JPM | | | Receive | | |
| Three-
Month USD
BBA LIBOR |
| | | 1.719 | | | | 8/29/18 | | | USD | | | 250,000 | | | | (2,753,619) | |
JPM | | | Receive | | |
| Six-Month
EUR
EURIBOR |
| | | 2.254 | | | | 9/5/23 | | | EUR | | | 95,365 | | | | (2,430,519) | |
| | | | | | | | | | | | | | | | | | | | | | | | | | |
Total of Cleared Interest Rate Swaps | | | | | | | | | | | | | | | | | | | | | | | | $ | (19,880,635) | |
| | | | | | | | | | | | | | | | | | | | | | | | | | |
41 OPPENHEIMER INTERNATIONAL BOND FUND
| | | | |
| | |
| | STATEMENTOF INVESTMENTS Continued | | |
|
| Footnotes to Statement of Investments Continued |
| Over-the-Counter Interest Rate Swaps at September 30, 2013 |
| | | | | | | | | | | | | | | | | | | | | | | | | | | | |
| Counterparty | | Pay/Receive
Floating
Rate | | | Floating
Rate | | | Fixed Rate | | | Maturity
Date | | | Notional Amount
(000’s) | | | Value | |
BAC | | | Pay | | |
| MXN TIIE
BANXICO |
| | | 8.255% | | | | 8/10/23 | | | | MXN | | | | 291,700 | | | $ | (108,771) | |
BAC | | | Pay | | |
| Three-
Month SEK
STIBOR
SIDE |
| | | 1.700 | | | | 4/22/17 | | | | SEK | | | | 1,700,000 | | | | (3,313,475) | |
BAC | | | Pay | | |
| Three-
Month SEK
STIBOR
SIDE |
| | | 2.175 | | | | 5/10/23 | | | | SEK | | | | 163,000 | | | | (1,134,439) | |
BAC | | | Pay | | |
| Three-
Month ZAR
JIBAR
SAFEX |
| | | 6.980 | | | | 6/20/15 | | | | ZAR | | | | 459,100 | | | | 198,769 | |
BOFA | | | Pay | | |
| Three-
Month CAD
BA CDOR |
| | | 2.159 | | | | 4/9/20 | | | | CAD | | | | 100,000 | | | | (3,364,601) | |
BOFA | | | Pay | | |
| MXN TIIE
BANXICO |
| | | 7.530 | | | | 5/18/33 | | | | MXN | | | | 87,800 | | | | (82,590) | |
BOFA | | | Pay | | |
| Three-
Month CAD
BA CDOR |
| | | 1.660 | | | | 5/9/16 | | | | CAD | | | | 469,950 | | | | (1,535,129) | |
BOFA | | | Pay | | |
| MXN TIIE
BANXICO |
| | | 6.390 | | | | 2/8/33 | | | | MXN | | | | 200,000 | | | | (2,045,517) | |
BOFA | | | Pay | | |
| MXN TIIE
BANXICO |
| | | 6.315 | | | | 2/23/33 | | | | MXN | | | | 100,000 | | | | (1,081,193) | |
BOFA | | | Pay | | |
| Three-
Month CAD
BA CDOR |
| | | 3.155 | | | | 9/18/23 | | | | CAD | | | | 103,675 | | | | 1,260,509 | |
GSCO | | | Pay | | | | BZDI | | | | 9.950 | | | | 1/2/15 | | | | BRL | | | | 161,990 | | | | 53,978 | |
GSCO | | | Pay | | |
| Three-
Month ZAR
JIBAR
SAFEX |
| | | 7.000 | | | | 6/20/15 | | | | ZAR | | | | 707,400 | | | | 319,334 | |
GSCO | | | Pay | | |
| Three-
Month ZAR
JIBAR
SAFEX |
| | | 7.950 | | | | 6/22/16 | | | | ZAR | | | | 500,000 | | | | 233,798 | |
GSCO | | | Pay | | |
| Three-
Month ZAR
JIBAR
SAFEX |
| | | 7.850 | | | | 6/25/16 | | | | ZAR | | | | 482,600 | | | | 187,888 | |
GSCO | | | Pay | | |
| Three-
Month ZAR
JIBAR
SAFEX |
| | | 7.638 | | | | 8/3/16 | | | | ZAR | | | | 1,206,000 | | | | 146,599 | |
GSCO | | | Pay | | |
| Six-Month
JPY BBA
LIBOR |
| | | 0.820 | | | | 4/15/23 | | | | JPY | | | | 2,641,000 | | | | 95,661 | |
GSCO | | | Pay | | |
| Three-
Month SEK
STIBOR
SIDE |
| | | 1.565 | | | | 5/3/18 | | | | SEK | | | | 635,000 | | | | (2,235,098) | |
42 OPPENHEIMER INTERNATIONAL BOND FUND
|
| Footnotes to Statement of Investments Continued |
| Over-the-Counter Interest Rate Swaps: Continued |
| | | | | | | | | | | | | | | | | | | | | | | | | | | | |
| Counterparty | | Pay/Receive
Floating
Rate | | | Floating
Rate | | | Fixed Rate | | | Maturity
Date | | | Notional Amount
(000’s) | | | Value | |
| |
GSCO | | | Pay | | |
| MXN TIIE
BANXICO |
| | | 6.325% | | | | 3/10/33 | | | | MXN | | | | 235,000 | | | $ | (2,907,424) | |
| |
GSCO | | | Pay | | |
| MXN TIIE
BANXICO |
| | | 6.360 | | | | 2/8/33 | | | | MXN | | | | 200,000 | | | | (2,395,683) | |
| |
HSBC | | | Pay | | |
| MXN TIIE
BANXICO |
| | | 7.775 | | | | 7/28/23 | | | | MXN | | | | 298,500 | | | | (451,500) | |
| |
JPM | | | Pay | | |
| MXN TIIE
BANXICO |
| | | 7.030 | | | | 5/23/23 | | | | MXN | | | | 850,000 | | | | (2,750,883) | |
| |
JPM | | | Pay | | |
| MXN TIIE
BANXICO |
| | | 6.320 | | | | 2/23/33 | | | | MXN | | | | 140,000 | | | | (1,507,942) | |
| |
JPM | | | Pay | | |
| Three-
Month ZAR
JIBAR
SAFEX |
| | | 6.450 | | | | 7/2/15 | | | | ZAR | | | | 1,347,200 | | | | (89,473) | |
| |
JPM | | | Receive | | |
| Three-
Month USD
BBA LIBOR |
| | | 2.150 | | | | 5/30/23 | | | | USD | | | | 27,000 | | | | 1,153,026 | |
| |
JPM | | | Pay | | |
| Three-
Month ZAR
JIBAR
SAFEX |
| | | 7.460 | | | | 6/19/16 | | | | ZAR | | | | 957,500 | | | | 61,687 | |
| |
JPM | | | Pay | | |
| MXN TIIE
BANXICO |
| | | 7.340 | | | | 5/17/33 | | | | MXN | | | | 87,800 | | | | (218,931) | |
| |
JPM | | | Pay | | |
| Three-
Month
KRW CD
KSDA |
| | | 2.960 | | | | 3/15/23 | | | | KRW | | | | 25,000,000 | | | | (678,134) | |
| |
JPM | | | Pay | | |
| Three-
Month ZAR
JIBAR
SAFEX |
| | | 7.920 | | | | 6/20/16 | | | | ZAR | | | | 762,300 | | | | 357,820 | |
| |
JPM | | | Pay | | | | BZDI | | | | 8.700 | | | | 1/2/17 | | | | BRL | | | | 300,000 | | | | (6,591,791) | |
| | | | | | | | | | | | | | | | | | | | | | | | | | | | |
Total Over-the-Counter Interest Rate Swaps | | | | | | | | | | | | | | | | | | | | | | $ | (28,423,505) | |
| | | | | | | | | | | | | | | | | | | | | | | | | | | | |
|
| Over-the-Counter Credit Default Swaptions Written at September 30, 2013 |
| | | | | | | | | | | | | | | | | | | | | | | | | | | | | | | | | | | | |
| Description | | Counterparty | | | Buy/Sell
Protection | | | Reference Asset | | | Fixed
Rate | | | Expiration
Date | | | | | | Notional
Amount
(000’s) | | | Premiums
Received | | | Value | |
| |
| Credit Default Swap maturing 6/20/18 Call | | | JPM | | | | Sell | | | | CDX.NA.HY.20 | | | | 5.000% | | | | 12/18/13 | | | | USD | | | | 46,945 | | | $ | 715,911 | | | | $ (1,219,828) | |
| |
| Credit Default Swap maturing 6/20/18 Call | | | JPM | | | | Sell | | | | CDX.NA.HY.20 | | | | 5.000 | | | | 12/18/13 | | | | USD | | | | 46,945 | | | | 751,120 | | | | (66,221) | |
43 OPPENHEIMER INTERNATIONAL BOND FUND
| | | | |
| | |
| | STATEMENTOF INVESTMENTS Continued | | |
|
| Footnotes to Statement of Investments Continued |
| Over-the-Counter Credit Default Swaptions Written: Continued |
| | | | | | | | | | | | | | | | | | | | | | | | | | | | | | | | | | | | |
| Description | | Counterparty | | | Buy/Sell
Protection | | | Reference
Asset | | | Fixed
Rate | | | Expiration
Date | | | | | | Notional
Amount
(000’s) | | | Premiums
Received | | | Value | |
| |
| Credit Default Swap maturing 6/20/18 Call | | | JPM | | | | Sell | | |
| iTraxx Europe
Crossover
Series 19
Version 1 |
| | | 5.000% | | | | 11/20/13 | | | | EUR | | | | 44,380 | | | $ | 489,066 | | | $ | (133,426 | ) |
| |
| Credit Default Swap maturing 6/20/18 Call | | | BOFA | | | | Sell | | |
| iTraxx Europe
Senior
Financials
Series 19
Version 1 |
| | | 1.000 | | | | 10/16/13 | | | | EUR | | | | 60,430 | | | | 119,687 | | | | (180,845 | ) |
| | | | | | | | | | | | | | | | | | | | | | | | | | | | | | | | |
Total of Over-the-Counter Credit Default Swaptions Written | | | | | | | | | | | $ | 2,075,784 | | | $ | (1,600,320 | ) |
| | | | | | | | | | | | | | | | | | | | | | | | | | | | | | | | |
| | | | | | | | | | | | | | | | | | | | | | | | | | | | | | | | | | | | |
| Over-the-Counter Interest Rate Swaptions Written at September 30, 2013 | |
| Description | | Counterparty | | | Pay/Receive
Floating
Rate | | | Floating
Rate | | | Fixed
Rate | | | Expiration
Date | | | | | | Notional
Amount
(000’s) | | | Premiums
Received | | | Value | |
| |
| Interest Rate Swap maturing 7/20/20 Call | | | BAC | | | | Pay | | |
| Six-
Month
GBP BBA
LIBOR |
| | | 2.770% | | | | 7/20/15 | | | | GBP | | | | 131,725 | | | $ | 2,653,276 | | | | $ (4,400,437 | ) |
| |
| Interest Rate Swap maturing 6/1/33 Call | | | BAC | | | | Pay | | |
| Six-
Month
EUR
EURIBOR |
| | | 3.117 | | | | 5/30/23 | | | | EUR | | | | 43,925 | | | | 3,870,578 | | | | (4,150,139) | |
| |
| Interest Rate Swap maturing 10/20/23 Call | | | BAC | | | | Pay | | |
| MXN TIIE
BANXICO |
| | | 5.390 | | | | 10/31/13 | | | | MXN | | | | 193,300 | | | | 322,722 | | | | (1,463,057) | |
| |
| Interest Rate Swap maturing 8/5/17 Call | | | BAC | | | | Pay | | |
| Six-
Month
EUR
EURIBOR |
| | | 1.490 | | | | 8/3/15 | | | | EUR | | | | 287,135 | | | | 2,630,307 | | | | (2,742,321) | |
| |
| Interest Rate Swap maturing 6/20/21 Call | | | BAC | | | | Pay | | |
| Six-
Month
GBP BBA
LIBOR |
| | | 3.118 | | | | 6/20/16 | | | | GBP | | | | 175,715 | | | | 3,702,574 | | | | (7,530,033) | |
| |
| Interest Rate Swap maturing 1/14/19 Call | | | BAC | | | | Receive | | |
| Six-
Month
GBP BBA
LIBOR |
| | | 1.250 | | | | 1/14/14 | | | | GBP | | | | 219,515 | | | | 667,404 | | | | (116,211) | |
| |
| Interest Rate Swap maturing 7/20/20 Call | | | BAC | | | | Receive | | |
| Six-
Month GBP BBA
LIBOR |
| | | 1.770 | | | | 7/20/15 | | | | GBP | | | | 131,725 | | | | 1,869,354 | | | | (896,043) | |
| |
44 OPPENHEIMER INTERNATIONAL BOND FUND
Footnotes to Statement of Investments Continued
| | | | | | | | | | | | | | | | | | | | | | | | | | | | | | | | | | | | |
| Over-the-Counter Interest Rate Swaptions Written: Continued | | | | | | | | | | | | | | | | | |
| Description Counterparty | | | Pay/Receive
Floating
Rate | | | Floating
Rate | | | Fixed Rate | | | Expiration
Date | | | | | | Notional Amount (000’s) | | | Premiums Received | | | Value | |
| Interest Rate Swap maturing 6/20/21 Call | | | BAC | | | | Receive | | |
| Six-Month
GBP BBA
LIBOR |
| | | 2.118% | | | | 6/20/16 | | | | GBP | | | | 175,715 | | | $ | 4,635,074 | | | $ | (1,816,753 | ) |
| Interest Rate Swap maturing 4/27/22 Call | | | BAC | | | | Pay | | |
| Three-
Month
USD BBA
LIBOR |
| | | 3.100 | | | | 4/25/17 | | | | USD | | | | 310,270 | | | | 8,035,993 | | | | (15,187,403 | ) |
| Interest Rate Swap maturing 1/14/19 Call | | | BAC | | | | Pay | | |
| Six-Month
GBP BBA
LIBOR |
| | | 2.000 | | | | 1/14/14 | | | | GBP | | | | 219,515 | | | | 2,161,736 | | | | (2,250,366 | ) |
| Interest Rate Swap maturing 12/9/18 Call | | | BAC | | | | Receive | | |
| Three-
Month
USD BBA
LIBOR |
| | | 1.995 | | | | 12/5/13 | | | | USD | | | | 329,740 | | | | 2,225,745 | | | | (5,984,009 | ) |
| Interest Rate Swap maturing 1/25/21 Call | | | BAC | | | | Pay | | |
| Six-Month
GBP BBA
LIBOR |
| | | 2.295 | | | | 1/25/16 | | | | GBP | | | | 158,255 | | | | 5,917,080 | | | | (10,604,787 | ) |
| Interest Rate Swap maturing 11/9/22 Call | | | BAC | | | | Pay | | |
| Three-
Month
USD BBA
LIBOR |
| | | 3.165 | | | | 11/7/17 | | | | USD | | | | 250,000 | | | | 6,725,000 | | | | (13,424,398 | ) |
| Interest Rate Swap maturing 2/12/18 Call | | | BAC | | | | Receive | | |
| Three-
Month
USD BBA
LIBOR |
| | | 1.862 | | | | 2/6/14 | | | | USD | | | | 155,670 | | | | 350,258 | | | | (269,030 | ) |
| Interest Rate Swap maturing 4/10/17 Call | | | BAC | | | | Pay | | |
| Six-Month
GBP BBA
LIBOR |
| | | 0.838 | | | | 4/10/14 | | | | GBP | | | | 200,000 | | | | 1,655,375 | | | | (5,632,859 | ) |
| Interest Rate Swap maturing 8/4/21 Call | | | BOFA | | | | Pay | | |
| Three-
Month
USD BBA
LIBOR |
| | | 4.860 | | | | 8/2/16 | | | | USD | | | | 173,385 | | | | 2,600,775 | | | | (2,528,278 | ) |
| Interest Rate Swap maturing 10/21/23 Call | | | BOFA | | | | Receive | | |
| Three-
Month
USD BBA
LIBOR |
| | | 3.070 | | | | 10/17/13 | | | | USD | | | | 76,390 | | | | 794,456 | | | | (1,936,831 | ) |
45 OPPENHEIMER INTERNATIONAL BOND FUND
| | | | |
| | |
| | STATEMENTOF INVESTMENTS Continued | | |
Footnotes to Statement of Investments Continued
| | | | | | | | | | | | | | | | | | | | | | | | | | | | | | | | | | | | |
| Over-the-Counter Interest Rate Swaptions Written: Continued | | | | | | | | | | | | | | | | | |
| Description Counterparty | | | Pay/Receive
Floating
Rate | | | Floating
Rate | | | Fixed
Rate | | | Expiration
Date | | | | | | Notional
Amount
(000’s) | | | Premiums Received | | | Value | |
| Interest Rate Swap maturing 2/5/44 Call | | | BOFA | | | | Receive | | |
| Three-
Month
USD BBA
LIBOR |
| | | 3.760% | | | | 2/3/14 | | | | USD | | | | 25,945 | | | $ | 1,250,549 | | | $ | (971,265 | ) |
| Interest Rate Swap maturing 7/27/26 Call | | | BOFA | | | | Pay | | |
| Three-
Month
USD BBA
LIBOR |
| | | 3.960 | | | | 7/25/16 | | | | USD | | | | 150,240 | | | | 8,133,923 | | | | (8,038,126 | ) |
| Interest Rate Swap maturing 1/2/24 Call | | | BOFA | | | | Pay | | |
| MXN TIIE
BANXICO |
| | | 6.060 | | | | 1/13/14 | | | | MXN | | | | 219,685 | | | | 636,801 | | | | (1,119,863 | ) |
| Interest Rate Swap maturing 12/18/18 Call | | | BOFA | | | | Pay | | |
| Three-
Month
USD BBA
LIBOR |
| | | 2.403 | | | | 12/16/13 | | | | USD | | | | 163,900 | | | | 1,098,130 | | | | (1,741,357 | ) |
| Interest Rate Swap maturing 10/8/23 Call | | | BOFA | | | | Pay | | |
| Three-
Month
CAD BA
CDOR |
| | | 2.583 | | | | 10/8/13 | | | | CAD | | | | 78,525 | | | | 681,808 | | | | (3,073,766 | ) |
| Interest Rate Swap maturing 12/4/20 Call | | | GSCO | | | | Pay | | |
| Six-Month
GBP BBA
LIBOR |
| | | 2.055 | | | | 12/4/15 | | | | GBP | | | | 166,905 | | | | 6,294,832 | | | | (12,271,068 | ) |
| Interest Rate Swap maturing 11/24/22 Call | | | GSCO | | | | Pay | | |
| Three-
Month
USD BBA
LIBOR |
| | | 2.701 | | | | 11/21/17 | | | | USD | | | | 125,000 | | | | 4,618,750 | | | | (8,499,543 | ) |
| Interest Rate Swap maturing 12/27/18 Call | | | GSCO | | | | Pay | | |
| Six-Month
EUR
EURIBOR |
| | | 2.055 | | | | 12/20/13 | | | | EUR | | | | 219,545 | | | | 1,721,041 | | | | (1,100,273 | ) |
| Interest Rate Swap maturing 1/22/24 Call | | | GSCO | | | | Pay | | |
| Three-
Month
USD BBA
LIBOR |
| | | 4.500 | | | | 1/16/14 | | | | USD | | | | 116,785 | | | | 1,167,850 | | | | (634,858 | ) |
| Interest Rate Swap maturing 1/16/16 Call | | | GSCO | | | | Pay | | |
| Three-
Month
USD BBA
LIBOR |
| | | 2.000 | | | | 3/13/14 | | | | USD | | | | 1,017,000 | | | | 610,200 | | | | (122,772 | ) |
46 OPPENHEIMER INTERNATIONAL BOND FUND
Footnotes to Statement of Investments Continued
|
| Over-the-Counter Interest Rate Swaptions Written: Continued |
| | | | | | | | | | | | | | | | | | | | | | | | | | | | | | | | | | | | |
| | | | | | Pay/Receive
Floating | | | Floating | | | Fixed | | | Expiration | | | | | | Notional Amount | | | Premiums | | | | |
| Description | | Counterparty | | | Rate | | | Rate | | | Rate | | | Date | | | | | | (000’s) | | | Received | | | Value | |
| Interest Rate Swap maturing 3/7/19 Call | | | JPM | | | | Pay | | |
| Three-
Month
USD BBA
LIBOR |
| | | 2.860% | | | | 3/5/14 | | | | USD | | | | 126,355 | | | $ | 1,010,840 | | | $ | (282,031 | ) |
| Interest Rate Swap maturing 10/12/23 Call | | | JPM | | | | Pay | | |
| MXN TIIE
BANXICO |
| | | 6.750 | | | | 12/23/13 | | | | MXN | | | | 208,700 | | | | 448,672 | | | | (451,217 | ) |
| Interest Rate Swap maturing 10/19/23 Call | | | JPM | | | | Pay | | |
| MXN TIIE
BANXICO |
| | | 5.440 | | | | 10/30/13 | | | | MXN | | | | 196,000 | | | | 333,985 | | | | (1,425,315 | ) |
| Interest Rate Swap maturing 5/13/24 Call | | | JPM | | | | Pay | | |
| Six-Month
AUD BBR
BBSW |
| | | 4.075 | | | | 5/12/14 | | | | AUD | | | | 43,985 | | | | 1,144,927 | | | | (1,944,418 | ) |
| Interest Rate Swap maturing 1/26/27 Call | | | UBS | | | | Receive | | |
| Six-Month
EUR
EURIBOR |
| | | 2.545 | | | | 1/24/17 | | | | EUR | | | | 87,935 | | | | 5,383,590 | | | | (3,675,208 | ) |
| Interest Rate Swap maturing 6/12/17 Call | | | UBS | | | | Pay | | |
| Six-Month
EUR
EURIBOR |
| | | 1.320 | | | | 6/10/15 | | | | EUR | | | | 302,870 | | | | 2,855,721 | | | | (2,798,484 | ) |
| Interest Rate Swap maturing 5/23/18 Call | | | UBS | | | | Pay | | |
| Six-Month
GBP BBA
LIBOR |
| | | 1.545 | | | | 5/23/16 | | | | GBP | | | | 187,925 | | | | 2,484,916 | | | | (6,257,427 | ) |
| Interest Rate Swap maturing 9/23/20 Call | | | UBS | | | | Pay | | |
| Six-Month
EUR
EURIBOR |
| | | 2.620 | | | | 9/21/15 | | | | EUR | | | | 440,000 | | | | 9,898,843 | | | | (8,441,928 | ) |
| Interest Rate Swap maturing 12/9/18 Call | | | UBS | | | | Receive | | |
| Six-Month
EUR
EURIBOR |
| | | 1.650 | | | | 12/5/13 | | | | EUR | | | | 133,140 | | | | 1,406,064 | | | | (3,189,075 | ) |
| Interest Rate Swap maturing 12/5/18 Call | | | UBS | | | | Receive | | |
| Six-Month
GBP BBA
LIBOR |
| | | 2.150 | | | | 12/5/13 | | | | GBP | | | | 88,765 | | | | 1,259,260 | | | | (2,541,226 | ) |
47 OPPENHEIMER INTERNATIONAL BOND FUND
| | | | |
| | |
| | STATEMENTOF INVESTMENTS Continued | | |
Footnotes to Statement of Investments Continued
|
| Over-the-Counter Interest Rate Swaptions Written: Continued |
| | | | | | | | | | | | | | | | | | | | | | | | | | | | | | | | | | | | |
| | | | | | Pay/Receive | | | | | | | | | | | | | | | Notional | | | | | | | |
| Description | | Counterparty | | | Floating
Rate | | | Floating Rate | | | Fixed Rate | | | Expiration Date | | | | | | Amount (000’s) | | | Premiums
Received | | | Value | |
| Interest Rate Swap maturing 11/5/23 Call | | | UBS | | | | Pay | | |
| Three-
Month
USD BBA
LIBOR |
| | | 3.408% | | | | 11/1/13 | | | | USD | | | | 131,685 | | | $ | 981,053 | | | $ | (37,043) | |
| Interest Rate Swap maturing 3/7/24 Call | | | UBS | | | | Receive | | |
| Six-Month
EUR
EURIBOR |
| | | 2.510 | | | | 3/5/14 | | | | EUR | | | | 88,765 | | | | 2,329,016 | | | | (4,274,592) | |
| | | | | | | | | | | | | | | | | | | | | | | | | | | | | | | | |
Total of Over-the-Counter Interest Rate Swaptions Written | | | $ | 106,568,478 | | | $ | (153,823,810) | |
| | | | | | | | | | | | | | | | | | | | | | | | | | | | | | | | |
| | |
| Glossary: |
| Counterparty Abbreviations: | | |
BAC | | Barclays Bank plc |
BNP | | BNP Paribas |
BOFA | | Bank of America NA |
CITI | | Citibank NA |
CSS | | Credit Suisse International |
DEU | | Deutsche Bank Securities AG |
GSCO | | Goldman Sachs Bank USA |
HSBC | | HSBC Bank USA NA |
JPM | | JPMorgan Chase Bank NA |
MSCO | | Morgan Stanley Capital Services, Inc. |
NOM | | Nomura Global Financial Products, Inc. |
RBSC | | RBS Greenwich Capital |
UBS | | UBS AG |
|
| Currency abbreviations indicate amounts reporting in currencies: |
AUD | | Australian Dollar |
BRL | | Brazilian Real |
CAD | | Canadian Dollar |
CHF | | Swiss Franc |
CLP | | Chilean Peso |
COP | | Colombian Peso |
DKK | | Danish Krone |
EUR | | Euro |
GBP | | British Pound Sterling |
HUF | | Hungarian Forint |
IDR | | Indonesia Rupiah |
INR | | Indian Rupee |
JPY | | Japanese Yen |
KRW | | South Korean Won |
MXN | | Mexican Nuevo Peso |
MYR | | Malaysian Ringgit |
NGN | | Nigeria Naira |
NOK | | Norwegian Krone |
PEN | | Peruvian New Sol |
PHP | | Philippines Peso |
PLN | | Polish Zloty |
RSD | | Serbian Dinar |
RUB | | Russian Ruble |
SEK | | Swedish Krona |
SGD | | Singapore Dollar |
48 OPPENHEIMER INTERNATIONAL BOND FUND
| | |
| Footnotes to Statement of Investments Continued |
| Currency abbreviations indicate amounts reporting in currencies: Continued |
THB | | Thai Bhat |
TRY | | New Turkish Lira |
ZAR | | South African Rand |
| |
Definitions: | | |
BA CDOR | | Canada Bankers Acceptances Deposit Offering Rate |
BANXICO | | Banco de Mexico |
BBA LIBOR | | British Bankers’ Association London -Interbank Offered Rate |
BBR BBSW | | Bank Bill Swap Reference Rate (Australian Financial Market) |
BZDI | | Brazil Interbank Deposit Rate |
CD | | Certificate of Deposit |
CDX.NA.HY.20 | | Markit CDX North American High Yield |
EURIBOR | | Euro Interbank Offered Rate |
iTraxx Europe Crossover | | |
Series 19 Version 1 | | Credit Default Swap Trading Index for a Specific Basket of Securities |
iTraxx Europe Senior | | |
Financials Series 19 | | |
Version 1 | | Credit Default Swap Trading Index for a Specific Basket of Securities |
JIBAR SAFEX | | Johannesburg Intgerbank Agreed Rate South African Fututres Exchange |
KSDA | | Korean Securities Dealers Assn. |
STIBOR SIDE | | Stockholm Interbank Offered Rate |
TIIE | | Interbank Equilibrium Interest Rate |
| |
Exchange Abbreviations: | | |
CBT | | Chicago Board of Trade |
CITI | | Citigroup |
EUX | | European Stock Exchanges |
JPM | | JPMorgan Chase Bank NA |
LIF | | London International Financial Futures and Options Exchange |
SFE | | Sydney Futures Exchange |
See accompanying Notes to Financial Statements.
49 OPPENHEIMER INTERNATIONAL BOND FUND
| | | | |
| | |
| | STATEMENTOF ASSETS AND LIABILITIES September 30, 2013 | | |
| | | | |
| |
| Assets | | | | |
| Investments, at value—see accompanying statement of investments: | | | | |
| Unaffiliated companies (cost $10,947,445,085) | | $ | 10,621,376,926 | |
| Affiliated companies (cost $454,741,805) | | | 454,741,805 | |
| | | | |
| | | 11,076,118,731 | |
| |
| Cash—foreign currencies (cost $2,284,571) | | | 2,271,305 | |
| |
| Cash used for collateral on OTC derivatives | | | 52,513,807 | |
| |
| Unrealized appreciation on foreign currency exchange contracts | | | 175,667,582 | |
| |
| Swaps, at value (net premiums paid $3,352,030) | | | 9,330,422 | |
| |
| Receivables and other assets: | | | | |
| Interest, dividends and principal paydowns | | | 131,321,847 | |
| Investments sold | | | 99,883,798 | |
| Shares of beneficial interest sold | | | 26,601,898 | |
| Variation margin receivable | | | 2,792,919 | |
| Other | | | 414,572 | |
| | | | |
| Total assets | | | 11,576,916,881 | |
| |
| Liabilities | | | | |
| Bank overdraft | | | 16,852,855 | |
| |
| Unrealized depreciation on foreign currency exchange contracts | | | 148,001,812 | |
| |
| Options written, at value (premiums received $92,181,322) | | | 76,963,208 | |
| |
| Swaps, at value (net premiums received $3,429,022) | | | 36,342,817 | |
| |
| Swaptions written, at value (premiums received $108,644,262) | | | 155,424,130 | |
| |
| Payables and other liabilities: | | | | |
| Investments purchased (including $44,682,954 purchased on a when-issued or delayed delivery basis) | | | 167,011,461 | |
| Shares of beneficial interest redeemed | | | 40,524,884 | |
| Variation margin payable | | | 22,541,414 | |
| Dividends | | | 3,599,384 | |
| Transfer and shareholder servicing agent fees | | | 2,013,324 | |
| Distribution and service plan fees | | | 1,276,092 | |
| Shareholder communications | | | 603,656 | |
| Trustees’ compensation | | | 188,697 | |
| Other | | | 1,410,682 | |
| | | | |
| Total liabilities | | | 672,754,416 | |
| |
Net Assets | | $ | 10,904,162,465 | |
| | | | |
| | | | |
| |
| Composition of Net Assets | | | | |
| Par value of shares of beneficial interest | | $ | 1,791,942 | |
| |
| Additional paid-in capital | | | 11,361,005,637 | |
| |
| Accumulated net investment loss | | | (69,078,199 | ) |
| |
| Accumulated net realized gain on investments and foreign currency transactions | | | 7,518,655 | |
| |
| Net unrealized depreciation on investments and translation of assets and liabilities denominated in foreign currencies | | | (397,075,570 | ) |
| | | | |
Net Assets | | $ | 10,904,162,465 | |
| | | | |
50 OPPENHEIMER INTERNATIONAL BOND FUND
| | | | |
| Net Asset Value Per Share | | | | |
Class A Shares: | | | | |
Net asset value and redemption price per share (based on net assets of $4,794,923,234 and 787,437,425 shares of beneficial interest outstanding) | | $ | 6.09 | |
Maximum offering price per share (net asset value plus sales charge of 4.75% of offering price) | | $ | 6.39 | |
Class B Shares: | | | | |
Net asset value, redemption price (excludes applicable contingent deferred sales charge) and offering price per share (based on net assets of $128,904,871 and 21,249,762 shares of beneficial interest outstanding) | | $ | 6.07 | |
Class C Shares: | | | | |
Net asset value, redemption price (excludes applicable contingent deferred sales charge) and offering price per share (based on net assets of $1,238,931,009 and 204,215,348 shares of beneficial interest outstanding) | | $ | 6.07 | |
Class I Shares: | | | | |
Net asset value, redemption price and offering price per share (based on net assets of $542,636,749 and 89,233,614 shares of beneficial interest outstanding) | | $ | 6.08 | |
Class N Shares: | | | | |
Net asset value, redemption price (excludes applicable contingent deferred sales charge) and offering price per share (based on net assets of $252,758,633 and 41,629,457 shares of beneficial interest outstanding) | | $ | 6.07 | |
Class Y Shares: | | | | |
Net asset value, redemption price and offering price per share (based on net assets of $3,946,007,969 and 648,175,974 shares of beneficial interest outstanding) | | $ | 6.09 | |
See accompanying Notes to Financial Statements
51 OPPENHEIMER INTERNATIONAL BOND FUND
| | | | |
| | |
| | STATEMENTOF OPERATIONS For the Year Ended September 30, 2013 | | |
| | | | | | |
| Investment Income | | | | | | |
| Interest | | $ | 573,850,436 | | | |
| Dividends: | | | | | | |
| Unaffiliated companies | | | 1,023,886 | | | |
| Affiliated companies | | | 475,255 | | | |
| Other income | | | 24,338 | | | |
| | | |
| Total investment income | | | 575,373,915 | | | |
| Expenses | | | | | | |
| Management fees | | | 62,673,797 | | | |
| Distribution and service plan fees: | | | | | | |
| Class A | | | 13,880,450 | | | |
| Class B | | | 1,660,943 | | | |
| Class C | | | 15,123,348 | | | |
| Class N | | | 1,457,145 | | | |
| Transfer and shareholder servicing agent fees: | | | | | | |
| Class A | | | 12,239,047 | | | |
| Class B | | | 479,997 | | | |
| Class C | | | 2,216,908 | | | |
| Class I | | | 61,584 | | | |
| Class N | | | 1,334,240 | | | |
| Class Y | | | 9,279,571 | | | |
| Shareholder communications: | | | | | | |
| Class A | | | 636,950 | | | |
| Class B | | | 44,849 | | | |
| Class C | | | 161,487 | | | |
| Class I | | | 679 | | | |
| Class N | | | 23,117 | | | |
| Class Y | | | 598,890 | | | |
| Custodian fees and expenses | | | 2,674,064 | | | |
| Trustees’ compensation | | | 282,888 | | | |
| Other | | | 614,108 | | | |
| | | |
| Total expenses | | | 125,444,062 | | | |
| Less waivers and reimbursements of expenses | | | (657,507 | ) | | |
| | | |
| Net expenses | | | 124,786,555 | | | |
Net Investment Income | | | 450,587,360 | | | |
52 OPPENHEIMER INTERNATIONAL BOND FUND
| | | | |
| Realized and Unrealized Gain (Loss) | | | | |
| Net realized gain (loss) on: | | | | |
| Investments from unaffiliated companies (including premiums on options and swaptions exercised) | | $ | 117,543,838 | |
| Closing and expiration of option contracts written | | | 102,362,852 | |
| Closing and expiration of futures contracts | | | 65,915,271 | |
| Closing and expiration of swaption contracts written | | | 44,588,767 | |
| Foreign currency transactions | | | (337,968,360) | |
| Swap contracts | | | (43,100,496) | |
| | | | |
| Net realized loss | | | (50,658,128) | |
| Net change in unrealized appreciation/depreciation on: | | | | |
| Investments | | | (570,133,687) | |
| Translation of assets and liabilities denominated in foreign currencies | | | (66,980,835) | |
| Futures contracts | | | (16,820,052) | |
| Option contracts written | | | (4,601,736) | |
| Swaption contracts written | | | (55,109,200) | |
| Swap contracts | | | (37,438,236) | |
| | | | |
| Net change in unrealized appreciation/depreciation | | | (751,083,746) | |
| Net Decrease in Net Assets Resulting from Operations | | $ | (351,154,514) | |
| | | | |
See accompanying Notes to Financial Statements.
53 OPPENHEIMER INTERNATIONAL BOND FUND
| | | | |
| | |
| | STATEMENTOF CHANGES IN NET ASSETS | | |
| | | | | | | | |
| | | Year Ended
September 30, 2013 | | | Year Ended
September 28, 20121 | |
| Operations | | | | | | | | |
| Net investment income | | $ | 450,587,360 | | | $ | 489,386,565 | |
| Net realized gain (loss) | | | (50,658,128) | | | | 39,823,300 | |
| Net change in unrealized appreciation/depreciation | | | (751,083,746) | | | | 601,244,919 | |
| | | | | | | | |
Net increase (decrease) in net assets resulting from operations | | | (351,154,514) | | | | 1,130,454,784 | |
| Dividends and/or Distributions to Shareholders | | | | | | | | |
| Dividends from net investment income: | | | | | | | | |
| Class A | | | (207,329,209) | | | | (319,029,375) | |
| Class B | | | (4,769,252) | | | | (9,346,345) | |
| Class C | | | (45,809,112) | | | | (76,041,583) | |
| Class I | | | (8,379,307) | | | | (10,813) | |
| Class N | | | (9,643,527) | | | | (15,305,409) | |
| Class Y | | | (187,397,255) | | | | (243,652,704) | |
| | | | (463,327,662) | | | | (663,386,229) | |
| Distributions from net realized gain: | | | | | | | | |
| Class A | | | (35,431,146) | | | | — | |
| Class B | | | (1,125,675) | | | | — | |
| Class C | | | (9,753,509) | | | | — | |
| Class I | | | (202,424) | | | | — | |
| Class N | | | (1,870,317) | | | | — | |
| Class Y | | | (29,569,939) | | | | — | |
| | | | (77,953,010) | | | | — | |
| Beneficial Interest Transactions | | | | | | | | |
| Net increase (decrease) in net assets resulting from beneficial interest transactions: | | | | | | | | |
| Class A | | | (700,925,118) | | | | (714,539,449) | |
| Class B | | | (54,212,964) | | | | (40,258,973) | |
| Class C | | | (270,119,587) | | | | (171,620,269) | |
| Class I | | | 577,670,503 | | | | 824,893 | |
| Class N | | | (42,305,087) | | | | (18,961,583) | |
| Class Y | | | (459,827,692) | | | | 484,085,543 | |
| | | | | | | | |
| | | | (949,719,945) | | | | (460,469,838) | |
| Net Assets | | | | | | | | |
| Total increase (decrease) | | | (1,842,155,131) | | | | 6,598,717 | |
| Beginning of period | | | 12,746,317,596 | | | | 12,739,718,879 | |
| | | | | | | | |
| | |
End of period (including accumulated net investment income (loss) of
$(69,078,199) and $2,911,536, respectively) | | $ | 10,904,162,465 | | | $ | 12,746,317,596 | |
1. September 28, 2012 represents the last business day of the Fund’s reporting period. See Note 1 of the accompanying Notes.
See accompanying Notes to Financial Statements.
54 OPPENHEIMER INTERNATIONAL BOND FUND
| | | | | | | | | | | | | | | | | | | | |
| Class A | | Year Ended
September 30,
2013 | | | Year Ended
September 28,
20121 | | | Year Ended
September 30,
2011 | | | Year Ended
September 30,
2010 | | | Year Ended
September 30,
2009 | |
| |
| Per Share Operating Data | | | | | | | | | | | | | | | | | | | | |
| Net asset value, beginning of period | | $ | 6.54 | | | $ | 6.29 | | | $ | 6.80 | | | $ | 6.54 | | | $ | 5.96 | |
| |
| Income (loss) from investment operations: | | | | | | | | | | | | | | | | | | | | |
| Net investment income2 | | | 0.23 | | | | 0.25 | | | | 0.25 | | | | 0.26 | | | | 0.22 | |
| Net realized and unrealized gain (loss) | | | (0.40) | | | | 0.33 | | | | (0.44) | | | | 0.31 | | | | 0.74 | |
| | | | |
| Total from investment operations | | | (0.17) | | | | 0.58 | | | | (0.19) | | | | 0.57 | | | | 0.96 | |
| |
| Dividends and/or distributions to shareholders: | | | | | | | | | | | | | | | | | | | | |
| Dividends from net investment income | | | (0.24) | | | | (0.33) | | | | (0.26) | | | | (0.26) | | | | (0.33) | |
| Distributions from net realized gain | | | (0.04) | | | | 0.00 | | | | (0.06) | | | | (0.05) | | | | (0.05) | |
| | | | |
| Total dividends and/or distributions to shareholders | | | (0.28) | | | | (0.33) | | | | (0.32) | | | | (0.31) | | | | (0.38) | |
| |
| Net asset value, end of period | | $ | 6.09 | | | $ | 6.54 | | | $ | 6.29 | | | $ | 6.80 | | | $ | 6.54 | |
| | | | |
| |
| Total Return, at Net Asset Value3 | | | (2.77)% | | | | 9.58% | | | | (2.88)% | | | | 9.04% | | | | 16.83% | |
| |
| Ratios/Supplemental Data | | | | | | | | | | | | | | | | | | | | |
| Net assets, end of period (in thousands) | | $ | 4,794,923 | | | $ | 5,886,327 | | | $ | 6,382,276 | | | $ | 7,406,875 | | | $ | 7,268,308 | |
| |
| Average net assets (in thousands) | | $ | 5,586,929 | | | $ | 6,013,740 | | | $ | 7,004,799 | | | $ | 7,345,330 | | | $ | 6,632,191 | |
| |
| Ratios to average net assets:4 | | | | | | | | | | | | | | | | | | | | |
| Net investment income | | | 3.61% | | | | 3.89% | | | | 3.80% | | | | 4.04% | | | | 3.77% | |
| Total expenses5 | | | 1.01% | | | | 1.02% | | | | 0.98% | | | | 0.98% | | | | 0.99% | |
| Expenses after payments, waivers and/or reimbursements and reduction to custodian expenses | | | 1.01% | | | | 1.02% | | | | 0.98% | | | | 0.98% | | | | 0.98% | |
| |
| Portfolio turnover rate | | | 105% | | | | 111% | | | | 80% | | | | 146% | | | | 112% | |
1. September 28, 2012 represents the last business day of the Fund’s reporting period. See Note 1 of the accompanying Notes.
2. Per share amounts calculated based on the average shares outstanding during the period.
3. Assumes an initial investment on the business day before the first day of the fiscal period, with all dividends and distributions reinvested in additional shares on the reinvestment date, and redemption at the net asset value calculated on the last business day of the fiscal period. Sales charges are not reflected in the total returns. Total returns are not annualized for periods less than one full year. Returns do not reflect the deduction of taxes that a shareholder would pay on fund distributions or the redemption of fund shares.
4. Annualized for periods less than one full year.
5. Total expenses including indirect expenses from affiliated fund were as follows:
| | | | | | | | |
| | Year Ended September 30, 2013 | | | 1.01 | % | | |
| | Year Ended September 28, 2012 | | | 1.02 | % | | |
| | Year Ended September 30, 2011 | | | 0.98 | % | | |
| | Year Ended September 30, 2010 | | | 0.98 | % | | |
| | Year Ended September 30, 2009 | | | 1.00 | % | | |
See accompanying Notes to Financial Statements.
55 OPPENHEIMER INTERNATIONAL BOND FUND
| | | | |
| | |
| | FINANCIAL HIGHLIGHTS Continued | | |
| | | | | | | | | | | | | | | | | | | | |
| Class B | | Year Ended
September 30,
2013 | | | Year Ended
September 28,
20121 | | | Year Ended
September 30,
2011 | | | Year Ended
September 30,
2010 | | | Year Ended
September 30,
2009 | |
| |
| Per Share Operating Data | | | | | | | | | | | | | | | | | | | | |
| Net asset value, beginning of period | | $ | 6.51 | | | $ | 6.27 | | | $ | 6.78 | | | $ | 6.52 | | | $ | 5.94 | |
| |
| Income (loss) from investment operations: | | | | | | | | | | | | | | | | | | | | |
| Net investment income2 | | | 0.18 | | | | 0.19 | | | | 0.19 | | | | 0.20 | | | | 0.17 | |
| Net realized and unrealized gain (loss) | | | (0.40) | | | | 0.33 | | | | (0.44) | | | | 0.31 | | | | 0.74 | |
| | | | |
| Total from investment operations | | | (0.22) | | | | 0.52 | | | | (0.25) | | | | 0.51 | | | | 0.91 | |
| |
| Dividends and/or distributions to shareholders: | | | | | | | | | | | | | | | | | | | | |
| Dividends from net investment income | | | (0.18) | | | | (0.28) | | | | (0.20) | | | | (0.20) | | | | (0.28) | |
| Distributions from net realized gain | | | (0.04) | | | | 0.00 | | | | (0.06) | | | | (0.05) | | | | (0.05) | |
| | | | |
| Total dividends and/or distributions to shareholders | | | (0.22) | | | | (0.28) | | | | (0.26) | | | | (0.25) | | | | (0.33) | |
| |
| Net asset value, end of period | | $ | 6.07 | | | $ | 6.51 | | | $ | 6.27 | | | $ | 6.78 | | | $ | 6.52 | |
| | | | |
| |
| Total Return, at Net Asset Value3 | | | (3 .46)% | | | | 8.50% | | | | (3.74)% | | | | 8.13% | | | | 15.87% | |
| |
| Ratios/Supplemental Data | | | | | | | | | | | | | | | | | | | | |
| Net assets, end of period (in thousands) | | $ | 128,905 | | | $ | 193,955 | | | $ | 226,660 | | | $ | 286,029 | | | $ | 284,424 | |
| |
| Average net assets (in thousands) | | $ | 165,674 | | | $ | 208,830 | | | $ | 257,491 | | | $ | 279,115 | | | $ | 269,970 | |
| |
| Ratios to average net assets:4 | | | | | | | | | | | | | | | | | | | | |
| Net investment income | | | 2.77% | | | | 3.02% | | | | 2.93% | | | | 3.18% | | | | 2.89% | |
| Total expenses5 | | | 1.85% | | | | 1.89% | | | | 1.84% | | | | 1.85% | | | | 1.86% | |
| Expenses after payments, waivers and/or reimbursements and reduction to custodian expenses | | | 1.85% | | | | 1.89% | | | | 1.84% | | | | 1.85% | | | | 1.85% | |
| |
| Portfolio turnover rate | | | 105% | | | | 111% | | | | 80% | | | | 146% | | | | 112% | |
1. September 28, 2012 represents the last business day of the Fund’s reporting period. See Note 1 of the accompanying Notes.
2. Per share amounts calculated based on the average shares outstanding during the period.
3. Assumes an initial investment on the business day before the first day of the fiscal period, with all dividends and distributions reinvested in additional shares on the reinvestment date, and redemption at the net asset value calculated on the last business day of the fiscal period. Sales charges are not reflected in the total returns. Total returns are not annualized for periods less than one full year. Returns do not reflect the deduction of taxes that a shareholder would pay on fund distributions or the redemption of fund shares.
4. Annualized for periods less than one full year.
5. Total expenses including indirect expenses from affiliated fund were as follows:
| | | | | | | | |
| | Year Ended September 30, 2013 | | | 1.85 | % | | |
| | Year Ended September 28, 2012 | | | 1.89 | % | | |
| | Year Ended September 30, 2011 | | | 1.84 | % | | |
| | Year Ended September 30, 2010 | | | 1.85 | % | | |
| | Year Ended September 30, 2009 | | | 1.87 | % | | |
See accompanying Notes to Financial Statements.
56 OPPENHEIMER INTERNATIONAL BOND FUND
| | | | | | | | | | | | | | | | | | | | |
| Class C | | Year Ended
September 30,
2013 | | | Year Ended
September 28,
20121 | | | Year Ended
September 30,
2011 | | | Year Ended
September 30,
2010 | | | Year Ended
September 30,
2009 | |
| |
| Per Share Operating Data | | | | | | | | | | | | | | | | | | | | |
| Net asset value, beginning of period | | $ | 6.51 | | | $ | 6.27 | | | $ | 6.78 �� | | | $ | 6.52 | | | $ | 5.94 | |
| |
| Income (loss) from investment operations: | | | | | | | | | | | | | | | | | | | | |
| Net investment income2 | | | 0.19 | | | | 0.20 | | | | 0.21 | | | | 0.21 | | | | 0.18 | |
| Net realized and unrealized gain (loss) | | | (0.40) | | | | 0.33 | | | | (0.45) | | | | 0.31 | | | | 0.74 | |
| | | | |
| Total from investment operations | | | (0.21) | | | | 0.53 | | | | (0.24) | | | | 0.52 | | | | 0.92 | |
| |
| Dividends and/or distributions to shareholders: | | | | | | | | | | | | | | | | | | | | |
| Dividends from net investment income | | | (0.19) | | | | (0.29) | | | | (0.21) | | | | (0.21) | | | | (0.29) | |
| Distributions from net realized gain | | | (0.04) | | | | 0.00 | | | | (0.06) | | | | (0.05) | | | | (0.05) | |
| | | | |
| Total dividends and/or distributions to shareholders | | | (0.23) | | | | (0.29) | | | | (0.27) | | | | (0.26) | | | | (0.34) | |
| |
| Net asset value, end of period | | $ | 6.07 | | | $ | 6.51 | | | $ | 6.27 | | | $ | 6.78 | | | $ | 6.52 | |
| | | | |
| |
| Total Return, at Net Asset Value3 | | | (3.30)% | | | | 8 .69% | | | | (3.58)% | | | | 8.29% | | | | 16.04% | |
| |
| Ratios/Supplemental Data | | | | | | | | | | | | | | | | | | | | |
| Net assets, end of period (in thousands) | | $ | 1,238,931 | | | $ | 1,614,123 | | | $ | 1,724,712 | | | $ | 2,029,424 | | | $ | 1,812,805 | |
| |
| Average net assets (in thousands) | | $ | 1,509,389 | | | $ | 1,651,022 | | | $ | 1,891,414 | | | $ | 1,965,153 | | | $ | 1,594,278 | |
| |
| Ratios to average net assets:4 | | | | | | | | | | | | | | | | | | | | |
| Net investment income | | | 2.93% | | | | 3.21% | | | | 3.10% | | | | 3.34% | | | | 3.05% | |
| Total expenses5 | | | 1.69% | | | | 1.71% | | | | 1.68% | | | | 1.69% | | | | 1.71% | |
| Expenses after payments, waivers and/or reimbursements and reduction to custodian expenses | | | 1.69% | | | | 1.71% | | | | 1.68% | | | | 1.69% | | | | 1.70% | |
| |
| Portfolio turnover rate | | | 105% | | | | 111% | | | | 80% | | | | 146% | | | | 112% | |
1. September 28, 2012 represents the last business day of the Fund’s reporting period. See Note 1 of the accompanying Notes.
2. Per share amounts calculated based on the average shares outstanding during the period.
3. Assumes an initial investment on the business day before the first day of the fiscal period, with all dividends and distributions reinvested in additional shares on the reinvestment date, and redemption at the net asset value calculated on the last business day of the fiscal period. Sales charges are not reflected in the total returns. Total returns are not annualized for periods less than one full year. Returns do not reflect the deduction of taxes that a shareholder would pay on fund distributions or the redemption of fund shares.
4. Annualized for periods less than one full year.
5. Total expenses including indirect expenses from affiliated fund were as follows:
| | | | | | | | |
| | Year Ended September 30, 2013 | | | 1.69 | % | | |
| | Year Ended September 28, 2012 | | | 1.71 | % | | |
| | Year Ended September 30, 2011 | | | 1.68 | % | | |
| | Year Ended September 30, 2010 | | | 1.69 | % | | |
| | Year Ended September 30, 2009 | | | 1.72 | % | | |
See accompanying Notes to Financial Statements.
57 OPPENHEIMER INTERNATIONAL BOND FUND
| | | | |
| | |
| | FINANCIAL HIGHLIGHTS Continued | | |
| | | | | | | | | | |
| Class I | | Year Ended
September 30,
2013 | | | Period Ended
September 28,
20121,2 | | | |
| | | |
Per Share Operating Data | | | | | | | | | | |
| Net asset value, beginning of period | | $ | 6.53 | | | $ | 6.36 | | | |
| | | |
| Income (loss) from investment operations: | | | | | | | | | | |
| Net investment income3 | | | 0.24 | | | | 0.18 | | | |
| Net realized and unrealized gain (loss) | | | (0.38) | | | | 0.18 | | | |
| | | | | | |
| Total from investment operations | | | (0.14) | | | | 0.36 | | | |
| | | |
| Dividends and/or distributions to shareholders: | | | | | | | | | | |
| Dividends from net investment income | | | (0.27) | | | | (0.19) | | | |
| Distributions from net realized gain | | | (0.04) | | | | 0.00 | | | |
| | | | | | |
| Total dividends and/or distributions to shareholders | | | (0.31) | | | | (0.19) | | | |
| | | |
| Net asset value, end of period | | $ | 6.08 | | | $ | 6.53 | | | |
| | | | | | |
| | | |
Total Return, at Net Asset Value4 | | | (2.31)% | | | | 5.70% | | | |
| | | |
Ratios/Supplemental Data | | | | | | | | | | |
| Net assets, end of period (in thousands) | | $ | 542,637 | | | $ | 855 | | | |
| | | |
| Average net assets (in thousands) | | $ | 206,805 | | | $ | 380 | | | |
| | | |
| Ratios to average net assets:5 | | | | | | | | | | |
| Net investment income | | | 3.95% | | | | 4.20% | | | |
| Total expenses6 | | | 0.57% | | | | 0.57% | | | |
| Expenses after payments, waivers and/or reimbursements and reduction to custodian expenses | | | 0.57% | | | | 0.57% | | | |
| | | |
| Portfolio turnover rate | | | 105% | | | | 111% | | | |
1. September 28, 2012 represents the last business day of the Fund’s reporting period. See Note 1 of the accompanying Notes
2. For the period from January 27, 2012 (inception of offering) to September 28, 2012.
3. Per share amounts calculated based on the average shares outstanding during the period.
4. Assumes an initial investment on the business day before the first day of the fiscal period, with all dividends and distributions reinvested in additional shares on the reinvestment date, and redemption at the net asset value calculated on the last business day of the fiscal period. Sales charges are not reflected in the total returns. Total returns are not annualized for periods less than one full year. Returns do not reflect the deduction of taxes that a shareholder would pay on fund distributions or the redemption of fund shares.
5. Annualized for periods less than one full year.
6. Total expenses including indirect expenses from affiliated fund were as follows:
| | | | | | | | |
| | Year Ended September 30, 2013 | | | 0.57 | % | | |
| | Period Ended September 28, 2012 | | | 0.57 | % | | |
See accompanying Notes to Financial Statements.
58 OPPENHEIMER INTERNATIONAL BOND FUND
| | | | | | | | | | | | | | | | | | | | |
| Class N | | Year Ended
September 30,
2013 | | | Year Ended
September 28,
20121 | | | Year Ended
September 30,
2011 | | | Year Ended
September 30,
2010 | | | Year Ended
September 30,
2009 | |
| |
| Per Share Operating Data | | | | | | | | | | | | | | | | | | | | |
| Net asset value, beginning of period | | $ | 6.52 | | | $ | 6.28 | | | $ | 6.79 | | | $ | 6.52 | | | $ | 5.95 | |
| |
| Income (loss) from investment operations: | | | | | | | | | | | | | | | | | | | | |
| Net investment income2 | | | 0.20 | | | | 0.22 | | | | 0.22 | | | | 0.23 | | | | 0.20 | |
| Net realized and unrealized gain (loss) | | | (0.40) | | | | 0.33 | | | | (0.44) | | | | 0.32 | | | | 0.72 | |
| | | | |
| Total from investment operations | | | (0.20) | | | | 0.55 | | | | (0.22) | | | | 0.55 | | | | 0.92 | |
| |
| Dividends and/or distributions to shareholders: | | | | | | | | | | | | | | | | | | | | |
| Dividends from net investment income | | | (0.21) | | | | (0.31) | | | | (0.23) | | | | (0.23) | | | | (0.30) | |
| Distributions from net realized gain | | | (0.04) | | | | 0.00 | | | | (0.06) | | | | (0.05) | | | | (0.05) | |
| | | | |
| Total dividends and/or distributions to shareholders | | | (0.25) | | | | (0.31) | | | | (0.29) | | | | (0.28) | | | | (0.35) | |
| |
| Net asset value, end of period | | $ | 6.07 | | | $ | 6.52 | | | $ | 6.28 | | | $ | 6.79 | | | $ | 6.52 | |
| | | | |
| |
Total Return, at Net Asset Value3 | | | (3.16)% | | | | 9.01% | | | | (3.28)% | | | | 8.80% | | | | 16.23% | |
| |
Ratios/Supplemental Data | | | | | | | | | | | | | | | | | | | | |
| Net assets, end of period (in thousands) | | $ | 252,758 | | | $ | 314,773 | | | $ | 322,070 | | | $ | 310,338 | | | $ | 258,219 | |
| |
| Average net assets (in thousands) | | $ | 290,208 | | | $ | 314,673 | | | $ | 325,834 | | | $ | 279,336 | | | $ | 233,767 | |
| |
| Ratios to average net assets:4 | | | | | | | | | | | | | | | | | | | | |
| Net investment income | | | 3.19% | | | | 3.50% | | | | 3.39% | | | | 3.65% | | | | 3.37% | |
| Total expenses5 | | | 1.53% | | | | 1.54% | | | | 1.44% | | | | 1.65% | | | | 1.68% | |
| Expenses after payments, waivers and/or reimbursements and reduction to custodian expenses | | | 1.43% | | | | 1.41% | | | | 1.38% | | | | 1.38% | | | | 1.38% | |
| |
| Portfolio turnover rate | | | 105% | | | | 111% | | | | 80% | | | | 146% | | | | 112% | |
1. September 28, 2012 represents the last business day of the Fund’s reporting period. See Note 1 of the accompanying Notes.
2. Per share amounts calculated based on the average shares outstanding during the period.
3. Assumes an initial investment on the business day before the first day of the fiscal period, with all dividends and distributions reinvested in additional shares on the reinvestment date, and redemption at the net asset value calculated on the last business day of the fiscal period. Sales charges are not reflected in the total returns. Total returns are not annualized for periods less than one full year. Returns do not reflect the deduction of taxes that a shareholder would pay on fund distributions or the redemption of fund shares.
4. Annualized for periods less than one full year.
5. Total expenses including indirect expenses from affiliated fund were as follows:
| | | | | | | | |
| | Year Ended September 30, 2013 | | | 1.53 | % | | |
| | Year Ended September 28, 2012 | | | 1.54 | % | | |
| | Year Ended September 30, 2011 | | | 1.44 | % | | |
| | Year Ended September 30, 2010 | | | 1.65 | % | | |
| | Year Ended September 30, 2009 | | | 1.69 | % | | |
See accompanying Notes to Financial Statements.
59 OPPENHEIMER INTERNATIONAL BOND FUND
| | | | |
| | |
| | FINANCIAL HIGHLIGHTS Continued | | |
| | | | | | | | | | | | | | | | | | | | |
| Class Y | | Year Ended
September 30, 2013 | | | Year Ended
September 28,
20121 | | | Year Ended
September 30,
2011 | | | Year Ended
September 30,
2010 | | | Year Ended
September 30,
2009 | |
| |
| Per Share Operating Data | | | | | | | | | | | | | | | | | | | | |
| Net asset value, beginning of period | | $ | 6.53 | | | $ | 6.29 | | | $ | 6.80 | | | $ | 6.54 | | | $ | 5.96 | |
| |
| Income (loss) from investment operations: | | | | | | | | | | | | | | | | | | | | |
| Net investment income2 | | | 0.25 | | | | 0.26 | | | | 0.27 | | | | 0.28 | | | | 0.25 | |
| Net realized and unrealized gain (loss) | | | (0.40) | | | | 0.33 | | | | (0.44) | | | | 0.31 | | | | 0.73 | |
| | | | |
| Total from investment operations | | | (0.15) | | | | 0.59 | | | | (0.17) | | | | 0.59 | | | | 0.98 | |
| |
| Dividends and/or distributions to shareholders: | | | | | | | | | | | | | | | | | | | | |
| Dividends from net investment income | | | (0.25) | | | | (0.35) | | | | (0.28) | | | | (0.28) | | | | (0.35) | |
| Distributions from net realized gain | | | (0.04) | | | | 0.00 | | | | (0.06) | | | | (0.05) | | | | (0.05) | |
| | | | |
| Total dividends and/or distributions to shareholders | | | (0.29) | | | | (0.35) | | | | (0.34) | | | | (0.33) | | | | (0.40) | |
| |
| Net asset value, end of period | | $ | 6.09 | | | $ | 6.53 | | | $ | 6.29 | | | $ | 6.80 | | | $ | 6.54 | |
| | | | |
| |
| Total Return, at Net Asset Value3 | | | (2.36)% | | | | 9.71% | | | | (2.64)% | | | | 9.38% | | | | 17.26% | |
| |
| Ratios/Supplemental Data | | | | | | | | | | | | | | | | | | | | |
| Net assets, end of period (in thousands) | | $ | 3,946,008 | | | $ | 4,736,285 | | | $ | 4,084,001 | | | $ | 3,388,175 | | | $ | 1,890,729 | |
| |
| Average net assets (in thousands) | | $ | 4,710,455 | | | $ | 4,446,720 | | | $ | 3,861,749 | | | $ | 2,732,256 | | | $ | 1,317,017 | |
| |
| Ratios to average net assets:4 | | | | | | | | | | | | | | | | | | | | |
| Net investment income | | | 3.88% | | | | 4.16% | | | | 4.04% | | | | 4.38% | | | | 4.16% | |
| Total expenses5 | | | 0.74% | | | | 0.75% | | | | 0.74% | | | | 0.67% | | | | 0.62% | |
| Expenses after payments, waivers and/or reimbursements and reduction to custodian expenses | | | 0.74% | | | | 0.75% | | | | 0.73% | | | | 0.67% | | | | 0.61% | |
| |
| Portfolio turnover rate | | | 105% | | | | 111% | | | | 80% | | | | 146% | | | | 112% | |
1. September 28, 2012 represents the last business day of the Fund’s reporting period. See Note 1 of the accompanying Notes.
2. Per share amounts calculated based on the average shares outstanding during the period.
3. Assumes an initial investment on the business day before the first day of the fiscal period, with all dividends and distributions reinvested in additional shares on the reinvestment date, and redemption at the net asset value calculated on the last business day of the fiscal period. Sales charges are not reflected in the total returns. Total returns are not annualized for periods less than one full year. Returns do not reflect the deduction of taxes that a shareholder would pay on fund distributions or the redemption of fund shares.
4. Annualized for periods less than one full year.
5. Total expenses including indirect expenses from affiliated fund were as follows:
| | | | | | | | |
| | Year Ended September 30, 2013 | | | 0.74 | % | | |
| | Year Ended September 28, 2012 | | | 0.75 | % | | |
| | Year Ended September 30, 2011 | | | 0.74 | % | | |
| | Year Ended September 30, 2010 | | | 0.67 | % | | |
| | Year Ended September 30, 2009 | | | 0.63 | % | | |
See accompanying Notes to Financial Statements.
60 OPPENHEIMER INTERNATIONAL BOND FUND
| | | | |
| | |
| | NOTESTO FINANCIAL STATEMENTS September 30, 2013 | | |
1. Significant Accounting Policies
Oppenheimer International Bond Fund (the “Fund”) is a non-diversified open-end management investment company registered under the Investment Company Act of 1940, as amended. The Fund’s investment objective is to seek total return. The Fund’s investment adviser was OppenheimerFunds, Inc. (“OFI” or the “Sub-Adviser”) through December 31, 2012. Effective January 1, 2013, the Fund’s investment adviser is OFI Global Asset Management, Inc. (“OFI Global” or the “Manager”), a wholly-owned subsidiary of OFI. The Manager has entered into a sub-advisory agreement with OFI, as of the same effective date.
The Fund offers Class A, Class C, Class I, Class N and Class Y shares, and previously offered Class B shares for new purchase through June 29, 2012. Subsequent to that date, no new purchases of Class B shares are permitted, however reinvestment of dividend and/or capital gain distributions and exchanges of Class B shares into and from other Oppenheimer funds will be allowed. Class A shares are sold at their offering price, which is normally net asset value plus a front-end sales charge. Class C and Class N shares are sold, and Class B shares were sold, without a front-end sales charge but may be subject to a contingent deferred sales charge (“CDSC”). Class N shares are sold only through retirement plans. Retirement plans that offer Class N shares may impose charges on those accounts. Class I and Class Y shares are sold to certain institutional investors or intermediaries without either a front-end sales charge or a CDSC, however, the intermediaries may impose charges on their accountholders who beneficially own Class I and Class Y shares. All classes of shares have identical rights and voting privileges with respect to the Fund in general and exclusive voting rights on matters that affect that class alone. Earnings, net assets and net asset value per share may differ due to each class having its own expenses, such as transfer and shareholder servicing agent fees and shareholder communications, directly attributable to that class. Class A, B, C and N shares have separate distribution and/or service plans under which they pay fees. Class I and Class Y shares do not pay such fees. Class B shares will automatically convert to Class A shares 72 months after the date of purchase.
The following is a summary of significant accounting policies consistently followed by the Fund.
Previous Annual Period. The last day of the Fund’s fiscal year was the last day the New York Stock Exchange was open for trading. The Fund’s financial statements have been presented through that date to maintain consistency with the Fund’s net asset value calculations used for shareholder transactions.
Structured Securities. The Fund invests in structured securities whose market values, interest rates and/or redemption prices are linked to the performance of underlying foreign currencies, interest rate spreads, stock market indices, prices of individual securities, commodities or other financial instruments or the occurrence of other specific events. The structured securities are often leveraged, increasing the volatility of each note’s market value relative to the change in the underlying linked financial element or event. Fluctuations in value of these securities are recorded as unrealized gains and losses in the accompanying Statement of Operations. The Fund records a realized gain or loss when a structured security is sold or matures.
61 OPPENHEIMER INTERNATIONAL BOND FUND
| | | | |
| | |
| | NOTESTO FINANCIAL STATEMENTS Continued | | |
1. Significant Accounting Policies (Continued)
Securities on a When-Issued or Delayed Delivery Basis. The Fund may purchase securities on a “when-issued” basis, and may purchase or sell securities on a “delayed delivery” basis. “When-issued” or “delayed delivery” refers to securities whose terms and indenture are available and for which a market exists, but which are not available for immediate delivery. Delivery and payment for securities that have been purchased by the Fund on a when-issued basis normally takes place within six months and possibly as long as two years or more after the trade date. During this period, such securities do not earn interest, are subject to market fluctuation and may increase or decrease in value prior to their delivery. The purchase of securities on a when-issued basis may increase the volatility of the Fund’s net asset value to the extent the Fund executes such transactions while remaining substantially fully invested. When the Fund engages in when-issued or delayed delivery transactions, it relies on the buyer or seller, as the case may be, to complete the transaction. Their failure to do so may cause the Fund to lose the opportunity to obtain or dispose of the security at a price and yield it considers advantageous. The Fund may also sell securities that it purchased on a when-issued basis or forward commitment prior to settlement of the original purchase.
As of September 30, 2013, the Fund had purchased securities issued on a when-issued or delayed delivery basis as follows:
| | | | |
| | | When-Issued or
Delayed Delivery
Basis Transactions | |
| Purchased securities | | | $44,682,954 | |
Credit Risk. The Fund invests in high-yield, non-investment-grade bonds, which may be subject to a greater degree of credit risk. Credit risk relates to the ability of the issuer to meet interest or principal payments or both as they become due. The Fund may acquire securities that have missed an interest payment, and is not obligated to dispose of securities whose issuers or underlying obligors subsequently miss an interest payment. Information concerning securities not accruing interest as of September 30, 2013 is as follows:
| | | | |
| Cost | | $ | 38,809,060 | |
| Market Value | | $ | 9,615,608 | |
| Market Value as a % of Net Assets | | | 0.09 | % |
Investment in Oppenheimer Institutional Money Market Fund. The Fund is permitted to invest daily available cash balances in an affiliated money market fund. The Fund may invest the available cash in Class E shares of Oppenheimer Institutional Money Market Fund (“IMMF”) to seek current income while preserving liquidity. IMMF is a registered open-end management investment company, regulated as a money market fund under the Investment Company Act of 1940, as amended. The Manager is the investment adviser of IMMF, and the Sub-Adviser provides investment and related advisory services to IMMF. When applicable, the Fund’s investment in IMMF is included in the Statement of Investments. Shares of IMMF are
62 OPPENHEIMER INTERNATIONAL BOND FUND
1. Significant Accounting Policies (Continued)
valued at their net asset value per share. As a shareholder, the Fund is subject to its proportional share of IMMF’s Class E expenses, including its management fee. The Manager will waive fees and/or reimburse Fund expenses in an amount equal to the indirect management fees incurred through the Fund’s investment in IMMF.
Foreign Currency Translation. The Fund’s accounting records are maintained in U.S. dollars. The values of securities denominated in foreign currencies and amounts related to the purchase and sale of foreign securities and foreign investment income are translated into U.S. dollars as of the close of the New York Stock Exchange (the “Exchange”), normally 4:00 P.M. Eastern time, on each day the Exchange is open for trading. Foreign exchange rates may be valued primarily using a reliable bank, dealer or service authorized by the Board of Trustees.
Reported net realized gains and losses from foreign currency transactions arise from sales of portfolio securities, sales and maturities of short-term securities, sales of foreign currencies, exchange rate fluctuations between the trade and settlement dates on securities transactions, and the difference between the amounts of dividends, interest, and foreign withholding taxes recorded on the Fund’s books and the U.S. dollar equivalent of the amounts actually received or paid. Net unrealized appreciation and depreciation on the translation of assets and liabilities denominated in foreign currencies arise from changes in the values of assets and liabilities, including investments in securities at fiscal period end, resulting from changes in exchange rates.
The effect of changes in foreign currency exchange rates on investments is separately identified from the fluctuations arising from changes in market values of securities held and reported with all other foreign currency gains and losses in the Fund’s Statement of Operations.
Allocation of Income, Expenses, Gains and Losses. Income, expenses (other than those attributable to a specific class), gains and losses are allocated on a daily basis to each class of shares based upon the relative proportion of net assets represented by such class. Operating expenses directly attributable to a specific class are charged against the operations of that class.
Federal Taxes. The Fund intends to comply with provisions of the Internal Revenue Code applicable to regulated investment companies and to distribute substantially all of its investment company taxable income, including any net realized gain on investments not offset by capital loss carryforwards, if any, to shareholders. Therefore, no federal income or excise tax provision is required. The Fund files income tax returns in U.S. federal and applicable state jurisdictions. The statute of limitations on the Fund’s tax return filings generally remain open for the three preceding fiscal reporting period ends.
The tax components of capital shown in the following table represent distribution requirements the Fund must satisfy under the income tax regulations, losses the Fund may be able to offset against income and gains realized in future years and unrealized appreciation or depreciation of securities and other investments for federal income tax purposes.
63 OPPENHEIMER INTERNATIONAL BOND FUND
| | | | |
| | |
| | NOTESTO FINANCIAL STATEMENTS Continued | | |
1. Significant Accounting Policies (Continued)
| | | | | | | | | | | | |
Undistributed Net Investment Income | | Undistributed
Long-Term
Gain | | | Accumulated
Loss
Carryforward1,2,3 | | | Net Unrealized
Depreciation
Based on cost of
Securities and
Other Investments
for Federal Income
Tax Purposes | |
| $— | | | $2,722,543 | | | | $2,935 | | | | $452,325,277 | |
1. The Fund had $2,935 of straddle losses which were deferred.
2. During the fiscal year ended September 30, 2013, the Fund did not utilize any capital loss carryforward.
3. During the fiscal year ended September 28, 2012, the Fund did not utilize any capital loss carryforward.
Net investment income (loss) and net realized gain (loss) may differ for financial statement and tax purposes. The character of dividends and distributions made during the fiscal year from net investment income or net realized gains may differ from their ultimate characterization for federal income tax purposes. Also, due to timing of dividends and distributions, the fiscal year in which amounts are distributed may differ from the fiscal year in which the income or net realized gain was recorded by the Fund.
Accordingly, the following amounts have been reclassified for September 30, 2013. Net assets of the Fund were unaffected by the reclassifications.
| | | | | | | | |
Increase to Paid-in Capital | | Increase to Accumulated
Net Investment
Loss | | | Reduction to Accumulated Net
Realized Loss on Investments4 | |
| $743,213 | | | $59,249,433 | | | | $58,506,220 | |
4. $667,678, all of which was long-term capital gain, was distributed in connection with Fund share redemptions.
The tax character of distributions paid during the years ended September 30, 2013 and September 30, 2012 was as follows:
| | | | | | | | |
| | | Year Ended September 30, 2013 | | | Year Ended September 30, 2012 | |
| Distributions paid from: | | | | | | | | |
| Ordinary income | | $ | 268,505,254 | | | $ | 561,142,674 | |
| Long-term capital gain | | | 272,775,418 | | | | 102,243,555 | |
| | | | |
| Total | | $ | 541,280,672 | | | $ | 663,386,229 | |
| | | | |
The aggregate cost of securities and other investments and the composition of unrealized appreciation and depreciation of securities and other investments for federal income tax purposes as of September 30, 2013 are noted in the following table. The primary difference between book and tax appreciation or depreciation of securities and other investments, if applicable, is attributable to the tax deferral of losses or tax realization of financial statement unrealized gain or loss.
64 OPPENHEIMER INTERNATIONAL BOND FUND
1. Significant Accounting Policies (Continued)
| | | | |
| Federal tax cost of securities | | $ | 11,410,945,251 | |
| Federal tax cost of other investments | | | 1,290,607,610 | |
| | | | |
| Total federal tax cost | | $ | 12,701,552,861 | |
| | | | |
| Gross unrealized appreciation | | $ | 288,335,723 | |
| Gross unrealized depreciation | | | (740,661,000) | |
| | | | |
| Net unrealized depreciation | | $ | (452,325,277) | |
| | | | |
Trustees’ Compensation. The Board of Trustees has adopted a compensation deferral plan for independent trustees that enables trustees to elect to defer receipt of all or a portion of the annual compensation they are entitled to receive from the Fund. For purposes of determining the amount owed to the Trustee under the plan, deferred amounts are treated as though equal dollar amounts had been invested in shares of the Fund or in other Oppenheimer funds selected by the Trustee. The Fund purchases shares of the funds selected for deferral by the Trustee in amounts equal to his or her deemed investment, resulting in a Fund asset equal to the deferred compensation liability. Such assets are included as a component of “Other” within the asset section of the Statement of Assets and Liabilities. Deferral of trustees’ fees under the plan will not affect the net assets of the Fund, and will not materially affect the Fund’s assets, liabilities or net investment income per share. Amounts will be deferred until distributed in accordance with the compensation deferral plan.
Dividends and Distributions to Shareholders. Dividends and distributions to shareholders, which are determined in accordance with income tax regulations and may differ from U.S. generally accepted accounting principles, are recorded on the ex-dividend date. Income distributions, if any, are declared daily and paid monthly. Capital gain distributions, if any, are declared and paid annually.
Investment Income. Dividend income is recorded on the ex-dividend date or upon ex-dividend notification in the case of certain foreign dividends where the ex-dividend date may have passed. Non-cash dividends included in dividend income, if any, are recorded at the fair market value of the securities received. Interest income is recognized on an accrual basis. Discount and premium, which are included in interest income on the Statement of Operations, are amortized or accreted daily.
Custodian Fees. “Custodian fees and expenses” in the Statement of Operations may include interest expense incurred by the Fund on any cash overdrafts of its custodian account during the period. Such cash overdrafts may result from the effects of failed trades in portfolio securities and from cash outflows resulting from unanticipated shareholder redemption activity. The Fund pays interest to its custodian on such cash overdrafts, to the extent they are not offset by positive cash balances maintained by the Fund, at a rate equal to the Federal Funds Rate plus 0.50%. The “Reduction to custodian expenses” line item, if applicable, represents earnings on cash balances maintained by the Fund during the period. Such interest expense and other custodian fees may be paid with these earnings.
65 OPPENHEIMER INTERNATIONAL BOND FUND
| | | | |
| | |
| | NOTESTO FINANCIAL STATEMENTS Continued | | |
1. Significant Accounting Policies (Continued)
Security Transactions. Security transactions are recorded on the trade date. Realized gains and losses on securities sold are determined on the basis of identified cost.
Indemnifications. The Fund’s organizational documents provide current and former trustees and officers with a limited indemnification against liabilities arising in connection with the performance of their duties to the Fund. In the normal course of business, the Fund may also enter into contracts that provide general indemnifications. The Fund’s maximum exposure under these arrangements is unknown as this would be dependent on future claims that may be made against the Fund. The risk of material loss from such claims is considered remote.
Other. The preparation of financial statements in conformity with accounting principles generally accepted in the United States of America requires management to make estimates and assumptions that affect the reported amounts of assets and liabilities and disclosure of contingent assets and liabilities at the date of the financial statements and the reported amounts of increases and decreases in net assets from operations during the reporting period. Actual results could differ from those estimates.
2. Securities Valuation
The Fund calculates the net asset value of its shares as of the close of the New York Stock Exchange (the “Exchange”), normally 4:00 P.M. Eastern time, on each day the Exchange is open for trading.
The Fund’s Board has adopted procedures for the valuation of the Fund’s securities and has delegated the day-to-day responsibility for valuation determinations under those procedures to the Manager. The Manager has established a Valuation Committee which is responsible for determining a “fair valuation” for any security for which market quotations are not “readily available.” The Valuation Committee’s fair valuation determinations are subject to review, approval and ratification by the Fund’s Board at its next regularly scheduled meeting covering the calendar quarter in which the fair valuation was determined.
Valuation Methods and Inputs
Securities are valued using unadjusted quoted market prices, when available, as supplied primarily by third party pricing services or dealers.
The following methodologies are used to determine the market value or the fair value of the types of securities described below:
Securities traded on a registered U.S. securities exchange (including exchange-traded derivatives other than futures and futures options) are valued based on the last sale price of the security reported on the principal exchange on which it is traded, prior to the time when the Fund’s assets are valued. In the absence of a sale, the security is valued at the last sale price on the prior trading day, if it is within the spread of the current day’s closing “bid” and “asked” prices, and if not, at the current day’s closing bid price. A security of a foreign issuer traded on a foreign exchange but not listed on a registered U.S. securities exchange is valued based on the last sale price on the principal exchange on which the security is traded, as identified by the third party pricing service used by the Manager, prior to the time when the
66 OPPENHEIMER INTERNATIONAL BOND FUND
2. Securities Valuation (Continued)
Fund’s assets are valued. If the last sale price is unavailable, the security is valued at the most recent official closing price on the principal exchange on which it is traded. If the last sales price or official closing price for a foreign security is not available, the security is valued at the mean between the bid and asked price per the exchange or, if not available from the exchange, obtained from two dealers. If bid and asked prices are not available from either the exchange or two dealers, the security is valued by using one of the following methodologies (listed in order of priority); (1) using a bid from the exchange, (2) the mean between the bid and asked price as provided by a single dealer, or (3) a bid from a single dealer.
Shares of a registered investment company that are not traded on an exchange are valued at that investment company’s net asset value per share.
Corporate and government debt securities (of U.S. or foreign issuers) and municipal debt securities, event-linked bonds, loans, mortgage-backed securities, collateralized mortgage obligations, and asset-backed securities are valued at the mean between the “bid” and “asked” prices utilizing evaluated prices obtained from third party pricing services or broker-dealers who may use matrix pricing methods to determine the evaluated prices.
Short-term money market type debt securities with a remaining maturity of sixty days or less are valued at cost adjusted by the amortization of discount or premium to maturity (amortized cost), which approximates market value. Short-term debt securities with a remaining maturity in excess of sixty days are valued at the mean between the “bid” and “asked” prices utilizing evaluated prices obtained from third party pricing services or broker-dealers.
Structured securities, swaps, swaptions, and other over-the-counter derivatives are valued utilizing evaluated prices obtained from third party pricing services or broker-dealers. Forward foreign currency exchange contracts are valued utilizing current and forward currency rates obtained from third party pricing services. When the settlement date of a contract is an interim date for which a quotation is not available, interpolated values are derived using the nearest dated forward currency rate.
Futures contracts and futures options traded on a commodities or futures exchange will be valued at the final settlement price or official closing price on the principal exchange as reported by such principal exchange at its trading session ending at, or most recently prior to, the time when the Fund’s assets are valued.
A description of the standard inputs that may generally be considered by the third party pricing vendors in determining their evaluated prices is provided below.
| | |
| Security Type | | Standard inputs generally considered by third-party pricing vendors |
| Corporate debt, government debt, municipal, mortgage-backed and asset-backed securities | | Reported trade data, broker-dealer price quotations, benchmark yields, issuer spreads on comparable securities, the credit quality, yield, maturity, and other appropriate factors. |
|
| Loans | | Information obtained from market participants regarding reported trade data and broker-dealer price quotations. |
67 OPPENHEIMER INTERNATIONAL BOND FUND
| | | | |
| | |
| | NOTESTO FINANCIAL STATEMENTS Continued | | |
2. Securities Valuation (Continued)
| | |
| Security Type | | Standard inputs generally considered by third-party pricing vendors |
| Event-linked bonds | | Information obtained from market participants regarding reported trade data and broker-dealer price quotations. |
|
| Structured securities | | Relevant market information such as the price of underlying financial instruments, stock market indices, foreign currencies, interest rate spreads, commodities, or the occurrence of other specific events. |
|
| Swaps | | Relevant market information, including underlying reference assets such as credit spreads, credit event probabilities, index values, individual security values, forward interest rates, variable interest rates, volatility measures, and forward currency rates. |
If a market value or price cannot be determined for a security using the methodologies described above, or if, in the “good faith” opinion of the Manager, the market value or price obtained does not constitute a “readily available market quotation,” or a significant event has occurred that would materially affect the value of the security the security is fair valued either (i) by a standardized fair valuation methodology applicable to the security type or the significant event as previously approved by the Valuation Committee and the Fund’s Board or (ii) as determined in good faith by the Manager’s Valuation Committee. The Valuation Committee considers all relevant facts that are reasonably available, through either public information or information available to the Manager, when determining the fair value of a security. Fair value determinations by the Manager are subject to review, approval and ratification by the Fund’s Board at its next regularly scheduled meeting covering the calendar quarter in which the fair valuation was determined. Those fair valuation standardized methodologies include, but are not limited to, valuing securities at the last sale price or initially at cost and subsequently adjusting the value based on: changes in company specific fundamentals, changes in an appropriate securities index, or changes in the value of similar securities which may be further adjusted for any discounts related to security-specific resale restrictions. When possible, such methodologies use observable market inputs such as unadjusted quoted prices of similar securities, observable interest rates, currency rates and yield curves. The methodologies used for valuing securities are not necessarily an indication of the risks associated with investing in those securities nor can it be assured that the Fund can obtain the fair value assigned to a security if it were to sell the security.
To assess the continuing appropriateness of security valuations, the Manager, or its third party service provider who is subject to oversight by the Manager, regularly compares prior day prices, prices on comparable securities, and sale prices to the current day prices and challenges those prices exceeding certain tolerance levels with the third party pricing service or broker source. For those securities valued by fair valuations, whether through a standardized fair valuation methodology or a fair valuation determination, the Valuation Committee reviews and affirms the reasonableness of the valuations based on such methodologies and fair valuation determinations on a regular basis after considering all relevant information that is reasonably available.
68 OPPENHEIMER INTERNATIONAL BOND FUND
2. Securities Valuation (Continued)
Classifications
Each investment asset or liability of the Fund is assigned a level at measurement date based on the significance and source of the inputs to its valuation. Various data inputs are used in determining the value of each of the Fund’s investments as of the reporting period end. These data inputs are categorized in the following hierarchy under applicable financial accounting standards:
1) Level 1-unadjusted quoted prices in active markets for identical assets or liabilities (including securities actively traded on a securities exchange)
2) Level 2-inputs other than unadjusted quoted prices that are observable for the asset or liability (such as unadjusted quoted prices for similar assets and market corroborated inputs such as interest rates, prepayment speeds, credit risks, etc.)
3) Level 3-significant unobservable inputs (including the Manager’s own judgments about assumptions that market participants would use in pricing the asset or liability).
The inputs used for valuing securities are not necessarily an indication of the risks associated with investing in those securities.
The table below categorizes amounts that are included in the Fund’s Statement of Assets and Liabilities as of September 30, 2013 based on valuation input level:
| | | | | | | | | | | | | | | | |
| | | Level 1—
Unadjusted
Quoted Prices | | | Level 2— Other Significant
Observable Inputs | | | Level 3—
Significant
Unobservable
Inputs | | | Value | |
Assets Table | | | | | | | | | | | | |
Investments, at Value: | | | | | | | | | | | | |
| Asset-Backed Securities | | $ | — | | | $ | 22,712,209 | | | $ | — | | | $ | 22,712,209 | |
| U.S. Government Obligations | | | — | | | | 788,818,213 | | | | — | | | | 788,818,213 | |
| Foreign Government Obligations | | | — | | | | 6,624,421,747 | | | | — | | | | 6,624,421,747 | |
| Corporate Loans | | | — | | | | — | | | | 7,411,950 | | | | 7,411,950 | |
| Corporate Bonds and Notes | | | — | | | | 2,906,684,571 | | | | — | | | | 2,906,684,571 | |
| Over-the-Counter Credit Default Swaptions Purchased | | | — | | | | 571,245 | | | | — | | | | 571,245 | |
| Over-the-Counter Interest Rate Swaptions Purchased | | | — | | | | 64,909,371 | | | | — | | | | 64,909,371 | |
| Structured Securities | | | — | | | | 100,188,041 | | | | 26,103,346 | | | | 126,291,387 | |
| Over-the-Counter Options Purchased | | | — | | | | 79,556,233 | | | | — | | | | 79,556,233 | |
| Investment Company | | | 454,741,805 | | | | — | | | | — | | | | 454,741,805 | |
| | | | |
| Total Investments, at Value | | | 454,741,805 | | | | 10,587,861,630 | | | | 33,515,296 | | | | 11,076,118,731 | |
Other Financial Instruments: | | | | | | | | | | | | |
| Swaps, at value | | | — | | | | 9,330,422 | | | | — | | | | 9,330,422 | |
| Variation margin receivable | | | 2,792,919 | | | | — | | | | — | | | | 2,792,919 | |
| Foreign currency exchange contracts | | | — | | | | 175,667,582 | | | | — | | | | 175,667,582 | |
| | | | |
Total Assets | | $ | 457,534,724 | | | $ | 10,772,859,634 | | | $ | 33,515,296 | | | $ | 11,263,909,654 | |
| | | | |
69 OPPENHEIMER INTERNATIONAL BOND FUND
| | | | |
| | |
| | NOTESTO FINANCIAL STATEMENTS Continued | | |
2. Securities Valuation (Continued)
| | | | | | | | | | | | | | | | |
Liabilities Table | | | | | | | | | | | | | | | | |
Other Financial Instruments: | | | | | | | | | | | | | | | | |
| Swaps, at value | | $ | — | | | $ | (36,342,817 | ) | | $ | — | | | $ | (36,342,817) | |
| Options written, at value | | | — | | | | (76,963,208 | ) | | | — | | | | (76,963,208) | |
| Variation margin payable | | | (22,541,414) | | | | — | | | | — | | | | (22,541,414) | |
| Foreign currency exchange contracts | | | — | | | | (148,001,812 | ) | | | — | | | | (148,001,812) | |
| Swaptions written, at value | | | — | | | | (155,424,130 | ) | | | — | | | | (155,424,130) | |
| | | | |
Total Liabilities | | $ | (22,541,414) | | | $ | (416,731,967 | ) | | $ | — | | | $ | (439,273,381) | |
| | | | |
Currency contracts and forwards, if any, are reported at their unrealized appreciation/ depreciation at measurement date, which represents the change in the contract’s value from trade date. Futures, if any, are reported at their variation margin at measurement date, which represents the amount due to/from the Fund at that date. All additional assets and liabilities included in the above table are reported at their market value at measurement date.
The table below shows the transfers between Level 2 and Level 3. The Fund’s policy is to recognize transfers in and transfers out as of the beginning of the reporting period.
| | | | | | | | | | | | | | | | |
| | | Transfers into
Level 2* | | | Transfers out of
Level 2** | | | Transfers into
Level 3** | | | Transfers out
of Level 3* | |
Assets Table | | | | | | | | | | | | | | | | |
Investments, at Value: | | | | | | | | | | | | | | | | |
| Corporate Bonds and Notes | | $ | 1,050,000 | | | $ | — | | | $ | — | | | $ | (1,050,000 | ) |
| Structured Securities | | | — | | | | (33,092,336 | ) | | | 33,092,336 | | | | — | |
| | | | |
Total Assets | | $ | 1,050,000 | | | $ | (33,092,336 | ) | | $ | 33,092,336 | | | $ | (1,050,000 | ) |
| | | | |
*Transferred from Level 3 to Level 2 due to the availability of market data for this security.
**Transferred from Level 2 to Level 3 because of the lack of observable market data.
3. Shares of Beneficial Interest
The Fund has authorized an unlimited number of $0.001 par value shares of beneficial interest of each class. Transactions in shares of beneficial interest were as follows:
| | | | | | | | | | | | | | | | |
| | | Year Ended September 30, 2013 | | | Year Ended September 28, 20121 | |
| | | Shares | | | Amount | | | Shares | | | Amount | |
Class A | | | | | | | | | | | | | | | | |
| Sold | | | 169,999,853 | | | $ | 1,096,720,599 | | | | 171,776,974 | | | $ | 1,091,554,116 | |
| Dividends and/or distributions reinvested | | | 34,057,019 | | | | 218,725,321 | | | | 44,995,865 | | | | 283,930,046 | |
| Redeemed | | | (317,280,030 | ) | | | (2,016,371,038 | ) | | | (330,147,419 | ) | | | (2,090,023,611 | ) |
| | | | |
Net decrease | | | (113,223,158 | ) | | $ | (700,925,118 | ) | | | (113,374,580 | ) | | $ | (714,539,449 | ) |
| | | | |
70 OPPENHEIMER INTERNATIONAL BOND FUND
3. Shares of Beneficial Interest (Continued)
| | | | | | | | | | | | | | | | |
| | | Year Ended September 30, 2013 | | | Year Ended September 28, 20121 | |
| | | Shares | | | Amount | | | Shares | | | Amount | |
Class B | | | | | | | | | | | | | | | | |
| Sold | | | 770,887 | | | $ | 4,999,634 | | | | 3,720,749 | | | $ | 23,495,746 | |
| Dividends and/or distributions reinvested | | | 783,095 | | | | 5,026,246 | | | | 1,241,531 | | | | 7,791,960 | |
| Redeemed | | | (10,093,565 | ) | | | (64,238,844 | ) | | | (11,319,946 | ) | | | (71,546,679) | |
| | | | |
Net decrease | | | (8,539,583 | ) | | $ | (54,212,964 | ) | | | (6,357,666 | ) | | $ | (40,258,973) | |
| | | | |
| | | | | | | | | | | | | |
Class C | | | | | | | | | | | | | | | | |
| Sold | | | 26,672,457 | | | $ | 172,591,137 | | | | 25,358,117 | | | $ | 160,456,837 | |
| Dividends and/or distributions reinvested | | | 6,785,301 | | | | 43,478,473 | | | | 9,136,135 | | | | 57,381,021 | |
| Redeemed | | | (77,120,939 | ) | | | (486,189,197 | ) | | | (61,630,623 | ) | | | (389,458,127) | |
| | | | |
Net decrease | | | (43,663,181 | ) | | $ | (270,119,587 | ) | | | (27,136,371 | ) | | $ | (171,620,269) | |
| | | | |
| | | | | | | | | | | | | |
Class I | | | | | | | | | | | | | | | | |
| Sold | | | 93,571,163 | | | $ | 605,032,423 | | | | 140,600 | | | $ | 887,480 | |
| Dividends and/or distributions reinvested | | | 1,287,295 | | | | 7,890,371 | | | | 1,641 | | | | 10,490 | |
| Redeemed | | | (5,755,768 | ) | | | (35,252,291 | ) | | | (11,317 | ) | | | (73,077) | |
| | | | |
Net increase | | | 89,102,690 | | | $ | 577,670,503 | | | | 130,924 | | | $ | 824,893 | |
| | | | |
| | | | | | | | | | | | | |
Class N | | | | | | | | | | | | | | | | |
| Sold | | | 10,017,017 | | | $ | 64,394,771 | | | | 12,083,868 | | | $ | 76,484,026 | |
| Dividends and/or distributions reinvested | | | 1,676,531 | | | | 10,735,942 | | | | 2,250,133 | | | | 14,151,519 | |
| Redeemed | | | (18,368,050 | ) | | | (117,435,800 | ) | | | (17,347,866 | ) | | | (109,597,128) | |
| | | | |
Net decrease | | | (6,674,502 | ) | | $ | (42,305,087 | ) | | | (3,013,865 | ) | | $ | (18,961,583) | |
| | | | |
| | | | | | | | | | | | | |
Class Y | | | | | | | | | | | | | | | | |
| Sold | | | 306,355,987 | | | $ | 1,956,264,328 | | | | 276,613,105 | | | $ | 1,755,512,047 | |
| Dividends and/or distributions reinvested | | | 28,172,034 | | | | 180,799,056 | | | | 32,234,890 | | | | 203,553,471 | |
| Redeemed | | | (411,258,163 | ) | | | (2,596,891,076 | ) | | | (233,014,570 | ) | | | (1,474,979,975) | |
| | | | |
Net increase (decrease) | | | (76,730,142 | ) | | $ | (459,827,692 | ) | | | 75,833,425 | | | $ | 484,085,543 | |
| | | | |
1. For the year ended September 28, 2012, for Class A, Class B, Class C, Class N and Class Y shares, and for the period from January 27, 2012 (inception of offering) to September 28, 2012, for Class I shares.
4. Purchases and Sales of Securities
The aggregate cost of purchases and proceeds from sales of securities, other than short-term obligations and investments in IMMF, for the year ended September 30, 2013 were as follows:
| | | | | | | | |
| | | Purchases | | | Sales | |
| Investment securities | | $ | 10,133,758,212 | | | $ | 12,403,262,705 | |
| U.S. government and government agency obligations | | | 616,868,128 | | | | 640,911,420 | |
71 OPPENHEIMER INTERNATIONAL BOND FUND
| | | | |
| | |
| | NOTESTO FINANCIAL STATEMENTS Continued | | |
5. Fees and Other Transactions with Affiliates
Management Fees. Under the investment advisory agreement, the Fund pays the Manager a management fee based on the daily net assets of the Fund at an annual rate as shown in the following table:
| | | | |
| Fee Schedule | | | |
| Up to $200 million | | | 0.75% | |
| Next $200 million | | | 0.72 | |
| Next $200 million | | | 0.69 | |
| Next $200 million | | | 0.66 | |
| Next $200 million | | | 0.60 | |
| Next $4 billion | | | 0.50 | |
| Next $10 billion | | | 0.48 | |
| Over $15 billion | | | 0.45 | |
Sub-Adviser Fees. The Manager has retained the Sub-Adviser to provide the day-to-day portfolio management of the Fund. Under the Sub-Advisory Agreement, the Manager pays the Sub-Adviser an annual fee in monthly installments, equal to a percentage of the investment management fee collected by the Manager from the Fund, which shall be calculated after any investment management fee waivers. The fee paid to the Sub-Adviser is paid by the Manager, not by the Fund.
Transfer Agent Fees. OppenheimerFunds Services (“OFS”), a division of OFI, acted as the transfer and shareholder servicing agent for the Fund through December 31, 2012. Effective January 1, 2013, OFI Global (the “Transfer Agent”) serves as the transfer and shareholder servicing agent for the Fund. Fees incurred by the Fund with respect to these services are detailed in the Statement of Operations.
Sub-Transfer Agent Fees. Effective January 1, 2013, the Transfer Agent has retained Shareholder Services, Inc., a wholly-owned subsidiary of OFI (the “Sub-Transfer Agent”), to provide the day-to-day transfer agent and shareholder servicing of the Fund. Under the Sub-Transfer Agency Agreement, the Transfer Agent pays the Sub-Transfer Agent an annual fee in monthly installments, equal to a percentage of the transfer agent fee collected by the Transfer Agent from the Fund, which shall be calculated after any applicable fee waivers. The fee paid to the Sub-Transfer Agent is paid by the Transfer Agent, not by the Fund.
Distribution and Service Plan (12b-1) Fees. Under its General Distributor’s Agreement with the Fund, OppenheimerFunds Distributor, Inc. (the “Distributor”) acts as the Fund’s principal underwriter in the continuous public offering of the Fund’s classes of shares.
Service Plan for Class A Shares. The Fund has adopted a Service Plan (the “Plan”) for Class A shares under Rule 12b-1 of the Investment Company Act of 1940. Under the Plan, the Fund reimburses the Distributor for a portion of its costs incurred for services provided to accounts that hold Class A shares. Reimbursement is made periodically at an annual rate of up to 0.25% of the daily net assets of Class A shares of the Fund. The Distributor currently uses all of those fees to pay dealers, brokers, banks and other financial institutions periodically for providing personal service and maintenance of accounts of their customers
72 OPPENHEIMER INTERNATIONAL BOND FUND
5. Fees and Other Transactions with Affiliates (Continued)
that hold Class A shares. Any unreimbursed expenses the Distributor incurs with respect to Class A shares in any fiscal year cannot be recovered in subsequent periods. Fees incurred by the Fund under the Plan are detailed in the Statement of Operations.
Distribution and Service Plans for Class B, Class C and Class N Shares. The Fund has adopted Distribution and Service Plans (the “Plans”) for Class B, Class C and Class N shares under Rule 12b-1 of the Investment Company Act of 1940 to compensate the Distributor for its services in connection with the distribution of those shares and servicing accounts. Under the Plans, the Fund pays the Distributor an annual asset-based sales charge of 0.75% on Class B and Class C shares daily net assets and 0.25% on Class N shares daily net assets. The Distributor also receives a service fee of 0.25% per year under each plan. If either the Class B, Class C or Class N plan is terminated by the Fund or by the shareholders of a class, the Board of Trustees and its independent trustees must determine whether the Distributor shall be entitled to payment from the Fund of all or a portion of the service fee and/or asset-based sales charge in respect to shares sold prior to the effective date of such termination. Fees incurred by the Fund under the Plans are detailed in the Statement of Operations. The Distributor determines its uncompensated expenses under the Plans at calendar quarter ends. The Distributor’s aggregate uncompensated expenses under the Plans at September 30, 2013 were as follows:
| | | | |
| Class B | | $ | 4,016,786 | |
| Class C | | | 37,922,205 | |
| Class N | | | 7,401,744 | |
Sales Charges. Front-end sales charges and contingent deferred sales charges (“CDSC”) do not represent expenses of the Fund. They are deducted from the proceeds of sales of Fund shares prior to investment or from redemption proceeds prior to remittance, as applicable. The sales charges retained by the Distributor from the sale of shares and the CDSC retained by the Distributor on the redemption of shares is shown in the following table for the period indicated.
| | | | | | | | | | | | | | | | | | | | |
| Year Ended | | Class A Front-End
Sales Charges
Retained by
Distributor | | | Class A
Contingent
Deferred Sales
Charges
Retained by
Distributor | | | Class B
Contingent
Deferred Sales
Charges
Retained by
Distributor | | | Class C
Contingent
Deferred Sales
Charges
Retained by
Distributor | | | Class N
Contingent
Deferred Sales
Charges
Retained by
Distributor | |
| September 30, 2013 | | | $597,129 | | | | $41,980 | | | | $432,369 | | | | $109,049 | | | | $2,996 | |
Waivers and Reimbursements of Expenses. The Manager will waive fees and/or reimburse Fund expenses in an amount equal to the indirect management fees incurred through the Fund’s investment in IMMF. During the year ended September 30, 2013, the Manager waived fees and/or reimbursed the Fund $348,087 for IMMF management fees.
The Transfer Agent has voluntarily agreed to limit transfer and shareholder servicing agent fees for Classes B, C, N and Y shares to 0.35% of average annual net assets per class and for Class A shares to 0.30% of average annual net assets of the class.
73 OPPENHEIMER INTERNATIONAL BOND FUND
| | | | |
| | |
| | NOTESTO FINANCIAL STATEMENTS Continued | | |
5. Fees and Other Transactions with Affiliates (Continued)
During the year ended September 30, 2013, the Transfer Agent waived transfer and shareholder servicing agent fees as follows:
Some of these undertakings may be modified or terminated at any time; some may not be modified or terminated until after one year from the date of the current prospectus, as indicated therein.
6. Risk Exposures and the Use of Derivative Instruments
The Fund’s investment objectives not only permit the Fund to purchase investment securities, they also allow the Fund to enter into various types of derivatives contracts, including, but not limited to, futures contracts, forward currency exchange contracts, credit default swaps, interest rate swaps, total return swaps, variance swaps and purchased and written options. In doing so, the Fund will employ strategies in differing combinations to permit it to increase, decrease, or change the level or types of exposure to market risk factors. These instruments may allow the Fund to pursue its objectives more quickly and efficiently than if it were to make direct purchases or sales of securities capable of effecting a similar response to market factors. Such contracts may be entered into through a bilateral over-the-counter (“OTC”) transaction, or through a securities or futures exchange and cleared through a clearinghouse.
Market Risk Factors. In accordance with its investment objectives, the Fund may use derivatives to increase or decrease its exposure to one or more of the following market risk factors:
Commodity Risk. Commodity risk relates to the change in value of commodities or commodity indexes as they relate to increases or decreases in the commodities market. Commodities are physical assets that have tangible properties. Examples of these types of assets are crude oil, heating oil, metals, livestock, and agricultural products.
Credit Risk. Credit risk relates to the ability of the issuer to meet interest and principal payments, or both, as they come due. In general, lower-grade, higher-yield bonds are subject to credit risk to a greater extent than lower-yield, higher-quality bonds.
Equity Risk. Equity risk relates to the change in value of equity securities as they relate to increases or decreases in the general market.
Foreign Exchange Rate Risk. Foreign exchange rate risk relates to the change in the U.S. dollar value of a security held that is denominated in a foreign currency. The U.S. dollar value of a foreign currency denominated security will decrease as the dollar appreciates against the currency, while the U.S. dollar value will increase as the dollar depreciates against the currency.
Interest Rate Risk. Interest rate risk refers to the fluctuations in value of fixed-income securities resulting from the inverse relationship between price and yield. For example, an increase in general interest rates will tend to reduce the market value of already issued fixed-income investments, and a decline in general interest rates will tend to increase their
74 OPPENHEIMER INTERNATIONAL BOND FUND
6. Risk Exposures and the Use of Derivative Instrument (Continued)
value. In addition, debt securities with longer maturities, which tend to have higher yields, are subject to potentially greater fluctuations in value from changes in interest rates than obligations with shorter maturities.
Volatility Risk. Volatility risk refers to the magnitude of the movement, but not the direction of the movement, in a financial instrument’s price over a defined time period. Large increases or decreases in a financial instrument’s price over a relative time period typically indicate greater volatility risk, while small increases or decreases in its price typically indicate lower volatility risk.
Derivatives may have little or no initial cash investment relative to their market value exposure and therefore can produce significant gains or losses in excess of their cost due to unanticipated changes in the market risk factors and the overall market. This use of embedded leverage allows the Fund to increase its market value exposure relative to its net assets and can substantially increase the volatility of the Fund’s performance. In instances where the Fund is using derivatives to decrease, or hedge, exposures to market risk factors for securities held by the Fund, there are also risks that those derivatives may not perform as expected resulting in losses for the combined or hedged positions. Some derivatives have the potential for unlimited loss, regardless of the size of the Fund’s initial investment.
Additional associated risks from investing in derivatives also exist and potentially could have significant effects on the valuation of the derivative and the Fund. Typically, the associated risks are not the risks that the Fund is attempting to increase or decrease exposure to, per its investment objectives, but are the additional risks from investing in derivatives. Examples of these associated risks are liquidity risk, which is the risk that the Fund will not be able to sell the derivative in the open market in a timely manner, and counterparty credit risk, which is the risk that the counterparty will not fulfill its obligation to the Fund.
The Fund’s actual exposures to these market risk factors and associated risks during the period are discussed in further detail, by derivative type, below.
Forward Currency Exchange Contracts
The Fund may enter into forward currency exchange contracts (“forward contracts”) for the purchase or sale of a foreign currency at a negotiated rate at a future date. Such contracts are traded in the OTC inter-bank currency dealer market.
Forward contracts are reported on a schedule following the Statement of Investments. The unrealized appreciation (depreciation) is reported in the Statement of Assets and Liabilities as a receivable (or payable) and in the Statement of Operations within the change in unrealized appreciation (depreciation). At contract close, the difference between the original cost of the contract and the value at the close date is recorded as a realized gain (loss) in the Statement of Operations.
The Fund has entered into forward contracts with the obligation to purchase specified foreign currencies in the future at a currently negotiated forward rate in order to take a positive investment perspective on the related currency. These forward contracts seek to increase exposure to foreign exchange rate risk.
75 OPPENHEIMER INTERNATIONAL BOND FUND
| | | | |
| | |
| | NOTESTO FINANCIAL STATEMENTS Continued | | |
6. Risk Exposures and the Use of Derivative Instrument (Continued)
The Fund has entered into forward contracts with the obligation to purchase specified foreign currencies in the future at a currently negotiated forward rate in order to decrease exposure to foreign exchange rate risk associated with foreign currency denominated securities held by the Fund.
The Fund has entered into forward contracts with the obligation to sell specified foreign currencies in the future at a currently negotiated forward rate in order to take a negative investment perspective on the related currency. These forward contracts seek to increase exposure to foreign exchange rate risk.
The Fund has entered into forward contracts with the obligation to sell specified foreign currencies in the future at a currently negotiated forward rate in order to decrease exposure to foreign exchange rate risk associated with foreign currency denominated securities held by the Fund.
During the year ended September 30, 2013, the Fund had daily average contract amounts on forward contracts to buy and sell of $3,972,089,327 and $7,452,881,511, respectively.
Additional associated risk to the Fund includes counterparty credit risk. Counterparty credit risk arises from the possibility that the counterparty to a forward contract will default and fail to perform its obligations to the Fund.
Futures Contracts
A futures contract is a commitment to buy or sell a specific amount of a commodity, financial instrument or currency at a negotiated price on a stipulated future date. The Fund may buy and sell futures contracts and may also buy or write put or call options on these futures contracts. Futures contracts and options thereon are generally entered into on a regulated futures exchange and cleared through a clearinghouse associated with the exchange.
Upon entering into a futures contract, the Fund is required to deposit either cash or securities (initial margin) in an amount equal to a certain percentage of the contract value in an account registered in the futures commission merchant’s name. Subsequent payments (variation margin) are paid to or from the futures commission merchant each day equal to the daily changes in the contract value. Such payments are recorded as unrealized gains and losses. Should the Fund fail to make requested variation margin payments, the futures commission merchant can gain access to the initial margin to satisfy the Fund’s payment obligations.
Futures contracts are reported on a schedule following the Statement of Investments. Securities held by a futures commission merchant to cover initial margin requirements on open futures contracts are noted in the Statement of Investments. Cash held by a futures commission merchant to cover initial margin requirements on open futures contracts and the receivable and/or payable for the daily mark to market for the variation margin are noted in the Statement of Assets and Liabilities. The net change in unrealized appreciation and depreciation is reported in the Statement of Operations. Realized gains (losses) are reported in the Statement of Operations at the closing or expiration of futures contracts.
The Fund has purchased futures contracts on various bonds and notes to increase exposure to interest rate risk.
76 OPPENHEIMER INTERNATIONAL BOND FUND
6. Risk Exposures and the Use of Derivative Instrument (Continued)
The Fund has sold futures contracts on various bonds and notes to decrease exposure to interest rate risk.
The Fund has purchased futures contracts on various currencies to increase exposure to foreign exchange rate risk.
The Fund has sold futures contracts on various currencies to decrease exposure to foreign exchange rate risk.
The Fund has purchased futures contracts, which have values that are linked to the price movement of the related volatility indexes, in order to increase exposure to volatility risk.
The Fund has sold futures contracts, which have values that are linked to the price movement of the related volatility indexes, in order to decrease exposure to volatility risk.
During the year ended September 30, 2013, the Fund had an ending monthly average market value of $51,152,519 and $1,303,727,573 on futures contracts purchased and sold, respectively.
Additional associated risks of entering into futures contracts (and related options) include the possibility that there may be an illiquid market where the Fund is unable to liquidate the contract or enter into an offsetting position and, if used for hedging purposes, the risk that the price of the contract will correlate imperfectly with the prices of the Fund’s securities.
Option Activity
The Fund may buy and sell put and call options, or write put and call options. When an option is written, the Fund receives a premium and becomes obligated to sell or purchase the underlying security, currency or other underlying financial instrument at a fixed price, upon exercise of the option.
Options can be traded through an exchange or through a privately negotiated arrangement with a dealer in an OTC transaction. Options traded through an exchange are generally cleared through a clearinghouse (such as The Options Clearing Corporation). The difference between the premium received or paid, and market value of the option, is recorded as unrealized appreciation or depreciation. The net change in unrealized appreciation or depreciation is reported in the Statement of Operations. When an option is exercised, the cost of the security purchased or the proceeds of the security sale are adjusted by the amount of premium received or paid. Upon the expiration or closing of the option transaction, a gain or loss is reported in the Statement of Operations.
The Fund has purchased call options on currencies to increase exposure to foreign exchange rate risk. A purchased call option becomes more valuable as the price of the underlying financial instrument appreciates relative to the strike price.
The Fund has purchased put options on currencies to decrease exposure to foreign exchange rate risk. A purchased put option becomes more valuable as the price of the underlying financial instrument depreciates relative to the strike price.
The Fund has purchased call options on treasury and/or euro futures to increase exposure to interest rate risk. A purchased call option becomes more valuable as the price of the underlying financial instrument appreciates relative to the strike price.
77 OPPENHEIMER INTERNATIONAL BOND FUND
| | | | |
| | |
| | NOTESTO FINANCIAL STATEMENTS Continued | | |
6. Risk Exposures and the Use of Derivative Instrument (Continued)
The Fund has purchased put options on treasury and/or euro futures to decrease exposure to interest rate risk. A purchased put option becomes more valuable as the price of the underlying financial instrument depreciates relative to the strike price.
During the year ended September 30, 2013, the Fund had an ending monthly average market value of $23,575,093 and $62,569,607 on purchased call options and purchased put options, respectively.
Options written, if any, are reported in a schedule following the Statement of Investments and as a liability in the Statement of Assets and Liabilities. Securities held in collateral accounts to cover potential obligations with respect to outstanding written options are noted in the Statement of Investments.
The risk in writing a call option is that the market price of the security increases and if the option is exercised, the Fund must either purchase the security at a higher price for delivery or, if the Fund owns the underlying security, give up the opportunity for profit. The risk in writing a put option is that the Fund may incur a loss if the market price of the security decreases and the option is exercised. The risk in buying an option is that the Fund pays a premium whether or not the option is exercised. The Fund also has the additional risk that there may be an illiquid market where the Fund is unable to close the contract.
The Fund has written put options on currencies to increase exposure to foreign exchange rate risk. A written put option becomes more valuable as the price of the underlying financial instrument appreciates relative to the strike price.
The Fund has written call options on currencies to decrease exposure to foreign exchange rate risk. A written call option becomes more valuable as the price of the underlying financial instrument depreciates relative to the strike price.
The Fund has written call options on treasury and/or euro futures to decrease exposure to interest rate risk. A written call option becomes more valuable as the price of the underlying financial instrument depreciates relative to the strike price.
The Fund has written put options on treasury and/or euro futures to increase exposure to interest rate risk. A written put option becomes more valuable as the price of the underlying financial instrument appreciates relative to the strike price.
During the year ended September 30, 2013, the Fund had an ending monthly average market value of $32,675,570 and $31,510,230 on written call options and written put options, respectively.
Additional associated risks to the Fund include counterparty credit risk and liquidity risk.
Written option activity for the year ended September 30, 2013 was as follows:
| | | | | | | | | | | | | | | | |
| | | Call Options | | | Put Options | |
| | | Number of Contracts | | | Amount of
Premiums | | | Number of Contracts | | | Amount of
Premiums | |
| Options outstanding as of September 28, 2012 | | | 120,025,259,722 | | | $ | 21,469,321 | | | | 145,504,820,854 | | | $ | 34,561,577 | |
| Options written | | | 1,385,002,267,792 | | | | 209,119,028 | | | | 1,315,932,331,366 | | | | 227,092,063 | |
| Options closed or expired | | | (1,216,858,397,514 | ) | | | (157,451,177 | ) | | | (1,049,885,332,220 | ) | | | (186,406,943 | ) |
| Options exercised | | | (94,508,330,000 | ) | | | (19,561,109 | ) | | | (230,839,940,000 | ) | | | (36,641,438 | ) |
| | | | |
| Options outstanding as of September 30, 2013 | | | 193,660,800,000 | | | $ | 53,576,063 | | | | 180,711,880,000 | | | $ | 38,605,259 | |
| | | | |
78 OPPENHEIMER INTERNATIONAL BOND FUND
6. Risk Exposures and the Use of Derivative Instrument (Continued)
Swap Contracts
The Fund may enter into swap contract agreements with a counterparty to exchange a series of cash flows based on either specified reference rates, the price or volatility of asset or non-asset references, or the occurrence of a credit event, over a specified period. Swaps can be executed in a bi-lateral privately negotiated arrangement with a dealer in an OTC transaction (“OTC swaps”) or executed on a regulated market. Certain swaps, regardless of the venue of their execution, are required to be cleared through a clearinghouse (“cleared swaps”). Swap contracts may include interest rate, equity, debt, index, total return, credit default, currency, and volatility swaps.
Swap contracts are reported on a schedule following the Statement of Investments. Daily changes in the value of cleared swaps are reported as variation margin receivable or payable on the Statement of Assets and Liabilities. The values of OTC swap contracts are aggregated by positive and negative values and disclosed separately on the Statement of Assets and Liabilities. The unrealized appreciation (depreciation) related to the change in the valuation of the notional amount of the swap is combined with the accrued interest due to (owed by) the Fund, if any, at termination or settlement. The net change in this amount during the period is included on the Statement of Operations. The Fund also records any periodic payments received from (paid to) the counterparty, including at termination, under such contracts as realized gain (loss) on the Statement of Operations.
Swap contract agreements are exposed to the market risk factor of the specific underlying reference rate or asset. Swap contracts are typically more attractively priced compared to similar investments in related cash securities because they isolate the risk to one market risk factor and eliminate the other market risk factors. Investments in cash securities (for instance bonds) have exposure to multiple risk factors (credit and interest rate risk). Because swaps have embedded leverage, they can expose the Fund to substantial risk in the isolated market risk factor.
Credit Default Swap Contracts. A credit default swap is a contract that enables an investor to buy or sell protection against a defined-issuer credit event, such as the issuer’s failure to make timely payments of interest or principal on a debt security, bankruptcy or restructuring. The Fund may enter into credit default swaps either by buying or selling protection on a corporate issuer, sovereign issuer, or a basket or index of issuers (the “reference asset”).
The buyer of protection pays a periodic fee to the seller of protection based on the notional amount of the swap contract. The seller of protection agrees to compensate the buyer of protection for future potential losses as a result of a credit event on the reference asset. The contract effectively transfers the credit event risk of the reference asset from the buyer of protection to the seller of protection.
The ongoing value of the contract will fluctuate throughout the term of the contract based primarily on the credit risk of the reference asset. If the credit quality of the reference asset improves relative to the credit quality at contract initiation, the buyer of protection may have an unrealized loss greater than the anticipated periodic fee owed. This unrealized loss would be the result of current credit protection being cheaper than the cost of credit
79 OPPENHEIMER INTERNATIONAL BOND FUND
| | | | |
| | |
| | NOTESTO FINANCIAL STATEMENTS Continued | | |
6. Risk Exposures and the Use of Derivative Instrument (Continued)
protection at contract initiation. If the buyer elects to terminate the contract prior to its maturity, and there has been no credit event, this unrealized loss will become realized. If the contract is held to maturity, and there has been no credit event, the realized loss will be equal to the periodic fee paid over the life of the contract.
If there is a credit event, the buyer of protection can exercise its rights under the contract and receive a payment from the seller of protection equal to the notional amount of the swap less the market value of specified debt securities issued by the reference asset. Upon exercise of the contract the difference between such value and the notional amount is recorded as realized gain (loss) and is included on the Statement of Operations.
The Fund has sold credit protection through credit default swaps to increase exposure to the credit risk of individual issuers and/or indexes of issuers that are either unavailable or considered to be less attractive in the bond market.
The Fund has purchased credit protection through credit default swaps to decrease exposure to the credit risk of individual issuers and/or indexes of issuers.
The Fund has engaged in spread curve trades by simultaneously purchasing and selling protection through credit default swaps referenced to the same reference asset but with different maturities. Spread curve trades attempt to gain exposure to credit risk on a forward basis by realizing gains on the expected differences in spreads.
For the year ended September 30, 2013, the Fund had ending monthly average notional amounts of $280,049,786 and $115,970,886 on credit default swaps to buy protection and credit default swaps to sell protection, respectively.
Additional associated risks to the Fund include counterparty credit risk and liquidity risk.
Interest Rate Swap Contracts. An interest rate swap is an agreement between counterparties to exchange periodic payments based on interest rates. One cash flow stream will typically be a floating rate payment based upon a specified floating interest rate while the other is typically a fixed interest rate.
The Fund has entered into interest rate swaps in which it pays a floating interest rate and receives a fixed interest rate in order to increase exposure to interest rate risk. Typically, if relative interest rates rise, payments made by the Fund under a swap agreement will be greater than the payments received by the Fund.
The Fund has entered into interest rate swaps in which it pays a fixed interest rate and receives a floating interest rate in order to decrease exposure to interest rate risk. Typically, if relative interest rates rise, payments received by the Fund under the swap agreement will be greater than the payments made by the Fund.
For the year ended September 30, 2013, the Fund had ending monthly average notional amounts of $606,712,759 and $1,746,304,738 on interest rate swaps which pay a fixed rate and interest rate swaps which receive a fixed rate, respectively.
Additional associated risks to the Fund include counterparty credit risk and liquidity risk.
Volatility Swap Contracts. A volatility swap is an agreement between counterparties to exchange periodic payments based on the measured volatility of a reference security, index, currency or other reference investment over a specified time frame. One cash flow is typically based on the realized volatility of the reference investment as measured by
80 OPPENHEIMER INTERNATIONAL BOND FUND
6. Risk Exposures and the Use of Derivative Instrument (Continued)
changes in its price or level over the specified time period while the other cash flow is based on a specified rate representing expected volatility for the reference investment at the time the swap is executed, or the measured volatility of a different reference investment over the specified time period. The appreciation or depreciation on a volatility swap will typically depend on the magnitude of the reference investment’s volatility, or size of the movements in its price, over the specified time period, rather than general directional increases or decreases in its price.
Volatility swaps are less standard in structure than other types of swaps and provide pure, or isolated, exposure to volatility risk of the specific underlying reference investment. Volatility swaps are typically used to speculate on future volatility levels, to trade the spread between realized and expected volatility, or to decrease the volatility exposure of investments held by the Fund.
Variance swaps are a type of volatility swap where counterparties agree to exchange periodic payments based on the measured variance (or the volatility squared) of a reference security, index, or other reference investment over a specified time period. At payment date, a net cash flow will be exchanged based on the difference between the realized variance of the reference investment over the specified time period and the specified rate representing expected variance for the reference investment at the time the swap is executed multiplied by the notional amount of the contract.
The Fund has entered into volatility swaps to increase exposure to the volatility risk of various reference investments. These types of volatility swaps require the Fund to pay the measured volatility and receive a fixed rate payment. If the measured volatility of the related reference investment increases over the period, the swaps will depreciate in value. Conversely, if the measured volatility of the related reference investment decreases over the period, the swaps will appreciate in value.
The Fund has entered into volatility swaps to decrease exposure to the volatility risk of various reference investments. These types of volatility swaps require the Fund to pay a fixed rate payment and receive the measured volatility. If the measured volatility of the related reference investment increases over the period, the swaps will appreciate in value. Conversely, if the measured volatility of the related reference investment decreases over the period, the swaps will depreciate in value.
For the year ended September 30, 2013, the Fund had ending monthly average notional amounts of $254,364 and $407,284 on volatility swaps which pay measured volatility/variance and volatility swaps which receive measured volatility/variance, respectively.
Additional associated risks to the Fund include counterparty credit risk and liquidity risk.
As of September 30, 2013, the Fund had no such volatility swap agreements outstanding.
81 OPPENHEIMER INTERNATIONAL BOND FUND
| | | | |
| | |
| | NOTESTO FINANCIAL STATEMENTS Continued | | |
6. Risk Exposures and the Use of Derivative Instrument (Continued)
Swaption Transactions
The Fund may enter into a swaption contract which grants the purchaser the right, but not the obligation, to enter into a swap transaction at preset terms detailed in the underlying agreement within a specified period of time. The purchaser pays a premium to the swaption writer who bears the risk of unfavorable changes in the preset terms on the underlying swap.
Purchased swaptions are reported as a component of investments in the Statement of Investments and the Statement of Assets and Liabilities. Written swaptions are reported on a schedule following the Statement of Investments and their value is reported as a separate asset or liability line item in the Statement of Assets and Liabilities. The net change in unrealized appreciation or depreciation on written swaptions is separately reported in the Statement of Operations. When a swaption is exercised, the cost of the swap is adjusted by the amount of premium paid or received. Upon the expiration or closing of an unexercised swaption contract, a gain or loss is reported in the Statement of Operations for the amount of the premium paid or received.
The Fund generally will incur a greater risk when it writes a swaption than when it purchases a swaption. When the Fund writes a swaption it will become obligated, upon exercise of the swaption, according to the terms of the underlying agreement. Swaption contracts written by the Fund do not give rise to counterparty credit risk prior to exercise as they obligate the Fund, not its counterparty, to perform. When the Fund purchases a swaption it only risks losing the amount of the premium it paid if the swaption expires unexercised. However, when the Fund exercises a purchased swaption there is a risk that the counterparty will fail to perform or otherwise default on its obligations under the swaption contract.
The Fund purchased swaptions which gives it the option to enter into an interest rate swap in which it pays a floating interest rate and receives a fixed interest rate in order to increase exposure to interest rate risk. A purchased swaption of this type becomes more valuable as the reference interest rate decreases relative to the preset interest rate.
The Fund has purchased swaptions which gives it the option to enter into an interest rate swap in which it pays a fixed interest rate and receives a floating interest rate in order to decrease exposure to interest rate risk. A purchased swaption of this type becomes more valuable as the reference interest rate increases relative to the preset interest rate.
The Fund has purchased swaptions which gives it the option to sell credit protection through credit default swaps in order to increase exposure to the credit risk of individual issuers and/ or indexes of issuers. A purchased swaption of this type becomes more valuable as the likelihood of a credit event on the reference asset decreases.
The Fund has purchased swaptions which gives it the option to buy credit protection through credit default swaps in order to decrease exposure to the credit risk of individual issuers and/or indexes of issuers. A purchased swaption of this type becomes more valuable as the likelihood of a credit event on the reference asset increases.
The Fund has written swaptions which gives it the obligation, if exercised by the purchaser, to enter into an interest rate swap in which it pays a floating interest rate and receives a fixed interest rate in order to increase exposure to interest rate risk. A written swaption of this type becomes more valuable as the reference interest rate decreases relative to the preset interest rate.
82 OPPENHEIMER INTERNATIONAL BOND FUND
6. Risk Exposures and the Use of Derivative Instrument (Continued)
The Fund has written swaptions which gives it the obligation, if exercised by the purchaser, to enter into an interest rate swap in which it pays a fixed interest rate and receives a floating interest rate in order to decrease exposure to interest rate risk. A written swaption of this type becomes more valuable as the reference interest rate increases relative to the preset interest rate.
The Fund has written swaptions which give it the obligation, if exercised by the purchaser, to sell credit protection through credit default swaps in order to increase exposure to the credit risk of individual issuers and/or indexes of issuers. A written swaption of this type becomes more valuable as the likelihood of a credit event on the reference asset decreases.
The Fund has written swaptions which give it the obligation, if exercised by the purchaser, to buy credit protection through credit default swaps in order to decrease exposure to the credit risk of individual issuers and/or, indexes of issuers. A written swaption of this type becomes more valuable as the likelihood of a credit event on the reference asset increases.
During the year ended September 30, 2013, the Fund had an ending monthly average market value of $80,233,823 and $110,093,202 on purchased and written swaptions, respectively.
Written swaption activity for the year ended September 30, 2013 was as follows:
| | | | | | | | | | |
| | | Call Swaptions | | | |
| | | Notional
Amount | | | Amount of
Premiums | | |
| Swaptions outstanding as of September 28, 2012 | | | 4,463,288,346 | | | $ | 93,319,898 | | |
| Swaptions written | | | 37,208,005,000 | | | | 327,906,304 | | |
| Swaptions closed or expired | | | (29,972,743,346 | ) | | | (293,281,841) | | |
| Swaptions exercised | | | (3,948,215,000 | ) | | | (19,300,099) | | |
| | | | | |
| Swaptions outstanding as of September 30, 2013 | | | 7,750,335,000 | | | $ | 108,644,262 | | |
| | | | | |
Counterparty Credit Risk. Derivative positions are subject to the risk that the counterparty will not fulfill its obligation to the Fund. The Fund intends to enter into derivative transactions with counterparties that the Manager believes to be creditworthy at the time of the transaction.
The Fund’s risk of loss from counterparty credit risk on OTC derivatives is generally limited to the aggregate unrealized gain netted against any collateral held by the Fund. For OTC options purchased, the Fund bears the risk of loss of the amount of the premiums paid plus the positive change in market values net of any collateral held by the Fund should the counterparty fail to perform under the contracts. Options written by the Fund do not typically give rise to counterparty credit risk, as options written generally obligate the Fund and not the counterparty to perform.
To reduce counterparty risk with respect to OTC transactions, the Fund has entered into master netting arrangements, established within the Fund’s International Swap and Derivatives Association, Inc. (“ISDA”) master agreements, which allow the Fund to make (or to have an entitlement to receive) a single net payment in the event of default (close-out
83 OPPENHEIMER INTERNATIONAL BOND FUND
| | | | |
| | |
| | NOTESTO FINANCIAL STATEMENTS Continued | | |
6. Risk Exposures and the Use of Derivative Instrument (Continued)
netting) for outstanding payables and receivables with respect to certain OTC positions in swaps, options, swaptions, and forward currency exchange contracts for each individual counterparty. In addition, the Fund may require that certain counterparties post cash and/or securities in collateral accounts to cover their net payment obligations for those derivative contracts subject to ISDA master agreements. If the counterparty fails to perform under these contracts and agreements, the cash and/or securities will be made available to the Fund.
As of September 30, 2013, the Fund has required certain counterparties to post collateral of $51,090,153.
ISDA master agreements include credit related contingent features which allow counterparties to OTC derivatives to terminate derivative contracts prior to maturity in the event that, for example, the Fund’s net assets decline by a stated percentage or the Fund fails to meet the terms of its ISDA master agreements, which would cause the Fund to accelerate payment of any net liability owed to the counterparty.
For financial reporting purposes, the Fund does not offset derivative assets and derivative liabilities that are subject to netting arrangements in the Statement of Assets and Liabilities. Bankruptcy or insolvency laws of a particular jurisdiction may impose restrictions on or prohibitions against the right of offset in bankruptcy, insolvency or other events.
The Fund’s risk of loss from counterparty credit risk on exchange-traded derivatives cleared through a clearinghouse and for cleared swaps is generally considered lower than as compared to OTC derivatives. However, counterparty credit risk exists with respect to initial and variation margin deposited/paid by the Fund that is held in futures commission merchant, broker and/or clearinghouse accounts for such exchange-traded derivatives and for cleared swaps.
With respect to cleared swaps, such transactions will be submitted for clearing, and if cleared, will be held in accounts at futures commission merchants or brokers that are members of clearinghouses. While brokers, futures commission merchants and clearinghouses are required to segregate customer margin from their own assets, in the event that a broker, futures commission merchant or clearinghouse becomes insolvent or goes into bankruptcy and at that time there is a shortfall in the aggregate amount of margin held by the broker, futures commission merchant or clearinghouse for all its customers, U.S. bankruptcy laws will typically allocate that shortfall on a pro-rata basis across all the broker’s, futures commission merchant’s or clearinghouse’s customers, potentially resulting in losses to the Fund.
There is the risk that a broker, futures commission merchant or clearinghouse will decline to clear a transaction on the Fund’s behalf, and the Fund may be required to pay a termination fee to the executing broker with whom the Fund initially enters into the transaction. Clearinghouses may also be permitted to terminate cleared swaps at any time. The Fund is also subject to the risk that the broker or futures commission merchant will improperly use the Fund’s assets deposited/paid as initial or variation margin to satisfy payment obligations of another customer. In the event of a default by another customer of the broker or futures commission merchant, the Fund might not receive its variation margin payments from the clearinghouse, due to the manner in which variation margin payments are aggregated for all customers of the broker/futures commission merchant.
84 OPPENHEIMER INTERNATIONAL BOND FUND
6. Risk Exposures and the Use of Derivative Instrument (Continued)
Collateral and margin requirements differ by type of derivative. Margin requirements are established by the broker, futures commission merchant or clearinghouse for exchange-traded and cleared derivatives, including cleared swaps. Brokers, futures commission merchants and clearinghouses can ask for margin in excess of the regulatory minimum, or increase the margin amount, in certain circumstances.
Collateral terms are contract specific for OTC derivatives. For derivatives traded under an ISDA master agreement, the collateral requirements are typically calculated by netting the mark to market amount for each transaction under such agreement and comparing that amount to the value of any collateral currently pledged by the Fund or the counterparty.
For financial reporting purposes, cash collateral that has been pledged to cover obligations of the Fund, if any, is reported separately on the Statement of Assets and Liabilities as cash pledged as collateral. Non-cash collateral pledged by the Fund, if any, is noted in the Statement of Investments. Generally, the amount of collateral due from or to a party must exceed a minimum transfer amount threshold (e.g. $250,000) before a transfer has to be made. To the extent amounts due to the Fund from its counterparties are not fully collateralized, contractually or otherwise, the Fund bears the risk of loss from counterparty nonperformance.
The following table presents by counterparty the Fund’s OTC derivative assets net of the related collateral posted for the benefit of the Fund at September 30, 2013:
| | | | | | | | | | | | | | | | | | | | |
| | | | | | Gross Amounts Not Offset in the Statement
of Assets & Liabilities | | | | |
| Counterparty | | Gross Amount
of Assets in
the Statement
of Assets &
Liabilities* | | | Financial
Instruments
Available for
Offset | | | Financial
Instruments
Collateral
Received** | | | Cash
Collateral
Received** | | | Net Amount | |
| Bank of America NA | | $ | 57,792,073 | | | $ | (51,991,023 | ) | | $ | — | | | $ | — | | | $ | 5,801,050 | |
| Barclays Bank plc | | | 87,072,324 | | | | (87,072,324 | ) | | | — | | | | — | | | | — | |
| BNP Paribas | | | 3,414,135 | | | | (3,414,135 | ) | | | — | | | | — | | | | — | |
| Citibank NA | | | 18,750,171 | | | | (10,290,165 | ) | | | (6,794,168 | ) | | | — | | | | 1,665,838 | |
| Credit Suisse International | | | 2,697,704 | | | | (422,156 | ) | | | (1,779,162 | ) | | | — | | | | 496,386 | |
| Deutsche Bank Securities AG | | | 482,410 | | | | (482,410 | ) | | | — | | | | — | | | | — | |
| Goldman Sachs Bank USA | | | 84,675,499 | | | | (84,675,499 | ) | | | — | | | | — | | | | — | |
| HSBC Bank USA NA | | | 726,177 | | | | (451,500 | ) | | | — | | | | — | | | | 274,677 | |
| JPMorgan Chase Bank NA | | | 13,525,741 | | | | (13,525,741 | ) | | | — | | | | — | | | | — | |
| Morgan Stanley Capital Services, Inc. | | | 11,830,295 | | | | (11,830,295 | ) | | | — | | | | — | | | | — | |
| Nomura Global Financial Products, Inc. | | | 15,969,478 | | | | (9,923,792 | ) | | | (5,541,031 | ) | | | — | | | | 504,655 | |
| RBS Greenwich Capital | | | 21,796,533 | | | | (9,302,800 | ) | | | (12,493,733 | ) | | | — | | | | — | |
| UBS AG | | | 11,302,313 | | | | (11,302,313 | ) | | | — | | | | — | | | | — | |
| | | | |
Total | | $ | 330,034,853 | | | $ | (294,684,153 | ) | | $ | (26,608,094) | | | $ | — | | | $ | 8,742,606 | |
| | | | |
*OTC derivatives are reported gross on the Statement of Assets and Liabilities. Exchange traded options and margin related to cleared swaps and futures are excluded from these reported amounts.
85 OPPENHEIMER INTERNATIONAL BOND FUND
| | | | |
| | |
| | NOTESTO FINANCIAL STATEMENTS Continued | | |
6. Risk Exposures and the Use of Derivative Instrument (Continued)
**Reported collateral posted for the benefit of the Fund within this table is limited to the net outstanding amount due from an individual counterparty. The collateral posted for the benefit of the Fund may exceed these amounts.
The following table presents by counterparty the Fund’s OTC derivative liabilities net of the related collateral pledged by Fund at September 30, 2013:
| | | | | | | | | | | | | | | | | | | | |
| | | | | | Gross Amounts Not Offset in the Statement
of Assets & Liabilities | | | | |
| Counterparty | | Gross Amount
of Liabilities in
the Statement of Assets &
Liabilities* | | | Financial
Instruments
Available for
Offset | | | Financial
Instruments
Collateral
Pledged** | | | Cash
Collateral
Pledged** | | | Net Amount | |
Bank of America NA | | $ | (51,991,023 | ) | | $ | 51,991,023 | | | $ | — | | | $ | — | | | $ | — | |
Barclays Bank plc | | | (118,357,623 | ) | | | 87,072,324 | | | | 31,285,299 | | | | — | | | | — | |
BNP Paribas | | | (9,541,633 | ) | | | 3,414,135 | | | | 5,108,885 | | | | — | | | | (1,018,613 | ) |
Citibank NA | | | (10,290,165 | ) | | | 10,290,165 | | | | — | | | | — | | | | — | |
Credit Suisse International | | | (422,156 | ) | | | 422,156 | | | | — | | | | — | | | | — | |
Deutsche Bank Securities AG | | | (1,521,884 | ) | | | 482,410 | | | | 1,039,474 | | | | — | | | | — | |
Goldman Sachs Bank USA | | | (125,924,349 | ) | | | 84,675,499 | | | | 25,594,445 | | | | — | | | | (15,654,405 | ) |
HSBC Bank USA NA | | | (451,500 | ) | | | 451,500 | | | | — | | | | — | | | | — | |
JPMorgan Chase Bank NA | | | (25,322,462 | ) | | | 13,525,741 | | | | 11,796,721 | | | | — | | | | — | |
Morgan Stanley Capital Services, Inc. | | | (22,235,542 | ) | | | 11,830,295 | | | | 8,737,842 | | | | — | | | | (1,667,405 | ) |
Nomura Global Financial Products, Inc. | | | (9,923,792 | ) | | | 9,923,792 | | | | — | | | | — | | | | — | |
RBS Greenwich Capital | | | (9,302,800 | ) | | | 9,302,800 | | | | — | | | | — | | | | — | |
UBS AG | | | (31,447,038 | ) | | | 11,302,313 | | | | 20,144,725 | | | | — | | | | — | |
| | | | |
Total | | $ | (416,731,967 | ) | | $ | 294,684,153 | | | $ | 103,707,391 | | | $ | — | | | $ | (18,340,423) | |
| | | | |
*OTC derivatives are reported gross on the Statement of Assets and Liabilities. Exchange traded options and margin related to cleared swaps and futures are excluded from these reported amounts.
**Reported collateral pledged within this table is limited to the net outstanding amount due from the Fund. The securities pledged as collateral by the Fund as reported on the Statements of Investments may exceed these amounts.
The following table presents the valuations of derivative instruments by risk exposure as reported within the Statement of Assets and Liabilities as of September 30, 2013:
| | | | | | | | | | | | |
| | | Asset Derivatives | | | Liability Derivatives | |
Derivatives Not Accounted for as Hedging Instruments | | Statement of Assets and Liabilities Location | | Value | | | Statement of Assets and Liabilities Location | | Value | |
| Credit contracts | | Swaps, at value | | $ | 5,261,353 | | | Swaps, at value | | $ | 3,850,243 | |
| Interest rate contracts | | Swaps, at value | | | 4,069,069 | | | Swaps, at value | | | 32,492,574 | |
| Interest rate contracts | | Variation margin receivable | | | 2,792,919 | * | | Variation margin payable | | | 22,541,414 | * |
| Foreign exchange contracts | | Unrealized appreciation on foreign currency exchange contracts | | | 175,667,582 | | | Unrealized depreciation on foreign currency exchange contracts | | | 148,001,812 | |
| Interest rate contracts | | | | | | | | Options written, at value | | | 752,445 | |
| Foreign exchange contracts | | | | | | | | Options written, at value | | | 76,210,763 | |
| Credit contracts | | | | | | | | Swaptions written, at value | | | 1,600,320 | |
| Interest rate contracts | | | | | | | | Swaptions written, at value | | | 153,823,810 | |
86 OPPENHEIMER INTERNATIONAL BOND FUND
6. Risk Exposures and the Use of Derivative Instrument (Continued)
| | | | | | | | | | | | | | |
| | | Asset Derivatives | | | Liability Derivatives | |
Derivatives Not Accounted for as Hedging Instruments | | Statement of Assets
and Liabilities
Location | | | Value | | | Statement of Assets
and Liabilities
Location | | Value | |
| Interest rate contracts | | | Investments, at value | | | $ | 64,909,371 | | | | | | | |
| Credit contracts | | | Investments, at value | | | | 571,245 ** | | | | | | | |
| Foreign exchange contracts | | | Investments, at value | | | | 79,556,233 ** | | | | | | | |
| | | | | | | | | | | | | | |
| Total | | | | | | $ | 332,827,772 | | | | | $ | 439,273,381 | |
| | | | | | | | | | | | | | |
*Includes only the current day’s variation margin. Prior variation margin movements have been reflected in cash on the Statement of Assets and Liabilities upon receipt or payment.
**Amounts relate to purchased option contracts and purchased swaption contracts.
The effect of derivative instruments on the Statement of Operations is as follows:
| | | | | | | | | | | | | | | | | | | | | | | | | | | | |
| Amount of Realized Gain or (Loss) Recognized on Derivatives | |
Derivatives Not Accounted for as Hedging Instruments | | Investments from unaffiliated
companies
(including
premiums on
options and
swaptions
exercised)* | | | Closing and
expiration of swaption
contracts
written | | | Closing and
expiration of
option
contracts
written | | | Closing
and
expiration
of futures
contracts | | | Foreign
currency
transactions | | | Swap
contracts | | | Total | |
Credit contracts | | $ | (8,559,331 | ) | | $ | 16,337,156 | | | $ | — | | | $ | — | | | $ | — | | | $ | (16,800,747 | ) | | $ | (9,022,922) | |
Foreign exchange contracts | | | (45,851,154 | ) | | | — | | | | 87,248,284 | | | | 2,594,162 | | | | 156,806,021 | | | | — | | | | 200,797,313 | |
Interest rate contracts | | | (33,069,426 | ) | | | 28,251,611 | | | | 15,114,568 | | | | 62,013,314 | | | | — | | | | (20,737,642 | ) | | | 51,572,425 | |
Volatility contracts | | | — | | | | — | | | | — | | | | 1,307,795 | | | | — | | | | (5,562,107 | ) | | | (4,254,312) | |
| | | | |
Total | | $ | (87,479,911 | ) | | $ | 44,588,767 | | | $ | 102,362,852 | | | $ | 65,915,271 | | | $ | 156,806,021 | | | $ | (43,100,496 | ) | | $ | 239,092,504 | |
| | | | |
*Includes purchased option contracts, purchased swaption contracts, written option contracts exercised and written swaption contracts exercised, if any.
| | | | | | | | | | | | | | | | | | | | | | | | | | | | |
| Amount of Change in Unrealized Gain or (Loss) Recognized on Derivatives | |
Derivatives Not Accounted for as Hedging Instruments | | Investments* | | | Swaption
contracts
written | | | Option
contracts
written | | | Futures
contracts | | | Translation
of assets and
liabilities
denominated
in foreign
Currency | | | Swap
contracts | | | Total | |
Credit contracts | | $ | (1,189,200) | | | $ | 1,533,993 | | | $ | — | | | $ | — | | | | $ — | | | | $ 2,027,004 | | | | $ 2,371,797 | |
Foreign exchange contracts | | | 23,538,317 | | | | — | | | | (5,283,756 | ) | | | (119,716 | ) | | | 65,222,581 | | | | — | | | | 83,357,426 | |
Interest rate contracts | | | 51,925,487 | | | | (56,643,193 | ) | | | 682,020 | | | | (16,742,557 | ) | | | — | | | | (39,505,226 | ) | | | (60,283,469 | ) |
Volatility contracts | | | — | | | | — | | | | — | | | | 42,221 | | | | — | | | | 39,986 | | | | 82,207 | |
| | | | |
Total | | | $74,274,604 | | | $ | (55,109,200) | | | $ | (4,601,736) | | | $ | (16,820,052) | | | | $65,222,581 | | | | $(37,438,236) | | | $ | 25,527,961 | |
| | | | |
*Includes purchased option contracts and purchased swaption contracts, if any.
87 OPPENHEIMER INTERNATIONAL BOND FUND
| | | | |
| | |
| | NOTESTO FINANCIAL STATEMENTS Continued | | |
7. Restricted Securities
As of September 30, 2013, investments in securities included issues that are restricted. A restricted security may have a contractual restriction on its resale and is valued under methods approved by the Board of Trustees as reflecting fair value. Securities that are restricted are marked with an applicable footnote on the Statement of Investments. Restricted securities are reported on a schedule following the Statement of Investments.
8. Pending Litigation
Since 2009, seven class action lawsuits have been pending in the U.S. District Court for the District of Colorado against OppenheimerFunds, Inc. (“OFI”), OppenheimerFunds Distributor, Inc., the Fund’s principal underwriter and distributor (the “Distributor”), and certain funds (but not including the Fund) advised by OFI Global Asset Management, Inc. and distributed by the Distributor (the “Defendant Funds”). The lawsuits also name as defendants certain officers and current and former trustees of the respective Defendant Funds. The lawsuits raise claims under federal securities law and allege, among other things, that the disclosure documents of the respective Defendant Funds contained misrepresentations and omissions and that the respective Defendant Funds’ investment policies were not followed. The plaintiffs in these actions seek unspecified damages, equitable relief and awards of attorneys’ fees and litigation expenses. The Defendant Funds’ Boards of Trustees have also engaged counsel to represent the Funds and the present and former Independent Trustees named in those suits. On August 26, 2013, the parties in six of these lawsuits executed a memorandum of understanding setting forth the terms of proposed settlements of those actions. The proposed settlements are subject to a variety of contingencies, including the execution of settlement agreements, which will require preliminary and final approval by the court. The proposed settlements do not resolve a seventh outstanding lawsuit relating to Oppenheimer California Municipal Fund.
Other class action and individual lawsuits have been filed since 2008 in various state and federal courts against OFI and certain of its affiliates by investors seeking to recover investments they allegedly lost as a result of the “Ponzi” scheme run by Bernard L. Madoff and his firm, Bernard L. Madoff Investment Securities, LLC (“BLMIS”). Plaintiffs in these suits allege that they suffered losses as a result of their investments in several funds managed by an affiliate of OFI and assert a variety of claims, including breach of fiduciary duty, fraud, negligent misrepresentation, unjust enrichment, and violation of federal and state securities laws and regulations, among others. They seek unspecified damages, equitable relief and awards of attorneys’ fees and litigation expenses. Neither the Distributor, nor any of the Oppenheimer mutual funds, their independent trustees or directors are named as defendants in these lawsuits. None of the Oppenheimer mutual funds invested in any funds or accounts managed by Madoff or BLMIS. On February 28, 2011, a stipulation of partial settlement of three groups of consolidated putative class action lawsuits relating to these matters was filed in the U.S. District Court for the Southern District of New York. On August 19, 2011, the court entered an order and final judgment approving the settlement as fair, reasonable and adequate. In September 2011, certain parties filed notices of appeal from the court’s order approving the settlement. The settlement does not resolve other outstanding lawsuits against OFI and its affiliates relating to BLMIS.
88 OPPENHEIMER INTERNATIONAL BOND FUND
8. Pending Litigation (Continued)
On April 16, 2010, a lawsuit was filed in New York state court against (i) OFI, (ii) an affiliate of OFI and (iii) AAArdvark IV Funding Limited (“AAArdvark IV”), an entity advised by OFI’s affiliate, in connection with investments made by the plaintiffs in AAArdvark IV. Plaintiffs allege breach of contract and common law fraud claims against the defendants and seek compensatory damages, costs and disbursements, including attorney fees. On April 11, 2013, the court granted defendants’ motion for summary judgment, dismissing plaintiffs’ fraud claim with prejudice and dismissing their contract claim without prejudice, and granted plaintiffs leave to replead their contract claim to assert a cause of action for specific performance within 30 days. On May 9, 2013, plaintiffs filed a notice of appeal from the court’s dismissal order. On July 15, 2011, a lawsuit was filed in New York state court against OFI, an affiliate of OFI and AAArdvark Funding Limited (“AAArdvark I”), an entity advised by OFI’s affiliate, in connection with investments made by the plaintiffs in AAArdvark I. The complaint alleges breach of contract and common law fraud claims against the defendants and seeks compensatory damages, costs and disbursements, including attorney fees. On November 9, 2011, a lawsuit was filed in New York state court against OFI, an affiliate of OFI and AAArdvark XS Funding Limited (“AAArdvark XS”), an entity advised by OFI’s affiliate, in connection with investments made by the plaintiffs in AAArdvark XS. The complaint alleges breach of contract against the defendants and seeks compensatory damages, costs and disbursements, including attorney fees.
OFI believes the lawsuits and appeals described above are without legal merit and, with the exception of actions it has settled, is defending against them vigorously. While it is premature to render any opinion as to the outcome in these lawsuits, or whether any costs that the Defendant Funds may bear in defending the suits might not be reimbursed by insurance, OFI believes that these suits should not impair the ability of OFI or the Distributor to perform their respective duties to the Fund, and that the outcome of all of the suits together should not have any material effect on the operations of any of the Oppenheimer mutual funds.
89 OPPENHEIMER INTERNATIONAL BOND FUND
| | | | |
| | |
| | REPORTOF INDEPENDENT REGISTERED PUBLIC ACCOUNTING FIRM | | |
The Board of Trustees and Shareholders of Oppenheimer International Bond Fund:
We have audited the accompanying statement of assets and liabilities of Oppenheimer International Bond Fund, including the statement of investments, as of September 30, 2013, and the related statement of operations for the year then ended, the statements of changes in net assets for each of the years in the two-year period then ended, and the financial highlights for each of the years or periods in the five-year period then ended. These financial statements and financial highlights are the responsibility of the Fund’s management. Our responsibility is to express an opinion on these financial statements and financial highlights based on our audits.
We conducted our audits in accordance with the standards of the Public Company Accounting Oversight Board (United States). Those standards require that we plan and perform the audit to obtain reasonable assurance about whether the financial statements and financial highlights are free of material misstatement. An audit includes examining, on a test basis, evidence supporting the amounts and disclosures in the financial statements. Our procedures included confirmation of securities owned as of September 30, 2013, by correspondence with the custodian, transfer agent and brokers, or by other appropriate auditing procedures where replies from brokers were not received. An audit also includes assessing the accounting principles used and significant estimates made by management, as well as evaluating the overall financial statement presentation. We believe that our audits provide a reasonable basis for our opinion.
In our opinion, the financial statements and financial highlights referred to above present fairly, in all material respects, the financial position of Oppenheimer International Bond Fund as of September 30, 2013, the results of its operations for the year then ended, the changes in its net assets for each of the years in the two-year period then ended, and the financial highlights for each of the years or periods in the five-year period then ended, in conformity with U.S. generally accepted accounting principles.
KPMGLLP
Denver, Colorado
November 26, 2013
90 OPPENHEIMER INTERNATIONAL BOND FUND
| | | | |
| | |
| | FEDERAL INCOME TAX INFORMATION Unaudited | | |
In early 2013, if applicable, shareholders of record received information regarding all dividends and distributions paid to them by the Fund during calendar year 2012.
Capital gain distributions of $0.04003 per share were paid to Class A, Class B, Class C, Class I, Class N and Class Y shareholders, respectively, on December 28, 2012. Whether received in stock or in cash, the capital gain distribution should be treated by shareholders as a gain from the sale of the capital assets held for more than one year (long-term capital gains).
None of the dividends paid by the Fund during the fiscal year ended September 30, 2013 are eligible for the corporate dividend-received deduction.
Dividends, if any, paid by the Fund during the fiscal year ended September 30, 2013 which are not designated as capital gain distributions, may be eligible for lower individual income tax rates to the extent that the Fund has received qualified dividend income as stipulated by recent tax legislation. In early 2013, shareholders of record received information regarding the percentage of distributions that are eligible for lower individual income tax rates. The amount will be the maximum amount allowed.
Recent tax legislation allows a regulated investment company to designate distributions not designated as capital gain distributions, as either interest related dividends or short-term capital gain dividends, both of which are exempt from the U.S. withholding tax applicable to non U.S. taxpayers. For the fiscal year ended September 30, 2013, the maximum amount allowable but not less than $14,414,478 of the ordinary distributions to be paid by the Fund qualifies as an interest related dividend and the maximum amount allowable but not less than $46,693,220 of the short-term capital gain distribution to be paid by the Fund qualifies as a short-term capital gain dividend.
Income Dividend Recharacterization
The Fund recharacterized a portion of its monthly income dividends to long-term capital gain distributions for tax purposes only. This recharacterization is necessary due to the treatment of foreign currency gains and losses for tax purposes. If you receive a Form 1099 from the Fund, this recharacterization will be reflected in the information reported to you on your Form 1099. If you do not receive a Form 1099, the information below will be necessary to appropriately characterize your distributions for tax purposes. See the following example for how to use the information below.
Example
Shareholder received $100 in dividends from the fund in September. Shareholder’s holding is in Class Y. Shareholder should multiply the $100 by 69.4429% (from below). The result will be $69.44 of long-term capital gain and $30.56 of ordinary dividends. The shareholder uses this new characterization for tax purposes.
91 OPPENHEIMER INTERNATIONAL BOND FUND
| | | | |
| | |
| | FEDERAL INCOME TAX INFORMATION Continued | | |
| | | | | | | | | | | | | | | | |
| CUSIP | | Class | | Ex-Date
3/28/2013 | | Ex-Date
4/30/2013 | | Ex-Date
5/31/2013 | | Ex-Date
6/28/2013 | | Ex-Date
7/31/2013 | | Ex-Date
8/30/2013 | | Ex-Date
9/30/2013 |
| | | | | | | | |
68380T608 | | Class I | | 53.9325% | | 71.0811% | | 68.6586% | | 68.4841% | | 68.9427% | | 67.8795% | | 64.7879% |
| | | | | | | | |
68380T509 | | Class Y | | 55.9462% | | 73.4888% | | 71.8415% | | 71.2869% | | 72.0158% | | 70.8459% | | 69.4429% |
| | | | | | | | |
68380T400 | | Class N | | 67.6315% | | 88.1679% | | 86.1577% | | 86.9335% | | 87.4564% | | 84.9673% | | 70.5368% |
| | | | | | | | |
68380T103 | | Class A | | 60.0234% | | 78.5164% | | 77.3564% | | 76.5214% | | 77.1568% | | 76.3306% | | 74.1908% |
| | | | | | | | |
68380T202 | | Class B | | 77.0973% | | 100.0000% | | 100.0000% | | 100.0000% | | 100.0000% | | 100.0000% | | 100.0000% |
| | | | | | | | |
68380T301 | | Class C | | 73.6528% | | 95.7659% | | 94.7849% | | 94.8104% | | 94.6271% | | 94.4515% | | 93.7638% |
If you have questions, please contact OppenheimerFunds at 1-800-225-5677.
The foregoing information is presented to assist shareholders in reporting distributions received from the Fund to the Internal Revenue Service. Because of the complexity of the federal regulations which may affect your individual tax return and the many variations in state and local tax regulations, we recommend that you consult your tax advisor for specific guidance.
92 OPPENHEIMER INTERNATIONAL BOND FUND
| | | | |
| | |
| | BOARD APPROVAL OF THE FUND’S INVESTMENT ADVISORY AGREEMENT Unaudited | | |
The Fund has entered into an investment advisory agreement with OFI Global Asset Management, Inc. (“OFI Global” or the “Adviser”), a wholly-owned subsidiary of OppenheimerFunds, Inc. (“OFI” or the “Sub-Adviser”) (“OFI Global” and “OFI” together the “Managers”) and OFI Global has entered into a sub-advisory agreement with OFI whereby OFI provides investment sub-advisory services to the Fund (collectively, the “Agreements”). Each year, the Board of Trustees (the “Board”), including a majority of the independent Trustees, is required to determine whether to renew the Agreements. The Investment Company Act of 1940, as amended, requires that the Board request and evaluate, and that the Managers provide, such information as may be reasonably necessary to evaluate the terms of the Agreements. The Board employs an independent consultant to prepare a report that provides information, including comparative information that the Board requests for that purpose. In addition to in-person meetings focused on this evaluation, the Board receives information throughout the year regarding Fund services, fees, expenses and performance.
The Adviser, Sub-Adviser and the independent consultant provided information to the Board on the following factors: (i) the nature, quality and extent of the Managers’ services, (ii) the investment performance of the Fund and the Managers, (iii) the fees and expenses of the Fund, including comparative expense information, (iv) the profitability of the Managers and their affiliates, including an analysis of the cost of providing services, (v) whether economies of scale are realized as the Fund grows and whether fee levels reflect these economies of scale for Fund investors and (vi) other benefits to the Managers from their relationship with the Fund. The Board was aware that there are alternatives to retaining the Managers.
Outlined below is a summary of the principal information considered by the Board as well as the Board’s conclusions.
Nature, Quality and Extent of Services. The Board considered information about the nature, quality and extent of the services provided to the Fund and information regarding the Managers’ key personnel who provide such services. The Sub-Adviser’s duties include providing the Fund with the services of the portfolio managers and the Sub-Adviser’s investment team, who provide research, analysis and other advisory services in regard to the Fund’s investments; securities trading services; oversight of third-party service providers; monitoring compliance with applicable Fund policies and procedures and adherence to the Fund’s investment restrictions; and risk management. The Managers are responsible for providing certain administrative services to the Fund as well. Those services include providing and supervising all administrative and clerical personnel who are necessary in order to provide effective corporate administration for the Fund; compiling and maintaining records with respect to the Fund’s operations; preparing and filing reports required by the Securities and Exchange Commission; preparing periodic reports regarding the operations of the Fund for its shareholders; preparing proxy materials for shareholder meetings; and preparing the registration statements required by Federal and state securities laws for the sale of the Fund’s shares. The Managers also provide the Fund with office space, facilities and equipment.
The Board also considered the quality of the services provided and the quality of the Managers’ resources that are available to the Fund. The Board took account of the fact that the Sub-Adviser has had over fifty years of experience as an investment adviser and that its assets under management rank it among the top mutual fund managers in the United States. The Board evaluated the Sub-Adviser’s advisory, administrative, accounting, legal, compliance
93 OPPENHEIMER INTERNATIONAL BOND FUND
| | | | |
| | |
| | BOARD APPROVAL OF THE FUND’S INVESTMENT ADVISORY AGREEMENT Unaudited / Continued | | |
services and risk management, and information the Board has received regarding the experience and professional qualifications of the Managers’ key personnel and the size and functions of its staff. In its evaluation of the quality of the portfolio management services provided, the Board considered the experience of Arthur Steinmetz, Sara Zervos and Hemant Baijal, the portfolio managers for the Fund, and the Sub-Adviser’s investment team and analysts. The Board members also considered the totality of their experiences with the Managers as directors or trustees of the Fund and other funds advised by the Managers. The Board considered information regarding the quality of services provided by affiliates of the Managers, which its members have become knowledgeable about in connection with the renewal of the Fund’s service agreements. The Board concluded, in light of the Managers’ experience, reputation, personnel, operations and resources that the Fund benefits from the services provided under the Agreement.
Investment Performance of the Fund, the Adviser and the Sub-Adviser. Throughout the year, the Adviser and the Sub-Adviser provided information on the investment performance of the Fund, the Adviser and the Sub-Adviser, including comparative performance information. The Board also reviewed information, prepared by the Adviser, the Sub-Adviser and the independent consultant, comparing the Fund’s historical performance to its benchmark and to the performance of other retail world bond funds. The Board considered that the Fund outperformed its performance category median for the one-, three-, five-, and ten-year periods. The Board also noted that the Fund performed in the first quintile of its performance category for the one- and ten-year periods.
Costs of Services by the Adviser. The Board reviewed the fees paid to the Adviser and the other expenses borne by the Fund. The Board also considered the comparability of the fees charged and the services provided to the Fund to the fees and services for other clients or accounts advised by the Adviser. The independent consultant provided comparative data in regard to the fees and expenses of the Fund and other retail front-end load world bond funds with comparable asset levels and distribution features. The Board noted that the Fund’s contractual management fees and total expenses were lower than its respective peer group median and category median. Within the total asset range of $5 billion to $10 billion, the Fund’s effective rate was lower than its peer group median and category median.
Economies of Scale and Profits Realized by the Adviser and Sub-Adviser. The Board considered information regarding the Managers’ costs in serving as the Fund’s investment adviser and sub-adviser, including the costs associated with the personnel and systems necessary to manage the Fund, and information regarding the Managers’ profitability from their relationship with the Fund. The Board reviewed whether the Managers may realize economies of scale in managing and supporting the Fund. The Board noted that the Fund currently has management fee breakpoints, which are intended to share with Fund shareholders economies of scale that may exist as the Fund’s assets grow.
Other Benefits to the Managers. In addition to considering the profits realized by the Managers, the Board considered information that was provided regarding the direct and indirect benefits the Managers receive as a result of their relationship with the Fund, including compensation paid to the Managers’ affiliates. The Board also considered that the Managers must be able to pay and retain experienced professional personnel at competitive rates to provide quality services to the Fund.
94 OPPENHEIMER INTERNATIONAL BOND FUND
Conclusions. These factors were also considered by the independent Trustees meeting separately from the full Board, assisted by experienced counsel to the Fund and to the independent Trustees. Fund counsel and the independent Trustees’ counsel are independent of the Managers within the meaning and intent of the Securities and Exchange Commission Rules.
Based on its review of the information it received and its evaluations described above, the Board, including a majority of the independent Trustees, decided to continue the Agreements through September 30, 2014. In arriving at its decision, the Board did not identify any factor or factors as being more important than others, but considered all of the above information, and considered the terms and conditions of the Agreements, including the management fees, in light of all the surrounding circumstances.
95 OPPENHEIMER INTERNATIONAL BOND FUND
| | | | |
| | |
| | PORTFOLIO PROXY VOTING POLICIESAND PROCEDURES; UPDATES TO STATEMENTS OF INVESTMENTS Unaudited | | |
The Fund has adopted Portfolio Proxy Voting Policies and Procedures under which the Fund votes proxies relating to securities (“portfolio proxies”) held by the Fund. A description of the Fund’s Portfolio Proxy Voting Policies and Procedures is available (i) without charge, upon request, by calling the Fund toll-free at 1.800.CALL OPP (225.5677), (ii) on the Fund’s website at oppenheimerfunds.com, and (iii) on the SEC’s website at www.sec.gov. In addition, the Fund is required to file Form N-PX, with its complete proxy voting record for the 12 months ended June 30th, no later than August 31st of each year. The Fund’s voting record is available (i) without charge, upon request, by calling the Fund toll-free at 1.800.CALL OPP (225.5677), and (ii) in the Form N-PX filing on the SEC’s website at www.sec.gov.
The Fund files its complete schedule of portfolio holdings with the SEC for the first quarter and the third quarter of each fiscal year on Form N-Q. The Fund’s Form N-Q filings are available on the SEC’s website at www.sec.gov. Those forms may be reviewed and copied at the SEC’s Public Reference Room in Washington, D.C. Information on the operation of the Public Reference Room may be obtained by calling 1-800-SEC-0330.
Householding—Delivery of Shareholder Documents
This is to inform you about OppenheimerFunds’ “householding” policy. If more than one member of your household maintains an account in a particular fund, OppenheimerFunds will mail only one copy of the fund’s prospectus (or, if available, the fund’s summary prospectus), annual and semiannual report and privacy policy. The consolidation of these mailings, called householding, benefits your fund through reduced mailing expense, and benefits you by reducing the volume of mail you receive from OppenheimerFunds. Householding does not affect the delivery of your account statements.
Please note that we will continue to household these mailings for as long as you remain an OppenheimerFunds shareholder, unless you request otherwise. If you prefer to receive multiple copies of these materials, please call us at 1.800.CALL-OPP (225-5677). You may also notify us in writing or via email. We will begin sending you individual copies of the prospectus (or, if available, the summary prospectus), reports and privacy policy within 30 days of receiving your request to stop householding.
96 OPPENHEIMER INTERNATIONAL BOND FUND
| | | | |
| | |
| | TRUSTEES AND OFFICERS unaudited | | |
| | |
Name, Position(s) Held with the Fund, Length of Service, Year of Birth | | Principal Occupation(s) During the Past 5 Years; Other Trusteeships/Directorships Held; Number of Portfolios in the Fund Complex Currently Overseen |
| |
INDEPENDENT TRUSTEES | | The address of each Trustee in the chart below is 6803 S. Tucson Way, Centennial, Colorado 80112-3924. Each Trustee serves for an indefinite term, or until his or her resignation, retirement, death or removal. |
| |
Sam Freedman, Chairman of the Board of Trustees (since 2012) and Trustee (since 1996) Year of Birth: 1940 | | Director of Colorado UpLIFT (charitable organization) (since September 1984). Mr. Freedman held several positions with the Sub-Adviser and with subsidiary or affiliated companies of the Sub-Adviser (until October 1994). Oversees 38 portfolios in the OppenheimerFunds complex. Mr. Freedman has served on the Boards of certain Oppenheimer funds since 1996, during which time he has become familiar with the Fund’s (and other Oppenheimer funds’) financial, accounting, regulatory and investment matters and has contributed to the Boards’ deliberations. |
| |
Edward L. Cameron, Trustee (since 1999) Year of Birth: 1938 | | Member of The Life Guard of Mount Vernon (George Washington historical site) (June 2000-June 2006); Partner of PricewaterhouseCoopers LLP (accounting firm) (July 1974-June 1999); Chairman of Price Waterhouse LLP Global Investment Management Industry Services Group (accounting firm) (July 1994-June 1998). Oversees 38 portfolios in the OppenheimerFunds complex. Mr. Cameron has served on the Boards of certain Oppenheimer funds since 1999, during which time he has become familiar with the Fund’s (and other Oppenheimer funds’) financial, accounting, regulatory and investment matters and has contributed to the Boards’ deliberations. |
| |
Jon S. Fossel, Trustee (since 1995) Year of Birth: 1942 | | Chairman of the Board (2006-December 2011) and Director (June 2002-December 2011) of UNUMProvident (insurance company); Director of Northwestern Energy Corp. (public utility corporation) (November 2004-December 2009); Director of P.R. Pharmaceuticals (October 1999-October 2003); Director of Rocky Mountain Elk Foundation (non-profit organization) (February 1998-February 2003 and February 2005-February 2007); Chairman and Director (until October 1996) and President and Chief Executive Officer (until October 1995) of the Sub-Adviser; President, Chief Executive Officer and Director of the following: Oppenheimer Acquisition Corp. (“OAC”) (parent holding company of the Sub-Adviser), Shareholders Services, Inc. and Shareholder Financial Services, Inc. (until October 1995). Oversees 38 portfolios in the OppenheimerFunds complex. Mr. Fossel has served on the Boards of certain Oppenheimer funds since 1990, during which time he has become familiar with the Fund’s (and other Oppenheimer funds’) financial, accounting, regulatory and investment matters and has contributed to the Boards’ deliberations. |
| |
Richard F. Grabish, Trustee (since 2012) Year of Birth: 1948 | | Formerly Senior Vice President and Assistant Director of Sales and Marketing (March 1997-December 2007), Director (March 1987-December 2007) and Manager of Private Client Services (June 1985-June 2005) of A.G. Edwards & Sons, Inc. (broker/dealer and investment firm); Chairman and Chief Executive Officer of A.G. Edwards Trust Company, FSB (March 2001-December 2007); President and Vice Chairman of A.G. Edwards Trust Company, FSB (investment adviser) (April 1987-March 2001); President of A.G. Edwards Trust Company, FSB (investment adviser) (June 2005-December 2007). Oversees 38 portfolios in the OppenheimerFunds complex. Mr. Grabish has served on the Boards of certain Oppenheimer funds since 2001, during which time he has become familiar with the Fund’s (and other Oppenheimer funds’) financial, accounting, regulatory and investment matters and has contributed to the Boards’ deliberations. |
97 OPPENHEIMER INTERNATIONAL BOND FUND
| | | | |
| | |
| | TRUSTEES AND OFFICERS unaudited / Continued | | |
| | |
Beverly L. Hamilton, Trustee (since 2002) Year of Birth: 1946 | | Trustee of Monterey Institute for International Studies (educational organization) (since February 2000); Board Member of Middlebury College (educational organization) (December 2005-June 2011); Chairman (since 2010) of American Funds’ Emerging Markets Growth Fund, Inc. (mutual fund); Director of The California Endowment (philanthropic organization) (April 2002-April 2008); Director (February 2002-2005) and Chairman of Trustees (2006-2007) of the Community Hospital of Monterey Peninsula; Director (October 1991-2005); Vice Chairman (2006-2009) of American Funds’ Emerging Markets Growth Fund, Inc. (mutual fund); President of ARCO Investment Management Company (February 1991-April 2000); Member of the investment committees of The Rockefeller Foundation (2001-2006) and The University of Michigan (since 2000); Advisor at Credit Suisse First Boston’s Sprout venture capital unit (venture capital fund) (1994-January 2005); Trustee of MassMutual Institutional Funds (investment company) (1996-June 2004); Trustee of MML Series Investment Fund (investment company) (April 1989-June 2004); Member of the investment committee of Hartford Hospital (2000-2003); and Advisor to Unilever (Holland) pension fund (2000-2003). Oversees 38 portfolios in the OppenheimerFunds complex. Ms. Hamilton has served on the Boards of certain Oppenheimer funds since 2002, during which time she has become familiar with the Fund’s (and other Oppenheimer funds’) financial, accounting, regulatory and investment matters and has contributed to the Boards’ deliberations. |
| |
Victoria J. Herget, Trustee (since 2012) Year of Birth:1951 | | Independent Director of the First American Funds (mutual fund family) (2003-2011); former Managing Director (1993-2001), Principal (1985-1993), Vice President (1978-1985) and Assistant Vice President (1973-1978) of Zurich Scudder Investments (and its predecessor firms); Board Chair (2008-Present) and Director (2004-Present), United Educators (insurance company); Trustee (1992-2007), Chair of the Board of Trustees (1999-2007), Investment Committee Chair (1994-1999) and Investment Committee member (2007-2010) of Wellesley College; Trustee (since 2000) and Chair (since 2010), Newberry Library; Trustee, Mather LifeWays (since 2001); Trustee, BoardSource (2006-2009) and Chicago City Day School (1994-2005). Oversees 38 portfolios in the OppenheimerFunds complex. Ms. Herget has served on the Boards of certain Oppenheimer funds since 2012, during which time she has become familiar with the Fund’s (and other Oppenheimer funds’) financial, accounting, regulatory and investment matters and has contributed to the Boards’ deliberations. |
| |
Robert J. Malone, Trustee (since 2002) Year of Birth: 1944 | | Chairman of the Board (since 2012) and Director (since August 2005) of Jones International University (educational organization) (since August 2005); Chairman, Chief Executive Officer and Director of Steele Street Bank Trust (commercial banking) (since August 2003); Trustee of the Gallagher Family Foundation (non-profit organization) (since 2000); Board of Directors of Opera Colorado Foundation (non-profit organization) (2008-2012); Director of Colorado UpLIFT (charitable organization) (1986-2010); Director of Jones Knowledge, Inc. (2006-2010); Former Chairman of U.S. Bank-Colorado (subsidiary of U.S. Bancorp and formerly Colorado National Bank) (July 1996-April 1999); Director of Commercial Assets, Inc. (real estate investment trust) (1993-2000); Director of U.S. Exploration, Inc. (oil and gas exploration) (1997-February 2004); Chairman of the Board (1991-1994) and Trustee (1985-1994) of Regis University; and Chairman of the Board (1990-1991 and Trustee (1984-1999) of Young Presidents Organization. Oversees 38 portfolios in the OppenheimerFunds complex. Mr. Malone has served on the Boards of certain Oppenheimer funds since 2002, during which time he has become familiar with the Fund’s (and other Oppenheimer funds’) financial, accounting, regulatory and investment matters and has contributed to the Boards’ deliberations. |
98 OPPENHEIMER INTERNATIONAL BOND FUND
| | |
F. William Marshall, Jr., Trustee (since 2000) Year of Birth: 1942 | | Trustee Emeritus of Worcester Polytech Institute (WPI) (private university) (since 2009); Trustee of MassMutual Select Funds (formerly MassMutual Institutional Funds) (investment company) (since 1996), MML Series Investment Fund (investment company) (since 1996) and Mass Mutual Premier Funds (investment company) (since January 2012); President and Treasurer of the SIS Fund (private charitable fund) (January 1999 – March 2011); Former Trustee of WPI (1985-2008); Former Chairman of the Board (2004-2006) and Former Chairman of the Investment Committee of WPI (1994-2008); Chairman of SIS & Family Bank, F.S.B. (formerly SIS Bank) (commercial bank) (January 1999-July 1999); Executive Vice President of Peoples Heritage Financial Group, Inc. (commercial bank) (January 1999-July 1999); and Former President and Chief Executive Officer of SIS Bancorp. (1993-1999). Oversees 42 portfolios in the OppenheimerFunds complex. Mr. Marshall has served on the Boards of certain Oppenheimer funds since 2000, during which time he has become familiar with the Fund’s (and other Oppenheimer funds’) financial, accounting, regulatory and investment matters and has contributed to the Boards’ deliberations. |
| |
Karen L. Stuckey, Trustee (since 2012) Year of Birth: 1953 | | Partner (1990-2012) of PricewaterhouseCoopers LLP (held various positions 1975-1990); Emeritus Trustee (since 2006), Trustee (1992-2006) and member of Executive, Nominating and Audit Committees and Chair of Finance Committee of Lehigh University; and member, Women’s Investment Management Forum since inception. Oversees 38 portfolios in the OppenheimerFunds complex. Ms. Stuckey has served on the Boards of certain Oppenheimer funds since 2012, during which time she has become familiar with the Fund’s (and other Oppenheimer funds’) financial, accounting, regulatory and investment matters and has contributed to the Boards’ deliberations. |
| |
James D. Vaughn, Trustee (since 2012) Year of Birth:1945 | | Retired; former managing partner (1994-2001) of Denver office of Deloitte & Touche LLP, (held various positions 1969-1993); Trustee and Chairman of the Audit Committee of Schroder Funds (2003-2012); Board member and Chairman of Audit Committee of AMG National Trust Bank (since 2005); Trustee and Investment Committee member, University of South Dakota Foundation (since 1996); Board member, Audit Committee Member and past Board Chair, Junior Achievement (since 1993); former Board member, Mile High United Way, Boys and Girls Clubs, Boy Scouts, Colorado Business Committee for the Arts, Economic Club of Colorado and Metro Denver Network. Oversees 38 portfolios in the OppenheimerFunds complex. Mr. Vaughn has served on the Boards of certain Oppenheimer funds since 2012, during which time he has become familiar with the Fund’s (and other Oppenheimer funds’) financial, accounting, regulatory and investment matters and has contributed to the Boards’ deliberations. |
| | |
INTERESTED TRUSTEE AND OFFICER | | Mr. Glavin is an “Interested Trustee” because he is affiliated with the Manager and the Sub-Adviser by virtue of his positions as an officer and director of the Manager and a director of the Sub-Adviser, and as a shareholder of the Sub-Adviser’s parent company. Both as a Trustee and as an officer, he serves for an indefinite term, or until his resignation, retirement, death or removal. Mr. Glavin’s address is Two World Financial Center, 225 Liberty Street, 11th Floor, New York, New York 10281-1008. |
| |
William F. Glavin, Jr., Trustee, President and Principal Executive Officer (since 2009) Year of Birth: 1958 | | Director, Chairman and Chief Executive Officer of the Manager (since January 2013); President of the Manager (January 2013-May 2013); Chairman of the Sub-Adviser (December 2009-December 2012); Chief Executive Officer (January 2009-December 2012) and Director of the Sub-Adviser (since January 2009); President of the Sub-Adviser (May 2009-December 2012); Management Director (since June 2009), President (since December 2009) and Chief Executive Officer (since January 2011) of Oppenheimer Acquisition Corp. (“OAC”) (the Sub-Adviser’s parent holding company); Director of Oppenheimer Real Asset Management, Inc. (since March |
99 OPPENHEIMER INTERNATIONAL BOND FUND
| | | | |
| | |
| | TRUSTEES AND OFFICERS Unaudited / Continued | | |
| | |
William F. Glavin, Jr., Continued | | 2010); Executive Vice President (March 2006-February 2009) and Chief Operating Officer (July 2007-February 2009) of Massachusetts Mutual Life Insurance Company (OAC’s parent company); Director (May 2004-March 2006) and Chief Operating Officer and Chief Compliance Officer (May 2004-January 2005), President (January 2005-March 2006) and Chief Executive Officer (June 2005-March 2006) of Babson Capital Management LLC; Director (March 2005-March 2006), President (May 2003-March 2006) and Chief Compliance Officer (July 2005-March 2006) of Babson Capital Securities, Inc. (a broker-dealer); President (May 2003-March 2006) of Babson Investment Company, Inc.; Director (May 2004-August 2006) of Babson Capital Europe Limited; Director (May 2004-October 2006) of Babson Capital Guernsey Limited; Director (May 2004-March 2006) of Babson Capital Management LLC; Non-Executive Director (March 2005-March 2007) of Baring Asset Management Limited; Director (February 2005-June 2006) Baring Pension Trustees Limited; Director and Treasurer (December 2003-November 2006) of Charter Oak Capital Management, Inc.; Director (May 2006-September 2006) of C.M. Benefit Insurance Company; Director (May 2008-June 2009) and Executive Vice President (June 2007-July 2009) of C.M. Life Insurance Company; President (March 2006-May 2007) of MassMutual Assignment Company; Director (January 2005-December 2006), Deputy Chairman (March 2005-December 2006) and President (February 2005-March 2005) of MassMutual Holdings (Bermuda) Limited; Director (May 2008-June 2009) and Executive Vice President (June 2007-July 2009) of MML Bay State Life Insurance Company; Chief Executive Officer and President (April 2007-January 2009) of MML Distributors, LLC; and Chairman (March 2006-December 2008) and Chief Executive Officer (May 2007-December 2008) of MML Investors Services, Inc. An officer of 89 portfolios in the OppenheimerFunds complex. |
| | |
OTHER OFFICERS OF THE FUND | | The addresses of the Officers in the chart below are as follows: for Messrs. Steinmetz, Baijal, Gabinet and Mss. Zervos and Nasta, Two World Financial Center, 225 Liberty Street, New York, New York 10281-1008, for Messrs. Vandehey and Wixted, 6803 S. Tucson Way, Centennial, Colorado 80112-3924. Each Officer serves for an indefinite term or until his or her resignation, retirement, death or removal. |
| |
Arthur P. Steinmetz, Vice President (since 2004) Year of Birth: 1958 | | President of the Manager (since May 2013); Chief Investment Officer of the OppenheimerFunds advisory entities (since January 2013); Director of the Manager (since January 2013); President and Director of OFI SteelPath, Inc. (since January 2013); Executive Vice President of the Manager (January 2013-May 2013); Chief Investment Officer of the Sub-Adviser (October 2010-December 2012); Chief Investment Officer, Fixed-Income, of the Sub-Adviser (April 2009-October 2010); Executive Vice President of the Sub-Adviser (October 2009-December 2012); Director of Fixed Income of the Sub-Adviser (January 2009-April 2009); and a Senior Vice President of the Sub-Adviser (March 1993-September 2009). A portfolio manager and an officer of other portfolios in the OppenheimerFunds complex. |
| |
Sara J. Zervos, Ph.D. Vice President (since 2009) Year of Birth: 1969 | | Senior Vice President of the Sub-Adviser (since January 2011); Head of the Global Debt Team (since October 2010) and is the team’s Director of International Research; Vice President of the Sub-Adviser (April 2008-December 2010). Portfolio manager with Sailfish Capital Management (May 2007-February 2008) and a portfolio manager for emerging market debt at Dillon Read Capital Management and OTA Asset Management (June 2004-April 2007). A portfolio manager and an officer of other portfolios in the OppenheimerFunds complex. |
100 OPPENHEIMER INTERNATIONAL BOND FUND
| | |
Hemant Baijal Vice President (since 2013) Year of Birth: 1962 | | Vice President and Senior Portfolio Manager of the Sub-Adviser (since July 2011). Co-founder, Partner and Portfolio Manager of Six Seasons Global Asset Management (January 2009-December 2010). Partner and Portfolio Manager of Aravali Partners, LLC (September 2006-December 2008); Partner and Portfolio Manager at Havell Capital Management, LLC (November 1996-August 2006). A portfolio manager and an officer in the OppenheimerFunds complex. |
| |
Arthur S. Gabinet, Secretary and Chief Legal Officer (since 2011) Year of Birth: 1958 | | Executive Vice President, Secretary and General Counsel of the Manager (since January 2013); General Counsel OFI SteelPath, Inc. (since January 2013); Executive Vice President (May 2010-December 2012) and General Counsel (since January 2011) of the Sub-Adviser; General Counsel of the Distributor (since January 2011); General Counsel of Centennial Asset Management Corporation (January 2011-December 2012); Executive Vice President (January 2011-December 2012) and General Counsel of HarbourView Asset Management Corporation (since January 2011); Assistant Secretary (since January 2011) and Director (since January 2011) of OppenheimerFunds International Ltd. and OppenheimerFunds plc; Director of Oppenheimer Real Asset Management, Inc. (January 2011-December 2012) and General Counsel (since January 2011); Executive Vice President (January 2011-December 2011) and General Counsel of Shareholder Financial Services, Inc. and Shareholder Services, Inc. (since January 2011); Executive Vice President (January 2011-December 2012) and General Counsel of OFI Private Investments Inc. (since January 2011); Vice President of OppenheimerFunds Legacy Program (January 2011-December 2011); Executive Vice President (January 2011-December 2012) and General Counsel of OFI Global Institutional, Inc. (since January 2011); General Counsel, Asset Management of the Sub-Adviser (May 2010-December 2010); Principal, The Vanguard Group (November 2005-April 2010); District Administrator, U.S. Securities and Exchange Commission (January 2003-October 2005). An officer of 89 portfolios in the OppenheimerFunds complex. |
| |
Christina M. Nasta, Vice President and Chief Business Officer (since 2011) Year of Birth: 1973 | | Senior Vice President of OppenheimerFunds Distributor, Inc. (since January 2013); Senior Vice President of the Sub-Adviser (July 2010-December 2012); Vice President of the Sub-Adviser (January 2003-July 2010); Vice President of OppenheimerFunds Distributor, Inc. (January 2003-July 2010). An officer of 89 portfolios in the OppenheimerFunds complex. |
| |
Mark S. Vandehey, Vice President and Chief Compliance Officer (since 2004) Year of Birth: 1950 | | Senior Vice President and Chief Compliance Officer of the Manager (since January 2013); Chief Compliance Officer of OFI SteelPath, Inc. (since January 2013); Senior Vice President of the Sub-Adviser (March 2004-December 2012); Chief Compliance Officer of the Sub-Adviser, OppenheimerFunds Distributor, Inc., OFI Global Trust Company, OFI Global Institutional, Inc., Oppenheimer Real Asset Management, Inc., OFI Private Investments, Inc., Harborview Asset Management Corporation, Trinity Investment Management Corporation, and Shareholder Services, Inc. (since March 2004); Vice President of OppenheimerFunds Distributor, Inc., Centennial Asset Management Corporation and Shareholder Services, Inc. (June 1983-December 2012). An officer of 89 portfolios in the OppenheimerFunds complex. |
| |
Brian W. Wixted, Treasurer and Principal Financial & Accounting Officer (since 1999) Year of Birth: 1959 | | Senior Vice President of the Manager (since January 2013); Treasurer of the Sub-Adviser, HarbourView Asset Management Corporation, Shareholder Financial Services, Inc., Shareholder Services, Inc., and Oppenheimer Real Asset Management, Inc. (March 1999-June 2008), OFI Private Investments, Inc. (March 2000-June 2008), OppenheimerFunds International Ltd. and OppenheimerFunds plc (since May 2000), OFI Global Institutional, Inc. (November 2000-June 2008), and OppenheimerFunds Legacy Program (charitable trust program established by the Sub-Adviser) (June 2003-December 2011); Treasurer and Chief Financial Officer of OFI Global Trust |
101 OPPENHEIMER INTERNATIONAL BOND FUND
| | | | |
| | |
| | TRUSTEES AND OFFICERS unaudited / Continued | | |
| | |
Brian W. Wixted, Continurd | | Company (since May 2000); Assistant Treasurer of Oppenheimer Acquisition Corporation (March 1999-June 2008). An officer of 89 portfolios in the OppenheimerFunds complex. |
The Fund’s Statement of Additional Information contains additional information about the Fund’s Trustees and Officers and is available without charge, upon request, by calling 1.800.CALL OPP (225.5677).
102 OPPENHEIMER INTERNATIONAL BOND FUND
| | | | |
| | |
| | OPPENHEIMER INTERNATIONAL BOND FUND | | |
| | |
| Manager | | OFI Global Asset Management, Inc. |
| |
| Sub-Adviser | | OppenheimerFunds, Inc. |
| |
| Distributor | | OppenheimerFunds Distributor, Inc. |
| |
| Transfer and Shareholder Servicing Agent | | OFI Global Asset Management, Inc. |
| |
| Sub-Transfer Agent | | Shareholder Services, Inc. |
| | DBA OppenheimerFunds Services |
| |
| Independent Registered Public Accounting Firm | | KPMG LLP |
| |
| Counsel | | K&L Gates LLP |
© 2013 OppenheimerFunds, Inc. All rights reserved.
103 OPPENHEIMER INTERNATIONAL BOND FUND
As an Oppenheimer fund shareholder, you are entitled to know how we protect your personal information and how we limit its disclosure.
Information Sources
We obtain nonpublic personal information about our shareholders from the following sources:
— Applications or other forms
— When you create a user ID and password for online account access
— When you enroll in eDocs Direct, our electronic document delivery service
— Your transactions with us, our affiliates or others
— A software program on our website, often referred to as a “cookie,” which indicates which parts of our site you’ve visited
— When you set up challenge questions to reset your password online
If you visit oppenheimerfunds.com and do not log on to the secure account information areas, we do not obtain any personal information about you. When you do log on to a secure area, we do obtain your user ID and password to identify you. We also use this information to provide you with products and services you have requested, to inform you about products and services that you may be interested in and assist you in other ways.
We do not collect personal information through our website unless you willingly provide it to us, either directly by email or in those areas of the website that request information. In order to update your personal information (including your mailing address, email address and phone number) you must first log on and visit your user profile.
If you have set your browser to warn you before accepting cookies, you will receive the warning message with each cookie. You can refuse cookies by turning them off in your browser. However, doing so may limit your access to certain sections of our website.
We use cookies to help us improve and manage our website. For example, cookies help us recognize new versus repeat visitors to the site, track the pages visited, and enable some special features on the website. This data helps us provide a better service for our website visitors.
Protection of Information
We do not disclose any non-public personal information (such as names on a customer list) about current or former customers to anyone, except as permitted by law.
Disclosure of Information
We send your financial advisor (as designated by you) copies of confirmations, account statements and other documents reporting activity in your fund accounts. We may also use details about you and your investments to help us, our financial service affiliates, or firms that jointly market their financial products and services with ours, to better serve your investment needs or suggest financial services or educational material that may be of interest to you. If this requires us to provide you with an opportunity to “opt in” or “opt out” of such information sharing with a firm not affiliated with us, you will receive notification on how to do so, before any such sharing takes place.
Right of Refusal
We will not disclose your personal information to unaffiliated third parties (except as permitted by law), unless we first offer you a reasonable opportunity to refuse or “opt out” of such disclosure.
104 OPPENHEIMER INTERNATIONAL BOND FUND
Internet Security and Encryption
In general, the email services provided by our website are encrypted and provide a secure and private means of communication with us. To protect your own privacy, confidential and/or personal information should only be communicated via email when you are advised that you are using a secure website.
As a security measure, we do not include personal or account information in non-secure emails, and we advise you not to send such information to us in non-secure emails. Instead, you may take advantage of the secure features of our website to encrypt your email correspondence. To do this, you will need to use a browser that supports Secure Sockets Layer (SSL) protocol.
We do not guarantee or warrant that any part of our website, including files available for download, are free of viruses or other harmful code. It is your responsibility to take appropriate precautions, such as use of an anti-virus software package, to protect your computer hardware and software.
| | — | | All transactions, including redemptions, exchanges and purchases, are secured by SSL and 128-bit encryption. SSL is used to establish a secure connection between your PC and OppenheimerFunds’ server. It transmits information in an encrypted and scrambled format. |
| | — | | Encryption is achieved through an electronic scrambling technology that uses a “key” to code and then decode the data. Encryption acts like the cable converter box you may have on your television set. It scrambles data with a secret code so that no one can make sense of it while it is being transmitted. When the data reaches its destination, the same software unscrambles the data. |
| | — | | You can exit the secure area by either closing your browser, or for added security, you can use the Log Out button before you close your browser. |
Other Security Measures
We maintain physical, electronic and procedural safeguards to protect your personal account information. Our employees and agents have access to that information only so that they may offer you products or provide services, for example, when responding to your account questions.
How You Can Help
You can also do your part to keep your account information private and to prevent unauthorized transactions. If you obtain a user ID and password for your account, do not allow it to be used by anyone else. Also, take special precautions when accessing your account on a computer used by others.
Who We Are
This joint notice describes the privacy policies of the Oppenheimer funds, OppenheimerFunds, Inc., and each of its financial institution subsidiaries, the trustee of OppenheimerFunds Individual Retirement Accounts (IRAs) and the custodian of the OppenheimerFunds 403(b)(7) tax sheltered custodial accounts. It applies to all Oppenheimer fund accounts you presently have, or may open in the future, using your Social Security number—whether or not you remain a shareholder of our funds. This notice was last updated November 2012. In the event it is updated or changed, we will post an updated notice on our website at oppenheimerfunds.com. If you have any questions about these privacy policies, write to us at P.O. Box 5270, Denver, CO 80217-5270, email us by clicking on the Contact Us section of our website at oppenheimerfunds.com or call us at 1.800.CALL OPP (225.5677).
105 OPPENHEIMER INTERNATIONAL BOND FUND
THIS PAGE INTENTIONALLY LEFT BLANK.
106 OPPENHEIMER INTERNATIONAL BOND FUND
107 OPPENHEIMER INTERNATIONAL BOND FUND
THIS PAGE INTENTIONALLY LEFT BLANK.
108 OPPENHEIMER INTERNATIONAL BOND FUND
THIS PAGE INTENTIONALLY LEFT BLANK.
109 OPPENHEIMER INTERNATIONAL BOND FUND
THIS PAGE INTENTIONALLY LEFT BLANK.
110 OPPENHEIMER INTERNATIONAL BOND FUND
THIS PAGE INTENTIONALLY LEFT BLANK.
111 OPPENHEIMER INTERNATIONAL BOND FUND

Visit us at oppenheimerfunds.com for 24-hr access to account information and transactions or call us at 1.800.CALL OPP (1.800.225.5677) for 24-hr automated information and automated transactions. Representatives also available Mon-Fri 8am-8pm ET. Oppenheimer funds are distributed by OppenheimerFunds Distributor, Inc. 1261921 RA0815.001.0813 October 22, 2013
Item 2. Code of Ethics.
The registrant has adopted a code of ethics that applies to the registrant’s principal executive officer, principal financial officer, principal accounting officer or controller or persons performing similar functions.
Item 3. Audit Committee Financial Expert.
The Board of Trustees of the registrant has determined that F. William Marshall, Jr., the Chairman of the Board’s Audit Committee, is the audit committee financial expert and that Mr. Marshall is “independent” for purposes of this Item 3.
Item 4. Principal Accountant Fees and Services.
The principal accountant for the audit of the registrant’s annual financial statements billed $63,300 in fiscal 2013 and $62,000 in fiscal 2012.
The principal accountant for the audit of the registrant’s annual financial statements billed no such fees in fiscal 2013 and no such fees in fiscal 2012.
The principal accountant for the audit of the registrant’s annual financial statements billed $469,080 in fiscal 2013 and $424,956 in fiscal 2012 to the registrant’s investment adviser or any entity controlling, controlled by, or under common control with the adviser that provides ongoing services to the registrant.
Such services include: Internal control reviews, compliance procedures, GIPS attestation procedures, internal audit training, surprise exams, system conversion testing, and corporate restructuring.
The principal accountant for the audit of the registrant’s annual financial statements billed no such fees in fiscal 2013 and no such fees in fiscal 2012.
The principal accountant for the audit of the registrant’s annual financial statements billed $653,930 in fiscal 2013 and $359,124 in fiscal 2012 to the registrant’s investment adviser or any entity controlling, controlled by, or under common control with the adviser that provides ongoing services to the registrant.
Such services include: tax compliance, tax planning and tax advice. Tax compliance generally involves preparation of original and amended tax returns, claims for a refund and tax payment-planning services. Tax planning and tax advice includes assistance with tax audits and appeals, tax advice related to mergers and acquisitions and requests for rulings or technical advice from taxing authorities.
The principal accountant for the audit of the registrant’s annual financial statements billed no such fees in fiscal 2013 and no such fees in fiscal 2012.
The principal accountant for the audit of the registrant’s annual financial statements billed no such fees in fiscal 2013 and no such fees in fiscal 2012 to the registrant’s investment adviser or any entity controlling, controlled by, or under common control with the adviser that provides ongoing services to the registrant.
Such fees would include the cost to the principal accountant of attending audit committee meetings and consultations regarding the registrant’s retirement plan with respect to its Trustees.
| (e) | (1) During its regularly scheduled periodic meetings, the registrant’s audit committee will pre-approve all audit, audit-related, tax and other services to be provided by the principal accountants of the registrant. |
The audit committee has delegated pre-approval authority to its Chairman for any subsequent new engagements that arise between regularly scheduled meeting dates provided that any fees such pre-approved are presented to the audit committee at its next regularly scheduled meeting.
Under applicable laws, pre-approval of non-audit services may be waived provided that: 1) the aggregate amount of all such services provided constitutes no more than five percent of the total amount of fees paid by the registrant to its principal accountant during the fiscal year in which services are provided 2) such services were not recognized by the registrant at the time of engagement as non-audit services and 3) such services are promptly brought to the attention of the audit committee of the registrant and approved prior to the completion of the audit.
(2) 0%
| (f) | Not applicable as less than 50%. |
| (g) | The principal accountant for the audit of the registrant’s annual financial statements billed $1,123,010 in fiscal 2013 and $784,080 in fiscal 2012 to the registrant and the registrant’s investment adviser or any entity controlling, controlled by, or under common control with the adviser that provides ongoing services to the registrant related to non-audit fees. Those billings did not include any prohibited non-audit services as defined by the Securities Exchange Act of 1934. |
| (h) | The registrant’s audit committee of the board of Trustees has considered whether the provision of non-audit services that were rendered to the registrant’s investment adviser, and any entity controlling, controlled by, or under common control with the investment adviser that provides ongoing services to the registrant that were not pre-approved pursuant to paragraph (c)(7)(ii) of Rule 2-01 of Regulation S-X is compatible with maintaining the principal accountant’s independence. No such services were rendered. |
Item 5. Audit Committee of Listed Registrants
Not applicable.
Item 6. Schedule of Investments.
a) Not applicable. The complete schedule of investments is included in Item 1 of this Form N-CSR.
b) Not applicable.
Item 7. Disclosure of Proxy Voting Policies and Procedures for Closed-End Management Investment Companies.
Not applicable.
Item 8. Portfolio Managers of Closed-End Management Investment Companies.
Not applicable.
Item 9. Purchases of Equity Securities by Closed-End Management Investment Company and Affiliated Purchasers.
Not applicable.
Item 10. Submission of Matters to a Vote of Security Holders.
The Fund’s Governance Committee Provisions with Respect to Nominations of Directors/Trustees to the Respective Boards
None
Item 11. Controls and Procedures.
Based on their evaluation of the registrant’s disclosure controls and procedures (as defined in rule 30a-3(c) under the Investment Company Act of 1940 (17 CFR 270.30a-3(c)) as of 9/30/2013, the registrant’s principal executive officer and principal financial officer found the registrant’s disclosure controls and procedures to provide reasonable assurances that information required to be disclosed by the registrant in the reports that it files under the Securities Exchange Act of 1934 (a) is accumulated and communicated to registrant’s management, including its principal executive officer and principal financial officer, to allow timely decisions regarding required disclosure, and (b) is recorded, processed, summarized and reported, within the time periods specified in the rules and forms adopted by the U.S. Securities and Exchange Commission.
There have been no changes in the registrant’s internal controls over financial reporting that occurred during the registrant’s second fiscal quarter of the period covered by this report that have materially affected, or are reasonably likely to materially affect, the registrant’s internal control over financial reporting.
Item 12. Exhibits.
| (a) | (1) Exhibit attached hereto. |
(2) Exhibits attached hereto.
(3) Not applicable.
| (b) | Exhibit attached hereto. |
SIGNATURES
Pursuant to the requirements of the Securities Exchange Act of 1934 and the Investment Company Act of 1940, the registrant has duly caused this report to be signed on its behalf by the undersigned, thereunto duly authorized.
Oppenheimer International Bond Fund
| | |
By: | | /s/ William F. Glavin, Jr. |
| | William F. Glavin, Jr. |
| | Principal Executive Officer |
| |
Date: | | 11/11/2013 |
Pursuant to the requirements of the Securities Exchange Act of 1934 and the Investment Company Act of 1940, this report has been signed below by the following persons on behalf of the registrant and in the capacities and on the dates indicated.
| | |
By: | | /s/ William F. Glavin, Jr. |
| | William F. Glavin, Jr. |
| | Principal Executive Officer |
| |
Date: | | 11/11/2013 |
| | |
By: | | /s/ Brian W. Wixted |
| | Brian W. Wixted |
| | Principal Financial Officer |
| |
Date: | | 11/11/2013 |