UNITED STATES
SECURITIES AND EXCHANGE COMMISSION
WASHINGTON, D.C. 20549
FORM N-CSR
CERTIFIED SHAREHOLDER REPORT OF REGISTERED
MANAGEMENT INVESTMENT COMPANIES
Investment Company Act file number 811-07255
Oppenheimer International Bond Fund
(Exact name of registrant as specified in charter)
6803 South Tucson Way, Centennial, Colorado 80112-3924
(Address of principal executive offices) (Zip code)
Arthur S. Gabinet
OFI Global Asset Management, Inc.
Two World Financial Center, New York, New York 10281-1008
(Name and address of agent for service)
Registrant’s telephone number, including area code: (303) 768-3200
Date of fiscal year end: September 30
Date of reporting period: 3/31/2014
Item 1. Reports to Stockholders.
| 3 | ||||
| 7 | ||||
| 10 | ||||
| 12 | ||||
| 55 | ||||
| 57 | ||||
| 59 | ||||
| 60 | ||||
| 69 | ||||
Portfolio Proxy Voting Policies and Procedures; Updates to Statement of Investments | 98 | |||
| 99 | ||||
| 100 | ||||
Class A Shares
AVERAGE ANNUAL TOTAL RETURNS AT 3/31/14
| Class A Shares of the Fund | Citigroup Non-U.S. | JPMorgan Government Bond Index- Emerging | JPMorgan Emerging | |||||||||||||||||||||
| Without Sales Charge | With Sales Charge | Dollar World Government Bond Index | Markets Global Diversified | Markets Bond Index Global Diversified | Reference Index | |||||||||||||||||||
6-Month | 1.85 | % | -2.99 | % | 1.94 | % | 0.33 | % | 5.31 | % | 2.15 | % | ||||||||||||
1-Year | -2.96 | -7.57 | 2.43 | -7.14 | 0.56 | -0.80 | ||||||||||||||||||
5-Year | 6.45 | 5.42 | 4.15 | 9.79 | 11.70 | 6.57 | ||||||||||||||||||
10-Year | 6.15 | 5.64 | 4.27 | 9.32 | 8.19 | 6.01 | ||||||||||||||||||
Performance data quoted represents past performance, which does not guarantee future results. The investment return and principal value of an investment in the Fund will fluctuate so that an investor’s shares, when redeemed, may be worth more or less than their original cost. Fund returns include changes in share price, reinvested distributions, and a 4.75% maximum applicable sales charge except where “without sales charge” is indicated. Current performance may be lower or higher than the performance quoted. Returns do not consider capital gains or income taxes on an individual’s investment. Returns for periods of less than one year are cumulative and not annualized. For performance data current to the most recent month-end, visit oppenheimerfunds.com or call 1.800.CALL OPP (225.5677).
2 OPPENHEIMER INTERNATIONAL BOND FUND
The Fund’s Class A shares (without sales charge) produced a cumulative total return of 1.85% during the reporting period. On a relative basis, the Fund underperformed its Reference Index, a customized weighted index currently comprised of 50% of the Citigroup Non-U.S. Dollar World Government Bond Index, 30% of the JPMorgan Government Bond Index - Emerging Markets Global Diversified, and 20% of the JPMorgan Emerging Markets Bond Index Global Diversified, which returned 2.15%.
MARKET OVERVIEW
The global economy finished 2013 with slow and steady growth throughout the developed world. U.S. growth improved during the reporting period driven by continued strength in manufacturing, reasonable employment gains and strong activity in the housing market. Japan and Europe also posted stronger economic performances, but the Eurozone’s gains masked continued divergence among member states with countries like Spain and Ireland improving and France remaining weak. At the end of May 2013, market volatility picked up measurably as remarks from former Federal Reserve (“Fed”) Chairman Ben Bernanke indicated a possible tapering of the Fed’s asset purchase program if the economy continued to show improvement. Fears about a possible slowdown in the world’s emerging economies were exacerbated by the prospect of quantitative easing, which has been a steady source of liquidity, coming to an end. However, when the Fed actually announced in December that it would reduce its asset purchases by $10 billion a month from $85 billion to $75 billion, its decision to “taper” was met with relative calm in financial markets. U.S. interest rates generally rose and
by the end of 2013 the interest rate on 10-year Treasury bonds was roughly 3.0%. That capped a weak year for both Treasuries and investment-grade fixed income. The U.S. dollar strengthened against almost every major currency and developed market equities finished 2013 with double digit gains for the year. Emerging markets were the relative laggards in the global economy during 2013. Growth remained slow throughout the world’s emerging economies as inflation and persistent current account deficits restrained activity in countries such as India, Indonesia and Brazil. China’s economy grew, albeit at a much slower pace than prior years, as its leaders instituted several measures in an attempt to reorient the nation’s economy from an export-led model to a consumption-led one.
The global economy started 2014 with continued slow and steady growth throughout the developed world. U.S. growth remained reasonably strong, though data softened for the first quarter, partially attributed to cold weather effects across much of the country. The Eurozone also grew at a slightly faster pace than
3 OPPENHEIMER INTERNATIONAL BOND FUND
2013, but has continued to struggle with very low inflation and weak bank lending. The Fed continued its program of “tapering” asset purchases by $10 billion per month for the first three months of the year, bringing their current monthly purchases to $55 billion in March. Interest rates in the U.S. have fallen slightly since the beginning of the year. The U.S. dollar remained relatively stable and U.S. equities were largely flat after a very strong 2013. Emerging markets posted a modest recovery during this time. Countries such as India, Turkey, South Africa and Brazil appeared to take some of the necessary steps to deal with higher inflation by raising benchmark interest rates, while currency depreciation helped restore competitiveness. Many of these countries, however, still need longer-term structural reforms. Export growth has also remained slow to the U.S. and European Union, restraining growth. China has continued its transition from an investment-led growth model to a consumption-led one, which has caused it to see several months of slower growth as well. We also began to see growing geopolitical tension (Russia and Ukraine) and political noise (Thailand, Turkey, Venezuela). We expect political noise stemming from upcoming elections in many developing countries could continue to cause uncertainty throughout 2014.
FUND REVIEW
The strongest performing areas of the Fund on an absolute and relative basis this reporting period were its developed market debt strategies, exposure to emerging market
corporate debt and underweight exposure to emerging market local debt. Among the Fund’s developed market strategies, the Fund’s overall overweight position in developed market debt benefited performance, as it generally outperformed emerging market debt. We also maintained a near zero allocation to the Japanese yen. This underweight position benefited particularly over the first half of the reporting period. Our long-term view is that Abenomics (a term used to generally describe easing policies instituted by Japan’s central bank and Prime Minister Shinzo Abe) will continue to stay the course to spur inflation and growth in the Japanese economy, which we believe is likely to result in a weaker yen. Given this, at period end we maintained a large underweight position, though we may take small tactical bets in the currency as opportunities present themselves in the short term. During the reporting period, we also maintained an overweight to European periphery debt, particularly Portugal, which contributed positively to performance. Exposure to Australian interest rates also benefited the Fund.
Among emerging market corporates, exposure to Brazil, Mexico and Colombia, benefited this reporting period. While our allocation to Russian corporate debt detracted from performance this reporting period, it is worth mentioning that we lowered our exposure to Russian debt given our view that long-term fundamentals were deteriorating in the sovereign and corporates. We also had near zero exposure to the
4 OPPENHEIMER INTERNATIONAL BOND FUND
Russian ruble, which suffered considerably given the rising geopolitical tension surrounding the nation’s disputed incursion into Ukraine. Unrelated to the decreased exposure to Russian debt, we reduced our allocation to emerging market corporate debt in general. This move was based on our view that we continue to find opportunities with similar upside in other credit markets, and we believe the sensitivity to U.S. yield curve changes could contribute to more volatility in emerging market corporates than other asset classes due to their lower liquidity. We maintain a very positive outlook on global credit, so the assets from this allocation change were largely redeployed into developed market credit. Within developed market credit, we continue to maintain an overweight to financials in Europe, where we believe that low interest rates and deleveraging may provide a tail wind.
The most significant detractor from performance this reporting period was our exposure to emerging market local debt. This was due largely to a wholesale selloff in January. In addition, our underweights in Indonesia, Turkey and South Africa led us to miss some of the subsequent rally in February and March.
STRATEGY & OUTLOOK
Our outlook for international debt centers around four key themes. The first of which is that emerging market countries have become highly differentiated. The introduction of taper talk last May sent reverberations through global markets and sent interest
rates in many developing countries higher. The abrupt change in market sentiment lay bare some fundamental challenges to countries with high current account deficits – challenges that a prolonged period of easy money in the U.S. may have masked to some degree. However, not all emerging market countries are experiencing fragilities. Most are at a low point cyclically in their economic cycle, but very few face structural problems. As the U.S. interest rate cycle plays out, one of the most important things we will examine is whether or not emerging market policymakers are taking necessary steps to stay ahead of it. Those that do their homework and take action to keep their economies looking attractive either by “price” (high real yields) or a strong structural story may show resilience to future volatility, while those that do not make proper adjustments may continue to suffer. Therefore, at period end we have maintained our current lower allocations to emerging market debt and concentrate our exposure, in both U.S. dollar (external) debt and local currency debt, in what we view as the best stories. It is worth noting that we believe that another large driver of global growth and liquidity conditions, the European Union, remains a few years behind the U.S. cycle. While growth in the European Union finally emerged from recession in the second quarter of 2013 - with even some periphery countries returning to positive growth more recently, we continue to believe that further easing on the part of the European Central Bank may be on the horizon.
5 OPPENHEIMER INTERNATIONAL BOND FUND
We believe that recent disappointing U.S. economic data will prove to be largely the work of cold weather-induced distortions that will likely be sorted out over time. Our view is that data may turn more positive, which may cause the interest rates in the U.S. to rise. We also believe that this dynamic may maintain a strong U.S. dollar. As a result, we maintained our short duration position (approximately 2.15 years vs. our Reference Index as of March 31), and maintained our lower than average foreign currency exposure with core positions in the euro, Indian rupee and Korean won.
Our third driving theme is our very positive view of credit. We continue to see evidence of solid balance sheets globally, and many European corporates continue to deleverage. However, as mentioned earlier in this discussion, U.S. dollar-denominated debt may be prone to future volatility should U.S. interest rates rise. In such an environment,
we have concentrated our emerging market corporate exposure where we see the most attractive opportunities, and plan to maintain our allocation to developed market credit, and particularly to high yield European credit, where the deleveraging theme is likely to continue to be a boon.
Finally, in this environment, we believe it will be “alpha” rather than “beta” that will drive emerging market debt performance, and active management will be more important than ever. Moreover, we believe that active investment decisions in currency, interest rates and credit are more likely to produce positive performance (alpha) during periods that investors differentiate among markets rather than the beta associated with broad risk aversion moves. In particular, with rising developed market bond yields presenting a head-wind, country and currency selection (alpha) will be critical.
 |
Arthur P. Steinmetz Portfolio Manager |

 |
Hemant Baijal Portfolio Manager |
 |
Sara J. Zervos, Ph.D. Portfolio Manager |
6 OPPENHEIMER INTERNATIONAL BOND FUND
TOP TEN GEOGRAPHICAL HOLDINGS
United States | 12.1 | % | ||
United Kingdom | 7.0 | |||
Italy | 6.8 | |||
Germany | 6.4 | |||
France | 6.3 | |||
Brazil | 6.3 | |||
Japan | 6.1 | |||
Australia | 4.7 | |||
Mexico | 4.5 | |||
South Africa | 2.7 |
Portfolio holdings and allocation are subject to change. Percentages are as of March 31, 2014, and are based on total market value of investments.
REGIONAL ALLOCATION
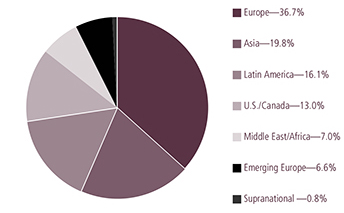
Portfolio holdings and allocations are subject to change. Percentages are as of March 31, 2014, and are based on the total market value of investments.
7 OPPENHEIMER INTERNATIONAL BOND FUND
Share Class Performance
AVERAGE ANNUAL TOTAL RETURNS WITHOUT SALES CHARGE AS OF 3/31/14
| Inception Date | 6-Month | 1-Year | 5-Year | 10-Year | ||||||||||||||||
Class A (OIBAX) | 6/15/95 | 1.85 | % | -2.96 | % | 6.45 | % | 6.15 | % | |||||||||||
Class B (OIBBX) | 6/15/95 | 1.45 | % | -3.61 | % | 5.55 | % | 5.61 | % | |||||||||||
Class C (OIBCX) | 6/15/95 | 1.50 | % | -3.49 | % | 5.72 | % | 5.39 | % | |||||||||||
Class I (OIBIX) | 1/27/12 | 2.08 | % | -2.52 | % | 2.44 | %* | N/A | ||||||||||||
Class N (OIBNX) | 3/1/01 | 1.67 | % | -3.30 | % | 6.05 | % | 5.72 | % | |||||||||||
Class Y (OIBYX) | 9/27/04 | 2.00 | % | -2.53 | % | 6.76 | % | 7.10 | %* | |||||||||||
AVERAGE ANNUAL TOTAL RETURNS WITH SALES CHARGE AS OF 3/31/14
| Inception Date | 6-Month | 1-Year | 5-Year | 10-Year | ||||||||||||||||
Class A (OIBAX) | 6/15/95 | -2.99 | % | -7.57 | % | 5.42 | % | 5.64 | % | |||||||||||
Class B (OIBBX) | 6/15/95 | -3.55 | % | -8.31 | % | 5.23 | % | 5.61 | % | |||||||||||
Class C (OIBCX) | 6/15/95 | 0.50 | % | -4.43 | % | 5.72 | % | 5.39 | % | |||||||||||
Class I (OIBIX) | 1/27/12 | 2.08 | % | -2.52 | % | 2.44 | %* | N/A | ||||||||||||
Class N (OIBNX) | 3/1/01 | 0.67 | % | -4.24 | % | 6.05 | % | 5.72 | % | |||||||||||
Class Y (OIBYX) | 9/27/04 | 2.00 | % | -2.53 | % | 6.76 | % | 7.10 | %* | |||||||||||
| * | Shows performance since inception. |
STANDARDIZED YIELDS
For the 30 Days Ended 3/31/14
Class A | 2.52 | % | ||
Class B | 1.89 | |||
Class C | 1.90 | |||
Class I | 3.09 | |||
Class N | 2.40 | |||
Class Y | 2.89 |
Performance data quoted represents past performance, which does not guarantee future results. The investment return and principal value of an investment in the Fund will fluctuate so that an investor’s shares, when redeemed, may be worth more or less than their original cost. Current performance may be lower or higher than the performance quoted. Returns do not consider capital gains or income taxes on an individual’s investment. Returns for periods of less than one year are cumulative and not annualized. For performance data current to the most recent month-end, visit oppenheimerfunds.com or call 1.800.CALL OPP (225.5677). Fund returns include changes in share price, reinvested distributions, and the applicable sales charge (unless otherwise indicated): for Class A shares, the current maximum initial sales charge of 4.75%; for Class B shares, the contingent deferred sales charge of 5% (1-year) and 2% (5-year); and for Class C and N shares, the contingent deferred sales charge of 1% for the 1-year period. There is no sales charge for Class I and Class Y shares. Because Class B shares convert to Class A shares 72 months after purchase, the 10-year return for Class B shares uses Class A performance for the period after conversion.
8 OPPENHEIMER INTERNATIONAL BOND FUND
Standardized yield is based on net investment income for the 30-day period ended 3/31/14 and the maximum offering price at the end of the period for Class A shares and the net asset value for Class B, Class C, Class I, Class N and Class Y shares. Each result is compounded semiannually and then annualized. Falling share prices will tend to artificially raise yields.
The Fund’s performance is compared to the Citigroup Non-U.S. Dollar World Government Bond Index, JPMorgan Government Bond Index - Emerging Markets Global Diversified, the JPMorgan Emerging Markets Bond Index Global Diversified, and the Fund’s Reference Index. The Citigroup Non-U.S. Dollar World Government Bond Index is an index of fixed rate government bonds with maturities of one year or longer. The JPMorgan Government Bond Index - Emerging Markets Global Diversified is a comprehensive, global local Emerging Markets Index, and consists of regularly traded, liquid fixed-rate, domestic currency government bonds to which international investors can gain exposure. The JPMorgan Emerging Markets Bond Index Global Diversified tracks total returns for U.S. dollar-denominated debt instruments issued by emerging market sovereign and quasi-sovereign entities: Brady bonds, loans, Eurobonds. The Fund’s Reference Index is a customized weighted index currently comprised of 50% of the Citigroup Non-U.S. Dollar World Government Bond Index, 30% of the JPMorgan Government Bond Index - Emerging Markets Global Diversified, and 20% of the JPMorgan Emerging Markets Bond Index Global Diversified. The Indices are unmanaged and cannot be purchased directly by investors. While index comparisons may be useful to provide a benchmark for the Fund’s performance, it must be noted that the Fund’s investments are not limited to the investments comprising the Indices. Index performance includes reinvestment of income, but does not reflect transaction costs, fees, expenses or taxes. Index performance is shown for illustrative purposes only as a benchmark for the Fund’s performance, and does not predict or depict performance of the Fund. The Fund’s performance reflects the effects of the Fund’s business and operating expenses.
The Fund’s investment strategy and focus can change over time. The mention of specific fund holdings does not constitute a recommendation by OppenheimerFunds, Inc. or its affiliates.
Before investing in any of the Oppenheimer funds, investors should carefully consider a fund’s investment objectives, risks, charges and expenses. Fund prospectuses and summary prospectuses contain this and other information about the funds, and may be obtained by asking your financial advisor, visiting oppenheimerfunds.com, or calling 1.800.CALL OPP (225.5677). Read prospectuses and summary prospectuses carefully before investing.
Shares of Oppenheimer funds are not deposits or obligations of any bank, are not guaranteed by any bank, are not insured by the FDIC or any other agency, and involve investment risks, including the possible loss of the principal amount invested.
9 OPPENHEIMER INTERNATIONAL BOND FUND
Fund Expenses. As a shareholder of the Fund, you incur two types of costs: (1) transaction costs, which may include sales charges (loads) on purchase payments, contingent deferred sales charges on redemptions; and (2) ongoing costs, including management fees; distribution and service fees; and other Fund expenses. These examples are intended to help you understand your ongoing costs (in dollars) of investing in the Fund and to compare these costs with the ongoing costs of investing in other mutual funds.
The examples are based on an investment of $1,000.00 invested at the beginning of the period and held for the entire 6-month period ended March 31, 2014.
Actual Expenses. The first section of the table provides information about actual account values and actual expenses. You may use the information in this section for the class of shares you hold, together with the amount you invested, to estimate the expense that you paid over the period. Simply divide your account value by $1,000.00 (for example, an $8,600.00 account value divided by $1,000.00 = 8.60), then multiply the result by the number in the first section under the heading entitled “Expenses Paid During Period” to estimate the expenses you paid on your account during this period.
Hypothetical Example for Comparison Purposes. The second section of the table provides information about hypothetical account values and hypothetical expenses based on the Fund’s actual expense ratio for each class of shares, and an assumed rate of return of 5% per year for each class before expenses, which is not the actual return. The hypothetical account values and expenses may not be used to estimate the actual ending account balance or expenses you paid for the period. You may use this information to compare the ongoing costs of investing in the Fund and other funds. To do so, compare this 5% hypothetical example for the class of shares you hold with the 5% hypothetical examples that appear in the shareholder reports of the other funds.
Please note that the expenses shown in the table are meant to highlight your ongoing costs only and do not reflect any transactional costs, such as front-end or contingent deferred sales charges (loads). Therefore, the “hypothetical” section of the table is useful in comparing ongoing costs only, and will not help you determine the relative total costs of owning different funds. In addition, if these transactional costs were included, your costs would have been higher.
10 OPPENHEIMER INTERNATIONAL BOND FUND
Actual | Beginning Account Value October 1, 2013 | Ending Account Value March 31, 2014 | Expenses Paid During 6 Months Ended March 31, 2014 | |||||||||
Class A | $ | 1,000.00 | $ | 1,018.50 | $ | 5.20 | ||||||
Class B | 1,000.00 | 1,014.50 | 9.23 | |||||||||
Class C | 1,000.00 | 1,015.00 | 8.68 | |||||||||
Class I | 1,000.00 | 1,020.80 | 2.88 | |||||||||
Class N | 1,000.00 | 1,016.70 | 7.01 | |||||||||
Class Y | 1,000.00 | 1,020.00 | 3.63 | |||||||||
Hypothetical (5% return before expenses) | ||||||||||||
Class A | 1,000.00 | 1,019.80 | 5.20 | |||||||||
Class B | 1,000.00 | 1,015.81 | 9.24 | |||||||||
Class C | 1,000.00 | 1,016.36 | 8.68 | |||||||||
Class I | 1,000.00 | 1,022.09 | 2.88 | |||||||||
Class N | 1,000.00 | 1,018.00 | 7.02 | |||||||||
Class Y | 1,000.00 | 1,021.34 | 3.63 | |||||||||
Expenses are equal to the Fund’s annualized expense ratio for that class, multiplied by the average account value over the period, multiplied by 182/365 (to reflect the one-half year period). Those annualized expense ratios, excluding indirect expenses from affiliated funds, based on the 6-month period ended March 31, 2014 are as follows:
Class | Expense Ratios | |||
Class A | 1.03 | % | ||
Class B | 1.83 | |||
Class C | 1.72 | |||
Class I | 0.57 | |||
Class N | 1.39 | |||
Class Y | 0.72 | |||
The expense ratios reflect voluntary and/or contractual waivers and/or reimbursements of expenses by the Fund’s Manager and Transfer Agent. Some of these undertakings may be modified or terminated at any time, as indicated in the Fund’s prospectus. The “Financial Highlights” tables in the Fund’s financial statements, included in this report, also show the gross expense ratios, without such waivers or reimbursements and reduction to custodian expenses, if applicable.
11 OPPENHEIMER INTERNATIONAL BOND FUND
STATEMENTOF INVESTMENTS March 31, 2014 Unaudited
| Principal Amount | Value | |||||||||
Asset-Backed Securities—0.5% |
| |||||||||
Axius Europe CLO SA, Series 2007-1X, Cl. E, 4.82%, 11/15/231 | EUR | 6,972,613 | $ | 9,203,470 | ||||||
Cadogan Square CLO IV BV, Series 4X, Cl. D, 1.956%, 7/24/231 | EUR | 4,650,000 | 5,641,187 | |||||||
Halcyon Structured Asset Management European CLO BV, Series 2006-IIX, Cl. E, 4.254%, 1/25/231 | EUR | 6,470,000 | 8,386,614 | |||||||
Harvest CLO IA SA: | ||||||||||
Series I-X, Cl. C, 2.216%, 3/29/171 | EUR | 1,015,000 | 1,398,040 | |||||||
Series I-X, Cl. D, 3.316%, 3/29/171 | EUR | 2,530,000 | 3,386,341 | |||||||
Series I-X, Cl. E, 7.916%, 3/29/171 | EUR | 2,530,000 | 3,368,301 | |||||||
Highlander Euro CDO II Cayman Ltd., Series 2006-2CX, Cl. E, 3.92%, 12/14/221 | EUR | 6,249,148 | 8,026,925 | |||||||
Stichting Halcyon Structured Asset Management European, Series 2007-IX, Cl. E, 4.206%, 7/24/231 | EUR | 1,654,222 | 1,973,311 | |||||||
Theseus European CLO SA, Series 2006-1X, Cl. E, 4.387%, 8/27/221 | EUR | 3,505,000 | 4,622,821 | |||||||
|
| |||||||||
Total Asset-Backed Securities (Cost $42,548,605) |
| 46,007,010 | ||||||||
Mortgage-Backed Obligation—0.2% | ||||||||||
IM Pastor 4 Fondo de Titulizacion de Activos, Series 4, Cl. A, 0.453%, 3/22/441 | EUR | 15,751,384 | 17,793,240 | |||||||
U.S. Government Obligation—1.6% | ||||||||||
United States Treasury Nts., 0.375%, 1/31/162,3 (Cost $145,157,475) | 145,000,000 | 145,068,005 | ||||||||
Foreign Government Obligations—60.1% | ||||||||||
Angola—0.1% | ||||||||||
Republic of Angola Via Northern Lights III BV Sr. Unsec. Nts., 7%, 8/16/19 | 11,820,000 | 12,972,450 | ||||||||
Australia—4.5% | ||||||||||
Australia Government Bonds: | ||||||||||
2.00%, 8/21/35 | AUD | 10,000,000 | 9,276,643 | |||||||
3.25%, 4/21/29 | AUD | 4,625,000 | 3,710,793 | |||||||
4.50%, 4/21/33 | AUD | 81,940,000 | 74,472,545 | |||||||
4.75%, 4/21/27 | AUD | 50,000,000 | 48,326,534 | |||||||
5.75%, 7/15/22 | AUD | 75,000,000 | 78,525,087 | |||||||
New South Wales Treasury Corp. Sr. Unsec. Nts., 6%, 5/1/23 | AUD | 40,000,000 | 41,973,454 | |||||||
Queensland Treasury Corp. Sr. Unsec. Nts.: | ||||||||||
Series 19, 6.25%, 6/14/19 | AUD | 22,075,000 | 22,967,443 | |||||||
Series 21, 6.00%, 6/14/21 | AUD | 56,000,000 | 58,237,883 | |||||||
Series 22, 6.00%, 7/21/22 | AUD | 7,400,000 | 7,624,423 | |||||||
Series 33, 6.50%, 3/14/33 | AUD | 25,590,000 | 27,337,318 | |||||||
Victoria Treasury Corp. Sr. Unsec. Nts.: | ||||||||||
5.50%, 11/17/26 | AUD | 31,385,000 | 31,253,950 | |||||||
Series 1224, 5.50%, 12/17/24 | AUD | 20,720,000 | 20,801,332 | |||||||
|
| |||||||||
| 424,507,405 | ||||||||||
Belgium—1.8% | ||||||||||
Kingdom of Belgium Bonds, Series 58, 3.75%, 9/28/20 | EUR | 100,000,000 | 158,397,511 | |||||||
Kingdom of Belgium Unsec. Bonds, Series 60, 4.25%, 3/28/414 | EUR | 5,055,000 | 8,465,115 | |||||||
|
| |||||||||
| 166,862,626 | ||||||||||
12 OPPENHEIMER INTERNATIONAL BOND FUND
| Principal Amount | Value | |||||||||||
Brazil—4.1% |
| |||||||||||
Brazil Minas SPE via State of Minas Gerais Sec. Bonds, 5.333%, 2/15/284 | $ | 12,675,000 | $ | 12,326,438 | ||||||||
Federative Republic of Brazil International Bonds, 4.25%, 1/7/25 | 6,400,000 | 6,200,000 | ||||||||||
Federative Republic of Brazil Letra Tesouro Nacional Treasury Bills: | ||||||||||||
10.346%, 10/1/145 | BRL | 73,480,000 | 30,711,661 | |||||||||
10.356%, 7/1/145 | BRL | 323,015,000 | 138,818,294 | |||||||||
10.949%, 1/1/155 | BRL | 255,930,000 | 104,004,583 | |||||||||
Federative Republic of Brazil Nota Do Tesouro Nacional Unsec. Nts.: | ||||||||||||
9.762%, 1/1/18 | BRL | 65,790,000 | 26,897,058 | |||||||||
9.762%, 1/1/21 | BRL | 12,875,000 | 5,030,402 | |||||||||
10.00%, 1/1/23 | BRL | 17,295,000 | 6,583,080 | |||||||||
13.288%, 8/15/5011 | BRL | 19,290,000 | 18,506,369 | |||||||||
13.505%, 5/15/4511 | BRL | 21,060,000 | 20,308,581 | |||||||||
Federative Republic of Brazil Sr. Unsec. Nts., 4.875%, 1/22/21 | 12,573,000 | 13,427,964 | ||||||||||
|
| |||||||||||
| 382,814,430 | ||||||||||||
Canada—0.8% | ||||||||||||
Canada Unsec. Bonds, 3.75%, 6/1/19 | CAD | 73,380,000 | 73,028,201 | |||||||||
Colombia—0.7% | ||||||||||||
Republic of Colombia International Bonds, 4.375%, 7/12/21 | 13,755,000 | 14,339,587 | ||||||||||
Republic of Colombia Sr. Unsec. Nts.: | ||||||||||||
4.00%, 2/26/24 | 11,010,000 | 10,927,425 | ||||||||||
5.625%, 2/26/44 | 17,725,000 | 18,593,525 | ||||||||||
8.125%, 5/21/24 | 11,920,000 | 15,555,600 | ||||||||||
Series B, 7.00%, 5/4/22 | COP | 7,695,000,000 | 4,070,631 | |||||||||
Series B, 10.00%, 7/24/24 | COP | 5,474,000,000 | 3,487,005 | |||||||||
|
| |||||||||||
| 66,973,773 | ||||||||||||
Croatia—0.2% | ||||||||||||
Republic of Croatia Sr. Unsec. Nts.: | ||||||||||||
5.50%, 4/4/234 | 13,510,000 | 13,719,405 | ||||||||||
6.375%, 3/24/214 | 3,115,000 | 3,371,988 | ||||||||||
6.75%, 11/5/194 | 3,010,000 | 3,329,812 | ||||||||||
|
| |||||||||||
| 20,421,205 | ||||||||||||
Denmark—0.5% | ||||||||||||
Kingdom of Denmark Bonds, 4%, 11/15/19 | DKK | 217,580,000 | 47,143,598 | |||||||||
Dominican Republic—0.1% | ||||||||||||
Banco de Reservas de la Republica Dominicana Sub. Nts., 7%, 2/1/234 | 6,030,000 | 5,705,888 | ||||||||||
Dominican Republic Sr. Unsec. Bonds, 5.875%, 4/18/244 | 6,700,000 | 6,683,250 | ||||||||||
|
| |||||||||||
| 12,389,138 | ||||||||||||
Finland—0.5% | ||||||||||||
Republic of Finland Bonds, 2%, 4/15/244 | EUR | 35,000,000 | 48,820,182 | |||||||||
France—3.7% | ||||||||||||
French Republic Unsec. Bonds: | ||||||||||||
2.25%, 10/25/22 | EUR | 64,835,000 | 92,978,749 | |||||||||
2.75%, 10/25/27 | EUR | 51,415,000 | 73,000,958 | |||||||||
3.75%, 10/25/19 | EUR | 46,690,000 | 73,851,853 | |||||||||
13 OPPENHEIMER INTERNATIONAL BOND FUND
STATEMENTOF INVESTMENTS Unaudited / Continued
| Principal Amount | Value | |||||||||
France (Continued) |
| |||||||||
French Republic Unsec. Bonds: (Continued) | ||||||||||
4.50%, 4/25/41 | EUR | 58,950,000 | $ | 103,764,113 | ||||||
|
| |||||||||
| 343,595,673 | ||||||||||
Gabon—0.1% | ||||||||||
Gabonese Republic Unsec. Bonds, 6.375%, 12/12/244 | 6,060,000 | 6,438,750 | ||||||||
Germany—5.3% | ||||||||||
Federal Republic of Germany Bonds, 2.25%, 4/11/14 | EUR | 215,400,000 | 296,867,769 | |||||||
Federal Republic of Germany Unsec. Bonds: | ||||||||||
1.50%, 5/15/23 | EUR | 90,045,000 | 124,842,183 | |||||||
2.50%, 7/4/44 | EUR | 55,120,000 | 77,335,949 | |||||||
|
| |||||||||
| 499,045,901 | ||||||||||
Greece—0.4% | ||||||||||
Athens Urban Transportation Organisation Sr. Unsec. Nts., 4.851%, 9/19/16 | EUR | 8,390,000 | 11,040,109 | |||||||
Hellenic Republic Sr. Unsec. Bonds: | ||||||||||
2.00%, 2/24/261 | EUR | 840,000 | 857,611 | |||||||
2.00%, 2/24/271 | EUR | 840,000 | 843,446 | |||||||
2.00%, 2/24/281 | EUR | 840,000 | 828,033 | |||||||
2.00%, 2/24/291 | EUR | 840,000 | 817,077 | |||||||
2.00%, 2/24/301 | EUR | 840,000 | 807,331 | |||||||
2.00%, 2/24/341 | EUR | 1,690,000 | 1,562,793 | |||||||
5.20%, 7/17/34 | EUR | 16,700,000 | 18,250,867 | |||||||
Hellenic Republic Sr. Unsec. Nts., 5%, Series 15BR, 8/22/16 | JPY | 418,400,000 | 3,837,881 | |||||||
|
| |||||||||
| 38,845,148 | ||||||||||
Hungary—0.7% | ||||||||||
Hungary Sr. Unsec. Bonds, 7.625%, 3/29/41 | 915,000 | 1,059,112 | ||||||||
Hungary Sr. Unsec. Nts.: | ||||||||||
4.00%, 3/25/19 | 8,850,000 | 8,810,175 | ||||||||
5.375%, 2/21/23 | 8,800,000 | 8,966,320 | ||||||||
5.375%, 3/25/24 | 4,130,000 | 4,148,585 | ||||||||
6.375%, 3/29/21 | 7,185,000 | 7,894,519 | ||||||||
Hungary Unsec. Bonds: | ||||||||||
Series 19/A, 6.50%, 6/24/19 | HUF | 2,804,000,000 | 13,532,230 | |||||||
Series 20/A, 7.50%, 11/12/20 | HUF | 1,546,000,000 | 7,878,537 | |||||||
Series 23/A, 6.00%, 11/24/23 | HUF | 3,201,000,000 | 14,999,887 | |||||||
|
| |||||||||
| 67,289,365 | ||||||||||
India—1.9% | ||||||||||
Republic of India Sr. Unsec. Bonds: | ||||||||||
7.28%, 6/3/19 | INR | 5,573,000,000 | 87,948,934 | |||||||
8.28%, 9/21/27 | INR | 2,041,000,000 | 31,943,935 | |||||||
8.83%, 11/25/23 | INR | 3,647,000,000 | 61,160,476 | |||||||
|
| |||||||||
| 181,053,345 | ||||||||||
Indonesia—1.8% | ||||||||||
Perusahaan Penerbit SBSN Indonesia Sr. Unsec. Bonds, 4%, 11/21/184 | 18,755,000 | 19,247,319 | ||||||||
Perusahaan Penerbit SBSN Indonesia Unsec. Nts., 6.125%, 3/15/194 | 11,575,000 | 12,703,563 | ||||||||
14 OPPENHEIMER INTERNATIONAL BOND FUND
| Principal Amount | Value | |||||||||||
Indonesia (Continued) |
| |||||||||||
Republic of Indonesia Sr. Unsec. Bonds: | ||||||||||||
3.375%, 4/15/234 | $ | 6,265,000 | $ | 5,622,837 | ||||||||
4.875%, 5/5/214 | 17,510,000 | 18,035,300 | ||||||||||
5.375%, 10/17/234 | 22,250,000 | 23,195,625 | ||||||||||
5.875%, 1/15/244 | 15,365,000 | 16,536,581 | ||||||||||
6.75%, 1/15/444 | 7,395,000 | 8,106,769 | ||||||||||
7.75%, 1/17/384 | 7,755,000 | 9,286,612 | ||||||||||
11.625%, 3/4/194 | 3,750,000 | 5,114,062 | ||||||||||
Republic of Indonesia Treasury Bonds: | ||||||||||||
Series FR68, 8.375%, 3/15/34 | IDR | 150,670,000,000 | 13,140,175 | |||||||||
Series FR70, 8.375%, 3/15/24 | IDR | 235,640,000,000 | 21,391,175 | |||||||||
Series FR71, 9.00%, 3/15/29 | IDR | 163,070,000,000 | 14,992,751 | |||||||||
|
| |||||||||||
| 167,372,769 | ||||||||||||
Italy—6.1% | ||||||||||||
Republic of Italy Buoni Poliennali del Tesoro Unsec. Bonds: | ||||||||||||
3.50%, 11/1/17 | EUR | 21,770,000 | 32,137,178 | |||||||||
4.00%, 9/1/20 | EUR | 54,165,000 | 81,894,111 | |||||||||
4.50%, 3/1/19 | EUR | 126,305,000 | 195,631,049 | |||||||||
4.50%, 3/1/24 | EUR | 15,000,000 | 22,823,286 | |||||||||
4.75%, 9/1/444 | EUR | 20,230,000 | 30,192,394 | |||||||||
5.00%, 3/1/22 | EUR | 10,125,000 | 16,044,764 | |||||||||
5.00%, 9/1/40 | EUR | 40,540,000 | 63,137,564 | |||||||||
Republic of Italy Buoni Poliennali del Tesoro Unsec. Nts., 4.75%, 5/1/17 | EUR | 27,240,000 | 41,495,010 | |||||||||
Republic of Italy Certificati di Credito del Tesoro Unsec. Nts., 1.14%, 10/15/171 | EUR | 22,685,000 | 31,294,274 | |||||||||
Republic of Italy International Sr. Unsec. Bonds, 4.50%, 6/8/15 | JPY | 5,000,000,000 | 50,213,486 | |||||||||
|
| |||||||||||
| 564,863,116 | ||||||||||||
Ivory Coast—0.3% | ||||||||||||
Republic of Cote d’Ivoire Sr. Unsec. Bonds, 5.75%, 12/31/321 | 31,705,000 | 29,961,225 | ||||||||||
Japan—6.0% | ||||||||||||
Japan Bank for International Cooperation Sr. Unsec. Nts., 2.30%, 3/19/18 | CAD | 13,205,000 | 12,014,460 | |||||||||
Japan Sr. Unsec. Bonds: | ||||||||||||
Series 112, 2.10%, 6/20/29 | JPY | 5,243,000,000 | 58,182,543 | |||||||||
Series 134, 1.80%, 3/20/32 | JPY | 14,053,000,000 | 146,344,673 | |||||||||
Series 143, 1.60%, 3/20/33 | JPY | 13,914,000,000 | 138,689,074 | |||||||||
Series 328, 0.60%, 3/20/23 | JPY | 1,115,000,000 | 10,845,677 | |||||||||
Series 329, 0.80%, 6/20/23 | JPY | 3,029,000,000 | 29,934,115 | |||||||||
Series 36, 2.00%, 3/20/42 | JPY | 12,678,000,000 | 131,354,840 | |||||||||
Series 38, 1.80%, 3/20/43 | JPY | 3,031,000,000 | 30,044,356 | |||||||||
|
| |||||||||||
| 557,409,738 | ||||||||||||
Kazakhstan—0.1% | ||||||||||||
Development Bank of Kazakhstan JSC Sr. Unsec. Bonds, 4.125%, 12/10/224 | 5,645,000 | 5,122,838 | ||||||||||
Latvia—0.1% | ||||||||||||
Republic of Latvia Sr. Unsec. Nts., 5.25%, 6/16/214 | 10,380,000 | 11,355,201 | ||||||||||
15 OPPENHEIMER INTERNATIONAL BOND FUND
STATEMENTOF INVESTMENTS Unaudited / Continued
| Principal Amount | Value | |||||||||||
Lithuania—0.4% |
| |||||||||||
Republic of Lithuania Sr. Unsec. Bonds: | ||||||||||||
5.125%, 9/14/174 | $ | 17,000,000 | $ | 18,635,060 | ||||||||
6.125%, 3/9/214 | 16,670,000 | 19,132,159 | ||||||||||
|
| |||||||||||
| 37,767,219 | ||||||||||||
Malaysia—0.3% | ||||||||||||
Federation of Malaysia Sr. Unsec. Bonds, 4.262%, 9/15/16 | MYR | 83,350,000 | 26,065,846 | |||||||||
Mexico—2.2% | ||||||||||||
United Mexican States Bonds: | ||||||||||||
7.75%, 11/13/42 | MXN | 153,400,000 | 12,602,347 | |||||||||
8.00%, 12/7/23 | MXN | 69,400,000 | 6,026,512 | |||||||||
United Mexican States Sr. Unsec. Bonds, 5.55%, 1/21/45 | 7,250,000 | 7,721,250 | ||||||||||
United Mexican States Sr. Unsec. Nts., 5.625%, 3/19/14 | GBP | 8,000,000 | 12,891,604 | |||||||||
United Mexican States Unsec. Bonds: | ||||||||||||
Series M, 6.50%, 6/9/22 | MXN | 456,450,000 | 36,117,465 | |||||||||
Series M, 7.00%, 6/19/14 | MXN | 343,200,000 | 26,608,403 | |||||||||
Series M10, 7.75%, 12/14/17 | MXN | 751,940,000 | 63,607,483 | |||||||||
Series M20, 7.50%, 6/3/27 | MXN | 282,470,000 | 23,581,869 | |||||||||
Series M20, 8.50%, 5/31/29 | MXN | 223,080,000 | 20,008,972 | |||||||||
|
| |||||||||||
| 209,165,905 | ||||||||||||
Morocco—0.2% | ||||||||||||
Kingdom of Morocco Sr. Unsec. Nts., 4.25%, 12/11/224 | 14,315,000 | 13,957,125 | ||||||||||
Netherlands—0.9% | ||||||||||||
Kingdom of the Netherlands Unsec. Bonds: | ||||||||||||
4.00%, 7/15/194 | EUR | 37,870,000 | 60,569,512 | |||||||||
4.00%, 1/15/374 | EUR | 13,535,000 | 23,535,099 | |||||||||
|
| |||||||||||
| 84,104,611 | ||||||||||||
Panama—0.3% | ||||||||||||
Republic of Panama Sr. Unsec. Bonds: | ||||||||||||
5.20%, 1/30/20 | 7,320,000 | 8,139,840 | ||||||||||
6.70%, 1/26/36 | 4,230,000 | 4,991,400 | ||||||||||
8.875%, 9/30/27 | 5,280,000 | 7,339,200 | ||||||||||
9.375%, 4/1/29 | 4,710,000 | 6,702,330 | ||||||||||
|
| |||||||||||
| 27,172,770 | ||||||||||||
Peru—0.6% | ||||||||||||
Republic of Peru Sr. Unsec. Bonds: | ||||||||||||
6.55%, 3/14/37 | 7,695,000 | 9,291,713 | ||||||||||
7.35%, 7/21/25 | 11,820,000 | 15,262,575 | ||||||||||
7.84%, 8/12/204 | PEN | 35,005,000 | 13,851,959 | |||||||||
8.20%, 8/12/264 | PEN | 34,370,000 | 14,129,807 | |||||||||
|
| |||||||||||
| 52,536,054 | ||||||||||||
Philippines—0.5% | ||||||||||||
Republic of the Philippines Sr. Unsec. Bonds: | ||||||||||||
6.375%, 1/15/32 | 11,750,000 | 14,379,063 | ||||||||||
6.375%, 10/23/34 | 14,200,000 | 17,679,000 | ||||||||||
7.75%, 1/14/31 | 2,190,000 | 3,003,037 | ||||||||||
9.875%, 1/15/19 | 8,165,000 | 10,839,037 | ||||||||||
16 OPPENHEIMER INTERNATIONAL BOND FUND
| Principal Amount | Value | |||||||||||
Philippines (Continued) |
| |||||||||||
Republic of the Philippines Sr. Unsec. Bonds: (Continued) | ||||||||||||
10.625%, 3/16/25 | $ | 2,800,000 | $ | 4,371,500 | ||||||||
|
| |||||||||||
| 50,271,637 | ||||||||||||
Poland—1.5% | ||||||||||||
Republic of Poland Sr. Unsec. Bonds: | ||||||||||||
3.00%, 3/17/23 | 18,095,000 | 16,964,062 | ||||||||||
5.125%, 4/21/21 | 22,615,000 | 25,029,151 | ||||||||||
Republic of Poland Unsec. Bonds: | ||||||||||||
5.25%, 10/25/17 | PLN | 103,545,000 | 36,427,582 | |||||||||
5.25%, 10/25/20 | PLN | 47,010,000 | 16,753,939 | |||||||||
5.50%, 4/25/15 | PLN | 74,715,000 | 25,420,199 | |||||||||
5.75%, 10/25/21 | PLN | 45,365,000 | 16,637,934 | |||||||||
|
| |||||||||||
| 137,232,867 | ||||||||||||
Portugal—0.8% | ||||||||||||
Republic of Portugal Obrigacoes do Tesouro OT Sr. Unsec. Bonds, 4.75%, 6/14/19 | EUR | 48,380,000 | 72,490,641 | |||||||||
Romania—0.5% | ||||||||||||
Romania Sr. Unsec. Bonds: | ||||||||||||
4.875%, 1/22/244 | 4,860,000 | 4,932,900 | ||||||||||
6.125%, 1/22/444 | 3,570,000 | 3,777,060 | ||||||||||
6.75%, 2/7/224 | 19,880,000 | 23,234,750 | ||||||||||
Romania Unsec. Bonds: | ||||||||||||
5.85%, 4/26/23 | RON | 5,890,000 | 1,898,152 | |||||||||
5.90%, 7/26/17 | RON | 47,660,000 | 15,485,067 | |||||||||
|
| |||||||||||
| 49,327,929 | ||||||||||||
Russia—0.9% | ||||||||||||
AHML Via AHML Finance Ltd. Unsec. Nts., 7.75%, 2/13/184 | RUB | 132,500,000 | 3,470,485 | |||||||||
Russian Federation Sr. Unsec. Bonds: | ||||||||||||
4.875%, 9/16/234 | 7,080,000 | 7,035,750 | ||||||||||
5.875%, 9/16/434 | 4,210,000 | 4,178,425 | ||||||||||
7.50%, 3/31/301,4 | 8,367,275 | 9,544,969 | ||||||||||
Russian Federation Sr. Unsec. Nts., 5%, 4/29/204 | 22,600,000 | 23,617,000 | ||||||||||
Russian Federation Unsec. Bonds: | ||||||||||||
Series 6205, 7.60%, 4/14/21 | RUB | 252,500,000 | 6,836,779 | |||||||||
Series 6209, 7.60%, 7/20/22 | RUB | 208,300,000 | 5,544,965 | |||||||||
Series 6210, 6.80%, 12/11/19 | RUB | 70,900,000 | 1,885,342 | |||||||||
Series 6211, 7.00%, 1/25/23 | RUB | 263,800,000 | 6,785,417 | |||||||||
Series 6215, 7.00%, 8/16/23 | RUB | 200,000,000 | 5,109,860 | |||||||||
Vnesheconombank Sr. Unsec. Bonds, Series 9, 7.90%, 3/18/211 | RUB | 181,100,000 | 5,082,208 | |||||||||
|
| |||||||||||
| 79,091,200 | ||||||||||||
Serbia—0.3% | ||||||||||||
Republic of Serbia Sr. Unsec. Bonds, 5.25%, 11/21/174 | 5,485,000 | 5,718,112 | ||||||||||
Republic of Serbia Treasury Bills, 10.004%, 6/12/145 | RSD | 1,287,000,000 | 15,164,482 | |||||||||
Republic of Serbia Unsec. Bonds, 5.875%, 12/3/184 | 6,075,000 | 6,454,688 | ||||||||||
|
| |||||||||||
| 27,337,282 | ||||||||||||
Singapore—0.8% | ||||||||||||
Republic of Singapore Sr. Unsec. Bonds: | ||||||||||||
2.375%, 4/1/17 | SGD | 25,130,000 | 20,949,418 | |||||||||
17 OPPENHEIMER INTERNATIONAL BOND FUND
STATEMENTOF INVESTMENTS Unaudited / Continued
| Principal Amount | Value | |||||||||
Singapore (Continued) |
| |||||||||
Republic of Singapore Sr. Unsec. Bonds: (Continued) | ||||||||||
3.00%, 9/1/24 | SGD | 65,000,000 | $ | 53,508,709 | ||||||
|
| |||||||||
| 74,458,127 | ||||||||||
Slovenia—0.2% | ||||||||||
Republic of Slovenia Bonds, 4.125%, 2/18/194 | 14,580,000 | 15,112,170 | ||||||||
South Africa—2.4% | ||||||||||
Republic of South Africa Sr. Unsec. Bonds: | ||||||||||
5.875%, 5/30/22 | 4,585,000 | 5,055,879 | ||||||||
5.875%, 9/16/25 | 16,405,000 | 17,684,590 | ||||||||
Series R207, 7.25%, 1/15/20 | ZAR | 507,860,000 | 46,510,675 | |||||||
Series R208, 6.75%, 3/31/21 | ZAR | 815,335,000 | 71,634,862 | |||||||
Series R209, 6.25%, 3/31/36 | ZAR | 99,810,000 | 7,080,367 | |||||||
Republic of South Africa Unsec. Bonds: | ||||||||||
Series 2023, 7.75%, 2/28/23 | ZAR | 131,450,000 | 12,079,853 | |||||||
Series R186, 10.50%, 12/21/26 | ZAR | 482,110,000 | 53,173,189 | |||||||
Series R213, 7.00%, 2/28/31 | ZAR | 169,936,000 | 13,681,737 | |||||||
|
| |||||||||
| 226,901,152 | ||||||||||
Spain—1.0% | ||||||||||
Autonomous Community of Madrid Spain Sr. Unsec. Bonds, 4.30%, 9/15/26 | EUR | 9,875,000 | 14,148,384 | |||||||
Instituto de Credito Oficial Sr. Unsec. Nts., 5%, 5/15/15 | NOK | 85,000,000 | 14,442,235 | |||||||
Kingdom of Spain Bonds: | ||||||||||
3.80%, 4/30/244 | EUR | 15,000,000 | 21,679,926 | |||||||
5.15%, 10/31/444 | EUR | 11,890,000 | 18,873,907 | |||||||
Kingdom of Spain Sr. Unsec. Bonds, 4.50%, 1/31/18 | EUR | 18,675,000 | 28,617,210 | |||||||
|
| |||||||||
| 97,761,662 | ||||||||||
Sri Lanka—0.2% | ||||||||||
Democratic Socialist Republic of Sri Lanka Sr. Unsec. Bonds: | ||||||||||
5.875%, 7/25/224 | 4,085,000 | 4,146,275 | ||||||||
6.00%, 1/14/194 | 7,130,000 | 7,477,588 | ||||||||
6.25%, 10/4/204 | 4,695,000 | 4,964,962 | ||||||||
6.25%, 7/27/214 | 5,120,000 | 5,356,800 | ||||||||
|
| |||||||||
| 21,945,625 | ||||||||||
Tanzania—0.1% | ||||||||||
United Republic of Tanzania Sr. Unsec. Nts., 6.332%, 3/9/201 | 8,165,000 | 8,685,519 | ||||||||
Turkey—1.5% | ||||||||||
Republic of Turkey Bonds: | ||||||||||
5.75%, 3/22/24 | 13,850,000 | 14,397,075 | ||||||||
8.80%, 11/14/18 | TRY | 70,000,000 | 31,160,911 | |||||||
8.80%, 9/27/23 | TRY | 20,000,000 | 8,632,051 | |||||||
Republic of Turkey Sr. Unsec. Bonds: | ||||||||||
4.35%, 11/12/21 | EUR | 6,250,000 | 8,959,030 | |||||||
6.25%, 9/26/22 | 12,810,000 | 13,796,370 | ||||||||
6.625%, 2/17/45 | 15,250,000 | 16,145,938 | ||||||||
6.875%, 3/17/36 | 4,565,000 | 4,965,579 | ||||||||
7.375%, 2/5/25 | 8,130,000 | 9,345,435 | ||||||||
Republic of Turkey Unsec. Bonds: | ||||||||||
5.828%, 2/11/1511 | TRY | 20,680,000 | 13,395,323 | |||||||
18 OPPENHEIMER INTERNATIONAL BOND FUND
| Principal Amount | Value | |||||||||
Turkey (Continued) |
| |||||||||
Republic of Turkey Unsec. Bonds: (Continued) | ||||||||||
6.30%, 2/14/18 | TRY | 32,500,000 | $ | 13,404,332 | ||||||
8.50%, 9/14/22 | TRY | 23,000,000 | 9,835,491 | |||||||
|
| |||||||||
| 144,037,535 | ||||||||||
United Arab Emirates—0.2% | ||||||||||
Emirate of Dubai Sr. Unsec. International Bonds: | ||||||||||
5.591%, 6/22/21 | 13,320,000 | 14,818,500 | ||||||||
7.75%, 10/5/20 | 6,100,000 | 7,649,400 | ||||||||
|
| |||||||||
| 22,467,900 | ||||||||||
United Kingdom—4.0% | ||||||||||
United Kingdom Unsec. Treasury Bonds: | ||||||||||
3.75%, 9/7/21 | GBP | 104,275,000 | 190,177,827 | |||||||
4.00%, 9/7/16 | GBP | 41,200,000 | 73,819,389 | |||||||
4.25%, 12/7/55 | GBP | 15,155,000 | 29,782,197 | |||||||
4.75%, 12/7/38 | GBP | 37,875,000 | 77,175,642 | |||||||
|
| |||||||||
| 370,955,055 | ||||||||||
Uruguay—0.3% | ||||||||||
Oriental Republic of Uruguay Sr. Unsec. Bonds: | ||||||||||
4.50%, 8/14/24 | 22,605,000 | 23,226,638 | ||||||||
7.625%, 3/21/36 | 1,620,000 | 2,081,700 | ||||||||
|
| |||||||||
| 25,308,338 | ||||||||||
Venezuela—0.2% | ||||||||||
Bolivarian Republic of Venezuela Sr. Unsec. Bonds, 13.625%, 8/15/184 | 14,475,000 | 14,185,500 | ||||||||
|
| |||||||||
Total Foreign Government Obligations (Cost $5,539,430,542) |
| 5,616,625,746 | ||||||||
Corporate Bonds and Notes—25.1% | ||||||||||
Consumer Discretionary—0.6% | ||||||||||
Auto Components—0.2% | ||||||||||
GKN Holdings plc, 6.75% Sr. Unsec. Nts., 10/28/19 | GBP | 4,065,000 | 7,904,923 | |||||||
Servus Luxembourg Holding SCA, 7.75% Sr. Sec. Nts., 6/15/184 | EUR | 5,305,000 | 7,839,025 | |||||||
|
| |||||||||
| 15,743,948 | ||||||||||
Automobiles—0.1% | ||||||||||
Daimler Finance North America LLC, 2.375% Sr. Unsec. Nts., 8/1/184 | 6,035,000 | 6,098,247 | ||||||||
Media—0.3% | ||||||||||
Myriad International Holdings BV, 6% Sr. Unsec. Nts., 7/18/204 | 5,225,000 | 5,695,250 | ||||||||
UPC Holding BV, 6.75% Sr. Unsec. Nts., 3/15/234 | EUR | 6,840,000 | 10,327,746 | |||||||
Virgin Media Finance plc, 7% Sr. Unsec. Nts., 4/15/234 | GBP | 3,315,000 | 5,927,502 | |||||||
Virgin Media Secured Finance plc, 6% Sr. Sec. Nts., 4/15/214 | GBP | 2,460,000 | 4,352,386 | |||||||
VTR Finance BV, 6.875% Sr. Sec. Nts., 1/15/244 | 3,080,000 | 3,210,900 | ||||||||
|
| |||||||||
| 29,513,784 | ||||||||||
Textiles, Apparel & Luxury Goods—0.0% | ||||||||||
Levi Strauss & Co., 7.75% Sr. Unsec. Nts., 5/15/18 | EUR | 350,000 | 506,335 | |||||||
19 OPPENHEIMER INTERNATIONAL BOND FUND
STATEMENTOF INVESTMENTS Unaudited / Continued
| Principal Amount | Value | |||||||||||
Consumer Staples—0.3% |
| |||||||||||
Beverages—0.0% |
| |||||||||||
Pernod Ricard SA: | ||||||||||||
4.45% Sr. Unsec. Nts., 1/15/224 | $ | 3,065,000 | $ | 3,211,139 | ||||||||
5.75% Sr. Unsec. Nts., 4/7/214 | 2,550,000 | 2,899,289 | ||||||||||
|
| |||||||||||
| 6,110,428 | ||||||||||||
Food Products—0.3% | ||||||||||||
BRF SA, 5.875% Sr. Unsec. Nts., 6/6/224 | 9,215,000 | 9,560,562 | ||||||||||
Marfrig Overseas Ltd., 9.50% Sr. Unsec. Nts., 5/4/204 | 6,220,000 | 6,305,525 | ||||||||||
MHP SA, 8.25% Sr. Unsec. Nts., 4/2/204 | 10,250,000 | 8,968,750 | ||||||||||
|
| |||||||||||
| 24,834,837 | ||||||||||||
Energy—3.7% | ||||||||||||
Energy Equipment & Services—0.5% | ||||||||||||
North Atlantic Drilling Ltd., 6.05% Sr. Unsec. Nts., 10/30/181,4 | NOK | 21,500,000 | 3,590,634 | |||||||||
Odebrecht Offshore Drilling Finance Ltd., 6.75% Sr. Sec. Nts., 10/1/224 | 12,910,383 | 13,426,798 | ||||||||||
QGOG Constellation SA, 6.25% Sr. Unsec. Nts., 11/9/194 | 10,455,000 | 10,468,069 | ||||||||||
Seadrill Ltd., 6.125% Sr. Unsec. Nts., 9/15/174 | 6,985,000 | 7,316,788 | ||||||||||
Sinopec Group Overseas Development 2013 Ltd., 4.375% Sr. Unsec. Nts., 10/17/234 | 9,390,000 | 9,496,858 | ||||||||||
|
| |||||||||||
| 44,299,147 | ||||||||||||
Oil, Gas & Consumable Fuels—3.2% | ||||||||||||
Afren plc, 6.625% Sr. Sec. Nts., 12/9/204 | 5,670,000 | 5,811,750 | ||||||||||
Alliance Oil Co. Ltd.: | ||||||||||||
7.00% Sr. Unsec. Nts., 5/4/204 | 8,655,000 | 7,573,125 | ||||||||||
9.875% Sr. Unsec. Nts., 3/11/154 | 1,665,000 | 1,681,650 | ||||||||||
CNOOC Curtis Funding No 1 Pty Ltd., 4.50% Sr. Unsec. Nts., 10/3/234 | 9,430,000 | 9,614,498 | ||||||||||
Dolphin Energy Ltd., 5.50% Sr. Sec. Nts., 12/15/214 | 7,720,000 | 8,733,250 | ||||||||||
Ecopetrol SA, 7.625% Sr. Unsec. Nts., 7/23/19 | 2,255,000 | 2,714,456 | ||||||||||
Empresa Nacional del Petroleo: | ||||||||||||
4.75% Sr. Unsec. Nts., 12/6/214 | 10,365,000 | 10,723,484 | ||||||||||
5.25% Sr. Unsec. Nts., 8/10/204 | 5,545,000 | 5,879,896 | ||||||||||
Gazprom Neft OAO Via GPN Capital SA, 6% Sr. Unsec. Nts., 11/27/234 | 5,970,000 | 5,872,988 | ||||||||||
Gazprom OAO Via Gaz Capital SA: | ||||||||||||
3.85% Sr. Unsec. Nts., 2/6/204 | 6,090,000 | 5,739,825 | ||||||||||
4.95% Sr. Unsec. Nts., 7/19/224 | 10,635,000 | 10,023,487 | ||||||||||
Indian Oil Corp. Ltd., 5.75% Sr. Unsec. Nts., 8/1/23 | 5,000,000 | 5,220,400 | ||||||||||
KazMunayGas National Co. JSC: | ||||||||||||
7.00% Sr. Unsec. Nts., 5/5/204 | 2,505,000 | 2,836,912 | ||||||||||
9.125% Sr. Unsec. Nts., 7/2/184 | 6,655,000 | 8,010,956 | ||||||||||
MEG Energy Corp.: | ||||||||||||
6.50% Sr. Unsec. Nts., 3/15/214 | 4,180,000 | 4,420,350 | ||||||||||
7.00% Sr. Unsec. Nts., 3/31/244 | 2,550,000 | 2,703,000 | ||||||||||
Novatek OAO via Novatek Finance Ltd.: | ||||||||||||
4.422% Sr. Unsec. Nts., 12/13/224 | 8,200,000 | 7,287,750 | ||||||||||
7.75% Sr. Unsec. Nts., 2/21/174 | RUB | 61,420,000 | 1,659,299 | |||||||||
Odebrecht Drilling Norbe VIII/IX Ltd., 6.35% Sr. Sec. Nts., 6/30/214 | 1,678,500 | 1,749,836 | ||||||||||
20 OPPENHEIMER INTERNATIONAL BOND FUND
| Principal Amount | Value | |||||||||||
Oil, Gas & Consumable Fuels (Continued) | ||||||||||||
Origin Energy Finance Ltd.: | ||||||||||||
3.50% Sr. Unsec. Nts., 10/9/184 | $ | 6,650,000 | $ | 6,778,179 | ||||||||
5.45% Sr. Unsec. Nts., 10/14/214 | 596,000 | 644,447 | ||||||||||
Pacific Rubiales Energy Corp.: | ||||||||||||
5.125% Sr. Unsec. Nts., 3/28/234 | 9,795,000 | 9,574,613 | ||||||||||
5.375% Sr. Unsec. Nts., 1/26/194 | 9,515,000 | 9,895,600 | ||||||||||
Pemex Project Funding Master Trust, 6.625% Sr. Unsec. Nts., 6/15/35 | 6,190,000 | 6,901,850 | ||||||||||
Pertamina Persero PT, 4.875% Sr. Unsec. Nts., 5/3/224 | 9,375,000 | 9,035,156 | ||||||||||
Petroleos de Venezuela SA: | ||||||||||||
5.375% Sr. Unsec. Nts., 4/12/27 | 9,000,000 | 4,815,000 | ||||||||||
6.00% Sr. Unsec. Nts., 11/15/264 | 17,715,000 | 9,698,963 | ||||||||||
9.00% Sr. Unsec. Nts., 11/17/21 | 15,675,000 | 11,756,250 | ||||||||||
Petroleos Mexicanos: | ||||||||||||
3.50% Sr. Unsec. Nts., 1/30/23 | 8,400,000 | 7,925,400 | ||||||||||
5.50% Sr. Unsec. Nts., 6/27/44 | 6,020,000 | 5,839,400 | ||||||||||
6.375% Sr. Unsec. Nts., 1/23/454 | 10,800,000 | 11,677,500 | ||||||||||
8.00% Sr. Unsec. Nts., 5/3/19 | 23,275,000 | 28,511,875 | ||||||||||
Petroleum Co. of Trinidad & Tobago Ltd.: | ||||||||||||
6.00% Sr. Unsec. Nts., 5/8/224 | 2,659,792 | 2,869,250 | ||||||||||
9.75% Sr. Unsec. Nts., 8/14/194 | 4,665,000 | 5,854,575 | ||||||||||
Petronas Capital Ltd., 7.875% Sr. Unsec. Nts., 5/22/224 | 10,810,000 | 14,175,521 | ||||||||||
Reliance Industries Ltd., 5.875% Sr. Unsec. Perpetual Bonds4,6 | 24,195,000 | 22,198,913 | ||||||||||
Schahin II Finance Co. SPV Ltd., 5.875% Sr. Sec. Nts., 9/25/224 | 11,199,720 | 10,821,730 | ||||||||||
Sibur Securities Ltd., 3.914% Sr. Unsec. Nts., 1/31/184 | 6,725,000 | 6,203,812 | ||||||||||
Tengizchevroil Finance Co. Sarl, 6.124% Sr. Sec. Nts., 11/15/144 | 2,002,296 | 2,035,214 | ||||||||||
Tullow Oil plc, 6% Sr. Unsec. Nts., 11/1/204 | 3,231,000 | 3,295,620 | ||||||||||
|
| |||||||||||
| 298,765,780 | ||||||||||||
Financials—11.0% | ||||||||||||
Capital Markets—0.9% | ||||||||||||
Deutsche Bank AG, 4.296% Jr. Sub. Nts., 5/24/281 | 25,000,000 | 23,603,075 | ||||||||||
Deutsche Bank Capital Trust V, 4.901% Jr. Sub. Perpetual Bonds1,4,6 | 23,100,000 | 22,407,000 | ||||||||||
KION Finance SA, 6.75% Sr. Sec. Nts., 2/15/204 | EUR | 4,170,000 | 6,337,951 | |||||||||
Red de Carreteras de Occidente SAPIB de CV, 9% Sr. Sec. Nts., 6/10/284 | MXN | 151,500,000 | 10,263,486 | |||||||||
UBS AG (Jersey Branch), 7.25% Sub. Nts., 2/22/221 | 19,715,000 | 21,705,827 | ||||||||||
|
| |||||||||||
| 84,317,339 | ||||||||||||
Commercial Banks—7.6% | ||||||||||||
Akbank TAS, 7.50% Sr. Unsec. Nts., 2/5/184 | TRY | 16,795,000 | 6,779,381 | |||||||||
Banco ABC Brasil SA, 8.50% Sr. Unsec. Nts., 3/28/164 | BRL | 8,360,000 | 3,371,265 | |||||||||
Banco Bilbao Vizcaya Argentaria SA, 9% Jr. Sub. Perpetual Bonds1,6 | 2,000,000 | 2,173,500 | ||||||||||
Banco BMG SA, 9.95% Sub. Nts., 11/5/194 | 9,060,000 | 9,331,800 | ||||||||||
Banco del Estado de Chile, 4.125% Sr. Unsec. Nts., 10/7/204 | 11,470,000 | 11,924,625 | ||||||||||
Banco do Brasil SA (Cayman), 9.25% Jr. Sub. Perpetual Bonds1,4,6 | 5,775,000 | 6,251,437 | ||||||||||
Banco do Estado do Rio Grande do Sul SA, 7.375% Sub. Nts., 2/2/224 | 7,685,000 | 7,896,337 | ||||||||||
21 OPPENHEIMER INTERNATIONAL BOND FUND
STATEMENTOF INVESTMENTS Unaudited / Continued
| Principal Amount | Value | |||||||||||
Commercial Banks (Continued) | ||||||||||||
Banco Santander Brasil SA (Cayman Islands), 8% Sr. Unsec. Unsub. Nts., 3/18/164 | BRL | 14,290,000 | $ | 5,880,691 | ||||||||
Bancolombia SA, 5.125% Unsec. Sub. Nts., 9/11/22 | 14,250,000 | 13,965,000 | ||||||||||
Bank of Scotland plc: | ||||||||||||
4.875% Sec. Nts., 12/20/24 | GBP | 8,675,000 | 16,348,020 | |||||||||
4.875% Sec. Nts., 11/8/16 | GBP | 5,170,000 | 9,363,353 | |||||||||
Barclays Bank plc, 6% Jr. Sub. Perpetual Bonds1,6 | GBP | 9,280,000 | 15,076,854 | |||||||||
Barclays plc, 8.25% Jr. Sub. Perpetual Bonds1,6 | 23,000,000 | 24,192,780 | ||||||||||
BBVA Banco Continental SA, 5% Sr. Unsec. Nts., 8/26/224 | 8,075,000 | 8,206,219 | ||||||||||
BNP Paribas SA: | ||||||||||||
5.945% Jr. Sub. Perpetual Bonds1,6 | GBP | 9,965,000 | 17,429,702 | |||||||||
7.195% Jr. Sub. Perpetual Bonds1,4,6 | 15,000,000 | 16,087,500 | ||||||||||
BPCE SA: | ||||||||||||
5.25% Jr. Sub. Perpetual Bonds1,6 | EUR | 2,540,000 | 3,531,949 | |||||||||
5.70% Sub. Nts., 10/22/234 | 4,235,000 | 4,410,710 | ||||||||||
9.00% Jr. Sub. Perpetual Bonds1,6 | EUR | 26,450,000 | 38,686,317 | |||||||||
Brazil Loan Trust 1, 5.477% Sec. Nts., 7/24/234 | 10,265,000 | 10,431,806 | ||||||||||
Commerzbank AG, 8.125% Sub. Nts., 9/19/234 | 12,885,000 | 14,801,644 | ||||||||||
Corp. Financiera de Desarrollo SA, 4.75% Sr. Unsec. Nts., 2/8/224 | 9,315,000 | 9,454,725 | ||||||||||
CorpGroup Banking SA, 6.75% Sr. Unsec. Nts., 3/15/234 | 9,355,000 | 9,214,675 | ||||||||||
Credit Agricole SA: | ||||||||||||
6.637% Jr. Sub. Perpetual Bonds1,4,6 | 3,486,000 | 3,637,641 | ||||||||||
8.375% Jr. Sub. Perpetual Bonds1,4,6 | 39,875,000 | 45,457,500 | ||||||||||
Danske Bank, 5.684% Jr. Sub. Perpetual Bonds1,6 | GBP | 5,495,000 | 9,523,764 | |||||||||
EUROFIMA, 6.25% Sr. Unsec. Nts., 12/28/18 | AUD | 35,270,000 | 35,814,696 | |||||||||
European Investment Bank: | ||||||||||||
6.00% Sr. Unsec. Nts., 8/6/20 | AUD | 15,000,000 | 15,203,582 | |||||||||
6.50% Sr. Unsec. Nts., 8/7/19 | AUD | 20,000,000 | 20,661,711 | |||||||||
Export-Import Bank of India, 4% Sr. Unsec. Nts., 1/14/23 | 4,200,000 | 4,004,154 | ||||||||||
Grupo Aval Ltd.: | ||||||||||||
4.75% Sr. Unsec. Nts., 9/26/224 | 10,935,000 | 10,579,612 | ||||||||||
5.25% Sr. Unsec. Nts., 2/1/174 | 2,915,000 | 3,089,900 | ||||||||||
HBOS Capital Funding LP, 6.461% Jr. Sub. Perpetual Bonds1,6 | GBP | 3,385,000 | 5,986,133 | |||||||||
Hungarian Development Bank, 6.25% Sr. Unsec. Nts., 10/21/204 | 6,400,000 | 6,780,032 | ||||||||||
ICICI Bank Ltd., 6.375% Jr. Sub. Nts., 4/30/221,4 | 7,120,000 | 7,173,400 | ||||||||||
ICICI Bank Ltd. (Dubai), 4.80% Sr. Unsec. Nts., 5/22/194 | 9,410,000 | 9,803,884 | ||||||||||
Intesa Sanpaolo SpA: | ||||||||||||
2.375% Sr. Unsec. Nts., 1/13/17 | 7,390,000 | 7,420,875 | ||||||||||
5.25% Sr. Unsec. Nts., 1/12/24 | 30,000,000 | 30,881,790 | ||||||||||
LBG Capital No.1 plc, 6.439% Sub. Nts., 5/23/20 | EUR | 1,320,000 | 1,920,938 | |||||||||
Lloyds TSB Bank plc, 6% Sec. Nts., 2/8/29 | GBP | 15,365,000 | 31,797,277 | |||||||||
Rabobank Capital Funding Trust IV, 5.556% Jr. Sub. Perpetual Bonds1,4,6 | GBP | 8,355,000 | 14,635,045 | |||||||||
RBS Capital Trust III, 5.512% Jr. Sub. Perpetual Bonds1,6 | 13,697,000 | 13,560,030 | ||||||||||
Royal Bank of Scotland Group plc, 6% Sub. Nts., 12/19/23 | 1,545,000 | 1,587,814 | ||||||||||
Royal Bank of Scotland plc (The): | ||||||||||||
2.375% Sub. Nts., 11/2/15 | CHF | 3,020,000 | 3,483,786 | |||||||||
13.125% Sub. Nts., 3/19/221 | AUD | 30,052,000 | 33,270,776 | |||||||||
Santander UK plc, 5% Sub. Nts., 11/7/234 | 6,530,000 | 6,731,744 | ||||||||||
Scottish Widows plc, 5.125% Jr. Sub. Perpetual Bonds1,6 | GBP | 2,285,000 | 3,841,818 | |||||||||
22 OPPENHEIMER INTERNATIONAL BOND FUND
| Principal Amount | Value | |||||||||||
Commercial Banks (Continued) | ||||||||||||
Skandinaviska Enskilda Banken AB, 2.375% Sr. Unsec. Nts., 11/20/184 | $ | 6,100,000 | $ | 6,102,013 | ||||||||
Societe Generale SA: | ||||||||||||
5.00% Sub. Nts., 1/17/244 | 4,540,000 | 4,533,549 | ||||||||||
5.922% Jr. Sub. Perpetual Bonds1,4,6 | 12,565,000 | 13,429,422 | ||||||||||
7.875% Jr. Sub. Perpetual Bonds1,4,6 | 12,120,000 | 12,607,830 | ||||||||||
8.25% Jr. Sub. Perpetual Bonds1,6 | 5,000,000 | 5,401,625 | ||||||||||
Stadshypotek AB, 6% Sec. Nts., 6/21/17 | SEK | 169,000,000 | 29,782,728 | |||||||||
Standard Chartered plc: | ||||||||||||
5.20% Sub. Nts., 1/26/244 | 10,000,000 | 10,287,680 | ||||||||||
5.70% Sub. Nts., 3/26/444 | 30,000,000 | 29,775,000 | ||||||||||
Toronto-Dominion Bank (The), 2.625% Sr. Unsec. Nts., 9/10/18 | 6,125,000 | 6,281,451 | ||||||||||
|
| |||||||||||
| 709,859,490 | ||||||||||||
Consumer Finance—0.0% | ||||||||||||
Astana Finance JSC, 9.16% Sr. Unsec. Nts., 3/14/127 | 14,000,000 | 857,500 | ||||||||||
Diversified Financial Services—1.4% | ||||||||||||
ABN AMRO Bank NV, 4.31% Jr. Sub. Perpetual Bonds1,6 | EUR | 11,455,000 | 16,058,884 | |||||||||
AG Spring Finance II Ltd., 9.50% Sr. Sec. Nts., 6/1/194 | EUR | 1,190,000 | 1,750,063 | |||||||||
AG Spring Finance Ltd., 7.50% Sr. Sec. Nts., 6/1/184 | EUR | 1,430,000 | 2,114,345 | |||||||||
AyT Cedulas Cajas X Fondo de Titulizacion, 3.75% Sec. Nts., 6/30/25 | EUR | 5,000,000 | 6,952,931 | |||||||||
Baggot Securities Ltd., 10.24% Sec. Perpetual Bonds6 | EUR | 4,595,000 | 6,903,827 | |||||||||
Baggot Securities Ltd., 10.24% Sec. Perpetual Bonds4,6 | EUR | 3,000,000 | 4,507,395 | |||||||||
Banco BTG Pactual SA (Cayman Islands): | ||||||||||||
4.00% Sr. Unsec. Nts., 1/16/204 | 15,715,000 | 14,772,100 | ||||||||||
5.75% Sub. Nts., 9/28/224 | 9,105,000 | 8,547,319 | ||||||||||
Banco Invex SA/Hipotecaria Credito y Casa SA de CV, 6.45% Sec. Nts., 3/13/347,11 | MXN | 27,602,566 | 375,903 | |||||||||
Cedulas TDA 6 Fondo de Titulizacion de Activos, 3.875% Sec. Nts., 5/23/25 | EUR | 5,000,000 | 7,011,267 | |||||||||
Columbus International, Inc., 7.375% Sr. Unsec. Nts., 3/30/214 | 2,595,000 | 2,676,094 | ||||||||||
Export Credit Bank of Turkey, 5.875% Sr. Unsec. Nts., 4/24/194 | 23,865,000 | 24,854,204 | ||||||||||
FTE Verwaltungs GmbH, 9% Sr. Sec. Nts., 7/15/204 | EUR | 3,290,000 | 5,079,197 | |||||||||
ING Verzekeringen NV, 6.375% Sub. Nts., 5/7/271 | EUR | 6,400,000 | 9,658,759 | |||||||||
JPMorgan Hipotecaria su Casita: | ||||||||||||
6.10% Sec. Nts., 9/25/3511 | MXN | 7,528,131 | 794,170 | |||||||||
6.47% Sec. Nts., 8/26/358,11 | MXN | 34,101,099 | 252,772 | |||||||||
Magyar Export-Import Bank Zrt, 5.50% Sr. Unsec. Nts., 2/12/184 | 8,720,000 | 9,199,600 | ||||||||||
National Savings Bank, 8.875% Sr. Unsec. Nts., 9/18/184 | 4,875,000 | 5,460,000 | ||||||||||
SPCM SA, 5.50% Sr. Unsec. Nts., 6/15/204 | EUR | 775,000 | 1,158,431 | |||||||||
|
| |||||||||||
| 128,127,261 | ||||||||||||
Insurance—0.6% | ||||||||||||
Assicurazioni Generali SpA, 7.75% Sr. Sub. Nts., 12/12/421 | EUR | 2,000,000 | 3,296,028 | |||||||||
Aviva plc: | ||||||||||||
5.902% Jr. Sub. Perpetual Bonds1,6 | GBP | 1,020,000 | 1,737,904 | |||||||||
6.125% Jr. Sub. Perpetual Bonds1,6 | GBP | 6,890,000 | 12,003,563 | |||||||||
AXA SA, 6.379% Jr. Sub. Perpetual Bonds1,4,6 | 20,000,000 | 21,225,000 | ||||||||||
Swiss Re Capital I LP, 6.854% Jr. Sub. Perpetual Bonds1,4,6 | 13,145,000 | 14,130,875 | ||||||||||
23 OPPENHEIMER INTERNATIONAL BOND FUND
STATEMENTOF INVESTMENTS Unaudited / Continued
| Principal Amount | Value | |||||||||
Insurance (Continued) |
| |||||||||
Swiss Reinsurance Co. via ELM BV, 3.775% Jr. Sub. Perpetual Bonds1,6 | AUD | 10,000,000 | $ | 8,896,529 | ||||||
|
| |||||||||
| 61,289,899 | ||||||||||
Real Estate Investment Trusts (REITs)—0.0% | ||||||||||
TRUST F/1401, 5.25% Sr. Unsec. Nts., 12/15/244 | 3,665,000 | 3,665,000 | ||||||||
Real Estate Management & Development—0.5% | ||||||||||
Agile Property Holdings Ltd., 9.875% Sr. Unsec. Nts., 3/20/17 | 5,000,000 | 5,237,500 | ||||||||
Country Garden Holdings Co. Ltd., 7.50% Sr. Unsec. Unsub. Nts., 1/10/234 | 10,910,000 | 10,200,850 | ||||||||
Fondo MIVIVIENDA SA, 3.50% Sr. Unsec. Nts., 1/31/234 | 14,340,000 | 13,264,500 | ||||||||
Jafz Sukuk Ltd., 7% Sr. Unsec. Nts., 6/19/19 | 9,275,000 | 10,712,625 | ||||||||
Techem GmbH, 6.125% Sr. Sec. Nts., 10/1/194 | EUR | 2,635,000 | 3,970,321 | |||||||
|
| |||||||||
| 43,385,796 | ||||||||||
Health Care—0.0% | ||||||||||
Health Care Equipment & Supplies—0.0% | ||||||||||
ConvaTec Healthcare D Sarl, 10.875% Sr. Unsec. Nts., 12/15/184 | EUR | 3,140,000 | 4,830,039 | |||||||
Industrials—1.5% | ||||||||||
Airlines—0.2% | ||||||||||
Emirates Airline, 4.50% Sr. Unsec. Nts., 2/6/254 | 21,415,000 | 20,772,550 | ||||||||
Construction & Engineering—0.4% | ||||||||||
Andrade Gutierrez International SA, 4% Sr. Unsec. Nts., 4/30/184 | 8,555,000 | 8,533,612 | ||||||||
IIRSA Norte Finance Ltd., 8.75% Sr. Sec. Nts., 5/30/244 | 13,115,993 | 15,378,502 | ||||||||
OAS Investments GmbH, 8.25% Sr. Nts., 10/19/194 | 13,330,000 | 13,429,975 | ||||||||
Odebrecht Finance Ltd., 8.25% Sr. Unsec. Nts., 4/25/184 | BRL | 9,645,000 | 3,570,648 | |||||||
|
| |||||||||
| 40,912,737 | ||||||||||
Electrical Equipment—0.1% | ||||||||||
Orion Engineered Carbons Bondco GmbH, 10% Sr. Sec. Nts., 6/15/184 | EUR | 3,195,000 | 4,814,461 | |||||||
Industrial Conglomerates—0.4% | ||||||||||
Alfa SAB de CV, 5.25% Sr. Unsec. Nts., 3/25/244 | 4,100,000 | 4,212,750 | ||||||||
General Electric Capital Australia Funding Pty Ltd., 7% Sr. Unsec. Nts., 10/8/15 | AUD | 23,660,000 | 23,116,151 | |||||||
Hutchison Whampoa Ltd., 3.75% Perpetual Bonds1,6 | EUR | 4,000,000 | 5,434,003 | |||||||
|
| |||||||||
| 32,762,904 | ||||||||||
Marine—0.0% | ||||||||||
Drill Rigs Holdings, Inc., 6.50% Sr. Sec. Nts., 10/1/174 | 3,630,000 | 3,802,425 | ||||||||
Road & Rail—0.3% | ||||||||||
Kazakhstan Temir Zholy Finance BV, 6.375% Sr. Unsec. Nts., 10/6/204 | 6,215,000 | 6,805,425 | ||||||||
REFER-Rede Ferroviaria Nacional, 4% Sr. Unsec. Nts., 3/16/15 | EUR | 17,945,000 | 25,340,274 | |||||||
|
| |||||||||
| 32,145,699 | ||||||||||
24 OPPENHEIMER INTERNATIONAL BOND FUND
| Principal Amount | Value | |||||||||||
Transportation Infrastructure—0.1% |
| |||||||||||
Empresa de Transporte de Pasajeros Metro SA, 4.75% Unsec. Nts., 2/4/244 | $ | 4,855,000 | $ | 5,055,390 | ||||||||
Information Technology—0.1% | ||||||||||||
Internet Software & Services—0.1% | ||||||||||||
Cerved Group SpA, 6.375% Sr. Sec. Nts., 1/15/204 | EUR | 4,275,000 | 6,404,781 | |||||||||
Materials—2.6% | ||||||||||||
Chemicals—0.3% | ||||||||||||
Braskem Finance Ltd., 5.375% Sr. Unsec. Nts., 5/2/224 | 14,565,000 | 14,237,287 | ||||||||||
Mexichem SAB de CV, 4.875% Sr. Unsec. Nts., 9/19/224 | 9,800,000 | 9,824,500 | ||||||||||
|
| |||||||||||
| 24,061,787 | ||||||||||||
Construction Materials—1.0% | ||||||||||||
Calcipar SA, 6.875% Sr. Sec. Nts., 5/1/184 | 380,000 | 406,600 | ||||||||||
Cemex Espana Luxembourg: | ||||||||||||
9.25% Sr. Sec. Nts., 5/12/204 | 24,830,000 | 27,375,075 | ||||||||||
9.875% Sr. Sec. Nts., 4/30/194 | 9,955,000 | 11,597,575 | ||||||||||
Cemex Finance LLC: | ||||||||||||
6.00% Sr. Sec. Nts., 4/1/244,9 | 24,735,000 | 24,858,675 | ||||||||||
9.375% Sr. Sec. Nts., 10/12/224 | 20,155,000 | 23,757,706 | ||||||||||
HeidelbergCement Finance Luxembourg SA: | ||||||||||||
7.50% Sr. Unsec. Nts., 4/3/20 | EUR | 1,550,000 | 2,650,512 | |||||||||
8.00% Sr. Unsec. Nts., 1/31/17 | EUR | 1,850,000 | 2,979,757 | |||||||||
Lafarge SA, 5.375% Sr. Unsec. Nts., 6/26/17 | EUR | 1,375,000 | 2,089,879 | |||||||||
|
| |||||||||||
| 95,715,779 | ||||||||||||
Containers & Packaging—0.1% | ||||||||||||
Cascades, Inc., 7.875% Sr. Unsec. Nts., 1/15/20 | 4,600,000 | 4,945,000 | ||||||||||
Smurfit Kappa Acquisitions: | ||||||||||||
4.875% Sr. Sec. Nts., 9/15/184 | 2,950,000 | 3,141,750 | ||||||||||
7.75% Sr. Sec. Nts., 11/15/194 | EUR | 3,475,000 | 5,163,379 | |||||||||
|
| |||||||||||
| 13,250,129 | ||||||||||||
Metals & Mining—1.2% | ||||||||||||
ALROSA Finance SA, 7.75% Sr. Unsec. Nts., 11/3/204 | 13,610,000 | 14,494,650 | ||||||||||
CSN Islands XI Corp., 6.875% Sr. Unsec. Nts., 9/21/194 | 5,530,000 | 5,806,500 | ||||||||||
Evraz Group SA, 6.50% Sr. Unsec. Nts., 4/22/204 | 5,240,000 | 4,427,800 | ||||||||||
Ferrexpo Finance plc, 7.875% Sr. Unsec. Nts., 4/7/164 | 12,720,000 | 12,402,000 | ||||||||||
FMG Resources August 2006 Pty Ltd.: | ||||||||||||
6.875% Sr. Unsec. Nts., 2/1/184 | 4,615,000 | 4,874,594 | ||||||||||
8.25% Sr. Unsec. Nts., 11/1/194 | 2,330,000 | 2,571,737 | ||||||||||
Gerdau Trade, Inc., 5.75% Sr. Unsec. Nts., 1/30/214 | 8,035,000 | 8,276,050 | ||||||||||
Gestamp Funding Luxembourg SA, 5.875% Sr. Sec. Nts., 5/31/204 | EUR | 4,415,000 | 6,508,087 | |||||||||
Metalloinvest Finance Ltd., 5.625% Unsec. Nts., 4/17/204 | 6,710,000 | 6,340,950 | ||||||||||
Mexico Generadora de Energia S de RL, 5.50% Sr. Sec. Nts., 12/6/324 | 9,120,000 | 8,983,200 | ||||||||||
MMC Norilsk Nickel OJSC via MMC Finance Ltd., 5.55% Sr. Unsec. Nts., 10/28/204 | 10,440,000 | 10,309,500 | ||||||||||
Polyus Gold International Ltd., 5.625% Sr. Unsec. Nts., 4/29/204 | 6,185,000 | 5,798,438 | ||||||||||
Samarco Mineracao SA, 5.75% Sr. Unsec. Nts., 10/24/234 | 7,550,000 | 7,616,063 | ||||||||||
25 OPPENHEIMER INTERNATIONAL BOND FUND
STATEMENTOF INVESTMENTS Unaudited / Continued
| Principal Amount | Value | |||||||||||
Metals & Mining (Continued) |
| |||||||||||
Severstal OAO Via Steel Capital SA, 4.45% Sr. Unsec. Nts., 3/19/184 | $ | 5,730,000 | $ | 5,615,400 | ||||||||
Xstrata Finance Canada Ltd., 2.05% Sr. Unsec. Nts., 10/23/154 | 6,075,000 | 6,147,177 | ||||||||||
|
| |||||||||||
| 110,172,146 | ||||||||||||
Telecommunication Services—2.1% | ||||||||||||
Diversified Telecommunication Services—1.1% | ||||||||||||
Colombia Telecomunicaciones SA ESP, 5.375% Sr. Unsec. Nts., 9/27/224 | 4,270,000 | 4,195,275 | ||||||||||
Deutsche Telekom International Finance BV, 4.875% Sr. Unsec. Nts., 3/6/424 | 6,125,000 | 6,184,602 | ||||||||||
Koninklijke KPN NV, 8.375% Sr. Unsec. Nts., 10/1/30 | 7,390,000 | 9,986,181 | ||||||||||
Koninklijke KPN NV, 6.125% Sr. Sub. Perpetual Bonds1,6 | EUR | 5,350,000 | 7,705,782 | |||||||||
Oi SA: | ||||||||||||
5.75% Sr. Unsec. Nts., 2/10/224 | 15,825,000 | 15,310,687 | ||||||||||
9.75% Sr. Unsec. Nts., 9/15/164 | BRL | 19,740,000 | 7,895,130 | |||||||||
Portugal Telecom International Finance BV: | ||||||||||||
4.625% Sr. Unsec. Nts., 5/8/20 | EUR | 4,590,000 | 6,692,479 | |||||||||
5.00% Sr. Unsec. Nts., 11/4/19 | EUR | 1,530,000 | 2,293,458 | |||||||||
5.625% Sr. Unsec. Nts., 2/8/16 | EUR | 2,425,000 | 3,595,801 | |||||||||
Telecom Italia Capital SA, 7.721% Sr. Unsec. Unsub. Nts., 6/4/38 | 11,837,000 | 12,724,775 | ||||||||||
Telefonica Chile SA, 3.875% Sr. Unsec. Nts., 10/12/224 | 3,995,000 | 3,806,468 | ||||||||||
Telefonica Emisiones SAU, 7.045% Sr. Unsec. Unsub. Nts., 6/20/36 | 4,360,000 | 5,309,412 | ||||||||||
Telefonica Europe BV, 6.50% Sr. Sub. Perpetual Bonds1,6 | EUR | 9,080,000 | 13,378,442 | |||||||||
Telekom Austria AG, 5.625% Sub. Perpetual Bonds1,6 | EUR | 3,435,000 | 5,033,212 | |||||||||
|
| |||||||||||
| 104,111,704 | ||||||||||||
Wireless Telecommunication Services—1.0% | ||||||||||||
America Movil SAB de CV, 8.46% Sr. Unsec. Nts., 12/18/36 | MXN | 140,800,000 | 10,282,719 | |||||||||
Digicel Group Ltd.: | ||||||||||||
7.125% Sr. Unsec. Nts., 4/1/224,9 | 4,335,000 | 4,394,606 | ||||||||||
8.25% Sr. Unsec. Nts., 9/30/204 | 9,765,000 | 10,472,963 | ||||||||||
ENTEL Chile SA, 4.875% Sr. Unsec. Nts., 10/30/244 | 9,440,000 | 9,541,782 | ||||||||||
Millicom International Cellular SA, 6.625% Sr. Unsec. Nts., 10/15/214 | 3,015,000 | 3,203,438 | ||||||||||
Mobile Telesystems OJSC via MTS International Funding Ltd., 5% Sr. Unsec. Nts., 5/30/234 | 8,570,000 | 7,970,100 | ||||||||||
Sistema JSFC via Sistema International Funding SA, 6.95% Sr. Unsec. Nts., 5/17/194 | 5,085,000 | 5,262,975 | ||||||||||
Vimpel Communications Via VIP Finance Ireland Ltd. OJSC, 9.125% Sr. Unsec. Nts., 4/30/184 | 12,410,000 | 13,713,050 | ||||||||||
VimpelCom Holdings BV: | ||||||||||||
7.504% Sr. Unsec. Nts., 3/1/224 | 17,320,000 | 17,728,752 | ||||||||||
9.00% Sr. Unsec. Nts., 2/13/184 | RUB | 128,400,000 | 3,524,203 | |||||||||
Vimpel-Communications OJSC, 8.85% Sr. Unsec. Nts., 3/8/221 | RUB | 95,300,000 | 2,710,822 | |||||||||
|
| |||||||||||
| 88,805,410 | ||||||||||||
Utilities—3.2% | ||||||||||||
Electric Utilities—2.3% | ||||||||||||
Bhira Investments Ltd., 8.50% Jr. Sub. Nts., 4/27/711 | 3,500,000 | 3,575,695 | ||||||||||
26 OPPENHEIMER INTERNATIONAL BOND FUND
| Principal Amount | Value | |||||||||||
Electric Utilities (Continued) |
| |||||||||||
EDP Finance BV: | ||||||||||||
5.25% Sr. Unsec. Nts., 1/14/214 | $ | 575,000 | $ | 594,550 | ||||||||
6.00% Sr. Unsec. Nts., 2/2/184 | 7,180,000 | 7,808,250 | ||||||||||
Electricite de France SA: | ||||||||||||
5.25% Jr. Sub. Perpetual Bonds1,4,6 | 39,945,000 | 40,104,780 | ||||||||||
5.625% Jr. Sub. Perpetual Bonds1,4,6 | 9,730,000 | 9,811,537 | ||||||||||
Empresas Publicas de Medellin ESP: | ||||||||||||
7.625% Sr. Unsec. Nts., 7/29/194 | 6,255,000 | 7,474,725 | ||||||||||
8.375% Sr. Unsec. Nts., 2/1/214 | COP | 4,300,190,000 | 2,289,725 | |||||||||
Enel SpA, 5% Sub. Nts., 1/15/751 | EUR | 4,880,000 | 6,868,073 | |||||||||
Eskom Holdings Ltd., 6.75% Sr. Unsec. Nts., 8/6/234 | 16,130,000 | 16,943,113 | ||||||||||
Iberdrola International BV, 5.75% Sub. Perpetual Bonds1,6 | EUR | 5,040,000 | 7,394,674 | |||||||||
Israel Electric Corp. Ltd.: | ||||||||||||
6.70% Sr. Sec. Nts., 2/10/174 | 13,675,000 | 14,946,775 | ||||||||||
7.25% Sr. Sec. Nts., 1/15/194 | 63,540,000 | 71,244,225 | ||||||||||
9.375% Sr. Sec. Nts., 1/28/204 | 3,030,000 | 3,738,263 | ||||||||||
National Power Corp., 5.875% Sr. Unsec. Nts., 12/19/16 | PHP | 665,100,000 | 15,835,149 | |||||||||
Perusahaan Listrik Negara PT, 5.50% Sr. Unsec. Nts., 11/22/214 | 9,380,000 | 9,520,700 | ||||||||||
|
| |||||||||||
| 218,150,234 | ||||||||||||
Gas Utilities—0.2% | ||||||||||||
Empresa de Energia de Bogota SA, 6.125% Sr. Unsec. Nts., 11/10/214 | 8,195,000 | 8,809,625 | ||||||||||
Gas Natural Capital Markets SA, 4.375% Sr. Unsec. Nts., 11/2/16 | EUR | 3,930,000 | 5,868,673 | |||||||||
Gas Natural de Lima y Callao SA, 4.375% Sr. Unsec. Nts., 4/1/234 | 5,100,000 | 4,813,125 | ||||||||||
Transportadora de Gas Internacional SA ESP, 5.70% Sr. Unsec. Nts., 3/20/224 | 4,180,000 | 4,368,100 | ||||||||||
|
| |||||||||||
| 23,859,523 | ||||||||||||
Independent Power and Renewable Electricity Producers—0.5% | ||||||||||||
Colbun SA, 6% Sr. Unsec. Nts., 1/21/204 | 15,410,000 | 17,004,627 | ||||||||||
Comision Federal de Electricidad, 4.875% Sr. Unsec. Nts., 1/15/244 | 10,970,000 | 11,161,975 | ||||||||||
Edison SpA, 3.875% Sr. Unsec. Nts., 11/10/17 | EUR | 3,670,000 | 5,525,675 | |||||||||
Infinis plc, 7% Sr. Sec. Nts., 2/15/194 | GBP | 3,810,000 | 6,939,387 | |||||||||
Power Sector Assets & Liabilities Management Corp., 7.39% Sr. Unsec. Nts., 12/2/244 | 3,000,000 | 3,783,900 | ||||||||||
|
| |||||||||||
| 44,415,564 | ||||||||||||
Multi-Utilities—0.2% | ||||||||||||
National Grid North America, Inc., 1.75% Sr. Unsec. Nts., 2/20/18 | EUR | 4,340,000 | 6,084,734 | |||||||||
NGG Finance plc, 4.25% Sub. Nts., 6/18/761 | EUR | 6,805,000 | 9,653,483 | |||||||||
|
| |||||||||||
| 15,738,217 | ||||||||||||
|
| |||||||||||
Total Corporate Bonds and Notes (Cost $2,326,783,050) |
| 2,347,156,270 | ||||||||||
Structured Securities—0.4% | ||||||||||||
Credit Suisse First Boston International, Moitk Total Return Linked Nts., 21%, 3/30/117 | RUB | 220,242,600 | — | |||||||||
27 OPPENHEIMER INTERNATIONAL BOND FUND
STATEMENTOF INVESTMENTS Unaudited / Continued
| Principal Amount | Value | |||||||||
Structured Securities (Continued) | ||||||||||
Credit Suisse First Boston, Inc. (Nassau Branch), Russian Specialized Construction & Installation Administration Total Return Linked Nts., 13%, 5/24/107 | RUB | 64,600,000 | $ | — | ||||||
Deutsche Bank AG, Opic Reforma I Credit Linked Nts.: | ||||||||||
Cl. 2A, 7.208%, 5/22/158 | MXN | 1,273,571 | 91,551 | |||||||
Cl. 2B, 7.208%, 5/22/158 | MXN | 2,228,143 | 160,171 | |||||||
Cl. 2C, 7.208%, 5/22/158 | MXN | 33,594,990 | 2,414,990 | |||||||
Cl. 2D, 7.208%, 5/22/158 | MXN | 2,448,356 | 176,001 | |||||||
Cl. 2E, 7.208%, 5/22/158 | MXN | 1,778,777 | 127,868 | |||||||
Cl. 2F, 7.208%, 5/22/158 | MXN | 1,136,016 | 81,663 | |||||||
Cl. 2G, 7.208%, 5/22/158 | MXN | 209,207 | 15,039 | |||||||
Deutsche Bank AG, Coriolanus Ltd. Sec. Credit Linked Bonds: | ||||||||||
3.01%, 4/30/254,5 | 3,799,298 | 2,607,337 | ||||||||
3.138%, 4/30/254,5 | 3,735,797 | 2,563,759 | ||||||||
3.191%, 4/30/254,5 | 4,651,371 | 3,192,088 | ||||||||
3.242%, 4/30/254,5 | 5,308,833 | 3,643,283 | ||||||||
3.269%, 4/30/254,5 | 4,241,136 | 2,910,557 | ||||||||
3.346%, 4/30/254,5 | 3,986,488 | 2,735,800 | ||||||||
3.797%, 4/30/254,5 | 4,840,890 | 3,322,149 | ||||||||
3.894%, 4/30/251,4 | 4,179,333 | 2,868,143 | ||||||||
Goldman Sachs Capital Markets LP, Republic of Colombia Credit Linked Nts., | COP | 7,259,000,000 | 4,624,072 | |||||||
LB Peru Trust II Certificates, Series 1998-A, 3.795%, 2/28/167 | 11,734 | — | ||||||||
Morgan Stanley, Russian Federation Total Return Linked Bonds, Series 007, | RUB | 209,149,152 | 2,990,968 | |||||||
|
| |||||||||
Total Structured Securities (Cost $50,744,697) | 34,525,439 | |||||||||
Short-Term Notes—2.6% | ||||||||||
Bank Negara Malaysia Monetary Unsec. Nts.: | ||||||||||
2.855%, 5/22/145 | MYR | 21,585,000 | 6,583,784 | |||||||
2.876%, 6/17/145 | MYR | 29,815,000 | 9,073,639 | |||||||
2.905%, 8/5/145 | MYR | 29,815,000 | 9,037,930 | |||||||
2.919%, 7/24/145 | MYR | 186,200,000 | 56,498,058 | |||||||
2.924%, 7/10/145 | MYR | 15,650,000 | 4,753,977 | |||||||
Korea Monetary Stabilization Bonds: | ||||||||||
2.72%, 12/9/14 | KRW | 29,369,000,000 | 27,610,061 | |||||||
2.73%, 11/9/14 | KRW | 17,981,000,000 | 16,903,626 | |||||||
United States Treasury Bills: | ||||||||||
0.04%, 5/29/145 | 60,000,000 | 59,996,133 | ||||||||
0.041%, 6/5/145 | 54,530,000 | 54,528,528 | ||||||||
|
| |||||||||
Total Short-Term Notes (Cost $244,645,832) | 244,985,736 | |||||||||
28 OPPENHEIMER INTERNATIONAL BOND FUND
| Counterparty | Exercise Price | Expiration Date | Contracts | Value | ||||||||||||||||||||||||
Over-the-Counter Options Purchased—0.7% | ||||||||||||||||||||||||||||
AUD Currency Call10 | GSG | NZD | 1.075 | 6/12/14 | AUD | 100,000,000 | $ | 945,413 | ||||||||||||||||||||
AUD Currency Put10 | GSG | USD | 0.840 | 4/16/14 | AUD | 210,000,000 | — | |||||||||||||||||||||
AUD Currency Put10 | GSG | USD | 0.850 | 11/10/14 | AUD | 150,000,000 | 1,458,450 | |||||||||||||||||||||
AUD Currency Put10 | GSG | CAD | 1.000 | 6/27/14 | AUD | 100,000,000 | 794,618 | |||||||||||||||||||||
AUD Currency Put10 | BOA | USD | 0.840 | 12/4/14 | AUD | 150,000,000 | 1,458,900 | |||||||||||||||||||||
BRL Currency Put10 | CITNA-B | BRL | 2.510 | 4/15/14 | BRL | 75,450,000 | 226 | |||||||||||||||||||||
BRL Currency Put10 | GSG | BRL | 2.340 | 4/24/14 | BRL | 175,500,000 | 302,211 | |||||||||||||||||||||
CAD Currency Put10 | TDB | CAD | 1.150 | 5/9/14 | CAD | 83,000,000 | 60,258 | |||||||||||||||||||||
CAD Currency Put10 | JPM | CAD | 1.194 | 1/23/15 | CAD | 238,800,000 | 1,495,127 | |||||||||||||||||||||
CNH Currency Call10 | JPM | CNH | 6.147 | 10/16/14 | CNH | 580,550,000 | 123,657 | |||||||||||||||||||||
CNH Currency Call10 | BOA | CNH | 6.000 | 2/18/15 | CNH | 600,000,000 | 25,200 | |||||||||||||||||||||
CNH Currency Call10 | BOA | CNH | 6.000 | 2/25/15 | CNH | 900,000,000 | 41,400 | |||||||||||||||||||||
CNH Currency Put10 | BOA | CNH | 6.250 | 2/18/15 | CNH | 625,000,000 | 855,625 | |||||||||||||||||||||
CNH Currency Call10 | BOA | CNH | 6.152 | 1/5/16 | CNH | 769,000,000 | 742,854 | |||||||||||||||||||||
CNH Currency Put10 | JPM | CNH | 6.153 | 1/12/16 | CNH | 370,200,000 | 1,427,861 | |||||||||||||||||||||
EUR Currency Call10 | MOS-A | USD | 1.462 | 3/18/15 | EUR | 150,000,000 | 1,670,850 | |||||||||||||||||||||
EUR Currency Put10 | BAC | USD | 1.320 | 8/14/14 | EUR | 75,000,000 | 500,250 | |||||||||||||||||||||
EUR Currency Put10 | GSG | GBP | 0.815 | 5/15/14 | EUR | 75,000,000 | 365,595 | |||||||||||||||||||||
EUR Currency Put10 | BOA | USD | 1.310 | 3/6/15 | EUR | 250,000,000 | 4,247,000 | |||||||||||||||||||||
29 OPPENHEIMER INTERNATIONAL BOND FUND
STATEMENTOF INVESTMENTS Unaudited / Continued
| Counterparty | Exercise Price | Expiration Date | Contracts | Value | ||||||||||||||||||||||||
Over-the-Counter Options Purchased (Continued) |
| |||||||||||||||||||||||||||
EUR Currency Put10 | GSG | USD | 1.300 | 2/25/15 | EUR | 150,000,000 | $ | 2,179,050 | ||||||||||||||||||||
EUR Currency Put10 | JPM | USD | 1.342 | 6/27/14 | EUR | 100,000,000 | 654,000 | |||||||||||||||||||||
EUR Currency Put10 | CITNA-B | USD | 1.340 | 7/10/14 | EUR | 100,000,000 | 732,400 | |||||||||||||||||||||
EUR Currency Put10 | BOA | USD | 1.302 | 5/23/14 | EUR | 194,375,000 | 73,279 | |||||||||||||||||||||
EUR Currency Put10 | GSG | HUF | 305.000 | 4/29/14 | EUR | 21,525,000 | 136,138 | |||||||||||||||||||||
EUR Currency Put10 | GSG | JPY | 135.500 | 5/1/14 | EUR | 75,000,000 | 109,049 | |||||||||||||||||||||
GBP Currency Put10 | BAC | USD | 1.583 | 2/25/15 | GBP | 100,000,000 | 1,797,900 | |||||||||||||||||||||
GBP Currency Put10 | BAC | USD | 1.630 | 6/27/14 | GBP | 50,000,000 | 382,800 | |||||||||||||||||||||
GBP Currency Call10 | BAC | USD | 1.679 | 5/22/14 | GBP | 90,000,000 | 846,900 | |||||||||||||||||||||
GBP Currency Put10 | GSG | CAD | 1.820 | 6/6/14 | GBP | 100,000,000 | 1,571,382 | |||||||||||||||||||||
GBP Currency Put10 | BAC | USD | 1.580 | 2/25/15 | GBP | 100,000,000 | 1,740,500 | |||||||||||||||||||||
IDR Currency Call10 | GSG | IDR | 12000.000 | 2/5/15 | IDR | 600,000,000,000 | 1,800,000 | |||||||||||||||||||||
IDR Currency Call10 | GSG | IDR | 12000.000 | 2/16/15 | IDR | 900,000,000,000 | 2,700,000 | |||||||||||||||||||||
INR Currency Put10 | BOA | INR | 62.000 | 7/1/14 | INR | 3,100,000,000 | 923,800 | |||||||||||||||||||||
INR Currency Call10 | JPM | INR | 59.900 | 6/10/14 | INR | 3,578,000,000 | 690,554 | |||||||||||||||||||||
JPY Currency Call10 | GSG | JPY | 101.000 | 4/14/14 | JPY | 50,500,000,000 | 606,000 | |||||||||||||||||||||
30 OPPENHEIMER INTERNATIONAL BOND FUND
| Counterparty | Exercise Price | Expiration Date | Contracts | Value | ||||||||||||||||||||||||
Over-the-Counter Options Purchased (Continued) |
| |||||||||||||||||||||||||||
JPY Currency Put10 | BOA | KRW | 10.195 | 4/30/15 | JPY | 5,000,000,000 | $ | 1,575,592 | ||||||||||||||||||||
JPY Currency Put10 | JPM | KRW | 10.100 | 5/7/15 | JPY | 5,000,000,000 | 1,503,148 | |||||||||||||||||||||
JPY Currency Put10 | BOA | KRW | 9.900 | 5/7/15 | JPY | 5,000,000,000 | 1,031,247 | |||||||||||||||||||||
JPY Currency Put10 | GSG | JPY | 108.000 | 5/22/15 | JPY | 21,365,000,000 | 4,294,365 | |||||||||||||||||||||
JPY Currency Put10 | BAC | JPY | 103.750 | 4/1/14 | JPY | 12,968,750,000 | 51,875 | |||||||||||||||||||||
JPY Currency Call10 | BOA | JPY | 98.500 | 6/18/14 | JPY | 19,700,000,000 | 650,100 | |||||||||||||||||||||
JPY Currency Put10 | GSG | JPY | 104.000 | 9/7/15 | JPY | 20,800,000,000 | 8,008,000 | |||||||||||||||||||||
JPY Currency Call10 | JPM | JPY | 100.200 | 4/1/14 | JPY | 12,525,000,000 | — | |||||||||||||||||||||
JPY Currency Call10 | BOA | JPY | 101.000 | 5/15/14 | JPY | 20,200,000,000 | 909,000 | |||||||||||||||||||||
KRW Currency Call10 | BOA | KRW | 1035.000 | 2/2/15 | KRW | 103,500,000,000 | 1,242,000 | |||||||||||||||||||||
KRW Currency Call10 | BOA | KRW | 1035.000 | 2/2/15 | KRW | 103,500,000,000 | 1,242,000 | |||||||||||||||||||||
MXN Currency Call10 | GSG | MXN | 13.000 | 6/6/14 | MXN | 4,875,000,000 | 4,060,875 | |||||||||||||||||||||
MYR Currency Call10 | BOA | MYR | 3.250 | 8/14/14 | MYR | 162,500,000 | 889,363 | |||||||||||||||||||||
Republic of Italy Buoni Poliennali del Tesoro Unsec. Bonds, 4.50%, 3/1/24 Call10 | JPM | EUR | 107.820 | 5/27/14 | EUR | 25,000,000 | 705,154 | |||||||||||||||||||||
31 OPPENHEIMER INTERNATIONAL BOND FUND
STATEMENTOF INVESTMENTS Unaudited / Continued
| Counterparty | Exercise Price | Expiration Date | Contracts | Value | ||||||||||||||||||||||||
Over-the-Counter Options Purchased (Continued) |
| |||||||||||||||||||||||||||
Republic of Italy Buoni Poliennali del Tesoro Unsec. Bonds, 4.50%, 3/1/24 Call10 | JPM | EUR | 108.530 | 6/17/14 | EUR | 25,000,000 | $ | 480,429 | ||||||||||||||||||||
Republic of Italy Buoni Poliennali del Tesoro Unsec. Bonds, 4.50%, 3/1/24 Call10 | JPM | EUR | 104.540 | 4/15/14 | EUR | 25,000,000 | 1,916,339 | |||||||||||||||||||||
TRY Currency Put10 | MOS-A | TRY | 2.340 | 4/25/14 | TRY | 69,815,000 | 5,027 | |||||||||||||||||||||
TWD Currency Put10 | GSG | TWD | 31.000 | 6/23/14 | TWD | 3,100,000,000 | 220,100 | |||||||||||||||||||||
|
| |||||||||||||||||||||||||||
Total Over-the-Counter Options Purchased (Cost $93,617,917) |
| 62,243,861 | ||||||||||||||||||||||||||
| Counterparty | Buy /Sell Protection | Reference Asset | Fixed Rate | Expiration Date | Notional Amount (000’s) | |||||||||||||||||||||||||||
Over-the-Counter Credit Default Swaptions Purchased—0.0% |
| |||||||||||||||||||||||||||||||
Credit Default Swap maturing 12/20/18 Call10 | JPM | Buy | CDX.NA.HY. 21 | 5.000 | % | 4/16/14 | USD | 100,000 | 330,330 | |||||||||||||||||||||||
Credit Default Swap maturing 12/20/18 Call10 | BAC | Buy | CDX.NA.HY. 21 | 5.000 | 5/21/14 | USD | 50,000 | 244,265 | ||||||||||||||||||||||||
Credit Default Swap maturing 12/20/18 Call10 | JPM | Buy | | iTraxx Europe Series 20 Version 1 | | 1.000 | 4/16/14 | EUR | 197,750 | 44,897 | ||||||||||||||||||||||
32 OPPENHEIMER INTERNATIONAL BOND FUND
| Counterparty | Buy /Sell Protection | Reference Asset | Fixed Rate | Expiration Date | Notional Amount (000’s) | Value | ||||||||||||||||||||||||||
Over-the-Counter Credit Default Swaptions Purchased (Continued) |
| |||||||||||||||||||||||||||||||
Credit Default Swap maturing 12/20/18 Call10 | JPM | Buy | CDX.NA.HY. 21 | 5.000 | % | 6/18/14 | USD | 50,000 | $ | 182,025 | ||||||||||||||||||||||
Credit Default Swap maturing 12/20/18 Call10 | JPM | Buy | CDX.NA.HY. 21 | 5.000 | 4/16/14 | USD | 100,000 | 151,790 | ||||||||||||||||||||||||
|
| |||||||||||||||||||||||||||||||
Total Over-the-Counter Credit Default Swaptions Purchased (Cost $1,234,723) |
| 953,307 | ||||||||||||||||||||||||||||||
| Counterparty | Pay/Receive Floating Rate | Floating Rate | Fixed Rate | Expiration Date | ||||||||||||||||||||||||||||
Over-the-Counter Interest Rate Swaptions Purchased—0.5% |
| |||||||||||||||||||||||||||||||
Interest Rate Swap maturing 1/18/48 Call10 | JPM | Receive | | Three-Month USD BBA LIBOR | | 4.380 | % | 1/16/18 | USD | 24,670 | 1,712,279 | |||||||||||||||||||||
Interest Rate Swap maturing 1/27/26 Call10 | BOA | Receive | | Three-Month USD BBA LIBOR | | 4.211 | 1/25/16 | USD | 200,000 | 3,920,364 | ||||||||||||||||||||||
Interest Rate Swap maturing 1/4/16 Call10 | GSG | Pay | BZDI | 12.750 | 1/2/15 | BRL | 320,000 | 863,477 | ||||||||||||||||||||||||
Interest Rate Swap maturing 1/4/16 Call10 | FIB | Pay | BZDI | 12.750 | 1/2/15 | BRL | 500,000 | 1,349,182 | ||||||||||||||||||||||||
Interest Rate Swap maturing 1/4/16 Call10 | GSG | Pay | BZDI | 12.750 | 1/2/15 | BRL | 1,200,000 | 3,238,038 | ||||||||||||||||||||||||
33 OPPENHEIMER INTERNATIONAL BOND FUND
STATEMENTOF INVESTMENTS Unaudited / Continued
| Counterparty | Pay/Receive Floating Rate | Floating Rate | Fixed Rate | Expiration Date | Notional Amount (000’s) | Value | ||||||||||||||||||||||||||
Over-the-Counter Interest Rate Swaptions Purchased (Continued) |
| |||||||||||||||||||||||||||||||
Interest Rate Swap maturing 11/16/26 Call10 | JPM | Receive | | Three-Month KRW CD KSDA | | 3.625 | % | 11/15/16 | KRW | 100,000,000 | $ | 1,694,367 | ||||||||||||||||||||
Interest Rate Swap maturing 11/20/28 Call10 | BOA | Receive | | Three-Month KRW CD KSDA | | 3.640 | 11/19/18 | KRW | 50,000,000 | 1,154,793 | ||||||||||||||||||||||
Interest Rate Swap maturing 11/25/19 Call10 | BAC | Pay | | Six-Month GBP BBA LIBOR | | 2.533 | 11/25/14 | GBP | 200,000 | 5,572,272 | ||||||||||||||||||||||
Interest Rate Swap maturing 11/28/23 Call10 | GSG | Receive | | Three-Month KRW CD KSDA | | 3.749 | 11/27/18 | KRW | 50,000,000 | 663,078 | ||||||||||||||||||||||
Interest Rate Swap maturing 11/30/23 Call10 | GSG | Receive | | Three-Month KRW CD KSDA | | 3.785 | 11/29/18 | KRW | 100,000,000 | 1,279,344 | ||||||||||||||||||||||
Interest Rate Swap maturing 12/5/22 Call10 | BOA | Pay | | Six-Month AUD BBR BBSW | | 4.373 | 12/4/17 | AUD | 100,000 | 1,167,118 | ||||||||||||||||||||||
Interest Rate Swap maturing 2/8/29 Call10 | JPM | Receive | | Three-Month KRW CD KSDA | | 3.580 | 2/7/19 | KRW | 75,000,000 | 1,877,625 | ||||||||||||||||||||||
Interest Rate Swap maturing 3/20/45 Call10 | BOA | Receive | | Three-Month USD BBA LIBOR | | 3.785 | 3/18/15 | USD | 75,000 | 3,236,259 | ||||||||||||||||||||||
34 OPPENHEIMER INTERNATIONAL BOND FUND
| Counterparty | Pay/Receive Floating Rate | Floating Rate | Fixed Rate | Expiration Date | Notional Amount (000’s) | Value | ||||||||||||||||||||||||||
Over-the-Counter Interest Rate Swaptions Purchased (Continued) |
| |||||||||||||||||||||||||||||||
Interest Rate Swap maturing 3/8/26 Call10 | JPM | Pay | | Three-Month KRW CD KSDA | | 3.480 | % | 3/7/16 | KRW | 100,000,000 | $ | 2,224,419 | ||||||||||||||||||||
Interest Rate Swap maturing 5/14/19 Call10 | BAC | Receive | | Three-Month USD BBA LIBOR | | 2.003 | 5/12/14 | USD | 550,000 | 1,456,108 | ||||||||||||||||||||||
Interest Rate Swap maturing 5/14/44 Call10 | JPM | Receive | | Six-Month EUR EURIBOR | | 2.730 | 5/12/14 | EUR | 39,555 | 32,608 | ||||||||||||||||||||||
Interest Rate Swap maturing 5/15/21 Call10 | BAC | Receive | | Three-Month USD BBA LIBOR | | 2.584 | 5/13/14 | USD | 150,000 | 427,813 | ||||||||||||||||||||||
Interest Rate Swap maturing 5/16/24 Call10 | GSG | Receive | | Three-Month USD BBA LIBOR | | 3.148 | 5/14/14 | USD | 300,000 | 540,480 | ||||||||||||||||||||||
Interest Rate Swap maturing 5/2/19 Call10 | UBS | Receive | | Three-Month USD BBA LIBOR | | 2.010 | 4/30/14 | USD | 76,500 | 120,786 | ||||||||||||||||||||||
Interest Rate Swap maturing 5/30/33 Call10 | BAC | Receive | | Six-Month GBP BBA LIBOR | | 3.990 | 5/30/23 | GBP | 40,415 | 3,442,589 | ||||||||||||||||||||||
Interest Rate Swap maturing 5/8/24 Call10 | BOA | Receive | | Three-Month USD BBA LIBOR | | 2.874 | 5/6/14 | USD | 79,060 | 638,198 | ||||||||||||||||||||||
35 OPPENHEIMER INTERNATIONAL BOND FUND
STATEMENTOF INVESTMENTS Unaudited / Continued
| Counterparty | Pay/Receive Floating Rate | Floating Rate | Fixed Rate | Expiration Date | Notional Amount (000’s) | Value | ||||||||||||||||||||||||||
Over-the-Counter Interest Rate Swaptions Purchased (Continued) |
| |||||||||||||||||||||||||||||||
Interest Rate Swap maturing 5/8/24 Call10 | BOA | Receive | | Three-Month USD BBA LIBOR | | 3.030 | % | 5/6/14 | USD | 98,860 | $ | 296,507 | ||||||||||||||||||||
Interest Rate Swap maturing 6/10/24 Call10 | JPM | Receive | | Six-Month EUR EURIBOR | | 1.955 | 6/6/14 | EUR | 150,000 | 925,483 | ||||||||||||||||||||||
Interest Rate Swap maturing 6/16/19 Call10 | GSG | Receive | | Six-Month AUD BBR BBSW | | 4.063 | 6/13/14 | AUD | 150,000 | 300,543 | ||||||||||||||||||||||
Interest Rate Swap maturing 6/17/19 Call10 | JPM | Receive | | Six-Month AUD BBR BBSW | | 3.983 | 6/16/14 | AUD | 150,000 | 443,797 | ||||||||||||||||||||||
Interest Rate Swap maturing 6/20/24 Call10 | GSG | Receive | | Three-Month USD BBA LIBOR | | 4.250 | 6/18/14 | USD | 120,000 | 558,245 | ||||||||||||||||||||||
Interest Rate Swap maturing 6/24/19 Call10 | BOA | Receive | | Three-Month USD BBA LIBOR | | 2.155 | 6/20/14 | USD | 400,000 | 1,435,000 | ||||||||||||||||||||||
Interest Rate Swap maturing 6/24/19 Call10 | JPM | Receive | | Three-Month USD BBA LIBOR | | 2.150 | 6/20/14 | USD | 97,890 | 357,324 | ||||||||||||||||||||||
Interest Rate Swap maturing 6/27/19 Call10 | JPM | Receive | | Three-Month USD BBA LIBOR | | 2.180 | 6/25/14 | USD | 250,000 | 890,487 | ||||||||||||||||||||||
36 OPPENHEIMER INTERNATIONAL BOND FUND
| Counterparty | Pay/Receive Floating Rate | Floating Rate | Fixed Rate | Expiration Date | Notional Amount (000’s) | Value | ||||||||||||||||||||||||||
Over-the-Counter Interest Rate Swaptions Purchased (Continued) |
| |||||||||||||||||||||||||||||||
Interest Rate Swap maturing 6/27/19 Call10 | BOA | Receive | | Three-Month USD BBA LIBOR | | 2.183 | % | 6/25/14 | USD | 146,590 | $ | 517,793 | ||||||||||||||||||||
Interest Rate Swap maturing 6/27/19 Call10 | JPM | Receive | | Three-Month USD BBA LIBOR | | 2.195 | 6/25/14 | USD | 250,000 | 846,763 | ||||||||||||||||||||||
Interest Rate Swap maturing 7/25/18 Call10 | GSG | Receive | | Three-Month USD BBA LIBOR | | 2.828 | 7/21/14 | USD | 600,000 | 1,721,586 | ||||||||||||||||||||||
Interest Rate Swap maturing 8/4/46 Call10 | BOA | Receive | | Three-Month USD BBA LIBOR | | 4.860 | 8/2/16 | USD | 43,895 | 1,074,952 | ||||||||||||||||||||||
|
| |||||||||||||||||||||||||||||||
Total Over-the-Counter Interest Rate Swaptions Purchased (Cost $61,324,238) |
| 45,979,677 | ||||||||||||||||||||||||||||||
| Shares | ||||||||||||||||||||||||||||||||
Investment Company—8.5% |
| |||||||||||||||||||||||||||||||
Oppenheimer Institutional Money Market Fund, Cl. E, 0.08%12,13 (Cost $794,738,431) |
| 794,738,431 | 794,738,431 | |||||||||||||||||||||||||||||
Total Investments, at Value (Cost $9,317,209,357) |
| 100.2 | % | 9,356,076,722 | ||||||||||||||||||||||||||||
Liabilities in Excess of Other Assets |
| (0.2 | ) | (17,638,590 | ) | |||||||||||||||||||||||||||
|
|
|
| |||||||||||||||||||||||||||||
Net Assets |
| 100.0 | % | $ | 9,338,438,132 | |||||||||||||||||||||||||||
|
|
|
| |||||||||||||||||||||||||||||
Footnotes to Statement of Investments
| 1. | Represents the current interest rate for a variable or increasing rate security. |
| 2. | All or portion of the security position is held in accounts at a futures clearing merchant and pledged to cover margin requirements on open futures contracts and written options on futures, if applicable. The aggregate market value of such securities is $17,005,270. See Note 6 of the accompanying Notes. |
| 3. | All or portion of the security position is held in segregated accounts and pledged to cover margin requirements under certain derivative contracts. The aggregate market value of such securities is $15,023,043. See Note 6 of the accompanying Notes. |
| 4. | Represents securities sold under Rule 144A, which are exempt from registration under the Securities Act of 1933, as amended. These securities have been determined to be liquid under guidelines established by the Board of Trustees. These securities amount to $2,170,153,184 or 23.24% of the Fund’s net assets as of March 31, 2014. |
| 5. | Zero coupon bond reflects effective yield on the date of purchase. |
| 6. | This bond has no contractual maturity date, is not redeemable and contractually pays an indefinite stream of interest. Rate reported represents the current interest rate for this variable rate security. |
37 OPPENHEIMER INTERNATIONAL BOND FUND
STATEMENTOF INVESTMENTS Unaudited / Continued
Footnotes to Statement of Investments (Continued)
| 7. | This security is not accruing income because the issuer has missed an interest payment on it and/or is not anticipated to make future interest and or principal payments. The rate shown is the original contractual interest rate. See Note 1 of the accompanying Notes. |
| 8. | Restricted security. The aggregate value of restricted securities as of March 31, 2014 was $3,320,055, which represents 0.04% of the Fund’s net assets. See Note 7 of the accompanying Notes. Information concerning restricted securities is as follows: |
Security | Acquisition Dates | Cost | Value | Unrealized Depreciation | ||||||||||||
Deutsche Bank AG, Opic Reforma I Credit Linked Nts., Cl. 2A, 7.208%, 5/22/15 | 5/21/08 | $ | 122,792 | $ | 91,551 | $ | 31,241 | |||||||||
Deutsche Bank AG, Opic Reforma I Credit Linked Nts., Cl. 2B, 7.208%, 5/22/15 | 6/12/08 | 214,813 | 160,171 | 54,642 | ||||||||||||
Deutsche Bank AG, Opic Reforma I Credit Linked Nts., Cl. 2C, 7.208%, 5/22/15 | 6/18/08 | 3,259,229 | 2,414,990 | 844,239 | ||||||||||||
Deutsche Bank AG, Opic Reforma I Credit Linked Nts., Cl. 2D, 7.208%, 5/22/15 | 7/08/08 | 237,353 | 176,001 | 61,352 | ||||||||||||
Deutsche Bank AG, Opic Reforma I Credit Linked Nts., Cl. 2E, 7.208%, 5/22/15 | 7/15/08 | 172,730 | 127,868 | 44,862 | ||||||||||||
Deutsche Bank AG, Opic Reforma I Credit Linked Nts., Cl. 2F, 7.208%, 5/22/15 | 8/8/08 | 111,830 | 81,663 | 30,167 | ||||||||||||
Deutsche Bank AG, Opic Reforma I Credit Linked Nts., Cl. 2G, 7.208%, 5/22/15 | 8/22/08 | 20,634 | 15,039 | 5,595 | ||||||||||||
JPMorgan Hipotecaria su Casita, 6.47% Sec. Nts., 8/26/35 | 3/21/07 | 3,122,914 | 252,772 | 2,870,142 | ||||||||||||
|
|
|
|
|
| |||||||||||
| $ | 7,262,295 | $ | 3,320,055 | $ | 3,942,240 | |||||||||||
|
|
|
|
|
| |||||||||||
| 9. | All or a portion of the security position is when-issued or delayed delivery to be delivered and settled after March 31, 2014. See Note 1 of the accompanying Notes. |
| 10. | Non-income producing security. |
| 11. | Denotes an inflation-indexed security: coupon or principal are indexed to a consumer price index. |
| 12. | Is or was an affiliate, as defined in the Investment Company Act of 1940, at or during the period ended March 31, 2014, by virtue of the Fund owning at least 5% of the voting securities of the issuer or as a result of the Fund and the issuer having the same investment adviser. Transactions during the period in which the issuer was an affiliate are as follows: |
| Shares September 30, 2013 | Gross Additions | Gross Reductions | Shares March 31, 2014 | |||||||||||||
Oppenheimer Institutional Money Market Fund, | 454,741,805 | 3,482,986,670 | 3,142,990,044 | 794,738,431 | ||||||||||||
| Value | Income | |||||||
Oppenheimer Institutional Money Market Fund, Cl. E | $ | 794,738,431 | $ | 107,428 | ||||
| 13. | Rate shown is the 7-day yield as of March 31, 2014. |
38 OPPENHEIMER INTERNATIONAL BOND FUND
Distribution of investments representing geographic holdings, as a percentage of total investments at value, is as follows:
Geographic Holdings | Value | Percent | ||||||
United States | $ | 1,130,685,368 | 12.1 | % | ||||
United Kingdom | 653,409,173 | 7.0 | ||||||
Italy | 641,087,036 | 6.8 | ||||||
Germany | 597,972,669 | 6.4 | ||||||
France | 589,309,473 | 6.3 | ||||||
Brazil | 586,608,096 | 6.3 | ||||||
Japan | 571,929,078 | 6.1 | ||||||
Australia | 444,033,743 | 4.7 | ||||||
Mexico | 424,555,593 | 4.5 | ||||||
South Africa | 249,539,515 | 2.7 | ||||||
India | 234,644,144 | 2.5 | ||||||
Russia | 226,020,745 | 2.4 | ||||||
Indonesia | 190,428,625 | 2.0 | ||||||
Turkey | 175,676,146 | 1.9 | ||||||
Spain | 174,016,296 | 1.9 | ||||||
Belgium | 166,862,626 | 1.8 | ||||||
Netherlands | 153,843,075 | 1.6 | ||||||
Colombia | 151,757,914 | 1.6 | ||||||
Poland | 137,232,867 | 1.5 | ||||||
Peru | 127,496,240 | 1.4 | ||||||
Malaysia | 127,078,117 | 1.4 | ||||||
Portugal | 118,815,453 | 1.3 | ||||||
Canada | 99,080,564 | 1.1 | ||||||
Israel | 89,929,263 | 1.0 | ||||||
Hungary | 83,268,997 | 0.9 | ||||||
Chile | 76,361,847 | 0.8 | ||||||
Singapore | 74,458,127 | 0.8 | ||||||
Supranational | 71,679,988 | 0.8 | ||||||
Philippines | 69,890,687 | 0.7 | ||||||
United Arab Emirates | 62,686,325 | 0.7 | ||||||
Denmark | 56,667,362 | 0.6 | ||||||
Romania | 49,327,929 | 0.5 | ||||||
South Korea | 48,875,312 | 0.5 | ||||||
Finland | 48,820,182 | 0.5 | ||||||
Switzerland | 44,733,201 | 0.5 | ||||||
Greece | 42,647,573 | 0.4 | ||||||
Venezuela | 40,455,713 | 0.4 | ||||||
Lithuania | 37,767,219 | 0.4 | ||||||
China | 36,214,785 | 0.4 | ||||||
Sweden | 35,884,741 | 0.4 | ||||||
Luxembourg | 35,054,637 | 0.4 | ||||||
Ivory Coast | 29,961,225 | 0.3 | ||||||
Sri Lanka | 27,405,625 | 0.3 | ||||||
Serbia | 27,337,282 | 0.3 | ||||||
Panama | 27,172,770 | 0.3 | ||||||
Kazakhstan | 25,668,845 | 0.3 | ||||||
Uruguay | 25,308,338 | 0.3 | ||||||
Croatia | 21,972,724 | 0.2 | ||||||
Ukraine | 21,370,750 | 0.2 | ||||||
Ireland | 19,716,351 | 0.2 | ||||||
Slovenia | 15,112,170 | 0.2 | ||||||
Jamaica | 14,867,569 | 0.2 | ||||||
39 OPPENHEIMER INTERNATIONAL BOND FUND
STATEMENTOF INVESTMENTS Unaudited / Continued
Geographic Holdings (Continued) | Value | Percent | ||||||
Morocco | $ | 13,957,125 | 0.1 | % | ||||
Angola | 12,972,450 | 0.1 | ||||||
Dominican Republic | 12,389,138 | 0.1 | ||||||
Latvia | 11,355,201 | 0.1 | ||||||
Norway | 10,907,422 | 0.1 | ||||||
Eurozone | 10,745,115 | 0.1 | ||||||
Trinidad | 8,723,825 | 0.1 | ||||||
Tanzania | 8,685,519 | 0.1 | ||||||
Jersey, Channel Islands | 8,026,925 | 0.1 | ||||||
Gabon | 6,438,750 | 0.1 | ||||||
Nigeria | 5,811,750 | 0.1 | ||||||
Hong Kong | 5,434,003 | 0.1 | ||||||
Austria | 5,033,212 | 0.0 | ||||||
Barbados | 2,676,094 | 0.0 | ||||||
Taiwan | 220,100 | 0.0 | ||||||
|
|
|
| |||||
Total | $ | 9,356,076,722 | 100.0 | % | ||||
|
|
|
| |||||
Forward Currency Exchange Contracts as of March 31, 2014
Counterparty | Settlement Month(s) | Currency Purchased (000’s) | Currency Sold (000’s) | Unrealized Appreciation | Unrealized Depreciation | |||||||||||||||||||||||
BAC | 05/2014 | EUR | 66,755 | USD | 92,385 | $ | — | $ | 429,078 | |||||||||||||||||||
BAC | 04/2014 | GBP | 50,000 | USD | 83,260 | 89,864 | — | |||||||||||||||||||||
BAC | 04/2014 | JPY | 10,132,000 | USD | 100,026 | — | 1,850,777 | |||||||||||||||||||||
BAC | 04/2014 | MXN | 328,880 | USD | 24,814 | 367,561 | — | |||||||||||||||||||||
BAC | 05/2014 | TRY | 65,450 | USD | 29,689 | 587,028 | — | |||||||||||||||||||||
BAC | 01/2015 | USD | 23,985 | BRL | 61,940 | — | 1,328,551 | |||||||||||||||||||||
BAC | 04/2014 – 05/2014 | USD | 68,987 | EUR | 50,010 | 141,893 | 43,712 | |||||||||||||||||||||
BAC | 05/2014 | USD | 30,240 | INR | 1,893,750 | — | 1,109,804 | |||||||||||||||||||||
BAC | 04/2014 | USD | 3,631 | MXN | 47,940 | — | 40,060 | |||||||||||||||||||||
BAC | 05/2014 | USD | 15,477 | RUB | 563,220 | — | 357,513 | |||||||||||||||||||||
BAC | 05/2014 | USD | 2,940 | ZAR | 32,730 | — | 152,686 | |||||||||||||||||||||
BNP | 05/2014 | CAD | 114,130 | USD | 106,729 | — | 3,634,661 | |||||||||||||||||||||
BNP | 05/2014 | DKK | 90,425 | USD | 16,577 | 115,133 | — | |||||||||||||||||||||
BNP | 04/2014 | EUR | 20,380 | USD | 27,893 | 182,861 | — | |||||||||||||||||||||
BNP | 04/2014 – 05/2014 | GBP | 11,930 | USD | 19,772 | 109,440 | — | |||||||||||||||||||||
BNP | 04/2014 | JPY | 1,359,000 | USD | 13,406 | — | 237,656 | |||||||||||||||||||||
BNP | 04/2014 – 06/2014 | MXN | 811,000 | USD | 60,761 | 1,069,119 | — | |||||||||||||||||||||
BNP | 05/2014 | NOK | 20,930 | USD | 3,407 | 80,307 | — | |||||||||||||||||||||
BNP | 04/2014 | PLN | 164,940 | USD | 53,609 | 885,158 | — | |||||||||||||||||||||
BNP | 04/2014 | RON | 76,950 | USD | 23,235 | 518,386 | — | |||||||||||||||||||||
BNP | 05/2014 | TRY | 65,110 | USD | 28,937 | 1,181,730 | — | |||||||||||||||||||||
BNP | 05/2014 | USD | 6,312 | CAD | 6,735 | 228,692 | — | |||||||||||||||||||||
BNP | 05/2014 | USD | 24,021 | DKK | 131,890 | — | 324,858 | |||||||||||||||||||||
BNP | 04/2014 – 07/2014 | USD | 162,294 | EUR | 119,280 | 41,464 | 2,068,488 | |||||||||||||||||||||
BNP | 04/2014 – 05/2014 | USD | 266,187 | GBP | 160,765 | — | 1,750,263 | |||||||||||||||||||||
BNP | 04/2014 | USD | 49,714 | JPY | 5,088,000 | 413,435 | — | |||||||||||||||||||||
BNP | 06/2014 | USD | 44,926 | MXN | 598,300 | — | 623,428 | |||||||||||||||||||||
BNP | 05/2014 | USD | 1,688 | NOK | 10,470 | — | 56,682 | |||||||||||||||||||||
BNP | 05/2014 | USD | 15,090 | TRY | 34,880 | — | 1,045,132 | |||||||||||||||||||||
BNP | 06/2014 | USD | 81,323 | ZAR | 889,105 | — | 2,123,033 | |||||||||||||||||||||
40 OPPENHEIMER INTERNATIONAL BOND FUND
Forward Currency Exchange Contracts (Continued)
Counterparty | Settlement Month(s) | Currency Purchased (000’s) | Currency Sold (000’s) | Unrealized Appreciation | Unrealized Depreciation | |||||||||||||||||||||||
BOA | 05/2014 | AUD | 26,535 | USD | 23,720 | $ | 789,387 | $ | — | |||||||||||||||||||
BOA | 04/2014 | BRL | 422,360 | USD | 179,244 | 6,899,215 | — | |||||||||||||||||||||
BOA | 04/2014 | COP | 71,639,000 | USD | 35,618 | 659,586 | — | |||||||||||||||||||||
BOA | 12/2014 | EUR | 10,415 | USD | 14,319 | 28,314 | — | |||||||||||||||||||||
BOA | 12/2014 | GBP | 2,345 | USD | 3,902 | — | 474 | |||||||||||||||||||||
BOA | 04/2014 – 07/2014 | INR | 2,280,250 | USD | 37,883 | 193,826 | — | |||||||||||||||||||||
BOA | 05/2014 | JPY | 18,397,000 | USD | 181,578 | — | 3,282,235 | |||||||||||||||||||||
BOA | 04/2014 – 05/2014 | KRW | 303,590,000 | USD | 283,326 | 1,405,440 | — | |||||||||||||||||||||
BOA | 04/2014 – 10/2014 | MXN | 1,808,500 | USD | 135,938 | 1,805,732 | — | |||||||||||||||||||||
BOA | 05/2014 | TRY | 65,580 | USD | 29,686 | 650,135 | — | |||||||||||||||||||||
BOA | 05/2014 | USD | 285,910 | AUD | 320,595 | — | 10,216,047 | |||||||||||||||||||||
BOA | 04/2014 – 01/2015 | USD | 154,925 | BRL | 376,430 | — | 6,282,207 | |||||||||||||||||||||
BOA | 04/2014 | USD | 10,565 | COP | 21,077,000 | — | 108,709 | |||||||||||||||||||||
BOA | 04/2014 – 10/2014 | USD | 67,939 | INR | 4,217,000 | 88,666 | 1,267,376 | |||||||||||||||||||||
BOA | 05/2014 | USD | 399,617 | JPY | 40,783,000 | 4,366,080 | — | |||||||||||||||||||||
BOA | 04/2014 – 02/2015 | USD | 146,350 | KRW | 159,850,000 | — | 2,510,508 | |||||||||||||||||||||
BOA | 04/2014 – 06/2014 | USD | 186,907 | MXN | 2,485,525 | — | 2,810,333 | |||||||||||||||||||||
BOA | 05/2014 | USD | 28,650 | MYR | 95,770 | — | 714,495 | |||||||||||||||||||||
BOA | 08/2014 | USD | 3,642 | PEN | 10,470 | — | 24,205 | |||||||||||||||||||||
BOA | 05/2014 | USD | 19,727 | RUB | 724,300 | — | 636,247 | |||||||||||||||||||||
BOA | 05/2014 | USD | 53,055 | SGD | 67,250 | — | 408,291 | |||||||||||||||||||||
BOA | 05/2014 | USD | 38,943 | TRY | 87,750 | — | 1,648,145 | |||||||||||||||||||||
BOA | 05/2014 | USD | 15,377 | ZAR | 166,870 | — | 393,227 | |||||||||||||||||||||
CITNA-B | 05/2014 | CAD | 75,105 | USD | 70,274 | — | 2,431,422 | |||||||||||||||||||||
CITNA-B | 04/2014 | EUR | 16,000 | USD | 21,982 | 59,533 | — | |||||||||||||||||||||
CITNA-B | 04/2014 | MXN | 1,722,880 | USD | 130,368 | 1,528,387 | 28,903 | |||||||||||||||||||||
CITNA-B | 05/2014 | PLN | 23,550 | USD | 7,521 | 237,611 | — | |||||||||||||||||||||
CITNA-B | 05/2014 | USD | 222,947 | AUD | 247,735 | — | 5,879,964 | |||||||||||||||||||||
CITNA-B | 05/2014 | USD | 140,447 | CAD | 148,920 | 5,927,051 | — | |||||||||||||||||||||
CITNA-B | 04/2014 | USD | 9,058 | COP | 18,140,000 | — | 128,971 | |||||||||||||||||||||
CITNA-B | 04/2014 | USD | 5,693 | EUR | 4,155 | — | 30,686 | |||||||||||||||||||||
CITNA-B | 04/2014 – 05/2014 | USD | 4,433 | GBP | 2,660 | 1,047 | 736 | |||||||||||||||||||||
CITNA-B | 05/2014 | USD | 9,297 | HUF | 2,128,100 | — | 211,463 | |||||||||||||||||||||
CITNA-B | 04/2014 | USD | 45,012 | JPY | 4,569,000 | 740,174 | — | |||||||||||||||||||||
CITNA-B | 04/2014 | USD | 95,796 | MXN | 1,289,600 | — | 2,859,338 | |||||||||||||||||||||
DEU | 05/2014 | EUR | 61,065 | USD | 83,871 | 459,153 | 212,732 | |||||||||||||||||||||
DEU | 05/2014 | JPY | 86,466,000 | USD | 845,995 | — | 8,005,096 | |||||||||||||||||||||
DEU | 05/2014 | USD | 69,579 | EUR | 50,885 | — | 515,116 | |||||||||||||||||||||
DEU | 05/2014 | USD | 664,850 | JPY | 67,955,000 | 6,260,891 | — | |||||||||||||||||||||
DEU | 05/2014 | USD | 20,678 | PLN | 64,740 | — | 651,553 | |||||||||||||||||||||
DEU | 05/2014 | ZAR | 30,660 | USD | 2,943 | — | 57,071 | |||||||||||||||||||||
FIB | 04/2014 – 05/2014 | RUB | 705,200 | USD | 19,127 | 782,887 | — | |||||||||||||||||||||
GSCO-OT | 05/2014 – 09/2014 | AUD | 11,205 | USD | 10,466 | 51,225 | 230,300 | |||||||||||||||||||||
GSCO-OT | 04/2014 – 01/2015 | BRL | 790,780 | USD | 339,175 | 5,940,900 | 7,068,681 | |||||||||||||||||||||
GSCO-OT | 04/2014 | COP | 10,195,000 | USD | 4,977 | 186,133 | — | |||||||||||||||||||||
GSCO-OT | 05/2014 | GBP | 53,925 | USD | 89,954 | 149,311 | 241,348 | |||||||||||||||||||||
GSCO-OT | 04/2014 – 09/2014 | INR | 6,640,700 | USD | 107,129 | 1,849,509 | 215,326 | |||||||||||||||||||||
41 OPPENHEIMER INTERNATIONAL BOND FUND
STATEMENTOF INVESTMENTS Unaudited / Continued
Forward Currency Exchange Contracts (Continued)
Counterparty | Settlement Month(s) | Currency Purchased (000’s) | Currency Sold (000’s) | Unrealized Appreciation | Unrealized Depreciation | |||||||||||||||||||||||
GSCO-OT | 04/2014 | KRW | 120,215,000 | USD | 113,000 | $ | — | $ | 181,433 | |||||||||||||||||||
GSCO-OT | 04/2014 | MXN | 133,980 | USD | 10,000 | 258,683 | — | |||||||||||||||||||||
GSCO-OT | 05/2014 – 09/2014 | USD | 23,514 | AUD | 26,235 | — | 655,415 | |||||||||||||||||||||
GSCO-OT | 04/2014 – 01/2015 | USD | 441,379 | BRL | 1,062,318 | 2,433,058 | 12,316,580 | |||||||||||||||||||||
GSCO-OT | 04/2014 | USD | 11,835 | COP | 24,064,000 | — | 352,391 | |||||||||||||||||||||
GSCO-OT | 06/2014 | USD | 344,025 | EUR | 250,000 | — | 347,539 | |||||||||||||||||||||
GSCO-OT | 05/2014 | USD | 32,723 | GBP | 19,590 | 78,131 | — | |||||||||||||||||||||
GSCO-OT | 04/2014 – 09/2014 | USD | 99,779 | INR | 6,640,700 | — | 8,984,392 | |||||||||||||||||||||
GSCO-OT | 05/2014 | USD | 109,000 | JPY | 11,372,000 | — | 1,212,040 | |||||||||||||||||||||
GSCO-OT | 04/2014 – 10/2014 | USD | 203,014 | MXN | 2,734,780 | — | 5,320,757 | |||||||||||||||||||||
HSBC | 04/2014 | RUB | 214,800 | USD | 5,785 | 282,176 | — | |||||||||||||||||||||
JPM | 01/2016 | CNH | 370,050 | USD | 60,176 | — | 1,318,909 | |||||||||||||||||||||
JPM | 04/2014 | COP | 2,625,000 | USD | 1,287 | 42,314 | — | |||||||||||||||||||||
JPM | 05/2014 | IDR | 935,501,000 | USD | 79,641 | 3,226,227 | — | |||||||||||||||||||||
JPM | 04/2014 | INR | 2,087,000 | USD | 34,076 | 835,925 | — | |||||||||||||||||||||
JPM | 04/2014 | MXN | 1,360,300 | USD | 101,010 | 3,143,583 | — | |||||||||||||||||||||
JPM | 05/2014 | PLN | 385,445 | USD | 125,964 | 1,029,408 | — | |||||||||||||||||||||
JPM | 04/2014 | RUB | 645,200 | USD | 17,592 | 631,436 | — | |||||||||||||||||||||
JPM | 05/2014 | THB | 977,200 | USD | 31,121 | — | 1,045,924 | |||||||||||||||||||||
JPM | 05/2014 | TRY | 28,870 | USD | 12,689 | 665,877 | — | |||||||||||||||||||||
JPM | 04/2014 – 10/2014 | USD | 62,007 | BRL | 153,675 | — | 3,997,287 | |||||||||||||||||||||
JPM | 05/2014 | USD | 41,980 | IDR | 491,171,000 | — | 1,566,318 | |||||||||||||||||||||
JPM | 04/2014 – 07/2014 | USD | 69,027 | INR | 4,178,000 | 56,363 | 186,603 | |||||||||||||||||||||
JPM | 04/2014 | USD | 74,496 | MXN | 1,000,000 | — | 2,017,152 | |||||||||||||||||||||
JPM | 05/2014 | USD | 12,880 | MYR | 42,500 | — | 137,502 | |||||||||||||||||||||
JPM | 08/2014 | USD | 15,878 | PHP | 725,000 | — | 274,719 | |||||||||||||||||||||
JPM | 04/2014 – 05/2014 | USD | 49,528 | RUB | 1,785,870 | — | 781,435 | |||||||||||||||||||||
JPM | 05/2014 | USD | 32,283 | THB | 977,200 | 2,207,693 | — | |||||||||||||||||||||
JPM | 05/2014 | USD | 6,667 | TRY | 15,410 | — | 461,774 | |||||||||||||||||||||
JPM | 05/2014 | USD | 46,350 | ZAR | 503,220 | — | 1,205,890 | |||||||||||||||||||||
JPM | 05/2014 | ZAR | 110,960 | USD | 10,221 | 265,407 | — | |||||||||||||||||||||
MSCO | 04/2014 – 05/2014 | BRL | 227,260 | USD | 99,099 | 350,333 | — | |||||||||||||||||||||
MSCO | 04/2014 – 10/2014 | MXN | 773,300 | USD | 57,672 | 1,428,056 | — | |||||||||||||||||||||
MSCO | 05/2014 | SEK | 790 | USD | 121 | 545 | — | |||||||||||||||||||||
MSCO | 04/2014 – 07/2014 | USD | 148,953 | BRL | 341,272 | 287,094 | 407,117 | |||||||||||||||||||||
MSCO | 07/2014 – 09/2014 | USD | 385,744 | EUR | 281,415 | — | 1,895,096 | |||||||||||||||||||||
MSCO | 04/2014 | USD | 133,276 | JPY | 13,865,000 | — | 1,071,006 | |||||||||||||||||||||
MSCO | 04/2014 | USD | 12,626 | MXN | 165,600 | — | 53,088 | |||||||||||||||||||||
MSCO | 05/2014 | USD | 1,379 | SEK | 9,110 | — | 27,196 | |||||||||||||||||||||
MSCO | 05/2014 | USD | 31,444 | TRY | 71,520 | — | 1,639,873 | |||||||||||||||||||||
NOM | 04/2014 | USD | 287,061 | JPY | 28,001,000 | 15,741,928 | — | |||||||||||||||||||||
RBS | 05/2014 | CHF | 15,875 | USD | 17,519 | 446,151 | — | |||||||||||||||||||||
RBS | 05/2014 | USD | 415 | CHF | 375 | — | 9,342 | |||||||||||||||||||||
RBS | 04/2014 | USD | 3,490 | NOK | 21,685 | — | 130,310 | |||||||||||||||||||||
RBS | 05/2014 | USD | 69,475 | ZAR | 787,265 | — | 4,924,350 | |||||||||||||||||||||
TDB | 04/2014 | USD | 12,205 | MXN | 164,200 | — | 367,223 | |||||||||||||||||||||
|
|
|
| |||||||||||||||||||||||||
Total Unrealized Appreciation and Depreciation |
| $ | 80,482,652 | $ | 129,136,248 | |||||||||||||||||||||||
|
|
|
| |||||||||||||||||||||||||
42 OPPENHEIMER INTERNATIONAL BOND FUND
Futures Contracts as of March 31, 2014
Description | Exchange | Buy/Sell | Expiration Date | Number of Contracts | Value | Unrealized Appreciation (Depreciation) | ||||||||||||||||||
Euro-Bundesobligations | EUX | Sell | 6/6/14 | 700 | $ | 138,269,218 | $ | (700,424 | ) | |||||||||||||||
U.S. Treasury Long Bonds | CBT | Sell | 6/19/14 | 794 | 105,775,688 | (707,843 | ) | |||||||||||||||||
U.S. Treasury Nts., 5 yr. | CBT | Sell | 6/30/14 | 2,500 | 297,382,825 | 1,892,255 | ||||||||||||||||||
U.S. Treasury Nts., 10 yr. | CBT | Buy | 6/19/14 | 500 | 61,750,000 | (789,853 | ) | |||||||||||||||||
|
| |||||||||||||||||||||||
| $ | (305,865 | ) | ||||||||||||||||||||||
|
| |||||||||||||||||||||||
Over-the-Counter Options Written at March 31, 2014
Description | Counterparty | Exercise Price | Expiration Date | Number of Contracts | Premiums Received | Value | ||||||||||||||||||||||||||
AUD Currency Call | BOA | AUD | 0.900 | 12/4/14 | AUD | (150,000,000 | ) | $ | 2,196,776 | $ | (5,367,900 | ) | ||||||||||||||||||||
AUD Currency Call | GSG | AUD | 1.040 | 6/27/14 | AUD | (100,000,000 | ) | 737,232 | (758,015 | ) | ||||||||||||||||||||||
AUD Currency Call | GSG | AUD | 1.100 | 6/12/14 | AUD | (100,000,000 | ) | 403,718 | (329,350 | ) | ||||||||||||||||||||||
AUD Currency Put | GSG | AUD | 0.800 | 11/10/14 | AUD | (150,000,000 | ) | 2,247,600 | (572,250 | ) | ||||||||||||||||||||||
BRL Currency Call | CITNA-B | BRL | 2.305 | 4/15/14 | BRL | (69,290,000 | ) | 249,504 | (559,378 | ) | ||||||||||||||||||||||
BRL Currency Call | GSG | BRL | 2.275 | 4/24/14 | BRL | (170,625,000 | ) | 305,250 | (879,060 | ) | ||||||||||||||||||||||
EUR Currency Put | CITNA-B | EUR | 1.288 | 7/10/14 | EUR | (100,000,000 | ) | 640,780 | (132,800 | ) | ||||||||||||||||||||||
EUR Currency Call | GSG | EUR | 329.000 | 4/29/14 | EUR | (21,525,000 | ) | 290,275 | (8,186 | ) | ||||||||||||||||||||||
GBP Currency Call | GSG | GBP | 1.870 | 6/6/14 | GBP | (100,000,000 | ) | 1,507,358 | (1,521,780 | ) | ||||||||||||||||||||||
IDR Currency Put | GSG | IDR | 17000.000 | 2/5/15 | IDR | (850,000,000,000 | ) | 675,000 | — | |||||||||||||||||||||||
IDR Currency Call | GSG | IDR | 11500.000 | 2/5/15 | IDR | (575,000,000,000 | ) | 462,519 | (1,150,000 | ) | ||||||||||||||||||||||
IDR Currency Put | GSG | IDR | 16000.000 | 2/16/15 | IDR | (1,200,000,000,000 | ) | 1,282,500 | — | |||||||||||||||||||||||
IDR Currency Call | GSG | IDR | 11500.000 | 2/16/15 | IDR | (862,500,000,000 | ) | 693,755 | (1,725,000 | ) | ||||||||||||||||||||||
INR Currency Put | BOA | INR | 65.000 | 7/1/14 | INR | (3,250,000,000 | ) | 333,500 | (344,500 | ) | ||||||||||||||||||||||
INR Currency Call | BOA | INR | 59.000 | 7/1/14 | INR | (2,950,000,000 | ) | 481,050 | (359,900 | ) | ||||||||||||||||||||||
JPY Currency Call | BAC | JPY | 100.200 | 4/1/14 | JPY | (12,525,000,000 | ) | 258,750 | — | |||||||||||||||||||||||
JPY Currency Call | BOA | JPY | 13.695 | 4/30/15 | JPY | (5,000,000,000 | ) | 1,980,818 | (452,372 | ) | ||||||||||||||||||||||
JPY Currency Call | BOA | JPY | 13.540 | 5/7/15 | JPY | (5,000,000,000 | ) | 1,647,213 | (503,839 | ) | ||||||||||||||||||||||
JPY Currency Put | BOA | JPY | 104.500 | 6/18/14 | JPY | (20,900,000,000 | ) | 1,170,000 | (2,069,100 | ) | ||||||||||||||||||||||
JPY Currency Put | GSG | JPY | 120.000 | 5/22/15 | JPY | (23,739,000,000 | ) | 4,015,846 | (925,821 | ) | ||||||||||||||||||||||
JPY Currency Call | GSG | JPY | 84.550 | 12/18/15 | JPY | (15,032,000,000 | ) | 4,450,040 | (1,879,000 | ) | ||||||||||||||||||||||
JPY Currency Call | GSG | JPY | 11.500 | 3/31/15 | JPY | (5,000,000,000 | ) | 1,091,907 | (1,089,473 | ) | ||||||||||||||||||||||
43 OPPENHEIMER INTERNATIONAL BOND FUND
STATEMENTOF INVESTMENTS Unaudited / Continued
Over-the-Counter Options Written (Continued)
Description | Counterparty | Exercise Price | Expiration Date | Number of Contracts | Premiums Received | Value | ||||||||||||||||||||||||||
JPY Currency Put | JPM | JPY | 103.750 | 4/1/14 | JPY | (12,968,750,000 | ) | $ | 468,750 | $ | (51,875 | ) | ||||||||||||||||||||
JPY Currency Call | JPM | JPY | 13.180 | 5/7/15 | JPY | (5,000,000,000 | ) | 1,783,639 | (574,760 | ) | ||||||||||||||||||||||
KRW Currency Put | BOA | KRW | 1200.000 | 2/2/15 | KRW | (120,000,000,000 | ) | 1,880,092 | (1,200,000 | ) | ||||||||||||||||||||||
KRW Currency Put | BOA | KRW | 1200.000 | 2/2/15 | KRW | (120,000,000,000 | ) | 1,912,592 | (1,200,000 | ) | ||||||||||||||||||||||
KRW Currency Put | GSG | KRW | 1125.000 | 1/5/15 | KRW | (281,250,000,000 | ) | 5,300,007 | (4,781,250 | ) | ||||||||||||||||||||||
MXN Currency Call | GSG | MXN | 12.800 | 6/6/14 | MXN | (2,560,000,000 | ) | 954,000 | (1,093,120 | ) | ||||||||||||||||||||||
MYR Currency Put | BOA | MYR | 3.500 | 8/14/14 | MYR | (175,000,000 | ) | 420,000 | (247,625 | ) | ||||||||||||||||||||||
MYR Currency Put | GSG | MYR | 3.300 | 4/28/14 | MYR | (330,000,000 | ) | 710,000 | (438,900 | ) | ||||||||||||||||||||||
Republic of Italy Buoni Poliennali del Tesoro Unsec. Bonds, 3.50%, 12/1/18 Call | JPM | EUR | 105.790 | 5/27/14 | EUR | (50,000,000 | ) | 383,082 | (889,416 | ) | ||||||||||||||||||||||
Republic of Italy Buoni Poliennali del Tesoro Unsec. Bonds, 3.50%, 12/1/18 Call | JPM | EUR | 104.050 | 4/15/14 | EUR | (50,000,000 | ) | 333,065 | (2,264,720 | ) | ||||||||||||||||||||||
Republic of Italy Buoni Poliennali del Tesoro Unsec. Bonds, 3.50%, 12/1/18 Call | JPM | EUR | 106.120 | 6/17/14 | EUR | (50,000,000 | ) | 313,357 | (605,789 | ) | ||||||||||||||||||||||
TWD Currency Put | GSG | TWD | 31.500 | 6/23/14 | TWD | (3,150,000,000 | ) | 210,000 | (78,750 | ) | ||||||||||||||||||||||
ZAR Currency Put | BAC | ZAR | 10.925 | 6/10/14 | ZAR | (338,600,000 | ) | 832,476 | (429,345 | ) | ||||||||||||||||||||||
|
|
|
| |||||||||||||||||||||||||||||
Total Over-the-Counter Options Written |
| $ | 42,622,451 | $ | (34,483,274 | ) | ||||||||||||||||||||||||||
|
|
|
| |||||||||||||||||||||||||||||
Over-the-Counter Credit Default Swaps at March 31, 2014
Reference Asset | Counterparty | Buy/Sell Protection | Fixed Rate | Maturity Date | Notional Amount (000’s) | Premiums Received/(Paid) | Value | |||||||||||||||||||||||||
Banco Bilbao Vizcaya Argentaria Sociedad Anonima | UBS | Sell | 3.000 | % | 12/20/17 | EUR | 4,405 | $ | 171,759 | $ | 442,449 | |||||||||||||||||||||
Banco Bilbao Vizcaya Argentaria Sociedad Anonima | UBS | Sell | 3.000 | 12/20/17 | EUR | 4,405 | 171,759 | 442,449 | ||||||||||||||||||||||||
Banco Santander SA | BAC | Sell | 3.000 | 9/20/17 | EUR | 20,000 | (72,103 | ) | 2,011,452 | |||||||||||||||||||||||
Banco Santander SA | BOA | Sell | 3.000 | 12/20/17 | EUR | 5,000 | (106,114 | ) | 520,601 | |||||||||||||||||||||||
Banco Santander SA | UBS | Sell | 3.000 | 9/20/17 | EUR | 8,850 | (31,905 | ) | 890,068 | |||||||||||||||||||||||
44 OPPENHEIMER INTERNATIONAL BOND FUND
Over-the-Counter Credit Default Swaps (Continued)
Reference Asset | Counterparty | Buy/Sell Protection | Fixed Rate | Maturity Date | Notional Amount (000’s) | Premiums Received/(Paid) | Value | |||||||||||||||||||||||||
Bolivarian Republic of Venezuela | FIB | Buy | 5.000 | % | 3/20/19 | USD | 8,295 | $ | (2,199,134 | ) | $ | 2,093,325 | ||||||||||||||||||||
iTraxx Asia Ex-Japan IG Sereis 20 Version 1 | GSG | Sell | 1.000 | 12/20/18 | USD | 25,000 | 372,206 | (168,127 | ) | |||||||||||||||||||||||
iTraxx Asia Ex-Japan IG Sereis 21 Version 1 | GSG | Sell | 1.000 | 6/20/19 | USD | 20,000 | 375,624 | (147,778 | ) | |||||||||||||||||||||||
Republic of Ireland | GSG | Buy | 1.000 | 3/20/18 | EUR | 19,335 | (715,358 | ) | (366,245 | ) | ||||||||||||||||||||||
Republic of Ireland | GSG | Buy | 1.000 | 3/20/18 | USD | 21,975 | (923,121 | ) | (305,475 | ) | ||||||||||||||||||||||
Russian Federation | BOA | Buy | 1.000 | 3/20/19 | USD | 49,450 | (3,704,592 | ) | 2,582,700 | |||||||||||||||||||||||
Russian Federation | BOA | Buy | 1.000 | 3/20/19 | USD | 15,455 | (1,250,253 | ) | 807,192 | |||||||||||||||||||||||
Russian Federation | JPM | Buy | 1.000 | 3/20/19 | USD | 6,370 | (394,279 | ) | 332,696 | |||||||||||||||||||||||
Telefonica SA | UBS | Sell | 1.000 | 9/20/17 | EUR | 5,000 | 627,078 | 13,670 | ||||||||||||||||||||||||
Ukraine | JPM | Buy | 5.000 | 12/20/18 | USD | 4,050 | (817,359 | ) | 585,867 | |||||||||||||||||||||||
|
|
|
| |||||||||||||||||||||||||||||
Total Over-the-Counter Credit Default Swaps |
| $ | (8,495,792 | ) | $ | 9,734,844 | ||||||||||||||||||||||||||
|
|
|
| |||||||||||||||||||||||||||||
The table that follows shows the undiscounted maximum potential payment by the Fund related to selling credit protection in credit default swaps:
Type of Reference Asset on which the Fund Sold Protection | Total Maximum Potential Payments for Selling Credit Protection (Undiscounted) | Amount Recoverable* | Reference Asset Rating Range** | |||||||||||||
Investment Grade Single Name Corporate Debt (EUR) | 47,660,000 | EUR | — | EUR | BBB to BBB- | |||||||||||
Investment Grade Sovereign Debt | $ | 45,000,000 | $ | — | A- | |||||||||||
|
|
|
| |||||||||||||
Total EUR | 47,660,000 | EUR | — | EUR | ||||||||||||
|
|
|
| |||||||||||||
Total USD | $ | 45,000,000 | $ | — | ||||||||||||
|
|
|
| |||||||||||||
| * | The Fund has no amounts recoverable from related purchased protection. In addition, the Fund has no recourse provisions under the credit derivatives and holds no collateral which can offset or reduce potential payments under a triggering event. |
| ** | The period end reference asset security ratings, as rated by any rating organization, are included in the equivalent Standard & Poor’s rating category. The reference asset rating represents the likelihood of a potential credit event on the reference asset which would result in a related payment by the Fund. |
45 OPPENHEIMER INTERNATIONAL BOND FUND
STATEMENTOF INVESTMENTS Unaudited / Continued
Over-the-Counter Currency Swaps at March 31, 2014
Counterparty | Pay/Receive Floating Rate | Fixed Rate | Floating Rate | Maturity Date | Notional Amount Currency Received (000’s) | Notional Amount Currency Delivered (000’s) | Premiums Received/ (Paid) | Value | ||||||||||||||||||||||||||||||||
BAC | Pay | 7.150 | % | | Six-Month USD BBA LIBOR | | 1/28/19 | INR | 1,567,863 | USD | 25,000 | $ | — | $ | 1,286,247 | |||||||||||||||||||||||||
BOA | Receive | 1.480 | | Three-Month USD BBA LIBOR | | 3/24/16 | USD | 150,000 | CNH | 939,600 | — | (154,578 | ) | |||||||||||||||||||||||||||
BOA | Receive | 1.150 | | Three-Month USD BBA LIBOR | | 2/27/16 | USD | 200,000 | CNH | 1,233,000 | — | 385,362 | ||||||||||||||||||||||||||||
BOA | Pay | 7.100 | | Six-Month USD BBA LIBOR | | 1/21/19 | INR | 921,795 | USD | 15,025 | — | 395,720 | ||||||||||||||||||||||||||||
GSG | Pay | 7.210 | | Six-Month USD BBA LIBOR | | 1/13/19 | INR | 935,000 | USD | 15,039 | — | 924,562 | ||||||||||||||||||||||||||||
GSG | Pay | 7.100 | | Six-Month USD BBA LIBOR | | 1/15/19 | INR | 931,750 | USD | 15,045 | — | 785,232 | ||||||||||||||||||||||||||||
GSG | Pay | 7.370 | | Six-Month USD BBA LIBOR | | 1/7/19 | INR | 1,559,500 | USD | 25,000 | — | 1,832,793 | ||||||||||||||||||||||||||||
JPM | Receive | 1.140 | | Three-Month USD BBA LIBOR | | 3/3/16 | USD | 150,000 | CNH | 916,200 | — | 312,734 | ||||||||||||||||||||||||||||
JPM | Receive | 1.355 | | Three-Month USD BBA LIBOR | | 3/14/16 | USD | 150,000 | CNH | 928,125 | — | 10,114 | ||||||||||||||||||||||||||||
|
|
|
| |||||||||||||||||||||||||||||||||||||
Total of Over-the-Counter Currency Swaps |
| $ | — | $ | 5,778,186 | |||||||||||||||||||||||||||||||||||
|
|
|
| |||||||||||||||||||||||||||||||||||||
46 OPPENHEIMER INTERNATIONAL BOND FUND
Cleared Interest Rate Swaps at March 31, 2014
Counterparty | Pay/Receive Floating Rate | Floating Rate | Fixed Rate | Maturity Date | Notional Amount (000’s) | Value | ||||||||||||||||||||||
BAC | Receive | | Three-Month USD BBA LIBOR | | 1.552 | % | 12/9/18 | USD | 164,870 | $ | 380,858 | |||||||||||||||||
BAC | Receive | | Three-Month USD BBA LIBOR | | 3.625 | 3/22/26 | USD | 19,775 | 27,585 | |||||||||||||||||||
BOA | Receive | | Three-Month USD BBA LIBOR | | 4.078 | 3/18/24 | USD | 59,000 | (31,948 | ) | ||||||||||||||||||
BOA | Receive | | Three-Month USD BBA LIBOR | | 4.083 | 3/19/24 | USD | 60,000 | (43,799 | ) | ||||||||||||||||||
BOA | Pay | | Six-Month AUD BBR BBSW | | 5.560 | 2/14/24 | AUD | 72,000 | 686,783 | |||||||||||||||||||
BOA | Receive | | Six-Month AUD BBR BBSW | | 3.668 | 3/17/19 | AUD | 100,000 | 137,240 | |||||||||||||||||||
BOA | Pay | | Six-Month AUD BBR BBSW | | 5.480 | 3/12/24 | AUD | 72,000 | 444,787 | |||||||||||||||||||
BOA | Receive | | Three-Month USD BBA LIBOR | | 2.850 | 2/18/24 | USD | 25,000 | (112,328 | ) | ||||||||||||||||||
BOA | Receive | | Six-Month AUD BBR BBSW | | 3.720 | 3/13/19 | AUD | 96,000 | (105,461 | ) | ||||||||||||||||||
BOA | Receive | | Six-Month AUD BBR BBSW | | 3.768 | 3/14/19 | AUD | 96,000 | (309,705 | ) | ||||||||||||||||||
BOA | Receive | | Six-Month AUD BBR BBSW | | 3.743 | 3/12/19 | AUD | 96,000 | (226,624 | ) | ||||||||||||||||||
JPM | Receive | | Three-Month USD BBA LIBOR | | 1.719 | 8/29/18 | USD | 90,000 | (581,544 | ) | ||||||||||||||||||
JPM | Receive | | Three-Month USD BBA LIBOR | | 3.036 | 1/8/24 | USD | 170,000 | (4,320,028 | ) | ||||||||||||||||||
UBS | Receive | | Six-Month EUR EURIBOR | | 1.060 | 12/9/18 | EUR | 133,140 | (1,637,999 | ) | ||||||||||||||||||
UBS | Receive | | Six-Month EUR EURIBOR | | 2.254 | 9/5/23 | EUR | 95,365 | (7,986,000 | ) | ||||||||||||||||||
|
| |||||||||||||||||||||||||||
Total Cleared Interest Rate Swaps |
| $ | (13,678,183 | ) | ||||||||||||||||||||||||
|
| |||||||||||||||||||||||||||
47 OPPENHEIMER INTERNATIONAL BOND FUND
STATEMENTOF INVESTMENTS Unaudited / Continued
Over-the-Counter Interest Rate Swaps at March 31, 2014
Counterparty | Pay/Receive Floating Rate | Floating Rate | Fixed Rate | Maturity Date | Notional Amount (000’s) | Value | ||||||||||||||||||||||
BAC | Pay | | Three-Month SEK STIBOR SIDE | | 2.175 | % | 5/10/23 | SEK | 163,000 | $ | (4,884 | ) | ||||||||||||||||
BOA | Pay | BZDI | 12.700 | 1/4/16 | BRL | 182,075 | (73,290 | ) | ||||||||||||||||||||
BOA | Pay | BZDI | 13.230 | 1/4/16 | BRL | 403,830 | 514,534 | |||||||||||||||||||||
BOA | Pay | | MXN TIIE BANXICO | | 4.345 | 1/11/16 | MXN | 1,022,900 | 220,116 | |||||||||||||||||||
DEU | Pay | BZDI | 12.850 | 1/4/16 | BRL | 204,360 | 15,039 | |||||||||||||||||||||
GSG | Pay | BZDI | 12.703 | 1/4/16 | BRL | 207,380 | (81,828 | ) | ||||||||||||||||||||
GSG | Pay | BZDI | 12.520 | 1/4/16 | BRL | 149,220 | (145,569 | ) | ||||||||||||||||||||
GSG | Receive | | Six-Month SGD SOR VWAP | | 2.810 | 9/1/24 | SGD | 63,000 | (323,620 | ) | ||||||||||||||||||
GSG | Pay | | Three-Month SEK STIBOR SIDE | | 1.565 | 5/3/18 | SEK | 635,000 | 1,200,360 | |||||||||||||||||||
GSG | Pay | BZDI | 11.880 | 1/4/16 | BRL | 191,000 | (177,878 | ) | ||||||||||||||||||||
GSG | Pay | NSERO | 8.630 | 3/10/15 | INR | 20,000,000 | (105,257 | ) | ||||||||||||||||||||
HSBC | Pay | | MXN TIIE BANXICO | | 4.760 | 1/13/16 | MXN | 1,640,400 | 321,416 | |||||||||||||||||||
JPM | Pay | BZDI | 12.090 | 1/4/16 | BRL | 155,110 | 42,058 | |||||||||||||||||||||
JPM | Pay | | Three-Month KRW CD KSDA | | 2.960 | 3/15/23 | KRW | 25,000,000 | (537,516 | ) | ||||||||||||||||||
JPM | Pay | | Three-Month KRW CD KSDA | | 3.243 | 3/18/24 | KRW | 60,000,000 | (229,464 | ) | ||||||||||||||||||
JPM | Receive | | Three-Month USD BBA LIBOR | | 2.150 | 5/30/23 | USD | 27,000 | 1,123,636 | |||||||||||||||||||
JPM | Pay | BZDI | 12.810 | 1/4/16 | BRL | 198,720 | (10,581 | ) | ||||||||||||||||||||
JPM | Pay | BZDI | 12.490 | 1/4/16 | BRL | 198,340 | (212,465 | ) | ||||||||||||||||||||
JPM | Pay | | MXN TIIE BANXICO | | 7.030 | 5/23/23 | MXN | 850,000 | (2,223,297 | ) | ||||||||||||||||||
|
| |||||||||||||||||||||||||||
Total Over-the-Counter Interest Rate Swaps |
| $ | (688,490 | ) | ||||||||||||||||||||||||
|
| |||||||||||||||||||||||||||
Over-the-Counter Credit Default Swaptions Written at March 31, 2014
Description | Counterparty | Buy/Sell Protection | Reference Asset | Fixed Rate | Expiration Date | Notional Amount (000’s) | Premiums Received | Value | ||||||||||||||||||||||||||||
Credit Default Swap maturing 12/20/18 Call | JPM | Sell | | CDX.NA.HY. 21 | | 5.000 | % | 4/16/14 | USD | 50,000 | $ | 125,000 | $ | (1,425 | ) | |||||||||||||||||||||
Credit Default Swap maturing 12/20/18 Call | JPM | Sell | | CDX.NA.HY. 21 | | 5.000 | 4/16/14 | USD | 100,000 | 150,000 | (26,590 | ) | ||||||||||||||||||||||||
Credit Default Swap maturing 12/20/18 Call | JPM | Sell | | CDX.NA.IG. 21 | | 1.000 | 6/18/14 | USD | 250,000 | 337,500 | (217,050 | ) | ||||||||||||||||||||||||
Credit Default Swap maturing 12/20/18 Call | JPM | Sell | | CDX.NA.IG. 21 | | 1.000 | 6/18/14 | USD | 250,000 | 275,000 | (361,475 | ) | ||||||||||||||||||||||||
48 OPPENHEIMER INTERNATIONAL BOND FUND
Over-the-Counter Credit Default Swaptions Written (Continued)
Description | Counterparty | Buy/Sell Protection | Reference Asset | Fixed Rate | Expiration Date | Notional Amount (000’s) | Premiums Received | Value | ||||||||||||||||||||||||||||
Credit Default Swap maturing 12/20/18 Call | JPM | Sell | | iTraxx Europe Series 20 Version 1 | | 1.000 | % | 4/16/14 | EUR | 197,750 | $ | 172,135 | $ | (12,586 | ) | |||||||||||||||||||||
Credit Default Swap maturing 12/20/18 Call | JPM | Sell | | CDX.NA.HY. 21 | | 5.000 | 4/16/14 | USD | 150,000 | 202,500 | (13,470 | ) | ||||||||||||||||||||||||
Credit Default Swap maturing 12/20/18 Call | BAC | Sell | | CDX.NA.HY. 21 | | 5.000 | 5/21/14 | USD | 50,000 | 285,000 | (114,030 | ) | ||||||||||||||||||||||||
Credit Default Swap maturing 6/20/19 Call | JPM | Sell | | iTraxx Europe Crossover Series 21 Version 1 | | 5.000 | 6/18/14 | EUR | 59,110 | 301,498 | (445,006 | ) | ||||||||||||||||||||||||
Credit Default Swap maturing 6/20/19 Call | JPM | Sell | | iTraxx Europe Crossover Series 21 Version 1 | | 5.000 | 6/18/14 | EUR | 59,110 | 574,477 | (421,897 | ) | ||||||||||||||||||||||||
|
|
|
| |||||||||||||||||||||||||||||||||
Total Over-the-Counter Credit Default Swaptions Written |
| $ | 2,423,110 | $ | (1,613,529 | ) | ||||||||||||||||||||||||||||||
|
|
|
| |||||||||||||||||||||||||||||||||
Over-the-Counter Interest Rate Swaptions Written at March 31, 2014
Description | Counterparty | Pay/ Receive Floating Rate | Floating Rate | Fixed Rate | Expiration Date | Notional Amount (000’s) | Premiums Received | Value | ||||||||||||||||||||||||||||
Interest Rate Swap maturing 5/15/21 Call | BAC | Receive | | Three- Month USD BBA LIBOR | | 2.184 | % | 5/13/14 | USD | 150,000 | $ | 577,500 | $ | (172,884 | ) | |||||||||||||||||||||
Interest Rate Swap maturing 11/25/44 Call | BAC | Receive | | Six-Month GBP BBA LIBOR | | 3.468 | 11/25/14 | GBP | 54,000 | 3,364,816 | (3,759,226 | ) | ||||||||||||||||||||||||
Interest Rate Swap maturing 5/14/19 Call | BAC | Receive | | Three- Month USD BBA LIBOR | | 1.603 | 5/12/14 | USD | 550,000 | 1,540,000 | (291,902 | ) | ||||||||||||||||||||||||
Interest Rate Swap maturing 3/22/26 Call | BAC | Pay | | Three- Month USD BBA LIBOR | | 4.125 | 3/18/16 | USD | 61,305 | 1,544,886 | (1,487,327 | ) | ||||||||||||||||||||||||
Interest Rate Swap maturing 6/1/33 Call | BAC | Pay | | Six-Month EUR EURIBOR | | 3.117 | 5/30/23 | EUR | 43,925 | 3,870,578 | (3,997,422 | ) | ||||||||||||||||||||||||
Interest Rate Swap maturing 4/8/24 Call | BAC | Pay | | Six-Month AUD BBR BBSW | | 4.420 | 4/7/14 | AUD | 75,000 | 505,153 | (252,014 | ) | ||||||||||||||||||||||||
Interest Rate Swap maturing 3/20/20 Call | BOA | Pay | | Three- Month USD BBA LIBOR | | 2.320 | 3/18/15 | USD | 300,000 | 4,830,000 | (5,952,060 | ) | ||||||||||||||||||||||||
49 OPPENHEIMER INTERNATIONAL BOND FUND
STATEMENTOF INVESTMENTS Unaudited / Continued
Over-the-Counter Interest Rate Swaptions Written (Continued)
Description | Counterparty | Pay/Receive Floating Rate | Floating Rate | Fixed Rate | Expiration Date | Notional Amount (000’s) | Premiums Received | Value | ||||||||||||||||||||||||||||
Interest Rate Swap maturing 9/8/24 Call | BOA | Pay |
| Three- Month USD BBA LIBOR |
| 3.465 | % | 9/4/14 | USD | 79,060 | $ | 537,608 | $ | (414,538 | ) | |||||||||||||||||||||
Interest Rate Swap maturing 9/8/24 Call | BOA | Receive |
| Three- Month USD BBA LIBOR |
| 2.565 | 9/4/14 | USD | 79,060 | 377,116 | (213,472 | ) | ||||||||||||||||||||||||
Interest Rate Swap maturing 6/27/19 Call | BOA | Receive |
| Three- Month USD BBA LIBOR |
| 1.783 | 6/25/14 | USD | 146,590 | 403,123 | (461,887 | ) | ||||||||||||||||||||||||
Interest Rate Swap maturing 8/4/21 Call | BOA | Pay |
| Three- Month USD BBA LIBOR |
| 4.860 | 8/2/16 | USD | 173,385 | 2,600,775 | (1,595,586 | ) | ||||||||||||||||||||||||
Interest Rate Swap maturing 6/24/19 Call | BOA | Receive |
| Three- Month USD BBA LIBOR |
| 1.855 | 6/20/14 | USD | 400,000 | 1,520,000 | (1,755,724 | ) | ||||||||||||||||||||||||
Interest Rate Swap maturing 1/4/16 Call | FIB | Pay | BZDI | 13.515 | 1/2/15 | BRL | 500,000 | 744,744 | (963,515 | ) | ||||||||||||||||||||||||||
Interest Rate Swap maturing 1/4/16 Call | FIB | Receive | BZDI | 11.750 | 1/2/15 | BRL | 500,000 | 531,960 | (673,076 | ) | ||||||||||||||||||||||||||
Interest Rate Swap maturing 1/4/16 Call | GSG | Pay | BZDI | 13.510 | 1/2/15 | BRL | 320,000 | 448,507 | (618,441 | ) | ||||||||||||||||||||||||||
Interest Rate Swap maturing 6/20/18 Call | GSG | Pay |
| Three- Month USD BBA LIBOR |
| 2.500 | 6/18/14 | USD | 250,000 | 525,000 | (1,007,718 | ) | ||||||||||||||||||||||||
Interest Rate Swap maturing 1/4/16 Call | GSG | Receive | BZDI | 11.750 | 1/2/15 | BRL | 320,000 | 323,921 | (430,769 | ) | ||||||||||||||||||||||||||
Interest Rate Swap maturing 6/16/19 Call | GSG | Receive |
| Six- Month AUD BBR BBSW |
| 3.663 | 6/13/14 | AUD | 150,000 | 414,426 | (451,003 | ) | ||||||||||||||||||||||||
Interest Rate Swap maturing 7/25/18 Call | GSG | Receive |
| Three- Month USD BBA LIBOR |
| 2.428 | 7/21/14 | USD | 600,000 | 1,710,000 | (1,714,506 | ) | ||||||||||||||||||||||||
Interest Rate Swap maturing 6/5/24 Call | GSG | Pay | | MXN TIIE BANXICO | | 6.720 | 6/17/14 | MXN | 480,000 | 639,209 | (816,492 | ) | ||||||||||||||||||||||||
Interest Rate Swap maturing 1/4/16 Call | GSG | Receive | BZDI | 11.750 | 1/2/15 | BRL | 1,200,000 | 1,051,218 | (1,615,383 | ) | ||||||||||||||||||||||||||
Interest Rate Swap maturing 5/16/24 Call | GSG | Pay | | MXN TIIE BANXICO | | 6.755 | 5/28/14 | MXN | 450,000 | 708,113 | (534,392 | ) | ||||||||||||||||||||||||
50 OPPENHEIMER INTERNATIONAL BOND FUND
Over-the-Counter Interest Rate Swaptions Written (Continued)
Description | Counterparty | Pay/Receive Floating Rate | Floating Rate | Fixed Rate | Expiration Date | Notional Amount (000’s) | Premiums Received | Value | ||||||||||||||||||||||||||||
Interest Rate Swap maturing 1/4/16 Call | GSG | Pay | BZDI | 13.830 | % | 1/2/15 | BRL | 1,200,000 | $ | 1,671,932 | $ | (1,919,587 | ) | |||||||||||||||||||||||
Interest Rate Swap maturing 6/27/19 Call | JPM | Receive |
| Three- Month USD BBA LIBOR |
| 1.795 | 6/25/14 | USD | 250,000 | 750,000 | (840,065 | ) | ||||||||||||||||||||||||
Interest Rate Swap maturing 6/27/19 Call | JPM | Receive |
| Three- Month USD BBA LIBOR |
| 1.780 | 6/25/14 | USD | 250,000 | 750,000 | (777,508 | ) | ||||||||||||||||||||||||
Interest Rate Swap maturing 6/24/19 Call | JPM | Receive |
| Three- Month USD BBA LIBOR |
| 1.850 | 6/20/14 | USD | 97,890 | 371,982 | (419,721 | ) | ||||||||||||||||||||||||
Interest Rate Swap maturing 3/21/24 Call | JPM | Pay | | MXN TIIE BANXICO | | 6.950 | 4/2/14 | MXN | 230,000 | 396,006 | (108 | ) | ||||||||||||||||||||||||
Interest Rate Swap maturing 1/18/20 Call | JPM | Pay |
| Three- Month USD BBA LIBOR |
| 4.340 | 1/16/18 | USD | 213,145 | 2,451,167 | (2,246,955 | ) | ||||||||||||||||||||||||
Interest Rate Swap maturing 3/20/24 Call | JPM | Pay | | MXN TIIE BANXICO | | 6.905 | 4/1/14 | MXN | 155,500 | 280,637 | (8 | ) | ||||||||||||||||||||||||
Interest Rate Swap maturing 5/13/24 Call | JPM | Pay |
| Six- Month AUD BBR BBSW |
| 4.075 | 5/12/14 | AUD | 43,985 | 1,144,927 | (1,279,815 | ) | ||||||||||||||||||||||||
Interest Rate Swap maturing 3/20/24 Call | JPM | Pay | | MXN TIIE BANXICO | | 6.930 | 4/1/14 | MXN | 155,500 | 290,191 | (2 | ) | ||||||||||||||||||||||||
Interest Rate Swap maturing 2/12/29 Call | JPM | Pay |
| Three- Month KRW CD KSDA |
| 4.610 | 2/11/19 | KRW | 100,000,000 | 1,026,886 | (761,684 | ) | ||||||||||||||||||||||||
Interest Rate Swap maturing 6/10/24 Call | JPM | Pay |
| Six- Month EUR EURIBOR |
| 2.205 | 6/6/14 | EUR | 150,000 | 643,560 | (161,714 | ) | ||||||||||||||||||||||||
Interest Rate Swap maturing 6/17/19 Call | JPM | Receive |
| Six- Month AUD BBR BBSW |
| 3.583 | 6/16/14 | AUD | 150,000 | 393,175 | (312,716 | ) | ||||||||||||||||||||||||
51 OPPENHEIMER INTERNATIONAL BOND FUND
STATEMENTOF INVESTMENTS Unaudited / Continued
Over-the-Counter Interest Rate Swaptions Written (Continued)
Description | Counterparty | Pay/Receive Floating Rate | Floating Rate | Fixed Rate | Expiration Date | Notional Amount (000’s) | Premiums Received | Value | ||||||||||||||||||||||||||||
Interest Rate Swap maturing 4/8/24 Call | JPM | Pay |
| Six- Month AUD BBR BBSW |
| 4.400 | % | 4/7/14 | AUD | 75,000 | $ | 538,830 | $ | (316,791 | ) | |||||||||||||||||||||
Interest Rate Swap maturing 5/14/44 Call | JPM | Receive |
| Six- Month EUR EURIBOR |
| 2.430 | 5/12/14 | EUR | 39,555 | 535,564 | (498,741 | ) | ||||||||||||||||||||||||
Interest Rate Swap maturing 5/10/24 Call | JPM | Pay | | MXN TIIE BANXICO | | 6.800 | 5/22/14 | MXN | 275,000 | 448,449 | (276,687 | ) | ||||||||||||||||||||||||
|
|
|
| |||||||||||||||||||||||||||||||||
Total Over-the-Counter Interest Rate Swaptions Written |
| $ | 40,461,959 | $ | (38,991,439 | ) | ||||||||||||||||||||||||||||||
|
|
|
| |||||||||||||||||||||||||||||||||
Glossary:
Counterparty
Abbreviations
| BAC | Barclays Bank plc | |
| BNP | BNP Paribas | |
| BOA | Bank of America NA | |
| CITNA-B | Citibank NA | |
| DEU | Deutsche Bank AG | |
| FIB | Credit Suisse International | |
| GSCO-OT | Goldman Sachs Bank USA | |
| GSG | Goldman Sachs Group, Inc. (The) | |
| HSBC | HSBC Bank USA NA | |
| JPM | JPMorgan Chase Bank NA | |
| MOS-A | Morgan Stanley | |
| MSCO | Morgan Stanley Capital Services, Inc. | |
| NOM | Nomura Global Financial Products, Inc. | |
| RBS | Royal Bank of Scotland plc (The) | |
| TDB | Toronto Dominion Bank | |
| UBS | UBS AG | |
| Currency abbreviations indicate amounts reporting in currencies | ||
| AUD | Australian Dollar | |
| BRL | Brazilian Real | |
| CAD | Canadian Dollar | |
| CHF | Swiss Franc | |
| CNH | Offshore Chinese Renminbi | |
| COP | Colombian Peso | |
| DKK | Danish Krone | |
| EUR | Euro | |
| GBP | British Pound Sterling | |
| HUF | Hungarian Forint | |
| IDR | Indonesia Rupiah | |
52 OPPENHEIMER INTERNATIONAL BOND FUND
| Currency abbreviations indicate amounts reporting in currencies (Continued) | ||
| INR | Indian Rupee | |
| JPY | Japanese Yen | |
| KRW | South Korean Won | |
| MXN | Mexican Nuevo Peso | |
| MYR | Malaysian Ringgit | |
| NOK | Norwegian Krone | |
| NZD | New Zealand Dollar | |
| PEN | Peruvian New Sol | |
| PHP | Philippines Peso | |
| PLN | Polish Zloty | |
| RON | New Romanian Leu | |
| RSD | Serbian Dinar | |
| RUB | Russian Ruble | |
| SEK | Swedish Krona | |
| SGD | Singapore Dollar | |
| THB | Thailand Baht | |
| TRY | New Turkish Lira | |
| TWD | New Taiwan Dollar | |
| USD | U.S. Dollar | |
| ZAR | South African Rand | |
| Definitions | ||
| BANXICO | Banco de Mexico | |
| BBA LIBOR | British Bankers’ Association London – Interbank Offered Rate | |
| BBR BBSW | Bank Bill Swap Reference Rate (Australian Financial Market) | |
| BZDI | Brazil Interbank Deposit Rate | |
| CD | Certificate of Deposit | |
| CDX.NA.HY.21 | Markit CDX North American High Yield | |
| CDX.NA.IG.21 | Markit CDX North American Investment Grade High Volatility | |
| EURIBOR | Euro Interbank Offered Rate | |
| iTraxx Asia Ex-Japan Series 20 Version 1 | Credit Default Swap Trading Index for a Specific Basket of Securities | |
| iTraxx Asia Ex-Japan Series 21 Version 1 | Credit Default Swap Trading Index for a Specific Basket of Securities | |
| iTraxx Europe Crossover Series 21 Version 1 | Credit Default Swap Trading Index for a Specific Basket of Securities | |
| iTraxx Europe Series 20 Version 1 | Credit Default Swap Trading Index for a Specific Basket of Securities | |
| KSDA | Korean Securities Dealers Assn. | |
| LIBOR | London - Interbank Offered Rate | |
| NSERO | Indian Rupee Floating Rate | |
| SOR VWAP | Swap Offer Rate Singapore Dollar Index | |
| STIBOR SIDE | Stockholm Interbank Offered Rate | |
| TIIE | Interbank Equilibrium Interest Rate | |
53 OPPENHEIMER INTERNATIONAL BOND FUND
STATEMENTOF INVESTMENTS Unaudited / Continued
Exchange Abbreviations | ||
| CBT | Chicago Board of Trade | |
| EUX | European Stock Exchange | |
| OTC | Over-the-Counter | |
See accompanying Notes to Financial Statements.
54 OPPENHEIMER INTERNATIONAL BOND FUND
STATEMENTOF ASSETS AND LIABILITIES March 31, 2014 Unaudited
Assets | ||||
Investments, at value—see accompanying statement of investments: | ||||
Unaffiliated companies (cost $8,522,470,926) | $ | 8,561,338,291 | ||
Affiliated companies (cost $794,738,431) | 794,738,431 | |||
|
| |||
| 9,356,076,722 | ||||
Cash used for collateral on futures | 43,964,594 | |||
Cash used for collateral on OTC derivatives | 11,104,873 | |||
Unrealized appreciation on foreign currency exchange contracts | 80,482,652 | |||
Swaps, at value (premiums paid $7,605,143) | 20,092,392 | |||
Receivables and other assets: | ||||
Investments sold | 148,416,372 | |||
Interest, dividends and principal paydowns | 113,078,761 | |||
Shares of beneficial interest sold | 13,198,346 | |||
Variation margin receivable—centrally cleared swaps | 1,677,253 | |||
Variation margin receivable | 388,125 | |||
Other | 914,265 | |||
|
| |||
Total assets | 9,789,394,355 | |||
Liabilities | ||||
Bank overdraft | 23,414,434 | |||
Bank overdraft-foreign | 816,198 | |||
Unrealized depreciation on foreign currency exchange contracts | 129,136,248 | |||
Options written, at value (premiums received $42,622,451) | 34,483,274 | |||
Swaps, at value (premiums paid $890,649) | 5,267,852 | |||
Swaptions written, at value (premiums received $42,885,069) | 40,604,968 | |||
Payables and other liabilities: | ||||
Investments purchased (including $29,070,000 purchased on a when-issued or delayed delivery basis) | 163,059,777 | |||
Shares of beneficial interest redeemed | 34,444,841 | |||
Variation margin payable—centrally cleared swaps | 15,355,436 | |||
Dividends | 2,722,752 | |||
Distribution and service plan fees | 1,089,289 | |||
Trustees’ compensation | 210,085 | |||
Variation margin payable | 187,500 | |||
Other | 163,569 | |||
|
| |||
Total liabilities | 450,956,223 | |||
Net Assets | $ | 9,338,438,132 | ||
|
| |||
Composition of Net Assets | ||||
Par value of shares of beneficial interest | $ | 1,532,326 | ||
Additional paid-in capital | 9,782,286,628 | |||
Accumulated net investment loss | (67,991,509 | ) | ||
Accumulated net realized loss on investments and foreign currency transactions | (371,417,907 | ) | ||
|
| |||
Net unrealized depreciation on investments and translation of assets and liabilities denominated in foreign currencies | (5,971,406 | ) | ||
|
| |||
Net Assets | $ | 9,338,438,132 | ||
|
|
55 �� OPPENHEIMER INTERNATIONAL BOND FUND
STATEMENTOF ASSETS AND LIABILITIES Unaudited / Continued
Net Asset Value Per Share | ||||
Class A Shares: | ||||
Net asset value and redemption price per share (based on net assets of $3,956,988,700 and 648,844,588 shares of beneficial interest outstanding) | $ | 6.10 | ||
Maximum offering price per share (net asset value plus sales charge of 4.75% of offering price) | $ | 6.40 | ||
Class B Shares: | ||||
Net asset value, redemption price (excludes applicable contingent deferred sales charge) and offering price per share (based on net assets of $99,603,635 and 16,395,332 shares of beneficial interest outstanding) | $ | 6.08 | ||
Class C Shares: | ||||
Net asset value, redemption price (excludes applicable contingent deferred sales charge) and offering price per share (based on net assets of $1,014,610,367 and 166,991,118 shares of beneficial interest outstanding) | $ | 6.08 | ||
Class I Shares: | ||||
Net asset value, redemption price and offering price per share (based on net assets of $571,603,943 and 93,846,199 shares of beneficial interest outstanding) | $ | 6.09 | ||
Class N Shares: | ||||
Net asset value, redemption price (excludes applicable contingent deferred sales charge) and offering price per share (based on net assets of $232,997,282 and 38,317,715 shares of beneficial interest outstanding) | $ | 6.08 | ||
Class Y Shares: | ||||
Net asset value, redemption price and offering price per share (based on net assets of $3,462,634,205 and 567,930,649 shares of beneficial interest outstanding) | $ | 6.10 |
See accompanying Notes to Financial Statements
56 OPPENHEIMER INTERNATIONAL BOND FUND
STATEMENTOF OPERATIONS For the Six Months Ended March 31, 2014 Unaudited
Investment Income | ||||
Interest | $ | 216,248,804 | ||
Dividends from affiliated companies | 107,428 | |||
|
| |||
Total investment income | 216,356,232 | |||
Expenses | ||||
Management fees | 25,466,379 | |||
Distribution and service plan fees: | ||||
Class A | 5,432,595 | |||
Class B | 569,449 | |||
Class C | 5,603,185 | |||
Class N | 602,534 | |||
Transfer and shareholder servicing agent fees: | ||||
Class A | 5,130,408 | |||
Class B | 155,377 | |||
Class C | 944,173 | |||
Class I | 80,283 | |||
Class N | 485,376 | |||
Class Y | 3,094,142 | |||
Shareholder communications: | ||||
Class A | 223,640 | |||
Class B | 7,832 | |||
Class C | 54,360 | |||
Class I | 227 | |||
Class N | 1,784 | |||
Class Y | 280,742 | |||
Custodian fees and expenses | 956,190 | |||
Trustees’ compensation | 110,751 | |||
Other | 313,614 | |||
|
| |||
Total expenses | 49,513,041 | |||
Less waivers and reimbursements of expenses | (204,423 | ) | ||
|
| |||
Net expenses | 49,308,618 | |||
Net Investment Income | 167,047,614 |
57 OPPENHEIMER INTERNATIONAL BOND FUND
STATEMENTOF OPERATIONS Unaudited / Continued
Realized and Unrealized Gain (Loss) | ||||
Net realized gain (loss) on: | ||||
Investments from unaffiliated companies (including premiums on options and swaptions exercised) | $ | (143,685,006 | ) | |
Closing and expiration of option contracts written | 14,723,084 | |||
Closing and expiration of futures contracts | (21,697,414 | ) | ||
Foreign currency transactions | (181,546,224 | ) | ||
Swap contracts | (55,653,831 | ) | ||
Closing and expiration of swaption contracts written | 12,422,829 | |||
|
| |||
Net realized loss | (375,436,562 | ) | ||
Net change in unrealized appreciation/depreciation on: | ||||
Investments | 196,551,118 | |||
Translation of assets and liabilities denominated in foreign currencies | 91,617,751 | |||
Futures contracts | 21,487,660 | |||
Option contracts written | (7,078,937 | ) | ||
Swap contracts | 39,466,603 | |||
Swaption contracts written | 49,059,969 | |||
|
| |||
Net change in unrealized appreciation/depreciation | 391,104,164 | |||
Net Increase in Net Assets Resulting from Operations | $ | 182,715,216 | ||
|
|
See accompanying Notes to Financial Statements.
58 OPPENHEIMER INTERNATIONAL BOND FUND
STATEMENTSOF CHANGES IN NET ASSETS
| Six Months Ended March 31, 2014 (Unaudited) | Year Ended September 30, 2013 | |||||||
Operations | ||||||||
Net investment income | $ | 167,047,614 | $ | 450,587,360 | ||||
Net realized loss | (375,436,562 | ) | (50,658,128 | ) | ||||
Net change in unrealized appreciation/depreciation | 391,104,164 | (751,083,746 | ) | |||||
|
|
|
| |||||
Net increase (decrease) in net assets resulting from operations | 182,715,216 | (351,154,514 | ) | |||||
Dividends and/or Distributions to Shareholders | ||||||||
Dividends from net investment income: | ||||||||
Class A | (71,565,011 | ) | (207,329,209 | ) | ||||
Class B | (1,412,116 | ) | (4,769,252 | ) | ||||
Class C | (14,543,723 | ) | (45,809,112 | ) | ||||
Class I | (9,966,539 | ) | (8,379,307 | ) | ||||
Class N | (3,505,453 | ) | (9,643,527 | ) | ||||
Class Y | (64,968,082 | ) | (187,397,255 | ) | ||||
|
|
|
| |||||
| (165,960,924 | ) | (463,327,662 | ) | |||||
Distributions from net realized gain: | ||||||||
Class A | (1,551,481 | ) | (35,431,146 | ) | ||||
Class B | (41,079 | ) | (1,125,675 | ) | ||||
Class C | (397,939 | ) | (9,753,509 | ) | ||||
Class I | (171,958 | ) | (202,424 | ) | ||||
Class N | (86,156 | ) | (1,870,317 | ) | ||||
Class Y | (1,251,387 | ) | (29,569,939 | ) | ||||
|
|
|
| |||||
| (3,500,000 | ) | (77,953,010 | ) | |||||
Beneficial Interest Transactions | ||||||||
Net increase (decrease) in net assets resulting from beneficial interest transactions: | ||||||||
Class A | (842,554,617 | ) | (700,925,118 | ) | ||||
Class B | (29,376,239 | ) | (54,212,964 | ) | ||||
Class C | (225,776,001 | ) | (270,119,587 | ) | ||||
Class I | 27,758,807 | 577,670,503 | ||||||
Class N | (20,098,032 | ) | (42,305,087 | ) | ||||
Class Y | (488,932,543 | ) | (459,827,692 | ) | ||||
|
|
|
| |||||
| (1,578,978,625 | ) | (949,719,945 | ) | |||||
Net Assets | ||||||||
Total decrease | (1,565,724,333 | ) | (1,842,155,131 | ) | ||||
Beginning of period | 10,904,162,465 | 12,746,317,596 | ||||||
|
|
|
| |||||
End of period (including accumulated net investment loss of $67,991,509 and $69,078,199, respectively) | $ | 9,338,438,132 | $ | 10,904,162,465 | ||||
|
|
|
| |||||
See accompanying Notes to Financial Statements.
59 OPPENHEIMER INTERNATIONAL BOND FUND
Class A | Six Months Ended March 31, 2014 (Unaudited) | Year Ended September 30, 2013 | Year Ended September 28, 2012 1 | Year Ended September 30, 2011 | Year Ended September 30, 2010 | Year Ended September 30, 2009 | ||||||||||||||||||
Per Share Operating Data | ||||||||||||||||||||||||
Net asset value, beginning of period | $ | 6.09 | $ | 6.54 | $ | 6.29 | $ | 6.80 | $ | 6.54 | $ | 5.96 | ||||||||||||
Income (loss) from investment operations: | ||||||||||||||||||||||||
Net investment income2 | 0.10 | 0.23 | 0.25 | 0.25 | 0.26 | 0.22 | ||||||||||||||||||
Net realized and unrealized gain (loss) | 0.01 | (0.40 | ) | 0.33 | (0.44 | ) | 0.31 | 0.74 | ||||||||||||||||
|
|
|
|
|
|
|
|
|
|
|
| |||||||||||||
Total from investment operations | 0.11 | (0.17 | ) | 0.58 | (0.19 | ) | 0.57 | 0.96 | ||||||||||||||||
Dividends and/or distributions to shareholders: | ||||||||||||||||||||||||
Dividends from net investment income | (0.10 | ) | (0.24 | ) | (0.33 | ) | (0.26 | ) | (0.26 | ) | (0.33 | ) | ||||||||||||
Distributions from net realized gain | 0.00 | 3 | (0.04 | ) | 0.00 | (0.06 | ) | (0.05 | ) | (0.05 | ) | |||||||||||||
|
|
|
|
|
|
|
|
|
|
|
| |||||||||||||
Total dividends and/or distributions to shareholders | (0.10 | ) | (0.28 | ) | (0.33 | ) | (0.32 | ) | (0.31 | ) | (0.38 | ) | ||||||||||||
|
|
|
|
|
|
|
|
|
|
|
| |||||||||||||
Net asset value, end of period | $ | 6.10 | $ | 6.09 | $ | 6.54 | $ | 6.29 | $ | 6.80 | $ | 6.54 | ||||||||||||
|
|
|
|
|
|
|
|
|
|
|
| |||||||||||||
Total Return, at Net Asset Value4 | 1.85 | % | (2.77 | )% | 9.58 | % | (2.88 | )% | 9.04 | % | 16.83 | % | ||||||||||||
Ratios/Supplemental Data | ||||||||||||||||||||||||
Net assets, end of period (in thousands) | $ | 3,956,989 | $ | 4,794,923 | $ | 5,886,327 | $ | 6,382,276 | $ | 7,406,875 | $ | 7,268,308 | ||||||||||||
Average net assets (in thousands) | $ | 4,380,721 | $ | 5,586,929 | $ | 6,013,740 | $ | 7,004,799 | $ | 7,345,330 | $ | 6,632,191 | ||||||||||||
Ratios to average net assets:5 | ||||||||||||||||||||||||
Net investment income | 3.30 | % | 3.61 | % | 3.89 | % | 3.80 | % | 4.04 | % | 3.77 | % | ||||||||||||
Total expenses6 | 1.03 | % | 1.01 | % | 1.02 | % | 0.98 | % | 0.98 | % | 0.99 | % | ||||||||||||
Expenses after payments, waivers and/or reimbursements and reduction to custodian expenses | 1.03 | % | 1.01 | % | 1.02 | % | 0.98 | % | 0.98 | % | 0.98 | % | ||||||||||||
Portfolio turnover rate | 52 | % | 105 | % | 111 | % | 80 | % | 146 | % | 112 | % | ||||||||||||
60 OPPENHEIMER INTERNATIONAL BOND FUND
| 1. | September 28, 2012 represents the last business day of the Fund’s reporting period. |
| 2. | Per share amounts calculated based on the average shares outstanding during the period. |
| 3. | Less than $0.005 per share. |
| 4. | Assumes an initial investment on the business day before the first day of the fiscal period, with all dividends and distributions reinvested in additional shares on the reinvestment date, and redemption at the net asset value calculated on the last business day of the fiscal period. Sales charges are not reflected in the total returns. Total returns are not annualized for periods less than one full year. Returns do not reflect the deduction of taxes that a shareholder would pay on fund distributions or the redemption of fund shares. |
| 5. | Annualized for periods less than one full year. |
| 6. | Total expenses including indirect expenses from affiliated fund were as follows: |
Six Months Ended March 31, 2014 | 1.03 | % | ||
Year Ended September 30, 2013 | 1.01 | % | ||
Year Ended September 28, 2012 | 1.02 | % | ||
Year Ended September 30, 2011 | 0.98 | % | ||
Year Ended September 30, 2010 | 0.98 | % | ||
Year Ended September 30, 2009 | 1.00 | % |
See accompanying Notes to Financial Statements.
61 OPPENHEIMER INTERNATIONAL BOND FUND
FINANCIAL HIGHLIGHTS Continued
Class B | Six Months Ended March 31, 2014 (Unaudited) | Year Ended September 30, 2013 | Year Ended September 28, 2012 1 | Year Ended September 30, 2011 | Year Ended September 30, 2010 | Year Ended September 30, 2009 | ||||||||||||||||||
Per Share Operating Data | ||||||||||||||||||||||||
Net asset value, beginning of period | $ | 6.07 | $ | 6.51 | $ | 6.27 | $ | 6.78 | $ | 6.52 | $ | 5.94 | ||||||||||||
Income (loss) from investment operations: | ||||||||||||||||||||||||
Net investment income2 | 0.08 | 0.18 | 0.19 | 0.19 | 0.20 | 0.17 | ||||||||||||||||||
Net realized and unrealized gain (loss) | 0.00 | 3 | (0.40 | ) | 0.33 | (0.44 | ) | 0.31 | 0.74 | |||||||||||||||
|
|
|
|
|
|
|
|
|
|
|
| |||||||||||||
Total from investment operations | 0.08 | (0.22 | ) | 0.52 | (0.25 | ) | 0.51 | 0.91 | ||||||||||||||||
Dividends and/or distributions to shareholders: | ||||||||||||||||||||||||
Dividends from net investment income | (0.07 | ) | (0.18 | ) | (0.28 | ) | (0.20 | ) | (0.20 | ) | (0.28 | ) | ||||||||||||
Distributions from net realized gain | 0.00 | 3 | (0.04 | ) | 0.00 | (0.06 | ) | (0.05 | ) | (0.05 | ) | |||||||||||||
|
|
|
|
|
|
|
|
|
|
|
| |||||||||||||
Total dividends and/or distributions to shareholders | (0.07 | ) | (0.22 | ) | (0.28 | ) | (0.26 | ) | (0.25 | ) | (0.33 | ) | ||||||||||||
|
|
|
|
|
|
|
|
|
|
|
| |||||||||||||
Net asset value, end of period | $ | 6.08 | $ | 6.07 | $ | 6.51 | $ | 6.27 | $ | 6.78 | $ | 6.52 | ||||||||||||
|
|
|
|
|
|
|
|
|
|
|
| |||||||||||||
Total Return, at Net Asset Value4 | 1.45 | % | (3.46 | )% | 8.50 | % | (3.74 | )% | 8.13 | % | 15.87 | % | ||||||||||||
Ratios/Supplemental Data | ||||||||||||||||||||||||
Net assets, end of period (in thousands) | $ | 99,604 | $ | 128,905 | $ | 193,955 | $ | 226,660 | $ | 286,029 | $ | 284,424 | ||||||||||||
Average net assets (in thousands) | $ | 113,989 | $ | 165,674 | $ | 208,830 | $ | 257,491 | $ | 279,115 | $ | 269,970 | ||||||||||||
Ratios to average net assets:5 | ||||||||||||||||||||||||
Net investment income | 2.50 | % | 2.77 | % | 3.02 | % | 2.93 | % | 3.18 | % | 2.89 | % | ||||||||||||
Total expenses6 | 1.83 | % | 1.85 | % | 1.89 | % | 1.84 | % | 1.85 | % | 1.86 | % | ||||||||||||
Expenses after payments, waivers and/or reimbursements and reduction to custodian expenses | 1.83 | % | 1.85 | % | 1.89 | % | 1.84 | % | 1.85 | % | 1.85 | % | ||||||||||||
Portfolio turnover rate | 52 | % | 105 | % | 111 | % | 80 | % | 146 | % | 112 | % | ||||||||||||
| 1. | September 28, 2012 represents the last business day of the Fund’s reporting period. |
| 2. | Per share amounts calculated based on the average shares outstanding during the period. |
| 3. | Less than $0.005 per share. |
| 4. | Assumes an initial investment on the business day before the first day of the fiscal period, with all dividends and distributions reinvested in additional shares on the reinvestment date, and redemption at the net asset value calculated on the last business day of the fiscal period. Sales charges are not reflected in the total returns. Total returns are not annualized for periods less than one full year. Returns do not reflect the deduction of taxes that a shareholder would pay on fund distributions or the redemption of fund shares. |
| 5. | Annualized for periods less than one full year. |
| 6. | Total expenses including indirect expenses from affiliated fund were as follows: |
Six Months Ended March 31, 2014 | 1.83 | % | ||
Year Ended September 30, 2013 | 1.85 | % | ||
Year Ended September 28, 2012 | 1.89 | % | ||
Year Ended September 30, 2011 | 1.84 | % | ||
Year Ended September 30, 2010 | 1.85 | % | ||
Year Ended September 30, 2009 | 1.87 | % |
See accompanying Notes to Financial Statements.
62 OPPENHEIMER INTERNATIONAL BOND FUND
Class C | Six Months Ended March 31, 2014 (Unaudited) | Year Ended September 30, 2013 | Year Ended September 28, 2012 1 | Year Ended September 30, 2011 | Year Ended September 30, 2010 | Year Ended September 30, 2009 | ||||||||||||||||||
Per Share Operating Data | ||||||||||||||||||||||||
Net asset value, beginning of period | $ | 6.07 | $ | 6.51 | $ | 6.27 | $ | 6.78 | $ | 6.52 | $ | 5.94 | ||||||||||||
Income (loss) from investment operations: | ||||||||||||||||||||||||
Net investment income2 | 0.08 | 0.19 | 0.20 | 0.21 | 0.21 | 0.18 | ||||||||||||||||||
Net realized and unrealized gain (loss) | 0.01 | (0.40 | ) | 0.33 | (0.45 | ) | 0.31 | 0.74 | ||||||||||||||||
|
|
|
|
|
|
|
|
|
|
|
| |||||||||||||
Total from investment operations | 0.09 | (0.21 | ) | 0.53 | (0.24 | ) | 0.52 | 0.92 | ||||||||||||||||
Dividends and/or distributions to shareholders: | ||||||||||||||||||||||||
Dividends from net investment income | (0.08 | ) | (0.19 | ) | (0.29 | ) | (0.21 | ) | (0.21 | ) | (0.29 | ) | ||||||||||||
Distributions from net realized gain | 0.00 | 3 | (0.04 | ) | 0.00 | (0.06 | ) | (0.05 | ) | (0.05 | ) | |||||||||||||
|
|
|
|
|
|
|
|
|
|
|
| |||||||||||||
Total dividends and/or distributions to shareholders | (0.08 | ) | (0.23 | ) | (0.29 | ) | (0.27 | ) | (0.26 | ) | (0.34 | ) | ||||||||||||
|
|
|
|
|
|
|
|
|
|
|
| |||||||||||||
Net asset value, end of period | $ | 6.08 | $ | 6.07 | $ | 6.51 | $ | 6.27 | $ | 6.78 | $ | 6.52 | ||||||||||||
|
|
|
|
|
|
|
|
|
|
|
| |||||||||||||
Total Return, at Net Asset Value4 | 1.50 | % | (3.30 | )% | 8.69 | % | (3.58 | )% | 8.29 | % | 16.04 | % | ||||||||||||
Ratios/Supplemental Data | ||||||||||||||||||||||||
Net assets, end of period (in thousands) | $ | 1,014,610 | $ | 1,238,931 | $ | 1,614,123 | $ | 1,724,712 | $ | 2,029,424 | $ | 1,812,805 | ||||||||||||
Average net assets (in thousands) | $ | 1,123,063 | $ | 1,509,389 | $ | 1,651,022 | $ | 1,891,414 | $ | 1,965,153 | $ | 1,594,278 | ||||||||||||
Ratios to average net assets:5 | ||||||||||||||||||||||||
Net investment income | 2.62 | % | 2.93 | % | 3.21 | % | 3.10 | % | 3.34 | % | 3.05 | % | ||||||||||||
Total expenses6 | 1.72 | % | 1.69 | % | 1.71 | % | 1.68 | % | 1.69 | % | 1.71 | % | ||||||||||||
Expenses after payments, waivers and/or reimbursements and reduction to custodian expenses | 1.72 | % | 1.69 | % | 1.71 | % | 1.68 | % | 1.69 | % | 1.70 | % | ||||||||||||
Portfolio turnover rate | 52 | % | 105 | % | 111 | % | 80 | % | 146 | % | 112 | % | ||||||||||||
63 OPPENHEIMER INTERNATIONAL BOND FUND
FINANCIAL HIGHLIGHTS Continued
| 1. | September 28, 2012 represents the last business day of the Fund’s reporting period. |
| 2. | Per share amounts calculated based on the average shares outstanding during the period. |
| 3. | Less than $0.005 per share. |
| 4. | Assumes an initial investment on the business day before the first day of the fiscal period, with all dividends and distributions reinvested in additional shares on the reinvestment date, and redemption at the net asset value calculated on the last business day of the fiscal period. Sales charges are not reflected in the total returns. Total returns are not annualized for periods less than one full year. Returns do not reflect the deduction of taxes that a shareholder would pay on fund distributions or the redemption of fund shares. |
| 5. | Annualized for periods less than one full year. |
| 6. | Total expenses including indirect expenses from affiliated fund were as follows: |
Six Months Ended March 31, 2014 | 1.72 | % | ||
Year Ended September 30, 2013 | 1.69 | % | ||
Year Ended September 28, 2012 | 1.71 | % | ||
Year Ended September 30, 2011 | 1.68 | % | ||
Year Ended September 30, 2010 | 1.69 | % | ||
Year Ended September 30, 2009 | 1.72 | % |
See accompanying Notes to Financial Statements.
64 OPPENHEIMER INTERNATIONAL BOND FUND
Class I | Six Months Ended March 31, 2014 (Unaudited) | Year Ended September 30, 2013 | Period Ended September 28, 20121,2 | |||||||||
Per Share Operating Data | ||||||||||||
Net asset value, beginning of period | $ | 6.08 | $ | 6.53 | $ | 6.36 | ||||||
Income (loss) from investment operations: | ||||||||||||
Net investment income3 | 0.11 | 0.24 | 0.18 | |||||||||
Net realized and unrealized gain (loss) | 0.01 | (0.38 | ) | 0.18 | ||||||||
|
|
|
|
|
| |||||||
Total from investment operations | 0.12 | (0.14 | ) | 0.36 | ||||||||
Dividends and/or distributions to shareholders: | ||||||||||||
Dividends from net investment income | (0.11 | ) | (0.27 | ) | (0.19 | ) | ||||||
Distributions from net realized gain | 0.00 | 4 | (0.04 | ) | 0.00 | |||||||
|
|
|
|
|
| |||||||
Total dividends and/or distributions to shareholders | (0.11 | ) | (0.31 | ) | (0.19 | ) | ||||||
|
|
|
|
|
| |||||||
Net asset value, end of period | $ | 6.09 | $ | 6.08 | $ | 6.53 | ||||||
|
|
|
|
|
| |||||||
Total Return, at Net Asset Value5 | 2.08 | % | (2.31 | )% | 5.70 | % | ||||||
Ratios/Supplemental Data | ||||||||||||
Net assets, end of period (in thousands) | $ | 571,604 | $ | 542,637 | $ | 855 | ||||||
Average net assets (in thousands) | $ | 536,504 | $ | 206,805 | $ | 380 | ||||||
Ratios to average net assets:6 | ||||||||||||
Net investment income | 3.75 | % | 3.95 | % | 4.20 | % | ||||||
Total expenses7 | 0.57 | % | 0.57 | % | 0.57 | % | ||||||
Expenses after payments, waivers and/or reimbursements and reduction to custodian expenses | 0.57 | % | 0.57 | % | 0.57 | % | ||||||
Portfolio turnover rate | 52 | % | 105 | % | 111 | % | ||||||
| 1. | September 28, 2012 represents the last business day of the Fund’s reporting period. |
| 2. | For the period from January 27, 2012 (inception of offering) to September 28, 2012. |
| 3. | Per share amounts calculated based on the average shares outstanding during the period. |
| 4. | Less than $0.005 per share. |
| 5. | Assumes an initial investment on the business day before the first day of the fiscal period, with all dividends and distributions reinvested in additional shares on the reinvestment date, and redemption at the net asset value calculated on the last business day of the fiscal period. Sales charges are not reflected in the total returns. Total returns are not annualized for periods less than one full year. Returns do not reflect the deduction of taxes that a shareholder would pay on fund distributions or the redemption of fund shares. |
| 6. | Annualized for periods less than one full year. |
| 7. | Total expenses including indirect expenses from affiliated fund were as follows: |
Six Months Ended March 31, 2014 | 0.57 | % | ||
Year Ended September 30, 2013 | 0.57 | % | ||
Period Ended September 28, 2012 | 0.57 | % |
See accompanying Notes to Financial Statements.
65 OPPENHEIMER INTERNATIONAL BOND FUND
FINANCIAL HIGHLIGHTS Continued
Class N | Six Months Ended March 31, 2014 (Unaudited) | Year Ended September 30, 2013 | Year Ended September 28, 2012 1 | Year Ended September 30, 2011 | Year Ended September 30, 2010 | Year Ended September 30, 2009 | ||||||||||||||||||
Per Share Operating Data | ||||||||||||||||||||||||
Net asset value, beginning of period | $ | 6.07 | $ | 6.52 | $ | 6.28 | $ | 6.79 | $ | 6.52 | $ | 5.95 | ||||||||||||
Income (loss) from investment operations: | ||||||||||||||||||||||||
Net investment income2 | 0.09 | 0.20 | 0.22 | 0.22 | 0.23 | 0.20 | ||||||||||||||||||
Net realized and unrealized gain (loss) | 0.01 | (0.40 | ) | 0.33 | (0.44 | ) | 0.32 | 0.72 | ||||||||||||||||
|
|
|
|
|
|
|
|
|
|
|
| |||||||||||||
Total from investment operations | 0.10 | (0.20 | ) | 0.55 | (0.22 | ) | 0.55 | 0.92 | ||||||||||||||||
Dividends and/or distributions to shareholders: | ||||||||||||||||||||||||
Dividends from net investment income | (0.09 | ) | (0.21 | ) | (0.31 | ) | (0.23 | ) | (0.23 | ) | (0.30 | ) | ||||||||||||
Distributions from net realized gain | 0.00 | 3 | (0.04 | ) | 0.00 | (0.06 | ) | (0.05 | ) | (0.05 | ) | |||||||||||||
|
|
|
|
|
|
|
|
|
|
|
| |||||||||||||
Total dividends and/or distributions to shareholders | (0.09 | ) | (0.25 | ) | (0.31 | ) | (0.29 | ) | (0.28 | ) | (0.35 | ) | ||||||||||||
|
|
|
|
|
|
|
|
|
|
|
| |||||||||||||
Net asset value, end of period | $ | 6.08 | $ | 6.07 | $ | 6.52 | $ | 6.28 | $ | 6.79 | $ | 6.52 | ||||||||||||
|
|
|
|
|
|
|
|
|
|
|
| |||||||||||||
Total Return, at Net Asset Value4 | 1.67 | % | (3.16 | )% | 9.01 | % | (3.28 | )% | 8.80 | % | 16.23 | % | ||||||||||||
Ratios/Supplemental Data | ||||||||||||||||||||||||
Net assets, end of period (in thousands) | $ | 232,997 | $ | 252,758 | $ | 314,773 | $ | 322,070 | $ | 310,338 | $ | 258,219 | ||||||||||||
Average net assets (in thousands) | $ | 241,525 | $ | 290,208 | $ | 314,673 | $ | 325,834 | $ | 279,336 | $ | 233,767 | ||||||||||||
Ratios to average net assets:5 | ||||||||||||||||||||||||
Net investment income | 2.93 | % | 3.19 | % | 3.50 | % | 3.39 | % | 3.65 | % | 3.37 | % | ||||||||||||
Total expenses6 | 1.44 | % | 1.53 | % | 1.54 | % | 1.44 | % | 1.65 | % | 1.68 | % | ||||||||||||
Expenses after payments, waivers and/or reimbursements and reduction to custodian expenses | 1.39 | % | 1.43 | % | 1.41 | % | 1.38 | % | 1.38 | % | 1.38 | % | ||||||||||||
Portfolio turnover rate | 52 | % | 105 | % | 111 | % | 80 | % | 146 | % | 112 | % | ||||||||||||
| 1. | September 28, 2012 represents the last business day of the Fund’s reporting period. |
| 2. | Per share amounts calculated based on the average shares outstanding during the period. |
| 3. | Less than $0.005 per share. |
| 4. | Assumes an initial investment on the business day before the first day of the fiscal period, with all dividends and distributions reinvested in additional shares on the reinvestment date, and redemption at the net asset value calculated on the last business day of the fiscal period. Sales charges are not reflected in the total returns. Total returns are not annualized for periods less than one full year. Returns do not reflect the deduction of taxes that a shareholder would pay on fund distributions or the redemption of fund shares. |
| 5. | Annualized for periods less than one full year. |
| 6. | Total expenses including indirect expenses from affiliated fund were as follows: |
Six Months Ended March 31, 2014 | 1.44 | % | ||
Year Ended September 30, 2013 | 1.53 | % | ||
Year Ended September 28, 2012 | 1.54 | % | ||
Year Ended September 30, 2011 | 1.44 | % | ||
Year Ended September 30, 2010 | 1.65 | % | ||
Year Ended September 30, 2009 | 1.69 | % |
See accompanying Notes to Financial Statements.
66 OPPENHEIMER INTERNATIONAL BOND FUND
Class Y | Six Months Ended March 31, 2014 (Unaudited) | Year Ended September 30, 2013 | Year Ended September 28, 2012 1 | Year Ended September 30, 2011 | Year Ended September 30, 2010 | Year Ended September 30, 2009 | ||||||||||||||||||
Per Share Operating Data | ||||||||||||||||||||||||
Net asset value, beginning of period | $ | 6.09 | $ | 6.53 | $ | 6.29 | $ | 6.80 | $ | 6.54 | $ | 5.96 | ||||||||||||
Income (loss) from investment operations: | ||||||||||||||||||||||||
Net investment income2 | 0.11 | 0.25 | 0.26 | 0.27 | 0.28 | 0.25 | ||||||||||||||||||
Net realized and unrealized gain (loss) | 0.01 | (0.40 | ) | 0.33 | (0.44 | ) | 0.31 | 0.73 | ||||||||||||||||
|
|
|
|
|
|
|
|
|
|
| �� | |||||||||||||
Total from investment operations | 0.12 | (0.15 | ) | 0.59 | (0.17 | ) | 0.59 | 0.98 | ||||||||||||||||
Dividends and/or distributions to shareholders: | ||||||||||||||||||||||||
Dividends from net investment income | (0.11 | ) | (0.25 | ) | (0.35 | ) | (0.28 | ) | (0.28 | ) | (0.35 | ) | ||||||||||||
Distributions from net realized gain | 0.00 | 3 | (0.04 | ) | 0.00 | (0.06 | ) | (0.05 | ) | (0.05 | ) | |||||||||||||
|
|
|
|
|
|
|
|
|
|
|
| |||||||||||||
Total dividends and/or distributions to shareholders | (0.11 | ) | (0.29 | ) | (0.35 | ) | (0.34 | ) | (0.33 | ) | (0.40 | ) | ||||||||||||
|
|
|
|
|
|
|
|
|
|
|
| |||||||||||||
Net asset value, end of period | $ | 6.10 | $ | 6.09 | $ | 6.53 | $ | 6.29 | $ | 6.80 | $ | 6.54 | ||||||||||||
|
|
|
|
|
|
|
|
|
|
|
| |||||||||||||
Total Return, at Net Asset Value4 | 2.00 | % | (2.36 | )% | 9.71 | % | (2.64 | )% | 9.38 | % | 17.26 | % | ||||||||||||
Ratios/Supplemental Data | ||||||||||||||||||||||||
Net assets, end of period (in thousands) | $ | 3,462,634 | $ | 3,946,008 | $ | 4,736,285 | $ | 4,084,001 | $ | 3,388,175 | $ | 1,890,729 | ||||||||||||
Average net assets (in thousands) | $ | 3,640,529 | $ | 4,710,455 | $ | 4,446,720 | $ | 3,861,749 | $ | 2,732,256 | $ | 1,317,017 | ||||||||||||
Ratios to average net assets:5 | ||||||||||||||||||||||||
Net investment income | 3.60 | % | 3.88 | % | 4.16 | % | 4.04 | % | 4.38 | % | 4.16 | % | ||||||||||||
Total expenses6 | 0.72 | % | 0.74 | % | 0.75 | % | 0.74 | % | 0.67 | % | 0.62 | % | ||||||||||||
Expenses after payments, waivers and/or reimbursements and reduction to custodian expenses | 0.72 | % | 0.74 | % | 0.75 | % | 0.73 | % | 0.67 | % | 0.61 | % | ||||||||||||
Portfolio turnover rate | 52 | % | 105 | % | 111 | % | 80 | % | 146 | % | 112 | % | ||||||||||||
67 OPPENHEIMER INTERNATIONAL BOND FUND
FINANCIAL HIGHLIGHTS Continued
| 1. | September 28, 2012 represents the last business day of the Fund’s reporting period. |
| 2. | Per share amounts calculated based on the average shares outstanding during the period. |
| 3. | Less than $0.005 per share. |
| 4. | Assumes an initial investment on the business day before the first day of the fiscal period, with all dividends and distributions reinvested in additional shares on the reinvestment date, and redemption at the net asset value calculated on the last business day of the fiscal period. Sales charges are not reflected in the total returns. Total returns are not annualized for periods less than one full year. Returns do not reflect the deduction of taxes that a shareholder would pay on fund distributions or the redemption of fund shares. |
| 5. | Annualized for periods less than one full year. |
| 6. | Total expenses including indirect expenses from affiliated fund were as follows: |
Six Months Ended March 31, 2014 | 0.72 | % | ||
Year Ended September 30, 2013 | 0.74 | % | ||
Year Ended September 28, 2012 | 0.75 | % | ||
Year Ended September 30, 2011 | 0.74 | % | ||
Year Ended September 30, 2010 | 0.67 | % | ||
Year Ended September 30, 2009 | 0.63 | % |
See accompanying Notes to Financial Statements.
68 OPPENHEIMER INTERNATIONAL BOND FUND
NOTESTO FINANCIAL STATEMENTS March 31, 2014 Unaudited
1. Significant Accounting Policies
Oppenheimer International Bond Fund (the “Fund”) is a non-diversified open-end management investment company registered under the Investment Company Act of 1940, as amended. The Fund’s investment objective is to seek total return. The Fund’s investment adviser is OFI Global Asset Management, Inc. (“OFI Global” or the “Manager”), a wholly-owned subsidiary of OppenheimerFunds, Inc. (“OFI” or the “Sub-Adviser���). The Manager has entered into a sub-advisory agreement with OFI.
The Fund offers Class A, Class C, Class I, Class N and Class Y shares, and previously offered Class B shares for new purchase through June 29, 2012. Subsequent to that date, no new purchases of Class B shares are permitted, however reinvestment of dividend and/or capital gain distributions and exchanges of Class B shares into and from other Oppenheimer funds will be allowed. Class A shares are sold at their offering price, which is normally net asset value plus a front-end sales charge. Class C and Class N shares are sold, and Class B shares were sold, without a front-end sales charge but may be subject to a contingent deferred sales charge (“CDSC”). Class N shares are sold only through retirement plans. Retirement plans that offer Class N shares may impose charges on those accounts. Class I and Class Y shares are sold to certain institutional investors or intermediaries without either a front-end sales charge or a CDSC, however, the intermediaries may impose charges on their accountholders who beneficially own Class I and Class Y shares. All classes of shares have identical rights and voting privileges with respect to the Fund in general and exclusive voting rights on matters that affect that class alone. Earnings, net assets and net asset value per share may differ due to each class having its own expenses, such as transfer and shareholder servicing agent fees and shareholder communications, directly attributable to that class. Class A, B, C and N shares have separate distribution and/or service plans under which they pay fees. Class I and Class Y shares do not pay such fees. Class B shares will automatically convert to Class A shares 72 months after the date of purchase.
The following is a summary of significant accounting policies consistently followed by the Fund.
Structured Securities. The Fund invests in structured securities whose market values, interest rates and/or redemption prices are linked to the performance of underlying foreign currencies, interest rate spreads, stock market indices, prices of individual securities, commodities or other financial instruments or the occurrence of other specific events. The structured securities are often leveraged, increasing the volatility of each note’s market value relative to the change in the underlying linked financial element or event. Fluctuations in value of these securities are recorded as unrealized gains and losses in the accompanying Statement of Operations. The Fund records a realized gain or loss when a structured security is sold or matures.
Securities on a When-Issued or Delayed Delivery Basis. The Fund may purchase securities on a “when-issued” basis, and may purchase or sell securities on a “delayed delivery” basis. “When-issued” or “delayed delivery” refers to securities whose terms and indenture are available and for which a market exists, but which are not available for immediate delivery. Delivery and payment for securities that have been purchased by the Fund
69 OPPENHEIMER INTERNATIONAL BOND FUND
NOTESTO FINANCIAL STATEMENTS Unaudited / Continued
1. Significant Accounting Policies (Continued)
on a when-issued basis normally takes place within six months and possibly as long as two years or more after the trade date. During this period, such securities do not earn interest, are subject to market fluctuation and may increase or decrease in value prior to their delivery. The purchase of securities on a when-issued basis may increase the volatility of the Fund’s net asset value to the extent the Fund executes such transactions while remaining substantially fully invested. When the Fund engages in when-issued or delayed delivery transactions, it relies on the buyer or seller, as the case may be, to complete the transaction. Their failure to do so may cause the Fund to lose the opportunity to obtain or dispose of the security at a price and yield it considers advantageous. The Fund may also sell securities that it purchased on a when-issued basis or forward commitment prior to settlement of the original purchase.
As of March 31, 2014, the Fund had purchased securities issued on a when-issued or delayed delivery basis:
| When-Issued or Delayed Delivery Basis Transactions | ||||
Purchased securities | $ | 29,070,000 | ||
Credit Risk. The Fund invests in high-yield, non-investment-grade bonds, which may be subject to a greater degree of credit risk. Credit risk relates to the ability of the issuer to meet interest or principal payments or both as they become due. The Fund may acquire securities that have missed an interest payment, and is not obligated to dispose of securities whose issuers or underlying obligors subsequently miss an interest payment. Information concerning securities not accruing interest as of March 31, 2014 is as follows:
Cost | $ | 33,265,935 | ||
Market Value | $ | 1,233,403 | ||
Market Value as % of Net Assets | 0.01 | % |
Investment in Oppenheimer Institutional Money Market Fund. The Fund is permitted to invest daily available cash balances in an affiliated money market fund. The Fund may invest the available cash in Class E shares of Oppenheimer Institutional Money Market Fund (“IMMF”) to seek current income while preserving liquidity. IMMF is a registered open-end management investment company, regulated as a money market fund under the Investment Company Act of 1940, as amended. The Manager is the investment adviser of IMMF, and the Sub-Adviser provides investment and related advisory services to IMMF. When applicable, the Fund’s investment in IMMF is included in the Statement of Investments. Shares of IMMF are valued at their net asset value per share. As a shareholder, the Fund is subject to its proportional share of IMMF’s Class E expenses, including its management fee. The Manager will waive fees and/or reimburse Fund expenses in an amount equal to the indirect management fees incurred through the Fund’s investment in IMMF.
Foreign Currency Translation. The Fund’s accounting records are maintained in U.S. dollars. The values of securities denominated in foreign currencies and amounts related to the purchase and sale of foreign securities and foreign investment income are translated into U.S.
70 OPPENHEIMER INTERNATIONAL BOND FUND
1. Significant Accounting Policies (Continued)
dollars as of the close of the New York Stock Exchange (the “Exchange”), normally 4:00 P.M. Eastern time, on each day the Exchange is open for trading. Foreign exchange rates may be valued primarily using a reliable bank, dealer or service authorized by the Board of Trustees.
Reported net realized gains and losses from foreign currency transactions arise from sales of portfolio securities, sales and maturities of short-term securities, sales of foreign currencies, exchange rate fluctuations between the trade and settlement dates on securities transactions, and the difference between the amounts of dividends, interest, and foreign withholding taxes recorded on the Fund’s books and the U.S. dollar equivalent of the amounts actually received or paid. Net unrealized appreciation and depreciation on the translation of assets and liabilities denominated in foreign currencies arise from changes in the values of assets and liabilities, including investments in securities at fiscal period end, resulting from changes in exchange rates.
The effect of changes in foreign currency exchange rates on investments is separately identified from the fluctuations arising from changes in market values of securities held and reported with all other foreign currency gains and losses in the Fund’s Statement of Operations.
Allocation of Income, Expenses, Gains and Losses. Income, expenses (other than those attributable to a specific class), gains and losses are allocated on a daily basis to each class of shares based upon the relative proportion of net assets represented by such class. Operating expenses directly attributable to a specific class are charged against the operations of that class.
Federal Taxes. The Fund intends to comply with provisions of the Internal Revenue Code applicable to regulated investment companies and to distribute substantially all of its investment company taxable income to shareholders. Therefore, no federal income or excise tax provision is required. The Fund files income tax returns in U.S. federal and applicable state jurisdictions. The statute of limitations on the Fund’s tax return filings generally remain open for the three preceding fiscal reporting period ends.
During the fiscal year ended September 30, 2013, the Fund did not utilize any capital loss carryforward to offset capital gains realized in that fiscal year. The Fund had straddle losses of $2,935. Capital loss carryforwards with no expiration, if any, must be utilized prior to those with expiration dates. Capital losses with no expiration will be carried forward to future years if not offset by gains.
As of March 31, 2014, it is estimated that the capital loss carryforwards would be $375,436,562 which will not expire. The estimated capital loss carryforward represents the carryforward as of the end of the last fiscal year, increased or decreased by capital losses or gains realized in the first six months of the current fiscal year. During the six months ended March 31, 2014, it is estimated that the Fund will not utilize any capital loss carryforward to offset realized capital gains.
71 OPPENHEIMER INTERNATIONAL BOND FUND
NOTESTO FINANCIAL STATEMENTS Unaudited / Continued
1. Significant Accounting Policies (Continued)
Net investment income (loss) and net realized gain (loss) may differ for financial statement and tax purposes. The character of dividends and distributions made during the fiscal year from net investment income or net realized gains may differ from their ultimate characterization for federal income tax purposes. Also, due to timing of dividends and distributions, the fiscal year in which amounts are distributed may differ from the fiscal year in which the income or net realized gain was recorded by the Fund.
The aggregate cost of securities and other investments and the composition of unrealized appreciation and depreciation of securities and other investments for federal income tax purposes as of March 31, 2014 are noted in the following table. The primary difference between book and tax appreciation or depreciation of securities and other investments, if applicable, is attributable to the tax deferral of losses or tax realization of financial statement unrealized gain or loss.
Federal tax cost of securities | $ | 9,325,967,719 | ||
Federal tax cost of other investments | (556,830,194 | ) | ||
|
| |||
Total federal tax cost | $ | 8,769,137,525 | ||
|
| |||
Gross unrealized appreciation | $ | 424,525,031 | ||
Gross unrealized depreciation | (392,021,635 | ) | ||
|
| |||
Net unrealized appreciation | $ | 32,503,396 | ||
|
|
Trustees’ Compensation. The Board of Trustees has adopted a compensation deferral plan for independent trustees that enables trustees to elect to defer receipt of all or a portion of the annual compensation they are entitled to receive from the Fund. For purposes of determining the amount owed to the Trustee under the plan, deferred amounts are treated as though equal dollar amounts had been invested in shares of the Fund or in other Oppenheimer funds selected by the Trustee. The Fund purchases shares of the funds selected for deferral by the Trustee in amounts equal to his or her deemed investment, resulting in a Fund asset equal to the deferred compensation liability. Such assets are included as a component of “Other” within the asset section of the Statement of Assets and Liabilities. Deferral of trustees’ fees under the plan will not affect the net assets of the Fund, and will not materially affect the Fund’s assets, liabilities or net investment income per share. Amounts will be deferred until distributed in accordance with the compensation deferral plan.
Dividends and Distributions to Shareholders. Dividends and distributions to shareholders, which are determined in accordance with income tax regulations and may differ from U.S. generally accepted accounting principles, are recorded on the ex-dividend date. Income distributions, if any, are declared daily and paid monthly. Capital gain distributions, if any, are declared and paid annually.
72 OPPENHEIMER INTERNATIONAL BOND FUND
1. Significant Accounting Policies (Continued)
Investment Income. Dividend income is recorded on the ex-dividend date or upon ex-dividend notification in the case of certain foreign dividends where the ex-dividend date may have passed. Non-cash dividends included in dividend income, if any, are recorded at the fair market value of the securities received. Interest income is recognized on an accrual basis. Discount and premium, which are included in interest income on the Statement of Operations, are amortized or accreted daily.
Custodian Fees. “Custodian fees and expenses” in the Statement of Operations may include interest expense incurred by the Fund on any cash overdrafts of its custodian account during the period. Such cash overdrafts may result from the effects of failed trades in portfolio securities and from cash outflows resulting from unanticipated shareholder redemption activity. The Fund pays interest to its custodian on such cash overdrafts, to the extent they are not offset by positive cash balances maintained by the Fund, at a rate equal to the Federal Funds Rate plus 0.50%. The “Reduction to custodian expenses” line item, if applicable, represents earnings on cash balances maintained by the Fund during the period. Such interest expense and other custodian fees may be paid with these earnings.
Security Transactions. Security transactions are recorded on the trade date. Realized gains and losses on securities sold are determined on the basis of identified cost.
Indemnifications. The Fund’s organizational documents provide current and former trustees and officers with a limited indemnification against liabilities arising in connection with the performance of their duties to the Fund. In the normal course of business, the Fund may also enter into contracts that provide general indemnifications. The Fund’s maximum exposure under these arrangements is unknown as this would be dependent on future claims that may be made against the Fund. The risk of material loss from such claims is considered remote.
Other. The preparation of financial statements in conformity with accounting principles generally accepted in the United States of America requires management to make estimates and assumptions that affect the reported amounts of assets and liabilities and disclosure of contingent assets and liabilities at the date of the financial statements and the reported amounts of increases and decreases in net assets from operations during the reporting period. Actual results could differ from those estimates.
2. Securities Valuation
The Fund calculates the net asset value of its shares as of the close of the New York Stock Exchange (the “Exchange”), normally 4:00 P.M. Eastern time, on each day the Exchange is open for trading.
The Fund’s Board has adopted procedures for the valuation of the Fund’s securities and has delegated the day-to-day responsibility for valuation determinations under those procedures to the Manager. The Manager has established a Valuation Committee which is responsible for determining a “fair valuation” for any security for which market quotations are not “readily available.” The Valuation Committee’s fair valuation determinations are subject to review, approval and ratification by the Fund’s Board at its next regularly scheduled meeting covering the calendar quarter in which the fair valuation was determined.
73 OPPENHEIMER INTERNATIONAL BOND FUND
NOTESTO FINANCIAL STATEMENTS Unaudited / Continued
2. Securities Valuation (Continued)
Valuation Methods and Inputs
Securities are valued using unadjusted quoted market prices, when available, as supplied primarily by third party pricing services or dealers.
The following methodologies are used to determine the market value or the fair value of the types of securities described below:
Securities traded on a registered U.S. securities exchange (including exchange-traded derivatives other than futures and futures options) are valued based on the last sale price of the security reported on the principal exchange on which it is traded, prior to the time when the Fund’s assets are valued. In the absence of a sale, the security is valued at the last sale price on the prior trading day, if it is within the spread of the current day’s closing “bid” and “asked” prices, and if not, at the current day’s closing bid price. A security of a foreign issuer traded on a foreign exchange, but not listed on a registered U.S. securities exchange, is valued based on the last sale price on the principal exchange on which the security is traded, as identified by the third party pricing service used by the Manager, prior to the time when the Fund’s assets are valued. If the last sale price is unavailable, the security is valued at the most recent official closing price on the principal exchange on which it is traded. If the last sales price or official closing price for a foreign security is not available, the security is valued at the mean between the bid and asked price per the exchange or, if not available from the exchange, obtained from two dealers. If bid and asked prices are not available from either the exchange or two dealers, the security is valued by using one of the following methodologies (listed in order of priority): (1) using a bid from the exchange, (2) the mean between the bid and asked price as provided by a single dealer, or (3) a bid from a single dealer.
Shares of a registered investment company that are not traded on an exchange are valued at that investment company’s net asset value per share.
Corporate and government debt securities (of U.S. or foreign issuers) and municipal debt securities, event-linked bonds, loans, mortgage-backed securities, collateralized mortgage obligations, and asset-backed securities are valued at the mean between the “bid” and “asked” prices utilizing evaluated prices obtained from third party pricing services or broker-dealers who may use matrix pricing methods to determine the evaluated prices.
Short-term money market type debt securities with a remaining maturity of sixty days or less are valued at cost adjusted by the amortization of discount or premium to maturity (amortized cost), which approximates market value. Short-term debt securities with a remaining maturity in excess of sixty days are valued at the mean between the “bid” and “asked” prices utilizing evaluated prices obtained from third party pricing services or broker-dealers.
Structured securities, swaps, swaptions, and other over-the-counter derivatives are valued utilizing evaluated prices obtained from third party pricing services or broker-dealers.
74 OPPENHEIMER INTERNATIONAL BOND FUND
2. Securities Valuation (Continued)
Forward foreign currency exchange contracts are valued utilizing current and forward currency rates obtained from third party pricing services. When the settlement date of a contract is an interim date for which a quotation is not available, interpolated values are derived using the nearest dated forward currency rate.
Futures contracts and futures options traded on a commodities or futures exchange will be valued at the final settlement price or official closing price on the principal exchange as reported by such principal exchange at its trading session ending at, or most recently prior to, the time when the Fund’s assets are valued.
A description of the standard inputs that may generally be considered by the third party pricing vendors in determining their evaluated prices is provided below.
Security Type | Standard inputs generally considered by third-party pricing vendors | |
| Corporate debt, government debt, municipal, mortgage-backed and asset-backed securities | Reported trade data, broker-dealer price quotations, benchmark yields, issuer spreads on comparable securities, the credit quality, yield, maturity, and other appropriate factors. | |
| Loans | Information obtained from market participants regarding reported trade data and broker-dealer price quotations. | |
| Event-linked bonds | Information obtained from market participants regarding reported trade data and broker-dealer price quotations. | |
| Structured securities | Relevant market information such as the price of underlying financial instruments, stock market indices, foreign currencies, interest rate spreads, commodities, or the occurrence of other specific events. | |
| Swaps | Relevant market information, including underlying reference assets such as credit spreads, credit event probabilities, index values, individual security values, forward interest rates, variable interest rates, volatility measures, and forward currency rates. | |
If a market value or price cannot be determined for a security using the methodologies described above, or if, in the “good faith” opinion of the Manager, the market value or price obtained does not constitute a “readily available market quotation,” or a significant event has occurred that would materially affect the value of the security the security is fair valued either (i) by a standardized fair valuation methodology applicable to the security type or the significant event as previously approved by the Valuation Committee and the Fund’s Board or (ii) as determined in good faith by the Manager’s Valuation Committee. The Valuation Committee considers all relevant facts that are reasonably available, through either public information or information available to the Manager, when determining the fair value of a security. Fair value determinations by the Manager are subject to review, approval and ratification by the Fund’s Board at its next regularly scheduled meeting covering the calendar quarter in which the fair valuation was determined. Those fair valuation standardized methodologies include, but are not limited to, valuing securities at the last sale price or initially at cost and subsequently adjusting the value based on: changes in company specific fundamentals, changes in an appropriate securities index, or changes in the value of similar securities which may be further adjusted for any discounts related to security-specific resale restrictions. When possible, such methodologies use observable market inputs such as unadjusted quoted prices of similar securities, observable interest rates, currency rates and yield curves. The methodologies used for valuing securities are not necessarily an indication of the risks associated with investing in those securities nor can it be assured that the Fund can obtain the fair value assigned to a security if it were to sell the security.
75 OPPENHEIMER INTERNATIONAL BOND FUND
NOTESTO FINANCIAL STATEMENTS Unaudited / Continued
2. Securities Valuation (Continued)
To assess the continuing appropriateness of security valuations, the Manager, or its third party service provider who is subject to oversight by the Manager, regularly compares prior day prices, prices on comparable securities, and sale prices to the current day prices and challenges those prices exceeding certain tolerance levels with the third party pricing service or broker source. For those securities valued by fair valuations, whether through a standardized fair valuation methodology or a fair valuation determination, the Valuation Committee reviews and affirms the reasonableness of the valuations based on such methodologies and fair valuation determinations on a regular basis after considering all relevant information that is reasonably available.
Classifications
Each investment asset or liability of the Fund is assigned a level at measurement date based on the significance and source of the inputs to its valuation. Various data inputs are used in determining the value of each of the Fund’s investments as of the reporting period end. These data inputs are categorized in the following hierarchy under applicable financial accounting standards:
1) Level 1-unadjusted quoted prices in active markets for identical assets or liabilities (including securities actively traded on a securities exchange)
2) Level 2-inputs other than unadjusted quoted prices that are observable for the asset or liability (such as unadjusted quoted prices for similar assets and market corroborated inputs such as interest rates, prepayment speeds, credit risks, etc.)
3) Level 3-significant unobservable inputs (including the Manager’s own judgments about assumptions that market participants would use in pricing the asset or liability).
The inputs used for valuing securities are not necessarily an indication of the risks associated with investing in those securities.
The table below categorizes amounts that are included in the Fund’s Statement of Assets and Liabilities as of March 31, 2014 based on valuation input level:
| Level 1— Unadjusted Quoted Prices | Level 2— Other Significant Observable Inputs | Level 3— Significant Unobservable Inputs | Value | |||||||||||||
Assets Table |
| |||||||||||||||
Investments, at Value: |
| |||||||||||||||
Asset-Backed Securities | $ | — | $ | 37,980,085 | $ | 8,026,925 | $ | 46,007,010 | ||||||||
Mortgage-Backed Obligation | — | 17,793,240 | — | 17,793,240 | ||||||||||||
U.S. Government Obligation | — | 145,068,005 | — | 145,068,005 | ||||||||||||
Foreign Government Obligations | — | 5,616,625,746 | — | 5,616,625,746 | ||||||||||||
Corporate Bonds and Notes | — | 2,330,945,218 | 16,211,052 | 2,347,156,270 | ||||||||||||
Structured Securities | — | 28,467,188 | 6,058,251 | 34,525,439 | ||||||||||||
Short-Term Notes | — | 244,985,736 | — | 244,985,736 | ||||||||||||
Over-the-Counter Options Purchased | — | 62,243,861 | — | 62,243,861 | ||||||||||||
76 OPPENHEIMER INTERNATIONAL BOND FUND
2. Securities Valuation (Continued)
| Level 1— Unadjusted Quoted Prices | Level 2— Other Significant Observable Inputs | Level 3— Significant Unobservable Inputs | Value | |||||||||||||
Investments, at Value: Continued |
| |||||||||||||||
Over-the-Counter Credit Default Swaptions Purchased | $ | — | $ | 953,307 | $ | — | $ | 953,307 | ||||||||
Over-the-Counter Interest Rate Swaptions Purchased | — | 45,979,677 | — | 45,979,677 | ||||||||||||
Investment Company | 794,738,431 | — | — | 794,738,431 | ||||||||||||
|
|
|
|
|
|
|
| |||||||||
Total Investments, at Value | 794,738,431 | 8,531,042,063 | 30,296,228 | 9,356,076,722 | ||||||||||||
Other Financial Instruments: | ||||||||||||||||
Swaps, at value | — | 20,092,392 | — | 20,092,392 | ||||||||||||
Variation margin receivable | 388,125 | — | — | 388,125 | ||||||||||||
Variation margin receivable - centrally cleared swaps | — | 1,677,253 | — | 1,677,253 | ||||||||||||
Foreign currency exchange contracts | — | 80,482,652 | — | 80,482,652 | ||||||||||||
|
|
|
|
|
|
|
| |||||||||
Total Assets | $ | 795,126,556 | $ | 8,633,294,360 | $ | 30,296,228 | $ | 9,458,717,144 | ||||||||
|
|
|
|
|
|
|
| |||||||||
Liabilities Table | ||||||||||||||||
Other Financial Instruments: | ||||||||||||||||
Swaps, at value | $ | — | $ | (5,267,852 | ) | $ | — | $ | (5,267,852 | ) | ||||||
Options written, at value | — | (34,483,274 | ) | — | (34,483,274 | ) | ||||||||||
Variation margin payable | (187,500 | ) | — | — | (187,500 | ) | ||||||||||
Variation margin payable - centrally cleared swaps | — | (15,355,436 | ) | — | (15,355,436 | ) | ||||||||||
Foreign currency exchange contracts | — | (129,136,248 | ) | — | (129,136,248 | ) | ||||||||||
Swaptions written, at value | — | (40,604,968 | ) | — | (40,604,968 | ) | ||||||||||
|
|
|
|
|
|
|
| |||||||||
Total Liabilities | $ | (187,500 | ) | $ | (224,847,778 | ) | $ | — | $ | (225,035,278 | ) | |||||
|
|
|
|
|
|
|
| |||||||||
Currency contracts and forwards, if any, are reported at their unrealized appreciation/ depreciation at measurement date, which represents the change in the contract’s value from trade date. Futures, if any, are reported at their variation margin at measurement date, which represents the amount due to/from the Fund at that date. All additional assets and liabilities included in the above table are reported at their market value at measurement date.
The table below shows the transfers between Level 2 and Level 3. The Fund’s policy is to recognize transfers in and transfers out as of the beginning of the reporting period.
| Transfers out of Level 2* | Transfers into Level 3* | |||||||
Assets Table | ||||||||
Investments, at Value: | ||||||||
Corporate Bonds and Notes | $ | (17,879,566 | ) | $ | 17,879,566 | |||
| * | Transferred from Level 2 to Level 3 because of the lack of observable market data. |
77 OPPENHEIMER INTERNATIONAL BOND FUND
NOTESTO FINANCIAL STATEMENTS Unaudited / Continued
3. Shares of Beneficial Interest
The Fund has authorized an unlimited number of $0.001 par value shares of beneficial interest of each class. Transactions in shares of beneficial interest were as follows:
| Six Months Ended March 31, 2014 | Year Ended September 30, 2013 | |||||||||||||||
| Shares | Amount | Shares | Amount | |||||||||||||
Class A | ||||||||||||||||
Sold | 56,224,159 | $ | 342,284,571 | 169,999,853 | $ | 1,096,720,599 | ||||||||||
Dividends and/or distributions reinvested | 10,873,574 | 66,160,294 | 34,057,019 | 218,725,321 | ||||||||||||
Redeemed | (205,690,570 | ) | (1,250,999,482 | ) | (317,280,030 | ) | (2,016,371,038 | ) | ||||||||
|
|
|
|
|
|
|
| |||||||||
Net decrease | (138,592,837 | ) | $ | (842,554,617 | ) | (113,223,158 | ) | $ | (700,925,118 | ) | ||||||
|
|
|
|
|
|
|
| |||||||||
Class B | ||||||||||||||||
Sold | 188,404 | $ | 1,147,119 | 770,887 | $ | 4,999,634 | ||||||||||
Dividends and/or distributions reinvested | 208,387 | 1,262,978 | 783,095 | 5,026,246 | ||||||||||||
Redeemed | (5,251,221 | ) | (31,786,336 | ) | (10,093,565 | ) | (64,238,844 | ) | ||||||||
|
|
|
|
|
|
|
| |||||||||
Net decrease | (4,854,430 | ) | $ | (29,376,239 | ) | (8,539,583 | ) | $ | (54,212,964 | ) | ||||||
|
|
|
|
|
|
|
| |||||||||
Class C | ||||||||||||||||
Sold | 5,077,592 | $ | 30,784,400 | 26,672,457 | $ | 172,591,137 | ||||||||||
Dividends and/or distributions reinvested | 1,949,367 | 11,814,395 | 6,785,301 | 43,478,473 | ||||||||||||
Redeemed | (44,251,189 | ) | (268,374,796 | ) | (77,120,939 | ) | (486,189,197 | ) | ||||||||
|
|
|
|
|
|
|
| |||||||||
Net decrease | (37,224,230 | ) | $ | (225,776,001 | ) | (43,663,181 | ) | $ | (270,119,587 | ) | ||||||
|
|
|
|
|
|
|
| |||||||||
Class I | ||||||||||||||||
Sold | 47,837,294 | $ | 290,626,858 | 93,571,163 | $ | 605,032,423 | ||||||||||
Dividends and/or distributions reinvested | 1,527,243 | 9,280,957 | 1,287,295 | 7,890,371 | ||||||||||||
Redeemed | (44,751,952 | ) | (272,149,008 | ) | (5,755,768 | ) | (35,252,291 | ) | ||||||||
|
|
|
|
|
|
|
| |||||||||
Net increase | 4,612,585 | $ | 27,758,807 | 89,102,690 | $ | 577,670,503 | ||||||||||
|
|
|
|
|
|
|
| |||||||||
Class N | ||||||||||||||||
Sold | 3,585,874 | $ | 21,750,427 | 10,017,017 | $ | 64,394,771 | ||||||||||
Dividends and/or distributions reinvested | 550,635 | 3,340,096 | 1,676,531 | 10,735,942 | ||||||||||||
Redeemed | (7,448,251 | ) | (45,188,555 | ) | (18,368,050 | ) | (117,435,800 | ) | ||||||||
|
|
|
|
|
|
|
| |||||||||
Net decrease | (3,311,742 | ) | $ | (20,098,032 | ) | (6,674,502 | ) | $ | (42,305,087 | ) | ||||||
|
|
|
|
|
|
|
| |||||||||
Class Y | ||||||||||||||||
Sold | 114,370,401 | $ | 694,882,280 | 306,355,987 | $ | 1,956,264,328 | ||||||||||
Dividends and/or distributions reinvested | 9,154,879 | 55,701,160 | 28,172,034 | 180,799,056 | ||||||||||||
Redeemed | (203,770,605 | ) | (1,239,515,983 | ) | (411,258,163 | ) | (2,596,891,076 | ) | ||||||||
|
|
|
|
|
|
|
| |||||||||
Net decrease | (80,245,325 | ) | $ | (488,932,543 | ) | (76,730,142 | ) | $ | (459,827,692 | ) | ||||||
|
|
|
|
|
|
|
| |||||||||
78 OPPENHEIMER INTERNATIONAL BOND FUND
4. Purchases and Sales of Securities
The aggregate cost of purchases and proceeds from sales of securities, other than short-term obligations and investments in IMMF, for the six months ended March 31, 2014 were as follows:
| Purchases | Sales | |||||||
Investment securities | $ | 4,041,556,475 | $ | 5,248,768,386 | ||||
U.S. government and government agency obligations | 499,710,320 | 354,781,523 | ||||||
5. Fees and Other Transactions with Affiliates
Management Fees. Under the investment advisory agreement, the Fund pays the Manager a management fee based on the daily net assets of the Fund at an annual rate as shown in the following table:
Fee Schedule | ||||
Up to $200 million | 0.75 | % | ||
Next $200 million | 0.72 | |||
Next $200 million | 0.69 | |||
Next $200 million | 0.66 | |||
Next $200 million | 0.60 | |||
Next $4 billion | 0.50 | |||
Next $10 billion | 0.48 | |||
Over $15 billion | 0.45 | |||
Sub-Adviser Fees. The Manager has retained the Sub-Adviser to provide the day-to-day portfolio management of the Fund. Under the Sub-Advisory Agreement, the Manager pays the Sub-Adviser an annual fee in monthly installments, equal to a percentage of the investment management fee collected by the Manager from the Fund, which shall be calculated after any investment management fee waivers. The fee paid to the Sub-Adviser is paid by the Manager, not by the Fund.
Transfer Agent Fees. OFI Global (the “Transfer Agent”) serves as the transfer and shareholder servicing agent for the Fund. Fees incurred by the Fund with respect to these services are detailed in the Statement of Operations.
Sub-Transfer Agent Fees. The Transfer Agent has retained Shareholder Services, Inc., a wholly-owned subsidiary of OFI (the “Sub-Transfer Agent”), to provide the day-to-day transfer agent and shareholder servicing of the Fund. Under the Sub-Transfer Agency Agreement, the Transfer Agent pays the Sub-Transfer Agent an annual fee in monthly installments, equal to a percentage of the transfer agent fee collected by the Transfer Agent from the Fund, which shall be calculated after any applicable fee waivers. The fee paid to the Sub-Transfer Agent is paid by the Transfer Agent, not by the Fund.
Distribution and Service Plan (12b-1) Fees. Under its General Distributor’s Agreement with the Fund, OppenheimerFunds Distributor, Inc. (the “Distributor”) acts as the Fund’s principal underwriter in the continuous public offering of the Fund’s classes of shares.
79 OPPENHEIMER INTERNATIONAL BOND FUND
NOTESTO FINANCIAL STATEMENTS Unaudited / Continued
5. Fees and Other Transactions with Affiliates (Continued)
Service Plan for Class A Shares. The Fund has adopted a Service Plan (the “Plan”) for Class A shares under Rule 12b-1 of the Investment Company Act of 1940. Under the Plan, the Fund reimburses the Distributor for a portion of its costs incurred for services provided to accounts that hold Class A shares. Reimbursement is made periodically at an annual rate of up to 0.25% of the daily net assets of Class A shares of the Fund. The Distributor currently uses all of those fees to pay dealers, brokers, banks and other financial institutions periodically for providing personal service and maintenance of accounts of their customers that hold Class A shares. Any unreimbursed expenses the Distributor incurs with respect to Class A shares in any fiscal year cannot be recovered in subsequent periods. Fees incurred by the Fund under the Plan are detailed in the Statement of Operations.
Distribution and Service Plans for Class B, Class C and Class N Shares. The Fund has adopted Distribution and Service Plans (the “Plans”) for Class B, Class C and Class N shares under Rule 12b-1 of the Investment Company Act of 1940 to compensate the Distributor for its services in connection with the distribution of those shares and servicing accounts. Under the Plans, the Fund pays the Distributor an annual asset-based sales charge of 0.75% on Class B and Class C shares daily net assets and 0.25% on Class N shares daily net assets. The Distributor also receives a service fee of 0.25% per year under each plan. If either the Class B, Class C or Class N plan is terminated by the Fund or by the shareholders of a class, the Board of Trustees and its independent trustees must determine whether the Distributor shall be entitled to payment from the Fund of all or a portion of the service fee and/or asset-based sales charge in respect to shares sold prior to the effective date of such termination. Fees incurred by the Fund under the Plans are detailed in the Statement of Operations. The Distributor determines its uncompensated expenses under the Plans at calendar quarter ends. The Distributor’s aggregate uncompensated expenses under the Plans at March 31, 2014 were as follows:
Class B | $ | 3,445,394 | ||
Class C | 38,078,959 | |||
Class N | 7,617,499 |
Sales Charges. Front-end sales charges and contingent deferred sales charges (“CDSC”) do not represent expenses of the Fund. They are deducted from the proceeds of sales of Fund shares prior to investment or from redemption proceeds prior to remittance, as applicable. The sales charges retained by the Distributor from the sale of shares and the CDSC retained by the Distributor on the redemption of shares is shown in the following table for the period indicated.
80 OPPENHEIMER INTERNATIONAL BOND FUND
5. Fees and Other Transactions with Affiliates (Continued)
Six Months Ended | Class A Front-End Sales Charges Retained by Distributor | Class A Contingent Deferred Sales Charges Retained by Distributor | Class B Contingent Deferred Sales Charges Retained by Distributor | Class C Contingent Deferred Sales Charges Retained by Distributor | Class N Contingent Deferred Sales Charges Retained by Distributor | |||||||||||||||
March 31, 2014 | $ | 139,159 | $ | 32,694 | $ | 168,329 | $ | 59,460 | $ | 1,873 | ||||||||||
Waivers and Reimbursements of Expenses. The Manager has voluntarily agreed to waive fees and/or reimburse Fund expenses in an amount equal to the indirect management fees incurred through the Fund’s investment in IMMF. During the six months ended March 31, 2014, the Manager waived fees and/or reimbursed the Fund $140,260 for IMMF management fees.
The Transfer Agent has contractually agreed to limit transfer and shareholder servicing agent fees for Classes B, C, N and Y shares to 0.35% of average annual net assets per class and for Class A shares to 0.30% of average annual net assets of the class.
During the six months ended March 31, 2014, the Transfer Agent waived transfer and shareholder servicing agent fees as follows:
Class N | $ | 64,163 |
Some of these undertakings may be modified or terminated at any time; some may not be modified or terminated until after one year from the date of the current prospectus, as indicated therein.
6. Risk Exposures and the Use of Derivative Instruments
The Fund’s investment objectives not only permit the Fund to purchase investment securities, they also allow the Fund to enter into various types of derivatives contracts, including, but not limited to, futures contracts, forward currency exchange contracts, credit default swaps, interest rate swaps, total return swaps, variance swaps and purchased and written options. In doing so, the Fund will employ strategies in differing combinations to permit it to increase, decrease, or change the level or types of exposure to market risk factors. These instruments may allow the Fund to pursue its objectives more quickly and efficiently than if it were to make direct purchases or sales of securities capable of effecting a similar response to market factors. Such contracts may be entered into through a bilateral over-the-counter (“OTC”) transaction, or through a securities or futures exchange and cleared through a clearinghouse.
Market Risk Factors. In accordance with its investment objectives, the Fund may use derivatives to increase or decrease its exposure to one or more of the following market risk factors:
Commodity Risk. Commodity risk relates to the change in value of commodities or commodity indexes as they relate to increases or decreases in the commodities market. Commodities are physical assets that have tangible properties. Examples of these types of assets are crude oil, heating oil, metals, livestock, and agricultural products.
81 OPPENHEIMER INTERNATIONAL BOND FUND
NOTESTO FINANCIAL STATEMENTS Unaudited / Continued
6. Risk Exposures and the Use of Derivative Instruments (Continued)
Credit Risk. Credit risk relates to the ability of the issuer to meet interest and principal payments, or both, as they come due. In general, lower-grade, higher-yield bonds are subject to credit risk to a greater extent than lower-yield, higher-quality bonds.
Equity Risk. Equity risk relates to the change in value of equity securities as they relate to increases or decreases in the general market.
Foreign Exchange Rate Risk. Foreign exchange rate risk relates to the change in the U.S. dollar value of a security held that is denominated in a foreign currency. The U.S. dollar value of a foreign currency denominated security will decrease as the dollar appreciates against the currency, while the U.S. dollar value will increase as the dollar depreciates against the currency.
Interest Rate Risk. Interest rate risk refers to the fluctuations in value of fixed-income securities resulting from the inverse relationship between price and yield. For example, an increase in general interest rates will tend to reduce the market value of already issued fixed-income investments, and a decline in general interest rates will tend to increase their value. In addition, debt securities with longer maturities, which tend to have higher yields, are subject to potentially greater fluctuations in value from changes in interest rates than obligations with shorter maturities.
Volatility Risk. Volatility risk refers to the magnitude of the movement, but not the direction of the movement, in a financial instrument’s price over a defined time period. Large increases or decreases in a financial instrument’s price over a relative time period typically indicate greater volatility risk, while small increases or decreases in its price typically indicate lower volatility risk.
Derivatives may have little or no initial cash investment relative to their market value exposure and therefore can produce significant gains or losses in excess of their cost due to unanticipated changes in the market risk factors and the overall market. This use of embedded leverage allows the Fund to increase its market value exposure relative to its net assets and can substantially increase the volatility of the Fund’s performance. In instances where the Fund is using derivatives to decrease, or hedge, exposures to market risk factors for securities held by the Fund, there are also risks that those derivatives may not perform as expected resulting in losses for the combined or hedged positions. Some derivatives have the potential for unlimited loss, regardless of the size of the Fund’s initial investment.
Additional associated risks from investing in derivatives also exist and potentially could have significant effects on the valuation of the derivative and the Fund. Typically, the associated risks are not the risks that the Fund is attempting to increase or decrease exposure to, per its investment objectives, but are the additional risks from investing in derivatives. Examples of these associated risks are liquidity risk, which is the risk that the Fund will not be able to sell the derivative in the open market in a timely manner, and counterparty credit risk, which is the risk that the counterparty will not fulfill its obligation to the Fund.
The Fund’s actual exposures to these market risk factors and associated risks during the period are discussed in further detail, by derivative type, below.
82 OPPENHEIMER INTERNATIONAL BOND FUND
6. Risk Exposures and the Use of Derivative Instruments (Continued)
Forward Currency Exchange Contracts
The Fund may enter into forward currency exchange contracts (“forward contracts”) for the purchase or sale of a foreign currency at a negotiated rate at a future date. Such contracts are traded in the OTC inter-bank currency dealer market.
Forward contracts are reported on a schedule following the Statement of Investments. The unrealized appreciation (depreciation) is reported in the Statement of Assets and Liabilities as a receivable (or payable) and in the Statement of Operations within the change in unrealized appreciation (depreciation). At contract close, the difference between the original cost of the contract and the value at the close date is recorded as a realized gain (loss) in the Statement of Operations.
The Fund has entered into forward contracts with the obligation to purchase specified foreign currencies in the future at a currently negotiated forward rate in order to take a positive investment perspective on the related currency. These forward contracts seek to increase exposure to foreign exchange rate risk.
The Fund has entered into forward contracts with the obligation to purchase specified foreign currencies in the future at a currently negotiated forward rate in order to decrease exposure to foreign exchange rate risk associated with foreign currency denominated securities held by the Fund.
The Fund has entered into forward contracts with the obligation to sell specified foreign currencies in the future at a currently negotiated forward rate in order to take a negative investment perspective on the related currency. These forward contracts seek to increase exposure to foreign exchange rate risk.
The Fund has entered into forward contracts with the obligation to sell specified foreign currencies in the future at a currently negotiated forward rate in order to decrease exposure to foreign exchange rate risk associated with foreign currency denominated securities held by the Fund.
During the six months ended March 31, 2014, the Fund had daily average contract amounts on forward contracts to buy and sell of $6,883,769,657 and $4,685,221,530, respectively.
Additional associated risk to the Fund includes counterparty credit risk. Counterparty credit risk arises from the possibility that the counterparty to a forward contract will default and fail to perform its obligations to the Fund.
Futures Contracts
A futures contract is a commitment to buy or sell a specific amount of a commodity, financial instrument or currency at a negotiated price on a stipulated future date. The Fund may buy and sell futures contracts and may also buy or write put or call options on these futures contracts. Futures contracts and options thereon are generally entered into on a regulated futures exchange and cleared through a clearinghouse associated with the exchange.
Upon entering into a futures contract, the Fund is required to deposit either cash or securities (initial margin) in an amount equal to a certain percentage of the contract value in an account registered in the futures commission merchant’s name. Subsequent payments
83 OPPENHEIMER INTERNATIONAL BOND FUND
NOTESTO FINANCIAL STATEMENTS Unaudited / Continued
6. Risk Exposures and the Use of Derivative Instruments (Continued)
(variation margin) are paid to or from the futures commission merchant each day equal to the daily changes in the contract value. Such payments are recorded as unrealized gains and losses. Should the Fund fail to make requested variation margin payments, the futures commission merchant can gain access to the initial margin to satisfy the Fund’s payment obligations.
Futures contracts are reported on a schedule following the Statement of Investments. Securities held by a futures commission merchant to cover initial margin requirements on open futures contracts are noted in the Statement of Investments. Cash held by a futures commission merchant to cover initial margin requirements on open futures contracts and the receivable and/or payable for the daily mark to market for the variation margin are noted in the Statement of Assets and Liabilities. The net change in unrealized appreciation and depreciation is reported in the Statement of Operations. Realized gains (losses) are reported in the Statement of Operations at the closing or expiration of futures contracts.
The Fund has purchased futures contracts on various bonds and notes to increase exposure to interest rate risk.
The Fund has sold futures contracts on various bonds and notes to decrease exposure to interest rate risk.
During the six months ended March 31, 2014, the Fund had an ending monthly average market value of $33,618,746 and $917,638,026 on futures contracts purchased and sold, respectively.
Additional associated risks of entering into futures contracts (and related options) include the possibility that there may be an illiquid market where the Fund is unable to liquidate the contract or enter into an offsetting position and, if used for hedging purposes, the risk that the price of the contract will correlate imperfectly with the prices of the Fund’s securities.
Option Activity
The Fund may buy and sell put and call options, or write put and call options. When an option is written, the Fund receives a premium and becomes obligated to sell or purchase the underlying security, currency or other underlying financial instrument at a fixed price, upon exercise of the option.
Options can be traded through an exchange or through a privately negotiated arrangement with a dealer in an OTC transaction. Options traded through an exchange are generally cleared through a clearinghouse (such as The Options Clearing Corporation). The difference between the premium received or paid, and market value of the option, is recorded as unrealized appreciation or depreciation. The net change in unrealized appreciation or depreciation is reported in the Statement of Operations. When an option is exercised, the cost of the security purchased or the proceeds of the security sale are adjusted by the amount of premium received or paid. Upon the expiration or closing of the option transaction, a gain or loss is reported in the Statement of Operations.
The Fund has purchased call options on currencies to increase exposure to foreign exchange rate risk. A purchased call option becomes more valuable as the price of the underlying financial instrument appreciates relative to the strike price.
84 OPPENHEIMER INTERNATIONAL BOND FUND
6. Risk Exposures and the Use of Derivative Instruments (Continued)
The Fund has purchased put options on currencies to decrease exposure to foreign exchange rate risk. A purchased put option becomes more valuable as the price of the underlying financial instrument depreciates relative to the strike price.
The Fund has purchased call options on treasury and/or euro futures to increase exposure to interest rate risk. A purchased call option becomes more valuable as the price of the underlying financial instrument appreciates relative to the strike price.
During the six months ended March 31, 2014, the Fund had an ending monthly average market value of $26,821,627 and $74,108,658 on purchased call options and purchased put options, respectively.
Options written, if any, are reported in a schedule following the Statement of Investments and as a liability in the Statement of Assets and Liabilities. Securities held in collateral accounts to cover potential obligations with respect to outstanding written options are noted in the Statement of Investments.
The risk in writing a call option is that the market price of the security increases and if the option is exercised, the Fund must either purchase the security at a higher price for delivery or, if the Fund owns the underlying security, give up the opportunity for profit. The risk in writing a put option is that the Fund may incur a loss if the market price of the security decreases and the option is exercised. The risk in buying an option is that the Fund pays a premium whether or not the option is exercised. The Fund also has the additional risk that there may be an illiquid market where the Fund is unable to close the contract.
The Fund has written put options on currencies to increase exposure to foreign exchange rate risk. A written put option becomes more valuable as the price of the underlying financial instrument appreciates relative to the strike price.
The Fund has written call options on currencies to decrease exposure to foreign exchange rate risk. A written call option becomes more valuable as the price of the underlying financial instrument depreciates relative to the strike price.
The Fund has written call options on treasury and/or euro futures to decrease exposure to interest rate risk. A written call option becomes more valuable as the price of the underlying financial instrument depreciates relative to the strike price.
During the six months ended March 31, 2014, the Fund had an ending monthly average market value of $31,391,412 and $25,167,372 on written call options and written put options, respectively.
Additional associated risks to the Fund include counterparty credit risk and liquidity risk.
85 OPPENHEIMER INTERNATIONAL BOND FUND
NOTESTO FINANCIAL STATEMENTS Unaudited / Continued
6. Risk Exposures and the Use of Derivative Instruments (Continued)
Written option activity for the six months ended March 31, 2014 was as follows:
| Call Options | Put Options | |||||||||||||||
| Number of Contracts | Amount of Premiums | Number of Contracts | Amount of Premiums | |||||||||||||
Options outstanding as of September 30, 2013 | 193,660,800,000 | $ | 53,576,063 | 180,711,880,000 | $ | 38,605,259 | ||||||||||
Options written | 1,963,403,805,000 | 50,686,802 | 3,047,540,060,000 | 68,312,969 | ||||||||||||
Options closed or expired | (59,113,815,000 | ) | (4,621,883 | ) | (87,743,800,000 | ) | (10,101,202 | ) | ||||||||
Options exercised | (606,522,350,000 | ) | (79,117,674 | ) | (504,156,790,000 | ) | (74,717,883 | ) | ||||||||
|
|
|
|
|
|
|
| |||||||||
Options outstanding as of March 31, 2014 | 1,491,428,440,000 | $ | 20,523,308 | 2,636,351,350,000 | $ | 22,099,143 | ||||||||||
|
|
|
|
|
|
|
| |||||||||
Swap Contracts
The Fund may enter into swap contract agreements with a counterparty to exchange a series of cash flows based on either specified reference rates, the price or volatility of asset or non-asset references, or the occurrence of a credit event, over a specified period. Swaps can be executed in a bi-lateral privately negotiated arrangement with a dealer in an OTC transaction (“OTC swaps”) or executed on a regulated market. Certain swaps, regardless of the venue of their execution, are required to be cleared through a clearinghouse (“cleared swaps”). Swap contracts may include interest rate, equity, debt, index, total return, credit default, currency, and volatility swaps.
Swap contracts are reported on a schedule following the Statement of Investments. Daily changes in the value of cleared swaps are reported as variation margin receivable or payable on the Statement of Assets and Liabilities. The values of OTC swap contracts are aggregated by positive and negative values and disclosed separately on the Statement of Assets and Liabilities. The unrealized appreciation (depreciation) related to the change in the valuation of the notional amount of the swap is combined with the accrued interest due to (owed by) the Fund, if any, at termination or settlement. The net change in this amount during the period is included on the Statement of Operations. The Fund also records any periodic payments received from (paid to) the counterparty, including at termination, under such contracts as realized gain (loss) on the Statement of Operations.
Swap contract agreements are exposed to the market risk factor of the specific underlying reference rate or asset. Swap contracts are typically more attractively priced compared to similar investments in related cash securities because they isolate the risk to one market risk factor and eliminate the other market risk factors. Investments in cash securities (for instance bonds) have exposure to multiple risk factors (credit and interest rate risk). Because swaps have embedded leverage, they can expose the Fund to substantial risk in the isolated market risk factor.
Credit Default Swap Contracts. A credit default swap is a contract that enables an investor to buy or sell protection against a defined-issuer credit event, such as the issuer’s failure to make timely payments of interest or principal on a debt security, bankruptcy or restructuring. The Fund may enter into credit default swaps either by buying or selling protection on a corporate issuer, sovereign issuer, or a basket or index of issuers (the “reference asset”).
86 OPPENHEIMER INTERNATIONAL BOND FUND
6. Risk Exposures and the Use of Derivative Instruments (Continued)
The buyer of protection pays a periodic fee to the seller of protection based on the notional amount of the swap contract. The seller of protection agrees to compensate the buyer of protection for future potential losses as a result of a credit event on the reference asset. The contract effectively transfers the credit event risk of the reference asset from the buyer of protection to the seller of protection.
The ongoing value of the contract will fluctuate throughout the term of the contract based primarily on the credit risk of the reference asset. If the credit quality of the reference asset improves relative to the credit quality at contract initiation, the buyer of protection may have an unrealized loss greater than the anticipated periodic fee owed. This unrealized loss would be the result of current credit protection being cheaper than the cost of credit protection at contract initiation. If the buyer elects to terminate the contract prior to its maturity, and there has been no credit event, this unrealized loss will become realized. If the contract is held to maturity, and there has been no credit event, the realized loss will be equal to the periodic fee paid over the life of the contract.
If there is a credit event, the buyer of protection can exercise its rights under the contract and receive a payment from the seller of protection equal to the notional amount of the swap less the market value of specified debt securities issued by the reference asset. Upon exercise of the contract the difference between such value and the notional amount is recorded as realized gain (loss) and is included on the Statement of Operations.
The Fund has sold credit protection through credit default swaps to increase exposure to the credit risk of individual issuers and/or indexes of issuers that are either unavailable or considered to be less attractive in the bond market.
The Fund has purchased credit protection through credit default swaps to decrease exposure to the credit risk of individual issuers and/or indexes of issuers.
For the six months ended March 31, 2014, the Fund had ending monthly average notional amounts of $79,142,965 and $88,601,729 on credit default swaps to buy protection and credit default swaps to sell protection, respectively.
Additional associated risks to the Fund include counterparty credit risk and liquidity risk.
Interest Rate Swap Contracts. An interest rate swap is an agreement between counterparties to exchange periodic payments based on interest rates. One cash flow stream will typically be a floating rate payment based upon a specified floating interest rate while the other is typically a fixed interest rate.
The Fund has entered into interest rate swaps in which it pays a floating interest rate and receives a fixed interest rate in order to increase exposure to interest rate risk. Typically, if relative interest rates rise, payments made by the Fund under a swap agreement will be greater than the payments received by the Fund.
The Fund has entered into interest rate swaps in which it pays a fixed interest rate and receives a floating interest rate in order to decrease exposure to interest rate risk. Typically, if relative interest rates rise, payments received by the Fund under the swap agreement will be greater than the payments made by the Fund.
For the six months ended March 31, 2014, the Fund had ending monthly average notional amounts of $1,421,049,455 and $2,242,603,503 on interest rate swaps which pay a fixed rate and interest rate swaps which receive a fixed rate, respectively.
Additional associated risks to the Fund include counterparty credit risk and liquidity risk.
87 OPPENHEIMER INTERNATIONAL BOND FUND
NOTESTO FINANCIAL STATEMENTS Unaudited / Continued
6. Risk Exposures and the Use of Derivative Instruments (Continued)
Currency Swap Contracts. A currency swap contract is an agreement between counterparties to exchange different currencies at contract inception that are equivalent to a notional value. The exchange at contract inception is made at the current spot rate. The contract also includes an agreement to reverse the exchange of the same notional values of those currencies at contract termination. The re-exchange at contract termination may take place at the same exchange rate, a specified rate or the then current spot rate. Certain currency swap contracts provide for exchanging the currencies only at contract termination and can provide for only a net payment in the settlement currency, typically USD. A currency swap contract may also include the exchange of periodic payments, between the counterparties, that are based on interest rates available in the respective currencies at contract inception. Other currency swap contracts may not provide for exchanging the different currencies at all, and only for exchanging interest cash flows based on the notional value in the contract.
The Fund has entered into currency swap contracts with the obligation to pay an interest rate on the dollar notional amount and receive an interest rate on various foreign currency notional amounts in order to take a positive investment perspective on the related currencies for which the Fund receives a payment. These currency swap contracts increase exposure to foreign exchange rate risk.
The Fund has entered into currency swap contracts with the obligation to pay an interest rate on various foreign currency notional amounts and receive an interest rate on the dollar notional amount in order to take a negative investment perspective on the related currencies for which the Fund receives a payment. These currency swap contracts may decrease exposure to foreign exchange rate risk related to positions held by the Fund.
For the six months ended March 31, 2014, the Fund had ending monthly average notional amounts of $142,499,303 and $41,275,086 on currency swaps which pay a fixed rate and which receive a fixed rate, respectively.
Additional associated risks to the Fund include counterparty credit risk and liquidity risk.
Swaption Transactions
The Fund may enter into a swaption contract which grants the purchaser the right, but not the obligation, to enter into a swap transaction at preset terms detailed in the underlying agreement within a specified period of time. The purchaser pays a premium to the swaption writer who bears the risk of unfavorable changes in the preset terms on the underlying swap.
Purchased swaptions are reported as a component of investments in the Statement of Investments and the Statement of Assets and Liabilities. Written swaptions are reported on a schedule following the Statement of Investments and their value is reported as a separate asset or liability line item in the Statement of Assets and Liabilities. The net change in unrealized appreciation or depreciation on written swaptions is separately reported in the Statement of Operations. When a swaption is exercised, the cost of the swap is adjusted by the amount of premium paid or received. Upon the expiration or closing of an unexercised swaption contract, a gain or loss is reported in the Statement of Operations for the amount of the premium paid or received.
88 OPPENHEIMER INTERNATIONAL BOND FUND
6. Risk Exposures and the Use of Derivative Instruments (Continued)
The Fund generally will incur a greater risk when it writes a swaption than when it purchases a swaption. When the Fund writes a swaption it will become obligated, upon exercise of the swaption, according to the terms of the underlying agreement. Swaption contracts written by the Fund do not give rise to counterparty credit risk prior to exercise as they obligate the Fund, not its counterparty, to perform. When the Fund purchases a swaption it only risks losing the amount of the premium it paid if the swaption expires unexercised. However, when the Fund exercises a purchased swaption there is a risk that the counterparty will fail to perform or otherwise default on its obligations under the swaption contract.
The Fund has purchased swaptions which gives it the option to enter into an interest rate swap in which it pays a floating interest rate and receives a fixed interest rate in order to increase exposure to interest rate risk. A purchased swaption of this type becomes more valuable as the reference interest rate decreases relative to the preset interest rate.
The Fund has purchased swaptions which gives it the option to enter into an interest rate swap in which it pays a fixed interest rate and receives a floating interest rate in order to decrease exposure to interest rate risk. A purchased swaption of this type becomes more valuable as the reference interest rate increases relative to the preset interest rate.
The Fund has purchased swaptions which gives it the option to sell credit protection through credit default swaps in order to increase exposure to the credit risk of individual issuers and/ or indexes of issuers. A purchased swaption of this type becomes more valuable as the likelihood of a credit event on the reference asset decreases.
The Fund has purchased swaptions which gives it the option to buy credit protection through credit default swaps in order to decrease exposure to the credit risk of individual issuers and/or indexes of issuers. A purchased swaption of this type becomes more valuable as the likelihood of a credit event on the reference asset increases.
The Fund has written swaptions which gives it the obligation, if exercised by the purchaser, to enter into an interest rate swap in which it pays a floating interest rate and receives a fixed interest rate in order to increase exposure to interest rate risk. A written swaption of this type becomes more valuable as the reference interest rate decreases relative to the preset interest rate.
The Fund has written swaptions which gives it the obligation, if exercised by the purchaser, to enter into an interest rate swap in which it pays a fixed interest rate and receives a floating interest rate in order to decrease exposure to interest rate risk. A written swaption of this type becomes more valuable as the reference interest rate increases relative to the preset interest rate.
The Fund has written swaptions which give it the obligation, if exercised by the purchaser, to sell credit protection through credit default swaps in order to increase exposure to the credit risk of individual issuers and/or indexes of issuers. A written swaption of this type becomes more valuable as the likelihood of a credit event on the reference asset decreases.
The Fund has written swaptions which give it the obligation, if exercised by the purchaser, to buy credit protection through credit default swaps in order to decrease exposure to the credit risk of individual issuers and/or, indexes of issuers. A written swaption of this type becomes more valuable as the likelihood of a credit event on the reference asset increases.
89 OPPENHEIMER INTERNATIONAL BOND FUND
NOTESTO FINANCIAL STATEMENTS Unaudited / Continued
6. Risk Exposures and the Use of Derivative Instruments (Continued)
During the six months ended March 31, 2014, the Fund had an ending monthly average market value of $55,399,672 and $100,648,995 on purchased and written swaptions, respectively.
Written swaption activity for the six months ended March 31, 2014 was as follows:
| Call Swaptions | ||||||||
| Notional Amount | Amount of Premiums | |||||||
Swaptions outstanding as of September 30, 2013 | $ | 7,750,335,000 | $ | 108,644,262 | ||||
Swaptions written | 123,729,195,000 | 93,136,882 | ||||||
Swaptions closed or expired | (3,954,175,000 | ) | (12,422,828 | ) | ||||
Swaptions exercised | (16,191,485,000 | ) | (146,473,247 | ) | ||||
|
|
|
| |||||
Swaptions outstanding as of March 31, 2014 | $ | 111,333,870,000 | $ | 42,885,069 | ||||
|
|
|
| |||||
Counterparty Credit Risk. Derivative positions are subject to the risk that the counterparty will not fulfill its obligation to the Fund. The Fund intends to enter into derivative transactions with counterparties that the Manager believes to be creditworthy at the time of the transaction.
The Fund’s risk of loss from counterparty credit risk on OTC derivatives is generally limited to the aggregate unrealized gain netted against any collateral held by the Fund. For OTC options purchased, the Fund bears the risk of loss of the amount of the premiums paid plus the positive change in market values net of any collateral held by the Fund should the counterparty fail to perform under the contracts. Options written by the Fund do not typically give rise to counterparty credit risk, as options written generally obligate the Fund and not the counterparty to perform.
To reduce counterparty risk with respect to OTC transactions, the Fund has entered into master netting arrangements, established within the Fund’s International Swap and Derivatives Association, Inc. (“ISDA”) master agreements, which allow the Fund to make (or to have an entitlement to receive) a single net payment in the event of default (close-out netting) for outstanding payables and receivables with respect to certain OTC positions in swaps, options, swaptions, and forward currency exchange contracts for each individual counterparty. In addition, the Fund may require that certain counterparties post cash and/or securities in collateral accounts to cover their net payment obligations for those derivative contracts subject to ISDA master agreements. If the counterparty fails to perform under these contracts and agreements, the cash and/or securities will be made available to the Fund.
As of March 31, 2014, the Fund has required certain counterparties to post collateral of $36,238,568.
ISDA master agreements include credit related contingent features which allow counterparties to OTC derivatives to terminate derivative contracts prior to maturity in the event that, for example, the Fund’s net assets decline by a stated percentage or the Fund fails to meet the terms of its ISDA master agreements, which would cause the Fund to accelerate payment of any net liability owed to the counterparty.
90 OPPENHEIMER INTERNATIONAL BOND FUND
6. Risk Exposures and the Use of Derivative Instruments (Continued)
For financial reporting purposes, the Fund does not offset derivative assets and derivative liabilities that are subject to netting arrangements in the Statement of Assets and Liabilities. Bankruptcy or insolvency laws of a particular jurisdiction may impose restrictions on or prohibitions against the right of offset in bankruptcy, insolvency or other events.
The Fund’s risk of loss from counterparty credit risk on exchange-traded derivatives cleared through a clearinghouse and for cleared swaps is generally considered lower than as compared to OTC derivatives. However, counterparty credit risk exists with respect to initial and variation margin deposited/paid by the Fund that is held in futures commission merchant, broker and/or clearinghouse accounts for such exchange-traded derivatives and for cleared swaps.
With respect to cleared swaps, such transactions will be submitted for clearing, and if cleared, will be held in accounts at futures commission merchants or brokers that are members of clearinghouses. While brokers, futures commission merchants and clearinghouses are required to segregate customer margin from their own assets, in the event that a broker, futures commission merchant or clearinghouse becomes insolvent or goes into bankruptcy and at that time there is a shortfall in the aggregate amount of margin held by the broker, futures commission merchant or clearinghouse for all its customers, U.S. bankruptcy laws will typically allocate that shortfall on a pro-rata basis across all the broker’s, futures commission merchant’s or clearinghouse’s customers, potentially resulting in losses to the Fund.
There is the risk that a broker, futures commission merchant or clearinghouse will decline to clear a transaction on the Fund’s behalf, and the Fund may be required to pay a termination fee to the executing broker with whom the Fund initially enters into the transaction. Clearinghouses may also be permitted to terminate cleared swaps at any time. The Fund is also subject to the risk that the broker or futures commission merchant will improperly use the Fund’s assets deposited/paid as initial or variation margin to satisfy payment obligations of another customer. In the event of a default by another customer of the broker or futures commission merchant, the Fund might not receive its variation margin payments from the clearinghouse, due to the manner in which variation margin payments are aggregated for all customers of the broker/futures commission merchant.
Collateral and margin requirements differ by type of derivative. Margin requirements are established by the broker, futures commission merchant or clearinghouse for exchange-traded and cleared derivatives, including cleared swaps. Brokers, futures commission merchants and clearinghouses can ask for margin in excess of the regulatory minimum, or increase the margin amount, in certain circumstances.
Collateral terms are contract specific for OTC derivatives. For derivatives traded under an ISDA master agreement, the collateral requirements are typically calculated by netting the mark to market amount for each transaction under such agreement and comparing that amount to the value of any collateral currently pledged by the Fund or the counterparty.
For financial reporting purposes, cash collateral that has been pledged to cover obligations of the Fund, if any, is reported separately on the Statement of Assets and Liabilities as cash pledged as collateral. Non-cash collateral pledged by the Fund, if any, is noted in the Statement of Investments. Generally, the amount of collateral due from or to a party must exceed a minimum transfer amount threshold (e.g. $250,000) before a transfer has to be
91 OPPENHEIMER INTERNATIONAL BOND FUND
NOTESTO FINANCIAL STATEMENTS Unaudited / Continued
6. Risk Exposures and the Use of Derivative Instruments (Continued)
made. To the extent amounts due to the Fund from its counterparties are not fully collateralized, contractually or otherwise, the Fund bears the risk of loss from counterparty nonperformance.
The following table presents by counterparty the Fund’s OTC derivative assets net of the related collateral posted for the benefit of the Fund at March 31, 2014:
| Gross Amounts Not Offset in the Statement of Assets & Liabilities | ||||||||||||||||||||
Counterparty | Gross Amount of Assets in the Statement of Assets & Liabilities* | Financial Instruments Available for Offset | Financial Instruments Collateral Received** | Cash Collateral Received** | Net Amount | |||||||||||||||
Bank of America NA | $ | 51,660,950 | $ | (51,660,950 | ) | $ | — | $ | — | $ | — | |||||||||
Barclays Bank plc | 20,947,317 | (15,821,215 | ) | (5,126,102 | ) | — | — | |||||||||||||
BNP Paribas | 4,825,725 | (4,825,725 | ) | — | — | — | ||||||||||||||
Citibank NA | 9,226,429 | (9,226,429 | ) | — | — | — | ||||||||||||||
Credit Suisse International | 4,225,394 | (1,636,591 | ) | (2,324,223 | ) | — | 264,580 | |||||||||||||
Deutsche Bank AG | 6,735,083 | (6,735,083 | ) | — | — | — | ||||||||||||||
Goldman Sachs Bank USA | 10,946,950 | (10,946,950 | ) | — | — | — | ||||||||||||||
Goldman Sachs Group, Inc. (The) | 43,458,984 | (28,160,023 | ) | — | (11,104,873 | ) | 4,194,088 | |||||||||||||
HSBC Bank USA, NA | 603,592 | — | (323,850 | ) | — | 279,742 | ||||||||||||||
JPMorgan Chase Bank NA | 35,221,801 | (29,985,410 | ) | (4,054,149 | ) | — | 1,182,240 | |||||||||||||
Morgan Stanley | 1,675,877 | — | — | — | 1,675,877 | |||||||||||||||
Morgan Stanley Capital Services, Inc. | 2,066,028 | (2,066,028 | ) | — | — | — | ||||||||||||||
Nomura Global Financial Products, Inc. | 15,741,928 | — | (9,989,303 | ) | — | 5,752,625 | ||||||||||||||
RBS Greenwich Capital | 446,151 | (446,151 | ) | — | — | — | ||||||||||||||
Toronto Dominion Bank | 60,258 | (60,258 | ) | — | — | — | ||||||||||||||
UBS AG | 1,909,422 | — | (1,909,422 | ) | — | — | ||||||||||||||
|
|
|
|
|
|
|
|
|
| |||||||||||
Total | $ | 209,751,889 | $ | (161,570,813 | ) | $ | (23,727,049 | ) | $ | (11,104,873 | ) | $ | 13,349,154 | |||||||
|
|
|
|
|
|
|
|
|
| |||||||||||
| * | OTC derivatives are reported gross on the Statement of Assets and Liabilities. Exchange traded options and margin related to cleared swaps and futures are excluded from these reported amounts. |
| ** | Reported collateral posted for the benefit of the Fund within this table is limited to the net outstanding amount due from an individual counterparty. The collateral posted for the benefit of the Fund may exceed these amounts. |
92 OPPENHEIMER INTERNATIONAL BOND FUND
6. Risk Exposures and the Use of Derivative Instruments (Continued)
The following table presents by counterparty the Fund’s OTC derivative liabilities net of the related collateral pledged by the Fund at March 31, 2014:
| Gross Amounts Not Offset in the Statement of Assets & Liabilities | ||||||||||||||||||||
Counterparty | Gross Amount of Liabilities in the Statement of Assets & Liabilities* | Financial Instruments Available for Offset | Financial Instruments Collateral Pledged** | Cash Collateral Pledged** | Net Amount | |||||||||||||||
Bank of America NA | $ | (52,668,870 | ) | $ | 51,660,950 | $ | — | $ | — | $ | (1,007,920 | ) | ||||||||
Barclays Bank plc | (15,821,215 | ) | 15,821,215 | — | — | — | ||||||||||||||
BNP Paribas | (11,864,201 | ) | 4,825,725 | 6,152,884 | — | (885,592 | ) | |||||||||||||
Citibank NA | (12,263,661 | ) | 9,226,429 | 3,037,232 | — | — | ||||||||||||||
Credit Suisse International | (1,636,591 | ) | 1,636,591 | — | — | — | ||||||||||||||
Deutsche Bank AG | (9,441,568 | ) | 6,735,083 | 948,445 | — | (1,758,040 | ) | |||||||||||||
Goldman Sachs Bank USA | (37,126,202 | ) | 10,946,950 | — | — | (26,179,252 | ) | |||||||||||||
Goldman Sachs Group, Inc. (The) | (28,160,023 | ) | 28,160,023 | — | — | — | ||||||||||||||
HSBC Bank USA, NA | — | — | — | — | — | |||||||||||||||
JPMorgan Chase Bank NA | (29,985,410 | ) | 29,985,410 | — | — | — | ||||||||||||||
Morgan Stanley | — | — | — | — | — | |||||||||||||||
Morgan Stanley Capital Services, Inc. | (5,093,376 | ) | 2,066,028 | 1,443,677 | — | (1,583,671 | ) | |||||||||||||
Nomura Global Financial Products, Inc. | — | — | — | — | — | |||||||||||||||
RBS Greenwich Capital | (5,064,002 | ) | 446,151 | 2,627,232 | — | (1,990,619 | ) | |||||||||||||
Toronto Dominion Bank | (367,223 | ) | 60,258 | 275,129 | — | (31,836 | ) | |||||||||||||
UBS AG | — | — | — | — | — | |||||||||||||||
|
|
|
|
|
|
|
|
|
| |||||||||||
Total | $ | (209,492,342 | ) | $ | 161,570,813 | $ | 14,484,599 | $ | — | $ | (33,436,930 | ) | ||||||||
|
|
|
|
|
|
|
|
|
| |||||||||||
| * | OTC derivatives are reported gross on the Statement of Assets and Liabilities. Exchange traded options and margin related to cleared swaps and futures are excluded from these reported amounts. |
| ** | Reported collateral pledged within this table is limited to the net outstanding amount due from the Fund to an individual counterparty. The securities pledged as collateral by the Fund as reported on the Statements of Investments may exceed these amounts. |
The following table presents the valuations of derivative instruments by risk exposure as reported within the Statement of Assets and Liabilities as of March 31, 2014:
Asset Derivatives | Liability Derivatives | |||||||||||
Derivatives Not Accounted for as | Statement of Assets and Liabilities Location | Value | Statement of Assets and Liabilities Location | Value | ||||||||
Credit contracts | Swaps, at value | $ | 10,722,469 | Swaps, at value | $ | 987,625 | ||||||
Foreign exchange contracts | Swaps, at value | 5,932,764 | Swaps, at value | 154,578 | ||||||||
Interest rate contracts | Swaps, at value | 3,437,159 | Swaps, at value | 4,125,649 | ||||||||
Interest rate contracts | Variation margin receivable | 388,125 | * | Variation margin payable | 187,500 | * | ||||||
Interest rate contracts | Variation margin receivable – centrally cleared swaps | 1,677,253 | Variation margin payable – centrally cleared swaps | 15,355,436 | ||||||||
Foreign exchange contracts | Unrealized appreciation on foreign currency exchange contracts | 80,482,652 | Unrealized depreciation on foreign currency exchange contracts | 129,136,248 | ||||||||
93 OPPENHEIMER INTERNATIONAL BOND FUND
NOTESTO FINANCIAL STATEMENTS Unaudited / Continued
6. Risk Exposures and the Use of Derivative Instruments (Continued)
Asset Derivatives | Liability Derivatives | |||||||||||
Derivatives Not Accounted for as | Statement of Assets and Liabilities Location | Value | Statement of Assets and Liabilities Location | Value | ||||||||
Foreign exchange contracts | Options written, at value | $ | 30,723,349 | |||||||||
Interest rate contracts | Options written, at value | 3,759,925 | ||||||||||
Credit contracts | Swaptions written, at value | 1,613,529 | ||||||||||
Interest rate contracts | Swaptions written, at value | 38,991,439 | ||||||||||
Credit contracts | Investments, at value | $ | 953,307 | ** | ||||||||
Foreign exchange contracts | Investments, at value | 59,141,939 | ** | |||||||||
Interest rate contracts | Investments, at value | 49,081,599 | ** | |||||||||
|
|
|
| |||||||||
Total | $ | 211,817,267 | $ | 225,035,278 | ||||||||
|
|
|
| |||||||||
| * | Includes only the current day’s variation margin. Prior variation margin movements have been reflected in cash on the Statement of Assets and Liabilities upon receipt or payment. |
| ** | Amounts relate to purchased option contracts and purchased swaption contracts. |
The effective of derivative instruments on the Statement of Operations is as follows:
Amount of Realized Gain or (Loss) Recognized on Derivatives | ||||||||||||||||
Derivatives Not Accounted for as Hedging | Investment from unaffiliated companies* | Closing and expiration of swaption contracts written | Closing and expiration of option contracts written | Closing and expiration of futures contracts | ||||||||||||
Credit contracts | $ | (3,297,576 | ) | $ | 934,514 | $ | — | $ | — | |||||||
Foreign exchange contracts | (13,593,438 | ) | — | 13,084,229 | — | |||||||||||
Interest rate contracts | (62,176,684 | ) | 11,488,315 | 1,638,855 | (21,697,414 | ) | ||||||||||
|
|
|
|
|
|
|
| |||||||||
Total | $ | (79,067,698 | ) | $ | 12,422,829 | $ | 14,723,084 | $ | (21,697,414 | ) | ||||||
|
|
|
|
|
|
|
| |||||||||
94 OPPENHEIMER INTERNATIONAL BOND FUND
6. Risk Exposures and the Use of Derivative Instruments (Continued)
Amount of Realized Gain or (Loss) Recognized on Derivatives (Continued) | ||||||||||||
Derivatives Not Accounted for as Hedging Instruments | Foreign currency transactions | Swap contracts | Total | |||||||||
Credit contracts | $ | — | $ | 625,775 | $ | (1,737,287 | ) | |||||
Foreign exchange contracts | 21,401,508 | — | 20,892,299 | |||||||||
Interest rate contracts | — | (56,279,606 | ) | (127,026,534 | ) | |||||||
|
|
|
|
|
| |||||||
Total | $ | 21,401,508 | $ | (55,653,831 | ) | $ | (107,871,522 | ) | ||||
|
|
|
|
|
| |||||||
| * | Includes purchased option contracts, purchased swaption contracts, written option contracts exercised and written swaption contracts exercised, if any. |
Amount of Change in Unrealized Gain or (Loss) Recognized on Derivatives | ||||||||||||||||||||
Derivatives Not Accounted for as Hedging Instruments | Investments* | Swaption contracts written | Option contracts written | Futures contracts | Translation of assets and liabilities denominated in foreign currencies | |||||||||||||||
Credit contracts | $ | 824,134 | $ | 334,117 | $ | — | $ | — | $ | — | ||||||||||
Foreign exchange contracts | 19,680,781 | — | (3,462,106 | ) | — | (76,319,366 | ) | |||||||||||||
Interest rate contracts | (3,978,082 | ) | 48,725,852 | (3,616,831 | ) | 21,487,660 | — | |||||||||||||
|
|
|
|
|
|
|
|
|
| |||||||||||
Total | $ | 16,526,833 | $ | 49,059,969 | $ | (7,078,937 | ) | $ | 21,487,660 | $ | (76,319,366 | ) | ||||||||
|
|
|
|
|
|
|
|
|
| |||||||||||
Amount of Change in Unrealized Gain or (Loss) Recognized on Derivatives (Continued) | ||||||||
Derivatives Not Accounted for as Hedging Instruments | Swap contracts | Total | ||||||
Credit contracts | $ | (249,050 | ) | $ | 909,201 | |||
Foreign exchange contracts | 5,778,186 | (54,322,505 | ) | |||||
Interest rate contracts | 33,937,467 | 96,556,066 | ||||||
|
|
|
| |||||
Total | $ | 39,466,603 | $ | 43,142,762 | ||||
|
|
|
| |||||
| * | Includes purchased option contracts and purchased swaption contracts, if any. |
7. Restricted Securities
As of March 31, 2014, investments in securities included issues that are restricted. A restricted security may have a contractual restriction on its resale and is valued under methods approved by the Board of Trustees as reflecting fair value. Securities that are restricted are marked with an applicable footnote on the Statement of Investments. Restricted securities are reported on a schedule following the Statement of Investments.
95 OPPENHEIMER INTERNATIONAL BOND FUND
NOTESTO FINANCIAL STATEMENTS Unaudited / Continued
8. Pending Litigation
Since 2009, seven class action lawsuits have been pending in the U.S. District Court for the District of Colorado against OppenheimerFunds, Inc. (“OFI”), OppenheimerFunds Distributor, Inc., the Fund’s principal underwriter and distributor (the “Distributor”), and certain funds (but not including the Fund) advised by OFI Global Asset Management, Inc. and distributed by the Distributor (the “Defendant Funds”). The lawsuits also name as defendants certain officers and current and former trustees of the respective Defendant Funds. The lawsuits raise claims under federal securities law and allege, among other things, that the disclosure documents of the respective Defendant Funds contained misrepresentations and omissions and that the respective Defendant Funds’ investment policies were not followed. The plaintiffs in these actions seek unspecified damages, equitable relief and awards of attorneys’ fees and litigation expenses. The Defendant Funds’ Boards of Trustees have also engaged counsel to represent the Funds and the present and former Independent Trustees named in those suits. On March 5, 2014, the parties in six of these lawsuits executed stipulations and agreements of settlement resolving those actions. The settlements are subject to a variety of contingencies, including approval by the court. The settlements do not resolve a seventh outstanding lawsuit relating to Oppenheimer Rochester California Municipal Fund.
Other class action and individual lawsuits have been filed since 2008 in various state and federal courts against OFI and certain of its affiliates by investors seeking to recover investments they allegedly lost as a result of the “Ponzi” scheme run by Bernard L. Madoff and his firm, Bernard L. Madoff Investment Securities, LLC (“BLMIS”). Plaintiffs in these suits allege that they suffered losses as a result of their investments in several funds managed by an affiliate of OFI and assert a variety of claims, including breach of fiduciary duty, fraud, negligent misrepresentation, unjust enrichment, and violation of federal and state securities laws and regulations, among others. They seek unspecified damages, equitable relief and awards of attorneys’ fees and litigation expenses. Neither the Distributor, nor any of the Oppenheimer mutual funds, their independent trustees or directors are named as defendants in these lawsuits. None of the Oppenheimer mutual funds invested in any funds or accounts managed by Madoff or BLMIS. On February 28, 2011, a stipulation of partial settlement of three groups of consolidated putative class action lawsuits relating to these matters was filed in the U.S. District Court for the Southern District of New York. On August 19, 2011, the court entered an order and final judgment approving the settlement as fair, reasonable and adequate. In September 2011, certain parties filed notices of appeal from the court’s order approving the settlement. The settlement does not resolve other outstanding lawsuits against OFI and its affiliates relating to BLMIS.
On April 16, 2010, a lawsuit was filed in New York state court against (i) OFI, (ii) an affiliate of OFI and (iii) AAArdvark IV Funding Limited (“AAArdvark IV”), an entity advised by OFI’s affiliate, in connection with investments made by the plaintiffs in AAArdvark IV. Plaintiffs alleged breach of contract and common law fraud claims against the defendants and sought compensatory damages, costs and disbursements, including attorney fees. On April 11, 2013, the court granted defendants’ motion for summary judgment, dismissing plaintiffs’ fraud claim with prejudice and dismissing their contract claim without prejudice, and granted plaintiffs leave to replead their contract claim to assert a cause of action for specific performance within 30 days. On May 9, 2013, plaintiffs filed a notice of appeal from the
96 OPPENHEIMER INTERNATIONAL BOND FUND
8. Pending Litigation (Continued)
court’s dismissal order. On January 7, 2014, the appellate court affirmed the trial court’s dismissal order. On March 28, 2014, the parties filed a stipulation of discontinuance dismissing the lawsuit with prejudice. On July 15, 2011, a lawsuit was filed in New York state court against OFI, an affiliate of OFI and AAArdvark Funding Limited (“AAArdvark I”), an entity advised by OFI’s affiliate, in connection with investments made by the plaintiffs in AAArdvark I. The complaint alleged breach of contract and common law fraud claims against the defendants and sought compensatory damages, costs and disbursements, including attorney fees. On March 28, 2014, the parties filed a stipulation of discontinuance dismissing the lawsuit with prejudice. On November 9, 2011, a lawsuit was filed in New York state court against OFI, an affiliate of OFI and AAArdvark XS Funding Limited (“AAArdvark XS”), an entity advised by OFI’s affiliate, in connection with investments made by the plaintiffs in AAArdvark XS. The complaint alleged breach of contract against the defendants and sought compensatory damages, costs and disbursements, including attorney fees. On November 8, 2013, the parties filed a stipulation of discontinuance dismissing the lawsuit with prejudice.
OFI believes the lawsuits and appeals described above are without legal merit and, with the exception of actions it has settled, is defending against them vigorously. While it is premature to render any opinion as to the outcome in these lawsuits, or whether any costs that the Defendant Funds may bear in defending the suits might not be reimbursed by insurance, OFI believes that these suits should not impair the ability of OFI or the Distributor to perform their respective duties to the Fund, and that the outcome of all of the suits together should not have any material effect on the operations of any of the Oppenheimer mutual funds.
97 OPPENHEIMER INTERNATIONAL BOND FUND
PORTFOLIO PROXY VOTING POLICIESAND PROCEDURES; UPDATES TO STATEMENTS OF INVESTMENTS Unaudited
The Fund has adopted Portfolio Proxy Voting Policies and Procedures under which the Fund votes proxies relating to securities (“portfolio proxies”) held by the Fund. A description of the Fund’s Portfolio Proxy Voting Policies and Procedures is available (i) without charge, upon request, by calling the Fund toll-free at 1.800.CALL OPP (225.5677), (ii) on the Fund’s website at oppenheimerfunds.com, and (iii) on the SEC’s website at www.sec.gov. In addition, the Fund is required to file Form N-PX, with its complete proxy voting record for the 12 months ended June 30th, no later than August 31st of each year. The Fund’s voting record is available (i) without charge, upon request, by calling the Fund toll-free at 1.800.CALL OPP (225.5677), and (ii) in the Form N-PX filing on the SEC’s website at www.sec.gov.
The Fund files its complete schedule of portfolio holdings with the SEC for the first quarter and the third quarter of each fiscal year on Form N-Q. The Fund’s Form N-Q filings are available on the SEC’s website at www.sec.gov. Those forms may be reviewed and copied at the SEC’s Public Reference Room in Washington, D.C. Information on the operation of the Public Reference Room may be obtained by calling 1-800-SEC-0330.
Householding—Delivery of Shareholder Documents
This is to inform you about OppenheimerFunds’ “householding” policy. If more than one member of your household maintains an account in a particular fund, OppenheimerFunds will mail only one copy of the fund’s prospectus (or, if available, the fund’s summary prospectus), annual and semiannual report and privacy policy. The consolidation of these mailings, called householding, benefits your fund through reduced mailing expense, and benefits you by reducing the volume of mail you receive from OppenheimerFunds. Householding does not affect the delivery of your account statements.
Please note that we will continue to household these mailings for as long as you remain an OppenheimerFunds shareholder, unless you request otherwise. If you prefer to receive multiple copies of these materials, please call us at 1.800.CALL-OPP (225-5677). You may also notify us in writing or via email. We will begin sending you individual copies of the prospectus (or, if available, the summary prospectus), reports and privacy policy within 30 days of receiving your request to stop householding.
98 OPPENHEIMER INTERNATIONAL BOND FUND
OPPENHEIMER INTERNATIONAL BOND FUND
© 2014 OppenheimerFunds, Inc. All rights reserved.
99 OPPENHEIMER INTERNATIONAL BOND FUND
As an Oppenheimer fund shareholder, you are entitled to know how we protect your personal information and how we limit its disclosure.
Information Sources
We obtain nonpublic personal information about our shareholders from the following sources:
| • | Applications or other forms |
| • | When you create a user ID and password for online account access |
| • | When you enroll in eDocs Direct, our electronic document delivery service |
| • | Your transactions with us, our affiliates or others |
| • | A software program on our website, often referred to as a “cookie,” which indicates which parts of our site you’ve visited |
| • | When you set up challenge questions to reset your password online |
If you visit oppenheimerfunds.com and do not log on to the secure account information areas, we do not obtain any personal information about you. When you do log on to a secure area, we do obtain your user ID and password to identify you. We also use this information to provide you with products and services you have requested, to inform you about products and services that you may be interested in and assist you in other ways.
We do not collect personal information through our website unless you willingly provide it to us, either directly by email or in those areas of the website that request information. In order to update your personal information (including your mailing address, email address and phone number) you must first log on and visit your user profile.
If you have set your browser to warn you before accepting cookies, you will receive the warning message with each cookie. You can refuse cookies by turning them off in your browser. However, doing so may limit your access to certain sections of our website.
We use cookies to help us improve and manage our website. For example, cookies help us recognize new versus repeat visitors to the site, track the pages visited, and enable some special features on the website. This data helps us provide a better service for our website visitors.
Protection of Information
We do not disclose any non-public personal information (such as names on a customer list) about current or former customers to anyone, except as permitted by law.
Disclosure of Information
We send your financial advisor (as designated by you) copies of confirmations, account statements and other documents reporting activity in your fund accounts. We may also use details about you and your investments to help us, our financial service affiliates, or firms that jointly market their financial products and services with ours, to better serve your investment needs or suggest financial services or educational material that may be of interest to you. If this requires us to provide you with an opportunity to “opt in” or “opt out” of such information sharing with a firm not affiliated with us, you will receive notification on how to do so, before any such sharing takes place.
Right of Refusal
We will not disclose your personal information to unaffiliated third parties (except as permitted by law), unless we first offer you a reasonable opportunity to refuse or “opt out” of such disclosure.
100 OPPENHEIMER INTERNATIONAL BOND FUND
Internet Security and Encryption
In general, the email services provided by our website are encrypted and provide a secure and private means of communication with us. To protect your own privacy, confidential and/or personal information should only be communicated via email when you are advised that you are using a secure website.
As a security measure, we do not include personal or account information in non-secure emails, and we advise you not to send such information to us in non-secure emails. Instead, you may take advantage of the secure features of our website to encrypt your email correspondence. To do this, you will need to use a browser that supports Secure Sockets Layer (SSL) protocol.
We do not guarantee or warrant that any part of our website, including files available for download, are free of viruses or other harmful code. It is your responsibility to take appropriate precautions, such as use of an anti-virus software package, to protect your computer hardware and software.
| • | All transactions, including redemptions, exchanges and purchases, are secured by SSL and 128-bit encryption. SSL is used to establish a secure connection between your PC and OppenheimerFunds’ server. It transmits information in an encrypted and scrambled format. |
| • | Encryption is achieved through an electronic scrambling technology that uses a “key” to code and then decode the data. Encryption acts like the cable converter box you may have on your television set. It scrambles data with a secret code so that no one can make sense of it while it is being transmitted. When the data reaches its destination, the same software unscrambles the data. |
| • | You can exit the secure area by either closing your browser, or for added security, you can use the Log Out button before you close your browser. |
Other Security Measures
We maintain physical, electronic and procedural safeguards to protect your personal account information. Our employees and agents have access to that information only so that they may offer you products or provide services, for example, when responding to your account questions.
How You Can Help
You can also do your part to keep your account information private and to prevent unauthorized transactions. If you obtain a user ID and password for your account, do not allow it to be used by anyone else. Also, take special precautions when accessing your account on a computer used by others.
Who We Are
This joint notice describes the privacy policies of the Oppenheimer funds, OppenheimerFunds, Inc., and each of its investment adviser subsidiaries, OppenheimerFunds Distributor, Inc. and OFI Global Trust Co. It applies to all Oppenheimer fund accounts you presently have, or may open in the future, using your Social Security number—whether or not you remain a shareholder of our funds. This notice was last updated November 2013. In the event it is updated or changed, we will post an updated notice on our website at oppenheimerfunds.com. If you have any questions about these privacy policies, write to us at P.O. Box 5270, Denver, CO 80217-5270, email us by clicking on the Contact Us section of our website at oppenheimerfunds.com or call us at 1.800.CALL OPP (225.5677).
101 OPPENHEIMER INTERNATIONAL BOND FUND
THIS PAGE INTENTIONALLY LEFT BLANK.
102 OPPENHEIMER INTERNATIONAL BOND FUND
THIS PAGE INTENTIONALLY LEFT BLANK.
103 OPPENHEIMER INTERNATIONAL BOND FUND

Item 2. Code of Ethics.
Not applicable to semiannual reports.
Item 3. Audit Committee Financial Expert.
Not applicable to semiannual reports.
Item 4. Principal Accountant Fees and Services.
Not applicable to semiannual reports.
Item 5. Audit Committee of Listed Registrants
Not applicable.
Item 6. Schedule of Investments.
a) Not applicable. The complete schedule of investments is included in Item 1 of this Form N-CSR.
b) Not applicable.
Item 7. Disclosure of Proxy Voting Policies and Procedures for Closed-End Management Investment Companies.
Not applicable.
Item 8. Portfolio Managers of Closed-End Management Investment Companies.
Not applicable.
Item 9. Purchases of Equity Securities by Closed-End Management Investment Company and Affiliated Purchasers.
Not applicable.
Item 10. Submission of Matters to a Vote of Security Holders.
The Fund’s Governance Committee Provisions with Respect to Nominations of Directors/Trustees to the Respective Boards
None
Item 11. Controls and Procedures.
Based on their evaluation of the registrant’s disclosure controls and procedures (as defined in rule 30a-3(c) under the Investment Company Act of 1940 (17 CFR 270.30a-3(c)) as of 3/31/2014, the registrant’s principal executive officer and principal financial officer found the registrant’s disclosure controls and procedures to provide reasonable assurances that information required to be disclosed by the registrant in the reports that it files under the Securities Exchange Act of 1934 (a) is accumulated and communicated to registrant’s management, including its principal executive officer and principal financial officer, to allow timely decisions regarding required disclosure, and (b) is recorded, processed, summarized and reported, within the time periods specified in the rules and forms adopted by the U.S. Securities and Exchange Commission.
There have been no changes in the registrant’s internal controls over financial reporting that occurred during the registrant’s second fiscal quarter of the period covered by this report that have materially affected, or are reasonably likely to materially affect, the registrant’s internal control over financial reporting.
Item 12. Exhibits.
| (a) | (1) Not applicable to semiannual reports. |
| (2) Exhibits attached hereto. |
| (3) Not applicable. |
| (b) | Exhibit attached hereto. |
SIGNATURES
Pursuant to the requirements of the Securities Exchange Act of 1934 and the Investment Company Act of 1940, the registrant has duly caused this report to be signed on its behalf by the undersigned, thereunto duly authorized.
Oppenheimer International Bond Fund
| By: | /s/ William F. Glavin, Jr. | |
| William F. Glavin, Jr. | ||
| Principal Executive Officer | ||
| Date: | 5/13/2014 | |
Pursuant to the requirements of the Securities Exchange Act of 1934 and the Investment Company Act of 1940, this report has been signed below by the following persons on behalf of the registrant and in the capacities and on the dates indicated.
| By: | /s/ William F. Glavin, Jr. | |
| William F. Glavin, Jr. | ||
| Principal Executive Officer | ||
| Date: | 5/13/2014 | |
| By: | /s/ Brian W. Wixted | |
| Brian W. Wixted | ||
| Principal Financial Officer | ||
| Date: | 5/13/2014 | |