UNITED STATES
SECURITIES AND EXCHANGE COMMISSION
WASHINGTON, D.C. 20549
FORM N-CSR
CERTIFIED SHAREHOLDER REPORT OF REGISTERED
MANAGEMENT INVESTMENT COMPANIES
Investment Company Act file number 811-07255
Oppenheimer International Bond Fund
(Exact name of registrant as specified in charter)
6803 South Tucson Way, Centennial, Colorado 80112-3924
(Address of principal executive offices) (Zip code)
Cynthia Lo Bessette
OFI Global Asset Management, Inc.
225 Liberty Street, New York, New York 10281-1008
(Name and address of agent for service)
Registrant’s telephone number, including area code: (303) 768-3200
Date of fiscal year end: September 30
Date of reporting period: 9/30/2018
Item 1. Reports to Stockholders.
An Important Update
On October 18, 2018, Massachusetts Mutual Life Insurance Company, an indirect corporate parent of OppenheimerFunds, Inc. and its subsidiaries OFI Global Asset Management, Inc., OFI SteelPath, Inc. and OFI Advisors, LLC, announced that it has entered into an agreement whereby Invesco Ltd., a global investment management company, will acquire OppenheimerFunds, Inc. As of the date of this report, the transaction is expected to close in the second quarter of 2019, pending necessary regulatory and other third-party approvals. This is subject to change.
Table of Contents
Class A Shares
AVERAGE ANNUAL TOTAL RETURNS AT 9/30/18
| | | | | | | | | | | | | | |
| | | 1-Year | | | 5-Year | | | 10-Year | | | |
| Class A Shares of the Fund without Sales Charge | | | -4.20 | % | | | 1.61 | % | | | 3.62 | % | | |
| Class A Shares of the Fund with Sales Charge | | | -8.75 | | | | 0.62 | | | | 3.12 | | | |
| FTSE Non-U.S. Dollar World Government Bond Index | | | -1.57 | | | | -0.23 | | | | 1.99 | | | |
| JP Morgan Government Bond Index-Emerging Markets Global Diversified | | | -7.40 | | | | -1.68 | | | | 2.70 | | | |
| JP Morgan Emerging Markets Bond Index Global Diversified | | | -1.92 | | | | 5.38 | | | | 7.54 | | | |
| Reference Index | | | -3.36 | | | | 0.53 | | | | 3.23 | | | |
Performance data quoted represents past performance, which does not guarantee future results. The investment return and principal value of an investment in the Fund will fluctuate so that an investor’s shares, when redeemed, may be worth more or less than their original cost. Fund returns include changes in share price, reinvested distributions, and a 4.75% maximum applicable sales charge except where “without sales charge” is indicated. Current performance may be lower or higher than the performance quoted. Returns do not consider capital gains or income taxes on an individual’s investment. Returns for periods of less than one year are cumulative and not annualized. For performance data current to the most recent month-end, visit oppenheimerfunds.com or call 1.800.CALL OPP (225.5677). See Fund prospectuses and summary prospectuses for more information on share classes and sales charges.
|
| 3 OPPENHEIMER INTERNATIONAL BOND FUND |
Fund Performance Discussion
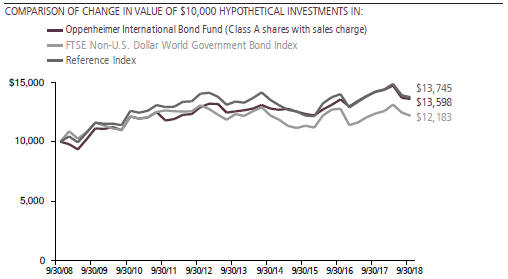
The Fund’s Class A shares (without sales charge) returned -4.20% during the reporting period, underperforming the Reference Index (“the Index”), a customized weighted index currently comprised of 50% of the FTSE Non-U.S. Dollar World Government Bond Index, 30% of the JP Morgan Government Bond Index – Emerging Markets Global Diversified, and 20% of the JP Morgan Emerging Markets Bond Index Global Diversified, which returned -3.36%.
MARKET OVERVIEW
After rallying to close 2017, 2018 has been volatile and eventful through September 30, 2018. Central banks were in action led by the Federal Reserve (Fed), which hiked the Fed Funds target rate by 25 basis points (bps) three times in 2018 – in March, June, and September – ending the period in a range of 2.00% - 2.25%. The Fed also eliminated its description of monetary policy as “accommodative” and increased the long-run dot plot. After announcing the end
of quantitative easing (QE) over the second quarter of 2018, the European Central Bank’s (ECB) decision makers’ rhetoric turned mildly hawkish. ECB President Draghi expressed confidence in the Eurozone outlook and highlighted a “relatively vigorous pick-up” in underlying inflation. Italy continued to create negative headlines as the government drafted a budget plan that was not in line with Eurozone fiscal rules. Global trade tensions remain escalated, with the U.S. imposing
|
| 4 OPPENHEIMER INTERNATIONAL BOND FUND |
tariffs on $200 billion of Chinese imports, with the possibility of additional tariffs if negotiations stall. On a positive note, the pending United States-Mexico-Canada Agreement has been agreed upon to replace NAFTA.
Global economic data continued to soften late in the reporting period, but current projections still point to global growth remaining around its historical average for 2018 and 2019. Growth leadership in the developed world changed hands, with the U.S. growth momentum increasing due to fiscal stimulus, while Eurozone growth slowed down a bit. Despite some moderation, we believe that growth in developed markets is above long-term potential, creating jobs, and continuing to reduce the slack in labor and product markets.
Global headwinds are catching up with Asian growth. In the second quarter of 2018, as we expected, Chinese growth started slowing down as a result of earlier tight policies to reduce financial leverage. With the trade dispute taking a turn for the worse, we expect this slowdown to continue and some of the pain to be shared with the rest of Asia’s manufacturing economies through lower exports, exchange rates, and lower profit margins. This impact may take time to show up in the real economy depending on the reach and impact of tariffs on global supply chains. Many countries in the supply chain stand to lose from lower trade, while some are likely to gain from potential relocation of production and from their exports to Chinese
domestic consumers. We think China will mitigate most of the growth impact to its domestic economy by a combination of looser fiscal policy and allowing more adjustment in the foreign exchange rate. However, we believe that the indirect impact through sentiment and investment is likely to spell out further slowdown in Asia, although still resilient capital expenditure demand from developed markets will provide some support to the region. Nonetheless, we see Asian emerging market growth stabilizing by the second half of 2019 due to policy support from China. There are other headwinds to the region besides trade; most notably higher oil prices, especially for current account deficit countries such as India and Indonesia. Hence, we remain cautious and will consider the potential risks especially if trade tensions escalate.
When we look at Latin America, the new outlook with downward growth revisions was driven by the larger economies where domestic and external headwinds are larger, especially in Argentina. The other economies in the region continue to follow cyclical momentum, back toward potential growth. We see the region now growing 1.5% this year, down from 1.7% in 2017 and also below the 2.4% potential. Barring bad political outcomes, the lower current account deficits and historically low inflation are supportive of demand. These are external and domestic factors that, in our view, should help Latin economies in this period of divergent global growth and unstable markets.
|
| 5 OPPENHEIMER INTERNATIONAL BOND FUND |
Argentina was one of the “Fragile Two” economies along with Turkey suffering unsustainable market stress this reporting period. In the absence of tighter fiscal and monetary policies, foreign lending stopped, and Argentina’s currency suffered a mini-crisis, as markets made the adjustment. In turn, the response to the peso plunge was a revised International Monetary Fund (IMF) program. We believe that a more demanding program will inflict strong headwinds in front of economic activity, bringing the economy deeper into recession, and calling into question the resilience of its social fabric and its policy environment. Looking forward, we see both the IMF and the Macri administration fully committed to the success of the program.
Eurozone data weakness seems to have stabilized in the second half of 2018. The underlying forces of growth in the Eurozone, such as job creation and income growth, revival of bank lending, and high levels of confidence, are intact and growth should remain in the 1.5% – 2% range. Japan’s growth rebounded in the second quarter of 2018 due to strong investment expenditures. Growth expectations remain upbeat in several other countries, including Canada, Australia, and Sweden.
The U.S. economy continues to show strong growth momentum. 2018 gross domestic product (GDP) growth is expected to be around 3%, significantly exceeding its 2% trend growth of this expansion. Private consumption, the driving force of the
economy in recent years, is growing at a stable rate. Strong household finances, ongoing job creation, and high levels of consumer confidence point to stable growth in consumption with upside risks to the growth rate. Additionally, fixed business investment gained momentum in the second quarter, broadening across sectors. Forward looking indicators suggest a healthy dose of growth for the business investment outlook. With increasingly less slack in the economy, strong profits, and the corporate tax cuts, we expect investment to support growth and productivity improvements.
The Fed is on track to deliver one more hike this year, as the economy is near the Fed’s dual mandate of full employment and price stability. On the inflation front, the underlying inflation is around the Fed’s 2% target. The unemployment rate is at historical lows; however, the rising labor participation rate and stable wage growth suggest that there may still be some slack in the labor market. The Federal Open Market Committee under Jerome Powell’s leadership signaled that the Fed will remain cautious and tighten policy gradually, giving comfort to the markets. So far, the Fed’s hiking cycle has been orderly.
The U.S. dollar (USD) had mixed returns during the one-year period ending September 30 with developed market and emerging market currencies rising or falling based on specific market news. The Mexican peso (5.6%) performed well as NAFTA’s replacement assuaged concerns and election concerns declined. The South
|
| 6 OPPENHEIMER INTERNATIONAL BOND FUND |
African rand (2.8%) and the Polish zloty (0.66%) performed well due to South Africa’s decreased political concerns and Poland’s integration with the EU. The largest declines vs. USD came from the Turkish lira (-31.1%) which suffered to due lack of credible monetary policy and the Brazilian real (-17.1%) which declined due to concerns regarding the upcoming presidential election and a truckers’ strike that impacted trade.
Government bond yields rose across many markets during the one-year reporting period. U.S. Treasury 10-year rates trended higher during the period and ended at 3.06%. To close the period, German 10-year yields ended at 0.47%, Japanese 10-year yields closed at 0.12% while Indian 10-year yields ended at 8.0%. Brazilian 10-year yields ended the period at 11.8%.
FUND REVIEW
The Fund invests in three major risk categories, or levers – interest rates (typically government bonds), currencies, and credit (corporate bonds and other fixed-income instruments containing credit risk). During the reporting period, the Fund’s underperformance versus the Index was largely the result of its currency exposure. Interest rates detracted from performance to a lesser degree, while credit outperformed the Index.
Currencies detracted most from performance, due mainly to out of benchmark position in the Argentine peso. Other detractors from
performance included our underweight position in the South African rand and our underweight position in the Japanese yen. A positive performer was our underweight exposure to the euro.
In interest rates, the primary reason for the Fund’s underperformance included overweight positions in Mexico and India. Positive contributors included an overweight position in the Eurozone and underweight to Turkey.
In credit, notable contributors to performance included our exposure to European financial subordinated debt. Detractors included the off-benchmark exposures to Argentina and India along with our underweight to Mexican peso.
STRATEGY & OUTLOOK
Looking forward, we believe that global growth has peaked, initially led by the current weakness in emerging markets. Over the next nine months we expect that developed market growth will slow down as emerging market growth bottoms somewhere in the second quarter of 2019. In our view, U.S. growth will slow down from its current rapid pace; however, we believe it will remain well above potential for the next two to three quarters with risks that inflation surprises modestly to the upside. We also believe that European growth will remain in the Goldilocks range to 1.5% - 2%. Within emerging markets, we believe dispersion in returns will remain high. We believe that improving domestic fundamentals in some countries and possible
|
| 7 OPPENHEIMER INTERNATIONAL BOND FUND |
fiscal stimulus in China will offset the effect of tariffs, and therefore expect the current slowdown in emerging market countries as an aggregate to abate by the second quarter of 2019. With higher oil prices a risk, those countries with larger import bills and current account deficits such as India and Indonesia could face headwinds, although India is currently growing more strongly than expected.
From an asset valuation perspective, it leaves emerging market assets at historically even cheaper levels versus developed market assets. Currently, emerging market local bonds offer real yields that are at or close to 15-year highs when compared to developed market real yields. In those countries where the central banks have raised rates, we see value in short-term interest rates. In the countries where the central banks have not fully tightened, we see value in long-term bonds, particularly if the yield curves are very steep.
Similarly, emerging market currency levels are back to levels last seen in 2015 near the U.S. dollar high. In credit, we find European financial subordinated debt offers value, as do both emerging market hard currency sovereign debt and corporate debt. On the expensive side of the spectrum are core European rates and U.S. high-yield bonds. We are maintaining our overweight allocations to emerging market debt and European corporate credit. Our currency exposure is slightly tilted more toward developed market currencies, but we still maintain significant exposure to emerging market currencies.
We maintain our view that the U.S. dollar will decline over the medium term. The U.S. dollar’s decline that started towards the ends of 2015 was interrupted by the large fiscal stimulus that impacted the U.S. economy this year. As the effects of this stimulus fade, we expect the dollar to resume its downtrend for the next three to five years.
| | |
 | |  |
| | Christopher Kelly, CFA |
| | Portfolio Manager |
|
| 8 OPPENHEIMER INTERNATIONAL BOND FUND |
Top Holdings and Allocations
TOP TEN GEOGRAPHICAL HOLDINGS
| | | | |
| United States | | | 11.4 | % |
| Mexico | | | 9.8 | |
| United Kingdom | | | 8.2 | |
| India | | | 6.7 | |
| Brazil | | | 5.2 | |
| South Africa | | | 4.9 | |
| Canada | | | 4.3 | |
| Spain | | | 4.1 | |
| Portugal | | | 3.6 | |
| Greece | | | 3.2 | |
|
| Portfolio holdings and allocation are subject to change. Percentages are as of September 30, 2018, and are based on total market value of investments. |
REGIONAL ALLOCATION
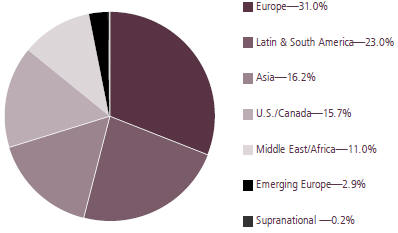
Portfolio holdings and allocations are subject to change. Percentages are as of September 30, 2018, and are based on the total market value of investments.
For more current Fund holdings, please visit oppenheimerfunds.com.
|
| 9 OPPENHEIMER INTERNATIONAL BOND FUND |
Share Class Performance
AVERAGE ANNUAL TOTAL RETURNS WITHOUT SALES CHARGE AS OF 9/30/18
| | | | | | | | | | |
| | | Inception Date | | 1-Year | | 5-Year | | 10-Year | | |
| Class A (OIBAX) | | 6/15/95 | | -4.20% | | 1.61% | | 3.62% | | |
| Class C (OIBCX) | | 6/15/95 | | -4.79 | | 0.85 | | 2.88 | | |
| Class I (OIBIX) | | 1/27/12 | | -3.83 | | 2.04 | | 2.01* | | |
| Class R (OIBNX) | | 3/1/01 | | -4.47 | | 1.34 | | 3.27 | | |
| Class Y (OIBYX) | | 9/27/04 | | -3.80 | | 1.86 | | 3.91 | | |
| |
| AVERAGE ANNUAL TOTAL RETURNS WITH SALES CHARGE AS OF 9/30/18 | | |
| | | Inception Date | | 1-Year | | 5-Year | | 10-Year | | |
| Class A (OIBAX) | | 6/15/95 | | -8.75% | | 0.62% | | 3.12% | | |
| Class C (OIBCX) | | 6/15/95 | | -5.71 | | 0.85 | | 2.88 | | |
| Class I (OIBIX) | | 1/27/12 | | -3.83 | | 2.04 | | 2.01* | | |
| Class R (OIBNX) | | 3/1/01 | | -4.47 | | 1.34 | | 3.27 | | |
| Class Y (OIBYX) | | 9/27/04 | | -3.80 | | 1.86 | | 3.91 | | |
*Shows performance since inception.
| | | | |
| STANDARDIZED YIELDS | |
|
| For the 30 Days Ended 9/30/18 | |
| Class A | | | 3.78% | |
| Class C | | | 3.22 | |
| Class I | | | 4.36 | |
| Class R | | | 3.73 | |
| Class Y | | | 4.21 | |
| | | | |
| UNSUBSIDIZED STANDARDIZED YIELDS | |
|
| For the 30 Days Ended 9/30/18 | |
| Class A | | | 3.76% | |
| Class C | | | 3.20 | |
| Class I | | | 4.34 | |
| Class R | | | 3.71 | |
| Class Y | | | 4.19 | |
Performance data quoted represents past performance, which does not guarantee future results. The investment return and principal value of an investment in the Fund will fluctuate so that an investor’s shares, when redeemed, may be worth more or less than their original cost. Current performance may be lower or higher than the performance quoted. Returns do not consider capital gains or income taxes on an individual’s investment. For performance data current to the most recent month-end, visit oppenheimerfunds.com or call 1.800. CALL OPP (225.5677). Fund returns include changes in share price, reinvested distributions, and the applicable sales charge: for Class A shares, the current maximum initial sales charge of 4.75% and for Class C shares, the contingent deferred sales charge of 1% for the 1-year period. There is no sales charge for Class I, Class R and Class Y shares. Returns for periods of less than one year are cumulative and not annualized. See Fund prospectuses and summary prospectuses for more information on share classes and sales charges.
Standardized yield is based on an SEC-standardized formula designed to approximate the Fund’s annualized hypothetical current income from securities less expenses for the 30-day period ended September 30, 2018 and that date’s maximum offering price (for Class A shares) or net asset value (for all other share classes). Each result is compounded semiannually and
|
| 10 OPPENHEIMER INTERNATIONAL BOND FUND |
then annualized. Falling share prices will tend to artificially raise yields. The unsubsidized standardized yield is computed under an SEC-standardized formula based on net income earned for the 30-day period ended September 30, 2018. The calculation excludes any expense reimbursements and thus may result in a lower yield.
The Fund’s performance is compared to the FTSE Non-U.S. Dollar World Government Bond Index, JP Morgan Government Bond Index-Emerging Markets Global Diversified, JP Morgan Emerging Markets Bond Index Global Diversified, and the Fund’s Reference Index. The FTSE Non-U.S. Dollar World Government Bond Index is an index of fixed rate government bonds with a maturity of one year or longer and amounts outstanding of at least U.S. $25 million. The JPMorgan Government Bond Index-Emerging Markets Global Diversified is a comprehensive, global local Emerging Markets Index, and consists of regularly traded, liquid fixed-rate, domestic currency government bonds to which international investors can gain exposure. The JPMorgan Emerging Markets Bond Index Global Diversified is a composite index representing an unleveraged investment in emerging market bonds that is broadly based across the spectrum of emerging market bonds and includes reinvestment of income (to represent real assets). The indices are unmanaged and cannot be purchased directly by investors. While index comparisons may be useful to provide a benchmark for the Fund’s performance, it must be noted that the Fund’s investments are not limited to the investments comprising the indices. Index performance includes reinvestment of income, but does not reflect transaction costs, fees, expenses or taxes. Index performance is shown for illustrative purposes only as a benchmark for the Fund’s performance, and does not predict or depict performance of the Fund. The Fund’s performance reflects the effects of the Fund’s business and operating expenses.
The views in the Fund Performance Discussion represent the opinions of this Fund’s portfolio manager(s) and are not intended as investment advice or to predict or depict the performance of any investment. These views are as of the close of business on September 30, 2018, and are subject to change based on subsequent developments. The Fund’s portfolio and strategies are subject to change.
Before investing in any of the Oppenheimer funds, investors should carefully consider a fund’s investment objectives, risks, charges and expenses. Fund prospectuses and summary prospectuses contain this and other information about the funds, and may be obtained by asking your financial advisor, visiting oppenheimerfunds.com, or calling 1.800.CALL OPP (225.5677). Read prospectuses and summary prospectuses carefully before investing.
Shares of Oppenheimer funds are not deposits or obligations of any bank, are not guaranteed by any bank, are not insured by the FDIC or any other agency, and involve investment risks, including the possible loss of the principal amount invested.
|
| 11 OPPENHEIMER INTERNATIONAL BOND FUND |
Fund Expenses
Fund Expenses. As a shareholder of the Fund, you incur two types of costs: (1) transaction costs, which may include sales charges (loads) on purchase payments and/or contingent deferred sales charges on redemptions; and (2) ongoing costs, including management fees; distribution and service fees; and other Fund expenses. These examples are intended to help you understand your ongoing costs (in dollars) of investing in the Fund and to compare these costs with the ongoing costs of investing in other mutual funds.
The examples are based on an investment of $1,000.00 invested at the beginning of the period and held for the entire 6-month period ended September 30, 2018.
Actual Expenses. The first section of the table provides information about actual account values and actual expenses. You may use the information in this section for the class of shares you hold, together with the amount you invested, to estimate the expense that you paid over the period. Simply divide your account value by $1,000.00 (for example, an $8,600.00 account value divided by $1,000.00 = 8.60), then multiply the result by the number in the first section under the heading entitled “Expenses Paid During 6 Months Ended September 30, 2018” to estimate the expenses you paid on your account during this period.
Hypothetical Example for Comparison Purposes. The second section of the table provides information about hypothetical account values and hypothetical expenses based on the Fund’s actual expense ratio for each class of shares, and an assumed rate of return of 5% per year for each class before expenses, which is not the Fund’s actual return. The hypothetical account values and expenses may not be used to estimate the actual ending account balance or expenses you paid for the period. You may use this information to compare the ongoing costs of investing in the Fund and other funds. To do so, compare this 5% hypothetical example for the class of shares you hold with the 5% hypothetical examples that appear in the shareholder reports of the other funds.
Please note that the expenses shown in the table are meant to highlight your ongoing costs only and do not reflect any transactional costs, such as front-end or contingent deferred sales charges (loads). Therefore, the “hypothetical” section of the table is useful in comparing ongoing costs only, and will not help you determine the relative total costs of owning different funds. In addition, if these transactional costs were included, your costs would have been higher.
|
| 12 OPPENHEIMER INTERNATIONAL BOND FUND |
| | | | | | |
| Actual | | Beginning Account Value April 1, 2018 | | Ending Account Value September 30, 2018 | | Expenses Paid During 6 Months Ended September 30, 2018 |
| Class A | | $ 1,000.00 | | $ 922.60 | | $ 4.69 |
| Class C | | 1,000.00 | | 920.30 | | 8.32 |
| Class I | | 1,000.00 | | 924.20 | | 2.80 |
| Class R | | 1,000.00 | | 921.10 | | 5.89 |
| Class Y | | 1,000.00 | | 925.30 | | 3.48 |
| | | |
Hypothetical (5% return before expenses) | | | | | | |
| Class A | | 1,000.00 | | 1,020.21 | | 4.92 |
| Class C | | 1,000.00 | | 1,016.44 | | 8.73 |
| Class I | | 1,000.00 | | 1,022.16 | | 2.94 |
| Class R | | 1,000.00 | | 1,018.95 | | 6.19 |
| Class Y | | 1,000.00 | | 1,021.46 | | 3.66 |
Expenses are equal to the Fund’s annualized expense ratio for that class, multiplied by the average account value over the period, multiplied by 183/365 (to reflect the one-half year period). Those annualized expense ratios, excluding indirect expenses from affiliated funds, based on the 6-month period ended September 30, 2018 are as follows:
| | | | |
| Class | | Expense Ratios | |
| Class A | | | 0.97% | |
| Class C | | | 1.72 | |
| Class I | | | 0.58 | |
| Class R | | | 1.22 | |
| Class Y | | | 0.72 | |
The expense ratios reflect voluntary and/or contractual waivers and/or reimbursements of expenses by the Fund’s Manager and Transfer Agent. Some of these undertakings may be modified or terminated at any time, as indicated in the Fund’s prospectus. The “Consolidated Financial Highlights” tables in the Fund’s financial statements, included in this report, also show the gross expense ratios, without such waivers or reimbursements and reduction to custodian expenses, if applicable.
|
| 13 OPPENHEIMER INTERNATIONAL BOND FUND |
CONSOLIDATED STATEMENT OF INVESTMENTS September 30, 2018
| | | | | | | | | | |
| | | | | Principal Amount | | | Value | |
| Mortgage-Backed Obligations—3.6% | | | | | | | | | | |
| Alba plc, Series 2007-1, Cl. C, 1.087% [BP0003M+29], 3/17/391,2 | | GBP | | | 11,832,600 | | | $ | 14,136,288 | |
| Capital Mortgage Srl, Series 2007-1, Cl. B, 0.00% [EUR003M+22], 1/30/471,2 | | EUR | | | 8,000,000 | | | | 5,913,506 | |
| Eurohome UK Mortgages plc: | | | | | | | | | | |
| Series 2007-1, Cl. B1, 1.697% [BP0003M+90], 6/15/441,2 | | GBP | | | 5,275,000 | | | | 5,580,330 | |
| Series 2007-1, Cl. M2, 1.297% [BP0003M+50], 6/15/441,2 | | GBP | | | 4,000,000 | | | | 4,386,118 | |
| Series 2007-2, Cl. B1, 2.197% [BP0003M+140], 9/15/441,2 | | GBP | | | 4,000,000 | | | | 4,477,789 | |
| Eurosail 2006-3nc plc, Series 2006-3X, Cl. D1C, 1.702% [BP0003M+90], 9/10/441,2 | | GBP | | | 11,000,000 | | | | 11,777,271 | |
| Eurosail UK plc, Series 2007-5X, Cl. A1A, 1.57% [BP0003M+77], 9/13/451,2 | | GBP | | | 10,032,078 | | | | 12,705,346 | |
| Fondo de Titulizacion de Activos Santander Hipotecario 2, Series 2, Cl. E, 1.779% [EUR003M+210], 1/18/491,2 | | EUR | | | 7,700,000 | | | | 7,197,117 | |
| Great Hall Mortgages No 1 plc, Series 2007-1, Cl. DA, 1.58% [BP0003M+78], 3/18/391,2 | | GBP | | | 8,000,000 | | | | 9,144,623 | |
| Grifonas Finance plc: | | | | | | | | | | |
| Series 1, Cl. A, 0.014% [EUR006M+28], 8/28/391,2 | | EUR | | | 19,386,720 | | | | 20,601,340 | |
| Series 1, Cl. B, 0.254% [EUR006M+52], 8/28/391,2 | | EUR | | | 5,000,000 | | | | 4,029,842 | |
| Hipocat 9 Fondo de Titulizacion de Activos, Series HIPO-9, Cl. C, 0.00% [EUR003M+29], 7/15/381,2 | | EUR | | | 17,400,000 | | | | 15,657,365 | |
IM Pastor 4 Fondo de Titulizacion de Activos: Series 4, Cl. A, [EUR003M+14], 3/22/441,2 | | EUR | | | 16,809,849 | | | | 17,638,439 | |
| Series 4, Cl. B, [EUR003M+19], 3/22/441,2 | | EUR | | | 3,000,000 | | | | 1,871,556 | |
| Ludgate Funding plc, Series 2007-1, 0.00%, 1/1/61 | | GBP | | | 207,500,000 | | | | 7,143,541 | |
| Newgate Funding plc: | | | | | | | | | | |
| Series 2006-2, Cl. CB, 0.106% [EUR003M+43], 12/1/501,2 | | EUR | | | 3,781,491 | | | | 3,997,010 | |
| Series 2007-2X, Cl. CB, 0.121% [EUR003M+44], 12/15/501,2 | | EUR | | | 3,484,319 | | | | 3,555,360 | |
| Series 2007-3X, Cl. D, 3.797% [BP0003M+300], 12/15/501,2 | | GBP | | | 4,565,638 | | | | 5,909,690 | |
| Sestante Finance Srl, Series 3, Cl. C1, 0.479% [EUR003M+80], 7/15/451,2 | | EUR | | | 9,700,000 | | | | 5,271,491 | |
| TDA 27 Hipocat 9 Fondo de Titulizacion de Activos, Series 27, Cl. A3, 0.00% [EUR003M+19], 12/28/501,2 | | EUR | | | 35,000,000 | | | | 35,613,803 | |
| Total Mortgage-Backed Obligations (Cost $195,670,122) | | | | | | | | | 196,607,825 | |
| | | | | | | | | | |
| Foreign Government Obligations—56.1% | | | | | | | | | | |
Angola—0.6% | | | | | | | | | | |
| Republic of Angola, 9.375% Sr. Unsec. Nts., 5/8/483 | | | | | 29,425,000 | | | | 31,197,268 | |
| | | | | | | | | | | |
Argentina—2.0% | | | | | | | | | | |
| Argentine Republic: | | | | | | | | | | |
| 5.875% Sr. Unsec. Nts., 1/11/28 | | | | | 27,535,000 | | | | 21,875,464 | |
| 6.875% Sr. Unsec. Nts., 4/22/21 | | | | | 9,775,000 | | | | 9,376,766 | |
| 6.875% Sr. Unsec. Nts., 1/26/27 | | | | | 10,125,000 | | | | 8,631,563 | |
| 6.875% Sr. Unsec. Nts., 1/11/48 | | | | | 11,950,000 | | | | 9,261,250 | |
| 7.50% Sr. Unsec. Nts., 4/22/26 | | | | | 52,980,000 | | | | 47,284,650 | |
| 15.50% Bonds, 10/17/26 | | ARS | | | 135,000,000 | | | | 2,383,371 | |
| 16.00% Bonds, 10/17/23 | | ARS | | | 68,258,140 | | | | 1,341,798 | |
| 18.20% Unsec. Nts., 10/3/21 | | ARS | | | 212,805,000 | | | | 4,172,120 | |
|
| 14 OPPENHEIMER INTERNATIONAL BOND FUND |
| | | | | | | | | | |
| | | | | Principal Amount | | | Value | |
Argentina (Continued) | | | | | | | | | | |
| Argentine Republic: (Continued) | | | | | | | | | | |
| 41.144% [BADLARPP+375] Unsec. Nts., 4/12/251,2 | | ARS | | | 120,000,000 | | | $ | 2,526,120 | |
| 45.375% [BADLARPP+325] Sr. Unsec. Nts., 3/1/201 | | ARS | | | 180,336,000 | | | | 4,448,379 | |
| | | | | | | | | | |
| | | | | | | | | 111,301,481 | |
| | | | | | | | | | | |
Australia—1.3% | | | | | | | | | | |
| Commonwealth of Australia: | | | | | | | | | | |
| 1.00% Sr. Unsec. Nts., 2/21/502,4 | | AUD | | | 76,000,000 | | | | 53,430,236 | |
| 2.75% Sr. Unsec. Nts., 11/21/292 | | AUD | | | 23,500,000 | | | | 17,071,213 | |
| | | | | | | | | | |
| | | | | | | | | 70,501,449 | |
| | | | | | | | | | | |
Brazil—3.9% | | | | | | | | | | |
| Federative Republic of Brazil: | | | | | | | | | | |
| 6.00% Unsec. Nts., 8/15/224 | | BRL | | | 30,170,000 | | | | 23,917,292 | |
| 6.00% Unsec. Nts., 5/15/454 | | BRL | | | 32,900,000 | | | | 25,703,232 | |
| 10.00% Unsec. Nts., 1/1/21 | | BRL | | | 325,000,000 | | | | 81,279,832 | |
| 10.00% Unsec. Nts., 1/1/27 | | BRL | | | 291,000,000 | | | | 66,111,571 | |
| 10.00% Unsec. Nts., 1/1/29 | | BRL | | | 70,000,000 | | | | 15,784,510 | |
| | | | | | | | | | |
| | | | | | | | | 212,796,437 | |
| | | | | | | | | | | |
Canada—4.2% | | | | | | | | | | |
| Canada Housing Trust No 1: | | | | | | | | | | |
| 1.25% Bonds, 6/15/213 | | CAD | | | 100,000,000 | | | | 75,221,616 | |
| 2.35%, 6/15/233 | | CAD | | | 120,000,000 | | | | 91,796,075 | |
| 2.65%, 3/15/223 | | CAD | | | 80,000,000 | | | | 62,333,914 | |
| | | | | | | | | | |
| | | | | | | | | 229,351,605 | |
| | | | | | | | | | | |
Chile—0.5% | | | | | | | | | | |
| Republic of Chile: | | | | | | | | | | |
| 4.50% Unsec. Nts., 2/28/21 | | CLP | | | 15,335,000,000 | | | | 23,684,943 | |
| 4.50% Bonds, 3/1/21 | | CLP | | | 700,000,000 | | | | 1,081,039 | |
| | | | | | | | | | |
| | | | | | | | | 24,765,982 | |
| | | | | | | | | | | |
Colombia—1.3% | | | | | | | | | | |
| Republic of Colombia: | | | | | | | | | | |
| 3.875% Sr. Unsec. Nts., 4/25/27 | | | | | 3,250,000 | | | | 3,156,563 | |
| 4.00% Sr. Unsec. Nts., 2/26/24 | | | | | 2,980,000 | | | | 2,983,725 | |
| 6.125% Sr. Unsec. Nts., 1/18/41 | | | | | 11,050,000 | | | | 12,541,750 | |
| Series B, 6.25% Sr. Unsec. Nts., 11/26/25 | | COP | | | 80,000,000,000 | | | | 26,692,129 | |
| Series B, 7.00% Sr. Unsec. Nts., 9/11/19 | | COP | | | 75,000,000,000 | | | | 25,940,411 | |
| | | | | | | | | | |
| | | | | | | | | 71,314,578 | |
| | | |
| | | | | | | | | | | |
Cyprus—0.5% | | | | | | | | | | |
| Republic of Cyprus, 2.375% Sr. Unsec. Nts., 9/25/282 | | EUR | | | 22,500,000 | | | | 26,346,825 | |
| | | | | | | | | | | |
Dominican Republic—1.0% | | | | | | | | | | |
| Dominican Republic: | | | | | | | | | | |
| 5.95% Sr. Unsec. Nts., 1/25/273 | | | | | 38,480,000 | | | | 39,336,180 | |
|
| 15 OPPENHEIMER INTERNATIONAL BOND FUND |
CONSOLIDATED STATEMENT OF INVESTMENTS Continued
| | | | | | | | | | |
| | | | | Principal Amount | | | Value | |
Dominican Republic: (Continued) | | | | | | | | | | |
| Dominican Republic: (Continued) | | | | | | | | | | |
| 6.00% Sr. Unsec. Nts., 7/19/283 | | | | $ | 6,565,000 | | | $ | 6,692,033 | |
| 6.85% Sr. Unsec. Nts., 1/27/453 | | | | | 6,370,000 | | | | 6,473,512 | |
| | | | | | | | | | |
| | | | | | | | | 52,501,725 | |
| | | | | | | | | | | |
Ecuador—0.4% | | | | | | | | | | |
| Republic of Ecuador: | | | | | | | | | | |
| 7.875% Sr. Unsec. Nts., 1/23/283 | | | | | 5,520,000 | | | | 4,983,594 | |
| 8.875% Sr. Unsec. Nts., 10/23/273 | | | | | 11,310,000 | | | | 10,765,141 | |
| 9.65% Sr. Unsec. Nts., 12/13/263 | | | | | 6,545,000 | | | | 6,541,400 | |
| | | | | | | | | | |
| | | | | | | | | 22,290,135 | |
| | | | | | | | | | | |
Egypt—1.0% | | | | | | | | | | |
| Arab Republic of Egypt: | | | | | | | | | | |
| 4.75% Sr. Unsec. Nts., 4/16/263 | | EUR | | | 12,900,000 | | | | 14,423,765 | |
| 5.577% Sr. Unsec. Nts., 2/21/233 | | | | | 4,555,000 | | | | 4,426,658 | |
| 6.125% Sr. Unsec. Nts., 1/31/223 | | | | | 6,530,000 | | | | 6,547,892 | |
| 6.588% Sr. Unsec. Nts., 2/21/283 | | | | | 9,610,000 | | | | 9,217,259 | |
| 7.903% Sr. Unsec. Nts., 2/21/483 | | | | | 1,955,000 | | | | 1,871,545 | |
| 8.50% Sr. Unsec. Nts., 1/31/473 | | | | | 9,480,000 | | | | 9,542,653 | |
| Series 3YR, 15.00% Bonds, 10/3/20 | | EGP | | | 157,150,000 | | | | 8,210,421 | |
| | | | | | | | | | |
| | | | | | | | | 54,240,193 | |
| | | | | | | | | | | |
Gabon—0.2% | | | | | | | | | | |
| Gabonese Republic, 6.375% Bonds, 12/12/243 | | | | | 11,370,000 | | | | 10,788,993 | |
| | | | | | | | | | | |
Ghana—0.5% | | | | | | | | | | |
| Republic of Ghana: | | | | | | | | | | |
| 7.625% Sr. Unsec. Nts., 5/16/293 | | | | | 19,555,000 | | | | 19,647,065 | |
| 8.627% Sr. Unsec. Nts., 6/16/493 | | | | | 9,455,000 | | | | 9,502,275 | |
| | | | | | | | | | |
| | | | | | | | | 29,149,340 | |
| | | | | | | | | | | |
Greece—3.2% | | | | | | | | | | |
| Hellenic Republic: | | | | | | | | | | |
| 0.00% Bonds, 10/15/425 | | EUR | | | 107,000,000 | | | | 411,830 | |
| 3.90% Bonds, 1/30/332 | | EUR | | | 110,212,000 | | | | 117,109,726 | |
| 4.00% Bonds, 1/30/372 | | EUR | | | 35,225,000 | | | | 35,781,648 | |
| 4.375% Sr. Unsec. Nts., 8/1/222,3 | | EUR | | | 20,000,000 | | | | 24,249,713 | |
| | | | | | | | | | |
| | | | | | | | | 177,552,917 | |
| | | | | | | | | | | |
Honduras—0.1% | | | | | | | | | | |
| Republic of Honduras: | | | | | | | | | | |
| 6.25% Sr. Unsec. Nts., 1/19/273 | | | | | 3,160,000 | | | | 3,259,066 | |
| 8.75% Sr. Unsec. Nts., 12/16/203 | | | | | 2,850,000 | | | | 3,123,742 | |
| | | | | | | | | | |
| | | | | | | | | 6,382,808 | |
| | | | | | | | | | | |
Hungary—1.0% | | | | | | | | | | |
| Hungary: | | | | | | | | | | |
| Series 22/A, 7.00% Bonds, 6/24/22 | | HUF | | | 9,600,000,000 | | | | 40,545,648 | |
|
| 16 OPPENHEIMER INTERNATIONAL BOND FUND |
| | | | | | | | | | | | |
| | | | | | Principal Amount | | | Value | |
Hungary (Continued) | | | | | | | | | | | | |
| Hungary: (Continued) | | | | | | | | | | | | |
| Series 22/B, 1.75% Bonds, 10/26/22 | | | HUF | | | | 2,750,000,000 | | | $ | 9,732,247 | |
| Series 25/B, 5.50% Bonds, 6/24/25 | | | HUF | | | | 1,550,000,000 | | | | 6,402,222 | |
| | | | | | | | | | | | |
| | | | | | | | | | | 56,680,117 | |
| | | | | | | | | | | | | |
India—5.2% | | | | | | | | | | | | |
| Indian Railway Finance Corp. Ltd., 8.83% Sr. Sec. Nts., 3/25/23 | | | INR | | | | 250,000,000 | | | | 3,431,842 | |
Republic of India: | | | | | | | | | | | | |
| 6.84% Sr. Unsec. Nts., 12/19/22 | | | INR | | | | 1,000,000,000 | | | | 13,226,528 | |
| 7.68% Sr. Unsec. Nts., 12/15/23 | | | INR | | | | 1,300,000,000 | | | | 17,590,584 | |
| 8.15% Sr. Unsec. Nts., 11/24/26 | | | INR | | | | 500,000,000 | | | | 6,904,249 | |
| 8.20% Sr. Unsec. Nts., 2/15/22 | | | INR | | | | 5,650,000,000 | | | | 78,384,572 | |
| 8.20% Sr. Unsec. Nts., 9/24/25 | | | INR | | | | 3,375,000,000 | | | | 46,803,833 | |
| 8.27% Sr. Unsec. Nts., 6/9/20 | | | INR | | | | 3,023,000,000 | | | | 42,010,484 | |
| 8.40% Sr. Unsec. Nts., 7/28/24 | | | INR | | | | 3,997,000,000 | | | | 55,708,222 | |
| State of Gujarat, 7.52% Sr. Unsec. Nts., 5/24/27 | | | INR | | | | 500,000,000 | | | | 6,455,925 | |
| State of Maharastra, 7.99% Sr. Unsec. Nts., 10/28/25 | | | INR | | | | 500,000,000 | | | | 6,704,028 | |
| State of Tamil Nadu, 8.53% Sr. Unsec. Nts., 3/9/26 | | | INR | | | | 500,000,000 | | | | 6,908,229 | |
| | | | | | | | | | | | |
| | | | | | | | | | | 284,128,496 | |
| | | | | | | | | | | | | |
Indonesia—1.9% | | | | | | | | | | | | |
| Perusahaan Penerbit SBSN Indonesia III: | | | | | | | | | | | | |
| 4.35% Sr. Unsec. Nts., 9/10/243 | | | | | | | 3,560,000 | | | | 3,573,350 | |
| 4.55% Sr. Unsec. Nts., 3/29/263 | | | | | | | 5,680,000 | | | | 5,665,800 | |
| Republic of Indonesia: | | | | | | | | | | | | |
| 3.85% Sr. Unsec. Nts., 7/18/273 | | | | | | | 6,030,000 | | | | 5,756,214 | |
| 4.125% Sr. Unsec. Nts., 1/15/253 | | | | | | | 3,050,000 | | | | 3,007,513 | |
| Series FR56, 8.375% Sr. Unsec. Nts., 9/15/26 | | | IDR | | | | 288,430,000,000 | | | | 19,646,242 | |
| Series FR71, 9.00% Sr. Unsec. Nts., 3/15/29 | | | IDR | | | | 359,350,000,000 | | | | 25,381,350 | |
| Series FR73, 8.75% Sr. Unsec. Nts., 5/15/31 | | | IDR | | | | 560,080,000,000 | | | | 38,713,042 | |
| | | | | | | | | | | | |
| | | | | | | | | | | 101,743,511 | |
| | | | | | | | | | | | | |
Iraq—0.2% | | | | | | | | | | | | |
| Republic of Iraq: | | | | | | | | | | | | |
| 5.80% Unsec. Nts., 1/15/283 | | | | | | | 3,695,000 | | | | 3,511,562 | |
| 6.752% Sr. Unsec. Nts., 3/9/233 | | | | | | | 6,035,000 | | | | 6,046,225 | |
| | | | | | | | | | | | |
| | | | | | | | | | | 9,557,787 | |
| | | | | | | | | | | | | |
Ivory Coast—0.1% | | | | | | | | | | | | |
| Republic of Cote d’Ivoire, 6.625% Sr. Unsec. Nts., 3/22/483 | | | EUR | | | | 2,442,000 | | | | 2,659,014 | |
| | | | | | | | | | | | | |
Kenya—0.1% | | | | | | | | | | | | |
| Republic of Kenya, 8.25% Sr. Unsec. Nts., 2/28/483 | | | | | | | 3,280,000 | | | | 3,176,057 | |
| | | | | | | | | | | | | |
Malaysia—0.4% | | | | | | | | | | | | |
| Federation of Malaysia, Series 0116, 3.80% Sr. Unsec. Nts., 8/17/23 | | | MYR | | | | 80,000,000 | | | | 19,320,952 | |
|
| 17 OPPENHEIMER INTERNATIONAL BOND FUND |
CONSOLIDATED STATEMENT OF INVESTMENTS Continued
| | | | | | | | | | |
| | | | | Principal Amount | | | Value | |
Mexico—9.1% | | | | | | | | | | |
| United Mexican States: | | | | | | | | | | |
| 3.75% Sr. Unsec. Nts., 1/11/28 | | | | $ | 6,395,000 | | | $ | 6,102,429 | |
| 4.00% Bonds, 6/13/194 | | MXN | | | 1,630,809,300 | | | | 87,200,020 | |
| Series M, 5.00% Sr. Unsec. Nts., 12/11/19 | | MXN | | | 1,320,000,000 | | | | 68,270,535 | |
| Series M, 6.50% Bonds, 6/10/21 | | MXN | | | 400,000,000 | | | | 20,743,401 | |
| Series M, 8.00% Sr. Unsec. Nts., 12/7/23 | | MXN | | | 2,050,000,000 | | | | 110,697,152 | |
| Series M10, 8.50% Bonds, 12/13/18 | | MXN | | | 2,890,000,000 | | | | 154,581,180 | |
| Series M20, 8.50% Sr. Unsec. Nts., 5/31/29 | | MXN | | | 240,000,000 | | | | 13,318,243 | |
| Series M20, 10.00% Bonds, 12/5/24 | | MXN | | | 698,700,000 | | | | 41,417,221 | |
| | | | | | | | | | |
| | | | | | | | | 502,330,181 | |
| | | | | | | | | | | |
Mongolia—0.2% | | | | | | | | | | |
| Mongolia, 5.625% Sr. Unsec. Nts., 5/1/233 | | | | | 9,690,000 | | | | 9,432,663 | |
| | | | | | | | | | | |
New Zealand—0.4% | | | | | | | | | | |
| New Zealand, 3.00% Sr. Unsec. Nts., 4/20/29 | | NZD | | | 30,000,000 | | | | 20,596,463 | |
| | | | | | | | | | | |
Nigeria—0.4% | | | | | | | | | | |
| Federal Republic of Nigeria: | | | | | | | | | | |
| 7.143% Sr. Unsec. Nts., 2/23/303 | | | | | 14,260,000 | | | | 13,972,661 | |
| 7.696% Sr. Unsec. Nts., 2/23/383 | | | | | 10,770,000 | | | | 10,582,817 | |
| | | | | | | | | | |
| | | | | | | | | 24,555,478 | |
| | | | | | | | | | | |
Oman—0.4% | | | | | | | | | | |
| Sultanate of Oman, 6.75% Sr. Unsec. Nts., 1/17/483 | | | | | 24,235,000 | | | | 23,658,716 | |
| | | | | | | | | | | |
Peru—0.8% | | | | | | | | | | |
| Republic of Peru: | | | | | | | | | | |
| 6.35% Sr. Unsec. Nts., 8/12/283 | | PEN | | | 112,140,000 | | | | 35,766,690 | |
| 8.20% Sr. Unsec. Nts., 8/12/263 | | PEN | | | 29,000,000 | | | | 10,381,071 | |
| | | | | | | | | | |
| | | | | | | | | 46,147,761 | |
| | | | | | | | | | | |
Poland—0.3% | | | | | | | | | | |
| Republic of Poland: | | | | | | | | | | |
| Series 0725, 3.25% Bonds, 7/25/25 | | PLN | | | 30,000,000 | | | | 8,295,177 | |
| Series 0726, 2.50% Bonds, 7/25/26 | | PLN | | | 35,900,000 | | | | 9,337,038 | |
| | | | | | | | | | |
| | | | | | | | | 17,632,215 | |
| | | | | | | | | | | |
Portugal—2.9% | | | | | | | | | | |
| Portuguese Republic, 2.875% Sr. Unsec. Nts., 10/15/252,3 | | EUR | | | 125,500,000 | | | | 160,362,363 | |
| | | | | | | | | | | |
Russia—0.1% | | | | | | | | | | |
| Russian Federation, Series 6209, 7.60% Bonds, 7/20/22 | | RUB | | | 394,000,000 | | | | 5,948,078 | |
| | | | | | | | | | | |
Senegal—0.1% | | | | | | | | | | |
| Republic of Senegal: | | | | | | | | | | |
| 6.25% Unsec. Nts., 5/23/333 | | | | | 3,170,000 | | | | 2,967,361 | |
|
| 18 OPPENHEIMER INTERNATIONAL BOND FUND |
| | | | | | | | | | |
| | | | | Principal Amount | | | Value | |
Senegal (Continued) | | | | | | | | | | |
| Republic of Senegal: (Continued) | | | | $ | 5,690,000 | | | $ | 5,102,223 | |
| | | | | | | | | | |
| 6.75% Sr. Unsec. Nts., 3/13/483 | | | | | | | | | 8,069,584 | |
| | | | | | | | | | | |
Serbia—0.2% | | | | | | | | | | |
| Republic of Serbia, 5.875% Unsec. Nts., 12/3/183 | | | | | 12,245,000 | | | | 12,303,482 | |
| | | | | | | | | | | |
Singapore—0.3% | | | | | | | | | | |
| Republic of Singapore, 2.25% Sr. Unsec. Nts., 6/1/21 | | SGD | | | 25,000,000 | | | | 18,386,288 | |
| | | | | | | | | | | |
South Africa—4.2% | | | | | | | | | | |
| Republic of South Africa: | | | | | | | | | | |
| 4.30% Sr. Unsec. Nts., 10/12/28 | | | | | 14,685,000 | | | | 13,201,624 | |
| 5.375% Sr. Unsec. Nts., 7/24/44 | | | | | 4,545,000 | | | | 4,080,960 | |
| 5.65% Sr. Unsec. Nts., 9/27/47 | | | | | 3,920,000 | | | | 3,585,546 | |
| Series 2023, 7.75% Bonds, 2/28/23 | | ZAR | | | 311,100,000 | | | | 21,498,982 | |
| Series 2030, 8.00% Bonds, 1/31/30 | | ZAR | | | 260,000,000 | | | | 16,629,152 | |
| Series 2037, 8.50% Bonds, 1/31/37 | | ZAR | | | 181,800,000 | | | | 11,450,832 | |
| Series 2048, 8.75% Bonds, 2/28/48 | | ZAR | | | 452,000,000 | | | | 28,423,876 | |
| Series R186, 10.50% Bonds, 12/21/26 | | ZAR | | | 1,059,700,000 | | | | 81,253,671 | |
| Series R208, 6.75% Sr. Unsec. Nts., 3/31/21 | | ZAR | | | 514,540,000 | | | | 35,479,964 | |
| Series R214, 6.50% Bonds, 2/28/41 | | ZAR | | | 255,000,000 | | | | 12,564,618 | |
| | | | | | | | | | |
| | | | | | | | | 228,169,225 | |
| | | | | | | | | | | |
Sri Lanka—0.7% | | | | | | | | | | |
| Democratic Socialist Republic of Sri Lanka: | | | | | | | | | | |
| 5.75% Sr. Unsec. Nts., 4/18/233 | | | | | 9,690,000 | | | | 9,452,120 | |
| 5.875% Sr. Unsec. Nts., 7/25/223 | | | | | 8,995,000 | | | | 8,860,354 | |
| 6.00% Sr. Unsec. Nts., 1/14/193 | | | | | 9,430,000 | | | | 9,449,888 | |
| 6.25% Sr. Unsec. Nts., 10/4/203 | | | | | 2,955,000 | | | | 2,980,936 | |
| 6.75% Sr. Unsec. Nts., 4/18/283 | | | | | 6,490,000 | | | | 6,294,820 | |
| | | | | | | | | | |
| | | | | | | | | 37,038,118 | |
| | | | | | | | | | | |
Thailand—1.3% | | | | | | | | | | |
| Kingdom of Thailand: | | | | | | | | | | |
| 1.875% Sr. Unsec. Nts., 6/17/22 | | THB | | | 1,120,000,000 | | | | 34,219,602 | |
| 2.125% Sr. Unsec. Nts., 12/17/26 | | THB | | | 650,000,000 | | | | 19,340,675 | |
| 3.775% Sr. Unsec. Nts., 6/25/32 | | THB | | | 600,000,000 | | | | 19,862,653 | |
| | | | | | | | | | |
| | | | | | | | | 73,422,930 | |
| | | | | | | | | | | |
Turkey—1.0% | | | | | | | | | | |
| Republic of Turkey: | | | | | | | | | | |
| 8.50% Bonds, 7/10/19 | | TRY | | | 45,000,000 | | | | 6,758,463 | |
| 8.80% Bonds, 11/14/18 | | TRY | | | 73,165,000 | | | | 11,886,843 | |
| 10.70% Bonds, 2/17/21 | | TRY | | | 155,600,000 | | | | 19,646,269 | |
| 11.00% Bonds, 2/24/27 | | TRY | | | 14,900,000 | | | | 1,728,223 | |
| 12.40% Bonds, 3/8/28 | | TRY | | | 103,000,000 | | | | 13,346,258 | |
| | | | | | | | | | |
| | | | | | | | | 53,366,056 | |
|
| 19 OPPENHEIMER INTERNATIONAL BOND FUND |
CONSOLIDATED STATEMENT OF INVESTMENTS Continued
| | | | | | | | | | |
| | | | | Principal Amount | | | Value | |
Ukraine—1.1% | | | | | | | | | | |
| Ukraine: | | | | | | | | | | |
| 7.75% Sr. Unsec. Nts., 9/1/202 | | | | $ | 5,905,000 | | | $ | 5,964,050 | |
| 7.75% Sr. Unsec. Nts., 9/1/232 | | | | | 13,840,000 | | | | 13,620,290 | |
| 7.75% Sr. Unsec. Nts., 9/1/242 | | | | | 8,880,000 | | | | 8,637,318 | |
| 7.75% Sr. Unsec. Nts., 9/1/252 | | | | | 5,900,000 | | | | 5,631,226 | |
| 7.75% Sr. Unsec. Nts., 9/1/262 | | | | | 19,825,000 | | | | 18,696,561 | |
| 7.75% Sr. Unsec. Nts., 9/1/272 | | | | | 11,175,000 | | | | 10,421,827 | |
| | | | | | | | | | |
| | | | | | | | | 62,971,272 | |
| | | | | | | | | | | |
United Kingdom—2.6% | | | | | | | | | | |
| United Kingdom, 3.25% Bonds, 1/22/442 | | GBP | | | 88,000,000 | | | | 144,681,109 | |
| | | | | | | | | | | |
Uruguay—0.4% | | | | | | | | | | |
| Oriental Republic of Uruguay: | | | | | | | | | | |
| 5.10% Sr. Unsec. Nts., 6/18/50 | | | | | 17,730,000 | | | | 18,151,088 | |
| 9.875% Sr. Unsec. Nts., 6/20/223 | | UYU | | | 176,475,000 | | | | 5,280,328 | |
| | | | | | | | | | |
| | | | | | | | | 23,431,416 | |
| | | | | | | | | | |
| Total Foreign Government Obligations (Cost $3,347,878,421) | | | | | | | | | 3,080,251,068 | |
| | | | | | | | | | | |
| Corporate Bonds and Notes—27.9% | | | | | | | | | | |
| Consumer Discretionary—0.6% | | | | | | | | | | |
| Automobiles—0.1% | | | | | | | | | | |
| Aston Martin Capital Holdings Ltd., 6.50% Sr. Sec. Nts., 4/15/223 | | | | | 3,500,000 | | | | 3,594,080 | |
| Jaguar Land Rover Automotive plc, 4.50% Sr. Unsec. Nts., 10/1/273 | | | | | 1,900,000 | | | | 1,567,120 | |
| | | | | | | | | | |
| | | | | | | | | 5,161,200 | |
| | | | | | | | | | | |
| Hotels, Restaurants & Leisure—0.2% | | | | | | | | | | |
| Melco Resorts Finance Ltd., 4.875% Sr. Unsec. Nts., 6/6/253 | | | | | 8,220,000 | | | | 7,798,892 | |
| Sands China Ltd., 5.125% Sr. Unsec. Nts., 8/8/253 | | | | | 3,280,000 | | | | 3,276,707 | |
| | | | | | | | | | |
| | | | | | | | | 11,075,599 | |
| | | | | | | | | | | |
| Household Durables—0.0% | | | | | | | | | | |
| Arcelik AS, 5.00% Sr. Unsec. Nts., 4/3/233 | | | | | 3,245,000 | | | | 2,964,979 | |
| | | | | | | | | | | |
| Media—0.3% | | | | | | | | | | |
| Altice Luxembourg SA, 6.25% Sr. Unsec. Nts., 2/15/252 | | EUR | | | 5,475,000 | | | | 5,951,862 | |
| Ziggo BV, 4.25% Sr. Sec. Nts., 1/15/273 | | EUR | | | 8,000,000 | | | | 9,311,992 | |
| | | | | | | | | | |
| | | | | | | | | 15,263,854 | |
| | | | | | | | | | | |
| Consumer Staples—0.3% | | | | | | | | | | |
| Beverages—0.1% | | | | | | | | | | |
| Coca-Cola Icecek AS, 4.215% Sr. Unsec. Nts., 9/19/243 | | | | | 3,010,000 | | | | 2,837,726 | |
| | | | | | | | | | | |
| Food Products—0.2% | | | | | | | | | | |
| BRF SA, 3.95% Sr. Unsec. Nts., 5/22/233 | | | | | 3,240,000 | | | | 2,948,400 | |
| MARB BondCo plc, 6.875% Sr. Unsec. Nts., 1/19/253 | | | | | 3,255,000 | | | | 3,037,322 | |
| MHP Lux SA, 6.95% Sr. Unsec. Nts., 4/3/263 | | | | | 3,370,000 | | | | 3,153,814 | |
|
| 20 OPPENHEIMER INTERNATIONAL BOND FUND |
| | | | | | | | | | | | |
| | | | | | Principal Amount | | | Value | |
Food Products (Continued) | | | | | | | | | | | | |
| Minerva Luxembourg SA, 6.50% Sr. Unsec. Nts., 9/20/263 | | | | | | $ | 3,240,000 | | | $ | 3,049,650 | |
| | | | | | | | | | | | |
| | | | | | | | | | | 12,189,186 | |
| | | | | | | | | | | | | |
| Energy—3.4% | | | | | | | | | | | | |
| Energy Equipment & Services—0.8% | | | | | | | | | | | | |
| Eterna Capital Pte Ltd.: | | | | | | | | | | | | |
| 7.50% Sr. Sec. Nts., 12/11/222,6 | | | | | | | 5,826,974 | | | | 5,800,429 | |
| 8.00% Sr. Sec. Nts., 12/11/226 | | | | | | | 19,152,906 | | | | 18,534,401 | |
| Pertamina Persero PT, 5.625% Sr. Unsec. Nts., 5/20/433 | | | | | | | 16,495,000 | | | | 16,314,495 | |
| | | | | | | | | | | | |
| | | | | | | | | | | 40,649,325 | |
| | | | | | | | | | | | | |
| Oil, Gas & Consumable Fuels—2.6% | | | | | | | | | | | | |
| Frontera Energy Corp., 9.70% Sr. Unsec. Nts., 6/25/233 | | | | | | | 3,040,000 | | | | 3,199,600 | |
| Indika Energy Capital III Pte Ltd., 5.875% Sr. Sec. Nts., 11/9/243 | | | | | | | 5,005,000 | | | | 4,717,628 | |
| KazMunayGas National Co. JSC: | | | | | | | | | | | | |
| 4.75% Sr. Unsec. Nts., 4/24/253 | | | | | | | 6,680,000 | | | | 6,767,341 | |
| 5.375% Sr. Unsec. Nts., 4/24/303 | | | | | | | 12,955,000 | | | | 13,205,031 | |
| 6.375% Sr. Unsec. Nts., 10/24/483 | | | | | | | 11,515,000 | | | | 12,120,459 | |
| KazTransGas JSC, 4.375% Sr. Unsec. Nts., 9/26/273 | | | | | | | 7,590,000 | | | | 7,254,211 | |
| Medco Platinum Road Pte Ltd., 6.75% Sr. Sec. Nts., 1/30/253 | | | | | | | 14,095,000 | | | | 13,359,833 | |
| Petrobras Global Finance BV: | | | | | | | | | | | | |
| 5.299% Sr. Unsec. Nts., 1/27/25 | | | | | | | 9,755,000 | | | | 9,135,557 | |
| 5.75% Sr. Unsec. Nts., 2/1/29 | | | | | | | 9,750,000 | | | | 8,728,688 | |
| 6.85% Sr. Unsec. Nts., 6/5/15 | | | | | | | 3,255,000 | | | | 2,799,300 | |
| Petroleos Mexicanos: | | | | | | | | | | | | |
| 3.75% Sr. Unsec. Nts., 2/21/242 | | | EUR | | | | 2,975,000 | | | | 3,566,514 | |
| 3.75% Sr. Unsec. Nts., 4/16/262 | | | EUR | | | | 6,495,000 | | | | 7,564,631 | |
| 6.75% Sr. Unsec. Nts., 9/21/47 | | | | | | | 4,880,000 | | | | 4,668,647 | |
| Puma International Financing SA, 5.00% Sr. Unsec. Nts., 1/24/263 | | | | | | | 7,005,000 | | | | 5,934,650 | |
| Reliance Industries Ltd., 6.78% Unsec. Nts., 9/16/20 | | | INR | | | | 500,000,000 | | | | 6,717,692 | |
| Repsol International Finance BV, 4.50% [EUSA10+420] Jr. Sub. Nts., 3/25/751,2 | | | EUR | | | | 5,000,000 | | | | 6,237,712 | |
| Rio Oil Finance Trust Series 2018-1, 8.20% Sr. Sec. Nts., 4/6/283 | | | | | | | 4,835,000 | | | | 4,955,875 | |
| Saka Energi Indonesia PT, 4.45% Sr. Unsec. Nts., 5/5/243 | | | | | | | 4,110,000 | | | | 3,843,960 | |
| Southern Gas Corridor CJSC, 6.875% Sr. Unsec. Nts., 3/24/263 | | | | | | | 6,525,000 | | | | 7,266,553 | |
| Topaz Marine SA, 9.125% Sr. Unsec. Nts., 7/26/223 | | | | | | | 3,225,000 | | | | 3,332,102 | |
| YPF SA: | | | | | | | | | | | | |
| 8.50% Sr. Unsec. Nts., 7/28/253 | | | | | | | 5,200,000 | | | | 5,089,552 | |
| 36.75% [BADLARPP+400] Sr. Unsec. Nts., 7/7/201,3 | | | | | | | 8,000,000 | | | | 3,210,800 | |
| | | | | | | | | | | 143,676,336 | |
| | | | | | | | | | | | | |
| Financials—18.6% | | | | | | | | | | | | |
| Capital Markets—1.7% | | | | | | | | | | | | |
| Credit Suisse Group AG, 7.50% [USSW5+459.8] Jr. Sub. | | | | | | | | | | | | |
| Perpetual Bonds1,2,7 | | | | | | | 35,000,000 | | | | 36,924,300 | |
|
| 21 OPPENHEIMER INTERNATIONAL BOND FUND |
CONSOLIDATED STATEMENT OF INVESTMENTS Continued
| | | | | | | | | | | | |
| | | | | | Principal Amount | | | Value | |
| Capital Markets (Continued) | | | | | | | | | | | | |
| Huarong Finance 2017 Co. Ltd., 4.25% Sr. Unsec. Nts., 11/7/272 | | | | | | $ | 6,515,000 | | | $ | 5,973,317 | |
| Morgan Stanley, 7.50% Sr. Unsec. Nts., 4/2/325 | | | | | | | 25,000,000 | | | | 19,318,100 | |
| Seven & Seven Ltd., 3.542% [US0006M+100] Sr. Unsec. Nts., 9/11/191,3 | | | | | | | 1,000,000 | | | | 995,225 | |
| UBS AG (Stamford CT), 7.625% Sub. Nts., 8/17/22 | | | | | | | 10,000,000 | | | | 11,165,000 | |
| UBS Group Funding Switzerland AG: | | | | | | | | | | | | |
| 6.875% [USISDA05+549.65] Jr. Sub. Perpetual Bonds1,2,7 | | | | | | | 4,595,000 | | | | 4,740,960 | |
| 7.00% [USSW5+486.6] Jr. Sub. Perpetual Bonds1,2,7 | | | | | | | 8,000,000 | | | | 8,513,504 | |
| 7.125% [USSW5+546.4] Jr. Sub. Perpetual Bonds1,2,7 | | | | | | | 5,000,000 | | | | 5,130,175 | |
| | | | | | | | | | | | |
| | | | | | | | | | | 92,760,581 | |
| | | | | | | | | | | | | |
| Commercial Banks—13.0% | | | | | | | | | | | | |
| Adler Pelzer Holding GmbH, 4.125% Sr. Sec. Nts., 4/1/242 | | | EUR | | | | 1,300,000 | | | | 1,516,053 | |
| Allied Irish Banks plc, 4.125% [EUSA5+395] Sub. Nts., 11/26/251,2 | | | EUR | | | | 12,000,000 | | | | 14,784,467 | |
| Astana Finance JSC, 9.16% Sr. Unsec. Nts., 12/22/248,9 | | | | | | | 612,810 | | | | — | |
| Banca Monte dei Paschi di Siena SpA, 5.375% [EUSA5+500.5] Sub. Nts., 1/18/281,2 | | | EUR | | | | 15,000,000 | | | | 14,187,410 | |
| Banco Bilbao Vizcaya Argentaria SA: | | | | | | | | | | | | |
| 5.875% [EUSA5+577.9] Jr. Sub. Perpetual Bonds1,2,7,11 | | | EUR | | | | 22,500,000 | | | | 26,374,855 | |
| 6.75% [EUSA5+660.4] Jr. Sub. Perpetual Bonds1,2,7 | | | EUR | | | | 3,000,000 | | | | 3,629,589 | |
| 8.875% [EUSA5+917.7] Jr. Sub. Perpetual Bonds1,2,7 | | | EUR | | | | 27,200,000 | | | | 35,370,227 | |
| Banco do Brasil SA (Cayman), 3.875% Sr. Unsec. Nts., 10/10/22 | | | | | | | 14,625,000 | | | | 13,758,469 | |
| Banco Hipotecario SA, 36.333% [BADLARPP+250] Sr. Unsec. Nts., 1/12/201,3 | | | ARS | | | | 75,979,000 | | | | 1,665,920 | |
| Banco Mercantil del Norte SA (Grand Cayman), 7.625% [H15T10Y+535.3] Jr. Sub. Perpetual Bonds1,3,7 | | | | | | | 2,316,000 | | | | 2,350,740 | |
| Banco Santander SA, 6.75% [EUSA5+680.3] Jr. Sub. Perpetual Bonds1,2,7 | | | EUR | | | | 14,500,000 | | | | 18,181,369 | |
| Bank of Ireland, 10.00% Sub. Nts., 12/19/222 | | | EUR | | | | 9,500,000 | | | | 14,811,513 | |
| Bank of Scotland plc, 4.875% Sec. Nts., 12/20/24 | | | GBP | | | | 8,675,000 | | | | 13,292,198 | |
| Barclays Bank plc, 6.278% [US0003M+155] Jr. Sub. Perpetual Bonds1,7 | | | | | | | 4,000,000 | | | | 4,080,020 | |
| Barclays plc: | | | | | | | | | | | | |
| 6.50% [EUSA5+587.5] Jr. Sub. Perpetual Bonds1,7 | | | EUR | | | | 6,500,000 | | | | 7,792,097 | |
| 7.25% [BPSW5+646.2] Jr. Sub. Perpetual Bonds1,2,7 | | | GBP | | | | 5,000,000 | | | | 6,748,653 | |
| 7.75% [USSW5+484.2] Jr. Sub. Perpetual Bonds1,7 | | | | | | | 5,975,000 | | | | 6,004,875 | |
| 8.00% [EUSA5+675] Jr. Sub. Perpetual Bonds1,7 | | | EUR | | | | 11,105,000 | | | | 14,237,487 | |
| BBVA Bancomer SA, 5.35% [H15T5Y+300] Sub. Nts., 11/12/291,3 | | | | | | | 5,765,000 | | | | 5,548,813 | |
| BNP Paribas SA, 7.625% [USSW5+631.4] Jr. Sub. Perpetual Bonds1,3,7 | | | | | | | 24,000,000 | | | | 25,260,000 | |
| Caixa Geral de Depositos SA: | | | | | | | | | | | | |
| 1.00% Sec. Nts., 1/27/222 | | | EUR | | | | 3,000,000 | | | | 3,556,195 | |
| 5.75% [EUSA5+550] Sub. Nts., 6/28/281,2 | | | EUR | | | | 8,000,000 | | | | 9,800,655 | |
| 10.75% [EUSA5+1,092.5] Jr. Sub. Perpetual Bonds1,2,7 | | | EUR | | | | 7,000,000 | | | | 9,215,846 | |
|
| 22 OPPENHEIMER INTERNATIONAL BOND FUND |
| | | | | | | | | | | | |
| | | | | | Principal Amount | | | Value | |
| Commercial Banks (Continued) | | | | | | | | | | | | |
| CaixaBank SA, 6.75% [EUSA5+649.8] Jr. Sub. Perpetual Bonds1,2,7 | | | EUR | | | | 20,000,000 | | | $ | 25,128,489 | |
| Cooperatieve Rabobank UA, 5.50% [EUSA5+525] Jr. Sub. Perpetual Bonds1,2,7 | | | EUR | | | | 5,090,000 | | | | 6,236,612 | |
| Credit Agricole SA: | | | | | | | | | | | | |
| 6.625% [USSW5+469.7] Jr. Sub. Perpetual Bonds1,2,7 | | | | | | | 4,000,000 | | | | 4,045,588 | |
| 8.125% [USSW5+618.5] Jr. Sub. Perpetual Bonds1,3,7 | | | | | | | 4,405,000 | | | | 4,856,451 | |
| Credit Suisse AG, 6.50% Sub. Nts., 8/8/232 | | | | | | | 15,010,000 | | | | 16,061,315 | |
| Dresdner Funding Trust I, 8.151% Jr. Sub. Nts., 6/30/313 | | | | | | | 9,900,000 | | | | 12,256,200 | |
| EUROFIMA, 6.25% Sr. Unsec. Nts., 12/28/182 | | | AUD | | | | 5,270,000 | | | | 3,845,285 | |
| Export-Import Bank of India: | | | | | | | | | | | | |
| 9.50% Sr. Unsec. Nts., 10/9/18 | | | INR | | | | 175,000,000 | | | | 2,412,419 | |
| 9.70% Sr. Unsec. Nts., 11/21/18 | | | INR | | | | 200,000,000 | | | | 2,773,293 | |
| Fidelity Bank plc, 10.50% Sr. Unsec. Nts., 10/16/223 | | | | | | | 3,780,000 | | | | 3,870,153 | |
| HSBC Bank Capital Funding Sterling 1 LP, 5.844% [BP0006M+176] Jr. Sub. Perpetual Bonds1,2,7 | | | GBP | | | | 3,100,000 | | | | 4,859,145 | |
| HSBC Holdings plc: | | | | | | | | | | | | |
| 5.25% [EUSA5+438.3] Jr. Sub. Perpetual Bonds1,2,7 | | | EUR | | | | 21,000,000 | | | | 25,788,260 | |
| 6.25% [USISDA05+345.3] Jr. Sub. Perpetual Bonds1,7 | | | | | | | 15,000,000 | | | | 14,962,500 | |
| IDBI Bank Ltd. (GIFT-IFC), 5.00% Sr. Unsec. Nts., 9/25/192 | | | | | | | 2,530,000 | | | | 2,542,751 | |
| ING Groep NV, 6.875% [USSW5+512.4] Jr. Sub. Perpetual Bonds1,2,7 | | | | | | | 5,000,000 | | | | 5,087,410 | |
| Inter-American Development Bank, 24.539% Sr. Unsec. Nts., 9/28/2014 | | | TRY | | | | 57,100,000 | | | | 5,981,379 | |
| Intesa Sanpaolo SpA: | | | | | | | | | | | | |
| 4.375% Sr. Unsec. Nts., 1/12/483 | | | | | | | 10,000,000 | | | | 7,576,526 | |
| 5.017% Sub. Nts., 6/26/243 | | | | | | | 10,825,000 | | | | 9,777,698 | |
| 5.71% Sub. Nts., 1/15/263 | | | | | | | 2,000,000 | | | | 1,826,392 | |
| Intrum AB, 3.125% Sr. Unsec. Nts., 7/15/242 | | | EUR | | | | 7,655,000 | | | | 8,464,625 | |
| KBC Group NV, 5.625% [EUSA5+475.9] Jr. Sub. Perpetual Bonds1,2,7 | | | EUR | | | | 7,500,000 | | | | 8,835,193 | |
| Lloyds Bank plc: | | | | | | | | | | | | |
| 7.50% Sr. Unsec. Nts., 4/2/322,5 | | | | | | | 10,000,000 | | | | 7,740,490 | |
| 13.00% [GUKG5+1,340] Jr. Sub. Perpetual Bonds1,7 | | | GBP | | | | 5,000,000 | | | | 11,093,022 | |
| Lloyds Banking Group plc: | | | | | | | | | | | | |
| 6.375% [EUSA5+529] Jr. Sub. Perpetual Bonds1,2,7 | | | EUR | | | | 18,000,000 | | | | 22,144,370 | |
| 6.657% [US0003M+127] Jr. Sub. Perpetual Bonds1,7,10 | | | | | | | 12,000,000 | | | | 12,262,560 | |
| NN Group NV, 4.625% [EUR003M+395] Sub. Nts., 4/8/441,2 | | | EUR | | | | 5,000,000 | | | | 6,349,225 | |
| Novo Banco SA (Luxembourg): | | | | | | | | | | | | |
| 3.50% Sr. Unsec. Nts., 1/23/43 | | | EUR | | | | 10,000,000 | | | | 10,001,656 | |
| 3.50% Sr. Unsec. Nts., 2/19/432 | | | EUR | | | | 1,700,000 | | | | 1,701,987 | |
| 3.50% Sr. Unsec. Nts., 3/18/432 | | | EUR | | | | 2,300,000 | | | | 2,296,447 | |
| Rabobank Capital Funding Trust IV, 5.556% [BP0006M+146] Jr. Sub. Perpetual Bonds1,3,7 | | | GBP | | | | 8,005,000 | | | | 10,823,760 | |
| Societe Generale SA: | | | | | | | | | | | | |
| 6.75% [USSW5+392.9] Jr. Sub. Perpetual Bonds1,3,7 | | | | | | | 10,000,000 | | | | 9,342,500 | |
| 6.75% [EUSA5+553.8] Jr. Sub. Perpetual Bonds1,2,7 | | | EUR | | | | 10,000,000 | | | | 12,539,920 | |
| 7.375% [USSW5+623.8] Jr. Sub. Perpetual Bonds1,3,7 | | | | | | | 13,000,000 | | | | 13,438,750 | |
|
| 23 OPPENHEIMER INTERNATIONAL BOND FUND |
CONSOLIDATED STATEMENT OF INVESTMENTS Continued
| | | | | | | | | | |
| | | | | Principal Amount | | | Value | |
| Commercial Banks (Continued) | | | | | | | | | | |
| Stadshypotek AB: | | | | | | | | | | |
| 1.50% Sec. Nts., 3/17/212 | | SEK | | | 600,000,000 | | | $ | 69,893,850 | |
| 1.50% Sec. Nts., 12/15/212 | | SEK | | | 400,000,000 | | | | 46,699,237 | |
| Standard Chartered Bank, 5.375% [BP0003M+189] Jr. Sub. Perpetual Bonds1,7 | | GBP | | | 4,000,000 | | | | 5,367,698 | |
| Standard Chartered plc, 7.014% [US0003M+146] Jr. Sub. Perpetual Bonds1,3,7 | | | | | 5,460,000 | | | | 5,678,400 | |
| Swiss Insured Brazil Power Finance Sarl, 9.85% Sr. Sec. Nts., 7/16/32 | | BRL | | | 17,500,000 | | | | 4,019,079 | |
| UBS Group Funding Switzerland AG: | | | | | | | | | | |
| 5.00% [USSW5+243.2] Jr. Sub. Perpetual Bonds1,2,7 | | | | | 6,470,000 | | | | 5,734,232 | |
| 5.75% [EUSA5+528.7] Jr. Sub. Perpetual Bonds1,2,7 | | EUR | | | 11,000,000 | | | | 14,175,909 | |
| Westpac Banking Corp., 1.50% Sec. Nts., 3/24/212 | | EUR | | | 5,000,000 | | | | 6,025,623 | |
| Zenith Bank plc, 7.375% Sr. Unsec. Nts., 5/30/223 | | | | | 3,930,000 | | | | 3,978,457 | |
| | | | | | | | | | |
| | | | | | | | | 710,662,307 | |
| | | | | | | | | | | |
| Consumer Finance—0.3% | | | | | | | | | | |
| Minejesa Capital BV, 4.625% Sr. Sec. Nts., 8/10/303 | | | | | 17,770,000 | | | | 16,375,571 | |
| | | | | | | | | | | |
| Diversified Financial Services—0.4% | | | | | | | | | | |
| JPMorgan Hipotecaria su Casita, 6.47% Sec. Nts., 8/26/359,10 | | MXN | | | 34,101,099 | | | | 167,417 | |
| Power Finance Corp. Ltd., 7.99% Sr. Unsec. Nts., 12/20/22 | | INR | | | 400,000,000 | | | | 5,342,188 | |
| Rural Electrification Corp. Ltd.: | | | | | | | | | | |
| 8.36% Sr. Unsec. Nts., 9/22/20 | | INR | | | 850,000,000 | | | | 11,714,956 | |
| 9.04% Sr. Unsec. Nts., 10/12/19 | | INR | | | 250,000,000 | | | | 3,455,276 | |
| | | | | | | | | | |
| | | | | | | | | 20,679,837 | |
| | | | | | | | | | | |
| Insurance—2.4% | | | | | | | | | | |
| Aquarius & Investments plc for Swiss Reinsurance Co. Ltd., 6.375% [USSW5+521] Sub. Nts., 9/1/241,2 | | | | | 5,000,000 | | | | 5,110,580 | |
| ASR Nederland NV, 5.125% Sub. Nts., 9/29/452 | | EUR | | | 10,000,000 | | | | 12,830,148 | |
| Aviva plc: | | | | | | | | | | |
| 3.875% [EUSA5+348] Sub. Nts., 7/3/441,2 | | EUR | | | 7,000,000 | | | | 8,598,208 | |
| 6.125% [EUSA5+513] Sub. Nts., 7/5/431,2 | | EUR | | | 5,000,000 | | | | 6,778,250 | |
| 6.125% [GUKG5+240] Jr. Sub. Perpetual Bonds1,7 | | GBP | | | 6,560,000 | | | | 9,288,281 | |
| AXA SA: | | | | | | | | | | |
| 3.875% [EUSA11+325] Jr. Sub. Perpetual Bonds1,2,7 | | EUR | | | 10,500,000 | | | | 12,804,794 | |
| 8.60% Sub. Nts., 12/15/30 | | | | | 5,000,000 | | | | 6,512,500 | |
| Credit Agricole Assurances SA, 4.75% [EUSA5+535] Sub. Nts., 9/27/481,2 | | EUR | | | 18,000,000 | | | | 22,962,143 | |
| Credivalores-Crediservicios SAS: | | | | | | | | | | |
| 9.75% Sr. Unsec. Nts., 7/27/223 | | | | | 790,000 | | | | 790,987 | |
| 9.75% Sr. Unsec. Nts., 7/27/222,11 | | | | | 4,535,000 | | | | 4,540,669 | |
| NN Group NV, 4.375% [EUR003M+390] Jr. Sub. Perpetual Bonds1,2,7 | | EUR | | | 8,000,000 | | | | 9,814,588 | |
| Power Finance Corp. Ltd.: | | | | | | | | | | |
| 7.42% Sr. Unsec. Nts., 6/26/20 | | INR | | | 700,000,000 | | | | 9,535,634 | |
| 8.53% Sr. Unsec. Nts., 7/24/20 | | INR | | | 330,000,000 | | | | 4,569,614 | |
|
| 24 OPPENHEIMER INTERNATIONAL BOND FUND |
| | | | | | | | | | |
| | | | | Principal Amount | | | Value | |
| Insurance (Continued) | | | | | | | | | | |
| UNIQA Insurance Group AG, 6.875% [EUR003M+598.6] Sub. Nts., 7/31/431,2 | | EUR | | | 9,300,000 | | | $ | 12,808,417 | |
| VIVAT NV, 2.375% Sr. Unsec. Nts., 5/17/242 | | EUR | | | 6,000,000 | | | | 7,321,881 | |
| | | | | | | | | | |
| | | | | | | | | 134,266,694 | |
| | | | | | | | | | | |
| Real Estate Investment Trusts (REITs)—0.1% | | | | | | | | | | |
| Banco Invex SA/Hipotecaria Credito y Casa SA de CV, 6.45% Sec. Nts., 3/13/344,8,9 | | MXN | | | 27,602,566 | | | | — | |
| Trust F/1401, 5.25% Sr. Unsec. Nts., 1/30/263 | | | | | 6,805,000 | | | | 6,813,506 | |
| | | | | | | | | | |
| | | | | | | | | 6,813,506 | |
| | | | | | | | | | | |
| Real Estate Management & Development—0.6% | | | | | | | | | | |
| Agile Group Holdings Ltd., 9.00% Sr. Sec. Nts., 5/21/202 | | | | | 10,770,000 | | | | 11,275,932 | |
| CIFI Holdings Group Co. Ltd., 7.75% Sr. Unsec. Nts., 6/5/202 | | | | | 7,030,000 | | | | 7,126,423 | |
| Country Garden Holdings Co. Ltd., 7.50% Sr. Sec. Nts., 3/9/202 | | | | | 7,030,000 | | | | 7,172,920 | |
| New Metro Global Ltd., 6.50% Sr. Unsec. Nts., 4/23/212 | | | | | 3,280,000 | | | | 3,211,313 | |
| Times China Holdings Ltd., 6.25% Sr. Sec. Nts., 1/23/202 | | | | | 3,280,000 | | | | 3,254,354 | |
| | | | | | | | | | |
| | | | | | | | | 32,040,942 | |
| | | | | | | | | | | |
| Thrifts & Mortgage Finance—0.1% | | | | | | | | | | |
| Housing Development Finance Corp. Ltd.: | | | | | | | | | | |
| 8.75% Sr. Sec. Nts., 1/13/20 | | INR | | | 330,000,000 | | | | 4,530,551 | |
| 8.95% Sec. Nts., 10/19/20 | | INR | | | 125,000,000 | | | | 1,723,439 | |
| | | | | | | | | | |
| | | | | | | | | 6,253,990 | |
| | | | | | | | | | | |
| Health Care—0.3% | | | | | | | | | | |
| Health Care Providers & Services—0.1% | | | | | | | | | | |
| OCP SA, 4.50% Sr. Unsec. Nts., 10/22/253 | | | | | 6,360,000 | | | | 6,129,450 | |
| | | | | | | | | | | |
| Life Sciences Tools & Services—0.2% | | | | | | | | | | |
| IQVIA, Inc.: | | | | | | | | | | |
| 3.25% Sr. Unsec. Nts., 3/15/253 | | EUR | | | 6,000,000 | | | | 7,131,283 | |
| 3.25% Sr. Unsec. Nts., 3/15/252 | | EUR | | | 1,000,000 | | | | 1,186,335 | |
| | | | | | | | | | |
| | | | | | | | | 8,317,618 | |
| | | | | | | | | | | |
| Industrials—0.5% | | | | | | | | | | |
| Construction & Engineering—0.1% | | | | | | | | | | |
| Fideicomiso PA Concesion Ruta al Mar, 6.75% Sr. Sec. Nts., 2/15/443,4 | | COP | | | 8,000,000,000 | | | | 2,683,483 | |
| Fideicomiso PA Costera, 6.25% Sr. Sec. Nts., 1/15/343,4 | | COP | | | 5,916,031,565 | | | | 2,058,085 | |
| Fideicomiso PA Pacifico Tres, 8.25% Sr. Sec. Nts., 1/15/3510 | | | | | 3,060,000 | | | | 3,396,621 | |
| | | | | | | | | | |
| | | | | | | | | 8,138,189 | |
| | | | | | | | | | | |
| Industrial Conglomerates—0.1% | | | | | | | | | | |
| Tupras Turkiye Petrol Rafinerileri AS, 4.50% Sr. Unsec. Nts., 10/18/243 | | | | | 3,165,000 | | | | 2,794,537 | |
|
| 25 OPPENHEIMER INTERNATIONAL BOND FUND |
CONSOLIDATED STATEMENT OF INVESTMENTS Continued
| | | | | | | | | | |
| | | | | Principal Amount | | | Value | |
| Trading Companies & Distributors—0.1% | | | | | | | | | | |
| National Bank for Agriculture & Rural Development, 8.39% Sr. Unsec. Nts., 7/19/21 | | INR | | | 300,000,000 | | | $ | 4,107,943 | |
| | | | | | | | | | | |
| Transportation Infrastructure—0.2% | | | | | | | | | | |
| DP World Ltd., 5.625% Sr. Unsec. Nts., 9/25/483 | | | | | 6,540,000 | | | | 6,491,578 | |
| GMR Hyderabad International Airport Ltd., 4.25% Sr. Sec. Nts., 10/27/273 | | | | | 6,495,000 | | | | 5,713,749 | |
| | | | | | | | | | |
| | | | | | | | | 12,205,327 | |
| | | | | | | | | | | |
| Information Technology—0.2% | | | | | | | | | | |
| Communications Equipment—0.2% | | | | | | | | | | |
| HTA Group Ltd., 9.125% Sr. Unsec. Nts., 3/8/223 | | | | | 3,170,000 | | | | 3,265,100 | |
| Virgin Media Finance plc, 4.50% Sr. Unsec. Nts., 1/15/252 | | EUR | | | 6,950,000 | | | | 8,280,213 | |
| | | | | | | | | | |
| | | | | | | | | 11,545,313 | |
| | | | | | | | | | | |
| Materials—1.2% | | | | | | | | | | |
| Chemicals—0.4% | | | | | | | | | | |
| Crown European Holdings SA, 3.375% Sr. Unsec. Nts., 5/15/253 | | EUR | | | 5,000,000 | | | | 6,019,295 | |
| ONGC Videsh Ltd., 2.75% Sr. Unsec. Nts., 7/15/212 | | EUR | | | 7,565,000 | | | | 9,242,747 | |
| Petkim Petrokimya Holding AS, 5.875% Sr. Unsec. Nts., 1/26/233 | | | | | 5,385,000 | | | | 4,986,074 | |
| Starfruit Finco BV/Starfruit US Holdco LLC: | | | | | | | | | | |
| 6.50% Sr. Unsec. Nts., 10/1/2612 | | EUR | | | 1,500,000 | | | | 1,762,256 | |
| 8.00% Sr. Unsec. Nts., 10/1/263,12 | | | | | 1,250,000 | | | | 1,268,750 | |
| | | | | | | | | | |
| | | | | | | | | 23,279,122 | |
| | | | | | | | | | | |
| Construction Materials—0.2% | | | | | | | | | | |
| CIMPOR Financial Operations BV, 5.75% Sr. Unsec. Nts., 7/17/243 | | | | | 12,810,000 | | | | 8,994,798 | |
| | | | | | | | | | | |
| Containers & Packaging—0.1% | | | | | | | | | | |
| Klabin Finance SA, 4.875% Sr. Unsec. Nts., 9/19/273 | | | | | 6,330,000 | | | | 5,609,963 | |
| | | | | | | | | | | |
| Metals & Mining—0.3% | | | | | | | | | | |
| JSW Steel Ltd., 4.75% Sr. Unsec. Nts., 11/12/192 | | | | | 6,330,000 | | | | 6,320,125 | |
| Metinvest BV, 7.75% Sr. Unsec. Nts., 4/23/233 | | | | | 3,185,000 | | | | 3,066,209 | |
| Southern Copper Corp., 7.50% Sr. Unsec. Nts., 7/27/35 | | | | | 6,105,000 | | | | 7,570,200 | |
| | | | | | | | | | |
| | | | | | | | | 16,956,534 | |
| | | | | | | | | | | |
| Paper & Forest Products—0.2% | | | | | | | | | | |
| Suzano Austria GmbH: | | | | | | | | | | |
| 5.75% Sr. Unsec. Nts., 7/14/263 | | | | | 6,815,000 | | | | 6,891,668 | |
| 6.00% Sr. Unsec. Nts., 1/15/293 | | | | | 5,095,000 | | | | 5,121,749 | |
| | | | | | | | | | |
| | | | | | | | | 12,013,417 | |
| | | | | | | | | | | |
| Telecommunication Services—1.1% | | | | | | | | | | |
| Diversified Telecommunication Services—0.7% | | | | | | | | | | |
| Axtel SAB de CV, 6.375% Sr. Unsec. Nts., 11/14/243 | | | | | 6,495,000 | | | | 6,439,533 | |
|
| 26 OPPENHEIMER INTERNATIONAL BOND FUND |
| | | | | | | | | | |
| | | | | Principal Amount | | | Value | |
| Diversified Telecommunication Services (Continued) | | | | | | | | | | |
| Telecom Italia Finance SA, 7.75% Sr. Unsec. Nts., 1/24/33 | | EUR | | | 10,000,000 | | | $ | 16,025,450 | |
| Telefonica Europe BV, 3.75% [EUSA5+385.8] Jr. Sub. Perpetual Bonds1,2,7 | | EUR | | | 13,300,000 | | | | 15,826,917 | |
| | | | | | | | | | |
| | | | | | | | | 38,291,900 | |
| | | | | | | | | | | |
| Wireless Telecommunication Services—0.4% | | | | | | | | | | |
| C&W Senior Financing DAC, 6.875% Sr. Unsec. Nts., 9/15/273 | | | | | 3,820,000 | | | | 3,820,000 | |
| Telefonica Europe BV, 5.875% [EUSA10+430.1] Jr. Sub. Perpetual Bonds1,2,7 | | EUR | | | 5,000,000 | | | | 6,413,060 | |
| VEON Holdings BV, 4.95% Sr. Unsec. Nts., 6/16/243 | | | | | 6,005,000 | | | | 5,764,560 | |
| Wind Tre SpA, 3.125% Sr. Sec. Nts., 1/20/25 | | EUR | | | 6,315,000 | | | | 6,721,338 | |
| | | | | | | | | | |
| | | | | | | | | 22,718,958 | |
| Utilities—1.7% | | | | | | | | | | |
| Electric Utilities—1.1% | | | | | | | | | | |
| Capex SA, 6.875% Sr. Unsec. Nts., 5/15/243 | | | | | 2,740,000 | | | | 2,335,850 | |
| ContourGlobal Power Holdings SA, 3.375%, 8/1/23 | | EUR | | | 10,000,000 | | | | 11,642,429 | |
| Electricite de France SA, 5.375% [EUSA12+379.4] Jr. Sub. Perpetual Bonds1,2,7 | | EUR | | | 3,100,000 | | | | 3,895,902 | |
| Enel SpA, 8.75% [USSW5+588] Jr. Sub. Nts., 9/24/731,3 | | | | | 9,000,000 | | | | 9,990,000 | |
| Eskom Holdings SOC Ltd.: | | | | | | | | | | |
| 5.75% Sr. Unsec. Nts., 1/26/213 | | | | | 6,485,000 | | | | 6,325,871 | |
| 6.75% Sr. Unsec. Nts., 8/6/233 | | | | | 15,740,000 | | | | 15,166,749 | |
| Inkia Energy Ltd., 5.875% Sr. Unsec. Nts., 11/9/273 | | | | | 5,865,000 | | | | 5,593,802 | |
| Light Servicos de Eletricidade SA/Light Energia SA, 7.25% Sr. Unsec. Nts., 5/3/233 | | | | | 6,325,000 | | | | 6,024,563 | |
| | | | | | | | | | |
| | | | | | | | | 60,975,166 | |
| | | | | | | | | | | |
| Gas Utilities—0.1% | | | | | | | | | | |
| Gas Natural Fenosa Finance BV, 4.125% [EUSA8+335.3] Jr. Sub. Perpetual Bonds1,2,7 | | EUR | | | 5,000,000 | | | | 6,107,756 | |
| | | | | | | | | | | |
| Independent Power and Renewable Electricity Producers—0.2% | | | | | | | | | | |
| AES Andres BV/Dominican Power Partners/Empresa | | | | | | | | | | |
| Generadora de Electricidad Itabo SA, 7.95% Sr. Unsec. Nts., 5/11/263 | | | | | 3,325,000 | | | | 3,449,687 | |
| Azure Power Energy Ltd., 5.50% Sr. Sec. Nts., 11/3/223 | | | | | 2,620,000 | | | | 2,494,502 | |
| Reliance Jio Infocomm Ltd., 8.32% Sec. Nts., 7/8/21 | | INR | | | 335,000,000 | | | | 4,588,599 | |
| | | | | | | | | | |
| | | | | | | | | 10,532,788 | |
| | | | | | | | | | | |
| Multi-Utilities—0.3% | | | | | | | | | | |
| Eskom Holdings SOC Ltd., 6.35% Sr. Unsec. Nts., 8/10/283 | | | | | 17,410,000 | | | | 17,372,917 | |
| | | | | | | | | | |
| Total Corporate Bonds and Notes (Cost $1,588,695,185) | | | | | | | | | 1,529,763,329 | |
| | | | | | Shares | | | | | |
| Common Stock—0.0% | | | | | | | | | | |
| JSC Astana Finance, GDR9,10,13 (Cost $0) | | | | | 868,851 | | | | — | |
|
| 27 OPPENHEIMER INTERNATIONAL BOND FUND |
CONSOLIDATED STATEMENT OF INVESTMENTS Continued
| | | | | | | | | | | | |
| | | |
| | | | | | Principal Amount | | | Value | |
| Structured Securities—0.3% | | | | | | | | | | | | |
Deutsche Bank AG, Coriolanus Ltd. Sec. Credit Linked Bonds: | | | | | | | | | | | | |
3.003%, 4/30/253,14 | | | | | | $ | 2,312,616 | | | $ | 2,050,839 | |
3.054%, 4/30/253,14 | | | | | | | 2,946,629 | | | | 2,613,084 | |
3.098%, 4/30/253,14 | | | | | | | 2,543,942 | | | | 2,255,980 | |
3.131%, 4/30/253,14 | | | | | | | 2,273,963 | | | | 2,016,562 | |
3.179%, 4/30/253,14 | | | | | | | 2,831,269 | | | | 2,510,783 | |
3.231%, 4/30/253,14 | | | | | | | 3,231,464 | | | | 2,865,677 | |
3.265%, 4/30/253,14 | | | | | | | 2,581,561 | | | | 2,289,341 | |
| 3.346%, 4/30/253,14 | | | | | | | 2,426,558 | | | | 2,151,883 | |
Morgan Stanley, Russian Federation Total Return Linked Bonds, Series 007, Cl. VR, 5.00%, 8/22/349 | | | RUB | | | | 123,753,293 | | | | 449,989 | |
| | | | | | | | | | | | |
Total Structured Securities (Cost $21,973,630) | | | | | | | | | | | 19,204,138 | |
| | | | | | | | | | | | |
| Short-Term Notes—4.3% | | | | | | | | | | | | |
Arab Republic of Egypt Treasury Bills: | | | | | | | | | | | | |
16.166%, 10/9/1814 | | | EGP | | | | 77,300,000 | | | | 4,317,598 | |
18.914%, 3/19/1914 | | | EGP | | | | 25,000,000 | | | | 1,283,008 | |
18.983%, 3/5/1914 | | | EGP | | | | 26,150,000 | | | | 1,351,736 | |
19.049%, 2/26/1914 | | | EGP | | | | 110,000,000 | | | | 5,706,631 | |
Argentine Republic Treasury Bills: | | | | | | | | | | | | |
0.00%, 1/31/1914 | | | ARS | | | | 880,000,000 | | | | 21,596,572 | |
0.00%, 12/28/1814 | | | ARS | | | | 44,500,000 | | | | 1,102,531 | |
4.34%, 11/30/1814 | | | ARS | | | | 220,000,000 | | | | 5,368,128 | |
United States Treasury Bills: | | | | | | | | | | | | |
2.118%, 12/20/1814,15,16 | | | | | | | 150,000,000 | | | | 149,292,499 | |
2.212%, 1/31/1914,16 | | | | | | | 50,000,000 | | | | 49,624,045 | |
| | | | | | | | | | | | |
Total Short-Term Notes (Cost $243,377,537) | | | | | | | | | | | 239,642,748 | |
| | | | | | | | | | | | | | | | | | | | | | | | | | | | |
| | | | | | | |
| | | Counter- party | | | | | | Exercise Price | | | Expiration Date | | | Notional
Amount
(000’s) | | | Contracts
(000’s) | | | | |
| Over-the-Counter Options Purchased—0.9% | | | | | | | | | | | | | | | | | | | | | |
| BRL Currency Call13 | | | JPM | | | | BRL | | | | 3.000 | | | | 5/16/19 | | | | BRL 5,000 | | | | BRL 3,000 | | | | 60,938 | |
| BRL Currency Call13 | | | JPM | | | | BRL | | | | 3.753 | | | | 8/22/19 | | | | BRL 900,600 | | | | BRL 431,538 | | | | 2,306,568 | |
| BRL Currency Call13 | | | GSCO-OT | | | | BRL | | | | 3.150 | | | | 5/20/19 | | | | BRL 5,000 | | | | BRL 3,500 | | | | 109,243 | |
| BRL Currency Call13 | | | GSCO-OT | | | | BRL | | | | 3.656 | | | | 6/7/19 | | | | BRL 731,200 | | | | BRL 438,720 | | | | 1,493,403 | |
| BRL Currency Call13 | | | JPM | | | | BRL | | | | 3.150 | | | | 5/20/19 | | | | BRL 5,000 | | | | BRL 3,500 | | | | 109,243 | |
| BRL Currency Call13 | | | GSCO-OT | | | | BRL | | | | 3.300 | | | | 8/28/19 | | | | BRL 5,000 | | | | BRL 5,000 | | | | 575,676 | |
|
| 28 OPPENHEIMER INTERNATIONAL BOND FUND |
| | | | | | | | | | | | | | | | | | | | | | | | | | | | |
| | | Counter-
party | | | | | | Exercise
Price | | | Expiration
Date | | | Notional Amount (000’s) | | | Contracts (000’s) | | | Value | |
| Over-the-Counter Options Purchased (Continued) | | | | | | | | | | | | | |
| BRL Currency Call13 | | | JPM | | | | BRL | | | | 3.354 | | | | 9/25/19 | | | | BRL 5,150 | | | | BRL 3,000 | | | $ | 471,656 | |
| BRL Currency Call13 | | | JPM | | | | BRL | | | | 3.200 | | | | 4/25/19 | | | | BRL 482,560 | | | | BRL 320,000 | | | | 126,400 | |
| BRL Currency Call13 | | | CITNA-B | | | | BRL | | | | 3.200 | | | | 4/25/19 | | | | BRL 512,000 | | | | BRL 320,000 | | | | 126,400 | |
| CAD Currency Call13 | | | BOA | | | | CAD | | | | 1.277 | | | | 12/21/18 | | | | CAD 250,000 | | | | CAD 250,000 | | | | 1,767,500 | |
| CAD Currency Call13 | | | BOA | | | | CAD | | | | 1.288 | | | | 11/2/18 | | | | CAD 193,200 | | | | CAD 96,600 | | | | 569,264 | |
| CLP Currency Call13 | | | GSCO-OT | | | | CLP | | | | 644.150 | | | | 10/10/18 | | | | CLP 64,415,000 | | | | CLP 45,090,500 | | | | 135,272 | |
| CLP Currency Call13 | | | GSCO-OT | | | | CLP | | | | 640.000 | | | | 10/25/18 | | | | CLP 64,000,000 | | | | CLP 48,000,000 | | | | 240,000 | |
| CLP Currency Call13 | | | GSCO-OT | | | | CLP | | | | 671.500 | | | | 12/12/18 | | | | CLP 129,599,500 | | | | CLP 93,959,600 | | | | 4,885,899 | |
| CLP Currency Call13 | | | CITNA-B | | | | CLP | | | | 650.000 | | | | 2/21/19 | | | | CLP 97,500,000 | | | | CLP 58,500,000 | | | | 2,106,000 | |
| COP Currency Call13 | | | CITNA-B | | | | COP | | | | 2848.980 | | | | 10/31/18 | | | | COP 284,898,000 | | | | COP 142,449,000 | | | | 142,449 | |
| COP Currency Call13 | | | GSCO-OT | | | | COP | | | | 2848.500 | | | | 10/26/18 | | | | COP 427,275,000 | | | | COP 256,365,000 | | | | 256,365 | |
| COP Currency Call13 | | | JPM | | | | COP | | | | 2845.750 | | | | 10/26/18 | | | | COP 284,575,000 | | | | COP 142,287,500 | | | | 142,288 | |
| COP Currency Call13 | | | JPM | | | | COP | | | | 2840.000 | | | | 10/30/18 | | | | COP 213,000,000 | | | | COP 213,000,000 | | | | 213,000 | |
| EUR Currency Put13 | | | JPM | | | | SEK | | | | 9.250 | | | | 4/29/20 | | | | EUR 10,000 | | | | EUR 10,000 | | | | 2,044,470 | |
| EUR Currency Put13 | | | BOA | | | | NOK | | | | 8.200 | | | | 11/27/19 | | | | EUR 5,000 | | | | EUR 5,000 | | | | 247,748 | |
| EUR Currency Put13 | | | JPM | | | | NOK | | | | 8.200 | | | | 11/27/19 | | | | EUR 5,000 | | | | EUR 5,000 | | | | 247,748 | |
IDR Currency Call13 | | | SCB | | | | IDR | | | | 15050.000 | | | | 9/5/19 | | | | IDR 2,558,500,000 | | | | IDR 1,279,250,000 | | | | 1,279,250 | |
|
| 29 OPPENHEIMER INTERNATIONAL BOND FUND |
CONSOLIDATED STATEMENT OF INVESTMENTS Continued
| | | | | | | | | | | | | | | | | | | | | | | | | | | | |
| | | Counter-
party | | | | | | Exercise
Price | | | Expiration
Date | | | Notional Amount (000’s) | | | Contracts (000’s) | | | Value | |
| Over-the-Counter Options Purchased (Continued) | | | | | | | | | | | | | |
| IDR Currency Call13 | | | GSCO-OT | | | | IDR | | | | 15050.000 | | | | 9/6/19 | | | | IDR 4,379,550,000 | | | | IDR 4,289,250,000 | | | $ | 4,289,250 | |
| INR Currency Call13 | | | SCB | | | | INR | | | | 70.300 | | | | 11/27/18 | | | | INR 7,030,000 | | | | INR 4,218,000 | | | | 59,052 | |
| INR Currency Call13 | | | GSCO-OT | | | | INR | | | | 65.500 | | | | 10/15/18 | | | | INR 6,550,000 | | | | INR 3,275,000 | | | | — | |
| INR Currency Call13 | | | GSCO-OT | | | | INR | | | | 69.000 | | | | 10/30/18 | | | | INR 6,900,000 | | | | INR 5,175,000 | | | | 10,350 | |
| JPY Currency Call13 | | | GSCO-OT | | | | JPY | | | | 108.150 | | | | 11/6/18 | | | | JPY 10,815,000 | | | | JPY 10,815,000 | | | | 43,260 | |
| JPY Currency Call13 | | | BOA | | | | JPY | | | | 108.000 | | | | 12/7/18 | | | | JPY 54,000,000 | | | | JPY 36,000,000 | | | | 612,000 | |
| JPY Currency Call13 | | | JPM | | | | JPY | | | | 108.500 | | | | 12/10/18 | | | | JPY 27,125,000 | | | | JPY 18,083,300 | | | | 379,749 | |
| KRW Currency Call13 | | | GSCO-OT | | | | KRW | | | | 1115.000 | | | | 11/22/18 | | | | KRW 111,500,000 | | | | KRW 55,750,000 | | | | 724,750 | |
| MXN Currency Call13 | | | CITNA-B | | | | MXN | | | | 18.578 | | | | 8/15/19 | | | | MXN 1,393,328 | | | | MXN 928,885 | | | | 1,111,875 | |
| PLN Currency Call13 | | | GSCO-OT | | | | PLN | | | | 3.489 | | | | 8/19/19 | | | | PLN 872,125 | | | | PLN 523,275 | | | | 2,528,465 | |
| PLN Currency Call13 | | | GSCO-OT | | | | PLN | | | | 3.490 | | | | 8/16/19 | | | | PLN 174,500 | | | | PLN 174,500 | | | | 842,835 | |
| PLN Currency Call13 | | | GSCO-OT | | | | PLN | | | | 3.522 | | | | 8/15/19 | | | | PLN 704,400 | | | | PLN 704,400 | | | | 3,951,684 | |
| RUB Currency Call13 | | | GSCO-OT | | | | RUB | | | | 63.979 | | | | 8/12/19 | | | | RUB 6,397,900 | | | | RUB 4,798,420 | | | | 1,617,068 | |
| RUB Currency Call13 | | | JPM | | | | RUB | | | | 59.500 | | | | 6/7/19 | | | | RUB 14,875,000 | | | | RUB 8,925,000 | | | | 606,900 | |
| RUB Currency Call13 | | | GSCO-OT | | | | RUB | | | | 59.500 | | | | 6/12/19 | | | | RUB 8,625,053 | | | | RUB 7,437,500 | | | | 528,063 | |
| S&P 500 Index Put13 | | | BOA | | | | USD | | | | 2607.210 | | | | 7/19/19 | | | | USD 133,191 | | | | USD 46 | | | | 2,810,588 | |
S&P 500 Index Put13 | | | GSCO-OT | | | | USD | | | | 2623.381 | | | | 7/31/19 | | | | USD 135,923 | | | | USD 47 | | | | 3,088,616 | |
|
| 30 OPPENHEIMER INTERNATIONAL BOND FUND |
| | | | | | | | | | | | | | | | | | | | | | | | | | | | |
| | | Counter-
party | | | | | | Exercise
Price | | | Expiration
Date | | | Notional
Amount (000’s) | | | Contracts
(000’s) | | | Value | |
| Over-the-Counter Options Purchased (Continued) | | | | | | | | | | | | | |
| SGD Currency Put13 | | | GSCO-OT | | | | CNH | | | | 4.985 | | | | 11/22/18 | | | | SGD 75,000 | | | | SGD 75,000 | | | $ | 79,770 | |
| TRY Currency Call13 | | | GSCO-OT | | | | TRY | | | | 6.062 | | | | 5/31/19 | | | | TRY 454,613 | | | | TRY 454,613 | | | | 1,235,182 | |
| TRY Currency Put13 | | | JPM | | | | TRY | | | | 4.000 | | | | 5/23/19 | | | | TRY 10,000 | | | | TRY 7,500 | | | | 54,558 | |
| TRY Currency Call13 | | | JPM | | | | TRY | | | | 4.000 | | | | 5/23/19 | | | | TRY 5,000 | | | | TRY 5,000 | | | | 36,372 | |
| ZAR Currency Call13 | | | GSCO-OT | | | | ZAR | | | | 13.597 | | | | 8/15/19 | | | | ZAR 1,019,738 | | | | ZAR 679,825 | | | | 1,332,457 | |
| ZAR Currency Call13 | | | GSCO-OT | | | | ZAR | | | | 13.250 | | | | 8/12/19 | | | | ZAR 1,325,000 | | | | ZAR 993,750 | | | | 1,431,000 | |
| ZAR Currency Call13 | | | JPM | | | | ZAR | | | | 12.525 | | | | 5/27/19 | | | | ZAR 1,252,500 | | | | ZAR 1,252,500 | | | | 519,787 | |
ZAR Currency Call13 | | | GSCO-OT | | | | ZAR | | | | 12.469 | | | | 5/27/19 | | | | ZAR 1,246,850 | | | | ZAR 935,138 | | | | 348,806 | |
| | | | | | | | | | | | | | | | | | | | | | | | | | | | |
Total Over-the-Counter Options Purchased (Cost $80,820,649) | | | | | | | | | | | | 47,899,217 | |
| | | | | | | | | | | | | | | | | | | | | | | | | | | | |
| | | Counter -party | | | Buy /Sell
Protection | | | Reference Asset | | | Fixed Rate | | | Expiration
Date | | | Notional
Amount
(000’s) | | | | |
| Over-the-Counter Credit Default Swaption Purchased—0.0% | | | | | | | | | |
| Credit Default Swap maturing 6/20/23 Call13 (Cost $204,222) | | | JPM | | | | Buy | | |
| iTraxx Europe
Crossover Series 29
Version 1 |
| | | 5.00% | | | | 10/17/18 | | | | EUR 83,300 | | | | 67,701 | |
| | | | | | | |
| | | Counter -party | | | Pay/Receive
Floating
Rate | | | Floating Rate | | | Fixed Rate | | | Expiration
Date | | | Notional
Amount
(000’s) | | | | |
| Over-the-Counter Interest Rate Swaptions Purchased—1.2% | | | | | | | | | |
| Interest Rate Swap maturing 12/24/48 Put13 | | | BAC | | | | Receive | | |
| Six-Month
EUR-EURIBOR-Reuters |
| | | 1.690 | | | | 12/20/18 | | | | EUR 21,500 | | | | 95,356 | |
| Interest Rate Swap maturing 3/17/22 Call13 | | | GSCO-OT | | | | Pay | | |
| Three-Month
USD-LIBOR-BBA |
| | | 3.082 | | | | 3/13/20 | | | | USD 500,000 | | | | 2,627,470 | |
|
| 31 OPPENHEIMER INTERNATIONAL BOND FUND |
CONSOLIDATED STATEMENT OF INVESTMENTS Continued
| | | | | | | | | | | | | | | | | | | | | | | | | | | | |
| | | Counter
-party | | | Pay/Receive
Floating
Rate | | | Floating Rate | | | Fixed
Rate | | | Expiration
Date | | | Notional
Amount
(000’s) | | | Value | |
| Over-the-Counter Interest Rate Swaptions Purchased (Continued) | | | | | | | | | |
| Interest Rate Swap maturing 4/25/21 Call13 | | | BOA | | | | Pay | | | | Three-Month USD-LIBOR-BBA | | | | 2.980% | | | | 4/23/19 | | | | USD 440,000 | | | $ | 795,071 | |
| Interest Rate Swap maturing 5/30/33 Put13 | | | BAC | | | | Receive | | | | Six-Month GBP BBA LIBOR | | | | 3.990 | | | | 5/30/23 | | | | GBP 40,415 | | | | 362,471 | |
| Interest Rate Swap maturing 6/29/48 Put13 | | | JPM | | | | Receive | | | | Six-Month EUR-EURIBOR-Reuters | | | | 2.500 | | | | 6/27/23 | | | | EUR 129,567 | | | | 6,102,579 | |
| Interest Rate Swap maturing 6/8/38 Put13 | | | JPM | | | | Receive | | | | Three- Month USD-LIBOR- BBA | | | | 3.154 | | | | 6/6/28 | | | | USD 50,000 | | | | 3,769,468 | |
| Interest Rate Swap maturing 6/8/38 Call13 | | | JPM | | | | Pay | | | | Three- Month USD-LIBOR- BBA | | | | 3.154 | | | | 6/6/28 | | | | USD 50,000 | | | | 3,499,093 | |
| Interest Rate Swap maturing 6/9/48 Put13 | | | JPM | | | | Receive | | | | Three- Month USD-LIBOR- BBA | | | | 2.946 | | | | 6/7/38 | | | | USD 50,000 | | | | 4,597,121 | |
| Interest Rate Swap maturing 6/9/48 Call13 | | | JPM | | | | Pay | | | | Three- Month USD-LIBOR- BBA | | | | 2.946 | | | | 6/7/38 | | | | USD 50,000 | | | | 4,197,756 | |
| Interest Rate Swap maturing 9/17/77 Put13 | | | JPM | | | | Receive | | | | Six-Month EUR EURIBOR | | | | 1.600 | | | | 9/15/37 | | | | EUR 160,000 | | | | 39,631,919 | |
| | | | | | | | | | | | | | | | | | | | | | | | | | | | |
Total Over-the-Counter Interest Rate Swaptions Purchased
(Cost $70,797,329) | | | | | | | | | | | | 65,678,304 | |
| | | | | | | | |
| | | Shares | | | | |
Investment Company—6.8% | | | | | | | | |
Oppenheimer Institutional Government Money Market Fund, Cl. E, 1.95%17,18 (Cost $373,232,093) | | | 373,232,093 | | | | 373,232,093 | |
Total Investments, at Value (Cost $5,922,649,188) | | | 101.1% | | | | 5,552,346,423 | |
Net Other Assets (Liabilities) | | | (1.1) | | | | (58,235,514 | ) |
Net Assets | | | 100.0% | | | $ | 5,494,110,909 | |
| | | | |
Footnotes to Consolidated Statement of Investments
1. Represents the current interest rate for a variable or increasing rate security, determined as [Referenced Rate + Basis-point spread].
|
| 32 OPPENHEIMER INTERNATIONAL BOND FUND |
Footnotes to Consolidated Statement of Investments (Continued)
2. Represents securities sold under Regulation S, which are exempt from registration under the Securities Act of 1933, as amended. These securities may not be offered or sold in the United States without and exemption from, or in a transaction not subject to, the registration requirements of the Securities Act of 1933. These securities amount to $1,581,654,383 or 28.79% of the Fund’s net assets at period end.
3. Represents securities sold under Rule 144A, which are exempt from registration under the Securities Act of 1933, as amended. These securities have been determined to be liquid under guidelines established by the Board of Trustees. These securities amount to $1,291,282,362 or 23.50% of the Fund’s net assets at period end.
4. Denotes an inflation-indexed security: coupon or principal are indexed to a consumer price index.
5. This interest rate resets periodically. Interest rate shown reflects the rate in effect at period end. The rate on this variable rate security is not based on a published reference rate and spread but is determined by the issuer or agent based on current market conditions.
6. Interest or dividend is paid-in-kind, when applicable.
7. This bond has no contractual maturity date, is not redeemable and contractually pays an indefinite stream of interest.
8. This security is not accruing income because its issuer has missed or is expected to miss interest and/or principal payments. The rate shown is the contractual interest rate. See Note 4 of the accompanying Consolidated Notes.
9. The value of this security was determined using significant unobservable inputs. See Note 3 of the accompanying Consolidated Notes.
10. Restricted security. The aggregate value of restricted securities at period end was $15,826,598, which represents 0.29% of the Fund’s net assets. See Note 4 of the accompanying Consolidated Notes. Information concerning restricted securities is as follows:
| | | | | | | | | | | | | | | | |
| Security | | Acquisition Dates | | | Cost | | | Value | | | Unrealized
Appreciation/
(Depreciation) | |
| |
Fideicomiso PA Pacifico Tres, 8.25% Sr. Sec. Nts., 1/15/35 | | | 2/12/16-3/12/18 | | | $ | 3,020,936 | | | $ | 3,396,621 | | | $ | 375,685 | |
JPMorgan Hipotecaria su Casita, 6.47% Sec. Nts., 8/26/35 | | | 3/21/07 | | | | 3,120,340 | | | | 167,417 | | | | (2,952,923) | |
JSC Astana Finance, GDR | | | 6/5/15 | | | | — | | | | — | | | | — | |
| Lloyds Banking Group plc, 6.657% [US0003M+127] Jr. Sub. Perpetual Bonds | | | 5/23/17-3/28/18 | | | | 13,461,224 | | | | 12,262,560 | | | | (1,198,664) | |
| | | | | | | | |
| | | | | | $ | 19,602,500 | | | $ | 15,826,598 | | | $ | (3,775,902) | |
| | | | | | | | |
11. All or a portion of this security is owned by the subsidiary. See Note 2 of the accompanying Consolidated Notes.
12. All or a portion of the security position is when-issued or delayed delivery to be delivered and settled after period end. See Note 4 of the accompanying Consolidated Notes.
13. Non-income producing security.
14. Zero coupon bond reflects effective yield on the original acquisition date.
15. All or a portion of the security position is held in accounts at a futures clearing merchant and pledged to cover margin requirements on open futures contracts and written options on futures, if applicable. The aggregate market value of such securities is $18,046,477. See Note 6 of the accompanying Consolidated Notes.
16. All or a portion of the security position is held in segregated accounts and pledged to cover margin requirements under certain derivative contracts. The aggregate market value of such securities is $138,511,598. See Note 6 of the accompanying Consolidated Notes.
17. Rate shown is the 7-day yield at period end.
18. Is or was an affiliate, as defined in the Investment Company Act of 1940, as amended, at or during the reporting period, by virtue of the Fund owning at least 5% of the voting securities of the issuer or as a result of the Fund and the issuer having the same investment adviser. Transactions during the reporting period in which the issuer was an affiliate are as follows:
|
| 33 OPPENHEIMER INTERNATIONAL BOND FUND |
CONSOLIDATED STATEMENT OF INVESTMENTS Continued
Footnotes to Consolidated Statement of Investments (Continued)
| | | | | | | | | | | | | | | | |
| | | Shares
September 30,
2017 | | | Gross Additions | | | Gross
Reductions | | | Shares
September 30,
2018 | |
| |
Investment Company | | | | | | | | | | | | | | | | |
Oppenheimer Institutional Government Money Market Fund, Cl. E | | | 102,075,708 | | | | 4,291,421,488 | | | | 4,020,265,103 | | | | 373,232,093 | |
| | | | |
| | | Value | | | Income | | | Realized
Gain (Loss) | | | Change in
Unrealized
Gain (Loss) | |
| |
Investment Company | | | | | | | | | | | | | | | | |
Oppenheimer Institutional Government Money Market Fund, Cl. E | | $ | 373,232,093 | | | $ | 5,935,673 | | | $ | — | | | $ | — | |
Distribution of investments representing geographic holdings, as a percentage of total investments at value, is as follows:
| | | | | | |
| Geographic Holdings (Unaudited) | | Value | | | Percent |
|
United States | | | 633,810,508 | | | 11.4% |
Mexico | | | 540,561,856 | | | 9.8 |
United Kingdom | | | 455,683,376 | | | 8.2 |
India | | | 371,983,377 | | | 6.7 |
Brazil | | | 285,468,201 | | | 5.2 |
South Africa | | | 270,666,813 | | | 4.9 |
Canada | | | 234,887,968 | | | 4.3 |
Spain | | | 232,890,682 | | | 4.1 |
Portugal | | | 196,935,149 | | | 3.6 |
Greece | | | 177,552,917 | | | 3.2 |
Indonesia | | | 172,898,495 | | | 3.1 |
Argentina | | | 151,670,834 | | | 2.7 |
Sweden | | | 125,057,712 | | | 2.3 |
France | | | 121,677,844 | | | 2.2 |
Switzerland | | | 107,555,976 | | | 1.9 |
Colombia | | | 85,538,525 | | | 1.5 |
Netherlands | | | 76,911,174 | | | 1.4 |
Australia | | | 76,527,072 | | | 1.4 |
Thailand | | | 73,422,930 | | | 1.3 |
Peru | | | 72,472,110 | | | 1.3 |
Turkey | | | 68,275,483 | | | 1.2 |
Egypt | | | 66,899,165 | | | 1.2 |
Ukraine | | | 66,037,481 | | | 1.2 |
Italy | | | 61,264,361 | | | 1.1 |
Hungary | | | 56,680,118 | | | 1.0 |
Dominican Republic | | | 55,951,413 | | | 1.0 |
Eurozone | | | 48,437,522 | | | 0.9 |
Kazakhstan | | | 39,347,042 | | | 0.7 |
|
| 34 OPPENHEIMER INTERNATIONAL BOND FUND |
| | | | | | |
| Geographic Holdings (Unaudited) (Continued) | | Value | | | Percent |
|
Singapore | | $ | 37,760,541 | | | 0.7% |
Sri Lanka | | | 37,038,118 | | | 0.7 |
Ireland | | | 33,415,980 | | | 0.6 |
Nigeria | | | 32,404,088 | | | 0.6 |
Chile | | | 32,133,153 | | | 0.6 |
Angola | | | 31,197,268 | | | 0.6 |
China | | | 30,841,339 | | | 0.6 |
Ghana | | | 29,149,340 | | | 0.5 |
Cyprus | | | 26,346,825 | | | 0.5 |
Luxembourg | | | 25,131,127 | | | 0.5 |
Poland | | | 24,955,199 | | | 0.5 |
Oman | | | 23,658,716 | | | 0.4 |
Uruguay | | | 23,431,416 | | | 0.4 |
Ecuador | | | 22,290,135 | | | 0.4 |
New Zealand | | | 20,596,463 | | | 0.4 |
Malaysia | | | 19,320,952 | | | 0.2 |
Russia | | | 14,914,657 | | | 0.2 |
Germany | | | 13,772,253 | | | 0.2 |
Austria | | | 12,808,417 | | | 0.2 |
Serbia | | | 12,303,482 | | | 0.2 |
Gabon | | | 10,788,993 | | | 0.2 |
Supranational | | | 9,826,664 | | | 0.2 |
United Arab Emirates | | | 9,823,680 | | | 0.2 |
Iraq | | | 9,557,787 | | | 0.2 |
Mongolia | | | 9,432,663 | | | 0.2 |
Belgium | | | 8,835,193 | | | 0.2 |
Senegal | | | 8,069,584 | | | 0.1 |
Hong Kong | | | 7,798,892 | | | 0.1 |
Cayman Islands | | | 7,172,920 | | | 0.1 |
Azerbaijan | | | 6,766,553 | | | 0.1 |
Honduras | | | 6,382,808 | | | 0.1 |
Morocco | | | 6,129,450 | | | 0.1 |
Bermuda | | | 5,593,802 | | | 0.1 |
Macau | | | 3,276,707 | | | 0.1 |
Mauritius | | | 3,265,100 | | | 0.1 |
Kenya | | | 3,176,057 | | | 0.1 |
Ivory Coast | | | 2,659,014 | | | 0.0 |
South Korea | | | 2,219,974 | | | 0.0 |
Japan | | | 1,035,009 | | | 0.0 |
| | | |
Total | | $ | 5,552,346,423 | | | 100.0% |
| | | |
| | | | | | | | | | | | | | | | | | | | | | | | |
Forward Currency Exchange Contracts as of September 30, 2018 | |
Counter -party | | Settlement
Month(s) | | | Currency Purchased (000’s) | | | Currency Sold (000’s) | | | Unrealized
Appreciation | | | Unrealized
Depreciation | |
| |
BAC | | | 02/2019 | | | IDR | | | 930,815,000 | | | USD | | | 64,775 | | | $ | — | | | $ | 3,600,772 | |
BAC | | | 02/2019 | | | JPY | | | 30,000,000 | | | USD | | | 274,344 | | | | — | | | | 7,257,155 | |
BAC | | | 12/2018 | | | MXN | | | 461,320 | | | USD | | | 24,122 | | | | 226,489 | | | | — | |
BAC | | | 02/2019 | | | NOK | | | 410,000 | | | USD | | | 50,708 | | | | — | | | | 25,256 | |
BAC | | | 12/2018 | | | PLN | | | 132,614 | | | USD | | | 35,780 | | | | 263,603 | | | | — | |
BAC | | | 12/2018 | | | USD | | | 60,468 | | | COP | | | 187,901,000 | | | | — | | | | 2,849,097 | |
|
| 35 OPPENHEIMER INTERNATIONAL BOND FUND |
CONSOLIDATED STATEMENT OF INVESTMENTS Continued
| | | | | | | | | | | | | | | | | | | | | | | | |
Forward Currency Exchange Contracts (Continued) | |
Counter -party | | Settlement
Month(s) | | | Currency Purchased (000’s) | | | | | Currency Sold
(000’s) | | | Unrealized
Appreciation | | | Unrealized Depreciation | |
| |
BAC | | | 02/2019 | | | USD | | | 441,595 | | | EUR | | | 384,900 | | | $ | — | | | $ | 10,640,477 | |
BAC | | | 12/2018 | | | USD | | | 57,349 | | | HUF | | | 15,958,000 | | | | — | | | | 331,520 | |
BAC | | | 12/2018 | | | USD | | | 297,906 | | | MXN | | | 5,697,360 | | | | — | | | | 2,797,172 | |
BAC | | | 12/2018 | | | USD | | | 19,413 | | | MYR | | | 80,805 | | | | — | | | | 90,899 | |
BAC | | | 12/2018 | | | USD | | | 17,213 | | | PLN | | | 63,800 | | | | — | | | | 126,818 | |
BAC | | | 12/2018 | | | USD | | | 71,998 | | | THB | | | 2,344,900 | | | | — | | | | 696,161 | |
BAC | | | 12/2018 | | | USD | | | 154 | | | TRY | | | 990 | | | | — | | | | 1,554 | |
BOA | | | 10/2018 - 02/2019 | | | AUD | | | 158,270 | | | USD | | | 115,539 | | | | — | | | | 1,075,353 | |
BOA | | | 02/2019 | | | EUR | | | 574,085 | | | USD | | | 664,992 | | | | 9,802,563 | | | | 331,459 | |
BOA | | | 12/2018 | | | INR | | | 2,302,080 | | | USD | | | 31,525 | | | | — | | | | 181,555 | |
BOA | | | 02/2019 | | | USD | | | 61,033 | | | AUD | | | 84,510 | | | | — | | | | 140,156 | |
BOA | | | 02/2019 | | | USD | | | 228,548 | | | CAD | | | 299,450 | | | | — | | | | 3,939,703 | |
BOA | | | 02/2019 | | | USD | | | 370,319 | | | EUR | | | 318,660 | | | | 12,834 | | | | 4,067,915 | |
BOA | | | 12/2018 | | | USD | | | 353,531 | | | INR | | | 25,816,600 | | | | 2,036,047 | | | | — | |
BOA | | | 02/2019 | | | USD | | | 143,000 | | | JPY | | | 15,662,999 | | | | 3,547,002 | | | | — | |
CITNA-B | | | 10/2018 - 04/2019 | | | BRL | | | 1,463,077 | | | USD | | | 367,722 | | | | 1,623,743 | | | | 7,972,742 | |
CITNA-B | | | 10/2018 | | | CLP | | | 22,806,000 | | | USD | | | 35,000 | | | | — | | | | 320,845 | |
CITNA-B | | | 02/2019 | | | EUR | | | 30,195 | | | USD | | | 35,660 | | | | — | | | | 182,485 | |
CITNA-B | | | 02/2019 | | | GBP | | | 86,000 | | | USD | | | 110,863 | | | | 2,005,307 | | | | — | |
CITNA-B | | | 10/2018 | | | UAH | | | 260,500 | | | USD | | | 9,100 | | | | — | | | | 31,722 | |
CITNA-B | | | 02/2019 | | | USD | | | 61,743 | | | AUD | | | 84,795 | | | | 364,071 | | | | — | |
CITNA-B | | | 10/2018 - 04/2019 | | | USD | | | 605,602 | | | BRL | | | 2,465,918 | | | | 2,914,773 | | | | 6,822,058 | |
CITNA-B | | | 12/2018 | | | USD | | | 23,197 | | | CLP | | | 16,215,000 | | | | — | | | | 1,475,086 | |
CITNA-B | | | 02/2019 | | | USD | | | 205,945 | | | EUR | | | 173,035 | | | | 2,897,018 | | | | 226,229 | |
CITNA-B | | | 02/2019 | | | USD | | | 12,190 | | | GBP | | | 9,270 | | | | 23,318 | | | | — | |
CITNA-B | | | 02/2019 | | | USD | | | 14,363 | | | NOK | | | 120,855 | | | | — | | | | 576,321 | |
CITNA-B | | | 12/2018 | | | USD | | | 47,367 | | | PEN | | | 158,750 | | | | — | | | | 535,986 | |
CITNA-B | | | 12/2018 | | | USD | | | 205,017 | | | ZAR | | | 3,081,400 | | | | — | | | | 10,592,837 | |
CITNA-B | | | 12/2018 | | | ZAR | | | 67,840 | | | USD | | | 4,514 | | | | 233,212 | | | | — | |
DEU | | | 02/2019 | | | EUR | | | 8,030 | | | USD | | | 9,427 | | | | 32,844 | | | | 23,981 | |
DEU | | | 02/2019 | | | GBP | | | 168,085 | | | USD | | | 215,678 | | | | 4,920,944 | | | | — | |
DEU | | | 02/2019 | | | USD | | | 421,688 | | | EUR | | | 367,070 | | | | 64,129 | | | | 9,699,128 | |
DEU | | | 02/2019 | | | USD | | | 389,744 | | | GBP | | | 303,740 | | | | — | | | | 8,892,450 | |
DEU | | | 02/2019 | | | USD | | | 19,763 | | | NZD | | | 29,800 | | | | — | | | | 10,440 | |
GSCO-OT | | | 11/2018 - 02/2019 | | | BRL | | | 278,667 | | | USD | | | 73,352 | | | | — | | | | 4,642,117 | |
GSCO-OT | | | 02/2019 | | | SEK | | | 797,770 | | | USD | | | 88,068 | | | | 2,807,941 | | | | — | |
GSCO-OT | | | 06/2019 | | | TRY | | | 76,780 | | | USD | | | 11,000 | | | | — | | | | 120,163 | |
GSCO-OT | | | 02/2019 - 06/2019 | | | USD | | | 94,050 | | | BRL | | | 366,991 | | | | 5,171,509 | | | | — | |
GSCO-OT | | | 10/2018 | | | USD | | | 72,500 | | | CLP | | | 47,143,500 | | | | 796,430 | | | | — | |
GSCO-OT | | | 02/2019 | | | USD | | | 12,500 | | | IDR | | | 185,565,000 | | | | 304,648 | | | | — | |
GSCO-OT | | | 02/2019 | | | USD | | | 115,583 | | | SEK | | | 1,047,020 | | | | — | | | | 3,685,235 | |
GSCO-OT | | | 08/2019 | | | USD | | | 32,250 | | | ZAR | | | 475,617 | | | | — | | | | 32,384 | |
HSBC | | | 02/2019 | | | EUR | | | 520 | | | USD | | | 615 | | | | — | | | | 3,623 | |
HSBC | | | 02/2019 | | | GBP | | | 5,185 | | | USD | | | 6,832 | | | | — | | | | 27,282 | |
HSBC | | | 12/2018 | | | KRW | | | 12,237,650 | | | USD | | | 10,885 | | | | 163,734 | | | | — | |
HSBC | | | 12/2018 | | | MXN | | | 300,690 | | | USD | | | 15,754 | | | | 115,994 | | | | — | |
HSBC | | | 12/2018 | | | PHP | | | 2,575,000 | | | USD | | | 47,156 | | | | 170,739 | | | | — | |
HSBC | | | 02/2019 | | | USD | | | 4,149 | | | EUR | | | 3,550 | | | | 25,595 | | | | 48,070 | |
|
| 36 OPPENHEIMER INTERNATIONAL BOND FUND |
| | | | | | | | | | | | | | | | | | | | | | | | | | |
Forward Currency Exchange Contracts (Continued) | |
Counter -party | | Settlement
Month(s) | | | Currency Purchased (000’s) | | | | | | Currency Sold (000’s) | | | Unrealized
Appreciation | | | Unrealized Depreciation | |
HSBC | | | 12/2018 | | | USD | | | 194,576 | | | | MXN | | | | 3,713,740 | | | $ | — | | | $ | 1,432,610 | |
HSBC | | | 12/2018 | | | USD | | | 18,267 | | | | SGD | | | | 25,130 | | | | — | | | | 147,987 | |
JPM | | | 02/2019 | | | AUD | | | 11,670 | | | | USD | | | | 8,432 | | | | 15,692 | | | | — | |
JPM | | | 10/2018 - 05/2019 | | | BRL | | | 327,883 | | | | USD | | | | 83,582 | | | | — | | | | 2,713,628 | |
JPM | | | 10/2018 | | | CLP | | | 24,337,500 | | | | USD | | | | 37,526 | | | | — | | | | 501,605 | |
JPM | | | 02/2019 | | | EUR | | | 17,850 | | | | USD | | | | 21,108 | | | | — | | | | 137,150 | |
JPM | | | 09/2019 | | | IDR | | | 675,250,000 | | | | USD | | | | 42,716 | | | | 116,374 | | | | — | |
JPM | | | 02/2019 | | | JPY | | | 65,173,800 | | | | USD | | | | 596,020 | | | | — | | | | 15,759,770 | |
JPM | | | 10/2018 | | | UAH | | | 335,200 | | | | USD | | | | 11,705 | | | | — | | | | 35,633 | |
JPM | | | 10/2018 - 04/2019 | | | USD | | | 151,856 | | | | BRL | | | | 614,267 | | | | 3,370,462 | | | | 3,004,439 | |
JPM | | | 02/2019 | | | USD | | | 139,144 | | | | EUR | | | | 117,760 | | | | 798,450 | | | | — | |
JPM | | | 10/2018 - 02/2019 | | | USD | | | 137,042 | | | | IDR | | | | 2,044,526,000 | | | | 1,063,732 | | | | — | |
JPM | | | 02/2019 | | | USD | | | 154,500 | | | | JPY | | | | 16,950,895 | | | | 3,584,386 | | | | — | |
JPM | | | 03/2019 | | | USD | | | 50,000 | | | | PHP | | | | 2,612,500 | | | | 2,348,381 | | | | — | |
JPM | | | 12/2018 | | | USD | | | 8,498 | | | | RUB | | | | 590,100 | | | | — | | | | 434,084 | |
JPM | | | 12/2018 - 05/2019 | | | USD | | | 142,269 | | | | TRY | | | | 940,825 | | | | 1,338,721 | | | | 6,589,786 | |
JPM | | | 08/2019 | | | ZAR | | | 475,617 | | | | USD | | | | 32,250 | | | | 32,383 | | | | — | |
SCB | | | 10/2018 | | | USD | | | 49,818 | | | | AUD | | | | 69,000 | | | | — | | | | 58,646 | |
SCB | | | 10/2018 | | | USD | | | 22,376 | | | | AUD | | | | 31,000 | | | | — | | | | 32,548 | |
SCB | | | 09/2019 | | | USD | | | 41,477 | | | | IDR | | | | 675,250,000 | | | | — | | | | 1,354,815 | |
| | | | | | | | | | | | | | | | | | | | | | |
Total Unrealized Appreciation and Depreciation | | | | | | | | | | | $ | 53,193,068 | | | $ | 126,276,907 | |
| | | | | | | | | | | | | | | | | | | | | | |
| | | | | | | | | | | | | | | | | | | | | | | | |
Futures Contracts as of September 30, 2018 | |
| Description | | Buy/Sell | | | Expiration
Date | | | Number of Contracts | | | Notional Amount (000’s) | | | Value | | | Unrealized
Appreciation/
(Depreciation) | |
| |
Canadian Bonds, 10 yr. | | | Sell | | | | 12/18/18 | | | | 1,772 | | | | CAD 184,393 | | | $ | 181,939,875 | | | $ | 2,452,923 | |
Commonwealth of Australia Treasury Bonds, 10 yr. | | | Sell | | | | 12/17/18 | | | | 1,918 | | | | AUD 178,854 | | | | 178,645,241 | | | | 208,929 | |
Euro-BTP | | | Buy | | | | 12/6/18 | | | | 250 | | | | EUR 35,751 | | | | 35,946,107 | | | | 194,902 | |
Euro-BUND | | | Sell | | | | 12/6/18 | | | | 1,577 | | | | EUR 293,284 | | | | 290,740,650 | | | | 2,543,244 | |
Euro-BUXL | | | Sell | | | | 12/6/18 | | | | 454 | | | | EUR 92,730 | | | | 91,886,982 | | | | 842,865 | |
Euro-OAT | | | Sell | | | | 12/6/18 | | | | 600 | | | | EUR 106,040 | | | | 105,225,960 | | | | 814,367 | |
United States Treasury Long Bonds | | | Sell | | | | 12/19/18 | | | | 222 | | | | USD 32,070 | | | | 31,191,000 | | | | 878,930 | |
United States Treasury Nts., 10 yr. | | | Buy | | | | 12/19/18 | | | | 1,700 | | | | USD 204,713 | | | | 201,928,125 | | | | (2,785,261) | |
| | | | | | | | | | | | | | | | | | | | | | | | |
| | | | | | | | | | | | | | | | | | | | | | $ | 5,150,899 | |
| | | | | | | | | | | | | | | | | | | | | | | | |
|
| 37 OPPENHEIMER INTERNATIONAL BOND FUND |
CONSOLIDATED STATEMENT OF INVESTMENTS Continued
| | | | | | | | | | | | | | | | | | | | | | | | | | | | |
Over-the-Counter Options Written at September 30, 2018 | |
| Description | | Counter -party | | | Exercise
Price | | | Expiration Date | | | Number of
Contracts
(000’s) | | | Notional Amount (000’s) | | | Premiums Received | | | Value | |
| |
| | | | | | | AUD | | | | | | | | AUD | | | | | | | | | | | | | |
| | | | | | | |
AUD Currency Put | | | BOA | | | | 0.736 | | | | 11/7/18 | | | | (135,870) | | | | AUD 271,739 | | | $ | 1,244,000 | | | $ | (2,152,309) | |
| |
| | | | | | | AUD | | | | | | | | AUD | | | | | | | | | | | | | |
| | | | | | | |
AUD Currency Put | | | BOA | | | | 0.730 | | | | 10/25/18 | | | | (100,000) | | | | AUD 150,000 | | | | 674,520 | | | | (1,019,200) | |
| |
| | | | | | | AUD | | | | | | | | AUD | | | | | | | | | | | | | |
| | | | | | | |
AUD Currency Put | | | SCB | | | | 0.723 | | | | 12/28/18 | | | | (150,000) | | | | AUD 150,000 | | | | 1,838,071 | | | | (1,765,500) | |
| |
| | | | | | | BRL | | | | | | | | BRL | | | | | | | | | | | | | |
| | | | | | | |
BRL Currency Put | | | GSCO-OT | | | | 3.908 | | | | 11/1/18 | | | | (390,750) | | | | BRL 390,750 | | | | 2,809,000 | | | | (5,327,876) | |
| |
| | | | | | | BRL | | | | | | | | BRL | | | | | | | | | | | | | |
| | | | | | | |
BRL Currency Put | | | GSCO-OT | | | | 4.590 | | | | 6/7/19 | | | | (550,800) | | | | BRL 918,000 | | | | 3,633,121 | | | | (3,667,777) | |
| |
| | | | | | | BRL | | | | | | | | BRL | | | | | | | | | | | | | |
| | | | | | | |
BRL Currency Put | | | JPM | | | | 5.150 | | | | 8/22/19 | | | | (592,250) | | | | BRL 1,236,000 | | | | 2,636,260 | | | | (2,315,698) | |
| |
| | | | | | | BRL | | | | | | | | BRL | | | | | | | | | | | | | |
| | | | | | | |
BRL Currency Put | | | JPM | | | | 4.500 | | | | 11/13/18 | | | | (337,500) | | | | BRL 450,000 | | | | 1,369,875 | | | | (602,100) | |
| |
| | | | | | | BRL | | | | | | | | BRL | | | | | | | | | | | | | |
| | | | | | | |
BRL Currency Put1 | | | JPM | | | | 4.800 | | | | 9/25/19 | | | | (3,000) | | | | BRL 5,150 | | | | 454,800 | | | | (64,176) | |
| |
| | | | | | | CAD | | | | | | | | CAD | | | | | | | | | | | | | |
| | | | | | | |
CAD Currency Put | | | BOA | | | | 1.333 | | | | 11/2/18 | | | | (99,938) | | | | CAD 199,875 | | | | 422,625 | | | | (79,550) | |
| |
| | | | | | | CAD | | | | | | | | CAD | | | | | | | | | | | | | |
| | | | | | | |
CAD Currency Call | | | BOA | | | | 1.254 | | | | 11/2/18 | | | | (94,013) | | | | CAD 188,025 | | | | 211,125 | | | | (72,766) | |
| |
| | | | | | | CAD | | | | | | | | CAD | | | | | | | | | | | | | |
| | | | | | | |
CAD Currency Call | | | BOA | | | | 1.240 | | | | 12/21/18 | | | | (250,000) | | | | CAD 250,000 | | | | 541,973 | | | | (455,500) | |
| |
| | | | | | | CAD | | | | | | | | CAD | | | | | | | | | | | | | |
| | | | | | | |
CAD Currency Put | | | BOA | | | | 1.323 | | | | 12/21/18 | | | | (250,000) | | | | CAD 250,000 | | | | 1,183,366 | | | | (1,315,500) | |
| |
| | | | | | | CLP | | | | | | | | CLP | | | | | | | | | | | | | |
| | | | | | | |
CLP Currency Put | | | CITNA-B | | | | 710.000 | | | | 2/21/19 | | | | (63,900,000) | | | | CLP 106,500,000 | | | | 1,117,379 | | | | (830,700) | |
| |
| | | | | | | CLP | | | | | | | | CLP | | | | | | | | | | | | | |
| | | | | | | |
CLP Currency Call | | | CITNA-B | | | | 615.000 | | | | 2/21/19 | | | | (55,350,000) | | | | CLP 92,250,000 | | | | 487,546 | | | | (553,500) | |
| |
| | | | | | | CLP | | | | | | | | CLP | | | | | | | | | | | | | |
| | | | | | | |
CLP Currency Call | | | GSCO-OT | | | | 621.150 | | | | 10/10/18 | | | | (43,480,500) | | | | CLP 62,115,000 | | | | 286,877 | | | | (43,480) | |
| |
| | | | | | | CLP | | | | | | | | CLP | | | | | | | | | | | | | |
| | | | | | | |
CLP Currency Put | | | GSCO-OT | | | | 730.000 | | | | 12/12/18 | | | | (204,290,500) | | | | CLP 281,780,000 | | | | 1,997,850 | | | | (612,872) | |
| |
| | | | | | | CLP | | | | | | | | CLP | | | | | | | | | | | | | |
| | | | | | | |
CLP Currency Call | | | GSCO-OT | | | | 616.000 | | | | 10/25/18 | | | | (46,200,000) | | | | CLP 61,600,000 | | | | 273,001 | | | | (46,200) | |
| |
| | | | | | | COP | | | | | | | | COP | | | | | | | | | | | | | |
| | | | | | | |
COP Currency Call | | | CITNA-B | | | | 2727.420 | | | | 10/31/18 | | | | (136,371,000) | | | | COP 272,742,000 | | | | 221,750 | | | | (136,371) | |
|
| 38 OPPENHEIMER INTERNATIONAL BOND FUND |
| | | | | | | | | | | | | | | | | | | | | | | | | | | | |
Over-the-Counter Options Written (Continued) | |
| Description | | Counter -party | | | Exercise
Price | | | Expiration Date | | | Number of Contracts (000’s) | | | Notional Amount (000’s) | | | Premiums Received | | | Value | |
| |
| | | | | | | COP | | | | | | | | COP | | | | | | | | | | | | | |
| | | | | | | |
COP Currency Put | | | CITNA-B | | | | 3030.760 | | | | 10/31/18 | | | | (151,538,000) | | | | COP 303,076,000 | | | $ | 508,000 | | | $ | (454,614) | |
| |
| | | | | | | COP | | | | | | | | COP | | | | | | | | | | | | | |
| | | | | | | |
COP Currency Call | | | GSCO-OT | | | | 2721.400 | | | | 10/26/18 | | | | (244,926,000) | | | | COP 408,210,000 | | | | 388,620 | | | | — | |
| |
| | | | | | | COP | | | | | | | | COP | | | | | | | | | | | | | |
| | | | | | | |
COP Currency Put | | | GSCO-OT | | | | 3040.700 | | | | 10/26/18 | | | | (273,663,000) | | | | COP 456,105,000 | | | | 1,004,310 | | | | (547,326) | |
| |
| | | | | | | COP | | | | | | | | COP | | | | | | | | | | | | | |
| | | | | | | |
COP Currency Put | | | JPM | | | | 3030.000 | | | | 10/30/18 | | | | (227,250,000) | | | | COP 227,250,000 | | | | 750,900 | | | | (454,500) | |
| |
| | | | | | | COP | | | | | | | | COP | | | | | | | | | | | | | |
| | | | | | | |
COP Currency Call | | | JPM | | | | 2719.140 | | | | 10/26/18 | | | | (135,957,000) | | | | COP 271,914,000 | | | | 232,750 | | | | — | |
| |
| | | | | | | COP | | | | | | | | COP | | | | | | | | | | | | | |
| | | | | | | |
COP Currency Put | | | JPM | | | | 3037.800 | | | | 10/26/18 | | | | (151,890,000) | | | | COP 303,780,000 | | | | 539,500 | | | | (303,780) | |
| |
| | | | | | | COP | | | | | | | | COP | | | | | | | | | | | | | |
| | | | | | | |
COP Currency Call | | | JPM | | | | 2715.000 | | | | 10/30/18 | | | | (203,625,000) | | | | COP 203,625,000 | | | | 336,600 | | | | — | |
| |
| | | | | | | EUR | | | | | | | | EUR | | | | | | | | | | | | | |
| | | | | | | |
EUR Currency Put | | | BOA | | | | 1.168 | | | | 10/23/18 | | | | (150,000) | | | | EUR 150,000 | | | | 825,239 | | | | (1,584,750) | |
| |
| | | | | | | EUR | | | | | | | | EUR | | | | | | | | | | | | | |
| | | | | | | |
EUR Currency Put | | | BOA | | | | 1.170 | | | | 6/17/19 | | | | (150,000) | | | | EUR 150,000 | | | | 3,677,490 | | | | (3,283,650) | |
| |
| | | | | | | EUR | | | | | | | | EUR | | | | | | | | | | | | | |
| | | | | | | |
EUR Currency Put | | | GSCO-OT | | | | 1.175 | | | | 10/8/18 | | | | (200,000) | | | | EUR 200,000 | | | | 2,415,650 | | | | (2,818,600) | |
| |
| | | | | | | EUR | | | | | | | | EUR | | | | | | | | | | | | | |
| | | | | | | |
EUR Currency Call | | | GSCO-OT | | | | 86.800 | | | | 12/21/18 | | | | (60,000) | | | | EUR 100,000 | | | | 1,061,055 | | | | (815,684) | |
| |
| | | | | | | EUR | | | | | | | | EUR | | | | | | | | | | | | | |
| | | | | | | |
EUR Currency Call | | | JPM | | | | 17.438 | | | | 7/10/19 | | | | (50,000) | | | | EUR 75,000 | | | | 2,747,871 | | | | (3,434,908) | |
| |
| | | | | | | IDR | | | | | | | | IDR | | | | | | | | | | | | | |
| | | | | | | |
IDR Currency Put | | | GSCO-OT | | | | 15000.000 | | | | 7/10/19 | | | | (1,500,000,000) | | | | IDR 3,005,250,000 | | | | 3,650,000 | | | | (6,000,000) | |
| |
| | | | | | | IDR | | | | | | | | IDR | | | | | | | | | | | | | |
| | | | | | | |
IDR Currency Put | | | GSCO-OT | | | | 17550.000 | | | | 9/6/19 | | | | (5,001,750,000) | | | | IDR 5,107,050,000 | | | | 8,236,500 | | | | (5,001,750) | |
| |
| | | | | | | IDR | | | | | | | | IDR | | | | | | | | | | | | | |
| | | | | | | |
IDR Currency Put | | | SCB | | | | 17550.000 | | | | 9/5/19 | | | | (1,491,750,000) | | | | IDR 2,983,500,000 | | | | 2,451,825 | | | | (1,491,750) | |
| |
| | | | | | | INR | | | | | | | | INR | | | | | | | | | | | | | |
| | | | | | | |
INR Currency Put | | | GSCO-OT | | | | 70.400 | | | | 10/30/18 | | | | (5,280,000) | | | | INR 7,040,000 | | | | 533,850 | | | | (2,566,080) | |
| |
| | | | | | | INR | | | | | | | | INR | | | | | | | | | | | | | |
| | | | | | | |
INR Currency Put | | | GSCO-OT | | | | 67.000 | | | | 10/15/18 | | | | (3,350,000) | | | | INR 6,700,000 | | | | 625,000 | | | | (3,916,150) | |
| |
| | | | | | | INR | | | | | | | | INR | | | | | | | | | | | | | |
| | | | | | | |
INR Currency Call | | | GSCO-OT | | | | 67.500 | | | | 10/30/18 | | | | (5,062,500) | | | | INR 6,750,000 | | | | 162,150 | | | | (5,063) | |
|
| 39 OPPENHEIMER INTERNATIONAL BOND FUND |
CONSOLIDATED STATEMENT OF INVESTMENTS Continued
| | | | | | | | | | | | | | | | | | | | | | | | | | | | |
Over-the-Counter Options Written (Continued) | |
| Description | | Counter -party | | | Exercise
Price | | | Expiration Date | | | Number of
Contracts
(000’s) | | | Notional Amount (000’s) | | | Premiums Received | | | Value | |
| |
| | | | | | | INR | | | | | | | | INR | | | | | | | | | | | | | |
| | | | | | | |
INR Currency Call | | | GSCO-OT | | | | 63.500 | | | | 10/15/18 | | | | (3,175,000) | | | | INR 6,350,000 | | | $ | 94,999 | | | $ | — | |
| |
| | | | | | | INR | | | | | | | | INR | | | | | | | | | | | | | |
| | | | | | | |
INR Currency Put | | | SCB | | | | 72.750 | | | | 11/27/18 | | | | (4,365,000) | | | | INR 7,275,000 | | | | 332,520 | | | | (894,825) | |
| |
| | | | | | | INR | | | | | | | | INR | | | | | | | | | | | | | |
| | | | | | | |
INR Currency Call | | | SCB | | | | 68.650 | | | | 11/27/18 | | | | (4,119,000) | | | | INR 6,865,000 | | | | 165,660 | | | | (24,714) | |
| |
| | | | | | | JPY | | | | | | | | JPY | | | | | | | | | | | | | |
| | | | | | | |
JPY Currency Call | | | BOA | | | | 105.000 | | | | 12/7/18 | | | | (35,000,000) | | | | JPY 52,500,000 | | | | 1,148,334 | | | | (175,000) | |
| |
| | | | | | | JPY | | | | | | | | JPY | | | | | | | | | | | | | |
| | | | | | | |
JPY Currency Put | | | BOA | | | | 112.000 | | | | 12/7/18 | | | | (13,067,000) | | | | JPY 19,600,000 | | | | 865,105 | | | | (2,012,318) | |
| |
| | | | | | | JPY | | | | | | | | JPY | | | | | | | | | | | | | |
| | | | | | | |
JPY Currency Call | | | GSCO-OT | | | | 103.750 | | | | 11/6/18 | | | | (15,562,500) | | | | JPY 15,562,500 | | | | 1,408,650 | | | | — | |
| |
| | | | | | | JPY | | | | | | | | JPY | | | | | | | | | | | | | |
| | | | | | | |
JPY Currency Put | | | GSCO-OT | | | | 112.250 | | | | 11/6/18 | | | | (16,837,500) | | | | JPY 16,837,500 | | | | 1,203,750 | | | | (2,138,363) | |
| |
| | | | | | | JPY | | | | | | | | JPY | | | | | | | | | | | | | |
| | | | | | | |
JPY Currency Put | | | JPM | | | | 112.500 | | | | 12/10/18 | | | | (6,562,500) | | | | JPY 9,843,750 | | | | 397,356 | | | | (853,125) | |
| |
| | | | | | | JPY | | | | | | | | JPY | | | | | | | | | | | | | |
| | | | | | | |
JPY Currency Call | | | JPM | | | | 105.500 | | | | 12/10/18 | | | | (17,583,300) | | | | JPY 26,375,000 | | | | 631,230 | | | | (123,083) | |
| |
| | | | | | | KRW | | | | | | | | KRW | | | | | | | | | | | | | |
| | | | | | | |
KRW Currency Put | | | GSCO-OT | | | | 1170.000 | | | | 11/22/18 | | | | (58,500,000) | | | | KRW 117,000,000 | | | | 444,450 | | | | (58,500) | |
| |
| | | | | | | KRW | | | | | | | | KRW | | | | | | | | | | | | | |
| | | | | | | |
KRW Currency Call | | | GSCO-OT | | | | 1078.000 | | | | 11/22/18 | | | | (53,900,000) | | | | KRW 107,800,000 | �� | | | 185,800 | | | | (107,800) | |
| |
| | | | | | | MXN | | | | | | | | MXN | | | | | | | | | | | | | |
| | | | | | | |
MXN Currency Put | | | CITNA-B | | | | 22.828 | | | | 8/15/19 | | | | (1,141,405) | | | | MXN 1,712,108 | | | | 1,282,936 | | | | (696,257) | |
| |
| | | | | | | MXN | | | | | | | | MXN | | | | | | | | | | | | | |
| | | | | | | |
MXN Currency Put | | | GSCO-OT | | | | 19.500 | | | | 1/4/19 | | | | (1,820,000) | | | | MXN 2,730,000 | | | | 1,363,413 | | | | (1,439,620) | |
| |
| | | | | | | MXN | | | | | | | | MXN | | | | | | | | | | | | | |
| | | | | | | |
MXN Currency Put | | | JPM | | | | 19.250 | | | | 12/19/18 | | | | (2,310,000) | | | | MXN 2,310,000 | | | | 1,758,360 | | | | (1,940,400) | |
| |
| | | | | | | MXN | | | | | | | | MXN | | | | | | | | | | | | | |
| | | | | | | |
MXN Currency Call | | | JPM | | | | 18.500 | | | | 12/19/18 | | | | (2,220,000) | | | | MXN 2,220,000 | | | | 1,440,240 | | | | (1,305,360) | |
| |
| | | | | | | NOK | | | | | | | | NOK | | | | | | | | | | | | | |
| | | | | | | |
NOk Currency Put | | | BOA | | | | 8.090 | | | | 12/20/18 | | | | (809,000) | | | | NOK 809,000 | | | | 1,841,500 | | | | (1,787,081) | |
| |
| | | | | | | NOK | | | | | | | | NOK | | | | | | | | | | | | | |
| | | | | | | |
NOK Currency Put | | | GSCO-OT | | | | 8.208 | | | | 12/14/18 | | | | (1,985,066) | | | | NOK 3,570,263 | | | | 4,445,776 | | | | (2,804,898) | |
| |
| | | | | | | NOK | | | | | | | | NOK | | | | | | | | | | | | | |
| | | | | | | |
NOK Currency Put | | | JPM | | | | 8.101 | | | | 12/20/18 | | | | (1,492,204) | | | | NOK 2,487,007 | | | | 3,288,327 | | | | (3,173,918) | |
|
| 40 OPPENHEIMER INTERNATIONAL BOND FUND |
| | | | | | | | | | | | | | | | | | | | | | | | | | | | |
Over-the-Counter Options Written (Continued) | |
| Description | | Counter -party | | | Exercise
Price | | | Expiration
Date | | | Number of
Contracts
(000’s) | | | Notional Amount (000’s) | | | Premiums Received | | | Value | |
| |
| | | | | | | PLN | | | | | | | | PLN | | | | | | | | | | | | | |
| | | | | | | |
PLN Currency Put | | | GSCO-OT | | | | 4.107 | | | | 8/16/19 | | | | (205,325) | | | | PLN 205,325 | | | $ | 992,900 | | | $ | (500,788) | |
| |
| | | | | | | PLN | | | | | | | | PLN | | | | | | | | | | | | | |
| | | | | | | |
PLN Currency Put | | | GSCO-OT | | | | 4.104 | | | | 8/19/19 | | | | (615,525) | | | | PLN 1,025,875 | | | | 3,006,000 | | | | (1,529,579) | |
| |
| | | | | | | PLN | | | | | | | | PLN | | | | | | | | | | | | | |
| | | | | | | |
PLN Currency Put | | | GSCO-OT | | | | 3.670 | | | | 12/21/18 | | | | (734,000) | | | | PLN 734,000 | | | | 3,512,600 | | | | (3,784,504) | |
| |
| | | | | | | PLN | | | | | | | | PLN | | | | | | | | | | | | | |
| | | | | | | |
PLN Currency Put | | | GSCO-OT | | | | 4.164 | | | | 8/15/19 | | | | (832,800) | | | | PLN 832,800 | | | | 3,742,600 | | | | (1,712,237) | |
| |
| | | | | | | RUB | | | | | | | | RUB | | | | | | | | | | | | | |
| | | | | | | |
RUB Currency Put | | | GSCO-OT | | | | 83.540 | | | | 8/12/19 | | | | (6,265,500) | | | | RUB 8,354,000 | | | | 1,578,975 | | | | (971,153) | |
| |
| | | | | | | RUB | | | | | | | | RUB | | | | | | | | | | | | | |
| | | | | | | |
RUB Currency Put | | | GSCO-OT | | | | 70.000 | | | | 6/12/19 | | | | (8,750,000) | | | | RUB 10,147,121 | | | | 3,986,375 | | | | (4,147,500) | |
| |
| | | | | | | RUB | | | | | | | | RUB | | | | | | | | | | | | | |
| | | | | | | |
RUB Currency Put | | | JPM | | | | 70.000 | | | | 6/7/19 | | | | (10,500,000) | | | | RUB 17,500,000 | | | | 4,208,369 | | | | (4,893,000) | |
| |
| | | | | | | USD | | | | | | | | USD | | | | | | | | | | | | | |
| | | | | | | |
S&P 500 Index Put | | | BOA | | | | 2242.760 | | | | 7/19/19 | | | | (46) | | | | USD 133,191 | | | | 1,750,822 | | | | (1,130,063) | |
| |
| | | | | | | USD | | | | | | | | USD | | | | | | | | | | | | | |
| | | | | | | |
S&P 500 Index Put | | | GSCO-OT | | | | 2256.672 | | | | 7/31/19 | | | | (47) | | | | USD 135,923 | | | | 1,911,829 | | | | (1,260,850) | |
| |
| | | | | | | SEK | | | | | | | | SEK | | | | | | | | | | | | | |
| | | | | | | |
SEK Currency Put | | | GSCO-OT | | | | 8.606 | | | | 11/22/18 | | | | (1,161,700) | | | | SEK 2,323,485 | | | | 3,976,414 | | | | (4,227,426) | |
| |
| | | | | | | SEK | | | | | | | | SEK | | | | | | | | | | | | | |
| | | | | | | |
SEK Currency Put | | | JPM | | | | 8.725 | | | | 12/20/18 | | | | (872,500) | | | | SEK 872,500 | | | | 1,864,481 | | | | (2,297,293) | |
| |
| | | | | | | SGD | | | | | | | | SGD | | | | | | | | | | | | | |
| | | | | | | |
SGD Currency Put | | | GSCO-OT | | | | 4.880 | | | | 11/22/18 | | | | (75,000) | | | | SGD 75,000 | | | | 104,262 | | | | (31,875) | |
| |
| | | | | | | SGD | | | | | | | | SGD | | | | | | | | | | | | | |
| | | | | | | |
SGD Currency Call | | | GSCO-OT | | | | 5.106 | | | | 11/22/18 | | | | (75,000) | | | | SGD 75,000 | | | | 219,499 | | | | (107,641) | |
| |
| | | | | | | TRY | | | | | | | | TRY | | | | | | | | | | | | | |
| | | | | | | |
TRY Currency Put | | | CITNA-B | | | | 5.000 | | | | 6/7/19 | | | | (375,000) | | | | TRY 375,000 | | | | 2,887,500 | | | | (21,852,375) | |
| |
| | | | | | | TRY | | | | | | | | TRY | | | | | | | | | | | | | |
| | | | | | | |
TRY Currency Put | | | GSCO-OT | | | | 8.937 | | | | 5/31/19 | | | | (670,275) | | | | TRY 670,275 | | | | 3,663,000 | | | | (1,988,036) | |
| |
| | | | | | | TRY | | | | | | | | TRY | | | | | | | | | | | | | |
| | | | | | | |
TRY Currency Put | | | JPM | | | | 5.164 | | | | 10/15/18 | | | | (167,830) | | | | TRY 337,209 | | | | 1,067,560 | | | | (4,985,054) | |
| |
| | | | | | | ZAR | | | | | | | | ZAR | | | | | | | | | | | | | |
| | | | | | | |
ZAR Currency Put | | | GSCO-OT | | | | 17.916 | | | | 8/12/19 | | | | (1,343,663) | | | | ZAR 1,791,550 | | | | 1,840,801 | | | | (1,541,181) | |
| |
| | | | | | | ZAR | | | | | | | | ZAR | | | | | | | | | | | | | |
| | | | | | | |
ZAR Currency Call | | | GSCO-OT | | | | 11.324 | | | | 5/27/19 | | | | (849,263) | | | | ZAR 1,132,350 | | | | 770,475 | | | | (132,485) | |
|
| 41 OPPENHEIMER INTERNATIONAL BOND FUND |
CONSOLIDATED STATEMENT OF INVESTMENTS Continued
| | | | | | | | | | | | | | | | | | | | | | | | | | | | |
Over-the-Counter Options Written (Continued) | |
| Description | | Counter -party | | | Exercise
Price | | | Expiration Date | | | Number of
Contracts
(000’s) | | | Notional
Amount
(000’s) | | | Premiums
Received | | | Value | |
| |
| | | | | | | ZAR | | | | | | | | ZAR | | | | | | | | | | | | | |
| | | | | | | |
ZAR Currency Put | | | GSCO-OT | | | | 14.646 | | | | 5/27/19 | | | | (1,098,450) | | | | ZAR 1,464,600 | | | $ | 2,010,300 | | | $ | (4,104,908) | |
| |
| | | | | | | ZAR | | | | | | | | ZAR | | | | | | | | | | | | | |
| | | | | | | |
ZAR Currency Put | | | GSCO-OT | | | | 14.626 | | | | 11/28/18 | | | | (734,931) | | | | ZAR 1,096,913 | | | | 1,494,937 | | | | (956,146) | |
| |
| | | | | | | ZAR | | | | | | | | ZAR | | | | | | | | | | | | | |
| | | | | | | |
ZAR Currency Put | | | GSCO-OT | | | | 18.208 | | | | 8/15/19 | | | | (910,400) | | | | ZAR 1,365,600 | | | | 1,895,000 | | | | (945,905) | |
| |
| | | | | | | ZAR | | | | | | | | ZAR | | | | | | | | | | | | | |
| | | | | | | |
ZAR Currency Put | | | JPM | | | | 14.700 | | | | 5/27/19 | | | | (1,470,000) | | | | ZAR 1,470,000 | | | | 2,657,000 | | | | (5,336,100) | |
| |
| | | | | | | ZAR | | | | | | | | ZAR | | | | | | | | | | | | | |
| | | | | | | |
ZAR Currency Call | | | JPM | | | | 11.380 | | | | 5/27/19 | | | | (1,138,000) | | | | ZAR 1,138,000 | | | | 1,006,000 | | | | (177,528) | |
| | | | | | | | | | | | | | | | | | | | | | | | |
Total Over-the-Counter Options Written | | | | | | | | | | | | | | | $ | 123,996,554 | | | $ | (141,888,569) | |
| | | | | | | | | | | | | | | | | | | | | | | | |
1. Knock-out option becomes ineligible for exercise if at any time spot exchange rate is less than or equal to 3.8 BRL per 1 USD. If the spot rates are equal to or greater than 4.8 BRL per 1 USD the transaction will automatically exercise and the seller will pay the settlement amount. If the spot rates are not equal to or greater than 4.8 BRL per 1 USD this a transaction will expire worthless.
| | | | | | | | | | | | | | | | | | | | | | | | | | | | |
| Centrally Cleared Credit Default Swaps at September 30, 2018 | | | | | | | | | | |
| Reference Asset | | Buy/Sell
Protection | | | Fixed
Rate | | | Maturity
Date | | | Notional Amount
(000’s) | | | Premiums
Received/(Paid) | | | Value | | | Unrealized Appreciation/ (Depreciation) | |
| |
Argentine Republic Government | | | Buy | | | | 5.000% | | | | 6/20/19 | | | | USD 39,000 | | | $ | (1,142,400) | | | $ | (538,381) | | | $ | (1,680,781 | ) |
Argentine Republic Government | | | Sell | | | | 5.000 | | | | 12/20/18 | | | | USD 13,000 | | | | (60,964) | | | | 74,554 | | | | 13,590 | |
Argentine Republic Government | | | Sell | | | | 5.000 | | | | 12/20/18 | | | | USD 13,000 | | | | (78,003) | | | | 74,554 | | | | (3,449 | ) |
China Government International | | | Buy | | | | 1.000 | | | | 12/20/23 | | | | USD 35,000 | | | | 630,374 | | | | (734,395) | | | | (104,021 | ) |
Federation of Malaysia | | | Buy | | | | 1.000 | | | | 12/20/23 | | | | USD 16,250 | | | | (112,527) | | | | (50,412) | | | | (162,939 | ) |
Federative Republic of Brazil | | | Sell | | | | 1.000 | | | | 6/20/22 | | | | USD 15,000 | | | | 928,605 | | | | (581,949) | | | | 346,656 | |
Federative Republic of Brazil | | | Buy | | | | 1.000 | | | | 12/20/23 | | | | USD 28,000 | | | | (2,559,447) | | | | 2,032,892 | | | | (526,555 | ) |
Federative Republic of Brazil | | | Buy | | | | 1.000 | | | | 12/20/23 | | | | USD 19,500 | | | | (1,760,849) | | | | 1,415,764 | | | | (345,085 | ) |
Intesa Sanpaolo SpA | | | Buy | | | | 1.000 | | | | 12/20/21 | | | | EUR 15,000 | | | | (548,711) | | | | 144,091 | | | | (404,620 | ) |
Mexico Government International | | | Buy | | | | 1.000 | | | | 12/20/23 | | | | USD 13,000 | | | | (206,922) | | | | 75,278 | | | | (131,644 | ) |
|
| 42 OPPENHEIMER INTERNATIONAL BOND FUND |
| | | | | | | | | | | | | | | | | | | | | | | | | | |
| Centrally Cleared Credit Default Swaps (Continued) | | | | | | | | | | |
| Reference Asset | | Buy/Sell Protection | | Fixed
Rate | | | Maturity Date | | | Notional
Amount
(000’s) | | | Premiums
Received/(Paid) | | | Value | | | Unrealized Appreciation/ (Depreciation) | |
| |
Petrobras Global Finance BV | | Sell | | | 1.000% | | | | 12/20/20 | | | | USD 6,000 | | | $ | 60,552 | | | $ | (116,696 | ) | | $ | (56,144 | ) |
Petrobras Global Finance BV | | Sell | | | 1.000 | | | | 12/20/20 | | | | USD 6,000 | | | | 61,070 | | | | (116,696 | ) | | | (55,626 | ) |
Republic of Italy | | Sell | | | 1.000 | | | | 12/20/21 | | | | USD 16,000 | | | | 585,507 | | | | (530,928 | ) | | | 54,579 | |
Republic Of South Africa Gover | | Buy | | | 1.000 | | | | 12/20/23 | | | | USD 7,000 | | | | (427,085 | ) | | | 327,921 | | | | (99,164 | ) |
Republic Of South Africa Gover | | Buy | | | 1.000 | | | | 12/20/23 | | | | USD 22,750 | | | | (1,598,920 | ) | | | 1,065,742 | | | | (533,178 | ) |
Russian Foreign Bond-Eurobon | | Buy | | | 1.000 | | | | 12/20/23 | | | | USD 13,000 | | | | (443,978 | ) | | | 259,755 | | | | (184,223 | ) |
Turkey Government International | | Buy | | | 1.000 | | | | 12/20/23 | | | | USD 6,500 | | | | (856,557 | ) | | | 771,252 | | | | (85,305 | ) |
United Mexican States | | Buy | | | 5.000 | | | | 12/20/23 | | | | USD 35,000 | | | | (557,097 | ) | | | 201,214 | | | | (355,883 | ) |
| | | | | | | | | | | | | | | | | | |
Total Centrally Cleared Credit Default Swaps | | | | | | | | | | | | | | $ | (8,087,352 | ) | | $ | 3,773,560 | | | $ | (4,313,792 | ) |
| | | | | | | | | | | | | | | | | | |
| | | | | | | | | | | | | | | | | | | | | | | | | | | | | | | | |
| Over-the-Counter Credit Default Swaps at September 30, 2018 | | | | | | | | | | |
Reference Asset | | Counter-
party | | | Buy/Sell Protection | | | Fixed
Rate | | | Maturity
Date | | | Notional
Amount
(000’s) | | | Premiums
Received/(Paid) | | | Value | | | Unrealized Appreciation/ (Depreciation) | |
| |
| Eskom Holdings Soc Ltd. | | | GSCOI | | | | Sell | | | | 1.000% | | | | 12/20/22 | | | | USD9,500 | | | $ | 791,100 | | | $ | (1,230,716) | | | $ | (439,616) | |
| Federative Republic of Brazil | | | BNP | | | | Sell | | | | 1.000 | | | | 12/20/18 | | | | USD 10,265 | | | | 812,157 | | | | 7,558 | | | | 819,715 | |
| Hellenic Republic Government B | | | BAC | | | | Sell | | | | 1.000 | | | | 6/20/25 | | | | USD 12,500 | | | | 1,872,869 | | | | (2,030,628) | | | | (157,759) | |
| Hellenic Republic Government B | | | BAC | | | | Sell | | | | 1.000 | | | | 6/20/25 | | | | USD 5,000 | | | | 831,849 | | | | (812,251) | | | | 19,598 | |
| Hellenic Republic Government B | | | BAC | | | | Sell | | | | 1.000 | | | | 12/20/19 | | | | USD 16,650 | | | | 249,821 | | | | (222,028) | | | | 27,793 | |
| Hellenic Republic Government B | | | BAC | | | | Sell | | | | 1.000 | | | | 12/20/25 | | | | USD 23,250 | | | | 3,615,506 | | | | (4,046,931) | | | | (431,425) | |
| Hellenic Republic Government B | | | GSCOI | | | | Sell | | | | 1.000 | | | | 6/20/25 | | | | USD 5,000 | | | | 788,898 | | | | (812,251) | | | | (23,353) | |
| ICICI Bank Ltd. | | | GSCO-OT | | | | Sell | | | | 1.000 | | | | 12/20/19 | | | | USD 10,000 | | | | 359,971 | | | | 75,619 | | | | 435,590 | |
| Idbi Bank Ltd./difc Dubai | | | BAC | | | | Sell | | | | 1.000 | | | | 12/20/22 | | | | USD 6,000 | | | | 194,525 | | | | (154,354) | | | | 40,171 | |
| Idbi Bank Ltd./difc Dubai | | | BNP | | | | Sell | | | | 1.000 | | | | 12/20/22 | | | | USD 6,000 | | | | 181,053 | | | | (154,354) | | | | 26,699 | |
| Oriental Republic of Uruguay | | | BOA | | | | Sell | | | | 1.000 | | | | 12/20/21 | | | | USD 14,802 | | | | 267,519 | | | | 233,065 | | | | 500,584 | |
State Bank of India | | | BNP | | | | Sell | | | | 1.000 | | | | 9/20/19 | | | | USD 13,035 | | | | 537,811 | | | | 89,394 | | | | 627,205 | |
| | | | | | | | | | | | | | | | | | | | | | | | |
Total Over-the-Counter Credit Default Swaps | | | | | | | | | | | | | | | $ | 10,503,079 | | | $ | (9,057,877) | | | $ | 1,445,202 | |
| | | | | | | | | | | | | | | | | | | | | | | | |
The table that follows shows the undiscounted maximum potential payment by the Fund related to selling credit protection in credit default swaps:
|
| 43 OPPENHEIMER INTERNATIONAL BOND FUND |
CONSOLIDATED STATEMENT OF INVESTMENTS Continued
| | | | | | | | | | | | |
Type of Reference Asset on which the Fund Sold Protection | | Total Maximum
Potential Payments
for Selling Credit
Protection (Undiscounted) | | | Amount
Recoverable* | | | Reference
Asset Rating
Range** | |
Non-Investment Grade Single Name Corporate Debt | | $ | 33,500,000 | | | | | | | | CCC+ to BB+ | |
Investment Grade Single Name Corporate Debt | | | 23,035,000 | | | | | | | | BBB- | |
Investment Grade Sovereign Debt | | | 30,802,000 | | | | | | | | BBB | |
Non-Investment Grade Sovereign Debt | | | 113,665,000 | | | $ | 86,500,000 | | | | B+ to BB | |
| | | | | | | | | | | | |
Total USD | | $ | 201,002,000 | | | $ | 86,500,000 | | | | | |
| | | | | | | | | | | | |
* Amounts recoverable includes potential payments from related purchased protection for instances where the Fund is the seller of protection. In addition, the Fund has no recourse provisions under the credit derivatives and holds no collateral which can offset or reduce potential payments under a triggering event.
** The period end reference asset security ratings, as rated by any rating organization, are included in the equivalent Standard & Poor’s rating category. The reference asset rating represents the likelihood of a potential credit event on the reference asset which would result in a related payment by the Fund.
| | | | | | | | | | | | | | | | | | | | | | | | | | | | | | | | |
| Centrally Cleared Interest Rate Swaps at September 30, 2018 | |
Counter- party | | Pay/Receive
Floating
Rate | | | Floating Rate | | | Fixed
Rate | | | Maturity
Date | | | Notional
Amount (000’s) | | | Premiums
Received /
(Paid) | | | Value | | | Unrealized
Appreciation/ (Depreciation) | |
| BAC | | | Receive | | | | Six-Month EUR EURIBOR | | | | 1.123% | | | | 3/8/28 | | | | EUR 8,250 | | | $ | — | | | $ | (230,680) | | | $ | (230,680) | |
| BAC | | | Receive | | | | Six-Month HUF BUBOR | | | | 0.980 | | | | 6/27/22 | | | | HUF 3,000,000 | | | | — | | | | 297,836 | | | | 297,836 | |
| BNP | | | Pay | | | | MXN TIIE BANXICO | | | | 8.000 | | | | 8/13/20 | | | | MXN 2,147,000 | | | | — | | | | 208,936 | | | | 208,936 | |
| BOA | | | Pay | | | | BBSW6M | | | | 3.015 | | | | 4/26/28 | | | | AUD 75,000 | | | | — | | | | (1,062,035) | | | | (1,062,035) | |
| BOA | | | Pay | | | | EUR006M | | | | 0.888 | | | | 8/15/27 | | | | EUR 85,300 | | | | — | | | | 187,482 | | | | 187,482 | |
| BOA | | | Pay | | | | CDOR03 | | | | 2.720 | | | | 9/21/20 | | | | CAD 664,000 | | | | — | | | | (77,774) | | | | (77,774) | |
| BOA | | | Pay | | | | MXN TIIE BANXICO | | | | 6.500 | | | | 11/24/26 | | | | MXN 1,000,000 | | | | (15) | | | | (5,215,655) | | | | (5,215,670) | |
| CITNA-B | | | Pay | | | | Six-Month HUF BUBOR | | | | 2.205 | | | | 3/8/28 | | | | HUF 2,750,000 | | | | — | | | | (512,499) | | | | (512,499) | |
| CITNA-B | | | Pay | | | | CLICP | | | | 2.901 | | | | 8/9/19 | | | | CLP 64,000,000 | | | | — | | | | (516,973) | | | | (516,973) | |
| CITNA-B | | | Receive | | | | JIBA3M | | | | 7.250 | | | | 7/10/20 | | | | ZAR 585,000 | | | | — | | | | 114,053 | | | | 114,053 | |
| CITNA-B | | | Pay | | | | Three-Month ZAR JIBAR SAFEX | | | | 8.590 | | | | 1/23/28 | | | | ZAR 508,000 | | | | — | | | | (642,870) | | | | (642,870) | |
| DEU | | | Receive | | | | JIBA3M | | | | 7.120 | | | | 6/29/19 | | | | ZAR 1,433,300 | | | | — | | | | 35,441 | | | | 35,441 | |
| DEU | | | Pay | | | | JIBA3M | | | | 8.420 | | | | 8/29/28 | | | | ZAR 556,000 | | | | — | | | | (165,238) | | | | (165,238) | |
| DEU | | | Receive | | | | JIBA3M | | | | 7.500 | | | | 8/15/20 | | | | ZAR 785,000 | | | | — | | | | (56,555) | | | | (56,555) | |
| GSCOI | | | Receive | | | | Three-Month USD BBA LIBOR | | | | 3.150 | | | | 9/21/48 | | | | USD 40,000 | | | | — | | | | 204,809 | | | | 204,809 | |
| GSCOI | | | Pay | | | | MXN TIIE BANXICO | | | | 7.760 | | | | 9/25/20 | | | | MXN 2,090,000 | | | | — | | | | (102,810) | | | | (102,810) | |
| GSCOI | | | Receive | | | | BZDI | | | | 8.235 | | | | 1/2/20 | | | | BRL 316,000 | | | | — | | | | (190,851) | | | | (190,851) | |
|
| 44 OPPENHEIMER INTERNATIONAL BOND FUND |
| | | | | | | | | | | | | | | | | | | | | | | | | | | | | | | | |
| Centrally Cleared Interest Rate Swaps (Continued) | |
Counter- party | | Pay/Receive
Floating
Rate | | | Floating Rate | | | Fixed
Rate | | | Maturity
Date | | | Notional Amount (000’s) | | | Premiums
Received /
(Paid) | | | Value | | | Unrealized
Appreciation/
(Depreciation) | |
| GSCOI | | | Pay | | | | MXN TIIE BANXICO | | | | 8.210% | | | | 1/30/19 | | | | MXN 4,139,000 | | | $ | — | | | $ | 34,303 | | | $ | 34,303 | |
| GSCOI | | | Receive | | | | BZDI | | | | 10.135 | | | | 1/2/23 | | | | BRL 135,000 | | | | — | | | | 689,024 | | | | 689,024 | |
| GSCOI | | | Pay | | | | EUR006M | | | | 1.553 | | | | 7/4/44 | | | | EUR 22,980 | | | | — | | | | 184,251 | | | | 184,251 | |
| GSCOI | | | Pay | | | | BZDI | | | | 9.825 | | | | 7/1/20 | | | | BRL 892,000 | | | | — | | | | (641,737) | | | | (641,737) | |
| GSCOI | | | Pay | | | | EUR006M | | | | 0.885 | | | | 8/15/27 | | | | EUR 57,000 | | | | — | | | | 183,271 | | | | 183,271 | |
| GSCOI | | | Receive | | | | Six-Month PLN WIBOR WIBO | | | | 2.580 | | | | 2/6/23 | | | | PLN 115,000 | | | | — | | | | 640,062 | | | | 640,062 | |
| GSCOI | | | Receive | | | | Six-Month PLN WIBOR WIBO | | | | 1.775 | | | | 10/10/21 | | | | PLN 95,000 | | | | 3,197 | | | | (81,290) | | | | (78,093) | |
| GSCOI | | | Pay | | | | Six-Month PLN WIBOR WIBO | | | | 1.780 | | | | 6/10/21 | | | | PLN 200,000 | | | | (30,941) | | | | (481,885) | | | | (512,826) | |
| GSCOI | | | Pay | | | | COOVIBR | | | | 4.610 | | | | 6/7/20 | | | | COP 146,700,000 | | | | — | | | | (151,296) | | | | (151,296) | |
| GSCOI | | | Pay | | | | BZDI | | | | 11.730 | | | | 1/2/25 | | | | BRL 124,700 | | | | — | | | | 195,387 | | | | 195,387 | |
| GSCOI | | | Pay | | | | EUR006M | | | | 0.861 | | | | 8/15/27 | | | | EUR 42,600 | | | | — | | | | (21,441) | | | | (21,441) | |
| GSCOI | | | Pay | | | | EUR006M | | | | 1.482 | | | | 7/4/44 | | | | EUR 16,700 | | | | — | | | | (166,169) | | | | (166,169) | |
| JPM | | | Pay | | | | Six-Month PLN WIBOR WIBO | | | | 2.315 | | | | 1/15/26 | | | | PLN 90,200 | | | | (23,445) | | | | (430,883) | | | | (454,328) | |
| JPM | | | Pay | | | | BZDI | | | | 10.940 | | | | 1/2/23 | | | | BRL 160,000 | | | | — | | | | (166,325) | | | | (166,325) | |
| JPM | | | Pay | | | | Six-Month PLN WIBOR WIBO | | | | 2.090 | | | | 1/11/22 | | | | PLN 160,000 | | | | — | | | | 283,185 | | | | 283,185 | |
| JPM | | | Pay | | | | BZDI | | | | 10.500 | | | | 7/1/20 | | | | BRL 880,000 | | | | — | | | | (70,770) | | | | (70,770) | |
| JPM | | | Receive | | | | Three-Month USD BBA LIBOR | | | | 2.097 | | | | 6/8/27 | | | | USD 12,000 | | | | — | | | | 842,793 | | | | 842,793 | |
| TDB | | | Receive | | | | CDOR03 | | | | 2.668 | | | | 7/24/28 | | | | CAD 175,000 | | | | — | | | | 1,525,289 | | | | 1,525,289 | |
| UBS | | | Pay | | | | NDBB3M | | | | 2.035 | | | | 9/17/20 | | | | NZD 151,300 | | | | — | | | | (67,676) | | | | (67,676) | |
| UBS | | | Pay | | | | NDBB3M | | | | 2.120 | | | | 9/30/20 | | | | NZD 148,600 | | | | — | | | | 9,190 | | | | 9,190 | |
| Total Centrally Cleared Interest Rate Swaps | | | | | | | $ | (51,204) | | | $ | (5,418,100) | | | $ | (5,469,304) | |
| | | | | | | | | | | | | | | | | | | | | | | | | | | | | | | | |
| | | | | | | | | | | | | | | | | | | | | | | | | | | | | | | | |
| Over-the-Counter Interest Rate Swaps at September 30, 2018 | | | | | |
Counter- party | | Pay/Receive
Floating
Rate | | | Floating Rate | | | Fixed
Rate | | | Maturity
Date | | | Notional Amount (000’s) | | | Premiums
Received /
(Paid) | | | Value | | | Unrealized
Appreciation/
(Depreciation) | |
| BOA | | | Pay | | | | NSERO | | | | 6.623% | | | | 3/20/20 | | | | INR 7,200,000 | | | $
| —
|
| | $ | (807,720) | | | $ | (807,720) | |
| BOA | | | Receive | | |
| Six-Month INR FBIL MIBOR
OIS Compound |
| | | 6.705 | | | | 3/8/23 | | | | INR 3,602,500 | | | | — | | | | (25,544) | | | | (25,544) | |
| BOA | | | Pay | | | | NSERO | | | | 6.700 | | | | 3/8/20 | | | | INR 15,757,500 | | | | — | | | | (1,619,092) | | | | (1,619,092) | |
| BOA | | | Receive | | |
| Six-Month INR FBIL MIBOR
OIS Compound |
| | | 6.620 | | | | 3/20/23 | | | | INR 1,620,000 | | | | — | | | | 78,951 | | | | 78,951 | |
| BOA | | | Receive | | | | KLIB3M | | | | 3.895 | | | | 8/2/23 | | | | MYR 225,000 | | | | — | | | | 50,322 | | | | 50,322 | |
GSCOI | | | Receive | | | | KWCDC | | | | 1.970 | | | | 8/22/20 | | | | KRW 150,000,000 | | | | — | | | | 59,761 | | | | 59,761 | |
|
| 45 OPPENHEIMER INTERNATIONAL BOND FUND |
CONSOLIDATED STATEMENT OF INVESTMENTS Continued
| | | | | | | | | | | | | | | | | | | | | | | | | | | | | | |
| Over-the-Counter Interest Rate Swaps (Continued) | |
Counter- party | | Pay/Receive Floating Rate | | Floating Rate | | | Fixed Rate | | | Maturity
Date | | | Notional Amount (000’s) | | | Premiums
Received /
(Paid) | | | Value | | | Unrealized
Appreciation/ (Depreciation) | |
| GSCOI | | Pay | |
| Three-Month
COP IBR OIS
Compound |
| | | 6.470% | | | | 9/29/26 | | |
| COP
55,000,000 |
| | $ | — | | | $ | 471,657 | | | $ | 471,657 | |
| GSCOI | | Pay | |
| Six-Month CLP
TNA |
| | | 3.380 | | | | 9/14/22 | | |
| CLP
13,500,000 |
| | | — | | | | (391,263) | | | | (391,263) | |
| JPM | | Pay | |
| Three-Month
COP IBR OIS
Compound |
| | | 7.300 | | | | 6/1/26 | | |
| COP
39,425,000 |
| | | — | | | | 1,080,638 | | | | 1,080,638 | |
| JPM | | Pay | |
| Three-Month
COP IBR OIS
Compound |
| | | 5.700 | | | | 3/8/19 | | |
| COP
199,335,000 |
| | | — | | | | 511,998 | | | | 511,998 | |
| JPM | | Receive | |
| Five-Year EUR
CPI EXT |
| | | 1.603 | | | | 5/24/27 | | | | EUR 50,000 | | | | — | | | | 45,807 | | | | 45,807 | |
| JPM | | Pay | |
| Five-Year EUR
CPI EXT |
| | | 2.080 | | | | 5/24/37 | | | | EUR 50,000 | | | | — | | | | (77,440) | | | | (77,440) | |
| JPM | | Pay | |
| Three-Month
COP IBR OIS
Compound |
| | | 4.990 | | | | 5/2/20 | | |
| COP
105,000,000 |
| | | — | | | | 156,454 | | | | 156,454 | |
Total Over-the-Counter Interest Rate Swaps | | | | | | | | | | | | | | | $ | — | | | $ | (465,471) | | | $ | (465,471) | |
| | | | | | | | | | | | | | | | | | | | | | | | | |
| | | | | | | | | | | | | | | | | | | | | | | | | | | | |
| Over-the-Counter Total Return Swaps at September 30, 2018 | |
| Reference Asset | | Counter-
party | | | Pay/Receive
Total
Return* | | | Floating Rate | | | Maturity Date | | | Notional Amount (000’s) | | | Value | | | Unrealized Appreciation/ (Depreciation) | |
| IBoxx EUR Liquid High Yield Index Series 1 Version 1 | | | JPM | | | | Receive | | |
| EUR-EURIBOR-
Reuters |
| | | 6/26/19 | | | | EUR 100,000 | | | $ | 709,283 | | | $ | 709,283 | |
* Fund will pay or receive the total return of the reference asset depending on whether the return is positive or negative. For contracts where the Fund has elected to receive the total return of the reference asset if positive, it will be responsible for paying the floating rate and the total return of the reference asset if negative. If the Fund has elected to pay the total return of the reference asset if positive, it will receive the floating rate and the total return of the reference asset if negative.
| | | | | | | | | | | | | | | | | | | | | | | | | | | | | | | | |
| Over-the-Counter Credit Default Swaptions Written at September 30, 2018 | | | | | | | | | |
| Description | | Counter-
party | | | Buy/Sell Protection | | | Reference Asset | | | Fixed
Rate | | | Expiration Date | | | Notional
Amount (000’s) | | | Premiums
Received | | | Value | |
| Credit Default Swap maturing 6/20/23 Call | | | JPM | | | | Sell | | |
| iTraxx Europe Crossover
Series 29 Version 1 |
| | | 5.00% | | | | 10/17/18 | | | | EUR 83,300 | | | $ | 136,148 | | | $ | (41,394) | |
|
| 46 OPPENHEIMER INTERNATIONAL BOND FUND |
| | | | | | | | | | | | | | | | | | | | | | | | | | | | | | | | | | |
| Over-the-Counter Interest Rate Swaptions Written at September 30, 2018 | |
| Description | | Counter-
party | | | Pay/
Receive
Floating
Rate | | | Floating Rate | | Fixed
Rate | | | Expiration Date | | | Notional Amount
(000’s) | | | Premiums
Received | | | Value | |
| Interest Rate Swap maturing 12/20/18 Put | | | BAC | | | | Receive | | | Six-Month EUR- | | | 1.350% | | | | 12/20/18 | | | | EUR | | | | 21,500 | | | $ | 194,669 | | | $ | (40,103) | |
| Interest Rate Swap maturing 9/2/22 Call | | | BOA | | | | Pay | | | Three-Month USD-LIBOR-BBA | | | 2.945 | | | | 8/28/20 | | | | USD | | | | 250,000 | | | | 1,900,000 | | | | (2,281,925) | |
| Interest Rate Swap maturing 3/15/29 Put | | | BOA | | | | Receive | | | Six- Month AUD- BBR- BBSW | | | 2.851 | | | | 3/14/19 | | | | AUD | | | | 75,000 | | | | 710,968 | | | | (533,734) | |
| Interest Rate Swap maturing 9/22/22 Call | | | BOA | | | | Pay | | | Three- Month USD- LIBOR-BBA | | | 3.118 | | | | 9/18/20 | | | | USD | | | | 250,000 | | | | 1,975,000 | | | | (1,880,830) | |
| Interest Rate Swap maturing 9/22/22 Put | | | BOA | | | | Receive | | | Three- Month USD- LIBOR- BBA | | | 3.118 | | | | 9/18/20 | | | | USD | | | | 250,000 | | | | 1,975,000 | | | | (1,818,448) | |
| Interest Rate Swap maturing 6/12/20 Call | | | BOA | | | | Pay | | | Three- Month USD- LIBOR- BBA | | | 2.972 | | | | 6/10/19 | | | | USD | | | | 1,000,000 | | | | 2,140,000 | | | | (2,476,240) | |
| Interest Rate Swap maturing 4/25/29 Put | | | BOA | | | | Receive | | | Three- Month USD- LIBOR- BBA | | | 2.980 | | | | 4/23/19 | | | | USD | | | | 100,000 | | | | 1,865,000 | | | | (935,686) | |
| Interest Rate Swap maturing 3/17/30 Put | | | GSCOI | | | | Receive | | | Three- Month USD- LIBOR- BBA | | | 3.072 | | | | 3/13/20 | | | | USD | | | | 112,500 | | | | 3,060,000 | | | | (2,555,964) | |
| Interest Rate Swap maturing 8/30/20 Call | | | GSCOI | | | | Pay | | | Three- Month USD-LIBOR-BBA | | | 3.018 | | | | 8/28/19 | | | | USD | | | | 500,000 | | | | 1,096,250 | | | | (1,397,185) | |
| Interest Rate Swap maturing 8/6/20 Call | | | GSCOI | | | | Pay | | | Three- Month KRW-CD- KSDA | | | 2.120 | | | | 8/5/19 | | | | KRW | | | | 300,000,000 | | | | 372,484 | | | | (218,074) | |
|
| 47 OPPENHEIMER INTERNATIONAL BOND FUND |
CONSOLIDATED STATEMENT OF INVESTMENTS Continued
| | | | | | | | | | | | | | | | | | | | | | | | | | | | | | | | | | |
| Over-the-Counter Interest Rate Swaptions Written (Continued) | |
| Description | | Counter-
party | | | Pay/ Receive
Floating Rate | | | Floating Rate | | Fixed
Rate | | | Expiration
Date | | | Notional Amount
(000’s) | | | Premiums
Received | | | Value | |
| Interest Rate Swap maturing 9/21/21 Put | | | JPM | | | | Receive | | | Three-Month USD-LIBOR- BBA | | | 3.145% | | | | 9/18/19 | | | | USD | | | | 500,000 | | | $ | 1,275,000 | | | $ | (920,440) | |
| Interest Rate Swap maturing 9/21/21 Call | | | JPM | | | | Pay | | | Three- Month USD- LIBOR- BBA | | | 3.145 | | | | 9/18/19 | | | | USD | | | | 500,000 | | | | 1,275,000 | | | | (964,090) | |
| Interest Rate Swap maturing 8/16/20 Call | | | JPM | | | | Pay | | | Three- Month USD- LIBOR- BBA | | | 3.010 | | | | 7/12/19 | | | | USD | | | | 1,000,000 | | | | 2,050,000 | | | | (2,491,910) | |
| Interest Rate Swap maturing 6/30/31 Call | | | JPM | | | | Pay | | | Six- Month EUR EURIBOR | | | 2.750 | | | | 6/28/21 | | | | EUR | | | | 657,800 | | | | 5,262,989 | | | | (4,291,165) | |
| Interest Rate Swap maturing 9/17/67 Call | | | JPM | | | | Pay | | | Six- Month EUR EURIBOR | | | 3.100 | | | | 9/15/37 | | | | EUR | | | | 200,000 | | | | 19,261,235 | | | | (15,393,386) | |
| Interest Rate Swap maturing 10/29/23 Call | | | JPM | | | | Pay | | | Six- Month PLN- WIBOR- WIBO | | | 2.520 | | | | 10/25/18 | | | | PLN | | | | 104,000 | | | | 132,376 | | | | (70,579) | |
| | | | | | | | | | | | | | | | | | | | | | | | | | | | | | |
| Total Over-the-Counter Interest Rate Swaptions Written | | | | | | | | | | | $ | 44,545,971 | | | $ | (38,269,759) | |
| | | | | | | | | | | | | | | | | | | | | | | | | | | | | | |
| | |
| Glossary: |
| Counterparty Abbreviations |
| BAC | | Barclays Bank plc |
| BNP | | BNP Paribas |
| BOA | | Bank of America NA |
| CITNA-B | | Citibank NA |
| DEU | | Deutsche Bank AG |
| GSCOI | | Goldman Sachs International |
| GSCO-OT | | Goldman Sachs Bank USA |
| HSBC | | HSBC Bank USA NA |
| JPM | | JPMorgan Chase Bank NA |
| SCB | | Standard Chartered Bank |
| UBS | | UBS AG |
|
| Currency abbreviations indicate amounts reporting in currencies |
| ARS | | Argentine Peso |
| AUD | | Australian Dollar |
| BRL | | Brazilian Real |
| CAD | | Canadian Dollar |
|
| 48 OPPENHEIMER INTERNATIONAL BOND FUND |
| | |
| Currency abbreviations indicate amounts reporting in currencies (Continued) |
| CLP | | Chilean Peso |
| COP | | Colombian Peso |
| EGP | | Egyptian Pounds |
| EUR | | Euro |
| GBP | | British Pound Sterling |
| HUF | | Hungarian Forint |
| IDR | | Indonesian Rupiah |
| INR | | Indian Rupee |
| JPY | | Japanese Yen |
| KRW | | South Korean Won |
| MXN | | Mexican Nuevo Peso |
| MYR | | Malaysian Ringgit |
| NOK | | Norwegian Krone |
| NZD | | New Zealand Dollar |
| PEN | | Peruvian New Sol |
| PHP | | Philippine Peso |
| PLN | | Polish Zloty |
| RUB | | Russian Ruble |
| SEK | | Swedish Krona |
| SGD | | Singapore Dollar |
| THB | | Thailand Baht |
| TRY | | New Turkish Lira |
| UAH | | Ukraine Hryvnia |
| UYU | | Uruguay Peso |
| ZAR | | South African Rand |
|
| Definitions |
| BADLARPP | | Argentina Deposit Rates Badlar Private Banks ARS 30 to 35 Days |
| BANXICO | | Banco de Mexico |
| BBA LIBOR | | British Bankers’ Association London - Interbank Offered Rate |
| BBR | | Bank Bill Rate |
| BBSW | | Bank Bill Swap Reference Rate (Australian Financial Market) |
| BP0003M | | ICE LIBOR GBP 3 Month |
| BP0006M | | ICE LIBOR GBP 6 Month |
| BPSW5 | | GBP Swap 5 Year |
| BTP | | Italian Treasury Bonds |
| BUBOR | | Budapest Interbank Offered Rate |
| BUND | | German Federal Obligation |
| BUXL | | German Federal Obligation |
| BZDI | | Brazil Interbank Deposit Rate |
| CD | | Certificate of Deposit |
| COOVIBR | | Colombia IBR Overnight Nominal Interbank Reference Rate |
| CPI EXT | | Excluding Tobacco Consumer Price Index |
| EUR003M | | EURIBOR 3 Month ACT/360 |
| EUR006M | | EURIBOR 6 Month ACT/360 |
| EURIBOR | | Euro Interbank Offered Rate |
| EUSA5 | | EUR Swap Annual 5 Year |
| EUSA8 | | EUR Swap Annual 8 Year |
| EUSA10 | | EUR Swap Annual 10 Year |
| EUSA11 | | EUR Swap Annual 11 Year |
|
| 49 OPPENHEIMER INTERNATIONAL BOND FUND |
CONSOLIDATED STATEMENT OF INVESTMENTS Continued
| | |
| Definitions (Continued) |
| FBIL | | Financial Benchmarks India Private Ltd. |
| GUKG5 | | UK Government Bonds 5 Year Note Generic Bid Yield |
| H15T10Y | | US Treasury Yield Curve Rate T Note Constant Maturity 10 Year |
| H15T5Y | | US Treasury Yield Curve Rate T Note Constant Maturity 5 Year |
| IBR | | Indicador Bancario de Referencia |
| ICE LIBOR | | Intercontinental Exchange Benchmark Administration-London Interbank Offered Rate |
| JIBA3M | | South Africa Johannesburg Interbank Agreed Rate 3 Month |
| JIBAR SAFEX | | South Africa Johannesburg Interbank Agreed Rate/Futures Exchange |
| LIBOR | | London Interbank Offered Rate |
| KSDA | | Korean Securities Dealers Assn. |
| MIBOR | | Mumbai Interbank Offered Rate |
| NSERO | | India Rupee Floating Rate |
| OAT | | French Government Bonds |
| OIS | | Overnight Index Swap |
| S&P | | Standard & Poor’s |
| TNA | | Non-Deliverable CLP Camara |
| US0003M | | ICE LIBOR USD 3 Month |
| US0006M | | ICE LIBOR USD 6 Month |
| USISDA05 | | USD ICE Swap Rate 11:00am NY 5 Year |
| USSW5 | | USD Swap Semi 30/360 5 Year |
| WIBOR WIBO | | Poland Warsaw Interbank Offer Bid Rate |
See accompanying Notes to Consolidated Financial Statements.
|
| 50 OPPENHEIMER INTERNATIONAL BOND FUND |
CONSOLIDATED STATEMENT OF
ASSETS AND LIABILITIES September 30, 2018
| | | | |
| |
Assets | | | | |
| Investments, at value—see accompanying consolidated statement of investments: | | | | |
| Unaffiliated companies (cost $5,549,417,095) | | $ | 5,179,114,330 | |
| Affiliated companies (cost $373,232,093) | | | 373,232,093 | |
| | | | |
| | | 5,552,346,423 | |
| |
| Cash | | | 52,963,165 | |
| |
| Cash—foreign currencies (cost $403,378) | | | 47,520 | |
| |
| Cash used for collateral on futures | | | 16,264,000 | |
| |
| Cash used for collateral on OTC derivatives | | | 42,653,203 | |
| |
| Cash used for collateral on centrally cleared swaps | | | 33,946,461 | |
| |
| Unrealized appreciation on forward currency exchange contracts | | | 53,193,068 | |
| |
| Swaps, at value (premiums received $1,977,458) | | | 3,570,507 | |
| |
| Centrally cleared swaps, at value (premiums paid $9,098,533) | | | 12,078,329 | |
| |
| Receivables and other assets: | | | | |
| Investments sold | | | 65,998,314 | |
| Interest and dividends | | | 84,698,263 | |
| Shares of beneficial interest sold | | | 5,200,020 | |
| Variation margin receivable | | | 406,375 | |
| Other | | | 689,654 | |
| | | | |
Total assets | | | 5,924,055,302 | |
| |
| Liabilities | | | | |
| Unrealized depreciation on forward currency exchange contracts | | | 126,276,907 | |
| |
| Options written, at value (premiums received $123,996,554) | | | 141,888,569 | |
| |
| Swaps, at value (premiums received $8,525,621) | | | 12,384,572 | |
| |
| Centrally cleared swaps, at value (net premiums received $959,977) | | | 13,722,869 | |
| |
| Swaptions written, at value (premiums received $44,682,119) | | | 38,311,153 | |
| |
| Payables and other liabilities: | | | | |
| Investments purchased (including $3,012,725 purchased on a when-issued or delayed delivery basis) | | | 78,205,041 | |
| Shares of beneficial interest redeemed | | | 13,414,352 | |
| Variation margin payable | | | 2,792,030 | |
| Dividends | | | 1,405,366 | |
| Trustees’ compensation | | | 370,917 | |
| Distribution and service plan fees | | | 305,476 | |
| Shareholder communications | | | 39,073 | |
| Other | | | 828,068 | |
| | | | |
Total liabilities | | | 429,944,393 | |
| |
| Net Assets | | $ | 5,494,110,909 | |
| | | | |
|
| 51 OPPENHEIMER INTERNATIONAL BOND FUND |
CONSOLIDATED STATEMENT OF
ASSETS AND LIABILITIES Continued
| | | | |
| |
| Composition of Net Assets | | | | |
| Par value of shares of beneficial interest | | $ | 1,005,639 | |
| |
| Additional paid-in capital | | | 6,098,475,304 | |
| |
| Accumulated net investment loss | | | (16,913,422) | |
| |
| Accumulated net realized loss on investments and foreign currency transactions | | | (127,993,053) | |
| |
| Net unrealized depreciation on investments and translation of assets and liabilities denominated in foreign currencies | | | (460,463,559) | |
| | | | |
| Net Assets | | $ | 5,494,110,909 | |
| | | | |
|
| |
| Net Asset Value Per Share | | | | |
| Class A Shares: | | | | |
| |
| Net asset value and redemption price per share (based on net assets of $1,082,538,675 and 198,019,518 shares of beneficial interest outstanding) | | | $5.47 | |
Maximum offering price per share (net asset value plus sales charge of 4.75% of offering price) | | | $5.74 | |
| |
| |
| Class C Shares: | | | | |
| |
| Net asset value, redemption price (excludes applicable contingent deferred sales charge) and offering price per share (based on net assets of $291,792,789 and 53,572,917 shares of beneficial interest outstanding) | | | $5.45 | |
| |
| |
| Class I Shares: | | | | |
| |
| Net asset value, redemption price and offering price per share (based on net assets of $1,404,290,693 and 257,183,480 shares of beneficial interest outstanding) | | | $5.46 | |
| |
| |
| Class R Shares: | | | | |
| |
| Net asset value, redemption price (excludes applicable contingent deferred sales charge) and offering price per share (based on net assets of $117,667,907 and 21,586,659 shares of beneficial interest outstanding) | | | $5.45 | |
| |
| |
| Class Y Shares: | | | | |
| |
| Net asset value, redemption price and offering price per share (based on net assets of $2,597,820,845 and 475,276,760 shares of beneficial interest outstanding) | | | $5.47 | |
See accompanying Notes to Consolidated Financial Statements.
|
| 52 OPPENHEIMER INTERNATIONAL BOND FUND |
CONSOLIDATED STATEMENT OF
OPERATIONS For the Year Ended September 30, 2018
| | | | |
| |
| Investment Income | | | | |
| Interest (net of foreign withholding taxes of $3,690,075) | | $ | 289,524,726 | |
| |
| Dividends—Affiliated companies | | | 5,935,673 | |
| | | | |
| Total investment income | | | 295,460,399 | |
| |
| Expenses | | | | |
| Management fees | | | 30,384,364 | |
| |
| Distribution and service plan fees: | | | | |
| Class A | | | 2,996,092 | |
| Class B1 | | | 21,073 | |
| Class C | | | 3,402,002 | |
| Class R | | | 624,123 | |
| |
| Transfer and shareholder servicing agent fees: | | | | |
| Class A | | | 2,226,018 | |
| Class B1 | | | 4,215 | |
| Class C | | | 624,914 | |
| Class I | | | 383,369 | |
| Class R | | | 229,204 | |
| Class Y | | | 4,746,240 | |
| |
| Shareholder communications: | | | | |
| Class A | | | 42,711 | |
| Class C | | | 11,513 | |
| Class I | | | 5,939 | |
| Class Y | | | 97,881 | |
| |
| Custodian fees and expenses | | | 1,049,676 | |
| |
| Borrowing fees | | | 189,235 | |
| |
| Trustees’ compensation | | | 160,593 | |
| |
| Other | | | 198,647 | |
| | | | |
| Total expenses | | | 47,397,809 | |
| Less reduction to custodian expenses | | | (26,655) | |
| Less waivers and reimbursements of expenses | | | (1,298,614) | |
| | | | |
| Net expenses | | | 46,072,540 | |
| |
| Net Investment Income | | | 249,387,859 | |
|
| 53 OPPENHEIMER INTERNATIONAL BOND FUND |
CONSOLIDATED STATEMENT OF
OPERATIONS Continued
| | | | |
| |
| Realized and Unrealized Gain (Loss) | | | | |
| Net realized gain (loss) on: | | | | |
| Investment transactions in unaffiliated companies (includes premiums on options exercised) | | | | |
| (net of foreign capital gains tax of $373,426) | | $ | (52,225,283) | |
| Option contracts written | | | (49,894,242) | |
| Futures contracts | | | (660,719) | |
| Foreign currency transactions | | | (6,484,192) | |
| Forward currency exchange contracts | | | 144,830,851 | |
| Swap contracts | | | (3,746,032) | |
| Swaption contracts written | | | 17,573,401 | |
| | | | |
| Net realized gain | | | 49,393,784 | |
| |
| Net change in unrealized appreciation/depreciation on: | | | | |
| Investment transactions in unaffiliated companies | | | (455,799,345) | |
| Translation of assets and liabilities denominated in foreign currencies | | | (1,179,308) | |
| Forward currency exchange contracts | | | (65,742,493) | |
| Futures contracts | | | 4,982,036 | |
| Option contracts written | | | (16,075,381) | |
| Swap contracts | | | (15,554,464) | |
| Swaption contracts written | | | 2,801,299 | |
| | | | |
| Net change in unrealized appreciation/depreciation | | | (546,567,656) | |
| |
| Net Decrease in Net Assets Resulting from Operations | | $ | (247,786,013) | |
| | | | |
1. Effective June 1, 2018, all Class B shares converted to Class A shares.
See accompanying Notes to Consolidated Financial Statements.
|
| 54 OPPENHEIMER INTERNATIONAL BOND FUND |
CONSOLIDATED STATEMENTS OF CHANGES IN NET ASSETS
| | | | | | | | |
| | | Year Ended
September 30, 2018 | | | Year Ended September 30, 2017 | |
| |
| Operations | | | | | | | | |
| Net investment income | | $ | 249,387,859 | | | $ | 217,597,882 | |
| |
| Net realized gain (loss) | | | 49,393,784 | | | | (68,057,795) | |
| |
| Net change in unrealized appreciation/depreciation | | | (546,567,656 | ) | | | 75,676,269 | |
| | | | |
Net increase (decrease) in net assets resulting from operations | | | (247,786,013 | ) | | | 225,216,356 | |
| |
| Dividends and/or Distributions to Shareholders | | | | | | | | |
| Dividends from net investment income: | | | | | | | | |
| Class A | | | (27,440,410 | ) | | | (24,160,850) | |
| Class B1 | | | (38,410 | ) | | | (163,103) | |
| Class C | | | (6,338,822 | ) | | | (6,044,910) | |
| Class I | | | (31,579,039 | ) | | | (25,211,947) | |
| Class R | | | (2,664,591 | ) | | | (2,185,147) | |
| Class Y | | | (62,572,404 | ) | | | (37,761,200) | |
| | | | |
| | | (130,633,676 | ) | | | (95,527,157) | |
| |
| Tax return of capital distribution: | | | | | | | | |
| Class A | | | (24,741,533 | ) | | | (39,941,064) | |
| Class B1 | | | (34,633 | ) | | | (269,630) | |
| Class C | | | (5,715,373 | ) | | | (9,993,031) | |
| Class I | | | (28,473,110 | ) | | | (41,678,665) | |
| Class R | | | (2,402,517 | ) | | | (3,612,336) | |
| Class Y | | | (56,418,149 | ) | | | (62,424,233) | |
| | | | |
| | | (117,785,315 | ) | | | (157,918,959) | |
| |
| Beneficial Interest Transactions | | | | | | | | |
| Net increase (decrease) in net assets resulting from beneficial interest transactions: | | | | | | | | |
| Class A | | | (98,153,512 | ) | | | (321,216,991) | |
| Class B1 | | | (6,285,572 | ) | | | (11,594,539) | |
| Class C | | | (50,277,315 | ) | | | (120,082,457) | |
| Class I | | | 322,995,519 | | | | (419,205,515) | |
| Class R | | | (3,074,235 | ) | | | (14,905,760) | |
| Class Y | | | 496,898,414 | | | | 270,216,022 | |
| | | | |
| | | 662,103,299 | | | | (616,789,240) | |
| |
| Net Assets | | | | | | | | |
| Total increase (decrease) | | | 165,898,295 | | | | (645,019,000) | |
| |
| Beginning of period | | | 5,328,212,614 | | | | 5,973,231,614 | |
| | | | |
| End of period (including accumulated net investment loss of $16,913,422 and $141,403,253, respectively) | | $ | 5,494,110,909 | | | $ | 5,328,212,614 | |
| | | | |
1. Effective June 1, 2018, all Class B shares converted to Class A shares.
See accompanying Notes to Consolidated Financial Statements.
|
| 55 OPPENHEIMER INTERNATIONAL BOND FUND |
CONSOLIDATED FINANCIAL HIGHLIGHTS
| | | | | | | | | | |
| Class A | | Year Ended
September
30, 2018 | | Year Ended
September
30, 2017 | | Year Ended
September
30, 2016 | | Year Ended
September
30, 2015 | | Year Ended
September
30, 2014 |
|
| Per Share Operating Data | | | | | | | | | | |
| Net asset value, beginning of period | | $5.95 | | $5.95 | | $5.62 | | $6.01 | | $6.09 |
| Income (loss) from investment operations: | | | | | | | | | | |
| Net investment income1 | | 0.25 | | 0.23 | | 0.22 | | 0.18 | | 0.19 |
| Net realized and unrealized gain (loss) | | (0.48) | | 0.03 | | 0.33 | | (0.39) | | (0.08) |
| | |
| Total from investment operations | | (0.23) | | 0.26 | | 0.55 | | (0.21) | | 0.11 |
|
| Dividends and/or distributions to shareholders: | | | | | | | | | | |
| Dividends from net investment income | | (0.13) | | (0.10) | | (0.10) | | (0.14) | | (0.07) |
| Distributions from net realized gain | | 0.00 | | 0.00 | | 0.00 | | 0.00 | | (0.00)2 |
| Tax return of capital distribution | | (0.12) | | (0.16) | | (0.12) | | (0.04) | | (0.12) |
| | |
| Total dividends and/or distributions to shareholders | | (0.25) | | (0.26) | | (0.22) | | (0.18) | | (0.19) |
|
| Net asset value, end of period | | $5.47 | | $5.95 | | $5.95 | | $5.62 | | $6.01 |
| | |
|
|
| Total Return, at Net Asset Value3 | | (4.20)% | | 4.67% | | 9.95% | | (3.57)% | | 1.86% |
|
|
| Ratios/Supplemental Data | | | | | | | | | | |
| Net assets, end of period (in thousands) | | $1,082,539 | | $1,280,770 | | $1,611,584 | | $2,010,994 | | $3,104,220 |
|
| Average net assets (in thousands) | | $1,215,253 | | $1,391,397 | | $1,753,796 | | $2,556,904 | | $4,022,858 |
|
| Ratios to average net assets:4 | | | | | | | | | | |
| Net investment income | | 4.31% | | 3.94% | | 3.78% | | 3.03% | | 3.16% |
| Expenses excluding specific expenses listed below | | 1.01% | | 1.05% | | 1.05% | | 1.02% | | 1.02% |
| Interest and fees from borrowings | | 0.00%5 | | 0.00%5 | | 0.00%5 | | 0.00%5 | | 0.00% |
| | |
| Total expenses6 | | 1.01% | | 1.05% | | 1.05% | | 1.02% | | 1.02% |
| Expenses after payments, waivers and/or reimbursements and reduction to custodian expenses | | 0.99% | | 1.02% | | 1.03% | | 1.02%7 | | 1.02%7 |
|
| Portfolio turnover rate | | 115% | | 96% | | 128% | | 111% | | 108% |
1. Per share amounts calculated based on the average shares outstanding during the period.
2. Less than $0.005 per share.
3. Assumes an initial investment on the business day before the first day of the fiscal period, with all dividends and distributions reinvested in additional shares on the reinvestment date, and redemption at the net asset value calculated on the last business day of the fiscal period. Sales charges are not reflected in the total returns. Total returns are not annualized for periods less than one full year. Returns do not reflect the deduction of taxes that a shareholder would pay on fund distributions or the redemption of fund shares.
4. Annualized for periods less than one full year.
5. Less than 0.005%.
6. Total expenses including indirect expenses from affiliated fund fees and expenses were as follows:
| | | | | | | | |
| Year Ended September 30, 2018 | | | 1.02 | % | | | | |
| Year Ended September 30, 2017 | | | 1.06 | % | | | | |
| Year Ended September 30, 2016 | | | 1.05 | % | | | | |
| Year Ended September 30, 2015 | | | 1.02 | % | | | | |
| Year Ended September 30, 2014 | | | 1.02 | % | | | | |
7. Waiver was less than 0.005%.
See accompanying Notes to Consolidated Financial Statements.
|
| 56 OPPENHEIMER INTERNATIONAL BOND FUND |
| | | | | | | | | | |
| Class C | | Year Ended
September
30, 2018 | | Year Ended
September
30, 2017 | | Year Ended
September
30, 2016 | | Year Ended
September
30, 2015 | | Year Ended
September
30, 2014 |
|
| Per Share Operating Data | | | | | | | | | | |
| Net asset value, beginning of period | | $5.93 | | $5.92 | | $5.60 | | $5.99 | | $6.07 |
|
| Income (loss) from investment operations: | | | | | | | | | | |
| Net investment income1 | | 0.21 | | 0.18 | | 0.17 | | 0.13 | | 0.15 |
| Net realized and unrealized gain (loss) | | (0.48) | | 0.05 | | 0.32 | | (0.38) | | (0.08) |
| | |
| Total from investment operations | | (0.27) | | 0.23 | | 0.49 | | (0.25) | | 0.07 |
|
| Dividends and/or distributions to shareholders: | | | | | | | | | | |
| Dividends from net investment income | | (0.11) | | (0.08) | | (0.07) | | (0.11) | | (0.06) |
| Distributions from net realized gain | | 0.00 | | 0.00 | | 0.00 | | 0.00 | | (0.00)2 |
| Tax return of capital distribution | | (0.10) | | (0.14) | | (0.10) | | (0.03) | | (0.09) |
| | |
| Total dividends and/or distributions to shareholders | | (0.21) | | (0.22) | | (0.17) | | (0.14) | | (0.15) |
|
| Net asset value, end of period | | $5.45 | | $5.93 | | $5.92 | | $5.60 | | $5.99 |
| | |
|
|
| Total Return, at Net Asset Value3 | | (4.79)% | | 3.89% | | 8.97% | | (4.31)% | | 1.13% |
|
|
| Ratios/Supplemental Data | | | | | | | | | | |
| Net assets, end of period (in thousands) | | $291,793 | | $369,679 | | $493,319 | | $585,788 | | $858,281 |
|
| Average net assets (in thousands) | | $340,435 | | $414,939 | | $524,002 | | $713,793 | | $1,033,206 |
|
| Ratios to average net assets:4 | | | | | | | | | | |
| Net investment income | | 3.56% | | 3.20% | | 3.04% | | 2.30% | | 2.45% |
| Expenses excluding specific expenses listed below | | 1.76% | | 1.80% | | 1.80% | | 1.77% | | 1.74% |
| Interest and fees from borrowings | | 0.00%5 | | 0.00%5 | | 0.00%5 | | 0.00%5 | | 0.00% |
| | |
| Total expenses6 | | 1.76% | | 1.80% | | 1.80% | | 1.77% | | 1.74% |
| Expenses after payments, waivers and/or reimbursements and reduction to custodian expenses | | 1.74% | | 1.77% | | 1.78% | | 1.77%7 | | 1.74%7 |
|
| Portfolio turnover rate | | 115% | | 96% | | 128% | | 111% | | 108% |
1. Per share amounts calculated based on the average shares outstanding during the period.
2. Less than $0.005 per share.
3. Assumes an initial investment on the business day before the first day of the fiscal period, with all dividends and distributions reinvested in additional shares on the reinvestment date, and redemption at the net asset value calculated on the last business day of the fiscal period. Sales charges are not reflected in the total returns. Total returns are not annualized for periods less than one full year. Returns do not reflect the deduction of taxes that a shareholder would pay on fund distributions or the redemption of fund shares.
4. Annualized for periods less than one full year.
5. Less than 0.005%.
6. Total expenses including indirect expenses from affiliated fund fees and expenses were as follows:
| | | | | | | | |
| Year Ended September 30, 2018 | | | 1.77 | % | | | | |
| Year Ended September 30, 2017 | | | 1.81 | % | | | | |
| Year Ended September 30, 2016 | | | 1.80 | % | | | | |
| Year Ended September 30, 2015 | | | 1.77 | % | | | | |
| Year Ended September 30, 2014 | | | 1.74 | % | | | | |
7. Waiver was less than 0.005%.
See accompanying Notes to Consolidated Financial Statements.
|
| 57 OPPENHEIMER INTERNATIONAL BOND FUND |
CONSOLIDATED FINANCIAL HIGHLIGHTS Continued
| | | | | | | | | | |
| Class I | | Year Ended
September
30, 2018 | | Year Ended
September
30, 2017 | | Year Ended
September
30, 2016 | | Year Ended
September
30, 2015 | | Year Ended
September
30, 2014 |
|
| Per Share Operating Data | | | | | | | | | | |
| Net asset value, beginning of period | | $5.94 | | $5.94 | | $5.61 | | $6.00 | | $6.08 |
| Income (loss) from investment operations: | | | | | | | | | | |
| Net investment income1 | | 0.27 | | 0.25 | | 0.24 | | 0.21 | | 0.22 |
| Net realized and unrealized gain (loss) | | (0.48) | | 0.04 | | 0.33 | | (0.39) | | (0.08) |
| | |
| Total from investment operations | | (0.21) | | 0.29 | | 0.57 | | (0.18) | | 0.14 |
|
| Dividends and/or distributions to shareholders: | | | | | | | | | | |
| Dividends from net investment income | | (0.14) | | (0.11) | | (0.10) | | (0.16) | | (0.09) |
| Distributions from net realized gain | | 0.00 | | 0.00 | | 0.00 | | 0.00 | | (0.00)2 |
| Tax return of capital distribution | | (0.13) | | (0.18) | | (0.14) | | (0.05) | | (0.13) |
| | |
| Total dividends and/or distributions to shareholders | | (0.27) | | (0.29) | | (0.24) | | (0.21) | | (0.22) |
|
| Net asset value, end of period | | $5.46 | | $5.94 | | $5.94 | | $5.61 | | $6.00 |
| | |
|
|
| Total Return, at Net Asset Value3 | | (3.83)% | | 5.12% | | 10.45% | | (3.16)% | | 2.32% |
|
|
| Ratios/Supplemental Data | | | | | | | | | | |
| Net assets, end of period (in thousands) | | $1,404,290 | | $1,194,372 | | $1,631,480 | | $1,154,225 | | $779,478 |
|
| Average net assets (in thousands) | | $1,278,527 | | $1,327,997 | | $1,406,045 | | $918,521 | | $611,312 |
|
| Ratios to average net assets:4 | | | | | | | | | | |
| Net investment income | | 4.71% | | 4.37% | | 4.28% | | 3.54% | | 3.58% |
| Expenses excluding specific expenses listed below | | 0.60% | | 0.61% | | 0.60% | | 0.57% | | 0.56% |
| Interest and fees from borrowings | | 0.00%5 | | 0.00%5 | | 0.00%5 | | 0.00%5 | | 0.00% |
| | |
| Total expenses6 | | 0.60% | | 0.61% | | 0.60% | | 0.57% | | 0.56% |
| Expenses after payments, waivers and/or reimbursements and reduction to custodian expenses | | 0.58% | | 0.59% | | 0.58% | | 0.57%7 | | 0.56%7 |
|
| Portfolio turnover rate | | 115% | | 96% | | 128% | | 111% | | 108% |
1. Per share amounts calculated based on the average shares outstanding during the period.
2. Less than $0.005 per share.
3. Assumes an initial investment on the business day before the first day of the fiscal period, with all dividends and distributions reinvested in additional shares on the reinvestment date, and redemption at the net asset value calculated on the last business day of the fiscal period. Sales charges are not reflected in the total returns. Total returns are not annualized for periods less than one full year. Returns do not reflect the deduction of taxes that a shareholder would pay on fund distributions or the redemption of fund shares.
4. Annualized for periods less than one full year.
5. Less than 0.005%.
6. Total expenses including indirect expenses from affiliated fund fees and expenses were as follows:
| | | | | | | | |
| Year Ended September 30, 2018 | | | 0.61 | % | | | | |
| Year Ended September 30, 2017 | | | 0.62 | % | | | | |
| Year Ended September 30, 2016 | | | 0.60 | % | | | | |
| Year Ended September 30, 2015 | | | 0.57 | % | | | | |
| Year Ended September 30, 2014 | | | 0.56 | % | | | | |
7. Waiver was less than 0.005%.
See accompanying Notes to Consolidated Financial Statements.
|
| 58 OPPENHEIMER INTERNATIONAL BOND FUND |
| | | | | | | | | | | | | | | | | | | | |
| Class R | | Year Ended
September
30, 2018 | | | Year Ended
September
30, 2017 | | | Year Ended
September
30, 2016 | | | Year Ended
September
30, 2015 | | | Year Ended
September
30, 2014 | |
| |
| Per Share Operating Data | | | | | | | | | | | | | | | | | | | | |
| Net asset value, beginning of period | | | $5.93 | | | | $5.93 | | | | $5.60 | | | | $5.99 | | | | $6.07 | |
| |
| Income (loss) from investment operations: | | | | | | | | | | | | | | | | | | | | |
| Net investment income1 | | | 0.24 | | | | 0.21 | | | | 0.20 | | | | 0.16 | | | | 0.17 | |
| Net realized and unrealized gain (loss) | | | (0.49) | | | | 0.04 | | | | 0.33 | | | | (0.39) | | | | (0.08) | |
| | | | |
| Total from investment operations | | | (0.25) | | | | 0.25 | | | | 0.53 | | | | (0.23) | | | | 0.09 | |
| |
| Dividends and/or distributions to shareholders: | | | | | | | | | | | | | | | | | | | | |
| Dividends from net investment income | | | (0.12) | | | | (0.09) | | | | (0.09) | | | | (0.12) | | | | (0.07) | |
| Distributions from net realized gain | | | 0.00 | | | | 0.00 | | | | 0.00 | | | | 0.00 | | | | (0.00)2 | |
| Tax return of capital distribution | | | (0.11) | | | | (0.16) | | | | (0.11) | | | | (0.04) | | | | (0.10) | |
| | | | |
| Total dividends and/or distributions to shareholders | | | (0.23) | | | | (0.25) | | | | (0.20) | | | | (0.16) | | | | (0.17) | |
| |
| Net asset value, end of period | | | $5.45 | | | | $5.93 | | | | $5.93 | | | | $5.60 | | | | $5.99 | |
| | | | |
|
| |
| Total Return, at Net Asset Value3 | | | (4.47)% | | | | 4.41% | | | | 9.70% | | | | (3.84)% | | | | 1.55% | |
|
| |
| Ratios/Supplemental Data | | | | | | | | | | | | | | | | | | | | |
| Net assets, end of period (in thousands) | | | $117,668 | | | | $131,112 | | | | $146,479 | | | | $166,932 | | | | $216,721 | |
| |
| Average net assets (in thousands) | | | $125,233 | | | | $133,661 | | | | $149,525 | | | | $192,512 | | | | $234,841 | |
| |
| Ratios to average net assets:4 | | | | | | | | | | | | | | | | | | | | |
| Net investment income | | | 4.06% | | | | 3.67% | | | | 3.54% | | | | 2.81% | | | | 2.84% | |
| Expenses excluding specific expenses listed below | | | 1.25% | | | | 1.30% | | | | 1.29% | | | | 1.27% | | | | 1.35% | |
| Interest and fees from borrowings | | | 0.00%5 | | | | 0.00%5 | | | | 0.00%5 | | | | 0.00%5 | | | | 0.00% | |
| | | | |
| Total expenses6 | | | 1.25% | | | | 1.30% | | | | 1.29% | | | | 1.27% | | | | 1.35% | |
| Expenses after payments, waivers and/or reimbursements and reduction to custodian expenses | | | 1.23% | | | | 1.27% | | | | 1.27% | | | | 1.27%7 | | | | 1.32% | |
| |
| Portfolio turnover rate | | | 115% | | | | 96% | | | | 128% | | | | 111% | | | | 108% | |
1. Per share amounts calculated based on the average shares outstanding during the period.
2. Less than $0.005 per share.
3. Assumes an initial investment on the business day before the first day of the fiscal period, with all dividends and distributions reinvested in additional shares on the reinvestment date, and redemption at the net asset value calculated on the last business day of the fiscal period. Sales charges are not reflected in the total returns. Total returns are not annualized for periods less than one full year. Returns do not reflect the deduction of taxes that a shareholder would pay on fund distributions or the redemption of fund shares.
4. Annualized for periods less than one full year.
5. Less than 0.005%.
6. Total expenses including indirect expenses from affiliated fund fees and expenses were as follows:
| | | | | | | | |
| Year Ended September 30, 2018 | | | 1.26 | % | | | | |
| Year Ended September 30, 2017 | | | 1.31 | % | | | | |
| Year Ended September 30, 2016 | | | 1.29 | % | | | | |
| Year Ended September 30, 2015 | | | 1.27 | % | | | | |
| Year Ended September 30, 2014 | | | 1.35 | % | | | | |
7. Waiver was less than 0.005%.
See accompanying Notes to Consolidated Financial Statements.
|
| 59 OPPENHEIMER INTERNATIONAL BOND FUND |
CONSOLIDATED FINANCIAL HIGHLIGHTS Continued
| | | | | | | | | | | | | | | | | | | | |
| Class Y | | Year Ended
September
30, 2018 | | | Year Ended
September
30, 2017 | | | Year Ended
September
30, 2016 | | | Year Ended
September
30, 2015 | | | Year Ended
September
30, 2014 | |
| |
| Per Share Operating Data | | | | | | | | | | | | | | | | | | | | |
| Net asset value, beginning of period | | | $5.95 | | | | $5.95 | | | | $5.61 | | | | $6.01 | | | | $6.09 | |
| |
| Income (loss) from investment operations: | | | | | | | | | | | | | | | | | | | | |
| Net investment income1 | | | 0.26 | | | | 0.24 | | | | 0.23 | | | | 0.20 | | | | 0.21 | |
| Net realized and unrealized gain (loss) | | | (0.48) | | | | 0.04 | | | | 0.34 | | | | (0.41) | | | | (0.08) | |
| | | | |
| Total from investment operations | | | (0.22) | | | | 0.28 | | | | 0.57 | | | | (0.21) | | | | 0.13 | |
| |
| Dividends and/or distributions to shareholders: | | | | | | | | | | | | | | | | | | | | |
| Dividends from net investment income | | | (0.14) | | | | (0.11) | | | | (0.10) | | | | (0.15) | | | | (0.08) | |
| Distributions from net realized gain | | | 0.00 | | | | 0.00 | | | | 0.00 | | | | 0.00 | | | | (0.00)2 | |
| Tax return of capital distribution | | | (0.12) | | | | (0.17) | | | | (0.13) | | | | (0.04) | | | | (0.13) | |
| | | | |
| Total dividends and/or distributions to shareholders | | | (0.26) | | | | (0.28) | | | | (0.23) | | | | (0.19) | | | | (0.21) | |
| |
| Net asset value, end of period | | | $5.47 | | | | $5.95 | | | | $5.95 | | | | $5.61 | | | | $6.01 | |
| | | | |
|
| |
| Total Return, at Net Asset Value3 | | | (3.80)% | | | | 4.75% | | | | 10.42% | | | | (3.50)% | | | | 2.14% | |
|
| |
| Ratios/Supplemental Data | | | | | | | | | | | | | | | | | | | | |
| Net assets, end of period (in thousands) | | | $2,597,821 | | | | $2,345,993 | | | | $2,072,160 | | | | $2,781,868 | | | | $3,431,584 | |
| |
| Average net assets (in thousands) | | | $2,618,549 | | | | $2,088,382 | | | | $2,399,267 | | | | $3,128,046 | | | | $3,532,821 | |
| |
| Ratios to average net assets:4 | | | | | | | | | | | | | | | | | | | | |
| Net investment income | | | 4.56% | | | | 4.13% | | | | 4.03% | | | | 3.32% | | | | 3.43% | |
| Expenses excluding specific expenses listed below | | | 0.76% | | | | 0.80% | | | | 0.80% | | | | 0.77% | | | | 0.74% | |
| Interest and fees from borrowings | | | 0.00%5 | | | | 0.00%5 | | | | 0.00%5 | | | | 0.00%5 | | | | 0.00% | |
| | | | |
| Total expenses6 | | | 0.76% | | | | 0.80% | | | | 0.80% | | | | 0.77% | | | | 0.74% | |
| Expenses after payments, waivers and/or reimbursements and reduction to custodian expenses | | | 0.74% | | | | 0.77% | | | | 0.78% | | | | 0.77%7 | | | | 0.74%7 | |
| |
| Portfolio turnover rate | | | 115% | | | | 96% | | | | 128% | | | | 111% | | | | 108% | |
1. Per share amounts calculated based on the average shares outstanding during the period.
2. Less than $0.005 per share.
3. Assumes an initial investment on the business day before the first day of the fiscal period, with all dividends and distributions reinvested in additional shares on the reinvestment date, and redemption at the net asset value calculated on the last business day of the fiscal period. Sales charges are not reflected in the total returns. Total returns are not annualized for periods less than one full year. Returns do not reflect the deduction of taxes that a shareholder would pay on fund distributions or the redemption of fund shares.
4. Annualized for periods less than one full year.
5. Less than 0.005%.
6. Total expenses including indirect expenses from affiliated fund fees and expenses were as follows:
| | | | | | | | |
| Year Ended September 30, 2018 | | | 0.77 | % | | | | |
| Year Ended September 30, 2017 | | | 0.81 | % | | | | |
| Year Ended September 30, 2016 | | | 0.80 | % | | | | |
| Year Ended September 30, 2015 | | | 0.77 | % | | | | |
| Year Ended September 30, 2014 | | | 0.74 | % | | | | |
7. Waiver was less than 0.005%.
See accompanying Notes to Consolidated Financial Statements.
|
| 60 OPPENHEIMER INTERNATIONAL BOND FUND |
NOTES TO
CONSOLIDATED FINANCIAL STATEMENTS September 30, 2018
1. Organization
Oppenheimer International Bond Fund (the “Fund”) is a non-diversified open-end management investment company registered under the Investment Company Act of 1940 (“1940 Act”), as amended. The Fund’s investment objective is to seek total return. The Fund’s investment adviser is OFI Global Asset Management, Inc. (“OFI Global” or the “Manager”), a wholly-owned subsidiary of OppenheimerFunds, Inc. (“OFI” or the “Sub-Adviser”). The Manager has entered into a sub-advisory agreement with OFI.
The Fund offers Class A, Class C, Class I, Class R and Class Y shares, and previously offered Class B shares for new purchase through June 29, 2012. Subsequent to that date, no new purchases of Class B shares were permitted. Reinvestment of dividend and/or capital gain distributions and exchanges of Class B shares into and from other Oppenheimer funds were permitted through May 31, 2018. Effective June 1, 2018 (the “Conversion Date”), all Class B shares converted to Class A shares. Class A shares are sold at their offering price, which is normally net asset value plus a front-end sales charge. Class C and Class R shares are sold, and Class B shares were sold, without a front-end sales charge but may be subject to a contingent deferred sales charge (“CDSC”). Class R shares are sold only through retirement plans. Retirement plans that offer Class R shares may impose charges on those accounts. Class I and Class Y shares are sold to certain institutional investors or intermediaries without either a front-end sales charge or a CDSC, however, the intermediaries may impose charges on their accountholders who beneficially own Class I and Class Y shares. All classes of shares have identical rights and voting privileges with respect to the Fund in general and exclusive voting rights on matters that affect that class alone. Earnings, net assets and net asset value per share may differ due to each class having its own expenses, such as transfer and shareholder servicing agent fees and shareholder communications, directly attributable to that class. Class A, C and R shares have, and Class B shares had, separate distribution and/or service plans under which they pay, and Class B shares paid, fees. Class I and Class Y shares do not pay such fees. Previously issued Class B shares automatically converted to Class A shares 72 months after the date of purchase.
The following is a summary of significant accounting policies followed in the Fund’s preparation of financial statements in accordance with accounting principles generally accepted in the United States (“U.S. GAAP”).
2. Significant Accounting Policies
Security Valuation. All investments in securities are recorded at their estimated fair value, as described in Note 3.
Basis for Consolidation. The Fund has established a Cayman Islands exempted company, Oppenheimer International Bond Fund (Cayman) Ltd. (the “Subsidiary”), which is wholly-owned and controlled by the Fund. The Fund and Subsidiary are both managed by the Manager. The Fund may invest up to 25% of its total assets in the Subsidiary. The Subsidiary invests primarily in Regulation S securities. Regulation S securities are securities of U.S. and non-U.S. issuers that are issued through private offerings without registration with the
|
| 61 OPPENHEIMER INTERNATIONAL BOND FUND |
NOTES TO
CONSOLIDATED FINANCIAL STATEMENTS Continued
2. Significant Accounting Policies (Continued)
Securities and Exchange Commission pursuant to Regulation S under the Securities Act of 1933. The Fund applies its investment restrictions and compliance policies and procedures, on a look-through basis, to the Subsidiary.
The financial statements have been consolidated and include accounts of the Fund and the Subsidiary. Accordingly, all inter-company transactions and balances have been eliminated. At period end, the Fund owned 328,589 shares with net assets of $30,419,802 in the Subsidiary.
Other financial information at period end:
| | | | |
| Total market value of investments | | $ | 13,194,999 | |
| Net assets | | $ | 30,419,802 | |
| Net income (loss) | | $ | 1,679,111 | |
| Net realized gain (loss) | | $ | (5,323,309) | |
| Net change in unrealized appreciation/depreciation | | $ | (1,960,683) | |
Foreign Currency Translation. The books and records of the Fund are maintained in U.S. dollars. Any foreign currency amounts are translated into U.S. dollars on the following basis:
(1) Value of investment securities, other assets and liabilities — at the exchange rates prevailing at market close as described in Note 3.
(2) Purchases and sales of investment securities, income and expenses — at the rates of exchange prevailing on the respective dates of such transactions.
Although the net assets and the values are presented at the foreign exchange rates at market close, the Fund does not isolate the portion of the results of operations resulting from changes in foreign exchange rates on investments from the fluctuations arising from changes in prices of securities held. Such fluctuations are included with the net realized and unrealized gains or losses from investments shown in the Consolidated Statement of Operations.
For securities, which are subject to foreign withholding tax upon disposition, realized and unrealized gains or losses on such securities are recorded net of foreign withholding tax.
Reported net realized foreign exchange gains or losses arise from sales of foreign currencies, currency gains or losses realized between the trade and settlement dates on securities transactions, the difference between the amounts of dividends, interest, and foreign withholding tax reclaims recorded on the Fund’s books, and the U.S. dollar equivalent of the amounts actually received or paid. Net unrealized foreign exchange gains and losses arise from changes in the value of assets and liabilities other than investments in securities, resulting from changes in the exchange rate.
Allocation of Income, Expenses, Gains and Losses. Income, expenses (other than those attributable to a specific class), gains and losses are allocated on a daily basis to each class of shares based upon the relative proportion of net assets represented by such class. Operating expenses directly attributable to a specific class are charged against the operations of that class.
Dividends and Distributions to Shareholders. Dividends and distributions to
|
| 62 OPPENHEIMER INTERNATIONAL BOND FUND |
2. Significant Accounting Policies (Continued)
shareholders, which are determined in accordance with income tax regulations and may differ from U.S. GAAP, are recorded on the ex-dividend date. Income distributions, if any, are declared daily and paid monthly. Capital gain distributions, if any, are declared and paid annually or at other times as determined necessary by the Manager.
Investment Income. Dividend income is recorded on the ex-dividend date or upon ex-dividend notification in the case of certain foreign dividends where the ex-dividend date may have passed. Non-cash dividends included in dividend income, if any, are recorded at the fair value of the securities received. Withholding taxes on foreign dividends, if any, and capital gains taxes on foreign investments, if any, have been provided for in accordance with the Fund’s understanding of the applicable tax rules and regulations. Interest income, if any, is recognized on an accrual basis. Discount and premium, which are included in interest income on the Consolidated Statement of Operations, are amortized or accreted daily.
Custodian Fees. “Custodian fees and expenses” in the Consolidated Statement of Operations may include interest expense incurred by the Fund on any cash overdrafts of its custodian account during the period. Such cash overdrafts may result from the effects of failed trades in portfolio securities and from cash outflows resulting from unanticipated shareholder redemption activity. The Fund pays interest to its custodian on such cash overdrafts, to the extent they are not offset by positive cash balances maintained by the Fund, at a rate equal to the Federal Funds Rate plus 2.00%. The “Reduction to custodian expenses” line item, if applicable, represents earnings on cash balances maintained by the Fund during the period. Such interest expense and other custodian fees may be paid with these earnings.
Security Transactions. Security transactions are recorded on the trade date. Realized gains and losses on securities sold are determined on the basis of identified cost.
Indemnifications. The Fund’s organizational documents provide current and former Trustees and officers with a limited indemnification against liabilities arising in connection with the performance of their duties to the Fund. In the normal course of business, the Fund may also enter into contracts that provide general indemnifications. The Fund’s maximum exposure under these arrangements is unknown as this would be dependent on future claims that may be made against the Fund. The risk of material loss from such claims is considered remote.
Federal Taxes. The Fund intends to comply with provisions of the Internal Revenue Code applicable to regulated investment companies and to distribute substantially all of its investment company taxable income, including any net realized gain on investments not offset by capital loss carryforwards, if any, to shareholders. Therefore, no federal income or excise tax provision is required. The Fund files income tax returns in U.S. federal and applicable state jurisdictions. The statute of limitations on the Fund’s tax return filings generally remains open for the three preceding fiscal reporting period ends. The Fund has analyzed its tax positions for the fiscal year ended September 30, 2018, including open tax years, and does not believe
|
| 63 OPPENHEIMER INTERNATIONAL BOND FUND |
NOTES TO
CONSOLIDATED FINANCIAL STATEMENTS Continued
2. Significant Accounting Policies (Continued)
there are any uncertain tax positions requiring recognition in the Fund’s financial statements.
Subchapter M requires, among other things, that at least 90% of the Fund’s gross income be derived from securities or derived with respect to its business of investing in securities (typically referred to as “qualifying income”). Income from commodity-linked derivatives may not be treated as “qualifying income” for purposes of the 90% gross income requirement. The Internal Revenue Service (IRS) has previously issued a number of private letter rulings which conclude that income derived from commodity index-linked notes and investments in a wholly-owned subsidiary will be “qualifying income.” As a result, the Fund will gain exposure to commodities through commodity-linked notes and its wholly-owned subsidiary.
The IRS has suspended the granting of private letter rulings pending further review. As a result, there can be no assurance that the IRS will not change its position with respect to commodity-linked notes and wholly-owned subsidiaries. In addition, future legislation and guidance from the Treasury and the IRS may adversely affect the Fund’s ability to gain exposure to commodities through commodity-linked notes and its wholly-owned subsidiary.
The Fund is required to include in income for federal income tax purposes all of the subsidiary’s net income and gains whether or not such income is distributed by the subsidiary. Net income and gains from the subsidiary are generally treated as ordinary income by the Fund, regardless of the character of the subsidiary’s underlying income. Net losses from the subsidiary do not pass through to the Fund for federal income tax purposes.
The tax components of capital shown in the following table represent distribution requirements the Fund must satisfy under the income tax regulations, losses the Fund may be able to offset against income and gains realized in future years and unrealized appreciation or depreciation of securities and other investments for federal income tax purposes.
| | | | | | | | | | | | |
Undistributed Net Investment Income | | Undistributed
Long-Term
Gain | | | Accumulated
Loss
Carryforward1,2,3,4,5 | | | Net Unrealized
Depreciation
Based on cost of
Securities and
Other Investments
for Federal Income
Tax Purposes | |
| $— | | | $— | | | | $237,048,699 | | | | $362,575,157 | |
1. At period end, the Fund had $124,581,865 of net capital loss carryforward available to offset future realized capital gains, if any, and thereby reduce future taxable gain distributions.
2. The Fund had $111,596,942 of post-October foreign currency losses which were deferred.
3. The Fund had $869,892 of straddle losses which were deferred.
4. During the reporting period, the Fund utilized $50,756,055 of capital loss carryforward to offset capital gains realized in that fiscal year.
5. During the previous reporting period, the Fund utilized $20,368,037 of capital loss carryforward to offset capital gains realized in that fiscal year.
Net investment income (loss) and net realized gain (loss) may differ for financial statement and tax purposes. The character of dividends and distributions made during the fiscal year from net investment income or net realized gains are determined in accordance with federal
|
| 64 OPPENHEIMER INTERNATIONAL BOND FUND |
2. Significant Accounting Policies (Continued)
income tax requirements, which may differ from the character of net investment income or net realized gains presented in those financial statements in accordance with U.S. GAAP. Also, due to timing of dividends and distributions, the fiscal year in which amounts are distributed may differ from the fiscal year in which the income or net realized gain was recorded by the Fund.
Accordingly, the following amounts have been reclassified for the reporting period. Net assets of the Fund were unaffected by the reclassifications.
| | | | | | | | |
Reduction to Paid-in Capital | | Reduction to Accumulated
Net Investment
Loss | | | Increase to Accumulated Net
Realized Loss on Investments | |
| |
| $117,744,194 | | | $123,520,963 | | | | $5,776,769 | |
The tax character of distributions paid during the reporting periods:
| | | | | | | | |
| | | Year Ended September 30, 2018 | | �� | Year Ended
September 30, 2017 | |
| |
| Distributions paid from: | | | | | | | | |
| Ordinary income | | $ | 130,633,676 | | | $ | 95,527,157 | |
| Return of capital | | | 117,785,315 | | | | 157,918,959 | |
| | | | |
| Total | | $ | 248,418,991 | | | $ | 253,446,116 | |
| | | | |
The aggregate cost of securities and other investments and the composition of unrealized appreciation and depreciation of securities and other investments for federal income tax purposes at period end are noted in the following table. The primary difference between book and tax appreciation or depreciation of securities and other investments, if applicable, is attributable to the tax deferral of losses or tax realization of financial statement unrealized gain or loss.
| | | | |
| Federal tax cost of securities | | $ | 5,894,018,717 | |
| Federal tax cost of other investments | | | (886,804,124) | |
| | | | |
| Total federal tax cost | | $ | 5,007,214,593 | |
| | | | |
| Gross unrealized appreciation | | $ | 292,164,266 | |
| Gross unrealized depreciation | | | (654,739,423) | |
| | | | |
| Net unrealized depreciation | | $ | (362,575,157) | |
| | | | |
Certain foreign countries impose a tax on capital gains which is accrued by the Fund based on unrealized appreciation, if any, on affected securities. The tax is paid when the gain is realized.
Use of Estimates. The preparation of financial statements in conformity with U.S. GAAP requires management to make estimates and assumptions that affect the reported amounts of assets and liabilities and disclosure of contingent assets and liabilities at the date of the financial statements and the reported amounts of increases and decreases in net assets from operations during the reporting period. Actual results could differ from those estimates.
|
| 65 OPPENHEIMER INTERNATIONAL BOND FUND |
NOTES TO
CONSOLIDATED FINANCIAL STATEMENTS Continued
2. Significant Accounting Policies (Continued)
New Accounting Pronouncement. In March 2017, Financial Accounting Standards Board (“FASB”) issued Accounting Standards Update (“ASU”), ASU 2017-08. This provides guidance related to the amortization period for certain purchased callable debt securities held at a premium. The ASU is effective for annual periods beginning after December 15, 2018, and interim periods within those annual periods. The Manager is evaluating the impacts of these changes on the financial statements.
3. Securities Valuation
The Fund calculates the net asset value of its shares as of 4:00 P.M. Eastern Time, on each day the New York Stock Exchange (the “Exchange”) is open for trading, except in the case of a scheduled early closing of the Exchange, in which case the Fund will calculate net asset value of the shares as of the scheduled early closing time of the Exchange.
The Fund’s Board has adopted procedures for the valuation of the Fund’s securities and has delegated the day-to-day responsibility for valuation determinations under those procedures to the Manager. The Manager has established a Valuation Committee which is responsible for determining a fair valuation for any security for which market quotations are not readily available. The Valuation Committee’s fair valuation determinations are subject to review, approval and ratification by the Fund’s Board at least quarterly or more frequently, if necessary.
Valuation Methods and Inputs
Securities are valued primarily using unadjusted quoted market prices, when available, as supplied by third party pricing services or broker-dealers.
The following methodologies are used to determine the market value or the fair value of the types of securities described below:
Equity securities traded on a securities exchange (including exchange-traded derivatives other than futures and futures options) are valued based on the official closing price on the principal exchange on which the security is traded, as identified by the Manager, prior to the time when the Fund’s assets are valued. If the official closing price is unavailable, the security is valued at the last sale price on the principal exchange on which it is traded, or if no sales occurred, the security is valued at the mean between the quoted bid and asked prices. Over-the-counter equity securities are valued at the last published sale price, or if no sales occurred, at the mean between the quoted bid and asked prices. Events occurring after the close of trading on foreign exchanges may result in adjustments to the valuation of foreign securities to more accurately reflect their fair value as of the time when the Fund’s assets are valued.
Shares of a registered investment company that are not traded on an exchange are valued at that investment company’s net asset value per share.
Corporate and government debt securities (of U.S. or foreign issuers) and municipal debt securities, short-term notes, mortgage-backed securities, collateralized mortgage obligations, and asset-backed securities are valued at the mean between the bid and asked prices utilizing evaluated prices obtained from third party pricing services or broker-dealers who may use
|
| 66 OPPENHEIMER INTERNATIONAL BOND FUND |
3. Securities Valuation (Continued)
matrix pricing methods to determine the evaluated prices. Pricing services generally price debt securities assuming orderly transactions of an institutional “round lot” size, but some trades may occur in smaller, “odd lot” sizes, sometimes at lower prices than institutional round lot trades. Standard inputs generally considered by third-party pricing vendors include reported trade data, broker-dealer price quotations, benchmark yields, issuer spreads on comparable securities, the credit quality, yield, maturity, as well as other appropriate factors.
Structured securities, swaps, swaptions, and other over-the-counter derivatives are valued utilizing evaluated prices obtained from third party pricing services or broker-dealers. Standard inputs generally considered by third-party pricing vendors include market information relevant to the underlying reference asset such as the price of financial instruments, stock market indices, foreign currencies, interest rate spreads, commodities, credit spreads, credit event probabilities, index values, individual security values, forward interest rates, variable interest rates, volatility measures, and forward currency rates, or the occurrence of other specific events.
Forward foreign currency exchange contracts are valued utilizing current and forward currency rates obtained from third party pricing services. When the settlement date of a contract is an interim date for which a quotation is not available, interpolated values are derived using the nearest dated forward currency rate.
Futures contracts and futures options traded on a commodities or futures exchange will be valued at the final settlement price or official closing price on the principal exchange as reported by such principal exchange at its trading session ending at, or most recently prior to, the time when the Fund’s assets are valued.
Securities for which market quotations are not readily available, or when a significant event has occurred that would materially affect the value of the security, are fair valued either (i) by a standardized fair valuation methodology applicable to the security type or the significant event as previously approved by the Valuation Committee and the Fund’s Board or (ii) as determined in good faith by the Manager’s Valuation Committee. The Valuation Committee considers all relevant facts that are reasonably available, through either public information or information available to the Manager, when determining the fair value of a security. Those standardized fair valuation methodologies include, but are not limited to, valuing securities at the last sale price or initially at cost and subsequently adjusting the value based on: changes in company specific fundamentals, changes in an appropriate securities index, or changes in the value of similar securities which may be further adjusted for any discounts related to security-specific resale restrictions. When possible, such methodologies use observable market inputs such as unadjusted quoted prices of similar securities, observable interest rates, currency rates and yield curves. The methodologies used for valuing securities are not necessarily an indication of the risks associated with investing in those securities nor can it be assured that the Fund can obtain the fair value assigned to a security if it were to sell the security.
To assess the continuing appropriateness of security valuations, the Manager regularly compares prior day prices and sale prices to the current day prices and challenges those prices exceeding certain tolerance levels with the third party pricing service or broker source.
|
| 67 OPPENHEIMER INTERNATIONAL BOND FUND |
NOTES TO
CONSOLIDATED FINANCIAL STATEMENTS Continued
3. Securities Valuation (Continued)
For those securities valued by fair valuations, whether through a standardized fair valuation methodology or a fair valuation determination, the Valuation Committee reviews and affirms the reasonableness of the valuations based on such methodologies and fair valuation determinations on a regular basis after considering all relevant information that is reasonably available.
Classifications
Each investment asset or liability of the Fund is assigned a level at measurement date based on the significance and source of the inputs to its valuation. Various data inputs may be used in determining the value of each of the Fund’s investments as of the reporting period end.
These data inputs are categorized in the following hierarchy under applicable financial accounting standards:
1) Level 1-unadjusted quoted prices in active markets for identical assets or liabilities (including securities actively traded on a securities exchange)
2) Level 2-inputs other than unadjusted quoted prices that are observable for the asset or liability (such as unadjusted quoted prices for similar assets and market corroborated inputs such as interest rates, prepayment speeds, credit risks, etc.)
3) Level 3-significant unobservable inputs (including the Manager’s own judgments about assumptions that market participants would use in pricing the asset or liability).
The inputs used for valuing securities are not necessarily an indication of the risks associated with investing in those securities.
The Fund classifies each of its investments in investment companies which are publicly offered as Level 1. Investment companies that are not publicly offered, if any, are classified as Level 2 in the fair value hierarchy.
The table below categorizes amounts that are included in the Fund’s Consolidated Statement of Assets and Liabilities at period end based on valuation input level:
| | | | | | | | | | | | | | | | |
| | | Level 1—
Unadjusted
Quoted Prices | | | Level 2— Other Significant
Observable Inputs | | | Level 3—
Significant
Unobservable
Inputs | | | Value | |
| |
Assets Table | | | | | | | | | | | | | | | | |
Investments, at Value: | | | | | | | | | | | | | | | | |
Mortgage-Backed Obligations | | $ | — | | | $ | 196,607,825 | | | $ | — | | | $ | 196,607,825 | |
Foreign Government Obligations | | | — | | | | 3,080,251,068 | | | | — | | | | 3,080,251,068 | |
Corporate Bonds and Notes | | | — | | | | 1,529,595,912 | | | | 167,417 | | | | 1,529,763,329 | |
Common Stock | | | — | | | | — | | | | — | | | | — | |
Structured Securities | | | — | | | | 18,754,149 | | | | 449,989 | | | | 19,204,138 | |
Short-Term Notes | | | — | | | | 239,642,748 | | | | — | | | | 239,642,748 | |
Over-the-Counter Options Purchased | | | — | | | | 47,899,217 | | | | — | | | | 47,899,217 | |
Over-the-Counter Credit Default | | | | | | | | | | | | | | | | |
Swaption Purchased | | | — | | | | 67,701 | | | | — | | | | 67,701 | |
Over-the-Counter Interest Rate | | | | | | | | | | | | | | | | |
Swaptions Purchased | | | — | | | | 65,678,304 | | | | — | | | | 65,678,304 | |
|
| 68 OPPENHEIMER INTERNATIONAL BOND FUND |
3. Securities Valuation (Continued)
| | | | | | | | | | | | | | | | |
| | | Level 1—
Unadjusted
Quoted Prices | | | Level 2— Other Significant Observable Inputs | | | Level 3—
Significant
Unobservable
Inputs | | | Value | |
| |
Investments, at Value: (Continued) | | | | | | | | | | | | | | | | |
Investment Company | | $ | 373,232,093 | | | $ | — | | | $ | — | | | $ | 373,232,093 | |
| | | | |
Total Investments, at Value | | | 373,232,093 | | | | 5,178,496,924 | | | | 617,406 | | | | 5,552,346,423 | |
Other Financial Instruments: | | | | | | | | | | | | | | | | |
Swaps, at value | | | — | | | | 3,570,507 | | | | — | | | | 3,570,507 | |
Centrally cleared swaps, at value | | | — | | | | 12,078,329 | | | | — | | | | 12,078,329 | |
Futures contracts | | | 7,936,160 | | | | — | | | | — | | | | 7,936,160 | |
Forward currency exchange contracts | | | — | | | | 53,193,068 | | | | — | | | | 53,193,068 | |
| | | | |
Total Assets | | $ | 381,168,253 | | | $ | 5,247,338,828 | | | $ | 617,406 | | | $ | 5,629,124,487 | |
| | | | |
| | | | |
Liabilities Table | | | | | | | | | | | | | | | | |
Other Financial Instruments: | | | | | | | | | | | | | | | | |
Swaps, at value | | $ | — | | | $ | (12,384,572 | ) | | $ | — | | | $ | (12,384,572) | |
Centrally cleared swaps, at value | | | — | | | | (13,722,869 | ) | | | — | | | | (13,722,869) | |
Over-the-Counter Options written, at value | | | — | | | | (141,888,569 | ) | | | — | | | | (141,888,569) | |
Futures contracts | | | (2,785,261 | ) | | | — | | | | — | | | | (2,785,261) | |
Forward currency exchange contracts | | | — | | | | (126,276,907 | ) | | | — | | | | (126,276,907) | |
Swaptions written, at value | | | — | | | | (38,311,153 | ) | | | — | | | | (38,311,153) | |
| | | | |
Total Liabilities | | $ | (2,785,261 | ) | | $ | (332,584,070 | ) | | $ | — | | | $ | (335,369,331) | |
| | | | |
Forward currency exchange contracts and futures contracts, if any, are reported at their unrealized appreciation/depreciation at measurement date, which represents the change in the contract’s value from trade date. All additional assets and liabilities included in the above table are reported at their market value at measurement date.
The table below shows the transfers between Level 2 and Level 3. The Fund’s policy is to recognize transfers in and transfers out as of the beginning of the reporting period.
| | | | | | | | |
| | | Transfers into Level
2* | | | Transfers out of Level 3* | |
| |
Assets Table Investments, at Value: | | | | | | | | |
Foreign Government Obligations | | $ | 15,964,192 | | | $ | (15,964,192) | |
| | | | |
Total Assets | | $ | 15,964,192 | | | $ | (15,964,192) | |
| | | | |
* Transferred from Level 3 to Level 2 due to the availability of market data for this security.
4. Investments and Risks
Risks of Foreign Investing. The Fund may invest in foreign securities which are subject to special risks. Securities traded in foreign markets may be less liquid and more volatile than those traded in U.S. markets. Foreign issuers are usually not subject to the same accounting and disclosure requirements that U.S. companies are subject to, which may make it difficult
|
| 69 OPPENHEIMER INTERNATIONAL BOND FUND |
NOTES TO
CONSOLIDATED FINANCIAL STATEMENTS Continued
4. Investments and Risks (Continued)
for the Fund to evaluate a foreign company’s operations or financial condition. A change in the value of a foreign currency against the U.S. dollar will result in a change in the U.S. dollar value of investments denominated in that foreign currency and in the value of any income or distributions the Fund may receive on those investments. The value of foreign investments may be affected by exchange control regulations, foreign taxes, higher transaction and other costs, delays in the settlement of transactions, changes in economic or monetary policy in the United States or abroad, expropriation or nationalization of a company’s assets, or other political and economic factors. In addition, due to the inter-relationship of global economies and financial markets, changes in political and economic factors in one country or region could adversely affect conditions in another country or region. Investments in foreign securities may also expose the Fund to time-zone arbitrage risk. Foreign securities may trade on weekends or other days when the Fund does not price its shares. At times, the Fund may emphasize investments in a particular country or region and may be subject to greater risks from adverse events that occur in that country or region. Foreign securities and foreign currencies held in foreign banks and securities depositories may be subject to limited or no regulatory oversight.
Investments in Affiliated Funds. The Fund is permitted to invest in other mutual funds advised by the Manager (“Affiliated Funds”). Affiliated Funds are open-end management investment companies registered under the 1940 Act, as amended. The Manager is the investment adviser of, and the Sub-Adviser provides investment and related advisory services to, the Affiliated Funds. When applicable, the Fund’s investments in Affiliated Funds are included in the Consolidated Statement of Investments. Shares of Affiliated Funds are valued at their net asset value per share. As a shareholder, the Fund is subject to its proportional share of the Affiliated Funds’ expenses, including their management fee. The Manager will waive fees and/or reimburse Fund expenses in an amount equal to the indirect management fees incurred through the Fund’s investment in the Affiliated Funds.
Each of the Affiliated Funds in which the Fund invests has its own investment risks, and those risks can affect the value of the Fund’s investments and therefore the value of the Fund’s shares. To the extent that the Fund invests more of its assets in one Affiliated Fund than in another, the Fund will have greater exposure to the risks of that Affiliated Fund.
Investments in Money Market Instruments. The Fund is permitted to invest its free cash balances in money market instruments to provide liquidity or for defensive purposes. The Fund may invest in money market instruments by investing in Class E shares of Oppenheimer Institutional Government Money Market Fund (“IGMMF”), which is an Affiliated Fund. IGMMF is regulated as a money market fund under the 1940 Act, as amended. The Fund may also invest in money market instruments directly or in other affiliated or unaffiliated money market funds.
Structured Securities. The Fund invests in structured securities whose market values, interest rates and/or redemption prices are linked to the performance of underlying foreign currencies, interest rate spreads, stock market indices, prices of individual securities,
|
| 70 OPPENHEIMER INTERNATIONAL BOND FUND |
4. Investments and Risks (Continued)
commodities or other financial instruments or the occurrence of other specific events. The structured securities are often leveraged, increasing the volatility of each note’s market value relative to the change in the underlying linked financial element or event. Fluctuations in value of these securities are recorded as unrealized gains and losses in the accompanying Consolidated Statement of Operations. The Fund records a realized gain or loss when a structured security is sold or matures.
Securities on a When-Issued or Delayed Delivery Basis. The Fund may purchase securities on a “when-issued” basis, and may purchase or sell securities on a “delayed delivery” basis. “When-issued” or “delayed delivery” refers to securities whose terms and indenture are available and for which a market exists, but which are not available for immediate delivery. Delivery and payment for securities that have been purchased by the Fund on a when-issued basis normally takes place within six months and possibly as long as two years or more after the trade date. During this period, such securities do not earn interest, are subject to market fluctuation and may increase or decrease in value prior to their delivery. The purchase of securities on a when-issued basis may increase the volatility of the Fund’s net asset value to the extent the Fund executes such transactions while remaining substantially fully invested. When the Fund engages in when-issued or delayed delivery transactions, it relies on the buyer or seller, as the case may be, to complete the transaction. Their failure to do so may cause the Fund to lose the opportunity to obtain or dispose of the security at a price and yield it considers advantageous. The Fund may also sell securities that it purchased on a when-issued basis or forward commitment prior to settlement of the original purchase.
At period end, the Fund had purchased securities issued on a when-issued or delayed delivery basis as follows:
| | | | |
| | | When-Issued or
Delayed Delivery
Basis Transactions | |
| |
| Purchased securities | | | $3,012,725 | |
Restricted Securities. At period end, investments in securities included issues that are restricted. A restricted security may have a contractual restriction on its resale and is valued under methods approved by the Board of Trustees as reflecting fair value. Securities that are restricted are marked with an applicable footnote on the Consolidated Statement of Investments. Restricted securities are reported on a schedule following the Consolidated Statement of Investments.
Equity Security Risk. Stocks and other equity securities fluctuate in price. The value of the Fund’s portfolio may be affected by changes in the equity markets generally. Equity markets may experience significant short-term volatility and may fall sharply at times. Different markets may behave differently from each other and U.S. equity markets may move in the opposite direction from one or more foreign stock markets. Adverse events in any part of the equity or fixed-income markets may have unexpected negative effects on other market segments.
|
| 71 OPPENHEIMER INTERNATIONAL BOND FUND |
NOTES TO
CONSOLIDATED FINANCIAL STATEMENTS Continued
4. Investments and Risks (Continued)
The prices of individual equity securities generally do not all move in the same direction at the same time and a variety of factors can affect the price of a particular company’s securities. These factors may include, but are not limited to, poor earnings reports, a loss of customers, litigation against the company, general unfavorable performance of the company’s sector or industry, or changes in government regulations affecting the company or its industry.
Credit Risk. The Fund invests in high-yield, non-investment-grade bonds, which may be subject to a greater degree of credit risk. Credit risk relates to the ability of the issuer to meet interest or principal payments or both as they become due. The Fund may acquire securities that have missed an interest payment, and is not obligated to dispose of securities whose issuers or underlying obligors subsequently miss an interest and/or principal payment.
Information concerning securities not accruing interest at period end is as follows:
| | | | |
| Cost | | | $10,122,195 | |
| Market Value | | | $0 | |
| Market Value as % of Net Assets | | | Less than 0.005% | |
Sovereign Debt Risk. The Fund invests in sovereign debt securities, which are subject to certain special risks. These risks include, but are not limited to, the risk that a governmental entity may delay or refuse, or otherwise be unable, to pay interest or repay the principal on its sovereign debt. There may also be no legal process for collecting sovereign debt that a government does not pay or bankruptcy proceedings through which all or part of such sovereign debt may be collected. In addition, a restructuring or default of sovereign debt may also cause additional impacts to the financial markets, such as downgrades to credit ratings, reduced liquidity and increased volatility, among others.
5. Market Risk Factors
The Fund’s investments in securities and/or financial derivatives may expose the Fund to various market risk factors:
Commodity Risk. Commodity risk relates to the change in value of commodities or commodity indexes as they relate to increases or decreases in the commodities market. Commodities are physical assets that have tangible properties. Examples of these types of assets are crude oil, heating oil, metals, livestock, and agricultural products.
Credit Risk. Credit risk relates to the ability of the issuer of debt to meet interest and principal payments, or both, as they come due. In general, lower-grade, higher-yield debt securities are subject to credit risk to a greater extent than lower-yield, higher-quality securities.
Equity Risk. Equity risk relates to the change in value of equity securities as they relate to increases or decreases in the general market.
Foreign Exchange Rate Risk. Foreign exchange rate risk relates to the change in the U.S. dollar value of a security held that is denominated in a foreign currency. The U.S. dollar value of a foreign currency denominated security will decrease as the dollar appreciates
|
| 72 OPPENHEIMER INTERNATIONAL BOND FUND |
5. Market Risk Factors (Continued)
against the currency, while the U.S. dollar value will increase as the dollar depreciates against the currency.
Interest Rate Risk. Interest rate risk refers to the fluctuations in value of fixed-income securities resulting from the inverse relationship between price and yield. For example, an increase in general interest rates will tend to reduce the market value of already issued fixed-income investments, and a decline in general interest rates will tend to increase their value. In addition, debt securities with longer maturities, which tend to have higher yields, are subject to potentially greater fluctuations in value from changes in interest rates than obligations with shorter maturities.
Volatility Risk. Volatility risk refers to the magnitude of the movement, but not the direction of the movement, in a financial instrument’s price over a defined time period. Large increases or decreases in a financial instrument’s price over a relative time period typically indicate greater volatility risk, while small increases or decreases in its price typically indicate lower volatility risk.
6. Use of Derivatives
The Fund’s investment objective not only permits the Fund to purchase investment securities, it also allows the Fund to enter into various types of derivatives contracts, including, but not limited to, futures contracts, forward currency exchange contracts, credit default swaps, interest rate swaps, total return swaps, variance swaps and purchased and written options. In doing so, the Fund will employ strategies in differing combinations to permit it to increase, decrease, or change the level or types of exposure to market risk factors. These instruments may allow the Fund to pursue its objectives more quickly and efficiently than if it were to make direct purchases or sales of securities capable of effecting a similar response to market factors. Such contracts may be entered into through a bilateral over-the-counter (“OTC”) transaction, or through a securities or futures exchange and cleared through a clearinghouse.
Derivatives may have little or no initial cash investment relative to their market value exposure and therefore can produce significant gains or losses in excess of their cost due to changes in the market risk factors and the overall market. This use of embedded leverage allows the Fund to increase its market value exposure relative to its net assets and can substantially increase the volatility of the Fund’s performance. In instances where the Fund is using derivatives to decrease, or hedge, exposures to market risk factors for securities held by the Fund, there are also risks that those derivatives may not perform as expected resulting in losses for the combined or hedged positions. Some derivatives have the potential for unlimited loss, regardless of the size of the Fund’s initial investment.
Additional associated risks from investing in derivatives also exist and potentially could have significant effects on the valuation of the derivative and the Fund. Typically, the associated risks are not the risks that the Fund is attempting to increase or decrease exposure to, per its investment objectives, but are the additional risks from investing in derivatives. Examples of these associated risks are liquidity risk, which is the risk that the Fund will not be able to sell the derivative in the open market in a timely manner, and counterparty credit risk,
|
| 73 OPPENHEIMER INTERNATIONAL BOND FUND |
NOTES TO
CONSOLIDATED FINANCIAL STATEMENTS Continued
6. Use of Derivatives (Continued)
which is the risk that the counterparty will not fulfill its obligation to the Fund.
The Fund’s actual exposures to these market risk factors and associated risks during the period are discussed in further detail, by derivative type, below.
Forward Currency Exchange Contracts
The Fund may enter into forward currency exchange contracts (“forward contracts”) for the purchase or sale of a foreign currency at a negotiated rate at a future date. Such contracts are traded in the OTC inter-bank currency dealer market.
Forward contracts are reported on a schedule following the Consolidated Statement of Investments. The unrealized appreciation (depreciation) is reported in the Consolidated Statement of Assets and Liabilities as a receivable (or payable) and in the Consolidated Statement of Operations within the change in unrealized appreciation (depreciation). At contract close, the difference between the original cost of the contract and the value at the close date is recorded as a realized gain (loss) in the Consolidated Statement of Operations.
The Fund may enter into forward foreign currency exchange contracts in order to decrease exposure to foreign exchange rate risk associated with either specific transactions or portfolio instruments or to increase exposure to foreign exchange rate risk.
During the reporting period, the Fund had daily average contract amounts on forward contracts to buy and sell of $4,993,070,947 and $6,018,599,767, respectively.
Additional associated risk to the Fund includes counterparty credit risk. Counterparty credit risk arises from the possibility that the counterparty to a forward contract will default and fail to perform its obligations to the Fund.
Futures Contracts
A futures contract is a commitment to buy or sell a specific amount of a commodity, financial instrument or currency at a negotiated price on a stipulated future date. The Fund may buy and sell futures contracts and may also buy or write put or call options on these futures contracts. Futures contracts and options thereon are generally entered into on a regulated futures exchange and cleared through a clearinghouse associated with the exchange.
Upon entering into a futures contract, the Fund is required to deposit either cash or securities (initial margin) in an amount equal to a certain percentage of the contract value in an account registered in the futures commission merchant’s name. Subsequent payments (variation margin) are paid to or from the futures commission merchant each day equal to the daily changes in the contract value. Such payments are recorded as unrealized gains and losses. Should the Fund fail to make requested variation margin payments, the futures commission merchant can gain access to the initial margin to satisfy the Fund’s payment obligations.
Futures contracts are reported on a schedule following the Consolidated Statement of Investments. Securities held by a futures commission merchant to cover initial margin requirements on open futures contracts are noted in the Consolidated Statement of Investments. Cash held by a futures commission merchant to cover initial margin requirements on open futures contracts and the receivable and/or payable for the daily mark to market
|
| 74 OPPENHEIMER INTERNATIONAL BOND FUND |
6. Use of Derivatives (Continued)
for the variation margin are noted in the Consolidated Statement of Assets and Liabilities. The net change in unrealized appreciation and depreciation is reported in the Consolidated Statement of Operations. Realized gains (losses) are reported in the Consolidated Statement of Operations at the closing or expiration of futures contracts.
The Fund may purchase and/or sell financial futures contracts and options on futures contracts to gain exposure to, or decrease exposure to interest rate risk, equity risk, foreign exchange rate risk, volatility risk, or commodity risk.
During the reporting period, the Fund had an ending monthly average market value of $48,691,478 and $319,796,617 on futures contracts purchased and sold, respectively.
Additional associated risks of entering into futures contracts (and related options) include the possibility that there may be an illiquid market where the Fund is unable to liquidate the contract or enter into an offsetting position and, if used for hedging purposes, the risk that the price of the contract will correlate imperfectly with the prices of the Fund’s securities.
Option Activity
The Fund may buy and sell put and call options, or write put and call options. When an option is written, the Fund receives a premium and becomes obligated to sell or purchase the underlying security, currency or other underlying financial instrument at a fixed price, upon exercise of the option.
Options can be traded through an exchange or through a privately negotiated arrangement with a dealer in an OTC transaction. Options traded through an exchange are generally cleared through a clearinghouse (such as The Options Clearing Corporation). The difference between the premium received or paid, and market value of the option, is recorded as unrealized appreciation or depreciation. The net change in unrealized appreciation or depreciation is reported in the Consolidated Statement of Operations. When an option is exercised, the cost of the security purchased or the proceeds of the security sale are adjusted by the amount of premium received or paid. Upon the expiration or closing of the option transaction, a gain or loss is reported in the Consolidated Statement of Operations.
Foreign Currency Options. The Fund may purchase or write call and put options on currencies to increase or decrease exposure to foreign exchange rate risk. A purchased call, or written put option becomes more valuable as the price of the underlying financial instrument appreciates relative to the strike price. A purchased put, or written call option becomes more valuable as the price of the underlying financial instrument depreciates relative to the strike price.
Interest Rate Options. The Fund may purchase or write call and put options on treasury and/or euro futures to increase or decrease exposure to interest rate risk. A purchased call or written put option becomes more valuable as the price of the underlying financial instrument appreciates relative to the strike price. A purchased put or written call option becomes more valuable as the price of the underlying financial instrument depreciates relative to the strike price.
Index/Security Options. The Fund may purchase or write call and put options on individual equity securities and/or equity indexes to increase or decrease exposure to equity risk. A
|
| 75 OPPENHEIMER INTERNATIONAL BOND FUND |
NOTES TO
CONSOLIDATED FINANCIAL STATEMENTS Continued
6. Use of Derivatives (Continued)
purchased call or written put option becomes more valuable as the price of the underlying financial instrument appreciates relative to the strike price. A purchased put or written call option becomes more valuable as the price of the underlying financial instrument depreciates relative to the strike price.
During the reporting period, the Fund had an ending monthly average market value of $16,698,209 and $7,864,856 on purchased call options and purchased put options, respectively.
Options written, if any, are reported in a schedule following the Consolidated Statement of Investments and as a liability in the Consolidated Statement of Assets and Liabilities. Securities held in collateral accounts to cover potential obligations with respect to outstanding written options are noted in the Consolidated Statement of Investments.
The risk in writing a call option is the market price of the underlying security increasing above the strike price and the option being exercised. The Fund must then purchase the underlying security at the higher market price and deliver it for the strike price or, if it owns the underlying security, deliver it at the strike price and forego any benefit from the increase in the price of the underlying security above the strike price. The risk in writing a put option is the market price of the underlying security decreasing below the strike price and the option being exercised. The Fund must then purchase the underlying security at the strike price when the market price of the underlying security is below the strike price. Alternatively, the Fund could also close out a written option position, in which case the risk is that the closing transaction will require a premium to be paid by the Fund that is greater than the premium the Fund received. When writing options, the Fund has the additional risk that there may be an illiquid market where the Fund is unable to close the contract. The risk in buying an option is that the Fund pays a premium for the option, and the option may be worth less than the premium paid or expire worthless.
During the reporting period, the Fund had an ending monthly average market value of $14,002,395 and $70,461,998 on written call options and written put options, respectively.
Additional associated risks to the Fund include counterparty credit risk and liquidity risk.
Swap Contracts
The Fund may enter into swap contract agreements with a counterparty to exchange a series of cash flows based on either specified reference rates, the price or volatility of asset or non-asset references, or the occurrence of a credit event, over a specified period. Swaps can be executed in a bi-lateral privately negotiated arrangement with a dealer in an OTC transaction (“OTC swaps”) or executed on a regulated market. Certain swaps, regardless of the venue of their execution, are required to be cleared through a clearinghouse (“centrally cleared swaps”). Swap contracts may include interest rate, equity, debt, index, total return, credit default, currency, and volatility swaps.
Swap contracts are reported on a schedule following the Consolidated Statement of Investments. The values of centrally cleared swap and OTC swap contracts are aggregated by positive and negative values and disclosed separately on the Consolidated Statement of Assets and Liabilities. The unrealized appreciation (depreciation) related to the change in the
|
| 76 OPPENHEIMER INTERNATIONAL BOND FUND |
6. Use of Derivatives (Continued)
valuation of the notional amount of the swap is combined with the accrued interest due to (owed by) the Fund, if any, at termination or settlement. The net change in this amount during the period is included on the Consolidated Statement of Operations. The Fund also records any periodic payments received from (paid to) the counterparty, including at termination, under such contracts as realized gain (loss) on the Consolidated Statement of Operations.
Swap contract agreements are exposed to the market risk factor of the specific underlying reference rate or asset. Swap contracts are typically more attractively priced compared to similar investments in related cash securities because they isolate the risk to one market risk factor and eliminate the other market risk factors. Investments in cash securities (for instance bonds) have exposure to multiple risk factors (credit and interest rate risk). Because swaps have embedded leverage, they can expose the Fund to substantial risk in the isolated market risk factor.
Credit Default Swap Contracts. A credit default swap is a contract that enables an investor to buy or sell protection against a defined-issuer credit event, such as the issuer’s failure to make timely payments of interest or principal on a debt security, bankruptcy or restructuring. The Fund may enter into credit default swaps either by buying or selling protection on a corporate issuer, sovereign issuer, or a basket or index of issuers (the “reference asset”).
The buyer of protection pays a periodic fee to the seller of protection based on the notional amount of the swap contract. The seller of protection agrees to compensate the buyer of protection for future potential losses as a result of a credit event on the reference asset. The contract effectively transfers the credit event risk of the reference asset from the buyer of protection to the seller of protection.
The ongoing value of the contract will fluctuate throughout the term of the contract based primarily on the credit risk of the reference asset. If the credit quality of the reference asset improves relative to the credit quality at contract initiation, the buyer of protection may have an unrealized loss greater than the anticipated periodic fee owed. This unrealized loss would be the result of current credit protection being cheaper than the cost of credit protection at contract initiation. If the buyer elects to terminate the contract prior to its maturity, and there has been no credit event, this unrealized loss will become realized. If the contract is held to maturity, and there has been no credit event, the realized loss will be equal to the periodic fee paid over the life of the contract.
If there is a credit event, the buyer of protection can exercise its rights under the contract and receive a payment from the seller of protection equal to the notional amount of the swap less the market value of specified debt securities issued by the reference asset. Upon exercise of the contract the difference between such value and the notional amount is recorded as realized gain (loss) and is included on the Consolidated Statement of Operations.
The Fund may purchase or sell credit protection through credit default swaps to increase or decrease exposure to the credit risk of individual issuers and/or indexes of issuers that are either unavailable or considered to be less attractive in the bond market.
The Fund has engaged in spread curve trades by simultaneously purchasing and selling
|
| 77 OPPENHEIMER INTERNATIONAL BOND FUND |
NOTES TO
CONSOLIDATED FINANCIAL STATEMENTS Continued
6. Use of Derivatives (Continued)
protection through credit default swaps referenced to the same reference asset but with different maturities. Spread curve trades attempt to gain exposure to credit risk on a forward basis by realizing gains on the expected differences in spreads.
For the reporting period, the Fund had ending monthly average notional amounts of $352,307,441 and $163,409,767 on credit default swaps to buy protection and credit default swaps to sell protection, respectively.
Additional associated risks to the Fund include counterparty credit risk and liquidity risk.
Interest Rate Swap Contracts. An interest rate swap is an agreement between counterparties to exchange periodic payments based on interest rates. One cash flow stream will typically be a floating rate payment based upon a specified floating interest rate while the other is typically a fixed interest rate.
The Fund may enter into interest rate swaps in which it pays the fixed or floating interest rate in order to increase or decrease exposure to interest rate risk. Typically, if relative interest rates rise, floating payments under a swap agreement will be greater than the fixed payments.
For the reporting period, the Fund had ending monthly average notional amounts of $1,087,343,875 and $2,577,886,552 on interest rate swaps which pay a fixed rate and interest rate swaps which receive a fixed rate, respectively.
Additional associated risks to the Fund include counterparty credit risk and liquidity risk.
Total Return Swap Contracts. A total return swap is an agreement between counterparties to exchange periodic payments based on the value of asset or non-asset references. One cash flow is typically based on a non-asset reference (such as an interest rate) and the other on the total return of a reference asset (such as a security or a basket of securities or securities index). The total return of the reference asset typically includes appreciation or depreciation on the reference asset, plus any interest or dividend payments.
Total return swap contracts are exposed to the market risk factor of the specific underlying financial instrument or index. Total return swaps are less standard in structure than other types of swaps and can isolate and/or include multiple types of market risk factors including equity risk, credit risk, and interest rate risk.
The Fund may enter into total return swaps to increase or decrease exposure to the credit risk of various indexes or basket of securities. These credit risk related total return swaps require the Fund to pay to, or receive payments from, the counterparty based on the movement of credit spreads of the related indexes or securities.
For the reporting period, the Fund had ending monthly average notional amounts of $63,672,901 which are long the reference.
Additional associated risks to the Fund include counterparty credit risk and liquidity risk.
Swaption Transactions
The Fund may enter into a swaption contract which grants the purchaser the right, but not the obligation, to enter into a swap transaction at preset terms detailed in the underlying agreement within a specified period of time. The purchaser pays a premium to the swaption writer who bears the risk of unfavorable changes in the preset terms on the underlying swap.
|
| 78 OPPENHEIMER INTERNATIONAL BOND FUND |
6. Use of Derivatives (Continued)
Purchased swaptions are reported as a component of investments in the Consolidated Statement of Investments and the Consolidated Statement of Assets and Liabilities. Written swaptions are reported on a schedule following the Consolidated Statement of Investments and their value is reported as a separate asset or liability line item in the Consolidated Statement of Assets and Liabilities. The net change in unrealized appreciation or depreciation on written swaptions is separately reported in the Consolidated Statement of Operations. When a swaption is exercised, the cost of the swap is adjusted by the amount of premium paid or received. Upon the expiration or closing of an unexercised swaption contract, a gain or loss is reported in the Consolidated Statement of Operations for the amount of the premium paid or received.
The Fund generally will incur a greater risk when it writes a swaption than when it purchases a swaption. When the Fund writes a swaption it will become obligated, upon exercise of the swaption, according to the terms of the underlying agreement. Swaption contracts written by the Fund do not give rise to counterparty credit risk prior to exercise as they obligate the Fund, not its counterparty, to perform. When the Fund purchases a swaption it only risks losing the amount of the premium it paid if the swaption expires unexercised. However, when the Fund exercises a purchased swaption there is a risk that the counterparty will fail to perform or otherwise default on its obligations under the swaption contract.
The Fund may purchase swaptions which give it the option to enter into an interest rate swap in which it pays a floating or fixed interest rate and receives a fixed or floating interest rate in order to increase or decrease exposure to interest rate risk. Purchasing the fixed portion of this swaption becomes more valuable as the reference interest rate decreases relative to the preset interest rate. Purchasing the floating portion of this swaption becomes more valuable as the reference interest rate increases relative to the preset interest rate.
The Fund may purchase swaptions which give it the option to buy or sell credit protection through credit default swaps in order to decrease or increase exposure to the credit risk of individual issuers and/ or indexes of issuers. A swaption selling protection becomes more valuable as the likelihood of a credit event on the reference asset decreases. A swaption buying protection becomes more valuable as the likelihood of a credit event on the reference asset increases.
The Fund may write swaptions which give it the obligation, if exercised by the purchaser, to enter into an interest rate swap in which it pays a fixed or floating interest rate and receives a floating or fixed interest rate in order to increase or decrease exposure to interest rate risk. A written swaption paying a fixed rate becomes more valuable as the reference interest rate increases relative to the preset interest rate. A written swaption paying a floating rate becomes more valuable as the reference interest rate decreases relative to the preset interest rate.
The Fund may write swaptions which give it the obligation, if exercised by the purchaser, to sell or buy credit protection through credit default swaps in order to increase or decrease exposure to the credit risk of individual issuers and/or indexes of issuers. A written swaption selling protection becomes more valuable as the likelihood of a credit event on the reference asset decreases. A written swaption buying protection becomes more valuable as the
|
| 79 OPPENHEIMER INTERNATIONAL BOND FUND |
NOTES TO
CONSOLIDATED FINANCIAL STATEMENTS Continued
6. Use of Derivatives (Continued)
likelihood of a credit event on the reference asset increases.
During the reporting period, the Fund had an ending monthly average market value of $109,165,663 and $60,470,384 on purchased and written swaptions, respectively.
Counterparty Credit Risk. Derivative positions are subject to the risk that the counterparty will not fulfill its obligation to the Fund. The Fund intends to enter into derivative transactions with counterparties that the Manager believes to be creditworthy at the time of the transaction.
The Fund’s risk of loss from counterparty credit risk on OTC derivatives is generally limited to the aggregate unrealized gain netted against any collateral held by the Fund. For OTC options purchased, the Fund bears the risk of loss of the amount of the premiums paid plus the positive change in market values net of any collateral held by the Fund should the counterparty fail to perform under the contracts. Options written by the Fund do not typically give rise to counterparty credit risk, as options written generally obligate the Fund and not the counterparty to perform.
To reduce counterparty risk with respect to OTC transactions, the Fund has entered into master netting arrangements, established within the Fund’s International Swap and Derivatives Association, Inc. (“ISDA”) master agreements, which allow the Fund to make (or to have an entitlement to receive) a single net payment in the event of default (close-out netting) for outstanding payables and receivables with respect to certain OTC positions in swaps, options, swaptions, and forward currency exchange contracts for each individual counterparty. In addition, the Fund may require that certain counterparties post cash and/or securities in collateral accounts to cover their net payment obligations for those derivative contracts subject to ISDA master agreements. If the counterparty fails to perform under these contracts and agreements, the cash and/or securities will be made available to the Fund.
ISDA master agreements include credit related contingent features which allow counterparties to OTC derivatives to terminate derivative contracts prior to maturity in the event that, for example, the Fund’s net assets decline by a stated percentage or the Fund fails to meet the terms of its ISDA master agreements, which would cause the Fund to accelerate payment of any net liability owed to the counterparty.
For financial reporting purposes, the Fund does not offset derivative assets and derivative liabilities that are subject to netting arrangements in the Consolidated Statement of Assets and Liabilities. Bankruptcy or insolvency laws of a particular jurisdiction may impose restrictions on or prohibitions against the right of offset in bankruptcy, insolvency or other events.
The Fund’s risk of loss from counterparty credit risk on exchange-traded derivatives cleared through a clearinghouse and for centrally cleared swaps is generally considered lower than as compared to OTC derivatives. However, counterparty credit risk exists with respect to initial and variation margin deposited/paid by the Fund that is held in futures commission merchant, broker and/or clearinghouse accounts for such exchange-traded derivatives and for centrally cleared swaps.
With respect to centrally cleared swaps, such transactions will be submitted for clearing,
|
| 80 OPPENHEIMER INTERNATIONAL BOND FUND |
6. Use of Derivatives (Continued)
and if cleared, will be held in accounts at futures commission merchants or brokers that are members of clearinghouses. While brokers, futures commission merchants and clearinghouses are required to segregate customer margin from their own assets, in the event that a broker, futures commission merchant or clearinghouse becomes insolvent or goes into bankruptcy and at that time there is a shortfall in the aggregate amount of margin held by the broker, futures commission merchant or clearinghouse for all its customers, U.S. bankruptcy laws will typically allocate that shortfall on a pro-rata basis across all the broker’s, futures commission merchant’s or clearinghouse’s customers, potentially resulting in losses to the Fund.
There is the risk that a broker, futures commission merchant or clearinghouse will decline to clear a transaction on the Fund’s behalf, and the Fund may be required to pay a termination fee to the executing broker with whom the Fund initially enters into the transaction. Clearinghouses may also be permitted to terminate centrally cleared swaps at any time. The Fund is also subject to the risk that the broker or futures commission merchant will improperly use the Fund’s assets deposited/paid as initial or variation margin to satisfy payment obligations of another customer. In the event of a default by another customer of the broker or futures commission merchant, the Fund might not receive its variation margin payments from the clearinghouse, due to the manner in which variation margin payments are aggregated for all customers of the broker/futures commission merchant.
Collateral and margin requirements differ by type of derivative. Margin requirements are established by the broker, futures commission merchant or clearinghouse for exchange-traded and cleared derivatives, including centrally cleared swaps. Brokers, futures commission merchants and clearinghouses can ask for margin in excess of the regulatory minimum, or increase the margin amount, in certain circumstances.
Collateral terms are contract specific for OTC derivatives. For derivatives traded under an ISDA master agreement, the collateral requirements are typically calculated by netting the mark to market amount for each transaction under such agreement and comparing that amount to the value of any collateral currently pledged by the Fund or the counterparty.
For financial reporting purposes, cash collateral that has been pledged to cover obligations of the Fund, if any, is reported separately on the Consolidated Statement of Assets and Liabilities as cash pledged as collateral. Non-cash collateral pledged by the Fund, if any, is noted in the Consolidated Statement of Investments. Generally, the amount of collateral due from or to a party must exceed a minimum transfer amount threshold (e.g., $250,000) before a transfer has to be made. To the extent amounts due to the Fund from its counterparties are not fully collateralized, contractually or otherwise, the Fund bears the risk of loss from counterparty nonperformance.
The following table presents by counterparty the Fund’s OTC derivative assets net of the related collateral pledged by the Fund at period end:
|
| 81 OPPENHEIMER INTERNATIONAL BOND FUND |
NOTES TO
CONSOLIDATED FINANCIAL STATEMENTS Continued
6. Use of Derivatives (Continued)
| | | | | | | | | | | | | | | | | | | | |
| | | | | | Gross Amounts Not Offset in the Consolidated
Statement of Assets & Liabilities | | | | |
| Counterparty | | Gross Amounts
Not Offset in the
Consolidated
Statement
of Assets &
Liabilities* | | | Financial
Instruments
Available for
Offset | | | Financial
Instruments
Collateral
Received** | | | Cash Collateral
Received** | | | Net Amount | |
Bank of America NA | | $ | 22,562,955 | | | $ | (22,562,955) | | | $ | – | | | $ | – | | | $ | – | |
Barclays Bank plc | | | 947,919 | | | | (947,919) | | | | – | | | | – | | | | – | |
BNP Paribas | | | 96,952 | | | | (96,952) | | | | – | | | | – | | | | – | |
Citibank NA | | | 13,548,166 | | | | (13,548,166) | | | | – | | | | – | | | | – | |
Deutsche Bank AG | | | 5,017,917 | | | | (5,017,917) | | | | – | | | | – | | | | – | |
Goldman Sachs Bank USA | | | 41,531,031 | | | | (41,531,031) | | | | – | | | | – | | | | – | |
Goldman Sachs International | | | 531,418 | | | | (531,418) | | | | – | | | | – | | | | – | |
HSBC Bank USA NA | | | 476,062 | | | | (476,062) | | | | – | | | | – | | | | – | |
JPMorgan Chase Bank NA | | | 84,358,075 | | | | (84,358,075) | | | | – | | | | – | | | | – | |
Standard Chartered Bank | | | 1,338,302 | | | | (1,338,302) | | | | – | | | | – | | | | – | |
| | | | |
| | $ | 170,408,797 | | | $ | (170,408,797) | | | $ | – | | | $ | – | | | $ | – | |
| | | | |
| | | | |
*OTC derivatives are reported gross on the Consolidated Statement of Assets and Liabilities. Exchange traded options and margin related to centrally cleared swaps and futures, if any, are excluded from these reported amounts.
**Reported collateral posted for the benefit of the Fund within this table is limited to the net outstanding amount due from an individual counterparty. The collateral posted for the benefit of the Fund may exceed these amounts.
The following table presents by counterparty the Fund’s OTC derivative liabilities net of the related collateral pledged by the Fund at period end:
| | | | | | | | | | | | | | | | | | | | |
| | | | | | Gross Amounts Not Offset in the Consolidated
Statement of Assets & Liabilities | | | | |
| Counterparty | | Gross Amounts
Not Offset in the
Consolidated
Statement
of Assets &
Liabilities* | | | Financial
Instruments
Available for
Offset | | | Financial
Instruments
Collateral
Pledged** | | | Cash Collateral
Pledged** | | | Net Amount | |
Bank of America NA | | $ | (37,183,047) | | | $ | 22,562,955 | | | $ | 6,353,889 | | | $ | – | | | $ | (8,266,203) | |
Barclays Bank plc | | | (35,723,176) | | | | 947,919 | | | | 32,641,594 | | | | – | | | | (2,133,663) | |
BNP Paribas | | | (154,354) | | | | 96,952 | | | | – | | | | – | | | | (57,402) | |
Citibank NA | | | (53,260,128) | | | | 13,548,166 | | | | 39,711,962 | | | | – | | | | – | |
Deutsche Bank AG | | | (18,625,999) | | | | 5,017,917 | | | | 10,748,082 | | | | 2,860,000 | | | | – | |
Goldman Sachs Bank USA | | | (74,340,152) | | | | 41,531,031 | | | | 964,430 | | | | 29,213,203 | | | | (2,631,488) | |
Goldman Sachs International | | | (6,605,453) | | | | 531,418 | | | | 1,282,920 | | | | 270,000 | | | | (4,521,115) | |
HSBC Bank USA NA | | | (1,659,572) | | | | 476,062 | | | | 371,241 | | | | – | | | | (812,269) | |
|
| 82 OPPENHEIMER INTERNATIONAL BOND FUND |
6. Use of Derivatives (Continued)
| | | | | | | | | | | | | | | | | | | | |
| | | | | | Gross Amounts Not Offset in the Consolidated
Statement of Assets & Liabilities | | | | |
| Counterparty | | Gross Amounts
Not Offset in the
Consolidated
Statement
of Assets &
Liabilities* | | | Financial
Instruments
Available for
Offset | | | Financial
Instruments
Collateral
Pledged** | | | Cash Collateral
Pledged** | | | Net Amount | |
JPMorgan Chase Bank NA | | $ | (85,686,522) | | | $ | 84,358,075 | | | $ | — | | | $ | 1,328,447 | | | $ | – | |
Standard Chartered Bank | | | (5,622,798) | | | | 1,338,302 | | | | 929,421 | | | | 1,390,000 | | | | (1,965,075) | |
| | | | |
| | $ | (318,861,201) | | | $ | 170,408,797 | | | $ | 93,003,539 | | | $ | 35,061,650 | | | $ | (20,387,215) | |
| | | | |
| | | | |
*OTC derivatives are reported gross on the Consolidated Statement of Assets and Liabilities. Exchange traded options and margin related to centrally cleared swaps and futures, if any, are excluded from these reported amounts.
**Reported collateral pledged within this table is limited to the net outstanding amount due from the Fund. The securities pledged as collateral by the Fund as reported on the Consolidated Statement of Investments may exceed these amounts.
The following table presents the valuations of derivative instruments by risk exposure as reported within the Consolidated Statement of Assets and Liabilities at period end:
| | | | | | | | | | | | |
| | | Asset Derivatives | | | Liability Derivatives | |
Derivatives Not Accounted for as Hedging Instruments | | Consolidated
Statement of Assets
and Liabilities Location | | Value | | | Consolidated
Statement of Assets
and Liabilities Location | | Value | |
Credit contracts | | Swaps, at value | | $ | 1,114,919 | | | Swaps, at value | | $ | 9,463,513 | |
Interest rate contracts | | Swaps, at value | | | 2,455,588 | | | Swaps, at value | | | 2,921,059 | |
Interest rate contracts | | Centrally cleared swaps, at value | | | 5,635,312 | | | Centrally cleared swaps, at value | | | 11,053,412 | |
Credit contracts | | Centrally cleared swaps, at value | | | 6,443,017 | | | Centrally cleared swaps, at value | | | 2,669,457 | |
| Interest rate contracts | | Variation margin receivable | | | 406,375* | | | Variation margin receivable | | | 2,792,030* | |
| Forward currency exchange contracts | | Unrealized appreciation on forward currency exchange contracts | | | 53,193,068 | | | Unrealized depreciation on forward currency exchange contracts | | | 126,276,907 | |
| Equity contracts | | | | | | | | Options written, at value | | | 2,390,913 | |
| Forward currency exchange contracts | | | | | | | | Options written, at value | | | 139,497,656 | |
| Credit contracts | | | | | | | | Swaptions written, at value | | | 41,394 | |
| Interest rate contracts | | | | | | | | Swaptions written, at value | | | 38,269,759 | |
| Credit contracts | | Investments, at value | | | 67,701** | | | | | | | |
| Equity contracts | | Investments, at value | | | 5,899,204** | | | | | | | |
| Forward currency exchange contracts | | Investments, at value | | | 42,000,013** | | | | | | | |
Interest rate contracts | | Investments, at value | | | 65,678,304** | | | | | | | |
| | | | | | | | | | | | |
Total | | | | $ | 182,893,501 | | | | | $ | 335,376,100 | |
| | | | | | | | | | | | |
*Includes only the current day’s variation margin. Prior variation margin movements have been reflected in cash on the Consolidated Statement of Assets and Liabilities upon receipt or payment.
|
| 83 OPPENHEIMER INTERNATIONAL BOND FUND |
NOTES TO
CONSOLIDATED FINANCIAL STATEMENTS Continued
6. Use of Derivatives (Continued)
**Amounts relate to purchased option contracts and purchased swaption contracts, if any.
The effect of derivative instruments on the Consolidated Statement of Operations is as follows:
| | | | | | | | | | | | | | | | |
Amount of Realized Gain or (Loss) Recognized on Derivatives | |
Derivatives Not Accounted for as Hedging Instruments | | Investment
transactions
in unaffiliated
companies* | | | Swaption
contracts
written | | | Option
contracts
written | | | Futures
contracts | |
Credit contracts | | $ | (2,490,686) | | | $ | 5,007,462 | | | $ | — | | | $ | — | |
Equity contracts | | | (2,000,590) | | | | — | | | | — | | | | — | |
Forward currency exchange contracts | | | (39,236,465) | | | | — | | | | (49,065,363) | | | | — | |
Interest rate contracts | | | (3,831,605) | | | | 12,565,939 | | | | (828,879) | | | | (660,719) | |
| | | | |
Total | | $ | (47,559,346) | | | $ | 17,573,401 | | | $ | (49,894,242) | | | $ | (660,719) | |
| | | | |
| | | | | | | | | | | | |
Amount of Realized Gain or (Loss) Recognized on Derivatives | |
Derivatives Not Accounted for as Hedging Instruments | | Forward
currency
exchange
contracts | | | Swap contracts | | | Total | |
Credit contracts | | $ | — | | | $ | 6,356,369 | | | $ | 8,873,145 | |
Equity contracts | | | — | | | | — | | | | (2,000,590) | |
Forward currency exchange contracts | | | 144,830,851 | | | | — | | | | 56,529,023 | |
Interest rate contracts | | | — | | | | (10,102,401) | | | | (2,857,665) | |
| | | | |
Total | | $ | 144,830,851 | | | $ | (3,746,032) | | | $ | 60,543,913 | |
| | | | |
*Includes purchased option contracts and purchased swaption contracts, if any.
| | | | | | | | | | | | | | | | |
Amount of Change in Unrealized Gain or (Loss) Recognized on Derivatives | |
Derivatives Not Accounted for as Hedging Instruments | | Investment
transactions
in unaffiliated
companies* | | | Option
contracts
written | | | Swaption
contracts
written | | | Futures
contracts | |
Credit contracts | | $ | 837,370 | | | $ | – | | | $ | 383,129 | | | $ | — | |
Equity contracts | | | 5,899,204 | | | | 1,271,738 | | | | — | | | | — | |
Forward currency exchange contracts | | | 42,000,013 | | | | (17,347,119) | | | | — | | | | — | |
Interest rate contracts | | | 3,249,600 | | | | – | | | | 2,418,170 | | | | 4,982,036 | |
| | | | |
Total | | $ | 51,986,187 | | | $ | (16,075,381) | | | $ | 2,801,299 | | | $ | 4,982,036 | |
| | | | |
|
| 84 OPPENHEIMER INTERNATIONAL BOND FUND |
6. Use of Derivatives (Continued)
| | | | | | | | | | | | |
Amount of Change in Unrealized Gain or (Loss) Recognized on Derivatives | |
Derivatives Not Accounted for as Hedging Instruments | | Forward
currency
exchange
contracts | | | Swap contracts | | | Total | |
Credit contracts | | $ | — | | | $ | (13,717,549) | | | $ | (12,497,050) | |
Equity contracts | | | — | | | | — | | | | 7,170,942 | |
Forward currency exchange contracts | | | (65,742,493) | | | | — | | | | (41,089,599) | |
Interest rate contracts | | | — | | | | (1,836,915) | | | | 8,812,891 | |
| | | | |
Total | | $ | (65,742,493) | | | $ | (15,554,464) | | | $ | (37,602,816) | |
| | | | |
*Includes purchased option contracts and purchased swaption contracts, if any.
7. Shares of Beneficial Interest
The Fund has authorized an unlimited number of $0.001 par value shares of beneficial interest of each class. Transactions in shares of beneficial interest were as follows:
| | | | | | | | | | | | | | | | |
| | | Year Ended September 30, 2018 | | | Year Ended September 30, 2017 | |
| | | Shares | | | Amount | | | Shares | | | Amount | |
Class A | | | | | | | | | | | | | | | | |
Sold1 | | | 42,674,811 | | | $ | 249,905,235 | | | | 33,215,903 | | | $ | 192,596,948 | |
Dividends and/or distributions reinvested | | | 8,272,570 | | | | 48,015,112 | | | | 10,118,544 | | | | 58,513,744 | |
Redeemed | | | (68,276,202) | | | | (396,073,859) | | | | (99,000,839) | | | | (572,327,683) | |
| | | | |
Net decrease | | | (17,328,821) | | | $ | (98,153,512) | | | | (55,666,392) | | | $ | (321,216,991) | |
| | | | |
|
| |
Class B | | | | | | | | | | | | | | | | |
Sold | | | 4,820 | | | $ | 28,765 | | | | 49,514 | | | $ | 288,493 | |
Dividends and/or distributions reinvested | | | 11,786 | | | | 70,078 | | | | 69,721 | | | | 400,047 | |
Redeemed1 | | | (1,077,352) | | | | (6,384,415) | | | | (2,132,370) | | | | (12,283,079) | |
| | | | |
Net decrease | | | (1,060,746) | | | $ | (6,285,572) | | | | (2,013,135) | | | $ | (11,594,539) | |
| | | | |
|
| |
Class C | | | | | | | | | | | | | | | | |
Sold | | | 5,778,272 | | | $ | 33,966,614 | | | | 3,277,871 | | | $ | 18,916,038 | |
Dividends and/or distributions reinvested | | | 1,921,742 | | | | 11,113,665 | | | | 2,356,675 | | | | 13,573,517 | |
Redeemed | | | (16,515,106) | | | | (95,357,594) | | | | (26,515,697) | | | | (152,572,012) | |
| | | | |
Net decrease | | | (8,815,092) | | | $ | (50,277,315) | | | | (20,881,151) | | | $ | (120,082,457) | |
| | | | |
|
| |
Class I | | | | | | | | | | | | | | | | |
Sold | | | 172,301,770 | | | $ | 980,079,104 | | | | 47,001,372 | | | $ | 271,989,516 | |
Dividends and/or distributions reinvested | | | 9,948,927 | | | | 57,437,582 | | | | 11,314,777 | | | | 65,348,110 | |
Redeemed | | | (126,133,503) | | | | (714,521,167) | | | | (131,938,102) | | | | (756,543,141) | |
| | | | |
Net increase (decrease) | | | 56,117,194 | | | $ | 322,995,519 | | | | (73,621,953) | | | $ | (419,205,515) | |
| | | | |
|
| 85 OPPENHEIMER INTERNATIONAL BOND FUND |
NOTES TO
CONSOLIDATED FINANCIAL STATEMENTS Continued
7. Shares of Beneficial Interest (Continued)
| | | | | | | | | | | | | | | | |
| | | Year Ended September 30, 2018 | | | Year Ended September 30, 2017 | |
| | | Shares | | | Amount | | | Shares | | | Amount | |
Class R | | | | | | | | | | | | | | | | |
Sold | | | 4,559,765 | | | $ | 26,435,800 | | | | 3,635,144 | | | $ | 20,971,449 | |
Dividends and/or distributions reinvested | | | 829,378 | | | | 4,793,502 | | | | 947,336 | | | | 5,465,034 | |
Redeemed | | | (5,911,392) | | | | (34,303,537) | | | | (7,177,948) | | | | (41,342,243) | |
| | | | |
Net decrease | | | (522,249) | | | $ | (3,074,235) | | | | (2,595,468) | | | $ | (14,905,760) | |
| | | | |
|
| |
Class Y | | | | | | | | | | | | | | | | |
Sold | | | 214,651,641 | | | $ | 1,260,130,600 | | | | 129,553,202 | | | $ | 752,409,177 | |
Dividends and/or distributions reinvested | | | 19,137,649 | | | | 110,695,020 | | | | 16,240,485 | | | | 94,081,754 | |
Redeemed | | | (153,046,264) | | | | (873,927,206) | | | | (99,816,640) | | | | (576,274,909) | |
| | | | |
Net increase | | | 80,743,026 | | | $ | 496,898,414 | | | | 45,977,047 | | | $ | 270,216,022 | |
| | | | |
1. All outstanding Class B shares converted to Class A shares on June 1, 2018
8. Purchases and Sales of Securities
The aggregate cost of purchases and proceeds from sales of securities, other than short-term obligations and investments in IGMMF, for the reporting period were as follows:
| | | | | | | | |
| | | Purchases | | | Sales | |
Investment securities | | | $5,849,871,051 | | | | $5,468,038,797 | |
U.S. government and government agency obligations | | | 113,260,286 | | | | 118,040,360 | |
9. Fees and Other Transactions with Affiliates
Management Fees. Under the investment advisory agreement, the Fund pays the Manager a management fee based on the daily net assets of the Fund at an annual rate as shown in the following table:
| | | | |
| Fee Schedule | | | |
Up to $200 million | | | 0.75% | |
Next $200 million | | | 0.72 | |
Next $200 million | | | 0.69 | |
Next $200 million | | | 0.66 | |
Next $200 million | | | 0.60 | |
Next $4 billion | | | 0.50 | |
Next $10 billion | | | 0.48 | |
Over $15 billion | | | 0.45 | |
The Manager also provides investment management related services to the Subsidiary. The Subsidiary pays the Manager a monthly management fee at an annual rate according to the above schedule. The Subsidiary also pays certain other expenses including custody and directors’ fees.
The Fund’s effective management fee for the reporting period was 0.53% of average annual net assets before any Subsidiary management fees or any applicable waivers.
|
| 86 OPPENHEIMER INTERNATIONAL BOND FUND |
9. Fees and Other Transactions with Affiliates (Continued)
Sub-Adviser Fees. The Manager has retained the Sub-Adviser to provide the day-to-day portfolio management of the Fund and the Subsidiary. Under the Sub-Advisory Agreement, the Manager pays the Sub-Adviser an annual fee in monthly installments, equal to a percentage of the investment management fee collected by the Manager from the Fund and the Subsidiary, which shall be calculated after any investment management fee waivers. The fee paid to the Sub-Adviser is paid by the Manager, not by the Fund.
Transfer Agent Fees. OFI Global (the “Transfer Agent”) serves as the transfer and shareholder servicing agent for the Fund. The Fund pays the Transfer Agent a fee based on annual net assets, which shall be calculated after any applicable fee waivers. Fees incurred and average net assets for each class with respect to these services are detailed in the Consolidated Statement of Operations and Consolidated Financial Highlights, respectively.
Sub-Transfer Agent Fees. The Transfer Agent has retained Shareholder Services, Inc., a wholly-owned subsidiary of OFI (the “Sub-Transfer Agent”), to provide the day-to-day transfer agent and shareholder servicing of the Fund. Under the Sub-Transfer Agency Agreement, the Transfer Agent pays the Sub-Transfer Agent an annual fee in monthly installments, equal to a percentage of the transfer agent fee collected by the Transfer Agent from the Fund, which shall be calculated after any applicable fee waivers. The fee paid to the Sub-Transfer Agent is paid by the Transfer Agent, not by the Fund.
Trustees’ Compensation. The Fund’s Board of Trustees (“Board”) has adopted a compensation deferral plan for Independent Trustees that enables Trustees to elect to defer receipt of all or a portion of the annual compensation they are entitled to receive from the Fund. For purposes of determining the amount owed to the Trustees under the plan, deferred amounts are treated as though equal dollar amounts had been invested in shares of the Fund or in other Oppenheimer funds selected by the Trustees. The Fund purchases shares of the funds selected for deferral by the Trustees in amounts equal to his or her deemed investment, resulting in a Fund asset equal to the deferred compensation liability. Such assets are included as a component of “Other” within the asset section of the Consolidated Statement of Assets and Liabilities. Deferral of Trustees’ fees under the plan will not affect the net assets of the Fund and will not materially affect the Fund’s assets, liabilities or net investment income per share. Amounts will be deferred until distributed in accordance with the compensation deferral plan.
Distribution and Service Plan (12b-1) Fees. Under its General Distributor’s Agreement with the Fund, OppenheimerFunds Distributor, Inc. (the “Distributor”) acts as the Fund’s principal underwriter in the continuous public offering of the Fund’s classes of shares.
Service Plan for Class A Shares. The Fund has adopted a Service Plan (the “Plan”) for Class A shares pursuant to Rule 12b-1 under the 1940 Act. Under the Plan, the Fund reimburses the Distributor for a portion of its costs incurred for services provided to accounts
|
| 87 OPPENHEIMER INTERNATIONAL BOND FUND |
NOTES TO
CONSOLIDATED FINANCIAL STATEMENTS Continued
9. Fees and Other Transactions with Affiliates (Continued)
that hold Class A shares. Reimbursement is made periodically at an annual rate of up to 0.25% of the daily net assets of Class A shares of the Fund. The Distributor currently uses all of those fees to pay dealers, brokers, banks and other financial institutions periodically for providing personal service and maintenance of accounts of their customers that hold Class A shares. Any unreimbursed expenses the Distributor incurs with respect to Class A shares in any fiscal year cannot be recovered in subsequent periods. Fees incurred by the Fund under the Plan are detailed in the Consolidated Statement of Operations.
Distribution and Service Plans for Class B, Class C and Class R Shares. The Fund has adopted Distribution and Service Plans (the “Plans”) for Class C and Class R shares, and had previously adopted a similar plan for Class B shares, pursuant to Rule 12b-1 under the 1940 Act to compensate the Distributor for distributing those share classes, maintaining accounts and providing shareholder services. Under the Plans, the Fund pays the Distributor an annual asset-based sales charge of 0.75% on Class C shares’ daily net assets and 0.25% on Class R shares’ daily net assets. The Fund paid the Distributor an annual asset-based sales charge of 0.75% on Class B shares prior to their Conversion Date. The Fund also pays a service fee under the Plans at an annual rate of 0.25% of daily net assets and previously paid this fee for Class B prior to their Conversion Date. The Plans continue in effect from year to year only if the Fund’s Board of Trustees votes annually to approve their continuance at an in person meeting called for that purpose. Fees incurred by the Fund under the Plans are detailed in the Consolidated Statement of Operations.
Sales Charges. Front-end sales charges and CDSC do not represent expenses of the Fund. They are deducted from the proceeds of sales of Fund shares prior to investment or from redemption proceeds prior to remittance, as applicable. The sales charges retained by the Distributor from the sale of shares and the CDSC retained by the Distributor on the redemption of shares is shown in the following table for the period indicated.
| | | | | | | | | | | | | | | | | | | | |
| Year Ended | | Class A
Front-End
Sales Charges
Retained by
Distributor | | | Class A
Contingent
Deferred
Sales Charges
Retained by
Distributor | | | Class B
Contingent
Deferred
Sales Charges
Retained by
Distributor1 | | | Class C
Contingent
Deferred
Sales Charges
Retained by
Distributor | | | Class R
Contingent
Deferred
Sales Charges
Retained by
Distributor | |
| |
| September 30, 2018 | | | $140,597 | | | | $7,772 | | | | $2,986 | | | | $13,161 | | | | $— | |
1. Effective June 1, 2018, all Class B shares converted to Class A shares.
Waivers and Reimbursements of Expenses. The Manager has contractually agreed to waive the management fee it receives from the Fund in an amount equal to the management fee it receives from the Subsidiary. During the reporting period, the Manager waived $768,097. This fee waiver and/or expense reimbursement may not be amended or withdrawn for one year from the date of the Fund’s prospectus, unless approved by the Board.
Effective for the period January 1, 2017 through December 31, 2017, the Transfer
|
| 88 OPPENHEIMER INTERNATIONAL BOND FUND |
9. Fees and Other Transactions with Affiliates (Continued)
Agent voluntarily waived and/or reimbursed Fund expenses in an amount equal to 0.015% of average annual net assets for Classes A, B, C, R and Y.
During the reporting period, the Transfer Agent waived fees and/or reimbursed the Fund for transfer agent and shareholder servicing agent fees as follows:
| | | | |
Class A | | $ | 47,689 | |
Class B1 | | | 185 | |
Class C | | | 13,715 | |
Class R | | | 4,868 | |
Class Y | | | 88,986 | |
1. Effective June 1, 2018, all Class B shares converted to Class A shares.
The Manager will waive fees and/or reimburse Fund expenses in an amount equal to the indirect management fees incurred through the Fund’s investment in IGMMF. During the reporting period, the Manager waived fees and/or reimbursed the Fund $375,074 for IGMMF management fees. This fee waiver and/or expense reimbursement may not be amended or withdrawn for one year from the date of the Fund’s prospectus, unless approved by the Board.
Cross-Trades. The Fund is permitted to purchase and sell securities from and to other Funds managed by the Manager (“cross-trade”) pursuant to “Cross-Trading” Procedures adopted by the Fund’s Board of Trustees. These procedures are designed to ensure that any cross-trade of securities between Funds or between a Fund and another account or private fund that is an affiliate of the Fund solely by virtue of having a common investment adviser, common trustee/ director or common officer complies with Rule 17a-7 under the 1940 Act. Further, as defined under these procedures, each cross-trade is effected at the current market price.
During the period, the Fund had $171,274,837 in purchases and $37,170,960 in sales considered cross-trades, resulting in $2,056,019 of realized gain/(loss).
10. Borrowings and Other Financing
Joint Credit Facility. A number of mutual funds managed by the Manager participate in a $1.95 billion revolving credit facility (the “Facility”) intended to provide short-term financing, if necessary, subject to certain restrictions in connection with atypical redemption activity. Expenses and fees related to the Facility are paid by the participating funds and are disclosed separately or as other expenses on the Consolidated Statement of Operations. The Fund did not utilize the Facility during the reporting period.
11. Subsequent Event
On October 18, 2018, Massachusetts Mutual Life Insurance Company (“MassMutual”), an indirect corporate parent of the Sub-Adviser and the Manager announced that it has entered into a definitive agreement, whereby Invesco Ltd. (“Invesco”), a global investment management company, will acquire the Sub-Adviser. As of the time of the announcement, the
|
| 89 OPPENHEIMER INTERNATIONAL BOND FUND |
NOTES TO
CONSOLIDATED FINANCIAL STATEMENTS Continued
11. Subsequent Event (Continued)
transaction is expected to close in the second quarter of 2019, pending necessary regulatory and other third-party approvals. This is subject to change.
|
| 90 OPPENHEIMER INTERNATIONAL BOND FUND |
REPORT OF INDEPENDENT REGISTERED PUBLIC ACCOUNTING FIRM
To the Shareholders and Board of Trustees
Oppenheimer International Bond Fund:
Opinion on the Consolidated Financial Statements
We have audited the accompanying consolidated statement of assets and liabilities of Oppenheimer International Bond Fund (the “Fund”) and subsidiary, including the consolidated statement of investments, as of September 30, 2018, the related consolidated statement of operations for the year then ended, the consolidated statements of changes in net assets for each of the years in the two year period then ended, and the related consolidated notes (collectively, the “consolidated financial statements”) and the consolidated financial highlights for each of the years in the five year period then ended. In our opinion, the consolidated financial statements and consolidated financial highlights present fairly, in all material respects, the consolidated financial position of the Fund and subsidiary as of September 30, 2018, the results of their consolidated operations for the year then ended, the changes in their consolidated net assets for each of the years in the two year period then ended, and the consolidated financial highlights for each of the years in the five year period then ended, in conformity with U.S. generally accepted accounting principles.
Basis for Opinion
These consolidated financial statements and consolidated financial highlights are the responsibility of the Fund’s management. Our responsibility is to express an opinion on these consolidated financial statements and consolidated financial highlights based on our audits. We are a public accounting firm registered with the Public Company Accounting Oversight Board (United States) (“PCAOB”) and are required to be independent with respect to the Fund and subsidiary in accordance with the U.S. federal securities laws and the applicable rules and regulations of the Securities and Exchange Commission and the PCAOB.
We conducted our audits in accordance with the standards of the PCAOB. Those standards require that we plan and perform the audit to obtain reasonable assurance about whether the consolidated financial statements and consolidated financial highlights are free of material misstatement, whether due to error or fraud. Our audits included performing procedures to assess the risks of material misstatement of the consolidated financial statements and consolidated financial highlights, whether due to error or fraud, and performing procedures that respond to those risks. Such procedures included examining, on a test basis, evidence regarding the amounts and disclosures in the consolidated financial statements and consolidated financial highlights. Such procedures also included confirmation of securities owned as of September 30, 2018, by correspondence with the custodian, brokers and the transfer agent, or by other appropriate auditing procedures. Our audits also included evaluating the accounting principles used and significant estimates made by management, as well as evaluating the overall presentation of the consolidated financial statements and consolidated financial highlights. We believe that our audits provide a reasonable basis for our opinion.
KPMG LLP
We have not been able to determine the specific year that we began serving as the auditor of one or more Oppenheimer Funds investment companies, however we are aware that we have served as the auditor of one or more Oppenheimer Funds investment companies since at least 1969.
Denver, Colorado
November 28, 2018
|
| 91 OPPENHEIMER INTERNATIONAL BOND FUND |
FEDERAL INCOME TAX INFORMATION Unaudited
In early 2018, if applicable, shareholders of record received information regarding all dividends and distributions paid to them by the Fund during calendar year 2017.
Dividends, if any, paid by the Fund during the reporting period which are not designated as capital gain distributions should be multiplied by the maximum amount allowable but not less than 0.46% to arrive at the amount eligible for the corporate dividend-received deduction.
A portion, if any, of the dividends paid by the Fund during the reporting period which are not designated as capital gain distributions are eligible for lower individual income tax rates to the extent that the Fund has received qualified dividend income as stipulated by recent tax legislation. The maximum amount allowable but not less than $28,358,522 of the Fund’s fiscal year taxable income may be eligible for the lower individual income tax rates. In early 2018, shareholders of record received information regarding the percentage of distributions that are eligible for lower individual income tax rates.
Recent tax legislation allows a regulated investment company to designate distributions not designated as capital gain distributions, as either interest related dividends or short-term capital gain dividends, both of which are exempt from the U.S. withholding tax applicable to non U.S. taxpayers. For the reporting period, the maximum amount allowable but not less than $9,238,435 of the ordinary distributions to be paid by the Fund qualifies as an interest related dividend.
The foregoing information is presented to assist shareholders in reporting distributions received from the Fund to the Internal Revenue Service. Because of the complexity of the federal regulations which may affect your individual tax return and the many variations in state and local tax regulations, we recommend that you consult your tax advisor for specific guidance.
|
| 92 OPPENHEIMER INTERNATIONAL BOND FUND |
BOARD APPROVAL OF THE FUND’S INVESTMENT ADVISORY
AND SUB-ADVISORY AGREEMENTS Unaudited
The Fund has entered into an investment advisory agreement with OFI Global Asset Management, Inc. (“OFI Global” or the “Adviser”), a wholly-owned subsidiary of OppenheimerFunds, Inc. (“OFI” or the “Sub-Adviser”) (“OFI Global” and “OFI” together the “Managers”) and OFI Global has entered into a sub-advisory agreement with OFI whereby OFI provides investment sub-advisory services to the Fund (collectively, the “Agreements”). Each year, the Board of Trustees (the “Board”), including a majority of the independent Trustees, is required to determine whether to approve the terms of the Agreements and the renewal thereof. The Investment Company Act of 1940, as amended, requires that the Board request and evaluate, and that the Managers provide, such information as may be reasonably necessary to evaluate the terms of the Agreements. The Board employs an independent consultant to prepare a report that provides information, including comparative information that the Board requests for that purpose. In addition to in-person meetings focused on this evaluation, the Board receives information throughout the year regarding Fund services, fees, expenses and performance.
The Managers and the independent consultant provided information to the Board on the following factors: (i) the nature, quality and extent of the Managers’ services, (ii) the comparative investment performance of the Fund and the Managers, (iii) the fees and expenses of the Fund, including comparative fee and expense information, (iv) the profitability of the Managers and their affiliates, including an analysis of the cost of providing services, (v) whether economies of scale are realized as the Fund grows and whether fee levels reflect these economies of scale for Fund investors and (vi) other benefits to the Managers from their relationship with the Fund. The Board was aware that there are alternatives to retaining the Managers.
Outlined below is a summary of the principal information considered by the Board as well as the Board’s conclusions.
Nature, Quality and Extent of Services. The Board considered information about the nature, quality and extent of the services provided to the Fund and information regarding the Managers’ key personnel who provide such services. The Managers’ duties include providing the Fund with the services of the Sub-Adviser’s portfolio managers and investment team, who provide research, analysis and other advisory services in regard to the Fund’s investments; and securities trading services. OFI Global is responsible for oversight of third-party service providers; monitoring compliance with applicable Fund policies and procedures and adherence to the Fund’s investment restrictions; risk management; and oversight of the Sub-Adviser. OFI Global is also responsible for providing certain administrative services to the Fund. Those services include providing and supervising all administrative and clerical personnel who are necessary in order to provide effective corporate administration for the Fund; compiling and maintaining records with respect to the Fund’s operations; preparing and filing reports required by the U.S. Securities and Exchange Commission; preparing periodic reports regarding the operations of the Fund for its shareholders; preparing proxy materials for shareholder meetings; and preparing the registration statements required by federal and state securities laws for the sale of the Fund’s shares. OFI Global also provides the Fund with office space, facilities and equipment.
|
| 93 OPPENHEIMER INTERNATIONAL BOND FUND |
BOARD APPROVAL OF THE FUND’S INVESTMENT ADVISORY
AND SUB-ADVISORY AGREEMENTS Unaudited / Continued
The Board also considered the quality of the services provided and the quality of the Managers’ resources that are available to the Fund. The Board took account of the fact that the Sub-Adviser has over fifty years of experience as an investment adviser and that its assets under management rank it among the top mutual fund managers in the United States. The Board evaluated the Managers’ advisory, administrative, accounting, legal, compliance and risk management services, among other services, and information the Board has received regarding the experience and professional qualifications of the Managers’ key personnel and the size and functions of their staff. In its evaluation of the quality of the portfolio management services provided, the Board considered the experience of Hemant Baijal, Christopher Kelly and Wim Vandenhoeck, the portfolio managers for the Fund, and the Sub-Adviser’s investment team and analysts. The Board members also considered the totality of their experiences with the Managers as directors or trustees of the Fund and other funds advised by the Managers. The Board considered information regarding the quality of services provided by affiliates of the Managers, which the Board members have become knowledgeable about through their experiences with the Managers and in connection with the review or renewal of the Fund’s service agreements or service providers. The Board concluded, in light of the Managers’ experience, reputation, personnel, operations and resources that the Fund benefits from the services provided under the Agreements.
Investment Performance of the Managers and the Fund. Throughout the year, the Managers provided information on the investment performance of the Fund, the Adviser and the Sub-Adviser, including comparative performance information. The Board reviewed information, prepared by the Managers and the independent consultant, comparing the Fund’s historical performance to its benchmark and to the performance of other retail world bond funds. The Board considered that the Fund outperformed its category median for the one-, three- and five-year periods and was in line with its category median in the ten-year period, ranking in the 50th percentile. The Board also noted that effective January 2018, a new portfolio manager joined the Fund’s management team.
Fees and Expenses of the Fund. The Board reviewed the fees paid to the Managers and the other expenses borne by the Fund. The Board noted that the Adviser, not the Fund, pays the Sub-Adviser’s fee under the sub-advisory agreement. The independent consultant provided comparative data in regard to the fees and expenses of the Fund and other retail front-end load world bond funds with comparable asset levels and distribution features. The Board noted that the Fund’s contractual management fee was lower than its peer group median and category median, while the Fund’s total expenses were equal to its peer group median and higher than its category median. The Board considered the Fund’s current fee waivers, specifically that (a) the Adviser has contractually agreed to waive the management fee it receives from the Fund in an amount equal to the management fee it receives from the Fund’s subsidiary, which will be in effect for so long as the Fund invests in the subsidiary, and may not be terminated unless approved by the Fund’s Board; and (b) the Adviser has contractually agreed to waive fees and/or reimburse Fund expenses in an amount equal to the indirect management fees incurred through the Fund’s investments in funds managed by the Adviser or its affiliates, which may not be amended or withdrawn for one year from the date of the Fund’s prospectus, unless approved by the Fund’s Board. Finally, the Board
|
| 94 OPPENHEIMER INTERNATIONAL BOND FUND |
considered that the Adviser, in its capacity as the Fund’s transfer agent, voluntarily waived and/or reimbursed the Fund for transfer agent fees in an amount equal to 0.015% of average annual net assets, and that effective January 1, 2018, after discussions with the Board, the Fund’s transfer agent fee rate was decreased.
Economies of Scale and Profits Realized by the Managers. The Board considered information regarding the Managers’ costs in serving as the Fund’s investment adviser and sub-adviser, including the costs associated with the personnel and systems necessary to manage the Fund, and information regarding the Managers’ profitability from their relationship with the Fund. The Board also considered that the Managers must be able to pay and retain experienced professional personnel at competitive rates to provide quality services to the Fund. The Board reviewed whether the Managers may realize economies of scale in managing and supporting the Fund. The Board noted that the Fund currently has management fee breakpoints, which are intended to share with Fund shareholders economies of scale that may exist as the Fund’s assets grow.
Other Benefits to the Managers. In addition to considering the profits realized by the Managers, the Board considered information that was provided regarding the direct and indirect benefits the Managers receive as a result of their relationship with the Fund, including compensation paid to the Managers’ affiliates.
Conclusions. These factors were also considered by the independent Trustees meeting separately from the full Board, assisted by experienced counsel to the Fund and to the independent Trustees. Fund counsel and the independent Trustees’ counsel are independent of the Managers within the meaning and intent of the Securities and Exchange Commission Rules.
Based on its review of the information it received and its evaluations described above, the Board, including a majority of the independent Trustees, decided to continue the Agreements through August 31, 2019. In arriving at its decision, the Board did not identify any factor or factors as being more important than others, but considered all of the above information, and considered the terms and conditions of the Agreements, including the management fees, in light of all the surrounding circumstances.
|
| 95 OPPENHEIMER INTERNATIONAL BOND FUND |
PORTFOLIO PROXY VOTING POLICIES AND GUIDELINES;
UPDATES TO STATEMENT OF INVESTMENTS Unaudited
The Fund has adopted Portfolio Proxy Voting Policies and Guidelines under which the Fund votes proxies relating to securities (“portfolio proxies”) held by the Fund. A description of the Fund’s Portfolio Proxy Voting Policies and Guidelines is available (i) without charge, upon request, by calling the Fund toll-free at 1.800.CALL OPP (225.5677), (ii) on the Fund’s website at www.oppenheimerfunds.com, and (iii) on the SEC’s website at www.sec.gov. In addition, the Fund is required to file Form N-PX, with its complete proxy voting record for the 12 months ended June 30th, no later than August 31st of each year. The Fund’s voting record is available (i) without charge, upon request, by calling the Fund toll-free at 1.800.CALL OPP (225.5677), and (ii) in the Form N-PX filing on the SEC’s website at www.sec.gov. The Fund files its complete schedule of portfolio holdings with the SEC for the first quarter and the third quarter of each fiscal year on Form N-Q.
The Fund’s Form N-Q filings are available on the SEC’s website at www.sec.gov. Those forms may be reviewed and copied at the SEC’s Public Reference Room in Washington, D.C. Information on the operation of the Public Reference Room may be obtained by calling 1-800-SEC-0330.
Householding—Delivery of Shareholder Documents
This is to inform you about OppenheimerFunds’ “householding” policy. If more than one member of your household maintains an account in a particular fund, OppenheimerFunds will mail only one copy of the fund’s prospectus (or, if available, the fund’s summary prospectus), annual and semiannual report and privacy policy. The consolidation of these mailings, called householding, benefits your fund through reduced mailing expense, and benefits you by reducing the volume of mail you receive from OppenheimerFunds. Householding does not affect the delivery of your account statements.
Please note that we will continue to household these mailings for as long as you remain an OppenheimerFunds shareholder, unless you request otherwise. If you prefer to receive multiple copies of these materials, please call us at 1.800.CALL-OPP (225-5677). You may also notify us in writing or via email. We will begin sending you individual copies of the prospectus (or, if available, the summary prospectus), reports and privacy policy within 30 days of receiving your request to stop householding.
|
| 96 OPPENHEIMER INTERNATIONAL BOND FUND |
TRUSTEES AND OFFICERS
| | |
|
| Name, Position(s) Held with the | | Principal Occupation(s) During the Past 5 Years; Other Trusteeships/ |
| Fund, Length of Service, Year of | | Directorships Held. |
| Birth | | |
| |
| INDEPENDENT TRUSTEES | | The address of each Trustee in the chart below is 6803 S. Tucson Way, Centennial, Colorado 80112-3924. Each Trustee serves for an indefinite term, or until his or her resignation, retirement, death or removal. Each of the Trustees in the chart below oversees 58 portfolios in the OppenheimerFunds complex. |
| |
Robert J. Malone, Chairman of the Board of Trustees (since 2016), Trustee (since 2002) Year of Birth: 1944 | | Chairman - Colorado Market of MidFirst Bank (since January 2015); Chairman of the Board (2012-2016) and Director (August 2005-January 2016) of Jones International University (educational organization); Trustee of the Gallagher Family Foundation (non-profit organization) (2000-2016); Chairman, Chief Executive Officer and Director of Steele Street Bank Trust (commercial banking) (August 2003-January 2015); Director of Opera Colorado Foundation (non-profit organization) (2008-2012); Director of Colorado UpLIFT (charitable organization) (1986-2010); Director of Jones Knowledge, Inc. (2006-2010); Former Chairman of U.S. Bank-Colorado (subsidiary of U.S. Bancorp and formerly Colorado National Bank) (July 1996-April 1999); Director of Commercial Assets, Inc. (real estate investment trust) (1993-2000); Director of U.S. Exploration, Inc. (oil and gas exploration) (1997-February 2004); Chairman of the Board (1991-1994) and Trustee (1985-1994) of Regis University; and Chairman of the Board (1990-1991) and Member (1984-1999) of Young Presidents Organization. Mr. Malone has served on the Boards of certain Oppenheimer funds since 2002, during which time he has become familiar with the Fund’s (and other Oppenheimer funds’) financial, accounting, regulatory and investment matters and has contributed to the Board’s deliberations. |
| |
Andrew J. Donohue, Trustee (since 2017) Year of Birth: 1950 | | Director, Mutual Fund Directors Forum (since February 2018); Of Counsel, Shearman & Sterling LLP (since September 2017); Chief of Staff of the U.S. Securities and Exchange Commission (regulator) (June 2015-February 2017); Managing Director and Investment Company General Counsel of Goldman Sachs (investment bank) (November 2012-May 2015); Partner at Morgan Lewis & Bockius, LLP (law firm) (March 2011-October 2012); Director of the Division of Investment Management of U.S. Securities and Exchange Commission (regulator) (May 2006-November 2010); Global General Counsel of Merrill Lynch Investment Managers (investment firm) (May 2003-May 2006); General Counsel (October 1991-November 2001) and Executive Vice President (January 1993-November 2001) of OppenheimerFunds, Inc. (investment firm) (June 1991-November 2001). Mr. Donohue has served on the Boards of certain Oppenheimer funds since 2017, during which time he has become familiar with the Fund’s (and other Oppenheimer funds’) financial, accounting, regulatory and investment matters and has contributed to the Board’s deliberations. |
| |
Richard F. Grabish, Trustee (since 2012) Year of Birth: 1948 | | Formerly Senior Vice President and Assistant Director of Sales and Marketing (March 1997-December 2007), Director (March 1987-December 2007) and Manager of Private Client Services (June 1985-June 2005) of A.G. Edwards & Sons, Inc. (broker/dealer and investment firm); Chairman and Chief Executive Officer of A.G. Edwards Trust Company, FSB (March 2001-December 2007); President and Vice Chairman of A.G. Edwards Trust Company, FSB (investment adviser) (April 1987-March 2001); President of A.G. Edwards Trust Company, FSB (investment adviser) (June 2005-December 2007). Mr. Grabish has served on the Boards of certain Oppenheimer funds since 2001, during which time he has become familiar with the Fund’s (and other Oppenheimer funds’) financial, accounting, regulatory and investment matters and has contributed to the Board’s deliberations. |
|
| 97 OPPENHEIMER INTERNATIONAL BOND FUND |
TRUSTEES AND OFFICERS Continued
| | |
|
Beverly L. Hamilton, Trustee (since 2002) Year of Birth: 1946 | | Trustee of Monterey Institute for International Studies (educational organization) (2000-2014); Board Member of Middlebury College (educational organization) (December 2005-June 2011); Director of the Board (1991-2016), Vice Chairman of the Board (2006-2009) and Chairman of the Board (2010-2013) of American Funds’ Emerging Markets Growth Fund, Inc. (mutual fund); Director of The California Endowment (philanthropic organization) (April 2002-April 2008); Director (February 2002-2005) and Chairman of Trustees (2006-2007) of the Community Hospital of Monterey Peninsula; President of ARCO Investment Management Company (February 1991-April 2000); Member of the investment committees of The Rockefeller Foundation (2001-2006) and The University of Michigan (since 2000); Advisor at Credit Suisse First Boston’s Sprout venture capital unit (venture capital fund) (1994-January 2005); Trustee of MassMutual Institutional Funds (investment company) (1996-June 2004); Trustee of MML Series Investment Fund (investment company) (April 1989-June 2004); Member of the investment committee of Hartford Hospital (2000-2003); and Advisor to Unilever (Holland) pension fund (2000-2003). Ms. Hamilton has served on the Boards of certain Oppenheimer funds since 2002, during which time she has become familiar with the Fund’s (and other Oppenheimer funds’) financial, accounting, regulatory and investment matters and has contributed to the Board’s deliberations. |
| |
Victoria J. Herget, Trustee (since 2012) Year of Birth: 1951 | | Board Chair (2008-2015) and Director (2004-Present) of United Educators (insurance company); Trustee (since 2000) and Chair (2010-2017) of Newberry Library (independent research library); Trustee, Mather LifeWays (senior living organization) (since 2001); Independent Director of the First American Funds (mutual fund family) (2003-2011); former Managing Director (1993-2001), Principal (1985-1993), Vice President (1978-1985) and Assistant Vice President (1973-1978) of Zurich Scudder Investments (investment adviser) (and its predecessor firms); Trustee (1992-2007), Chair of the Board of Trustees (1999-2007), Investment Committee Chair (1994-1999) and Investment Committee member (2007-2010) of Wellesley College; Trustee, BoardSource (non-profit organization) (2006-2009) and Chicago City Day School (K-8 School) (1994-2005). Ms. Herget has served on the Boards of certain Oppenheimer funds since 2012, during which time she has become familiar with the Fund’s (and other Oppenheimer funds’) financial, accounting, regulatory and investment matters and has contributed to the Board’s deliberations. |
| |
Karen L. Stuckey, Trustee (since 2012) Year of Birth: 1953 | | Member (since May 2015) of Desert Mountain Community Foundation Advisory Board (non-profit organization); Partner (1990-2012) of PricewaterhouseCoopers LLP (professional services firm) (held various positions 1975-1990); Trustee (1992-2006); member of Executive, Nominating and Audit Committees and Chair of Finance Committee (1992-2006), and Emeritus Trustee (since 2006) of Lehigh University; member, Women’s Investment Management Forum (professional organization) (since inception) and Trustee of Jennies School for Little Children (non-profit) (2011-2014). Ms. Stuckey has served on the Boards of certain Oppenheimer funds since 2012, during which time she has become familiar with the Fund’s (and other Oppenheimer funds’) financial, accounting, regulatory and investment matters and has contributed to the Board’s deliberations. |
| |
James D. Vaughn, Trustee (since 2012) Year of Birth:1945 | | Retired; former managing partner (1994-2001) of Denver office of Deloitte & Touche LLP, (held various positions in Denver and New York offices from 1969- 1993); Trustee and Chairman of the Audit Committee of Schroder Funds (2003- 2012); Board member and Chairman of Audit Committee of AMG National Trust |
|
| 98 OPPENHEIMER INTERNATIONAL BOND FUND |
| | |
James D. Vaughn, Continued | | Bank (since 2005); Trustee and Investment Committee member, University of South Dakota Foundation (since 1996); Board member, Audit Committee Member and past Board Chair, Junior Achievement (since 1993); former Board member, Mile High United Way, Boys and Girls Clubs, Boy Scouts, Colorado Business Committee for the Arts, Economic Club of Colorado and Metro Denver Network. Mr. Vaughn has served on the Boards of certain Oppenheimer funds since 2012, during which time he has become familiar with the Fund’s (and other Oppenheimer funds’) financial, accounting, regulatory and investment matters and has contributed to the Board’s deliberations. |
INTERESTED TRUSTEE AND OFFICER | | Mr. Steinmetz is an “Interested Trustee” because he is affiliated with the Manager and the Sub-Adviser by virtue of his positions as Chairman and director of the Sub-Adviser and officer and director of the Manager. Both as a Trustee and as an officer, Mr. Steinmetz serves for an indefinite term, or until his resignation, retirement, death or removal. Mr. Steinmetz’s address is 225 Liberty Street, New York, New York 10281-1008. Mr. Steinmetz is an officer of 105 portfolios in the OppenheimerFunds complex. |
| |
Arthur P. Steinmetz, Trustee (since 2015), President and Principal Executive Officer (since 2014) Year of Birth: 1958 | | Chairman of OppenheimerFunds, Inc. (since January 2015); CEO and Chairman of OFI Global Asset Management, Inc. (since July 2014), President of OFI Global Asset Management, Inc. (since May 2013), a Director of OFI Global Asset Management, Inc. (since January 2013), Director of OppenheimerFunds, Inc. (since July 2014), President, Management Director and CEO of Oppenheimer Acquisition Corp. (OppenheimerFunds, Inc.‘s parent holding company) (since July 2014), and President and Director of OFI SteelPath, Inc. (since January 2013). Chief Investment Officer of the OppenheimerFunds advisory entities (January 2013-December 2013); Executive Vice President of OFI Global Asset Management, Inc. (January 2013-May 2013); Chief Investment Officer of OppenheimerFunds, Inc. (October 2010-December 2012); Chief Investment Officer, Fixed-Income, of OppenheimerFunds, Inc. (April 2009-October 2010); Executive Vice President of OppenheimerFunds, Inc. (October 2009-December 2012); Director of Fixed Income of OppenheimerFunds, Inc. (January 2009-April 2009); and a Senior Vice President of OppenheimerFunds, Inc. (March 1993-September 2009). |
| |
| OTHER OFFICERS OF THE FUND | | The addresses of the Officers in the chart below are as follows: for Messrs. Baijal, Kelly, Vandenhoeck, Mss. Lo Bessette, Foxson and Picciotto, 225 Liberty Street, New York, New York 10281-1008, for Mr. Petersen, 6803 S. Tucson Way, Centennial, Colorado 80112-3924. Each Officer serves for an indefinite term or until his or her resignation, retirement, death or removal. |
| |
Hemant Baijal, Vice President (since 2013) Year of Birth: 1962 | | Senior Vice President of the Sub-Adviser (since January 2016); Senior Portfolio Manager of the Sub-Adviser (since July 2011); Co-Head of the Global Debt Team (since January 2015); Vice President of the Sub-Adviser (July 2011-January 2016). Co-founder, Partner and Portfolio Manager of Six Seasons Global Asset Management (January 2009-December 2010); Partner and Portfolio Manager of Aravali Partners, LLC (September 2006-December 2008); Partner and Portfolio Manager at Havell Capital Management, LLC (November 1996-August 2006). |
| |
Christopher Kelly, Vice President (since 2015) Year of Birth: 1967 | | Senior Vice President of the Sub-Adviser (since January 2016); Portfolio Manager of the Sub-Adviser(since March 2015); Co-Head of the Global Debt Team (since March 2015); Vice President of the Sub-Adviser (March 2015-January 2016). Deputy Head of Emerging Markets Fixed Income at BlackRock, Inc. (June 2012 - January 2015); Portfolio Manager and Deputy Chief Investment Officer of Emerging Markets at Fisher Francis Trees and Watts, a BNP Paribas Investment Partner (February 2008 - April 2012). |
|
| 99 OPPENHEIMER INTERNATIONAL BOND FUND |
TRUSTEES AND OFFICERS Continued
| | |
Wim Vandenhoeck, Vice President (since 2018) Year of Birth: 1970 | | Vice President and Senior Portfolio Manager of the Sub-Adviser (since January 2018); Portfolio Manager of the Sub-Adviser (February 2015 - January 2018). Partner at APQ Partners LLP, London (2013-2015); Asset manager at GLG Partners LP, London, (2010-2013); Partner at Six Seasons Global Asset Management LLC, New York (2009-2010) Aravali Partners LLC, New York (2006-2008) and Havell Capital Management LLC, New York (1997-2006); Earlier in his career, he has held positions at Bank Brussels Lambert (1994-1997) and Paribas Bank (1992-1993). |
| |
Cynthia Lo Bessette, Secretary and Chief Legal Officer (since 2016) Year of Birth: 1969 | | Executive Vice President, General Counsel and Secretary of OFI Global Asset Management, Inc. (since February 2016); Senior Vice President and Deputy General Counsel of OFI Global Asset Management, Inc. (March 2015-February 2016); Chief Legal Officer of OppenheimerFunds, Inc. and OppenheimerFunds Distributor, Inc. (since February 2016); Vice President, General Counsel and Secretary of Oppenheimer Acquisition Corp. (since February 2016); General Counsel of OFI SteelPath, Inc., OFI Advisors, LLC and Index Management Solutions, LLC (since February 2016); Chief Legal Officer of OFI Global Institutional, Inc., HarbourView Asset Management Corporation, OFI Global Trust Company, Oppenheimer Real Asset Management, Inc., OFI Private Investments Inc., Shareholder Services, Inc. and Trinity Investment Management Corporation (since February 2016); Corporate Counsel (February 2012-March 2015) and Deputy Chief Legal Officer (April 2013-March 2015) of Jennison Associates LLC; Assistant General Counsel (April 2008-September 2009) and Deputy General Counsel (October 2009-February 2012) of Lord Abbett & Co. LLC. |
| |
Jennifer Foxson, Vice President and Chief Business Officer (since 2014) Year of Birth: 1969 | | Senior Vice President of OppenheimerFunds Distributor, Inc. (since June 2014); Vice President of OppenheimerFunds Distributor, Inc. (April 2006-June 2014); Vice President of OppenheimerFunds, Inc. (January 1998-March 2006); Assistant Vice President of OppenheimerFunds, Inc. (October 1991-December 1998). |
| |
Mary Ann Picciotto, Chief Compliance Officer and Chief Anti-Money Laundering Officer (since 2014) Year of Birth: 1973 | | Senior Vice President and Chief Compliance Officer of OFI Global Asset Management, Inc. (since March 2014); Chief Compliance Officer of OppenheimerFunds, Inc., OFI SteelPath, Inc., OFI Global Institutional, Inc., Oppenheimer Real Asset Management, Inc., OFI Private Investments Inc., Harborview Asset Management Corporation, Trinity Investment Management Corporation, and Shareholder Services, Inc. (since March 2014); Managing Director of Morgan Stanley Investment Management Inc. and certain of its various affiliated entities; Chief Compliance Officer of various Morgan Stanley Funds (May 2010-January 2014); Chief Compliance Officer of Morgan Stanley Investment Management Inc. (April 2007-January 2014). |
| |
Brian S. Petersen, Treasurer and Principal Financial & Accounting Officer (since 2016) Year of Birth: 1970 | | Senior Vice President of OFI Global Asset Management, Inc. (since January 2017); Vice President of OFI Global Asset Management, Inc. (January 2013-January 2017); Vice President of OppenheimerFunds, Inc. (February 2007-December 2012); Assistant Vice President of OppenheimerFunds, Inc. (August 2002-2007). |
The Fund’s Statement of Additional Information contains additional information about the Fund’s Trustees and Officers and is available without charge, upon request, by calling 1.800.CALL OPP (225.5677).
|
| 100 OPPENHEIMER INTERNATIONAL BOND FUND |
OPPENHEIMER INTERNATIONAL BOND FUND
| | |
| Manager | | OFI Global Asset Management, Inc. |
| |
| Sub-Adviser | | OppenheimerFunds, Inc. |
| |
| Distributor | | OppenheimerFunds Distributor, Inc. |
| |
| Transfer and Shareholder Servicing Agent | | OFI Global Asset Management, Inc. |
| |
| Sub-Transfer Agent | | Shareholder Services, Inc. DBA OppenheimerFunds Services |
| |
| Independent Registered Public Accounting Firm | | KPMG LLP |
| |
| Legal Counsel | | Ropes & Gray LLP |
©2018 OppenheimerFunds, Inc. All rights reserved.
|
| 101 OPPENHEIMER INTERNATIONAL BOND FUND |
PRIVACY NOTICE
As an Oppenheimer fund shareholder, you are entitled to know how we protect your personal information and how we limit its disclosure.
Information Sources
We obtain non-public personal information about our shareholders from the following sources:
| ● | | Applications or other forms. |
| ● | | When you create a user ID and password for online account access. |
| ● | | When you enroll in eDocs Direct,SM our electronic document delivery service. |
| ● | | Your transactions with us, our affiliates or others. |
| ● | | Technologies on our website, including: “cookies” and web beacons, which are used to collect data on the pages you visit and the features you use. |
If you visit oppenheimerfunds.com and do not log on to the secure account information areas, we do not obtain any personal information about you. When you do log on to a secure area, we do obtain your user ID and password to identify you. We also use this information to provide you with products and services you have requested, to inform you about products and services that you may be interested in and assist you in other ways.
We do not collect personal information through our website unless you willingly provide it to us, either directly by email or in those areas of the website that request information. In order to update your personal information (including your mailing address, email address and phone number) you must first log on and visit your user profile.
If you have set your browser to warn you before accepting cookies, you will receive the warning message with each cookie. You can refuse cookies by turning them off in your browser. However, doing so may limit your access to certain sections of our website.
We use cookies to help us improve and manage our website. For example, cookies help us recognize new versus repeat visitors to the site, track the pages visited, and enable some special features on the website. This data helps us provide better service for our website visitors.
Protection of Information
We do not disclose any non-public personal information (such as names on a customer list) about current or former customers to anyone, except as permitted by law.
Disclosure of Information
Copies of confirmations, account statements and other documents reporting activity in your fund accounts are made available to your financial advisor (as designated by you). We may also use details about you and your investments to help us, our financial service affiliates, or firms that jointly market their financial products and services with ours, to better serve your investment needs or suggest educational material that may be of interest to you. If this requires us to provide you with an opportunity to “opt in” or “opt out” of such information sharing with a firm not affiliated with us, you will receive notification on how to do so, before any such sharing takes place.
Right of Refusal
We will not disclose your personal information to unaffiliated third parties (except as permitted by law), unless we first offer you a reasonable opportunity to refuse or “opt out” of such disclosure.
|
| 102 OPPENHEIMER INTERNATIONAL BOND FUND |
Internet Security and Encryption
In general, the email services provided by our website are encrypted and provide a secure and private means of communication with us. To protect your own privacy, confidential and/ or personal information should only be communicated via email when you are advised that you are using a secure website.
As a security measure, we do not include personal or account information in non-secure emails, and we advise you not to send such information to us in non-secure emails. Instead, you may take advantage of the secure features of our website to encrypt your email correspondence. To do this, you will need to use a browser that supports Secure Sockets Layer (SSL) protocol.
| ● | | All transactions conducted via our websites, including redemptions, exchanges and purchases, are secured by the highest encryption standards available. SSL is used to establish a secure connection between your PC and OppenheimerFunds’ server. It transmits information in an encrypted and scrambled format. |
| ● | | Encryption is achieved through an electronic scrambling technology that uses a “key” to code and then decode the data. Encryption acts like the cable converter box you may have on your television set. It scrambles data with a secret code so that no one can make sense of it while it is being transmitted. When the data reaches its destination, the same software unscrambles the data. |
| ● | | You can exit the secure area by closing your browser or, for added security, you can use the Log Out button before you close your browser. |
Other Security Measures
We maintain physical, electronic and procedural safeguards to protect your personal account information. Our employees and agents have access to that information only so that they may offer you products or provide services, for example, when responding to your account questions.
How You Can Help
You can also do your part to keep your account information private and to prevent unauthorized transactions. If you obtain a user ID and password for your account, safeguard that information. Strengthening your online credentials–your online security profile–typically your user name, password, and security questions and answers, can be one of your most important lines of defense on the Internet. For additional information on how you can help prevent identity theft, visit https://www. oppenheimerfunds.com/security.
Who We Are
This joint notice describes the privacy policies of the Oppenheimer funds, OppenheimerFunds, Inc., each of its investment adviser subsidiaries, OppenheimerFunds Distributor, Inc. and OFI Global Trust Co. It applies to all Oppenheimer fund accounts you presently have, or may open in the future, using your Social Security number—whether or not you remain a shareholder of our funds. This notice was last updated as of November 2017. In the event it is updated or changed, we will post an updated notice on our website at oppenheimerfunds.com. If you have any questions about this privacy policy, email us by clicking on the Contact Us section of our website at oppenheimerfunds.com, write to us at P.O. Box 5270, Denver, CO 80217-5270, or call us at 800 CALL OPP (225 5677).
|
| 103 OPPENHEIMER INTERNATIONAL BOND FUND |

Visit us at oppenheimerfunds.com for 24-hr access to
account information and transactions or call us at 800.CALL
OPP (800.225.5677) for 24-hr automated information and
automated transactions. Representatives also available
Mon–Fri 8am-8pm ET.
| | |
Visit Us | | |
oppenheimerfunds.com | | |
Call Us | | |
800 225 5677 | | |
Follow Us | | |
 | | Oppenheimer funds are distributed by OppenheimerFunds Distributor, Inc. 225 Liberty Street, New York, NY 10281-1008 © 2018 OppenheimerFunds Distributor, Inc. All rights reserved. RA0880.001.0918 November 21, 2018 |
|
|
|
Item 2. Code of Ethics.
The registrant has adopted a code of ethics that applies to the registrant’s principal executive officer, principal financial officer, principal accounting officer or controller or persons performing similar functions.
Item 3. Audit Committee Financial Expert.
The Board of Trustees of the registrant has determined that Karen L. Stuckey, the Chairwoman of the Board’s Audit Committee, is the audit committee financial expert and that Ms. Stuckey is “independent” for purposes of this Item 3.
Item 4. Principal Accountant Fees and Services.
The principal accountant for the audit of the registrant’s annual financial statements billed $88,800 in fiscal 2018 and $93,400 in fiscal 2017.
The principal accountant for the audit of the registrant’s annual financial statements billed $3,500 in fiscal 2018 and $3,500 in fiscal 2017.
The principal accountant for the audit of the registrant’s annual financial statements billed $297,836 in fiscal 2018 and $386,986 in fiscal 2017 to the registrant’s investment adviser or any entity controlling, controlled by, or under common control with the adviser that provides ongoing services to the registrant.
Such services include: Internal control reviews, GIPS attestation procedures, CP Conduit fees, incremental and additional audit services.
The principal accountant for the audit of the registrant’s annual financial statements billed $14,947 in fiscal 2018 and $7,318 in fiscal 2017.
The principal accountant for the audit of the registrant’s annual financial statements billed $534,826 in fiscal 2018 and $286,402 in fiscal 2017 to the registrant’s investment adviser or any entity controlling, controlled by, or under common control with the adviser that provides ongoing services to the registrant.
Such services include: tax compliance, tax planning and tax advice. Tax compliance generally involves preparation of original and amended tax returns, claims for a refund and tax payment-planning services. Tax planning and tax advice includes assistance with tax audits and appeals, tax advice related to mergers and acquisitions and requests for rulings or technical advice from taxing authorities.
The principal accountant for the audit of the registrant’s annual financial statements billed no such fees in fiscal 2018 and no such fees in fiscal 2017.
The principal accountant for the audit of the registrant’s annual financial statements billed no such fees in fiscal 2018 and no such fees in fiscal 2017 to the registrant’s investment adviser or any entity controlling, controlled by, or under common control with the adviser that provides ongoing services to the registrant.
Such fees would include the cost to the principal accountant of attending audit committee meetings and consultations regarding the registrant’s retirement plan with respect to its Trustees.
| (e) | (1) During its regularly scheduled periodic meetings, the registrant’s audit committee will pre-approve all audit, audit-related, tax and other services to be provided by the principal accountants of the registrant. |
The audit committee has delegated pre-approval authority to its Chairman for any subsequent new engagements that arise between regularly scheduled meeting dates provided that any fees such pre-approved are presented to the audit committee at its next regularly scheduled meeting.
Under applicable laws, pre-approval of non-audit services may be waived provided that: 1) the aggregate amount of all such services provided constitutes no more than five percent of the total amount of fees paid by the registrant to its principal accountant during the fiscal year in which services are provided 2) such services were not recognized by the registrant at the time of engagement as non-audit services and 3) such services are promptly brought to the attention of the audit committee of the registrant and approved prior to the completion of the audit.
(2) 0%
| (f) | Not applicable as less than 50%. |
| (g) | The principal accountant for the audit of the registrant’s annual financial statements billed $851,109 in fiscal 2018 and $684,206 in fiscal 2017 to the registrant and the registrant’s investment adviser or any entity controlling, controlled by, or under common control with the adviser that provides ongoing services to the registrant related to non-audit fees. Those billings did not include any prohibited non-audit services as defined by the Securities Exchange Act of 1934. |
| (h) | The registrant’s audit committee of the board of Trustees has considered whether the provision of non-audit services that were rendered to the registrant’s investment adviser, and any entity controlling, controlled by, or under common control with the investment adviser that provides ongoing services to the registrant that were not pre-approved pursuant to paragraph (c)(7)(ii) of Rule 2-01 of Regulation S-X is compatible with maintaining the principal accountant’s independence. No such services were rendered. |
Item 5. Audit Committee of Listed Registrants
Not applicable.
Item 6. Schedule of Investments.
a) Not applicable. The complete schedule of investments is included in Item 1 of this Form N-CSR.
b) Not applicable.
Item 7. Disclosure of Proxy Voting Policies and Procedures for Closed-End Management Investment Companies.
Not applicable.
Item 8. Portfolio Managers of Closed-End Management Investment Companies.
Not applicable.
Item 9. Purchases of Equity Securities by Closed-End Management Investment Company and Affiliated Purchasers.
Not applicable.
Item 10. Submission of Matters to a Vote of Security Holders.
The Fund’s Governance Committee Provisions with Respect to Nominations of Directors/Trustees to the Respective Boards
None
Item 11. Controls and Procedures.
Based on their evaluation of the registrant’s disclosure controls and procedures (as defined in rule 30a-3(c) under the Investment Company Act of 1940 (17 CFR 270.30a-3(c)) as of 9/30/2018, the registrant’s principal executive officer and principal financial officer found the registrant’s disclosure controls and procedures to provide reasonable assurances that information required to be disclosed by the registrant in the reports that it files under the Securities Exchange Act of 1934 (a) is accumulated and communicated to registrant’s management, including its principal executive officer and principal financial officer, to allow timely decisions regarding required disclosure, and (b) is recorded, processed, summarized and reported, within the time periods specified in the rules and forms adopted by the U.S. Securities and Exchange Commission.
There have been no changes in the registrant’s internal controls over financial reporting that occurred during the registrant’s second fiscal quarter of the period covered by this report that have materially affected, or are reasonably likely to materially affect, the registrant’s internal control over financial reporting.
Item 12. Disclosure of Securities Lending Activities for Closed-End Management Investment Companies.
Not applicable.
Item 13. Exhibits.
| (a) | (1) Exhibit attached hereto. |
| | (2) Exhibits attached hereto. |
SIGNATURES
Pursuant to the requirements of the Securities Exchange Act of 1934 and the Investment Company Act of 1940, the registrant has duly caused this report to be signed on its behalf by the undersigned, thereunto duly authorized.
| | |
| Oppenheimer International Bond Fund |
| |
| By: | | /s/ Arthur P. Steinmetz |
| | Arthur P. Steinmetz |
| | Principal Executive Officer |
|
| Date: 11/16/2018 |
Pursuant to the requirements of the Securities Exchange Act of 1934 and the Investment Company Act of 1940, this report has been signed below by the following persons on behalf of the registrant and in the capacities and on the dates indicated.
| | |
| By: | | /s/ Arthur P. Steinmetz |
| | Arthur P. Steinmetz |
| | Principal Executive Officer |
|
| Date: 11/16/2018 |
| | |
| By: | | /s/ Brian S. Petersen |
| | Brian S. Petersen |
| | Principal Financial Officer |
|
| Date: 11/16/2018 |