Table of Contents
UNITED STATES
SECURITIES AND EXCHANGE COMMISSION
Washington, D.C. 20549
FORM N-CSRS
CERTIFIED SHAREHOLDER REPORT OF REGISTERED MANAGEMENT
INVESTMENT COMPANIES
Investment Company Act file number 811-07257
SEI Institutional Investments Trust
(Exact name of registrant as specified in charter)
SEI Investments
One Freedom Valley Drive
Oaks, PA 19456
(Address of principal executive offices) (Zip code)
SEI Investments
One Freedom Valley Drive
Oaks, PA 19456
CT Corporation
101 Federal Street
Boston, MA 02110
(Name and address of agent for service)
Registrant’s telephone number, including area code: 1-800-342-5734
Date of fiscal year end: May 31, 2010
Date of reporting period: November 30, 2009
Table of Contents
| Item 1. | Reports to Stockholders. |
Table of Contents

SEI Institutional Investments Trust
Semi-Annual Report as of November 30, 2009
Large Cap Fund
Large Cap Diversified Alpha Fund
Large Cap Disciplined Equity Fund
Large Cap Index Fund
Small Cap Fund
Small/Mid Cap Equity Fund
U.S. Managed Volatility Fund
International Equity Fund
World Equity Ex-US Fund
Screened World Equity Ex-US Fund
Enhanced LIBOR Opportunities Fund
Core Fixed Income Fund
High Yield Bond Fund
Long Duration Fund
Emerging Markets Debt Fund
Real Return Fund
Table of Contents
| 1 | ||
| 108 | ||
| 112 | ||
| 116 | ||
| 122 | ||
| 125 | ||
| 143 | ||
Board of Trustees Consideration in Approving | 145 | |
The Trust files its complete schedule of portfolio holdings with the Securities and Exchange Commission for the first and third quarters of each fiscal year on Form N-Q within sixty days after the end of the period. The Trust’s Forms N-Q are available on the Commission’s website at http://www.sec.gov, and may be reviewed and copied at the Commission’s Public Reference Room in Washington, DC. Information on the operation of the Public Reference Room may be obtained by calling 1-800-SEC-0330.
A description of the policies and procedures that the Trust uses to determine how to vote proxies relating to portfolio securities, as well as information relating to how a Fund voted proxies relating to portfolio securities during the most recent 12-month period ended June 30, is available (i) without charge, upon request, by calling 1-800-DIAL-SEI; and (ii) on the Commission’s website at http://www.sec.gov.
Table of Contents
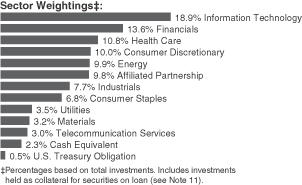
SUMMARY SCHEDULE OF INVESTMENTS (Unaudited)
Large Cap Fund
November 30, 2009
| Description | Percentage of Net Assets (%) | Shares | Market Value ($ Thousands) | |||||
COMMON STOCK — 91.2% | ||||||||
Consumer Discretionary — 10.5% | ||||||||
Amazon.com* (A) | 0.9 | % | 60 | $ | 8,199 | |||
Comcast, Cl A | 0.5 | 349 | 5,118 | |||||
Lowe’s | 0.6 | 239 | 5,206 | |||||
NIKE, Cl B (A) | 0.5 | 75 | 4,848 | |||||
Staples (A) | 0.5 | 218 | 5,088 | |||||
Time Warner (A) | 0.6 | 185 | 5,698 | |||||
Other Securities | 6.9 | 65,691 | ||||||
| 99,848 | ||||||||
Consumer Staples — 7.1% | ||||||||
PepsiCo | 0.9 | 136 | 8,433 | |||||
Procter & Gamble | 1.5 | 220 | 13,705 | |||||
Walgreen | 0.6 | 138 | 5,357 | |||||
Other Securities | 4.1 | 40,674 | ||||||
| 68,169 | ||||||||
Energy — 10.3% | ||||||||
Chevron | 1.5 | 177 | 13,781 | |||||
ConocoPhillips | 0.9 | 160 | 8,278 | |||||
Exxon Mobil | 2.5 | 313 | 23,531 | |||||
Occidental Petroleum | 0.5 | 61 | 4,931 | |||||
Other Securities | 4.9 | 48,034 | ||||||
| 98,555 | ||||||||
Financials — 14.2% | ||||||||
Aflac | 0.7 | 136 | 6,248 | |||||
American Express | 0.7 | 167 | 6,993 | |||||
Bank of America | 1.1 | 641 | 10,156 | |||||
CME Group, Cl A | 0.5 | 15 | 5,020 | |||||
Goldman Sachs Group | 0.9 | 49 | 8,278 | |||||
JPMorgan Chase | 1.5 | 349 | 14,826 | |||||
Wells Fargo (A) | 1.2 | 419 | 11,737 | |||||
Other Securities | 7.6 | 72,603 | ||||||
| 135,861 | ||||||||
Health Care — 11.3% | ||||||||
Allergan | 0.8 | 138 | 8,021 | |||||
Amgen* | 0.5 | 83 | 4,702 | |||||
| Description | Percentage of Net Assets (%) | Shares | Market Value ($ Thousands) | |||||
Gilead Sciences* | 0.6 | % | 130 | $ | 5,987 | |||
Johnson & Johnson | 1.1 | 169 | 10,648 | |||||
Medco Health Solutions* | 0.5 | 77 | 4,835 | |||||
Merck | 0.5 | 136 | 4,915 | |||||
Pfizer | 0.9 | 462 | 8,387 | |||||
UnitedHealth Group | 0.8 | 264 | 7,572 | |||||
Other Securities | 5.6 | 52,537 | ||||||
| 107,604 | ||||||||
Industrials — 8.0% | ||||||||
General Electric | 1.2 | 701 | 11,223 | |||||
United Parcel Service, Cl B | 0.5 | 91 | 5,256 | |||||
United Technologies | 0.6 | 88 | 5,913 | |||||
Other Securities | 5.7 | 54,027 | ||||||
| 76,419 | ||||||||
Information Technology — 19.7% | ||||||||
Adobe Systems* (A) | 0.6 | 159 | 5,560 | |||||
Apple* | 1.8 | 83 | 16,553 | |||||
Cisco Systems* | 1.2 | 470 | 10,992 | |||||
eBay* | 0.6 | 233 | 5,711 | |||||
EMC* | 0.7 | 375 | 6,305 | |||||
Google, Cl A* | 1.5 | 25 | 14,737 | |||||
Hewlett-Packard | 1.0 | 182 | 8,918 | |||||
Intel | 0.8 | 368 | 7,056 | |||||
International Business Machines | 1.0 | 76 | 9,569 | |||||
Microsoft | 1.6 | 504 | 14,815 | |||||
Qualcomm | 0.9 | 185 | 8,322 | |||||
Visa, Cl A (A) | 0.8 | 94 | 7,589 | |||||
Yahoo!* | 0.6 | 357 | 5,340 | |||||
Other Securities | 6.6 | 66,526 | ||||||
| 187,993 | ||||||||
Materials — 3.3% | ||||||||
Praxair | 0.5 | 57 | 4,694 | |||||
Other Securities | 2.8 | 26,961 | ||||||
| 31,655 | ||||||||
Telecommunication Services — 3.2% | ||||||||
AT&T | 1.4 | 503 | 13,546 | |||||
Crown Castle International* | 0.5 | 136 | 4,974 | |||||
Verizon Communications | 0.8 | 235 | 7,405 | |||||
Other Securities | 0.5 | 4,288 | ||||||
| 30,213 | ||||||||
Utilities — 3.6% | ||||||||
AES* | 0.6 | 482 | 6,143 | |||||
Other Securities | 3.0 | 28,695 | ||||||
| 34,838 | ||||||||
Total Common Stock | 871,155 | |||||||
| SEI Institutional Investments Trust / Semi-Annual Report / November 30, 2009 | 1 |
Table of Contents
SUMMARY SCHEDULE OF INVESTMENTS (Unaudited)
Large Cap Fund (Concluded)
November 30, 2009
| Description | Percentage of Net Assets (%) | Shares/Face Amount ($ Thousands) | Market Value ($ Thousands) | ||||||
AFFILIATED PARTNERSHIP — 10.2% | |||||||||
SEI Liquidity Fund, L.P. | 10.2 | % | 98,067,520 | $ | 97,301 | ||||
Total Affiliated Partnership | 97,301 | ||||||||
CASH EQUIVALENT — 2.4% | |||||||||
SEI Daily Income Trust, | 2.4 | 22,595,219 | 22,595 | ||||||
Total Cash Equivalent | 22,595 | ||||||||
U.S. TREASURY OBLIGATION (C) (D) — 0.5% | |||||||||
U.S. Treasury Bill | 0.5 | $ | 5,200 | 5,200 | |||||
Total U.S. Treasury Obligation | 5,200 | ||||||||
Total Investments — 104.3% | $ | 996,251 | |||||||
A summary of the open futures contracts held by the Fund at November 30, 2009, is as follows:
| Type of Contract | Number of Contracts Long (Short) | Expiration Date | Unrealized Appreciation ($ Thousands) | ||||
S&P 500 Composite Index | 263 | Dec-2009 | $ | 1,122 | |||
S&P Mid 400 E-Mini | 139 | Dec-2009 | 70 | ||||
| $ | 1,192 | ||||||
For the year ended November 30, 2009, the total amount of all open futures contracts, as presented in the table above, are representative of the volume of activity for this derivative type during the period.
Percentages are based on a Net Assets of $954,913 ($ Thousands).
| (A) | This security or a partial position of this security is on loan at November 30, 2009. The total value of securities on loan at November 30, 2009 was $96,118 ($ Thousands). |
| (B) | This security was purchased with cash collateral held from securities on loan (see Note 11). The total value of such securities as of November 30, 2009 was $97,301 ($ Thousands). |
| (C) | Security, or a portion thereof, has been pledged as collateral on open futures contracts. |
| (D) | The rate reported is the effective yield at time of purchase. |
| * | Non-income producing security. |
| ** | The rate reported is the 7-day effective yield as of November 30, 2009. |
| † | Investment in Affiliated Security (see Note 5). |
Cl — Class
L.P. — Limited Partnership
S&P — Standard & Poor’s
The Summary Schedule of Investments does not reflect the complete portfolio holdings. It includes the Fund’s 50 largest unaffiliated holdings and each investment of any issuer that exceeds 1% of the Fund’s net assets. “Other Securities” represent all issues not required to be disclosed under the rules adopted by the U.S. Securities and Exchange Commission (“SEC”). In certain instances, securities for which footnotes listed above may otherwise apply are included in the Other Securities caption. The complete schedule of portfolio holdings is available (i) without charge, upon request, by calling (800) 342-5734; and (ii) on the SEC’s website at http://www.sec.gov.
The following is a summary of the inputs used as of November 30, 2009 in valuing the Fund’s investments carried at value ($ Thousands):
| Investments in Securities | Level 1 | Level 2 | Level 3 | Total | ||||||||
Common Stock | $ | 871,155 | $ | — | $ | — | $ | 871,155 | ||||
Affiliated Partnership | — | 97,301 | — | 97,301 | ||||||||
Cash Equivalent | 22,595 | — | — | 22,595 | ||||||||
U.S. Treasury Obligation | — | 5,200 | — | 5,200 | ||||||||
Total Investments in Securities | $ | 893,750 | $ | 102,501 | $ | — | $ | 996,251 | ||||
| Other Financial Instruments | Level 1 | Level 2 | Level 3 | Total | ||||||||
Futures Contracts* | $ | 1,192 | $ | — | $ | — | $ | 1,192 | ||||
Total Other Financial Instruments | $ | 1,192 | $ | — | $ | — | $ | 1,192 | ||||
| * | Futures contracts are valued at the unrealized appreciation on the instrument. |
For more information on valuation inputs, see Note 2 — Significant Accounting Policies in Notes to Financial Statements.
The accompanying notes are an integral part of the financial statements.
| 2 | SEI Institutional Investments Trust / Semi-Annual Report / November 30, 2009 |
Table of Contents
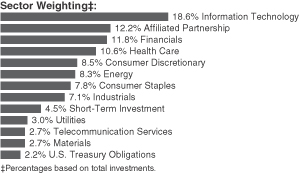
SUMMARY SCHEDULE OF INVESTMENTS (Unaudited)
Large Cap Diversified Alpha Fund
November 30, 2009
| Description | Percentage of Net Assets (%) | Shares | Market Value ($ Thousands) | |||||
COMMON STOCK — 80.9% | ||||||||
Consumer Discretionary — 8.5% | ||||||||
Amazon.com* | 0.4 | % | 10,750 | $ | 1,461 | |||
Comcast, Cl A | 0.7 | 177,307 | 2,601 | |||||
Other Securities | 7.4 | 26,010 | ||||||
| 30,072 | ||||||||
Consumer Staples — 7.8% | ||||||||
PepsiCo | 0.5 | 26,250 | 1,633 | |||||
Philip Morris International | 0.8 | 58,895 | 2,832 | |||||
Procter & Gamble | 1.1 | 61,700 | 3,847 | |||||
Sara Lee | 0.5 | 131,955 | 1,602 | |||||
Sysco | 0.7 | 90,448 | 2,446 | |||||
Walgreen | 0.5 | 45,247 | 1,760 | |||||
Wal-Mart Stores | 0.4 | 29,100 | 1,587 | |||||
Other Securities | 3.3 | 11,978 | ||||||
| 27,685 | ||||||||
Energy — 8.3% | ||||||||
Chevron | 1.7 | 78,186 | 6,102 | |||||
ConocoPhillips | 0.6 | 43,029 | 2,228 | |||||
Exxon Mobil | 3.0 | 139,348 | 10,461 | |||||
Occidental Petroleum | 0.5 | 21,751 | 1,757 | |||||
Other Securities | 2.5 | 8,798 | ||||||
| 29,346 | ||||||||
Financials — 11.7% | ||||||||
Aflac | 0.6 | 45,825 | 2,109 | |||||
American Express | 0.9 | 73,348 | 3,068 | |||||
Bank of America | 0.4 | 99,129 | 1,571 | |||||
Goldman Sachs Group | 0.6 | 11,235 | 1,906 | |||||
JPMorgan Chase | 0.5 | 43,900 | 1,865 | |||||
T. Rowe Price Group | 0.7 | 53,106 | 2,598 | |||||
US Bancorp | 0.4 | 61,897 | 1,494 | |||||
Wells Fargo | 0.7 | 81,987 | 2,299 | |||||
Other Securities | 6.9 | 24,812 | ||||||
| 41,722 | ||||||||
| Description | Percentage of Net Assets (%) | Shares | Market Value ($ Thousands) | |||||
Health Care — 10.6% | ||||||||
Allergan | 0.5 | % | 32,700 | $ | 1,901 | |||
AmerisourceBergen | 0.5 | 69,493 | 1,716 | |||||
Amgen* | 0.9 | 53,063 | 2,990 | |||||
Biogen Idec* | 0.5 | 36,116 | 1,695 | |||||
Cardinal Health | 0.5 | 55,720 | 1,796 | |||||
Gilead Sciences* | 0.4 | 30,900 | 1,423 | |||||
Johnson & Johnson | 1.2 | 68,717 | 4,318 | |||||
Medco Health Solutions* | 0.5 | 25,500 | 1,611 | |||||
Pfizer | 0.9 | 177,265 | 3,221 | |||||
UnitedHealth Group | 0.7 | 84,827 | 2,432 | |||||
Other Securities | 4.0 | 14,536 | ||||||
| 37,639 | ||||||||
Industrials — 7.1% | ||||||||
General Dynamics | 0.6 | 29,896 | 1,970 | |||||
General Electric | 0.5 | 112,000 | 1,794 | |||||
Lockheed Martin | 0.4 | 18,620 | 1,438 | |||||
Other Securities | 5.6 | 20,102 | ||||||
| 25,304 | ||||||||
Information Technology — 18.6% | ||||||||
Apple* | 1.0 | 16,675 | 3,334 | |||||
Cisco Systems* | 0.9 | 131,100 | 3,068 | |||||
Corning | 0.6 | 121,564 | 2,028 | |||||
Google, Cl A* | 1.3 | 8,125 | 4,737 | |||||
Hewlett-Packard | 0.6 | 45,400 | 2,227 | |||||
Intel | 0.9 | 164,895 | 3,166 | |||||
International Business Machines | 1.2 | 34,334 | 4,338 | |||||
Microsoft | 2.2 | 264,436 | 7,777 | |||||
Qualcomm | 0.6 | 46,125 | 2,076 | |||||
Symantec* | 0.5 | 107,000 | 1,899 | |||||
Texas Instruments | 1.0 | 136,088 | 3,442 | |||||
Visa, Cl A | 0.7 | 30,261 | 2,451 | |||||
Other Securities | 7.1 | 25,575 | ||||||
| 66,118 | ||||||||
Materials — 2.7% | ||||||||
Other Securities | 2.7 | 9,729 | ||||||
Telecommunication Services — 2.7% | ||||||||
AT&T | 1.5 | 197,443 | 5,319 | |||||
Other Securities | 1.2 | 4,331 | ||||||
| 9,650 | ||||||||
Utilities — 2.9% | ||||||||
AES* | 0.6 | 163,026 | 2,077 | |||||
Other Securities | 2.3 | 8,378 | ||||||
| 10,455 | ||||||||
| SEI Institutional Investments Trust / Semi-Annual Report / November 30, 2009 | 3 |
Table of Contents
SUMMARY SCHEDULE OF INVESTMENTS (Unaudited)
Large Cap Diversified Alpha Fund (Concluded)
November 30, 2009
| Description | Percentage of Net Assets (%) | Shares/Face Amount ($ Thousands) | Market Value ($ Thousands) | ||||||
Total Common Stock | $ | 287,720 | |||||||
AFFILIATED PARTNERSHIP — 12.2% | |||||||||
SEI LIBOR Plus Portfolio† | 12.2 | % | 6,723,909 | 43,302 | |||||
Total Affiliated Partnership | 43,302 | ||||||||
CASH EQUIVALENT — 4.5% | |||||||||
SEI Daily Income Trust, | 4.5 | 16,000,101 | 16,000 | ||||||
Total Cash Equivalent | 16,000 | ||||||||
U.S. TREASURY OBLIGATIONS (A) (B) — 2.1% | |||||||||
U.S. Treasury Bills | 0.1 | $ | 300 | 299 | |||||
0.130%, 12/03/09 | 1.3 | 4,848 | 4,848 | ||||||
0.079%, 01/07/10 | 0.7 | 2,500 | 2,500 | ||||||
Total U.S. Treasury Obligations | 7,647 | ||||||||
Total Investments — 99.7% (Cost $337,009)($ Thousands) | $ | 354,669 | |||||||
A summary of the open futures contracts held by the Fund at November 30, 2009, is as follows:
| Type of Contract | Number of Contracts Long (Short) | Expiration Date | Unrealized Appreciation ($ Thousands) | ||||
S&P 500 Composite Index | 240 | Dec-2009 | $ | 4,839 | |||
S&P 500 E-Mini | 20 | Dec-2009 | 58 | ||||
| $ | 4,897 | ||||||
For the year ended November 30, 2009, the total amount of all open futures contracts, as presented in the table above, are representative of the volume of activity for this derivative type during the period.
Percentages are based on a Net Assets of $355,676 ($ Thousands).
| (A) | The rate reported is the effective yield at time of purchase. |
| (B) | Security, or a portion thereof, has been pledged as collateral on open futures contracts. |
| * | Non-income producing security. |
| ** | Rate shown is the 7-day effective yield as of November 30, 2009. |
| † | Investment in Affiliated Security (see Note 5). |
Cl — Class
LIBOR — London Interbank Offered Rate
S&P — Standard & Poor’s
The Summary Schedule of Investments does not reflect the complete portfolio holdings. It includes the Fund’s 50 largest unaffiliated holdings and each investment of any issuer that exceeds 1% of the Fund’s net assets. “Other Securities” represent all issues not required to be disclosed under the rules adopted by the U.S. Securities and Exchange Commission (“SEC”). In certain instances, securities for which footnotes listed above may otherwise apply are included in the Other Securities section. The complete schedule of portfolio holdings is available (i) without charge, upon request, by calling (800) 342-5734; and (ii) on the SEC’s website at http://www.sec.gov.
The following is a summary of the inputs used as of November 30, 2009 in valuing the Fund’s investments carried at value ($ Thousands):
| Investments in Securities | Level 1 | Level 2 | Level 3 | Total | ||||||||
Common Stock | $ | 287,720 | $ | — | $ | — | $ | 287,720 | ||||
Cash Equivalent | 16,000 | — | — | 16,000 | ||||||||
U.S. Treasury Obligations | — | 7,647 | — | 7,647 | ||||||||
Affiliated Partnership | — | 43,302 | — | 43,302 | ||||||||
Total Investments in Securities | $ | 303,720 | $ | 50,949 | $ | — | $ | 354,669 | ||||
| Other Financial Instruments | Level 1 | Level 2 | Level 3 | Total | ||||||||
Futures Contracts* | $ | 4,897 | $ | — | $ | — | $ | 4,897 | ||||
Total Other Financial Instruments | $ | 4,897 | $ | — | $ | — | $ | 4,897 | ||||
| * | Futures contracts are valued at the unrealized appreciation on the instrument. |
For more information on valuation inputs, see Note 2 — Significant Accounting Policies in Notes to Financial Statements.
The accompanying notes are an integral part of the financial statements.
| 4 | SEI Institutional Investments Trust / Semi-Annual Report / November 30, 2009 |
Table of Contents
SUMMARY SCHEDULE OF INVESTMENTS (Unaudited)
Large Cap Disciplined Equity Fund
November 30, 2009

| Description | Percentage of Net Assets (%) | Shares | Market Value ($ Thousands) | |||||
COMMON STOCK — 83.7% |
| |||||||
Consumer Discretionary — 8.0% |
| |||||||
Comcast, Cl A | 0.9 | % | 4,455,886 | $ | 65,368 | |||
Home Depot (A) | 0.5 | 1,178,468 | 32,243 | |||||
Other Securities | 6.6 | 482,972 | ||||||
| 580,583 | ||||||||
Consumer Staples — 10.0% |
| |||||||
Altria Group | 0.5 | 1,634,244 | 30,740 | |||||
Archer-Daniels-Midland | 0.5 | 1,085,978 | 33,459 | |||||
Coca-Cola (A) | 0.6 | 772,604 | 44,193 | |||||
PepsiCo (A) | 0.8 | 901,097 | 56,066 | |||||
Philip Morris International | 1.1 | 1,683,491 | 80,959 | |||||
Procter & Gamble | 1.4 | 1,596,411 | 99,536 | |||||
Walgreen (A) | 0.5 | 899,492 | 34,981 | |||||
Wal-Mart Stores | 1.4 | 1,929,689 | 105,265 | |||||
Other Securities | 3.2 | 236,360 | ||||||
| 721,559 | ||||||||
Energy — 10.1% | ||||||||
Chevron | 2.1 | 1,903,443 | 148,545 | |||||
ConocoPhillips | 0.8 | 1,047,143 | 54,211 | |||||
Exxon Mobil | 3.5 | 3,400,086 | 255,244 | |||||
Marathon Oil (A) | 0.5 | 1,075,640 | 35,087 | |||||
Other Securities | 3.2 | 233,884 | ||||||
| 726,971 | ||||||||
Financials — 11.9% | ||||||||
American Express | 1.0 | 1,751,778 | 73,277 | |||||
Bank of America | 0.8 | 3,408,159 | 54,019 | |||||
Goldman Sachs Group (A) | 0.8 | 350,923 | 59,538 | |||||
JPMorgan Chase | 1.7 | 2,822,544 | 119,930 | |||||
PNC Financial Services Group (A) | 0.4 | 520,311 | 29,663 | |||||
T. Rowe Price Group (A) | 0.4 | 619,900 | 30,332 | |||||
Travelers | 0.5 | 625,385 | 32,764 | |||||
US Bancorp (A) | 0.4 | 1,279,664 | 30,878 | |||||
| Description | Percentage of Net Assets (%) | Shares | Market Value ($ Thousands) | |||||
Wells Fargo (A) | 0.9 | % | 2,229,655 | $ | 62,519 | |||
Other Securities | 5.0 | 366,244 | ||||||
| 859,164 | ||||||||
Health Care — 11.0% | ||||||||
Amgen* | 0.7 | 919,852 | 51,834 | |||||
Johnson & Johnson | 1.9 | 2,179,694 | 136,972 | |||||
McKesson | 0.5 | 606,259 | 37,600 | |||||
Medtronic | 0.5 | 795,269 | 33,751 | |||||
Merck | 0.6 | 1,227,315 | 44,441 | |||||
Pfizer | 1.4 | 5,553,948 | 100,915 | |||||
WellPoint* | 0.5 | 614,166 | 33,183 | |||||
Other Securities | 4.9 | 353,115 | ||||||
| 791,811 | ||||||||
Industrials — 8.4% | ||||||||
3M | 0.5 | 492,216 | 38,117 | |||||
General Dynamics | 0.6 | 643,129 | 42,382 | |||||
General Electric (A) | 0.9 | 4,056,486 | 64,985 | |||||
Illinois Tool Works | 0.4 | 642,724 | 31,262 | |||||
Lockheed Martin | 0.8 | 745,887 | 57,605 | |||||
United Parcel Service, Cl B (A) | 0.5 | 648,657 | 37,278 | |||||
Other Securities | 4.7 | 336,555 | ||||||
| 608,184 | ||||||||
Information Technology — 15.9% | ||||||||
Apple* | 1.3 | 462,850 | 92,528 | |||||
Cisco Systems* | 0.9 | 2,824,408 | 66,091 | |||||
Corning | 0.6 | 2,406,450 | 40,140 | |||||
Dell* (A) | 0.4 | 2,200,163 | 31,066 | |||||
Google, Cl A* | 1.0 | 118,577 | 69,130 | |||||
Hewlett-Packard | 0.8 | 1,218,544 | 59,782 | |||||
Intel | 1.4 | 5,290,370 | 101,575 | |||||
International Business Machines | 1.7 | 973,190 | 122,963 | |||||
Microsoft | 1.9 | 4,553,575 | 133,921 | |||||
Oracle | 0.6 | 2,035,316 | 44,940 | |||||
Texas Instruments (A) | 0.6 | 1,613,888 | 40,815 | |||||
Other Securities | 4.7 | 345,149 | ||||||
| 1,148,100 | ||||||||
Materials — 2.5% | ||||||||
Other Securities | 2.5 | 183,252 | ||||||
Telecommunication Services — 3.1% | ||||||||
AT&T | 2.0 | 5,262,332 | 141,767 | |||||
Verizon Communications | 0.6 | 1,323,598 | 41,641 | |||||
Other Securities | 0.5 | 41,701 | ||||||
| 225,109 | ||||||||
| SEI Institutional Investments Trust / Semi-Annual Report / November 30, 2009 | 5 |
Table of Contents
SUMMARY SCHEDULE OF INVESTMENTS (Unaudited)
Large Cap Disciplined Equity Fund (Concluded)
November 30, 2009
| Description | Percentage of Net Assets (%) | Shares/Face Amount ($ Thousands) | Market Value ($ Thousands) | ||||||
Utilities — 2.8% | |||||||||
Other Securities | 2.8 | % | $ | 202,057 | |||||
Total Common Stock | 6,046,790 | ||||||||
AFFILIATED PARTNERSHIPS — 22.8% | |||||||||
SEI Liquidity Fund, L.P. | 11.7 | 856,147,343 | 846,148 | ||||||
SEI LIBOR Plus Portfolio† | 11.1 | 124,403,038 | 801,156 | ||||||
Total Affiliated Partnerships | 1,647,304 | ||||||||
CASH EQUIVALENT — 3.8% |
| ||||||||
SEI Daily Income Trust, | 3.8 | 274,430,379 | 274,430 | ||||||
Total Cash Equivalent |
| 274,430 | |||||||
U.S. TREASURY OBLIGATIONS (C) (D) — 1.9% | |||||||||
U.S. Treasury Bills | 1.8 | $ | 128,500 | 128,499 | |||||
0.290%, 12/17/09 | 0.0 | 700 | 700 | ||||||
0.071%, 01/07/10 | 0.0 | 2,700 | 2,700 | ||||||
0.249%, 09/23/10 | 0.1 | 5,145 | 5,137 | ||||||
Total U.S. Treasury Obligations | 137,036 | ||||||||
Total Investments — 112.2% | $ | 8,105,560 | |||||||
A summary of the open futures contracts held by the Fund at November 30, 2009, is as follows:
| Type of Contract | Number of Contracts Long (Short) | Expiration Date | Unrealized Appreciation ($ Thousands) | ||||
S&P 500 Composite Index | 4,163 | Dec-2009 | $ | 84,237 | |||
S&P 500 Composite Index | 13 | Dec-2009 | 242 | ||||
S&P 500 E-Mini | 740 | Dec-2009 | 1,818 | ||||
| $ | 86,297 | ||||||
For the year ended November 30, 2009, the total amount of all open futures contracts, as presented in the table above, are representative of the volume of activity for this derivative type during the period.
Percentages are based on a Net Assets of $7,221,501 ($ Thousands).
| (A) | This security or a partial position of this security is on loan at November 30, 2009. The total value of securities on loan at November 30, 2009 was $838,520 ($ Thousands). |
| (B) | This security was purchased with cash collateral held from securities on loan (see Note 11). The total value of such securities on November 30, 2009 was $846,148 ($ Thousands). |
| (C) | The rate reported is the effective yield at time of purchase. |
| (D) | Security, or a portion thereof, has been pledged as collateral on open futures contracts. |
| * | Non-income producing security. |
| ** | Rate shown is the 7-day effective yield as of November 30, 2009. |
| † | Investment in Affiliated Security (see Note 5). |
| Cl | — Class |
LIBOR — London Interbank Offered Rate
L.P. — Limited Partnership
S&P — Standard & Poor’s
The Summary Schedule of Investments does not reflect the complete portfolio holdings. It includes the Fund’s 50 largest unaffiliated holdings and each investment of any issuer that exceeds 1% of the Fund’s net assets. “Other Securities” represent all issues not required to be disclosed under the rules adopted by the U.S. Securities and Exchange Commission (“SEC”). In certain instances, securities for which footnotes listed above may otherwise apply are included in the Other Securities caption. The complete schedule of portfolio holdings is available (i) without charge, upon request, by calling (800) 342-5734; and (ii) on the SEC’s website at http://www.sec.gov.
The following is a summary of the inputs used as of November 30, 2009 in valuing the Fund’s investments carried at value ($ Thousands):
| Investments in Securities | Level 1 | Level 2 | Level 3 | Total | ||||||||
Common Stock | $ | 6,046,790 | $ | — | $ | — | $ | 6,046,790 | ||||
Affiliated Partnerships | — | 1,647,304 | — | 1,647,304 | ||||||||
Cash Equivalent | 274,430 | — | — | 274,430 | ||||||||
U.S. Treasury Obligations | — | 137,036 | — | 137,036 | ||||||||
Total Investments in Securities | $ | 6,321,220 | $ | 1,784,340 | $ | — | $ | 8,105,560 | ||||
| Other Financial Instruments | Level 1 | Level 2 | Level 3 | Total | ||||||||
Futures Contracts* | $ | 86,297 | $ | — | $ | — | $ | 86,297 | ||||
Total Other Financial Instruments | $ | 86,297 | $ | — | $ | — | $ | 86,297 | ||||
| * | Futures contracts are valued at the unrealized appreciation on the instrument. |
For more information on valuation inputs, see Note 2 — Significant Accounting Policies in Notes to Financial Statements.
The accompanying notes are an integral part of the financial statements.
| 6 | SEI Institutional Investments Trust / Semi-Annual Report / November 30, 2009 |
Table of Contents
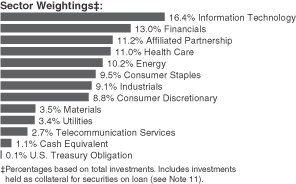
SUMMARY SCHEDULE OF INVESTMENTS (Unaudited)
Large Cap Index Fund
November 30, 2009
| Description | Percentage of Net Assets (%) | Shares | Market Value ($ Thousands) | |||||
COMMON STOCK — 98.6% | ||||||||
Consumer Discretionary — 9.9% | ||||||||
Amazon.com* (A) | 0.4 | % | 15,189 | $ | 2,064 | |||
Comcast, Cl A | 0.4 | 130,925 | 1,921 | |||||
Home Depot (A) | 0.4 | 77,315 | 2,115 | |||||
McDonald’s | 0.6 | 50,380 | 3,187 | |||||
Walt Disney | 0.5 | 85,584 | 2,586 | |||||
Other Securities | 7.6 | 37,531 | ||||||
| 49,404 | ||||||||
Consumer Staples — 10.8% | ||||||||
Coca-Cola (A) | 1.2 | 105,820 | 6,053 | |||||
Colgate-Palmolive (A) | 0.4 | 22,775 | 1,917 | |||||
CVS Caremark | 0.4 | 66,352 | 2,058 | |||||
Kraft Foods, Cl A | 0.4 | 67,015 | 1,781 | |||||
PepsiCo | 0.9 | 71,137 | 4,426 | |||||
Philip Morris International | 0.9 | 89,568 | 4,308 | |||||
Procter & Gamble | 1.7 | 133,274 | 8,310 | |||||
Wal-Mart Stores | 1.1 | 100,979 | 5,508 | |||||
Other Securities | 3.8 | 19,506 | ||||||
| 53,867 | ||||||||
Energy — 11.5% | ||||||||
Chevron | 1.4 | 91,602 | 7,149 | |||||
ConocoPhillips | 0.7 | 67,576 | 3,498 | |||||
Exxon Mobil | 3.4 | 223,212 | 16,757 | |||||
Occidental Petroleum | 0.6 | 36,954 | 2,985 | |||||
Schlumberger | 0.7 | 54,600 | 3,488 | |||||
Other Securities | 4.7 | 23,922 | ||||||
| 57,799 | ||||||||
Financials — 14.6% | ||||||||
American Express | 0.4 | 46,234 | 1,934 | |||||
Bank of America | 1.3 | 395,318 | 6,266 | |||||
Citigroup | 0.6 | 692,745 | 2,847 | |||||
Goldman Sachs Group | 0.8 | 22,975 | 3,898 | |||||
JPMorgan Chase | 1.5 | 171,834 | 7,301 | |||||
Morgan Stanley | 0.4 | 62,778 | 1,983 | |||||
SEI (C) | 0.0 | 5,642 | 99 | |||||
US Bancorp | 0.4 | 87,643 | 2,115 | |||||
| Description | Percentage of Net Assets (%) | Shares | Market Value ($ Thousands) | |||||
Wells Fargo (A) | 1.2 | % | 217,366 | $ | 6,095 | |||
Other Securities | 8.0 | 40,543 | ||||||
| 73,081 | ||||||||
Health Care — 12.4% | ||||||||
Abbott Laboratories | 0.8 | 70,576 | 3,846 | |||||
Amgen* | 0.5 | 46,667 | 2,630 | |||||
Bristol-Myers Squibb | 0.5 | 90,313 | 2,286 | |||||
Gilead Sciences* | 0.4 | 41,850 | 1,927 | |||||
Johnson & Johnson | 1.6 | 126,009 | 7,918 | |||||
Medtronic | 0.4 | 50,985 | 2,164 | |||||
Merck | 1.0 | 139,343 | 5,046 | |||||
Pfizer | 1.3 | 368,480 | 6,695 | |||||
Other Securities | 5.9 | 29,652 | ||||||
| 62,164 | ||||||||
Industrials — 10.2% | ||||||||
3M | 0.5 | 31,646 | 2,451 | |||||
General Electric | 1.6 | 484,023 | 7,754 | |||||
United Parcel Service, Cl B | 0.4 | 31,941 | 1,835 | |||||
United Technologies | 0.5 | 38,566 | 2,593 | |||||
Other Securities | 7.2 | 36,421 | ||||||
| 51,054 | ||||||||
Information Technology — 18.4% | ||||||||
Apple* | 1.6 | 40,823 | 8,161 | |||||
Cisco Systems* | 1.2 | 263,527 | 6,166 | |||||
Google, Cl A* | 1.3 | 10,944 | 6,380 | |||||
Hewlett-Packard | 1.1 | 109,301 | 5,362 | |||||
Intel | 1.0 | 255,158 | 4,899 | |||||
International Business Machines | 1.5 | 60,398 | 7,631 | |||||
Microsoft | 2.1 | 352,400 | 10,364 | |||||
Oracle | 0.8 | 174,467 | 3,852 | |||||
Qualcomm | 0.7 | 75,550 | 3,400 | |||||
Other Securities | 7.1 | 36,015 | ||||||
| 92,230 | ||||||||
Materials — 4.0% | ||||||||
Monsanto | 0.4 | 24,850 | 2,007 | |||||
Other Securities | 3.6 | 17,802 | ||||||
| 19,809 | ||||||||
Telecommunication Services — 3.0% | ||||||||
AT&T | 1.5 | 269,633 | 7,264 | |||||
Verizon Communications | 0.8 | 129,715 | 4,081 | |||||
Other Securities | 0.7 | 3,623 | ||||||
| 14,968 | ||||||||
Utilities — 3.8% | ||||||||
Other Securities | 3.8 | 19,076 | ||||||
Total Common Stock | 493,452 | |||||||
| SEI Institutional Investments Trust / Semi-Annual Report / November 30, 2009 | 7 |
Table of Contents
SUMMARY SCHEDULE OF INVESTMENTS (Unaudited)
Large Cap Index Fund (Concluded)
November 30, 2009
| Description | Percentage of Net Assets (%) | Shares | Market Value ($ Thousands) | |||||
AFFILIATED PARTNERSHIP — 12.6% | ||||||||
SEI Liquidity Fund, L.P. | 12.6 | % | 63,613,253 | $ | 62,795 | |||
Total Affiliated Partnership | 62,795 | |||||||
CASH EQUIVALENT — 1.2% |
| |||||||
SEI Daily Income Trust, | 1.2 | 6,208,971 | 6,209 | |||||
Total Cash Equivalent | 6,209 | |||||||
U.S. TREASURY OBLIGATION — 0.2% | ||||||||
Other Securities | 0.2 | 828 | ||||||
Total U.S. Treasury Obligation | 828 | |||||||
Total Investments — 112.6% | $ | 563,284 | ||||||
A summary of the open futures contracts held by the Fund at November 30, 2009, is as follows:
| Type of Contract | Number of Contracts Long (Short) | Expiration Date | Unrealized Appreciation ($ Thousands) | ||||
S&P 500 E-Mini | 146 | Dec-2009 | $ | 386 | |||
S&P Mid 400 E-Mini | 4 | Dec-2009 | 6 | ||||
| $ | 392 | ||||||
For the year ended November 30, 2009, the total amount of all open futures contracts, as presented in the table above, are representative of the volume of activity for this derivative type during the period.
Percentages are based on a Net Assets of $500,256 ($ Thousands).
| (A) | This security or a partial position of this security is on loan at November 30, 2009. The total value of securities on loan at November 30, 2009 was $62,407 ($ Thousands). |
| (B) | This security was purchased with cash collateral held from securities on loan (see Note 11). The total value of such securities on November 30, 2009 was $62,795 ($ Thousands). |
| (C) | The Fund may purchase securities of certain companies with which it is affiliated to the extent these companies are represented in its benchmark index. |
| * | Non-income producing security. |
| ** | The rate reported is the 7-day effective yield as of November 30, 2009 |
| † | Investment in Affiliated Security (see Note 5). |
Cl — Class
L.P. — Limited Partnership
S&P — Standard & Poor’s
The Summary Schedule of Investments does not reflect the complete portfolio holdings. It includes the Fund’s 50 largest unaffiliated holdings and each investment of any issuer that exceeds 1% of the Fund’s net assets. “Other Securities” represent all issues not required to be disclosed under the rules adopted by the U.S. Securities and Exchange Commission (“SEC”). In certain instances, securities for which footnotes listed above may otherwise apply are included in the Other Securities caption. The complete schedule of portfolio holdings is available (i) without charge, upon request, by calling (800) 342-5734; and (ii) on the SEC’s website at http://www.sec.gov.
The following is a summary of the inputs used as of November 30, 2009 in valuing the Fund’s investments carried at value ($ Thousands):
| Investments in Securities | Level 1 | Level 2 | Level 3 | Total | ||||||||
Common Stock | $ | 493,452 | $ | — | $ | — | $ | 493,452 | ||||
Affiliated Partnership | — | 62,795 | — | 62,795 | ||||||||
Cash Equivalent | 6,209 | — | — | 6,209 | ||||||||
U.S. Treasury Obligation | — | 828 | — | 828 | ||||||||
Total Investments in Securities | $ | 499,661 | $ | 63,623 | $ | — | $ | 563,284 | ||||
| Other Financial Instruments | Level 1 | Level 2 | Level 3 | Total | ||||||||
Futures Contracts* | $ | 392 | $ | — | $ | — | $ | 392 | ||||
Total Other Financial Instruments | $ | 392 | $ | — | $ | — | $ | 392 | ||||
| * | Futures contracts are valued at the unrealized appreciation on the instrument. |
For more information on valuation inputs, see Note 2 — Significant Accounting Policies in Notes to Financial Statements.
The accompanying notes are an integral part of the financial statements.
| 8 | SEI Institutional Investments Trust / Semi-Annual Report / November 30, 2009 |
Table of Contents
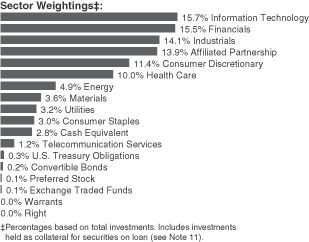
SUMMARY SCHEDULE OF INVESTMENTS (Unaudited)
Small Cap Fund
November 30, 2009
| Description | Percentage of Net Assets (%) | Shares | Market Value ($ Thousands) | |||||
COMMON STOCK — 96.4% | ||||||||
Consumer Discretionary — 13.3% | ||||||||
Capella Education* (A) | 0.3 | % | 41,467 | $ | 2,956 | |||
Cato, Cl A (A) | 0.3 | 164,537 | 3,148 | |||||
J Crew Group* | 0.3 | 71,625 | 3,065 | |||||
Jarden | 0.3 | 125,766 | 3,452 | |||||
Life Time Fitness* (A) | 0.3 | 161,144 | 3,642 | |||||
MDC Partners, Cl A* | 0.3 | 445,400 | 3,666 | |||||
Pinnacle Entertainment* | 0.2 | 273,945 | 2,896 | |||||
Other Securities | 11.3 | 137,391 | ||||||
| 160,216 | ||||||||
Consumer Staples — 3.5% | ||||||||
Del Monte Foods | 0.3 | 283,800 | 2,977 | |||||
Other Securities | 3.2 | 39,290 | ||||||
| 42,267 | ||||||||
Energy — 5.7% | ||||||||
Cal Dive International* | 0.3 | 470,737 | 3,418 | |||||
PetroHawk Energy* | 0.3 | 145,232 | 3,245 | |||||
World Fuel Services | 0.4 | 90,568 | 4,816 | |||||
Other Securities | 4.7 | 57,212 | ||||||
| 68,691 | ||||||||
Financials — 18.1% | ||||||||
Boston Properties‡ (A) | 0.4 | 62,050 | 4,156 | |||||
HCP‡ | 0.3 | 108,100 | 3,384 | |||||
MFA Mortgage Investments‡ | 0.3 | 425,143 | 3,218 | |||||
Nelnet, Cl A | 0.3 | 178,675 | 3,104 | |||||
Platinum Underwriters Holdings | 0.4 | 136,696 | 4,824 | |||||
Public Storage‡ | 0.3 | 45,024 | 3,583 | |||||
Simon Property Group‡ | 0.3 | 45,764 | 3,325 | |||||
Other Securities | 15.8 | 192,399 | ||||||
| 217,993 | ||||||||
| Description | Percentage of Net Assets (%) | Shares | Market Value ($ Thousands) | |||||
Health Care — 11.7% | ||||||||
AMAG Pharmaceuticals* (A) | 0.3 | % | 85,780 | $ | 3,207 | |||
BioMarin Pharmaceutical* | 0.3 | 188,242 | 3,108 | |||||
Conmed* | 0.3 | 166,047 | 3,452 | |||||
LHC Group* (A) | 0.3 | 129,465 | 3,984 | |||||
Mednax* | 0.3 | 58,433 | 3,284 | |||||
Phase Forward* | 0.3 | 222,175 | 3,390 | |||||
Other Securities | 9.9 | 120,943 | ||||||
| 141,368 | ||||||||
Industrials — 16.5% | ||||||||
Aegean Marine Petroleum Network | 0.3 | 175,830 | 4,726 | |||||
Airtran Holdings* | 0.3 | 735,361 | 3,030 | |||||
CoStar Group* (A) | 0.4 | 112,929 | 4,487 | |||||
EMCOR Group* | 0.4 | 234,218 | 5,574 | |||||
Gardner Denver | 0.2 | 76,177 | 2,851 | |||||
GeoEye* (A) | 0.3 | 98,071 | 3,057 | |||||
TransDigm Group | 0.3 | 78,777 | 3,415 | |||||
Watson Wyatt Worldwide, Cl A (A) | 0.2 | 68,984 | 2,852 | |||||
WESCO International* (A) | 0.3 | 136,074 | 3,552 | |||||
Other Securities | 13.8 | 166,119 | ||||||
| 199,663 | ||||||||
Information Technology — 18.3% | ||||||||
Arris Group* (A) | 0.3 | 304,360 | 3,040 | |||||
Benchmark Electronics* | 0.3 | 199,600 | 3,599 | |||||
Blackboard* | 0.3 | 76,545 | 3,194 | |||||
DTS* | 0.4 | 169,751 | 5,116 | |||||
Imation (A) | 0.3 | 363,206 | 3,185 | |||||
Manhattan Associates* | 0.3 | 128,700 | 3,032 | |||||
MAXIMUS | 0.3 | 78,500 | 3,650 | |||||
Teradyne* | 0.3 | 352,213 | 3,121 | |||||
VistaPrint* | 0.5 | 104,055 | 5,934 | |||||
Other Securities | 15.3 | 187,445 | ||||||
| 221,316 | ||||||||
Materials — 4.2% | ||||||||
NewMarket | 0.3 | 31,375 | 3,286 | |||||
Other Securities | 3.9 | 47,438 | ||||||
| 50,724 | ||||||||
Telecommunication Services — 1.4% | ||||||||
Neutral Tandem* (A) | 0.3 | 169,966 | 3,921 | |||||
SBA Communications, Cl A* | 0.4 | 135,441 | 4,340 | |||||
Other Securities | 0.7 | 8,958 | ||||||
| 17,219 | ||||||||
Utilities — 3.7% | ||||||||
El Paso Electric* | 0.4 | 229,900 | 4,552 | |||||
NorthWestern | 0.5 | 226,981 | 5,854 | |||||
| SEI Institutional Investments Trust / Semi-Annual Report / November 30, 2009 | 9 |
Table of Contents
SUMMARY SCHEDULE OF INVESTMENTS (Unaudited)
Small Cap Fund (Concluded)
November 30, 2009
| Description | Percentage of Net Assets (%) | Shares | Market Value ($ Thousands) | |||||
Portland General Electric (A) | 0.5 | % | 307,075 | $ | 6,022 | |||
Unisource Energy | 0.3 | 119,458 | 3,562 | |||||
Other Securities | 2.0 | 24,551 | ||||||
| 44,541 | ||||||||
Total Common Stock (Cost $1,085,739) ($ Thousands) |
| 1,163,998 | ||||||
PREFERRED STOCK — 0.2% | ||||||||
Consumer Discretionary — 0.1% | ||||||||
Other Securities | 0.1 | 1,307 | ||||||
Financials — 0.1% | ||||||||
Other Securities | 0.1 | 660 | ||||||
Total Preferred Stock (Cost $1,755) ($ Thousands) |
| 1,967 | ||||||
CONVERTIBLE BONDS — 0.3% | ||||||||
Consumer Discretionary — 0.0% | ||||||||
Other Securities | 0.0 | 315 | ||||||
Energy — 0.2% | ||||||||
Other Securities | 0.2 | 2,481 | ||||||
Financials — 0.1% | ||||||||
Other Securities | 0.1 | 424 | ||||||
Total Convertible Bonds (Cost $3,869) ($ Thousands) |
| 3,220 | ||||||
AFFILIATED PARTNERSHIP — 16.2% | ||||||||
SEI Liquidity Fund, L.P. | 16.2 | 201,493,152 | 195,330 | |||||
Total Affiliated Partnership (Cost $201,493) ($ Thousands) |
| 195,330 | ||||||
WARRANTS — 0.0% | ||||||||
Other Securities | 0.0 | 118 | ||||||
Total Warrants |
| 118 | ||||||
EXCHANGE TRADED FUNDS — 0.0% | ||||||||
Other Securities | 0.0 | 711 | ||||||
Total Exchange Traded Funds (Cost $758) ($ Thousands) |
| 711 | ||||||
RIGHT — 0.0% | ||||||||
United States — 0.0% | ||||||||
Other Securities | 0.0 | — | ||||||
Total Right |
| — | ||||||
| Description | Percentage of Net Assets (%) | Shares/Face Amount ($ Thousands) | Market Value ($ Thousands) | ||||||
CASH EQUIVALENT — 3.3% | |||||||||
SEI Daily Income Trust, | 3.3 | % | 39,871,487 | $ | 39,871 | ||||
Total Cash Equivalent (Cost $39,871) ($ Thousands) |
| 39,871 | |||||||
U.S. TREASURY OBLIGATIONS (C) (D) — 0.4% | |||||||||
U.S. Treasury Bills | 0.3 | $ | 3,070 | 3,070 | |||||
0.068%, 01/07/10 | 0.1 | 1,800 | 1,800 | ||||||
Total U.S. Treasury Obligations (Cost $4,870) ($ Thousands) |
| 4,870 | |||||||
Total Investments — 116.8% |
| $ | 1,410,085 | ||||||
A summary of the open futures contracts held by the Fund at November 30, 2009, is as follows:
| Type of Contract | Number of Contracts Long (Short) | Expiration Date | Unrealized Appreciation ($ Thousands) | ||||
Russell 2000 Index E-Mini | 461 | Dec-2009 | $ | 369 | |||
For the year ended November 30, 2009, the total amount of all open futures contracts, as presented in the table above, are representative of the volume of activity for this derivative type during the period.
Percentages are based on a Net Assets of $1,206,896 ($ Thousands).
| (A) | This security or a partial position of this security is on loan at November 30, 2009. The total value of securities on loan at November 30, 2009 was $150,257 ($ Thousands). |
| (B) | This security was purchased with cash collateral held from securities on loan (see Note 11). The total value of such securities as of November 30, 2009 was $195,330 ($ Thousands). |
| (C) | Security, or a portion thereof, has been pledged as collateral on open futures contracts. |
| (D) | The rate reported is the effective yield at time of purchase. |
| * | Non-income producing security. |
| ** | The rate reported is the 7-day effective yield as of November 30, 2009. |
| † | Investment in Affiliated Security (see Note 5). |
| ‡ | Real Estate Investment Trust |
Cl — Class
L.P. — Limited Partnership
The Summary Schedule of Investments does not reflect the complete portfolio holdings. It includes the Fund’s 50 largest unaffiliated holdings and each investment of any issuer that exceeds 1% of the Fund’s net assets. “Other Securities” represent all issues not required to be disclosed under the rules adopted by the U.S. Securities and Exchange Commission (“SEC”). In certain instances, securities for which footnotes listed above may otherwise apply are included in the Other Securities caption. The complete schedule of portfolio holdings is available (i) without charge, upon request, by calling (800) 342-5734; and (ii) on the SEC’s website at http://www.sec.gov.
| 10 | SEI Institutional Investments Trust / Semi-Annual Report / November 30, 2009 |
Table of Contents
The following is a summary of the inputs used as of November 30, 2009 in valuing the Fund’s investments carried at value ($ Thousands):
| Investments in Securities | Level 1 | Level 2 | Level 3 | Total | ||||||||
Common Stock | $ | 1,163,385 | $ | 257 | $ | 356 | $ | 1,163,998 | ||||
Affiliated Partnership | — | 195,330 | — | 195,330 | ||||||||
Convertible Bonds | — | 2,439 | 781 | 3,220 | ||||||||
Preferred Stock | — | 1,307 | 660 | 1,967 | ||||||||
Exchange Traded Funds | 711 | — | — | 711 | ||||||||
Warrants | 1 | 117 | — | 118 | ||||||||
Right | — | — | — | — | ||||||||
Cash Equivalent | 39,871 | — | — | 39,871 | ||||||||
U.S. Treasury Obligations | — | 4,870 | — | 4,870 | ||||||||
Total Investments in Securities | $ | 1,203,968 | $ | 204,320 | $ | 1,797 | $ | 1,410,085 | ||||
| Other Financial Instruments | Level 1 | Level 2 | Level 3 | Total | ||||||||
Futures Contracts* | $ | 369 | $ | — | $ | — | $ | 369 | ||||
Total Other Financial Instruments | $ | 369 | $ | — | $ | — | $ | 369 | ||||
The following is a reconciliation of investments in which significant unobservable inputs (Level 3) were used in determining value ($ Thousands):
| Investments in Common Stock | Investments in Convertible Bonds | Investments in Preferred Stock | |||||||
Beginning balance as of June 1, 2009 | $ | — | $ | 321 | $ | — | |||
Accrued discounts/premiums | — | 12 | — | ||||||
Realized gain/(loss) | — | — | — | ||||||
Change in unrealized appreciation/(depreciation) | — | 100 | — | ||||||
Net purchases/sales | — | 348 | 660 | ||||||
Net transfer in and/or out of Level 3 | 356 | — | — | ||||||
Ending balance as of November 30, 2009 | $ | 356 | $ | 781 | $ | 660 | |||
Changes in unrealized gains/(losses) included in earnings related to securities still held at reporting date | $ | — | $ | 63 | $ | — | |||
| * | Futures contracts are valued at the unrealized appreciation on the instrument. |
For more information on valuation inputs, see Note 2 — Significant Accounting Policies in Notes to Financial Statements.
Amounts designated as “—” are either $0 or have been rounded to $0.
The accompanying notes are an integral part of the financial statements.
| SEI Institutional Investments Trust / Semi-Annual Report / November 30, 2009 | 11 |
Table of Contents
SUMMARY SCHEDULE OF INVESTMENTS (Unaudited)
Small/Mid Cap Equity Fund
November 30, 2009

| Description | Percentage of Net Assets (%) | Shares | Market Value ($ Thousands) | |||||
COMMON STOCK — 97.6% | ||||||||
Consumer Discretionary — 14.8% | ||||||||
American Eagle Outfitters | 0.3 | % | 426,930 | $ | 6,566 | |||
Dick’s Sporting Goods* (A) | 0.3 | 304,324 | 6,318 | |||||
Hanesbrands* | 0.3 | 255,900 | 6,144 | |||||
Jones Apparel Group | 0.3 | 300,677 | 5,096 | |||||
Life Time Fitness* (A) | 0.2 | 214,910 | 4,857 | |||||
National CineMedia | 0.3 | 375,560 | 5,487 | |||||
PetSmart | 0.4 | 325,507 | 8,379 | |||||
Scientific Games, Cl A* | 0.3 | 406,137 | 5,747 | |||||
Other Securities | 12.4 | 263,295 | ||||||
| 311,889 | ||||||||
Consumer Staples — 3.3% | ||||||||
Dean Foods* | 0.3 | 346,302 | 5,506 | |||||
Herbalife | 0.3 | 133,520 | 5,600 | |||||
Other Securities | 2.7 | 55,026 | ||||||
| 66,132 | ||||||||
Energy — 5.2% | ||||||||
World Fuel Services | 0.2 | 124,249 | 6,608 | |||||
Other Securities | 5.0 | 100,960 | ||||||
| 107,568 | ||||||||
Financials — 17.9% | ||||||||
American Financial Group | 0.3 | 215,335 | 5,224 | |||||
Boston Properties‡ (A) | 0.5 | 144,995 | 9,712 | |||||
HCP‡ | 0.3 | 196,850 | 6,161 | |||||
Public Storage‡ (A) | 0.3 | 82,004 | 6,526 | |||||
Reinsurance Group of America, Cl A | 0.3 | 110,034 | 5,117 | |||||
Riskmetrics Group* (A) | 0.2 | 339,329 | 5,066 | |||||
Signature Bank NY* | 0.2 | 155,492 | 4,817 | |||||
Simon Property Group‡ | 0.3 | 83,314 | 6,054 | |||||
Other Securities | 15.5 | 324,300 | ||||||
| 372,977 | ||||||||
| Description | Percentage of Net Assets (%) | Shares | Market Value ($ Thousands) | |||||
Health Care — 12.4% | ||||||||
King Pharmaceuticals* (A) | 0.3 | % | 566,174 | $ | 6,698 | |||
LHC Group* (A) | 0.2 | 159,697 | 4,914 | |||||
Mednax* | 0.3 | 92,375 | 5,192 | |||||
Other Securities | 11.6 | 240,318 | ||||||
| 257,122 | ||||||||
Industrials — 14.3% | ||||||||
BE Aerospace* | 0.3 | 344,225 | 6,633 | |||||
Corrections of America* (A) | 0.3 | 227,567 | 5,687 | |||||
CoStar Group* (A) | 0.3 | 175,008 | 6,953 | |||||
Gardner Denver | 0.5 | 280,453 | 10,497 | |||||
IHS, Cl A* | 0.3 | 122,210 | 6,145 | |||||
JB Hunt Transport Services (A) | 0.3 | 166,201 | 5,295 | |||||
Resources Connection* | 0.3 | 334,303 | 6,442 | |||||
SYKES Enterprises* | 0.4 | 359,093 | 8,816 | |||||
WESCO International* | 0.3 | 201,267 | 5,253 | |||||
Other Securities | 11.3 | 237,210 | ||||||
| 298,931 | ||||||||
Information Technology — 17.8% | ||||||||
Equinix* (A) | 0.5 | 118,286 | 11,378 | |||||
Gartner* | 0.3 | 375,684 | 7,108 | |||||
GSI Commerce* (A) | 0.6 | 574,579 | 12,836 | |||||
Jabil Circuit | 0.3 | 488,360 | 6,500 | |||||
SkillSoft ADR* | 0.3 | 595,073 | 5,843 | |||||
Solera Holdings | 0.3 | 183,302 | 6,408 | |||||
Trimble Navigation* (A) | 0.3 | 253,488 | 5,660 | |||||
VistaPrint* | 0.7 | 238,619 | 13,608 | |||||
Vocus* (A) | 0.3 | 350,804 | 5,732 | |||||
Other Securities | 14.2 | 301,043 | ||||||
| 376,116 | ||||||||
Materials — 6.3% | ||||||||
Celanese, Cl A | 0.2 | 162,071 | 4,823 | |||||
Nalco Holding | 0.3 | 217,077 | 5,310 | |||||
Rockwood Holdings* (A) | 0.2 | 218,580 | 4,920 | |||||
Silgan Holdings | 0.3 | 96,606 | 5,175 | |||||
Other Securities | 5.3 | 108,145 | ||||||
| 128,373 | ||||||||
Telecommunication Services — 1.9% | ||||||||
NII Holdings* | 0.3 | 224,795 | 6,699 | |||||
SBA Communications, | 0.7 | 444,441 | 14,240 | |||||
Other Securities | 0.9 | 20,439 | ||||||
| 41,378 | ||||||||
Utilities — 3.7% | ||||||||
AGL Resources | 0.3 | 168,227 | 5,812 | |||||
Great Plains Energy | 0.3 | 303,648 | 5,405 | |||||
Portland General Electric | 0.4 | 373,658 | 7,327 | |||||
| 12 | SEI Institutional Investments Trust / Semi-Annual Report / November 30, 2009 |
Table of Contents
| Description | Percentage of Net Assets (%) | Shares/Face Amount ($ Thousands) | Market Value ($ Thousands) | ||||||
Other Securities | 2.7 | % | $ | 58,696 | |||||
| 77,240 | |||||||||
Total Common Stock | 2,037,726 | ||||||||
U.S. TREASURY OBLIGATIONS — 0.5% | |||||||||
U.S. Treasury Bill (C) | 0.5 | % | $ | 8,970 | $ | 8,970 | |||
0.065%, 01/07/10 | 0.0 | 400 | 400 | ||||||
Total U.S. Treasury Obligations | 9,370 | ||||||||
PREFERRED STOCK — 0.2% | |||||||||
Consumer Discretionary — 0.1% | |||||||||
Other Securities | 0.1 | 1,649 | |||||||
Financials — 0.1% | |||||||||
Other Securities | 0.1 | 1,440 | |||||||
Total Preferred Stock | 3,089 | ||||||||
CONVERTIBLE BONDS — 0.1% | |||||||||
Consumer Discretionary — 0.0% | |||||||||
Other Securities | 0.0 | 315 | |||||||
Energy — 0.1% | |||||||||
Other Securities | 0.1 | 1,870 | |||||||
Financials — 0.0% | |||||||||
Other Securities | 0.0 | 409 | |||||||
Total Convertible Bonds | 2,594 | ||||||||
WARRANTS — 0.0% | |||||||||
Other Securities | 0.0 | 176 | |||||||
Total Warrants | 176 | ||||||||
EXCHANGE TRADED FUND — 0.0% | |||||||||
Other Securities | 0.0 | 947 | |||||||
Total Exchange Traded Fund (Cost $974) ($ Thousands) | 947 | ||||||||
AFFILIATED PARTNERSHIP — 14.3% | |||||||||
SEI Liquidity Fund, L.P., | 14.3 | 306,891,896 | 299,398 | ||||||
Total Affiliated Partnership | 299,398 | ||||||||
| Description | Percentage of Net Assets (%) | Shares | Market Value ($ Thousands) | ||||
CASH EQUIVALENT — 2.3% | |||||||
SEI Daily Income Trust, | 2.3 | 48,116,451 | 48,116 | ||||
Total Cash Equivalent | 48,116 | ||||||
Total Investments — 115.0% | $ | 2,401,416 | |||||
A summary of the open futures contracts held by the Fund at November 30, 2009, is as follows:
| Type of Contract | Number of Contracts Long (Short) | Expiration Date | Unrealized Appreciation ($ Thousands) | ||||
Russell 2000 Index E-Mini | 200 | Dec-2009 | $ | 208 | |||
S&P Mid 400 Index E-Mini | 128 | Dec-2009 | 264 | ||||
| $ | 472 | ||||||
For the year ended November 30, 2009, the total amount of all open futures contracts, as presented in the table above, are representative of the volume of activity for this derivative type during the period.
Percentages are based on a Net Assets of $2,087,757 ($ Thousands)
| * | Non-income producing security. |
| ** | The rate reported is the 7-day effective yield as of November 30, 2009. |
| † | Investment in Affiliated Security (see Note 5) |
| ‡ | Real Estate Investment Trust |
| (A) | This security or a partial position of this security is on loan at November 30, 2009. The total value of securities on loan at November 30, 2009 was $239,050 ($ Thousands). |
| (B) | This security was purchased with cash collateral held from securities on loan (see Note 11). The total value of such securities as of November 30, 2009 was $299,398 ($ Thousands). |
| (C) | Rate reported is effective yield at time of purchase. |
ADR — American Depositary Receipt
Cl — Class
L.P. — Limited Partnership
S&P — Standard & Poor’s
The Summary Schedule of Investments does not reflect the complete portfolio holdings. It includes the Fund’s 50 largest unaffiliated holdings and each investment of any issuer that exceeds 1% of the Fund’s net assets. “Other Securities” represent all issues not required to be disclosed under the rules adopted by the U.S. Securities and Exchange Commission (“SEC”). In certain instances, securities for which footnotes listed above may otherwise apply are included in the Other Securities caption. The complete schedule of portfolio holdings is available (i) without charge, upon request, by calling (800) 342-5734; and (ii) on the SEC’s website at http://www.sec.gov.
The following is a summary of the inputs used as of November 30, 2009 in valuing the Fund’s investments carried at value ($ Thousands):
| Investments in Securities | Level 1 | Level 2 | Level 3 | Total | ||||||||
Common Stock | $ | 2,036,933 | $ | 479 | $ | 314 | $ | 2,037,726 | ||||
U.S. Treasury Obligations | — | 9,370 | — | 9,370 | ||||||||
Preferred Stock | — | 1,649 | 1,440 | 3,089 | ||||||||
Convertible Bonds | — | 2,146 | 448 | 2,594 | ||||||||
Exchange Traded Fund | 947 | — | — | 947 | ||||||||
Warrants | 22 | 154 | — | 176 | ||||||||
Affiliated Partnership | — | 299,398 | — | 299,398 | ||||||||
Cash Equivalent | 48,116 | — | — | 48,116 | ||||||||
Total Investments in Securities | $ | 2,086,018 | $ | 313,196 | $ | 2,202 | $ | 2,401,416 | ||||
| Other Financial Instruments | Level 1 | Level 2 | Level 3 | Total | ||||||||
Futures Contracts* | $ | 472 | $ | — | $ | — | $ | 472 | ||||
Total Other Financial Instruments | $ | 472 | $ | — | $ | — | $ | 472 | ||||
| * | Futures contracts are valued at the unrealized appreciation on the instrument. |
| SEI Institutional Investments Trust / Semi-Annual Report / November 30, 2009 | 13 |
Table of Contents
SUMMARY SCHEDULE OF INVESTMENTS (Unaudited)
Small/Mid Cap Equity Fund (concluded)
November 30, 2009
The following is a reconciliation of investments in which significant unobservable inputs (Level 3) were used in determining value ($ Thousands):
| Investments in Common Stock | Investments in Preferred Stock | Investments in | |||||||
Beginning balance as of June 1, 2009 | $ | — | $ | — | $ | 384 | |||
Accrued discounts/premiums | — | — | — | ||||||
Realized gain/(loss) | — | — | — | ||||||
Change in unrealized appreciation/(depreciation) | — | — | 64 | ||||||
Net purchases/sales | — | 1,440 | — | ||||||
Net transfer in and/or out of Level 3 | 306 | — | — | ||||||
Ending balance as of November 30, 2009 | $ | 306 | $ | 1,440 | $ | 448 | |||
Changes in unrealized gains/(losses) included in earnings related to securities still held at reporting date. | $ | — | $ | — | $ | 46 | |||
For more information on valuation inputs, see Note 2 — Significant Accounting Policies in Notes to Financial Statements.
Amounts designated as “—” are either $0 or have been rounded to $0.
The accompanying notes are an integral part of the financial statements.
| 14 | SEI Institutional Investments Trust / Semi-Annual Report / November 30, 2009 |
Table of Contents
SUMMARY SCHEDULE OF INVESTMENTS (Unaudited)
U.S. Managed Volatility Fund
November 30, 2009
| Description | Percentage of Net Assets (%) | Shares | Market Value ($ Thousands) | |||||
COMMON STOCK — 95.9% | ||||||||
Consumer Discretionary — 6.9% | ||||||||
priceline.com* | 0.5 | % | 7,078 | $ | 1,515 | |||
Strayer Education | 0.5 | 8,304 | 1,640 | |||||
Other Securities | 5.9 | 16,955 | ||||||
| 20,110 | ||||||||
Consumer Staples — 15.5% | ||||||||
Altria Group | 1.1 | 171,941 | 3,234 | |||||
Brown-Forman, Cl B | 0.9 | 50,788 | 2,599 | |||||
Campbell Soup | 0.7 | 55,513 | 1,941 | |||||
Hormel Foods | 1.6 | 122,726 | 4,605 | |||||
Lorillard | 1.2 | 44,766 | 3,488 | |||||
Philip Morris International | 1.2 | 71,620 | 3,444 | |||||
Reynolds American | 1.3 | 72,368 | 3,616 | |||||
Sysco | 1.2 | 131,280 | 3,550 | |||||
Tyson Foods, Cl A | 0.7 | 172,715 | 2,076 | |||||
Other Securities | 5.6 | 16,384 | ||||||
| 44,937 | ||||||||
Energy — 4.5% | ||||||||
Chevron | 0.8 | 27,607 | 2,154 | |||||
Exxon Mobil | 0.6 | 24,335 | 1,827 | |||||
Other Securities | 3.1 | 9,155 | ||||||
| 13,136 | ||||||||
Financials — 13.2% | ||||||||
Bank of Hawaii | 0.9 | 58,591 | 2,678 | |||||
Commerce Bancshares | 1.3 | 97,077 | 3,902 | |||||
Cullen/Frost Bankers | 1.0 | 59,594 | 2,862 | |||||
People’s United Financial | 1.0 | 180,791 | 2,945 | |||||
TFS Financial | 0.8 | 213,898 | 2,391 | |||||
Other Securities | 8.2 | 23,589 | ||||||
| 38,367 | ||||||||
Health Care — 21.8% | ||||||||
Abbott Laboratories | 1.6 | 83,042 | 4,525 | |||||
AmerisourceBergen | 1.7 | 203,890 | 5,034 | |||||
Amgen* | 1.3 | 65,222 | 3,675 | |||||
Baxter International | 0.7 | 39,470 | 2,153 | |||||
| Description | Percentage of Net Assets (%) | Shares | Market Value ($ Thousands) | |||||
Becton Dickinson | 1.1 | % | 41,209 | $ | 3,082 | |||
Biogen Idec* | 1.3 | 78,347 | 3,678 | |||||
C.R. Bard | 0.9 | 30,751 | 2,528 | |||||
Cardinal Health | 0.7 | 60,456 | 1,948 | |||||
Edwards Lifesciences* | 0.7 | 24,812 | 2,042 | |||||
Forest Laboratories* | 0.9 | 89,323 | 2,739 | |||||
Genzyme* | 1.2 | 70,659 | 3,582 | |||||
Gilead Sciences* | 1.1 | 67,560 | 3,111 | |||||
Johnson & Johnson | 1.2 | 55,053 | 3,459 | |||||
McKesson | 1.6 | 76,878 | 4,768 | |||||
Techne | 1.3 | 56,762 | 3,853 | |||||
Other Securities | 4.5 | 12,916 | ||||||
| 63,093 | ||||||||
Industrials — 4.1% | ||||||||
Other Securities | 4.1 | 11,834 | ||||||
Information Technology — 12.0% | ||||||||
Analog Devices | 0.9 | 81,601 | 2,447 | |||||
Google, Cl A* | 1.3 | 6,291 | 3,668 | |||||
Intel | 1.1 | 164,594 | 3,160 | |||||
International Business Machines | 0.7 | 16,729 | 2,114 | |||||
Tech Data* | 1.0 | 67,553 | 2,845 | |||||
Texas Instruments | 1.2 | 142,338 | 3,600 | |||||
Visa, Cl A | 0.9 | 32,022 | 2,594 | |||||
Other Securities | 4.9 | 14,432 | ||||||
| 34,860 | ||||||||
Materials — 3.6% | ||||||||
Newmont Mining | 1.2 | 64,067 | 3,436 | |||||
Other Securities | 2.4 | 6,922 | ||||||
| 10,358 | ||||||||
Telecommunication Services — 2.6% | ||||||||
AT&T | 0.6 | 59,600 | 1,606 | |||||
Verizon Communications | 0.5 | 50,894 | 1,601 | |||||
Other Securities | 1.5 | 4,146 | ||||||
| 7,353 | ||||||||
Utilities — 11.7% | ||||||||
AGL Resources | 0.7 | 57,898 | 2,001 | |||||
Atmos Energy | 0.8 | 82,948 | 2,272 | |||||
Nicor | 0.9 | 70,258 | 2,751 | |||||
NSTAR | 0.7 | 58,287 | 1,931 | |||||
Sempra Energy | 0.6 | 30,350 | 1,613 | |||||
Vectren | 0.7 | 82,749 | 1,944 | |||||
Wisconsin Energy | 1.0 | 66,796 | 3,012 | |||||
Other Securities | 6.3 | 18,414 | ||||||
| 33,938 | ||||||||
Total Common Stock | 277,986 | |||||||
| SEI Institutional Investments Trust / Semi-Annual Report / November 30, 2009 | 15 |
Table of Contents
SUMMARY SCHEDULE OF INVESTMENTS (Unaudited)
U.S. Managed Volatility Fund (Concluded)
November 30, 2009
| Description | Percentage of Net Assets (%) | Shares | Market Value ($ Thousands) | |||||
CASH EQUIVALENT — 3.7% | ||||||||
SEI Daily Income Trust, Prime Obligation Fund, Cl A 0.130%**† | 3.7 | % | 10,718 | $ | 10,718 | |||
Total Cash Equivalent |
| 10,718 | ||||||
U.S. TREASURY OBLIGATION — 0.4% | ||||||||
Other Securities | 0.4 | 1,200 | ||||||
Total U.S. Treasury Obligation |
| 1,200 | ||||||
Total Investments — 100.0% | $ | 289,904 | ||||||
A summary of the open futures contracts held by the Fund at November 30, 2009, is as follows:
| Type of Contract | Number of Contracts Long (Short) | Expiration Date | Unrealized Appreciation ($ Thousands) | ||||
S&P 500 Index E-Mini | 45 | Dec-2009 | $ | 127 | |||
For the year ended November 30, 2009, the total amount of all open futures contracts, as presented in the table above, are representative of the volume of activity for this derivative type during the period.
Percentages are based on a Net Assets of $289,962 ($ Thousands)
| * | Non-income producing security. |
| ** | The rate reported is the 7-day effective yield as of November 30, 2009. |
| † | Investment in Affiliated Security (see Note 5). |
Cl — Class
S&P — Standard & Poor’s
The Summary Schedule of Investments does not reflect the complete portfolio holdings. It includes the Fund’s 50 largest unaffiliated holdings and each investment of any issuer that exceeds 1% of the Fund’s net assets. “Other Securities” represent all issues not required to be disclosed under the rules adopted by the U.S. Securities and Exchange Commission (“SEC”). In certain instances, securities for which footnotes listed above may otherwise apply are included in the Other Securities caption. The complete schedule of portfolio holdings is available (i) without charge, upon request, by calling (800) 342-5734; and (ii) on the SEC’s website at http://www.sec.gov.
The following is a summary of the inputs used as of November 30, 2009 in valuing the Fund’s investments carried at value ($ Thousands):
| Investments in Securities | Level 1 | Level 2 | Level 3 | Total | ||||||||
Common Stock | $ | 277,986 | $ | — | $ | — | $ | 277,986 | ||||
Cash Equivalent | 10,718 | — | — | 10,718 | ||||||||
U.S. Treasury Obligation | — | 1,200 | — | 1,200 | ||||||||
Total Investments in Securities | $ | 288,704 | $ | 1,200 | $ | — | $ | 289,904 | ||||
| Other Financial Instruments | Level 1 | Level 2 | Level 3 | Total | ||||||||
Futures Contracts* | $ | 127 | $ | — | $ | — | $ | 127 | ||||
Total Other Financial Instruments | $ | 127 | $ | — | $ | — | $ | 127 | ||||
| * | Futures contracts are valued at the unrealized appreciation on the instrument. |
For more information on valuation inputs, see Note 2 — Significant Accounting Policies in Notes to Financial Statements.
Amounts designated as “—” are either $0 or have been rounded to $0.
The accompanying notes are an integral part of the financial statements.
| 16 | SEI Institutional Investments Trust / Semi-Annual Report / November 30, 2009 |
Table of Contents
SUMMARY SCHEDULE OF INVESTMENTS (Unaudited)
International Equity Fund
November 30, 2009
| Description | Percentage of Net Assets (%) | Shares | Market Value ($ Thousands) | |||||
COMMON STOCK — 89.7% | ||||||||
Argentina — 0.1% | ||||||||
Other Securities | 0.1 | % | $ | 781 | ||||
Australia — 5.6% | ||||||||
Australia & New Zealand Banking Group | 0.4 | 138,654 | 2,811 | |||||
BHP Billiton | 1.1 | 224,891 | 8,502 | |||||
Rio Tinto | 0.4 | 39,411 | 2,585 | |||||
Other Securities | 3.7 | 28,257 | ||||||
| 42,155 | ||||||||
Austria — 0.2% | ||||||||
Other Securities | 0.2 | 1,876 | ||||||
Belgium — 1.3% | ||||||||
InBev | 0.4 | 51,591 | 2,575 | |||||
Other Securities | 0.9 | 7,479 | ||||||
| 10,054 | ||||||||
Brazil — 0.4% | ||||||||
Other Securities | 0.4 | 3,272 | ||||||
Canada — 1.7% | ||||||||
Other Securities | 1.7 | 12,673 | ||||||
Chile — 0.3% | ||||||||
Banco Santander Chile ADR | 0.1 | 8,109 | 493 | |||||
Other Securities | 0.2 | 1,929 | ||||||
| 2,422 | ||||||||
China — 0.5% | ||||||||
Other Securities | 0.5 | 4,117 | ||||||
| Description | Percentage of Net Assets (%) | Shares | Market Value ($ Thousands) | |||||
Cyprus — 0.0% | ||||||||
Other Securities | 0.0 | % | $ | 206 | ||||
Denmark — 0.6% | ||||||||
Other Securities | 0.6 | 4,847 | ||||||
Finland — 0.9% | ||||||||
Other Securities | 0.9 | 6,852 | ||||||
France — 7.2% | ||||||||
BNP Paribas | 0.9 | 80,932 | 6,683 | |||||
Sanofi-Aventis | 1.2 | 121,621 | 9,188 | |||||
Total (A) | 0.6 | 74,550 | 4,612 | |||||
Other Securities | 4.5 | 33,891 | ||||||
| 54,374 | ||||||||
Germany — 6.6% | ||||||||
BASF | 0.5 | 67,085 | 4,045 | |||||
Deutsche Bank (A) | 0.5 | 53,410 | 3,853 | |||||
Deutsche Post | 0.5 | 179,195 | 3,355 | |||||
E.ON | 0.7 | 126,993 | 5,022 | |||||
Siemens | 0.8 | 62,742 | 6,147 | |||||
Other Securities | 3.6 | 27,034 | ||||||
| 49,456 | ||||||||
Greece — 0.8% | ||||||||
Other Securities | 0.8 | 5,812 | ||||||
Guernsey — 0.1% | ||||||||
Other Securities | 0.1 | 846 | ||||||
Hong Kong — 3.0% | ||||||||
BOC Hong Kong Holdings | 0.4 | 1,206,819 | 2,769 | |||||
Hang Seng Bank | 0.1 | 34,645 | 507 | |||||
Sun Hung Kai Properties | 0.5 | 248,891 | 3,690 | |||||
Other Securities | 2.0 | 15,477 | ||||||
| 22,443 | ||||||||
India — 0.7% | ||||||||
Other Securities | 0.7 | 5,106 | ||||||
Indonesia — 0.1% | ||||||||
Other Securities | 0.1 | 403 | ||||||
Ireland — 0.1% | ||||||||
Other Securities | 0.1 | 895 | ||||||
Israel — 0.2% | ||||||||
Other Securities | 0.2 | 1,753 | ||||||
Italy — 2.6% | ||||||||
Banca Intesa | 0.4 | 644,144 | 2,790 | |||||
Enel (A) | 0.5 | 667,376 | 3,993 | |||||
| SEI Institutional Investments Trust / Semi-Annual Report / November 30, 2009 | 17 |
Table of Contents
SUMMARY SCHEDULE OF INVESTMENTS (Unaudited)
International Equity Fund (Continued)
November 30, 2009
| Description | Percentage of Net Assets (%) | Shares | Market Value ($ Thousands) | |||||
Other Securities | 1.7 | % | $ | 12,541 | ||||
| 19,324 | ||||||||
Japan — 17.2% | ||||||||
Canon | 0.5 | 98,500 | 3,808 | |||||
East Japan Railway | 0.4 | 44,700 | 3,165 | |||||
Honda Motor | 0.7 | 156,400 | 4,902 | |||||
Mitsubishi | 0.7 | 219,400 | 4,966 | |||||
Nippon Telegraph & Telephone | 0.4 | 76,500 | 3,330 | |||||
Nissan Motor | 0.6 | 561,000 | 4,077 | |||||
Sumitomo Mitsui Financial Group | 0.4 | 77,600 | 2,567 | |||||
Toyota Motor | 0.4 | 82,200 | 3,283 | |||||
Other Securities | 13.1 | 98,875 | ||||||
| 128,973 | ||||||||
Jersey — 0.0% | ||||||||
Other Securities | 0.0 | 174 | ||||||
Mauritius — 0.1% | ||||||||
Other Securities | 0.1 | 447 | ||||||
Netherlands — 4.7% | ||||||||
Royal Dutch Shell, Cl A | 0.7 | 168,571 | 5,009 | |||||
Royal Dutch Shell, Cl B | 0.5 | 134,793 | 3,842 | |||||
Royal Dutch Shell, Cl A (GBP) | 0.3 | 76,989 | 2,275 | |||||
Unilever (A) | 0.6 | 144,258 | 4,419 | |||||
Other Securities | 2.6 | 19,494 | ||||||
| 35,039 | ||||||||
New Zealand — 0.1% | ||||||||
Other Securities | 0.1 | 1,149 | ||||||
Norway — 0.9% | ||||||||
Other Securities | 0.9 | 6,576 | ||||||
Papua New Guinea — 0.0% | ||||||||
Other Securities | 0.0 | 211 | ||||||
Portugal — 0.4% | ||||||||
Other Securities | 0.4 | 2,865 | ||||||
Russia — 0.3% | ||||||||
Other Securities | 0.3 | 2,034 | ||||||
Singapore — 1.7% | ||||||||
DBS Group Holdings | 0.5 | 341,000 | 3,525 | |||||
Other Securities | 1.2 | 8,895 | ||||||
| 12,420 | ||||||||
South Africa — 0.1% | ||||||||
Other Securities | 0.1 | 537 | ||||||
| Description | Percentage of Net Assets (%) | Shares | Market Value ($ Thousands) | |||||
South Korea — 0.2% | ||||||||
Other Securities | 0.2 | % | $ | 1,375 | ||||
Spain — 3.8% | ||||||||
Banco Bilbao Vizcaya Argentaria (A) | 0.6 | 249,832 | 4,705 | |||||
Banco Santander Central Hispano | 1.2 | 515,305 | 8,827 | |||||
Telefonica | 1.1 | 280,160 | 8,042 | |||||
Other Securities | 0.9 | 7,129 | ||||||
| 28,703 | ||||||||
Sweden — 1.8% | ||||||||
Electrolux, Cl B | 0.4 | 110,289 | 2,692 | |||||
Other Securities | 1.4 | 10,468 | ||||||
| 13,160 | ||||||||
Switzerland — 8.1% | ||||||||
Credit Suisse Group | 1.0 | 136,879 | 7,088 | |||||
Nestle | 1.4 | 219,078 | 10,358 | |||||
Novartis | 1.1 | 154,627 | 8,584 | |||||
Roche Holding | 0.8 | 36,129 | 5,911 | |||||
Xstrata | 0.6 | 264,593 | 4,642 | |||||
Zurich Financial Services | 0.5 | 17,434 | 3,757 | |||||
Other Securities | 2.7 | 20,417 | ||||||
| 60,757 | ||||||||
Taiwan — 0.6% | ||||||||
Other Securities | 0.6 | 4,232 | ||||||
Turkey — 0.2% | ||||||||
Other Securities | 0.2 | 1,434 | ||||||
United Kingdom — 16.0% | ||||||||
AstraZeneca | 1.2 | 192,291 | 8,574 | |||||
Barclays | 0.6 | 896,865 | 4,303 | |||||
BG Group | 0.4 | 185,035 | 3,349 | |||||
BHP Billiton | 0.7 | 170,692 | 5,203 | |||||
BP | 1.8 | 1,432,719 | 13,510 | |||||
British American Tobacco | 0.7 | 162,923 | 4,939 | |||||
GlaxoSmithKline | 0.7 | 269,954 | 5,569 | |||||
HSBC Holdings | 1.3 | 875,347 | 10,156 | |||||
Imperial Tobacco Group | 0.4 | 100,478 | 2,915 | |||||
Rio Tinto | 0.5 | 64,660 | 3,277 | |||||
Standard Chartered | 0.5 | 150,361 | 3,662 | |||||
Vodafone Group | 0.5 | 1,599,902 | 3,600 | |||||
Other Securities | 6.7 | 51,098 | ||||||
| 120,155 | ||||||||
United States — 0.5% | ||||||||
Other Securities | 0.5 | 3,191 | ||||||
Total Common Stock | 673,099 | |||||||
| 18 | SEI Institutional Investments Trust / Semi-Annual Report / November 30, 2009 |
Table of Contents
| Description | Percentage of Net Assets (%) | Face Amount ($ Thousands) | Market Value ($ Thousands) | ||||||
MORTGAGE-BACKED SECURITIES — 1.9% | |||||||||
Agency Mortgage-Backed Obligations — 0.3% | |||||||||
Other Securities | 0.3 | 2,208 | |||||||
Non-Agency Mortgage-Backed Obligations — 1.6% | |||||||||
Credit Suisse First Boston | |||||||||
4.512%, 07/15/37 | 0.1 | $ | 565 | 565 | |||||
Credit Suisse First Boston Mortgage Securities, Ser 2005-C4, Cl A2 | |||||||||
5.017%, 08/15/38 | 0.0 | 190 | 191 | ||||||
Credit Suisse First Boston Mortgage Securities, Ser 2001-CF2, Cl A4 | |||||||||
6.505%, 02/15/34 | 0.0 | 202 | 208 | ||||||
Credit Suisse First Boston Mortgage Securities, Ser 2003-C3, Cl A3 | |||||||||
3.382%, 05/15/38 | 0.0 | 132 | 133 | ||||||
Credit Suisse First Boston Mortgage Securities, Ser 2005-C1, Cl A2 | |||||||||
4.609%, 02/15/38 | 0.0 | 127 | 127 | ||||||
Other Securities | 1.5 | 10,766 | |||||||
| 11,990 | |||||||||
Total Mortgage-Backed Securities | 14,198 | ||||||||
ASSET-BACKED SECURITIES — 1.4% | |||||||||
Automotive — 0.4% | |||||||||
Other Securities | 0.4 | % | $ | 3,264 | |||||
Credit Cards — 0.6% | |||||||||
Other Securities | 0.7 | 5,070 | |||||||
Mortgage Related Securities — 0.4% | |||||||||
Other Securities | 0.4 | 2,351 | |||||||
Total Asset-Backed Securities | 10,685 | ||||||||
PREFERRED STOCK — 0.8% | |||||||||
Brazil — 0.4% | |||||||||
Other Securities | 0.4 | 2,920 | |||||||
| Description | Percentage of Net Assets (%) | Shares | Market Value ($ Thousands) | |||||
Germany — 0.4% | ||||||||
Other Securities | 0.4 | % | $ | 2,827 | ||||
Total Preferred Stock | 5,747 | |||||||
RIGHTS — 0.1% | ||||||||
Australia — 0.0% | ||||||||
Other Securities | 0.0 | — | ||||||
Belgium — 0.0% | ||||||||
Other Securities | 0.0 | — | ||||||
Germany — 0.0% | ||||||||
Other Securities | 0.0 | 34 | ||||||
Italy — 0.0% | ||||||||
Other Securities | 0.0 | 1 | ||||||
Netherlands — 0.1% | ||||||||
Other Securities | 0.1 | 266 | ||||||
Norway — 0.0% | ||||||||
Other Securities | 0.0 | 126 | ||||||
Spain — 0.0% | ||||||||
Other Securities | 0.0 | 7 | ||||||
United Kingdom — 0.0% | ||||||||
Other Securities | 0.0 | 27 | ||||||
Total Rights | 461 | |||||||
WARRANTS — 0.0% | ||||||||
Other Securities | 0.0 | 16 | ||||||
Total Warrants | 16 | |||||||
CORPORATE OBLIGATION — 0.0% | ||||||||
Financials — 0.0% | ||||||||
Other Securities | 0.0 | 284 | ||||||
Total Corporate Obligation | 284 | |||||||
AFFILIATED PARTNERSHIP — 4.5% | ||||||||
SEI Liquidity Fund, L.P. 0.320%*† (B) | 4.5 | 34,392,748 | 33,521 | |||||
Total Affiliated Partnership | 33,521 | |||||||
| SEI Institutional Investments Trust / Semi-Annual Report / November 30, 2009 | 19 |
Table of Contents
SUMMARY SCHEDULE OF INVESTMENTS (Unaudited)
International Equity Fund (Concluded)
November 30, 2009
| Description | Percentage of Net Assets (%) | Shares | Market Value ($ Thousands) | |||||
CASH EQUIVALENT — 2.5% | ||||||||
SEI Daily Income Trust, | 2.5 | % | 18,774,658 | $ | 18,775 | |||
Total Cash Equivalent | 18,775 | |||||||
U.S. TREASURY OBLIGATIONS — 0.4% (C) | ||||||||
Other Securities | 0.4 | 2,820 | ||||||
Total U.S. Treasury Obligations | 2,820 | |||||||
Total Investments — 101.3% | $ | 759,606 | ||||||
A summary of the outstanding forward foreign currency contracts held by the Fund at November 30, 2009, is as follows:
| Maturity Date | Currency to Deliver (Thousands) | Currency to Receive (Thousands) | Unrealized Depreciation ($ Thousands) | |||||||||
1/25/10 | AUD | 2,864 | USD | 2,567 | $ | (40 | ) | |||||
1/25/10 | USD | 2,631 | AUD | 2,864 | (25 | ) | ||||||
| $ | (65 | ) | ||||||||||
A summary of the open futures contracts held by the Fund at November 30, 2009, is as follows:
| Type of Contract | Number of Contracts Long (Short) | Expiration Date | Unrealized Appreciation (Depreciation) ($ Thousands) | |||||
DJ Euro Stoxx 50 Index | 244 | Dec-2009 | $ | 159 | ||||
E-Mini MSCI EAFE | 4 | Dec-2009 | 2 | |||||
FTSE 100 Index | 73 | Dec-2009 | 216 | |||||
Hang Seng Index | 2 | Dec-2009 | 1 | |||||
Nikkei 225 Index | 13 | Dec-2009 | (47 | ) | ||||
SPI 200 Index | 11 | Dec-2009 | 28 | |||||
Topix Index | 24 | Dec-2009 | (90 | ) | ||||
| $ | 269 | |||||||
For the year ended November 30, 2009, the total amount of all open futures contracts, as presented in the table above, are representative of the volume of activity for this derivative type during the period.
A summary of outstanding swap agreements held by the Fund at November 30, 2009, is as follows:
| Total Return Swap | ||||||||||||||
| Counterparty | Reference Entity/Obligation | Fund Pays | Fund Receives | Termination Date | Notional Amount (Thousands) | Net Unrealized Depreciation ($ Thousands) | ||||||||
| JPMorgan Chase Bank | MSCI Daily TR Net EAFE USD Market Index | 3-Month LIBOR Minus 25 Bps | Price Return | 10/15/10 | 32,906 | $ | (197 | ) | ||||||
Percentages are based on a Net Assets of $750,119 ($ Thousands)
| * | The rate reported is the 7-day effective yield as of November 30, 2009. |
| † | Investment in Affiliated Security (see Note 5). |
| (A) | This security or a partial position of this security is on loan at November 30, 2009 (see Note 11). The total value of securities on loan at November 30, 2009 was $31,767 ($ Thousands). |
| (B) | This security was purchased with cash collateral held from securities on loan (see Note 11). The total value of such securities on November 30, 2009 was $33,521 ($Thousands). |
| (C) | Security, or a portion thereof, has been pledged as collateral on open futures contracts. |
ADR — American Depositary Receipt
AUD — Australian Dollar
Cl — Class
GBP — British Pound Sterling
LIBOR — London Interbank Offered Rate
L.P. — Limited Partnership
MSCI EAFE — Morgan Stanley Capital International Europe, Australia, and the Far East
Ser — Series
DJ — Dow Jones
SPI — Share Price Index
FTSE — Financial Times and the London Stock Exchange
USD — U.S. Dollar
The Summary Schedule of Investments does not reflect the complete portfolio holdings. It includes the Fund’s 50 largest unaffiliated holdings and each investment of any issuer that exceeds 1% of the Fund’s net assets. “Other Securities” represent all issues not required to be disclosed under the rules adopted by the U.S. Securities and Exchange Commission (“SEC”). In certain instances, securities for which footnotes listed above may otherwise apply are included in the Other Securities caption. The complete schedule of portfolio holdings is available (i) without charge, upon request, by calling (800) 342-5734; and (ii) on the SEC’s website at http://www.sec.gov.
The following is a summary of the inputs used as of November 30, 2009 in valuing the Fund’s investments carried at value ($ Thousands):
| Investments in Securities | Level 1 | Level 2 | Level 3 | Total | ||||||||
Common Stock | $ | 671,665 | $ | 1,434 | $ | — | $ | 673,099 | ||||
Mortgage-Backed Securities | — | 14,198 | — | 14,198 | ||||||||
Asset-Backed Securities | — | 10,685 | — | 10,685 | ||||||||
Preferred Stock | 5,747 | — | — | 5,747 | ||||||||
Rights | 461 | — | — | 461 | ||||||||
Corporate Obligation | — | 284 | — | 284 | ||||||||
Warrants | 16 | — | — | 16 | ||||||||
Affiliated Partnership | — | 33,521 | — | 33,521 | ||||||||
Cash Equivalent | 18,775 | — | — | 18,775 | ||||||||
U.S. Treasury Obligations | — | 2,820 | — | 2,820 | ||||||||
Total Investments in Securities | $ | 696,664 | $ | 62,942 | $ | — | $ | 759,606 | ||||
| Other Financial Instruments | Level 1 | Level 2 | Level 3 | Total | ||||||||||
Futures Contracts* | $ | 269 | $ | — | $ | — | $ | 269 | ||||||
Forwards | — | (65 | ) | — | (65 | ) | ||||||||
Total Return Swap | — | (197 | ) | — | (197 | ) | ||||||||
Total Other Financial Instruments | $ | 269 | $ | (262 | ) | $ | — | $ | 7 | |||||
| * | Futures contracts are valued at the unrealized appreciation on the instrument. |
For more information on valuation inputs, see Note 2 — Significant Accounting Policies in Notes to Financial Statements.
Amounts designated as “—” are either $0 or have been rounded to $0.
The accompanying notes are an integral part of the financial statements.
| 20 | SEI Institutional Investments Trust / Semi-Annual Report / November 30, 2009 |
Table of Contents
SUMMARY SCHEDULE OF INVESTMENTS (Unaudited)
World Equity Ex-US Fund
November 30, 2009
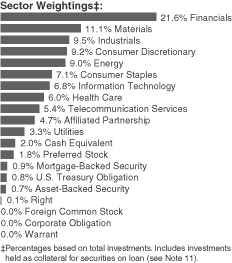
| Description | Percentage of Net Assets (%) | Shares | Market Value ($ Thousands) | |||||
COMMON STOCK — 91.6% | ||||||||
Argentina — 0.2% | ||||||||
Other Securities | 0.2 | % | $ | 5,265 | ||||
Australia — 4.2% | ||||||||
BHP Billiton | 0.8 | 662,008 | 25,026 | |||||
Other Securities | 3.4 | 118,123 | ||||||
| 143,149 | ||||||||
Austria — 0.2% | ||||||||
Other Securities | 0.2 | 7,816 | ||||||
Belgium — 1.1% | ||||||||
Other Securities | 1.1 | 36,978 | ||||||
Brazil — 2.0% | ||||||||
Other Securities | 2.0 | 70,357 | ||||||
Canada — 4.7% | ||||||||
Royal Bank of Canada (A) | 0.4 | 248,801 | 13,407 | |||||
Other Securities | 4.3 | 146,075 | ||||||
| 159,482 | ||||||||
Chile — 0.3% | ||||||||
Other Securities | 0.3 | 9,361 | ||||||
China — 2.5% | ||||||||
Bank of China | 0.5 | 28,105,000 | 15,847 | |||||
Industrial & Commercial Bank of China | 0.4 | 16,176,000 | 13,671 | |||||
Other Securities | 1.6 | 56,187 | ||||||
| 85,705 | ||||||||
| Description | Percentage of Net Assets (%) | Shares | Market Value ($ Thousands) | |||||
Colombia — 0.0% | ||||||||
Other Securities | 0.0 | % | $ | 383 | ||||
Cyprus — 0.0% | ||||||||
Other Securities | 0.0 | 930 | ||||||
Czech Republic — 0.1% | ||||||||
Other Securities | 0.1 | 2,557 | ||||||
Denmark — 0.5% | ||||||||
Other Securities | 0.5 | 16,326 | ||||||
Egypt — 0.1% | ||||||||
Other Securities | 0.1 | 3,967 | ||||||
Finland — 0.7% | ||||||||
Other Securities | 0.7 | 24,045 | ||||||
France — 5.3% | ||||||||
BNP Paribas | 0.6 | 259,027 | 21,389 | |||||
Sanofi-Aventis | 1.0 | 429,619 | 32,457 | |||||
Total (A) | 0.4 | 220,764 | 13,659 | |||||
Other Securities | 3.3 | 112,315 | ||||||
| 179,820 | ||||||||
Germany — 5.3% | ||||||||
BASF | 0.4 | 243,709 | 14,694 | |||||
Deutsche Bank (A) | 0.4 | 185,250 | 13,365 | |||||
Deutsche Post | 0.4 | 617,377 | 11,558 | |||||
E.ON | 0.5 | 430,751 | 17,034 | |||||
Siemens | 0.7 | 222,746 | 21,824 | |||||
Other Securities | 2.9 | 100,471 | ||||||
| 178,946 | ||||||||
Greece — 0.6% | ||||||||
Other Securities | 0.6 | 21,839 | ||||||
Guernsey — 0.1% | ||||||||
Other Securities | 0.1 | 3,435 | ||||||
Hong Kong — 3.5% | ||||||||
Hang Seng Bank | 0.1 | 97,800 | 1,431 | |||||
Sun Hung Kai Properties | 0.4 | 872,000 | 12,928 | |||||
Other Securities | 3.0 | 105,432 | ||||||
| 119,791 | ||||||||
Hungary — 0.1% | ||||||||
Other Securities | 0.1 | 3,994 | ||||||
India — 1.9% | ||||||||
Other Securities | 1.9 | 63,232 | ||||||
Indonesia — 0.4% | ||||||||
Other Securities | 0.4 | 14,149 | ||||||
| SEI Institutional Investments Trust / Semi-Annual Report / November 30, 2009 | 21 |
Table of Contents
SUMMARY SCHEDULE OF INVESTMENTS (Unaudited)
World Equity Ex-US Fund (Continued)
November 30, 2009
| Description | Percentage of Net Assets (%) | Shares | Market Value ($ Thousands) | |||||
Ireland — 0.1% | ||||||||
Other Securities | 0.1 | % | $ | 3,801 | ||||
Israel — 0.7% | ||||||||
Other Securities | 0.7 | 22,459 | ||||||
Italy — 2.0% | ||||||||
Enel (A) | 0.4 | 2,188,224 | 13,092 | |||||
Other Securities | 1.6 | 54,943 | ||||||
| 68,035 | ||||||||
Japan — 13.4% | ||||||||
Canon | 0.4 | 338,300 | 13,077 | |||||
East Japan Railway | 0.4 | 162,600 | 11,514 | |||||
Honda Motor | 0.5 | 555,900 | 17,423 | |||||
Mitsubishi | 0.5 | 793,200 | 17,955 | |||||
Nissan Motor | 0.4 | 2,024,300 | 14,710 | |||||
Toyota Motor | 0.4 | 289,000 | 11,541 | |||||
Other Securities | 10.8 | 368,750 | ||||||
| 454,970 | ||||||||
Jersey — 0.0% | ||||||||
Other Securities | 0.0 | 603 | ||||||
Kazakhstan — 0.1% | ||||||||
Other Securities | 0.1 | 1,856 | ||||||
Malaysia — 0.5% | ||||||||
Other Securities | 0.5 | 16,352 | ||||||
Mauritius — 0.0% | ||||||||
Other Securities | 0.0 | 1,422 | ||||||
Mexico — 1.3% | ||||||||
America Movil, Ser L | 0.5 | 6,485,309 | 15,690 | |||||
Other Securities | 0.8 | 30,031 | ||||||
| 45,721 | ||||||||
Netherlands — 3.8% | ||||||||
Royal Dutch Shell, Cl A | 0.5 | 552,025 | 16,402 | |||||
Royal Dutch Shell, Cl A (GBP) | 0.2 | 304,836 | 9,007 | |||||
Royal Dutch Shell, Cl B | 0.4 | 449,814 | 12,822 | |||||
Unilever (A) | 0.6 | 671,454 | 20,570 | |||||
Other Securities | 2.1 | 71,079 | ||||||
| 129,880 | ||||||||
New Zealand — 0.1% | ||||||||
Other Securities | 0.1 | 3,987 | ||||||
Norway — 0.8% | ||||||||
Other Securities | 0.8 | 28,310 | ||||||
| Description | Percentage of Net Assets (%) | Shares | Market Value ($ Thousands) | |||||
Pakistan — 0.1% | ||||||||
Other Securities | 0.1 | % | $ | 2,121 | ||||
Panama — 0.1% | ||||||||
Other Securities | 0.1 | 2,078 | ||||||
Papua New Guinea — 0.0% | ||||||||
Other Securities | 0.0 | 644 | ||||||
Philippines — 0.1% | ||||||||
Other Securities | 0.1 | 2,478 | ||||||
Poland — 0.2% | ||||||||
Other Securities | 0.2 | 6,668 | ||||||
Portugal — 0.3% | ||||||||
Other Securities | 0.3 | 10,192 | ||||||
Russia — 1.5% | ||||||||
Gazprom OAO ADR | 0.5 | 654,025 | 14,859 | |||||
Other Securities | 1.0 | 34,862 | ||||||
| 49,721 | ||||||||
Singapore — 1.1% | ||||||||
Other Securities | 1.1 | 37,849 | ||||||
South Africa — 1.3% | ||||||||
Other Securities | 1.3 | 43,198 | ||||||
South Korea — 3.0% | ||||||||
Samsung Electronics | 0.7 | 39,024 | 24,164 | |||||
Other Securities | 2.3 | 77,049 | ||||||
| 101,213 | ||||||||
Spain — 2.9% | ||||||||
Banco Bilbao Vizcaya Argentaria (A) | 0.5 | 814,896 | 15,348 | |||||
Banco Santander Central Hispano | 0.9 | 1,830,682 | 31,360 | |||||
Telefonica | 0.8 | 896,220 | 25,727 | |||||
Other Securities | 0.7 | 26,990 | ||||||
| 99,425 | ||||||||
Sweden — 1.4% | ||||||||
Other Securities | 1.4 | 46,144 | ||||||
Switzerland — 6.1% | ||||||||
Credit Suisse Group | 0.7 | 421,713 | 21,836 | |||||
Nestle | 1.0 | 689,804 | 32,613 | |||||
Novartis | 1.0 | 591,497 | 32,836 | |||||
Roche Holding | 0.6 | 130,669 | 21,378 | |||||
Xstrata | 0.5 | 906,614 | 15,905 | |||||
Zurich Financial Services | 0.4 | 60,490 | 13,034 | |||||
| 22 | SEI Institutional Investments Trust / Semi-Annual Report / November 30, 2009 |
Table of Contents
| Description | Percentage of Net Assets (%) | Shares | Market Value ($ Thousands) | |||||
Other Securities | 1.9 | % | $ | 69,625 | ||||
| 207,227 | ||||||||
Taiwan — 2.6% | ||||||||
HON HAI Precision Industry | 0.3 | 2,736,708 | 11,566 | |||||
Other Securities | 2.3 | 75,832 | ||||||
| 87,398 | ||||||||
Thailand — 0.7% | ||||||||
Other Securities | 0.7 | 24,862 | ||||||
Turkey — 0.9% | ||||||||
Other Securities | 0.9 | 32,075 | ||||||
United Kingdom — 12.2% | ||||||||
Anglo American | 0.3 | 264,324 | 11,291 | |||||
AstraZeneca | 0.9 | 661,895 | 29,513 | |||||
Barclays | 0.4 | 2,719,804 | 13,049 | |||||
BG Group | 0.3 | 632,356 | 11,447 | |||||
BHP Billiton | 0.5 | 610,525 | 18,611 | |||||
BP | 1.3 | 4,856,780 | 45,798 | |||||
British American Tobacco | 0.5 | 559,766 | 16,967 | |||||
GlaxoSmithKline | 0.5 | 905,580 | 18,681 | |||||
HSBC Holdings | 1.0 | 2,893,887 | 33,577 | |||||
Rio Tinto | 0.4 | 237,535 | 12,038 | |||||
Standard Chartered | 0.4 | 558,233 | 13,595 | |||||
Vodafone Group | 0.4 | 5,997,391 | 13,494 | |||||
Other Securities | 5.3 | 176,910 | ||||||
| 414,971 | ||||||||
United States — 0.5% | ||||||||
Other Securities | 0.5 | 17,508 | ||||||
Total Common Stock | 3,114,695 | |||||||
PREFERRED STOCK — 1.9% | ||||||||
Brazil — 1.7% | ||||||||
Petroleo Brasileiro | 0.5 | 838,500 | 18,625 | |||||
Other Securities | 1.2 | 38,347 | ||||||
| 56,972 | ||||||||
France — 0.0% | ||||||||
Other Securities | 0.0 | 560 | ||||||
Germany — 0.2% | ||||||||
Other Securities | 0.2 | 5,907 | ||||||
Total Preferred Stock | 63,439 | |||||||
| Description | Percentage of Net Assets (%) | Shares | Market Value ($ Thousands) | |||||
ASSET-BACKED SECURITIES — 0.8% | ||||||||
Automotive — 0.1% | ||||||||
Other Securities | 0.1 | $ | 6,431 | |||||
Credit Cards — 0.4% | ||||||||
Other Securities | 0.4 | 11,005 | ||||||
Mortgage Related Securities — 0.3% | ||||||||
Other Securities | 0.3 | 8,767 | ||||||
Total Asset-Backed Securities | 26,203 | |||||||
MORTGAGE-BACKED SECURITIES — 0.9% | ||||||||
Agency Mortgage-Backed Obligations — 0.2% | ||||||||
Other Securities | 0.2 | 5,498 | ||||||
Non-Agency Mortgage-Backed Obligations — 0.7% | ||||||||
Other Securities | 0.7 | % | 24,389 | |||||
Total Mortgage-Backed Securities (Cost $33,226) ($ Thousands) | 29,887 | |||||||
RIGHTS — 0.0% | ||||||||
Australia — 0.0% | ||||||||
Other Securities | 0.0 | — | ||||||
Belgium — 0.0% | ||||||||
Other Securities | 0.0 | — | ||||||
Germany — 0.0% | ||||||||
Other Securities | 0.0 | 138 | ||||||
Italy — 0.0% | ||||||||
Other Securities | 0.0 | 2 | ||||||
Netherlands — 0.0% | ||||||||
Other Securities | 0.0 | 914 | ||||||
Norway — 0.0% | ||||||||
Other Securities | 0.0 | 388 | ||||||
Spain — 0.0% | ||||||||
Other Securities | 0.0 | 17 | ||||||
United Kingdom — 0.0% | ||||||||
Other Securities | 0.0 | 493 | ||||||
Total Rights | 1,952 | |||||||
| SEI Institutional Investments Trust / Semi-Annual Report / November 30, 2009 | 23 |
Table of Contents
SUMMARY SCHEDULE OF INVESTMENTS (Unaudited)
World Equity Ex-US Fund (Concluded)
November 30, 2009
| Description | Percentage of Net Assets (%) | Shares/Face Amount ($ Thousands) | Market Value ($ Thousands) | ||||||
WARRANTS — 0.0% | |||||||||
Other Securities | 0.0 | % | $ | 50 | |||||
Total Warrants | 50 | ||||||||
U.S. TREASURY OBLIGATIONS — 0.8% | |||||||||
U.S. Treasury Bill (C)(D) |
| ||||||||
0.161%, 12/03/09 | 0.5 | $ | 18,000 | 18,000 | |||||
0.285%, 12/17/09 | 0.0 | 1,315 | 1,315 | ||||||
0.291%, 01/07/10 | 0.1 | 3,100 | 3,100 | ||||||
0.010%, 02/25/10 | 0.2 | 5,000 | 4,999 | ||||||
Total U.S. Treasury Obligations | 27,414 | ||||||||
CORPORATE OBLIGATION — 0.0% | |||||||||
Financials — 0.0% | |||||||||
Other Securities | 0.0 | 316 | |||||||
Total Corporate Obligation | 316 | ||||||||
AFFILIATED PARTNERSHIP — 4.8% | |||||||||
SEI Liquidity Fund, L.P. 0.320%*† (B) | 4.8 | 164,829,238 | 162,670 | ||||||
Total Affiliated Partnership (Cost $164,829) ($ Thousands) | 162,670 | ||||||||
| Description | Percentage of Net Assets (%) | Shares/Face Amount ($ Thousands) | Market Value ($ Thousands) | ||||
CASH EQUIVALENT — 2.0% | |||||||
SEI Daily Income Trust, | 2.0 | 68,710,600 | 68,711 | ||||
Total Cash Equivalent | 68,711 | ||||||
Total Investments — 102.8% | $ | 3,495,337 | |||||
A summary of the open futures contracts held by the Fund at November 30, 2009, is as follows:
| Type of Contract | Number of Contracts Long (Short) | Expiration Date | Unrealized Appreciation (Depreciation) ($ Thousands) | |||||
DJ Euro Stoxx 50 Index | 784 | Dec-2009 | $ | 432 | ||||
E-Mini MSCI EAFE | 28 | Dec-2009 | 45 | |||||
E-Mini MSCI Emerging | 351 | Dec-2009 | 1,309 | |||||
FTSE 100 Index | 227 | Dec-2009 | 678 | |||||
Hang Seng Index | 15 | Dec-2009 | (2 | ) | ||||
Nikkei 225 Index | 53 | Dec-2009 | (279 | ) | ||||
S&P/TSE 60 Index | 111 | Dec-2009 | 416 | |||||
SPI 200 Index | 89 | Dec-2009 | 237 | |||||
Topix Index | 234 | Dec-2009 | (890 | ) | ||||
| $ | 1,946 | |||||||
For the year ended November 30, 2009, the total amount of all open futures contracts, as presented in the table above, are representative of the volume of activity for this derivative type during the period.
A summary of the outstanding forward foreign currency contracts held by the Fund at November 30, 2009, is as follows:
| Maturity Date | Currency to Deliver (Thousands) | Currency to Receive (Thousands) | Unrealized Depreciation ($ Thousands) | |||||||||
12/3/09 | USD | 5,607 | CAD | 5,910 | $ | (1 | ) | |||||
1/25/10 | AUD | 11,589 | USD | 10,386 | (161 | ) | ||||||
1/25/10 | USD | 10,646 | AUD | 11,589 | (100 | ) | ||||||
| $ | (262 | ) | ||||||||||
A summary of outstanding swap agreements held by the Fund at November 30, 2009, is as follows:
| Total Return Swaps | ||||||||||||||
| Counterparty | Reference Entity/Obligation | Fund Pays | Fund Receives | Termination Date | Notional Amount (Thousands) | Net Unrealized Appreciation (Depreciation) ($Thousands) | ||||||||
| Morgan Stanley | MSCI Daily TR Net EAFE USD Market Index | 3-Month LIBOR | Price Return | 01/13/10 | 35,849 | $ | (81 | ) | ||||||
| Morgan Stanley | MSCI Daily TR Net EAFE USD Market Index | 1-Month LIBOR | Price Return | 08/03/10 | 17,365 | 617 | ||||||||
| $ | 536 | |||||||||||||
Percentages are based on a Net Assets of $3,401,044 ($ Thousands)
| * | The rate reported is the 7-day effective yield as of November 30, 2009. |
| † | Investment in Affiliated Security (see Note 5). |
| (A) | This security or a partial position of this security is on loan at November 30, 2009 (see Note 11). The total value of securities on loan at November 30, 2009 was $154,501 ($ Thousands). |
| (B) | This security was purchased with cash collateral held from securities on loan (see Note 11). The total value of such securities as of November 30, 2009 was $162,170 ($ Thousands). |
| (C) | The rate reported is the effective yield at time of purchase. |
| (D) | Security, or a portion thereof, has been pledged as collateral on open future contracts. |
ADR — American Depositary Receipt
AUD — Australian Dollar
CAD — Canadian Dollar
Cl — Class
DJ — Dow Jones
FTSE — Financial Times and the London Stock Exchange
GBP — British Pound Sterling
LIBOR — London Interbank Offered Rate
L.P. — Limited Partnership
MSCI EAFE — Morgan Stanley Capital International Europe, Australia, and the Far East
S&P — Standard & Poor’s
SPI — Share Price Index
Ser — Series
TSE — Toronto Stock Exchange
USD — U.S. Dollar
| 24 | SEI Institutional Investments Trust / Semi-Annual Report / November 30, 2009 |
Table of Contents
The Summary Schedule of Investments does not reflect the complete portfolio holdings. It includes the Fund’s 50 largest unaffiliated holdings and each investment of any issuer that exceeds 1% of the Fund’s net assets. “Other Securities” represent all issues not required to be disclosed under the rules adopted by the U.S. Securities and Exchange Commission (“SEC”). In certain instances, securities for which footnotes listed above may otherwise apply are included in the Other Securities caption. The complete schedule of portfolio holdings is available (i) without charge, upon request, by calling (800) 342-5734; and (ii) on the SEC’s website at http://www.sec.gov.
The following is a summary of the inputs used as of November 30, 2009 in valuing the Fund’s investments carried at value ($ Thousands):
| Investments in Securities | Level 1 | Level 2 | Level 3 | Total | ||||||||
Common Stock | $ | 3,081,441 | $ | 33,254 | $ | — | $ | 3,114,695 | ||||
Preferred Stock | 63,439 | — | — | 63,439 | ||||||||
Mortgage-Backed Securities | — | 29,887 | — | 29,887 | ||||||||
Asset-Backed Securities | — | 26,203 | — | 26,203 | ||||||||
Rights | 1,952 | — | — | 1,952 | ||||||||
Corporate Obligation | — | 316 | — | 316 | ||||||||
Warrants | 50 | — | — | 50 | ||||||||
Affiliated Partnership | — | 162,670 | — | 162,670 | ||||||||
Cash Equivalent | 68,711 | — | — | 68,711 | ||||||||
U.S. Treasury Obligations | — | 27,414 | — | 27,414 | ||||||||
Total Investments in Securities | $ | 3,215,593 | $ | 279,744 | $ | — | $ | 3,495,337 | ||||
| Other Financial Instruments | Level 1 | Level 2 | Level 3 | Total | ||||||||||
Futures Contracts* | $ | 1,946 | $ | — | $ | — | $ | 1,946 | ||||||
Forwards | — | (262 | ) | — | (262 | ) | ||||||||
Total Return Swaps | — | 536 | — | 536 | ||||||||||
Total Other Financial Instruments | $ | 1,946 | $ | 274 | $ | — | $ | 2,220 | ||||||
| * | Futures contracts are valued at the unrealized appreciation on the instrument. |
For more information on valuation inputs, see Note 2 — Significant Accounting Policies in Notes to Financial Statements.
Amounts designated as “—” are either $0 or have been rounded to $0.
The accompanying notes are an integral part of the financial statements.
| SEI Institutional Investments Trust / Semi-Annual Report / November 30, 2009 | 25 |
Table of Contents
SUMMARY SCHEDULE OF INVESTMENTS (Unaudited)
Screened World Equity Ex-US Fund
November 30, 2009
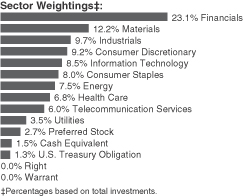
| Description | Percentage of Net Assets (%) | Shares | Market Value ($ Thousands) | |||||
COMMON STOCK — 93.3% | ||||||||
Argentina — 0.0% | ||||||||
Other Securities | 0.0 | % | $ | 27 | ||||
Australia — 4.4% | ||||||||
Australia & New Zealand Banking Group | 0.4 | 13,948 | 283 | |||||
Commonwealth Bank of Australia | 0.4 | 6,169 | 298 | |||||
Rio Tinto | 0.4 | 5,035 | 330 | |||||
Woolworths | 0.4 | 12,774 | 328 | |||||
Other Securities | 2.8 | 2,030 | ||||||
| 3,269 | ||||||||
Austria — 0.2% | ||||||||
Other Securities | 0.2 | 157 | ||||||
Belgium — 1.0% | ||||||||
InBev | 0.5 | 7,418 | 370 | |||||
Other Securities | 0.5 | 368 | ||||||
| 738 | ||||||||
Brazil — 1.2% | ||||||||
Other Securities | 1.2 | 912 | ||||||
Canada — 7.2% | ||||||||
EnCana | 0.4 | 6,169 | 331 | |||||
Royal Bank of Canada | 0.5 | 7,200 | 388 | |||||
Other Securities | 6.3 | 4,662 | ||||||
| 5,381 | ||||||||
Chile — 0.3% | ||||||||
Other Securities | 0.3 | 250 | ||||||
China — 3.2% | ||||||||
Industrial & Commercial Bank of China | 0.7 | 571,000 | 483 | |||||
Other Securities | 2.5 | 1,868 | ||||||
| 2,351 | ||||||||
| Description | Percentage of Net Assets (%) | Shares | Market Value ($ Thousands) | |||||
Colombia — 0.1% | ||||||||
Other Securities | 0.1 | % | $ | 72 | ||||
Czech Republic — 0.1% | ||||||||
Other Securities | 0.1 | 120 | ||||||
Denmark — 0.5% | ||||||||
Other Securities | 0.5 | 404 | ||||||
Egypt — 0.2% | ||||||||
Other Securities | 0.2 | 158 | ||||||
Finland — 0.6% | ||||||||
Other Securities | 0.6 | 422 | ||||||
France — 4.8% | ||||||||
France Telecom | 0.4 | 12,024 | 313 | |||||
Sanofi-Aventis | 0.9 | 8,882 | 671 | |||||
Other Securities | 3.5 | 2,622 | ||||||
| 3,606 | ||||||||
Germany — 4.1% | ||||||||
Allianz | 0.4 | 2,197 | 270 | |||||
BASF | 0.6 | 7,129 | 430 | |||||
Bayerische Motoren Werke | 0.4 | 5,891 | 278 | |||||
Deutsche Bank | 0.4 | 4,385 | 316 | |||||
E.ON | 0.6 | 11,243 | 445 | |||||
Other Securities | 1.7 | 1,318 | ||||||
| 3,057 | ||||||||
Greece — 0.6% | ||||||||
Other Securities | 0.6 | 469 | ||||||
Hong Kong — 3.3% | ||||||||
Other Securities | 3.3 | 2,371 | ||||||
Hungary — 0.2% | ||||||||
Other Securities | 0.2 | 144 | ||||||
India — 2.2% | ||||||||
HDFC Bank ADR | 0.6 | 3,471 | 467 | |||||
Infosys Technologies ADR | 0.9 | 13,222 | 674 | |||||
Other Securities | 0.7 | 517 | ||||||
| 1,658 | ||||||||
Indonesia — 0.6% | ||||||||
Other Securities | 0.6 | 417 | ||||||
Ireland — 0.1% | ||||||||
Other Securities | 0.1 | 72 | ||||||
Israel — 1.0% | ||||||||
Other Securities | 1.0 | 767 | ||||||
Italy — 2.0% | ||||||||
Enel | 0.4 | 48,532 | 290 | |||||
Other Securities | 1.6 | 1,166 | ||||||
| 1,456 | ||||||||
| 26 | SEI Institutional Investments Trust / Semi-Annual Report / November 30, 2009 |
Table of Contents
| Description | Percentage of Net Assets (%) | Shares | Market Value ($ Thousands) | |||||
Japan — 13.3% | ||||||||
Asahi Glass | 0.4 | % | 31,000 | $ | 272 | |||
Canon | 0.5 | 9,000 | 348 | |||||
Honda Motor | 0.6 | 14,235 | 446 | |||||
JFE Holdings | 0.5 | 10,200 | 336 | |||||
Mitsubishi | 0.6 | 20,800 | 471 | |||||
Toyota Motor | 0.6 | 10,333 | 413 | |||||
Other Securities | 10.1 | 7,630 | ||||||
| 9,916 | ||||||||
Malaysia — 0.5% | ||||||||
Other Securities | 0.5 | 368 | ||||||
Mauritius — 0.1% | ||||||||
Other Securities | 0.1 | 51 | ||||||
Mexico — 1.1% | ||||||||
America Movil, Ser L | 0.4 | 116,200 | 281 | |||||
Other Securities | 0.7 | 522 | ||||||
| 803 | ||||||||
Netherlands — 2.2% | ||||||||
Akzo Nobel | 0.4 | 4,706 | 298 | |||||
Koninklijke Philips Electronics | 0.4 | 10,390 | 284 | |||||
Other Securities | 1.4 | 1,032 | ||||||
| 1,614 | ||||||||
New Zealand — 0.0% | ||||||||
Other Securities | 0.0 | 5 | ||||||
Norway — 0.8% | ||||||||
Other Securities | 0.8 | 615 | ||||||
Papua New Guinea — 0.0% | ||||||||
Other Securities | 0.0 | 26 | ||||||
Peru — 0.0% | ||||||||
Other Securities | 0.0 | 12 | ||||||
Philippines — 0.1% | ||||||||
Other Securities | 0.1 | 45 | ||||||
Poland — 0.4% | ||||||||
Other Securities | 0.4 | 302 | ||||||
Portugal — 0.7% | ||||||||
Other Securities | 0.7 | 497 | ||||||
Russia — 0.8% | ||||||||
Other Securities | 0.8 | 591 | ||||||
Singapore — 1.3% | ||||||||
Other Securities | 1.3 | 978 | ||||||
| Description | Percentage of Net Assets (%) | Shares | Market Value ($ Thousands) | |||||
South Africa — 1.6% | ||||||||
Other Securities | 1.6 | % | $ | 1,207 | ||||
South Korea — 2.3% | ||||||||
Samsung Electronics | 0.4 | 520 | 322 | |||||
Other Securities | 1.9 | 1,411 | ||||||
| 1,733 | ||||||||
Spain — 3.7% | ||||||||
Banco Bilbao Vizcaya Argentaria | 0.7 | 27,711 | 522 | |||||
Banco Santander Central Hispano | 1.3 | 56,283 | 964 | |||||
Telefonica | 1.2 | 32,423 | 931 | |||||
Other Securities | 0.5 | 345 | ||||||
| 2,762 | ||||||||
Sweden — 2.1% | ||||||||
Svenska Cellulosa, Cl B | 0.4 | 20,793 | 286 | |||||
Other Securities | 1.7 | 1,239 | ||||||
| 1,525 | ||||||||
Switzerland — 7.4% | ||||||||
Credit Suisse Group | 1.1 | 15,610 | 808 | |||||
Nestle | 1.1 | 16,750 | 792 | |||||
Novartis | 1.5 | 19,768 | 1,097 | |||||
Roche Holding | 0.8 | 3,452 | 565 | |||||
Xstrata | 0.9 | 36,841 | 646 | |||||
Other Securities | 2.0 | 1,561 | ||||||
| 5,469 | ||||||||
Taiwan — 2.7% | ||||||||
Taiwan Semiconductor Manufacturing | 0.4 | 156,769 | 298 | |||||
Other Securities | 2.3 | 1,721 | ||||||
| 2,019 | ||||||||
Thailand — 0.3% | ||||||||
Other Securities | 0.3 | 211 | ||||||
Turkey — 0.6% | ||||||||
Other Securities | 0.6 | 477 | ||||||
United Kingdom — 13.3% | ||||||||
Anglo American | 0.6 | 9,536 | 407 | |||||
AstraZeneca | 1.0 | 16,606 | 740 | |||||
Barclays | 0.7 | 107,310 | 515 | |||||
BG Group | 0.5 | 18,551 | 336 | |||||
BHP Billiton | 0.6 | 13,930 | 425 | |||||
BP | 1.3 | 101,507 | 957 | |||||
British American Tobacco | 0.6 | 15,275 | 463 | |||||
GlaxoSmithKline | 0.8 | 29,938 | 618 | |||||
Rio Tinto | 0.7 | 10,791 | 547 | |||||
Vodafone Group | 0.5 | 169,129 | 380 | |||||
Other Securities | 6.0 | 4,488 | ||||||
| 9,876 | ||||||||
| SEI Institutional Investments Trust / Semi-Annual Report / November 30, 2009 | 27 |
Table of Contents
SUMMARY SCHEDULE OF INVESTMENTS (Unaudited)
Screened World Equity Ex-US Fund (Concluded)
November 30, 2009
| Description | Percentage of Net Assets (%) | Shares | Market Value ($ Thousands) | |||||
United States — 0.1% | ||||||||
Other Securities | 0.1 | % | $ | 67 | ||||
Total Common Stock | 69,447 | |||||||
PREFERRED STOCK — 2.7% | ||||||||
Brazil — 2.5% | ||||||||
Cia Vale do Rio Doce, Cl A | 0.7 | 21,900 | 531 | |||||
Telecomunicacoes de Sao Paulo | 0.1 | 2,300 | 57 | |||||
Other Securities | 1.7 | 1,277 | ||||||
| 1,865 | ||||||||
France — 0.0% | ||||||||
Other Securities | 0.0 | 14 | ||||||
Germany — 0.2% | ||||||||
Other Securities | 0.2 | 124 | ||||||
Total Preferred Stock | 2,003 | |||||||
WARRANTS — 0.0% | ||||||||
Other Securities | 0.0 | 1 | ||||||
Total Warrants | 1 | |||||||
RIGHTS — 0.0% | ||||||||
Belgium — 0.0% | ||||||||
Other Securities | 0.0 | — | ||||||
Italy — 0.0% | ||||||||
Other Securities | 0.0 | 1 | ||||||
Norway — 0.0% | ||||||||
Other Securities | 0.0 | 12 | ||||||
Spain — 0.0% | ||||||||
Other Securities | 0.0 | — | ||||||
United Kingdom — 0.0% | ||||||||
Other Securities | 0.0 | 19 | ||||||
Total Rights | 32 | |||||||
| Description | Percentage of Net Assets (%) | Shares/Face Amount ($ Thousands) | Market Value ($ Thousands) | ||||||
CASH EQUIVALENT — 1.5% | |||||||||
SEI Daily Income Trust, | 1.5 | % | 1,098,507 | $ | 1,099 | ||||
Total Cash Equivalent (Cost $1,099) ($ Thousands) | 1,099 | ||||||||
U.S. TREASURY OBLIGATION (A) (B) — 1.2% | |||||||||
U.S. Treasury Bills | 1.2 | $ | 925 | 925 | |||||
Total U.S. Treasury Obligation | 925 | ||||||||
Total Investments — 98.7% (Cost $67,134) ($ Thousands) | $ | 73,507 | |||||||
A summary of the open futures contracts held by the Fund at November 30, 2009, is as follows:
| Type of Contract | Number of Contracts Long (Short) | Expiration Date | Unrealized Appreciation (Depreciation) ($ Thousands) | |||||
DJ Euro Stoxx 50 Index | 19 | Dec-2009 | $ | 20 | ||||
FTSE 100 Index | 6 | Dec-2009 | 18 | |||||
Hang Seng Index | 1 | Dec-2009 | — | |||||
S&P/TSE 60 Index | 1 | Dec-2009 | 7 | |||||
SPI 200 Index | 1 | Dec-2009 | 2 | |||||
Topix Index | 5 | Dec-2009 | (23 | ) | ||||
| $ | 24 | |||||||
For the year ended November 30, 2009, the total amount of all open futures contracts, as presented in the table above, are representative of the volume of activity for this derivative type during the period.
Percentages are based on a Net Assets of $74,441 ($ Thousands)
| * | The rate reported is the 7-day effective yield as of November 30, 2009. |
| † | Investment in Affiliated Security (see Note 5). |
| (A) | The rate reported is the effective yield at time of purchase. |
| (B) | Security, or a portion thereof, has been pledged as collateral on open futures contracts. |
| ADR | — American Depositary Receipt |
Cl — Class
DJ — Dow Jones
FTSE — Financial Times and the London Stock Exchange
S&P — Standard & Poor’s
SPI — Share Price Index
| Ser | — Series |
TSE — Toronto Stock Exchange
The Summary Schedule of Investments does not reflect the complete portfolio holdings. It includes the Fund’s 50 largest unaffiliated holdings and each investment of any issuer that exceeds 1% of the Fund’s net assets. “Other Securities” represent all issues not required to be disclosed under the rules adopted by the U.S. Securities and Exchange Commission (“SEC”). In certain instances, securities for which footnotes listed above may otherwise apply are included in the Other Securities caption. The complete schedule of portfolio holdings is available (i) without charge, upon request, by calling (800) 342-5734; and (ii) on the SEC’s website at http://www.sec.gov.
| 28 | SEI Institutional Investments Trust / Semi-Annual Report / November 30, 2009 |
Table of Contents
The following is a summary of the inputs used as of November 30, 2009 in valuing the Fund’s investments carried at value ($ Thousands):
| Investments in Securities | Level 1 | Level 2 | Level 3 | Total | ||||||||
Common Stock | $ | 68,924 | $ | 523 | $ | — | $ | 69,447 | ||||
Preferred Stock | 2,003 | — | — | 2,003 | ||||||||
Rights | 32 | — | — | 32 | ||||||||
Warrants | 1 | — | — | 1 | ||||||||
Cash Equivalent | 1,099 | — | — | 1,099 | ||||||||
U.S. Treasury Obligation | — | 925 | — | 925 | ||||||||
Total Investments in Securities | $ | 72,059 | $ | 1,448 | $ | — | $ | 73,507 | ||||
| Other Financial Instruments | Level 1 | Level 2 | Level 3 | Total | ||||||||
Futures Contracts* | $ | 24 | $ | — | $ | — | $ | 24 | ||||
Total Other Financial Instruments | $ | 24 | $ | — | $ | — | $ | 24 | ||||
| * | Futures contracts are valued at the unrealized appreciation on the instrument. |
For more information on valuation inputs, see Note 2 — Significant Accounting Policies in Notes to Financial Statements.
The accompanying notes are an integral part of the financial statements.
| SEI Institutional Investments Trust / Semi-Annual Report / November 30, 2009 | 29 |
Table of Contents
SCHEDULE OF INVESTMENTS (Unaudited)
Enhanced LIBOR Opportunities Fund
November 30, 2009
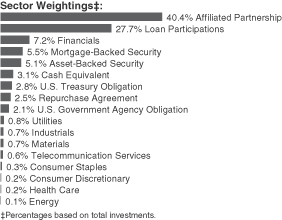
| Description | Face Amount ($ Thousands) | Market Value ($ Thousands) | ||||
LOAN PARTICIPATIONS — 28.7% | ||||||
Aeroflex, Ser B-1 | ||||||
3.750%, 08/15/14 | $ | 134 | $ | 121 | ||
3.738%, 08/15/14 | 456 | 415 | ||||
3.500%, 08/15/14 | 5 | 5 | ||||
Affinion, Ser B | ||||||
2.743%, 10/17/12 | 440 | 417 | ||||
Allison Transmission, Ser B | ||||||
3.000%, 08/07/14 | 696 | 610 | ||||
Aramark | ||||||
2.157%, 01/26/14 | 418 | 376 | ||||
0.120%, 01/26/14 | 27 | 25 | ||||
Ashland, Ser B | ||||||
7.650%, 05/13/14 | 284 | 288 | ||||
Asurion, Ser B | ||||||
3.251%, 07/03/14 | 525 | 492 | ||||
BBN Acquisitions | ||||||
7.250%, 09/14/15 | 459 | 459 | ||||
Biomet | ||||||
3.282%, 03/25/15 | 438 | 412 | ||||
Boozal, Ser B-15 | ||||||
7.500%, 07/02/15 | 112 | 112 | ||||
Burlington Coat Factory Warehouse, Ser C | ||||||
2.500%, 05/28/13 | 594 | 527 | ||||
Busch Enertain | ||||||
0.000%, 05/13/16 (G) | 500 | 500 | ||||
Calpine, 1st Lien | ||||||
3.165%, 03/29/14 | 773 | 706 | ||||
Cebridge, 2nd Lien | ||||||
6.257%, 05/05/14 | 216 | 214 | ||||
Cedar Fair | ||||||
4.246%, 08/30/14 | 175 | 166 | ||||
2.246%, 08/30/14 | 351 | 333 | ||||
2.246%, 08/30/12 | 145 | 135 | ||||
Celanese Holding, Ser B | ||||||
2.037%, 04/02/14 | 459 | 425 | ||||
Charter | ||||||
6.250%, 03/15/14 | 597 | 556 | ||||
| Description | Face Amount ($ Thousands) | Market Value ($ Thousands) | ||||
Cinemark USA | ||||||
2.130%, 10/05/13 | $ | 82 | $ | 77 | ||
2.040%, 10/05/13 | 251 | 235 | ||||
2.030%, 10/05/13 | 53 | 49 | ||||
1.990%, 10/05/13 | 74 | 69 | ||||
Clear Channel | ||||||
3.894%, 01/29/16 | 224 | 168 | ||||
Clear Channel, Ser B | ||||||
0.000%, 01/29/16 (G) | 870 | 654 | ||||
Community Health Systems | ||||||
2.613%, 07/25/14 | 856 | 782 | ||||
Community Health Systems (Delayed Draw) | ||||||
2.493%, 07/25/14 | 44 | 40 | ||||
Da Vita, Ser B-1 | ||||||
1.790%, 10/05/12 | 110 | 102 | ||||
1.750%, 10/05/12 | 340 | 319 | ||||
Dana Holding | ||||||
7.250%, 01/31/15 | 326 | 290 | ||||
Dana, Ser B | ||||||
0.000%, 01/31/15 (G) | 116 | 103 | ||||
Dealer Computer Services | ||||||
2.234%, 10/26/12 | 224 | 209 | ||||
Dealer Computer Services, 1st Lien | ||||||
2.246%, 10/26/12 | 449 | 418 | ||||
DIRECTV, Ser C | ||||||
5.250%, 04/13/13 | 438 | 435 | ||||
Discovery Communications | ||||||
5.250%, 05/14/14 | 522 | 523 | ||||
DJO Finance, Ser B | ||||||
3.265%, 05/20/14 | 182 | 171 | ||||
Dollar General, Ser B-2 | ||||||
3.011%, 07/07/14 | 998 | 928 | ||||
Dynegy Holdings | ||||||
4.000%, 04/02/13 | 685 | 645 | ||||
Enterprise GP Holdings | ||||||
2.534%, 11/10/14 | 208 | 197 | ||||
2.492%, 11/10/14 | 142 | 134 | ||||
Federal Mogul | ||||||
2.188%, 12/28/15 | 32 | 24 | ||||
2.188%, 12/29/14 | 380 | 286 | ||||
2.177%, 12/28/15 | 204 | 154 | ||||
2.177%, 12/29/14 | 81 | 61 | ||||
Flextronics International, Ser A-2 | ||||||
2.484%, 10/01/14 | 264 | 248 | ||||
Flextronics International, Ser A-3 | ||||||
2.484%, 10/01/14 | 308 | 289 | ||||
Georgia Pacific, Ser B1 | ||||||
2.316%, 12/20/12 | 378 | 358 | ||||
0.000%, 12/20/12 (G) | 500 | 474 | ||||
Graphic Packaging International | ||||||
3.030%, 05/16/14 | 440 | 414 | ||||
Green Valley Ranch Gaming, 1st Lien | ||||||
0.000%, 02/16/14 (G) | 450 | 327 | ||||
| 30 | SEI Institutional Investments Trust / Semi-Annual Report / November 30, 2009 |
Table of Contents
| Description | Face Amount ($ Thousands) | Market Value ($ Thousands) | ||||
Hanesbrands, Ser B | ||||||
5.254%, 09/05/13 | $ | 368 | $ | 367 | ||
Harrah’s Operating | ||||||
3.504%, 01/28/15 | 475 | 369 | ||||
Harrah’s Operating, Ser B-2 | ||||||
3.282%, 01/28/15 | 193 | 150 | ||||
HCA, Ser B | ||||||
2.532%, 11/18/13 | 1,012 | 940 | ||||
Hertz | ||||||
0.292%, 12/21/12 | 70 | 64 | ||||
Hertz, Ser B | ||||||
2.040%, 12/21/12 | 40 | 37 | ||||
2.030%, 12/21/12 | 253 | 231 | ||||
2.020%, 12/21/12 | 1 | 1 | ||||
2.000%, 12/21/12 | 85 | 78 | ||||
Hexion Specialty Chemical, Ser C-1 | ||||||
2.563%, 05/05/13 | 736 | 623 | ||||
Hexion Specialty Chemical, Ser C-2 | ||||||
2.563%, 05/05/13 | 160 | 135 | ||||
HMH Publishing, Ser B | ||||||
5.246%, 06/10/14 | 603 | 513 | ||||
Hub International | ||||||
6.750%, 06/13/14 | 350 | 345 | ||||
2.761%, 06/13/14 | 411 | 354 | ||||
Hub International (Delayed Draw) | ||||||
2.761%, 06/13/14 | 92 | 79 | ||||
Iasis Healthcare | ||||||
0.000%, 03/14/14 (G) | 347 | 320 | ||||
Iasis Healthcare (Delayed Draw) | ||||||
2.246%, 03/15/14 | 110 | 102 | ||||
Iasis Healthcare (Synthetic) | ||||||
0.145%, 03/15/14 | 30 | 28 | ||||
0.000%, 03/14/14 (G) | 153 | 141 | ||||
Iasis Healthcare, Ser B | ||||||
2.246%, 03/15/14 | 319 | 294 | ||||
Ineos Group, Ser B | ||||||
0.000%, 12/16/13 (G) | 225 | 194 | ||||
Ineos Group, Ser C | ||||||
0.000%, 12/16/14 (G) | 225 | 195 | ||||
Infor Enterprise Solution, 2nd Lien | ||||||
0.000%, 03/02/14 (G) | 141 | 96 | ||||
Infor Enterprise Solutions Holdings | ||||||
4.000%, 07/28/12 | 548 | 482 | ||||
Infor Global Enterprise Solutions | ||||||
6.484%, 03/02/14 | 305 | 207 | ||||
Infor Global Solutions Intermediate Holdings | ||||||
6.484%, 03/02/14 | 165 | 112 | ||||
Infor Global Solutions, Ser B | ||||||
0.000%, 07/30/12 (G) | 100 | 88 | ||||
Integra Telecom | ||||||
10.500%, 08/31/13 | 571 | 568 | ||||
Intelsat | ||||||
2.246%, 02/01/14 | 1,050 | 926 | ||||
| Description | Face Amount ($ Thousands) | Market Value ($ Thousands) | ||||
Inverness Medical, 2nd Lien | ||||||
0.000%, 06/26/15 (G) | $ | 440 | $ | 424 | ||
Jetro Holdings | ||||||
2.492%, 07/02/14 | 414 | 393 | ||||
Knology | ||||||
2.500%, 06/30/12 | 963 | 921 | ||||
Lake at Las Vegas Joint Venture | ||||||
16.100%, 06/20/12 (D) | 1,085 | 12 | ||||
15.460%, 06/20/12 (D) | 1,276 | 13 | ||||
7.746%, 06/20/12 | 588 | 293 | ||||
Lake at Las Vegas Joint Venture (Synthetic) | ||||||
16.100%, 06/20/12 (D) | 120 | 2 | ||||
Lamar Media | ||||||
5.500%, 09/30/12 | 345 | 345 | ||||
Language Line, Ser B-1 | ||||||
3.496%, 05/14/11 | 7 | 7 | ||||
Life Technologies | ||||||
5.250%, 11/21/15 | 1,087 | 1,085 | ||||
MEG Energy (Delayed Draw) | ||||||
2.290%, 03/30/13 | 74 | 67 | ||||
MEG Energy, Ser C | ||||||
2.290%, 03/30/13 | 364 | 330 | ||||
Metroflag, 2nd Lien | ||||||
11.250%, 01/06/09 (D) (F) | 1,500 | — | ||||
Mylan Laboratories, Ser B | ||||||
3.520%, 10/02/14 | 1,140 | 1,093 | ||||
Nalco, Ser B | ||||||
6.500%, 05/06/16 | 438 | 440 | ||||
Nielson Finance, Ser A | ||||||
3.992%, 12/31/17 | 626 | 572 | ||||
Niska | ||||||
1.995%, 05/12/13 | 430 | 397 | ||||
Niska (Delayed Draw) | ||||||
1.996%, 05/12/13 | 29 | 27 | ||||
Niska Gas Storage US | ||||||
1.996%, 05/12/13 | 5 | 5 | ||||
1.995%, 05/12/13 | 8 | 7 | ||||
Niska Gas Storage, Canada | ||||||
1.995%, 05/12/13 | 77 | 71 | ||||
NRG Holdings | ||||||
0.182%, 02/01/13 | 153 | 140 | ||||
NRG Holdings, Ser B | ||||||
2.022%, 02/01/13 | 285 | 261 | ||||
Oshkosh, Ser B | ||||||
6.330%, 12/06/13 | 432 | 430 | ||||
Pilot Travel Centers | ||||||
0.000%, 11/12/15 (G) | 250 | 250 | ||||
Reable Therapeutics, Ser B | ||||||
3.265%, 05/20/14 | 256 | 241 | ||||
Regal Cinemas | ||||||
4.033%, 10/27/13 | 353 | 346 | ||||
ReMax International | ||||||
3.790%, 12/17/12 | 64 | 62 | ||||
3.750%, 12/17/12 | 50 | 49 | ||||
| SEI Institutional Investments Trust / Semi-Annual Report / November 30, 2009 | 31 |
Table of Contents
SCHEDULE OF INVESTMENTS (Unaudited)
Enhanced LIBOR Opportunities Fund (Continued)
November 30, 2009
| Description | Face Amount ($ Thousands) | Market Value ($ Thousands) | ||||
ReMax International, Ser B-2 | ||||||
8.010%, 12/17/12 | $ | 79 | $ | 79 | ||
7.750%, 12/17/12 | 62 | 62 | ||||
Reynolds Group | ||||||
0.000%, 11/05/15 (G) | 840 | 838 | ||||
Sensata Technology | ||||||
2.031%, 04/27/13 | 439 | 386 | ||||
2.004%, 04/27/13 | 1 | 1 | ||||
Sirva Worldwide | ||||||
9.500%, 05/12/12 | 8 | 3 | ||||
Sirva Worldwide (Unfunded) | ||||||
0.500%, 05/12/12 | 274 | 164 | ||||
Sorenson Communication | ||||||
15.000%, 06/30/14 | 485 | 385 | ||||
Sorenson Communication, 2nd Lien | ||||||
7.234%, 02/16/14 | 225 | 209 | ||||
Sungard Data Systems | ||||||
3.900%, 02/28/16 | 423 | 396 | ||||
3.879%, 02/28/16 | 36 | 33 | ||||
Supervalu | ||||||
1.156%, 06/02/11 | 243 | 232 | ||||
1.129%, 06/02/11 | 17 | 17 | ||||
Supervalu, Ser A | ||||||
0.000%, 06/02/11 (G) | 240 | 230 | ||||
Texas Competitive Electric, Ser B-2 | ||||||
3.712%, 10/10/14 | 1,970 | 1,469 | ||||
Thomson Learning, Ser B | ||||||
2.730%, 07/05/14 | 597 | 508 | ||||
Travelport | ||||||
2.783%, 08/23/13 | 45 | 40 | ||||
Travelport , Ser B | ||||||
2.781%, 08/23/13 | 145 | 129 | ||||
Travelport, Ser B | ||||||
2.781%, 08/23/13 | 248 | 219 | ||||
Travelport, Ser C-1 | ||||||
7.783%, 08/23/13 | 160 | 160 | ||||
United Surgical Partners (Delayed Draw) | ||||||
2.250%, 04/19/14 | 83 | 76 | ||||
United Surgical Partners, Ser B | ||||||
2.314%, 04/19/14 | 365 | 331 | ||||
Univision Communications | ||||||
2.532%, 09/29/14 | 624 | 512 | ||||
Varietal | ||||||
2.743%, 06/29/14 | 340 | 297 | ||||
Verint Systems | ||||||
3.490%, 05/27/14 | 1,064 | 961 | ||||
VWR International , Ser B | ||||||
2.743%, 06/29/14 | 135 | 118 | ||||
Warner Chilcott PLC, Ser A | ||||||
5.500%, 10/30/14 | 169 | 169 | ||||
Warner Chilcott PLC, Ser B | ||||||
5.750%, 04/30/15 | 85 | 84 | ||||
Warner Chilcott PLC, Ser B2 | ||||||
5.750%, 04/30/15 | 186 | 186 | ||||
| Description | Face Amount ($ Thousands) | Market Value ($ Thousands) | ||||
Warner Chilcott PLC, Ser DD | ||||||
0.000%, 04/30/15 (G) | $ | 59 | $ | — | ||
Wide Open West Finance, 1st Lien | ||||||
2.719%, 06/30/14 | 547 | 500 | ||||
WM Bolthouse Farms, 1st Lien | ||||||
2.563%, 12/16/12 | 363 | 352 | ||||
Wm. Wrigley Jr., Ser B | ||||||
6.500%, 10/06/14 | 1,316 | 1,319 | ||||
Total Loan Participations | 43,264 | |||||
CORPORATE OBLIGATIONS — 11.1% | ||||||
Consumer Discretionary — 0.2% | ||||||
Macy’s Retail Holdings | ||||||
5.350%, 03/15/12 | 225 | 225 | ||||
Sirius XM Radio | ||||||
9.750%, 09/01/15 (A) | 90 | 93 | ||||
| 318 | ||||||
Consumer Staples — 0.3% | ||||||
Seminole Indian Tribe of Florida | ||||||
6.535%, 10/01/20 (A) | 450 | 413 | ||||
Energy — 0.1% | ||||||
Canadian Natural Resources | ||||||
5.700%, 05/15/17 | 150 | 162 | ||||
Financials — 7.4% | ||||||
Ameriprise Financial | ||||||
5.350%, 11/15/10 | 300 | 311 | ||||
Banco Santander Chile | ||||||
0.659%, 12/09/09 (A) (B) | 450 | 450 | ||||
Bank of America | ||||||
0.581%, 04/30/12 (B) | 200 | 201 | ||||
0.489%, 06/22/12 (B) | 500 | 503 | ||||
Capital One Financial MTN | ||||||
5.700%, 09/15/11 | 300 | 317 | ||||
Citibank | ||||||
0.284%, 07/12/11 (B) | 785 | 785 | ||||
Citigroup | ||||||
0.579%, 06/09/16 (B) | 300 | 248 | ||||
Citigroup Funding | ||||||
0.611%, 04/30/12 (B) | 125 | 126 | ||||
0.284%, 06/03/11 (B) | 135 | 135 | ||||
Everest Reinsurance Holdings | ||||||
8.750%, 03/15/10 | 295 | 300 | ||||
General Electric Capital | ||||||
0.371%, 04/28/11 (B) | 275 | 273 | ||||
0.292%, 12/21/12 (B) | 1,600 | 1,601 | ||||
Genworth Global Funding Trusts MTN | ||||||
5.200%, 10/08/10 | 400 | 410 | ||||
GMAC | ||||||
0.292%, 12/19/12 (B) | 350 | 350 | ||||
| 32 | SEI Institutional Investments Trust / Semi-Annual Report / November 30, 2009 |
Table of Contents
| Description | Face Amount ($ Thousands) | Market Value ($ Thousands) | ||||
Hartford Financial Services Group | ||||||
7.900%, 06/15/10 | $ | 250 | $ | 258 | ||
JPMorgan Chase | ||||||
0.529%, 06/15/12 (B) | 500 | 503 | ||||
JPMorgan Chase Capital XXI, Ser U | ||||||
1.231%, 02/02/37 (B) | 550 | 374 | ||||
Liberty Property L.P. | ||||||
7.250%, 03/15/11 ‡ | 300 | 310 | ||||
MBIA Insurance | ||||||
14.000%, 01/15/33 (A) (B) | 200 | 78 | ||||
Monumental Global Funding | ||||||
0.484%, 01/15/14 (A) (B) | 450 | 402 | ||||
Morgan Stanley | ||||||
0.554%, 02/10/12 (B) | 350 | 352 | ||||
0.500%, 03/13/12 (B) | 200 | 201 | ||||
Morgan Stanley, Ser G | ||||||
0.584%, 01/09/14 (B) | 400 | 378 | ||||
Prudential Financial MTN | ||||||
5.100%, 12/14/11 | 300 | 316 | ||||
Reinsurance Group of America | ||||||
5.625%, 03/15/17 | 300 | 300 | ||||
State Street | ||||||
0.381%, 04/30/12 (B) | 285 | 281 | ||||
State Street Bank and Trust | ||||||
0.499%, 09/15/11 (B) | 295 | 296 | ||||
Unitrin | ||||||
6.000%, 05/15/17 | 260 | 217 | ||||
4.875%, 11/01/10 | 300 | 298 | ||||
VTB 24 Capital PLC, Ser E MTN | ||||||
1.134%, 12/07/09 (B) | 200 | 200 | ||||
Wachovia | ||||||
0.419%, 03/15/11 (B) | 425 | 423 | ||||
| 11,197 | ||||||
Health Care — 0.2% | ||||||
UnitedHealth Group | ||||||
1.575%, 02/07/11 (B) | 250 | 251 | ||||
Industrials — 0.8% | ||||||
Berry Plastics | ||||||
5.034%, 02/15/15 (B) | 460 | 415 | ||||
Continental Airlines, Ser 061G | ||||||
0.698%, 06/02/13 (B) | 300 | 234 | ||||
Language Line | ||||||
11.125%, 06/15/12 | 500 | 514 | ||||
| 1,163 | ||||||
Materials — 0.7% | ||||||
NewPage | ||||||
11.375%, 12/31/14 (A) | 380 | 374 | ||||
Verso Paper Holdings LLC | ||||||
11.500%, 07/01/14 (A) | 675 | 736 | ||||
| 1,110 | ||||||
| Description | Face Amount ($ Thousands) | Market Value ($ Thousands) | ||||
Telecommunication Services — 0.6% | ||||||
Corning | ||||||
6.050%, 06/15/15 | $ | 300 | $ | 304 | ||
Telecom Italia Capital | ||||||
0.894%, 07/18/11 (B) | 300 | 297 | ||||
Vodafone Group PLC | ||||||
0.536%, 02/27/12 (B) | 300 | 299 | ||||
| 900 | ||||||
Utilities — 0.8% | ||||||
Ferrellgas Partners | ||||||
9.125%, 10/01/17 (A) | 450 | 468 | ||||
KeySpan | ||||||
7.625%, 11/15/10 | 300 | 318 | ||||
Ohio Power | ||||||
0.464%, 04/05/10 (B) | 270 | 270 | ||||
Southern, Ser A | ||||||
5.300%, 01/15/12 | 175 | 189 | ||||
| 1,245 | ||||||
Total Corporate Obligations | 16,759 | |||||
MORTGAGE-BACKED SECURITIES — 5.7% | ||||||
Agency Mortgage-Backed Obligations — 0.7% | ||||||
FNMA | ||||||
4.750%, 04/19/10 | 1,000 | 1,017 | ||||
Non-Agency Mortgage-Backed Obligations — 5.0% | ||||||
American Tower Trust, | ||||||
5.957%, 04/15/37 (A) | 250 | 250 | ||||
Banc of America Funding, Ser 2005-F, Cl 4A1 | ||||||
5.322%, 09/20/35 (B) | 440 | 314 | ||||
Banc of America Funding, | ||||||
5.528%, 05/20/36 (B) | 366 | 253 | ||||
Banc of America Large Loan, Ser 2007-BMB1, Cl A1 | ||||||
0.749%, 08/15/29 (A) (B) | 193 | 170 | ||||
Banc of America Mortgage Securities, Ser 2005-A, Cl 2A1 | ||||||
4.446%, 02/25/35 (B) | 213 | 164 | ||||
Bear Stearns Adjustable Rate Mortgage Trust, Ser 2006-1, Cl A1 | ||||||
4.625%, 02/25/36 (B) | 383 | 320 | ||||
Bear Stearns Commercial Mortgage Securities, Ser 2001-TOP2, Cl A2 | ||||||
6.480%, 02/15/35 | 500 | 517 | ||||
Citigroup Commercial Mortgage Trust, Ser 2007-FL3A, Cl J | ||||||
1.189%, 04/15/22 (A) (B) | 155 | 17 | ||||
| SEI Institutional Investments Trust / Semi-Annual Report / November 30, 2009 | 33 |
Table of Contents
SCHEDULE OF INVESTMENTS (Unaudited)
Enhanced LIBOR Opportunities Fund (Continued)
November 30, 2009
| Description | Face Amount ($ Thousands) | Market Value ($ Thousands) | ||||
Citigroup Mortgage Loan Trust, Ser 2006-AR1, Cl 1A1 | ||||||
4.900%, 10/25/35 (B) | $ | 409 | $ | 320 | ||
Credit Suisse First Boston Mortgage Securities, Ser 2000-C1, Cl A2 | ||||||
7.545%, 04/15/62 | 139 | 141 | ||||
Crown Castle Towers LLC, | ||||||
6.065%, 11/15/36 (A) | 380 | 388 | ||||
Crusade Global Trust, Ser 2007-1, Cl A1 | ||||||
0.344%, 04/19/38 (B) | 189 | 173 | ||||
First Horizon Alternative Mortgage Trust, Ser 2005-AA3, Cl 3A1 | ||||||
5.367%, 05/25/35 (B) | 225 | 180 | ||||
First Horizon Mortgage Pass-Through Certificate, Ser 2005-AR4, Cl 2A1 | ||||||
5.334%, 10/25/35 (B) | 200 | 148 | ||||
GMAC Mortgage Loan Trust, | ||||||
5.534%, 04/19/36 (B) | 399 | 284 | ||||
GS Mortgage Securities, | ||||||
1.292%, 03/06/20 (A) (B) | 75 | 60 | ||||
Harborview Mortgage Loan Trust, Ser 2005-14, Cl 3A1A | ||||||
5.317%, 12/19/35 (B) | 238 | 180 | ||||
JPMorgan Mortgage Trust, | ||||||
5.382%, 06/25/37 (B) | 361 | 226 | ||||
Master Adjustable Rate Mortgages Trust, Ser 2005-6, Cl 5A1 | ||||||
5.010%, 07/25/35 (B) | 396 | 291 | ||||
Merrill Lynch Mortgage Backed Securities Trust, Ser 2007-2, Cl 1A1 | ||||||
5.800%, 08/25/36 (B) | 408 | 281 | ||||
Merrill Lynch Mortgage Investors, Ser 2005-A1, Cl 2A1 | ||||||
3.532%, 12/25/34 (B) | 347 | 321 | ||||
Merrill Lynch Mortgage Investors, Ser 2005-A9, Cl 2A1E | ||||||
5.151%, 12/25/35 (B) | 335 | 264 | ||||
MLCC Mortgage Investors, | ||||||
5.291%, 02/25/36 (B) | 188 | 159 | ||||
Morgan Stanley Capital I, | ||||||
0.398%, 10/15/20 (A) (B) | 240 | 81 | ||||
MortgageIT Trust, Ser 2005-4, Cl A1 | ||||||
0.516%, 10/25/35 (B) | 381 | 240 | ||||
Residential Funding Mortgage Securities, Ser 2005-SA5, Cl 2A | ||||||
5.315%, 11/25/35 (B) | 149 | 111 | ||||
Residential Funding Mortgage Securities, Ser 2006-SA1, Cl 1A1 | ||||||
5.669%, 02/25/36 (B) | 131 | 92 | ||||
| Description | Face Amount ($ Thousands) | Market Value ($ Thousands) | ||||
Residential Funding Mortgage Securities, Ser 2007-SA2, Cl 2A2 | ||||||
5.651%, 04/25/37 (B) | $ | 273 | $ | 190 | ||
Washington Mutual Mortgage Pass-Through Certificate, Ser 2005-AR14, Cl 1A4 | ||||||
5.045%, 12/25/35 (B) | 390 | 292 | ||||
Washington Mutual Mortgage Pass-Through Certificate, Ser 2005-AR3, Cl A2 | ||||||
4.634%, 03/25/35 (B) | 328 | 285 | ||||
Wells Fargo Mortgage-Backed Securities Trust, Ser 2004-Z, Cl 2A1 | ||||||
4.444%, 12/25/34 (B) | 350 | 327 | ||||
Wells Fargo Mortgage-Backed Securities Trust, Ser 2005-AR16, Cl 6A3 | ||||||
5.000%, 10/25/35 (B) | 137 | 121 | ||||
Wells Fargo Mortgage-Backed Securities Trust, Ser 2005-AR16, Cl 3A2 | ||||||
4.113%, 10/25/35 (B) | 92 | 76 | ||||
Wells Fargo Mortgage-Backed Securities Trust, Ser 2006-AR2, Cl 2A3 | ||||||
5.100%, 03/25/36 (B) | 144 | 118 | ||||
Wells Fargo Mortgage-Backed Securities Trust, Ser 2006-AR8, Cl 2A1 | ||||||
5.240%, 04/25/36 (B) | 249 | 202 | ||||
| 7,556 | ||||||
Total Mortgage-Backed Securities (Cost $10,628) ($ Thousands) | 8,573 | |||||
ASSET-BACKED SECURITIES — 5.3% | ||||||
Automotive — 2.4% | ||||||
AmeriCredit Automobile Receivables Trust, Ser 2007-CM, Cl A4A | ||||||
5.550%, 04/07/14 | 500 | 520 | ||||
Americredit Prime Automobile Receivable, Ser 2007-2M, Cl A3 | ||||||
5.220%, 06/08/12 | 299 | 304 | ||||
Capital Auto Receivables Asset Trust, Ser 2007-1, Cl B | ||||||
5.150%, 09/17/12 | 230 | 237 | ||||
Capital Auto Receivables Asset Trust, Ser 2007-3, Cl A3A | ||||||
5.020%, 09/15/11 | 91 | 92 | ||||
Capital One Auto Finance Trust, Ser 2005-C, Cl A4A | ||||||
4.710%, 06/15/12 | 53 | 54 | ||||
Capital One Auto Finance Trust, Ser 2007-C, Cl A3A | ||||||
5.130%, 04/16/12 | 269 | 275 | ||||
CarMax Auto Owner Trust, Ser 2007-1, Cl C | ||||||
5.530%, 07/15/13 | 50 | 50 | ||||
| 34 | SEI Institutional Investments Trust / Semi-Annual Report / November 30, 2009 |
Table of Contents
| Description | Face Amount ($ Thousands) | Market Value ($ Thousands) | ||||
CarMax Auto Owner Trust, Ser 2008-1, Cl A4B | ||||||
1.539%, 02/15/13 (B) | $ | 485 | $ | 486 | ||
Daimler Chrysler Auto Trust, Ser 2007-A, Cl A3A | ||||||
5.000%, 02/08/12 | 275 | 280 | ||||
Ford Credit Auto Owner Trust, Ser 2007-B, Cl A3A | ||||||
5.150%, 11/15/11 | 179 | 183 | ||||
GE Dealer Floorplan Master Note Trust, Ser 2006-2, Cl C | ||||||
0.667%, 04/20/13 (B) | 120 | 93 | ||||
Harley-Davidson Motorcycle Trust, Ser 2007-1, Cl C | ||||||
5.540%, 04/15/15 | 105 | 105 | ||||
Hyundai Auto Receivables Trust, Ser 2007-A, Cl A3B | ||||||
0.639%, 01/17/12 (B) | 65 | 65 | ||||
Merrill Auto Trust Securitization, Ser 2007-1, Cl C | ||||||
5.960%, 12/15/13 | 181 | 184 | ||||
Nissan Auto Receivables Owner Trust, Ser 2007-B, Cl A3 | ||||||
5.030%, 05/16/11 | 69 | 70 | ||||
Superior Wholesale Inventory Financing Trust, Ser 2007-AE1, Cl B | ||||||
0.539%, 01/15/12 (B) | 25 | 25 | ||||
Superior Wholesale Inventory Financing Trust, Ser 2007-AE1, Cl C | ||||||
0.839%, 01/15/12 (B) | 45 | 45 | ||||
Swift Master Auto Receivables Trust, Ser 2007-2, Cl A | ||||||
0.889%, 10/15/12 (B) | 430 | 423 | ||||
USAA Auto Owner Trust, Ser 2007-2, Cl A3 | ||||||
4.900%, 02/15/12 | 98 | 100 | ||||
| 3,591 | ||||||
Credit Cards — 1.4% | ||||||
American Express Credit Account Master Trust, Ser 2007-2, Cl B | ||||||
0.419%, 09/15/16 (B) | 145 | 132 | ||||
Capital One Multi-Asset Execution Trust, Ser 2007-C2, Cl C2 | ||||||
0.539%, 11/15/14 (B) | 400 | 367 | ||||
Chase Issuance Trust, Ser 2005-C2, Cl C2 | ||||||
0.679%, 01/15/15 (B) | 400 | 379 | ||||
Citibank Credit Card Issuance Trust, Ser 2007-B5, Cl B5 | ||||||
0.862%, 11/07/14 (B) | 500 | 475 | ||||
Discover Card Master Trust, Ser 2008-A1, Cl A1 | ||||||
0.789%, 07/16/12 (B) | 210 | 210 | ||||
| Description | Face Amount ($ Thousands) | Market Value ($ Thousands) | ||||
GE Capital Credit Card Master Note Trust, Ser 2007-3, Cl C | ||||||
0.539%, 06/15/13 (B) | $ | 500 | $ | 487 | ||
| 2,050 | ||||||
Mortgage Related Securities — 0.8% | ||||||
First Franklin Mortgage Loan Asset, Ser 2006-FF18, Cl A2B | ||||||
0.346%, 12/25/37 (B) | 275 | 155 | ||||
First Franklin Mortgage Loan Asset, Ser 2007-FF1, Cl M2 | ||||||
0.496%, 01/25/38 (B) | 285 | 1 | ||||
Morgan Stanley Capital I, Ser 2007-HE2, Cl M2 | ||||||
0.504%, 01/25/37 (B) | 150 | 1 | ||||
Morgan Stanley Home Equity Loan Trust, Ser 2005-3, Cl M1 | ||||||
0.694%, 08/25/35 (B) | 350 | 269 | ||||
Morgan Stanley Home Equity Loan Trust, Ser 2005-4, Cl M1 | ||||||
0.654%, 09/25/35 (B) | 370 | 101 | ||||
Option One Mortgage Loan Trust, Ser 2005-3, Cl M1 | ||||||
0.706%, 08/25/35 (B) | 330 | 184 | ||||
Option One Mortgage Loan Trust, Ser 2005-5, Cl M1 | ||||||
0.634%, 12/25/35 (B) | 470 | 157 | ||||
Option One Mortgage Loan Trust, Ser 2007-FXD2, Cl 2A1 | ||||||
5.900%, 03/25/37 (C) | 137 | 132 | ||||
Option One Mortgage Loan Trust, Ser 2007-HL1, Cl 2A1 | ||||||
0.356%, 02/25/38 (B) | 113 | 100 | ||||
Residential Asset Securities, | ||||||
0.684%, 01/25/36 (B) | 375 | 133 | ||||
Securitized Asset-Backed Receivables LLC, Ser 2007-NC2, Cl M2 | ||||||
0.504%, 01/25/37 (B) | 145 | 1 | ||||
| 1,234 | ||||||
Other Asset-Backed Securities — 0.7% | ||||||
ACAS Business Loan Trust , Ser 2006-1A, Cl A | ||||||
0.486%, 11/27/19 (A) (B) | 359 | 289 | ||||
ACAS Business Loan Trust, Ser 2007-1A, Cl C | ||||||
1.123%, 08/16/19 (A) (B) | 425 | 115 | ||||
Dominos Pizza Master Issuer LLC, Ser 2007-1, Cl A2 | ||||||
5.261%, 04/25/37 (A) | 400 | 343 | ||||
Lambda Finance, Ser 2005-1A, Cl A3 | ||||||
0.502%, 11/15/29 (A) (B) | 197 | 186 | ||||
| SEI Institutional Investments Trust / Semi-Annual Report / November 30, 2009 | 35 |
Table of Contents
SCHEDULE OF INVESTMENTS (Unaudited)
Enhanced LIBOR Opportunities Fund (Concluded)
November 30, 2009
| Description | Face Amount ($ Thousands)/Shares | Market Value ($ Thousands) | ||||
Sierra Receivables Funding, Ser 2007-2A, Cl A2 | ||||||
1.237%, 09/20/19 (A) (B) | $ | 196 | $ | 165 | ||
| 1,098 | ||||||
Total Asset-Backed Securities (Cost $10,310) ($ Thousands) | 7,973 | |||||
U.S. TREASURY OBLIGATION — 2.9% | ||||||
U.S. Treasury Inflation Protection Securities | ||||||
0.875%, 04/15/10 | 3,810 | 4,356 | ||||
Total U.S. Treasury Obligation (Cost $4,347) ($ Thousands) | 4,356 | |||||
U.S. GOVERNMENT AGENCY OBLIGATIONS — 2.2% | ||||||
FHLB | ||||||
1.020%, 02/26/10 | 800 | 801 | ||||
1.375%, 05/16/11 | 1,500 | 1,519 | ||||
FNMA | ||||||
3.000%, 07/12/10 | 1,000 | 1,016 | ||||
Total U.S. Government Agency Obligations (Cost $3,313) ($ Thousands) | 3,336 | |||||
AFFILIATED PARTNERSHIP — 41.8% | ||||||
SEI LIBOR Plus Portfolio† | 9,799,008 | 63,106 | ||||
Total Affiliated Partnership (Cost $94,924) ($ Thousands) | 63,106 | |||||
CASH EQUIVALENT — 3.2% | ||||||
SEI Daily Income Trust, Prime Obligation Fund, Cl A 0.130%*† | 4,833,572 | 4,834 | ||||
Total Cash Equivalent (Cost $4,834) ($ Thousands) | 4,834 | |||||
REPURCHASE AGREEMENT (E) — 2.7% | ||||||
Bank of America 0.170%, dated 11/30/09, to be repurchased on 12/01/09, repurchase price $4,000,019 (collateralized by U.S. Government obligations, ranging in par value $1,528,107-$4,039,358, 5.000%-5.500%, 12/01/35- 10/01/39; with total market value $4,080,001) | 4,000 | 4,000 | ||||
Total Repurchase Agreement (Cost $4,000) ($ Thousands) | 4,000 | |||||
Total Investments — 103.6% (Cost $196,300)($ Thousands) | $ | 156,201 | ||||
A summary of the open futures contracts held by the Fund at November 30, 2009, is as follows:
| Type of Contract | Number of Contracts (Short) | Expiration Date | Unrealized Depreciation ($ Thousands) | ||||||
U.S. 10-Year Treasury Note | (4 | ) | Mar-2010 | $ | (1 | ) | |||
U.S. 2-Year Treasury Note | (39 | ) | Apr-2010 | (15 | ) | ||||
U.S. 5-Year Treasury Note | (16 | ) | Apr-2010 | (7 | ) | ||||
U.S. Long Treasury Bond | (3 | ) | Mar-2010 | (2 | ) | ||||
| $ | (25 | ) | |||||||
For the year ended November 30, 2009, the total amount of all open futures contracts, as presented in the table above, are representative of the volume of activity for this derivative type during the period.
Percentages are based on a Net Assets of $150,787 ($ Thousands)
| * | Rate shown is the 7-day effective yield as of November 30, 2009. |
| † | Investment in Affiliated Security (See Note 5). |
| ‡ | Real Estate Investment Trust |
| (A) | Securities sold within terms of a private placement memorandum, exempt from registration under Section 144A of the Securities Act of 1933, as amended, and may be sold only to dealers in that program or other “accredited investors.” These securities have been determined to be liquid under guidelines established by the board of Trustees. |
| (B) | Variable Rate Security — The rate reported is the rate in effect as of November 30, 2009. The date reported is the final maturity date. |
| (C) | Step Bonds — The rate reported is the effective yield as of November 30, 2009. The coupon on a step bond changes on a specific date. |
| (D) | Security in default on interest payments. |
| (E) | Tri-Party Repurchase Agreement. |
| (F) | Securities considered illiquid and restricted. The total value of such securities as of November 30, 2009 was $0 ($ Thousands) and represented 0.0% of net assets. |
| (G) | Unsettled Loan Participation. Interest rate not available. |
Cl — Class
FHLB — Federal Home Loan Bank
FNMA — Federal National Mortgage Association
LLC — Limited Liability Company
LIBOR — London Interbank Offered Rate
MTN — Medium Term Note
PLC — Public Limited Company
Ser — Series
Amounts designated as “—” are $O or have been rounded to $O.
The following is a summary of the inputs used as of November 30, 2009 in valuing the Fund’s investments carried at value ($ Thousands):
| Investments in Securities | Level 1 | Level 2 | Level 3 | Total | ||||||||
Loan Participations | $ | — | $ | 43,264 | $ | — | $ | 43,264 | ||||
Corporate Obligations | — | 16,759 | — | 16,759 | ||||||||
Mortgage-Backed Securities | — | 8,573 | — | 8,573 | ||||||||
Asset-Backed Securities | — | 7,973 | — | 7,973 | ||||||||
U.S. Treasury Obligation | — | 4,356 | — | 4,356 | ||||||||
U.S. Government Agency Obligations | — | 3,336 | — | 3,336 | ||||||||
Cash Equivalent | 4,834 | — | — | 4,834 | ||||||||
Repurchase Agreement | — | 4,000 | — | 4,000 | ||||||||
Affiliated Partnership | — | 63,106 | — | 63,106 | ||||||||
Total Investments in Securities | $ | 4,834 | $ | 151,367 | $ | — | $ | 156,201 | ||||
| Other Financial Instruments | Level 1 | Level 2 | Level 3 | Total | ||||||||||
Futures Contracts* | $ | (25 | ) | $ | — | $ | — | $ | (25 | ) | ||||
Total Other Financial Instruments | $ | (25 | ) | $ | — | $ | — | $ | (25 | ) | ||||
| 36 | SEI Institutional Investments Trust / Semi-Annual Report / November 30, 2009 |
Table of Contents
The following is a reconciliation of investments in which significant unobservable inputs (Level 3) were used in determining value ($ Thousands):
| Investments in Loan Participations | Investments in Common Stock | |||||||
Beginning balance as of June 1, 2009 | $ | — | $ | 88 | ||||
Accrued discounts/premiums | (2 | ) | — | |||||
Realized gain/(loss) | (24 | ) | 22 | |||||
Change in unrealized appreciation/(depreciation) | 2 | (88 | ) | |||||
Net purchases/sales | 24 | (22 | ) | |||||
Net transfer in and/or out of Level 3 | — | — | ||||||
Ending balance as of November 30, 2009 | $ | — | $ | — | ||||
Changes in unrealized gains/(losses) included in earnings related to securities still held at reporting date. | $ | — | $ | — | ||||
| * | Futures contracts are valued at the unrealized appreciation on the instrument. |
For more information on valuation inputs, see Note 2 — Significant Accounting Policies in Notes to Financial Statements.
The accompanying notes are an integral part of the financial statements.
| SEI Institutional Investments Trust / Semi-Annual Report / November 30, 2009 | 37 |
Table of Contents
SCHEDULE OF INVESTMENTS (Unaudited)
Core Fixed Income Fund
November 30, 2009
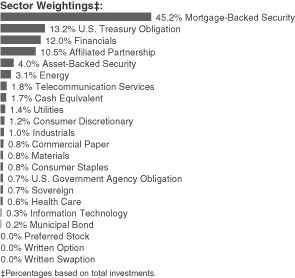
| Description | Face Amount ($ Thousands) | Market Value ($ Thousands) | ||||
MORTGAGE-BACKED SECURITIES — 51.2% | ||||||
Agency Mortgage-Backed Obligations — 35.3% | ||||||
FHLMC | ||||||
11.000%, 02/17/21 | $ | 2,532 | $ | 2,806 | ||
10.000%, 03/17/26 to 10/01/30 | 4,340 | 5,012 | ||||
7.500%, 08/01/30 to 09/01/38 | 2,853 | 3,202 | ||||
7.000%, 11/01/15 to 09/01/25 | 192 | 214 | ||||
6.500%, 06/01/17 to 09/01/38 | 39,827 | 43,178 | ||||
6.000%, 10/01/19 to 08/01/38 | 41,832 | 45,060 | ||||
5.500%, 12/01/13 to 01/01/38 | 197,059 | 210,695 | ||||
5.000%, 04/18/17 to 06/01/36 | 44,820 | 47,890 | ||||
4.000%, 10/01/33 | 1,767 | 1,777 | ||||
FHLMC ARM (A) | ||||||
6.713%, 08/01/36 | 3,564 | 3,787 | ||||
6.696%, 07/01/36 | 1,870 | 1,987 | ||||
6.679%, 08/01/36 | 1,693 | 1,810 | ||||
6.599%, 11/01/37 | 1,169 | 1,245 | ||||
6.572%, 12/01/36 | 2,199 | 2,343 | ||||
6.515%, 10/01/36 | 799 | 854 | ||||
6.488%, 02/01/37 | 1,700 | 1,809 | ||||
6.424%, 09/01/36 | 14,081 | 15,006 | ||||
6.357%, 12/01/36 | 3,222 | 3,429 | ||||
6.303%, 10/01/36 | 4,360 | 4,631 | ||||
6.262%, 02/01/37 | 3,655 | 3,888 | ||||
6.250%, 09/01/36 | 1,314 | 1,394 | ||||
6.238%, 03/01/37 | 1,487 | 1,575 | ||||
6.202%, 05/01/37 | 2,336 | 2,492 | ||||
6.173%, 12/01/36 | 1,887 | 2,008 | ||||
6.165%, 12/01/36 | 1,178 | 1,246 | ||||
6.137%, 09/01/36 | 654 | 695 | ||||
6.133%, 01/01/37 | 6,178 | 6,578 | ||||
6.129%, 04/01/37 | 455 | 487 | ||||
6.078%, 09/01/36 | 2,016 | 2,136 | ||||
| Description | Face Amount ($ Thousands) | Market Value ($ Thousands) | ||||
6.054%, 10/01/37 | $ | 3,251 | $ | 3,442 | ||
6.047%, 11/01/36 | 1,263 | 1,339 | ||||
6.039%, 12/01/36 | 3,295 | 3,496 | ||||
6.024%, 04/01/37 | 663 | 705 | ||||
5.998%, 01/01/37 | 2,447 | 2,612 | ||||
5.994%, 04/01/37 | 4,881 | 5,192 | ||||
5.990%, 02/01/37 | 1,220 | 1,297 | ||||
5.985%, 03/01/37 | 3,153 | 3,351 | ||||
5.978%, 10/01/36 | 1,818 | 1,906 | ||||
5.977%, 05/01/37 to 11/01/37 | 904 | 965 | ||||
5.973%, 05/01/37 | 809 | 863 | ||||
5.965%, 01/01/37 | 473 | 504 | ||||
5.956%, 11/01/36 to 03/01/38 | 8,017 | 8,531 | ||||
5.949%, 06/01/37 | 1,507 | 1,607 | ||||
5.918%, 07/01/37 | 996 | 1,061 | ||||
5.910%, 03/01/37 | 497 | 529 | ||||
5.885%, 05/01/37 | 605 | 643 | ||||
5.872%, 05/01/37 | 9,681 | 10,334 | ||||
5.869%, 05/01/36 | 1,572 | 1,659 | ||||
5.863%, 09/01/38 | 3,080 | 3,299 | ||||
5.847%, 05/01/37 | 3,946 | 4,194 | ||||
5.824%, 04/01/37 | 3,168 | 3,379 | ||||
5.813%, 05/01/37 | 1,373 | 1,453 | ||||
5.812%, 06/01/37 | 1,685 | 1,793 | ||||
5.808%, 11/01/38 | 3,131 | 3,335 | ||||
5.749%, 04/01/38 | 829 | 878 | ||||
5.730%, 02/01/37 | 1,384 | 1,471 | ||||
5.727%, 04/01/37 | 1,219 | 1,294 | ||||
5.700%, 03/01/36 | 1,103 | 1,170 | ||||
5.692%, 03/01/36 | 2,128 | 2,255 | ||||
5.653%, 10/01/38 | 965 | 1,022 | ||||
5.628%, 05/01/37 | 1,058 | 1,121 | ||||
5.617%, 07/01/38 | 4,711 | 5,001 | ||||
5.566%, 05/01/36 | 1,104 | 1,164 | ||||
5.543%, 05/01/36 | 2,544 | 2,680 | ||||
5.539%, 08/01/37 | 4,522 | 4,786 | ||||
5.421%, 05/01/38 | 1,879 | 1,986 | ||||
5.107%, 01/01/36 | 4,740 | 4,984 | ||||
FHLMC CMO, Ser 1, Cl Z | ||||||
9.300%, 04/15/19 | 28 | 31 | ||||
FHLMC CMO, Ser 1142, Cl IA | ||||||
7.000%, 10/15/21 | 416 | 449 | ||||
FHLMC CMO, Ser 1611, Cl Z | ||||||
6.500%, 11/15/23 | 11,718 | 12,641 | ||||
FHLMC CMO, Ser 1983, Cl Z | ||||||
6.500%, 12/15/23 | 1,321 | 1,425 | ||||
FHLMC CMO, Ser 2043, Cl CJ | ||||||
6.500%, 04/15/28 | 1,788 | 1,903 | ||||
FHLMC CMO, Ser 2075, Cl D | ||||||
6.500%, 08/15/28 | 1,972 | 2,130 | ||||
FHLMC CMO, Ser 2138, Cl KS, IO | ||||||
7.461%, 02/15/29 (A) | 2,367 | 230 | ||||
FHLMC CMO, Ser 2293, Cl ZA | ||||||
6.000%, 03/15/31 | 2,212 | 2,396 | ||||
| 38 | SEI Institutional Investments Trust / Semi-Annual Report / November 30, 2009 |
Table of Contents
| Description | Face Amount ($ Thousands) | Market Value ($ Thousands) | ||||
FHLMC CMO, Ser 2312, Cl Z | ||||||
6.500%, 05/15/31 | $ | 1,336 | $ | 1,441 | ||
FHLMC CMO, Ser 2357, Cl ZJ | ||||||
6.500%, 09/15/31 | 368 | 403 | ||||
FHLMC CMO, Ser 2389, Cl CD | ||||||
6.000%, 03/15/16 | 180 | 180 | ||||
FHLMC CMO, Ser 2434, Cl ZA | ||||||
6.500%, 04/15/32 | 3,556 | 3,891 | ||||
FHLMC CMO, Ser 2456, Cl CJ | ||||||
6.500%, 06/15/32 | 1,128 | 1,237 | ||||
FHLMC CMO, Ser 2458, Cl ZM | ||||||
6.500%, 06/15/32 | 1,880 | 2,071 | ||||
FHLMC CMO, Ser 2542, Cl ES | ||||||
5.000%, 12/15/17 | 1,000 | 1,070 | ||||
FHLMC CMO, Ser 2558, Cl BD | ||||||
5.000%, 01/15/18 | 4,137 | 4,457 | ||||
FHLMC CMO, Ser 2590, Cl BY | ||||||
5.000%, 03/15/18 | 1,346 | 1,450 | ||||
FHLMC CMO, Ser 2590, Cl NU | ||||||
5.000%, 06/15/17 | 1,000 | 1,049 | ||||
FHLMC CMO, Ser 2631, Cl SA | ||||||
14.412%, 06/15/33 (A) | 1,032 | 1,166 | ||||
FHLMC CMO, Ser 2631, Cl MC | ||||||
5.000%, 02/15/32 | 484 | 511 | ||||
FHLMC CMO, Ser 2671, Cl S | ||||||
14.321%, 09/15/33 (A) | 941 | 1,057 | ||||
FHLMC CMO, Ser 2676, Cl CY | ||||||
4.000%, 09/15/18 | 2,291 | 2,389 | ||||
FHLMC CMO, Ser 2684, Cl SN | ||||||
27.056%, 10/15/33 (A) | 200 | 235 | ||||
FHLMC CMO, Ser 2690, Cl SJ | ||||||
8.792%, 10/15/33 (A) | 714 | 675 | ||||
FHLMC CMO, Ser 2690, Cl TV | ||||||
4.500%, 11/15/25 | 1,800 | 1,878 | ||||
FHLMC CMO, Ser 2698, Cl SV | ||||||
8.642%, 11/15/33 (A) | 410 | 386 | ||||
FHLMC CMO, Ser 2727, Cl PW | ||||||
3.570%, 06/15/29 | 558 | 570 | ||||
FHLMC CMO, Ser 2733, Cl ME | ||||||
5.000%, 01/15/34 | 6,302 | 6,604 | ||||
FHLMC CMO, Ser 2765, Cl CT | ||||||
4.000%, 03/15/19 | 1,557 | 1,606 | ||||
FHLMC CMO, Ser 2778, Cl JD | ||||||
5.000%, 12/15/32 | 1,974 | 2,102 | ||||
FHLMC CMO, Ser 2790, Cl TN | ||||||
4.000%, 05/15/24 | 2,779 | 2,837 | ||||
FHLMC CMO, Ser 2827, Cl CS | ||||||
15.843%, 04/15/32 (A) | 150 | 154 | ||||
FHLMC CMO, Ser 2833, Cl KO, PO | ||||||
0.000%, 08/15/34 | 381 | 328 | ||||
FHLMC CMO, Ser 2843, Cl BC | ||||||
5.000%, 08/15/19 | 1,740 | 1,871 | ||||
FHLMC CMO, Ser 2864, Cl NB | ||||||
5.500%, 07/15/33 | 2,000 | 2,169 | ||||
| Description | Face Amount ($ Thousands) | Market Value ($ Thousands) | ||||
FHLMC CMO, Ser 2865, Cl GO, PO | ||||||
0.000%, 10/15/33 | $ | 567 | $ | 478 | ||
FHLMC CMO, Ser 2875, Cl HB | ||||||
4.000%, 10/15/19 | 954 | 977 | ||||
FHLMC CMO, Ser 2934, Cl CI | ||||||
5.000%, 01/15/34 | 9,978 | 10,628 | ||||
FHLMC CMO, Ser 2945, Cl SA | ||||||
11.864%, 03/15/20 (A) | 3,676 | 4,139 | ||||
FHLMC CMO, Ser 2950, Cl JO, PO | ||||||
0.000%, 03/15/20 | 579 | 546 | ||||
FHLMC CMO, Ser 2968, Cl FC | ||||||
1.235%, 12/15/34 (A) | 418 | 415 | ||||
FHLMC CMO, Ser 2981, Cl FA | ||||||
0.639%, 05/15/35 (A) | 1,061 | 1,030 | ||||
FHLMC CMO, Ser 2985, Cl JR | ||||||
4.500%, 06/15/25 | 4,161 | 4,337 | ||||
FHLMC CMO, Ser 2990, Cl LK | ||||||
0.609%, 10/15/34 (A) | 955 | 947 | ||||
FHLMC CMO, Ser 3001, Cl HP | ||||||
21.045%, 05/15/35 (A) | 153 | 175 | ||||
FHLMC CMO, Ser 3006, Cl QS | ||||||
19.504%, 07/15/35 (A) | 965 | 1,089 | ||||
FHLMC CMO, Ser 3012, Cl GK | ||||||
23.676%, 06/15/35 (A) | 148 | 172 | ||||
FHLMC CMO, Ser 3028, Cl PG | ||||||
5.500%, 09/15/35 | 270 | 293 | ||||
FHLMC CMO, Ser 3035, Cl PA | ||||||
5.500%, 09/15/35 | 1,095 | 1,191 | ||||
FHLMC CMO, Ser 3047, Cl YT | ||||||
0.000%, 09/15/34 (A) | 294 | 288 | ||||
FHLMC CMO, Ser 3049, Cl XF | ||||||
0.589%, 05/15/33 (A) | 1,179 | 1,151 | ||||
FHLMC CMO, Ser 3052, Cl MH | ||||||
5.250%, 10/15/34 | 3,275 | 3,478 | ||||
FHLMC CMO, Ser 3076, Cl MP | ||||||
0.094%, 10/15/30 (E) | 157 | 157 | ||||
FHLMC CMO, Ser 3167, Cl QA | ||||||
6.000%, 10/15/26 | 311 | 313 | ||||
FHLMC CMO, Ser 3195, Cl PD | ||||||
6.500%, 07/15/36 | 2,500 | 2,790 | ||||
FHLMC CMO, Ser 3202, Cl HI, IO | ||||||
6.411%, 08/15/36 (A) | 1,450 | 155 | ||||
FHLMC CMO, Ser 3217, Cl CX, IO | ||||||
6.351%, 09/15/36 (A) | 1,368 | 128 | ||||
FHLMC CMO, Ser 3234, Cl MC | ||||||
4.500%, 10/15/36 | 166 | 165 | ||||
FHLMC CMO, Ser 3263, Cl WE | ||||||
0.457%, 08/15/35 (A) | 183 | 176 | ||||
FHLMC CMO, Ser 3273, Cl TH | ||||||
7.500%, 08/15/35 (A) | 215 | 215 | ||||
FHLMC CMO, Ser 3289, Cl PC | ||||||
5.000%, 12/15/32 | 3,362 | 3,537 | ||||
FHLMC CMO, Ser 3312, Cl BP | ||||||
5.500%, 01/15/31 | 300 | 314 | ||||
| SEI Institutional Investments Trust / Semi-Annual Report / November 30, 2009 | 39 |
Table of Contents
SCHEDULE OF INVESTMENTS (Unaudited)
Core Fixed Income Fund (Continued)
November 30, 2009
| Description | Face Amount ($ Thousands) | Market Value ($ Thousands) | ||||
FHLMC CMO, Ser 3372, Cl BD | ||||||
4.500%, 10/15/22 | $ | 2,533 | $ | 2,670 | ||
FHLMC CMO, Ser 3383, Cl SA, IO | ||||||
6.211%, 11/15/37 (A) | 1,769 | 156 | ||||
FHLMC CMO, Ser 3387, Cl SA, IO | ||||||
6.181%, 11/15/37 (A) | 1,431 | 144 | ||||
FHLMC CMO, Ser 3437, Cl AI, IO | ||||||
1.335%, 09/15/11 | 4,544 | 49 | ||||
FHLMC CMO, Ser 3455, Cl SE, IO | ||||||
5.961%, 06/15/38 (A) | 5,678 | 574 | ||||
FHLMC CMO, Ser 3465, Cl HA | ||||||
4.000%, 07/15/17 | 5,263 | 5,496 | ||||
FHLMC CMO, Ser 3546, Cl A | ||||||
6.116%, 02/15/39 (A) | 1,079 | 1,137 | ||||
FHLMC CMO, Ser T-41, Cl 2A | ||||||
6.976%, 07/25/32 (A) | 917 | 1,017 | ||||
FHLMC CMO, Ser T-42, Cl A5 | ||||||
7.500%, 02/25/42 | 1,261 | 1,420 | ||||
FHLMC CMO, Ser T-54, Cl 3A | ||||||
7.000%, 02/25/43 | 847 | 940 | ||||
FHLMC CMO, Ser T-57, Cl 1A1 | ||||||
6.500%, 07/25/43 | 803 | 878 | ||||
FHLMC CMO, Ser T-58, Cl 4A | ||||||
7.500%, 09/25/43 | 1,036 | 1,174 | ||||
FHLMC CMO, Ser T-60, Cl 1A2 | ||||||
7.000%, 03/25/44 | 766 | 851 | ||||
FHLMC-GNMA CMO, Cl L | ||||||
6.250%, 10/25/23 | 1,021 | 1,112 | ||||
FNMA TBA | ||||||
6.500%, 01/01/38 | 13,500 | 14,544 | ||||
6.000%, 01/01/38 | 5,000 | 5,347 | ||||
5.000%, 12/01/22 to 12/01/37 | 5,800 | 6,147 | ||||
4.500%, 12/01/18 to 12/25/39 | 99,760 | 102,440 | ||||
FNMA | ||||||
8.000%, 04/01/15 to 11/01/37 | 3,970 | 4,371 | ||||
7.500%, 06/01/30 to 11/01/38 | 5,777 | 6,430 | ||||
7.000%, 12/01/15 to 06/01/35 | 10,842 | 11,999 | ||||
6.500%, 05/01/17 to 12/01/37 | 63,646 | 69,016 | ||||
6.000%, 03/01/19 to 11/01/38 | 169,382 | 182,369 | ||||
5.500%, 04/01/14 to 08/01/37 | 219,157 | 235,430 | ||||
5.000%, 02/01/20 to 11/01/36 | 132,875 | 140,154 | ||||
4.500%, 07/01/20 to 04/01/38 | 38,621 | 40,207 | ||||
4.000%, 04/01/19 to 11/01/20 | 3,949 | 4,074 | ||||
FNMA ARM (A) | ||||||
6.657%, 01/01/37 | 2,227 | 2,367 | ||||
6.594%, 09/01/36 | 1,078 | 1,142 | ||||
6.346%, 09/01/36 | 1,024 | 1,090 | ||||
6.286%, 09/01/37 | 1,338 | 1,422 | ||||
6.277%, 09/01/37 | 5,604 | 5,968 | ||||
6.272%, 10/01/36 | 961 | 1,025 | ||||
6.261%, 07/01/37 | 1,014 | 1,084 | ||||
6.233%, 10/01/36 | 2,006 | 2,128 | ||||
6.231%, 02/01/37 | 1,531 | 1,629 | ||||
6.217%, 09/01/37 | 76 | 81 | ||||
| Description | Face Amount ($ Thousands) | Market Value ($ Thousands) | ||||
6.212%, 06/01/36 | $ | 2,575 | $ | 2,736 | ||
6.203%, 11/01/37 | 2,812 | 2,984 | ||||
6.200%, 08/01/36 | 853 | 910 | ||||
6.166%, 09/01/36 | 2,485 | 2,635 | ||||
6.123%, 09/01/37 | 1,868 | 1,994 | ||||
6.109%, 11/01/37 | 724 | 774 | ||||
6.106%, 12/01/36 | 1,288 | 1,378 | ||||
6.085%, 08/01/36 | 1,285 | 1,364 | ||||
6.040%, 05/01/36 | 1,047 | 1,109 | ||||
6.020%, 09/01/37 | 1,910 | 2,034 | ||||
6.019%, 10/01/37 | 1,930 | 2,060 | ||||
6.015%, 07/01/37 | 2,277 | 2,417 | ||||
6.013%, 01/01/37 | 1,538 | 1,641 | ||||
5.981%, 04/01/37 | 1,571 | 1,674 | ||||
5.963%, 01/01/37 | 2,125 | 2,267 | ||||
5.937%, 07/01/36 | 2,325 | 2,471 | ||||
5.925%, 03/01/37 | 1,041 | 1,109 | ||||
5.924%, 01/01/37 | 1,911 | 2,038 | ||||
5.918%, 06/01/36 to 10/01/36 | 2,003 | 2,118 | ||||
5.900%, 11/01/36 to 12/01/36 | 6,005 | 6,371 | ||||
5.884%, 02/01/37 | 1,380 | 1,471 | ||||
5.874%, 10/01/36 | 4,087 | 4,328 | ||||
5.855%, 04/01/37 | 2,643 | 2,812 | ||||
5.837%, 08/01/37 | 2,744 | 2,919 | ||||
5.761%, 03/01/37 | 12,524 | 13,321 | ||||
5.754%, 02/01/37 | 2,042 | 2,170 | ||||
5.745%, 05/01/37 | 117 | 125 | ||||
5.686%, 01/01/23 | 1,174 | 1,254 | ||||
5.675%, 05/01/37 | 5,138 | 5,448 | ||||
5.668%, 05/01/37 | 803 | 853 | ||||
5.663%, 11/01/36 | 1,361 | 1,437 | ||||
5.628%, 02/01/36 | 8,662 | 9,188 | ||||
5.607%, 11/01/37 | 1,106 | 1,164 | ||||
5.604%, 02/01/38 | 2,062 | 2,193 | ||||
5.586%, 06/01/36 to 05/01/37 | 4,240 | 4,484 | ||||
5.521%, 10/01/36 | 3,477 | 3,671 | ||||
5.499%, 07/01/37 | 955 | 1,011 | ||||
2.782%, 11/01/35 | 1,898 | 1,913 | ||||
2.767%, 11/01/35 | 1,750 | 1,764 | ||||
2.763%, 11/01/35 | 1,828 | 1,843 | ||||
2.753%, 11/01/35 | 1,889 | 1,904 | ||||
2.749%, 11/01/35 | 1,897 | 1,912 | ||||
FNMA CMO, Cl A3 | ||||||
4.001%, 01/25/19 | 4,134 | 4,188 | ||||
FNMA CMO, Ser 1991-113, Cl ZE | ||||||
7.500%, 09/25/21 | 376 | 414 | ||||
FNMA CMO, Ser 1992-143, Cl M | ||||||
8.000%, 09/25/22 | 982 | 1,091 | ||||
FNMA CMO, Ser 1992-69, Cl Z | ||||||
8.000%, 05/25/22 | 853 | 947 | ||||
FNMA CMO, Ser 1992-96, Cl B, PO | ||||||
0.000%, 05/25/22 | 1 | 1 | ||||
FNMA CMO, Ser 1993-149, Cl SH | ||||||
11.500%, 08/25/23 (A) | 384 | 436 | ||||
| 40 | SEI Institutional Investments Trust / Semi-Annual Report / November 30, 2009 |
Table of Contents
| Description | Face Amount ($ Thousands) | Market Value ($ Thousands) | ||||
FNMA CMO, Ser 1993-75, Cl ZQ | ||||||
6.500%, 05/25/23 | $ | 1,601 | $ | 1,729 | ||
FNMA CMO, Ser 1993-99, Cl Z | ||||||
7.000%, 07/25/23 | 2,099 | 2,305 | ||||
FNMA CMO, Ser 1994-31, Cl ZC | ||||||
6.500%, 02/25/24 | 1,373 | 1,500 | ||||
FNMA CMO, Ser 1994-63, Cl PK | ||||||
7.000%, 04/25/24 | 1,238 | 1,382 | ||||
FNMA CMO, Ser 1997-32, Cl PG | ||||||
6.500%, 04/25/27 | 927 | 1,004 | ||||
FNMA CMO, Ser 1999-11, Cl Z | ||||||
5.500%, 03/25/29 | 2,480 | 2,652 | ||||
FNMA CMO, Ser 2001-50, Cl BA | ||||||
7.000%, 10/25/41 | 1,060 | 1,170 | ||||
FNMA CMO, Ser 2001-71, Cl QE | ||||||
6.000%, 12/25/16 | 1,877 | 2,030 | ||||
FNMA CMO, Ser 2001-79, Cl BA | ||||||
7.000%, 03/25/45 | 746 | 823 | ||||
FNMA CMO, Ser 2001-81, Cl HE | ||||||
6.500%, 01/25/32 | 15,874 | 17,306 | ||||
FNMA CMO, Ser 2002-10, Cl SB | ||||||
18.634%, 03/25/17 (A) | 217 | 263 | ||||
FNMA CMO, Ser 2002-90, Cl A1 | ||||||
6.500%, 06/25/42 | 909 | 993 | ||||
FNMA CMO, Ser 2002-94, Cl HQ | ||||||
4.500%, 01/25/18 | 2,379 | 2,530 | ||||
FNMA CMO, Ser 2003-108, Cl BE | ||||||
4.000%, 11/25/18 | 230 | 239 | ||||
FNMA CMO, Ser 2003-125, Cl AY | ||||||
4.000%, 12/25/18 | 660 | 684 | ||||
FNMA CMO, Ser 2003-131, Cl SK | ||||||
15.728%, 01/25/34 (A) | 1,090 | 1,252 | ||||
FNMA CMO, Ser 2003-24, Cl MV | ||||||
5.500%, 02/25/14 | 1,366 | 1,471 | ||||
FNMA CMO, Ser 2003-3, Cl HJ | ||||||
5.000%, 02/25/18 | 1,000 | 1,072 | ||||
FNMA CMO, Ser 2003-30, Cl HS, IO | ||||||
7.414%, 07/25/17 (A) | 1,954 | 128 | ||||
FNMA CMO, Ser 2003-35, Cl EA, PO | ||||||
0.000%, 05/25/33 | 761 | 627 | ||||
FNMA CMO, Ser 2003-49, Cl YD | ||||||
5.500%, 06/25/23 | 1,356 | 1,472 | ||||
FNMA CMO, Ser 2003-50, Cl QJ | ||||||
5.000%, 08/25/28 | 379 | 384 | ||||
FNMA CMO, Ser 2003-91, Cl XT | ||||||
4.500%, 12/25/17 | 1,533 | 1,567 | ||||
FNMA CMO, Ser 2004-101, Cl HD | ||||||
5.000%, 01/25/20 | 2,500 | 2,686 | ||||
FNMA CMO, Ser 2004-52, Cl PX, PO | ||||||
0.000%, 09/25/32 | 461 | 445 | ||||
FNMA CMO, Ser 2004-60, Cl PA | ||||||
5.500%, 04/25/34 | 1,475 | 1,575 | ||||
| Description | Face Amount ($ Thousands) | Market Value ($ Thousands) | ||||
FNMA CMO, Ser 2004-61, Cl CO, PO | ||||||
0.000%, 10/25/31 | $ | 536 | $ | 524 | ||
FNMA CMO, Ser 2005-106, Cl US | ||||||
23.702%, 11/25/35 (A) | 1,453 | 2,039 | ||||
FNMA CMO, Ser 2005-14, Cl BA | ||||||
4.500%, 04/25/19 | 2,118 | 2,217 | ||||
FNMA CMO, Ser 2005-16, Cl PE | ||||||
5.000%, 03/25/34 | 5,423 | 5,772 | ||||
FNMA CMO, Ser 2005-58, Cl MA | ||||||
5.500%, 07/25/35 | 874 | 951 | ||||
FNMA CMO, Ser 2005-72, Cl SB | ||||||
16.285%, 08/25/35 (A) | 954 | 1,108 | ||||
FNMA CMO, Ser 2005-74, Cl CS | ||||||
19.371%, 05/25/35 (A) | 751 | 889 | ||||
FNMA CMO, Ser 2005-88, Cl QO, PO | ||||||
0.000%, 11/25/33 | 544 | 489 | ||||
FNMA CMO, Ser 2005-96, Cl BP | ||||||
5.900%, 02/25/15 | 927 | 951 | ||||
FNMA CMO, Ser 2006-118, Cl A2 | ||||||
0.296%, 12/25/36 (A) | 2,305 | 2,204 | ||||
FNMA CMO, Ser 2006-23, Cl FK | ||||||
0.486%, 04/25/36 (A) | 673 | 658 | ||||
FNMA CMO, Ser 2006-3, Cl D0, PO | ||||||
0.000%, 03/25/36 | 1,016 | 918 | ||||
FNMA CMO, Ser 2006-33, Cl LS | ||||||
29.088%, 05/25/36 (A) | 599 | 806 | ||||
FNMA CMO, Ser 2006-44, Cl P, PO | ||||||
0.000%, 12/25/33 | 496 | 426 | ||||
FNMA CMO, Ser 2006-44, Cl FP | ||||||
0.636%, 06/25/36 (A) | 1,058 | 1,052 | ||||
FNMA CMO, Ser 2006-46, Cl SW | ||||||
23.334%, 06/25/36 (A) | 674 | 893 | ||||
FNMA CMO, Ser 2006-60, Cl UO, PO | ||||||
0.000%, 07/25/36 | 1,424 | 1,298 | ||||
FNMA CMO, Ser 2006-75, Cl VD | ||||||
6.500%, 05/25/17 | 1,518 | 1,634 | ||||
FNMA CMO, Ser 2007-113, Cl DB | ||||||
4.500%, 12/25/22 | 3,664 | 3,854 | ||||
FNMA CMO, Ser 2007-116, Cl HI | ||||||
6.599%, 01/25/38 (A) | 7,460 | 611 | ||||
FNMA CMO, Ser 2007-30, Cl MA | ||||||
4.250%, 02/25/37 | 1,342 | 1,406 | ||||
FNMA CMO, Ser 2007-39, Cl NA | ||||||
4.250%, 01/25/37 | 194 | 203 | ||||
FNMA CMO, Ser 2007-43, Cl FL | ||||||
0.536%, 05/25/37 (A) | 733 | 721 | ||||
FNMA CMO, Ser 2007-53, Cl SH, IO | ||||||
5.864%, 06/25/37 (A) | 3,293 | 324 | ||||
FNMA CMO, Ser 2007-54, Cl FA | ||||||
0.636%, 06/25/37 (A) | 2,964 | 2,925 | ||||
| SEI Institutional Investments Trust / Semi-Annual Report / November 30, 2009 | 41 |
Table of Contents
SCHEDULE OF INVESTMENTS (Unaudited)
Core Fixed Income Fund (Continued)
November 30, 2009
| Description | Face Amount ($ Thousands) | Market Value ($ Thousands) | ||||
FNMA CMO, Ser 2007-60, Cl AX, IO | ||||||
6.914%, 07/25/37 (A) | $ | 3,752 | $ | 506 | ||
FNMA CMO, Ser 2007-79, Cl SB | ||||||
23.152%, 08/25/37 (A) | 283 | 365 | ||||
FNMA CMO, Ser 2007-92, Cl YS, IO | ||||||
5.544%, 06/25/37 (A) | 3,099 | 277 | ||||
FNMA CMO, Ser 2008-1, Cl BI, IO | ||||||
5.674%, 02/25/38 (A) | 3,887 | 363 | ||||
FNMA CMO, Ser 2008-22, Cl SI | ||||||
6.194%, 03/25/37 (A) | 23,000 | 2,514 | ||||
FNMA CMO, Ser 2008-24, Cl DY | ||||||
5.000%, 04/25/23 | 1,500 | 1,612 | ||||
FNMA CMO, Ser 2008-32, Cl SA, IO | ||||||
6.614%, 04/25/38 (A) | 1,992 | 188 | ||||
FNMA CMO, Ser 2008-35, Cl IM, IO | ||||||
0.642%, 10/25/16 (A) | 5,600 | 75 | ||||
FNMA CMO, Ser 2008-4, Cl SD, IO | ||||||
5.764%, 02/25/38 (A) | 5,750 | 546 | ||||
FNMA CMO, Ser 2008-53, Cl CA | ||||||
5.000%, 07/25/23 | 3,500 | 3,750 | ||||
FNMA CMO, Ser 2008-66, Cl B | ||||||
5.000%, 08/25/23 | 669 | 716 | ||||
FNMA CMO, Ser 2009-31, Cl A2 | ||||||
4.287%, 07/25/19 | 6,238 | 6,433 | ||||
FNMA CMO, Ser 2009-99, Cl SC, IO | ||||||
5.935%, 12/25/39 (A) | 6,000 | 534 | ||||
FNMA CMO, Ser G92-41, Cl MA | ||||||
8.000%, 08/25/22 | 1,216 | 1,338 | ||||
FNMA Grantor Trust CMO, Ser 2000-86, Cl A1 | ||||||
7.500%, 06/25/30 | 1,236 | 1,396 | ||||
FNMA Grantor Trust CMO, Ser 2001-T10, Cl A2 | ||||||
7.500%, 12/25/41 | 2,820 | 3,185 | ||||
FNMA Grantor Trust CMO, Ser 2002-T19, Cl A2 | ||||||
7.000%, 07/25/42 | 838 | 923 | ||||
FNMA Grantor Trust CMO, Ser 2002-T3, Cl B | ||||||
5.763%, 12/25/11 | 727 | 784 | ||||
FNMA Grantor Trust CMO, Ser 2004-T3, Cl 1A3 | ||||||
7.000%, 02/25/44 | 1,036 | 1,153 | ||||
FNMA Interest STRIP CMO, IO | ||||||
7.000%, 01/01/32 | 1,181 | 196 | ||||
6.500%, 02/01/33 | 1,937 | 288 | ||||
FNMA Whole Loan CMO, Ser 2003-W1, Cl 2A | ||||||
7.500%, 12/25/42 | 1,120 | 1,256 | ||||
FNMA Whole Loan CMO, Ser 2003-W2, Cl 2A9 | ||||||
5.900%, 07/25/42 | 1,897 | 2,019 | ||||
FNMA Whole Loan CMO, Ser 2003-W6, Cl 3A | ||||||
6.500%, 09/25/42 | 942 | 1,033 | ||||
| Description | Face Amount ($ Thousands) | Market Value ($ Thousands) | ||||
FNMA Whole Loan CMO, Ser 2004-W1, Cl 2A2 | ||||||
7.000%, 12/25/33 | $ | 1,177 | $ | 1,310 | ||
FNMA Whole Loan CMO, Ser 2004-W2, Cl 2A2 | ||||||
7.000%, 02/25/44 | 1,442 | 1,590 | ||||
FNMA Whole Loan CMO, Ser 2004-W9, Cl 2A1 | ||||||
6.500%, 02/25/44 | 1,074 | 1,172 | ||||
FNMA Whole Loan CMO, Ser 2005-W3, Cl 2AF | ||||||
0.456%, 03/25/45 (A) | 2,132 | 2,023 | ||||
FNMA Whole Loan CMO, Ser 2006-W1, Cl 1A3 | ||||||
7.500%, 12/25/45 | 487 | 548 | ||||
FNMA Whole Loan CMO, Ser 2006-W2, Cl 1AF1 | ||||||
0.456%, 02/25/36 (A) | 1,125 | 1,083 | ||||
FNMA Whole Loan CMO, Ser 2007-W1, Cl 1AF1 | ||||||
0.496%, 11/25/46 (A) | 1,703 | 1,634 | ||||
FNMA Whole Loan CMO, Ser 2007-W7, Cl 1A4 | ||||||
37.764%, 07/25/37 (A) | 162 | 287 | ||||
GNMA | ||||||
9.500%, 12/15/20 | 12 | 13 | ||||
7.500%, 10/15/37 to 09/20/38 | 4,501 | 4,909 | ||||
7.000%, 04/15/26 to 06/15/35 | 5,163 | 5,715 | ||||
6.500%, 01/15/24 to 02/15/39 | 18,803 | 20,352 | ||||
6.000%, 11/15/23 to 02/15/35 | 37,630 | 40,662 | ||||
5.000%, 05/15/33 to 11/15/35 | 32,705 | 34,616 | ||||
GNMA TBA | ||||||
4.500%, 12/15/39 to 01/15/40 | 58,265 | 59,734 | ||||
GNMA CMO, Ser 2001-18, Cl WH | ||||||
31.563%, 04/20/31 (A) | 151 | 225 | ||||
GNMA CMO, Ser 2001-22, Cl PS | ||||||
20.391%, 03/17/31 (A) | 1,145 | 1,465 | ||||
GNMA CMO, Ser 2001-61, Cl Z | ||||||
6.500%, 12/20/31 | 1,810 | 2,077 | ||||
GNMA CMO, Ser 2002-23, Cl SD | ||||||
20.309%, 04/16/32 (A) | 1,769 | 2,144 | ||||
GNMA CMO, Ser 2002-51, Cl SG | ||||||
31.475%, 04/20/31 (A) | 145 | 215 | ||||
GNMA CMO, Ser 2002-57, Cl SB | ||||||
108.919%, 08/16/32 | 108 | 445 | ||||
GNMA CMO, Ser 2002-69, Cl SC | ||||||
15.980%, 02/20/32 (A) | 482 | 529 | ||||
GNMA CMO, Ser 2003-60, Cl GS | ||||||
12.019%, 05/16/33 (A) | 238 | 256 | ||||
GNMA CMO, Ser 2003-86, Cl ZK | ||||||
5.000%, 10/20/33 | 11,785 | 12,199 | ||||
GNMA CMO, Ser 2003-97, Cl SA, IO | ||||||
6.311%, 11/16/33 (A) | 856 | 99 | ||||
| 42 | SEI Institutional Investments Trust / Semi-Annual Report / November 30, 2009 |
Table of Contents
| Description | Face Amount ($ Thousands) | Market Value ($ Thousands) | ||||
GNMA CMO, Ser 2004-28, Cl SV | ||||||
8.763%, 04/20/34 (A) | $ | 1,849 | $ | 1,814 | ||
GNMA CMO, Ser 2004-34, Cl JO, PO | ||||||
0.000%, 02/20/34 | 322 | 302 | ||||
GNMA CMO, Ser 2004-71, Cl ST | ||||||
7.000%, 09/20/34 (A) | 568 | 545 | ||||
GNMA CMO, Ser 2004-80, Cl IP, IO | ||||||
5.500%, 07/20/34 | 1,269 | 8 | ||||
GNMA CMO, Ser 2004-87, Cl SB | ||||||
7.399%, 03/17/33 (A) | 465 | 432 | ||||
GNMA CMO, Ser 2004-87, Cl LI, IO | ||||||
5.000%, 12/20/28 | 894 | 8 | ||||
GNMA CMO, Ser 2005-3, Cl SB, IO | ||||||
5.863%, 01/20/35 (A) | 2,467 | 237 | ||||
GNMA CMO, Ser 2005-7, Cl JM | ||||||
16.198%, 05/18/34 (A) | 481 | 566 | ||||
GNMA CMO, Ser 2005-92, Cl PB | ||||||
6.000%, 12/20/35 | 1,000 | 1,094 | ||||
GNMA CMO, Ser 2006-37, Cl JG | ||||||
5.000%, 07/20/36 | 1,723 | 1,828 | ||||
GNMA CMO, Ser 2006-38, Cl SW, IO | ||||||
6.263%, 06/20/36 (A) | 2,706 | 255 | ||||
GNMA CMO, Ser 2007-17, Cl AF | ||||||
0.439%, 04/16/37 (A) | 1,153 | 1,127 | ||||
GNMA CMO, Ser 2007-27, Cl SD, IO | ||||||
5.963%, 05/20/37 (A) | 1,843 | 157 | ||||
GNMA CMO, Ser 2007-42, Cl SB, IO | ||||||
6.513%, 07/20/37 (A) | 2,732 | 258 | ||||
GNMA CMO, Ser 2007-45, Cl QA, IO | ||||||
6.403%, 07/20/37 (A) | 1,802 | 170 | ||||
GNMA CMO, Ser 2007-72, Cl USIO, IO | ||||||
6.313%, 11/20/37 (A) | 2,152 | 185 | ||||
GNMA CMO, Ser 2007-81, Cl SP, IO | ||||||
6.413%, 12/20/37 (A) | 2,698 | 282 | ||||
GNMA CMO, Ser 2007-82, Cl SA, IO | ||||||
6.293%, 12/20/37 (A) | 1,764 | 135 | ||||
GNMA CMO, Ser 2007-9, Cl CI, IO | ||||||
5.963%, 03/20/37 (A) | 2,188 | 191 | ||||
GNMA CMO, Ser 2008-10, Cl S, IO | ||||||
5.593%, 02/20/38 (A) | 3,413 | 228 | ||||
GNMA CMO, Ser 2008-2, Cl MS, IO | ||||||
6.921%, 01/16/38 (A) | 2,430 | 269 | ||||
GNMA CMO, Ser 2008-33, Cl XS, IO | ||||||
7.461%, 04/16/38 (A) | 1,548 | 160 | ||||
GNMA CMO, Ser 2008-55, Cl SA, IO | ||||||
5.963%, 06/20/38 (A) | 3,082 | 262 | ||||
GNMA CMO, Ser 2009-14, Cl KI, IO | ||||||
6.500%, 03/20/39 | 1,760 | 217 | ||||
GNMA CMO, Ser 2009-14, Cl NI, IO | ||||||
6.500%, 03/20/39 | 84 | 10 | ||||
| Description | Face Amount ($ Thousands) | Market Value ($ Thousands) | ||||
GNMA CMO, Ser 2009-18, Cl PI, IO | ||||||
5.500%, 11/16/37 | $ | 1,868 | $ | 267 | ||
GNMA CMO, Ser 2009-22, Cl SA, IO | ||||||
6.033%, 04/20/39 (A) | 4,575 | 413 | ||||
GNMA CMO, Ser 2009-24, Cl DS, IO | ||||||
6.063%, 03/20/39 (A) | 2,429 | 242 | ||||
GNMA CMO, Ser 2009-25, Cl SE, IO | ||||||
7.363%, 09/20/38 (A) | 1,894 | 222 | ||||
GNMA CMO, Ser 2009-31, Cl TS, IO | ||||||
6.063%, 03/20/39 (A) | 4,585 | 397 | ||||
GNMA CMO, Ser 2009-33, Cl TI, IO | ||||||
6.000%, 05/20/39 | 769 | 113 | ||||
GNMA CMO, Ser 2009-42, Cl SC, IO | ||||||
5.843%, 06/20/39 (A) | 1,637 | 160 | ||||
GNMA CMO, Ser 2009-42, Cl IY, IO | ||||||
1.000%, 06/16/37 (A) | 3,567 | 60 | ||||
GNMA CMO, Ser 2009-43, Cl SA, IO | ||||||
5.713%, 06/20/39 (A) | 4,248 | 319 | ||||
GNMA CMO, Ser 2009-44, Cl MV | ||||||
6.000%, 04/20/20 | 1,458 | 1,610 | ||||
GNMA CMO, Ser 2009-6, Cl SH, IO | ||||||
5.803%, 02/20/39 (A) | 3,474 | 291 | ||||
GNMA CMO, Ser 2009-61, Cl ES, IO | ||||||
6.513%, 03/20/39 (A) | 5,810 | 706 | ||||
GNMA CMO, Ser 2009-65, Cl TS, IO | ||||||
6.163%, 12/20/38 (A) | 5,954 | 603 | ||||
GNMA CMO, Ser 2009-65, Cl IQ, IO | ||||||
6.000%, 12/20/38 | 1,985 | 259 | ||||
GNMA CMO, Ser 2009-66, Cl LC | ||||||
6.000%, 08/16/39 | 2,245 | 2,455 | ||||
| 1,925,010 | ||||||
Non-Agency Mortgage-Backed Obligations — 15.9% | ||||||
American Home Mortgage Assets, Ser 2006-5, Cl A1 | ||||||
1.552%, 11/25/46 (A) | 1,716 | 819 | ||||
American Home Mortgage Assets, Ser 2007-2, Cl A1 | ||||||
0.361%, 03/25/47 (A) | 14,412 | 7,006 | ||||
American Tower Trust, Ser 2007-1A, Cl AFX | ||||||
5.420%, 04/15/37 (B) | 3,409 | 3,443 | ||||
ASG Resecuritization Trust, Ser 2009-2, Cl A55 | ||||||
5.807%, 05/24/36 (A) (B) | 1,238 | 1,238 | ||||
ASG Resecuritization Trust, Ser 2009-3, Cl A65 | ||||||
5.594%, 03/26/37 (A) (B) | 2,509 | 2,471 | ||||
ASG Resecuritization Trust, Ser 2009-4, Cl A60 | ||||||
6.000%, 06/28/37 (B) | 1,887 | 1,868 | ||||
Asset Securitization, Ser 1996-D3, Cl A2 | ||||||
7.775%, 10/13/26 (A) | 2,159 | 2,295 | ||||
| SEI Institutional Investments Trust / Semi-Annual Report / November 30, 2009 | 43 |
Table of Contents
SCHEDULE OF INVESTMENTS (Unaudited)
Core Fixed Income Fund (Continued)
November 30, 2009
| Description | Face Amount ($ Thousands) | Market Value ($ Thousands) | ||||
Banc of America Alternative Loan Trust, Ser 2003-11, Cl 1A1 | ||||||
6.000%, 01/25/34 | $ | 427 | $ | 415 | ||
Banc of America Alternative Loan Trust, Ser 2003-11, Cl 2A1 | ||||||
6.000%, 01/25/34 | 871 | 846 | ||||
Banc of America Alternative Loan Trust, Ser 2003-7, Cl 1CB1 | ||||||
5.500%, 09/25/33 | 639 | 647 | ||||
Banc of America Alternative Loan Trust, Ser 2003-9, Cl 1CB2 | ||||||
5.500%, 11/25/33 | 1,039 | 1,053 | ||||
Banc of America Alternative Loan Trust, Ser 2004-1, Cl 5A1 | ||||||
5.500%, 02/25/19 | 737 | 716 | ||||
Banc of America Alternative Loan Trust, Ser 2004-8, Cl 3A1 | ||||||
5.500%, 09/25/19 | 640 | 640 | ||||
Banc of America Alternative Loan Trust, Ser 2006-8, Cl 3A1 | ||||||
6.251%, 11/25/21 (A) | 321 | 282 | ||||
Banc of America Alternative Loan Trust, Ser 2007-1, Cl 2A1 | ||||||
6.457%, 04/25/37 (A) | 499 | 314 | ||||
Banc of America Commercial Mortgage Securities, Ser 2002-PB2, Cl B | ||||||
6.309%, 06/11/35 | 1,075 | 1,102 | ||||
Banc of America Commercial Mortgage Securities, Ser 2002-PB2, Cl A4 | ||||||
6.186%, 06/11/35 | 5,100 | 5,385 | ||||
Banc of America Commercial Mortgage Securities, Ser 2003-1, Cl A1 | ||||||
3.878%, 09/11/36 | 3,395 | 3,437 | ||||
Banc of America Commercial Mortgage Securities, Ser 2004-2, Cl A5 | ||||||
4.580%, 11/10/38 | 564 | 564 | ||||
Banc of America Commercial Mortgage Securities, Ser 2005-3, Cl A4 | ||||||
4.668%, 07/10/43 | 8,860 | 8,561 | ||||
Banc of America Commercial Mortgage, Ser 2004-2, Cl A4 | ||||||
4.153%, 11/10/38 | — | — | ||||
Banc of America Commercial Mortgage, Ser 2005-3, Cl AM | ||||||
4.727%, 07/10/43 | 500 | 431 | ||||
Banc of America Commercial Mortgage, Ser 2006-1, Cl A4 | ||||||
5.372%, 09/10/45 (A) | 500 | 486 | ||||
| Description | Face Amount ($ Thousands) | Market Value ($ Thousands) | ||||
Banc of America Commercial Mortgage, Ser 2006-6, Cl A2 | ||||||
5.309%, 10/10/45 | $ | 1,902 | $ | 1,925 | ||
Banc of America Commercial Mortgage, Ser 2007-2, Cl A2 | ||||||
5.634%, 04/10/49 (A) | 2,383 | 2,365 | ||||
Banc of America Funding, Ser 2004-2, Cl 1CB1 | ||||||
5.750%, 09/20/34 | 728 | 671 | ||||
Banc of America Funding, Ser 2004-3, Cl 1A7 | ||||||
5.500%, 10/25/34 | 1,411 | 1,399 | ||||
Banc of America Funding, Ser 2005-B, Cl 2A1 | ||||||
5.080%, 04/20/35 (A) | 4,976 | 3,307 | ||||
Banc of America Mortgage Securities, Ser 2003-3, Cl 2A1 | ||||||
0.786%, 05/25/18 (A) | 591 | 561 | ||||
Banc of America Mortgage Securities, Ser 2004-3, Cl 1A23 | ||||||
4.500%, 04/25/34 | 1,201 | 1,201 | ||||
Banc of America Mortgage Securities, Ser 2004-5, Cl 4A1 | ||||||
4.750%, 06/25/19 | 503 | 507 | ||||
Banc of America Mortgage Securities, Ser 2004-9, Cl 3A1 | ||||||
6.500%, 09/25/32 | 314 | 311 | ||||
BCAP LLC Trust, Ser 2009-RR10, Cl 17A1 | ||||||
5.750%, 06/26/37 (B) | 2,430 | 2,405 | ||||
BCAP LLC Trust, Ser 2009-RR13, Cl 11A1 | ||||||
5.250%, 05/26/37 (A) (B) | 1,000 | 1,000 | ||||
BCAP LLC Trust, Ser 2009-RR5, Cl 8A1 | ||||||
5.500%, 11/26/34 (B) | 1,522 | 1,476 | ||||
Bear Stearns Adjustable Rate Mortgage Trust, Ser 2004-2, Cl 24A | ||||||
5.269%, 05/25/34 (A) | 3,491 | 3,323 | ||||
Bear Stearns Alt-A Trust, Ser 2005-2, Cl 2A4 | ||||||
4.180%, 04/25/35 (A) | 278 | 183 | ||||
Bear Stearns Asset Backed Securities Trust, Ser 2006-AC1, Cl 1A1 | ||||||
5.750%, 02/25/36 | 2,408 | 1,672 | ||||
Bear Stearns Commercial Mortgage Securities, Ser 2001-TOP4, Cl A3 | ||||||
5.610%, 11/15/33 | 1,709 | 1,779 | ||||
Bear Stearns Commercial Mortgage Securities, Ser 2002-TOP6, Cl A2 | ||||||
6.460%, 10/15/36 | 3,645 | 3,855 | ||||
| 44 | SEI Institutional Investments Trust / Semi-Annual Report / November 30, 2009 |
Table of Contents
| Description | Face Amount ($ Thousands) | Market Value ($ Thousands) | ||||
Bear Stearns Commercial Mortgage Securities, Ser 2002-TOP8, Cl A2 | ||||||
4.830%, 08/15/38 | $ | 3,071 | $ | 3,160 | ||
Bear Stearns Commercial Mortgage Securities, Ser 2003-T-12, Cl A3 | ||||||
4.240%, 08/13/39 (A) | 881 | 886 | ||||
Bear Stearns Commercial Mortgage Securities, Ser 2004-PWR4, Cl A3 | ||||||
5.468%, 06/11/41 (A) | 751 | 780 | ||||
Bear Stearns Commercial Mortgage Securities, Ser 2004-PWR4, Cl A2 | ||||||
5.286%, 06/11/41 (A) | 1,541 | 1,588 | ||||
Bear Stearns Commercial Mortgage Securities, Ser 2004-PWR6, Cl A6 | ||||||
4.825%, 11/11/41 | 637 | 638 | ||||
Bear Stearns Commercial Mortgage Securities, Ser 2004-T16, Cl A6 | ||||||
4.750%, 02/13/46 (A) | 1,718 | 1,695 | ||||
Bear Stearns Commercial Mortgage Securities, Ser 2005-PWR9, Cl AAB | ||||||
4.804%, 09/11/42 | 1,280 | 1,314 | ||||
Bear Stearns Commercial Mortgage Securities, Ser 2005-T20, Cl A4A | ||||||
5.298%, 10/12/42 (A) | 6,500 | 6,576 | ||||
Bear Stearns Commercial Mortgage Securities, Ser 2006-T24, Cl A4 | ||||||
5.537%, 10/12/41 | 300 | 298 | ||||
Bear Stearns Commercial Mortgage Securities, Ser 2007-PW10, Cl A4 | ||||||
5.405%, 12/11/40 (A) | 10,186 | 10,231 | ||||
Bear Stearns Commercial Mortgage Securities, Ser 2007-PW17, Cl A3 | ||||||
5.736%, 06/11/50 | 2,640 | 2,448 | ||||
Bear Stearns Commercial Mortgage Securities, Ser 2007-PW18, Cl AM | ||||||
6.084%, 06/11/50 (A) | 885 | 612 | ||||
Chase Mortgage Finance, Ser 2003-S15, Cl 2A10 | ||||||
0.686%, 01/25/34 (A) | 1,054 | 1,045 | ||||
Chase Mortgage Finance, Ser 2003-S9, Cl AP, PO | ||||||
0.000%, 10/25/18 | 387 | 314 | ||||
Chase Mortgage Finance, Ser 2005-A1, Cl 2A3 | ||||||
5.238%, 12/25/35 (A) | 13,166 | 9,705 | ||||
Chase Mortgage Finance, Ser 2007-A1, Cl 2A1 | ||||||
4.129%, 02/25/37 (A) | 539 | 506 | ||||
Chase Mortgage Finance, Ser 2007-A2, Cl 1A1 | ||||||
4.053%, 07/25/37 (A) | 807 | 734 | ||||
Citicorp Mortgage Securities, Ser 2004-3, Cl A8 | ||||||
5.250%, 05/25/34 | 656 | 655 | ||||
| Description | Face Amount ($ Thousands) | Market Value ($ Thousands) | ||||
Citigroup Deutsche Bank Commercial Mortgage, Ser 2007-CD4, Cl A4 | ||||||
5.320%, 12/11/49 | $ | 6,855 | $ | 5,778 | ||
Citigroup Mortgage Loan Trust, Ser 2004-UST1, Cl A6 | ||||||
5.073%, 08/25/34 (A) | 904 | 885 | ||||
Citigroup Mortgage Loan Trust, Ser 2005-11, Cl A3 | ||||||
4.900%, 12/25/35 (A) | 6,801 | 5,040 | ||||
Citigroup Mortgage Loan Trust, Ser 2009-5, Cl 8A1 | ||||||
6.000%, 06/25/36 (B) | 1,517 | 1,395 | ||||
Commercial Mortgage Asset Trust, Ser 1999-C1, Cl A4 | ||||||
6.975%, 01/17/32 (A) | 6,991 | 7,496 | ||||
Commercial Mortgage Asset Trust, Ser 1999-C2, Cl A2 | ||||||
7.546%, 11/17/32 (A) | 59 | 59 | ||||
Commercial Mortgage Loan Trust, Ser 2008-LS1, Cl A4B | ||||||
6.220%, 12/10/49 (A) | 9,920 | 8,460 | ||||
Commercial Mortgage Loan Trust, Ser 2008-LS1, Cl AJ | ||||||
6.220%, 12/10/49 (A) | 1,210 | 549 | ||||
Commercial Mortgage Pass Through Certificates, Ser 2004-LB2A, Cl A4 | ||||||
4.715%, 03/10/39 | 3,361 | 3,354 | ||||
Commercial Mortgage Pass Through Certificates, Ser 2004-LB3A, Cl A5 | ||||||
5.476%, 07/10/37 (A) | 1,876 | 1,898 | ||||
Commercial Mortgage Pass Through Certificates, Ser 2005-LP5, Cl A4 | ||||||
4.982%, 05/10/43 (A) | 600 | 603 | ||||
Commercial Mortgage Pass-Through Certificates, Ser 2001-J2A, Cl A2 | ||||||
6.096%, 07/16/34 (B) | 5,564 | 5,790 | ||||
Countrywide Alternative Loan Trust, Ser 2003-20CB, Cl 1A1 | ||||||
5.500%, 10/25/33 | 2,836 | 2,789 | ||||
Countrywide Alternative Loan Trust, Ser 2004-27CB, Cl A1 | ||||||
6.000%, 12/25/34 | 2,456 | 2,067 | ||||
Countrywide Alternative Loan Trust, Ser 2004-32CB, Cl 2A3, IO | ||||||
4.864%, 02/25/35 (A) | 46,713 | 4,055 | ||||
Countrywide Alternative Loan Trust, Ser 2004-J1, Cl 1A1 | ||||||
6.000%, 02/25/34 | 481 | 477 | ||||
Countrywide Alternative Loan Trust, Ser 2004-J6, Cl PO, PO | ||||||
0.000%, 11/25/31 | 405 | 264 | ||||
Countrywide Alternative Loan Trust, Ser 2004-J6, Cl 2A1 | ||||||
6.500%, 11/25/31 | 1,555 | 1,447 | ||||
| SEI Institutional Investments Trust / Semi-Annual Report / November 30, 2009 | 45 |
Table of Contents
SCHEDULE OF INVESTMENTS (Unaudited)
Core Fixed Income Fund (Continued)
November 30, 2009
| Description | Face Amount ($ Thousands) | Market Value ($ Thousands) | ||||
Countrywide Alternative Loan Trust, Ser 2005-27, Cl 2A1 | ||||||
2.107%, 08/25/35 (A) | $ | 4,287 | $ | 2,023 | ||
Countrywide Alternative Loan Trust, Ser 2005-27, Cl 3A2 | ||||||
1.857%, 08/25/35 (A) | 1,111 | 501 | ||||
Countrywide Alternative Loan Trust, Ser 2005-56, Cl 4A1 | ||||||
0.546%, 11/25/35 (A) | 8,127 | 4,050 | ||||
Countrywide Alternative Loan Trust, Ser 2005-59, Cl 1A1 | ||||||
0.567%, 11/20/35 (A) | 9,809 | 4,868 | ||||
Countrywide Alternative Loan Trust, Ser 2005-72, Cl A1 | ||||||
0.506%, 01/25/36 (A) | 3,108 | 1,590 | ||||
Countrywide Alternative Loan Trust, Ser 2006-0A9, Cl 2A1A | ||||||
0.447%, 07/20/46 (A) | 648 | 268 | ||||
Countrywide Alternative Loan Trust, Ser 2006-OA11, Cl A4 | ||||||
0.426%, 09/25/46 (A) | 10,324 | 4,386 | ||||
Countrywide Home Loan Mortgage Pass Through Trust, Ser 2003-49, Cl A3 | ||||||
3.697%, 12/19/33 (A) | — | 1 | ||||
Countrywide Home Loan Mortgage Pass Through Trust, Ser 2003-56, Cl 6A1 | ||||||
5.201%, 12/25/33 (A) | 679 | 558 | ||||
Countrywide Home Loan Mortgage Pass Through Trust, Ser 2003-J1, Cl A6 | ||||||
5.250%, 09/25/33 | 1,000 | 1,010 | ||||
Countrywide Home Loan Mortgage Pass Through Trust, Ser 2003-J7, Cl 4A3 | ||||||
9.468%, 08/25/18 (A) | 273 | 213 | ||||
Countrywide Home Loan Mortgage Pass Through Trust, Ser 2004-20, Cl 2A1 | ||||||
3.348%, 09/25/34 (A) | 98 | 66 | ||||
Countrywide Home Loan Mortgage Pass Through Trust, Ser 2004-8, Cl 2A1 | ||||||
4.500%, 06/25/19 | 2,045 | 2,039 | ||||
Countrywide Home Loan Mortgage Pass-Through Trust, Ser 2005-20, Cl A7 | ||||||
5.250%, 10/25/35 | 818 | 675 | ||||
Countrywide Home Loan Mortgage Pass-Through Trust, Ser 2005-R3, Cl AF | ||||||
0.636%, 09/25/35 (A) (B) | 7,916 | 5,930 | ||||
| Description | Face Amount ($ Thousands) | Market Value ($ Thousands) | ||||
Credit Suisse First Boston Mortgage Securities, Ser 2001-CF2, Cl A4 | ||||||
6.505%, 02/15/34 | $ | 1,797 | $ | 1,850 | ||
Credit Suisse First Boston Mortgage Securities, Ser 2001-CK1, Cl A3 | ||||||
6.380%, 12/18/35 | 1,158 | 1,187 | ||||
Credit Suisse First Boston Mortgage Securities, Ser 2001-CKN5, Cl A4 | ||||||
5.435%, 09/15/34 | 3,307 | 3,424 | ||||
Credit Suisse First Boston Mortgage Securities, Ser 2002-CKS4, Cl A1 | ||||||
4.485%, 11/15/36 | 74 | 76 | ||||
Credit Suisse First Boston Mortgage Securities, Ser 2002-CKS4, Cl A2 | ||||||
5.183%, 11/15/36 | 6,381 | 6,654 | ||||
Credit Suisse First Boston Mortgage Securities, Ser 2002-CP5, Cl A2 | ||||||
4.940%, 12/15/35 | 987 | 1,015 | ||||
Credit Suisse First Boston Mortgage Securities, Ser 2003-29, Cl 8A1 | ||||||
6.000%, 11/25/18 | 728 | 711 | ||||
Credit Suisse First Boston Mortgage Securities, Ser 2003-CK2, Cl A4 | ||||||
4.801%, 03/15/36 | 1,215 | 1,245 | ||||
Credit Suisse First Boston Mortgage Securities, Ser 2003-CPN1, Cl A2 | ||||||
4.597%, 03/15/35 | 851 | 865 | ||||
Credit Suisse First Boston Mortgage Securities, Ser 2004-AR5, Cl 7A2 | ||||||
3.633%, 06/25/34 (A) | 955 | 905 | ||||
Credit Suisse First Boston Mortgage Securities, Ser 2005-C1, Cl A3 | ||||||
4.813%, 02/15/38 | 374 | 376 | ||||
Credit Suisse First Boston Mortgage Securities, Ser 2005-C5, Cl A4 | ||||||
5.100%, 08/15/38 (A) | 1,333 | 1,310 | ||||
Credit Suisse First Boston Mortgage Securities, Ser 2005-C6, Cl A4 | ||||||
5.230%, 12/15/40 (A) | 22,220 | 21,771 | ||||
Credit Suisse Mortgage Capital Certificates, Ser 2006-C4, Cl A3 | ||||||
5.467%, 09/15/39 | 12,930 | 10,744 | ||||
Credit Suisse Mortgage Capital Certificates, Ser 2006-C5, Cl A3 | ||||||
5.311%, 12/15/39 | 10,517 | 8,662 | ||||
Credit Suisse Mortgage Capital Certificates, Ser 2009-12R, Cl 7A1 | ||||||
5.500%, 10/27/35 (B) | 1,165 | 1,161 | ||||
CS First Boston Mortgage Securities, Ser 2005-4, Cl 3A24 | ||||||
18.167%, 06/25/35 (A) | 369 | 364 | ||||
CW Capital Cobalt, Ser 2006-C1, Cl A4 | ||||||
5.223%, 08/15/48 | 7,040 | 6,013 | ||||
| 46 | SEI Institutional Investments Trust / Semi-Annual Report / November 30, 2009 |
Table of Contents
| Description | Face Amount ($ Thousands) | Market Value ($ Thousands) | ||||
DLJ Commercial Mortgage, Ser 2000-CKP1, Cl A1B | ||||||
7.180%, 11/10/33 | $ | 1,301 | $ | 1,332 | ||
DSLA Mortgage Loan Trust, Ser 2004-AR2, Cl A2B | ||||||
0.637%, 11/19/44 (A) | 2,285 | 529 | ||||
DSLA Mortgage Loan Trust, Ser 2006-AR1, Cl 1A1A | ||||||
1.552%, 03/19/46 (A) | 438 | 171 | ||||
FHLMC Multifamily Structured Pass Through Certificates, Ser K003, Cl AAB | ||||||
4.768%, 05/25/18 | 2,824 | 2,986 | ||||
FHLMC Multifamily Structured Pass Through Certificates, Ser K004, Cl A2 | ||||||
4.186%, 08/25/19 | 4,549 | 4,650 | ||||
First Horizon Alternative Mortgage Securities, Ser 2006-FA6, Cl 2A10 | ||||||
6.000%, 11/25/36 | 994 | 796 | ||||
First Horizon Asset Securities, Ser 2003-8, Cl 2A1 | ||||||
4.500%, 09/25/18 | 1,754 | 1,767 | ||||
First Union National Bank Commercial Mortgage, Ser 2000-C2, Cl A2 | ||||||
7.202%, 10/15/32 | 1,387 | 1,420 | ||||
First Union National Bank Commercial Mortgage, Ser 2000-C2, Cl B | ||||||
7.281%, 10/15/32 (A) | 500 | 517 | ||||
First Union National Bank Commercial Mortgage, Ser 2001-C4, Cl B | ||||||
6.417%, 12/12/33 | 926 | 948 | ||||
GE Capital Commercial Mortgage, Ser 2001-2, Cl A3 | ||||||
6.030%, 08/11/33 | 524 | 531 | ||||
GE Capital Commercial Mortgage, Ser 2001-3, Cl A1 | ||||||
5.560%, 06/10/38 | 49 | 50 | ||||
GE Capital Commercial Mortgage, Ser 2002-1A, Cl A3 | ||||||
6.269%, 12/10/35 | 1,562 | 1,663 | ||||
GE Capital Commercial Mortgage, Ser 2005-C4, Cl A4 | ||||||
5.513%, 11/10/45 (A) | 4,128 | 4,117 | ||||
GE Capital Commercial Mortgage, Ser 2007-C1, Cl A4 | ||||||
5.543%, 12/10/49 | 2,500 | 2,002 | ||||
GMAC Commercial Mortgage Securities, Ser 2000-C2, Cl A2 | ||||||
7.455%, 08/16/33 (A) | 95 | 96 | ||||
| Description | Face Amount ($ Thousands) | Market Value ($ Thousands) | ||||
GMAC Commercial Mortgage Securities, Ser 2002-C3, Cl A2 | ||||||
4.930%, 07/10/39 | $ | 3,009 | $ | 3,117 | ||
GMAC Commercial Mortgage Securities, Ser 2003-C2, Cl A2 | ||||||
5.670%, 05/10/40 (A) | 1,259 | 1,324 | ||||
GMAC Commercial Mortgage Securities, Ser 2003-C3, Cl A4 | ||||||
5.023%, 04/10/40 | 5,138 | 5,266 | ||||
GMAC Commercial Mortgage Securities, Ser 2006-C1, Cl A4 | ||||||
5.238%, 11/10/45 (A) | 700 | 672 | ||||
GMAC Mortgage Loan Trust, Ser 2003-AR1, Cl A4 | ||||||
4.133%, 10/19/33 (A) | 2,663 | 2,503 | ||||
GMAC Mortgage Loan Trust, Ser 2003-GH2, Cl A4 | ||||||
5.000%, 10/25/33 | 812 | 778 | ||||
GMAC Mortgage Loan Trust, Ser 2003-J7, Cl A7 | ||||||
5.000%, 11/25/33 | 1,084 | 983 | ||||
GMAC Mortgage Loan Trust, Ser 2004-J4, Cl A1 | ||||||
5.500%, 09/25/34 | 379 | 375 | ||||
GMAC Mortgage Loan Trust, Ser 2005-AR5 , Cl 3A1 | ||||||
5.048%, 09/19/35 (A) | 249 | 195 | ||||
GMAC Mortgage Loan Trust, Ser 2005-AR6, Cl 2A1 | ||||||
5.224%, 11/19/35 (A) | 1,118 | 877 | ||||
Greenpoint Mortgage Funding Trust, Ser 2007-AR1, Cl 1A1A | ||||||
0.316%, 02/25/47 (A) | 13,892 | 10,460 | ||||
Greenwich Capital Commercial Funding, Ser 2004-GG1, Cl A6 | ||||||
5.135%, 06/10/36 (A) | 1,156 | 1,129 | ||||
Greenwich Capital Commercial Funding, Ser 2005-GG3, Cl A4 | ||||||
4.799%, 08/10/42 (A) | 1,311 | 1,261 | ||||
Greenwich Capital Commercial Funding, Ser 2005-GG5, Cl A5 | ||||||
5.224%, 04/10/37 (A) | 2,491 | 2,324 | ||||
Greenwich Capital Commercial Funding, Ser 2005-GG5, Cl AAB | ||||||
5.190%, 04/10/37 (A) | 335 | 342 | ||||
Greenwich Capital Commercial Funding, Ser 2006-GG7, Cl A4 | ||||||
6.116%, 07/10/38 (A) | 15,178 | 13,781 | ||||
GS Mortgage Securities II, Ser 2001-GL3A, Cl A2 | ||||||
6.449%, 08/05/18 (A) (B) | 5,378 | 5,630 | ||||
GS Mortgage Securities II, Ser 2005-GG4, Cl AABA | ||||||
4.680%, 07/10/39 | 6,191 | 6,372 | ||||
| SEI Institutional Investments Trust / Semi-Annual Report / November 30, 2009 | 47 |
Table of Contents
SCHEDULE OF INVESTMENTS (Unaudited)
Core Fixed Income Fund (Continued)
November 30, 2009
| Description | Face Amount ($ Thousands) | Market Value ($ Thousands) | ||||
GS Mortgage Securities II, Ser 2006-GG6, Cl A4 | ||||||
5.553%, 04/10/38 (A) | $ | 1,000 | $ | 902 | ||
GS Mortgage Securities II, Ser 2006-GG6, Cl A2 | ||||||
5.506%, 04/10/38 (A) | 460 | 466 | ||||
GSMPS Mortgage Loan Trust, Ser 1998-1, Cl A | ||||||
8.000%, 09/19/27 (A) (B) | 5 | 5 | ||||
GSMPS Mortgage Loan Trust, Ser 2005-RP3, Cl 1AF | ||||||
0.586%, 09/25/35 (A) (B) | 3,116 | 2,000 | ||||
GSMPS Mortgage Loan Trust, Ser 2006-RP2, Cl 1AF1 | ||||||
0.636%, 04/25/36 (A) (B) | 2,271 | 1,779 | ||||
GSR Mortgage Loan Trust, Ser 2007-1F, Cl 2A4 | ||||||
5.500%, 01/25/37 | 125 | 99 | ||||
Harborview Mortgage Loan Trust, Ser 2005-01, Cl X, IO | ||||||
2.692%, 03/19/35 | 11,400 | 381 | ||||
Harborview Mortgage Loan Trust, Ser 2005-12, Cl X2B, IO | ||||||
2.437%, 10/19/35 (A) | 22,676 | 737 | ||||
Heller Financial Commercial Mortgage Asset, Ser 1999-PH1, Cl C | ||||||
7.183%, 05/15/31 (A) | 110 | 110 | ||||
Impac Secured Assets CMN Owner Trust, Ser 2003-2, Cl A1 | ||||||
5.500%, 08/25/33 | 1,006 | 1,020 | ||||
Impac Secured Assets CMN Owner Trust, Ser 2006-2, Cl 2A1 | ||||||
0.586%, 08/25/36 (A) | 1,664 | 1,302 | ||||
Indymac INDA Mortgage Loan Trust, Ser 2007-AR7, Cl 1A1 | ||||||
6.155%, 11/25/37 (A) | 2,145 | 1,548 | ||||
JPMorgan Alternative Loan Trust, Ser 2006-A7, Cl 2A6 | ||||||
5.750%, 12/25/36 (A) | 11,300 | 4,315 | ||||
JPMorgan Chase Commercial Mortgage Securities, Ser 2000-C10, Cl A2 | ||||||
7.371%, 08/15/32 (A) | 829 | 830 | ||||
JPMorgan Chase Commercial Mortgage Securities, Ser 2001-CIBC, Cl A3 | ||||||
6.260%, 03/15/33 | 1,253 | 1,286 | ||||
JPMorgan Chase Commercial Mortgage Securities, Ser 2001-CIB3, Cl A3 | ||||||
6.465%, 11/15/35 | 5,615 | 5,888 | ||||
JPMorgan Chase Commercial Mortgage Securities, Ser 2002-CIB4, Cl A3 | ||||||
6.162%, 05/12/34 | 5,517 | 5,828 | ||||
| Description | Face Amount ($ Thousands) | Market Value ($ Thousands) | ||||
JPMorgan Chase Commercial Mortgage Securities, Ser 2007-LDPX, Cl A2S | ||||||
5.305%, 01/15/49 | $ | 7,733 | $ | 7,481 | ||
JPMorgan Chase Commercial Mortgage Securities, Ser 2002-CIB5, Cl A2 | ||||||
5.161%, 10/12/37 | 1,137 | 1,184 | ||||
JPMorgan Chase Commercial Mortgage Securities, Ser 2003-PM1A, Cl A4 | ||||||
5.326%, 08/12/40 (A) | 1,911 | 1,981 | ||||
JPMorgan Chase Commercial Mortgage Securities, Ser 2004-C3, Cl A2 | ||||||
4.223%, 01/15/42 | 11,070 | 11,059 | ||||
JPMorgan Chase Commercial Mortgage Securities, Ser 2004-CB9, Cl A4 | ||||||
5.557%, 06/12/41 (A) | 2,579 | 2,619 | ||||
JPMorgan Chase Commercial Mortgage Securities, Ser 2006-LDP7, Cl A2 | ||||||
6.051%, 04/15/45 (A) | 2,400 | 2,459 | ||||
JPMorgan Chase Commercial Mortgage Securities, Ser 2006-LDP8, Cl A4 | ||||||
5.399%, 05/15/45 | 500 | 464 | ||||
JPMorgan Chase Commercial Mortgage Securities, Ser 2005-LDP4, Cl A4 | ||||||
4.918%, 10/15/42 (A) | 2,477 | 2,465 | ||||
JPMorgan Chase Commercial Mortgage Securities, Ser 2006-CB14, Cl A4 | ||||||
5.481%, 12/12/44 (A) | 2,089 | 2,001 | ||||
JPMorgan Chase Commercial Mortgage Securities, Ser 2007-CB19, Cl A2 | ||||||
5.815%, 02/12/49 (A) | 774 | 784 | ||||
JPMorgan Chase Commercial Mortgage Securities, Ser 2007-LD12, Cl A4 | ||||||
5.882%, 02/15/51 (A) | 7,877 | 6,774 | ||||
JPMorgan Chase Commercial Mortgage Securities, Ser 2007-LD12, Cl AM | ||||||
6.260%, 02/15/51 (A) | 995 | 687 | ||||
JPMorgan Chase Commercial Mortgage Securities, Ser 2007-LDPX, Cl A3 | ||||||
5.420%, 01/15/49 | 7,442 | 6,215 | ||||
JPMorgan Mortgage Trust, Ser 2004-A3, Cl SF3 | ||||||
4.577%, 06/25/34 (A) | 4,675 | 4,460 | ||||
| 48 | SEI Institutional Investments Trust / Semi-Annual Report / November 30, 2009 |
Table of Contents
| Description | Face Amount ($ Thousands) | Market Value ($ Thousands) | ||||
JPMorgan Mortgage Trust, Ser 2004-A5, Cl 4A2 | ||||||
4.816%, 12/25/34 (A) | $ | 3,341 | $ | 3,276 | ||
JPMorgan Mortgage Trust, Ser 2004-A5, Cl 4A4 | ||||||
4.826%, 12/25/34 (A) | 11,500 | 11,033 | ||||
JPMorgan Mortgage Trust, Ser 2005-A3, Cl 11A2 | ||||||
4.495%, 06/25/35 (A) | 13,065 | 9,649 | ||||
JPMorgan Mortgage Trust, Ser 2005-A2, Cl 5A2 | ||||||
4.320%, 04/25/35 (A) | 360 | 267 | ||||
JPMorgan Mortgage Trust, Ser 2006-A2, Cl 4A1 | ||||||
4.056%, 08/25/34 (A) | 2,795 | 2,485 | ||||
JPMorgan Mortgage Trust, Ser 2006-A3, Cl 6A1 | ||||||
3.999%, 08/25/34 (A) | 1,226 | 1,051 | ||||
JPMorgan Mortgage Trust, Ser 2006-A2, Cl 2A2 | ||||||
5.757%, 04/25/36 (A) | 13,400 | 8,997 | ||||
JPMorgan Mortgage Trust, Ser 2006-A3, Cl 3A4 | ||||||
5.730%, 05/25/36 (A) | 14,500 | 11,540 | ||||
LB-UBS Commercial Mortgage Trust, Ser 2000-C4, Cl A2 | ||||||
7.370%, 08/15/26 | 1,699 | 1,729 | ||||
LB-UBS Commercial Mortgage Trust, Ser 2000-C5, Cl A2 | ||||||
6.510%, 12/15/26 | 2,928 | 3,020 | ||||
LB-UBS Commercial Mortgage Trust, Ser 2001-C2, Cl A2 | ||||||
6.653%, 11/15/27 | 702 | 733 | ||||
LB-UBS Commercial Mortgage Trust, Ser 2002-C2, Cl A4 | ||||||
5.594%, 06/15/31 | 13,224 | 13,982 | ||||
LB-UBS Commercial Mortgage Trust, Ser 2002-C4, Cl A4 | ||||||
4.563%, 09/15/26 | 1,017 | 1,048 | ||||
LB-UBS Commercial Mortgage Trust, Ser 2002-C4, Cl A5 | ||||||
4.853%, 09/15/31 | 2,169 | 2,261 | ||||
LB-UBS Commercial Mortgage Trust, Ser 2003-C3, Cl A4 | ||||||
4.166%, 05/15/32 | 576 | 580 | ||||
LB-UBS Commercial Mortgage Trust, Ser 2003-C8, Cl A4 | ||||||
5.124%, 11/15/32 (A) | 17,485 | 18,060 | ||||
LB-UBS Commercial Mortgage Trust, Ser 2004-C7, Cl A5 | ||||||
4.628%, 10/15/29 | 853 | 843 | ||||
LB-UBS Commercial Mortgage Trust, Ser 2006-C1, Cl A4 | ||||||
5.156%, 02/15/31 | 350 | 342 | ||||
| Description | Face Amount ($ Thousands) | Market Value ($ Thousands) | ||||
LB-UBS Commercial Mortgage Trust, Ser 2007-C1, Cl AAB | ||||||
5.403%, 02/15/40 | $ | 413 | $ | 405 | ||
LB-UBS Commercial Mortgage Trust, Ser 2007-C1, Cl A3 | ||||||
5.398%, 02/15/40 | 1,841 | 1,800 | ||||
LB-UBS Commercial Mortgage Trust, Ser 2007-C2, Cl AM | ||||||
5.493%, 02/15/40 (A) | 1,050 | 684 | ||||
Master Adjustable Rate Mortgages Trust, Ser 2004-13, Cl 3A6 | ||||||
3.096%, 11/21/34 (A) | 1,200 | 1,174 | ||||
Master Adjustable Rate Mortgages Trust, Ser 2004-13, Cl 3A7 | ||||||
3.096%, 11/21/34 (A) | 1,585 | 1,288 | ||||
Master Adjustable Rate Mortgages Trust, Ser 2004-13, Cl 3A7A | ||||||
3.096%, 11/21/34 (A) | 11,650 | 10,154 | ||||
Master Adjustable Rate Mortgages Trust, Ser 2007-3, Cl 12A1 | ||||||
0.436%, 05/25/47 (A) | 18,676 | 8,624 | ||||
Master Alternative Loans Trust, Ser 2004-4, Cl 1A1 | ||||||
5.500%, 05/25/34 | 2,494 | 2,502 | ||||
Master Reperforming Loan Trust, Ser 2005-1, Cl 1A1 | ||||||
6.000%, 08/25/34 (B) | 3,785 | 3,490 | ||||
Master Reperforming Loan Trust, Ser 2005-2, Cl 1A1F | ||||||
0.586%, 05/25/35 (A) (B) | 732 | 582 | ||||
Master Reperforming Loan Trust, Ser 2006-1, Cl 1A1F | ||||||
0.596%, 07/25/35 (A) (B) | 1,674 | 1,392 | ||||
MASTR Alternative Loans Trust, Ser 2003-9, Cl 2A1 | ||||||
6.000%, 12/25/33 | 668 | 656 | ||||
MASTR Alternative Loans Trust, Ser 2006-3, Cl AA3 | ||||||
6.250%, 07/25/36 | 802 | 585 | ||||
MASTR Asset Securitization Trust, Ser 2004-10, Cl SA1 | ||||||
0.636%, 11/25/34 (A) | 184 | 173 | ||||
Merit Securities, Ser 2003-13, Cl A4 | ||||||
7.963%, 12/28/33 (A) | 3,483 | 3,487 | ||||
Merrill Lynch Mortgage Investors, Ser 2004-A1, Cl 2A1 | ||||||
3.841%, 02/25/34 (A) | 262 | 251 | ||||
Merrill Lynch Mortgage Investors, Ser 2004-A1, Cl 4A | ||||||
5.261%, 02/25/34 (A) | 5,082 | 4,933 | ||||
Merrill Lynch Mortgage Investors, Ser 2005-A2, Cl A2 | ||||||
4.475%, 02/25/35 (A) | 256 | 221 | ||||
Merrill Lynch Mortgage Trust, Ser 2003-KEY1, Cl A4 | ||||||
5.236%, 11/12/35 (A) | 3,365 | 3,483 | ||||
| SEI Institutional Investments Trust / Semi-Annual Report / November 30, 2009 | 49 |
Table of Contents
SCHEDULE OF INVESTMENTS (Unaudited)
Core Fixed Income Fund (Continued)
November 30, 2009
| Description | Face Amount ($ Thousands) | Market Value ($ Thousands) | ||||
Merrill Lynch Mortgage Trust, Ser 2005-CIP1, Cl A3A | ||||||
4.949%, 07/12/38 (A) | $ | 1,254 | $ | 1,244 | ||
Merrill Lynch Mortgage Trust, Ser 2006-1, Cl 1A | ||||||
3.941%, 02/25/36 (A) | 550 | 401 | ||||
Merrill Lynch, Ser 2006-1, Cl A2 | ||||||
5.439%, 02/12/39 (A) | 2,381 | 2,402 | ||||
Merrill Lynch, Ser 2006-4, Cl A3 | ||||||
5.172%, 12/12/49 (A) | 16,900 | 14,279 | ||||
Merrill Lynch, Ser 2007-7, Cl A4 | ||||||
5.810%, 06/12/50 (A) | 6,740 | 5,485 | ||||
Merrill Lynch, Ser 2007-9, Cl AM | ||||||
5.856%, 09/12/49 (A) | 2,130 | 1,385 | ||||
Merrill Lynch/Countrywide Commercial Mortgage Trust, Ser 2007-6, Cl A4 | ||||||
5.485%, 03/12/51 (A) | 6,740 | 5,412 | ||||
MLCC Mortgage Investors, Ser 2004-A, Cl A2 | ||||||
0.889%, 04/25/29 (A) | 443 | 360 | ||||
MLCC Mortgage Investors, Ser 2004-B, Cl A3 | ||||||
2.537%, 05/25/29 (A) | 636 | 591 | ||||
MLCC Mortgage Investors, Ser 2005-1, Cl 2A2 | ||||||
4.804%, 04/25/35 (A) | 336 | 284 | ||||
MLCC Mortgage Investors, Ser 2005-1, Cl 2A1 | ||||||
4.804%, 04/25/35 (A) | 108 | 91 | ||||
Morgan Stanley Capital I, Ser 2003-IQ5, Cl A4 | ||||||
5.010%, 04/15/38 | 3,640 | 3,764 | ||||
Morgan Stanley Capital I, Ser 2003-T11, Cl A4 | ||||||
5.150%, 06/13/41 | 2,202 | 2,271 | ||||
Morgan Stanley Capital I, Ser 2004-HQ3, Cl A4 | ||||||
4.800%, 01/13/41 | 2,256 | 2,243 | ||||
Morgan Stanley Capital I, Ser 2004-HQ4, Cl A7 | ||||||
4.970%, 04/14/40 | 6,653 | 6,648 | ||||
Morgan Stanley Capital I, Ser 2004-IQ7, Cl A4 | ||||||
5.537%, 06/15/38 (A) | 4,367 | 4,402 | ||||
Morgan Stanley Capital I, Ser 2005-HQ5, Cl A4 | ||||||
5.168%, 01/14/42 | 680 | 689 | ||||
Morgan Stanley Capital I, Ser 2005-HQ5, Cl AAB | ||||||
5.037%, 01/14/42 | 3,939 | 4,066 | ||||
Morgan Stanley Capital I, Ser 2005-HQ6, Cl A4A | ||||||
4.989%, 08/13/42 | 9,252 | 9,072 | ||||
| Description | Face Amount ($ Thousands) | Market Value ($ Thousands) | ||||
Morgan Stanley Capital I, Ser 2005-HQ7, Cl AAB | ||||||
5.355%, 11/14/42 (A) | $ | 2,829 | $ | 2,956 | ||
Morgan Stanley Capital I, Ser 2005-T17, Cl A5 | ||||||
4.780%, 12/13/41 | 692 | 697 | ||||
Morgan Stanley Capital I, Ser 2005-T17, Cl A4 | ||||||
4.520%, 12/13/41 | 211 | 213 | ||||
Morgan Stanley Capital I, Ser 2006-HQ10, Cl AM | ||||||
5.360%, 11/12/41 | 2,130 | 1,611 | ||||
Morgan Stanley Capital I, Ser 2006-HQ8, Cl A2 | ||||||
5.374%, 03/12/44 | 2,130 | 2,147 | ||||
Morgan Stanley Capital I, Ser 2006-HQ8, Cl A4 | ||||||
5.558%, 03/12/44 (A) | 2,789 | 2,662 | ||||
Morgan Stanley Capital I, Ser 2006-T21, Cl A4 | ||||||
5.162%, 10/12/52 (A) | 7,900 | 7,755 | ||||
Morgan Stanley Capital I, Ser 2007-HQ11, Cl A31 | ||||||
5.439%, 02/12/44 | 831 | 807 | ||||
Morgan Stanley Dean Witter Capital I, Ser 2000-LIFE, Cl A2 | ||||||
7.570%, 11/15/36 (A) | 529 | 529 | ||||
Morgan Stanley Dean Witter Capital I, Ser 2001-TOP5, Cl A4 | ||||||
6.390%, 10/15/35 | 6,886 | 7,257 | ||||
Morgan Stanley Dean Witter Capital I, Ser 2002-HQ, Cl A3 | ||||||
6.510%, 04/15/34 | 647 | 688 | ||||
Morgan Stanley Dean Witter Capital I, Ser 2002-IQ2, Cl A4 | ||||||
5.740%, 12/15/35 | 551 | 581 | ||||
Morgan Stanley Dean Witter Capital I, Ser 2003-HQ2, Cl A2 | ||||||
4.920%, 03/12/35 | 7,164 | 7,340 | ||||
Morgan Stanley Dean Witter Capital I, Ser 2003-TOP9, Cl A2 | ||||||
4.740%, 11/13/36 | 1,328 | 1,365 | ||||
Morgan Stanley Mortgage Loan Trust, Ser 2007-6XS, Cl 2A1S | ||||||
0.346%, 02/25/47 (A) | 679 | 516 | ||||
New York Mortgage Trust, Ser 2006-1, Cl 2A2 | ||||||
5.645%, 05/25/36 (A) | 788 | 656 | ||||
Nomura Asset Securities, Ser 1998-D6, Cl A1C | ||||||
6.690%, 03/15/30 | 4,921 | 5,278 | ||||
Prime Mortgage Trust, Ser 2004-CL1, Cl 1PO, PO | ||||||
0.000%, 02/25/34 | 177 | 134 | ||||
| 50 | SEI Institutional Investments Trust / Semi-Annual Report / November 30, 2009 |
Table of Contents
| Description | Face Amount ($ Thousands) | Market Value ($ Thousands) | ||||
Prime Mortgage Trust, Ser 2006-DR1, Cl 2A1 | ||||||
5.500%, 05/25/35 (B) | $ | 3,078 | $ | 2,483 | ||
RBSGC Mortgage Pass Through Certificates, Ser 2007-B, Cl 1A4 | ||||||
0.686%, 01/25/37 (A) | 6,546 | 3,227 | ||||
Residential Accredit Loans, Ser 2003-QS18, Cl A1 | ||||||
5.000%, 09/25/18 | 680 | 674 | ||||
Residential Accredit Loans, Ser 2003-QS19, Cl A1 | ||||||
5.750%, 10/25/33 | 632 | 607 | ||||
Residential Accredit Loans, Ser 2004-QS7, Cl A4 | ||||||
5.500%, 05/25/34 | 1,346 | 955 | ||||
Residential Accredit Loans, Ser 2005-Q02, Cl A1 | ||||||
1.992%, 09/25/45 (A) | 1,239 | 615 | ||||
Residential Accredit Loans, Ser 2006-QO8, Cl 1A1A | ||||||
0.326%, 10/25/46 (A) | 7,278 | 6,646 | ||||
Residential Asset Mortgage Products, Ser 2004-SL1, Cl A8 | ||||||
6.500%, 11/25/31 | 1,166 | 1,131 | ||||
Residential Asset Mortgage Products, Ser 2004-SL3, Cl A2 | ||||||
6.500%, 12/25/31 | 2,156 | 2,044 | ||||
Residential Asset Securitization Trust, Ser 2003-A5, Cl A1 | ||||||
5.500%, 06/25/33 | 686 | 655 | ||||
Residential Asset Securitization Trust, Ser 2004-IP2, Cl 2A1 | ||||||
3.362%, 12/25/34 (A) | 2,026 | 1,607 | ||||
Salomon Brothers Mortgage Securities VII, Ser 2000-C3, Cl A2 | ||||||
6.592%, 12/18/33 | 3,140 | 3,202 | ||||
Salomon Brothers Mortgage Securities VII, Ser 2002-KEY2, Cl A2 | ||||||
4.467%, 03/18/36 | 1,790 | 1,845 | ||||
Station Place Securitization Trust | ||||||
1.740%, 11/30/39 | 1,000 | 1,000 | ||||
Structured Adjustable Rate Mortgage Loan Trust, Ser 2005-18, Cl 1A1 | ||||||
5.624%, 09/25/35 (A) | 4,918 | 3,522 | ||||
Structured Adjustable Rate Mortgage Loan Trust, Ser 2005-19XS, Cl 1A1 | ||||||
0.556%, 10/25/35 (A) | 6,124 | 3,569 | ||||
Structured Asset Mortgage Investments, Ser 2004-AR8, Cl A1 | ||||||
0.577%, 05/19/35 (A) | 247 | 174 | ||||
Structured Asset Mortgage Investments, Ser 2006-AR6, Cl 1A3 | ||||||
0.426%, 07/25/46 (A) | 222 | 107 | ||||
| Description | Face Amount ($ Thousands) | Market Value ($ Thousands) | ||||
Structured Asset Mortgage Investments, Ser 2006-AR8, Cl A1A | ||||||
0.436%, 10/25/36 (A) | $ | 6,929 | $ | 3,263 | ||
Structured Asset Mortgage Investments, Ser 2007-AR4, Cl GA4B | ||||||
0.416%, 09/25/47 (A) | 19,753 | 9,858 | ||||
Structured Asset Securities, Ser 2003-16, Cl A3 | ||||||
0.736%, 06/25/33 (A) | 1,409 | 1,273 | ||||
Structured Asset Securities, Ser 2003-31A, Cl 2A7 | ||||||
3.165%, 10/25/33 (A) | 11,911 | 9,495 | ||||
Structured Asset Securities, Ser 2003-33H, Cl 1A1 | ||||||
5.500%, 10/25/33 | 1,271 | 1,227 | ||||
Structured Asset Securities, Ser 2004-5H, Cl A4 | ||||||
5.540%, 12/25/33 | 1,000 | 956 | ||||
Structured Asset Securities, Ser 2005-6 , Cl 5A8 | ||||||
13.428%, 05/25/35 (A) | 263 | 229 | ||||
Thornburg Mortgage Securities Trust, Ser 2003-4, Cl A1 | ||||||
0.556%, 09/25/43 (A) | 257 | 220 | ||||
Thornburg Mortgage Securities Trust, Ser 2007-4, Cl 2A1 | ||||||
6.209%, 09/25/37 (A) | 6,914 | 5,495 | ||||
Thornburg Mortgage Securities Trust, Ser 2007-4, Cl 3A1 | ||||||
6.196%, 09/25/37 (A) | 6,853 | 5,489 | ||||
TIAA Seasoned Commercial Mortgage Trust, Ser 2007-C4, Cl A3 | ||||||
6.073%, 08/15/39 (A) | 2,500 | 2,657 | ||||
US Bank National Mortgage Association, Ser 2007-1, Cl A | ||||||
5.920%, 05/25/12 | 6,530 | 6,955 | ||||
Vendee Mortgage Trust CMO, Ser 1993-1, Cl ZB | ||||||
7.250%, 02/15/23 | 3,200 | 3,544 | ||||
Virginia Housing Development Authority, Ser 2006-2, Cl CTFS | ||||||
6.000%, 06/25/34 | 706 | 702 | ||||
Wachovia Bank Commercial Mortgage Trust, Ser 2002-C1, Cl A4 | ||||||
6.287%, 04/15/34 | 2,587 | 2,751 | ||||
Wachovia Bank Commercial Mortgage Trust, Ser 2003-C6, Cl A3 | ||||||
4.957%, 08/15/35 (A) | 1,341 | 1,337 | ||||
| SEI Institutional Investments Trust / Semi-Annual Report / November 30, 2009 | 51 |
Table of Contents
SCHEDULE OF INVESTMENTS (Unaudited)
Core Fixed Income Fund (Continued)
November 30, 2009
| Description | Face Amount ($ Thousands) | Market Value ($ Thousands) | ||||
Wachovia Bank Commercial Mortgage Trust, Ser 2003-C7, Cl A1 | ||||||
4.241%, 10/15/35 (B) | $ | 439 | $ | 443 | ||
Wachovia Bank Commercial Mortgage Trust, Ser 2003-C8, Cl A3 | ||||||
4.445%, 11/15/35 | 1,021 | 1,021 | ||||
Wachovia Bank Commercial Mortgage Trust, Ser 2005-C18, Cl A4 | ||||||
4.935%, 04/15/42 | 1,945 | 1,928 | ||||
WaMu Mortgage Pass Through Certificates, Ser 2003-AR10, Cl A7 | ||||||
2.825%, 10/25/33 (A) | 745 | 659 | ||||
WaMu Mortgage Pass Through Certificates, Ser 2003-AR9, Cl 2A | ||||||
2.882%, 09/25/33 (A) | 464 | 451 | ||||
WaMu Mortgage Pass Through Certificates, Ser 2003-S11, Cl 2A5 | ||||||
16.401%, 11/25/33 (A) | 1,057 | 1,043 | ||||
WaMu Mortgage Pass Through Certificates, Ser 2003-S13, Cl 21A1 | ||||||
4.500%, 12/25/18 | 804 | 818 | ||||
WaMu Mortgage Pass Through Certificates, Ser 2003-S4, Cl 2A10 | ||||||
16.814%, 06/25/33 (A) | 192 | 174 | ||||
WaMu Mortgage Pass Through Certificates, Ser 2003-S9, Cl A8 | ||||||
5.250%, 10/25/33 | 2,063 | 1,873 | ||||
WaMu Mortgage Pass Through Certificates, Ser 2004-AR11, Cl A | ||||||
2.900%, 10/25/34 (A) | 56 | 53 | ||||
WaMu Mortgage Pass Through Certificates, Ser 2004-AR14, Cl A1 | ||||||
4.190%, 01/25/35 (A) | 1,940 | 1,797 | ||||
WaMu Mortgage Pass Through Certificates, Ser 2004-AR3, Cl A1 | ||||||
3.136%, 06/25/34 (A) | 380 | 353 | ||||
WaMu Mortgage Pass Through Certificates, Ser 2004-CB2, Cl 7A | ||||||
5.500%, 08/25/19 | 854 | 855 | ||||
WaMu Mortgage Pass Through Certificates, Ser 2006-AR13, Cl 2A | ||||||
2.912%, 10/25/46 (A) | 1,656 | 956 | ||||
WaMu Mortgage Pass Through Certificates, Ser 2007-HY3, Cl 4A1 | ||||||
5.318%, 03/25/37 (A) | 483 | 357 | ||||
| Description | Face Amount ($ Thousands) | Market Value ($ Thousands) | ||||
WaMu Mortgage Pass-Through Certificates, Ser 2002-AR18, Cl A | ||||||
4.189%, 01/25/33 (A) | $ | 399 | $ | 368 | ||
WaMu Mortgage Pass-Through Certificates, Ser 2003-MS1, Cl 1A | ||||||
5.000%, 02/25/18 | 645 | 659 | ||||
WaMu Mortgage Pass-Through Certificates, Ser 2005-AR11, Cl A1A | ||||||
0.556%, 08/25/45 (A) | 174 | 118 | ||||
WaMu Mortgage Pass-Through Certificates, Ser 2005-AR13, Cl A1A1 | ||||||
0.526%, 10/25/45 (A) | 4,396 | 3,060 | ||||
WaMu Mortgage Pass-Through Certificates, Ser 2005-AR15, Cl A1A2 | ||||||
0.516%, 11/25/45 (A) | 6,864 | 3,907 | ||||
WaMu Mortgage Pass-Through Certificates, Ser 2005-AR16, Cl 1A4A | ||||||
5.091%, 12/25/35 (A) | 13,585 | 9,056 | ||||
WaMu Mortgage Pass-Through Certificates, Ser 2005-AR19, Cl A1A2 | ||||||
0.526%, 12/25/45 (A) | 6,618 | 3,678 | ||||
WaMu Mortgage Pass-Through Certificates, Ser 2006-AR1, Cl 1A1B | ||||||
1.702%, 01/25/46 (A) | 3,478 | 831 | ||||
WaMu Mortgage Pass-Through Certificates, Ser 2006-AR14, Cl 1A4 | ||||||
5.606%, 11/25/36 (A) | 540 | 410 | ||||
WaMu Mortgage Pass-Through Certificates, Ser 2006-AR15, Cl 2A1B | ||||||
2.132%, 11/25/46 (A) | 2,200 | 645 | ||||
WaMu Mortgage Pass-Through Certificates, Ser 2006-AR15, Cl 1A | ||||||
1.472%, 11/25/46 (A) | 3,360 | 1,690 | ||||
WaMu Mortgage Pass-Through Certificates, Ser 2006-AR15, Cl 1A1B | ||||||
1.472%, 11/25/46 (A) | 1,938 | 533 | ||||
WaMu Mortgage Pass-Through Certificates, Ser 2006-AR17, Cl 1A1B | ||||||
1.442%, 12/25/46 (A) | 663 | 204 | ||||
WaMu Mortgage Pass-Through Certificates, Ser 2006-AR17, Cl 2A | ||||||
2.912%, 12/25/46 (A) | 759 | 399 | ||||
| 52 | SEI Institutional Investments Trust / Semi-Annual Report / November 30, 2009 |
Table of Contents
| Description | Face Amount ($ Thousands) | Market Value ($ Thousands) | ||||
WaMu Mortgage Pass-Through Certificates, Ser 2006-AR4, Cl DA | ||||||
1.602%, 06/25/46 (A) | $ | 1,447 | $ | 522 | ||
WaMu Mortgage Pass-Through Certificates, Ser 2006-AR7, Cl A1B | ||||||
1.552%, 09/25/46 (A) | 1,124 | 225 | ||||
WaMu Mortgage Pass-Through Certificates, Ser 2007-HY1, Cl 4A1 | ||||||
5.386%, 02/25/37 (A) | 9,596 | 6,015 | ||||
WaMu Mortgage Pass-Through Certificates, Ser 2007-HY1, Cl 1A1 | ||||||
5.672%, 02/25/37 (A) | 7,218 | 4,879 | ||||
WaMu Mortgage Pass-Through Certificates, Ser 2007-HY3, Cl 1A1 | ||||||
5.574%, 03/25/37 (A) | 8,250 | 5,312 | ||||
WaMu Mortgage Pass-Through Certificates, Ser 2007-OA5, Cl 1A | ||||||
1.382%, 06/25/47 (A) | 13,634 | 6,874 | ||||
WaMu Mortgage Pass-Through Certificates, Ser 2007-OA5, Cl A1B | ||||||
1.472%, 05/25/47 (A) | 17,036 | 3,535 | ||||
WaMu Mortgage Pass-Through Certificates, Ser 2007-OA6, Cl 1A | ||||||
1.442%, 07/25/47 (A) | 13,671 | 6,885 | ||||
Washington Mutual Alternative Mortgage Pass-Through Certificates, Ser 2005-3, Cl CX, IO | ||||||
5.500%, 05/25/35 | 912 | 123 | ||||
Washington Mutual Mortgage Pass Through Certificates, Ser 2003-AR6, Cl A1 | ||||||
3.052%, 06/25/33 (A) | 713 | 664 | ||||
Washington Mutual Mortgage Pass Through Certificates, Ser 2004-AR3, Cl A2 | ||||||
3.136%, 06/25/34 (A) | 498 | 462 | ||||
Washington Mutual MSC Mortgage Pass-Through CTFS, Ser 2003-MS8, Cl 1P, PO | ||||||
1.656%, 05/25/33 | 451 | 334 | ||||
Washington Mutual MSC Mortgage Pass-Through CTFS, Ser 2003-MS9, Cl 2P, PO | ||||||
1.655%, 04/25/33 | 894 | 551 | ||||
Wells Fargo Mortgage Backed Securities Trust, Ser 2003-15, Cl 1A1 | ||||||
4.750%, 12/25/18 | 2,854 | 2,918 | ||||
| Description | Face Amount ($ Thousands) | Market Value ($ Thousands) | ||||
Wells Fargo Mortgage Backed Securities Trust, Ser 2003-C, Cl A6 | ||||||
4.836%, 02/25/33 (A) | $ | 953 | $ | 927 | ||
Wells Fargo Mortgage Backed Securities Trust, Ser 2003-J, Cl 2A5 | ||||||
4.437%, 10/25/33 (A) | 436 | 423 | ||||
Wells Fargo Mortgage Backed Securities Trust, Ser 2003-K, Cl 1A1 | ||||||
4.473%, 11/25/33 (A) | 1,870 | 1,836 | ||||
Wells Fargo Mortgage Backed Securities Trust, Ser 2004-B, Cl A1 | ||||||
4.885%, 02/25/34 (A) | 1,259 | 1,196 | ||||
Wells Fargo Mortgage Backed Securities Trust, Ser 2004-E, Cl A2 | ||||||
4.500%, 05/25/34 (A) | 320 | 307 | ||||
Wells Fargo Mortgage Backed Securities Trust, Ser 2004-E, Cl A8 | ||||||
4.855%, 05/25/34 (A) | 1,000 | 976 | ||||
Wells Fargo Mortgage Backed Securities Trust, Ser 2004-EE, Cl 3A1 | ||||||
3.995%, 12/25/34 (A) | 412 | 409 | ||||
Wells Fargo Mortgage Backed Securities Trust, Ser 2004-EE, Cl 3A2 | ||||||
3.995%, 12/25/34 (A) | 618 | 606 | ||||
Wells Fargo Mortgage Backed Securities Trust, Ser 2004-EE, Cl 2A1 | ||||||
3.122%, 12/25/34 (A) | 1,164 | 1,110 | ||||
Wells Fargo Mortgage Backed Securities Trust, Ser 2004-I, Cl 1A1 | ||||||
3.689%, 07/25/34 (A) | 1,075 | 1,088 | ||||
Wells Fargo Mortgage Backed Securities Trust, Ser 2004-P, Cl 2A1 | ||||||
3.066%, 09/25/34 (A) | 742 | 678 | ||||
Wells Fargo Mortgage Backed Securities Trust, Ser 2004-V, Cl 1A1 | ||||||
3.301%, 10/25/34 (A) | 1,023 | 1,007 | ||||
Wells Fargo Mortgage Backed Securities Trust, Ser 2004-V, Cl 1A2 | ||||||
3.301%, 10/25/34 (A) | 818 | 809 | ||||
Wells Fargo Mortgage Backed Securities Trust, Ser 2005-AR8, Cl 2A1 | ||||||
3.530%, 06/25/35 (A) | 1,381 | 1,254 | ||||
| SEI Institutional Investments Trust / Semi-Annual Report / November 30, 2009 | 53 |
Table of Contents
SCHEDULE OF INVESTMENTS (Unaudited)
Core Fixed Income Fund (Continued)
November 30, 2009
| Description | Face Amount ($ Thousands) | Market Value ($ Thousands) | ||||
Wells Fargo Mortgage-Backed Securities Trust, Ser 2004-EE, Cl 2A2 | ||||||
3.122%, 12/25/34 (A) | $ | 776 | $ | 744 | ||
Wells Fargo Mortgage-Backed Securities Trust, Ser 2004-L, Cl A6 | ||||||
4.762%, 07/25/34 (A) | 895 | 875 | ||||
Wells Fargo Mortgage-Backed Securities Trust, Ser 2004-L, Cl A5 | ||||||
4.762%, 07/25/34 (A) | 881 | 881 | ||||
Wells Fargo Mortgage-Backed Securities Trust, Ser 2004-O, Cl A1 | ||||||
4.866%, 08/25/34 (A) | 800 | 799 | ||||
Wells Fargo Mortgage-Backed Securities Trust, Ser 2005-AR14, Cl A1 | ||||||
5.386%, 08/25/35 (A) | 1,038 | 901 | ||||
Wells Fargo Mortgage-Backed Securities Trust, Ser 2006-2, Cl 3A1 | ||||||
5.750%, 03/25/36 | 12,068 | 10,401 | ||||
Wells Fargo Mortgage-Backed Securities Trust, Ser 2006-AR18, Cl 1A1 | ||||||
5.918%, 11/25/36 (A) | 1,253 | 1,020 | ||||
| 864,614 | ||||||
Total Mortgage-Backed Securities | 2,789,624 | |||||
CORPORATE OBLIGATIONS — 26.9% | ||||||
Consumer Discretionary — 1.4% | ||||||
British Sky Broadcasting Group | ||||||
9.500%, 11/15/18 (B) | 3,475 | 4,577 | ||||
Comcast | ||||||
6.500%, 01/15/17 | 2,455 | 2,730 | ||||
6.500%, 01/15/15 | 3,635 | 4,086 | ||||
5.700%, 05/15/18 (C) | 2,320 | 2,464 | ||||
Comcast Cable Communications | ||||||
8.375%, 03/15/13 | 3,412 | 3,994 | ||||
6.750%, 01/30/11 (C) | 1,840 | 1,951 | ||||
CVS | ||||||
5.789%, 01/10/26 (B) | 1,981 | 1,882 | ||||
CVS Lease Pass-Through (B) | ||||||
6.036%, 12/10/28 | 10,117 | 10,271 | ||||
5.880%, 01/10/28 | 178 | 177 | ||||
DaimlerChrysler | ||||||
7.300%, 01/15/12 | 2,515 | 2,766 | ||||
6.500%, 11/15/13 | 460 | 508 | ||||
Eastman Kodak | ||||||
7.250%, 11/15/13 | 2,445 | 1,944 | ||||
| Description | Face Amount ($ Thousands) | Market Value ($ Thousands) | ||||
Grupo Televisa | ||||||
6.625%, 01/15/40 (B) | $ | 2,900 | $ | 2,849 | ||
JetBlue Airways Private Trust, Ser 2004-2, Cl G1 | ||||||
0.648%, 08/15/16 (A) | 5,823 | 4,251 | ||||
Kohl’s | ||||||
6.250%, 12/15/17 | 255 | 287 | ||||
McDonald’s MTN | ||||||
5.350%, 03/01/18 (C) | 3,770 | 4,181 | ||||
Rogers Cable | ||||||
5.500%, 03/15/14 | 1,165 | 1,264 | ||||
Staples | ||||||
9.750%, 01/15/14 | 305 | 369 | ||||
Target | ||||||
4.000%, 06/15/13 | 355 | 377 | ||||
Thomson Reuters | ||||||
5.950%, 07/15/13 | 1,655 | 1,859 | ||||
4.700%, 10/15/19 | 250 | 257 | ||||
Time Warner | ||||||
7.700%, 05/01/32 | 1,385 | 1,624 | ||||
6.875%, 05/01/12 | 130 | 144 | ||||
Time Warner Cable | ||||||
8.750%, 02/14/19 | 5,170 | 6,439 | ||||
8.250%, 04/01/19 | 3,235 | 3,938 | ||||
7.300%, 07/01/38 | 400 | 451 | ||||
6.750%, 07/01/18 | 120 | 134 | ||||
5.850%, 05/01/17 | 1,230 | 1,311 | ||||
Time Warner Entertainment | ||||||
8.375%, 07/15/33 | 1,180 | 1,416 | ||||
Viacom | ||||||
6.250%, 04/30/16 | 300 | 331 | ||||
Wal-Mart Stores | ||||||
6.200%, 04/15/38 | 1,550 | 1,751 | ||||
5.800%, 02/15/18 (C) | 3,360 | 3,825 | ||||
| 74,408 | ||||||
Consumer Staples — 0.9% | ||||||
Altria Group | ||||||
9.700%, 11/10/18 | 4,705 | 5,831 | ||||
Anheuser-Busch InBev Worldwide (B) | ||||||
7.750%, 01/15/19 | 5,565 | 6,674 | ||||
7.200%, 01/15/14 | 100 | 115 | ||||
5.375%, 01/15/20 | 3,150 | 3,306 | ||||
Bunge Finance | ||||||
8.500%, 06/15/19 | 350 | 408 | ||||
5.900%, 04/01/17 | 107 | 108 | ||||
Cargill | ||||||
7.350%, 03/06/19 (B) | 400 | 475 | ||||
CVS Caremark | ||||||
6.600%, 03/15/19 | 280 | 314 | ||||
Diageo Capital | ||||||
7.375%, 01/15/14 | 8,580 | 10,090 | ||||
Diageo Finance BV | ||||||
5.500%, 04/01/13 | 300 | 329 | ||||
| 54 | SEI Institutional Investments Trust / Semi-Annual Report / November 30, 2009 |
Table of Contents
| Description | Face Amount ($ Thousands) | Market Value ($ Thousands) | ||||
GlaxoSmithKline Capital | ||||||
4.375%, 04/15/14 | $ | 200 | $ | 215 | ||
Kraft Foods | ||||||
6.750%, 02/19/14 | 200 | 225 | ||||
6.125%, 08/23/18 | 700 | 754 | ||||
PepsiCo | ||||||
7.900%, 11/01/18 (C) | 4,000 | 5,090 | ||||
Roche Holdings | ||||||
6.000%, 03/01/19 (B) (C) | 2,310 | 2,607 | ||||
SABMiller | ||||||
5.500%, 08/15/13 (B) | 320 | 347 | ||||
Safeway | ||||||
6.350%, 08/15/17 | 5,196 | 5,820 | ||||
Wyeth | ||||||
5.950%, 04/01/37 (C) | 3,610 | 3,963 | ||||
| 46,671 | ||||||
Energy — 3.5% | ||||||
Anadarko Finance, Ser B | ||||||
7.500%, 05/01/31 | 3,293 | 3,733 | ||||
Anadarko Petroleum | ||||||
8.700%, 03/15/19 | 4,600 | 5,761 | ||||
6.950%, 06/15/19 | 90 | 103 | ||||
6.450%, 09/15/36 | 955 | 1,003 | ||||
5.950%, 09/15/16 | 5,010 | 5,467 | ||||
Apache | ||||||
6.000%, 09/15/13 | 3,300 | 3,747 | ||||
5.625%, 01/15/17 | 390 | 432 | ||||
Baker Hughes | ||||||
7.500%, 11/15/18 | 5,380 | 6,652 | ||||
Cenovus Energy | ||||||
5.700%, 10/15/19 (B) | 2,730 | 2,894 | ||||
Conoco Funding | ||||||
7.250%, 10/15/31 | 885 | 1,049 | ||||
6.950%, 04/15/29 | 3,685 | 4,278 | ||||
6.350%, 10/15/11 | 430 | 473 | ||||
ConocoPhillips | ||||||
6.000%, 01/15/20 | 460 | 517 | ||||
5.900%, 10/15/32 | 10 | 10 | ||||
5.900%, 05/15/38 | 700 | 738 | ||||
Duke Capital LLC | ||||||
8.000%, 10/01/19 | 702 | 833 | ||||
El Paso | ||||||
6.950%, 06/01/28 | 2,250 | 1,946 | ||||
EnCana | ||||||
6.500%, 05/15/19 | 565 | 639 | ||||
Energy Transfer Partners | ||||||
9.000%, 04/15/19 | 3,025 | 3,687 | ||||
8.500%, 04/15/14 | 2,095 | 2,450 | ||||
6.700%, 07/01/18 | 4,900 | 5,403 | ||||
Enterprise Products Operating LLC | ||||||
9.750%, 01/31/14 | 7,250 | 8,829 | ||||
Gaz Capital for Gazprom | ||||||
6.212%, 11/22/16 (B) | 427 | 414 | ||||
| Description | Face Amount ($ Thousands) | Market Value ($ Thousands) | ||||
Halliburton | ||||||
6.150%, 09/15/19 | $ | 300 | $ | 342 | ||
Hess | ||||||
8.125%, 02/15/19 | 4,200 | 5,168 | ||||
7.875%, 10/01/29 | 1,130 | 1,351 | ||||
7.300%, 08/15/31 | 4,335 | 5,002 | ||||
Husky Energy | ||||||
7.250%, 12/15/19 | 2,765 | 3,232 | ||||
5.900%, 06/15/14 | 1,590 | 1,748 | ||||
Kerr-McGee | ||||||
6.950%, 07/01/24 | 2,325 | 2,528 | ||||
Kinder Morgan Energy Partners | ||||||
7.125%, 03/15/12 | 1,760 | 1,942 | ||||
6.950%, 01/15/38 | 455 | 492 | ||||
6.000%, 02/01/17 | 3,140 | 3,386 | ||||
5.950%, 02/15/18 (C) | 350 | 376 | ||||
5.000%, 12/15/13 | 1,190 | 1,265 | ||||
Knight | ||||||
6.500%, 09/01/12 | 7,315 | 7,516 | ||||
Marathon Oil | ||||||
7.500%, 02/15/19 | 300 | 354 | ||||
Occidental Petroleum | ||||||
7.000%, 11/01/13 | 7,060 | 8,279 | ||||
Pemex Project Funding Master Trust | ||||||
6.625%, 06/15/35 | 5,602 | 5,633 | ||||
0.855%, 12/03/12 (A) (B) | 201 | 193 | ||||
Petrobras International Finance | ||||||
7.875%, 03/15/19 (C) | 4,280 | 5,000 | ||||
6.875%, 01/20/40 | 2,245 | 2,312 | ||||
6.125%, 10/06/16 (C) | 1,890 | 2,022 | ||||
5.750%, 01/20/20 | 537 | 547 | ||||
Petro-Canada | ||||||
6.800%, 05/15/38 | 250 | 275 | ||||
6.050%, 05/15/18 | 260 | 283 | ||||
Ras Laffan Liquefied Natural Gas III | ||||||
5.500%, 09/30/14 (B) (C) | 3,400 | 3,570 | ||||
4.500%, 09/30/12 (B) | 3,160 | 3,270 | ||||
Shell International Finance BV | ||||||
6.375%, 12/15/38 | 2,790 | 3,248 | ||||
4.300%, 09/22/19 | 1,000 | 1,025 | ||||
4.000%, 03/21/14 | 5,030 | 5,355 | ||||
Sonat | ||||||
7.625%, 07/15/11 | 2,880 | 2,926 | ||||
Southern Union | ||||||
8.250%, 11/15/29 | 5,018 | 5,716 | ||||
Statoil | ||||||
2.900%, 10/15/14 | 3,545 | 3,622 | ||||
Suncor Energy | ||||||
6.500%, 06/15/38 (C) | 3,250 | 3,452 | ||||
Talisman Energy | ||||||
7.750%, 06/01/19 | 390 | 467 | ||||
Total Capital | ||||||
3.125%, 10/02/15 | 6,320 | 6,445 | ||||
TransCanada PipeLines | ||||||
6.500%, 08/15/18 | 425 | 490 | ||||
| SEI Institutional Investments Trust / Semi-Annual Report / November 30, 2009 | 55 |
Table of Contents
SCHEDULE OF INVESTMENTS (Unaudited)
Core Fixed Income Fund (Continued)
November 30, 2009
| Description | Face Amount ($ Thousands) | Market Value ($ Thousands) | ||||
Union Pacific Resources Group | ||||||
7.150%, 05/15/28 | $ | 150 | $ | 152 | ||
Valero Energy | ||||||
9.375%, 03/15/19 | 7,000 | 8,452 | ||||
6.625%, 06/15/37 | 1,500 | 1,449 | ||||
Williams | ||||||
8.750%, 01/15/20 | 3,765 | 4,400 | ||||
8.750%, 03/15/32 | 2,170 | 2,540 | ||||
7.875%, 09/01/21 | 3,865 | 4,313 | ||||
7.750%, 06/15/31 | 740 | 801 | ||||
Williams, Ser A | ||||||
7.500%, 01/15/31 | 20 | 21 | ||||
XTO Energy | ||||||
7.500%, 04/15/12 | 1,320 | 1,477 | ||||
6.750%, 08/01/37 | 390 | 433 | ||||
6.250%, 08/01/17 | 380 | 421 | ||||
5.650%, 04/01/16 | 390 | 416 | ||||
5.500%, 06/15/18 | 5,622 | 5,955 | ||||
4.625%, 06/15/13 | 100 | 105 | ||||
| 190,825 | ||||||
Financials — 13.6% | ||||||
Achmea Hypotheekbank | ||||||
3.200%, 11/03/14 (B) | 7,220 | 7,400 | ||||
Aegon, Ser CMS | ||||||
3.570%, 07/29/49 (A) | 2,180 | 1,040 | ||||
Aiful | ||||||
5.000%, 08/10/10 (B) (C) | 2,620 | 1,598 | ||||
Allied World Assurance Holdings | ||||||
7.500%, 08/01/16 | 2,000 | 2,149 | ||||
Allstate | ||||||
5.000%, 08/15/14 | 300 | 321 | ||||
American Express | ||||||
8.150%, 03/19/38 | 2,110 | 2,663 | ||||
7.250%, 05/20/14 (C) | 2,470 | 2,822 | ||||
6.800%, 09/01/66 (A) | 2,545 | 2,138 | ||||
5.875%, 05/02/13 | 2,100 | 2,277 | ||||
American Express Credit MTN | ||||||
7.300%, 08/20/13 | 500 | 568 | ||||
5.125%, 08/25/14 | 5,900 | 6,282 | ||||
American General Finance MTN | ||||||
6.900%, 12/15/17 | 1,500 | 1,053 | ||||
American International Group | ||||||
8.250%, 08/15/18 | 980 | 847 | ||||
6.250%, 03/15/37 | 5,000 | 2,425 | ||||
5.850%, 01/16/18 | 2,670 | 2,027 | ||||
ASIF Global Financing XIX | ||||||
4.900%, 01/17/13 (B) | 450 | 416 | ||||
Associates Corp of North America | ||||||
6.950%, 11/01/18 | 200 | 206 | ||||
Australia & New Zealand Banking Group | ||||||
0.720%, 10/29/49 (A) | 1,400 | 835 | ||||
BA Covered Bond Issuer | ||||||
5.500%, 06/14/12 (B) | 1,500 | 1,620 | ||||
| Description | Face Amount ($ Thousands) | Market Value ($ Thousands) | ||||
BAC Capital Trust XIV | ||||||
5.630%, 03/15/12 (A) | $ | 180 | $ | 119 | ||
BAC Capital Trust XV | ||||||
1.161%, 06/01/56 (A) | 9,235 | 5,730 | ||||
Bank of America | ||||||
7.625%, 06/01/19 | 200 | 229 | ||||
7.375%, 05/15/14 | 7,705 | 8,649 | ||||
6.500%, 08/01/16 | 500 | 531 | ||||
6.000%, 09/01/17 | 2,125 | 2,199 | ||||
5.750%, 12/01/17 | 4,545 | 4,635 | ||||
5.420%, 03/15/17 | 2,500 | 2,436 | ||||
Bank of Ireland | ||||||
0.563%, 12/29/49 (A) | 1,030 | 283 | ||||
Bank of New York Mellon MTN | ||||||
4.600%, 01/15/20 | 160 | 164 | ||||
Bank of Scotland | ||||||
1.500%, 11/29/49 (A) | 330 | 168 | ||||
Bank One | ||||||
7.875%, 08/01/10 | 4,440 | 4,654 | ||||
Barclays Bank | ||||||
6.050%, 12/04/17 (B) | 2,490 | 2,592 | ||||
5.200%, 07/10/14 | 1,430 | 1,534 | ||||
5.000%, 09/22/16 | 7,735 | 8,023 | ||||
2.500%, 01/23/13 | 500 | 502 | ||||
0.875%, 08/07/49 (A) | 380 | 201 | ||||
Barnett Capital III | ||||||
0.906%, 02/01/27 (A) | 600 | 413 | ||||
Barrick International Bank | ||||||
6.350%, 10/15/36 (B) | 5,200 | 5,552 | ||||
BB&T | ||||||
6.850%, 04/30/19 | 350 | 398 | ||||
4.900%, 06/30/17 | 400 | 396 | ||||
3.850%, 07/27/12 | 150 | 156 | ||||
3.375%, 09/25/13 | 620 | 631 | ||||
Bear Stearns | ||||||
7.250%, 02/01/18 | 4,280 | 4,949 | ||||
6.950%, 08/10/12 | 1,665 | 1,871 | ||||
6.400%, 10/02/17 (C) | 11,750 | 12,956 | ||||
4.650%, 07/02/18 | 3,000 | 2,985 | ||||
BNP Paribas | ||||||
0.738%, 03/23/87 (A) | 510 | 383 | ||||
Boeing Capital | ||||||
4.700%, 10/27/19 | 920 | 931 | ||||
BP Capital Markets | ||||||
5.250%, 11/07/13 | 7,600 | 8,455 | ||||
3.875%, 03/10/15 | 9,990 | 10,527 | ||||
3.625%, 05/08/14 | 100 | 105 | ||||
Capital One Bank USA | ||||||
8.800%, 07/15/19 | 2,480 | 2,937 | ||||
Capital One Financial | ||||||
7.375%, 05/23/14 | 450 | 516 | ||||
6.750%, 09/15/17 | 590 | 651 | ||||
Caterpillar Financial Services MTN | ||||||
7.150%, 02/15/19 | 250 | 301 | ||||
| 56 | SEI Institutional Investments Trust / Semi-Annual Report / November 30, 2009 |
Table of Contents
| Description | Face Amount ($ Thousands) | Market Value ($ Thousands) | ||||
6.200%, 09/30/13 (C) | $ | 5,640 | $ | 6,307 | ||
5.850%, 09/01/17 | 580 | 635 | ||||
Cedar Brakes II LLC | ||||||
9.875%, 09/01/13 (B) | 3,592 | 3,675 | ||||
Chase Capital VI | ||||||
0.906%, 08/01/28 (A) | 2,000 | 1,424 | ||||
Citigroup | ||||||
8.500%, 05/22/19 | 600 | 678 | ||||
8.125%, 07/15/39 | 3,450 | 3,793 | ||||
6.875%, 03/05/38 (C) | 9,660 | 9,361 | ||||
6.500%, 08/19/13 | 2,920 | 3,116 | ||||
6.375%, 08/12/14 | 2,650 | 2,787 | ||||
6.125%, 08/25/36 | 2,000 | 1,698 | ||||
5.500%, 02/15/17 | 10,000 | 9,518 | ||||
5.500%, 04/11/13 | 3,699 | 3,823 | ||||
5.500%, 10/15/14 | 1,000 | 1,019 | ||||
5.000%, 09/15/14 | 2,890 | 2,809 | ||||
0.812%, 08/25/36 (A) | 2,839 | 1,594 | ||||
Citigroup Capital III | ||||||
7.625%, 12/01/36 | 2,000 | 1,330 | ||||
Citigroup Capital XXI | ||||||
8.300%, 12/21/57 (A) (C) | 1,703 | 1,516 | ||||
Citigroup Funding MTN | ||||||
1.875%, 10/22/12 | 6,280 | 6,367 | ||||
0.611%, 04/30/12 (A) | 4,900 | 4,943 | ||||
Comerica Capital Trust II | ||||||
6.576%, 02/20/37 (A) | 220 | 163 | ||||
Commonwealth Bank of Australia | ||||||
5.000%, 10/15/19 (B) (C) | 3,805 | 3,909 | ||||
3.750%, 10/15/14 (B) | 5,025 | 5,147 | ||||
Corestates Capital I | ||||||
8.000%, 12/15/26 (B) | 629 | 623 | ||||
Countrywide Financial MTN | ||||||
5.800%, 06/07/12 | 5,283 | 5,648 | ||||
4.000%, 03/22/11 | 5,750 | 5,874 | ||||
Credit Agricole | ||||||
8.375%, 12/31/49 (A) (B) (C) | 4,740 | 4,977 | ||||
Credit Suisse NY | ||||||
6.000%, 02/15/18 | 9,445 | 10,103 | ||||
5.500%, 05/01/14 | 1,775 | 1,947 | ||||
5.300%, 08/13/19 | 600 | 629 | ||||
5.000%, 05/15/13 | 8,500 | 9,179 | ||||
3.450%, 07/02/12 | 300 | 312 | ||||
Credit Suisse USA | ||||||
5.125%, 08/15/15 | 310 | 334 | ||||
5.125%, 01/15/14 | 335 | 360 | ||||
Depfa ACS Bank | ||||||
5.125%, 03/16/37 (B) | 4,200 | 3,263 | ||||
Deutsche Bank MTN | ||||||
3.875%, 08/18/14 | 295 | 305 | ||||
Deutsche Bank Capital Funding Trust | ||||||
5.628%, 01/19/49 (A) (B) | 4,789 | 3,520 | ||||
Discover Financial Services | ||||||
0.830%, 06/11/10 (A) | 3,547 | 3,510 | ||||
| Description | Face Amount ($ Thousands) | Market Value ($ Thousands) | ||||
Dresdner Funding Trust I | ||||||
8.151%, 06/30/31 (B) | $ | 365 | $ | 272 | ||
ERP Operating | ||||||
5.750%, 06/15/17‡ | 500 | 512 | ||||
5.125%, 03/15/16‡ | 1,000 | 995 | ||||
Export-Import Bank of Korea | ||||||
5.875%, 01/14/15 | 3,560 | 3,865 | ||||
5.500%, 10/17/12 | 2,320 | 2,484 | ||||
Farmers Exchange Capital | ||||||
7.200%, 07/15/48 (B) | 2,519 | 2,017 | ||||
7.050%, 07/15/28 (B) | 1,063 | 914 | ||||
Farmers Insurance Exchange | ||||||
8.625%, 05/01/24 (B) | 4,118 | 4,053 | ||||
First Industrial MTN | ||||||
7.500%, 12/01/17 | 1,765 | 1,404 | ||||
Fleet Capital Trust II | ||||||
7.920%, 12/11/26 | 1,600 | 1,496 | ||||
FMR LLC | ||||||
6.450%, 11/15/39 (B) | 250 | 252 | ||||
General Electric Capital | ||||||
6.875%, 01/10/39 | 6,761 | 7,090 | ||||
6.375%, 11/15/67 (A) | 8,925 | 7,341 | ||||
6.000%, 08/07/19 | 550 | 579 | ||||
5.900%, 05/13/14 | 5,010 | 5,495 | ||||
5.625%, 09/15/17 | 800 | 836 | ||||
5.625%, 05/01/18 | 8,225 | 8,495 | ||||
5.450%, 01/15/13 | 180 | 194 | ||||
5.400%, 02/15/17 | 1,800 | 1,857 | ||||
0.658%, 05/05/26 (A) | 4,345 | 3,462 | ||||
0.559%, 09/15/14 (A) | 6,550 | 6,080 | ||||
0.404%, 04/10/12 (A) | 500 | 486 | ||||
0.399%, 03/20/14 (A) | 2,000 | 1,847 | ||||
Glitnir Banki (B) (D) | ||||||
7.451%, 09/14/16 | 500 | — | ||||
6.693%, 06/15/16 | 4,480 | — | ||||
6.375%, 09/25/12 | 3,100 | 667 | ||||
6.330%, 07/28/11 | 2,440 | 525 | ||||
GMAC | ||||||
1.750%, 10/30/12 | 3,960 | 4,001 | ||||
GMAC LLC | ||||||
8.000%, 12/31/18 (B) (C) | 305 | 253 | ||||
7.750%, 01/19/10 (B) | 1,545 | 1,543 | ||||
7.500%, 12/31/13 (B) | 2,110 | 1,941 | ||||
7.250%, 03/02/11 (B) (C) | 1,744 | 1,705 | ||||
2.455%, 12/01/14 (A) (B) | 4,579 | 3,549 | ||||
Goldman Sachs Capital II | ||||||
5.793%, 12/29/49 (A) | 23,795 | 17,489 | ||||
Goldman Sachs Group | ||||||
7.500%, 02/15/19 (C) | 6,675 | 7,883 | ||||
6.750%, 10/01/37 | 4,405 | 4,534 | ||||
6.600%, 01/15/12 | 2,630 | 2,877 | ||||
6.250%, 09/01/17 | 1,400 | 1,528 | ||||
6.150%, 04/01/18 | 7,800 | 8,419 | ||||
5.950%, 01/18/18 | 500 | 535 | ||||
| SEI Institutional Investments Trust / Semi-Annual Report / November 30, 2009 | 57 |
Table of Contents
SCHEDULE OF INVESTMENTS (Unaudited)
Core Fixed Income Fund (Continued)
November 30, 2009
| Description | Face Amount ($ Thousands) | Market Value ($ Thousands) | ||||
5.450%, 11/01/12 | $ | 6,770 | $ | 7,364 | ||
5.150%, 01/15/14 | 470 | 500 | ||||
5.125%, 01/15/15 | 2,095 | 2,224 | ||||
4.500%, 06/15/10 | 450 | 459 | ||||
3.625%, 08/01/12 | 300 | 312 | ||||
0.784%, 01/12/15 (A) | 3,000 | 2,912 | ||||
0.683%, 07/22/15 (A) | 1,000 | 926 | ||||
HBOS | ||||||
6.750%, 05/21/18 (B) (C) | 5,100 | 4,742 | ||||
HBOS Capital Funding | ||||||
6.071%, 06/30/49 (A) (B) | 1,920 | 1,210 | ||||
HCP | ||||||
6.700%, 01/30/18‡ | 1,120 | 1,134 | ||||
6.300%, 09/15/16‡ | 975 | 982 | ||||
6.000%, 01/30/17‡ | 6,610 | 6,511 | ||||
5.650%, 12/15/13‡ | 3,305 | 3,364 | ||||
Highwoods Properties | ||||||
7.500%, 04/15/18‡ | 1,339 | 1,336 | ||||
Hongkong & Shanghai Banking | ||||||
0.438%, 07/22/49 (A) | 195 | 119 | ||||
HRPT Properties Trust | ||||||
6.650%, 01/15/18‡ | 150 | 142 | ||||
6.250%, 08/15/16‡ | 300 | 292 | ||||
HSBC Bank | ||||||
1.288%, 06/29/49 (A) | 1,160 | 708 | ||||
HSBC Finance | ||||||
8.000%, 07/15/10 | 2,330 | 2,424 | ||||
7.000%, 05/15/12 | 1,975 | 2,168 | ||||
6.375%, 11/27/12 | 365 | 399 | ||||
5.500%, 01/19/16 | 600 | 638 | ||||
4.750%, 07/15/13 | 166 | 174 | ||||
0.534%, 01/15/14 (A) | 500 | 463 | ||||
HSBC Holdings | ||||||
6.800%, 06/01/38 | 1,975 | 2,178 | ||||
Hutchison Whampoa International | ||||||
5.750%, 09/11/19 (B) | 2,330 | 2,402 | ||||
4.625%, 09/11/15 (B) | 6,890 | 7,022 | ||||
ILFC E-Capital Trust II | ||||||
6.250%, 12/21/65 (A) (B) (C) | 1,200 | 552 | ||||
International Lease Finance MTN | ||||||
5.250%, 01/10/13 | 400 | 322 | ||||
Jackson National Life Global Funding MTN | ||||||
5.375%, 05/08/13 (B) | 610 | 629 | ||||
Jefferies Group | ||||||
6.450%, 06/08/27 | 590 | 502 | ||||
6.250%, 01/15/36 | 400 | 324 | ||||
John Deere Capital MTN | ||||||
5.750%, 09/10/18 | 300 | 336 | ||||
JPMorgan Chase | ||||||
7.900%, 04/29/49 (A) (C) | 5,732 | 5,605 | ||||
6.400%, 05/15/38 (C) | 2,800 | 3,100 | ||||
6.300%, 04/23/19 | 2,200 | 2,452 | ||||
5.750%, 01/02/13 | 3,670 | 3,979 | ||||
| Description | Face Amount ($ Thousands) | Market Value ($ Thousands) | ||||
5.375%, 10/01/12 | $ | 3,605 | $ | 3,953 | ||
5.150%, 10/01/15 | 240 | 253 | ||||
5.125%, 09/15/14 | 756 | 802 | ||||
4.650%, 06/01/14 | 2,820 | 3,012 | ||||
JPMorgan Chase Bank | ||||||
6.000%, 10/01/17 | 5,150 | 5,518 | ||||
0.630%, 06/13/16 (A) | 4,250 | 3,845 | ||||
JPMorgan Chase Capital XIII | ||||||
1.232%, 09/30/34 (A) | 1,440 | 998 | ||||
JPMorgan Chase Capital XXII | ||||||
6.450%, 02/02/37 | 500 | 450 | ||||
JPMorgan Chase Capital XXV | ||||||
6.800%, 10/01/37 | 3,135 | 3,102 | ||||
Kaupthing Bank (B) (D) | ||||||
7.625%, 02/28/15 | 8,130 | 1,890 | ||||
7.125%, 05/19/16 | 12,000 | 1 | ||||
5.750%, 10/04/11 | 1,120 | 260 | ||||
KeyBank | ||||||
5.800%, 07/01/14 | 600 | 598 | ||||
Landsbanki Islands | ||||||
6.100%, 08/25/11 (B) (D) | 6,520 | 342 | ||||
Lazard Group | ||||||
7.125%, 05/15/15 | 4,520 | 4,719 | ||||
6.850%, 06/15/17 | 4,515 | 4,631 | ||||
Lehman Brothers Holdings MTN | ||||||
6.750%, 12/28/17 (D) | 10,370 | 1 | ||||
6.500%, 07/19/17 (D) | 4,040 | — | ||||
6.200%, 09/26/14 (D) | 1,560 | 304 | ||||
5.250%, 02/06/12 (D) | 965 | 188 | ||||
Lehman Brothers Holdings Capital Trust VII MTN | ||||||
5.857%, 11/29/49 (D) | 20,630 | 2 | ||||
Liberty Mutual Group | ||||||
7.500%, 08/15/36 (B) | 2,028 | 1,825 | ||||
Lloyds Banking Group | ||||||
5.920%, 09/29/49 (A) (B) | 8,400 | 4,452 | ||||
M&T Bank | ||||||
5.375%, 05/24/12 | 325 | 338 | ||||
Mack-Cali Realty | ||||||
7.750%, 08/15/19‡ | 980 | 1,045 | ||||
MassMutual Global Funding II | ||||||
3.625%, 07/16/12 (B) | 150 | 156 | ||||
MBNA Capital, Ser A | ||||||
8.278%, 12/01/26 | 2,465 | 2,354 | ||||
Merna Reinsurance | ||||||
2.032%, 07/07/10 (A) (B) | 4,950 | 4,864 | ||||
Merrill Lynch | ||||||
7.430%, 09/01/22 | 4 | 4 | ||||
6.875%, 04/25/18 | 980 | 1,053 | ||||
6.400%, 08/28/17 | 900 | 946 | ||||
6.150%, 04/25/13 | 210 | 226 | ||||
5.700%, 05/02/17 | 600 | 595 | ||||
MetLife | ||||||
7.717%, 02/15/19 (C) | 3,500 | 4,197 | ||||
6.400%, 12/15/36 | 10,020 | 8,342 | ||||
| 58 | SEI Institutional Investments Trust / Semi-Annual Report / November 30, 2009 |
Table of Contents
| Description | Face Amount ($ Thousands) | Market Value ($ Thousands) | ||||
MetLife Capital Trust X | ||||||
9.250%, 04/08/38 (A) (B) | $ | 2,700 | $ | 2,808 | ||
Metropolitan Life Global Funding I | ||||||
5.125%, 04/10/13 (B) | 200 | 215 | ||||
5.125%, 06/10/14 (B) | 1,275 | 1,369 | ||||
2.875%, 09/17/12 (B) | 600 | 607 | ||||
Monumental Global Funding | ||||||
5.500%, 04/22/13 (B) | 235 | 247 | ||||
Morgan Stanley MTN | ||||||
7.250%, 04/01/32 | 1,990 | 2,283 | ||||
6.625%, 04/01/18 | 6,650 | 7,215 | ||||
6.250%, 08/28/17 | 550 | 589 | ||||
6.000%, 05/13/14 | 9,796 | 10,675 | ||||
5.950%, 12/28/17 (C) | 4,045 | 4,252 | ||||
5.625%, 09/23/19 | 3,660 | 3,707 | ||||
5.550%, 04/27/17 | 514 | 523 | ||||
5.300%, 03/01/13 | 400 | 427 | ||||
5.250%, 11/02/12 | 2,090 | 2,242 | ||||
4.750%, 04/01/14 | 2,270 | 2,310 | ||||
4.200%, 11/20/14 | 1,836 | 1,844 | ||||
0.734%, 10/18/16 (A) (C) | 7,725 | 6,957 | ||||
0.642%, 06/20/12 (A) | 7,510 | 7,581 | ||||
0.584%, 01/09/14 (A) | 1,475 | 1,394 | ||||
0.564%, 01/15/10 (A) (C) | 2,250 | 2,251 | ||||
0.534%, 01/18/11 (A) | 525 | 522 | ||||
MUFG Capital Finance 1 | ||||||
6.346%, 07/25/49 (A) | 1,840 | 1,660 | ||||
6.346%, 07/25/49 (A) | 378 | 329 | ||||
National Australia Bank | ||||||
5.350%, 06/12/13 (B) | 5,495 | 5,984 | ||||
National Capital Trust II | ||||||
5.486%, 12/29/49 (A) (B) | 3,207 | 2,598 | ||||
National City | ||||||
4.900%, 01/15/15 | 400 | 420 | ||||
National City Bank | ||||||
5.800%, 06/07/17 | 250 | 259 | ||||
0.625%, 06/07/17 (A) | 6,000 | 5,043 | ||||
National Rural Utilities Cooperative Finance | ||||||
2.625%, 09/16/12 | 95 | 97 | ||||
Nationwide Mutual Insurance | ||||||
6.600%, 04/15/34 (B) | 2,483 | 1,928 | ||||
5.810%, 12/15/24 (A) (B) | 3,900 | 3,077 | ||||
NB Capital Trust IV | ||||||
8.250%, 04/15/27 | 2,305 | 2,207 | ||||
New York Life Global Funding | ||||||
4.650%, 05/09/13 (B) | 300 | 321 | ||||
NIBC Bank MTN | ||||||
2.800%, 12/02/14 (B) | 4,985 | 4,992 | ||||
Nordea Bank | ||||||
3.700%, 11/13/14 (B) | 6,270 | 6,379 | ||||
2.500%, 11/13/12 (B) | 2,850 | 2,876 | ||||
Northern Trust | ||||||
5.500%, 08/15/13 | 85 | 95 | ||||
| Description | Face Amount ($ Thousands) | Market Value ($ Thousands) | ||||
Power Receivables Finance | ||||||
6.290%, 01/01/12 (B) | $ | 571 | $ | 579 | ||
6.290%, 01/01/12 | 1,807 | 1,834 | ||||
Pricoa Global Funding I | ||||||
5.450%, 06/11/14 (B) | 3,300 | 3,515 | ||||
Prime Property Fund | ||||||
5.600%, 06/15/11‡ (B) | 3,380 | 3,224 | ||||
5.500%, 01/15/14‡ (B) | 5,000 | 4,334 | ||||
Principal Life Global Funding I | ||||||
6.250%, 02/15/12 (B) | 600 | 637 | ||||
5.050%, 03/15/15 (B) | 750 | 745 | ||||
Private Export Funding | ||||||
3.050%, 10/15/14 | 1,235 | 1,260 | ||||
Prudential Holdings LLC | ||||||
8.695%, 12/18/23 (B) | 2,500 | 2,794 | ||||
1.167%, 12/18/17 (A) (B) | 3,725 | 3,054 | ||||
Rabobank Nederland | ||||||
11.000%, 12/31/49 (A) (B) | 2,448 | 3,027 | ||||
Resona Preferred Global Securities Cayman | ||||||
7.191%, 07/30/49 (A) (B) | 3,240 | 2,730 | ||||
Royal Bank of Canada | ||||||
0.500%, 06/29/85 (A) | 860 | 531 | ||||
Royal Bank of Scotland Group MTN | ||||||
9.118%, 03/31/49 | 569 | 529 | ||||
7.640%, 09/29/17 (A) | 1,300 | 608 | ||||
6.400%, 10/21/19 | 3,630 | 3,680 | ||||
RSHB Capital | ||||||
6.299%, 05/15/17 (B) | 1,190 | 1,185 | ||||
Security Benefit Life Insurance | ||||||
8.750%, 05/15/16 (B) | 5,200 | 1,144 | ||||
Shinsei Finance Cayman | ||||||
6.418%, 01/29/49 (A) (B) | 5,605 | 3,251 | ||||
Simon Property Group | ||||||
10.350%, 04/01/19‡ | 520 | 671 | ||||
6.750%, 05/15/14‡ | 165 | 181 | ||||
SLM MTN | ||||||
8.450%, 06/15/18 | 550 | 497 | ||||
SMFG Preferred Capital | ||||||
6.078%, 01/25/17 (A) (B) | 6,810 | 5,638 | ||||
Societe Generale | ||||||
0.551%, 11/29/49 (A) | 180 | 101 | ||||
0.551%, 11/29/49 (A) | 680 | 383 | ||||
State Street | ||||||
4.300%, 05/30/14 | 60 | 64 | ||||
Stingray Pass-Through Trust MTN | ||||||
5.902%, 01/12/15 (B) | 1,800 | 450 | ||||
SunTrust Capital VIII | ||||||
6.100%, 12/15/36 (A) | 5,570 | 3,929 | ||||
SunTrust Preferred Capital I | ||||||
5.853%, 12/15/11 (A) | 2,643 | 1,725 | ||||
TNK-BP Finance | ||||||
7.500%, 07/18/16 (B) | 1,800 | 1,800 | ||||
6.625%, 03/20/17 (B) | 1,070 | 1,014 | ||||
| SEI Institutional Investments Trust / Semi-Annual Report / November 30, 2009 | 59 |
Table of Contents
SCHEDULE OF INVESTMENTS (Unaudited)
Core Fixed Income Fund (Continued)
November 30, 2009
| Description | Face Amount ($ Thousands) | Market Value ($ Thousands) | ||||
Toll Road Investors Partnership II | ||||||
5.547%, 02/15/45 (B) (E) | $ | 7,217 | $ | 436 | ||
Travelers | ||||||
6.250%, 03/15/37 (A) | 6,250 | 5,663 | ||||
5.900%, 06/02/19 | 145 | 162 | ||||
Travelers Property Casualty | ||||||
7.750%, 04/15/26 | 300 | 357 | ||||
UBS | ||||||
5.875%, 12/20/17 | 520 | 540 | ||||
UDR MTN | ||||||
5.000%, 01/15/12‡ | 2,000 | 2,043 | ||||
US Bancorp MTN | ||||||
2.875%, 11/20/14 | 415 | 416 | ||||
Wachovia | ||||||
5.750%, 06/15/17 | 305 | 321 | ||||
5.500%, 05/01/13 | 600 | 650 | ||||
5.250%, 08/01/14 | 650 | 684 | ||||
Wachovia Bank | ||||||
6.000%, 11/15/17 | 6,800 | 7,252 | ||||
0.629%, 03/15/16 (A) | 1,200 | 1,073 | ||||
Wachovia Capital Trust III | ||||||
5.800%, 03/15/11 (A) | 3,752 | 2,570 | ||||
WEA Finance LLC | ||||||
7.500%, 06/02/14 (B) | 3,040 | 3,381 | ||||
7.125%, 04/15/18 (B) | 9,635 | 10,371 | ||||
6.750%, 09/02/19 (B) | 3,186 | 3,348 | ||||
Wells Fargo | ||||||
7.980%, 03/15/18 (A) | 395 | 366 | ||||
5.625%, 12/11/17 | 350 | 366 | ||||
5.000%, 11/15/14 | 1,145 | 1,199 | ||||
3.750%, 10/01/14 | 1,830 | 1,845 | ||||
Wells Fargo Capital X | ||||||
5.950%, 12/15/36 | 1,630 | 1,377 | ||||
Wells Fargo Capital XV | ||||||
9.750%, 12/31/49 (A) (C) | 7,770 | 8,236 | ||||
Westfield Capital | ||||||
4.375%, 11/15/10 (B) | 4,600 | 4,666 | ||||
Westfield Group | ||||||
5.400%, 10/01/12 (B) | 2,578 | 2,701 | ||||
Westpac Banking | ||||||
4.875%, 11/19/19 | 2,754 | 2,796 | ||||
2.250%, 11/19/12 | 5,170 | 5,210 | ||||
Woodbourne Capital Trust I | ||||||
1.346%, 04/08/49 (A) (B) | 625 | 131 | ||||
Woodbourne Capital Trust II | ||||||
1.346%, 04/08/49 (A) (B) | 625 | 131 | ||||
Woodbourne Capital Trust III | ||||||
1.346%, 04/08/49 (A) (B) | 625 | 131 | ||||
Woodbourne Capital Trust IV | ||||||
1.346%, 04/08/49 (A) (B) | 625 | 131 | ||||
ZFS Finance USA Trust I | ||||||
6.150%, 12/15/65 (A) (B) (C) | 2,549 | 2,256 | ||||
ZFS Finance USA Trust III | ||||||
1.449%, 12/15/65 (A) (B) | 620 | 502 | ||||
| 743,000 | ||||||
| Description | Face Amount ($ Thousands) | Market Value ($ Thousands) | ||||
Health Care — 0.7% | ||||||
Abbott Laboratories | ||||||
5.600%, 11/30/17 | $ | 470 | $ | 526 | ||
Amgen | ||||||
6.400%, 02/01/39 (C) | 2,855 | 3,286 | ||||
5.700%, 02/01/19 | 100 | 111 | ||||
CareFusion | ||||||
6.375%, 08/01/19 (B) | 2,210 | 2,449 | ||||
5.125%, 08/01/14 (B) | 3,475 | 3,714 | ||||
4.125%, 08/01/12 (B) | 1,870 | 1,950 | ||||
Coventry Health Care | ||||||
5.950%, 03/15/17 | 3,140 | 2,916 | ||||
GlaxoSmithKline Capital | ||||||
5.650%, 05/15/18 | 4,350 | 4,847 | ||||
HCA | ||||||
5.750%, 03/15/14 | 5,548 | 5,132 | ||||
Hospira | ||||||
6.400%, 05/15/15 | 20 | 23 | ||||
5.550%, 03/30/12 | 200 | 216 | ||||
Humana | ||||||
7.200%, 06/15/18 | 1,270 | 1,327 | ||||
Pfizer | ||||||
5.350%, 03/15/15 | 5,024 | 5,621 | ||||
Schering-Plough | ||||||
6.550%, 09/15/37 (C) | 1,435 | 1,700 | ||||
Tenet Healthcare | ||||||
7.375%, 02/01/13 | 168 | 165 | ||||
UnitedHealth Group | ||||||
6.875%, 02/15/38 | 3,320 | 3,552 | ||||
WellPoint | ||||||
5.875%, 06/15/17 | 350 | 375 | ||||
| 37,910 | ||||||
Industrials — 1.1% | ||||||
Air 2 US | ||||||
8.027%, 10/01/19 (B) | 2,521 | 2,218 | ||||
Allied Waste North America | ||||||
6.875%, 06/01/17 | 115 | 122 | ||||
Boeing | ||||||
4.875%, 02/15/20 | 2,760 | 2,871 | ||||
Burlington Northern Santa Fe | ||||||
7.290%, 06/01/36 | 200 | 237 | ||||
4.700%, 10/01/19 | 375 | 384 | ||||
Cedar Brakes I LLC | ||||||
8.500%, 02/15/14 (B) | 1,135 | 1,132 | ||||
Continental Airlines | ||||||
7.461%, 04/01/15 (C) | 1,385 | 1,274 | ||||
7.256%, 03/15/20 (C) | 1,250 | 1,162 | ||||
6.545%, 02/02/19 (C) | 182 | 176 | ||||
6.236%, 03/15/20 | 2,026 | 1,808 | ||||
5.983%, 04/19/22 (C) | 3,329 | 3,163 | ||||
CSX | ||||||
9.780%, 02/14/11 | 100 | 107 | ||||
7.375%, 02/01/19 | 210 | 249 | ||||
6.300%, 03/15/12 | 110 | 121 | ||||
| 60 | SEI Institutional Investments Trust / Semi-Annual Report / November 30, 2009 |
Table of Contents
| Description | Face Amount ($ Thousands) | Market Value ($ Thousands) | ||||
Delta Air Lines | ||||||
7.379%, 05/18/10 | $ | 464 | $ | 463 | ||
6.821%, 08/10/22 | 2,276 | 2,134 | ||||
6.619%, 03/18/11 | 256 | 253 | ||||
Delta Air Lines, Ser 2001-1 | ||||||
7.111%, 09/18/11 | 14,850 | 14,701 | ||||
General Electric | ||||||
5.250%, 12/06/17 | 250 | 260 | ||||
Lockheed Martin | ||||||
8.500%, 12/01/29 | 300 | 403 | ||||
Northrop Grumman Systems | ||||||
7.750%, 03/01/16 | 200 | 245 | ||||
Northwest Airlines, Ser 1A-2 | ||||||
6.841%, 04/01/11 | 4,500 | 4,410 | ||||
Systems 2001 Asset Trust LLC | ||||||
6.664%, 09/15/13 (B) | 192 | 198 | ||||
Tyco International Group | ||||||
6.750%, 02/15/11 | 1,170 | 1,240 | ||||
6.375%, 10/15/11 | 5,490 | 5,947 | ||||
6.000%, 11/15/13 | 1,945 | 2,149 | ||||
Union Pacific | ||||||
7.000%, 02/01/16 | 500 | 573 | ||||
Union Pacific Railroad 2003 Pass Through Trust | ||||||
4.698%, 01/02/24 | 179 | 179 | ||||
United Parcel Service | ||||||
4.500%, 01/15/13 (C) | 6,720 | 7,277 | ||||
United Technologies | ||||||
5.400%, 05/01/35 | 670 | 686 | ||||
Waste Management | ||||||
7.125%, 12/15/17 | 1,720 | 1,929 | ||||
7.100%, 08/01/26 | 1,375 | 1,520 | ||||
| 59,591 | ||||||
Information Technology — 0.3% | ||||||
Arrow Electronics | ||||||
6.875%, 06/01/18 | 270 | 288 | ||||
Cisco Systems | ||||||
5.900%, 02/15/39 | 1,080 | 1,131 | ||||
5.500%, 01/15/40 | 3,990 | 3,967 | ||||
4.450%, 01/15/20 | 5,235 | 5,325 | ||||
Dell | ||||||
5.875%, 06/15/19 (C) | 1,220 | 1,339 | ||||
5.650%, 04/15/18 | 415 | 447 | ||||
Hewlett-Packard | ||||||
4.750%, 06/02/14 | 4,412 | 4,810 | ||||
2.950%, 08/15/12 | 80 | 83 | ||||
International Business Machines | ||||||
7.625%, 10/15/18 | 365 | 461 | ||||
Intuit | ||||||
5.750%, 03/15/17 | 255 | 272 | ||||
Oracle | ||||||
5.000%, 07/08/19 | 450 | 479 | ||||
| Description | Face Amount ($ Thousands) | Market Value ($ Thousands) | ||||
Xerox | ||||||
8.250%, 05/15/14 | $ | 320 | $ | 372 | ||
| 18,974 | ||||||
Materials — 0.9% | ||||||
Alcoa | ||||||
6.000%, 07/15/13 (C) | 4,180 | 4,446 | ||||
Barrick Gold | ||||||
6.950%, 04/01/19 | 2,185 | 2,538 | ||||
Codelco | ||||||
4.750%, 10/15/14 (B) | 900 | 970 | ||||
Dow Chemical | ||||||
8.550%, 05/15/19 | 5,530 | 6,536 | ||||
4.850%, 08/15/12 | 3,855 | 4,075 | ||||
Freeport-McMoRan Copper & Gold | ||||||
8.375%, 04/01/17 | 7,725 | 8,334 | ||||
PPG Industries | ||||||
6.650%, 03/15/18 | 615 | 686 | ||||
5.750%, 03/15/13 | 615 | 666 | ||||
Rio Tinto Finance USA | ||||||
9.000%, 05/01/19 | 2,310 | 2,944 | ||||
6.500%, 07/15/18 | 5,080 | 5,630 | ||||
5.875%, 07/15/13 | 2,745 | 3,013 | ||||
Stauffer Chemical (E) (G) (H) | ||||||
5.944%, 04/15/18 | 860 | 181 | ||||
5.809%, 04/15/17 | 350 | 83 | ||||
5.275%, 04/15/10 | 300 | 167 | ||||
Vale Overseas | ||||||
6.875%, 11/10/39 | 2,910 | 3,008 | ||||
6.875%, 11/21/36 | 3,368 | 3,437 | ||||
| 46,714 | ||||||
Sovereign — 0.8% | ||||||
Brazilian Government International Bond | ||||||
5.625%, 01/07/41 | 2,505 | 2,417 | ||||
Province of Ontario Canada | ||||||
4.100%, 06/16/14 | 9,495 | 10,153 | ||||
4.000%, 10/07/19 | 2,125 | 2,138 | ||||
Qatar Govt International Bond | ||||||
4.000%, 01/20/15 (B) | 1,205 | 1,206 | ||||
Republic of Korea | ||||||
7.125%, 04/16/19 | 7,330 | 8,688 | ||||
Russian Federation | ||||||
7.500%, 03/31/30 | 1,012 | 1,142 | ||||
Societe Financement de l’Economie Francaise | ||||||
2.875%, 09/22/14 (B) | 6,620 | 6,760 | ||||
State of Qatar | ||||||
6.400%, 01/20/40 (B) | 1,205 | 1,229 | ||||
5.250%, 01/20/20 (B) | 1,965 | 1,980 | ||||
Svensk Exportkredit | ||||||
3.250%, 09/16/14 | 6,950 | 7,140 | ||||
| SEI Institutional Investments Trust / Semi-Annual Report / November 30, 2009 | 61 |
Table of Contents
SCHEDULE OF INVESTMENTS (Unaudited)
Core Fixed Income Fund (Continued)
November 30, 2009
| Description | Face Amount ($ Thousands) | Market Value ($ Thousands) | ||||
United Mexican States MTN | ||||||
7.500%, 04/08/33 | $ | 218 | $ | 262 | ||
6.375%, 01/16/13 | 350 | 387 | ||||
5.625%, 01/15/17 | 84 | 90 | ||||
United Mexican States, Ser A MTN | ||||||
6.750%, 09/27/34 | 798 | 886 | ||||
| 44,478 | ||||||
Telecommunication Services — 2.0% | ||||||
America Movil | ||||||
5.625%, 11/15/17 (C) | 1,450 | 1,552 | ||||
5.000%, 10/16/19 (B) | 4,600 | 4,642 | ||||
AT&T | ||||||
8.000%, 11/15/31 | 1,250 | 1,535 | ||||
6.700%, 11/15/13 | 500 | 573 | ||||
6.550%, 02/15/39 (C) | 6,860 | 7,406 | ||||
5.600%, 05/15/18 | 400 | 426 | ||||
5.100%, 09/15/14 (C) | 2,410 | 2,624 | ||||
BellSouth | ||||||
4.750%, 11/15/12 (C) | 190 | 205 | ||||
BellSouth Telecommunications | ||||||
6.300%, 12/15/15 | 280 | 304 | ||||
British Telecommunications | ||||||
9.625%, 12/15/30 | 2,825 | 3,616 | ||||
9.125%, 12/15/10 | 1,460 | 1,567 | ||||
5.950%, 01/15/18 (C) | 1,711 | 1,766 | ||||
Cellco Partnership | ||||||
8.500%, 11/15/18 | 3,015 | 3,852 | ||||
7.375%, 11/15/13 | 7,330 | 8,538 | ||||
5.550%, 02/01/14 | 1,120 | 1,234 | ||||
3.750%, 05/20/11 | 4,500 | 4,662 | ||||
COX Communications | ||||||
5.450%, 12/15/14 | 235 | 256 | ||||
Deutsche Telekom International Finance | ||||||
6.000%, 07/08/19 | 600 | 657 | ||||
5.750%, 03/23/16 | 2,175 | 2,354 | ||||
France Telecom | ||||||
7.750%, 03/01/11 | 1,895 | 2,046 | ||||
GTE | ||||||
8.750%, 11/01/21 | 600 | 739 | ||||
Historic TW | ||||||
9.150%, 02/01/23 | 500 | 630 | ||||
New Cingular Wireless Services | ||||||
8.125%, 05/01/12 | 1,255 | 1,440 | ||||
News America | ||||||
7.300%, 04/30/28 | 350 | 365 | ||||
6.900%, 08/15/39 (B) | 1,435 | 1,564 | ||||
6.650%, 11/15/37 | 260 | 274 | ||||
6.200%, 12/15/34 | 315 | 315 | ||||
News America Holdings | ||||||
8.875%, 04/26/23 | 200 | 240 | ||||
Qwest | ||||||
7.875%, 09/01/11 | 1,560 | 1,620 | ||||
7.500%, 10/01/14 | 4,065 | 4,156 | ||||
| Description | Face Amount ($ Thousands) | Market Value ($ Thousands) | ||||
Reed Elsevier Capital | ||||||
8.625%, 01/15/19 (C) | $ | 2,460 | $ | 3,086 | ||
Rogers Communications | ||||||
6.375%, 03/01/14 | 6,305 | 7,079 | ||||
Royal | ||||||
8.000%, 10/01/10 | 5,100 | 5,386 | ||||
Sprint Capital | ||||||
8.750%, 03/15/32 | 390 | 334 | ||||
8.375%, 03/15/12 | 5,300 | 5,446 | ||||
6.900%, 05/01/19 | 120 | 105 | ||||
TCI Communications | ||||||
8.750%, 08/01/15 | 701 | 856 | ||||
7.125%, 02/15/28 | 400 | 425 | ||||
Telecom Italia Capital | ||||||
6.999%, 06/04/18 (C) | 4,480 | 4,995 | ||||
5.250%, 10/01/15 | 370 | 389 | ||||
5.250%, 11/15/13 | 580 | 619 | ||||
4.950%, 09/30/14 | 1,320 | 1,394 | ||||
Telefonica Emisiones | ||||||
5.984%, 06/20/11 | 2,300 | 2,452 | ||||
5.877%, 07/15/19 | 115 | 126 | ||||
Verizon Communications | ||||||
8.950%, 03/01/39 | 5,410 | 7,411 | ||||
8.750%, 11/01/18 | 194 | 246 | ||||
6.400%, 02/15/38 | 660 | 710 | ||||
6.100%, 04/15/18 | 1,580 | 1,741 | ||||
5.500%, 02/15/18 | 2,810 | 2,987 | ||||
Verizon Global Funding | ||||||
7.750%, 12/01/30 | 200 | 238 | ||||
7.375%, 09/01/12 | 1,730 | 1,978 | ||||
6.875%, 06/15/12 | 465 | 521 | ||||
Verizon Maryland | ||||||
7.150%, 05/01/23 | 600 | 631 | ||||
Vodafone Group | ||||||
5.450%, 06/10/19 | 226 | 240 | ||||
| 110,553 | ||||||
Utilities — 1.7% | ||||||
Appalachian Power | ||||||
5.950%, 05/15/33 | 200 | 200 | ||||
Arizona Public Services | ||||||
8.000%, 12/30/15 | 608 | 660 | ||||
Carolina Power & Light | ||||||
5.300%, 01/15/19 | 400 | 434 | ||||
CenterPoint Energy Houston Electric LLC | ||||||
7.000%, 03/01/14 | 150 | 174 | ||||
Cleveland Electric Illuminating | ||||||
7.880%, 11/01/17 | 310 | 376 | ||||
Consumers Energy | ||||||
6.700%, 09/15/19 | 400 | 467 | ||||
Dominion Resources | ||||||
8.875%, 01/15/19 | 6,430 | 8,235 | ||||
6.400%, 06/15/18 | 300 | 339 | ||||
| 62 | SEI Institutional Investments Trust / Semi-Annual Report / November 30, 2009 |
Table of Contents
| Description | Face Amount ($ Thousands) | Market Value ($ Thousands) | ||||
5.700%, 09/17/12 | $ | 3,560 | $ | 3,905 | ||
4.750%, 12/15/10 | 740 | 767 | ||||
Dominion Resources, Ser D | ||||||
5.125%, 12/15/09 | 850 | 850 | ||||
DPL | ||||||
6.875%, 09/01/11 | 3,620 | 3,910 | ||||
Duke Energy | ||||||
6.300%, 02/01/14 | 2,830 | 3,157 | ||||
5.625%, 11/30/12 | 425 | 473 | ||||
Enel Finance International | ||||||
6.000%, 10/07/39 (B) | 2,175 | 2,230 | ||||
5.125%, 10/07/19 (B) | 2,610 | 2,696 | ||||
Exelon | ||||||
5.625%, 06/15/35 | 2,605 | 2,494 | ||||
Exelon Generation LLC | ||||||
6.250%, 10/01/39 | 1,720 | 1,796 | ||||
5.200%, 10/01/19 | 845 | 874 | ||||
FirstEnergy Solutions | ||||||
6.800%, 08/15/39 (B) | 1,310 | 1,361 | ||||
6.050%, 08/15/21 (B) | 3,175 | 3,324 | ||||
4.800%, 02/15/15 (B) | 1,035 | 1,076 | ||||
FirstEnergy, Ser B | ||||||
6.450%, 11/15/11 | 18 | 19 | ||||
FirstEnergy, Ser C | ||||||
7.375%, 11/15/31 | 4,935 | 5,517 | ||||
Hydro Quebec, Ser JL | ||||||
6.300%, 05/11/11 (C) | 1,050 | 1,133 | ||||
KCP&L Greater Missouri Operations | ||||||
11.875%, 07/01/12 | 3,360 | 3,907 | ||||
8.270%, 11/15/21 | 2,894 | 3,079 | ||||
Massachusetts Electric | ||||||
5.900%, 11/15/39 (B) | 210 | 216 | ||||
Nevada Power | ||||||
8.250%, 06/01/11 | 5,910 | 6,427 | ||||
7.125%, 03/15/19 | 400 | 459 | ||||
Niagara Mohawk Power | ||||||
4.881%, 08/15/19 (B) | 180 | 185 | ||||
Nisource Finance | ||||||
10.750%, 03/15/16 | 500 | 605 | ||||
6.800%, 01/15/19 | 3,547 | 3,823 | ||||
Northern States Power | ||||||
5.350%, 11/01/39 | 56 | 57 | ||||
Oncor Electric Delivery | ||||||
6.800%, 09/01/18 (C) | 4,135 | 4,710 | ||||
Pacific Gas & Electric | ||||||
8.250%, 10/15/18 | 1,130 | 1,428 | ||||
6.050%, 03/01/34 | 3,275 | 3,533 | ||||
5.800%, 03/01/37 | 840 | 880 | ||||
5.400%, 01/15/40 | 156 | 155 | ||||
PacifiCorp | ||||||
5.650%, 07/15/18 | 100 | 110 | ||||
5.500%, 01/15/19 | 400 | 437 | ||||
Power Contract Financing | ||||||
6.256%, 02/01/10 (B) | 653 | 656 | ||||
| Description | Face Amount ($ Thousands) | Market Value ($ Thousands) | ||||
Progress Energy | ||||||
6.850%, 04/15/12 | $ | 1,715 | $ | 1,885 | ||
6.000%, 12/01/39 | 200 | 203 | ||||
PSEG Power LLC | ||||||
5.500%, 12/01/15 | 445 | 484 | ||||
5.320%, 09/15/16 (B) | 126 | 133 | ||||
Public Service Electric & Gas MTN | ||||||
5.375%, 11/01/39 | 97 | 98 | ||||
Public Service of New Mexico | ||||||
7.950%, 05/15/18 | 3,000 | 3,140 | ||||
Public Service of Oklahoma | ||||||
5.150%, 12/01/19 | 170 | 175 | ||||
Sempra Energy | ||||||
8.900%, 11/15/13 | 400 | 477 | ||||
6.500%, 06/01/16 | 135 | 151 | ||||
Southern | ||||||
4.150%, 05/15/14 | 85 | 90 | ||||
Southern California Edison | ||||||
4.650%, 04/01/15 | 200 | 217 | ||||
Tennessee Valley Authority | ||||||
5.250%, 09/15/39 | 1,828 | 1,871 | ||||
Texas-New Mexico Power | ||||||
9.500%, 04/01/19 (B) | 875 | 1,084 | ||||
TXU | ||||||
6.500%, 11/15/24 | 410 | 188 | ||||
TXU, Ser P | ||||||
5.550%, 11/15/14 | 370 | 255 | ||||
TXU, Ser R | ||||||
6.550%, 11/15/34 | 4,385 | 1,954 | ||||
Virginia Electric and Power | ||||||
5.400%, 04/30/18 | 300 | 324 | ||||
| 89,863 | ||||||
Total Corporate Obligations (Cost $1,474,755) ($ Thousands) | 1,462,987 | |||||
U.S. TREASURY OBLIGATIONS — 14.8% | ||||||
U.S. Treasury Bills (E) | ||||||
0.130%, 12/03/09 (C) | 53,055 | 53,055 | ||||
0.138%, 12/10/09 (C) | 10,770 | 10,770 | ||||
0.107%, 12/17/09 (C) | 6,820 | 6,820 | ||||
0.046%, 02/18/10 | 1,615 | 1,615 | ||||
U.S. Treasury Bonds | ||||||
7.500%, 11/15/16 | 20,700 | 26,996 | ||||
8.750%, 05/15/17 | 21,675 | 30,311 | ||||
8.875%, 08/15/17 | 21,800 | 30,810 | ||||
8.875%, 02/15/19 | 7,358 | 10,714 | ||||
8.500%, 02/15/20 | 100 | 145 | ||||
8.750%, 08/15/20 | 3,950 | 5,850 | ||||
7.125%, 02/15/23 (C) | 3,742 | 5,077 | ||||
6.250%, 08/15/23 (C) | 9,565 | 12,118 | ||||
6.750%, 08/15/26 | 250 | 337 | ||||
6.500%, 11/15/26 | 100 | 132 | ||||
6.375%, 08/15/27 | 200 | 261 | ||||
| SEI Institutional Investments Trust / Semi-Annual Report / November 30, 2009 | 63 |
Table of Contents
SCHEDULE OF INVESTMENTS (Unaudited)
Core Fixed Income Fund (Continued)
November 30, 2009
| Description | Face Amount ($ Thousands) | Market Value ($ Thousands) | ||||
6.125%, 11/15/27 | $ | 150 | $ | 191 | ||
5.375%, 02/15/31 (C) | 21,419 | 25,218 | ||||
4.500%, 05/15/38 | 2,082 | 2,187 | ||||
3.500%, 02/15/39 (C) | 27,405 | 24,155 | ||||
4.250%, 05/15/39 (C) | 25,169 | 25,362 | ||||
4.500%, 08/15/39 (C) | 54,308 | 57,057 | ||||
4.375%, 11/15/39 (C) | 35,618 | 36,703 | ||||
U.S. Treasury Inflation-Protected Securities | ||||||
2.000%, 01/15/16 | 11,126 | 13,035 | ||||
2.375%, 01/15/25 | 160 | 201 | ||||
2.000%, 01/15/26 (C) | 2,310 | 2,630 | ||||
2.375%, 01/15/27 | 11,879 | 13,983 | ||||
1.750%, 01/15/28 (C) | 25,404 | 26,273 | ||||
3.625%, 04/15/28 (C) | 20,180 | 34,672 | ||||
3.875%, 04/15/29 | 570 | 1,004 | ||||
U.S. Treasury Notes | ||||||
1.000%, 09/30/11 | 15,030 | 15,144 | ||||
4.500%, 11/30/11 | 1,000 | 1,076 | ||||
1.875%, 06/15/12 | 2,007 | 2,057 | ||||
1.750%, 08/15/12 (C) | 5,250 | 5,360 | ||||
1.375%, 10/15/12 | 1,397 | 1,410 | ||||
1.375%, 11/15/12 (C) | 6,725 | 6,778 | ||||
3.875%, 02/15/13 | 300 | 325 | ||||
1.875%, 02/28/14 | 1,000 | 1,008 | ||||
2.625%, 06/30/14 (C) | 37,150 | 38,471 | ||||
2.375%, 09/30/14 (C) | 15,470 | 15,789 | ||||
2.375%, 10/31/14 | 398 | 405 | ||||
2.125%, 11/30/14 | 19,377 | 19,486 | ||||
2.375%, 03/31/16 (C) | 6,020 | 5,985 | ||||
3.000%, 08/31/16 | 1,857 | 1,904 | ||||
4.625%, 02/15/17 | 30,500 | 34,334 | ||||
4.500%, 05/15/17 | 1,600 | 1,786 | ||||
4.750%, 08/15/17 | 6,000 | 6,796 | ||||
3.750%, 11/15/18 (C) | 27,320 | 28,660 | ||||
2.750%, 02/15/19 (C) | 6,701 | 6,479 | ||||
3.125%, 05/15/19 (C) | 23,178 | 23,064 | ||||
3.625%, 08/15/19 (C) | 30,006 | 31,047 | ||||
3.375%, 11/15/19 (C) | 40,546 | 41,142 | ||||
U.S. Treasury STRIPS (E) | ||||||
2.156%, 02/15/13 | 1,000 | 959 | ||||
2.834%, 02/15/14 | 8,550 | 7,926 | ||||
2.740%, 05/15/14 | 2,150 | 1,978 | ||||
2.660%, 02/15/15 | 200 | 179 | ||||
3.132%, 08/15/16 | 5,100 | 4,212 | ||||
4.209%, 02/15/17 | 17,420 | 13,997 | ||||
3.712%, 08/15/17 | 4,000 | 3,132 | ||||
3.619%, 11/15/17 | 6,150 | 4,755 | ||||
3.405%, 02/15/18 | 1,050 | 802 | ||||
3.489%, 05/15/18 (C) | 4,360 | 3,327 | ||||
4.213%, 05/15/20 | 2,900 | 1,971 | ||||
4.415%, 08/15/20 | 4,550 | 3,051 | ||||
4.296%, 11/15/20 | 1,000 | 661 | ||||
5.294%, 02/15/21 | 200 | 131 | ||||
| Description | Shares/Face Amount ($ Thousands) | Market Value ($ Thousands) | ||||
4.830%, 11/15/21 | $ | 13,050 | $ | 8,214 | ||
4.048%, 02/15/22 | 300 | 186 | ||||
4.453%, 02/15/24 | 75 | 42 | ||||
6.321%, 05/15/24 | 800 | 438 | ||||
4.408%, 08/15/24 | 200 | 108 | ||||
4.506%, 05/15/29 | 100 | 42 | ||||
3.936%, 05/15/30 | 9,150 | 3,734 | ||||
4.292%, 02/15/32 | 200 | 74 | ||||
4.560%, 05/15/36 | 300 | 92 | ||||
Total U.S. Treasury Obligations (Cost $780,296) ($ Thousands) | 806,199 | |||||
AFFILIATED PARTNERSHIP — 11.9% | ||||||
SEI Liquidity Fund, L.P. | 657,743,190 | 646,774 | ||||
Total Affiliated Partnership (Cost $657,743) ($ Thousands) | 646,774 | |||||
ASSET-BACKED SECURITIES — 4.5% | ||||||
Automotive — 0.5% | ||||||
Ally Auto Receivables Trust, Ser 2009-1, Cl A3 | ||||||
2.330%, 06/17/13 (B) | 500 | 504 | ||||
Bank of America Auto Trust, Ser 2009-1A, Cl A4 | ||||||
3.520%, 06/15/16 (B) | 200 | 208 | ||||
Bank of America Auto Trust, Ser 2009-2A, Cl A3 | ||||||
2.130%, 09/15/13 (B) | 650 | 660 | ||||
Bank of America Auto Trust, Ser 2009-2A, Cl A4 | ||||||
3.030%, 10/15/16 (B) | 1,656 | 1,702 | ||||
Bank of America Auto Trust, Ser 2009-3A, Cl A4 | ||||||
2.670%, 12/15/16 (B) | 2,565 | 2,565 | ||||
Bank of America Auto Trust, Ser 2009-3A, Cl A3 | ||||||
1.670%, 12/15/13 (B) | 350 | 350 | ||||
Bank of America Auto Trust, Ser 2009-14, Cl A3 | ||||||
2.670%, 07/15/13 (B) | 600 | 613 | ||||
Chrysler Financial Auto Securitization Trust, Ser 2009-A, Cl A3 | ||||||
2.820%, 01/15/16 | 250 | 256 | ||||
CitiFinancial Auto Issuance Trust, Ser 2009-1, Cl A3 | ||||||
2.590%, 10/15/13 (B) | 695 | 702 | ||||
Daimler Chrysler Auto Trust, Ser 2008-B, Cl A2B | ||||||
1.172%, 07/08/11 (A) | 172 | 173 | ||||
Ford Credit Auto Owner Trust, Ser 2009-B, Cl A3 | ||||||
2.790%, 08/15/13 | 350 | 358 | ||||
| 64 | SEI Institutional Investments Trust / Semi-Annual Report / November 30, 2009 |
Table of Contents
| Description | Face Amount ($ Thousands) | Market Value ($ Thousands) | ||||
Ford Credit Auto Owner Trust, Ser 2009-B, Cl A4 | ||||||
4.500%, 07/15/14 | $ | 300 | $ | 319 | ||
Harley-Davidson Motorcycle Trust, Ser 2006-3, Cl A4 | ||||||
5.220%, 06/15/13 | 1,148 | 1,188 | ||||
Harley-Davidson Motorcycle Trust, Ser 2009-1, Cl A4 | ||||||
4.550%, 01/15/17 | 3,458 | 3,646 | ||||
Harley-Davidson Motorcycle Trust, Ser 2009-2, Cl A4 | ||||||
3.320%, 02/15/17 | 791 | 813 | ||||
Harley-Davidson Motorcycle Trust, Ser 2009-3, Cl A4 | ||||||
2.540%, 04/15/17 | 1,413 | 1,427 | ||||
Harley-Davidson Motorcycle Trust, Ser 2009-4, Cl A4 | ||||||
2.400%, 07/15/14 | 592 | 592 | ||||
Hertz Vehicle Financing LLC, Ser 2009-2A, Cl A2 | ||||||
5.290%, 03/25/16 (B) | 3,110 | 3,184 | ||||
Honda Auto Receivables Owner Trust, Ser 2009-3, Cl A4 | ||||||
3.300%, 09/15/15 | 250 | 258 | ||||
Honda Auto Receivables Owner Trust, Ser 2009-S1, Cl A3 | ||||||
2.310%, 05/15/13 | 200 | 204 | ||||
Hyundai Auto Receivables Trust, Ser 2009-A, Cl A4 | ||||||
3.150%, 03/15/16 | 1,098 | 1,131 | ||||
Nissan Auto Receivables Owner Trust, Ser 2009-A, Cl A4 | ||||||
4.740%, 08/17/15 | 1,896 | 2,042 | ||||
Triad Auto Receivables Owner Trust, Ser 2006-C, Cl A3 | ||||||
5.410%, 08/12/11 | 575 | 577 | ||||
5.260%, 11/14/11 | 282 | 284 | ||||
USAA Auto Owner Trust, Ser 2009-2, Cl A3 | ||||||
1.540%, 02/18/14 | 470 | 470 | ||||
USAA Auto Owner Trust, Ser 2009-2, Cl A4 | ||||||
2.530%, 07/15/15 | 365 | 369 | ||||
World Omni Auto Receivables Trust, Ser 2009-A, Cl A4 | ||||||
5.120%, 05/15/14 | 1,970 | 2,125 | ||||
| 26,720 | ||||||
Credit Cards — 1.0% | ||||||
BA Credit Card Trust, Ser 2006-A11, Cl A11 | ||||||
0.269%, 04/15/16 (A) | 8,316 | 7,890 | ||||
BA Credit Card Trust, Ser 2006-A12, Cl A12 | ||||||
0.259%, 03/15/14 (A) | 8,000 | 7,839 | ||||
| Description | Face Amount ($ Thousands) | Market Value ($ Thousands) | ||||
BA Credit Card Trust, Ser 2006-A9, Cl A9 | ||||||
0.249%, 02/15/13 (A) | $ | 2,823 | $ | 2,803 | ||
BA Credit Card Trust, Ser 2007-A4, Cl A4 | ||||||
0.279%, 11/15/19 (A) | 4,130 | 3,681 | ||||
Capital One Multi-Asset Execution Trust, Ser 2008-A3, Cl A3 | ||||||
5.050%, 02/15/16 | 6,888 | 7,335 | ||||
Chase Issuance Trust, Ser 2005-A6, Cl A6 | ||||||
0.309%, 07/15/14 (A) | 787 | 775 | ||||
Discover Card Master Trust I, Ser 2005-4, Cl A2 | ||||||
0.329%, 06/16/15 (A) | 3,319 | 3,223 | ||||
Discover Card Master Trust I, Ser 2006-3, Cl A1 | ||||||
0.269%, 03/15/14 (A) | 2,879 | 2,833 | ||||
Discover Card Master Trust, Ser 2009-A1, Cl A1 | ||||||
1.539%, 12/15/14 (A) | 2,066 | 2,071 | ||||
MBNA Master Credit Card Trust, Ser 1997-B, Cl A | ||||||
0.399%, 08/15/14 (A) | 6,141 | 5,980 | ||||
Nordstrom Private Label Credit Card Master Note Trust, Ser 2007-2A, Cl A | ||||||
0.299%, 05/15/15 (A) (B) | 2,382 | 2,237 | ||||
Target Credit Card Master Trust, Ser 2005-1, Cl A | ||||||
0.296%, 10/27/14 (A) | 6,258 | 6,149 | ||||
| 52,816 | ||||||
Mortgage Related Securities — 0.7% | ||||||
ABFS Mortgage Loan Trust, Ser 2002-3, Cl A | ||||||
4.763%, 09/15/33 | 9 | 8 | ||||
ABS Home Equity, Ser 2001-HE3, Cl A1 | ||||||
0.779%, 11/15/31 (A) | 255 | 188 | ||||
ACE Securities, Ser 2006-SL3, Cl A1 | ||||||
0.336%, 06/25/36 (A) | 6,813 | 776 | ||||
AFC Home Equity Loan Trust, Ser 2000-1, Cl 2A | ||||||
0.476%, 03/25/30 (A) | 2,572 | 848 | ||||
Citigroup Mortgage Loan Trust, Ser 2007-AHL1, Cl A2A | ||||||
0.276%, 12/25/36 (A) | 722 | 609 | ||||
Conseco Finance Home Loan Trust, Ser 2001-D, Cl A5 | ||||||
6.190%, 11/15/32 (A) | 5,262 | 4,976 | ||||
Contimortgage Home Equity Trust, Ser 1997-2, Cl A9 | ||||||
7.090%, 04/15/28 | 10 | 9 | ||||
| SEI Institutional Investments Trust / Semi-Annual Report / November 30, 2009 | 65 |
Table of Contents
SCHEDULE OF INVESTMENTS (Unaudited)
Core Fixed Income Fund (Continued)
November 30, 2009
| Description | Face Amount ($ Thousands) | Market Value ($ Thousands) | ||||
Delta Funding Home Equity Loan Trust, Ser 1999-3, Cl A1A | ||||||
1.059%, 09/15/29 (A) | $ | 310 | $ | 167 | ||
EMC Mortgage Loan Trust, Ser 2002-AA, Cl A1 | ||||||
0.706%, 05/25/39 (A) (B) | 982 | 740 | ||||
GMAC Mortgage Loan Trust, Ser 2007-HE2, Cl A6 | ||||||
6.249%, 12/25/37 | 964 | 498 | ||||
GSAA Trust, Ser 2005-6, Cl A3 | ||||||
0.606%, 06/25/35 (A) | 4,100 | 2,176 | ||||
HFC Home Equity Loan Asset Backed Certificates, Ser 2005-2, Cl M2 | ||||||
0.727%, 01/20/35 (A) | 608 | 501 | ||||
HFC Home Equity Loan Asset Backed Certificates, Ser 2005-2, Cl A1 | ||||||
0.507%, 01/20/35 (A) | 290 | 266 | ||||
HFC Home Equity Loan Asset Backed Certificates, Ser 2006-1, Cl A1 | ||||||
0.397%, 01/20/36 (A) | 679 | 592 | ||||
HFC Home Equity Loan Asset Backed Certificates, Ser 2006-2, Cl A1 | ||||||
0.387%, 03/20/36 (A) | 463 | 406 | ||||
HFC Home Equity Loan Asset Backed Certificates, Ser 2007-1, Cl A2F | ||||||
5.600%, 03/20/36 | 750 | 767 | ||||
HFC Home Equity Loan Asset Backed Certificates, Ser 2007-3, Cl APT | ||||||
1.437%, 11/20/36 (A) | 1,038 | 882 | ||||
Home Equity Asset Trust, Ser 2007-2, Cl 2A1 | ||||||
0.346%, 07/25/37 (A) | 3,392 | 3,233 | ||||
Indymac Home Equity Loan Asset-Backed Trust, Ser 2001-A, Cl AV | ||||||
0.496%, 03/25/31 (A) | 42 | 22 | ||||
Morgan Stanley ABS Capital I, Ser 2004-WMC3, Cl M1 | ||||||
0.986%, 01/25/35 (A) | 342 | 326 | ||||
Morgan Stanley Capital I, Ser 2007-HE2, Cl A2A | ||||||
0.276%, 01/25/37 (A) | 389 | 366 | ||||
Morgan Stanley Home Equity Loans, Ser 2007-1, Cl A1 | ||||||
0.286%, 12/25/36 (A) | 355 | 344 | ||||
Morgan Stanley Mortgage Loan Trust, Ser 2007-3XS, Cl 2A3S | ||||||
5.858%, 01/25/47 | 31 | 17 | ||||
| Description | Face Amount ($ Thousands) | Market Value ($ Thousands) | ||||
MSDWCC Heloc Trust, Ser 2003-1, Cl A | ||||||
0.776%, 11/25/15 (A) | $ | 88 | $ | 56 | ||
Nationstar Home Equity Loan Trust, Ser 2006-B, Cl AV3 | ||||||
0.406%, 09/25/36 (A) | 6,400 | 3,764 | ||||
Option One Mortgage Loan Trust, Ser 2001-4, Cl A | ||||||
0.836%, 01/25/32 (A) | 255 | 201 | ||||
Option One Mortgage Loan Trust, Ser 2007-14, Cl 2A3 | ||||||
0.376%, 01/25/37 (A) | 17,000 | 6,079 | ||||
Option One Mortgage Loan Trust, Ser 2007-5, Cl 2A4 | ||||||
0.536%, 05/25/37 (A) | 10,000 | 3,358 | ||||
Renaissance Home Equity Loan Trust, Ser 2005-2, Cl AF3 | ||||||
4.499%, 08/25/35 | 1,557 | 1,525 | ||||
Residential Funding Mortgage Securities II, Ser 2000-HI1, Cl AI7 | ||||||
8.790%, 02/25/25 | 1,017 | 846 | ||||
Residential Funding Mortgage Securities II, Ser 2007-HSA3, Cl AI2 | ||||||
5.890%, 06/25/37 (A) | 272 | 257 | ||||
Salomon Brothers Mortgage Securities VII, Ser 2003-UP1, Cl A | ||||||
3.450%, 04/25/32 (B) | 412 | 341 | ||||
Security National Mortgage Loan Trust, Ser 2007-1A, Cl 2A | ||||||
0.586%, 04/25/37 (A) (B) (G) (H) | 1,050 | 481 | ||||
Soundview Home Equity Loan Trust, Ser 2007-OPT1, Cl 2A1 | ||||||
0.316%, 06/25/37 (A) | 6,104 | 5,275 | ||||
Terwin Mortgage Trust, Ser 2005-9HGS, Cl A1 | ||||||
4.000%, 08/25/35 (A) (B) | 633 | 585 | ||||
UCFC Home Equity Loan, Ser 1998-D, Cl MF1 | ||||||
6.905%, 04/15/30 | 36 | 30 | ||||
| 41,515 | ||||||
Other Asset-Backed Securities — 2.3% | ||||||
Amortizing Residential Collateral Trust CMO, Ser 2002-BC1, Cl A | ||||||
0.916%, 01/25/32 (A) | 456 | 358 | ||||
CenterPoint Energy Transition Bond LLC, Ser 2008-A, Cl A1 | ||||||
4.192%, 02/01/20 | 1,774 | 1,893 | ||||
Chase Funding Mortgage Loan Asset-Backed Certificates, Ser 2002-1, Cl 2A2 | ||||||
0.736%, 03/25/32 (A) | 1,020 | 604 | ||||
| 66 | SEI Institutional Investments Trust / Semi-Annual Report / November 30, 2009 |
Table of Contents
| Description | Face Amount ($ Thousands) | Market Value ($ Thousands) | ||||
Chase Funding Mortgage Loan Asset-Backed Certificates, Ser 2003-6, Cl 1A7 | ||||||
4.277%, 11/25/34 | $ | 1,157 | $ | 1,005 | ||
Citicorp Residential Mortgage Securities, Ser 2006-2, Cl A5 | ||||||
6.036%, 09/25/36 | 6,340 | 5,689 | ||||
Citigroup Mortgage Loan Trust, Ser 2007-SHL1, Cl A | ||||||
0.636%, 11/25/46 (A) (B) | 1,271 | 585 | ||||
CNH Equipment Trust, Ser 2009-B, Cl A3 | ||||||
2.970%, 03/15/13 | 215 | 219 | ||||
CNH Equipment Trust, Ser 2009-C, Cl A3 | ||||||
1.850%, 12/16/13 | 130 | 130 | ||||
Conseco Finance Home Loan Trust, Ser 2000-E, Cl M1 | ||||||
8.130%, 08/15/31 (A) | 2,105 | 1,948 | ||||
Conseco Finance Securitizations, Ser 2000-4, Cl A6 | ||||||
8.310%, 05/01/32 (A) | 780 | 626 | ||||
Countrywide Asset-Backed Certificates, Cl A | ||||||
0.896%, 04/25/32 (A) | 70 | 34 | ||||
Countrywide Asset-Backed Certificates, Cl A1 | ||||||
0.566%, 07/25/36 (A) (B) | 479 | 213 | ||||
Countrywide Asset-Backed Certificates, Ser 2001-BC3, Cl A | ||||||
0.716%, 12/25/31 (A) | 52 | 25 | ||||
Countrywide Asset-Backed Certificates, Ser 2003-BC2, Cl 2A1 | ||||||
0.836%, 06/25/33 (A) | 115 | 81 | ||||
Countrywide Asset-Backed Certificates, Ser 2005-17, Cl 1AF3 | ||||||
5.711%, 05/25/36 (A) | 10,000 | 4,586 | ||||
Countrywide Asset-Backed Certificates, Ser 2005-6, Cl M1 | ||||||
0.726%, 12/25/35 (A) | 320 | 285 | ||||
Countrywide Asset-Backed Certificates, Ser 2006-15, Cl A3 | ||||||
5.689%, 10/25/46 (A) | 208 | 125 | ||||
Countrywide Asset-Backed Certificates, Ser 2007-7, Cl 2A2 | ||||||
0.396%, 10/25/47 (A) | 7,500 | 4,649 | ||||
Countrywide Asset-Backed Certificates, Ser 2007-QH1, Cl A1 | ||||||
0.436%, 02/25/37 (A) (B) | 1,358 | 896 | ||||
Countrywide Asset-Backed Certificates, Ser 2007-SD1, Cl A1 | ||||||
0.686%, 03/25/47 (A) (B) | 977 | 380 | ||||
| Description | Face Amount ($ Thousands) | Market Value ($ Thousands) | ||||
Countrywide Home Equity Loan Trust, Ser 2004-K, Cl 2A | ||||||
0.539%, 02/15/34 (A) | $ | 955 | $ | 435 | ||
Countrywide Home Equity Loan Trust, Ser 2005-F, Cl 2A | ||||||
0.479%, 12/15/35 (A) | 2,172 | 752 | ||||
Credit Suisse First Boston Mortgage Securities, Ser 2001-MH29, Cl A | ||||||
5.600%, 09/25/31 | 516 | 484 | ||||
Credit-Based Asset Servicing and Securitization LLC, Ser 2006-CB2, Cl AF4 | ||||||
5.704%, 12/25/36 | 1,657 | 1,109 | ||||
Credit-Based Asset Servicing and Securitization LLC, Ser 2006-CB2, Cl AF2 | ||||||
5.501%, 12/25/36 | 924 | 664 | ||||
Credit-Based Asset Servicing and Securitization LLC, Ser 2007-CB4, Cl A1A | ||||||
0.326%, 04/25/37 (A) | 4,821 | 4,118 | ||||
Credit-Based Asset Servicing and Securitization LLC, Ser 2007-RP1, Cl A | ||||||
0.546%, 05/25/46 (A) (B) | 13,898 | 7,697 | ||||
Diamond Investment Grade CDO, Ser 1X, Cl A1 | ||||||
0.997%, 10/11/14 (G) | 3,262 | 3,034 | ||||
Dominos Pizza Master Issuer LLC, Ser 2007-1, Cl A2 | ||||||
5.261%, 04/25/37 (B) | 3,452 | 2,962 | ||||
Embarcadero Aircraft Securitization Trust, Ser 2000-A, Cl A1 | ||||||
0.719%, 08/15/25 (A) (B) | 4,046 | 1,517 | ||||
Equity One, Ser 2003-2, Cl M1 | ||||||
5.050%, 09/25/33 (A) | 622 | 540 | ||||
Fieldstone Mortgage Investment, Ser 2007-A, Cl 2A2 | ||||||
0.506%, 04/25/47 (A) | 2,000 | 699 | ||||
First Horizon Asset Back Trust, Ser 2004-HE2, Cl A | ||||||
0.456%, 02/25/34 (A) | 1,196 | 625 | ||||
First Horizon Asset Back Trust, Ser 2006-HE2, Cl A | ||||||
0.366%, 10/25/26 (A) | 670 | 298 | ||||
GMAC Mortgage Loan Trust, Ser 2005-HE3, Cl A1VN | ||||||
0.496%, 02/25/36 (A) | 6,863 | 1,667 | ||||
Green Tree Financial, Ser 1996-5, Cl A6 | ||||||
7.750%, 07/15/27 | 520 | 529 | ||||
GSAMP Trust, Ser 2003-SEA, Cl A1 | ||||||
0.636%, 02/25/33 (A) | 2,010 | 1,124 | ||||
| SEI Institutional Investments Trust / Semi-Annual Report / November 30, 2009 | 67 |
Table of Contents
SCHEDULE OF INVESTMENTS (Unaudited)
Core Fixed Income Fund (Continued)
November 30, 2009
| Description | Face Amount ($ Thousands) | Market Value ($ Thousands) | ||||
GSAMP Trust, Ser 2006-SD2, Cl A1 | ||||||
0.346%, 05/25/46 (A) (B) (G) | $ | 3,307 | $ | 3,075 | ||
John Deere Owner Trust, Ser 2009-A, Cl A3 | ||||||
2.590%, 10/15/13 | 300 | 306 | ||||
John Deere Owner Trust, Ser 2009-B, Cl A3 | ||||||
1.570%, 10/15/13 | 535 | 538 | ||||
JPMorgan Mortgage Acquisition, Ser 2007-CH1, Cl AF6 | ||||||
5.501%, 10/25/36 | 9,605 | 6,999 | ||||
Lehman XS Trust, Ser 2005-5N, Cl 1A1 | ||||||
0.536%, 11/25/35 (A) | 4,756 | 2,489 | ||||
Lehman XS Trust, Ser 2005-7N, Cl 1A1B | ||||||
0.536%, 12/25/35 (A) | 3,589 | 918 | ||||
Lehman XS Trust, Ser 2006-GP1, Cl A4A | ||||||
0.566%, 05/25/46 (A) | 8,114 | 693 | ||||
Lone Star CDO Funding, Ser IX, Cl A | ||||||
1.664%, 12/15/12 (G) | 4,169 | 3,940 | ||||
Merrill Lynch Mortgage Investors, Ser 2006-WMC2, Cl A2D | ||||||
5.890%, 03/25/37 | 5,593 | 2,239 | ||||
Mid-State Trust, Ser 2003-11, Cl A1 | ||||||
4.864%, 07/15/38 | 2,816 | 2,599 | ||||
Mid-State Trust, Ser 2006-1, Cl A | ||||||
5.787%, 10/15/40 (B) | 6,768 | 6,978 | ||||
MSCC Heloc Trust, Ser 2005-1, Cl A | ||||||
0.426%, 07/25/17 (A) | 528 | 245 | ||||
Nelnet Student Loan Trust, Ser 2008-4, Cl A4 | ||||||
1.762%, 04/25/24 (A) | 4,540 | 4,740 | ||||
Oakwood Mortgage Investors, Ser 2002-C, Cl AIO, IO | ||||||
6.000%, 08/15/10 | 4,786 | 180 | ||||
Oncor Electric Delivery Transition Bond, Ser 2003-1, Cl A2 | ||||||
4.030%, 02/15/12 | 334 | 336 | ||||
Origen Manufactured Housing, Ser 2002-A, Cl A1 | ||||||
0.479%, 05/15/32 (A) | 39 | 35 | ||||
Popular ABS Mortgage Pass-Through Trust, Ser 2007-A, Cl A3 | ||||||
0.546%, 06/25/47 (A) | 10,380 | 3,794 | ||||
RAAC Series, Ser 2007-RP4, Cl A | ||||||
0.586%, 11/25/46 (A) (B) | 15,744 | 7,541 | ||||
RAAC Series, Ser 2007-SP3, Cl A1 | ||||||
1.436%, 09/25/47 (A) | 436 | 280 | ||||
SLC Student Loan Trust, Ser 2008-1, Cl A4A | ||||||
1.899%, 12/15/32 (A) | 9,247 | 9,687 | ||||
| Description | Face Amount ($ Thousands) | Market Value ($ Thousands) | ||||
SLM Student Loan Trust, Ser 2002-5, Cl A4L | ||||||
0.449%, 09/17/18 (A) | $ | 747 | $ | 741 | ||
SLM Student Loan Trust, Ser 2003-3, Cl A4 | ||||||
0.519%, 12/15/17 (A) | 650 | 647 | ||||
SLM Student Loan Trust, Ser 2003-6, Cl A4 | ||||||
0.499%, 12/17/18 (A) | 457 | 455 | ||||
SLM Student Loan Trust, Ser 2008-5, Cl A4 | ||||||
1.982%, 07/25/23 (A) | 1,855 | 1,953 | ||||
SLM Student Loan Trust, Ser 2008-6, Cl A4 | ||||||
1.382%, 07/25/23 (A) | 3,706 | 3,732 | ||||
SLM Student Loan Trust, Ser 2008-8, Cl A4 | ||||||
1.932%, 07/25/22 (A) | 2,093 | 2,180 | ||||
Swift Master Auto Receivables Trust, Ser 2007-1, Cl A | ||||||
0.339%, 06/15/12 (A) | 1,249 | 1,233 | ||||
Wells Fargo Home Equity Trust, Ser 2007-2, Cl A1 | ||||||
0.326%, 04/25/37 (A) | 2,816 | 2,753 | ||||
| 123,891 | ||||||
Total Asset-Backed Securities | 244,942 | |||||
U.S. GOVERNMENT AGENCY OBLIGATIONS — 1.1% | ||||||
FHLB | ||||||
5.500%, 08/13/14 (C) | 8,500 | 9,788 | ||||
5.000%, 11/17/17 | 5,000 | 5,558 | ||||
0.500%, 05/10/10 | 8,950 | 8,961 | ||||
FHLMC | ||||||
5.500%, 07/18/16 | 4,000 | 4,614 | ||||
5.625%, 11/23/35 | 1,620 | 1,666 | ||||
FICO STRIPS, PO | ||||||
0.000%, 02/08/18 to 09/26/19 (E) | 22,290 | 15,803 | ||||
FNMA | ||||||
6.250%, 02/01/11 | 7,210 | 7,617 | ||||
5.250%, 08/01/12 | 2,800 | 3,016 | ||||
5.000%, 02/13/17 | 5,000 | 5,612 | ||||
Total U.S. Government Agency Obligations | 62,635 | |||||
MUNICIPAL BONDS — 0.2% | ||||||
North Texas, Tollway Authority, RB | ||||||
6.718%, 01/01/49 | 2,205 | 2,419 | ||||
State of California, Build America Project, GO | ||||||
7.550%, 04/01/39 | 1,760 | 1,806 | ||||
7.300%, 10/01/39 | 9,310 | 9,278 | ||||
| 68 | SEI Institutional Investments Trust / Semi-Annual Report / November 30, 2009 |
Table of Contents
| Description | Face Amount ($ Thousands)/ Shares | Market Value ($ Thousands) | ||||
State of Illinois, GO | ||||||
5.100%, 06/01/33 | $ | 270 | $ | 244 | ||
Total Municipal Bonds | 13,747 | |||||
PREFERRED STOCK — 0.0% | ||||||
GMAC, 7.000% (B) | 1 | 388 | ||||
Zurich RegCaPS Funding Trust, 0.000% (A) (B) | — | 224 | ||||
Total Preferred Stock | 612 | |||||
COMMERCIAL PAPER — 0.9% | ||||||
BNP Paribas Finance | ||||||
0.140%, 12/23/09 | 20,970 | 20,968 | ||||
National Rural Utilities Cooperative Finance | ||||||
0.170%, 12/04/09 | 6,210 | 6,210 | ||||
Rabobank USA Financial | ||||||
0.171%, 12/03/09 | 20,760 | 20,760 | ||||
Total Commercial Paper (Cost $47,938) ($ Thousands) | 47,938 | |||||
| �� | ||||||
CASH EQUIVALENT — 2.0% | ||||||
SEI Daily Income Trust, Prime Obligation Fund, Cl A | ||||||
0.130%**† | 107,466,394 | 107,466 | ||||
Total Cash Equivalent | 107,466 | |||||
Total Investments — 113.5% | ||||||
(Cost $6,256,102) ($ Thousands) | $ | 6,182,924 | ||||
| Description | Contracts/ Notional Amount ($ Thousands) | Market Value ($ Thousands) | ||||||
WRITTEN OPTIONS — 0.0% |
| |||||||
March 2010 90Day EURO$ | $ | (136 | ) | $ | (61 | ) | ||
March 2010 90Day EURO$ Future Call, Expires 03/20/10, Strike Price $99.00* | (167 | ) | (265 | ) | ||||
March 2010 90Day EURO$ Future Put, Expires 03/20/10, Strike Price $99.13* | (219 | ) | (14 | ) | ||||
Total Written Options |
| (340 | ) | |||||
WRITTEN SWAPTIONS — 0.0% |
| |||||||
U.S. Swaption Call, Credit Suisse* | (23,700 | ) | (181 | ) | ||||
U.S. Swaption Put, Credit Suisse* | (23,700 | ) | (861 | ) | ||||
Total Written Swaptions |
| (1,042 | ) | |||||
| SEI Institutional Investments Trust / Semi-Annual Report / November 30, 2009 | 69 |
Table of Contents
SCHEDULE OF INVESTMENTS (Unaudited)
Core Fixed Income Fund (Concluded)
November 30, 2009
A summary of outstanding swap agreements held by the Fund at November 30, 2009, is as follows:
| Credit Default Swaps | |||||||||||||||||
| Counterparty | Reference Entity/Obligation | Buy/Sell Protection | (Pays)/ Receives Rate | Termination Date | Notional Amount (Thousands) | Net Unrealized Appreciation (Depreciation) ($Thousands) | |||||||||||
| Bank of America | CMBX-NA-AJ 1 Index | Buy | (0.84 | )% | 10/12/52 | $ | 3,850 | $ | (1,164 | ) | |||||||
| Bank of America | CMBX-NA-AJ 1 Index | Buy | (0.84 | ) | 10/12/52 | 5,500 | (1,713 | ) | |||||||||
| Barclays Bank PLC | ABX.HE.AAA 07-1 Index | Sell | 0.09 | 08/25/37 | (4,680 | ) | (2,482 | ) | |||||||||
| Barclays Bank PLC | ABX.HE.PENAAA 07-2 Index | Sell | 0.76 | 01/25/38 | (4,600 | ) | (77 | ) | |||||||||
| Barclays Bank PLC | ABX.HE.PENAAA 07-2 Index | Sell | 0.76 | 01/25/38 | (4,000 | ) | (30 | ) | |||||||||
| Barclays Bank PLC | CMBX-NA-AJ 1 Index | Buy | (0.84 | ) | 10/12/52 | 16,235 | (5,144 | ) | |||||||||
| Barclays Bank PLC | CMBX-NA-AJ 1 Index | Buy | (0.84 | ) | 10/12/49 | 2,000 | 408 | ||||||||||
| Barclays Bank PLC | CMBX-NA-AJ 1 Index | Buy | (0.84 | ) | 10/12/49 | 2,000 | 387 | ||||||||||
| Citigroup | ABX.HE.AAA 06-2 Index | Sell | 0.11 | 05/25/46 | (2,087 | ) | (491 | ) | |||||||||
| Citigroup | ABX.HE.AAA 07-1 Index | Sell | 0.09 | 08/25/37 | (3,545 | ) | (1,870 | ) | |||||||||
| Citigroup | ABX.HE.PENAAA 07-2 Index | Sell | 0.76 | 01/25/38 | (8,100 | ) | 344 | ||||||||||
| Citigroup | ABX.HE.PENAAA 07-2 Index | Sell | 0.76 | 01/25/38 | (5,500 | ) | 125 | ||||||||||
| Citigroup | Arrow Electric, 6.875% 06/01/18 | Buy | (0.82 | ) | 03/20/14 | 1,485 | (1 | ) | |||||||||
| Citigroup | CMBX-NA-AJ 1 Index | Buy | (0.84 | ) | 10/12/52 | 2,110 | (649 | ) | |||||||||
| Citigroup | Darden Restaurants Inc., 6.000% 08/15/35 | Buy | (2.73 | ) | 03/20/14 | 1,435 | (83 | ) | |||||||||
| Citigroup | Darden Restaurants Inc., 7.125% 02/01/16 | Buy | (2.40 | ) | 03/20/15 | 1,200 | (55 | ) | |||||||||
| Citigroup | DR Horton, Inc., 5.375% 6/15/12 | Buy | (1.00 | ) | 09/20/16 | 1,020 | 56 | ||||||||||
| Citigroup | Hewlett Packard, 5.400% 03/01/17 | Buy | (0.72 | ) | 03/20/14 | 1,485 | (29 | ) | |||||||||
| Citigroup | Home Depot, 5.875% 12/16/36 | Buy | (2.67 | ) | 03/20/14 | 5,100 | (447 | ) | |||||||||
| Citigroup | KB Home, 5.750% 2/01/14 | Buy | (1.00 | ) | 09/20/16 | 1,020 | 89 | ||||||||||
| Citigroup | Lowes Cos. Inc., 8.250% 06/01/10 | Buy | (1.20 | ) | 03/20/14 | 5,320 | (129 | ) | |||||||||
| Citigroup | Nordstrom Inc., 6.950%, 03/15/28 | Buy | (3.15 | ) | 03/20/14 | 1,135 | (106 | ) | |||||||||
| Credit Suisse | ABX.HE.AA 06-2 Index | Sell | 0.17 | 05/25/46 | (4,728 | ) | (456 | ) | |||||||||
| Credit Suisse | ABX.HE.AA 06-2 Index | Sell | 0.17 | 05/25/46 | (5,011 | ) | (520 | ) | |||||||||
| Credit Suisse | ABX.HE.AAA 06-1 Index | Sell | 0.09 | 08/25/37 | (4,000 | ) | (606 | ) | |||||||||
| Credit Suisse | CMBX-NA-AJ 1 Index | Buy | (0.84 | ) | 10/12/52 | 390 | (122 | ) | |||||||||
| Credit Suisse | General Electric Corp., 5.625% 09/15/17 | Sell | 6.55 | 12/20/10 | (2,570 | ) | 159 | ||||||||||
| Credit Suisse | Pulte Homes, Inc., 5.250% 1/15/14 | Buy | (1.00 | ) | 09/20/16 | 2,250 | 65 | ||||||||||
| Credit Suisse | Target Corporation, 4.000% 6/15/13 | Buy | (1.00 | ) | 12/20/14 | 1,280 | 4 | ||||||||||
| Credit Suisse | Toll Brothers Inc., 5.150% 05/15/15 | Buy | (1.00 | ) | 09/20/16 | 6,700 | 288 | ||||||||||
| Deutsche Bank | Centex Corporation, 5.250% 06/15/15 | Buy | (4.40 | ) | 12/20/13 | 600 | (87 | ) | |||||||||
| Deutsche Bank | Darden Restaurants Inc., 6.000% 08/15/35 | Buy | (2.25 | ) | 03/20/14 | 1,650 | (62 | ) | |||||||||
| Deutsche Bank | Darden Restaurants Inc., 7.125% 02/01/16 | Buy | (2.25 | ) | 03/20/13 | 600 | (22 | ) | |||||||||
| Deutsche Bank | DR Horton, Inc., 5.375% 6/15/12 | Buy | (1.00 | ) | 09/20/16 | 800 | 31 | ||||||||||
| Deutsche Bank | Kohl’S Corporation, 6.250% 12/15/17 | Buy | (1.00 | ) | 12/20/14 | 1,280 | (2 | ) | |||||||||
| Deutsche Bank | Nordstrom Inc., 6.950%, 03/15/28 | Buy | (2.10 | ) | 03/20/14 | 1,675 | (81 | ) | |||||||||
| Deutsche Bank | Pulte Homes, Inc., 5.250% 1/15/14 | Buy | (1.00 | ) | 09/20/16 | 3,050 | 93 | ||||||||||
| Deutsche Bank | Pulte Homes, Inc., 5.250% 1/15/14 | Buy | (1.00 | ) | 09/20/16 | 2,250 | 107 | ||||||||||
| Deutsche Bank | Target Corporation, 4.000% 6/15/13 | Buy | (1.00 | ) | 12/20/14 | 1,280 | 4 | ||||||||||
| Goldman Sachs | ABX.HE.AA 06-2 Index | Sell | 0.17 | 05/25/46 | (3,593 | ) | (355 | ) | |||||||||
| Goldman Sachs | ABX.HE.AAA 07-1 Index | Sell | 0.09 | 08/25/37 | (5,420 | ) | (1,090 | ) | |||||||||
| Goldman Sachs | DR Horton, Inc., 5.375% 6/15/12 | Buy | (1.00 | ) | 09/20/16 | 795 | 31 | ||||||||||
| Goldman Sachs | Pulte Homes, Inc., 5.250% 1/15/14 | Buy | (1.00 | ) | 09/20/16 | 1,600 | 53 | ||||||||||
| Merrill Lynch | Centex Corporation, 5.250% 06/15/15 | Buy | (3.56 | ) | 12/20/12 | 1,970 | (176 | ) | |||||||||
| Merrill Lynch | Centex Corporation, 5.250% 06/15/15 | Buy | (3.56 | ) | 12/20/12 | 1,375 | (127 | ) | |||||||||
| Morgan Stanley | ABX.HE.AAA 07-1 Index | Sell | 0.09 | 08/25/37 | (2,100 | ) | (440 | ) | |||||||||
| Morgan Stanley | ABX.HE.AAA 07-1 Index | Sell | 0.09 | 08/25/37 | (5,200 | ) | (1,046 | ) | |||||||||
| Morgan Stanley | CDX.IG HVOL.12 Index | Sell | 5.00 | 04/20/14 | (6,090 | ) | 553 | ||||||||||
| Morgan Stanley | Darden Restaurants Inc., 7.125% 02/01/16 | Buy | (2.25 | ) | 03/20/13 | 600 | (22 | ) | |||||||||
| Morgan Stanley | Kohl’s Corporation, 6.250% 12/15/17 | Buy | (1.00 | ) | 12/20/14 | 1,280 | (2 | ) | |||||||||
| Morgan Stanley | Midamerican Energy Corp., 4.625% 10/15/13 | Sell | 4.00 | 03/20/11 | (5,400 | ) | 238 | ||||||||||
| Royal Bank of Scotland | ABX.HE.AA 06-2 Index | Sell | 0.17 | 05/25/46 | (2,837 | ) | (274 | ) | |||||||||
| $ | (16,925 | ) | |||||||||||||||
| Interest Rate Swaps | |||||||||||||
| Counterparty | Fund Pays | Fund Receives | Termination Date | Notional Amount (Thousands) | Net Unrealized Appreciation (Depreciation) ($Thousands) | ||||||||
| Deutsche Bank | 2.90% | 3-Month LIBOR | 02/28/14 | $ | 87,200,000 | $ | (2,747 | ) | |||||
| Goldman Sachs | 4.21 | 10-YR CMS | 05/25/10 | 9,180,000 | 46 | ||||||||
| $ | (2,701 | ) | |||||||||||
| 70 | SEI Institutional Investments Trust / Semi-Annual Report / November 30, 2009 |
Table of Contents
A summary of the open futures contracts held by the Fund at November 30, 2009, is as follows:
| Type of Contract | Number of Contracts Long (Short) | Expiration Date | Unrealized Appreciation (Depreciation) ($ Thousands) | ||||||
90-Day Euro$ | 290 | Mar-2010 | $ | 770 | |||||
90-Day Euro$ | (26 | ) | Sep-2010 | (247 | ) | ||||
90-Day Euro$ | (26 | ) | Dec-2010 | (233 | ) | ||||
90-Day Euro$ | (26 | ) | Mar-2011 | (215 | ) | ||||
90-Day Euro$ | (26 | ) | Jun-2011 | (197 | ) | ||||
Euro Bond | 193 | Mar-2010 | (283 | ) | |||||
U.S. 10-Year Note | (1,709 | ) | Mar-2010 | (2,708 | ) | ||||
U.S. 10-Year Note | 406 | Mar-2010 | 519 | ||||||
U.S. 2-Year Note | 177 | Apr-2010 | 113 | ||||||
U.S. 5-Year Note | 2,312 | Apr-2010 | 2,485 | ||||||
U.S. 5-Year Note | 638 | Apr-2010 | 492 | ||||||
U.S. Long Treasury Bond | (426 | ) | Mar-2010 | (1,029 | ) | ||||
| $ | (533 | ) | |||||||
For the year ended November 30, 2009, the total amount of all open futures contracts, as presented in the table above, are representative of the volume of activity for this derivative type during the period.
Percentages are based on a Net Assets of $5,446,462 ($ Thousands)
| * | Non-income producing security. |
| ** | The rate reported is the 7-day effective yield as of November 30, 2009. |
| ‡ | Real Estate Investment Trust |
| † | Investment in Affiliated Security (See Note 4). |
| (A) | Variable Rate Security — The rate reported is the rate in effect as of November 30, 2009. The date reported is the final maturity date. |
| (B) | Securities sold within terms of a private placement memorandum, exempt from registration under Section 144A of the Securities Act of 1933, as amended, and may be sold only to dealers in that program or other “accredited investors.” These securities have been determined to be liquid under guidelines established by the board of Trustees. |
| (C) | This security or a partial position of this security is on loan at November 30, 2009. The total value of securities on loan at November 30, 2009 was $495,935 ($ Thousands). |
| (D) | Security in default on interest payments. |
| (E) | The rate reported is the effective yield at time of purchase. |
| (F) | This security was purchased with cash collateral held from securities on loan. The total value of this security as of November 30, 2009 was $646,774 ($ Thousands). |
| (G) | Security fair valued using methods determined in good faith by the Valuation Committee of the Board of Trustees. The total value of such securities as of November 30, 2009 was $10,961 ($ Thousands) and represented 0.20% of net assets. |
| (H) | Securities considered illiquid. The total value of such securities as of November 30, 2009 was $912 ($ Thousands) and represented 0.02% of net assets. |
ABS — Asset-Backed Security
ARM — Adjustable Rate Mortgage
CDO — Collateralized Debt Obligation
Cl — Class
CMO — Collateralized Mortgage Obligation
EUR — Euro
FHLB — Federal Home Loan Bank
FHLMC — Federal Home Loan Mortgage Corporation
FICO — Financing Corporation
FNMA — Federal National Mortgage Association
GNMA — Government National Mortgage Association
GO — General Obligation
IO — Interest Only — face amount represents notional amount
LIBOR — London Interbank Offered Rate
LLC — Limited Liability Company
L.P. — Limited Partnership
MTN — Medium Term Note
PLC — Public Limited Company
PO — Principal Only
RB — Revenue Bond
Ser — Series
STRIPS — Separately Traded Registered Interest and Principal Securities
TBA — To Be Announced
Amounts designated as “—” are $O or have been rounded to $O.
The following is a summary of the inputs used as of November 30, 2009 in valuing the Fund’s investments carried at value ($ Thousands):
| Investments in Securities | Level 1 | Level 2 | Level 3 | Total | ||||||||
Mortgage-Backed Securities | $ | — | $ | 2,779,475 | $ | 10,149 | $ | 2,789,624 | ||||
Corporate Obligations | — | 1,462,552 | 435 | 1,462,987 | ||||||||
U.S. Treasury Obligations | — | 806,199 | — | 806,199 | ||||||||
Affiliated Partnership | — | 646,774 | — | 646,774 | ||||||||
Asset-Backed Securities | — | 240,522 | 4,420 | 244,942 | ||||||||
U.S. Government Agency Obligations | — | 62,635 | — | 62,635 | ||||||||
Municipal Bonds | — | 13,747 | — | 13,747 | ||||||||
Preferred Stock | — | 612 | — | 612 | ||||||||
Cash Equivalent | 107,466 | — | — | 107,466 | ||||||||
Commercial Paper | — | 47,938 | — | 47,938 | ||||||||
Total Investments in Securities | $ | 107,466 | $ | 6,060,454 | $ | 15,004 | $ | 6,182,924 | ||||
| Liabilities | Level 1 | Level 2 | Level 3 | Total | |||||||||||
Written Options | $ | (340 | ) | $ | — | $ | — | $ | (340 | ) | |||||
Written Swaptions | — | — | (1,042 | ) | (1,042 | ) | |||||||||
Total Liabilities | $ | (340 | ) | $ | — | $ | (1,042 | ) | $ | (1,382 | ) | ||||
| Other Financial Instruments | Level 1 | Level 2 | Level 3 | Total | |||||||||||
Futures Contracts* | $ | (533 | ) | $ | — | $ | — | $ | (533 | ) | |||||
Credit Default Swaps | — | (16,925 | ) | — | (16,925 | ) | |||||||||
Interest Rate Swaps | — | (2,701 | ) | — | (2,701 | ) | |||||||||
Total Other Financial Instruments | $ | (533 | ) | $ | (19,626 | ) | $ | — | $ | (20,159 | ) | ||||
The following is a reconciliation of investments in which significant unobservable inputs (Level 3) were used in determining value ($ Thousands):
| Investments in Corporate Obligations | Investments in Mortgage-Backed Securities | ||||||
Beginning balance as of June 1, 2009 | $ | 442 | $ | 6,159 | |||
Accrued discounts/premiums | 29 | 59 | |||||
Realized gain/(loss) | — | 207 | |||||
Change in unrealized appreciation/(depreciation) | (36 | ) | 1,719 | ||||
Net purchases/sales | — | 2,005 | |||||
Net transfer in and/or out of Level 3 | — | — | |||||
Ending balance as of November 30, 2009 | $ | 435 | $ | 10,149 | |||
Changes in unrealized gains/(losses) included in earnings related to securities still held at reporting date. | $ | (36 | ) | $ | 1,725 | ||
| Investments in Asset-Backed Securities | Investments in Written Swaptions | |||||||
Beginning balance as of June 1, 2009 | $ | 6,789 | $ | — | ||||
Accrued discounts/premiums | 5 | — | ||||||
Realized gain/(loss) | 18 | — | ||||||
Change in unrealized appreciation/(depreciation) | 686 | (58 | ) | |||||
Net purchases/sales | (3,078 | ) | (984 | ) | ||||
Net transfer in and/or out of Level 3 | — | — | ||||||
Ending balance as of November 30, 2009 | 4,420 | $ | (1,042 | ) | ||||
Changes in unrealized gains/(losses) included in earnings related to securities still held at reporting date. | $ | 331 | $ | — | ||||
| * | Futures contracts are valued at the unrealized appreciation on the instrument. |
For more information on valuation inputs, see Note 2 — Significant Accounting Policies in Notes to Financial Statements.
The accompanying notes are an integral part of the financial statements.
| SEI Institutional Investments Trust / Semi-Annual Report / November 30, 2009 | 71 |
Table of Contents
SCHEDULE OF INVESTMENTS (Unaudited)
High Yield Bond Fund
November 30, 2009
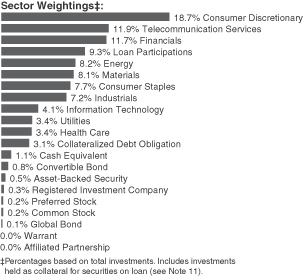
| Description | Face Amount ($ Thousands) | Market Value ($ Thousands) | ||||
CORPORATE OBLIGATIONS — 84.0% | ||||||
Consumer Discretionary — 18.7% | ||||||
Adelphia Communications (escrow security) | ||||||
10.250%, 06/15/11 (B) | $ | 125 | $ | 4 | ||
7.875%, 01/15/09 (B) | 250 | 9 | ||||
7.750%, 05/01/09 (B) | 75 | 1 | ||||
Adelphia Communications, Ser B (escrow security) | ||||||
9.500%, 02/15/04 | 25 | 1 | ||||
America West Airlines LLC | ||||||
8.057%, 07/02/20 | 2,110 | 1,899 | ||||
American Airlines | ||||||
13.000%, 08/01/16 (A) | 2,040 | 2,224 | ||||
Ameristar Casinos | ||||||
9.250%, 06/01/14 (A) | 2,100 | 2,142 | ||||
Amscan Holdings | ||||||
8.750%, 05/01/14 | 2,205 | 2,089 | ||||
ARAMARK | ||||||
8.500%, 02/01/15 | 1,110 | 1,113 | ||||
ArvinMeritor | ||||||
8.125%, 09/15/15 | 1,620 | 1,474 | ||||
Ashtead Capital | ||||||
9.000%, 08/15/16 (A) | 2,989 | 2,929 | ||||
Avis Budget Car Rental LLC | ||||||
7.750%, 05/15/16 | 780 | 698 | ||||
Beazer Homes USA | ||||||
12.000%, 10/15/17 (A) | 1,290 | 1,393 | ||||
8.625%, 05/15/11 | 1,250 | 1,213 | ||||
8.375%, 04/15/12 | 40 | 37 | ||||
6.500%, 11/15/13 | 1,475 | 1,180 | ||||
Belo | ||||||
8.000%, 11/15/16 | 1,250 | 1,259 | ||||
Blockbuster | ||||||
11.750%, 10/01/14 (A) | 3,035 | 2,838 | ||||
| Description | Face Amount ($ Thousands) | Market Value ($ Thousands) | ||||
9.000%, 09/01/12 | $ | 2,530 | $ | 1,265 | ||
Bon-Ton Department Stores | ||||||
10.250%, 03/15/14 | 635 | 571 | ||||
Boyd Gaming | ||||||
7.125%, 02/01/16 | 1,570 | 1,279 | ||||
Broder Brothers | ||||||
15.000%, 10/15/13 (A) | 573 | 419 | ||||
Brunswick | ||||||
11.750%, 08/15/13 | 1,500 | 1,706 | ||||
11.250%, 11/01/16 (A) | 3,465 | 3,872 | ||||
Burlington Coat Factory Investment Holdings | ||||||
14.500%, 10/15/14 | 4,105 | 4,115 | ||||
Burlington Coat Factory Warehouse | ||||||
11.125%, 04/15/14 | 3,920 | 4,057 | ||||
Cablevision Systems | ||||||
8.625%, 09/15/17 (A) | 1,305 | 1,338 | ||||
Caesars Entertainment | ||||||
8.125%, 05/15/11 | 265 | 265 | ||||
7.875%, 03/15/10 | 1,282 | 1,276 | ||||
Carrols | ||||||
9.000%, 01/15/13 | 325 | 327 | ||||
CCH II LLC | ||||||
10.250%, 09/15/10 (B) | 1,225 | 1,525 | ||||
CCH II LLC, Ser B | ||||||
10.250%, 09/15/10 (B) | 860 | 1,066 | ||||
CCO Holdings LLC | ||||||
0.000%, 11/15/13 (B) | 3,285 | 3,618 | ||||
Charter Communications Operating LLC | ||||||
10.875%, 09/15/14 (A) (B) | 4,075 | 4,539 | ||||
Charter Communications Operating LLC | ||||||
8.000%, 04/30/12 (A) (B) | 4,320 | 4,396 | ||||
Dana (escrow security) (B) | ||||||
7.000%, 03/15/28 | 200 | 5 | ||||
7.000%, 03/01/09 | 175 | 4 | ||||
6.500%, 03/01/29 | 1,100 | 27 | ||||
6.500%, 03/15/08 | 100 | 2 | ||||
Dave & Buster’s | ||||||
11.250%, 03/15/14 | 2,081 | 2,133 | ||||
Delta Air Lines | ||||||
7.920%, 11/18/10 | 575 | 575 | ||||
7.711%, 09/18/11 | 1,900 | 1,843 | ||||
Denny’s Holdings | ||||||
10.000%, 10/01/12 (B) | 380 | 388 | ||||
Dex Media | ||||||
9.000%, 11/15/13 (B) (D) | 1,020 | 250 | ||||
9.000%, 11/15/13 (D) | 1,625 | 398 | ||||
Dex Media West, Ser B | ||||||
9.875%, 08/15/13 (B) | 2,710 | 854 | ||||
8.500%, 08/15/10 (B) | 1,500 | 1,552 | ||||
DirecTV Holdings LLC | ||||||
6.375%, 06/15/15 | 1,650 | 1,695 | ||||
DISH DBS | ||||||
7.125%, 02/01/16 | 2,770 | 2,742 | ||||
| 72 | SEI Institutional Investments Trust / Semi-Annual Report / November 30, 2009 |
Table of Contents
| Description | Face Amount ($ Thousands) | Market Value ($ Thousands) | ||||
DR Horton | ||||||
6.000%, 04/15/11 | $ | 730 | $ | 737 | ||
Duane Reade | ||||||
11.750%, 08/01/15 (A) | 1,690 | 1,821 | ||||
9.750%, 08/01/11 | 250 | 254 | ||||
Eastman Kodak | ||||||
7.250%, 11/15/13 | 995 | 791 | ||||
Easton-Bell Sports | ||||||
9.750%, 12/01/16 (A) | 1,525 | 1,554 | ||||
El Dorado Casino Shreveport PIK | ||||||
10.000%, 08/01/12 | 1,102 | 925 | ||||
El Pollo Loco | ||||||
11.750%, 12/01/12 (A) | 2,250 | 2,323 | ||||
Eye Care Centers of America | ||||||
10.750%, 02/15/15 | 600 | 617 | ||||
Fontainebleau Las Vegas | ||||||
10.250%, 06/15/15 (A) (B) | 3,500 | 35 | ||||
Ford Motor | ||||||
7.450%, 07/16/31 | 1,710 | 1,456 | ||||
Galaxy Entertainment Finance | ||||||
9.875%, 12/15/12 (A) | 1,565 | 1,573 | ||||
Gaylord Entertainment | ||||||
6.750%, 11/15/14 | 415 | 376 | ||||
General Motors | ||||||
7.700%, 04/15/16 (B) | 1,601 | 336 | ||||
Goodyear Tire & Rubber | ||||||
10.500%, 05/15/16 | 325 | 350 | ||||
9.000%, 07/01/15 | 51 | 52 | ||||
8.625%, 12/01/11 | 831 | 851 | ||||
Group 1 Automotive | ||||||
8.250%, 08/15/13 | 100 | 99 | ||||
Hanesbrands, Ser B | ||||||
4.592%, 12/15/14 (C) | 1,685 | 1,521 | ||||
Harrah’s Operating | ||||||
11.250%, 06/01/17 (A) | 575 | 588 | ||||
10.000%, 12/15/18 (A) | 6,551 | 4,979 | ||||
5.750%, 10/01/17 | 1,000 | 500 | ||||
5.500%, 07/01/10 | 248 | 247 | ||||
Harrahs Operating Escrow LLC | ||||||
11.250%, 06/01/17 (A) | 7,430 | 7,579 | ||||
Hertz | ||||||
10.500%, 01/01/16 | 955 | 993 | ||||
8.875%, 01/01/14 | 1,580 | 1,588 | ||||
HSN | ||||||
11.250%, 08/01/16 | 1,700 | 1,874 | ||||
Inergy | ||||||
8.750%, 03/01/15 (A) | 550 | 561 | ||||
8.250%, 03/01/16 | 345 | 348 | ||||
6.875%, 12/15/14 | 275 | 266 | ||||
Interpublic Group | ||||||
2.273%, 11/15/10 (C) | 346 | 337 | ||||
Interpublic Group of Cos. | ||||||
10.000%, 07/15/17 (A) | 450 | 493 | ||||
| Description | Face Amount ($ Thousands) | Market Value ($ Thousands) | ||||
Invista | ||||||
9.250%, 05/01/12 (A) | $ | 608 | $ | 617 | ||
Isle of Capri Casinos | ||||||
7.000%, 03/01/14 | 1,240 | 1,079 | ||||
Jarden | ||||||
8.000%, 05/01/16 | 500 | 515 | ||||
7.500%, 05/01/17 | 1,910 | 1,891 | ||||
JC Penney | ||||||
7.950%, 04/01/17 | 515 | 548 | ||||
7.400%, 04/01/37 | 1,860 | 1,767 | ||||
K Hovnanian Enterprises | ||||||
10.625%, 10/15/16 (A) | 655 | 668 | ||||
7.500%, 05/15/16 | 685 | 493 | ||||
6.250%, 01/15/15 | 375 | 270 | ||||
KAR Holdings | ||||||
10.000%, 05/01/15 | 1,125 | 1,164 | ||||
8.750%, 05/01/14 | 1,050 | 1,066 | ||||
4.281%, 05/01/14 (C) | 800 | 744 | ||||
Lamar Media | ||||||
7.250%, 01/01/13 | 900 | 884 | ||||
6.625%, 08/15/15 | 1,700 | 1,615 | ||||
Landry’s Restaurants | ||||||
14.000%, 08/15/11 | 3,000 | 3,015 | ||||
11.625%, 12/01/15 (A) | 2,514 | 2,552 | ||||
Levi Strauss | ||||||
9.750%, 01/15/15 | 800 | 838 | ||||
Lions Gate Entertainment | ||||||
10.250%, 11/01/16 (A) | 3,265 | 3,175 | ||||
M/I Homes | ||||||
6.875%, 04/01/12 | 640 | 595 | ||||
Macy’s Retail Holdings | ||||||
8.875%, 07/15/15 | 2,430 | 2,582 | ||||
7.875%, 08/15/36 | 450 | 394 | ||||
6.700%, 07/15/34 | 165 | 139 | ||||
6.375%, 03/15/37 | 1,015 | 858 | ||||
5.900%, 12/01/16 | 1,155 | 1,091 | ||||
MDC Partners | ||||||
11.000%, 11/01/16 (A) | 3,300 | 3,300 | ||||
Meritage Homes | ||||||
7.000%, 05/01/14 | 995 | 945 | ||||
6.250%, 03/15/15 | 205 | 187 | ||||
MGM Mirage | ||||||
13.000%, 11/15/13 (A) | 75 | 85 | ||||
11.375%, 03/01/18 (A) | 410 | 354 | ||||
11.125%, 11/15/17 (A) | 1,045 | 1,144 | ||||
10.375%, 05/15/14 (A) | 775 | 827 | ||||
8.500%, 09/15/10 | 150 | 149 | ||||
7.625%, 01/15/17 | 1,935 | 1,471 | ||||
7.500%, 06/01/16 | 4,640 | 3,515 | ||||
6.875%, 04/01/16 | 250 | 186 | ||||
6.750%, 09/01/12 | 1,070 | 912 | ||||
6.750%, 04/01/13 | 2,210 | 1,815 | ||||
6.625%, 07/15/15 | 380 | 283 | ||||
5.875%, 02/27/14 | 3,085 | 2,391 | ||||
| SEI Institutional Investments Trust / Semi-Annual Report / November 30, 2009 | 73 |
Table of Contents
SCHEDULE OF INVESTMENTS (Unaudited)
High Yield Bond Fund (Continued)
November 30, 2009
| Description | Face Amount ($ Thousands) | Market Value ($ Thousands) | ||||
Michaels Stores | ||||||
11.375%, 11/01/16 (A) | $ | 21 | $ | 21 | ||
Mohegan Tribal Gaming Authority | ||||||
7.125%, 08/15/14 | 905 | 570 | ||||
MTR Gaming Group | ||||||
12.625%, 07/15/14 (A) | 1,055 | 978 | ||||
NCL | ||||||
11.750%, 11/15/16 (A) | 310 | 306 | ||||
Nebraska Book | ||||||
10.000%, 12/01/11 (A) | 1,650 | 1,658 | ||||
Neiman-Marcus Group | ||||||
10.375%, 10/15/15 | 1,500 | 1,354 | ||||
Neiman-Marcus Group PIK | ||||||
9.000%, 10/15/15 | 1,918 | 1,731 | ||||
Newell Rubbermaid | ||||||
10.600%, 04/15/19 | 1,055 | 1,342 | ||||
Norcraft Holdings | ||||||
9.750%, 09/01/12 | 1,475 | 1,401 | ||||
OSI Restaurant Partners | ||||||
10.000%, 06/15/15 | 2,873 | 2,485 | ||||
Peninsula Gaming LLC | ||||||
10.750%, 08/15/17 (A) | 1,250 | 1,244 | ||||
8.375%, 08/15/15 (A) | 1,250 | 1,231 | ||||
Penn National Gaming | ||||||
6.750%, 03/01/15 | 3,490 | 3,333 | ||||
Penske Auto Group | ||||||
7.750%, 12/15/16 | 1,700 | 1,645 | ||||
Pinnacle Entertainment | ||||||
7.500%, 06/15/15 | 2,095 | 1,865 | ||||
Quiksilver | ||||||
6.875%, 04/15/15 | 1,455 | 1,113 | ||||
QVC | ||||||
7.500%, 10/01/19 (A) | 3,575 | 3,575 | ||||
River Rock Entertainment Authority | ||||||
9.750%, 11/01/11 | 2,685 | 2,470 | ||||
RJ Tower | ||||||
12.000%, 06/01/13 (B) | 210 | 1 | ||||
Royal Caribbean Cruises | ||||||
11.875%, 07/15/15 | 900 | 1,008 | ||||
7.250%, 06/15/16 | 1,105 | 1,019 | ||||
7.000%, 06/15/13 | 925 | 879 | ||||
6.875%, 12/01/13 | 1,939 | 1,823 | ||||
RSC Equipment Rental | ||||||
9.500%, 12/01/14 | 5,510 | 5,393 | ||||
Salem Communications | ||||||
9.625%, 12/15/16 (A) | 1,152 | 1,175 | ||||
Sally Holdings LLC | ||||||
10.500%, 11/15/16 | 3,045 | 3,258 | ||||
9.250%, 11/15/14 | 1,615 | 1,672 | ||||
San Pasqual Casino | ||||||
8.000%, 09/15/13 (A) | 1,530 | 1,400 | ||||
Sbarro | ||||||
10.375%, 02/01/15 | 1,866 | 1,474 | ||||
| Description | Face Amount ($ Thousands) | Market Value ($ Thousands) | ||||
Sealy Mattress | ||||||
10.875%, 04/15/16 (A) | $ | 35 | $ | 39 | ||
8.250%, 06/15/14 | 3,805 | 3,748 | ||||
Seminole Hard Rock Entertainment | ||||||
2.799%, 03/15/14 (A) (C) | 600 | 486 | ||||
Service International | ||||||
7.375%, 10/01/14 | 1,035 | 1,032 | ||||
6.750%, 04/01/15 | 1,545 | 1,491 | ||||
Shingle Springs Tribal Group | ||||||
9.375%, 06/15/15 (A) | 1,945 | 1,410 | ||||
Simmons | ||||||
10.000%, 12/15/14 (B) (D) | 6,595 | 561 | ||||
Simmons Bedding | ||||||
7.875%, 01/15/14 (B) | 4,195 | 3,817 | ||||
Sinclair Broadcast Group | ||||||
8.000%, 03/15/12 | 2,025 | 1,946 | ||||
Sirius XM Radio | ||||||
9.750%, 09/01/15 (A) | 1,380 | 1,423 | ||||
Speedway Motorsports | ||||||
8.750%, 06/01/16 (A) | 1,750 | 1,846 | ||||
Stanadyne Holdings | ||||||
12.000%, 02/15/15 (D) | 1,500 | 975 | ||||
Stanadyne Holdings, Ser 1 | ||||||
10.000%, 08/15/14 | 475 | 418 | ||||
Standard Pacific Escrow LLC | ||||||
10.750%, 09/15/16 (A) | 2,275 | 2,252 | ||||
Starwood Hotels & Resorts Worldwide | ||||||
6.750%, 05/15/18 | 2,535 | 2,440 | ||||
Station Casinos | ||||||
6.875%, 03/01/16 (B) | 960 | 10 | ||||
6.625%, 03/15/18 (B) | 2,090 | 21 | ||||
Steinway Musical Instruments | ||||||
7.000%, 03/01/14 (A) | 5,070 | 4,487 | ||||
Sun Media | ||||||
7.625%, 02/15/13 | 835 | 747 | ||||
Tenneco | ||||||
8.625%, 11/15/14 | 1,435 | 1,406 | ||||
Toys R Us Property I LLC | ||||||
10.750%, 07/15/17 (A) | 640 | 683 | ||||
Travelport LLC | ||||||
11.875%, 09/01/16 | 6,045 | 6,045 | ||||
9.875%, 09/01/14 | 690 | 690 | ||||
4.881%, 09/01/14 (C) | 2,044 | 1,717 | ||||
TRW Automotive | ||||||
7.250%, 03/15/17 (A) | 1,095 | 1,013 | ||||
7.000%, 03/15/14 (A) | 2,040 | 1,930 | ||||
Turning Stone Resort Casino Enterprise | ||||||
9.125%, 09/15/14 (A) | 1,970 | 1,916 | ||||
UAL 1995 Pass Through Trust A | ||||||
9.020%, 04/19/12 | 546 | 137 | ||||
UAL Pass Through Trust, Ser 2000-2 | ||||||
7.811%, 04/01/11 (B) | 1,875 | 2,476 | ||||
7.186%, 04/01/11 | 94 | 94 | ||||
7.032%, 10/01/10 | 12 | 12 | ||||
| 74 | SEI Institutional Investments Trust / Semi-Annual Report / November 30, 2009 |
Table of Contents
| Description | Face Amount ($ Thousands) | Market Value ($ Thousands) | ||||
United Air Lines | ||||||
10.400%, 11/01/16 | $ | 2,605 | $ | 2,683 | ||
9.750%, 01/15/17 | 3,570 | 3,632 | ||||
United Components | ||||||
9.375%, 06/15/13 | 1,460 | 1,387 | ||||
Univision Communications | ||||||
9.750%, 03/15/15 (A) | 3,658 | 2,917 | ||||
Vail Resorts | ||||||
6.750%, 02/15/14 | 1,970 | 1,940 | ||||
Videotron | ||||||
6.875%, 01/15/14 | 2,339 | 2,281 | ||||
Wendy’s | ||||||
10.000%, 07/15/16 (A) | 1,840 | 1,987 | ||||
WMG Acquisition | ||||||
9.500%, 06/15/16 (A) | 2,355 | 2,532 | ||||
Wynn Las Vegas LLC | ||||||
7.875%, 11/01/17 (A) | 520 | �� | 517 | |||
XM Satellite Radio Holdings | ||||||
13.000%, 08/01/13 (A) | 2,860 | 2,967 | ||||
| 270,288 | ||||||
Consumer Staples — 7.6% | ||||||
Accellent | ||||||
10.500%, 12/01/13 | 915 | 881 | ||||
Alliance One International | ||||||
10.000%, 07/15/16 (A) | 220 | 231 | ||||
10.000%, 07/15/16 (A) | 1,090 | 1,145 | ||||
Apria Healthcare Group | ||||||
12.375%, 11/01/14 (A) | 5,120 | 5,594 | ||||
Avis Budget Car Rental LLC | ||||||
7.625%, 05/15/14 | 1,870 | 1,720 | ||||
Bausch & Lomb | ||||||
9.875%, 11/01/15 | 1,630 | 1,675 | ||||
Biomet | ||||||
11.625%, 10/15/17 | 3,440 | 3,741 | ||||
Catalent Pharma Solutions | ||||||
9.500%, 04/15/15 | 5,055 | 4,473 | ||||
Central Garden and Pet | ||||||
9.125%, 02/01/13 | 1,445 | 1,459 | ||||
Chiquita Brands International | ||||||
8.875%, 12/01/15 | 1,495 | 1,517 | ||||
Constellation Brands | ||||||
8.375%, 12/15/14 | 1,600 | 1,696 | ||||
7.250%, 05/15/17 | 1,250 | 1,263 | ||||
7.250%, 09/01/16 | 1,870 | 1,893 | ||||
Cott Beverages | ||||||
8.375%, 11/15/17 (A) | 2,325 | 2,325 | ||||
Del Monte | ||||||
7.500%, 10/15/19 (A) | 245 | 247 | ||||
DI Finance | ||||||
9.500%, 02/15/13 | 1,015 | 1,025 | ||||
DJO Finance LLC | ||||||
10.875%, 11/15/14 | 4,980 | 5,241 | ||||
| Description | Face Amount ($ Thousands) | Market Value ($ Thousands) | ||||
Dole Food | ||||||
13.875%, 03/15/14 (A) | $ | 1,101 | $ | 1,294 | ||
8.000%, 10/01/16 (A) | 700 | 707 | ||||
Fleming | ||||||
10.125%, 04/01/08 (B) (F) | 943 | — | ||||
HCA | ||||||
9.875%, 02/15/17 (A) | 170 | 184 | ||||
9.625%, 11/15/16 | 9,111 | 9,714 | ||||
9.250%, 11/15/16 | 1,200 | 1,272 | ||||
8.500%, 04/15/19 (A) | 2,640 | 2,785 | ||||
7.875%, 02/15/20 (A) | 2,895 | 2,967 | ||||
6.375%, 01/15/15 | 1,000 | 925 | ||||
Ingles Markets | ||||||
8.875%, 05/15/17 | 680 | 701 | ||||
JBS USA LLC | ||||||
11.625%, 05/01/14 (A) | 1,050 | 1,167 | ||||
Johnsondiversey Holdings | ||||||
10.500%, 05/15/20 (A) | 2,595 | 2,491 | ||||
Language Line | ||||||
14.125%, 06/15/13 | 500 | 540 | ||||
Laureate Education | ||||||
11.750%, 08/15/17 (A) | 400 | 403 | ||||
10.000%, 08/15/15 (A) | 525 | 526 | ||||
M-Foods Holdings | ||||||
9.750%, 10/01/13 (A) | 405 | 421 | ||||
Pantry | ||||||
7.750%, 02/15/14 | 3,785 | 3,624 | ||||
3.000%, 11/15/12 | 1,000 | 836 | ||||
Rite Aid | ||||||
10.375%, 07/15/16 | 2,130 | 2,178 | ||||
10.250%, 10/15/19 (A) | 250 | 254 | ||||
9.750%, 06/12/16 | 2,910 | 3,143 | ||||
9.500%, 06/15/17 | 2,875 | 2,365 | ||||
9.375%, 12/15/15 | 1,925 | 1,612 | ||||
8.625%, 03/01/15 | 1,645 | 1,361 | ||||
7.700%, 02/15/27 | 150 | 87 | ||||
7.500%, 03/01/17 | 685 | 620 | ||||
6.875%, 12/15/28 (A) | 350 | 199 | ||||
RSC Equipment Rental | ||||||
10.000%, 07/15/17 (A) | 2,000 | 2,155 | ||||
Seminole Indian Tribe of Florida | ||||||
6.535%, 10/01/20 (A) | 1,000 | 918 | ||||
5.798%, 10/01/13 (A) | 2,195 | 2,132 | ||||
ServiceMaster | ||||||
10.750%, 07/15/15 (A) | 4,750 | 4,798 | ||||
7.450%, 08/15/27 | 735 | 508 | ||||
7.250%, 03/01/38 | 1,145 | 756 | ||||
7.100%, 03/01/18 | 645 | 493 | ||||
Smithfield Foods | ||||||
10.000%, 07/15/14 (A) | 1,553 | 1,627 | ||||
7.750%, 05/15/13 | 1,540 | 1,428 | ||||
Southern States Cooperative | ||||||
11.000%, 11/01/11 (A) | 2,250 | 2,253 | ||||
| SEI Institutional Investments Trust / Semi-Annual Report / November 30, 2009 | 75 |
Table of Contents
SCHEDULE OF INVESTMENTS (Unaudited)
High Yield Bond Fund (Continued)
November 30, 2009
| Description | Face Amount ($ Thousands) | Market Value ($ Thousands) | ||||
Spectrum Brands | ||||||
12.000%, 08/28/19 | $ | 1,302 | $ | 1,237 | ||
SuperValu | ||||||
8.000%, 05/01/16 | 3,300 | 3,366 | ||||
Tops Markets LLC | ||||||
10.125%, 10/15/15 (A) | 1,330 | 1,363 | ||||
Trico Shipping | ||||||
11.875%, 11/01/14 (A) | 1,535 | 1,556 | ||||
United Rentals North America | ||||||
10.875%, 06/15/16 (A) | 3,000 | 3,187 | ||||
9.250%, 12/15/19 | 1,040 | 1,022 | ||||
Universal Hospital Services | ||||||
8.500%, 06/01/15 | 960 | 946 | ||||
US Oncology | ||||||
9.125%, 08/15/17 (A) | 825 | 860 | ||||
US Oncology Holdings | ||||||
6.428%, 03/15/12 (C) | 1,781 | 1,603 | ||||
| 110,710 | ||||||
Energy — 8.2% | ||||||
Allis-Chalmers Energy | ||||||
9.000%, 01/15/14 | 1,011 | 890 | ||||
8.500%, 03/01/17 | 3,905 | 2,821 | ||||
Anadarko Petroleum | ||||||
6.450%, 09/15/36 | 1,435 | 1,507 | ||||
Antero Resources Finance | ||||||
9.375%, 12/01/17 (A) | 990 | 992 | ||||
Arch Coal | ||||||
8.750%, 08/01/16 (A) | 2,665 | 2,745 | ||||
Atlas Energy Operating LLC | ||||||
12.125%, 08/01/17 | 1,870 | 2,090 | ||||
Atlas Energy Resources LLC | ||||||
10.750%, 02/01/18 (A) | 2,215 | 2,409 | ||||
Aventine Renewable Energy | ||||||
10.000%, 04/01/17 (B) | 2,600 | 1,859 | ||||
Basic Energy Services | ||||||
11.625%, 08/01/14 (A) | 1,300 | 1,378 | ||||
Bill Barrett | ||||||
9.875%, 07/15/16 | 1,000 | 1,055 | ||||
Calfrac Holdings | ||||||
7.750%, 02/15/15 (A) | 3,000 | 2,925 | ||||
Chesapeake Energy | ||||||
9.500%, 02/15/15 | 1,650 | 1,728 | ||||
7.500%, 06/15/14 | 219 | 220 | ||||
7.250%, 12/15/18 | 185 | 178 | ||||
7.000%, 08/15/14 | 255 | 254 | ||||
6.875%, 01/15/16 | 1,020 | 979 | ||||
6.500%, 08/15/17 | 1,050 | 974 | ||||
Cie Generale de Geophysique-Veritas | ||||||
9.500%, 05/15/16 (A) | 2,095 | 2,210 | ||||
Cloud Peak Energy Resources LLC | ||||||
8.500%, 12/15/19 (A) | 405 | 401 | ||||
8.250%, 12/15/17 (A) | 605 | 596 | ||||
| Description | Face Amount ($ Thousands) | Market Value ($ Thousands) | ||||
Complete Production Services | ||||||
8.000%, 12/15/16 | $ | 760 | $ | 745 | ||
Compton Petroleum Finance | ||||||
7.625%, 12/01/13 | 350 | 261 | ||||
Copano Energy LLC | ||||||
7.750%, 06/01/18 | 2,930 | 2,915 | ||||
Denbury Resources | ||||||
9.750%, 03/01/16 | 595 | 629 | ||||
7.500%, 12/15/15 | 1,175 | 1,166 | ||||
7.500%, 04/01/13 | 1,110 | 1,110 | ||||
Drummond | ||||||
9.000%, 10/15/14 (A) | 1,220 | 1,244 | ||||
Dynegy Holdings | ||||||
8.375%, 05/01/16 | 1,950 | 1,789 | ||||
7.750%, 06/01/19 | 1,995 | 1,631 | ||||
7.625%, 10/15/26 | 875 | 569 | ||||
7.500%, 06/01/15 | 2,200 | 2,024 | ||||
El Paso | ||||||
8.250%, 02/15/16 | 215 | 222 | ||||
8.050%, 10/15/30 | 150 | 141 | ||||
7.800%, 08/01/31 | 275 | 256 | ||||
7.420%, 02/15/37 | 1,300 | 1,152 | ||||
7.250%, 06/01/18 | 2,785 | 2,785 | ||||
Enterprise Products Operating LLC | ||||||
8.375%, 08/01/66 (C) | 290 | 282 | ||||
Forbes Energy Services LLC | ||||||
11.000%, 02/15/15 | 916 | 801 | ||||
Forest Oil | ||||||
8.500%, 02/15/14 (A) | 50 | 51 | ||||
8.000%, 12/15/11 | 800 | 822 | ||||
7.750%, 05/01/14 | 1,005 | 997 | ||||
7.250%, 06/15/19 | 2,760 | 2,615 | ||||
General Maritime | ||||||
12.000%, 11/15/17 (A) | 710 | 737 | ||||
Helix Energy Solutions Group | ||||||
9.500%, 01/15/16 (A) | 2,140 | 2,167 | ||||
Hercules Offshore | ||||||
10.500%, 10/15/17 (A) | 1,355 | 1,369 | ||||
Hillcorp Energy | ||||||
9.000%, 06/01/16 (A) | 255 | 256 | ||||
7.750%, 11/01/15 (A) | 3,545 | 3,412 | ||||
Holly | ||||||
9.875%, 06/15/17 (A) | 3,135 | 3,253 | ||||
International Coal Group | ||||||
10.250%, 07/15/14 | 1,360 | 1,319 | ||||
Key Energy Services | ||||||
8.375%, 12/01/14 | 1,405 | 1,372 | ||||
Linn Energy LLC | ||||||
11.750%, 05/15/17 (A) | 260 | 289 | ||||
Mariner Energy | ||||||
8.000%, 05/15/17 | 1,670 | 1,578 | ||||
MarkWest Energy Partners | ||||||
8.750%, 04/15/18 | 2,940 | 2,962 | ||||
| 76 | SEI Institutional Investments Trust / Semi-Annual Report / November 30, 2009 |
Table of Contents
| Description | Face Amount ($ Thousands) | Market Value ($ Thousands) | ||||
MarkWest Energy Partners, Ser B | ||||||
8.500%, 07/15/16 | $ | 250 | $ | 252 | ||
6.875%, 11/01/14 | 1,125 | 1,058 | ||||
McMoRan Exploration | ||||||
11.875%, 11/15/14 | 3,420 | 3,454 | ||||
Murray Energy | ||||||
10.250%, 10/15/15 (A) | 2,090 | 2,048 | ||||
Newfield Exploration | ||||||
7.125%, 05/15/18 | 525 | 526 | ||||
6.625%, 04/15/16 | 135 | 133 | ||||
OPTI Canada | ||||||
9.000%, 12/15/12 (A) | 460 | 459 | ||||
8.250%, 12/15/14 | 1,925 | 1,540 | ||||
7.875%, 12/15/14 | 1,260 | 1,002 | ||||
Parker Drilling | ||||||
9.625%, 10/01/13 | 639 | 652 | ||||
Penn Virginia | ||||||
10.375%, 06/15/16 | 400 | 431 | ||||
PetroHawk Energy | ||||||
10.500%, 08/01/14 (A) | 2,100 | 2,273 | ||||
9.125%, 07/15/13 | 1,847 | 1,916 | ||||
7.875%, 06/01/15 | 1,975 | 1,970 | ||||
Petroleum Development | ||||||
12.000%, 02/15/18 | 2,190 | 2,212 | ||||
Plains Exploration & Production | ||||||
10.000%, 03/01/16 | 650 | 697 | ||||
8.625%, 10/15/19 | 355 | 356 | ||||
7.750%, 06/15/15 | 75 | 74 | ||||
7.625%, 06/01/18 | 350 | 341 | ||||
7.000%, 03/15/17 | 600 | 570 | ||||
Pride International | ||||||
8.500%, 06/15/19 | 535 | 592 | ||||
Quicksilver Resources | ||||||
11.750%, 01/01/16 | 2,200 | 2,445 | ||||
8.250%, 08/01/15 | 770 | 766 | ||||
7.125%, 04/01/16 | 2,185 | 1,972 | ||||
Range Resources | ||||||
7.500%, 05/15/16 | 350 | 352 | ||||
Regency Energy Partners | ||||||
8.375%, 12/15/13 | 530 | 545 | ||||
Sabine Pass LNG LP | ||||||
7.500%, 11/30/16 (A) | 620 | 515 | ||||
7.500%, 11/30/16 | 595 | 494 | ||||
SandRidge Energy | ||||||
9.875%, 05/15/16 (A) | 1,185 | 1,215 | ||||
8.625%, 04/01/15 | 750 | 719 | ||||
Southwestern Energy | ||||||
7.500%, 02/01/18 (A) | 1,125 | 1,162 | ||||
Stone Energy | ||||||
8.250%, 12/15/11 | 2,600 | 2,574 | ||||
Swift Energy | ||||||
7.125%, 06/01/17 | 700 | 642 | ||||
Targa Resources Partners | ||||||
11.250%, 07/15/17 (A) | 4,435 | 4,745 | ||||
| Description | Face Amount ($ Thousands) | Market Value ($ Thousands) | ||||
Tesoro | ||||||
9.750%, 06/01/19 | $ | 2,800 | $ | 2,842 | ||
6.625%, 11/01/15 | 970 | 890 | ||||
Valero Energy | ||||||
10.500%, 03/15/39 | 960 | 1,264 | ||||
Venoco | ||||||
8.750%, 12/15/11 | 565 | 579 | ||||
Williams | ||||||
8.750%, 01/15/20 | 150 | 175 | ||||
8.125%, 03/15/12 | 150 | 165 | ||||
7.875%, 09/01/21 | 275 | 307 | ||||
7.750%, 06/15/31 | 350 | 379 | ||||
| 118,435 | ||||||
Financials — 11.8% | ||||||
ACE Cash Express | ||||||
10.250%, 10/01/14 (A) | 675 | 510 | ||||
Algoma Acquisition | ||||||
9.875%, 06/15/15 (A) | 1,095 | 931 | ||||
ALH Finance LLC | ||||||
8.500%, 01/15/13 | 2,445 | 2,396 | ||||
Alliant Holdings | ||||||
11.000%, 05/01/15 (A) | 2,500 | 2,463 | ||||
Allied Capital | ||||||
6.625%, 07/15/11 | 3,525 | 3,251 | ||||
6.000%, 04/01/12 | 1,300 | 1,103 | ||||
American General Finance MTN | ||||||
5.375%, 10/01/12 | 260 | 214 | ||||
4.875%, 07/15/12 | 1,430 | 1,192 | ||||
0.088%, 12/15/11 (C) | 2,130 | 1,707 | ||||
BAC Capital Trust XIV | ||||||
5.630%, 03/15/12 (C) | 2,135 | 1,409 | ||||
Bank of America | ||||||
8.125%, 05/15/18 (C) | 155 | 135 | ||||
8.000%, 12/29/49 (C) | 1,260 | 1,097 | ||||
C5 Capital SPV | ||||||
6.196%, 12/31/11 (A) (C) | 535 | 372 | ||||
Capital One Capital V | ||||||
10.250%, 08/15/39 | 1,265 | 1,391 | ||||
Cardtronics | ||||||
9.250%, 08/15/13 | 1,100 | 1,119 | ||||
9.250%, 08/15/13 | 2,040 | 2,076 | ||||
CEVA Group | ||||||
11.625%, 10/01/16 (A) | 2,305 | 2,354 | ||||
Chukchansi Economic Development Authority | ||||||
4.024%, 11/15/12 (A) (C) | 1,985 | 1,332 | ||||
CIT Group | ||||||
5.800%, 07/28/11 (B) | 1,295 | 907 | ||||
5.650%, 02/13/17 (B) | 3,295 | 2,316 | ||||
5.600%, 04/27/11 (B) | 1,235 | 865 | ||||
5.000%, 02/13/14 (B) | 2,400 | 1,680 | ||||
0.781%, 07/28/11 (B) (C) | 1,250 | 876 | ||||
| SEI Institutional Investments Trust / Semi-Annual Report / November 30, 2009 | 77 |
Table of Contents
SCHEDULE OF INVESTMENTS (Unaudited)
High Yield Bond Fund (Continued)
November 30, 2009
| Description | Face Amount ($ Thousands) | Market Value ($ Thousands) | ||||
CIT Group Funding of Canada | ||||||
4.650%, 07/01/10 (B) | $ | 135 | $ | 133 | ||
Citigroup Capital XXI | ||||||
8.300%, 12/21/57 (C) | 620 | 552 | ||||
City National Bank | ||||||
9.000%, 08/12/19 | 4,062 | 4,062 | ||||
Comerica Bank | ||||||
5.200%, 08/22/17 | 1,000 | 918 | ||||
Corporate Office Properties | ||||||
3.500%, 09/15/26‡ (A) | 260 | 245 | ||||
Developers Diversified Realty | ||||||
9.625%, 03/15/16‡ | 360 | 375 | ||||
E*Trade Financial PIK | ||||||
12.500%, 11/30/17 | 1,169 | 1,315 | ||||
Felcor Lodging | ||||||
10.000%, 10/01/14‡ (A) | 1,320 | 1,287 | ||||
FireKeepers Development Authority | ||||||
13.875%, 05/01/15 (A) | 2,050 | 2,296 | ||||
Ford Motor Credit LLC | ||||||
12.000%, 05/15/15 | 1,670 | 1,925 | ||||
9.875%, 08/10/11 | 1,115 | 1,157 | ||||
8.700%, 10/01/14 | 410 | 421 | ||||
8.000%, 06/01/14 | 3,000 | 3,018 | ||||
8.000%, 12/15/16 | 2,100 | 2,091 | ||||
7.800%, 06/01/12 | 4,130 | 4,127 | ||||
7.500%, 08/01/12 | 1,185 | 1,174 | ||||
7.250%, 10/25/11 | 90 | 90 | ||||
7.000%, 10/01/13 | 4,332 | 4,229 | ||||
5.549%, 06/15/11 (C) | 1,000 | 980 | ||||
Fresenius US Finance II | ||||||
9.000%, 07/15/15 (A) | 800 | 876 | ||||
Genworth Financial | ||||||
6.150%, 11/15/66 (C) | 2,765 | 1,770 | ||||
Genworth Global Funding Trusts | ||||||
0.459%, 12/15/10 (C) | 970 | 952 | ||||
0.412%, 05/15/12 (C) | 1,380 | 1,288 | ||||
GMAC LLC | ||||||
8.000%, 11/01/31 (A) | 3,883 | 3,330 | ||||
6.875%, 09/15/11 (A) | 2,622 | 2,524 | ||||
6.875%, 08/28/12 (A) | 5,327 | 5,047 | ||||
6.750%, 12/01/14 | 2,506 | 2,243 | ||||
6.625%, 05/15/12 (A) | 1,291 | 1,222 | ||||
6.000%, 12/15/11 (A) | 810 | 762 | ||||
HBOS MTN | ||||||
5.375%, 11/29/49 (A) (C) | 1,005 | 814 | ||||
HBOS Capital Funding | ||||||
6.071%, 06/30/49 (A) (C) | 1,890 | 1,191 | ||||
Hellas II | ||||||
6.881%, 01/15/15 (A) (B) (C) | 2,100 | 21 | ||||
Host Hotels & Resorts L.P. | ||||||
6.875%, 11/01/14‡ | 545 | 526 | ||||
Host Marriott L.P., Ser O | ||||||
6.375%, 03/15/15‡ | 385 | 363 | ||||
| Description | Face Amount ($ Thousands) | Market Value ($ Thousands) | ||||
Host Marriott LP, Ser Q | ||||||
6.750%, 06/01/16‡ | $ | 2,300 | $ | 2,179 | ||
HUB International Holdings | ||||||
10.250%, 06/15/15 (A) | 410 | 373 | ||||
9.000%, 12/15/14 (A) | 3,270 | 3,147 | ||||
Icahn Enterprises | ||||||
7.125%, 02/15/13 | 4,725 | 4,630 | ||||
ING Capital Funding Trust III | ||||||
8.439%, 12/29/49 (C) | 2,130 | 1,805 | ||||
International Lease Finance MTN | ||||||
6.625%, 11/15/13 | 630 | 509 | ||||
6.375%, 03/25/13 | 335 | 270 | ||||
5.625%, 09/20/13 | 1,055 | 830 | ||||
5.550%, 09/05/12 | 430 | 346 | ||||
5.350%, 03/01/12 | 125 | 107 | ||||
5.250%, 01/10/13 | 815 | 657 | ||||
Jefferies Group | ||||||
8.500%, 07/15/19 | 2,150 | 2,365 | ||||
JPMorgan Chase Capital XXV | ||||||
6.800%, 10/01/37 | 90 | 89 | ||||
LaBranche | ||||||
11.000%, 05/15/12 | 1,665 | 1,598 | ||||
Lehman Brothers Holdings MTN | ||||||
6.875%, 05/02/18 (B) | 3,500 | 744 | ||||
5.625%, 01/24/13 (B) | 1,000 | 215 | ||||
Lincoln National | ||||||
7.000%, 05/17/66 (C) | 595 | 458 | ||||
6.050%, 04/20/67 (C) | 390 | 279 | ||||
Lloyds Banking Group | ||||||
5.920%, 09/29/49 (A) (C) | 435 | 231 | ||||
Marlin Water Trust II | ||||||
6.310%, 07/15/03 (A) (B) | 4,000 | 2 | ||||
MetLife | ||||||
10.750%, 08/01/39 | 1,845 | 2,214 | ||||
MetLife Capital Trust X | ||||||
9.250%, 04/08/38 (A) (C) | 2,550 | 2,652 | ||||
National Life Insurance | ||||||
10.500%, 09/15/39 (A) | 1,100 | 1,115 | ||||
Nuveen Investments | ||||||
10.500%, 11/15/15 (A) | 8,125 | 7,150 | ||||
5.500%, 09/15/15 | 765 | 524 | ||||
Ohio Casualty | ||||||
7.300%, 06/15/14 | 1,050 | 1,066 | ||||
Omnicare | ||||||
3.250%, 12/15/35 | 920 | 738 | ||||
PHH | ||||||
7.125%, 03/01/13 | 1,385 | 1,292 | ||||
Pinnacle Foods Finance LLC | ||||||
10.625%, 04/01/17 | 1,675 | 1,750 | ||||
9.250%, 04/01/15 | 500 | 516 | ||||
PNC Preferred Funding Trust II | ||||||
6.113%, 03/29/49 (A) (C) | 1,040 | 683 | ||||
Popular North America Capital Trust I | ||||||
6.564%, 09/15/34 | 615 | 451 | ||||
| 78 | SEI Institutional Investments Trust / Semi-Annual Report / November 30, 2009 |
Table of Contents
| Description | Face Amount ($ Thousands) | Market Value ($ Thousands) | ||||
Protective Life | ||||||
8.450%, 10/15/39 | $ | 3,140 | $ | 3,080 | ||
Rabobank Nederland | ||||||
11.000%, 12/31/49 (A) (C) | 1,235 | 1,527 | ||||
Radian Group | ||||||
7.750%, 06/01/11 | 1,705 | 1,449 | ||||
Realogy | ||||||
12.375%, 04/15/15 | 905 | 570 | ||||
11.000%, 04/15/14 | 627 | 476 | ||||
10.500%, 04/15/14 | 2,175 | 1,751 | ||||
Reynolds Group DL Escrow | ||||||
7.750%, 10/15/16 (A) | 7,310 | 7,383 | ||||
Royal Bank of Scotland Group | ||||||
7.640%, 09/29/17 (C) | 1,720 | 804 | ||||
Senior Housing Properties Trust | ||||||
7.875%, 04/15/15‡ | 645 | 619 | ||||
Smurfit Kappa Funding | ||||||
7.750%, 04/01/15 | 2,140 | 2,044 | ||||
Snoqualmie Entertainment Authority | ||||||
9.125%, 02/01/15 (A) | 1,275 | 663 | ||||
4.680%, 02/01/14 (A) (C) | 275 | 140 | ||||
Susser Holdings LLC | ||||||
10.625%, 12/15/13 | 225 | 234 | ||||
Torchmark | ||||||
9.250%, 06/15/19 | 2,625 | 3,030 | ||||
UCI Holdco | ||||||
9.250%, 12/15/13 (C) | 1,199 | 816 | ||||
Unitrin | ||||||
6.000%, 05/15/17 | 1,140 | 950 | ||||
Universal City Development Partners | ||||||
8.875%, 11/15/15 (A) | 1,435 | 1,396 | ||||
USB Capital IX | ||||||
6.189%, 04/15/49 (C) | 1,015 | 792 | ||||
USI Holdings | ||||||
9.750%, 05/15/15 (A) | 2,637 | 2,347 | ||||
Ventas Realty L.P. | ||||||
7.125%, 06/01/15‡ | 1,026 | 1,011 | ||||
6.750%, 04/01/17‡ | 775 | 736 | ||||
VWR Funding | ||||||
10.250%, 07/15/15 | 5,748 | 5,590 | ||||
Yankee Acquisition, Ser B | ||||||
9.750%, 02/15/17 | 2,665 | 2,545 | ||||
8.500%, 02/15/15 | 2,705 | 2,637 | ||||
Zions Bancorporation | ||||||
7.750%, 09/23/14 | 620 | 552 | ||||
6.000%, 09/15/15 | 1,305 | 908 | ||||
5.650%, 05/15/14 | 160 | 122 | ||||
5.500%, 11/16/15 | 500 | 347 | ||||
| 170,524 | ||||||
Health Care — 3.1% | ||||||
Biomet | ||||||
10.375%, 10/15/17 | 8,040 | 8,623 | ||||
10.000%, 10/15/17 | 2,660 | 2,813 | ||||
| Description | Face Amount ($ Thousands) | Market Value ($ Thousands) | ||||
Bio-Rad Laboratories | ||||||
8.000%, 09/15/16 (A) | $ | 870 | $ | 907 | ||
Community Health Systems | ||||||
8.875%, 07/15/15 | 1,885 | 1,923 | ||||
Cooper | ||||||
7.125%, 02/15/15 | 1,590 | 1,552 | ||||
Health Management Associates | ||||||
6.125%, 04/15/16 | 2,120 | 1,945 | ||||
Inverness Medical Innovations | ||||||
9.000%, 05/15/16 | 6,320 | 6,415 | ||||
Psychiatric Solutions | ||||||
7.750%, 07/15/15 (A) | 315 | 296 | ||||
7.750%, 07/15/15 | 3,300 | 3,185 | ||||
ReAble Therapeutics Finance LLC | ||||||
11.750%, 11/15/14 | 1,882 | 1,900 | ||||
Select Medical | ||||||
7.625%, 02/01/15 | 2,505 | 2,398 | ||||
Spheris | ||||||
11.000%, 12/15/12 | 750 | 405 | ||||
Surgical Care Affiliates | ||||||
8.875%, 07/15/15 (A) | 1,656 | 1,441 | ||||
Talecris Biotherapeutics Holdings | ||||||
7.750%, 11/15/16 (A) | 1,990 | 2,000 | ||||
Tenet Healthcare | ||||||
10.000%, 05/01/18 (A) | 45 | 50 | ||||
9.250%, 02/01/15 | 2,820 | 2,961 | ||||
8.875%, 07/01/19 (A) | 495 | 530 | ||||
7.375%, 02/01/13 | 650 | 640 | ||||
United Surgical Partners International | ||||||
8.875%, 05/01/17 | 355 | 362 | ||||
United Surgical Partners International PIK | ||||||
9.250%, 05/01/17 | 4,190 | 4,232 | ||||
Vanguard Health Holding I | ||||||
11.250%, 10/01/15 (D) | 600 | 630 | ||||
Vanguard Health Holding II | ||||||
9.000%, 10/01/14 | 325 | 335 | ||||
| 45,543 | ||||||
Industrials — 7.2% | ||||||
ACCO Brands | ||||||
10.625%, 03/15/15 (A) | 3,605 | 3,889 | ||||
7.625%, 08/15/15 | 1,435 | 1,302 | ||||
Actuant | ||||||
6.875%, 06/15/17 | 2,575 | 2,462 | ||||
Aleris International | ||||||
10.000%, 12/15/16 (B) | 1,675 | 6 | ||||
Aleris International PIK | ||||||
9.000%, 12/15/14 (B) | 950 | 4 | ||||
Alliant Techsystems | ||||||
6.750%, 04/01/16 | 195 | 193 | ||||
Allison Transmission | ||||||
11.000%, 11/01/15 (A) | 1,795 | 1,858 | ||||
| SEI Institutional Investments Trust / Semi-Annual Report / November 30, 2009 | 79 |
Table of Contents
SCHEDULE OF INVESTMENTS (Unaudited)
High Yield Bond Fund (Continued)
November 30, 2009
| Description | Face Amount ($ Thousands) | Market Value ($ Thousands) | ||||
America West Airlines, Ser 99-1 | ||||||
7.930%, 01/02/19 | $ | 167 | $ | 151 | ||
Ames True Temper | ||||||
10.000%, 07/15/12 (E) | 650 | 559 | ||||
4.284%, 01/15/12 (C) | 1,480 | 1,306 | ||||
Anixter | ||||||
10.000%, 03/15/14 | 1,310 | 1,431 | ||||
Associated Materials | ||||||
11.250%, 03/01/14 (D) | 535 | 502 | ||||
Associated Materials LLC | ||||||
9.875%, 11/15/16 (A) | 630 | 658 | ||||
Atrium | ||||||
15.000%, 12/15/12 (A) (E) | 1,482 | 22 | ||||
Baker & Taylor | ||||||
11.500%, 07/01/13 (A) | 925 | 472 | ||||
Baldor Electric | ||||||
8.625%, 02/15/17 | 1,215 | 1,239 | ||||
BE Aerospace | ||||||
8.500%, 07/01/18 | 650 | 673 | ||||
Belden | ||||||
9.250%, 06/15/19 (A) | 305 | 325 | ||||
Bombardier | ||||||
8.000%, 11/15/14 (A) | 610 | 619 | ||||
Buffalo Thunder Development Authority | ||||||
9.375%, 12/15/14 (A) (B) | 2,050 | 379 | ||||
Building Materials Corp of America | ||||||
7.750%, 08/01/14 | 820 | 812 | ||||
BWAY | ||||||
10.000%, 04/15/14 (A) | 4,585 | 4,803 | ||||
C8 Capital SPV | ||||||
6.640%, 12/31/14 (A) (C) | 1,295 | 913 | ||||
Case New Holland | ||||||
7.750%, 09/01/13 (A) | 1,090 | 1,087 | ||||
Casella Waste Systems | ||||||
11.000%, 07/15/14 (A) | 30 | 32 | ||||
9.750%, 02/01/13 | 1,335 | 1,302 | ||||
Chart Industries | ||||||
9.125%, 10/15/15 | 2,000 | 1,980 | ||||
Clean Harbors | ||||||
7.625%, 08/15/16 (A) | 2,375 | 2,390 | ||||
Coleman Cable | ||||||
9.875%, 10/01/12 | 2,785 | 2,774 | ||||
Continental Airlines | ||||||
9.000%, 07/08/16 | 910 | 965 | ||||
7.339%, 04/19/14 | 1,490 | 1,334 | ||||
7.250%, 11/10/19 | 1,525 | 1,544 | ||||
Cornell | ||||||
10.750%, 07/01/12 | 370 | 377 | ||||
Corrections Corp of America | ||||||
7.750%, 06/01/17 | 520 | 541 | ||||
CPM Holdings | ||||||
10.625%, 09/01/14 (A) | 995 | 1,040 | ||||
Crown Americas LLC | ||||||
7.625%, 05/15/17 (A) | 590 | 602 | ||||
| Description | Face Amount ($ Thousands) | Market Value ($ Thousands) | ||||
Delta Air Lines | ||||||
12.250%, 03/15/15 (A) | $ | 3,035 | $ | 2,807 | ||
9.500%, 09/15/14 (A) | 620 | 629 | ||||
Delta Air Lines, Ser 2002-1, Cl C | ||||||
7.779%, 01/02/12 | 427 | 414 | ||||
DigitalGlobe | ||||||
10.500%, 05/01/14 (A) | 545 | 583 | ||||
Douglas Dynamics LLC | ||||||
7.750%, 01/15/12 (A) | 2,475 | 2,252 | ||||
Dycom Investments | ||||||
8.125%, 10/15/15 | 2,035 | 1,872 | ||||
ESCO | ||||||
4.174%, 12/15/13 (A) (C) | 280 | 256 | ||||
ESCO | ||||||
8.625%, 12/15/13 (A) | 105 | 104 | ||||
General Cable | ||||||
7.125%, 04/01/17 | 1,120 | 1,084 | ||||
Geo Group | ||||||
7.750%, 10/15/17 (A) | 60 | 61 | ||||
GeoEye | ||||||
9.625%, 10/01/15 (A) | 2,775 | 2,879 | ||||
Global Aviation Holdings | ||||||
14.000%, 08/15/13 (A) | 1,850 | 1,832 | ||||
Graphic Packaging International | ||||||
9.500%, 06/15/17 (A) | 2,420 | 2,553 | ||||
Harland Clarke Holdings | ||||||
9.500%, 05/15/15 | 1,000 | 939 | ||||
6.000%, 05/15/15 (C) | 370 | 304 | ||||
Interface | ||||||
11.375%, 11/01/13 (A) | 475 | 520 | ||||
9.500%, 02/01/14 | 180 | 178 | ||||
Interline Brands | ||||||
8.125%, 06/15/14 | 810 | 800 | ||||
Iron Mountain | ||||||
8.750%, 07/15/18 | 1,265 | 1,311 | ||||
8.375%, 08/15/21 | 715 | 731 | ||||
Kansas City Southern de Mexico | ||||||
12.500%, 04/01/16 (A) | 345 | 393 | ||||
9.375%, 05/01/12 | 940 | 961 | ||||
Koppers | ||||||
7.875%, 12/01/19 (A) | 1,445 | 1,445 | ||||
L-3 Communications, Ser B | ||||||
6.375%, 10/15/15 | 1,360 | 1,338 | ||||
Language Line | ||||||
11.125%, 06/15/12 | 3,300 | 3,392 | ||||
Mobile Mini | ||||||
6.875%, 05/01/15 | 1,340 | 1,253 | ||||
Mobile Services Group | ||||||
9.750%, 08/01/14 | 260 | 269 | ||||
Navistar International | ||||||
8.250%, 11/01/21 | 3,390 | 3,331 | ||||
NXP BV | ||||||
10.000%, 07/15/13 (A) | 598 | 605 | ||||
| 80 | SEI Institutional Investments Trust / Semi-Annual Report / November 30, 2009 |
Table of Contents
| Description | Face Amount ($ Thousands) | Market Value ($ Thousands) | ||||
Plastipak Holdings | ||||||
10.625%, 08/15/19 (A) | $ | 665 | $ | 732 | ||
8.500%, 12/15/15 (A) | 660 | 659 | ||||
Pregis | ||||||
12.375%, 10/15/13 | 1,898 | 1,803 | ||||
Quality Distribution LLC | ||||||
11.750%, 11/01/13 (A) | 800 | 760 | ||||
Quebecore | ||||||
0.000%, 11/15/13 (B) (F) | 1,800 | — | ||||
0.000%, 03/15/16 (I) | 2,175 | — | ||||
RailAmerica | ||||||
9.250%, 07/01/17 (A) | 1,138 | 1,189 | ||||
RBS Global | ||||||
9.500%, 08/01/14 (A) | 2,627 | 2,614 | ||||
RBS Global & Rexnord | ||||||
11.750%, 08/01/16 | 1,395 | 1,367 | ||||
9.500%, 08/01/14 | 40 | 40 | ||||
Sequa | ||||||
11.750%, 12/01/15 (A) | 1,050 | 935 | ||||
Solo Cup | ||||||
10.500%, 11/01/13 (A) | 990 | 1,042 | ||||
Spirit Aerosystems | ||||||
7.500%, 10/01/17 (A) | 295 | 289 | ||||
SPX | ||||||
7.625%, 12/15/14 | 1,330 | 1,357 | ||||
Terex | ||||||
10.875%, 06/01/16 | 1,000 | 1,062 | ||||
8.000%, 11/15/17 | 8,715 | 7,974 | ||||
Thermadyne Holdings | ||||||
10.500%, 02/01/14 | 1,040 | 905 | ||||
Titan International | ||||||
8.000%, 01/15/12 | 1,995 | 1,950 | ||||
Triumph Group | ||||||
8.000%, 11/15/17 (A) | 135 | 135 | ||||
United Air Lines | ||||||
9.125%, 01/15/12 (B) (F) | 625 | — | ||||
United Air Lines, Ser A | ||||||
10.670%, 05/01/04 (B) (F) | 325 | — | ||||
USG | ||||||
9.750%, 08/01/14 (A) | 1,955 | 2,048 | ||||
6.300%, 11/15/16 | 1,315 | 1,141 | ||||
Vought Aircraft Industries | ||||||
8.000%, 07/15/11 | 500 | 494 | ||||
| 104,138 | ||||||
Information Technology — 4.1% | ||||||
Activant Solutions | ||||||
9.500%, 05/01/16 | 1,900 | 1,753 | ||||
Advanced Micro Devices | ||||||
8.125%, 12/15/17 (A) | 260 | 245 | ||||
Amkor Technology | ||||||
9.250%, 06/01/16 | 2,840 | 2,925 | ||||
7.750%, 05/15/13 | 1,335 | 1,328 | ||||
| Description | Face Amount ($ Thousands) | Market Value ($ Thousands) | ||||
Avago Technologies Finance | ||||||
10.125%, 12/01/13 | $ | 670 | $ | 704 | ||
Compagnie Generale de Geophysique | ||||||
7.750%, 05/15/17 | 300 | 297 | ||||
7.500%, 05/15/15 | 850 | 841 | ||||
Compucom Systems | ||||||
12.500%, 10/01/15 (A) | 2,145 | 2,177 | ||||
First Data | ||||||
9.875%, 09/24/15 | 8,978 | 7,991 | ||||
Flextronics International | ||||||
6.250%, 11/15/14 | 1,780 | 1,727 | ||||
Freescale Semiconductor | ||||||
10.125%, 12/15/16 | 1,475 | 1,036 | ||||
8.875%, 12/15/14 | 1,605 | 1,364 | ||||
Freescale Semiconductor PIK | ||||||
9.125%, 12/15/14 | 2,230 | 1,806 | ||||
NXP Funding LLC | ||||||
7.875%, 10/15/14 | 3,620 | 3,077 | ||||
Open Solutions | ||||||
9.750%, 02/01/15 (A) | 2,000 | 1,480 | ||||
Sanmina-SCI | ||||||
8.125%, 03/01/16 | 1,475 | 1,434 | ||||
3.049%, 06/15/14 (A) (C) | 1,250 | 1,119 | ||||
Sensata Technologies | ||||||
8.000%, 05/01/14 | 790 | 766 | ||||
Smart Modular | ||||||
5.790%, 04/01/12 (C) | 760 | 714 | ||||
Spansion | ||||||
3.792%, 06/01/13 (A) (B) (C) | 585 | 609 | ||||
Stream Global Services | ||||||
11.250%, 10/01/14 (A) | 3,156 | 3,132 | ||||
Sungard Data Systems | ||||||
10.625%, 05/15/15 | 2,170 | 2,300 | ||||
10.250%, 08/15/15 | 6,015 | 6,166 | ||||
9.125%, 08/15/13 | 1,665 | 1,690 | ||||
Terremark Worldwide | ||||||
12.000%, 06/15/17 (A) | 2,605 | 2,843 | ||||
Unisys | ||||||
14.250%, 09/15/15 (A) | 1,580 | 1,778 | ||||
12.750%, 10/15/14 (A) | 6,485 | 7,231 | ||||
Viasat | ||||||
8.875%, 09/15/16 (A) | 665 | 671 | ||||
| 59,204 | ||||||
Materials — 8.1% | ||||||
AK Steel | ||||||
7.750%, 06/15/12 | 2,400 | 2,412 | ||||
Arch Western Finance LLC | ||||||
6.750%, 07/01/13 | 3,305 | 3,288 | ||||
Ashland | ||||||
9.125%, 06/01/17 (A) | 2,920 | 3,139 | ||||
Boise Paper Holdings LLC | ||||||
9.000%, 11/01/17 (A) | 3,115 | 3,177 | ||||
| SEI Institutional Investments Trust / Semi-Annual Report / November 30, 2009 | 81 |
Table of Contents
SCHEDULE OF INVESTMENTS (Unaudited)
High Yield Bond Fund (Continued)
November 30, 2009
| Description | Face Amount ($ Thousands) | Market Value ($ Thousands) | ||||
California Steel Industries | ||||||
6.125%, 03/15/14 | $ | 275 | $ | 256 | ||
Catalyst Paper | ||||||
7.375%, 03/01/14 | 338 | 203 | ||||
Catalyst Paper, Ser D | ||||||
8.625%, 06/15/11 | 1,055 | 783 | ||||
Century Aluminum | ||||||
7.500%, 08/15/14 | 1,060 | 975 | ||||
Clearwater Paper | ||||||
10.625%, 06/15/16 (A) | 820 | 902 | ||||
Cognis GmbH | ||||||
2.299%, 09/15/13 (A) (C) | 620 | 567 | ||||
Crown Americas | ||||||
7.750%, 11/15/15 | 400 | 408 | ||||
Domtar | �� | |||||
10.750%, 06/01/17 | 3,500 | 4,060 | ||||
9.500%, 08/01/16 | 250 | 265 | ||||
Dow Chemical | ||||||
8.550%, 05/15/19 | 2,405 | 2,842 | ||||
Evraz Group | ||||||
9.500%, 04/24/18 (A) | 700 | 702 | ||||
8.875%, 04/24/13 (A) | 525 | 525 | ||||
FMG Finance | ||||||
10.625%, 09/01/16 (A) | 2,830 | 3,085 | ||||
Freeport-McMoRan Copper & Gold | ||||||
8.375%, 04/01/17 | 4,475 | 4,827 | ||||
8.250%, 04/01/15 | 230 | 247 | ||||
Georgia-Pacific | ||||||
7.125%, 01/15/17 (A) | 5,480 | 5,549 | ||||
7.000%, 01/15/15 (A) | 2,060 | 2,086 | ||||
Georgia-Pacific LLC | ||||||
8.250%, 05/01/16 (A) | 2,750 | 2,915 | ||||
Graham Packaging | ||||||
9.875%, 10/15/14 | 4,295 | 4,359 | ||||
Greif | ||||||
7.750%, 08/01/19 (A) | 190 | 192 | ||||
Headwaters | ||||||
11.375%, 11/01/14 (A) | 2,565 | 2,623 | ||||
Hexion US Fin/Nova Scotia | ||||||
9.750%, 11/15/14 | 5,119 | 4,914 | ||||
4.773%, 11/15/14 (C) | 750 | 593 | ||||
Huntsman International LLC | ||||||
7.875%, 11/15/14 | 2,140 | 2,028 | ||||
7.375%, 01/01/15 | 505 | 470 | ||||
5.500%, 06/30/16 (A) | 385 | 334 | ||||
INEOS Group Holdings PLC | ||||||
8.500%, 02/15/16 (A) | 135 | 89 | ||||
Innophos Holdings | ||||||
9.500%, 04/15/12 (A) | 700 | 700 | ||||
International Paper | ||||||
7.950%, 06/15/18 | 2,138 | 2,475 | ||||
Intertape Polymer | ||||||
8.500%, 08/01/14 | 835 | 651 | ||||
| Description | Face Amount ($ Thousands) | Market Value ($ Thousands) | ||||
Johnsondiversey | ||||||
8.250%, 11/15/19 (A) | $ | 770 | $ | 769 | ||
MacDermid | ||||||
9.500%, 04/15/17 (A) | 1,765 | 1,747 | ||||
Millennium America | ||||||
7.625%, 11/15/26 (B) | 200 | 42 | ||||
Momentive Performance Materials | ||||||
12.500%, 06/15/14 (A) | 310 | 339 | ||||
Nalco | ||||||
8.250%, 05/15/17 (A) | 1,040 | 1,084 | ||||
Neenah | ||||||
9.500%, 01/01/17 | 500 | 255 | ||||
NewPage | ||||||
11.375%, 12/31/14 (A) | 3,830 | 3,773 | ||||
10.000%, 05/01/12 | 1,500 | 968 | ||||
Noranda Aluminium Acquisition | ||||||
5.274%, 05/15/15 (C) | 2,899 | 2,102 | ||||
Novelis | ||||||
11.500%, 02/15/15 (A) | 675 | 702 | ||||
7.250%, 02/15/15 (A) | 1,745 | 1,575 | ||||
P.H. Glatfelter | ||||||
7.125%, 05/01/16 | 1,155 | 1,145 | ||||
Packaging Dynamics Finance | ||||||
10.000%, 05/01/16 (A) | 1,165 | 862 | ||||
PE Paper Escrow GmbH | ||||||
12.000%, 08/01/14 (A) | 200 | 220 | ||||
PolyOne | ||||||
8.875%, 05/01/12 | 2,900 | 2,973 | ||||
Reichhold Industries | ||||||
9.000%, 08/15/14 (A) | 2,716 | 2,200 | ||||
Rio Tinto Finance USA | ||||||
9.000%, 05/01/19 | 400 | 510 | ||||
8.950%, 05/01/14 | 800 | 962 | ||||
Ryerson | ||||||
12.000%, 11/01/15 | 1,250 | 1,278 | ||||
Sappi Papier Holding | ||||||
6.750%, 06/15/12 (A) | 910 | 846 | ||||
Sealed Air | ||||||
7.875%, 06/15/17 (A) | 1,320 | 1,407 | ||||
Solo Cup | ||||||
8.500%, 02/15/14 | 1,320 | 1,271 | ||||
Solutia | ||||||
8.750%, 11/01/17 | 2,095 | 2,184 | ||||
0.000%, 12/31/99 (B) | 455 | 1 | ||||
Steel Capital for OAO Severstal | ||||||
9.750%, 07/29/13 (A) | 380 | 382 | ||||
Steel Dynamics | ||||||
8.250%, 04/15/16 (A) | 2,460 | 2,485 | ||||
7.375%, 11/01/12 | 1,375 | 1,371 | ||||
6.750%, 04/01/15 | 250 | 242 | ||||
Stone Container | ||||||
8.375%, 07/01/12 (B) | 1,770 | 1,394 | ||||
Teck Resources | ||||||
10.750%, 05/15/19 | 2,540 | 2,965 | ||||
| 82 | SEI Institutional Investments Trust / Semi-Annual Report / November 30, 2009 |
Table of Contents
| Description | Face Amount ($ Thousands) | Market Value ($ Thousands) | ||||
10.250%, 05/15/16 | $ | 2,715 | $ | 3,068 | ||
Terra Capital | ||||||
7.750%, 11/01/19 (A) | 3,015 | 3,196 | ||||
U.S. Steel | ||||||
6.650%, 06/01/37 | 970 | 777 | ||||
6.050%, 06/01/17 | 1,040 | 969 | ||||
Vedanta Resources | ||||||
9.500%, 07/18/18 (A) | 2,835 | 2,814 | ||||
Verso Paper Holdings LLC | ||||||
11.500%, 07/01/14 (A) | 1,460 | 1,591 | ||||
9.125%, 08/01/14 | 3,520 | 3,238 | ||||
Verso Paper Holdings LLC, Ser B | ||||||
11.375%, 08/01/16 | 190 | 144 | ||||
Vitro | ||||||
9.125%, 02/01/17 (B) | 2,735 | 1,176 | ||||
| 117,668 | ||||||
Telecommunication Services — 11.8% | ||||||
Aeroflex | ||||||
11.750%, 02/15/15 | 1,115 | 1,090 | ||||
Affinion Group | ||||||
11.500%, 10/15/15 | 640 | 666 | ||||
10.125%, 10/15/13 | 1,500 | 1,530 | ||||
10.125%, 10/15/13 (A) | 2,525 | 2,575 | ||||
Avaya | ||||||
10.125%, 11/01/15 (A) | 615 | 560 | ||||
9.750%, 11/01/15 (A) | 470 | 455 | ||||
CC Holdings GS V LLC | ||||||
7.750%, 05/01/17 (A) | 1,250 | 1,322 | ||||
CCH II LLC | ||||||
10.250%, 10/01/13 (A) (B) | 2,811 | 3,261 | ||||
Cengage Learning Acquisitions | ||||||
10.500%, 01/15/15 (A) | 1,570 | 1,456 | ||||
Cequel Communications | ||||||
8.625%, 11/15/17 (A) | 1,070 | 1,054 | ||||
Charter Communications Operating LLC | ||||||
8.375%, 04/30/14 (A) (B) | 845 | 860 | ||||
Cincinnati Bell | ||||||
8.250%, 10/15/17 | 445 | 442 | ||||
Clearwire Communications LLC | ||||||
12.000%, 12/01/15 (A) | 4,260 | 4,201 | ||||
12.000%, 12/01/15 (A) | 2,470 | 2,421 | ||||
Cleveland Unlimited | ||||||
12.000%, 12/15/10 (A) (C) | 4,260 | 4,217 | ||||
Columbus International | ||||||
11.500%, 11/20/14 (A) | 1,155 | 1,182 | ||||
Cricket Communications | ||||||
10.000%, 07/15/15 | 825 | 800 | ||||
Cricket Communications I | ||||||
9.375%, 11/01/14 | 5,777 | 5,560 | ||||
Crown Castle International | ||||||
9.000%, 01/15/15 | 3,075 | 3,252 | ||||
CSC Holdings | ||||||
8.625%, 02/15/19 (A) | 2,650 | 2,809 | ||||
| Description | Face Amount ($ Thousands) | Market Value ($ Thousands) | ||||
Digicel Group | ||||||
12.000%, 04/01/14 (A) | $ | 1,720 | $ | 1,922 | ||
9.250%, 09/01/12 (A) | 900 | 938 | ||||
8.875%, 01/15/15 (A) | 3,280 | 3,182 | ||||
8.250%, 09/01/17 (A) | 2,305 | 2,253 | ||||
DISH DBS | ||||||
7.875%, 09/01/19 (A) | 1,200 | 1,209 | ||||
7.750%, 05/31/15 | 4,980 | 5,055 | ||||
Frontier Communications | ||||||
6.625%, 03/15/15 | 1,100 | 1,056 | ||||
GCI | ||||||
8.625%, 11/15/19 (A) | 2,570 | 2,570 | ||||
Global Crossing | ||||||
12.000%, 09/15/15 (A) | 1,325 | 1,411 | ||||
Hughes Network Systems LLC | ||||||
9.500%, 04/15/14 | 1,315 | 1,328 | ||||
Inmarsat Finance | ||||||
7.375%, 12/01/17 (A) | 2,450 | 2,474 | ||||
Intelsat | ||||||
9.250%, 06/15/16 | 275 | 278 | ||||
Intelsat Bermuda | ||||||
11.500%, 02/04/17 (A) | 645 | 621 | ||||
11.250%, 06/15/16 | 3,300 | 3,523 | ||||
11.250%, 02/04/17 (A) | 3,625 | 3,589 | ||||
Intelsat Jackson Holdings | ||||||
9.500%, 06/15/16 | 1,300 | 1,360 | ||||
8.500%, 11/01/19 (A) | 1,830 | 1,830 | ||||
Intelsat Subsidiary Holding | ||||||
8.875%, 01/15/15 (A) | 2,250 | 2,272 | ||||
8.875%, 01/15/15 | 3,175 | 3,223 | ||||
iPCS PIK | ||||||
3.531%, 05/01/14 (C) | 2,840 | 2,286 | ||||
Level 3 Financing | ||||||
12.250%, 03/15/13 | 650 | 678 | ||||
9.250%, 11/01/14 | 670 | 591 | ||||
8.750%, 02/15/17 | 1,225 | 1,026 | ||||
4.601%, 02/15/15 (C) | 100 | 72 | ||||
Liberty Media LLC | ||||||
8.250%, 02/01/30 | 2,240 | 1,980 | ||||
Lucent Technologies | ||||||
6.450%, 03/15/29 | 1,155 | 889 | ||||
Mediacom LLC | ||||||
9.125%, 08/15/19 (A) | 875 | 888 | ||||
MetroPCS Wireless | ||||||
9.250%, 11/01/14 | 4,250 | 4,261 | ||||
9.250%, 11/01/14 | 1,150 | 1,153 | ||||
Nextel Communications | ||||||
6.875%, 10/31/13 | 1,991 | 1,891 | ||||
Nielsen Finance LLC | ||||||
12.500%, 08/01/11 (E) | 625 | 547 | ||||
11.625%, 02/01/14 | 280 | 301 | ||||
11.500%, 05/01/16 | 275 | 296 | ||||
10.000%, 08/01/14 | 940 | 971 | ||||
| SEI Institutional Investments Trust / Semi-Annual Report / November 30, 2009 | 83 |
Table of Contents
SCHEDULE OF INVESTMENTS (Unaudited)
High Yield Bond Fund (Continued)
November 30, 2009
| Description | Face Amount ($ Thousands) | Market Value ($ Thousands) | ||||
NII Capital | ||||||
10.000%, 08/15/16 (A) | $ | 3,150 | $ | 3,339 | ||
Nordic Telephone Holdings | ||||||
8.875%, 05/01/16 (A) | 3,075 | 3,229 | ||||
Orascom Telecom Finance | ||||||
7.875%, 02/08/14 (A) | 2,000 | 1,680 | ||||
PAETEC Holding | ||||||
9.500%, 07/15/15 | 2,176 | 2,026 | ||||
8.875%, 06/30/17 (A) | 1,960 | 1,945 | ||||
Quebecor Media | ||||||
7.750%, 03/15/16 | 4,795 | 4,627 | ||||
Qwest | ||||||
7.500%, 10/01/14 | 855 | 874 | ||||
7.250%, 09/15/25 | 725 | 638 | ||||
7.250%, 10/15/35 | 1,200 | 1,014 | ||||
6.875%, 09/15/33 | 275 | 234 | ||||
Qwest Capital Funding | ||||||
7.750%, 02/15/31 | 710 | 575 | ||||
7.250%, 02/15/11 | 300 | 301 | ||||
Qwest Communications International | ||||||
7.250%, 02/15/11 (D) | 2,065 | 2,065 | ||||
Qwest Communications International, Ser B | ||||||
7.500%, 02/15/14 | 1,125 | 1,114 | ||||
RH Donnelley | ||||||
11.750%, 05/15/15 (A) (B) | 1,235 | 1,044 | ||||
SBA Telecommunications | ||||||
8.250%, 08/15/19 (A) | 1,680 | 1,747 | ||||
8.000%, 08/15/16 (A) | 435 | 448 | ||||
Sinclair Television Group | ||||||
9.250%, 11/01/17 (A) | 1,005 | 1,019 | ||||
Sprint Capital | ||||||
8.750%, 03/15/32 | 3,845 | 3,292 | ||||
6.900%, 05/01/19 | 5,110 | 4,458 | ||||
Telcordia Technologies | ||||||
10.000%, 03/15/13 (A) | 465 | 386 | ||||
4.034%, 07/15/12 (A) (C) | 4,000 | 3,480 | ||||
Telesat Canada | ||||||
12.500%, 11/01/17 | 810 | 871 | ||||
11.000%, 11/01/15 | 795 | 841 | ||||
Univision Communications | ||||||
12.000%, 07/01/14 (A) | 1,231 | 1,339 | ||||
UPC Holding BV | ||||||
9.875%, 04/15/18 (A) | 3,085 | 3,208 | ||||
Videotron Ltee | ||||||
9.125%, 04/15/18 | 1,245 | 1,332 | ||||
VIP Finance Ireland for Vimpel Communications | ||||||
9.125%, 04/30/18 (A) | 655 | 688 | ||||
Virgin Media Finance | ||||||
9.500%, 08/15/16 | 3,680 | 3,864 | ||||
8.375%, 10/15/19 | 2,050 | 2,050 | ||||
Visant Holding | ||||||
10.250%, 12/01/13 (D) | 4,505 | 4,646 | ||||
| Description | Face Amount ($ Thousands) | Market Value ($ Thousands) | ||||
Vitamin Shoppe Industries | ||||||
7.773%, 11/15/12 (C) | $ | 1,052 | $ | 1,049 | ||
West | ||||||
11.000%, 10/15/16 | 1,905 | 1,919 | ||||
9.500%, 10/15/14 | 1,539 | 1,501 | ||||
Wind Acquisition Finance | ||||||
12.000%, 12/01/15 (A) | 3,015 | 3,226 | ||||
11.750%, 07/15/17 (A) | 2,188 | 2,428 | ||||
Windstream | ||||||
8.625%, 08/01/16 | 2,050 | 2,076 | ||||
8.125%, 08/01/13 | 10 | 10 | ||||
XM Satellite Radio | ||||||
11.250%, 06/15/13 (A) | 1,185 | 1,250 | ||||
XM Satellite Radio Holdings | ||||||
10.000%, 06/01/11 | 1,735 | 1,657 | ||||
| 171,127 | ||||||
Utilities — 3.4% | ||||||
AES | ||||||
9.750%, 04/15/16 (A) | 2,125 | 2,290 | ||||
8.000%, 10/15/17 | 1,045 | 1,048 | ||||
Calpine Construction Finance and CCFC Finance | ||||||
8.000%, 06/01/16 (A) | 965 | 970 | ||||
Calpine Generating LLC | ||||||
14.320%, 04/01/11 (B) (C) | 1,500 | 202 | ||||
Edison Mission Energy | ||||||
7.500%, 06/15/13 | 2,525 | 2,298 | ||||
7.200%, 05/15/19 | 3,850 | 2,791 | ||||
7.000%, 05/15/17 | 1,715 | 1,252 | ||||
Elwood Energy LLC | ||||||
8.159%, 07/05/26 | 1,018 | 913 | ||||
Energy Future Holdings | ||||||
10.875%, 11/01/17 | 4,745 | 3,333 | ||||
Ferrellgas Partners | ||||||
9.125%, 10/01/17 (A) | 2,500 | 2,600 | ||||
6.750%, 05/01/14 | 1,500 | 1,440 | ||||
KCP&L Greater Missouri Operations | ||||||
11.875%, 07/01/12 | 450 | 523 | ||||
Mirant Americas Generation LLC | ||||||
8.500%, 10/01/21 | 3,333 | 3,016 | ||||
Mirant Mid Atlantic Pass Through Trust A | ||||||
8.625%, 06/30/12 | 443 | 450 | ||||
Mirant North America LLC | ||||||
7.375%, 12/31/13 | 2,660 | 2,620 | ||||
North American Energy Alliance LLC | ||||||
10.875%, 06/01/16 (A) | 1,300 | 1,355 | ||||
NRG Energy | ||||||
8.500%, 06/15/19 | 1,220 | 1,232 | ||||
7.375%, 01/15/17 | 3,515 | 3,489 | ||||
7.375%, 02/01/16 | 2,690 | 2,676 | ||||
7.250%, 02/01/14 | 3,060 | 3,087 | ||||
| 84 | SEI Institutional Investments Trust / Semi-Annual Report / November 30, 2009 |
Table of Contents
| Description | Face Amount ($ Thousands) | Market Value ($ Thousands) | ||||
Orion Power Holdings | ||||||
12.000%, 05/01/10 | $ | 930 | $ | 956 | ||
Public Service of New Mexico | ||||||
7.950%, 05/15/18 | 2,800 | 2,931 | ||||
Puget Sound Energy | ||||||
6.974%, 06/01/67 (C) | 1,035 | 912 | ||||
Tenaska Alabama Partners | ||||||
7.000%, 06/30/21 (A) | 275 | 259 | ||||
Texas Competitive Electric Holdings LLC | ||||||
10.250%, 11/01/15 | 950 | 675 | ||||
10.250%, 11/01/15 | 5,820 | 4,132 | ||||
TXU | ||||||
6.500%, 11/15/24 | 1,010 | 464 | ||||
TXU, Ser P | ||||||
5.550%, 11/15/14 | 985 | 680 | ||||
TXU, Ser R | ||||||
6.550%, 11/15/34 | 1,430 | 637 | ||||
| 49,231 | ||||||
Total Corporate Obligations | 1,216,868 | |||||
LOAN PARTICIPATIONS — 9.5% | ||||||
Affinion Group Holdings | ||||||
8.273%, 03/01/12 (C) | 4,924 | 4,358 | ||||
Alion Science & Technology Commitment | ||||||
9.500%, 02/06/13 | 13 | 12 | ||||
9.500%, 02/06/13 | 2,474 | 2,246 | ||||
Alliant Insurance Service | ||||||
3.283%, 08/21/14 | 1,225 | 1,109 | ||||
8.000%, 08/21/14 | 798 | 794 | ||||
Allison Transmission | ||||||
3.040%, 08/07/14 (C) | 141 | 124 | ||||
3.030%, 08/07/14 (C) | 101 | 88 | ||||
3.000%, 08/07/14 (C) | 304 | 266 | ||||
2.990%, 08/07/14 (C) | 50 | 44 | ||||
American General Finance | ||||||
4.100%, 07/14/10 | 1,080 | 980 | ||||
0.000%, 07/14/10 (H) | 335 | 293 | ||||
Aspect Software Ser A-1 | ||||||
3.313%, 07/11/11 | 1,239 | 1,152 | ||||
Asurion | ||||||
6.739%, 07/03/15 (C) | 3,450 | 3,262 | ||||
ATP Oil and Gas | ||||||
9.000%, 12/26/13 | 130 | 126 | ||||
8.500%, 12/26/13 | 837 | 814 | ||||
Boston Generating 1st Lien | ||||||
7.234%, 12/20/16 | 167 | 2 | ||||
Boston Generating 2nd Lien | ||||||
4.484%, 06/20/14 | 650 | 134 | ||||
CDW Term Loan B | ||||||
0.000%, 10/12/14 (H) | 1,000 | 836 | ||||
| Description | Face Amount ($ Thousands) | Market Value ($ Thousands) | ||||
Central Parking | ||||||
2.563%, 05/22/14 (C) | $ | 1,723 | $ | 1,344 | ||
0.163%, 05/22/14 (C) | 616 | 465 | ||||
Chester Downs | ||||||
12.375%, 12/31/49 | 675 | 673 | ||||
Claire’s Stores | ||||||
3.032%, 05/27/14 | 2,580 | 2,013 | ||||
0.000%, 05/29/14 (H) | 1,675 | 1,307 | ||||
Clearwire | ||||||
9.250%, 07/03/12 | 1,492 | 1,481 | ||||
9.230%, 07/03/12 | 499 | 495 | ||||
0.000%, 07/03/12 (H) | 2,871 | 2,850 | ||||
DAE Aviation Holdings Ser B | ||||||
4.040%, 07/31/14 | 277 | 252 | ||||
4.030%, 09/27/14 (C) | 270 | 246 | ||||
4.000%, 09/27/14 | 1 | 1 | ||||
Dana | ||||||
0.000%, 01/31/15 (H) | 755 | 671 | ||||
Dealer Computer Services | ||||||
7.734%, 04/26/14 | 4,550 | 3,504 | ||||
2.234%, 10/26/12 | 1,970 | 1,834 | ||||
Dex Media West LLC | ||||||
6.750%, 06/30/11 | 1,502 | 1,346 | ||||
Dex Media West LLC, Ser B | ||||||
7.000%, 10/24/14 (C) | 1,977 | 1,781 | ||||
Dresser Rand 2nd Lien | ||||||
6.021%, 05/04/15 | 293 | 263 | ||||
5.987%, 05/04/15 | 587 | 526 | ||||
Federal Mogul | ||||||
2.177%, 12/29/14 | 2,569 | 1,938 | ||||
2.177%, 12/28/15 | 1,311 | 989 | ||||
First Data, Ser B-1 | ||||||
3.036%, 09/24/14 | 267 | 221 | ||||
3.032%, 09/24/14 | 158 | 132 | ||||
2.986%, 09/24/14 | 2,588 | 2,153 | ||||
Flextronics International | ||||||
2.540%, 10/01/12 | 1,489 | 1,397 | ||||
Flextronics International, Ser A | ||||||
2.484%, 10/01/14 | 1,194 | 1,120 | ||||
Ford Motor Company | ||||||
2.500%, 12/14/11 | 1,392 | 1,213 | ||||
0.000%, 12/14/11 (H) | 108 | 14 | ||||
Freescale Semiconductor Incremental | ||||||
12.500%, 12/15/14 | 4,489 | 4,604 | ||||
Gambro Aktiebolag | ||||||
0.000%, 11/24/16 (H) | 965 | 685 | ||||
Georgia Pacific | ||||||
2.283%, 12/20/12 | 200 | 189 | ||||
2.242%, 12/20/12 | 63 | 60 | ||||
Greektown Casino | ||||||
0.000%, 12/03/12 (B) (H) | 725 | 734 | ||||
Green Valley Ranch Gaming, 2nd Lien | ||||||
3.549%, 08/06/14 | 2,000 | 420 | ||||
0.000%, 02/16/14 (H) | 1,100 | 799 | ||||
| SEI Institutional Investments Trust / Semi-Annual Report / November 30, 2009 | 85 |
Table of Contents
SCHEDULE OF INVESTMENTS (Unaudited)
High Yield Bond Fund (Continued)
November 30, 2009
| Description | Face Amount ($ Thousands) | Market Value ($ Thousands) | ||||
Guitar Center | ||||||
3.740%, 10/09/13 | $ | 2,153 | $ | 1,804 | ||
Harrah’s Operating | ||||||
9.500%, 01/28/15 | 3,000 | 2,908 | ||||
3.283%, 01/28/15 | 32 | 24 | ||||
3.282%, 01/28/15 | 1,575 | 1,221 | ||||
Hexion Specialty Chemical, Ser C-1 | ||||||
2.563%, 05/05/13 (C) | 2,872 | 2,431 | ||||
Hexion Specialty Chemical, Ser C-2 | ||||||
2.563%, 05/05/13 (C) | 517 | 438 | ||||
Iasis Healthcare | ||||||
6.290%, 06/13/14 | 610 | 540 | ||||
5.531%, 06/13/14 | 3,055 | 2,706 | ||||
Ineos Holdings, Ser B | ||||||
4.789%, 12/16/13 (C) | 1,538 | 1,326 | ||||
0.000%, 12/16/13 | 250 | 215 | ||||
Ineos Holdings, Ser C | ||||||
5.289%, 12/16/14 (C) | 1,538 | 1,331 | ||||
0.000%, 12/16/14 (C) (H) | 250 | 216 | ||||
Ineos US Finance LLC | ||||||
10.001%, 12/16/14 | 1,985 | 1,718 | ||||
9.501%, 12/16/13 | 1,985 | 1,711 | ||||
Infor Enterprise Solution | ||||||
0.000%, 03/02/14 (H) | 2,188 | 1,488 | ||||
Infor Global Enterprise Solutions | ||||||
6.484%, 03/02/14 | 1,524 | 1,037 | ||||
Infor Global Solutions | ||||||
0.000%, 08/29/14 (H) | 1,400 | 507 | ||||
0.000%, 07/28/12 (H) | 1,203 | 1,060 | ||||
6.484%, 03/02/14 | 882 | 600 | ||||
Infor Global Solutions, Ser B | ||||||
0.000%, 07/30/12 (H) | 8 | 7 | ||||
Intelsat Bermuda | ||||||
2.739%, 02/01/14 (C) | 2,400 | 2,167 | ||||
Jacuzzi Brands | ||||||
2.531%, 02/14/14 | 589 | 381 | ||||
2.523%, 02/15/14 (C) | 460 | 298 | ||||
2.504%, 02/14/14 | 1 | 1 | ||||
0.182%, 02/07/14 | 14 | 9 | ||||
Landry’s Ser B | ||||||
9.500%, 05/13/11 | 822 | 824 | ||||
Language Line, Ser B | ||||||
0.270%, 05/14/11 (C) | — | — | ||||
Las Vegas Sands LLC | ||||||
2.040%, 05/17/14 | 1,851 | 1,538 | ||||
0.262%, 05/23/14 (C) | 1,300 | 1,080 | ||||
Lyondell Bank | ||||||
13.000%, 12/15/09 | 2,509 | 1,704 | ||||
3.736%, 04/30/14 | 339 | 246 | ||||
3.736%, 12/20/13 | 644 | 468 | ||||
Lyondell Chemical | ||||||
3.736%, 12/20/13 | 93 | 67 | ||||
Lyondell Dutch | ||||||
3.736%, 12/20/13 (C) | 207 | 151 | ||||
| Description | Face Amount ($ Thousands) | Market Value ($ Thousands) | ||||
Lyondell German | ||||||
3.986%, 12/22/14 | $ | 779 | $ | 567 | ||
Lyondell Rollup | ||||||
5.799%, 12/15/09 | 17 | 17 | ||||
5.795%, 12/15/09 | 1,688 | 1,629 | ||||
Lyondell US | ||||||
7.000%, 12/22/13 | 1,127 | 818 | ||||
7.000%, 12/20/14 | 1,127 | 818 | ||||
7.000%, 12/22/14 | 1,127 | 818 | ||||
Marsico Parent LLC | ||||||
0.000%, 12/14/13 (H) | 155 | 98 | ||||
0.000%, 12/15/14 (H) | 755 | 480 | ||||
Metroflag, 2nd Lien | ||||||
11.080%, 01/06/09 (B) (F) | 325 | — | ||||
Neiman Marcus Group | ||||||
2.322%, 04/26/13 | 605 | 515 | ||||
2.242%, 04/26/13 | 378 | 322 | ||||
Nuveen Investments | ||||||
12.500%, 11/09/14 | 550 | 565 | ||||
12.500%, 07/31/15 | 725 | 744 | ||||
3.282%, 11/09/14 (C) | 991 | 823 | ||||
3.281%, 11/09/14 (C) | 979 | 813 | ||||
Open Link Financial Term Loan B | ||||||
0.000%, 11/06/14 (H) | 2,750 | 2,695 | ||||
Orbitz Worldwide | ||||||
2.782%, 07/01/14 (C) | 189 | 168 | ||||
OSI Restaurant Partners | ||||||
2.545%, 06/14/14 (C) | 1,865 | 1,502 | ||||
0.000%, 06/14/14 (H) | 73 | 59 | ||||
Outback Term Loan | ||||||
0.000%, 06/14/14 (H) | 847 | 682 | ||||
Penhall | ||||||
9.631%, 04/01/12 | 798 | 32 | ||||
PQ | ||||||
0.281%, 07/30/15 (C) | 410 | 355 | ||||
0.000%, 06/14/14 (H) | 1,015 | 897 | ||||
Proquest. 2nd Lien | ||||||
6.039%, 02/09/15 | 1,200 | 1,104 | ||||
Realogy | ||||||
3.287%, 10/13/13 | 638 | 543 | ||||
3.284%, 10/13/13 | 594 | 505 | ||||
Rexnord | ||||||
7.361%, 03/01/13 | 1,998 | 1,149 | ||||
Reynold | ||||||
6.250%, 10/24/12 | 1,450 | 1,446 | ||||
Rite Aid | ||||||
9.500%, 06/01/15 | 2,040 | 2,097 | ||||
0.000%, 06/04/14 (H) | 1,065 | 1,095 | ||||
Sabre | ||||||
2.493%, 09/30/14 | 800 | 680 | ||||
2.489%, 09/30/14 | 540 | 459 | ||||
Sensata Technology | ||||||
2.031%, 04/27/13 | 2,120 | 1,865 | ||||
| 86 | SEI Institutional Investments Trust / Semi-Annual Report / November 30, 2009 |
Table of Contents
| Description | Face Amount ($ Thousands) | Market Value ($ Thousands) | ||||
Servicemaster | ||||||
2.840%, 10/17/14 | $ | 168 | $ | 146 | ||
2.750%, 10/17/14 | 704 | 612 | ||||
Simmons Holdco | ||||||
10.500%, 12/19/11 | 1,155 | 1,141 | ||||
7.351%, 02/15/12 | 1,303 | 20 | ||||
7.313%, 02/15/12 | 1,199 | 18 | ||||
Simmons Holdco, Unsecured | ||||||
7.351%, 02/15/12 | 436 | 6 | ||||
Sorenson Communication | ||||||
15.000%, 06/30/14 | 4,160 | 3,303 | ||||
Sorenson Communication, 2nd Lien | ||||||
7.234%, 02/16/14 (C) | 4,450 | 4,141 | ||||
Stallion Oilfield Service | ||||||
2.530%, 06/12/13 | 1,075 | 953 | ||||
Targa Resources | ||||||
0.000%, 02/09/16 (H) | 1,500 | 1,050 | ||||
Texas Competitive Electric | ||||||
3.782%, 10/10/14 (C) | 54 | 41 | ||||
3.775%, 10/10/14 (C) | 2,954 | 2,202 | ||||
3.753%, 10/10/14 (C) | 101 | 75 | ||||
3.742%, 10/10/14 (C) | 9,034 | 6,733 | ||||
Verint Systems, Ser T-1 | ||||||
3.490%, 05/25/14 (C) | 2,510 | 2,267 | ||||
Western Refining | ||||||
8.250%, 05/30/14 | 1 | 1 | ||||
Zuffa | ||||||
7.500%, 06/18/15 | 1,800 | 1,755 | ||||
Total Loan Participations | 137,406 | |||||
COLLATERALIZED DEBT OBLIGATION — 3.1% | ||||||
Other Asset-Backed Securities — 3.1% | ||||||
ACAS CLO, Ser 2007-1A, Cl A1J | ||||||
0.594%, 04/20/21 (A) (C) | 3,800 | 2,774 | ||||
Ares IIIR CLO, Ser 2007-3RA, Cl SUB | ||||||
0.000%, 04/16/21 (A) | 5,000 | 1,250 | ||||
Ares VR CLO, Ser 2006-5RA, Cl SUB | ||||||
0.000%, 02/24/18 (A) | 3,500 | 175 | ||||
Ares XI CLO, Ser 2007-11A, Cl SUB | ||||||
0.000%, 10/11/21 (A) | 3 | 676 | ||||
Babson CLO, Ser 2004-II, Cl SUB | ||||||
0.000%, 11/15/16 (A) | 18 | 342 | ||||
Babson CLO, Ser 2007-2A, Cl INC | ||||||
0.000%, 04/15/21 (A) (C) | 2,700 | 108 | ||||
Babson CLO, Ser 2007-2A, Cl D | ||||||
1.984%, 04/15/21 (A) (B) (C) | 1,050 | 399 | ||||
Battalion CLO, Ser 2007-1, Cl 1A | ||||||
0.000%, 07/14/22 (A) | 18 | 490 | ||||
Battalion CLO, Ser 2007-1A, Cl E | ||||||
4.534%, 07/14/22 (A) (B) (C) | 2,550 | 1,199 | ||||
Capitalsource Advisors CLO, | ||||||
0.000%, 08/27/20 (A) | 2,900 | 493 | ||||
| Description | Face Amount ($ Thousands) | Market Value ($ Thousands) | ||||
CIFC Funding , Ser 2007-IV | ||||||
0.000%, 12/19/07 | $ | 3,900 | $ | 975 | ||
CIFC Funding, Ser 2006-1BA, Cl A3L | ||||||
1.119%, 12/22/20 (A) (C) | 3,525 | 2,219 | ||||
CIFC Funding, Ser 2006-I | ||||||
0.000%, 10/20/20 (A) (C) | 2,000 | 260 | ||||
CIFC Funding, Ser 2006-II | ||||||
0.000%, 03/01/21 (A) (C) | 3,000 | 420 | ||||
CIFC Funding, Ser 2007-2A, Cl SUB | ||||||
0.000%, 04/15/21 (A) | 2,500 | 275 | ||||
CIFC Funding, Ser 2007-3A, Cl B | ||||||
1.532%, 07/26/21 (A) (C) | 2,700 | 1,589 | ||||
CIT CLO, Ser 2007-1A, Cl E | ||||||
5.606%, 06/20/21 (B) (C) | 2,200 | 704 | ||||
CIT CLO, Ser 2007-1A, Cl D | ||||||
2.292%, 06/20/21 (A) (C) | 3,000 | 1,260 | ||||
Connecticut Valley Structured | ||||||
0.000%, 03/23/23 (A) | 1,200 | 3 | ||||
Copper River CLO, | ||||||
0.000%, 01/20/21 (A) (C) | 3,000 | 1,200 | ||||
De Meer Middle Market CLO, | ||||||
0.000%, 10/20/18 (A) | 3,167 | 1,267 | ||||
De Meer Middle Market CLO, | ||||||
0.684%, 10/20/18 (A) (C) | 1,200 | 888 | ||||
Denali Capital CLO VII, | ||||||
0.000%, 01/22/22 (A) | 4,500 | 1,710 | ||||
Duane Street CLO, | ||||||
0.000%, 10/14/21 (A) | 3,500 | 245 | ||||
Emporia Preferred Funding, Cl C | ||||||
1.183%, 04/23/21 (A) (C) | 3,224 | 1,773 | ||||
Gale Force CLO, | ||||||
0.269%, 08/20/21 (C) | 60 | 2,250 | ||||
Gale Force CLO, | ||||||
6.669%, 08/20/21 (B) (C) | 4,200 | 2,016 | ||||
Gleneagles CLO, Ser AI | ||||||
0.000%, 11/01/17 (C) | 6 | 180 | ||||
Greenbriar CLO, | ||||||
3.031%, 11/01/21 (A) (B) (C) | 4,728 | 1,513 | ||||
Harch CLO, Ser 2007-1A, Cl C | ||||||
1.031%, 04/17/20 (A) (C) | 917 | 642 | ||||
Hudson Straits CLO, Cl B | ||||||
1.034%, 10/15/16 (A) (C) | 2,450 | 2,059 | ||||
ING Investment Management I CLO | ||||||
0.000%, 12/01/17 (A) (C) | 2 | 300 | ||||
ING Investment Management II CLO | ||||||
0.000%, 08/01/20 (A) (C) | 5 | 720 | ||||
Lightpoint CLO, Ser 2006-4A, Cl INC | ||||||
0.000%, 04/15/18 (A) | 2,000 | 140 | ||||
Marathon CLO, Ser 2005-2A, Cl INC | ||||||
0.000%, 12/20/19 (A) | 1,500 | 75 | ||||
| SEI Institutional Investments Trust / Semi-Annual Report / November 30, 2009 | 87 |
Table of Contents
SCHEDULE OF INVESTMENTS (Unaudited)
High Yield Bond Fund (Continued)
November 30, 2009
| Description | Face Amount ($ Thousands) | Market Value ($ Thousands) | ||||
Marlborough Street CLO, | ||||||
0.000%, 04/18/19 (A) | $ | 2,300 | $ | 184 | ||
Peritus I CDO, Ser 2005-1A, Cl C | ||||||
9.000%, 05/24/15 (A) (B) | 10,161 | 3,556 | ||||
Peritus I CDO | ||||||
0.000%, 12/19/07 | 3,000 | 150 | ||||
Rockwall Investors CDO | ||||||
0.000%, 08/01/21 (A) (C) | 3,000 | 30 | ||||
Stanfield Daytona CLO | ||||||
0.000%, 04/27/21 | 36 | 1,188 | ||||
Stanfield Veyron CLO, | ||||||
0.000%, 07/15/18 | 2,000 | 200 | ||||
Telos CLO, Cl A2 | ||||||
0.684%, 10/11/21 (A) (C) | 2,464 | 1,725 | ||||
Tralee CDO, Ser 2007-1A, Cl SUB | ||||||
0.000%, 04/16/22 (A) | 2,500 | 150 | ||||
Venture CDO, Cl A1B | ||||||
0.614%, 01/20/22 (A) (C) | 2,381 | 1,933 | ||||
Waterfront CLO, Ser 2007-1A, Cl A2 | ||||||
0.684%, 08/02/20 (A) (C) | 2,888 | 2,166 | ||||
Whitehorse CLO II | ||||||
0.000%, 06/15/17 (A) (C) | 35 | 875 | ||||
Total Collateralized Debt Obligation (Cost $89,816) ($ Thousands) | 44,746 | |||||
CONVERTIBLE BONDS — 0.8% | ||||||
ADC Telecommunications | ||||||
3.500%, 07/15/15 | 870 | 622 | ||||
Advanced Micro Devices | ||||||
6.000%, 05/01/15 | 605 | 531 | ||||
Beazer Homes USA | ||||||
4.625%, 06/15/24 | 509 | 465 | ||||
Bill Barrett | ||||||
5.000%, 03/15/28 | 600 | 572 | ||||
Century Aluminum | ||||||
1.750%, 08/01/24 | 190 | 175 | ||||
Developers Diversified Realty | ||||||
3.000%, 03/15/12‡ | 585 | 535 | ||||
Hologic | ||||||
2.000%, 12/15/37 | 765 | 620 | ||||
Horizon Lines | ||||||
4.250%, 08/15/12 | 570 | 450 | ||||
L-1 Identity Solutions | ||||||
3.750%, 05/15/27 | 630 | 574 | ||||
Leap Wireless International | ||||||
4.500%, 07/15/14 | 800 | 628 | ||||
Level 3 Communications | ||||||
5.250%, 12/15/11 | 385 | 349 | ||||
Liberty Media LLC | ||||||
4.000%, 11/15/29 | 375 | 191 | ||||
3.750%, 02/15/30 | 565 | 283 | ||||
Lions Gate Entertainment | ||||||
2.938%, 10/15/24 | 1,555 | 1,423 | ||||
| Description | Face Amount ($ Thousands)/ Shares | Market Value ($ Thousands) | ||||
Mirant CV to 131.9888 | ||||||
0.000%, 07/15/49 (B) (F) | $ | 750 | $ | — | ||
Mirant CV to 14.7167 | ||||||
0.000%, 06/15/21 (B) | 1,950 | 4 | ||||
Morgans Hotel Group | ||||||
2.375%, 10/15/14 (A) | 1,210 | 791 | ||||
NII Holdings CV to 8.4517 | ||||||
3.125%, 06/15/12 | 3,500 | 3,163 | ||||
Total Convertible Bonds | 11,376 | |||||
ASSET-BACKED SECURITIES — 0.5% | ||||||
Other Asset-Backed Securities — 0.5% | ||||||
ACAS Business Loan Trust, | ||||||
0.673%, 11/18/19 (A) (C) | 1,484 | 1,217 | ||||
Applebee’s Enterprises LLC | ||||||
6.427%, 12/20/37 (A) | 3,358 | 2,989 | ||||
Dominos Pizza Master Issuer LLC, Ser 2007-1, Cl A2 | ||||||
5.261%, 04/25/37 (A) | 1,403 | 1,203 | ||||
Sands Point Funding, | ||||||
1.084%, 07/18/20 (A) (C) | 2,580 | 1,419 | ||||
Total Asset-Backed Securities (Cost $6,311) ($ Thousands) | 6,828 | |||||
REGISTERED INVESTMENT COMPANIES — 0.3% | ||||||
BlackRock Insured | 14,500 | 1,232 | ||||
BlackRock MuniVest Fund II | 9,250 | 786 | ||||
BlackRock MuniYield Fund | 11,750 | 999 | ||||
BlackRock MuniYield New Jersey Fund | 14,500 | 1,233 | ||||
Total Registered Investment Companies | 4,250 | |||||
COMMON STOCK — 0.1% | ||||||
Broder Bros. (I)* | 53,969 | 33 | ||||
Dana Holdings* | 67,821 | 494 | ||||
Delta Air Lines* | 250 | 2 | ||||
Federal Mogul, Cl A* | 32,619 | 440 | ||||
Spectrum Brands* | 34,321 | 755 | ||||
VSS AHC, Cl A* (I) | 29,628 | 353 | ||||
World Color Press* | 25,483 | 243 | ||||
Total Common Stock | 2,320 | |||||
PREFERRED STOCK — 0.2% | ||||||
Axis Capital Holdings (C) | 13 | 967 | ||||
Crown Castle International | 18 | 1,067 | ||||
Dana, Ser B | 575 | 363 | ||||
GMAC Preferred Blocker* | 1 | 558 | ||||
Total Preferred Stock | 2,955 | |||||
| 88 | SEI Institutional Investments Trust / Semi-Annual Report / November 30, 2009 |
Table of Contents
| Description | Face Amount ($ Thousands) | Market Value ($ Thousands) | ||||
GLOBAL BOND — 0.1% | ||||||
Lincoln National | $ | 1,300 | $ | 1,517 | ||
Total Global Bond | 1,517 | |||||
WARRANTS — 0.0% | ||||||
Atrium, Expires 10/14/08* (E) (F) | 691 | — | ||||
World Color Press, Expires 07/20/14* | 28,884 | 76 | ||||
Total Warrants | 76 | |||||
| Description | Shares | Market Value ($ Thousands) | |||
AFFILIATED PARTNERSHIP — 0.0% | |||||
SEI Liquidity Fund, L.P. | 4,325 | $ | 4 | ||
Total Affiliated Partnership | 4 | ||||
CASH EQUIVALENT — 1.1% | |||||
SEI Daily Income Trust, Prime Obligation Fund, Cl A 0.130%**† | 15,770,568 | 15,771 | |||
Total Cash Equivalent | 15,771 | ||||
Total Investments — 99.7% | $ | 1,444,117 | |||
A summary of outstanding swap agreements help by the Fund at November 30, 2009, is as follows:
| Credit Default Swap | ||||||||||||||||
| Counterparty | Reference Entity/Obligation | Buy/Sell Protection | (Pays)/ Receives Rate | Termination Date | Notional Amount (Thousands) | Net Unrealized Depreciation ($ Thousands) | ||||||||||
| Barclays Bank PLC | CDX.NA.HY.13-V2 Index | Buy | 5.00 | % | 12/20/14 | $ | 14,200 | $ | (137 | ) | ||||||
Percentages are based on a Net Assets of $1,448,609 ($ Thousands)
| * | Non-income producing security. |
| ** | The rate reported is the 7-day effective yield as of November 30, 2009. |
| † | Investment in Affiliated Security (see Note 5). |
| ‡ | Real Estate Investment Trust |
| (A) | Securities sold within terms of a private placement memorandum, exempt from registration under Section 144A of the Securities Act of 1933, as amended, and may be sold only to dealers in that program or other “accredited investors.” These securities have been determined to be liquid under guidelines established by the board of Trustees. |
| (B) | Security in default on interest payments. |
| (C) | Variable Rate Security — The rate reported is the rate in effect as of November 30, 2009. The date reported is the final maturity date. |
| (D) | Step Bonds — The rate reflected is the effective yield on November 30, 2009. The coupon on a step bond changes on a specified date. |
| (E) | This security or a partial position of this security is on loan at November 30, 2009. The total value of securities on loan at November 30, 2009 was $5 ($ Thousands). |
| (F) | Securities considered illiquid. The total value of such securities as of November 30, 2009 was $0 ($ Thousands) and represented 0.00% of Net Assets. |
| (G) | This security was purchased with cash collateral held from securities on loan. The total value of such securities as of November 30, 2009 was $4 ($Thousands). |
| (H) | Unsettled Loan Participation. Interest rate not available. |
| (I) | Security fair valued using methods determined in good faith by the Valuation Committee of the Board of Trustees. The total value of such securities as of November 31, 2009 was $386 ($ Thousands) and represents 0.03% of net assets. |
CDO — Collateralized Debt Obligation
Cl — Class
CLO — Collateralized Loan Obligation
CV — Convertible Security
LLC — Limited Liability Company
L.P. — Limited Partnership
MTN — Medium Term Note
PIK — Payment-in-Kind
PLC — Public Limited Company
Ser — Series
Amounts designated as “—” are $O or have been rounded to $O.
The following is a summary of the inputs used as of November 30, 2009 in valuing the Fund’s investments carried at value ($ Thousands):
| Investments in Securities | Level 1 | Level 2 | Level 3 | Total | ||||||||
Corporate Obligations | $ | — | $ | 1,212,552 | $ | 4,316 | $ | 1,216,868 | ||||
Collateralized Debt Obligation | — | 5,256 | 39,490 | 44,746 | ||||||||
Convertible Bonds | — | 11,372 | 4 | 11,376 | ||||||||
Asset-Backed Securities | — | 5,612 | 1,216 | 6,828 | ||||||||
Registered Investment Companies | — | 4,250 | — | 4,250 | ||||||||
Preferred Stock | — | 2,955 | — | 2,955 | ||||||||
Common Stock | 1,592 | 353 | 375 | 2,320 | ||||||||
Global Bond | — | 1,517 | — | 1,517 | ||||||||
Warrants | — | 76 | — | 76 | ||||||||
Affiliated Partnership | — | 4 | — | 4 | ||||||||
Loan Participations | — | 128,437 | 8,969 | 137,406 | ||||||||
Cash Equivalent | 15,771 | — | — | 15,771 | ||||||||
Total Investments in Securities | $ | 17,363 | $ | 1,372,384 | $ | 54,370 | $ | 1,444,117 | ||||
| Other Financial Instruments | Level 1 | Level 2 | Level 3 | Total | ||||||||||
Credit Default Swaps | $ | — | $ | (137 | ) | $ | — | $ | (137 | ) | ||||
Total Other Financial Instruments | $ | — | $ | (137 | ) | $ | — | $ | (137 | ) | ||||
| SEI Institutional Investments Trust / Semi-Annual Report / November 30, 2009 | 89 |
Table of Contents
SCHEDULE OF INVESTMENTS (Unaudited)
High Yield Bond Fund (Concluded)
November 30, 2009
The following is a reconciliation of investments in which significant unobservable inputs (Level 3) were used in determining value ($ Thousands):
| Investments in Asset Backed | Investments in Collateralized Debt Obligations | Investments in Corporate Bonds | |||||||||
Beginning balance as of | $ | 3,885 | $ | 28,897 | $ | 321 | |||||
Accrued discounts/premiums | (52 | ) | (358 | ) | 12 | ||||||
Realized gain/(loss) | 162 | 6,741 | — | ||||||||
Change in unrealized appreciation/(depreciation) | 1,069 | 44,339 | 100 | ||||||||
Net purchases/sales | (3,848 | ) | (39,787 | ) | 348 | ||||||
Net transfer in and/or out of Level 3 | — | — | — | ||||||||
Ending balance as of November 30, 2009 | $ | 1,216 | $ | 39,832 | $ | 781 | |||||
Changes in unrealized gains/(losses) included in earnings related to securities still held at reporting date. | $ | 1,069 | $ | 28,684 | $ | 529 | |||||
| Investments in Convertible Bonds | Investments in Loan Participations | Investments in Common Stock | |||||||||
Beginning balance as of | $ | 4 | $ | 10,713 | $ | — | |||||
Accrued discounts/premiums | — | (41 | ) | — | |||||||
Realized gain/(loss) | 17 | (7,522 | ) | — | |||||||
Change in unrealized appreciation/(depreciation) | — | 7,065 | — | ||||||||
Net purchases/sales | (17 | ) | (2,210 | ) | 33 | ||||||
Net transfer in and/or out of Level 3 | — | 964 | — | ||||||||
Ending balance as of November 30, 2009 | $ | 4 | $ | 8,969 | $ | 33 | |||||
Changes in unrealized gains/(losses) included in earnings related to securities still held at reporting date. | $ | — | $ | (75 | ) | $ | — | ||||
For more information on valuation inputs, see Note 2 — Significant Accounting Policies in Notes to Financial Statements.
The accompanying notes are an integral part of the financial statements.
| 90 | SEI Institutional Investments Trust / Semi-Annual Report / November 30, 2009 |
Table of Contents
SCHEDULE OF INVESTMENTS (Unaudited)
Long Duration Fund
November 30, 2009
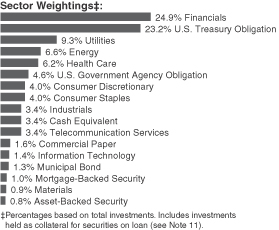
| Description | Face Amount ($ Thousands) | Market Value ($ Thousands) | ||||
CORPORATE OBLIGATIONS — 63.4% | ||||||
Consumer Discretionary — 4.0% | ||||||
Comcast | ||||||
6.550%, 07/01/39 | $ | 5,825 | $ | 6,190 | ||
Comcast Cable Communications Holdings | ||||||
9.455%, 11/15/22 | 3,750 | 4,892 | ||||
COX Communications | ||||||
8.375%, 03/01/39 (A) | 5,975 | 7,313 | ||||
Historic TW | ||||||
6.625%, 05/15/29 | 8,585 | 8,964 | ||||
McDonald’s MTN | ||||||
6.300%, 03/01/38 | 3,415 | 3,912 | ||||
News America | ||||||
7.850%, 03/01/39 | 7,950 | 9,349 | ||||
6.900%, 08/15/39 (A) | 2,775 | 3,024 | ||||
Target | ||||||
7.000%, 01/15/38 | 3,560 | 4,290 | ||||
Time Warner Cable | ||||||
8.750%, 02/14/19 | 9,070 | 11,296 | ||||
8.250%, 04/01/19 | 3,075 | 3,743 | ||||
6.750%, 06/15/39 | 1,650 | 1,754 | ||||
Time Warner Entertainment | ||||||
8.375%, 07/15/33 | 5,700 | 6,839 | ||||
Wal-Mart Stores | ||||||
6.200%, 04/15/38 | 8,250 | 9,320 | ||||
Yum! Brands | ||||||
6.875%, 11/15/37 | 5,620 | 6,184 | ||||
| 87,070 | ||||||
Consumer Staples — 4.0% | ||||||
Altria Group | ||||||
10.200%, 02/06/39 | 10,950 | 14,397 | ||||
Anheuser-Busch InBev Worldwide | ||||||
8.200%, 01/15/39 (A) | 5,210 | 6,708 | ||||
6.875%, 11/15/19 (A) | 8,400 | 9,587 | ||||
6.375%, 01/15/40 (A) | 6,295 | 6,721 | ||||
| Description | Face Amount ($ Thousands) | Market Value ($ Thousands) | ||||
CVS Caremark | ||||||
6.125%, 09/15/39 | $ | 7,255 | $ | 7,200 | ||
Diageo Capital | ||||||
5.875%, 09/30/36 | 4,508 | 4,984 | ||||
Dr Pepper Snapple Group | ||||||
6.820%, 05/01/18 | 2,000 | 2,316 | ||||
General Mills | ||||||
5.650%, 02/15/19 | 2,750 | 3,007 | ||||
HJ Heinz Finance | ||||||
7.125%, 08/01/39 (A) | 4,390 | 5,077 | ||||
Kraft Foods | ||||||
6.875%, 02/01/38 | 11,385 | 12,305 | ||||
Philip Morris International | ||||||
6.375%, 05/16/38 | 3,500 | 3,963 | ||||
Procter & Gamble | ||||||
5.550%, 03/05/37 | 4,000 | 4,306 | ||||
Ralcorp Holdings | ||||||
6.625%, 08/15/39 (A) | 5,000 | 5,162 | ||||
| 85,733 | ||||||
Energy — 6.5% | ||||||
Canadian Natural Resources | ||||||
6.750%, 02/01/39 | 3,600 | 4,072 | ||||
Cenovus Energy | ||||||
6.750%, 11/15/39 (A) | 4,515 | 4,963 | ||||
CenterPoint Energy Resources | ||||||
6.625%, 11/01/37 | 7,665 | 8,255 | ||||
6.000%, 05/15/18 | 3,500 | 3,738 | ||||
ConocoPhillips | ||||||
6.500%, 02/01/39 | 18,975 | 21,563 | ||||
Devon Energy Financing | ||||||
7.875%, 09/30/31 | 3,125 | 3,944 | ||||
EnCana | ||||||
6.500%, 02/01/38 | 3,625 | 3,969 | ||||
EQT | ||||||
8.125%, 06/01/19 | 9,365 | 10,937 | ||||
Husky Energy | ||||||
7.250%, 12/15/19 | 11,200 | 13,091 | ||||
Marathon Oil | ||||||
7.500%, 02/15/19 | 7,275 | 8,573 | ||||
6.600%, 10/01/37 | 3,700 | 3,985 | ||||
Panhandle Eastern Pipeline | ||||||
8.125%, 06/01/19 | 2,900 | 3,457 | ||||
7.000%, 06/15/18 | 700 | 788 | ||||
Petro-Canada | ||||||
6.800%, 05/15/38 | 3,725 | 4,102 | ||||
Suncor Energy | ||||||
6.850%, 06/01/39 | 3,675 | 4,094 | ||||
Talisman Energy | ||||||
7.750%, 06/01/19 | 3,075 | 3,682 | ||||
TransCanada Pipelines | ||||||
7.250%, 08/15/38 | 3,100 | 3,780 | ||||
Valero Energy | ||||||
6.625%, 06/15/37 | 7,205 | 6,962 | ||||
| SEI Institutional Investments Trust / Semi-Annual Report / November 30, 2009 | 91 |
Table of Contents
SCHEDULE OF INVESTMENTS (Unaudited)
Long Duration Fund (Continued)
November 30, 2009
| Description | Face Amount ($ Thousands) | Market Value ($ Thousands) | ||||
Williams | ||||||
8.750%, 01/15/20 | $ | 14,810 | $ | 17,309 | ||
7.875%, 09/01/21 | 2,150 | 2,399 | ||||
XTO Energy | ||||||
6.100%, 04/01/36 | 8,315 | 8,592 | ||||
| 142,255 | ||||||
Financials — 24.7% | ||||||
Allstate | ||||||
5.950%, 04/01/36 | 6,540 | 6,997 | ||||
American Express | ||||||
8.125%, 05/20/19 | 8,860 | 10,646 | ||||
BAC Capital Trust VI | ||||||
5.625%, 03/08/35 | 2,700 | 1,909 | ||||
BAC Capital Trust XV | ||||||
1.161%, 06/01/56 (B) | 8,000 | 4,964 | ||||
Bank of America | ||||||
7.625%, 06/01/19 | 5,000 | 5,726 | ||||
6.500%, 09/15/37 | 2,700 | 2,710 | ||||
5.750%, 12/01/17 | 5,750 | 5,864 | ||||
5.650%, 05/01/18 | 19,650 | 19,804 | ||||
Bank of America, Ser A | ||||||
8.070%, 12/31/26 (A) | 5,095 | 4,764 | ||||
Bear Stearns | ||||||
7.250%, 02/01/18 | 8,768 | 10,140 | ||||
6.400%, 10/02/17 | 9,175 | 10,116 | ||||
Berkshire Hathaway Finance | ||||||
5.400%, 05/15/18 | 4,346 | 4,658 | ||||
BRE Properties | ||||||
5.500%, 03/15/17‡ | 750 | 710 | ||||
Capital One Capital VI | ||||||
8.875%, 05/15/40 | 4,000 | 3,975 | ||||
CDP Financial | ||||||
5.600%, 11/25/39 (A) | 9,760 | 10,093 | ||||
Cedar Brakes II LLC | ||||||
9.875%, 09/01/13 (A) | 1,204 | 1,232 | ||||
Chase Capital II | ||||||
0.781%, 02/01/27 (B) | 4,984 | 3,547 | ||||
Chubb | ||||||
6.500%, 05/15/38 | 7,300 | 8,537 | ||||
Citigroup | ||||||
8.500%, 05/22/19 | 7,600 | 8,583 | ||||
8.125%, 07/15/39 | 7,910 | 8,696 | ||||
6.875%, 03/05/38 | 13,090 | 12,685 | ||||
5.875%, 05/29/37 | 4,761 | 4,155 | ||||
Citigroup Capital XXI | ||||||
8.300%, 12/21/57 (B) | 2,515 | 2,238 | ||||
Commonwealth Bank of Australia | ||||||
5.000%, 10/15/19 (A) | 4,250 | 4,366 | ||||
Credit Suisse | ||||||
6.000%, 02/15/18 | 7,600 | 8,129 | ||||
5.300%, 08/13/19 | 6,250 | 6,549 | ||||
Deutsche Bank Capital Funding Trust | ||||||
5.628%, 01/19/49 (A) (B) | 3,195 | 2,348 | ||||
| Description | Face Amount ($ Thousands) | Market Value ($ Thousands) | ||||
Discover Bank | ||||||
8.700%, 11/18/19 | $ | 5,200 | $ | 5,480 | ||
ERP Operating | ||||||
5.750%, 06/15/17‡ | 6,250 | 6,405 | ||||
Farmers Exchange Capital | ||||||
7.050%, 07/15/28 (A) | 17,350 | 14,922 | ||||
First Union Institutional Capital I | ||||||
8.040%, 12/01/26 | 1,250 | 1,213 | ||||
FleetBoston Financial | ||||||
6.875%, 01/15/28 | 3,250 | 3,233 | ||||
General Electric Capital MTN | ||||||
6.875%, 01/10/39 | 28,745 | 30,143 | ||||
5.875%, 01/14/38 | 14,450 | 13,412 | ||||
Goldman Sachs Group | ||||||
7.500%, 02/15/19 | 8,290 | 9,790 | ||||
6.750%, 10/01/37 | 16,150 | 16,622 | ||||
6.150%, 04/01/18 | 1,400 | 1,511 | ||||
0.458%, 02/06/12 (B) | 5,000 | 4,945 | ||||
Guardian Life Insurance of America | ||||||
7.375%, 09/30/39 (A) | 10,135 | 10,298 | ||||
HBOS | ||||||
6.750%, 05/21/18 (A) | 3,700 | 3,441 | ||||
HCP MTN | ||||||
6.700%, 01/30/18‡ | 1,500 | 1,518 | ||||
6.300%, 09/15/16‡ | 2,255 | 2,270 | ||||
Health Care | ||||||
5.875%, 05/15/15‡ | 7,725 | 7,793 | ||||
HSBC Holdings | ||||||
6.500%, 09/15/37 | 8,275 | 8,807 | ||||
Iberdrola Finance Ireland | ||||||
5.000%, 09/11/19 (A) | 3,700 | 3,809 | ||||
JPMorgan Chase | ||||||
6.300%, 04/23/19 | 9,555 | 10,647 | ||||
6.000%, 01/15/18 | 4,000 | 4,336 | ||||
Lincoln National | ||||||
8.750%, 07/01/19 | 4,825 | 5,629 | ||||
6.300%, 10/09/37 | 175 | 165 | ||||
Lloyds Banking Group | ||||||
5.920%, 09/29/49 (A) (B) | 2,800 | 1,484 | ||||
Macquarie Group | ||||||
7.625%, 08/13/19 (A) | 6,380 | 7,034 | ||||
Massachusetts Mutual Life Insurance | ||||||
8.875%, 06/01/39 (A) | 16,445 | 20,150 | ||||
MBNA Capital, Ser B | ||||||
1.081%, 02/01/27 (B) | 2,151 | 1,422 | ||||
Merrill Lynch MTN | ||||||
8.950%, 05/18/17 (B) | 1,340 | 1,380 | ||||
8.680%, 05/02/17 (B) | 1,305 | 1,031 | ||||
MetLife | ||||||
7.717%, 02/15/19 | 8,100 | 9,713 | ||||
Metropolitan Life Insurance | ||||||
7.800%, 11/01/25 (A) | 4,700 | 5,152 | ||||
| 92 | SEI Institutional Investments Trust / Semi-Annual Report / November 30, 2009 |
Table of Contents
| Description | Face Amount ($ Thousands) | Market Value ($ Thousands) | ||||
Morgan Stanley | ||||||
7.300%, 05/13/19 | $ | 6,445 | $ | 7,265 | ||
6.625%, 04/01/18 | 10,760 | 11,674 | ||||
5.625%, 09/23/19 | 15,625 | 15,825 | ||||
Nationwide Mutual Insurance | ||||||
7.875%, 04/01/33 (A) | 1,643 | 1,486 | ||||
6.600%, 04/15/34 (A) | 12,040 | 9,348 | ||||
New York Life Insurance | ||||||
6.750%, 11/15/39 (A) | 16,800 | 16,974 | ||||
Pacific Life Insurance | ||||||
9.250%, 06/15/39 (A) | 8,245 | 9,415 | ||||
PNC Funding | ||||||
6.700%, 06/10/19 | 3,235 | 3,664 | ||||
Power Receivables Finance | ||||||
6.290%, 01/01/12 (A) | 810 | 822 | ||||
Prudential Holdings LLC | ||||||
8.695%, 12/18/23 (A) | 7,700 | 8,606 | ||||
Prudential Insurance of America | ||||||
8.300%, 07/01/25 (A) | 5,500 | 5,979 | ||||
Raymond James Financial | ||||||
8.600%, 08/15/19 | 1,655 | 1,837 | ||||
Security Benefit Life | ||||||
7.450%, 10/01/33 (A) | 4,000 | 880 | ||||
Sempra Energy ESOP & Trust | ||||||
5.781%, 11/01/14 (A) | 2,000 | 2,000 | ||||
Simon Property Group | ||||||
10.350%, 04/01/19‡ | 1,995 | 2,575 | ||||
6.125%, 05/30/18‡ | 1,965 | 2,074 | ||||
5.750%, 05/01/12‡ | 1,670 | 1,782 | ||||
Wachovia | ||||||
6.605%, 10/01/25 | 3,100 | 3,066 | ||||
0.621%, 10/28/15 (B) | 10,950 | 9,952 | ||||
Wachovia Bank | ||||||
6.600%, 01/15/38 | 9,400 | 10,024 | ||||
WEA Finance LLC | ||||||
7.125%, 04/15/18 (A) | 4,513 | 4,858 | ||||
6.750%, 09/02/19 (A) | 2,780 | 2,921 | ||||
Weingarten Realty Investors MTN | ||||||
8.250%, 01/22/10‡ | 4,075 | 4,083 | ||||
Wells Fargo | ||||||
7.980%, 03/15/18 (B) | 465 | 431 | ||||
Westpac Banking | ||||||
4.875%, 11/19/19 | 5,035 | 5,112 | ||||
ZFS Finance USA Trust I | ||||||
6.150%, 12/15/65 (A) (B) | 8,606 | 7,616 | ||||
| 538,165 | ||||||
Health Care — 6.1% | ||||||
Abbott Laboratories | ||||||
6.000%, 04/01/39 | 8,950 | 9,919 | ||||
Aetna | ||||||
6.750%, 12/15/37 | 3,400 | 3,554 | ||||
Amgen | ||||||
6.400%, 02/01/39 | 2,500 | 2,877 | ||||
| Description | Face Amount ($ Thousands) | Market Value ($ Thousands) | ||||
AstraZeneca | ||||||
6.450%, 09/15/37 | $ | 6,625 | $ | 7,737 | ||
Bristol-Myers Squibb | ||||||
6.125%, 05/01/38 | 6,775 | 7,558 | ||||
CIGNA | ||||||
8.500%, 05/01/19 | 5,825 | 6,671 | ||||
Eli Lilly | ||||||
5.950%, 11/15/37 | 3,000 | 3,320 | ||||
Johnson & Johnson | ||||||
5.850%, 07/15/38 | 7,150 | 8,069 | ||||
Merck | ||||||
5.850%, 06/30/39 | 7,370 | 8,113 | ||||
Novartis Securities Investment | ||||||
5.125%, 02/10/19 | 4,000 | 4,326 | ||||
Pfizer | ||||||
7.200%, 03/15/39 | 20,050 | 25,504 | ||||
Roche Holdings | ||||||
7.000%, 03/01/39 (A) | 13,150 | 16,546 | ||||
UnitedHealth Group | ||||||
6.875%, 02/15/38 | 3,260 | 3,487 | ||||
6.625%, 11/15/37 | 8,855 | 9,195 | ||||
6.500%, 06/15/37 | 4,100 | 4,179 | ||||
5.800%, 03/15/36 | 5,000 | 4,668 | ||||
WellPoint | ||||||
7.000%, 02/15/19 | 6,506 | 7,482 | ||||
| 133,205 | ||||||
Industrials — 3.3% | ||||||
American Airlines | ||||||
3.857%, 07/09/10 | 4,950 | 4,791 | ||||
American Airlines | ||||||
10.375%, 07/02/19 | 580 | 641 | ||||
Boeing | ||||||
6.875%, 03/15/39 | 5,400 | 6,456 | ||||
Burlington Northern Santa Fe | ||||||
5.650%, 05/01/17 | 2,830 | 3,100 | ||||
Canadian National Railway | ||||||
5.550%, 03/01/19 | 3,900 | 4,325 | ||||
Continental Airlines | ||||||
9.000%, 07/08/16 | 6,525 | 6,917 | ||||
5.983%, 04/19/22 | 7,175 | 6,816 | ||||
Delta Air Lines | ||||||
7.750%, 12/17/19 | 5,200 | 5,258 | ||||
Delta Air Lines, Ser 2001-1 | ||||||
7.111%, 09/18/11 | 6,700 | 6,633 | ||||
Lockheed Martin | ||||||
5.500%, 11/15/39 | 5,850 | 5,893 | ||||
Meccanica Holdings USA | ||||||
7.375%, 07/15/39 (A) | 3,570 | 4,114 | ||||
6.250%, 01/15/40 (A) | 2,040 | 2,059 | ||||
| SEI Institutional Investments Trust / Semi-Annual Report / November 30, 2009 | 93 |
Table of Contents
SCHEDULE OF INVESTMENTS (Unaudited)
Long Duration Fund (Continued)
November 30, 2009
| Description | Face Amount ($ Thousands) | Market Value ($ Thousands) | ||||
Norfolk Southern | ||||||
5.900%, 06/15/19 | $ | 4,395 | $ | 4,922 | ||
5.750%, 01/15/16 | 1,500 | 1,648 | ||||
Union Pacific | ||||||
6.625%, 02/01/29 | 1,941 | 2,181 | ||||
6.125%, 02/15/20 | 2,000 | 2,259 | ||||
Waste Management | ||||||
6.125%, 11/30/39 | 4,240 | 4,373 | ||||
| 72,386 | ||||||
Information Technology — 1.4% | ||||||
Cisco Systems | ||||||
5.900%, 02/15/39 | 2,450 | 2,566 | ||||
5.500%, 01/15/40 | 12,920 | 12,845 | ||||
Microsoft | ||||||
5.200%, 06/01/39 | 2,505 | 2,574 | ||||
Oracle | ||||||
6.125%, 07/08/39 | 11,710 | 12,809 | ||||
| 30,794 | ||||||
Materials — 0.9% | ||||||
Barrick Gold Finance | ||||||
5.800%, 11/15/34 | 2,160 | 2,119 | ||||
Barrick North America Finance LLC | ||||||
7.500%, 09/15/38 | 6,435 | 7,711 | ||||
Dow Chemical | ||||||
9.400%, 05/15/39 | 3,680 | 4,719 | ||||
8.550%, 05/15/19 | 3,580 | 4,231 | ||||
| 18,780 | ||||||
Telecommunication Services — 3.3% | ||||||
AT&T | ||||||
6.550%, 02/15/39 | 5,000 | 5,398 | ||||
6.300%, 01/15/38 | 15,000 | 15,586 | ||||
British Telecommunications | ||||||
9.625%, 12/15/30 | 3,170 | 4,058 | ||||
Telecom Italia Capital | ||||||
7.721%, 06/04/38 | 5,500 | 6,390 | ||||
7.175%, 06/18/19 | 5,375 | 6,091 | ||||
Telefonica Emisiones | ||||||
7.045%, 06/20/36 | 3,330 | 3,903 | ||||
5.877%, 07/15/19 | 2,850 | 3,130 | ||||
Verizon Communications | ||||||
8.950%, 03/01/39 | 2,650 | 3,630 | ||||
7.350%, 04/01/39 | 12,135 | 14,439 | ||||
6.400%, 02/15/38 | 4,750 | 5,112 | ||||
6.350%, 04/01/19 | 828 | 930 | ||||
Vodafone Group | ||||||
6.150%, 02/27/37 | 3,675 | 3,918 | ||||
| 72,585 | ||||||
| Description | Face Amount ($ Thousands) | Market Value ($ Thousands) | ||||
Utilities — 9.2% | ||||||
Alabama Power | ||||||
6.000%, 03/01/39 | $ | 1,850 | $ | 2,041 | ||
Appalachian Power | ||||||
7.950%, 01/15/20 | 4,160 | 5,124 | ||||
Arizona Public Service | ||||||
8.750%, 03/01/19 | 5,025 | 6,053 | ||||
Consolidated Edison of New York | ||||||
6.750%, 04/01/38 | 5,500 | 6,571 | ||||
6.650%, 04/01/19 | 2,310 | 2,704 | ||||
6.200%, 06/15/36 | 2,225 | 2,474 | ||||
Duke Energy Carolinas LLC | ||||||
6.100%, 06/01/37 | 5,000 | 5,537 | ||||
EDF | ||||||
6.950%, 01/26/39 (A) | 7,190 | 8,731 | ||||
Enel Finance International | ||||||
6.000%, 10/07/39 (A) | 8,035 | 8,238 | ||||
Entergy Gulf States | ||||||
0.761%, 12/01/09 (B) | 1,085 | 1,085 | ||||
Entergy Texas | ||||||
7.125%, 02/01/19 | 11,750 | 13,422 | ||||
Exelon Generation LLC | ||||||
6.250%, 10/01/39 | 4,480 | 4,679 | ||||
Florida Gas Transmission LLC | ||||||
7.900%, 05/15/19 (A) | 6,000 | 7,247 | ||||
Florida Power & Light | ||||||
5.960%, 04/01/39 | 3,225 | 3,555 | ||||
FPL Group Capital | ||||||
6.000%, 03/01/19 | 4,000 | 4,459 | ||||
Georgia Power | ||||||
5.950%, 02/01/39 | 3,850 | 4,219 | ||||
Kansas City Power & Light | ||||||
7.150%, 04/01/19 | 8,250 | 9,830 | ||||
KCP&L Greater Missouri Operations | ||||||
8.270%, 11/15/21 | 5,100 | 5,426 | ||||
Metropolitan Edison | ||||||
7.700%, 01/15/19 | 2,500 | 2,979 | ||||
Midamerican Energy Holdings | ||||||
6.500%, 09/15/37 | 15,600 | 17,565 | ||||
Nisource Finance | ||||||
10.750%, 03/15/16 | 5,575 | 6,744 | ||||
Northern States Power | ||||||
5.350%, 11/01/39 | 4,625 | 4,694 | ||||
Oncor Electric Delivery | ||||||
7.500%, 09/01/38 | 3,200 | 3,930 | ||||
6.800%, 09/01/18 | 6,680 | 7,609 | ||||
Pacific Gas & Electric | ||||||
6.250%, 03/01/39 | 4,500 | 5,023 | ||||
Power Contract Financing | ||||||
6.256%, 02/01/10 (A) | 365 | 367 | ||||
Progress Energy | ||||||
7.050%, 03/15/19 | 4,500 | 5,232 | ||||
Southern California Edison | ||||||
6.050%, 03/15/39 | 7,050 | 7,865 | ||||
| 94 | SEI Institutional Investments Trust / Semi-Annual Report / November 30, 2009 |
Table of Contents
| Description | Face Amount ($ Thousands) | Market Value ($ Thousands) | ||||
Southern Union | ||||||
8.250%, 11/15/29 | $ | 6,375 | $ | 7,262 | ||
Southwestern Electric Power | ||||||
6.450%, 01/15/19 | 6,000 | 6,607 | ||||
Texas-New Mexico Power | ||||||
9.500%, 04/01/19 (A) | 8,560 | 10,605 | ||||
Union Electric | ||||||
8.450%, 03/15/39 | 3,000 | 4,060 | ||||
Virginia Electric and Power | ||||||
8.875%, 11/15/38 | 5,500 | 7,859 | ||||
| 199,796 | ||||||
Total Corporate Obligations (Cost $1,245,924) ($ Thousands) | 1,380,769 | |||||
U.S. TREASURY OBLIGATIONS — 23.0% | ||||||
U.S. Treasury Bills | ||||||
0.130%, 12/03/09 (C) | 3,145 | 3,145 | ||||
0.046%, 02/18/10 (C) | 9,715 | 9,715 | ||||
U.S. Treasury Bonds | ||||||
6.250%, 08/15/23 | 104,485 | 132,370 | ||||
7.625%, 02/15/25 | 20,420 | 29,312 | ||||
4.250%, 05/15/39 | 144,639 | 145,746 | ||||
4.500%, 08/15/39 | 47,300 | 49,695 | ||||
U.S. Treasury Notes | ||||||
2.375%, 08/31/14 | 520 | 531 | ||||
U.S. Treasury STRIPS (C) | ||||||
4.202%, 11/15/21 | 200,965 | 126,491 | ||||
1.428%, 11/15/22 | 2,635 | 1,573 | ||||
4.218%, 02/15/23 | 5,135 | 3,023 | ||||
Total U.S. Treasury Obligations (Cost $482,799) ($ Thousands) | 501,601 | |||||
U.S. GOVERNMENT AGENCY OBLIGATIONS — 4.6% | ||||||
FHLB | ||||||
0.020%, 12/01/09 (C) (D) | 6,510 | 6,510 | ||||
0.060%, 02/19/10 (C) | 43,825 | 43,820 | ||||
FICO STRIPS, PO | ||||||
0.000%, 08/03/18 to 12/06/18 (C) | 25,100 | 17,774 | ||||
4.812%, 09/26/19 (C) | 12,145 | 8,036 | ||||
FNMA | ||||||
0.130%, 12/16/09 (C) | 7,430 | 7,430 | ||||
FNMA STRIPS, PO | ||||||
0.000%, 07/15/26 to 01/15/27 (C) | 25,418 | 11,022 | ||||
Resolution Funding STRIPS | ||||||
3.851%, 10/15/17 (C) | 6,675 | 5,029 | ||||
Total U.S. Government Agency Obligations (Cost $97,899) ($ Thousands) | 99,621 | |||||
MUNICIPAL BONDS — 1.3% | ||||||
Bay Area, Toll Authority, Build America Project, RB | ||||||
6.263%, 04/01/49 | 5,000 | 5,011 | ||||
| Description | Face Amount ($ Thousands) | Market Value ($ Thousands) | ||||
Los Angeles, Department of Water & Power, RB | ||||||
6.008%, 07/01/39 | $ | 5,000 | $ | 5,042 | ||
State of California, Build America Project, GO | ||||||
7.550%, 04/01/39 | 8,000 | 8,211 | ||||
7.300%, 10/01/39 | 1,500 | 1,495 | ||||
State of Illinois, GO | ||||||
5.100%, 06/01/33 | 8,925 | 8,059 | ||||
Total Municipal Bonds (Cost $26,828) ($ Thousands) | 27,818 | |||||
MORTGAGE-BACKED SECURITIES — 1.0% | ||||||
Agency Mortgage-Backed Obligations — 0.1% | ||||||
FHLMC CMO, Ser 2748, Cl ZT | ||||||
5.500%, 02/15/24 | 517 | 552 | ||||
FNMA CMO, Ser 2004-12, Cl ZX | ||||||
6.000%, 03/25/34 | 677 | 752 | ||||
FNMA CMO, Ser 2004-80, Cl XZ | ||||||
5.000%, 11/25/34 | 399 | 379 | ||||
GNMA ARM | ||||||
4.375%, 06/20/32 (B) | 199 | 205 | ||||
| 1,888 | ||||||
Non-Agency Mortgage-Backed Obligations — 0.9% | ||||||
American Home Mortgage Investment Trust, Ser 2007-2, Cl 11A1 | ||||||
0.466%, 03/25/47 (B) | 1,851 | 797 | ||||
Bayview Commercial Asset Trust, Ser 2007-3, Cl A1 | ||||||
0.476%, 07/25/37 (A) (B) | 2,249 | 1,347 | ||||
Commercial Mortgage Loan Trust, Ser 2008-LS1, Cl A4B | ||||||
6.220%, 12/10/49 (B) | 1,775 | 1,514 | ||||
Countrywide Alternative Loan Trust, Ser 2005-16, Cl A5 | ||||||
0.516%, 06/25/35 (B) | 465 | 129 | ||||
Countrywide Home Loans, Ser 2006-2, Cl 1A1 | ||||||
0.556%, 03/25/35 (B) | 224 | 98 | ||||
Credit Suisse Mortgage Capital Certificates, Ser 2006-C5, Cl A3 | ||||||
5.311%, 12/15/39 | 6,560 | 5,403 | ||||
DSLA Mortgage Loan Trust, Ser 2005-AR2, Cl 2A1A | ||||||
0.447%, 03/19/45 (B) | 336 | 176 | ||||
Greenwich Capital Commercial Funding, Ser 2005-GG5, Cl AM | ||||||
5.277%, 04/10/37 (B) | 1,960 | 1,693 | ||||
GS Mortgage Securities II, Ser 2006-GG8, Cl A4 | ||||||
5.560%, 11/10/39 | 9,115 | 7,864 | ||||
| SEI Institutional Investments Trust / Semi-Annual Report / November 30, 2009 | 95 |
Table of Contents
SCHEDULE OF INVESTMENTS (Unaudited)
Long Duration Fund (Concluded)
November 30, 2009
| Description | Face Amount ($ Thousands) | Market Value ($ Thousands) | ||||
Harborview Mortgage Loan Trust, Ser 2004-8, Cl 2A4A | ||||||
0.637%, 11/19/34 (B) | $ | 414 | $ | 258 | ||
Harborview Mortgage Loan Trust, Ser 2005-11, Cl 2A1A | ||||||
0.547%, 08/19/45 (B) | 586 | 297 | ||||
Indymac Index Mortgage Loan Trust, Ser 2004-AR12, Cl A1 | ||||||
0.626%, 12/25/34 (B) | 206 | 124 | ||||
Indymac Index Mortgage Loan Trust, Ser 2004-AR5, Cl 2A1B | ||||||
0.636%, 08/25/34 (B) | 128 | 72 | ||||
Indymac Index Mortgage Loan Trust, Ser 2004-AR7, Cl A2 | ||||||
0.666%, 09/25/34 (B) | 51 | 32 | ||||
Indymac Index Mortgage Loan Trust, Ser 2005-AR18, Cl 2A1A | ||||||
0.546%, 10/25/36 (B) | 25 | 13 | ||||
JPMorgan Chase Commercial Mortgage Securities, Ser 2006-LDP7, Cl A4 | ||||||
6.065%, 04/15/45 (B) | 535 | 509 | ||||
Washington Mutual Mortgage Pass Through Certificates, Ser 2000-1, Cl M2 | ||||||
1.536%, 01/25/40 (B) | 155 | 150 | ||||
Washington Mutual Mortgage Pass Through Certificates, Ser 2005-AR2, Cl 2A21 | ||||||
0.566%, 01/25/45 (B) | 326 | 182 | ||||
Washington Mutual Mortgage Pass Through Certificates, Ser 2007-OA3, Cl 4A1 | ||||||
1.402%, 04/25/47 (B) | 256 | 115 | ||||
| 20,773 | ||||||
Total Mortgage-Backed Securities (Cost $23,777) ($ Thousands) | 22,661 | |||||
ASSET-BACKED SECURITIES — 0.8% | ||||||
Mortgage Related Securities — 0.8% | ||||||
Bayview Financial Acquisition Trust, Ser 2004-B, Cl A1 | ||||||
1.234%, 05/28/39 (A) (B) | 4,821 | 2,351 | ||||
Bayview Financial Acquisition Trust, Ser 2005-A, Cl A1 | ||||||
1.234%, 02/28/40 (A) (B) | 5,701 | 3,876 | ||||
Bayview Financial Revolving Mortgage Loan Trust, Ser 2005-E, Cl A1 | ||||||
0.734%, 12/28/40 (A) (B) | 5,600 | 2,580 | ||||
Citigroup Mortgage Loan Trust, Ser 2006-AMC1, Cl A2B | ||||||
0.396%, 09/25/36 (B) | 10,231 | 4,684 | ||||
| Description | Face Amount ($ Thousands)/ Shares | Market Value ($ Thousands) | ||||
Home Equity Asset Trust, Ser 2007-3, Cl 2A2 | ||||||
0.416%, 08/25/37 (B) | $ | 2,300 | $ | 1,090 | ||
Indymac Home Equity Loan Asset-Backed Trust, Ser 2002-A, Cl M1 | ||||||
1.361%, 05/25/33 (B) | 502 | 236 | ||||
JPMorgan Mortgage Acquisition, Ser 2007-HE1, Cl AV1 | ||||||
0.296%, 03/25/47 (B) | 516 | 371 | ||||
Nationstar Home Equity Loan Trust, Ser 2006-B, Cl AV3 | ||||||
0.406%, 09/25/36 (B) | 2,565 | 1,508 | ||||
Total Asset-Backed Securities (Cost $23,993) ($ Thousands) | 16,696 | |||||
COMMERCIAL PAPER (C) — 1.6% | ||||||
BNP Paribas Finance | ||||||
0.140%, 12/23/09 | 18,335 | 18,333 | ||||
Rabobank USA Financial | ||||||
0.230%, 12/03/09 | 16,230 | 16,230 | ||||
Total Commercial Paper (Cost $34,563) ($ Thousands) | 34,563 | |||||
CASH EQUIVALENT — 3.4% | ||||||
SEI Daily Income Trust, | 73,764,047 | 73,764 | ||||
Total Cash Equivalent (Cost $73,764) ($ Thousands) | 73,764 | |||||
Total Investments — 99.1% (Cost $2,009,547) ($ Thousands) | $ | 2,157,493 | ||||
A summary of the open futures contracts held by the Fund at November 30, 2009, is as follows:
| Type of Contract | Number of Contracts Long (Short) | Expiration Date | Unrealized Appreciation (Depreciation) ($ Thousands) | ||||||
U.S. 10-Year Treasury Note | (14 | ) | Mar-2010 | $ | (25 | ) | |||
U.S. Long Treasury Bond | 2,873 | Mar-2010 | 5,910 | ||||||
| $ | 5,885 | ||||||||
For the year ended November 30, 2009, the total amount of all open futures contracts, as presented in the table above, are representative of the volume of activity for this derivative type during the period.
| 96 | SEI Institutional Investments Trust / Semi-Annual Report / November 30, 2009 |
Table of Contents
A summary of outstanding swap agreements held by the Fund at November 30, 2009, is as follows:
| Credit Default Swap | |||||||||||||||||
| Counterparty | Reference Entity/Obligation | Buy/Sell Protection | (Pays)/ Receives Rate | Termination Date | Notional Amount (Thousands) | Net Unrealized Depreciation ($ Thousands) | |||||||||||
| Credit Suisse | ABX.HE.AAA 07-1 Index | Sell | 0.09 | % | 08/25/37 | $ | (1,225 | ) | $ | (640 | ) | ||||||
Percentages are based on a Net Assets of $2,177,673 ($ Thousands)
| * | The rate reported is the 7-day effective yield as of November 30, 2009. |
| † | Investment in Affiliated Security (see Note 4). |
| ‡ | Real Estate Investment Trust |
| (A) | Securities sold within terms of a private placement memorandum, exempt from registration under Section 144A of the Securities Act of 1933, as amended, and may be sold only to dealers in that program or other “accredited investors.” These securities have been determined to be liquid under guidelines established by the Board of Trustees. |
| (B) | Variable Rate Security — The rate reported is the rate in effect as of November 30, 2009. The date reported is the final maturity date. |
| (C) | The rate reported is the effective yield at time of purchase. |
| (D) | Security, or a portion thereof, has been pledged as collateral on open futures contracts. |
ARM — Adjustable Rate Mortgage
Cl — Class
CMO — Collateralized Mortgage Obligation
FHLB — Federal Home Loan Bank
FHLMC — Federal Home Loan Mortgage Corporation
FICO — Financial Corporation
FNMA — Federal National Mortgage Association
GNMA — Government National Mortgage Association
GO — General Obligation
LLC — Limited Liability Company
MTN — Medium Term Note
NY — New York
PO — Principal Only
RB — Revenue Bond
REIT — Real Estate Investment Trust
Ser — Series
STRIPS — Separately Traded Registered Interest and Principal Securities
Amounts designated as ”—” are either $0 or have been rounded to $0.
The following is a summary of the inputs used as of November 30, 2009 in valuing the Fund’s investments carried at value ($ Thousands):
| Investments in Securities | Level 1 | Level 2 | Level 3 | Total | ||||||||
Corporate Obligations | $ | — | $ | 1,373,852 | $ | 6,917 | $ | 1,380,769 | ||||
U.S. Treasury Obligations | — | 501,601 | — | 501,601 | ||||||||
U.S. Government Agency Obligations | — | 99,621 | — | 99,621 | ||||||||
Municipal Bonds | — | 27,818 | — | 27,818 | ||||||||
Mortgage-Backed Securities | — | 22,661 | — | 22,661 | ||||||||
Asset-Backed Securities | — | 16,696 | — | 16,696 | ||||||||
Commercial Paper | — | 34,563 | — | 34,563 | ||||||||
Cash Equivalent | 73,764 | — | — | 73,764 | ||||||||
Total Investments in Securities | $ | 73,764 | $ | 2,076,812 | $ | 6,917 | $ | 2,157,493 | ||||
| Other Financial Instruments | Level 1 | Level 2 | Level 3 | Total | ||||||||||
Futures Contracts * | $ | 5,885 | $ | — | $ | — | $ | 5,885 | ||||||
Credit Default Swaps | — | (640 | ) | — | (640 | ) | ||||||||
Total Other Financial Instruments | $ | 5,885 | $ | (640 | ) | $ | — | $ | 5,245 | |||||
The following is a reconciliation of investments in which significant unobservable inputs (Level 3) were used in determining value ($ Thousands):
| Investments in Corporate Obligations | |||
Beginning balance as of June 1, 2009 | $ | — | |
Accrued discounts/premiums | — | ||
Realized gain/(loss) | — | ||
Change in unrealized appreciation/(depreciation) | — | ||
Net purchases/sales | — | ||
Net transfer in and/or out of Level 3 | 6,917 | ||
Ending balance as of November 30, 2009 | $ | 6,917 | |
Changes in unrealized gains/(losses) included in earnings related to securities still held at reporting date | $ | — | |
| * | Futures contracts are valued at the unrealized appreciation on the instrument. |
For more information on valuation inputs, see Note 2 — Significant Accounting Policies in Notes to Financial Statements.
The accompanying notes are an integral part of the financial statements.
| SEI Institutional Investments Trust / Semi-Annual Report / November 30, 2009 | 97 |
Table of Contents
SCHEDULE OF INVESTMENTS (Unaudited)
Emerging Markets Debt Fund
November 30, 2009
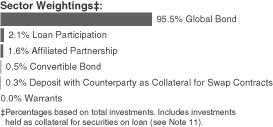
| Description | Face Amount (Thousands) (1) | Market Value ($ Thousands) | |||||
GLOBAL BONDS — 93.8% | |||||||
Argentina — 5.3% | |||||||
Alto Parana | |||||||
6.375%, 06/09/17 (A) | 370 | $ | 384 | ||||
Province Del Neuquen | |||||||
8.656%, 10/18/14 (A) | 170 | 173 | |||||
Province of Buenos Aires | |||||||
9.625%, 04/18/28 | 1,335 | 868 | |||||
9.625%, 04/18/28 (A) | 1,460 | 949 | |||||
9.375%, 09/14/18 | 1,440 | 989 | |||||
3.000%, 05/15/35 (B) | 1,100 | 377 | |||||
Province of Mendoza | |||||||
5.500%, 09/04/18 | 321 | 228 | |||||
Republic of Argentina | |||||||
15.500%, 12/19/49 (C) | 9,900 | 4,227 | |||||
10.500%, 11/14/02 (C) | 400 | 116 | |||||
10.250%, 02/06/03 (C) | 1,400 | 435 | |||||
10.250%, 01/26/07 (C) | EUR | 850 | 518 | ||||
9.000%, 11/19/08 (C) | 1,000 | 289 | |||||
9.000%, 05/26/09 (C) | EUR | 1,595 | 873 | ||||
8.500%, 07/01/04 (C) | EUR | 4,500 | 2,618 | ||||
8.500%, 02/23/05 (C) | 245 | 75 | |||||
8.375%, 12/20/03 | 1,000 | 430 | |||||
8.280%, 12/31/33 | 7,669 | 5,292 | |||||
8.125%, 04/21/08 (C) | EUR | 2,818 | 1,544 | ||||
7.875%, 07/29/05 (C) | 275 | 81 | |||||
7.000%, 09/12/13 | 790 | 654 | |||||
7.000%, 03/18/04 (C) | 555 | 167 | |||||
7.000%, 10/03/15 | 16,425 | 12,521 | |||||
6.000%, 03/31/23 (C) | 172 | 109 | |||||
3.169%, 12/15/35 (C) | 2,905 | 240 | |||||
2.500%, 03/31/19 (D) | 11,320 | 3,821 | |||||
2.280%, 12/15/35 (C) | 11,725 | 967 | |||||
0.000%, 03/31/23 (C) | 1,680 | 924 | |||||
0.000%, 08/03/12 (C) | 22,565 | 6,781 | |||||
Republic of Argentina, Ser E MTN | |||||||
10.000%, 01/07/05 (C) | EUR | 1,650 | 1,009 | ||||
9.250%, 07/20/04 (C) | EUR | 2,100 | 1,222 | ||||
7.000%, 03/18/04 (C) | EUR | 2,554 | 1,396 | ||||
Transportadora Gas Norte | |||||||
7.500%, 12/31/12 (A) (C) | 210 | 88 | |||||
7.500%, 12/31/12 (C) | 450 | 189 | |||||
6.500%, 12/31/12 (A) (C) | 30 | 13 | |||||
6.500%, 12/31/12 (C) | 120 | 50 | |||||
| 50,617 | |||||||
| Description | Face Amount (Thousands) (1) | Market Value ($ Thousands) | |||||
Barbados — 0.2% | |||||||
Columbus International | |||||||
11.500%, 11/20/14 (A) | 1,900 | $ | 1,945 | ||||
Belize — 0.0% | |||||||
Government of Belize | |||||||
4.250%, 02/20/29 (B) | 330 | 181 | |||||
Bosnia and Herzegovina — 0.1% | |||||||
Republic of Bosnia & Herzegovina | |||||||
10.039%, 12/11/17 (E) | EUR | 2,000 | 1,075 | ||||
Brazil — 9.2% | |||||||
Banco Bradesco | |||||||
6.750%, 09/29/19 (A) | 181 | 187 | |||||
Banco Nacional de Desenvolvimento Economico e Social | |||||||
6.500%, 06/10/19 (A) | 3,055 | 3,269 | |||||
Brazil Notas do Tesouro Nacional, Ser F | |||||||
10.000%, 01/01/17 | BRL | 38,775 | 19,982 | ||||
Federal Republic of Brazil | |||||||
12.250%, 03/06/30 | 195 | 344 | |||||
11.000%, 08/17/40 (F) | 13,805 | 18,795 | |||||
10.125%, 05/15/27 | 4,060 | 6,049 | |||||
8.875%, 04/15/24 | 3,860 | 5,095 | |||||
8.750%, 02/04/25 | 4,838 | 6,350 | |||||
8.250%, 01/20/34 | 6,595 | 8,630 | |||||
8.000%, 01/15/18 | 1,983 | 2,315 | |||||
7.875%, 03/07/15 | 900 | 1,069 | |||||
7.125%, 01/20/37 | 5,225 | 6,184 | |||||
6.000%, 01/17/17 | 4,340 | 4,757 | |||||
5.875%, 01/15/19 | 1,550 | 1,699 | |||||
Fibria Overseas Finance | |||||||
9.250%, 10/30/19 (A) | 1,040 | 1,139 | |||||
Petrobras International Finance | |||||||
7.875%, 03/15/19 | 740 | 864 | |||||
Voto-Votorantim Overseas Trading Operations | |||||||
6.625%, 09/25/19 (A) | 600 | 591 | |||||
| 87,319 | |||||||
Chile — 0.2% | |||||||
Empresa Nacional del Petroleo | |||||||
6.250%, 07/08/19 (A) | 1,300 | 1,386 | |||||
Nacional del Cobre de Chile - CODELCO | |||||||
7.500%, 01/15/19 | 450 | 548 | |||||
| 1,934 | |||||||
Colombia — 4.5% | |||||||
Bogota District Capital | |||||||
9.750%, 07/26/28 (A) | COP | 12,895,000 | 6,787 | ||||
| 98 | SEI Institutional Investments Trust / Semi-Annual Report / November 30, 2009 |
Table of Contents
| Description | Face Amount (Thousands) (1) | Market Value ($ Thousands) | |||||
Ecopetrol | |||||||
7.625%, 07/23/19 (A) | 750 | $ | 847 | ||||
Republic of Colombia | |||||||
11.750%, 02/25/20 | 2,758 | 4,027 | |||||
10.375%, 01/28/33 | 450 | 675 | |||||
9.850%, 06/28/27 | COP | 1,573,000 | 938 | ||||
8.375%, 02/15/27 | 3,100 | 3,503 | |||||
8.125%, 05/21/24 | 3,180 | 3,856 | |||||
7.375%, 09/18/37 | 8,395 | 9,591 | |||||
7.375%, 01/27/17 | 5,185 | 6,035 | |||||
7.375%, 03/18/19 | 4,540 | 5,294 | |||||
6.125%, 01/18/41 | 1,175 | 1,145 | |||||
| 42,698 | |||||||
Croatia — 0.3% | |||||||
Republic of Croatia | |||||||
6.750%, 11/05/19 (A) | 1,035 | 1,116 | |||||
Zagrebacki Holding D.O.O. | |||||||
5.500%, 07/10/17 | 1,500 | 1,791 | |||||
| 2,907 | |||||||
Czech Republic — 0.1% | |||||||
Central European Media Enterprises | |||||||
11.625%, 09/15/16 (A) | 600 | 833 | |||||
Dominican Republic — 0.0% | |||||||
Republic of Dominican Republic | |||||||
9.040%, 01/23/18 | 27 | 30 | |||||
Ecuador — 0.2% | |||||||
Republic of Ecuador | |||||||
9.375%, 12/15/15 | 1,550 | 1,465 | |||||
El Salvador — 1.0% | |||||||
Republic of El Salvador | |||||||
8.250%, 04/10/32 | 3,710 | 3,858 | |||||
7.650%, 06/15/35 | 5,139 | 5,113 | |||||
7.375%, 12/01/19 (A) | 500 | 514 | |||||
| 9,485 | |||||||
Gabon — 0.2% | |||||||
Gabonese Republic | |||||||
8.200%, 12/12/17 (A) | 2,100 | 2,137 | |||||
Georgia — 0.6% | |||||||
BG Finance for JSC Bank of Georgia | |||||||
9.000%, 02/08/12 | 2,500 | 2,406 | |||||
Republic of Georgia | |||||||
7.500%, 04/15/13 | 3,350 | 3,384 | |||||
| 5,790 | |||||||
| Description | Face Amount (Thousands) (1) | Market Value ($ Thousands) | |||||
Ghana — 0.2% | |||||||
Republic of Ghana | |||||||
8.500%, 10/04/17 (A) | 600 | $ | 594 | ||||
8.500%, 10/04/17 | 1,250 | 1,255 | |||||
| 1,849 | |||||||
India — 0.2% | |||||||
Vedanta Resources | |||||||
9.500%, 07/18/18 (A) | 2,295 | 2,278 | |||||
Indonesia — 7.7% | |||||||
Adaro Indonesia | |||||||
7.625%, 10/22/19 | 1,455 | 1,422 | |||||
Majapahit Holding | |||||||
8.000%, 08/07/19 (A) | 1,415 | 1,450 | |||||
7.875%, 06/29/37 (A) | 415 | 392 | |||||
7.750%, 10/17/16 | 200 | 210 | |||||
7.750%, 10/17/16 (A) | 1,200 | 1,239 | |||||
7.750%, 01/20/20 (A) | 1,845 | 1,861 | |||||
7.250%, 10/17/11 (A) | 885 | 916 | |||||
Republic of Indonesia | |||||||
12.800%, 06/17/21 (C) | IDR | 46,100,000 | 5,676 | ||||
11.625%, 03/04/19 (A) | 7,710 | 10,852 | |||||
11.625%, 03/04/19 | 900 | 1,263 | |||||
11.000%, 11/15/20 | IDR | 17,100,000 | 1,895 | ||||
10.375%, 05/04/14 (A) | 300 | 363 | |||||
10.375%, 05/04/14 | 400 | 483 | |||||
8.500%, 10/12/35 | 4,812 | 5,654 | |||||
7.750%, 01/17/38 | 20,945 | 22,568 | |||||
7.500%, 01/15/16 | 2,940 | 3,277 | |||||
7.250%, 04/20/15 | 3,340 | 3,659 | |||||
6.875%, 01/17/18 | 4,130 | 4,399 | |||||
6.750%, 03/10/14 (A) | 500 | 538 | |||||
6.750%, 03/10/14 | 1,900 | 2,044 | |||||
6.625%, 02/17/37 (A) | 225 | 217 | |||||
6.625%, 02/17/37 | 2,600 | 2,510 | |||||
| 72,888 | |||||||
Iraq — 1.0% | |||||||
Republic of Iraq | |||||||
5.800%, 01/15/28 | 13,165 | 9,742 | |||||
Ivory Coast — 0.1% | |||||||
Republic of Ivory Coast | |||||||
4.000%, 03/30/18 (C) | 7,000 | 593 | |||||
Jamaica — 0.0% | |||||||
Digicel Group | |||||||
8.875%, 01/15/15 (A) | 450 | 436 | |||||
| SEI Institutional Investments Trust / Semi-Annual Report / November 30, 2009 | 99 |
Table of Contents
SCHEDULE OF INVESTMENTS (Unaudited)
Emerging Markets Debt Fund (Continued)
November 30, 2009
| Description | Face Amount (Thousands) (1) | Market Value ($ Thousands) | |||
Kazakhstan — 3.3% | |||||
CenterCredit International | |||||
8.625%, 01/30/14 | 2,250 | $ | 2,027 | ||
Citigroup Global Markets for JSC Kazkommertsbank | |||||
7.375%, 04/07/14 (C) | 2,000 | 1,520 | |||
Halyk Savings Bank of Kazakhstan | |||||
9.250%, 10/16/13 | 875 | 860 | |||
7.750%, 05/13/13 | 100 | 95 | |||
HSBK Europe | |||||
9.250%, 10/16/13 (A) | 800 | 788 | |||
7.250%, 05/03/17 | 650 | 566 | |||
Kazkommerts International | |||||
8.500%, 04/16/13 | 850 | 748 | |||
8.000%, 11/03/15 | 2,400 | 1,944 | |||
7.875%, 04/07/14 | 500 | 426 | |||
7.500%, 11/29/16 | 3,050 | 2,409 | |||
6.875%, 02/13/17 | 600 | 676 | |||
KazMunaiGaz Finance MTN | |||||
11.750%, 01/23/15 (A) | 3,210 | 3,812 | |||
9.125%, 07/02/18 | 4,400 | 4,818 | |||
9.125%, 07/02/18 (A) | 4,425 | 4,845 | |||
8.375%, 07/02/13 | 5,085 | 5,365 | |||
Tengizchevroil Finance | |||||
6.124%, 11/15/14 | 457 | 454 | |||
| 31,353 | |||||
Lebanon — 0.1% | |||||
Lebanese Republic MTN | |||||
8.250%, 04/12/21 | 460 | 500 | |||
Lithuania — 0.2% | |||||
Republic of Lithuania | |||||
6.750%, 01/15/15 (A) | 1,405 | 1,411 | |||
Malaysia — 2.9% | |||||
Malaysia Government | |||||
4.378%, 11/29/19 | 12,720 | 3,782 | |||
Petroliam Nasional | |||||
7.750%, 08/15/15 | 1,460 | 1,740 | |||
7.625%, 10/15/26 | 430 | 529 | |||
Petronas Capital | |||||
7.875%, 05/22/22 | 4,930 | 6,139 | |||
7.875%, 05/22/22 (A) | 650 | 815 | |||
7.000%, 05/22/12 | 3,055 | 3,374 | |||
5.250%, 08/12/19 (A) | 10,865 | 11,137 | |||
| 27,516 | |||||
Mexico — 8.4% | |||||
C10 - EUR Capital | |||||
6.277%, 05/09/49 (C) | 1,800 | 1,784 | |||
Grupo Senda | |||||
10.500%, 10/03/15 | 4,590 | 3,741 | |||
| Description | Face Amount (Thousands) (1) | Market Value ($ Thousands) | |||
Mexican Bonos | |||||
8.500%, 05/31/29 | 44,160 | $ | 3,458 | ||
7.500%, 06/03/27 | 50,230 | 3,606 | |||
NII Capital | |||||
10.000%, 08/15/16 | 4,900 | 5,004 | |||
Oceanografia | |||||
11.250%, 07/15/15 | 1,286 | 693 | |||
Pemex Project Funding Master Trust | |||||
6.625%, 06/15/35 | 400 | 402 | |||
5.750%, 03/01/18 | 1,670 | 1,699 | |||
Petroleos Mexicanos | |||||
8.000%, 05/03/19 (A) | 465 | 546 | |||
United Mexican States | |||||
11.375%, 09/15/16 (F) | 540 | 756 | |||
8.300%, 08/15/31 | 13,160 | 16,976 | |||
8.125%, 12/30/19 (F) | 1,595 | 1,994 | |||
7.500%, 04/08/33 | 1,430 | 1,716 | |||
6.625%, 03/03/15 | 3,650 | 4,106 | |||
6.050%, 01/11/40 | 8,942 | 9,143 | |||
5.950%, 03/19/19 (F) | 8,832 | 9,574 | |||
5.875%, 02/17/14 | 1,000 | 1,088 | |||
5.625%, 01/15/17 | 4,950 | 5,287 | |||
United Mexican States, Ser A MTN | |||||
6.750%, 09/27/34 | 7,793 | 8,650 | |||
| 80,223 | |||||
Nigeria — 0.2% | |||||
GTB Finance | |||||
8.500%, 01/29/12 | 1,000 | 977 | |||
UBS | |||||
0.000%, 09/04/17 (A) (C) | 800 | 746 | |||
| 1,723 | |||||
Oman — 0.1% | |||||
Blue City Investments | |||||
13.750%, 11/07/13 | 2,750 | 550 | |||
4.074%, 11/07/13 (C) | 500 | 125 | |||
| 675 | |||||
Pakistan — 0.6% | |||||
Pakistan Mobile Communications | |||||
8.625%, 11/13/13 (A) | 330 | 281 | |||
Republic of Pakistan | |||||
7.125%, 03/31/16 | 3,650 | 3,396 | |||
6.875%, 06/01/17 | 2,850 | 2,394 | |||
| 6,071 | |||||
Panama — 2.3% | |||||
Republic of Panama | |||||
9.375%, 01/16/23 | 595 | 789 | |||
9.375%, 04/01/29 | 7,690 | 10,843 | |||
8.875%, 09/30/27 | 3,000 | 3,945 | |||
8.125%, 04/28/34 | 940 | 1,194 | |||
| 100 | SEI Institutional Investments Trust / Semi-Annual Report / November 30, 2009 |
Table of Contents
| Description | Face Amount (Thousands) (1) | Market Value ($ Thousands) | |||
7.250%, 03/15/15 | 2,940 | $ | 3,363 | ||
6.700%, 01/26/36 | 1,750 | 1,916 | |||
| 22,050 | |||||
Peru — 3.0% | |||||
Interoceanica IV Finance | |||||
3.959%, 11/30/25 (A) (E) | 762 | 360 | |||
3.952%, 11/30/18 (A) (E) | 370 | 276 | |||
3.280%, 11/30/18 | 700 | 522 | |||
Peru Enhanced Pass-Through Finance | |||||
7.062%, 06/02/25 (A) (E) | 500 | 215 | |||
4.359%, 05/31/18 (A) (E) | 1,367 | 1,070 | |||
4.090%, 05/31/18 (E) | 856 | 669 | |||
Republic of Peru | |||||
8.750%, 11/21/33 | 1,680 | 2,268 | |||
8.375%, 05/03/16 | 2,425 | 2,971 | |||
7.350%, 07/21/25 | 13,120 | 15,514 | |||
6.550%, 03/14/37 (F) | 4,585 | 4,917 | |||
| 28,782 | |||||
Philippines — 5.4% | |||||
National Power | |||||
9.625%, 05/15/28 | 1,100 | 1,326 | |||
Power Sector | |||||
7.390%, 12/02/24 | 1,465 | 1,466 | |||
7.250%, 05/27/19 | 760 | 796 | |||
Republic of Philippines | |||||
10.625%, 03/16/25 | 4,661 | 6,537 | |||
9.500%, 10/21/24 | 200 | 258 | |||
9.500%, 02/02/30 | 3,530 | 4,677 | |||
9.375%, 01/18/17 | 10,040 | 12,450 | |||
8.875%, 03/17/15 | 500 | 597 | |||
8.375%, 06/17/19 | 650 | 785 | |||
8.250%, 01/15/14 | 2,575 | 2,948 | |||
8.000%, 01/15/16 | 5,300 | 6,135 | |||
7.750%, 01/14/31 | 3,624 | 4,068 | |||
7.500%, 09/25/24 | 8,164 | 9,082 | |||
6.375%, 10/23/34 | 610 | 592 | |||
| 51,717 | |||||
Poland — 1.8% | |||||
Republic of Poland | |||||
6.375%, 07/15/19 | 14,405 | 16,023 | |||
TVN Finance | |||||
10.750%, 11/15/17 (A) | 1,000 | 1,503 | |||
| 17,526 | |||||
Qatar — 1.3% | |||||
Qtel International Finance | |||||
7.875%, 06/10/19 | 3,050 | 3,417 | |||
6.500%, 06/10/14 (A) | 750 | 811 | |||
State of Qatar | |||||
9.750%, 06/15/30 | 535 | 773 | |||
| Description | Face Amount (Thousands) (1) | Market Value ($ Thousands) | |||
6.400%, 01/20/40 (A) | 705 | $ | 719 | ||
5.250%, 01/20/20 (A) | 6,740 | 6,791 | |||
| 12,511 | |||||
Russia — 10.6% | |||||
ABN Amro Bank | |||||
9.625%, 03/01/13 | 700 | 774 | |||
Alfa Dividend Payment Rights | |||||
2.199%, 12/15/11 (A) (C) | 212 | 182 | |||
Alfa Invest MTN | |||||
9.250%, 06/24/13 (A) | 1,200 | 1,206 | |||
Gaz Capital MTN | |||||
8.625%, 04/28/34 | 1,200 | 1,323 | |||
6.510%, 03/07/22 | 220 | 201 | |||
6.212%, 11/22/16 | 600 | 576 | |||
Kuznetski (Bank of Moscow) | |||||
7.500%, 11/25/15 (C) | 1,300 | 1,258 | |||
RSHB Capital for Russian Agricultural Bank MTN | |||||
9.000%, 06/11/14 (A) | 1,300 | 1,455 | |||
7.750%, 05/29/18 | 1,250 | 1,353 | |||
6.299%, 05/15/17 | 400 | 395 | |||
Russian Federation | |||||
12.750%, 06/24/28 | 5,670 | 9,696 | |||
7.500%, 03/31/30 (B) | 57,956 | 65,351 | |||
Teorema Holding | |||||
11.000%, 10/27/09 (G) | 2,000 | 100 | |||
TransCapital (Transneft) | |||||
8.700%, 08/07/18 (A) | 1,065 | 1,205 | |||
7.700%, 08/07/13 (A) | 150 | 160 | |||
UBS (Vimpelcom) | |||||
8.250%, 05/23/16 | 190 | 192 | |||
VIP Finance Ireland for Vimpel Communications | |||||
9.125%, 04/30/18 (A) | 1,160 | 1,218 | |||
9.125%, 04/30/18 | 1,200 | 1,266 | |||
8.375%, 04/30/13 (A) | 1,265 | 1,312 | |||
VTB Capital | |||||
6.875%, 05/29/18 | 7,800 | 7,790 | |||
6.609%, 10/31/12 (A) | 3,500 | 3,570 | |||
| 100,583 | |||||
Singapore — 0.6% | |||||
Sea Production | |||||
4.700%, 02/14/12 | 8,800 | 6,160 | |||
South Africa — 1.5% | |||||
Edcon Proprietary | |||||
4.527%, 06/15/14 (C) | 2,350 | 2,205 | |||
PE Paper Escrow | |||||
12.000%, 08/01/14 | 900 | 985 | |||
Republic of South Africa | |||||
8.500%, 06/23/17 | 815 | 994 | |||
| SEI Institutional Investments Trust / Semi-Annual Report / November 30, 2009 | 101 |
Table of Contents
SCHEDULE OF INVESTMENTS (Unaudited)
Emerging Markets Debt Fund (Continued)
November 30, 2009
| Description | Face Amount (Thousands) (1) | Market Value ($ Thousands) | |||
6.875%, 05/27/19 | 2,995 | $ | 3,336 | ||
6.500%, 06/02/14 | 3,755 | 4,112 | |||
5.875%, 05/30/22 | 2,845 | 2,881 | |||
| 14,513 | |||||
South Korea — 0.7% | |||||
Export-Import Bank of Korea | |||||
8.125%, 01/21/14 | 2,105 | 2,459 | |||
5.875%, 01/14/15 | 1,125 | 1,221 | |||
Korea Development Bank | |||||
8.000%, 01/23/14 | 1,200 | 1,396 | |||
Korea Hydro & Nuclear Power | |||||
6.250%, 06/17/14 | 1,100 | 1,199 | |||
| 6,275 | |||||
Sri Lanka — 0.1% | |||||
Democratic Socialist Republic of | |||||
7.400%, 01/22/15 (A) | 500 | 512 | |||
Supra-National — 0.1% | |||||
Andina de Fomento | |||||
8.125%, 06/04/19 | 565 | 667 | |||
Central American Bank for Economic Integration | |||||
5.375%, 09/24/14 (A) | 350 | 360 | |||
Eurasian Development Bank MTN | |||||
7.375%, 09/29/14 (A) | 350 | 363 | |||
| 1,390 | |||||
Thailand — 0.2% | |||||
True Move | |||||
10.750%, 12/16/13 (A) | 850 | 812 | |||
10.375%, 08/01/14 (A) | 850 | 773 | |||
| 1,585 | |||||
Trinidad & Tobago — 0.5% | |||||
Petroleum of Trinidad & Tobago | |||||
9.750%, 08/14/19 (A) | 653 | 736 | |||
6.000%, 05/08/22 | 3,225 | 3,008 | |||
6.000%, 05/08/22 (A) | 900 | 839 | |||
| 4,583 | |||||
Tunisia — 0.2% | |||||
Banque Centrale de Tunisie | |||||
7.375%, 04/25/12 | 1,810 | 1,982 | |||
Turkey — 5.6% | |||||
GLOBUS CAPITAL FINANCE | |||||
8.500%, 03/05/12 | 700 | 588 | |||
Republic of Turkey | |||||
11.875%, 01/15/30 | 625 | 1,006 | |||
9.500%, 01/15/14 | 700 | 834 | |||
| Description | Face Amount (Thousands) (1) | Market Value ($ Thousands) | |||||
8.000%, 02/14/34 | 2,250 | $ | 2,599 | ||||
7.500%, 11/07/19 | 2,585 | 2,940 | |||||
7.500%, 07/14/17 | 4,870 | 5,540 | |||||
7.375%, 02/05/25 | 7,025 | 7,855 | |||||
7.250%, 03/15/15 | 4,375 | 4,894 | |||||
7.250%, 03/05/38 (F) | 5,345 | 5,666 | |||||
7.000%, 06/05/20 | 250 | 272 | |||||
7.000%, 03/11/19 | 2,050 | 2,255 | |||||
7.000%, 09/26/16 | 3,185 | 3,535 | |||||
6.875%, 03/17/36 (F) | 7,805 | 7,942 | |||||
6.750%, 04/03/18 | 6,530 | 7,085 | |||||
| 53,011 | |||||||
Ukraine — 2.6% | |||||||
Credit Suisse First Boston for City of Kiev | |||||||
8.000%, 11/06/15 | 750 | 471 | |||||
Credit Suisse First Boston International (Export/Import - Ukraine) | |||||||
7.650%, 09/07/11 | 500 | 420 | |||||
6.800%, 10/04/12 | 550 | 429 | |||||
Credit Suisse First Boston International (Ukrsotsbank) | |||||||
8.000%, 02/22/10 | 2,200 | 2,167 | |||||
Government of Ukraine | |||||||
7.650%, 06/11/13 | 3,340 | 2,748 | |||||
6.875%, 03/04/11 | 500 | 443 | |||||
6.875%, 03/04/11 (A) | 960 | 847 | |||||
6.750%, 11/14/17 | 800 | 586 | |||||
6.580%, 11/21/16 | 4,460 | 3,279 | |||||
6.385%, 06/26/12 | 680 | 559 | |||||
3.200%, 12/19/10 | 660,000 | 6,397 | |||||
MHP | |||||||
10.250%, 11/30/11 | 1,850 | 1,703 | |||||
NAK Naftogaz Ukraine | |||||||
9.500%, 09/30/14 | 3,600 | 2,791 | |||||
Springvale Holdings | |||||||
9.181%, 09/07/09 (C) (H) | 1,000 | 150 | |||||
UK Private Bank | |||||||
8.000%, 02/06/12 | 3,000 | 2,250 | |||||
| 25,240 | |||||||
United Arab Emirates — 1.9% | |||||||
Dolphin Energy | |||||||
5.888%, 06/15/19 (A) | 450 | 441 | |||||
5.888%, 06/15/19 | 1,400 | 1,372 | |||||
Dubai Holding Commercial | |||||||
4.750%, 01/30/14 | 1,850 | 1,639 | |||||
Emirate of Abu Dhabi | |||||||
6.750%, 04/08/19 (A) | 1,420 | 1,563 | |||||
Jafz Sukuk | |||||||
4.169%, 11/27/12 (C) | AED | 33,500 | 5,471 | ||||
| 102 | SEI Institutional Investments Trust / Semi-Annual Report / November 30, 2009 |
Table of Contents
| Description | Face Amount (Thousands) (1) | Market Value ($ Thousands) | |||||
MDC-GMTN | |||||||
7.625%, 05/06/19 | 800 | $ | 885 | ||||
Nakheel Development | |||||||
3.173%, 12/14/09 (C) | 11,150 | 6,355 | |||||
Nakheel Development 2 | |||||||
2.750%, 01/16/11 | 1,350 | 783 | |||||
| 18,509 | |||||||
Uruguay — 3.1% | |||||||
Republic of Uruguay | |||||||
9.250%, 05/17/17 | 5,820 | 7,275 | |||||
8.000%, 11/18/22 | 12,147 | 14,151 | |||||
7.625%, 03/21/36 | 2,086 | 2,305 | |||||
6.875%, 09/28/25 | 761 | 820 | |||||
Republic of Uruguay PIK | |||||||
7.875%, 01/15/33 | 4,220 | 4,768 | |||||
| 29,319 | |||||||
Venezuela — 5.1% | |||||||
Government of Venezuela | |||||||
13.625%, 08/15/18 | 305 | 282 | |||||
10.750%, 09/19/13 | 300 | 276 | |||||
9.375%, 01/13/34 | 2,370 | 1,606 | |||||
9.250%, 09/15/27 | 2,425 | 1,786 | |||||
9.250%, 05/07/28 | 5,850 | 3,963 | |||||
9.000%, 05/07/23 | 5,245 | 3,514 | |||||
8.500%, 10/08/14 | 5,275 | 4,154 | |||||
7.650%, 04/21/25 | 4,150 | 2,324 | |||||
7.000%, 03/31/38 | 200 | 107 | |||||
6.000%, 12/09/20 | 2,400 | 1,248 | |||||
5.750%, 02/26/16 | 4,850 | 3,007 | |||||
1.283%, 04/20/11 (C) | 25,825 | 22,468 | |||||
Petroleos de Venezuela | |||||||
5.375%, 04/12/27 | 3,105 | 1,304 | |||||
5.250%, 04/12/17 | 4,265 | 2,218 | |||||
| 48,257 | |||||||
Vietnam — 0.2% | |||||||
Socialist Republic of Vietnam | |||||||
6.875%, 01/15/16 | 2,035 | 2,082 | |||||
Yemen — 0.1% | |||||||
Pemberley SPV Finance 2008 Yemen MTN | |||||||
11.500%, 02/19/14 (H) | 1,100 | 638 | |||||
0.000%, 02/25/20 (C) (G) | 1,100 | — | |||||
| 638 | |||||||
Total Global Bonds | 892,899 | ||||||
LOAN PARTICIPATIONS (G) (H) — 2.0% | |||||||
Angola — 0.2% | |||||||
Republic of Angola | |||||||
3.472%, 04/30/16 | 1,300 | 1,574 | |||||
| Description | Face Amount (Thousands) (1)/ Shares | Market Value ($ Thousands) | |||||
Cambodia — 0.3% | |||||||
CAMGSM PIK | |||||||
12.756%, 05/25/11 | 2,550 | $ | 2,550 | ||||
Georgia — 0.0% | |||||||
Ashmore Cayman | |||||||
0.000%, 04/16/14 (E) | 221 | 119 | |||||
Indonesia — 0.4% | |||||||
Star Energy | |||||||
19.000%, 01/13/10 | 4,200 | 4,200 | |||||
Nigeria — 0.3% | |||||||
Oando | |||||||
13.900%, 02/23/10 | NGN | 229,710 | 1,482 | ||||
13.900%, 03/02/10 | NGN | 229,710 | 1,482 | ||||
| 2,964 | |||||||
Russia — 0.2% | |||||||
Snegri Overseas | |||||||
10.500%, 04/21/10 | 2,560 | 2,022 | |||||
Singapore — 0.3% | |||||||
Morton Bay Senior | |||||||
6.243%, 12/30/09 | 3,054 | 3,054 | |||||
Turkey — 0.3% | |||||||
Cukurova, Ser B | |||||||
8.493%, 05/01/12 | 3,361 | 2,772 | |||||
Total Loan Participations | 19,255 | ||||||
AFFILIATED PARTNERSHIP — 1.6% | |||||||
SEI Liquidity Fund, L.P. | |||||||
0.320%**† (I) | 15,626,807 | 15,340 | |||||
Total Affiliated Partnership | 15,340 | ||||||
DEPOSIT WITH COUNTERPARTY AS COLLATERAL FOR SWAP CONTRACTS (J) — 0.3% | |||||||
United States — 0.3% | |||||||
Deposits with Merrill Lynch as Collateral for Swap Contract Outstanding | 800 | 800 | |||||
Deposits with Merrill Lynch as Collateral for Swap Contract Outstanding | NGN | 285,300 | 1,924 | ||||
Total Deposit with Counterparty as Collateral for Swap Contracts | 2,724 | ||||||
| SEI Institutional Investments Trust / Semi-Annual Report / November 30, 2009 | 103 |
Table of Contents
SCHEDULE OF INVESTMENTS (Unaudited)
Emerging Markets Debt Fund (Concluded)
November 30, 2009
| Description | Face Amount (Thousands) (1) | Market Value ($ Thousands) | |||
CONVERTIBLE BONDS — 0.5% | |||||
India — 0.5% | |||||
FirstSource Solutions | |||||
6.030%, 12/04/12 (E) | 2,300 | $ | 2,097 | ||
Reliance Communications | |||||
0.000%, 03/01/12 (E) | 200 | 200 | |||
Suzlon Energy | |||||
2.438%, 07/25/14 | 500 | 455 | |||
1.271%, 06/12/12 | 2,484 | 2,373 | |||
Total Convertible Bonds | 5,125 | ||||
WARRANTS — 0.0% | |||||
Russia — 0.0% | |||||
Teorema Holding A, | 136 | — | |||
Teorema Holding B, | 272 | — | |||
Total Warrants | — | ||||
Total Investments — 98.2% | $ | 935,343 | |||
A summary of the open futures contracts held by the Fund at November 30, 2009, is as follows:
| Type of Contract | Number of Contracts Long | Expiration Date | Unrealized Appreciation ($ Thousands) | ||||
U.S. Long Treasury Bond | 10 | Mar-2010 | $ | 22 | |||
For the year ended November 30, 2009, the total amount of all open futures contracts, as presented in the table above, are representative of the volume of activity for this derivative type during the period.
A summary of the outstanding forward foreign currency contracts held by the Fund at November 30, 2009, is as follows:
| Maturity Date | Currency Deliver (Thousands) | Currency to Receive (Thousands) | Unrealized Appreciation (Depreciation) ($ Thousands) | |||||||||
12/2/09 | BRL | 17,340 | USD | 9,843 | $ | (84 | ) | |||||
12/2/09 | USD | 9,895 | BRL | 17,340 | 32 | |||||||
12/8/09-12/18/09 | USD | 6,806 | KRW | 8,013,170 | 92 | |||||||
12/10/09-12/14/09 | USD | 4,390 | RUB | 126,654 | (65 | ) | ||||||
12/18/09 | JPY | 563,141 | USD | 6,288 | (250 | ) | ||||||
12/18/09 | USD | 4,400 | INR | 202,708 | (46 | ) | ||||||
12/18/09-12/21/09 | EUR | 16,862 | USD | 25,156 | (156 | ) | ||||||
12/21/09 | USD | 1,075 | EUR | 715 | (2 | ) | ||||||
1/11/10 | TRY | 5,093 | USD | 3,398 | 91 | |||||||
1/11/10 | USD | 3,414 | TRY | 5,093 | (108 | ) | ||||||
1/19/10 | USD | 2,217 | PLN | 6,097 | (21 | ) | ||||||
1/29/10 | USD | 2,203 | HUF | 395,664 | (53 | ) | ||||||
| $ | (570 | ) | ||||||||||
A summary of outstanding swap agreements help by the Fund at November 30, 2009, is as follows:
| Total Return Swaps | ||||||||||||||||
| Counterparty | Reference Entity/Obligation | Fund Pays | Fund Receives | Termination Date | Notional Amount (Thousands) | Net Unrealized Depreciation ($ Thousands) | ||||||||||
| Merrill Lynch | Solar Gardens Ltd. Term Loan Credit Facility‡ | Cash Deposit Of Notional Amount | Price Return | 12/30/09 | NGN | 285,300 | $ | (43 | ) | |||||||
| Merrill Lynch | Zaporozh Term Loan, 9.784%, 12/31/10 | Cash Deposit Of Notional Amount | Price Return | 12/31/10 | 800 | (144 | ) | |||||||||
| $ | (187 | ) | ||||||||||||||
| Credit Default Swap | ||||||||||||||||
| Counterparty | Reference Entity/Obligation | Buy/Sell Protection | (Pays)/ Receives Rate | Termination Date | Notional Amount (Thousands) | Net Unrealized Appreciation ($ Thousands) | ||||||||||
| Credit Suisse | Republic of Kazakhstan | Sell | 14.25 | % | 02/20/10 | $(900) | $63 | |||||||||
Percentages are based on a Net Assets of $952,187 ($ Thousands)
| * | Non-income producing security. |
| ** | The rate reported is the 7-day effective yield as of November 30, 2009. |
| † | Investment in Affiliated Security (see Note 5). |
| ‡ | This swap was fair valued on November 30, 2009. |
| (1) | In U.S. dollars unless otherwise indicated. |
| (A) | Securities sold within terms of a private placement memorandum, exempt from registration under Section 144A of the Securities Act of 1933, as amended, and may be sold only to dealers in that program or other “accredited investors.” These securities have been determined to be liquid under guidelines established by the Board of Trustees. |
| (B) | Step Bonds — The rate reported is the effective yield on November 30, 2009. The coupon on a step bond changes on a specified date. |
| (C) | Security in default on interest payments. |
| (D) | Variable Rate Security — The rate reported is the rate in effect as of November 30, 2009. The date reported is final maturity date. |
| (E) | Zero coupon security. The rate reported is the effective yield at time of purchase. |
| (F) | This security or a partial position of this security is on loan at November 30, 2009 (see Note 11). The total value of securities on loan at November 30, 2009 was $14,924 ($ Thousands). |
| (G) | Security considered illiquid. The total value of such securities as of November 30, 2009 was $19,285 ($ Thousands) and represents 2.0% of Net Assets. |
| (H) | Security fair valued using methods determined in good faith by the Valuation Committee of the Board of trustees. The total market value of such securities as of November 30, 2009 was $20,043 and represented 2.1% of Net Assets. |
| 104 | SEI Institutional Investments Trust / Semi-Annual Report / November 30, 2009 |
Table of Contents
| Description |
| (I) | This security was purchased with cash collateral held from the securities on loan. The total value of such securities as of November 30, 2009 was $15,340 ($ Thousands). |
| (J) | Cash on loan to swap counterparty as collateral for outstanding swap contracts. |
AED — United Arab Emirates Dirham
BRL — Brazilian Real
COP — Colombian Peso
CV — Convertible Security
EUR — Euro
HUF — Hungary Forint
IDR — Indonesia Rupiah
INR — India Rupee
JPY — Japanese Yen
KRW — South Korean Won
L.P. — Limited Partnership
MTN — Medium Term Note
NGN — Nigerian Naira
PIK — Payment-in-Kind
PLN — Polish Zloty
RUB — Russian New Ruble
Ser — Series
TRY — New Turkish Lira
USD — U.S. Dollar
Amounts designated as “—” are $0 or have been rounded to $0.
The following is a summary of the inputs used as of November 30, 2009 in valuing the Fund’s investments carried at value ($ Thousands):
| Investments in Securities | Level 1 | Level 2 | Level 3 | Total | ||||||||
Global Bonds | $ | — | $ | 892,899 | $ | — | $ | 892,899 | ||||
Loan Participations | — | — | 19,255 | 19,255 | ||||||||
Affiliated Partnership | 15,340 | — | — | 15,340 | ||||||||
Deposit with Counterparty as Collateral for Swap Contracts | — | 2,724 | — | 2,724 | ||||||||
Convertible Bonds | — | 5,125 | — | 5,125 | ||||||||
Total Investments in Securities | $ | 15,340 | $ | 900,748 | $ | 19,255 | $ | 935,343 | ||||
| Other Financial Instruments | Level 1 | Level 2 | Level 3 | Total | |||||||||||
Futures Contracts * | $ | 22 | $ | — | $ | — | $ | 22 | |||||||
Forwards | — | (570 | ) | — | (570 | ) | |||||||||
Credit Default Swaps | — | 54 | — | 54 | |||||||||||
Total Return Swaps | — | — | (187 | ) | (187 | ) | |||||||||
Total Other Financial Instruments | $ | 22 | $ | (516 | ) | $ | (187 | ) | $ | (681 | ) | ||||
The following is a reconciliation of investments in which significant unobservable inputs (Level 3) were used in determining value ($ Thousands):
| Investments in Loan Participations | Investments in Total Return Swaps | ||||||
Beginning balance as of June 1, 2009 | $ | 11,161 | $ | (975 | ) | ||
Accrued discounts/premiums | 13 | — | |||||
Realized gain/(loss) | — | — | |||||
Change in unrealized appreciation/(depreciation) | 1,450 | 855 | |||||
Net purchases/sales | 6,631 | (67 | ) | ||||
Net transfer in and/or out of Level 3 | — | — | |||||
Ending balance as of November 30, 2009 | $ | 19,255 | $ | (187 | ) | ||
Changes in unrealized gains/(losses) included in earnings related to securities still held at reporting date | $ | 1,450 | $ | 855 | |||
| * | Futures contracts are valued at the unrealized appreciation on the instrument. |
For more information on valuation inputs, see Note 2 — Significant Accounting Policies in Notes to Financial Statements.
The accompanying notes are an integral part of the financial statements.
| SEI Institutional Investments Trust / Semi-Annual Report / November 30, 2009 | 105 |
Table of Contents
SCHEDULE OF INVESTMENTS (Unaudited)
Real Return Fund
November 30, 2009
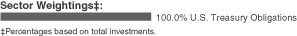
| Description | Face Amount ($ Thousands) | Market Value ($ Thousands) | ||||
U.S. TREASURY OBLIGATIONS — 98.2% | ||||||
U.S. Treasury Inflation-Protected Securities | ||||||
3.500%, 01/15/11 | $ | 5,875 | $ | 7,617 | ||
3.375%, 01/15/12 | 11,683 | 15,299 | ||||
2.000%, 04/15/12 | 24,796 | 27,776 | ||||
3.000%, 07/15/12 | 27,088 | 35,269 | ||||
0.625%, 04/15/13 | 19,995 | 20,900 | ||||
1.875%, 07/15/13 | 36,745 | 45,942 | ||||
2.000%, 01/15/14 | 41,649 | 52,077 | ||||
1.250%, 04/15/14 | 21,225 | 22,665 | ||||
2.000%, 07/15/14 | 29,611 | 36,495 | ||||
Total U.S. Treasury Obligations | 264,040 | |||||
Total Investments — 98.2% | $ | 264,040 | ||||
A summary of the open futures contracts held by the Fund at November 30, 2009, is as follows:
| Type of Contract | Number of Contract Long (Short) | Expiration Date | Unrealized Depreciation ($ Thousands) | ||||||
U.S. 5-Year Treasury Note | (161 | ) | Apr-2010 | $ | (68 | ) | |||
For the year ended November 30, 2009, the total amount of all open futures contracts, as presented in the table above, are representative of the volume of activity for this derivative type during the period.
| Percentages | are based on a Net Assets of $268,902 ($ Thousands) |
The following is a summary of the inputs used as of November 30, 2009 in valuing the Fund’s investments carried at value ($ Thousands):
| Investments in Securities | Level 1 | Level 2 | Level 3 | Total | ||||||||
U.S. Treasury Obligations | $ | — | $ | 264,040 | $ | — | $ | 264,040 | ||||
Total Investments in Securities | $ | — | $ | 264,040 | $ | — | $ | 264,040 | ||||
| Other Financial Instruments | Level 1 | Level 2 | Level 3 | Total | ||||||||||
Futures Contracts * | $ | (68 | ) | $ | — | $ | — | $ | (68 | ) | ||||
Total Other Financial Instruments | $ | (68 | ) | $ | — | $ | — | $ | (68 | ) | ||||
| * | Futures contracts are valued at the unrealized appreciation on the instrument. |
For more information on valuation inputs, see Note 2 — Significant Accounting Policies in Notes to Financial Statements.
Amounts designated as “—” are $0 or have been rounded to $0.
The accompanying notes are an integral part of the financial statements.
| 106 | SEI Institutional Investments Trust / Semi-Annual Report / November 30, 2009 |
Table of Contents
This page intentionally left blank.
Table of Contents
Statements of Assets and Liabilities ($ Thousands) (unaudited)
November 30, 2009
| Large Cap Fund | Large Cap Diversified Alpha Fund | Large Cap Disciplined Equity Fund | ||||||||||
ASSETS: | ||||||||||||
Investments, at value† | $ | 876,355 | * | $ | 295,367 | $ | 6,183,826 | * | ||||
Affiliated investment, at value†† | 119,896 | 59,302 | 1,921,734 | |||||||||
Cash | 4 | — | — | |||||||||
Foreign currency, at value††† | — | 8 | — | |||||||||
Receivable for fund shares sold | 69,581 | 168 | 7,885 | |||||||||
Receivable for investment securities sold | 6,428 | 3,027 | — | |||||||||
Dividends and interest receivable | 1,935 | 644 | 15,679 | |||||||||
Receivable for variation margin | 112 | 324 | 49,719 | |||||||||
Foreign tax reclaim receivable | — | — | — | |||||||||
Unrealized gain on foreign spot currency contracts | — | — | — | |||||||||
Unrealized gain on forward foreign currency contracts | — | — | — | |||||||||
Prepaid expenses | 10 | 5 | 90 | |||||||||
Total Assets | 1,074,321 | 358,845 | 8,178,933 | |||||||||
LIABILITIES: | ||||||||||||
Payable upon return on securities loaned | 98,068 | — | 856,147 | |||||||||
Payable for investment securities purchased | 5,772 | 2,902 | — | |||||||||
Payable for fund shares redeemed | 15,344 | 161 | 56,076 | |||||||||
Swap contracts, at value†††† | — | — | — | |||||||||
Payable for variation margin | 15 | — | 43,852 | |||||||||
Unrealized loss on foreign spot currency contracts | — | — | — | |||||||||
Unrealized loss on forward foreign currency contracts | — | — | — | |||||||||
Investment advisory fees payable | 176 | 85 | 999 | |||||||||
CCO fees payable | 1 | 1 | 13 | |||||||||
Trustees fees payable | 1 | — | 2 | |||||||||
Accrued expense payable | 31 | 20 | 343 | |||||||||
Total Liabilities | 119,408 | 3,169 | 957,432 | |||||||||
Net Assets | $ | 954,913 | $ | 355,676 | $ | 7,221,501 | ||||||
| † Cost of investments | $ | 753,983 | $ | 262,898 | $ | 5,246,130 | ||||||
| †† Cost of affiliated investments | 120,663 | 74,111 | 2,190,936 | |||||||||
| ††† Cost of foreign currency | — | 9 | — | |||||||||
| †††† Premiums received | — | — | — | |||||||||
| * Includes market value of securities on loan | 96,118 | — | 838,520 | |||||||||
NET ASSETS: | ||||||||||||
Paid-in Capital — (unlimited authorization — no par value) | $ | 981,950 | $ | 530,321 | $ | 9,431,468 | ||||||
Undistributed net investment income | 2,731 | 954 | 27,574 | |||||||||
Accumulated net realized gain (loss) on investments, futures, swap contracts and foreign currency | (152,565 | ) | (198,155 | ) | (2,992,332 | ) | ||||||
Net unrealized appreciation on investments | 121,605 | 17,660 | 668,494 | |||||||||
Net unrealized appreciation on futures contracts | 1,192 | 4,897 | 86,297 | |||||||||
Net unrealized depreciation on swap contracts | — | — | — | |||||||||
Net unrealized appreciation (depreciation) on forward foreign currency contracts, foreign currencies and translation of other assets and liabilities denominated in foreign currencies | — | (1 | ) | — | ||||||||
Net Assets | $ | 954,913 | $ | 355,676 | $ | 7,221,501 | ||||||
Net Asset Value, Offering and Redemption Price Per Share — Class A | $14.88 | $7.65 | $8.85 | |||||||||
| | ($954,912,786 ÷ 64,175,188 shares | ) | | ($355,676,075 ÷ 46,502,594 shares | ) | | ($7,221,500,911 ÷ 816,395,239 shares | ) | ||||
Amounts designated as “—” are $0 or have been rounded to $0.
The accompanying notes are an integral part of the financial statements.
| 108 | SEI Institutional Investments Trust / Semi-Annual Report / November 30, 2009 |
Table of Contents
| Large Cap Index Fund | Small Cap Fund | Small/Mid Cap Equity Fund | U.S. Managed Volatility Fund | International Equity Fund | |||||||||
| $494,280 | * | $1,174,884 | * | $2,053,902 | * | $279,186 | $707,310 | * | |||||
| 69,004 | 235,201 | 347,514 | 10,718 | 52,296 | |||||||||
| — | 16 | 175 | — | 15,033 | |||||||||
| — | 50 | 60 | — | 2,182 | |||||||||
| 231 | 341 | 6,592 | 332 | 549 | |||||||||
| 5,635 | 1,671 | 3,199 | 42 | 28,503 | |||||||||
| 1,249 | 1,825 | 2,940 | 608 | 2,131 | |||||||||
| 25 | 253 | 253 | 11 | — | |||||||||
| — | — | — | — | 1,154 | |||||||||
| — | — | — | — | 12 | |||||||||
| — | — | — | — | 228 | |||||||||
| 6 | 15 | 27 | 4 | 10 | |||||||||
| 570,430 | 1,414,256 | 2,414,662 | 290,901 | 809,408 | |||||||||
| 63,613 | 201,493 | 306,892 | — | 34,393 | |||||||||
| — | 3,264 | 6,143 | 461 | 8,367 | |||||||||
| 6,519 | 2,022 | 12,926 | 376 | 15,828 | |||||||||
| — | — | — | — | 197 | |||||||||
| — | — | — | — | 150 | |||||||||
| — | — | 2 | — | 28 | |||||||||
| — | — | — | — | 65 | |||||||||
| 16 | 520 | 834 | 81 | 193 | |||||||||
| 1 | 2 | 4 | 1 | 1 | |||||||||
| — | 1 | 1 | — | — | |||||||||
| 25 | 58 | 103 | 20 | 67 | |||||||||
| 70,174 | 207,360 | 326,905 | 939 | 59,289 | |||||||||
| $500,256 | $1,206,896 | $2,087,757 | $289,962 | $750,119 | |||||||||
| $407,875 | $1,097,044 | $1,854,436 | $239,872 | $618,776 | |||||||||
| 69,822 | 241,364 | 355,008 | 10,718 | 53,168 | |||||||||
| — | 49 | 60 | — | 2,182 | |||||||||
| — | — | — | — | — | |||||||||
| 62,407 | 150,257 | 239,050 | — | 31,767 | |||||||||
| $453,606 | $1,666,395 | $2,673,590 | $243,424 | $1,159,290 | |||||||||
| 2,483 | 2,213 | 1,237 | 1,058 | 9,842 | |||||||||
| (41,812 | ) | (533,758 | ) | (779,517 | ) | 6,039 | (506,600 | ) | |||||
| 85,587 | 71,677 | 191,972 | 39,314 | 87,662 | |||||||||
| 392 | 369 | 472 | 127 | 269 | |||||||||
| — | — | — | — | (197 | ) | ||||||||
| — | | — | 3 | — | (147 | ) | |||||||
| $500,256 | $1,206,896 | $2,087,757 | $289,962 | $750,119 | |||||||||
| $94.17 | $9.47 | $9.37 | $10.94 | $7.08 | |||||||||
| ($500,255,568 ÷ 5,312,436 shares | ) | ($1,206,896,023 ÷ 127,474,196 shares | ) | ($2,087,757,216 ÷ 222,756,969 shares | ) | ($289,961,999 ÷ 26,499,808 shares | ) | ($750,118,898 ÷ 106,010,726 shares | ) |
| SEI Institutional Investments Trust / Semi-Annual Report / November 30, 2009 | 109 |
Table of Contents
Statements of Assets and Liabilities ($ Thousands) (unaudited)
November 30, 2009
| World Equity Ex-US Fund | Screened World Equity Ex-US Fund | Enhanced LIBOR Opportunity Fund | ||||||||||
ASSETS: | ||||||||||||
Investments, at value† | $ | 3,263,956 | * | $ | 72,408 | $ | 84,261 | |||||
Affiliated investment, at value†† | 231,381 | 1,099 | 67,940 | |||||||||
Repurchase agreements | — | — | 4,000 | |||||||||
Cash | 44,174 | 431 | — | |||||||||
Foreign currency, at value††† | 18,925 | 355 | — | |||||||||
Cash held as collateral for forward foreign currency contracts, future | — | — | 200 | |||||||||
Margin call | — | — | — | |||||||||
Receivable for fund shares sold | 17,396 | 252 | 11 | |||||||||
Receivable for investment securities sold | 34,395 | 345 | 7,241 | |||||||||
Dividends and interest receivable | 7,903 | 145 | 418 | |||||||||
Receivable for variation margin | 1,113 | 21 | — | |||||||||
Foreign tax reclaim receivable | 1,830 | 39 | 1 | |||||||||
Unrealized gain on foreign spot currency contracts | 25 | — | — | |||||||||
Unrealized gain on forward foreign currency contracts | — | — | — | |||||||||
Swap contracts, at value†††† | 617 | — | — | |||||||||
Reimbursement of investment advisory fees | — | — | — | |||||||||
Prepaid expenses | 42 | 1 | 2 | |||||||||
Total Assets | 3,621,757 | 75,096 | 164,074 | |||||||||
LIABILITIES: | ||||||||||||
Payable upon return on securities loaned | 164,829 | — | — | |||||||||
Payable for loss on securities lending | — | — | — | |||||||||
Payable for investment securities purchased | 33,850 | 465 | 4,533 | |||||||||
Payable for fund shares redeemed | 18,356 | 78 | 8,540 | |||||||||
Income distribution payable | — | — | — | |||||||||
Swap contracts, at value†††† | 81 | — | — | |||||||||
Options written, at value††††† | — | — | — | |||||||||
Swaptions written, at value†††††† | — | — | — | |||||||||
Payable to custodian | — | — | 134 | |||||||||
Payable for variation margin | 621 | 13 | 14 | |||||||||
Overdraft of foreign currency, at value††† | — | — | — | |||||||||
Unrealized loss on foreign spot currency contracts | 19 | — | — | |||||||||
Unrealized loss on forward foreign currency contracts | 262 | — | — | |||||||||
Investment advisory fees payable | 1,122 | 26 | 49 | |||||||||
CCO fees payable | 6 | — | — | |||||||||
Trustees fees payable | 1 | — | — | |||||||||
Accrued expense payable | 238 | 73 | 17 | |||||||||
Accrued foreign capital gains tax on appreciated securities | 1,328 | — | — | |||||||||
Total Liabilities | 220,713 | 655 | 13,287 | |||||||||
Net Assets | $ | 3,401,044 | $ | 74,441 | $ | 150,787 | ||||||
| † Cost of investments and repurchase agreements | $ | 2,809,017 | $ | 66,035 | $ | 96,542 | ||||||
| †† Cost of affiliated investments | 233,540 | 1,099 | 99,758 | |||||||||
| ††† Cost of foreign currency | 18,910 | 354 | — | |||||||||
| †††† Premiums received | — | — | — | |||||||||
| ††††† Premiums received | — | — | — | |||||||||
| †††††† Premiums received | — | — | — | |||||||||
| * Includes market value of securities on loan | 154,501 | — | — | |||||||||
NET ASSETS: | ||||||||||||
Paid-in Capital — (unlimited authorization — no par value) | $ | 4,082,390 | $ | 95,968 | $ | 205,262 | ||||||
Undistributed net investment income | 53,673 | 868 | 1,035 | |||||||||
Accumulated net realized loss on investments, options contracts, swaptions, futures, swap contracts and foreign currency | (1,189,009 | ) | (28,799 | ) | (15,386 | ) | ||||||
Net unrealized appreciation (depreciation) on investments and option contracts | 452,780 | 6,373 | (40,099 | ) | ||||||||
Net unrealized appreciation (depreciation) on futures contracts | 1,946 | 24 | (25 | ) | ||||||||
Net unrealized appreciation (depreciation) on swap contracts | 536 | — | — | |||||||||
Net unrealized appreciation (depreciation) on forward foreign currency contracts, foreign currencies and translation of other assets and liabilities denominated in foreign currencies | 56 | 7 | — | |||||||||
Accumulated foreign capital gains tax on appreciated securities | (1,328 | ) | — | — | ||||||||
Net Assets | $ | 3,401,044 | $ | 74,441 | $ | 150,787 | ||||||
Net Asset Value, Offering and Redemption Price Per Share — Class A | $9.89 | $7.62 | $7.49 | |||||||||
| | ($3,401,043,659 ÷ 343,755,820 shares | ) | | ($74,441,101 ÷ 9,767,607 shares | ) | | ($150,786,830 ÷ 20,144,116 shares | ) | ||||
Amounts designated as “—” are $0 or have been rounded to $0.
The accompanying notes are an integral part of the financial statements.
| 110 | SEI Institutional Investments Trust / Semi-Annual Report / November 30, 2009 |
Table of Contents
| Core Fixed Income Fund | High Yield Bond Fund | Long Duration Fund | Emerging Markets Debt Fund | Real Return Fund | |||||||||
| $5,428,684 | * | $1,428,342 | * | $2,083,729 | $920,003 | * | $264,040 | ||||||
| 754,240 | 15,775 | 73,764 | 15,340 | — | |||||||||
| — | — | — | — | — | |||||||||
| — | — | 7 | 19,492 | 1,938 | |||||||||
| 510 | — | — | — | — | |||||||||
| 44,411 | | — | — | 1,863 | — | ||||||||
| — | 1,000 | 960 | — | — | |||||||||
| 142,520 | 12,424 | — | 8,506 | 1,917 | |||||||||
| 200,296 | 19,268 | — | 584 | — | |||||||||
| 39,466 | 27,897 | 25,116 | 16,544 | 1,696 | |||||||||
| 782 | — | 268 | 1 | 18,842 | |||||||||
| 193 | 23 | 58 | — | — | |||||||||
| — | — | — | — | — | |||||||||
| — | — | — | 215 | — | |||||||||
| 19,196 | 909 | — | 63 | — | |||||||||
| — | — | — | — | — | |||||||||
| 67 | 19 | 24 | 9 | 4 | |||||||||
| 6,630,365 | 1,505,657 | 2,183,926 | 982,620 | 288,437 | |||||||||
| 657,743 | 4 | — | 15,627 | — | |||||||||
| — | 1,911 | — | — | — | |||||||||
| 406,514 | 35,711 | 5,000 | 7,159 | — | |||||||||
| 53,891 | 17,172 | — | 4,557 | 561 | |||||||||
| 1,710 | 552 | — | — | — | |||||||||
| 59,300 | — | 851 | 187 | — | |||||||||
| 340 | — | — | — | — | |||||||||
| 1,042 | — | — | — | — | |||||||||
| 1,739 | 1,193 | — | — | — | |||||||||
| 670 | — | 1 | — | 18,880 | |||||||||
| — | — | — | 1,635 | — | |||||||||
| — | — | — | — | — | |||||||||
| — | — | — | 785 | — | |||||||||
| 622 | 384 | 311 | 412 | 74 | |||||||||
| 10 | 3 | 4 | 2 | 1 | |||||||||
| — | — | 1 | — | — | |||||||||
| 322 | 118 | 85 | 69 | 19 | |||||||||
| — | — | — | — | — | |||||||||
| 1,183,903 | 57,048 | 6,253 | 30,433 | 19,535 | |||||||||
| $5,446,462 | $1,448,609 | $2,177,673 | $952,187 | $268,902 | |||||||||
| $5,490,893 | $1,417,496 | $1,935,783 | $845,482 | $250,946 | |||||||||
| 765,209 | 15,775 | 73,764 | 15,627 | — | |||||||||
| 509 | — | — | (1,643 | ) | — | ||||||||
| (20,478 | ) | 1,046 | (211 | ) | — | — | |||||||
| (233 | ) | — | — | — | — | ||||||||
| (984 | ) | — | — | — | — | ||||||||
| 495,935 | 5 | — | 14,924 | — | |||||||||
| $5,549,564 | $1,639,534 | $2,069,738 | $959,167 | $251,810 | |||||||||
| 7,807 | 3,246 | 595 | 9,356 | 5,236 | |||||||||
(17,407 | ) | (204,880 | ) | (45,851 | ) | (89,959 | ) | (1,170 | ) | ||||
(73,343 | ) | 10,846 | 147,946 | 74,234 | 13,094 | ||||||||
| (533 | ) | — | 5,885 | 22 | (68 | ) | |||||||
| (19,626 | ) | (137 | ) | (640 | ) | (124 | ) | — | |||||
| — | | — | — | (509 | ) | — | |||||||
| — | — | — | — | — | |||||||||
| $5,446,462 | $1,448,609 | $2,177,673 | $952,187 | $268,902 | |||||||||
| $10.15 | $8.48 | $8.62 | $10.52 | $10.60 | |||||||||
| ($5,446,462,115 ÷ 536,811,705 shares | ) | ($1,448,608,710 ÷ 170,863,947 shares | ) | ($2,177,673,138 ÷ 252,593,778 shares | ) | ($952,186,528 ÷ 90,469,967 shares | ) | ($268,901,833 ÷ 25,358,141 shares | ) |
| SEI Institutional Investments Trust / Semi-Annual Report / November 30, 2009 | 111 |
Table of Contents
Statements of Operations ($ Thousands) (unaudited)
For the six month period ended November 30, 2009
| Large Cap Fund | Large Cap Diversified Alpha Fund | Large Cap Disciplined Equity Fund | ||||||||||
Investment Income | ||||||||||||
Dividends | $ | 7,159 | $ | 2,840 | $ | 68,809 | ||||||
Dividends from Affiliated Registered Investment Company(1) | 21 | 12 | 202 | |||||||||
Interest Income | 6 | 10 | 177 | |||||||||
Security Lending Income — Net | 196 | — | 1,444 | |||||||||
Less: Foreign Taxes Withheld | (5 | ) | (2 | ) | — | |||||||
| 7,377 | 2,860 | 70,632 | ||||||||||
Expenses: | ||||||||||||
Investment Advisory Fees | 1,479 | 699 | 13,448 | |||||||||
Administration Fees | 185 | 87 | 1,681 | |||||||||
Trustee Fees | 6 | 3 | 63 | |||||||||
Chief Compliance Officer Fees | 2 | 1 | 18 | |||||||||
Custodian/Wire Agent Fees | 16 | 11 | 194 | |||||||||
Professional Fees | 15 | 8 | 151 | |||||||||
Printing Fees | 6 | 3 | 61 | |||||||||
Registration Fees | 9 | 1 | 23 | |||||||||
Overdraft Fees | — | — | — | |||||||||
Other Expenses | 12 | 11 | 88 | |||||||||
Total Expenses | 1,730 | 824 | 15,727 | |||||||||
Less: | ||||||||||||
Waiver of Investment Advisory Fees | (583 | ) | (188 | ) | (7,826 | ) | ||||||
Waiver of Administration Fees | (185 | ) | (87 | ) | (1,681 | ) | ||||||
Fees Paid Indirectly(1) | (13 | ) | — | (1 | ) | |||||||
Net Expenses | 949 | 549 | 6,219 | |||||||||
Net Investment Income | 6,428 | 2,311 | 64,413 | |||||||||
Net Realized and Unrealized Gain (Loss) on Investments: | ||||||||||||
Investments | 8,856 | 3,420 | 103,287 | |||||||||
Affiliated Investments | — | — | (11,153 | ) | ||||||||
Futures Contracts | 3,782 | 18,092 | 315,775 | |||||||||
Swap Contracts | — | — | — | |||||||||
Foreign Currency Transactions | — | — | (788 | ) | ||||||||
Net Change in Unrealized Appreciation (Depreciation) on: | ||||||||||||
Investments | 112,405 | 44,654 | 831,207 | |||||||||
Affiliated Investments | (321 | ) | 3,560 | 73,143 | ||||||||
Futures Contracts | (327 | ) | (6,462 | ) | (118,906 | ) | ||||||
Swap Contracts | — | — | — | |||||||||
Foreign Currency and Translation of Other Assets and Liabilities Denominated in Foreign Currencies | — | — | 802 | |||||||||
Net Increase in Net Assets Resulting from Operations | $ | 130,823 | $ | 65,575 | $ | 1,257,780 | ||||||
| (1) | See Note 5 in the Notes to the Financial Statements. |
Amounts designated as “—” are zero or have been rounded to zero.
The accompanying notes are an integral part of the financial statements.
| 112 | SEI Institutional Investments Trust / Semi-Annual Report / November 30, 2009 |
Table of Contents
| Large Cap Index Fund | Small Cap Fund | Small/Mid Cap Fund | U.S. Managed Volatility Fund | International Equity Fund | ||||||||||||||
| $ | 5,389 | $ | 7,881 | $ | 13,259 | $ | 3,453 | $ | 7,380 | |||||||||
| 7 | 40 | 60 | 9 | 11 | ||||||||||||||
| 1 | 407 | 539 | 1 | 438 | ||||||||||||||
| 242 | 386 | 456 | — | 547 | ||||||||||||||
| — | (8 | ) | (7 | ) | (18 | ) | (437 | ) | ||||||||||
| 5,639 | 8,706 | 14,307 | 3,445 | 7,939 | ||||||||||||||
| 380 | 3,691 | 6,475 | 864 | 1,880 | ||||||||||||||
| 112 | 284 | 498 | 66 | 186 | ||||||||||||||
| 4 | 10 | 18 | 2 | 7 | ||||||||||||||
| 1 | 3 | 5 | 1 | 2 | ||||||||||||||
| 12 | 32 | 55 | 8 | 155 | ||||||||||||||
| 10 | 25 | 45 | 6 | 17 | ||||||||||||||
| 4 | 10 | 18 | 2 | 7 | ||||||||||||||
| 3 | 3 | 7 | 2 | 2 | ||||||||||||||
| — | — | — | — | 5 | ||||||||||||||
| 12 | 26 | 35 | 5 | 55 | ||||||||||||||
| 538 | 4,084 | 7,156 | 956 | 2,316 | ||||||||||||||
| (292 | ) | (731 | ) | (1,676 | ) | (425 | ) | (674 | ) | |||||||||
| (112 | ) | (284 | ) | (498 | ) | (66 | ) | (186 | ) | |||||||||
| — | (43 | ) | (80 | ) | — | (9 | ) | |||||||||||
| 134 | 3,026 | 4,902 | 465 | 1,447 | ||||||||||||||
| 5,505 | 5,680 | 9,405 | 2,980 | 6,492 | ||||||||||||||
| (10,576 | ) | 32,003 | 15,225 | 7,653 | 20,380 | |||||||||||||
| — | — | — | — | — | ||||||||||||||
| 2,045 | 9,188 | 9,866 | 1,397 | 3,443 | ||||||||||||||
| — | — | — | — | 13,616 | ||||||||||||||
| — | (9 | ) | (100 | ) | — | 1,141 | ||||||||||||
| 88,267 | 147,792 | 323,230 | 26,700 | 75,765 | ||||||||||||||
| (45 | ) | 80 | (167 | ) | — | 155 | ||||||||||||
| (685 | ) | (3,824 | ) | (332 | ) | (395 | ) | (661 | ) | |||||||||
| — | — | — | — | (6,331 | ) | |||||||||||||
| — |
| (1 | ) | 2 | — | (1,458 | ) | ||||||||||
| $ | 84,511 | $ | 190,909 | $ | 357,129 | $ | 38,335 | $ | 112,542 | |||||||||
| SEI Institutional Investments Trust / Semi-Annual Report / November 30, 2009 | 113 |
Table of Contents
Statements of Operations ($ Thousands) (unaudited)
For the six month period ended November 30, 2009
| World Equity Ex-US Fund | Screened World Equity Ex-US Fund | Enhanced LIBOR Opportunities Fund | ||||||||||
Investment Income | ||||||||||||
Dividends | $ | 32,412 | $ | 669 | $ | — | ||||||
Dividends from Affiliated Registered Investment Company(1) | 51 | 1 | 11 | |||||||||
Interest Income | 1,201 | 6 | 2,344 | |||||||||
Security Lending Income — Net | 1,782 | — | — | |||||||||
Less: Foreign Taxes Withheld | (2,776 | ) | (53 | ) | — | |||||||
| 32,670 | 623 | 2,355 | ||||||||||
Expenses: | ||||||||||||
Investment Advisory Fees | 8,586 | 201 | 372 | |||||||||
Administration Fees | 781 | 15 | 41 | |||||||||
Trustee Fees | 28 | 1 | 2 | |||||||||
Chief Compliance Officer Fees | 8 | — | — | |||||||||
Custodian/Wire Agent Fees | 416 | 91 | 5 | |||||||||
Professional Fees | 68 | 1 | 4 | |||||||||
Printing Fees | 28 | 1 | 2 | |||||||||
Registration Fees | 8 | — | — | |||||||||
Overdraft Fees | 34 | 2 | — | |||||||||
Other Expenses | 106 | 30 | 23 | |||||||||
Total Expenses | 10,063 | 342 | 449 | |||||||||
Less: | ||||||||||||
Waiver of Investment Advisory Fees | (2,230 | ) | (79 | ) | (67 | ) | ||||||
Waiver of Administration Fees | (781 | ) | (15 | ) | (41 | ) | ||||||
Fees Paid Indirectly(1) | (27 | ) | — | — | ||||||||
Net Expenses | 7,025 | 248 | 341 | |||||||||
Net Investment Income | 25,645 | 375 | 2,014 | |||||||||
Net Realized and Unrealized Gain (Loss) on Investments: | ||||||||||||
Investments | 93,436 | 79 | (6,263 | ) | ||||||||
Affiliated Investments | — | — | (2,304 | ) | ||||||||
Futures Contracts | 25,016 | 336 | (265 | ) | ||||||||
Written Options | — | — | — | |||||||||
Written Swaptions | — | — | — | |||||||||
Swap Contracts | 17,126 | — | — | |||||||||
Foreign Currency Transactions | 4,719 | (132 | ) | (77 | ) | |||||||
Net Change in Unrealized Appreciation (Depreciation) on: | ||||||||||||
Investments | 359,589 | 9,823 | 11,994 | |||||||||
Affiliated Investments | 484 | — | 8,035 | |||||||||
Futures Contracts | (6,804 | ) | (176 | ) | (4 | ) | ||||||
Written Options | — | — | — | |||||||||
Written Swaptions | — | — | — | |||||||||
Swap Contracts | (9,017 | ) | — | — | ||||||||
Foreign Capital Gains Tax | (630 | ) | — | — | ||||||||
Foreign Currency and Translation of Other Assets and Liabilities Denominated in Foreign Currencies | (7,130 | ) | (7 | ) | 79 | |||||||
Net Increase in Net Assets Resulting from Operations | $ | 502,434 | $ | 10,298 | $ | 13,209 | ||||||
| (1) | See Note 5 in the Notes to the Financial Statements. |
Amounts designated as “—” are zero or have been rounded to zero.
The accompanying notes are an integral part of the financial statements.
| 114 | SEI Institutional Investments Trust / Semi-Annual Report / November 30, 2009 |
Table of Contents
| Core Fixed Income Fund | High Yield Bond Fund | Long Duration Fund | Emerging Markets Debt Fund | Real Return Fund | ||||||||||||||
| $ | 24 | $ | 438 | $ | — | $ | — | $ | — | |||||||||
| 197 | 35 | 50 | — | 1 | ||||||||||||||
| 131,221 | 72,883 | 52,379 | 44,020 | 6,060 | ||||||||||||||
| 579 | 182 | — | 26 | — | ||||||||||||||
| (8 | ) | — | — | — | — | |||||||||||||
| 132,013 | 73,538 | 52,429 | 44,046 | 6,061 | ||||||||||||||
| 7,414 | 3,410 | 2,701 | 4,011 | 930 | ||||||||||||||
| 1,236 | 350 | 450 | 236 | 66 | ||||||||||||||
| 48 | 13 | 16 | 9 | 3 | ||||||||||||||
| 14 | 4 | 5 | 3 | 1 | ||||||||||||||
| 157 | 40 | 43 | 45 | 7 | ||||||||||||||
| 115 | 31 | 39 | 22 | 6 | ||||||||||||||
| 45 | 12 | 16 | 9 | 2 | ||||||||||||||
| 19 | 2 | 26 | 2 | 1 | ||||||||||||||
| — | — | — | 9 | 2 | ||||||||||||||
| 119 | 100 | 37 | 47 | 9 | ||||||||||||||
| 9,167 | 3,962 | 3,333 | 4,393 | 1,027 | ||||||||||||||
| (4,472 | ) | (1,164 | ) | (1,081 | ) | (1,555 | ) | (481 | ) | |||||||||
| (1,236 | ) | (350 | ) | (450 | ) | (236 | ) | (66 | ) | |||||||||
| — | — | — | — | — | ||||||||||||||
| 3,459 | 2,448 | 1,802 | 2,602 | 480 | ||||||||||||||
| 128,554 | 71,090 | 50,627 | 41,444 | 5,581 | ||||||||||||||
| 35,524 | 29,305 | (1,317 | ) | 16,593 | 5,204 | |||||||||||||
| — | (1,910 | ) | — | — | — | |||||||||||||
| 7,636 | — | 2,485 | 242 | (332 | ) | |||||||||||||
| 2,863 | — | — | — | — | ||||||||||||||
| 10 | — | — | — | — | ||||||||||||||
| (483 | ) | 56 | 1 | 526 | — | |||||||||||||
| (1,183 | ) | — | — | (54 | ) | 36 | ||||||||||||
| 323,391 | 232,223 | 159,830 | 99,468 | 2,222 | ||||||||||||||
| (913 | ) | 3,358 | — | (4 | ) | — | ||||||||||||
| 256 | — | 16,043 | (12 | ) | (68 | ) | ||||||||||||
| (317 | ) | — | — | — | — | |||||||||||||
| (58 | ) | — | — | — | — | |||||||||||||
| (3,001 | ) | (137 | ) | 35 | 996 | — | ||||||||||||
| — | — | — | — | — | ||||||||||||||
| 403 |
| — | — | (305 | ) | — | |||||||||||
| $ | 492,682 | $ | 333,985 | $ | 227,704 | $ | 158,894 | $ | 12,643 | |||||||||
| SEI Institutional Investments Trust / Semi-Annual Report / November 30, 2009 | 115 |
Table of Contents
Statements of Changes in Net Assets ($ Thousands)
For the period ended November 30, 2009 (Unaudited) and the year ended May 31, 2009
| Large Cap Fund | Large Cap Diversified Alpha Fund | |||||||||||||||
| 6/1/09 to 11/30/09 | 6/1/08 to 5/31/09 | 6/1/09 to 11/30/09 | 6/1/08 to 5/31/09 | |||||||||||||
Operations: | ||||||||||||||||
Net Investment Income | $ | 6,428 | $ | 7,363 | $ | 2,311 | $ | 5,503 | ||||||||
Net Realized Gain (Loss) from Investments, Affiliated Investments, Futures Contracts and Swap Contracts | 12,638 | (62,797 | ) | 21,512 | (186,360 | ) | ||||||||||
Net Realized Loss on Foreign Currency Transactions | — | — | — | — | ||||||||||||
Net Change in Unrealized Appreciation (Depreciation) on Investments, Affiliated Investments and Future Contracts | 111,757 | (40,243 | ) | 41,752 | (48,205 | ) | ||||||||||
Net Change in Unrealized Appreciation (Depreciation) on Foreign Currency Transactions | — | — | — | (1 | ) | |||||||||||
Net Increase (Decrease) in Net Assets Resulting from Operations | 130,823 | (95,677 | ) | 65,575 | (229,063 | ) | ||||||||||
Dividends and Distributions From: | ||||||||||||||||
Net Investment Income: | ||||||||||||||||
Class A | (5,283 | ) | (6,781 | ) | (1,357 | ) | (772 | ) | ||||||||
Net Realized Gains: | ||||||||||||||||
Class A | — | — | — | — | ||||||||||||
Return of Capital: | ||||||||||||||||
Class A | — | — | — | (2,889 | ) | |||||||||||
Total Dividends and Distributions | (5,283 | ) | (6,781 | ) | (1,357 | ) | (3,661 | ) | ||||||||
Capital Share Transactions:(1) | ||||||||||||||||
Class A: | ||||||||||||||||
Proceeds from Shares Issued | 366,429 | 331,341 | 23,611 | 188,769 | ||||||||||||
Reinvestment of Dividends & Distributions | 4,912 | 6,761 | 1,132 | 3,328 | ||||||||||||
Cost of Shares Redeemed | (68,389 | ) | (70,379 | ) | (64,287 | ) | (180,732 | ) | ||||||||
Increase (Decrease) in Net Assets Derived from Capital Share Transactions | 302,952 | 267,723 | (39,544 | ) | 11,365 | |||||||||||
Net Increase (Decrease) in Net Assets | 428,492 | 165,265 | 24,674 | (221,359 | ) | |||||||||||
Net Assets: | ||||||||||||||||
Beginning of Period | 526,421 | 361,156 | 331,002 | 552,361 | ||||||||||||
End of Period | $ | 954,913 | $ | 526,421 | $ | 355,676 | $ | 331,002 | ||||||||
Undistributed Net Investment Income Included in Net | $ | 2,731 | $ | 1,586 | $ | 954 | $ | — | ||||||||
| (1) | See Note 6 in the Notes to Financial Statements for additional information. |
| (2) | Includes subscriptions as a result of an in-kind transfers of securities (see Note 10). |
Amounts designated as “—” are zero or have been rounded to zero.
The accompanying notes are an integral part of the financial statements.
| 116 | SEI Institutional Investments Trust / Semi-Annual Report / November 30, 2009 |
Table of Contents
| Large Cap Disciplined Equity Fund | Large Cap Index Fund | Small Cap Fund | ||||||||||||||||||||
| 6/1/09 to 11/30/09 | 6/1/08 to 5/31/09 | 6/1/09 to 11/30/09 | 6/1/08 to 5/31/09 | 6/1/09 to 11/30/09 | 6/1/08 to 5/31/09 | |||||||||||||||||
| $ | 64,413 | $ | 126,794 | $ | 5,505 | $ | 8,446 | $ | 5,680 | $ | 14,533 | |||||||||||
| | 407,909 | | (2,910,132 | ) | (8,531 | ) | (29,441 | ) | 41,191 | (472,584 | ) | |||||||||||
| (788) | (1,882 | ) | — | — | (9 | ) | (114 | ) | ||||||||||||||
| | 785,444 | | (668,153 | ) | 87,537 | (109,708 | ) | 144,048 | (139,527 | ) | ||||||||||||
| 802 | (451 | ) | — | — | (1 | ) | 10 | |||||||||||||||
| 1,257,780 | (3,453,824 | ) | 84,511 | (130,703 | ) | 190,909 | (597,682 | ) | ||||||||||||||
| (37,056 | ) | (10,906 | ) | (4,372 | ) | (8,380 | ) | (4,385 | ) | (23,822 | ) | |||||||||||
| — | — | — | (620 | ) | — | — | ||||||||||||||||
| — | (79,835 | ) | — | — | — | — | ||||||||||||||||
| (37,056 | ) | (90,741 | ) | (4,372 | ) | (9,000 | ) | (4,385 | ) | (23,822 | ) | |||||||||||
| 686,180 | (2) | 2,154,108 | (2) | 100,137 | 156,678 | 111,756 | 174,015 | |||||||||||||||
| 36,003 | 89,812 | 4,223 | 8,560 | 4,004 | 22,561 | |||||||||||||||||
| (764,525 | ) | (1,423,578 | ) | (38,135 | ) | (58,516 | ) | (81,248 | ) | (408,912 | ) | |||||||||||
| (42,342 | ) | 820,342 | 66,225 | 106,722 | 34,512 | (212,336 | ) | |||||||||||||||
| 1,178,382 | (2,724,223 | ) | 146,364 | (32,981 | ) | 221,036 | (833,840 | ) | ||||||||||||||
| 6,043,119 | 8,767,342 | 353,892 | 386,873 | 985,860 | 1,819,700 | |||||||||||||||||
| $ | 7,221,501 | $ | 6,043,119 | $ | 500,256 | $ | 353,892 | $ | 1,206,896 | $ | 985,860 | |||||||||||
| $ | 27,574 | | $ | 217 | $ | 2,483 | $ | 1,350 | $ | 2,213 | $ | 918 | ||||||||||
| SEI Institutional Investments Trust / Semi-Annual Report / November 30, 2009 | 117 |
Table of Contents
Statements of Changes in Net Assets ($ Thousands)
For the period ended November 30, 2009 (Unaudited) and the Year ended May 31, 2009
| Small/Mid Cap Equity Fund | U.S. Managed Volatility Fund(3) | |||||||||||||||
| 6/1/09 to 11/30/09 | 6/1/08 to 5/31/09 | 6/1/09 to 11/30/09 | 6/1/08 to 5/31/09 | |||||||||||||
Operations: | ||||||||||||||||
Net Investment Income | $ | 9,405 | $ | 24,678 | $ | 2,980 | $ | 1,288 | ||||||||
Net Realized Gain (Loss) from Investments, Affiliated Investments, Futures Contracts and Swap Contracts | 25,091 | (654,891 | ) | 9,050 | (3,011 | ) | ||||||||||
Net Realized Gain (Loss) on Foreign Currency Transactions | (100 | ) | (404 | ) | — | — | ||||||||||
Net Change in Unrealized Appreciation (Depreciation) on Investments, Affiliated Investments, Future Contracts and Swap Contracts | 322,731 | (220,379 | ) | 26,305 | 13,136 | |||||||||||
Net Change in Unrealized Depreciation on Foreign Cap Gains Tax | — | — | — | — | ||||||||||||
Net Change in Unrealized Appreciation (Depreciation) on Foreign Currency Transactions | 2 | 9 | — | — | ||||||||||||
Net Increase (Decrease) in Net Assets Resulting from Operations | 357,129 | (850,987 | ) | 38,335 | 11,413 | |||||||||||
Dividends and Distributions From: | ||||||||||||||||
Net Investment Income: | ||||||||||||||||
Class A | (15,630 | ) | (27,726 | ) | (2,655 | ) | (555 | ) | ||||||||
Net Realized Gains: | ||||||||||||||||
Class A | — | — | — | — | ||||||||||||
Return of Capital: | ||||||||||||||||
Class A | — | — | — | — | ||||||||||||
Total Dividends and Distributions | (15,630 | ) | (27,726 | ) | (2,655 | ) | (555 | ) | ||||||||
Capital Share Transactions:(1) | ||||||||||||||||
Class A: | ||||||||||||||||
Proceeds from Shares Issued | 270,357 | 556,902 | 29,229 | 232,207 | ||||||||||||
Reinvestment of Dividends & Distributions | 15,192 | 27,474 | 2,655 | 555 | ||||||||||||
Cost of Shares Redeemed | (264,115 | ) | (353,895 | ) | (15,462 | ) | (5,760 | ) | ||||||||
Increase (Decrease) in Net Assets Derived from Capital Share Transactions | 21,434 | 230,481 | 16,422 | 227,002 | ||||||||||||
Net Increase (Decrease) in Net Assets | 362,933 | (648,232 | ) | 52,102 | 237,860 | |||||||||||
Net Assets: | ||||||||||||||||
Beginning of Period | 1,724,824 | 2,373,056 | 237,860 | — | ||||||||||||
End of Period | $ | 2,087,757 | $ | 1,724,824 | $ | 289,962 | $ | 237,860 | ||||||||
Undistributed Net Investment Income Included in Net Assets at Period End | $ | 1,237 | $ | 7,462 | $ | 1,058 | $ | 733 | ||||||||
| (1) | See Note 6 in the Notes to Financial Statements for additional information. |
| (2) | Includes subscriptions as a result of an in-kind transfers of securities (see Note 10). |
| (3) | Commenced operations on December 30, 2008. |
| (4) | Commenced operations on June 30, 2008. |
Amounts designated as “—” are zero or have been rounded to zero.
The accompanying notes are an integral part of the financial statements.
| 118 | SEI Institutional Investments Trust / Semi-Annual Report / November 30, 2009 |
Table of Contents
| International Equity Fund | World Equity Ex-US Fund | Screened World Equity Ex-US Fund(4) | Enhanced LIBOR Opportunities Fund | |||||||||||||||||||||||||||
| 6/1/09 to 11/30/09 | 6/1/08 to 5/31/09 | 6/1/09 to 11/30/09 | 6/1/08 to 5/31/09 | 6/1/09 to 11/30/09 | 6/1/08 to 5/31/09 | 6/1/09 to 11/30/09 | 6/1/08 to 5/31/09 | |||||||||||||||||||||||
| $ | 6,492 | $ | 26,627 | $ | 25,645 | $ | 73,495 | $ | 375 | $ | 1,211 | $ | 2,014 | $ | 5,626 | |||||||||||||||
| | 37,439 | | (529,662 | ) | 135,578 | (1,232,642 | ) | 415 | (29,065 | ) | (8,832 | ) | (13,555 | ) | ||||||||||||||||
| 1,141 | (19,516 | ) | 4,719 | (43,428 | ) | (132 | ) | (174 | ) | (77 | ) | (1,934 | ) | |||||||||||||||||
| | 68,928 | | (158,270 | ) | 344,252 | (190,170 | ) | 9,647 | (3,250 | ) | 20,025 | (43,748 | ) | |||||||||||||||||
| — | — | (630 | ) | (343 | ) | — | — | — | — | |||||||||||||||||||||
| (1,458 | ) | 2,112 | (7,130 | ) | 7,784 | (7 | ) | 14 | 79 | 235 | ||||||||||||||||||||
| 112,542 | (678,709 | ) | 502,434 | (1,385,304 | ) | 10,298 | (31,264 | ) | 13,209 | (53,376 | ) | |||||||||||||||||||
| — | (10,879 | ) | — | — | — | (561 | ) | (983 | ) | (3,100 | ) | |||||||||||||||||||
| — | (2,062 | ) | — | — | — | — | — | — | ||||||||||||||||||||||
| — | — | — | — | — | — | — | (929 | ) | ||||||||||||||||||||||
| — | (12,941 | ) | — | — | — | (561 | ) | (983 | ) | (4,029 | ) | |||||||||||||||||||
| 59,083 | 315,996 | 491,550 | 1,523,949 | 16,592 | 97,244 | 3,111 | 30,159 | |||||||||||||||||||||||
| — | 12,425 | — | — | — | 507 | 347 | 3,943 | |||||||||||||||||||||||
| (126,382 | ) | (384,857 | ) | (314,697 | ) | (718,008 | ) | (4,556 | ) | (13,819 | ) | (30,010 | ) | (55,964 | ) | |||||||||||||||
| (67,299 | ) | (56,436 | ) | 176,853 | 805,941 | 12,036 | 83,932 | (26,552 | ) | (21,862 | ) | |||||||||||||||||||
| 45,243 | (748,086 | ) | 679,287 | (579,363 | ) | 22,334 | 52,107 | (14,326 | ) | (79,267 | ) | |||||||||||||||||||
| 704,876 | 1,452,962 | 2,721,757 | 3,301,120 | 52,107 | — | 165,113 | 244,380 | |||||||||||||||||||||||
| $ | 750,119 | $ | 704,876 | $ | 3,401,044 | $ | 2,721,757 | $ | 74,441 | $ | 52,107 | $ | 150,787 | $ | 165,113 | |||||||||||||||
| $ | 9,842 | $ | 3,350 | $ | 53,673 | $ | 28,028 | $ | 868 | $ | 493 | $ | 1,035 | $ | 4 | |||||||||||||||
| SEI Institutional Investments Trust / Semi-Annual Report / November 30, 2009 | 119 |
Table of Contents
Statements of Changes in Net Assets ($ Thousands)
For the period ended November 30, 2009 (Unaudited) and the year ended May 31, 2009
| Core Fixed Income Fund | High Yield Bond Fund | |||||||||||||||
| 6/1/09 to 11/30/09 | 6/1/08 to 5/31/09 | 6/1/09 to 11/30/09 | 6/1/08 to 5/31/09 | |||||||||||||
Operations: | ||||||||||||||||
Net Investment Income | $ | 128,554 | $ | 296,773 | $ | 71,090 | $ | 132,188 | ||||||||
Net Realized Gain (Loss) from Investments, Affiliated Investments, Written Options, Written Swaptions, Futures Contracts and Swap Contracts | 45,550 | (53,563 | ) | 27,451 | (185,593 | ) | ||||||||||
Net Realized Gain (Loss) on Foreign Currency Transactions | (1,183 | ) | 12,443 | — | — | |||||||||||
Net Change in Unrealized Appreciation (Depreciation) on Investments, Affiliated Investments, Written Options, Written Swaptions, Futures Contracts and Swap Contracts | 319,358 | (215,205 | ) | 235,444 | (139,297 | ) | ||||||||||
Net Change in Unrealized Appreciation (Depreciation) on Foreign Currency Transactions | 403 | (1,392 | ) | — | — | |||||||||||
Net Increase (Decrease) in Net Assets Resulting from Operations | 492,682 | 39,056 | 333,985 | (192,702 | ) | |||||||||||
Dividends and Distributions From: | ||||||||||||||||
Net Investment Income: | ||||||||||||||||
Class A | (129,784 | ) | (298,149 | ) | (69,743 | ) | (125,601 | ) | ||||||||
Net Realized Gains: | ||||||||||||||||
Class A | — | (90,124 | ) | — | (10,261 | ) | ||||||||||
Return of Capital: | ||||||||||||||||
Class A | — | — | — | — | ||||||||||||
Total Dividends and Distributions | (129,784 | ) | (388,273 | ) | (69,743 | ) | (135,862 | ) | ||||||||
Capital Share Transactions:(1) | ||||||||||||||||
Class A: | ||||||||||||||||
Proceeds from Shares Issued | 1,265,366 | 1,885,234 | 198,654 | 340,771 | ||||||||||||
Reinvestment of Dividends & Distributions | 116,879 | 374,113 | 65,879 | 133,130 | ||||||||||||
Cost of Shares Redeemed | (839,274 | ) | (3,518,985 | ) | (319,437 | ) | (305,925 | ) | ||||||||
Increase (Decrease) in Net Assets Derived from Capital Share Transactions | 542,971 | (1,259,638 | ) | (54,904 | ) | 167,976 | ||||||||||
Net Increase (Decrease) in Net Assets | 905,869 | (1,608,855 | ) | 209,338 | (160,588 | ) | ||||||||||
Net Assets: | ||||||||||||||||
Beginning of Period | 4,540,593 | 6,149,448 | 1,239,271 | 1,399,859 | ||||||||||||
End of Period | $ | 5,446,462 | $ | 4,540,593 | $ | 1,448,609 | $ | 1,239,271 | ||||||||
Undistributed (Distributions in Excess of) Net Investment Income Included in Net Assets at Period End | $ | 7,807 | $ | (9,037 | ) | $ | 3,246 | $ | 367 | |||||||
| (1) | See Note 6 in the Notes to Financial Statements for additional information. |
Amounts designated as “—” are zero or have been rounded to zero.
The accompanying notes are an integral part of the financial statements.
| 120 | SEI Institutional Investments Trust / Semi-Annual Report / November 30, 2009 |
Table of Contents
| Long Duration Fund | Emerging Markets Debt Fund | Real Return Fund | ||||||||||||||||||||
| 6/1/09 to 11/30/09 | 6/1/08 to 5/31/09 | 6/1/09 to 11/30/09 | 6/1/08 to 5/31/09 | 6/1/09 to 11/30/09 | 6/1/08 to 5/31/09 | |||||||||||||||||
| $ | 50,627 | $ | 22,752 | $ | 41,444 | $ | 81,032 | $ | 5,581 | $ | 6,064 | |||||||||||
| | 1,169 | | (38,634 | ) | 17,361 | (96,832 | ) | 4,872 | (4,440 | ) | ||||||||||||
| — | — | (54 | ) | (11,390 | ) | 36 | 3,101 | |||||||||||||||
| | 175,908 | | (6,593 | ) | 100,448 | (24,829 | ) | 2,154 | (5,506 | ) | ||||||||||||
| | — | | — | (305 | ) | 756 | — | (610 | ) | |||||||||||||
| 227,704 | (22,475 | ) | 158,894 | (51,263 | ) | 12,643 | (1,391 | ) | ||||||||||||||
| (50,014 | ) | (24,618 | ) | (39,676 | ) | (76,229 | ) | — | (19,450 | ) | ||||||||||||
| — | — | — | — | — | (63 | ) | ||||||||||||||||
| — | — | — | — | — | (1,496 | ) | ||||||||||||||||
| (50,014 | ) | (24,618 | ) | (39,676 | ) | (76,229 | ) | — | (21,009 | ) | ||||||||||||
| 509,907 | 1,468,293 | 96,810 | 238,272 | 43,612 | 70,945 | |||||||||||||||||
| 49,915 | 24,542 | 37,782 | 74,453 | — | 20,190 | |||||||||||||||||
| (48,886 | ) | (72,449 | ) | (202,849 | ) | (346,498 | ) | (47,830 | ) | (170,387 | ) | |||||||||||
| 510,936 | 1,420,386 | (68,257 | ) | (33,773 | ) | (4,218 | ) | (79,252 | ) | |||||||||||||
| 688,626 | 1,373,293 | 50,961 | (161,265 | ) | 8,425 | (101,652 | ) | |||||||||||||||
| 1,489,047 | 115,754 | 901,226 | 1,062,491 | 260,477 | 362,129 | |||||||||||||||||
| $ | 2,177,673 | $ | 1,489,047 | $ | 952,187 | $ | 901,226 | $ | 268,902 | $ | 260,477 | |||||||||||
$ | 595 |
| $ | (18 | ) | $ | 9,356 | $ | 7,588 | $ | 5,236 | $ | (345 | ) | ||||||||
| SEI Institutional Investments Trust / Semi-Annual Report / November 30, 2009 | 121 |
Table of Contents
For the period ended November 30, 2009 (Unaudited) and the years or periods ended May 31,
For a share outstanding throughout each period
| Net Asset Value, Beginning of Period | Net Investment Income(2) | Net Realized and Unrealized Gains (Losses) on Securities | Total from Operations | Dividends from Net Investment Income | Distributions from Realized Capital Gains | Total Dividends and Distributions | Net Asset Value, End of Period | Total Return† | Net Assets End of Period ($ Thousands) | Ratio of Net Expenses to Average Net Assets | Ratio of Expenses to Average Net Assets (Excluding Fees Paid Indirectly and Including Waivers) | Ratio of Expenses to Average Net Assets (Excluding Fees Paid Indirectly and Waivers) | Ratio of Net Investment Income to Average Net Assets | Portfolio Turnover Rate† | ||||||||||||||||||||||||||||||||||||
Large Cap Fund | ||||||||||||||||||||||||||||||||||||||||||||||||||
Class A | ||||||||||||||||||||||||||||||||||||||||||||||||||
2009@ | $ | 12.55 | $ | 0.12 | $ | 2.31 | $ | 2.43 | $ | (0.10 | ) | $ | — | $ | (0.10 | ) | $ | 14.88 | 19.51 | % | $ | 954,913 | 0.25 | % | 0.26 | % | 0.47 | % | 1.74 | % | 38 | % | ||||||||||||||||||
2009 | 18.75 | 0.28 | (6.22 | ) | (5.94 | ) | (0.26 | ) | — | (0.26 | ) | 12.55 | (31.73 | ) | 526,421 | 0.25 | 0.26 | 0.48 | 2.16 | 81 | ||||||||||||||||||||||||||||||
2008 | 20.31 | 0.32 | (1.52 | ) | (1.20 | ) | (0.36 | ) | — | (0.36 | ) | 18.75 | (5.95 | ) | 361,156 | 0.26 | 0.26 | 0.47 | 1.66 | 57 | ||||||||||||||||||||||||||||||
2007 | 16.93 | 0.28 | 3.40 | 3.68 | (0.30 | ) | — | (0.30 | ) | 20.31 | 21.97 | 693,994 | 0.26 | 0.26 | 0.46 | 1.57 | 47 | |||||||||||||||||||||||||||||||||
2006 | 15.53 | 0.24 | 1.44 | 1.68 | (0.28 | ) | — | (0.28 | ) | 16.93 | 10.87 | 801,217 | 0.25 | 0.26 | 0.48 | 1.47 | 103 | |||||||||||||||||||||||||||||||||
2005 | 14.47 | 0.25 | 1.05 | 1.30 | (0.24 | ) | — | (0.24 | ) | 15.53 | 9.02 | 1,751,751 | 0.26 | 0.26 | 0.47 | 1.67 | 43 | |||||||||||||||||||||||||||||||||
Large Cap Diversified Alpha Fund |
| |||||||||||||||||||||||||||||||||||||||||||||||||
Class A | ||||||||||||||||||||||||||||||||||||||||||||||||||
2009@ | $ | 6.35 | $ | 0.05 | $ | 1.28 | $ | 1.33 | $ | (0.03 | ) | $ | — | $ | (0.03 | ) | $ | 7.65 | 20.95 | % | $ | 355,676 | 0.31 | % | 0.31 | % | 0.47 | % | 1.32 | % | 53 | % | ||||||||||||||||||
2009 | 10.23 | 0.10 | (3.91 | ) | (3.81 | ) | (0.07 | )** | — | (0.07 | ) | 6.35 | (37.33 | ) | 331,002 | 0.48 | * | 0.48 | * | 0.64 | 1.41 | 132 | ||||||||||||||||||||||||||||
2008 | 11.94 | 0.13 | (1.15 | ) | (1.02 | ) | (0.17 | ) | (0.52 | ) | (0.69 | ) | 10.23 | (8.80 | ) | 552,361 | 0.64 | * | 0.64 | * | 0.79 | 1.17 | 77 | |||||||||||||||||||||||||||
2007 | 9.94 | 0.19 | 2.04 | 2.23 | (0.16 | ) | (0.07 | ) | (0.23 | ) | 11.94 | 22.64 | 453,954 | 0.62 | * | 0.62 | * | 0.74 | 1.77 | 132 | ||||||||||||||||||||||||||||||
2006(1) | 10.00 | 0.04 | (0.09 | ) | (0.05 | ) | (0.01 | ) | — | (0.01 | ) | 9.94 | (0.49 | ) | 139,046 | 0.45 | * | 0.45 | * | 0.66 | 1.70 | 47 | ||||||||||||||||||||||||||||
Large Cap Disciplined Equity Fund |
| |||||||||||||||||||||||||||||||||||||||||||||||||
Class A | ||||||||||||||||||||||||||||||||||||||||||||||||||
2009@ | $ | 7.36 | $ | 0.08 | $ | 1.45 | $ | 1.53 | $ | (0.04 | ) | $ | — | $ | (0.04 | ) | $ | 8.85 | 20.91 | % | $ | 7,221,501 | 0.19 | % | 0.19 | % | 0.47 | % | 1.92 | % | 52 | % | ||||||||||||||||||
2009 | 12.07 | 0.16 | (4.75 | ) | (4.59 | ) | (0.12 | )*** | — | (0.12 | ) | 7.36 | (38.18 | ) | 6,043,119 | 0.19 | 0.19 | 0.47 | 1.97 | 108 | ||||||||||||||||||||||||||||||
2008 | 14.38 | 0.22 | (1.54 | ) | (1.32 | ) | (0.25 | ) | (0.74 | ) | (0.99 | ) | 12.07 | (9.57 | ) | 8,767,342 | 0.19 | 0.19 | 0.47 | 1.70 | 111 | |||||||||||||||||||||||||||||
2007†† | 12.36 | 0.51 | 2.27 | 2.78 | (0.30 | ) | (0.46 | ) | (0.76 | ) | 14.38 | 23.15 | 7,833,212 | 0.23 | (3) | 0.23 | (3) | 0.47 | (3) | 2.43 | 135 | |||||||||||||||||||||||||||||
2006†† | 12.05 | 0.26 | 0.85 | 1.11 | (0.22 | ) | (0.58 | ) | (0.80 | ) | 12.36 | 9.33 | 4,938,416 | 0.24 | 0.24 | 0.47 | 2.10 | 140 | ||||||||||||||||||||||||||||||||
2005†† | 11.18 | 0.20 | 0.94 | 1.14 | (0.18 | ) | (0.09 | ) | (0.27 | ) | 12.05 | 10.26 | 3,531,361 | 0.31 | 0.31 | 0.47 | 1.69 | 71 | ||||||||||||||||||||||||||||||||
Large Cap Index Fund |
| |||||||||||||||||||||||||||||||||||||||||||||||||
Class A | ||||||||||||||||||||||||||||||||||||||||||||||||||
2009@ | $ | 78.92 | $ | 1.07 | $ | 15.03 | $ | 16.10 | $ | (0.85 | ) | $ | — | $ | (0.85 | ) | $ | 94.17 | 20.54 | % | $ | 500,256 | 0.06 | % | 0.06 | % | 0.24 | % | 2.46 | % | 7 | % | ||||||||||||||||||
2009 | 121.02 | 2.13 | (41.96 | ) | (39.83 | ) | (2.13 | ) | (0.14 | ) | (2.27 | ) | 78.92 | (32.99 | ) | 353,892 | 0.06 | 0.06 | 0.25 | 2.56 | 18 | |||||||||||||||||||||||||||||
2008 | 135.30 | 2.47 | (10.72 | ) | (8.25 | ) | (2.52 | ) | (3.51 | ) | (6.03 | ) | 121.02 | (6.25 | ) | 386,873 | 0.06 | 0.06 | 0.24 | 1.97 | 14 | |||||||||||||||||||||||||||||
2007 | 113.02 | 2.29 | 23.15 | 25.44 | (2.33 | ) | (0.83 | ) | (3.16 | ) | 135.30 | 22.87 | 416,933 | 0.06 | 0.06 | 0.24 | 1.88 | 10 | ||||||||||||||||||||||||||||||||
2006 | 106.24 | 2.06 | 7.77 | 9.83 | (1.94 | ) | (1.11 | ) | (3.05 | ) | 113.02 | 9.34 | 367,084 | 0.08 | 0.08 | 0.24 | 1.84 | 20 | ||||||||||||||||||||||||||||||||
2005 | 99.12 | 1.93 | 7.20 | 9.13 | (1.82 | ) | (0.19 | ) | (2.01 | ) | 106.24 | 9.29 | 320,703 | 0.13 | 0.13 | 0.24 | 1.89 | 8 | ||||||||||||||||||||||||||||||||
Small Cap Fund |
| |||||||||||||||||||||||||||||||||||||||||||||||||
Class A | ||||||||||||||||||||||||||||||||||||||||||||||||||
2009@ | $ | 7.97 | $ | 0.05 | $ | 1.48 | $ | 1.53 | $ | (0.03 | ) | $ | — | $ | (0.03 | ) | $ | 9.47 | 19.29 | % | $ | 1,206,896 | 0.53 | % | 0.54 | % | 0.72 | % | 1.00 | % | 64 | % | ||||||||||||||||||
2009 | 12.42 | 0.11 | (4.37 | ) | (4.26 | ) | (0.19 | ) | — | (0.19 | ) | 7.97 | (34.27 | ) | 985,860 | 0.52 | 0.54 | 0.72 | 1.26 | 122 | ||||||||||||||||||||||||||||||
2008 | 16.44 | 0.11 | (2.26 | ) | (2.15 | ) | (0.12 | ) | (1.75 | ) | (1.87 | ) | 12.42 | (13.58 | ) | 1,819,700 | 0.52 | 0.54 | 0.72 | 0.80 | 99 | |||||||||||||||||||||||||||||
2007 | 15.52 | 0.10 | 2.85 | 2.95 | (0.12 | ) | (1.91 | ) | (2.03 | ) | 16.44 | 20.32 | 2,136,857 | 0.52 | 0.54 | 0.72 | 0.67 | 92 | ||||||||||||||||||||||||||||||||
2006 | 14.27 | 0.07 | 2.55 | 2.62 | (0.06 | ) | (1.31 | ) | (1.37 | ) | 15.52 | 18.93 | 1,951,138 | 0.52 | 0.54 | 0.72 | 0.44 | 119 | ||||||||||||||||||||||||||||||||
2005 | 14.70 | 0.07 | 1.38 | 1.45 | (0.05 | ) | (1.83 | ) | (1.88 | ) | 14.27 | 9.81 | 1,610,876 | 0.54 | 0.54 | 0.72 | 0.46 | 94 | ||||||||||||||||||||||||||||||||
| @ | For the six-month period ended November 30, 2009. All ratios for the period have been annualized. |
| * | The expense ratio includes dividend and interest expenses on short sales. Had these expenses been excluded, the ratios would have been 0.31% for the period ended May 31, 2009 and 0.32%, 0.35% and 0.34% for 2008, 2007 and 2006, respectively. |
| ** | Includes a return of capital of $0.05 per share. See Note 8 in Notes to Financial Statements. |
| *** | Includes a return of capital of $0.10 per share. See Note 8 in Notes to Financial Statements. |
| † | Returns and portfolio turnover rates are for the period indicated and have not been annualized. Returns do not reflect the deduction of taxes the shareholder would pay on fund distributions or redemption of Fund shares. |
| †† | Per share amounts have been adjusted for a 10 to 1 stock split paid to shareholders of record on November 16, 2006. |
| (1) | Commenced operations on February 28, 2006. All ratios for the period have been annualized. |
| (2) | Per share net investment income and net realized and unrealized gains (losses) calculated using average shares. |
| (3) | The expense ratio includes interest expense on reverse repurchase agreements. Had this expense been excluded, the ratios would have been 0.22%, 0.22%, and 0.47%, respectively. |
Amounts designated as “—” are zero or have been rounded to zero.
The accompanying notes are an integral part of the financial statements.
| 122 | SEI Institutional Investments Trust / Semi-Annual Report / November 30, 2009 |
Table of Contents
Financial Highlights
For the period ended November 30, 2009 (Unaudited) and the years or periods ended May 31,
For a share outstanding throughout each period
| Net Asset Value, Beginning of Period | Net Investment Income(3) | Net | Total from Operations | Dividends from Net Investment Income | Distributions from Realized Capital Gains | Total Dividends and Distributions | Net Asset Value, End of Period | Total Return† | Net Assets End of Period ($ Thousands) | Ratio of Net Expenses to Average Net Assets | Ratio of Expenses to Average Net Assets (Excluding Fees Paid Indirectly and Including Waivers) | Ratio of Expenses to Average Net Assets (Excluding Fees Paid Indirectly and Waivers) | Ratio of | Portfolio Turnover Rate† | ||||||||||||||||||||||||||||||||||||
Small/Mid Cap Equity Fund |
| |||||||||||||||||||||||||||||||||||||||||||||||||
Class A | ||||||||||||||||||||||||||||||||||||||||||||||||||
2009@ | $ | 7.85 | $ | 0.04 | $ | 1.55 | $ | 1.59 | $ | (0.07 | ) | $ | — | $ | (0.07 | ) | $ | 9.37 | 20.42 | % | $ | 2,087,757 | 0.49 | % | 0.50 | % | 0.72 | % | 0.94 | % | 55 | % | ||||||||||||||||||
2009 | 12.22 | 0.12 | (4.36 | ) | (4.24 | ) | (0.13 | ) | — | (0.13 | ) | 7.85 | (34.70 | ) | 1,724,824 | 0.48 | 0.50 | 0.72 | 1.40 | 125 | ||||||||||||||||||||||||||||||
2008 | 14.95 | 0.12 | (1.91 | ) | (1.79 | ) | (0.12 | ) | (0.82 | ) | (0.94 | ) | 12.22 | (12.14 | ) | 2,373,056 | 0.49 | 0.50 | 0.72 | 0.97 | 95 | |||||||||||||||||||||||||||||
2007†† | 13.38 | 0.19 | 2.57 | 2.76 | (0.13 | ) | (1.06 | ) | (1.19 | ) | 14.95 | 21.60 | 1,865,746 | 0.48 | 0.50 | 0.72 | 0.85 | 104 | ||||||||||||||||||||||||||||||||
2006†† | 11.96 | 0.09 | 1.97 | 2.06 | (0.08 | ) | (0.56 | ) | (0.64 | ) | 13.38 | 17.51 | 1,216,640 | 0.50 | 0.53 | 0.72 | 0.69 | 123 | ||||||||||||||||||||||||||||||||
2005†† | 10.70 | 0.05 | 1.38 | 1.43 | (0.05 | ) | (0.12 | ) | (0.17 | ) | 11.96 | 13.38 | 768,897 | 0.62 | 0.62 | 0.72 | 0.47 | 98 | ||||||||||||||||||||||||||||||||
U.S. Managed Volatility Fund |
| |||||||||||||||||||||||||||||||||||||||||||||||||
Class A | ||||||||||||||||||||||||||||||||||||||||||||||||||
2009@ | $ | 9.55 | $ | 0.12 | $ | 1.37 | $ | 1.49 | $ | (0.10 | ) | $ | — | $ | (0.10 | ) | $ | 10.94 | 15.76 | % | $ | 289,962 | 0.35 | % | 0.35 | % | 0.72 | % | 2.24 | % | 35 | % | ||||||||||||||||||
2009(2) | 10.00 | 0.09 | (0.51 | ) | (0.42 | ) | (0.03 | ) | — | (0.03 | ) | 9.55 | (4.16 | ) | 237,860 | 0.35 | 0.35 | 0.75 | 2.31 | 31 | ||||||||||||||||||||||||||||||
International Equity Fund | ||||||||||||||||||||||||||||||||||||||||||||||||||
Class A | ||||||||||||||||||||||||||||||||||||||||||||||||||
2009@ | $ | 6.08 | $ | 0.06 | $ | 0.94 | $ | 1.00 | $ | — | $ | — | $ | — | $ | 7.08 | 16.45 | % | $ | 750,119 | 0.39 | % | 0.39 | % | 0.62 | % | 1.74 | % | 67 | % | ||||||||||||||||||||
2009 | 11.12 | 0.21 | (5.15 | ) | (4.94 | ) | (0.09 | ) | (0.01 | ) | (0.10 | ) | 6.08 | (44.32 | ) | 704,876 | 0.39 | (9) | 0.39 | (9) | 0.61 | (9) | 3.03 | 200 | ||||||||||||||||||||||||||
2008 | 14.27 | 0.37 | (1.05 | ) | (0.68 | ) | (0.44 | ) | (2.03 | ) | (2.47 | ) | 11.12 | (5.52 | ) | 1,452,962 | 0.40 | (8) | 0.41 | (8) | 0.62 | (8) | 2.99 | 145 | ||||||||||||||||||||||||||
2007 | 14.05 | 0.37 | 3.12 | 3.49 | (0.50 | ) | (2.77 | ) | (3.27 | ) | 14.27 | 28.00 | 1,790,634 | 0.50 | (5) | 0.50 | (5) | 0.71 | (5) | 2.69 | 153 | |||||||||||||||||||||||||||||
2006 | 11.15 | 0.29 | 3.09 | 3.38 | (0.37 | ) | (0.11 | ) | (0.48 | ) | 14.05 | 30.77 | 1,656,985 | 0.36 | 0.36 | 0.63 | 2.30 | 116 | ||||||||||||||||||||||||||||||||
2005 | 10.06 | 0.23 | 1.16 | 1.39 | (0.30 | ) | — | (0.30 | ) | 11.15 | 13.73 | 1,677,254 | 0.43 | 0.43 | 0.58 | 2.12 | 48 | |||||||||||||||||||||||||||||||||
World Equity Ex-US Fund | ||||||||||||||||||||||||||||||||||||||||||||||||||
Class A | ||||||||||||||||||||||||||||||||||||||||||||||||||
2009@ | $ | 8.39 | $ | 0.08 | $ | 1.42 | $ | 1.50 | $ | — | $ | — | $ | — | $ | 9.89 | 17.88 | % | $ | 3,401,044 | 0.45 | % | 0.45 | % | 0.64 | % | 1.64 | % | 61 | % | ||||||||||||||||||||
2009 | 14.56 | 0.26 | (6.43 | ) | (6.17 | ) | — | — | — | 8.39 | (42.38 | ) | 2,721,757 | 0.45 | (10) | 0.45 | (10) | 0.66 | (10) | 3.03 | 171 | |||||||||||||||||||||||||||||
2008 | 15.96 | 0.38 | (0.51 | ) | (0.13 | ) | (0.39 | ) | (0.88 | ) | (1.27 | ) | 14.56 | (1.14 | ) | 3,301,120 | 0.57 | 0.57 | 0.67 | 2.58 | 153 | |||||||||||||||||||||||||||||
2007 | 12.99 | 0.35 | 3.47 | 3.82 | (0.33 | ) | (0.52 | ) | (0.85 | ) | 15.96 | 30.29 | 2,053,014 | 0.71 | (6) | 0.71 | (6) | 0.77 | (6) | 2.45 | 154 | |||||||||||||||||||||||||||||
2006 | 9.81 | 0.27 | 3.01 | 3.28 | (0.09 | ) | (0.01 | ) | (0.10 | ) | 12.99 | 33.52 | 908,582 | 0.60 | 0.61 | 0.76 | 2.22 | 104 | ||||||||||||||||||||||||||||||||
2005(4) | 10.00 | 0.07 | (0.26 | ) | (0.19 | ) | — | — | — | 9.81 | (1.90 | ) | 234,396 | 0.60 | 0.60 | 0.70 | 4.35 | 15 | ||||||||||||||||||||||||||||||||
Screened World Equity Ex-US Fund |
| |||||||||||||||||||||||||||||||||||||||||||||||||
Class A | ||||||||||||||||||||||||||||||||||||||||||||||||||
2009@ | $ | 6.42 | $ | 0.04 | $ | 1.16 | $ | 1.20 | $ | — | $ | — | $ | — | $ | 7.62 | 18.69 | % | $ | 74,441 | 0.80 | % | 0.80 | % | 1.11 | % | 1.21 | % | 58 | % | ||||||||||||||||||||
2009(1) | 10.00 | 0.14 | (3.66 | ) | (3.52 | ) | (0.06 | ) | — | (0.06 | ) | 6.42 | (35.12 | ) | 52,107 | 0.80 | 0.80 | 1.10 | 2.38 | 101 | ||||||||||||||||||||||||||||||
Enhanced LIBOR Opportunities Fund |
| |||||||||||||||||||||||||||||||||||||||||||||||||
Class A | ||||||||||||||||||||||||||||||||||||||||||||||||||
2009@ | $ | 6.95 | $ | 0.09 | $ | 0.49 | $ | 0.58 | $ | (0.04 | ) | $ | — | $ | (0.04 | ) | $ | 7.49 | 8.41 | % | $ | 150,787 | 0.41 | % | 0.41 | % | 0.54 | % | 2.43 | % | 13 | % | ||||||||||||||||||
2009 | 9.11 | 0.22 | (2.22 | ) | (2.00 | ) | (0.16 | )* | — | (0.16 | ) | 6.95 | (22.20 | ) | 165,113 | 0.41 | 0.41 | 0.54 | 2.91 | 27 | ||||||||||||||||||||||||||||||
2008 | 10.14 | 0.42 | (1.00 | ) | (0.58 | ) | (0.44 | ) | (0.01 | ) | (0.45 | ) | 9.11 | (5.88 | ) | 244,380 | 0.42 | 0.42 | 0.55 | 4.45 | 25 | |||||||||||||||||||||||||||||
2007(7) | 10.00 | 0.27 | 0.03 | 0.30 | (0.16 | ) | — | (0.16 | ) | 10.14 | 3.02 | 123,430 | 0.44 | 0.44 | 0.54 | 5.84 | 53 | |||||||||||||||||||||||||||||||||
Core Fixed Income Fund | ||||||||||||||||||||||||||||||||||||||||||||||||||
Class A | ||||||||||||||||||||||||||||||||||||||||||||||||||
2009@ | $ | 9.42 | $ | 0.26 | $ | 0.73 | $ | 0.99 | $ | (0.26 | ) | $ | — | $ | (0.26 | ) | $ | 10.15 | 10.60 | % | $ | 5,446,462 | 0.14 | % | 0.14 | % | 0.37 | % | 5.20 | % | 103 | % | ||||||||||||||||||
2009 | 9.95 | 0.52 | (0.38 | ) | 0.14 | (0.52 | ) | (0.15 | ) | (0.67 | ) | 9.42 | 1.85 | 4,540,593 | 0.14 | 0.14 | 0.37 | 5.56 | 411 | |||||||||||||||||||||||||||||||
2008 | 9.99 | 0.54 | (0.04 | ) | 0.50 | (0.54 | ) | — | (0.54 | ) | 9.95 | 5.10 | 6,149,448 | 0.14 | 0.14 | 0.37 | 5.35 | 432 | ||||||||||||||||||||||||||||||||
2007 | 9.84 | 0.53 | 0.14 | 0.67 | (0.52 | ) | — | (0.52 | ) | 9.99 | 6.95 | 5,894,127 | 0.14 | 0.14 | 0.37 | 5.23 | 428 | |||||||||||||||||||||||||||||||||
2006 | 10.34 | 0.47 | (0.48 | ) | (0.01 | ) | (0.48 | ) | (0.01 | ) | (0.49 | ) | 9.84 | (0.09 | ) | 4,646,403 | 0.14 | 0.14 | 0.37 | 4.62 | 545 | |||||||||||||||||||||||||||||
2005 | 10.19 | 0.41 | 0.27 | 0.68 | (0.42 | ) | (0.11 | ) | (0.53 | ) | 10.34 | 6.77 | 4,265,249 | 0.15 | 0.15 | 0.37 | 3.94 | 615 | ||||||||||||||||||||||||||||||||
| @ | For the six-month period ended November 30, 2009. All ratios for the period have been annualized. |
| * | Includes a return of capital of $0.04 per share. See Note 8 in Notes to Financial Statements. |
| † | Returns and portfolio turnover rates are for the period indicated and have not been annualized. Returns do not reflect the deduction of taxes the shareholder would pay on fund distributions or redemption of Fund shares. |
| †† | Per share amounts have been adjusted for a 10 to 1 stock split paid to shareholders of record on November 16, 2006. |
| (1) | Commenced operations on June 30, 2008. All ratios for the period have been annualized. |
| (2) | Commenced operations on December 30, 2008. All ratios for the period have been annualized. |
| (3) | Per share net investment income and net realized and unrealized gains (losses) calculated using average shares. |
| (4) | Commenced operations on March 28, 2005. All ratios for the period have been annualized. |
| (5) | The expense ratio includes interest expense on reverse repurchase agreements. Had this expense been excluded, the ratios would have been 0.37%, 0.37%, and 0.59%, respectively. |
| (6) | The expense ratio includes interest expense on reverse repurchase agreements. Had this expense been excluded, the ratios would have been 0.60%, 0.60%, and 0.67%, respectively. |
| (7) | Commenced operations on December 14, 2006. All ratios for the period have been annualized. |
| (8) | The expense ratio includes interest expense on reverse repurchase agreements. Had this expense been excluded, the ratio would have been 0.39%, 0.40%, and 0.61%, respectively. |
| (9) | The expense ratio includes interest expense on reverse repurchase agreements. Had this expense been excluded, the ratio would have been 0.39%, 0.39%, and 0.61%, respectively. |
| (10) | The expense ratio includes interest expense on reverse repurchase agreements. Had this expense been excluded, the ratio would have been 0.45%, 0.45%, and 0.66%, respectively. |
Amounts designated as “—” are zero or have been rounded to zero.
The accompanying notes are an integral part of the financial statements.
| SEI Institutional Investments Trust / Semi-Annual Report / November 30, 2009 | 123 |
Table of Contents
Financial Highlights
For the period ended November 30, 2009 (Unaudited) and the years or periods ended May 31,
For a share outstanding throughout each period
| Net Asset Value, Beginning of Period | Net Investment Income(3) | Net | Total from Operations | Dividends from Net Investment Income | Distributions from Realized Capital Gains | Total Dividends and Distributions | Net Asset Value, End of Period | Total Return† | Net Assets End of Period ($Thousands) | Ratio of Net Assets | Ratio of Net Assets | Ratio of Net Assets | Ratio of Net Investment Income to Average Net Assets | Portfolio Turnover Rate† | ||||||||||||||||||||||||||||||||||||
High Yield Bond Fund |
| |||||||||||||||||||||||||||||||||||||||||||||||||
Class A | ||||||||||||||||||||||||||||||||||||||||||||||||||
2009@ | $ | 7.00 | $ | 0.40 | $ | 1.47 | $ | 1.87 | $ | (0.39 | ) | $ | — | $ | (0.39 | ) | $ | 8.48 | 27.23 | % | $ | 1,448,609 | 0.35 | % | 0.35 | % | 0.57 | % | 10.16 | % | 56 | % | ||||||||||||||||||
2009 | 9.17 | 0.80 | (2.14 | ) | (1.34 | ) | (0.77 | ) | (0.06 | ) | (0.83 | ) | 7.00 | (13.79 | ) | 1,239,271 | 0.35 | 0.35 | 0.56 | 11.34 | 79 | |||||||||||||||||||||||||||||
2008 | 10.33 | 0.82 | (1.07 | ) | (0.25 | ) | (0.82 | ) | (0.09 | ) | (0.91 | ) | 9.17 | (2.36 | ) | 1,399,859 | 0.35 | 0.35 | 0.55 | 8.63 | 59 | |||||||||||||||||||||||||||||
2007 | 10.08 | 0.84 | 0.30 | 1.14 | (0.84 | ) | (0.05 | ) | (0.89 | ) | 10.33 | 11.81 | 1,241,924 | 0.35 | 0.35 | 0.56 | 8.25 | 98 | ||||||||||||||||||||||||||||||||
2006(2) | 10.00 | 0.40 | 0.08 | 0.48 | (0.40 | ) | — | (0.40 | ) | 10.08 | 4.85 | 862,371 | 0.35 | 0.35 | 0.57 | 8.15 | 58 | |||||||||||||||||||||||||||||||||
Long Duration Fund |
| |||||||||||||||||||||||||||||||||||||||||||||||||
Class A | ||||||||||||||||||||||||||||||||||||||||||||||||||
2009@ | $ | 7.77 | $ | 0.23 | $ | 0.85 | $ | 1.08 | $ | (0.23 | ) | $ | — | $ | (0.23 | ) | $ | 8.62 | 14.02 | % | $ | 2,177,673 | 0.20 | % | 0.20 | % | 0.37 | % | 5.62 | % | 68 | % | ||||||||||||||||||
2009 | 8.57 | 0.39 | (0.72 | ) | (0.33 | ) | (0.47 | ) | — | (0.47 | ) | 7.77 | (3.89 | ) | 1,489,047 | 0.20 | 0.20 | 0.39 | 4.88 | 95 | ||||||||||||||||||||||||||||||
2008 | 9.52 | 0.51 | (0.91 | ) | (0.40 | ) | (0.55 | ) | — | (0.55 | ) | 8.57 | (4.52 | ) | 115,754 | 0.20 | 0.20 | 0.39 | 5.47 | 58 | ||||||||||||||||||||||||||||||
2007 | 9.31 | 0.53 | 0.18 | 0.71 | (0.50 | ) | — | (0.50 | ) | 9.52 | 7.67 | 184,616 | 0.20 | 0.20 | 0.38 | 5.49 | 97 | |||||||||||||||||||||||||||||||||
2006 | 10.56 | 0.46 | (1.07 | ) | (0.61 | ) | (0.54 | ) | (0.10 | ) | (0.64 | ) | 9.31 | (6.08 | ) | 165,324 | 0.20 | 0.20 | 0.39 | 4.69 | 113 | |||||||||||||||||||||||||||||
2005 | 9.77 | 0.42 | 1.03 | 1.45 | (0.54 | ) | (0.12 | ) | (0.66 | ) | 10.56 | 15.26 | 76,054 | 0.20 | 0.20 | 0.41 | 4.05 | 449 | ||||||||||||||||||||||||||||||||
Emerging Markets Debt Fund |
| |||||||||||||||||||||||||||||||||||||||||||||||||
Class A | ||||||||||||||||||||||||||||||||||||||||||||||||||
2009@ | $ | 9.27 | $ | 0.44 | $ | 1.24 | $ | 1.68 | $ | (0.43 | ) | $ | — | $ | (0.43 | ) | $ | 10.52 | 18.59 | % | $ | 952,187 | 0.55 | % | 0.55 | % | 0.93 | % | 8.78 | % | 37 | % | ||||||||||||||||||
2009 | 10.42 | 0.75 | (1.19 | ) | (0.44 | ) | (0.71 | ) | — | (0.71 | ) | 9.27 | (3.55 | ) | 901,226 | 0.55 | 0.55 | 0.94 | 8.56 | 78 | ||||||||||||||||||||||||||||||
2008 | 10.95 | 0.70 | (0.37 | ) | 0.33 | (0.75 | ) | (0.11 | ) | (0.86 | ) | 10.42 | 3.24 | 1,062,491 | 0.55 | 0.55 | 0.93 | 6.65 | 66 | |||||||||||||||||||||||||||||||
2007 | 9.97 | 0.65 | 1.03 | 1.68 | (0.62 | ) | (0.08 | ) | (0.70 | ) | 10.95 | 17.40 | 804,036 | 0.55 | 0.55 | 0.94 | 6.16 | 89 | ||||||||||||||||||||||||||||||||
2006(2) | 10.00 | 0.27 | (0.17 | ) | 0.10 | (0.13 | ) | — | (0.13 | ) | 9.97 | 1.00 | 479,808 | 0.55 | 0.55 | 0.95 | 5.43 | 51 | ||||||||||||||||||||||||||||||||
Real Return Fund |
| |||||||||||||||||||||||||||||||||||||||||||||||||
Class A | ||||||||||||||||||||||||||||||||||||||||||||||||||
2009@ | $ | 10.11 | $ | 0.21 | $ | 0.28 | $ | 0.49 | $ | — | $ | — | $ | — | $ | 10.60 | 4.85 | % | $ | 268,902 | 0.36 | % | 0.36 | % | 0.77 | % | 4.20 | % | 122 | % | ||||||||||||||||||||
2009 | 10.99 | 0.21 | (0.27 | ) | (0.06 | ) | (0.82 | )* | — | (0.82 | ) | 10.11 | (0.17 | ) | 260,477 | 0.36 | 0.36 | 0.78 | 2.01 | 148 | ||||||||||||||||||||||||||||||
2008 | 10.10 | 0.58 | 0.75 | 1.33 | (0.34 | ) | (0.10 | ) | (0.44 | ) | 10.99 | 13.30 | 362,129 | 0.43 | 0.43 | 0.77 | 5.36 | 47 | ||||||||||||||||||||||||||||||||
2007(1) | 10.00 | 0.26 | (0.03 | ) | 0.23 | (0.13 | ) | — | (0.13 | ) | 10.10 | 2.29 | 221,531 | 0.44 | 0.44 | 0.78 | 5.67 | 18 | ||||||||||||||||||||||||||||||||
| @ | For the six-month period ended November 30, 2009. All ratios for the period have been annualized. |
| * | Includes a return of capital of $0.06 per share. See Note 8 in Notes to Financial Statements. |
| † | Returns and portfolio turnover rates are for the period indicated and have not been annualized. Returns do not reflect the deduction of taxes the shareholder would pay on fund distributions or redemption of Fund shares. |
| (1) | Commenced operations on December 14, 2006. All ratios for the period have been annualized. |
| (2) | Commenced operations on December 5, 2005. All ratios for the period have been annualized. |
| (3) | Per share net investment income and net realized and unrealized gains (losses) calculated using average shares. |
Amounts designated as “—” are zero or have been rounded to zero.
The accompanying notes are an integral part of the financial statements.
| 124 | SEI Institutional Investments Trust / Semi-Annual Report / November 30, 2009 |
Table of Contents
Notes to Financial Statements (Unaudited)
November 30, 2009
1. ORGANIZATION
SEI Institutional Investments Trust (the “Trust”) was organized as a Massachusetts business trust under a Declaration of Trust dated March 1, 1995. The Trust commenced operations on June 14, 1996.
The Trust is registered under the Investment Company Act of 1940, as amended, as an open-end investment company currently offering 16 Funds: Large Cap, Large Cap Diversified Alpha, Large Cap Disciplined Equity, Large Cap Index, Small Cap, Small/Mid Cap Equity, U.S. Managed Volatility, International Equity, World Equity Ex-US, Screened World Equity Ex-US, Enhanced LIBOR Opportunities, Core Fixed Income, High Yield Bond, Long Duration, Emerging Markets Debt and Real Return Funds (each a “Fund,” collectively, the “Funds”) each of which are diversified Funds with the exception of the Emerging Markets Debt Fund. The Trust is registered to offer Class A shares of all Funds. The assets of each Fund are segregated, and a shareholder’s interest is limited to the Fund in which shares are held. The Trust’s prospectus provides a description of each Fund’s investment objectives, policies, and strategies.
On May 13, 2009, the Board of Trustees approved the name and strategy change of the Real Return Plus Fund to the Real Return Fund.
2. SIGNIFICANT ACCOUNTING POLICIES
Financial Accounting Standards Board (“FASB”) has issued FASB ASC105 (formerly FASB Statement No. 168), The “FASB Accounting Standards Codification™” and the Hierarchy of Generally Accepted Accounting Principles (“ASC 105”). ASC 105 established the FASB Accounting Standards Codification™ (“Codification” or “ASC”) as the single source of authoritative U.S. generally accepted accounting principles (“GAAP”) recognized by the FASB to be applied by nongovernmental entities. Rules and interpretive releases of the Securities and Exchange Commission (“SEC”) under authority of federal securities laws were also sources of authoritative GAAP for SEC registrants. The Codification superseded all existing non-SEC accounting and reporting standards. All other non-grandfathered, non-SEC accounting literature not included in the Codification have become non-authoritative.
Following the Codification, the FASB will not issue new standards in the form of Statements, FASB Staff Positions or Emerging Issues Task Force Abstracts. Instead, it will issue Accounting Standards Updates, which will serve to update the Codification, provide background information about the guidance and provide the basis for conclusions on the changes to the Codification.
GAAP was not intended to be changed as a result of the FASB’s Codification project, but it has changed the way the guidance is organized and presented. As a result, these changes have had an impact on how companies reference GAAP in their financial statements and in their accounting policies for financial statements issued for interim and annual periods ending after September 15, 2009. The Trust implemented the Codification as of November 30, 2009.
The following is a summary of the significant accounting policies followed by the Funds.
Use of Estimates — The preparation of financial statements, in conformity with U.S. generally accepted accounting principles, requires management to make estimates and assumptions that affect the reported amount of assets and liabilities and disclosure of contingent assets and liabilities at the date of the financial statements and the reported amounts of increases and decreases in net assets from operations during the reporting period. Actual results could differ from those estimates.
Security Valuation — Securities listed on a securities exchange, market or automated quotation system for which quotations are readily available (except for securities traded on NASDAQ) are valued at the last quoted sale price on the primary exchange or market (foreign or domestic) on which they are traded, or, if there is no such reported sale, at the most recent quoted bid price. For securities traded on NASDAQ, the NASDAQ Official Closing Price will be used. Debt securities are priced based upon valuations provided by independent, third-party pricing agents, if available. Such values generally reflect the last reported sales price if the security is actively traded. The third-party pricing agents may also value debt securities at an evaluated bid price by employing methodologies that utilize actual market transactions, broker-supplied valuations, or other methodologies designed to identify the market value for such securities. Debt obligations acquired with remaining maturities of sixty days or less may be valued at their amortized cost, which approximates market value. The prices for foreign securities are reported in local currency and converted to U.S. dollars using currency exchange rates. Prices for most securities held in the Funds are provided daily by recognized independent pricing agents. If a security price cannot be obtained from an independent, third-party pricing agent, the Funds seek to obtain a bid price from at least one independent broker.
Securities for which market prices are not “readily available” are valued in accordance with Fair Value Procedures established by the Trust’s Board of Trustees. The Trust’s Fair Value Procedures are implemented through a Fair Value Committee (the “Committee”) designated by the Trust’s Board of Trustees. Some of the more common reasons that may necessitate that a security be valued using Fair Value Procedures include: the security’s trading has been halted or suspended; the security has been de-listed from a national exchange; the security’s primary trading market is temporarily closed at a time when under normal conditions it would be open; or the security’s primary pricing source is not able or willing to provide a price. When a security is valued in accordance with the Fair Value Procedures, the Committee will determine the value after taking into consideration relevant information reasonably available to the Committee.
For securities that principally trade on a foreign market or exchange, a significant gap in time can exist between the time of a particular security’s last trade and the time at which a Fund calculates its net
| SEI Institutional Investments Trust / Semi-Annual Report / November 30, 2009 | 125 |
Table of Contents
Notes to Financial Statements (Unaudited) (Continued)
November 30, 2009
asset value. The closing prices of such securities may no longer reflect their market value at the time a Fund calculates net asset value if an event that could materially affect the value of those securities (a “Significant Event”) has occurred between the time of the security’s last close and the time that a Fund calculates net asset value. A Significant Event may relate to a single issuer or to an entire market sector. If the adviser or sub-adviser of a Fund becomes aware of a Significant Event that has occurred with respect to a security or group of securities after the closing of the exchange or market on which the security or securities principally trade, but before the time at which a Fund calculates net asset value, the adviser or sub-adviser may request that a Fair Value Committee Meeting be called. In addition, the Trust’s administrator monitors price movements among certain selected indices, securities and/or baskets of securities that may be an indicator that the closing prices received earlier from foreign exchanges or markets may not reflect market value at the time a Fund calculates net asset value. If price movements in a monitored index or security exceed levels established by the administrator, the administrator notifies the adviser or sub-adviser for any Fund holding the relevant securities that such limits have been exceeded. In such event, the adviser or sub-adviser makes the determination whether a Fair Value Committee Meeting should be called based on the information provided.
The International Equity, World Equity Ex-US and Screened World Equity Ex-US Funds that hold international securities also use a third-party fair valuation vendor. The vendor provides a fair value for foreign securities held by these funds based on certain factors and methodologies (involving, generally, tracking valuation correlations between the U.S. market and each non-U.S. security). Values from the fair value vendor are applied in the event that there is a movement in the U.S. market that exceeds a specific threshold that has been established by the Committee. The Committee has also established a “confidence interval” which is used to determine the level of historical correlation between the value of a specific foreign security and movements in the U.S. market before a particular security will be fair valued when the threshold is exceeded. In the event that the threshold established by the Committee is exceeded on a specific day, these funds that hold international securities will value the non-U.S. securities within that fund that exceed the applicable “confidence interval” based upon the adjusted prices provided by the fair valuation vendor.
Options and warrants for which the primary market is a national securities exchange are valued at the last sale price on the exchange on which they are traded, or, in the absence of any sale, at the closing bid price. Options and warrants not traded on a national securities exchange are valued at the last quoted bid price.
In accordance with U.S. generally accepted accounting principles, Fair Value is defined as the price that a Fund would receive upon selling an investment in a timely transaction to an independent buyer in the principal or most advantageous market of the investment. A three tier hierarchy has been established to maximize the use of observable
and minimize the use of unobservable inputs and to establish classification of fair value measurements for disclosure purposes. Inputs refer broadly to the assumptions that market participants would use in pricing an asset. Inputs may be observable or unobservable. Observable inputs are inputs that reflect the assumptions market participants would use in pricing the asset or liability based on market data obtained from sources independent of the reporting entity. Unobservable inputs are inputs that reflect the reporting entity’s own assumptions about the assumptions market participants would use in pricing the asset or liability based on the best information available in the circumstances.
The three-tier hierarchy of inputs is summarized in the three broad Levels listed below:
| Level 1 — | quoted prices in active markets for identical investments |
| Level 2 — | other significant observable inputs (including quoted prices for similar investments, interest rates, prepayment speeds, credit risks, etc.) |
| Level 3 — | significant unobservable inputs (including the Fund’s own assumptions in determining the fair value of investments) |
The valuation techniques used by the Funds to measure fair value during the six month period ended November 30, 2009 maximized the use of observable inputs and minimized the use of unobservable inputs.
For the six month period ended November 30, 2009, there have been no significant changes to the Trust’s fair valuation methodologies.
Security Transactions and Investment Income — Security transactions are recorded on the trade date. Cost used in determining net realized capital gains and losses on the sale of securities is determined on the basis of specific identification. Dividend income and expense is recognized on the ex-dividend date, and interest income or expense is recognized using the accrual basis of accounting.
Distributions received on securities that represent a return of capital or capital gain are recorded as a reduction of cost of investments and/or as a realized gain. The Trust estimates the components of distributions received that may be considered nontaxable distributions or capital gain distributions.
Amortization and accretion is calculated using the scientific interest method, which approximates the effective interest method over the holding period of the security. Amortization of premiums and discounts is included in interest income.
Repurchase Agreements — A Fund may agree to purchase securities from financial institutions subject to the seller’s agreement to repurchase them at a mutually agreed upon date and price. It is the Fund’s policy that repurchase agreements are fully collateralized by U.S. Treasury and Government Agency securities. All collateral is held by the Fund’s custodian bank or a bank with which the custodian bank has entered into a subcustodian agreement, or is segregated in the Federal Reserve Book Entry System. In connection with transactions in
| 126 | SEI Institutional Investments Trust / Semi-Annual Report / November 30, 2009 |
Table of Contents
repurchase agreements, if the seller defaults and the value of the collateral declines, or if the seller enters an insolvency proceeding, realization of the collateral by the Fund may be delayed or limited.
Reverse Repurchase Agreements — The Large Cap Diversified Alpha, Large Cap Disciplined Equity, International Equity, World Equity Ex-US, Screened World Equity Ex-US, Enhanced LIBOR Opportunities and Real Return Funds may issue reverse repurchase agreements. A reverse repurchase agreement involves the sale of portfolio assets together with an agreement to repurchase the same assets later at a fixed price. Additional assets are maintained in an account with the broker. The segregated assets may consist of cash, U.S. Government securities, or other liquid securities at least equal in value to the obligations under the reverse repurchase agreements. In the event the buyer of securities under a reverse repurchase agreement files for bankruptcy or becomes insolvent, those Funds use of the proceeds under the reverse repurchase agreement may be restricted pending a determination by the other party, or its trustee or receiver, whether to enforce the obligation to repurchase the securities. There were no outstanding reverse repurchase agreements as of November 30, 2009.
Expenses — Expenses that are directly related to a Fund are charged directly to that Fund. Other operating expenses of the Funds are prorated to the Funds on the basis of relative net assets.
Foreign Currency Translation — The books and records of the Funds investing in international securities are maintained in U.S. dollars on the following basis:
(I) market value of investment securities, assets and liabilities at the current rate of exchange; and
(II) purchases and sales of investment securities, income and expenses at the relevant rates of exchange prevailing on the respective dates of such transactions.
The Funds do not isolate that portion of gains and losses on investments in equity securities that is due to changes in the foreign exchange rates from that which is due to changes in market prices of equity securities.
The Funds report certain foreign-currency-related transactions as components of realized gains for financial reporting purposes, whereas such components are treated as ordinary income for Federal income tax purposes.
Forward Foreign Currency Contracts — The Funds may enter into forward foreign currency contracts as hedges against either specific transactions, fund positions or anticipated fund positions. All commitments are marked-to-market daily at the applicable foreign exchange rate, and any resulting unrealized gains or losses are recorded currently. The Large Cap Disciplined Equity, International Equity, World Equity Ex-US, Enhanced LIBOR Opportunities, Core Fixed Income and Emerging Markets Debt Funds realized gains and losses at the time forward contracts were extinguished. Unrealized
gains or losses on outstanding positions in forward foreign currency contracts held at the close of the period are recognized as ordinary income or loss for Federal income tax purposes. These funds could be exposed to risk if the counterparties to the contracts are unable to meet the terms of the contract and from unanticipated movements in the value of a foreign currency relative to the U.S. dollar.
Finally, the risk exists that losses could exceed amounts disclosed on the Schedule of Investments or the Statement of Assets and Liabilities.
Futures Contracts — Each of the Funds, with the exception of the High Yield Bond Fund, utilized futures contracts during the six month period ended November 30, 2009. These Funds’ investments in futures contracts are designed to enable the Funds to more closely approximate the performance of their benchmark indices. The Funds may use futures contracts for tactical hedging purposes as well as to enhance the Fund’s returns. Initial margin deposits of cash or securities are made upon entering into futures contracts. The contracts are marked to market daily and the resulting changes in value are accounted for as unrealized gains and losses. Variation margin payments are paid or received, depending upon whether unrealized gains or losses are incurred. When the contract is closed, the Funds record a realized gain or loss equal to the difference between the proceeds from (or cost of) the closing transaction and the amount invested in the contract.
Risks of entering into futures contracts include the possibility that there will be an imperfect price correlation between the futures and the underlying securities. Second, it is possible that a lack of liquidity for futures contracts could exist in the secondary market, resulting in an inability to close a position prior to its maturity date. Third, the futures contract involves the risk that a Fund could lose more than the original margin deposit required to initiate a futures transaction.
Finally, the risk exists that losses could exceed amounts disclosed on the Schedule of Investments or the Statement of Assets and Liabilities.
Options/Swaptions Written/Purchased — A Fund may invest in financial options/swaptions contracts for the purpose of hedging its existing portfolio securities, or securities that a Fund intends to purchase, against fluctuations in fair market value caused by changes in prevailing market interest rates. The Core Fixed Income Fund may also invest in financial option/swaption contracts to enhance its returns. When the Fund writes or purchases an option/swaption, an amount equal to the premium received or paid by the Fund is recorded as a liability or an asset and is subsequently adjusted to the current market value of the option/swaption written or purchased. Premiums received or paid from writing or purchasing options/ swaptions which expire unexercised are treated by the Fund on the expiration date as realized gains or losses. The difference between the premium and the amount paid or received on effecting a closing purchase or sale transaction, including brokerage commissions, is also treated as a realized gain or loss. If an option/swaption is exercised, the premium paid or received is added to the cost of the
| SEI Institutional Investments Trust / Semi-Annual Report / November 30, 2009 | 127 |
Table of Contents
Notes to Financial Statements (Unaudited) (Continued)
November 30, 2009
purchase or proceeds from the sale in determining whether the Fund has realized a gain or a loss. The Core Fixed Income had options contracts and swaptions contracts as of November 30, 2009, as disclosed in the Fund’s Schedule of Investments.
The risk in writing a call option/swaption is a Fund may give up the opportunity for profit if the market price of the security increases. The risk in writing a put option/swaption is a Fund may incur a loss if the market price of the security decreases and the option/swaption is exercised. The risk in purchasing an option/swaption is a Fund may pay a premium whether or not the option/swaption is exercised. The Funds also have the additional risk of being unable to enter into a closing transaction at an acceptable price if a liquid secondary market does not exist. Option/swaption contracts also involve the risk that they may not work as intended due to unanticipated developments in market conditions or other causes.
Finally, the risk exists that losses could exceed amounts disclosed on the Schedule of Investments or the Statement of Assets and Liabilities.
Securities Sold Short — As consistent with each Fund’s investment objectives, a Fund may engage in short sales. Short sales are transactions under which a Fund sells a security it does not own. To complete such a transaction, a Fund must borrow the security to make delivery to the buyer. That Fund then is obligated to replace the security borrowed by purchasing the security at the market price at the time of the replacement. The price at such time may be more or less than the price at which the security was sold by a Fund. Until the security is replaced, a Fund is required to pay the lender amounts equal to any dividends or interest that accrue during the period of the loan. Dividends and interest are shown as an expense for financial reporting purposes. To borrow the security, a Fund also may be required to pay a premium, which would decrease proceeds of the security sold. The proceeds of the short sale are retained by the broker, to the extent necessary to meet margin requirements, until the short position is closed out. A gain, limited to the price at which a Fund sold the security short, or a loss, unlimited in size, will be recognized upon the close of a short sale.
Until a Fund closes its short position or replaces the borrowed security, that Fund will: (a) maintain a segregated account containing cash or liquid securities at such a level that (i) the amount deposited in the account plus the amount deposited with the broker as collateral will equal the current value of the security sold short; and (ii) the amount deposited in the segregated account plus the amount deposited with the broker as collateral will not be less than the market value of the security at the time the security was sold short, or (b) otherwise cover a Fund’s short positions. At November 30, 2009, none of the Funds held any short positions.
Swap Agreements — A Fund’s investments in swap contracts is mainly used as an efficient means to take and manage risk in the portfolio, including interest rate risk, credit risk and overall yield sensitivity. A swap agreement is a two-party contract under which an
agreement is made to exchange returns from predetermined investments or instruments, including a particular interest rate, foreign currency, or “basket” of securities representing a particular index. Credit default swaps involve the periodic payment by a Fund or counterparty of interest based on a specified rate multiplied by a notional amount assigned to an underlying debt instrument or group of debt instruments in exchange for the assumption of credit risk on the same instruments. In the event of a credit event, usually in the form of a credit rating downgrade, the party receiving periodic payments (i.e. floating rate payer) must pay the other party (i.e. fixed rate payer) an amount equal to the outstanding principal of the downgraded debt instrument. Total return swaps allow an investor to benefit from the cash flow without ever actually owning the underlying security. The receiver must pay any decline in value to the payer at the end of the total return swap. However, the investor does not need to make a payment if there is no decline in price. Payments can be made on various indices, bonds (i.e. mortgage-backed securities, bank debt and corporate), loans or commodities. The value of a total return swap is equal to the change in value of the underlying asset versus the accrued income payment based on LIBOR (London Interbank Offered Rate) or some other form of index on the notional amount. Interest rate swaps involve the exchange by a Fund with another party of their respective commitments to pay or receive interest (e.g., an exchange of floating rate payments for fixed rate payments) with respect to a notional amount of principal to manage a Fund’s exposure to interest rates. Payments received or made are recorded as realized gains or losses. A Fund could be exposed to credit or market risk due to unfavorable changes in the fluctuation of interest rates or if the counterparty defaults on its obligation to perform. Risk of loss may exceed amounts recognized on the statement of assets and liabilities. In connection with swap agreements, securities/cash may be set aside as collateral by a Fund’s custodian. A Fund may enter into swap agreements in order to, among other things, change the maturity or duration of the investment portfolio; protect a Fund’s value from changes in interest rates; or expose a Fund to a different security or market.
Swaps are marked-to-market daily based upon quotations from market makers and the resulting changes in market values, if any, are recorded as unrealized gains or losses in the Statement of Operations. Net payments of interest are recorded as realized gains or losses.
Entering into swap agreements involves, to varying degrees, elements of credit and market risk in excess of the amounts recognized on the Statement of Assets and Liabilities. Such risks involve the possibility that there will be no liquid market for these agreements, that the counterparty to the agreement may default on its obligation to perform and that there may be unfavorable changes in the fluctuation of interest rates. Risks also arise from potential losses from adverse market movements.
This risk is mitigated by having a master netting arrangement between a Fund and the counterparty and by having the counterparty post collateral to cover a Fund’s exposure to the counterparty. See Note 3 for further details.
| 128 | SEI Institutional Investments Trust / Semi-Annual Report / November 30, 2009 |
Table of Contents
Forward Treasury Commitments — A Fund may invest in commitments to purchase U.S. Treasury securities on an extended settlement basis. Such transactions involve the commitment to purchase a security with payment and delivery taking place in the future, sometimes a month or more after the transaction date. The Funds account for such transactions as purchases and sales and record an unrealized gain or loss each day equal to the difference between the cost of the purchase commitment and the current market value. Realized gains or losses are recorded upon closure or settlement of such commitments. No interest is earned prior to settlement of the transaction. These instruments are subject to market fluctuation due to changes in interest rates and the market value at the time of settlement could be higher or lower than the purchase price. A Fund may incur losses due to changes in the value of the underlying treasury securities from interest rate fluctuations or as a result of counterparty nonperformance.
Delayed Delivery Transactions — The Large Cap Disciplined Equity, Large Cap Diversified Alpha, Core Fixed Income, International Equity and World Equity Ex-US Funds may purchase or sell securities on a when-issued or delayed delivery basis. These transactions involve a commitment by those Funds to purchase or sell securities for a predetermined price or yield, with payment and delivery taking place beyond the customary settlement period. When purchasing a security on a delayed delivery basis, that fund assumes the rights and risks of ownership of the security, including the risk of price and yield fluctuations, and takes such fluctuations into account when determining its net asset value. Those Funds may dispose of or renegotiate a delayed delivery transaction after it is entered into, and may sell when-issued securities before they are delivered, which may result in a capital gain or loss. When those Funds have sold a security on a delayed delivery basis, that Fund does not participate in future gains and losses with respect to the security.
Collateralized Debt Obligations — A Fund may invest in collateralized debt obligations (“CDOs”), which include collateralized loan obligations (“CLOs”) and other similarly structured securities. CLOs are a type of asset-backed security. A CLO is a trust, typically collateralized by a pool of loans, which may include, among others, domestic and foreign senior secured loans, senior unsecured loans and subordinate corporate loans, including loans that may be rated below investment grade or equivalent unrated loans. CDOs may charge management fees and administrative expenses.
For CDOs, the cashflows from the trust are split into two or more portions, called tranches, varying in risk and yield. The riskiest portion is
the “equity” tranche which bears the bulk of defaults from the bonds or loans in the trust and serves to protect the other, more senior tranches from default in all but the most severe circumstances. Since it is partially protected from defaults, a senior tranche from a CDO trust typically has a higher rating and lower yield than their underlying securities, and can be rated investment grade. Despite the protection from the equity tranche, CDO tranches can experience substantial losses due to actual defaults, increased sensitivity to defaults due to collateral default and disappearance of protecting tranches, market anticipation of defaults, as well as aversion to CDO securities as a class.
The risks of an investment in a CDO depend largely on the type of the collateral securities and the class of the CDO in which a Fund invests. Normally, CLOs and other CDOs are privately offered and sold, and thus, are not registered under the securities laws. As a result, investments in CDOs may be characterized by a Fund as illiquid securities; however, an active dealer market may exist for CDOs allowing a CDO to qualify for Rule 144A transactions. In addition to the normal risks associated with fixed income securities (e.g., interest rate risk and default risk), CDOs carry additional risks including, but not limited to: (i) the possibility that distributions from collateral securities will not be adequate to make interest or other payments; (ii) the quality of the collateral may decline in value or default; (iii) a Fund may invest in CDOs that are subordinate to other classes; and (iv) the complex structure of the security may not be fully understood at the time of investment and may produce disputes with the issuer or unexpected investment results.
Dividends and Distributions to Shareholders — Dividends from net investment income are declared and paid to shareholders quarterly for the Large Cap, Large Cap Diversified Alpha, Large Cap Disciplined Equity, Large Cap Index, Small Cap, Small/Mid Cap Equity, U.S. Managed Volatility, Enhanced LIBOR Opportunities and Emerging Markets Debt Funds; declared daily and paid monthly for the Core Fixed Income, Long Duration and High Yield Bond Funds; and declared and paid at least annually for the International Equity, World Equity Ex-US, Screened World Equity Ex-US and Real Return Funds. Dividends and distributions are recorded on the ex-dividend date. Any net realized capital gains will be distributed at least annually by the Funds.
Illiquid Securities — A security is considered illiquid if it cannot be sold or disposed of in the ordinary course of business within seven days or less for its approximate carrying value on the books of a Fund. Valuations of illiquid securities may differ significantly from the values that would have been used had an active market value for these securities existed.
| SEI Institutional Investments Trust / Semi-Annual Report / November 30, 2009 | 129 |
Table of Contents
Notes to Financial Statements (Unaudited) (Continued)
November 30, 2009
Restricted Securities — At November 30, 2009, the following Funds owned private placement investments that were purchased through private offerings or acquired through initial public offerings and cannot be sold without prior registration under the Securities Act of 1933 or pursuant to an exemption therefrom. In addition, these Funds have generally agreed to further restrictions on the disposition of certain holdings as set forth in various agreements entered into in connection with the purchase of these private placement investments. The acquisition dates of these investments, the enforceable right to acquire these private placement investments, along with the cost and values at November 30, 2009, were as follows:
| Number of Shares/ Face Amount ($ Thousands) | Acquisition Date | Right to Acquire Date | Cost ($ Thousands) | Market Value ($ Thousands) | % of Net Assets | ||||||||||
| Small Cap Fund | |||||||||||||||
Rentech | 16,100 | 4/20/07 | 4/20/07 | $ | — | $ | 5 | 0.00 | % | ||||||
Scorpio Mining | 887 | 5/5/08 | 5/5/08 | 777 | 781 | 0.06 | |||||||||
Titanium Asset PP | 122,200 | 8/6/07 | 8/6/07 | 729 | 356 | 0.04 | |||||||||
Titanium Asset | 122 | 6/14/07 | 6/14/07 | — | — | 0.00 | |||||||||
Value Creation | 119,600 | 2/29/08 | 2/29/08 | 1,225 | 12 | 0.00 | |||||||||
| $ | 2,731 | $ | 1,154 | 0.10 | % | ||||||||||
Small/Mid Cap Equity Fund | |||||||||||||||
Rentech | 13,800 | 4/20/07 | 4/20/07 | $ | — | $ | 5 | 0.00 | % | ||||||
Scorpio Mining | 509 | 5/5/08 | 5/5/08 | 499 | 448 | 0.02 | |||||||||
Titanium Asset PP | 122,200 | 8/6/07 | 8/6/07 | 625 | 306 | 0.02 | |||||||||
Titanium Asset | 122 | 6/14/07 | 6/14/07 | — | — | 0.00 | |||||||||
Value Creation | 85,600 | 2/29/08 | 2/29/08 | 871 | 9 | 0.00 | |||||||||
| $ | 1,995 | $ | 768 | 0.04 | % | ||||||||||
Investments in Real Estate Investment Trusts (“REITs”) — Dividend income is recorded based on the income included in distributions received from the REIT investments using published REIT reclassifications including some management estimates when actual amounts are not available. Distributions received in excess of this estimated amount are recorded as a reduction of the cost of investments or reclassified to capital gains. The actual amounts of income, return of capital, and capital gains are only determined by each REIT after its fiscal year-end, and may differ from the estimated amounts.
3. CREDIT DERIVATIVES
A Fund enters into credit default swaps to simulate long and short bond positions that are either unavailable or considered to be less attractively priced in the bond market. A Fund uses these swaps to reduce risk where a Fund has exposure to the issuer, or to take an active long or short position with respect to the likelihood of an event of default. The reference obligation of the swap can be a single issuer, a “basket” of issuers, or an index. The underlying referenced assets are corporate debt, sovereign debt and asset-backed securities.
The buyer of a credit default swap is generally obligated to pay the seller a periodic stream of payments over the term of the contract in return for a contingent payment upon the occurrence of a credit event with respect to an underlying reference obligation. Generally, a credit event for corporate or sovereign reference obligations means bankruptcy, failure to pay, obligation acceleration, repudiation/moratorium or restructuring. For credit default swaps on asset-backed securities, a credit event may be triggered by events such as failure to pay principal, maturity extension, rating downgrade or write-down.
If a Fund is a seller of protection, and a credit event occurs, as defined under the terms of that particular swap agreement, a Fund will generally either (i) pay to the buyer an amount equal to the notional amount of the swap and take delivery of the referenced obligation, other deliverable obligations, or underlying securities comprising a referenced index or (ii) pay a net settlement amount in the form of cash or securities equal to the notional amount of the swap less the recovery value of the referenced obligation or underlying securities comprising a referenced index.
If a Fund is a buyer of protection and a credit event occurs, as defined under the terms of that particular swap agreement, a Fund will either (i) receive from the seller of protection an amount equal to the notional amount of the swap and deliver the referenced obligation, other deliverable obligations or underlying securities comprising the referenced index or (ii) receive a net settlement amount in the form of cash or securities equal to the notional amount of the swap less the recovery value of the referenced obligation or underlying securities comprising the referenced index. Recovery values are assumed by market makers considering either industry standard recovery rates or entity specific factors and considerations until a credit event occurs. If a credit event has occurred, the recovery value is determined by a facilitated auction whereby a minimum number of allowable broker bids, together with a specified valuation method, are used to calculate the settlement value.
Certain Funds are party to International Swap Dealers Association, Inc. Master Agreements (“ISDA Master Agreements”). These agreements are with select counterparties and they govern transactions, including certain over-the-counter derivative and foreign exchange contracts, entered into by the Funds and the counterparty.
| 130 | SEI Institutional Investments Trust / Semi-Annual Report / November 30, 2009 |
Table of Contents
As of November 30, 2009, the Core Fixed, Long Duration and the Emerging Markets Debt Funds are the buyers (“receiving protection”) on a total notional amount of $82.3 million, $0.0 million and $0.0 million, respectively) and are the sellers (“providing protection”) on a total notional amount of $79.5 million, $1.2 million and $0.9 million, respectively. The notional amounts of the swaps are not recorded in the financial statements; however the notional amount does approximate the maximum potential amount of future payments that the Funds could be required to make if the Funds were the sellers of protection and a credit event were to occur. Those credit default swaps (“CDS”) for which the Funds are providing protection at balance sheet date are summarized as follows:
CORE FIXED INCOME FUND WRITTEN CREDIT DERIVATIVE CONTRACTS | SINGLE NAME CDS | CDS ON AN INDEX | ||||||||||||||||
| REFERENCE ASSET | CORP US$ | SOVEREIGN US$ | ABS US$ | CORP US$ | Total | |||||||||||||
Fair value of written credit derivatives | $ | 320,340 | — | $ | (47,721,654 | ) | $ | 663,684 | $ | (46,737,630 | ) | |||||||
Maximum potential amount of future payments | $ | (7,970,000 | ) | — | $ | (65,401,399 | ) | $ | (6,089,958 | ) | $ | (79,461,357 | ) | |||||
Recourse provisions with third parties to recover any amounts paid under the credit derivative (including any purchased credit protection)1 | — | — | — | — | — | |||||||||||||
Collateral held by the fund can obtain upon occurrence of triggering event | — | — | — | — | — | |||||||||||||
| 1 | Potential recoveries would include purchased credit derivatives to the extent they offset written credit derivatives which have an identical underlying, or a netting arrangement or credit support annex with the counterparty. There may be other potential recoveries from recourse provisions where agreements cover multiple derivative arrangements but those amounts have not been included. |
| MAXIMUM POTENTIAL AMOUNT OF FUTURE PAYMENTS BY CONTRACT TERM | |||||||||||||||||||
| CORE FIXED INCOME FUND | 0-6 MONTHS | 6-12 MONTHS | 1-5 YEARS | 5-10 YEARS | > 10 YEARS | Total | |||||||||||||
Current credit spread* on underlying (in basis points) | |||||||||||||||||||
0-2,000 | — | — | $ | (14,059,958 | ) | $ | — | — | $ | (14,059,958 | ) | ||||||||
2,001-4,000 | — | — | — | — | $ | (27,032,499 | ) | $ | (27,032,499 | ) | |||||||||
4,001-6,000 | — | — | — | — | $ | (22,200,000 | ) | $ | (22,200,000 | ) | |||||||||
> than 6,000 | — | — | — | — | $ | (16,168,900 | ) | $ | (16,168,900 | ) | |||||||||
Total | — | — | $ | (14,059,958 | ) | $ | — | $ | (65,401,399 | ) | $ | (79,461,357 | ) | ||||||
| * | The credit spread on the underlying asset is generally indicative of the current status of the underlying risk of the Fund having to perform. The spread also reflects the cost of buying/selling protection and may include upfront payments required to be made to enter into a contract. Higher credit spreads with a shorter contract term is indicative of a higher likelihood of performance by the Fund. |
The credit spread disclosed above for each reference obligation where the Fund is the seller of protection is a representation of the current payment/performance risk of the swap.
LONG DURATION FUND WRITTEN CREDIT DERIVATIVE CONTRACTS | SINGLE NAME CDS | CDS ON AN INDEX | ||||||||||||
| REFERENCE ASSET | CORP US$ | SOVEREIGN US$ | ABS US$ | CORP US$ | Total | |||||||||
Fair value of written credit derivatives | — | — | $ | (845,176 | ) | — | $ | (845,176 | ) | |||||
Maximum potential amount of future payments | — | — | $ | (1,225,000 | ) | — | $ | (1,225,000 | ) | |||||
Recourse provisions with third parties to recover any amounts paid under the credit derivative (including any purchased credit protection)1 | — | — | — | — | — | |||||||||
Collateral held by the fund can obtain upon occurrence of triggering event | — | — | — | — | — | |||||||||
| 1 | Potential recoveries would include purchased credit derivatives to the extent they offset written credit derivatives which have an identical underlying, or a netting arrangement or credit support annex with the counterparty. There may be other potential recoveries from recourse provisions where agreements cover multiple derivative arrangements but those amounts have not been included. |
| MAXIMUM POTENTIAL AMOUNT OF FUTURE PAYMENTS BY CONTRACT TERM | ||||||||||||||||
| LONG DURATION FUND | 0-6 MONTHS | 6-12 MONTHS | 1-5 YEARS | 5-10 YEARS | > 10 YEARS | Total | ||||||||||
Current credit spread* on underlying (in basis points) | ||||||||||||||||
0-1,000 | — | — | — | — | — | — | ||||||||||
1,001-2,000 | — | — | — | — | — | — | ||||||||||
2,001-3,000 | — | — | — | — | — | — | ||||||||||
3,001-4000 | — | — | — | — | $ | (1,225,000 | ) | $ | (1,225,000 | ) | ||||||
> than 4,000 | — | — | — | — | — | — | ||||||||||
Total | — | — | — | — | $ | (1,225,000 | ) | $ | (1,225,000 | ) | ||||||
| * | The credit spread on the underlying asset is generally indicative of the current status of the underlying risk of the Fund having to perform. The spread also reflects the cost of buying/selling protection and may include upfront payments required to be made to enter into a contract. Higher credit spreads with a shorter contract term is indicative of a higher likelihood of performance by the Fund. |
| SEI Institutional Investments Trust / Semi-Annual Report / November 30, 2009 | 131 |
Table of Contents
Notes to Financial Statements (Unaudited) (Continued)
November 30, 2009
The credit spread disclosed above for each reference obligation where the Fund is the seller of protection is a representation of the current payment/performance risk of the swap.
EMERGING MARKETS DEBT FUND WRITTEN CREDIT DERIVATIVE CONTRACTS | SINGLE NAME CDS | CDS on an INDEX | ||||||||||||
| REFERENCE ASSET | CORP US$ | SOVEREIGN US$ | ABS US$ | CORP US$ | Total | |||||||||
Fair value of written credit derivatives | — | $ | (62,939 | ) | — | — | $ | (62,939 | ) | |||||
Maximum potential amount of future payments | — | $ | (900,000 | ) | — | — | $ | (900,000 | ) | |||||
Recourse provisions with third parties to recover any amounts paid under the credit derivative (including any purchased credit protection)1 | — | — | — | — | — | |||||||||
Collateral held by the fund can obtain upon occurrence of triggering event | — | — | — | — | — | |||||||||
| 1 | Potential recoveries would include purchased credit derivatives to the extent they offset written credit derivatives which have an identical underlying, or a netting arrangement or credit support annex with the counterparty. There may be other potential recoveries from recourse provisions where agreements cover multiple derivative arrangements but those amounts have not been included. |
| MAXIMUM POTENTIAL AMOUNT OF FUTURE PAYMENTS BY CONTRACT TERM | ||||||||||||||||
| EMERGING MARKETS DEBT FUND | 0-6 MONTHS | 6-12 MONTHS | 1-5 YEARS | 5-10 YEARS | > 10 YEARS | Total | ||||||||||
Current credit spread* on underlying (in basis points) | ||||||||||||||||
0-50 | — | — | — | — | — | — | ||||||||||
51-100 | — | — | — | — | — | — | ||||||||||
101-150 | $ | (900,000 | ) | — | — | — | — | $ | (900,000 | ) | ||||||
151-200 | — | — | — | — | — | — | ||||||||||
> than 200 | — | — | — | — | — | — | ||||||||||
Total | $ | (900,000 | ) | — | — | — | — | $ | (900,000 | ) | ||||||
| * | The credit spread on the underlying asset is generally indicative of the current status of the underlying risk of the Fund having to perform. The spread also reflects the cost of buying/selling protection and may include upfront payments required to be made to enter into a contract. Higher credit spreads with a shorter contract term is indicative of a higher likelihood of performance by the Fund. |
The credit spread disclosed above for each reference obligation where the Fund is the seller of protection is a representation of the current payment/performance risk of the swap.
4. DERIVATIVE TRANSACTIONS
The fair value of derivative instruments as of November 30, 2009 was as follows:
| Asset Derivatives | Liability Derivatives | |||||||||||
| Six month period ended November 30, 2009 ($ Thousands) | Six month period ended November 30, 2009 ($ Thousands) | |||||||||||
| Statement of Assets and Liabilities Location | Fair Value | Statement of Assets and Liabilities Location | Fair Value | |||||||||
Derivatives not accounted for as hedging instruments: |
| |||||||||||
| International Equity | ||||||||||||
Foreign exchange contracts | Unrealized gain on forward foreign currency contracts | $ | — | Unrealized loss on forward foreign currency contracts | $ | 65 | ||||||
Equity contracts | Net Assets — Unrealized appreciation on futures contracts | 406 | * | Net Assets — Unrealized depreciation on futures contracts | 137 | * | ||||||
Net Assets — Unrealized appreciation on swap contracts | — | Net Assets — Unrealized depreciation on swap contracts | 197 | † | ||||||||
Total Derivatives not accounted for as hedging instruments | $ | 406 | $ | 399 | ||||||||
| 132 | SEI Institutional Investments Trust / Semi-Annual Report / November 30, 2009 |
Table of Contents
| Asset Derivatives | Liability Derivatives | |||||||||||
| Six month period ended November 30, 2009 ($ Thousands) | Six month period ended November 30, 2009 ($ Thousands) | |||||||||||
| Statement of Assets and Liabilities Location | Fair Value | Statement of Assets and Liabilities Location | Fair Value | |||||||||
| World Equity Ex-US | ||||||||||||
Foreign exchange contracts | Unrealized gain on forward foreign currency contracts | $ | — | Unrealized loss on forward foreign currency contracts | $ | 262 | ||||||
Equity contracts | Net Assets — Unrealized appreciation on futures contracts | 3,117 | * | Net Assets — Unrealized depreciation on futures contracts | 1,171 | * | ||||||
Net Assets — Unrealized appreciation on swap contracts | 617 | † | Net Assets — Unrealized depreciation on swap contracts | 81 | † | |||||||
Total Derivatives not accounted for as hedging instruments | $ | 3,734 | $ | 1,514 | ||||||||
| Core Fixed Income | ||||||||||||
Interest rate contracts | Net Assets — Unrealized appreciation on futures contracts | $ | 4,379 | * | Net Assets — Unrealized depreciation on futures contracts | $ | 4,912 | * | ||||
Net Assets — Unrealized appreciation on swap contracts | 46 | † | Net Assets — Unrealized depreciation on swap contracts | 2,747 | † | |||||||
Investments, at value | — | Options written, at value | 340 | |||||||||
Investments, at value | — | Swaptions written, at value | 1,042 | |||||||||
Credit contracts | Net Assets — Unrealized appreciation on swap contracts | 3,035 | † | Net Assets — Unrealized depreciation on swap contracts | 19,960 | † | ||||||
Total Derivatives not accounted for as hedging instruments | $ | 7,460 | $ | 29,001 | ||||||||
| Long Duration | ||||||||||||
Interest rate contracts | Net Assets — Unrealized appreciation on futures contracts | $ | 5,910 | * | Net Assets — Unrealized depreciation on futures contracts | $ | 25 | * | ||||
Credit contracts | Net Assets — Unrealized depreciation on swap contracts | — | Net Assets — Unrealized depreciation on swap contracts | 640 | † | |||||||
Total Derivatives not accounted for as hedging instruments | $ | 5,910 | $ | 665 | ||||||||
| Emerging Markets Debt | ||||||||||||
Interest rate contracts | Net Assets — Unrealized appreciation on futures contracts | $ | 22 | * | Net Assets — Unrealized depreciation on futures contracts | $ | — | |||||
Foreign exchange contracts | Unrealized gain on forward foreign currency contracts | 215 | Unrealized loss on forward foreign currency contracts | 785 | * | |||||||
Credit contracts | Net Assets — Unrealized depreciation on swap contracts | 63 | † | Net Assets — Unrealized depreciation on swap contracts | — | |||||||
Equity contracts | Net Assets — Unrealized depreciation on swap contracts | — | Net Assets — Unrealized depreciation on swap contracts | 187 | † | |||||||
Total Derivatives not accounted for as hedging instruments | $ | 300 | $ | 972 | ||||||||
| * | Includes cumulative appreciation/depreciation of futures contracts as reported in the Schedules of Investments. Only current day’s variation margin is reported within the Statements of Assets & Liabilities. |
| † | Includes cumulative appreciation/depreciation of swap contracts as reported in the Schedules of Investments. Market Value is reported within the Statements of Assets & Liabilities for swap contracts that have paid premiums. |
| SEI Institutional Investments Trust / Semi-Annual Report / November 30, 2009 | 133 |
Table of Contents
Notes to Financial Statements (Unaudited) (Continued)
November 30, 2009
The effect of derivative instruments on the Statements of Operations for the six month period ended November 30, 2009.
Amount of realized Gain or (Loss) on Derivatives Recognized in Income ($ Thousands):
| Derivatives Not Accounted for as Hedging Instruments | Options | Swaptions | Futures | Forward Currency Contracts | Swaps | Total | ||||||||||||||||
Small Cap | ||||||||||||||||||||||
Foreign exchange contracts | $ | — | $ | — | $ | — | $ | 1 | $ | — | $ | 1 | ||||||||||
Equity contracts | — | — | 9,188 | — | — | 9,188 | ||||||||||||||||
Total | $ | — | $ | — | $ | 9,188 | $ | 1 | $ | — | $ | 9,189 | ||||||||||
International Equity | ||||||||||||||||||||||
Foreign exchange contracts | $ | — | $ | — | $ | — | $ | 2,715 | $ | — | $ | 2,715 | ||||||||||
Credit contracts | — | — | — | — | 645 | 645 | ||||||||||||||||
Equity contracts | — | — | 3,443 | — | 12,971 | 16,414 | ||||||||||||||||
Total | $ | — | $ | — | $ | 3,443 | $ | 2,715 | $ | 13,616 | $ | 19,774 | ||||||||||
World Equity Ex-US | ||||||||||||||||||||||
Interest rate contracts | $ | — | $ | — | $ | (180 | ) | $ | — | $ | — | $ | (180 | ) | ||||||||
Foreign exchange contracts | — | — | — | 9,511 | — | 9,511 | ||||||||||||||||
Credit contracts | — | — | — | — | 860 | 860 | ||||||||||||||||
Equity contracts | — | — | 25,196 | — | 16,266 | 41,462 | ||||||||||||||||
Total | $ | — | $ | — | $ | 25,016 | $ | 9,511 | $ | 17,126 | $ | 51,653 | ||||||||||
Core Fixed Income | ||||||||||||||||||||||
Interest rate contracts | $ | 2,863 | $ | 10 | $ | 7,932 | $ | — | $ | — | $ | 10,805 | ||||||||||
Foreign exchange contracts | — | — | — | (142 | ) | — | (142 | ) | ||||||||||||||
Credit contracts | — | — | — | — | (483 | ) | (483 | ) | ||||||||||||||
Total | $ | 2,863 | $ | 10 | $ | 7,932 | $ | (142 | ) | $ | (483 | ) | $ | 10,180 | ||||||||
Long Duration | ||||||||||||||||||||||
Interest rate contracts | $ | — | $ | — | $ | 2,485 | $ | — | $ | — | $ | 2,485 | ||||||||||
Credit contracts | — | — | — | — | 1 | 1 | ||||||||||||||||
Total | $ | — | $ | — | $ | 2,485 | $ | — | $ | 1 | $ | 2,486 | ||||||||||
Emerging Markets Debt | ||||||||||||||||||||||
Interest rate contracts | $ | — | $ | — | $ | 242 | $ | — | $ | — | $ | 242 | ||||||||||
Foreign exchange contracts | — | — | — | (4,896 | ) | — | (4,896 | ) | ||||||||||||||
Credit contracts | — | — | — | — | 526 | 526 | ||||||||||||||||
Total | $ | — | $ | — | $ | 242 | $ | (4,896 | ) | $ | 526 | $ | (4,128 | ) | ||||||||
| 134 | SEI Institutional Investments Trust / Semi-Annual Report / November 30, 2009 |
Table of Contents
Change in Unrealized Appreciation or (Depreciation) on Derivatives Recognized in Income ($ Thousands):
| Derivatives Not Accounted for as Hedging Instruments | Options | Swaptions | Futures | Forward Currency Contracts | Swaps | Total | ||||||||||||||||||
Large Cap Disciplined Equity | ||||||||||||||||||||||||
Foreign exchange contracts | $ | — | $ | — | $ | — | $ | 802 | $ | — | $ | 802 | ||||||||||||
Equity contracts | — | — | (118,906 | ) | — | — | (118,906 | ) | ||||||||||||||||
Total | $ | — | $ | — | $ | (118,906 | ) | $ | 802 | $ | — | $ | (118,104 | ) | ||||||||||
International Equity | ||||||||||||||||||||||||
Foreign exchange contracts | $ | — | $ | — | $ | — | $ | (1,353 | ) | $ | — | $ | (1,353 | ) | ||||||||||
Credit contracts | — | — | — | — | (689 | ) | (689 | ) | ||||||||||||||||
Equity contracts | — | — | (661 | ) | — | (5,642 | ) | (6,303 | ) | |||||||||||||||
Total | $ | — | $ | — | $ | (661 | ) | $ | (1,353 | ) | $ | (6,331 | ) | $ | (8,345 | ) | ||||||||
World Equity Ex-US | ||||||||||||||||||||||||
Interest rate contracts | $ | — | $ | — | $ | 45 | $ | — | $ | — | $ | 45 | ||||||||||||
Foreign exchange contracts | — | — | — | (6,367 | ) | — | (6,367 | ) | ||||||||||||||||
Credit contracts | — | — | — | — | (920 | ) | (920 | ) | ||||||||||||||||
Equity contracts | — | — | (6,849 | ) | — | (8,097 | ) | (14,946 | ) | |||||||||||||||
Total | $ | — | $ | — | $ | (6,804 | ) | $ | (6,367 | ) | $ | (9,017 | ) | $ | (22,188 | ) | ||||||||
Enhanced LIBOR Opportunities | ||||||||||||||||||||||||
Interest rate contracts | $ | — | $ | — | $ | (4 | ) | $ | — | $ | — | $ | (4 | ) | ||||||||||
Foreign exchange contracts | — | — | — | 79 | — | 79 | ||||||||||||||||||
Total | $ | — | $ | — | $ | (4 | ) | $ | 79 | $ | — | $ | 75 | |||||||||||
Core Fixed Income | ||||||||||||||||||||||||
Interest rate contracts | $ | (317 | ) | $ | (58 | ) | $ | 256 | $ | — | $ | (2,701 | ) | $ | (2,820 | ) | ||||||||
Foreign exchange contracts | — | — | — | 1,040 | — | 1,040 | ||||||||||||||||||
Credit contracts | — | — | — | — | (300 | ) | (300 | ) | ||||||||||||||||
Total | $ | (317 | ) | $ | (58 | ) | $ | 256 | $ | 1,040 | $ | (3,001 | ) | $ | (2,080 | ) | ||||||||
Long Duration | ||||||||||||||||||||||||
Interest rate contracts | $ | — | $ | — | $ | 16,043 | $ | — | $ | — | $ | 16,043 | ||||||||||||
Credit contracts | — | — | — | — | 35 | 35 | ||||||||||||||||||
Total | $ | — | $ | — | $ | 16,043 | $ | — | $ | 35 | $ | 16,078 | ||||||||||||
Emerging Markets Debt | ||||||||||||||||||||||||
Interest rate contracts | $ | — | $ | — | $ | (12 | ) | $ | — | $ | — | $ | (12 | ) | ||||||||||
Foreign exchange contracts | — | — | — | (434 | ) | — | (434 | ) | ||||||||||||||||
Credit contracts | — | — | — | — | 553 | 553 | ||||||||||||||||||
Equity contracts | — | — | — | — | 443 | 443 | ||||||||||||||||||
Total | $ | — | $ | — | $ | (12 | ) | $ | (434 | ) | $ | 996 | $ | 550 | ||||||||||
The ISDA Master Agreements maintain provisions for general obligations, representations, agreements, collateral, and events of default or termination. The occurrence of a specified event of termination may give a counterparty the right to terminate all of its contracts and affect settlement of all outstanding transactions under the applicable ISDA Master Agreement.
Written options transactions entered into during the six month period ended November 30, 2009 are summarized as follows:
| Core Fixed Income Fund | |||||||
| Number of Contracts | Premium ($ Thousands) | ||||||
| Balance at the beginning of period | 992 | $ | 609 | ||||
| Written | 4,608 | 3,707 | |||||
| Expired | (2,783 | ) | (1,711 | ) | |||
| Closing buys | (2,295 | ) | (2,372 | ) | |||
| Balance at the end of period | 522 | $ | 233 | ||||
Written swaptions transactions entered into during the six month period ended November 30, 2009 are summarized as follows:
| Core Fixed Income Fund | |||||||
| Notional Amount (Thousands) | Premium ($ Thousands) | ||||||
| Balance at the beginning of period | — | $ | — | ||||
| Written | 48,340 | 1,014 | |||||
| Expired | (470 | ) | (15 | ) | |||
| Closing buys | (470 | ) | (15 | ) | |||
| Balance at the end of period | 47,400 | $ | 984 | ||||
At November 30, 2009 the Funds had cash and/or securities at least equal to the value of written options.
5. AGREEMENTS AND OTHER TRANSACTIONS WITH AFFILIATES
Administration and Transfer Agency Agreements —The Trust and SEI Investments Global Funds Services (the “Administrator”) are parties to an Amended and Restated Administration and Transfer Agency
| SEI Institutional Investments Trust / Semi-Annual Report / November 30, 2009 | 135 |
Table of Contents
Notes to Financial Statements (Unaudited) (Continued)
November 30, 2009
Agreement dated December 10, 2003 under which the Administrator provides administrative and shareholder servicing for an annual fee of 0.05% of the average daily net assets of each Fund. For the six-month period ended November 30, 2009, and until further notice, the Administrator has voluntarily agreed to waive all of its fee.
Investment Advisory Agreement — SEI Investments Management Corporation (“SIMC”) serves as investment adviser (the “Adviser”) to each Fund. In connection with serving as investment adviser, SIMC is entitled to a fee that is calculated daily and paid monthly based on the average daily net assets of each Fund. SIMC has voluntarily agreed to waive a portion of its fee so that the total annual expenses of each Fund, exclusive of acquired fund fees expenses, will not exceed certain voluntary expense limitations adopted by SIMC. These waivers may be terminated at any time. The advisory fee and voluntary expense limitations for Class A of each Fund for the six-month period ended November 30, 2009:
| Advisory Fees | Voluntary Expense Limitations | |||||
Large Cap Fund | 0.400 | % | 0.260 | % | ||
Large Cap Diversified Alpha Fund | 0.400 | 0.350 | ||||
Large Cap Disciplined Equity Fund | 0.400 | 0.220 | ||||
Large Cap Index Fund | 0.170 | 0.060 | ||||
Small Cap Fund | 0.650 | 0.540 | ||||
Small/Mid Cap Equity Fund | 0.650 | 0.500 | ||||
U.S. Managed Volatility Fund | 0.650 | 0.350 | ||||
International Equity Fund | 0.505 | 0.390 | ||||
World Equity Ex-US Fund | 0.550 | 0.450 | ||||
Screened World Equity Ex-US Fund | 0.650 | 0.800 | ||||
Enhanced LIBOR Opportunities Fund | 0.450 | 0.440 | ||||
Core Fixed Income Fund | 0.300 | 0.140 | ||||
High Yield Bond Fund | 0.4875 | 0.350 | ||||
Long Duration Fund | 0.300 | 0.200 | ||||
Emerging Markets Debt Fund | 0.850 | 0.550 | ||||
Real Return Fund | 0.700 | 0.360 |
As of November 30, 2009, SIMC has entered into investment sub-advisory agreements with the following parties and pays the sub-advisers out of the fee that it receives from the Funds:
| Investment Sub-Adviser |
Large Cap Fund |
Aronson + Johnson + Ortiz, L.P. |
Delaware Management Company |
INTECH Investment Management, LLC |
Goldman Sachs Asset Management, L.P. |
Legg Mason Capital Management, Inc. |
LSV Asset Management |
Quantitative Management Associates, LLC |
Large Cap Diversified Alpha Fund |
Analytic Investors, LLC |
Aronson + Johnson + Ortiz, L.P. |
Delaware Management Company |
INTECH Investment Management, LLC |
| Investment Sub-Adviser |
Legg Mason Capital Management, Inc. |
Quantitative Management Associates, LLC |
Large Cap Disciplined Equity Fund |
Analytic Investors, Inc. |
INTECH Investment Management, LLC |
Legg Mason Capital Management, Inc. |
Massachusetts Financial Services Company |
Quantitative Management Associates, LLC |
Large Cap Index Fund |
SSgA Funds Management, Inc. |
Small Cap Fund |
AQR Capital Management, LLC |
Artisan Partners Limited Partnership |
Janus Capital Management, Inc. |
Lee Munder Investments, Ltd. |
Los Angeles Capital Management and Equity Research, Inc. |
LSV Asset Management |
Oppenheimer Capital, LLC |
Robeco Investment Management, Inc. |
Security Capital Research and Management, Inc. |
Wellington Management Company, LLP |
Small/Mid Cap Equity Fund |
Integrity Asset Management, LLC |
Janus Capital Management, Inc. |
Lee Munder Investments, Ltd. |
Los Angeles Capital Management and Equity Research, Inc. |
LSV Asset Management |
PanAgora Asset Management, Inc. |
Security Capital Research and Management Incorporated |
Wellington Management Company, LLP |
Wells Capital Management, Inc. |
U.S. Managed Volatility Fund |
Analytic Investors, LLC |
Aronson + Johnson + Ortiz, LP |
International Equity Fund |
Acadian Asset Management, Inc. |
AXA Rosenberg Investment Management, LLC |
Declaration Management & Research, LLC |
INTECH Investment Management, LLC |
McKinley Capital Management, LLC |
Principal Global Investors, LLC |
Quantitative Management Associates, LLC |
UBS Global Asset Management (Americas), Inc.* |
Wellington Management Company, LLC |
World Equity Ex-US Fund |
Acadian Asset Management, Inc. |
Artisan Partners Limited Partnership |
AXA Rosenberg Investment Management, LLC |
Declaration Management & Research, LLC |
INTECH Investment Management, LLC |
McKinley Capital Management, LLC |
Principal Global Investors, LLC |
Quantitative Management Associates, LLC |
Rexiter Capital Management Limited |
| 136 | SEI Institutional Investments Trust / Semi-Annual Report / November 30, 2009 |
Table of Contents
| Investment Sub-Adviser |
UBS Global Asset Management (Americas), Inc.* |
Wellington Management Company, LLC |
Screened World Equity Ex-US Fund |
AXA Rosenberg Investment Management, LLC |
McKinley Capital Management, LLC |
Principal Global Investors, LLC |
Quantitative Management Associates, LLC |
Enhanced LIBOR Opportunities Fund |
Ares Management, LLC |
Declaration Management & Research, LLC* |
UBS Global Asset Management (Americas), Inc.* |
Wellington Management Company, LLP |
Core Fixed Income Fund |
J.P. Morgan Investment Management, Inc. |
Metropolitan West Asset Management, LLC |
Wells Capital Management, Inc. |
Western Asset Management Company |
Western Asset Management Company Limited |
High Yield Bond Fund |
Ares Management, LLC |
Brigade Capital Management, LLC |
Delaware Management Company |
Guggenheim Partners, LLC |
J.P. Morgan Investment Management, Inc. |
Long Duration Fund |
Jennison Associates LLC |
Metropolitan West Asset Management, LLC |
Emerging Markets Debt Fund |
Ashmore Investment Management Limited |
ING Investment Management Advisors, B.V. |
Stone Harbor Investment Partners, L.P. |
Real Return Fund |
Wellington Management Company, LLP |
* Not funded. As of November 30, 2009, this manager has not been allocated assets to manage.
Other —The Distribution Agreement between SEI Investments Distribution Co. (the “Distributor”) and the Trust provides that the Distributor may receive compensation on fund transactions effected for the Trust in accordance with Securities and Exchange Commission (“SEC”) rules. Accordingly, it is expected that fund transactions may result in brokerage commissions being paid to the Distributor. The SEC rules require that such commissions not exceed usual and customary commissions.
Such commissions for the six-month period ended November 30, 2009 were as follows ($ Thousands):
| Large Cap Fund | $ | 16 | |
| Large Cap Diversified Alpha Fund | 1 | ||
| Small Cap Fund | 375 | ||
| Small/Mid Cap Equity Fund | 341 | ||
| International Equity Fund | 14 | ||
| World Equity Ex-US Fund | 47 |
Certain officers and/or trustees of the Trust are also officers of the Distributor or the Adviser. The Trust pays each unaffiliated Trustee an annual fee for attendance at quarterly, interim and committee meetings. Compensation of officers and affiliated Trustees of the Trust is paid by the Adviser or Administrator.
A portion of the services provided by the Chief Compliance Officer (“CCO”) and his staff, whom are employees of the Administrator, are paid for by the Trust as incurred. The services include regulatory oversight of the Trust’s Adviser, sub-advisers and service providers as required by SEC regulations. The CCO’s services have been approved by and are reviewed annually by the Board.
LSV Asset Management (partially-owned subsidiary of SIMC) serves as a sub-adviser to the Large Cap, Small Cap and Small/Mid Cap Equity Funds. For this service LSV Asset Management is entitled to receive a fee from SIMC. Such fees for the six-month period ended November 30, 2009 were as follows ($ Thousands):
| Large Cap Fund | $ | 74 | |
| Small Cap Fund | 162 | ||
| Small/Mid Cap Equity Fund | 381 |
Fees Paid Indirectly — The Funds may direct certain fund trades to the Distributor who pays a portion of the Fund’s expenses. Accordingly, the expenses reduced, which were used to pay third party expenses, can be found on the Statement of Operations and the effect on the Fund’s expense ratio, as a percentage of the Fund’s average daily net assets for the six-month period ended November 30, 2009, can be found on the Financial Highlights.
Investment in Affiliated Security — The Funds may invest the cash collateral from the securities lending program in the SEI Liquidity Fund L.P.
| SEI Institutional Investments Trust / Semi-Annual Report / November 30, 2009 | 137 |
Table of Contents
Notes to Financial Statements (Unaudited) (Continued)
November 30, 2009
6. CAPITAL SHARE TRANSACTIONS
Capital Share Transactions for the Funds were as follows (Thousands):
| Large Cap Fund | Large Cap Diversified Alpha | Large Cap Disciplined Equity Fund | ||||||||||||||||
| 6/1/09 to 11/30/09 (Unaudited) | 6/1/08 to 5/31/09 | 6/1/09 to 11/30/09 (Unaudited) | 6/1/08 to 5/31/09 | 6/1/09 to 11/30/09 (Unaudited) | 6/1/08 to 5/31/09 | |||||||||||||
Class A: | ||||||||||||||||||
Shares Issued | 26,711 | 27,740 | 3,352 | 23,513 | 84,462 | (1) | 263,121 | (1) | ||||||||||
Shares Issued In Lieu of Dividends and Distributions | 373 | 533 | 164 | 471 | 4,472 | 10,546 | ||||||||||||
Shares Redeemed | (4,844 | ) | (5,596 | ) | (9,119 | ) | (25,871 | ) | (93,438 | ) | (178,882 | ) | ||||||
Increase (Decrease) in Net Assets | 22,240 | 22,677 | (5,603 | ) | (1,887 | ) | (4,504 | ) | 94,785 | |||||||||
| Large Cap Index Fund | Small Cap Fund | Small/Mid Cap Fund | ||||||||||||||||
| 6/1/09 to 11/30/09 (Unaudited) | 6/1/08 to 5/31/09 | 6/1/09 to 11/30/09 (Unaudited) | 6/1/08 to 5/31/09 | 6/1/09 to 11/30/09 (Unaudited) | 6/1/08 to 5/31/09 | |||||||||||||
Class A: | ||||||||||||||||||
Shares Issued | 1,212 | 1,929 | 12,283 | 22,882 | 30,802 | 64,980 | ||||||||||||
Shares Issued In Lieu of Dividends and Distributions | 51 | 106 | 455 | 2,879 | 1,882 | 3,467 | ||||||||||||
Shares Redeemed | (435 | ) | (748 | ) | (8,985 | ) | (48,524 | ) | (29,520 | ) | (43,013 | ) | ||||||
Increase (Decrease) in Net Assets | 828 | 1,287 | 3,753 | (22,763 | ) | 3,164 | 25,434 | |||||||||||
| U.S. Managed Volatility Fund(2) | International Equity Fund | World Equity Ex-US Fund | ||||||||||||||||
| 6/1/09 to 11/30/09 (Unaudited) | 1/1/09 to 5/31/09 | 6/1/09 to 11/30/09 (Unaudited) | 6/1/08 to 5/31/09 | 6/1/09 to 11/30/09 (Unaudited) | 6/1/08 to 5/31/09 | |||||||||||||
Class A: | ||||||||||||||||||
Shares Issued | 2,793 | 25,465 | 8,871 | 44,814 | 53,315 | 180,222 | ||||||||||||
Shares Issued In Lieu of Dividends and Distributions | 266 | 64 | — | 2,178 | — | — | ||||||||||||
Shares Redeemed | (1,469 | ) | (619 | ) | (18,828 | ) | (61,714 | ) | (33,786 | ) | (82,715 | ) | ||||||
Increase (Decrease) in Net Assets | 1,590 | 24,910 | (9,957 | ) | (14,722 | ) | 19,529 | 97,507 | ||||||||||
| Screened World Equity Ex-US Fund(3) | Enhanced LIBOR Opportunities Fund | Core Fixed Income Fund | ||||||||||||||||
| 6/1/09 to 11/30/09 (Unaudited) | 6/30/08 to 5/31/09 | 6/1/09 to 11/30/09 (Unaudited) | 6/1/08 to 5/31/09 | 6/1/09 to 11/30/09 (Unaudited) | 6/1/08 to 5/31/09 | |||||||||||||
Class A: | ||||||||||||||||||
Shares Issued | 2,312 | 10,439 | 425 | 3,618 | 126,291 | 193,251 | ||||||||||||
Shares Issued In Lieu of Dividends and Distributions | — | 87 | 47 | 488 | 11,827 | 40,439 | ||||||||||||
Shares Redeemed | (656 | ) | (2,414 | ) | (4,070 | ) | (7,198 | ) | (83,482 | ) | (369,431 | ) | ||||||
Increase (Decrease) in Net Assets | 1,656 | 8,112 | (3,598 | ) | (3,092 | ) | 54,636 | (135,741 | ) | |||||||||
| High Yield Bond Fund | Long Duration Fund | |||||||||||||||||
| 6/1/09 to 11/30/09 (Unaudited) | 6/1/08 to 5/31/09 | 6/1/09 to 11/30/09 (Unaudited) | 6/1/08 to 5/31/09 | |||||||||||||||
Class A: | ||||||||||||||||||
Shares Issued | 25,300 | 48,241 | 61,169 | 183,981 | ||||||||||||||
Shares Issued In Lieu of Dividends and Distributions | 8,262 | 19,620 | 5,947 | 3,116 | ||||||||||||||
Shares Redeemed | (39,853 | ) | (43,406 | ) | (6,050 | ) | (9,083 | ) | ||||||||||
Increase (Decrease) in Net Assets | (6,291 | ) | 24,455 | 61,066 | 178,014 | |||||||||||||
| 138 | SEI Institutional Investments Trust / Semi-Annual Report / November 30, 2009 |
Table of Contents
| Emerging Markets Debt | Real Return Fund | |||||||||||||||
| 6/1/09 to 11/30/09 (Unaudited) | 6/1/08 to 5/31/09 | 6/1/09 to 11/30/09 (Unaudited) | 6/1/08 to 5/31/09 | |||||||||||||
Class A: | ||||||||||||||||
Shares Issued | 9,684 | 26,254 | 4,240 | 6,992 | ||||||||||||
Shares Issued In Lieu of Dividends and Distributions | 3,844 | 8,541 | — | 2,090 | ||||||||||||
Shares Redeemed | (20,267 | ) | (39,588 | ) | (4,634 | ) | (16,281 | ) | ||||||||
Increase (Decrease) in Net Assets | (6,739 | ) | (4,793 | ) | (394 | ) | (7,199 | ) | ||||||||
| (1) | Includes subscriptions as a result of in-kind transfers of securities (See Note 10). |
| (2) | Fund commenced operations on January 2, 2009. |
| (3) | Fund commenced operations on June 30, 2008. |
Amounts designated as “—” are zero or have been rounded to zero.
7. INVESTMENT TRANSACTIONS
The cost of security purchases and proceeds from the sale and maturities of securities other than temporary cash investments, during the six month period ended November 30, 2009, were as follows:
| U.S. Gov’t ($ Thousands) | Other ($ Thousands) | Total ($ Thousands) | |||||||
Large Cap Fund | |||||||||
Purchases | $ | — | $ | 516,377 | $ | 516,377 | |||
Sales | — | 262,183 | 262,183 | ||||||
Large Cap Diversified Alpha Fund | |||||||||
Purchases | — | 167,924 | 167,924 | ||||||
Sales | — | 177,141 | 177,141 | ||||||
Large Cap Disciplined Equity Fund* | |||||||||
Purchases | — | 3,458,037 | 3,458,037 | ||||||
Sales | — | 3,208,233 | 3,208,233 | ||||||
Large Cap Index Fund | |||||||||
Purchases | — | 99,817 | 99,817 | ||||||
Sales | — | 30,888 | 30,888 | ||||||
Small Cap Fund | |||||||||
Purchases | — | 724,238 | 724,238 | ||||||
Sales | — | 680,356 | 680,356 | ||||||
Small/Mid Cap Fund | |||||||||
Purchases | — | 1,103,599 | 1,103,599 | ||||||
Sales | — | 1,035,229 | 1,035,229 | ||||||
U.S. Managed Volatility Fund | |||||||||
Purchases | — | 101,767 | 101,767 | ||||||
Sales | — | 86,663 | 86,663 | ||||||
| U.S. Gov’t ($ Thousands) | Other ($ Thousands) | Total ($ Thousands) | |||||||
International Equity Fund | |||||||||
Purchases | $ | 36,545 | $ | 417,859 | $ | 454,404 | |||
Sales | 38,540 | 459,456 | 497,996 | ||||||
World Equity Ex-US Fund | |||||||||
Purchases | 121,192 | 1,799,932 | 1,921,124 | ||||||
Sales | 130,890 | 1,642,722 | 1,773,612 | ||||||
Screened World Equity Ex-US Fund | |||||||||
Purchases | — | 47,160 | 47,160 | ||||||
Sales | — | 33,856 | 33,856 | ||||||
Enhanced LIBOR Opportunities Fund | |||||||||
Purchases | 1,024 | 10,416 | 11,440 | ||||||
Sales | 1,714 | 10,093 | 11,807 | ||||||
Core Fixed Income Fund | |||||||||
Purchases | 3,863,384 | 1,073,593 | 4,936,977 | ||||||
Sales | 3,689,856 | 1,024,054 | 4,713,910 | ||||||
High Yield Bond Fund | |||||||||
Purchases | 353 | 678,415 | 678,768 | ||||||
Sales | — | 646,069 | 646,069 | ||||||
Long Duration Bond Fund | |||||||||
Purchases | 892,471 | 761,992 | 1,654,463 | ||||||
Sales | 774,197 | 276,238 | 1,050,435 | ||||||
Emerging Markets Debt Fund | |||||||||
Purchases | — | 306,015 | 306,015 | ||||||
Sales | — | 400,371 | 400,371 | ||||||
Real Return Fund | |||||||||
Purchases | 313,624 | 10 | 313,634 | ||||||
Sales | 316,217 | 10 | 316,227 | ||||||
| * | Includes In-Kind transactions (See Note 10). |
8. FEDERAL TAX INFORMATION
It is each Fund’s intention to continue to qualify as a regulated investment company under Subchapter M of the Internal Revenue Code and distribute all of its taxable income (including net capital gains). Accordingly, no provision for Federal income taxes is required.
Dividends from net investment income and distributions from net realized capital gains are determined in accordance with U.S. Federal income tax regulations, which may differ from those amounts determined under accounting principles generally accepted in the United States of America. These book/tax differences are either temporary or permanent in nature. To the extent these differences are permanent, they are charged or credited to paid-in capital, undistributed net investment income or accumulated net realized gain, as appropriate, in the period that the differences arise.
The tax character of dividends and distributions paid during the last two years or periods ended May 31, 2009 were as follows:
| Ordinary Income ($ Thousands) | Long-Term Capital Gain ($ Thousands) | Return of Capital ($ Thousands) | Total ($ Thousands) | |||||||||||
Large Cap Fund | 2009 | $ | 6,781 | $ | — | $ | — | $ | 6,781 | |||||
| 2008 | 8,626 | — | — | 8,626 | ||||||||||
Large Cap Diversified Alpha Fund | 2009 | 772 | — | 2,889 | 3,661 | |||||||||
| 2008 | 18,510 | 9,736 | — | 28,246 | ||||||||||
| SEI Institutional Investments Trust / Semi-Annual Report / November 30, 2009 | 139 |
Table of Contents
Notes to Financial Statements (Unaudited) (Continued)
November 30, 2009
| Ordinary Income ($ Thousands) | Long-Term Capital Gain ($ Thousands) | Return of Capital ($ Thousands) | Total ($ Thousands) | |||||||||||
Large Cap Disciplined Equity Fund | 2009 | $ | 10,906 | $ | — | $ | 79,835 | $ | 90,741 | |||||
| 2008 | 386,110 | 238,583 | — | 624,693 | ||||||||||
Large Cap Index Fund | 2009 | 8,392 | 608 | — | 9,000 | |||||||||
| 2008 | 8,808 | 9,258 | — | 18,066 | ||||||||||
Small Cap Fund | 2009 | 23,822 | — | — | 23,822 | |||||||||
| 2008 | 69,762 | 157,685 | 7,548 | 234,995 | ||||||||||
Small/Mid Cap Equity Fund | 2009 | 27,726 | — | — | 27,726 | |||||||||
| 2008 | 74,475 | 76,784 | 6,948 | 158,207 | ||||||||||
U.S. Managed Volatility Fund | 2009 | 555 | — | — | 555 | |||||||||
International Equity Fund | 2009 | 11,818 | 1,123 | — | 12,941 | |||||||||
| 2008 | 153,474 | 133,805 | — | 287,279 | ||||||||||
World Equity Ex-US Fund | 2009 | — | — | — | — | |||||||||
| 2008 | 157,238 | 71,654 | 1,085 | 229,977 | ||||||||||
Screened World Equity Ex-US Fund | 2009 | 561 | — | — | 561 | |||||||||
Enhanced LIBOR Opportunities Fund | 2009 | 3,100 | — | 929 | 4,029 | |||||||||
| 2008 | 8,666 | 161 | — | 8,827 | ||||||||||
Core Fixed Income Fund | 2009 | 360,778 | 27,495 | — | 388,273 | |||||||||
| 2008 | 336,849 | — | — | 336,849 | ||||||||||
High Yield Bond Fund | 2009 | 135,862 | — | — | 135,862 | |||||||||
| 2008 | 125,710 | 1,453 | — | 127,163 | ||||||||||
Long Duration Bond Fund | 2009 | 24,618 | — | — | 24,618 | |||||||||
| 2008 | 9,372 | — | — | 9,372 | ||||||||||
Emerging Markets Debt Fund | 2009 | 76,229 | — | — | 76,229 | |||||||||
| 2008 | 74,765 | 2,871 | — | 77,636 | ||||||||||
Real Return Fund | 2009 | 19,513 | — | 1,496 | 21,009 | |||||||||
| 2008 | 11,228 | 1,410 | — | 12,638 | ||||||||||
As of May 31, 2009, the components of Distributable Earnings/(Accumulated Losses) were as follows:
| Undistributed Ordinary Income ($ Thousands) | Capital Loss Carryforwards ($ Thousands) | Post October Losses ($ Thousands) | Post October Currency Losses ($ Thousands) | Unrealized Appreciation (Depreciation) ($ Thousands) | Other Temporary Differences ($ Thousands) | Total Distributable Earnings (Accumulated Losses) ($ Thousands) | |||||||||||||||||||||
Large Cap Fund | $ | 1,555 | $ | (97,300 | ) | $ | (33,608 | ) | $ | — | $ | (23,255 | ) | $ | 31 | $ | (152,577 | ) | |||||||||
Large Cap Diversified Alpha Fund | — | (80,326 | ) | (106,256 | ) | — | (52,281 | ) | — | (238,863 | ) | ||||||||||||||||
Large Cap Disciplined Equity Fund | — | (1,493,918 | ) | (1,507,113 | ) | (586 | ) | (429,877 | ) | 803 | (3,430,691 | ) | |||||||||||||||
Large Cap Index Fund | 1,310 | (6,369 | ) | (11,670 | ) | — | (16,800 | ) | 40 | (33,489 | ) | ||||||||||||||||
Small Cap Fund | 1,125 | (154,582 | ) | (310,129 | ) | (43 | ) | (182,386 | ) | (8 | ) | (646,023 | ) | ||||||||||||||
Small/Mid Cap Equity Fund | 8,142 | (208,795 | ) | (477,906 | ) | (365 | ) | (248,400 | ) | (8 | ) | (927,332 | ) | ||||||||||||||
U.S. Managed Volatility Fund | 733 | — | (1,283 | ) | — | 11,408 | — | 10,858 | |||||||||||||||||||
International Equity Fund | 5,769 | (163,564 | ) | (323,425 | ) | — | (39,175 | ) | (1,318 | ) | (521,713 | ) | |||||||||||||||
World Equity Ex-US Fund | 38,288 | (438,658 | ) | (693,343 | ) | — | (83,816 | ) | (6,251 | ) | (1,183,780 | ) | |||||||||||||||
Screened World Equity Ex-US Fund | 666 | (6,491 | ) | (18,690 | ) | — | (7,153 | ) | (157 | ) | (31,825 | ) | |||||||||||||||
Enhanced LIBOR Opportunities Fund | — | (11,891 | ) | (13,958 | ) | (78 | ) | (40,855 | ) | 81 | (66,701 | ) | |||||||||||||||
Core Fixed Income Fund | 31,853 | (32,495 | ) | (19,190 | ) | — | (425,494 | ) | (20,674 | ) | (466,000 | ) | |||||||||||||||
High Yield Bond Fund | 7,957 | (63,110 | ) | (140,658 | ) | — | (253,299 | ) | (6,057 | ) | (455,167 | ) | |||||||||||||||
Long Duration Fund | 6,671 | (9,572 | ) | (43,672 | ) | — | (16,494 | ) | (6,688 | ) | (69,755 | ) | |||||||||||||||
Emerging Markets Debt Fund | 25,892 | (26,548 | ) | (66,219 | ) | (2,412 | ) | (40,935 | ) | (15,976 | ) | (126,198 | ) | ||||||||||||||
Real Return Plus Fund | — | (2,963 | ) | (3,068 | ) | — | 10,480 | — | 4,449 | ||||||||||||||||||
Post-October losses represent losses realized on investment transactions from November 1, 2008 through May 31, 2009 that, in accordance with Federal income tax regulations, the Funds may elect to defer and treat as having arisen in the following fiscal year. For Federal income tax purposes, capital loss carryforwards may be carried forward and applied against future capital gains as follows:
| Expires 2011 ($ Thousands) | Expires 2015 ($ Thousands) | Expires 2016 ($ Thousands) | Expires 2017 ($ Thousands) | Total Capital Loss Carryforwards 05/31/09 ($ Thousands) | |||||||||||
Large Cap Fund | $ | 89,413 | $ | — | $ | — | $ | 7,887 | $ | 97,300 | |||||
Large Cap Diversified Alpha Fund | — | — | — | 80,326 | 80,326 | ||||||||||
| 140 | SEI Institutional Investments Trust / Semi-Annual Report / November 30, 2009 |
Table of Contents
| Expires 2011 ($ Thousands) | Expires 2015 ($ Thousands) | Expires 2016 ($ Thousands) | Expires 2017 ($ Thousands) | Total Capital Loss Carryforwards 05/31/09 ($ Thousands) | |||||||||||
Large Cap Disciplined Equity Fund | $ | — | $ | — | $ | — | $ | 1,493,918 | $ | 1,493,918 | |||||
Large Cap Index Fund | — | — | — | 6,369 | 6,369 | ||||||||||
Small Cap Fund | — | — | — | 154,582 | 154,582 | ||||||||||
Small/Mid Cap Equity Fund | — | — | — | 208,795 | 208,795 | ||||||||||
International Equity Fund | — | — | — | 163,564 | 163,564 | ||||||||||
World Equity Ex-US Fund | — | — | — | 438,658 | 438,658 | ||||||||||
Screened World Equity Ex-US Fund | — | — | — | 6,491 | 6,491 | ||||||||||
Enhanced LIBOR Opportunities Fund | — | — | 1,487 | 10,404 | 11,891 | ||||||||||
Core Fixed Income Fund | — | — | — | 32,495 | 32,495 | ||||||||||
High Yield Bond Fund | — | — | 1,148 | 61,962 | 63,110 | ||||||||||
Long Duration Fund | — | 2,250 | 796 | 6,526 | 9,572 | ||||||||||
Emerging Markets Debt Fund | — | — | — | 26,548 | 26,548 | ||||||||||
Real Return Fund | — | — | — | 2,963 | 2,963 | ||||||||||
For Federal income tax purposes, the cost of securities owned at November 30, 2009, and the net realized gains or losses on securities sold for the period were not materially different from amounts reported for financial reporting purposes. These differences are primarily due to investments in partnerships and wash sales which cannot be used for Federal income tax purposes in the current year and have been deferred for use in future years. The aggregate gross unrealized appreciation and depreciation on total investments held by the Funds at November 30, 2009, was as follows:
| Federal Tax Cost ($ Thousands) | Appreciated Securities ($ Thousands) | Depreciated Securities ($ Thousands) | Net Unrealized Appreciation (Depreciation) ($ Thousands) | |||||||||||
Large Cap Fund | $ | 874,646 | $ | 134,012 | $ | (12,407 | ) | $ | 121,605 | |||||
Large Cap Diversified Alpha Fund | 337,009 | 39,033 | (21,373 | ) | 17,660 | |||||||||
Large Cap Disciplined Equity Fund | 7,437,066 | 976,159 | (307,665 | ) | 668,494 | |||||||||
Large Cap Index Fund | 477,697 | 113,612 | (28,025 | ) | 85,587 | |||||||||
Small Cap Fund | 1,338,408 | 164,110 | (92,433 | ) | 71,677 | |||||||||
Small/Mid Cap Equity Fund | 2,209,444 | 323,421 | (131,449 | ) | 191,972 | |||||||||
U.S. Managed Volatility Fund | 250,590 | 43,654 | (4,340 | ) | 39,314 | |||||||||
International Equity Fund | 671,944 | 103,593 | (15,931 | ) | 87,662 | |||||||||
World Equity Ex-US Fund | 3,042,557 | 521,292 | (68,512 | ) | 452,780 | |||||||||
Screened World Equity Ex-US Fund | 67,134 | 8,662 | (2,289 | ) | 6,373 | |||||||||
Enhanced LIBOR Opportunities Fund | 196,300 | 1,417 | (41,516 | ) | (40,099 | ) | ||||||||
Core Fixed Income Fund | 6,254,886 | 265,340 | (338,683 | ) | (73,343 | ) | ||||||||
High Yield Bond Fund | 1,433,271 | 118,800 | (107,954 | ) | 10,846 | |||||||||
Long Duration Fund | 2,009,547 | 162,557 | (14,611 | ) | 147,946 | |||||||||
Emerging Markets Debt Fund | 861,109 | 104,264 | (30,030 | ) | 74,234 | |||||||||
Real Return Fund | 250,946 | 13,094 | — | 13,094 | ||||||||||
Management has analyzed the Fund’s tax position taken on federal income tax returns for all open tax years and has concluded that as of November 30, 2009, no provision for income tax would be required in the Fund’s financial statements. The Fund’s federal and state income and federal excise tax returns for tax years for which the applicable statutes of limitations have not expired are subject to examination by the Internal Revenue Service and state departments of revenue.
9. CONCENTRATION/RISKS
In the normal course of business, the Trust enters into contracts that provide general indemnifications by the Trust to the counterparty to the contract. The Trust’s maximum exposure under these arrangements is dependent on future claims that may be made against the Trust and, therefore, cannot be estimated; however, management believes that, based on experience, the risk of loss from such claims is considered remote.
The market values of the Core Fixed Income, Long Duration and High Yield Bond Funds’ investments may change in response to interest rate changes and other factors. During periods of falling interest rates, the values of fixed income securities generally rise. Conversely, during periods of rising interest rates, the values of such securities generally decline. Changes by recognized rating agencies in the ratings of any fixed income security and in the ability of an issuer to make payments of interest and principal may also affect the value of these investments.
The International Equity, World Equity Ex-US, Screened World Equity Ex-US and Emerging Markets Debt Funds concentrate their investments in securities of foreign issuers in various countries. These investments may involve certain considerations and risks not typically associated with investments in the United States, as a result of, among other factors, the possibility of future political and economic developments and the level of governmental supervision and regulation of securities markets in the respective countries.
10. IN-KIND TRANSFERS OF SECURITIES
During the six-month period ended November 30, 2009, the Large Cap Disciplined Equity Fund issued shares of beneficial interest in exchange for securities. These securities were transferred at their current value on the date of such transactions.
| Shares Issued | Value ($ Thousands) | ||||
Large Cap Disciplined Equity Fund | |||||
08/31/09 | 7,632,084 | $ | 62,736 | ||
| SEI Institutional Investments Trust / Semi-Annual Report / November 30, 2009 | 141 |
Table of Contents
Notes to Financial Statements (Unaudited) (Concluded)
November 30, 2009
During the year ended May 31, 2009, the Large Cap Disciplined Equity Fund issued shares of beneficial interest in exchange for securities. These securities were transferred at their current value on the date of such transactions.
| Shares Issued | Value ($ Thousands) | ||||
Large Cap Disciplined Equity Fund | |||||
09/30/08 | 7,801,537 | $ | 76,845 | ||
11. SECURITIES LENDING
Each Fund may lend portfolio securities to brokers, dealers and other financial organizations that meet capital and other credit requirements or other criteria established by the Trust’s Board of Trustees. These loans may not exceed 33 1/3% of the total asset value of the Fund (including the loan collateral). No Fund will lend portfolio securities to its Adviser, sub-adviser or their affiliates unless it has applied for and received specific authority to do so from the SEC. Loans of portfolio securities will be fully collateralized by cash. Collateral will be maintained in an amount equal to at least 100% of the current market value of the loaned securities by marking to market daily, although the borrower will be required to deliver collateral between 102% and 105% of the market value of borrowed securities for domestic and foreign securities, respectively. However, due to market fluctuations during the day, the value of securities loaned on a particular day may, during the course of the day, exceed the value of collateral. On each business day, the amount of collateral is adjusted based on the prior
day’s market fluctuations and the current day’s lending activity.
Income from lending activity is determined by the amount of interest earned on collateral, less any amounts payable to the borrowers of the securities and the lending agent. Lending securities involves certain risks, including the risk that the Fund may be delayed or prevented from recovering the collateral if the borrower fails to return the securities.
Cash collateral received in connection with securities lending is invested in short-term investments by the lending agent. These investments may include the SEI Liquidity Fund L.P., and the Fund bears all of the gains and losses on such investment. There is no guarantee that these investments will not lose value.
12. SUBSEQUENT EVENTS
Management has evaluated the need for disclosures and/or adjustments resulting from subsequent events through January 29, 2010, the date the financial statements were issued. Effective January 1, 2010, the Advisory Fee and Voluntary Expense Limitation for the Real Return Fund were reduced to 0.220% and 0.200%, respectively.
13. OTHER MATTERS
Due to volatility in the fixed income and equity markets, the market value of a Fund’s holdings may be materially different than shown in the Schedule of Investments (“SOI”). The values shown in the SOIs were the market values as of November 30, 2009 and do not reflect any market events after November 30, 2009.
| 142 | SEI Institutional Investments Trust / Semi-Annual Report / November 30, 2009 |
Table of Contents
Disclosure of Fund Expenses (Unaudited)
November 30, 2009
All mutual funds have operating expenses. As a shareholder of a fund, your investment is affected by these ongoing costs, which include (among others) costs for portfolio management, administrative services, and shareholder reports like this one. It is important for you to understand the impact of these costs on your investment returns.
Operating expenses such as these are deducted from the fund’s gross income and directly reduce your final investment return. These expenses are expressed as a percentage of the fund’s average net assets; this percentage is known as the fund’s expense ratio.
The following examples use the expense ratio and are intended to help you understand the ongoing costs (in dollars) of investing in your Fund and to compare these costs with those of other mutual funds. The examples are based on an investment of $1,000 made at the beginning of the period shown and held for the entire period.
The table on the next page illustrates your Fund’s costs in two ways:
• Actual fund return. This section helps you to estimate the actual expenses after fee waivers that your Fund incurred over the period. The “Expenses Paid During Period” column shows the actual dollar expense cost incurred by a $1,000 investment in the Fund, and the “Ending Account Value” number is derived from deducting that expense cost from the Fund’s gross investment return.
You can use this information, together with the actual amount you invested in the Fund, to estimate the expenses you paid over that period. Simply divide your actual starting account value by $1,000 to arrive at a ratio (for example, an $8,600 account value divided by $1,000 = 8.6), then multiply that ratio by the number shown for your Fund under “Expenses Paid During Period.”
• Hypothetical 5% return. This section helps you compare your Fund’s costs with those of other mutual funds. It assumes that the Fund had an annual 5% return before expenses during the year, but that the expense ratio (Column 3) is unchanged. This example is useful in making comparisons because the Securities and Exchange Commission requires all mutual funds to make this 5% calculation. You can assess your Fund’s comparative cost by comparing the hypothetical result for your Fund in the “Expense Paid During Period” column with those that appear in the same charts in the shareholder reports for other funds.
NOTE: Because the return is set at 5% for comparison purposes — NOT your Fund’s actual return — the account values shown do not apply to your specific investment.
| SEI Institutional Investments Trust / Semi-Annual Report / November 30, 2009 | 143 |
Table of Contents
Disclosure of Fund Expenses (Unaudited) (Concluded)
November 30, 2009
| Beginning Account Value 6/1/2009 | Ending Account Value 11/30/2009 | Annualized Expense Ratios | Expense Paid During Period* | |||||||||
Large Cap Fund | ||||||||||||
Actual Fund Return | ||||||||||||
Class A Shares | $ | 1,000.00 | $ | 1,195.10 | 0.25 | % | $ | 1.38 | ||||
Hypothetical 5% Return | ||||||||||||
Class A Shares | $ | 1,000.00 | $ | 1,023.82 | 0.25 | % | $ | 1.27 | ||||
Large Cap Diversified Alpha Fund | ||||||||||||
Actual Fund Return | ||||||||||||
Class A Shares | $ | 1,000.00 | $ | 1,209.50 | 0.31 | % | $ | 1.72 | ||||
Hypothetical 5% Return | ||||||||||||
Class A Shares | $ | 1,000.00 | $ | 1,023.51 | 0.31 | % | $ | 1.57 | ||||
Large Cap Disciplined Equity Fund | ||||||||||||
Actual Fund Return | ||||||||||||
Class A Shares | $ | 1,000.00 | $ | 1,209.10 | 0.19 | % | $ | 1.05 | ||||
Hypothetical 5% Return | ||||||||||||
Class A Shares | $ | 1,000.00 | $ | 1,024.12 | 0.19 | % | $ | 0.96 | ||||
Large Cap Index Fund | ||||||||||||
Actual Fund Return | ||||||||||||
Class A Shares | $ | 1,000.00 | $ | 1,205.40 | 0.06 | % | $ | 0.33 | ||||
Hypothetical 5% Return | ||||||||||||
Class A Shares | $ | 1,000.00 | $ | 1,024.77 | 0.06 | % | $ | 0.30 | ||||
Small Cap Fund | ||||||||||||
Actual Fund Return | ||||||||||||
Class A Shares | $ | 1,000.00 | $ | 1,192.90 | 0.53 | % | $ | 2.91 | ||||
Hypothetical 5% Return | ||||||||||||
Class A Shares | $ | 1,000.00 | $ | 1,022.66 | 0.53 | % | $ | 2.69 | ||||
Small/Mid Cap Equity Fund | ||||||||||||
Actual Fund Return | ||||||||||||
Class A Shares | $ | 1,000.00 | $ | 1,204.20 | 0.49 | % | $ | 2.71 | ||||
Hypothetical 5% Return | ||||||||||||
Class A Shares | $ | 1,000.00 | $ | 1,022.61 | 0.49 | % | $ | 2.48 | ||||
U.S. Managed Volatility Fund | ||||||||||||
Actual Fund Return | ||||||||||||
Class A Shares | $ | 1,000.00 | $ | 1,157.60 | 0.35 | % | $ | 1.89 | ||||
Hypothetical 5% Return | ||||||||||||
Class A Shares | $ | 1,000.00 | $ | 1,023.31 | 0.35 | % | $ | 1.78 | ||||
International Equity Fund | ||||||||||||
Actual Fund Return | ||||||||||||
Class A Shares | $ | 1,000.00 | $ | 1,164.50 | 0.39 | % | $ | 2.12 | ||||
Hypothetical 5% Return | ||||||||||||
Class A Shares | $ | 1,000.00 | $ | 1,023.11 | 0.39 | % | $ | 1.98 | ||||
World Equity Ex-US Fund | ||||||||||||
Actual Fund Return | ||||||||||||
Class A Shares | $ | 1,000.00 | $ | 1,178.80 | 0.45 | % | $ | 2.46 | ||||
Hypothetical 5% Return | ||||||||||||
Class A Shares | $ | 1,000.00 | $ | 1,022.81 | 0.45 | % | $ | 2.28 | ||||
Screened World Equity Ex-US Fund | ||||||||||||
Actual Fund Return | ||||||||||||
Class A Shares | $ | 1,000.00 | $ | 1,186.90 | 0.80 | % | $ | 4.39 | ||||
Hypothetical 5% Return | ||||||||||||
Class A Shares | $ | 1,000.00 | $ | 1,021.06 | 0.80 | % | $ | 4.05 | ||||
Enhanced LIBOR Opportunities Fund | ||||||||||||
Actual Fund Return | ||||||||||||
Class A Shares | $ | 1,000.00 | $ | 1,084.10 | 0.41 | % | $ | 2.14 | ||||
Hypothetical 5% Return | ||||||||||||
Class A Shares | $ | 1,000.00 | $ | 1,023.01 | 0.41 | % | $ | 2.08 | ||||
Core Fixed Income Fund | ||||||||||||
Actual Fund Return | ||||||||||||
Class A Shares | $ | 1,000.00 | $ | 1,106.00 | 0.14 | % | $ | 0.74 | ||||
Hypothetical 5% Return | ||||||||||||
Class A Shares | $ | 1,000.00 | $ | 1,024.37 | 0.14 | % | $ | 0.71 | ||||
| Beginning Account Value 6/1/2009 | Ending Account Value 11/30/2009 | Annualized Expense Ratios | Expense Paid During Period* | |||||||||
HighYield Bond Fund | ||||||||||||
Actual Fund Return | ||||||||||||
Class A Shares | $ | 1,000.00 | $ | 1,272.30 | 0.35 | % | $ | 1.99 | ||||
Hypothetical 5% Return | ||||||||||||
Class A Shares | $ | 1,000.00 | $ | 1,023.31 | 0.35 | % | $ | 1.78 | ||||
Long Duration Fund | ||||||||||||
Actual Fund Return | ||||||||||||
Class A Shares | $ | 1,000.00 | $ | 1,140.20 | 0.20 | % | $ | 1.07 | ||||
Hypothetical 5% Return | ||||||||||||
Class A Shares | $ | 1,000.00 | $ | 1,024.07 | 0.20 | % | $ | 1.01 | ||||
Emerging Markets Debt Fund | ||||||||||||
Actual Fund Return | ||||||||||||
Class A Shares | $ | 1,000.00 | $ | 1,185.90 | 0.55 | % | $ | 3.01 | ||||
Hypothetical 5% Return | ||||||||||||
Class A Shares | $ | 1,000.00 | $ | 1,022.31 | 0.55 | % | $ | 2.79 | ||||
Real Return Fund | ||||||||||||
Actual Fund Return | ||||||||||||
Class A Shares | $ | 1,000.00 | $ | 1,048.50 | 0.36 | % | $ | 1.85 | ||||
Hypothetical 5% Return | ||||||||||||
Class A Shares | $ | 1,000.00 | $ | 1,023.26 | 0.36 | % | $ | 1.83 | ||||
| * | Expenses are equal to the Fund’s annualized expense ratio multiplied by the average account value over the period, multiplied by 183/365 (to reflect one-half year period shown). |
| 144 | SEI Institutional Investments Trust / Semi-Annual Report / November 30, 2009 |
Table of Contents
Board of Trustees Considerations in Approving the Advisory and Sub-Advisory Agreements (Unaudited)
SEI Institutional Investments Trust (the “Trust”) and SEI Investments Management Corporation (“SIMC”) have entered into an investment advisory agreement (the “Advisory Agreement”). Pursuant to the Advisory Agreement, SIMC oversees the investment advisory services provided to the series of the Trust (the “Funds”) and may manage the cash portion of the Funds’ assets. Pursuant to separate sub-advisory agreements (the “Sub-Advisory Agreements” and, together with the Advisory Agreement, the “Investment Advisory Agreements”) with SIMC, and under the supervision of SIMC and the Trust’s Board of Trustees (the “Board”), the Sub-Advisers are responsible for the day-to-day investment management of all or a discrete portion of the assets of the Funds. The Sub-Advisers also are responsible for managing their employees who provide services to these Funds. The Sub-Advisers are selected based primarily upon the research and recommendations of SIMC, which evaluates quantitatively and qualitatively the Sub-Advisers’ skills and investment results in managing assets for specific asset classes, investment styles and strategies.
The Investment Company Act of 1940, as amended (the “1940 Act”) requires that the initial approval of, as well as the continuation of, the Funds’ Investment Advisory Agreements must be specifically approved: (i) by the vote of the Board of Trustees or by a vote of the shareholders of the Funds; and (ii) by the vote of a majority of the Trustees who are not parties to the Investment Advisory Agreements or “interested persons” of any party (the “Independent Trustees”), cast in person at a meeting called for the purpose of voting on such approval. In connection with their consideration of such approvals, the Funds’ Trustees must request and evaluate, and SIMC and the Sub-Advisers are required to furnish, such information as may be reasonably necessary to evaluate the terms of the Investment Advisory Agreements. In addition, the Securities and Exchange Commission (“SEC”) takes the position that, as part of their fiduciary duties with respect to a mutual fund’s fees, mutual fund boards are required to evaluate the material factors applicable to a decision to approve an Investment Advisory Agreement.
Consistent with these responsibilities, the Trust’s Board of Trustees calls and holds meetings each year that are dedicated to considering whether to renew the Investment Advisory Agreements between the Trust and SIMC and SIMC and the Sub-Advisers with respect to the Funds of the Trust. In preparation for these meetings, the Board requests and reviews a wide variety of materials provided by SIMC and the Sub-Advisers, including information about SIMC’s and the Sub-Advisers’ affiliates, personnel and operations. The Board also receives extensive data provided by third parties. This information is in addition to the detailed information about the Funds that the Board reviews during the course of each year, including information that relates to Fund operations and Fund performance. The Trustees also receive a memorandum from Fund counsel and independent counsel to the Independent Trustees regarding the responsibilities of Trustees in connection with their consideration of whether to approve the Trust’s Investment Advisory Agreements. Finally, the Independent Trustees receive advice from independent counsel to the Independent Trustees, meet in executive session outside the presence of Fund management and participate in question and answer sessions with representatives of SIMC and the Sub-Advisers.
Specifically, the Board requested and received written materials from SIMC and the Sub-Advisers regarding: (a) the quality of SIMC’s and the Sub-Advisers’ investment management and other services; (b) SIMC’s and the Sub-Advisers’ investment management personnel; (c) SIMC’s and the Sub-Advisers’ operations and financial condition; (d) SIMC’s and the Sub-Advisers’ brokerage practices (including any soft dollar arrangements) and investment strategies; (e) the level of the advisory fees that SIMC and the Sub-Advisers charge the Funds compared with the fees each charge to comparable mutual funds; (f) the Funds’ overall fees and operating expenses compared with similar mutual funds; (g) the level of SIMC’s and the Sub-Advisers’ profitability from their Fund-related operations; (h) SIMC’s and the Sub-Advisers’ compliance systems; (i) SIMC’s and the Sub-Advisers’ policies on and compliance procedures for personal securities transactions; (j) SIMC’s and the Sub-Advisers’ reputation, expertise and resources in domestic and/or international financial markets; and (k) the Funds’ performance compared with similar mutual funds.
| SEI Institutional Investments Trust / Semi-Annual Report / November 30, 2009 | 145 |
Table of Contents
Board of Trustees Considerations in Approving the Advisory and Sub-Advisory Agreements (Unaudited) (Continued)
At the June 24-25, 2009 and September 17-18, 2009 meetings of the Board of Trustees, the Trustees, including a majority of the Independent Trustees, approved the Investment Advisory Agreements and approved the selection of SIMC and the Sub-Advisers to act in their respective capacities for the Funds. The Board’s approval was based on its consideration and evaluation of a variety of specific factors discussed at the meetings and at prior meetings, including:
| • | the nature, extent and quality of the services provided to the Funds under the Investment Advisory Agreements, including the resources of SIMC and the Sub-Advisers and their affiliates dedicated to the Funds; |
| • | the Funds’ investment performance and how it compared to that of other comparable mutual funds; |
| • | the Funds’ expenses under each Investment Advisory Agreement and how those expenses compared to those of other comparable mutual funds; |
| • | the profitability of SIMC and the Sub-Advisers and their affiliates with respect to the Funds, including both direct and indirect benefits accruing to SIMC and the Sub-Advisers and their affiliates; and |
| • | the extent to which economies of scale would be realized as the Funds grow and whether fee levels in the Investment Advisory Agreements reflect those economies of scale for the benefit of Fund investors. |
Nature, Extent and Quality of Services. The Board of Trustees considered the nature, extent and quality of the services provided by SIMC and the Sub-Advisers to the Funds and the resources of SIMC and the Sub-Advisers and their affiliates dedicated to the Funds. In this regard, the Trustees evaluated, among other things, SIMC’s and the Sub-Advisers’ personnel, experience, track record and compliance program. The Trustees found the level of SIMC’s professional staff and culture of compliance satisfactory. Following evaluation, the Board concluded that, within the context of its full deliberations, the nature, extent and quality of services provided by SIMC and the Sub-Advisers to the Funds and the resources of SIMC and the Sub-Advisers and their affiliates dedicated to the Funds supported renewal of the Investment Advisory Agreements.
Fund Performance. The Board of Trustees considered Fund performance in determining whether to renew the Investment Advisory Agreements. Specifically, the Trustees considered the Funds’ performance relative to their peer groups and appropriate indices/benchmarks, in light of total return, yield and market trends. As part of this review, the Trustees considered the composition of each peer group and selection criteria. In evaluating performance, the Trustees considered both market risk and shareholder risk expectations for the Funds. The Trustees found Fund performance satisfactory, and where performance was below the benchmark, the Trustees were satisfied that appropriate steps were being taken. Following evaluation, the Board concluded that, within the context of its full deliberations, the performance of the Funds supported renewal of the Investment Advisory Agreements.
Fund Expenses. With respect to the Funds’ expenses under the Investment Advisory Agreements, the Trustees considered the rate of compensation called for by the Investment Advisory Agreements and the Funds’ net operating expense ratio in comparison to those of other comparable mutual funds. The Trustees also considered information about average expense ratios of comparable mutual funds in the Funds’ respective peer groups. The Trustees further considered the fact that the comparative fee analysis either showed that the various fees were below average or that there was a reasonable basis for the fee level. Finally, the Trustees considered the effects of SIMC’s voluntary waiver of management and other fees and the Sub-Advisers’ fees to prevent total Fund expenses from exceeding a specified cap and that SIMC and the Sub-Advisers, through waivers, have maintained the Funds’ net operating expenses at competitive levels for their respective distribution channels. Following evaluation, the Board concluded that, within the context of its full deliberations, the expenses of the Funds are reasonable and supported renewal of the Investment Advisory Agreements.
| 146 | SEI Institutional Investments Trust / Semi-Annual Report / November 30, 2009 |
Table of Contents
Profitability. With regard to profitability, the Trustees considered all compensation flowing to SIMC and the Sub-Adviser and their affiliates, directly or indirectly. The Trustees considered whether the varied levels of compensation and profitability under the Investment Advisory Agreements and other service agreements were reasonable and justified in light of the quality of all services rendered to the Funds by SIMC and the Sub-Advisers and their affiliates. The Trustees found that profitability was reasonable and that the margin was not increasing despite growth in assets. When considering the profitability of the Sub-Advisers, the Board took into account the fact that the Sub-Advisers are compensated by SIMC, and not by the Funds directly, and such compensation with respect to any Sub-Adviser reflects an arms-length negotiation between the Sub-Adviser and SIMC. Based on this evaluation, the Board concluded that, within the context of its full deliberations, the profitability of SIMC and the Sub-Advisers are reasonable and supported renewal of the Investment Advisory Agreements.
Economies of Scale. The Trustees considered the existence of any economies of scale and whether those were passed along to the Funds’ shareholders through a graduated investment advisory fee schedule or other means, including any fee waivers by SIMC and its affiliates. Based on this evaluation, the Board concluded that, within the context of its full deliberations, the Funds obtain reasonable benefit from economies of scale.
Based on the Trustees’ deliberation and their evaluation of the information described above, the Board, including all of the Independent Trustees, unanimously approved the continuation of the Investment Advisory Agreements and concluded that the compensation under the Investment Advisory Agreements is fair and reasonable in light of such services and expenses and such other matters as the Trustees considered to be relevant in the exercise of their reasonable judgment. In the course of their deliberations, the Trustees did not identify any particular information that was all-important or controlling.
| SEI Institutional Investments Trust / Semi-Annual Report / November 30, 2009 | 147 |
Table of Contents
SEI INSTITUTIONAL INVESTMENTS TRUST SEMI-ANNUAL REPORT NOVEMBER 30, 2009
Robert A. Nesher, Chairman
Trustees
William M. Doran
James M. Storey
George J. Sullivan, Jr.
Rosemarie B. Greco
Nina Lesavoy
James M. Williams
Mitchell A. Johnson
Hubert L. Harris, Jr.
Officers
Robert A. Nesher
President and Chief Executive Officer
Stephen F. Panner
Controller and Chief Financial Officer
Russell Emery
Chief Compliance Officer
Timothy D. Barto
Vice President, Secretary
James Ndiaye
Vice President, Assistant Secretary
Michael T. Pang
Vice President, Assistant Secretary
Aaron Buser
Vice President, Assistant Secretary
David F. McCann
Vice President, Assistant Secretary
John J. McCue
Vice President
Andrew S. Decker
Anti-Money Laundering Compliance Officer
Investment Adviser
SEI Investments Management Corporation
Administrator
SEI Investments Global Funds Services
Distributor
SEI Investments Distribution Co.
Legal Counsel
Morgan, Lewis & Bockius LLP
Independent Registered Public Accounting Firm
KPMG LLP
This report and the financial statements contained herein are submitted for the general information of the shareholders of the Trust and must be preceded or accompanied by a current prospectus. Shares of the Funds are not deposits or obligations of, or guaranteed or endorsed by, any bank. The shares are not federally insured by the Federal Deposit Insurance Corporation (FDIC), the Federal Reserve Board, or any other government agency. Investment in the shares involves risk, including the possible loss of principal.
For more information call
1 800 DIAL SEI
(1 800 342 5734)
Table of Contents
SEI Investments Distribution Co.
Oaks, PA 19456 1.800.DIAL.SEI (1.800.342.5734)
SEI-F-120 (11/09)
Table of Contents
| Item 2. | Code of Ethics. |
Not applicable for semi-annual report.
| Item 3. | Audit Committee Financial Expert. |
Not applicable for semi-annual report.
| Item 4. | Principal Accountant Fees and Services. |
Not applicable for semi-annual report.
| Item 5. | Audit Committee of Listed Registrants. |
Not applicable for semi-annual report.
| Item 6. | Schedule of Investments. |
The Schedules of Investments in securities of unaffiliated issuers as of the close of the reporting period for the Large Cap Fund, Large Cap Diversified Alpha Fund, Large Cap Disciplined Equity Fund, Large Cap Index Fund, Small Cap Fund, Small/Mid Cap Fund, U.S. Managed Volatility Fund, International Equity Fund, World Equity Ex-US Fund and Screened World Equity Ex-US Fund are listed below. The Schedule of Investments in securities of unaffiliated issuers as of the close of the reporting period for the Enhanced LIBOR Opportunities Fund, Core Fixed Income Fund, High Yield Bond Fund, Long Duration Bond Fund, Emerging Markets Debt Fund and Real Return Fund are included as part of the report to shareholders filed under Item 1 of this form.
Table of Contents
SCHEDULE OF INVESTMENTS (Unaudited)
Large Cap Fund
November 30, 2009
Description | Shares | Market Value ($ Thousands) | |||
COMMON STOCK — 91.2% | |||||
Consumer Discretionary — 10.5% | |||||
99 Cents Only Stores* | 5,800 | $ | 70 | ||
Abercrombie & Fitch, Cl A | 1,300 | 52 | |||
Advance Auto Parts | 7,100 | 279 | |||
Aeropostale* | 5,400 | 170 | |||
Amazon.com* (A) | 60,330 | 8,199 | |||
American Axle & Manufacturing Holdings | 16,400 | 103 | |||
American Eagle Outfitters | 8,000 | 123 | |||
American Greetings, Cl A | 7,000 | 145 | |||
Apollo Group, Cl A* | 9,600 | 548 | |||
Asbury Automotive Group* | 7,500 | 80 | |||
Autoliv (A) | 15,000 | 609 | |||
AutoNation* (A) | 1,000 | 18 | |||
AutoZone* (A) | 1,787 | 264 | |||
Barnes & Noble (A) | 4,300 | 100 | |||
Bed Bath & Beyond* | 2,500 | 93 | |||
Best Buy (A) | 47,195 | 2,021 | |||
Big Lots* | 14,500 | 334 | |||
Bob Evans Farms | 2,300 | 58 | |||
BorgWarner | 4,200 | 127 | |||
Brinker International | 3,000 | 41 | |||
Brink’s Home Security Holdings* | 2,600 | 85 | |||
Cablevision Systems, Cl A | 5,126 | 128 | |||
Carmax* (A) | 11,100 | 221 | |||
Carnival | 1,300 | 42 | |||
CBS, Cl B | 69,300 | 888 | |||
Chico’s FAS* | 37,100 | 522 | |||
Chipotle Mexican Grill, Cl A* (A) | 1,900 | 159 | |||
Coach | 41,800 | 1,453 | |||
Comcast, Cl A | 348,847 | 5,118 | |||
Cooper Tire & Rubber | 1,700 | 30 | |||
Core-Mark Holding* | 1,700 | 51 | |||
Darden Restaurants | 20,500 | 644 | |||
Dick’s Sporting Goods* | 5,200 | 108 | |||
DIRECTV, Cl A* (A) | 131,446 | 4,158 | |||
Discovery Communications, Cl C* | 4,700 | 132 | |||
DISH Network, Cl A (A) | 27,300 | 565 | |||
Dollar Tree* (A) | 6,000 | 294 | |||
DR Horton | 1,400 | 14 | |||
Eastman Kodak (A) | 289,300 | 1,172 | |||
Expedia* (A) | 7,800 | 199 | |||
Family Dollar Stores (A) | 13,500 | 412 | |||
Foot Locker | 33,700 | 320 | |||
Ford Motor* (A) | 238,800 | 2,123 | |||
Gannett | 38,000 | 376 | |||
Gap | 57,500 | 1,232 | |||
Garmin (A) | 16,000 | 478 | |||
Gentex | 1,800 | 30 | |||
Genuine Parts | 1,158 | 41 | |||
Goodyear Tire & Rubber* | 8,600 | 118 | |||
H&R Block | 1,300 | 26 | |||
Hanesbrands* (A) | 7,100 | 170 | |||
Harley-Davidson (A) | 8,800 | 256 | |||
Harman International Industries | 900 | 34 | |||
Hasbro | 21,900 | 649 | |||
Helen of Troy* | 4,700 | 97 | |||
Home Depot (A) | 49,300 | 1,349 | |||
International Game Technology | 12,300 | 232 | |||
Interpublic Group* | 4,000 | 25 | |||
Description | Shares | Market Value ($ Thousands) | |||
J.C. Penney (A) | 99,560 | $ | 2,861 | ||
Jarden | 12,900 | 354 | |||
Johnson Controls | 49,751 | 1,346 | |||
KB Home (A) | 5,100 | 69 | |||
Kohl’s* | 4,694 | 250 | |||
Lamar Advertising, Cl A* | 900 | 25 | |||
Las Vegas Sands* (A) | 2,300 | 35 | |||
Leggett & Platt | 11,800 | 230 | |||
Lennar, Cl A | 6,100 | 77 | |||
Liberty Global, Cl A* (A) | 23,200 | 447 | |||
Liberty Media - Capital, Ser A* | 3,800 | 84 | |||
Liberty Media - Interactive, Cl A* | 3,900 | 42 | |||
Liberty Media - Starz* | 800 | 38 | |||
Limited Brands (A) | 3,500 | 58 | |||
Lithia Motors, Cl A | 2,200 | 16 | |||
LKQ* | 500 | 9 | |||
Lowe’s | 238,700 | 5,206 | |||
Macy’s | 87,900 | 1,434 | |||
Magna International, Cl A | 1,800 | 87 | |||
Marriott International, Cl A (A) | 20,238 | 521 | |||
McDonald’s | 30,825 | 1,950 | |||
McGraw-Hill | 27,200 | 815 | |||
MDC Holdings (A) | 1,300 | 39 | |||
MGM Mirage* (A) | 10,000 | 106 | |||
Newell Rubbermaid | 800 | 12 | |||
News, Cl A (A) | 95,100 | 1,090 | |||
NIKE, Cl B (A) | 74,710 | 4,848 | |||
Nordstrom (A) | 2,300 | 77 | |||
NVR* | 100 | 67 | |||
Office Depot* | 13,300 | 82 | |||
Omnicom Group | 23,200 | 852 | |||
O’Reilly Automotive* | 7,900 | 306 | |||
Oxford Industries | 2,000 | 43 | |||
Penn National Gaming* (A) | 4,600 | 123 | |||
PetSmart | 23,700 | 610 | |||
Phillips-Van Heusen | 700 | 28 | |||
Polo Ralph Lauren, Cl A | 400 | 31 | |||
priceline.com* (A) | 12,200 | 2,612 | |||
Pulte Homes (A) | 1,892 | 17 | |||
RadioShack | 29,500 | 556 | |||
Regal Entertainment Group, Cl A (A) | 2,800 | 38 | |||
Ross Stores | 23,000 | 1,012 | |||
Royal Caribbean Cruises* | 2,500 | 61 | |||
Sally Beauty Holdings* (A) | 15,200 | 106 | |||
Scholastic (A) | 1,400 | 35 | |||
Scientific Games, Cl A* | 600 | 8 | |||
Scripps Networks Interactive, Cl A | 1,100 | 43 | |||
Sears Holdings* (A) | 43,400 | 3,079 | |||
Service International | 2,900 | 22 | |||
Sherwin-Williams | 3,325 | 202 | |||
Signet Jewelers* | 1,100 | 29 | |||
Skechers U.S.A., Cl A* | 1,500 | 33 | |||
Smith & Wesson Holding* (A) | 20,000 | 99 | |||
Sonic Automotive, Cl A (A) | 8,500 | 75 | |||
Stanley Works (A) | 4,400 | 214 | |||
Staples (A) | 218,175 | 5,088 | |||
Starbucks* | 11,800 | 258 | |||
Starwood Hotels & Resorts Worldwide | 11,140 | 357 | |||
Steven Madden* | 1,600 | 57 | |||
Strayer Education (A) | 2,200 | 435 | |||
Target | 68,969 | 3,211 | |||
Tempur-Pedic International* | 7,800 | 168 | |||
| 1 | SEI Institutional Investments Trust / Semi-Annual Report / November 30, 2009 |
Table of Contents
SCHEDULE OF INVESTMENTS (Unaudited)
Large Cap Fund
November 30, 2009
Description | Shares | Market Value ($ Thousands) | |||
Thor Industries | 800 | $ | 23 | ||
Time Warner (A) | 185,489 | 5,698 | |||
Time Warner Cable, Cl A (A) | 52,293 | 2,191 | |||
TJX | 23,500 | 902 | |||
Toll Brothers* | 700 | 14 | |||
True Religion Apparel* (A) | — | — | |||
TRW Automotive Holdings* | 60,500 | 1,316 | |||
Universal Technical Institute* | 3,400 | 64 | |||
Urban Outfitters* | 1,900 | 60 | |||
VF | 1,559 | 113 | |||
Viacom, Cl B* | 61,428 | 1,821 | |||
Virgin Media (A) | 8,800 | 145 | |||
WABCO Holdings | 2,000 | 47 | |||
Walt Disney | 80,342 | 2,428 | |||
Weight Watchers International (A) | 32,000 | 886 | |||
Wendy’s, Cl A | 20,200 | 83 | |||
Whirlpool (A) | 10,700 | 793 | |||
Williams-Sonoma (A) | 4,200 | 85 | |||
WMS Industries* | 2,800 | 109 | |||
Wyndham Worldwide | 21,100 | 392 | |||
Wynn Resorts* (A) | 17,100 | 1,104 | |||
Yum! Brands (A) | 59,700 | 2,106 | |||
| 99,848 | |||||
Consumer Staples — 7.1% | |||||
Altria Group | 31,138 | 586 | |||
Archer-Daniels-Midland | 58,900 | 1,815 | |||
Avon Products | 43,130 | 1,477 | |||
BJ’s Wholesale Club* (A) | 26,400 | 916 | |||
Brown-Forman, Cl B | 175 | 9 | |||
Bunge | 12,700 | 786 | |||
Campbell Soup | 19,400 | 678 | |||
Central European Distribution* | 1,700 | 47 | |||
Chiquita Brands International* (A) | 1,200 | 20 | |||
Clorox | 4,700 | 283 | |||
Coca-Cola | 58,181 | 3,328 | |||
Coca-Cola Enterprises (A) | 71,500 | 1,405 | |||
Colgate-Palmolive | 7,539 | 635 | |||
ConAgra Foods | 96,500 | 2,141 | |||
Corn Products International | 14,000 | 393 | |||
Costco Wholesale | 32,230 | 1,931 | |||
CVS Caremark | 71,767 | 2,226 | |||
Del Monte Foods | 50,700 | 532 | |||
Dr Pepper Snapple Group | 9,500 | 249 | |||
Energizer Holdings* | 500 | 28 | |||
General Mills | 17,646 | 1,200 | |||
Green Mountain Coffee Roasters* (A) | 1,300 | 82 | |||
Hansen Natural* | 500 | 18 | |||
Herbalife | 14,800 | 621 | |||
Hershey | 9,400 | 333 | |||
HJ Heinz | 2,507 | 106 | |||
Hormel Foods | 3,800 | 143 | |||
JM Smucker | 1,800 | 106 | |||
Kellogg | 10,282 | 541 | |||
Kimberly-Clark | 18,154 | 1,198 | |||
Kraft Foods, Cl A | 77,834 | 2,069 | |||
Kroger | 34,722 | 790 | |||
Lorillard | 1,759 | 137 | |||
Molson Coors Brewing, Cl B | 600 | 27 | |||
NBTY* | 2,500 | 100 | |||
Pepsi Bottling Group | 15,600 | 592 | |||
PepsiAmericas | 1,300 | 38 | |||
Description | Shares | Market Value ($ Thousands) | |||
PepsiCo | 135,529 | $ | 8,433 | ||
Philip Morris International | 70,163 | 3,374 | |||
Prestige Brands Holdings* | 9,800 | 68 | |||
Procter & Gamble | 219,807 | 13,705 | |||
Ralcorp Holdings* | 11,400 | 660 | |||
Revlon, Cl A* (A) | 3,300 | 60 | |||
Reynolds American | 34,884 | 1,743 | |||
Safeway | 63,800 | 1,436 | |||
Sanderson Farms (A) | 6,200 | 249 | |||
Sara Lee | 39,500 | 480 | |||
Smithfield Foods* (A) | 5,500 | 85 | |||
Supervalu (A) | 34,300 | 474 | |||
Sysco | 6,924 | 187 | |||
Tyson Foods, Cl A | 11,000 | 132 | |||
Walgreen | 137,760 | 5,357 | |||
Wal-Mart Stores | 73,222 | 3,994 | |||
Whole Foods Market* (A) | 5,700 | 146 | |||
| 68,169 | |||||
Energy — 10.3% | |||||
Alpha Natural Resources* (A) | 2,467 | 91 | |||
Anadarko Petroleum | 10,700 | 637 | |||
Apache | 19,200 | 1,829 | |||
Arch Coal | 1,700 | 35 | |||
Atwood Oceanics* | 1,000 | 38 | |||
Baker Hughes | 301 | 12 | |||
BJ Services | 48,800 | 916 | |||
Cabot Oil & Gas | 4,100 | 157 | |||
Cal Dive International* | 9,800 | 71 | |||
Cameron International* | 1,258 | 48 | |||
Canadian Natural Resources | 31,255 | 2,098 | |||
Chesapeake Energy | 76,500 | 1,830 | |||
Chevron | 176,584 | 13,781 | |||
Cimarex Energy (A) | 3,800 | 178 | |||
Concho Resources* | 2,100 | 86 | |||
ConocoPhillips | 159,897 | 8,278 | |||
Consol Energy | 1,000 | 46 | |||
Denbury Resources* (A) | 2,100 | 28 | |||
Devon Energy | 29,000 | 1,953 | |||
Diamond Offshore Drilling (A) | 6,200 | 617 | |||
Dresser-Rand Group* | 9,100 | 256 | |||
El Paso | 43,000 | 411 | |||
Encore Acquisition* | 1,700 | 77 | |||
ENSCO International | 600 | 26 | |||
EOG Resources (A) | 44,390 | 3,839 | |||
Exxon Mobil | 313,455 | 23,531 | |||
FMC Technologies* | 5,200 | 283 | |||
Frontier Oil | 4,500 | 52 | |||
Halliburton | 84,470 | 2,480 | |||
Helix Energy Solutions Group* | 59,900 | 704 | |||
Helmerich & Payne | 500 | 19 | |||
Hess | 1,053 | 61 | |||
Holly | 14,100 | 359 | |||
Marathon Oil | 101,264 | 3,303 | |||
Massey Energy (A) | 1,900 | 72 | |||
Murphy Oil | 43,600 | 2,459 | |||
Nabors Industries* | 1,800 | 37 | |||
National Oilwell Varco | 78,134 | 3,361 | |||
Newfield Exploration* | 2,300 | 97 | |||
Noble | 16,300 | 673 | |||
Noble Energy | 3,300 | 215 | |||
Occidental Petroleum | 61,030 | 4,931 | |||
Oceaneering International* | 2,100 | 115 | |||
| 2 | SEI Institutional Investments Trust / Semi-Annual Report / November 30, 2009 |
Table of Contents
SCHEDULE OF INVESTMENTS (Unaudited)
Large Cap Fund
November 30, 2009
Description | Shares | Market Value ($ Thousands) | |||
Oil States International* | 19,400 | $ | 696 | ||
Overseas Shipholding Group (A) | 6,300 | 241 | |||
Patterson-UTI Energy | 44,400 | 683 | |||
Peabody Energy | 2,100 | 93 | |||
PetroHawk Energy* | 4,200 | 94 | |||
Petroleo Brasileiro ADR | 26,430 | 1,355 | |||
Pioneer Natural Resources | 1,100 | 46 | |||
Plains Exploration & Production* | 1,800 | 49 | |||
Pride International* | 1,000 | 32 | |||
Quicksilver Resources* (A) | 6,600 | 88 | |||
Range Resources | 23,030 | 1,085 | |||
Rowan | 800 | 20 | |||
SandRidge Energy* (A) | 3,800 | 36 | |||
Schlumberger | 40,066 | 2,560 | |||
SEACOR Holdings* | 6,300 | 483 | |||
Southern Union | 59,500 | 1,233 | |||
Southwestern Energy* | 2,400 | 106 | |||
Spectra Energy | 19,500 | 379 | |||
St. Mary Land & Exploration | 600 | 19 | |||
Stone Energy* | 10,100 | 191 | |||
Suncor Energy | 18,624 | 674 | |||
Sunoco | 17,900 | 451 | |||
Tesoro (A) | 2,100 | 27 | |||
Tidewater | 11,300 | 508 | |||
Transocean* | 24,000 | 2,049 | |||
Unit* | 1,400 | 53 | |||
Valero Energy | 48,900 | 777 | |||
Walter Industries | 4,900 | 336 | |||
Western Refining* (A) | 9,700 | 45 | |||
Whiting Petroleum* | 300 | 19 | |||
Williams | 88,100 | 1,752 | |||
XTO Energy | 53,837 | 2,285 | |||
| 98,555 | |||||
Financials — 14.2% | |||||
ACE | 4,200 | 205 | |||
Affiliated Managers Group* | 1,500 | 98 | |||
Aflac | 135,740 | 6,248 | |||
Allied World Assurance Holdings | 8,300 | 397 | |||
Allstate | 110,120 | 3,129 | |||
AMB Property‡ | 1,000 | 24 | |||
American Equity Investment Life Holding | 7,700 | 56 | |||
American Express | 167,177 | 6,993 | |||
American Financial Group | 11,500 | 279 | |||
American International Group* (A) | 3,000 | 85 | |||
AmeriCredit* (A) | 6,800 | 125 | |||
Ameriprise Financial | 53,200 | 2,028 | |||
Annaly Capital Management‡ | 55,400 | 1,020 | |||
Anworth Mortgage Asset‡ | 3,200 | 23 | |||
Arch Capital Group* | 300 | 21 | |||
Argo Group International Holdings* | 3,500 | 102 | |||
Aspen Insurance Holdings | 2,400 | 62 | |||
Associated Banc (A) | 7,800 | 88 | |||
Assurant | 22,507 | 688 | |||
AvalonBay Communities‡ (A) | 203 | 15 | |||
Axis Capital Holdings | 17,100 | 479 | |||
Bancorpsouth (A) | 2,400 | 56 | |||
Bank of America | 640,758 | 10,156 | |||
Bank of Hawaii | 200 | 9 | |||
Bank of New York Mellon | 149,286 | 3,977 | |||
BB&T (A) | 19,401 | 483 | |||
Description | Shares | Market Value ($ Thousands) | |||
BlackRock, Cl A | 2,500 | $ | 568 | ||
BOK Financial (A) | 12,300 | 572 | |||
Boston Properties‡ | 400 | 27 | |||
Brandywine Realty Trust‡ | 24,900 | 245 | |||
Brookfield Asset Management, Cl A | 32,100 | 681 | |||
Brown & Brown | 1,200 | 21 | |||
Camden Property Trust‡ | 500 | 19 | |||
Capital One Financial | 86,400 | 3,314 | |||
Cardinal Financial | 3,500 | 30 | |||
CB Richard Ellis Group, Cl A* (A) | 8,800 | 101 | |||
CBL & Associates Properties‡ (A) | 17,300 | 160 | |||
Charles Schwab (A) | 43,985 | 806 | |||
Chimera Investment‡ | 86,200 | 348 | |||
Chubb | 41,160 | 2,064 | |||
Cincinnati Financial | 15,400 | 393 | |||
Citigroup | 609,330 | 2,505 | |||
City National | 700 | 28 | |||
CME Group, Cl A | 15,295 | 5,020 | |||
Comerica | 14,300 | 407 | |||
Commerce Bancshares | 872 | 35 | |||
Credicorp | 2,700 | 193 | |||
Cullen/Frost Bankers | 2,200 | 106 | |||
Dime Community Bancshares (A) | 2,600 | 29 | |||
Discover Financial Services | 19,700 | 305 | |||
Duke Realty‡ (A) | 900 | 10 | |||
Eagle Bancorp* | 900 | 9 | |||
Eaton Vance (A) | 5,500 | 166 | |||
Endurance Specialty Holdings (A) | 24,200 | 905 | |||
Equity Residential‡ | 700 | 23 | |||
Erie Indemnity, Cl A | 400 | 15 | |||
Everest Re Group | 14,900 | 1,268 | |||
Federal Realty Investment Trust‡ | 300 | 19 | |||
Federated Investors, Cl B (A) | 10,700 | 276 | |||
Fidelity National Financial, Cl A | 2,100 | 29 | |||
Fifth Third Bancorp | 14,300 | 144 | |||
First American (A) | 1,400 | 44 | |||
First Community Bancshares (A) | 2,700 | 30 | |||
First Financial Holdings | 3,500 | 47 | |||
First Horizon National* (A) | 5,893 | 80 | |||
Flagstone Reinsurance Holdings | 2,100 | 23 | |||
FNB (Pennsylvania) | 17,500 | 114 | |||
Forest City Enterprises, Cl A (A) | 5,100 | 55 | |||
Franklin Resources | 11,871 | 1,282 | |||
Genworth Financial, Cl A* (A) | 6,300 | 68 | |||
Goldman Sachs Group | 48,789 | 8,278 | |||
Greenhill | 900 | 73 | |||
Hartford Financial Services Group | 20,223 | 495 | |||
HCC Insurance Holdings | 6,500 | 170 | |||
HCP‡ (A) | 11,400 | 357 | |||
Health Care REIT‡ (A) | 500 | 22 | |||
Hospitality Properties Trust‡ | 18,300 | 355 | |||
Host Hotels & Resorts‡ (A) | 10,200 | 107 | |||
HRPT Properties Trust‡ | 124,000 | 761 | |||
Hudson City Bancorp | 55,500 | 738 | |||
Huntington Bancshares | 109,700 | 419 | |||
IntercontinentalExchange* (A) | 32,700 | 3,492 | |||
International Bancshares | 3,600 | 60 | |||
Invesco | 15,600 | 347 | |||
Jefferies Group (A) | 5,600 | 131 | |||
Jones Lang LaSalle | 2,400 | 122 | |||
JPMorgan Chase | 348,930 | 14,826 | |||
Keycorp | 33,800 | 198 | |||
| 3 | SEI Institutional Investments Trust / Semi-Annual Report / November 30, 2009 |
Table of Contents
SCHEDULE OF INVESTMENTS (Unaudited)
Large Cap Fund
November 30, 2009
Description | Shares | Market Value ($ Thousands) | |||
Lazard, Cl A | 3,100 | $ | 120 | ||
Legg Mason | 1,400 | 40 | |||
Liberty Property Trust‡ | 1,800 | 53 | |||
Lincoln National | 16,500 | 378 | |||
Loews | 8,447 | 299 | |||
M&T Bank (A) | 900 | 59 | |||
Macerich‡ (A) | 407 | 12 | |||
Mack-Cali Realty‡ | 400 | 12 | |||
Marshall & Ilsley | 23,500 | 135 | |||
MBIA* (A) | 2,700 | 9 | |||
MetLife | 40,590 | 1,388 | |||
MFA Mortgage Investments‡ | 33,200 | 251 | |||
Montpelier Re Holdings (A) | 15,700 | 263 | |||
Moody’s (A) | 37,800 | 878 | |||
Morgan Stanley | 78,817 | 2,489 | |||
MSCI, Cl A* | 600 | 18 | |||
NASDAQ OMX Group* | 2,500 | 47 | |||
Nationwide Health Properties‡ | 300 | 10 | |||
Nelnet, Cl A | 3,100 | 54 | |||
New York Community Bancorp (A) | 14,700 | 172 | |||
Northern Trust | 15,105 | 748 | |||
NYSE Euronext | 93,600 | 2,366 | |||
OceanFirst Financial | 1,800 | 18 | |||
Old Republic International | 4,500 | 48 | |||
OneBeacon Insurance Group, Cl A | 5,400 | 76 | |||
optionsXpress Holdings | 1,500 | 23 | |||
Parkway Properties‡ | 2,200 | 41 | |||
PartnerRe | 6,300 | 485 | |||
People’s United Financial | 29,960 | 488 | |||
Phoenix | 10,700 | 27 | |||
Platinum Underwriters Holdings | 15,700 | 554 | |||
PNC Financial Services Group | 46,229 | 2,635 | |||
Principal Financial Group | 12,200 | 310 | |||
Progressive | 17,600 | 295 | |||
Protective Life | 5,700 | 94 | |||
Provident Financial Services | 10,400 | 110 | |||
Prudential Financial | 57,300 | 2,856 | |||
Public Storage‡ | 2,100 | 167 | |||
Ramco-Gershenson Properties‡ | 3,300 | 30 | |||
Raymond James Financial (A) | 2,100 | 51 | |||
Rayonier‡ | 1,000 | 40 | |||
Regions Financial | 45,755 | 268 | |||
RenaissanceRe Holdings | 4,300 | 229 | |||
Senior Housing Properties Trust‡ | 4,200 | 87 | |||
Simon Property Group‡ | 9,321 | 677 | |||
SL Green Realty‡ (A) | 1,500 | 67 | |||
SLM* | 8,300 | 91 | |||
St. Joe* (A) | 1,500 | 37 | |||
State Street | 55,200 | 2,280 | |||
SunTrust Banks (A) | 14,900 | 352 | |||
T. Rowe Price Group | 26,132 | 1,279 | |||
Taubman Centers‡ (A) | 18,300 | 629 | |||
TCF Financial (A) | 8,100 | 106 | |||
TD Ameritrade Holding* | 1,600 | 31 | |||
Torchmark (A) | 21,345 | 928 | |||
Transatlantic Holdings | 500 | 27 | |||
Travelers | 73,718 | 3,862 | |||
Trustco Bank (A) | 13,400 | 82 | |||
Unum Group | 84,400 | 1,607 | |||
US Bancorp | 60,755 | 1,466 | |||
Validus Holdings | 1,600 | 42 | |||
Ventas‡ | 600 | 26 | |||
Waddell & Reed Financial, Cl A | 4,400 | 128 | |||
Description | Shares | Market Value ($ Thousands) | |||
Webster Financial (A) | 12,600 | $ | 160 | ||
Wells Fargo (A) | 418,569 | 11,737 | |||
WR Berkley (A) | 8,500 | 210 | |||
XL Capital, Cl A | 42,200 | 773 | |||
Zions Bancorporation (A) | 11,400 | 150 | |||
| 135,861 | |||||
Health Care — 11.3% | |||||
Abbott Laboratories | 78,183 | 4,260 | |||
Aetna (A) | 116,000 | 3,377 | |||
Allergan | 137,980 | 8,021 | |||
Allscripts-Misys Healthcare Solutions* (A) | 1,800 | 35 | |||
American Medical Systems Holdings* | 6,700 | 118 | |||
AmerisourceBergen | 31,700 | 783 | |||
Amgen* | 83,445 | 4,702 | |||
Amylin Pharmaceuticals* (A) | 3,100 | 44 | |||
Atrion | 100 | 14 | |||
Baxter International | 52,169 | 2,846 | |||
Beckman Coulter | 300 | 20 | |||
Becton Dickinson | 13,961 | 1,044 | |||
Biogen Idec* | 22,770 | 1,069 | |||
BioMarin Pharmaceutical* | 300 | 5 | |||
Boston Scientific* | 33,500 | 280 | |||
Bristol-Myers Squibb | 168,313 | 4,260 | |||
Bruker* | 3,500 | 40 | |||
C.R. Bard | 6,150 | 506 | |||
Cantel Medical* | 1,800 | 32 | |||
Cardinal Health | 5,000 | 161 | |||
CareFusion* | 7,700 | 199 | |||
Celgene* | 776 | 43 | |||
Cephalon* | 500 | 27 | |||
Cerner* (A) | 1,700 | 128 | |||
Charles River Laboratories International* | 1,600 | 51 | |||
CIGNA | 23,714 | 761 | |||
Community Health Systems* | 1,300 | 40 | |||
Cooper | 700 | 24 | |||
Coventry Health Care* | 17,800 | 401 | |||
DaVita* | 300 | 18 | |||
Dendreon* (A) | 5,000 | 137 | |||
Edwards Lifesciences* | 2,600 | 214 | |||
Eli Lilly | 74,804 | 2,748 | |||
Endo Pharmaceuticals Holdings* | 16,800 | 370 | |||
Enzon Pharmaceuticals* (A) | 3,300 | 32 | |||
Express Scripts* | 13,200 | 1,132 | |||
Forest Laboratories* | 40,200 | 1,232 | |||
Gen-Probe* | 300 | 13 | |||
Genzyme* | 27,350 | 1,387 | |||
Gilead Sciences* | 130,023 | 5,987 | |||
Health Management Associates, Cl A* | 5,200 | 32 | |||
Health Net* | 6,300 | 134 | |||
Hologic* | 5,800 | 84 | |||
Hospira* | 8,400 | 394 | |||
Humana* | 9,200 | 382 | |||
IMS Health | 1,700 | 36 | |||
Intuitive Surgical* (A) | 2,300 | 645 | |||
Invacare | 1,900 | 47 | |||
Inverness Medical Innovations* (A) | 2,000 | 84 | |||
Johnson & Johnson | 169,444 | 10,648 | |||
| 4 | SEI Institutional Investments Trust / Semi-Annual Report / November 30, 2009 |
Table of Contents
SCHEDULE OF INVESTMENTS (Unaudited)
Large Cap Fund
November 30, 2009
Description | Shares | Market Value ($ Thousands) | |||
Kinetic Concepts* | 14,200 | $ | 479 | ||
King Pharmaceuticals* (A) | 39,300 | 465 | |||
Laboratory Corp of America Holdings* | 2,152 | 157 | |||
Life Technologies* | 1,400 | 70 | |||
LifePoint Hospitals* | 1,600 | 46 | |||
Lincare Holdings* (A) | 8,800 | 312 | |||
McKesson | 14,200 | 881 | |||
Medco Health Solutions* | 76,546 | 4,835 | |||
Mednax* | 1,500 | 84 | |||
Medtronic | 74,871 | 3,178 | |||
Merck | 135,743 | 4,915 | |||
Meridian Bioscience | 4,500 | 93 | |||
Mettler Toledo International* (A) | 2,800 | 278 | |||
Millipore* | 300 | 20 | |||
Mylan Laboratories* (A) | 14,000 | 250 | |||
Novo Nordisk ADR (A) | 42,700 | 2,849 | |||
Par Pharmaceutical* | 2,800 | 66 | |||
Perrigo (A) | 1,400 | 56 | |||
Pfizer | 461,589 | 8,387 | |||
Quest Diagnostics | 15,200 | 881 | |||
Quidel* | 5,600 | 70 | |||
ResMed* | 1,300 | 65 | |||
Sirona Dental Systems* | 700 | 20 | |||
St. Jude Medical* | 73,710 | 2,706 | |||
Stryker | 28,500 | 1,436 | |||
Tenet Healthcare* | 4,300 | 19 | |||
Teva Pharmaceutical Industries ADR | 33,125 | 1,749 | |||
Thermo Fisher Scientific* | 25,594 | 1,209 | |||
UnitedHealth Group | 264,100 | 7,572 | |||
Universal Health Services, Cl B | 7,800 | 436 | |||
Valeant Pharmaceuticals International* (A) | 7,700 | 252 | |||
Vertex Pharmaceuticals* (A) | 200 | 8 | |||
Watson Pharmaceuticals* (A) | 28,200 | 1,046 | |||
WellPoint* | 59,000 | 3,188 | |||
Zimmer Holdings* | 8,100 | 479 | |||
| 107,604 | |||||
Industrials — 8.0% | |||||
3M | 16,598 | 1,285 | |||
ABB ADR | 8,890 | 163 | |||
Aecom Technology* | 7,200 | 183 | |||
AGCO* | 15,900 | 482 | |||
Aircastle | 3,400 | 30 | |||
Alliant Techsystems* (A) | 6,600 | 566 | |||
American Science & Engineering | 300 | 21 | |||
AO Smith | 900 | 38 | |||
Avis Budget Group* (A) | 2,400 | 23 | |||
BE Aerospace* | 3,200 | 62 | |||
Boeing (A) | 35,730 | 1,873 | |||
Brink’s | 3,100 | 70 | |||
Bucyrus International, Cl A | 400 | 21 | |||
Burlington Northern Santa Fe | 16,000 | 1,573 | |||
C.H. Robinson Worldwide (A) | 12,787 | 713 | |||
Carlisle | 100 | 3 | |||
Caterpillar (A) | 28,950 | 1,690 | |||
Cintas | 2,400 | 67 | |||
Con-way | 1,900 | 58 | |||
Cooper Industries, Cl A | 6,400 | 273 | |||
Copa Holdings, Cl A | 1,000 | 50 | |||
Corrections of America* | 1,200 | 30 | |||
Description | Shares | Market Value ($ Thousands) | |||
Crane | 6,900 | $ | 193 | ||
CSX | 6,890 | 327 | |||
Cummins | 35,545 | 1,596 | |||
Danaher | 23,620 | 1,675 | |||
Deere | 13,800 | 738 | |||
Dollar Thrifty Automotive Group* | 800 | 15 | |||
Dover | 14,800 | 605 | |||
Dun & Bradstreet | 807 | 63 | |||
DynCorp International, Cl A* | 7,400 | 103 | |||
Eaton | 900 | 58 | |||
Emerson Electric | 31,420 | 1,301 | |||
Ennis | 1,000 | 15 | |||
Equifax | 600 | 17 | |||
Expeditors International Washington (A) | 109,000 | 3,480 | |||
Fastenal (A) | 700 | 26 | |||
Federal Signal | 2,000 | 12 | |||
FedEx | 20,300 | 1,714 | |||
First Solar* (A) | 500 | 60 | |||
Flowserve | 800 | 80 | |||
Fluor (A) | 3,800 | 161 | |||
Foster Wheeler* | 17,100 | 510 | |||
Gardner Denver | 18,700 | 700 | |||
General Cable* (A) | 1,800 | 53 | |||
General Dynamics | 35,486 | 2,339 | |||
General Electric | 700,543 | 11,223 | |||
Goodrich | 25,900 | 1,537 | |||
Harsco | 26,600 | 825 | |||
Hertz Global Holdings* (A) | 7,900 | 77 | |||
Honeywell International | 43,427 | 1,671 | |||
Hubbell, Cl B | 4,300 | 195 | |||
IDEX | 200 | 6 | |||
Illinois Tool Works | 35,300 | 1,717 | |||
Iron Mountain* | 6,000 | 144 | |||
ITT | 1,360 | 70 | |||
Jacobs Engineering Group* | 1,100 | 39 | |||
JB Hunt Transport Services | 300 | 9 | |||
Joy Global | 25,550 | 1,368 | |||
KBR | 43,900 | 818 | |||
Kirby* | 1,400 | 47 | |||
L-3 Communications Holdings, Cl 3 | 19,500 | 1,528 | |||
Lennox International | 800 | 30 | |||
Lockheed Martin | 11,185 | 864 | |||
Manpower | 5,400 | 266 | |||
Masco | 1,200 | 16 | |||
McDermott International* | 18,200 | 381 | |||
Monster Worldwide* | 6,700 | 98 | |||
Multi-Color | 1,900 | 21 | |||
Navistar International* | 600 | 20 | |||
Norfolk Southern | 9,800 | 504 | |||
Northrop Grumman | 56,059 | 3,072 | |||
Oshkosh Truck | 7,200 | 286 | |||
Owens Corning* | 2,600 | 61 | |||
Paccar | 1,000 | 37 | |||
Parker Hannifin | 25,865 | 1,396 | |||
Pitney Bowes | 700 | 16 | |||
Precision Castparts | 1,325 | 137 | |||
Quanta Services* | 61,900 | 1,161 | |||
Raytheon | 62,900 | 3,241 | |||
Robert Half International | 700 | 16 | |||
Rockwell Automation | 4,700 | 204 | |||
Rockwell Collins | 3,600 | 192 | |||
| 5 | SEI Institutional Investments Trust / Semi-Annual Report / November 30, 2009 |
Table of Contents
SCHEDULE OF INVESTMENTS (Unaudited)
Large Cap Fund
November 30, 2009
Description | Shares | Market Value ($ Thousands) | |||
Roper Industries | 200 | $ | 11 | ||
RR Donnelley & Sons | 53,800 | 1,107 | |||
Ryder System | 1,100 | 45 | |||
Schawk, Cl A | 1,100 | 12 | |||
Shaw Group* | 1,100 | 31 | |||
Spirit Aerosystems Holdings, Cl A* | 4,600 | 84 | |||
SPX | 400 | 21 | |||
Terex* (A) | 2,400 | 45 | |||
Textron (A) | 2,400 | 48 | |||
Thomas & Betts* | 2,200 | 80 | |||
Toro | 5,400 | 215 | |||
TransDigm Group | 1,300 | 56 | |||
Tyco International | 27,400 | 983 | |||
Union Pacific | 41,192 | 2,606 | |||
United Parcel Service, Cl B | 91,455 | 5,256 | |||
United Technologies | 87,944 | 5,913 | |||
URS* | 6,200 | 258 | |||
UTi Worldwide | 600 | 8 | |||
Waste Management (A) | 13,300 | 437 | |||
Watson Wyatt Worldwide, Cl A | 3,100 | 128 | |||
Werner Enterprises | 4,800 | 89 | |||
WESCO International* | 800 | 21 | |||
WW Grainger (A) | 5,700 | 557 | |||
| 76,419 | |||||
Information Technology — 19.7% | |||||
Accenture, Cl A | 33,050 | 1,356 | |||
Acme Packet* | 8,800 | 90 | |||
Adobe Systems* (A) | 158,505 | 5,560 | |||
Advanced Micro Devices* | 8,500 | 60 | |||
Affiliated Computer Services, Cl A* | 3,100 | 171 | |||
Akamai Technologies* | 1,000 | 24 | |||
Alliance Data Systems* (A) | 1,100 | 67 | |||
Altera | 4,700 | 99 | |||
Amdocs* | 44,500 | 1,176 | |||
Amphenol, Cl A | 700 | 29 | |||
Analog Devices | 44,380 | 1,331 | |||
Apple* | 82,802 | 16,553 | |||
Applied Materials | 1,700 | 21 | |||
Arris Group* | 3,700 | 37 | |||
Arrow Electronics* | 3,600 | 94 | |||
Autodesk* | 52,800 | 1,238 | |||
Automatic Data Processing | 7,246 | 315 | |||
Avnet* | 17,900 | 488 | |||
BMC Software* | 15,800 | 612 | |||
Brightpoint* | 5,100 | 37 | |||
Broadcom, Cl A* (A) | 71,610 | 2,091 | |||
Broadridge Financial Solutions | 10,900 | 240 | |||
Brocade Communications Systems* | 3,100 | 22 | |||
CA | 107,700 | 2,380 | |||
Cadence Design Systems* | 11,800 | 71 | |||
Ciena* (A) | 2,100 | 26 | |||
Cirrus Logic* | 3,800 | 21 | |||
Cisco Systems* | 469,730 | 10,992 | |||
Citrix Systems* | 38,860 | 1,484 | |||
Cognizant Technology Solutions, Cl A* | 4,900 | 215 | |||
CommScope* | 800 | 20 | |||
Computer Sciences* | 22,200 | 1,228 | |||
Compuware* | 8,600 | 60 | |||
Description | Shares | Market Value ($ Thousands) | |||
Corning | 35,100 | $ | 585 | ||
Cree* (A) | 1,400 | 67 | |||
Cypress Semiconductor* (A) | 6,200 | 59 | |||
DealerTrack Holdings* | 5,400 | 92 | |||
Dell* | 51,900 | 733 | |||
Dolby Laboratories, Cl A* | 1,700 | 76 | |||
DST Systems* | 5,500 | 234 | |||
eBay* | 233,400 | 5,711 | |||
EchoStar, Cl A* | 900 | 17 | |||
Electronic Arts* | 51,050 | 862 | |||
EMC* | 374,625 | 6,305 | |||
Equinix* (A) | 800 | 77 | |||
F5 Networks* | 2,200 | 103 | |||
Factset Research Systems (A) | 1,400 | 101 | |||
Fairchild Semiconductor International, Cl A* | 8,600 | 70 | |||
Fidelity National Information Services | 14,051 | 318 | |||
Fiserv* | 11,400 | 527 | |||
Flextronics International* | 110,600 | 782 | |||
Google, Cl A* | 25,277 | 14,737 | |||
Harris | 26,300 | 1,155 | |||
Harris Stratex Networks, Cl A* | 2,335 | 15 | |||
Hewitt Associates, Cl A* | 6,000 | 241 | |||
Hewlett-Packard | 181,785 | 8,918 | |||
IAC* | 13,700 | 266 | |||
infoGROUP | 2,200 | 18 | |||
Ingram Micro, Cl A* | 47,300 | 804 | |||
Intel | 367,511 | 7,056 | |||
Interactive Intelligence* | 1,400 | 24 | |||
International Business Machines | 75,731 | 9,569 | |||
Intersil, Cl A | 5,900 | 76 | |||
Intuit* (A) | 124,200 | 3,628 | |||
j2 Global Communications* | 3,900 | 78 | |||
Jabil Circuit | 3,700 | 49 | |||
JDS Uniphase* | 10,300 | 76 | |||
Juniper Networks* | 6,200 | 162 | |||
Kla-Tencor (A) | 4,500 | 141 | |||
Lam Research* (A) | 2,000 | 68 | |||
Lender Processing Services | 900 | 38 | |||
Linear Technology (A) | 5,700 | 154 | |||
Loral Space & Communications* | 600 | 20 | |||
LSI* | 12,500 | 66 | |||
Marvell Technology Group* | 40,400 | 623 | |||
Mastercard, Cl A (A) | 16,200 | 3,902 | |||
Maxim Integrated Products | 1,700 | 30 | |||
McAfee* | 7,300 | 279 | |||
MEMC Electronic Materials* | 2,200 | 26 | |||
Microchip Technology (A) | 3,000 | 79 | |||
Micron Technology* (A) | 102,300 | 769 | |||
Micros Systems* | 5,900 | 166 | |||
Microsoft | 503,729 | 14,815 | |||
Molex (A) | 2,400 | 45 | |||
Motorola | 15,500 | 124 | |||
National Semiconductor (A) | 800 | 12 | |||
NCR* | 28,000 | 264 | |||
NetApp* | 6,600 | 203 | |||
NeuStar, Cl A* | 8,500 | 199 | |||
Nokia ADR (A) | 127,100 | 1,685 | |||
Nortel Networks* | 5 | — | |||
Novatel Wireless* | 10,900 | 91 | |||
Novellus Systems* | 6,700 | 139 | |||
Nuance Communications* | 1,900 | 29 | |||
| 6 | SEI Institutional Investments Trust / Semi-Annual Report / November 30, 2009 |
Table of Contents
SCHEDULE OF INVESTMENTS (Unaudited)
Large Cap Fund
November 30, 2009
Description | Shares | Market Value ($ Thousands) | |||
NVE* | 200 | $ | 7 | ||
Nvidia* | 26,100 | 341 | |||
ON Semiconductor* (A) | 1,900 | 15 | |||
Oracle | 185,361 | 4,093 | |||
Paychex (A) | 58,100 | 1,821 | |||
Pegasystems | 1,800 | 52 | |||
Qualcomm | 184,935 | 8,322 | |||
Rackspace Hosting* (A) | 77,800 | 1,440 | |||
Rambus* (A) | 2,200 | 39 | |||
Red Hat* | 38,400 | 1,025 | |||
Rovi* (A) | 4,708 | 140 | |||
SAIC* | 31,900 | 568 | |||
Salesforce.com* | 1,100 | 69 | |||
SanDisk* | 1,400 | 28 | |||
Seagate Technology | 83,100 | 1,257 | |||
Semtech* | 6,000 | 96 | |||
Silicon Laboratories* | 2,600 | 110 | |||
Sun Microsystems* | 6,800 | 58 | |||
Sybase* (A) | 4,000 | 161 | |||
Symantec* | 202,840 | 3,600 | |||
Symyx Technologies* | 1,500 | 6 | |||
Synopsys* (A) | 21,400 | 481 | |||
Tech Data* | 17,600 | 741 | |||
Tellabs* | 13,500 | 76 | |||
Teradata* | 105,100 | 3,079 | |||
Teradyne* (A) | 9,300 | 82 | |||
Texas Instruments | 143,132 | 3,620 | |||
Total System Services | 11,600 | 200 | |||
Trimble Navigation* | 600 | 13 | |||
Tyco Electronics | 28,700 | 666 | |||
Varian Semiconductor Equipment Associates* | 700 | 20 | |||
VeriSign* (A) | 127,900 | 2,870 | |||
Visa, Cl A (A) | 93,690 | 7,589 | |||
Vishay Intertechnology* (A) | 47,400 | 344 | |||
VMware, Cl A* | 1,600 | 67 | |||
WebMD Health, Cl A* (A) | 1,510 | 55 | |||
Western Digital* | 32,400 | 1,194 | |||
Western Union | 69,842 | 1,289 | |||
Xerox (A) | 81,900 | 631 | |||
Xilinx | 5,900 | 133 | |||
Yahoo!* | 356,740 | 5,340 | |||
Zebra Technologies, Cl A* | 18,400 | 489 | |||
| 187,993 | |||||
Materials — 3.3% | |||||
AEP Industries* | 1,600 | 60 | |||
Air Products & Chemicals | 2,800 | 232 | |||
Albemarle | 4,700 | 159 | |||
Alcoa | 12,500 | 156 | |||
Allegheny Technologies | 2,000 | 68 | |||
Ashland | 15,900 | 571 | |||
Ball | 17,800 | 880 | |||
Bemis | 9,800 | 287 | |||
Celanese, Cl A | 7,000 | 208 | |||
Cliffs Natural Resources (A) | 700 | 31 | |||
Commercial Metals (A) | 2,700 | 43 | |||
Crown Holdings* | 9,100 | 229 | |||
E.I. Du Pont de Nemours | 27,700 | 958 | |||
Eagle Materials (A) | 1,800 | 49 | |||
Eastman Chemical | 26,200 | 1,575 | |||
Ecolab | 9,200 | 413 | |||
FMC | 1,000 | 56 | |||
Description | Shares | Market Value ($ Thousands) | |||
Freeport-McMoRan Copper & Gold, Cl B | 40,725 | $ | 3,372 | ||
Greif, Cl A | 1,900 | 106 | |||
Huntsman | 11,400 | 109 | |||
International Flavors & Fragrances | 600 | 24 | |||
International Paper | 41,800 | 1,064 | |||
Intrepid Potash* | 200 | 6 | |||
Lubrizol | 22,200 | 1,610 | |||
MeadWestvaco | 4,300 | 118 | |||
Monsanto | 14,517 | 1,172 | |||
Mosaic | 300 | 16 | |||
Nalco Holding (A) | 50,200 | 1,228 | |||
NewMarket | 2,400 | 251 | |||
Newmont Mining | 2,100 | 113 | |||
Nucor | 43,000 | 1,824 | |||
Omnova Solutions* | 6,900 | 46 | |||
Owens-Illinois* | 16,000 | 500 | |||
Packaging of America | 1,200 | 24 | |||
Pactiv* | 11,500 | 280 | |||
Potash Corp of Saskatchewan | 14,810 | 1,665 | |||
PPG Industries | 1,500 | 89 | |||
Praxair | 57,221 | 4,694 | |||
Reliance Steel & Aluminum (A) | 2,400 | 98 | |||
Rock-Tenn, Cl A | 12,550 | 567 | |||
RPM International | 2,800 | 55 | |||
Schnitzer Steel Industries, Cl A | 1,000 | 45 | |||
Scotts Miracle-Gro, Cl A | 6,200 | 248 | |||
Sealed Air | 38,200 | 852 | |||
Sigma-Aldrich (A) | 500 | 27 | |||
Solutia* | 13,400 | 144 | |||
Sonoco Products | 26,100 | 736 | |||
Southern Copper (A) | 43,700 | 1,522 | |||
Spartech | 5,400 | 59 | |||
Steel Dynamics | 800 | 13 | |||
Stepan | 1,200 | 75 | |||
Syngenta ADR (A) | 51,000 | 2,729 | |||
Temple-Inland | 4,900 | 88 | |||
Valspar (A) | 3,200 | 84 | |||
Weyerhaeuser | 700 | 27 | |||
| 31,655 | |||||
Telecommunication Services — 3.2% | |||||
American Tower, Cl A* | 27,054 | 1,107 | |||
AT&T | 502,834 | 13,546 | |||
CenturyTel | 29,591 | 1,053 | |||
Crown Castle International* | 135,573 | 4,974 | |||
MetroPCS Communications* | 7,100 | 45 | |||
NII Holdings* | 30,700 | 915 | |||
Qwest Communications International (A) | 27,300 | 100 | |||
SBA Communications, Cl A* | 2,600 | 83 | |||
Sprint Nextel* | 193,600 | 718 | |||
Telephone & Data Systems | 7,700 | 235 | |||
tw telecom , Cl A* | 1,600 | 23 | |||
Verizon Communications | 235,362 | 7,405 | |||
Windstream | 900 | 9 | |||
| 30,213 | |||||
Utilities — 3.6% | |||||
AES* | 482,187 | 6,143 | |||
AGL Resources | 12,000 | 414 | |||
Allegheny Energy | 200 | 4 | |||
Alliant Energy | 17,200 | 473 | |||
| 7 | SEI Institutional Investments Trust / Semi-Annual Report / November 30, 2009 |
Table of Contents
SCHEDULE OF INVESTMENTS (Unaudited)
Large Cap Fund
November 30, 2009
Description | Shares | Market Value ($ Thousands) | |||
Ameren | 18,200 | $ | 473 | ||
American Electric Power | 51,037 | 1,643 | |||
Aqua America (A) | 8,100 | 132 | |||
Atmos Energy | 16,400 | 449 | |||
Calpine* | 11,100 | 124 | |||
Centerpoint Energy | 400 | 5 | |||
CMS Energy (A) | 42,200 | 601 | |||
Consolidated Edison (A) | 5,900 | 253 | |||
Constellation Energy Group | 20,400 | 649 | |||
Dominion Resources | 41,904 | 1,524 | |||
DPL | 6,600 | 177 | |||
DTE Energy (A) | 37,100 | 1,488 | |||
Duke Energy | 11,600 | 194 | |||
Edison International | 65,000 | 2,213 | |||
Energen | 22,200 | 966 | |||
Entergy | 2,200 | 173 | |||
Equities | 10,100 | 416 | |||
Exelon | 50,454 | 2,431 | |||
FirstEnergy | 23,903 | 1,030 | |||
FPL Group | 23,900 | 1,242 | |||
ITC Holdings | 800 | 36 | |||
Mirant* (A) | 97,300 | 1,386 | |||
National Fuel Gas | 12,000 | 562 | |||
NiSource | 46,500 | 663 | |||
Northeast Utilities | 5,400 | 130 | |||
NRG Energy* (A) | 8,200 | 196 | |||
NSTAR | 4,600 | 152 | |||
NV Energy | 57,200 | 666 | |||
OGE Energy | 1,900 | 66 | |||
Oneok | 100 | 4 | |||
Pepco Holdings | 13,800 | 225 | |||
PG&E | 22,919 | 970 | |||
Pinnacle West Capital | 23,000 | 807 | |||
PPL | 4,865 | 148 | |||
Progress Energy | 2,800 | 109 | |||
Public Service Enterprise Group | 58,340 | 1,830 | |||
Questar | 2,200 | 87 | |||
SCANA | 2,400 | 85 | |||
Sempra Energy | 49,567 | 2,634 | |||
Southern | 1,739 | 56 | |||
TECO Energy (A) | 2,300 | 34 | |||
UGI | 14,000 | 329 | |||
Westar Energy | 1,200 | 25 | |||
Wisconsin Energy | 3,100 | 140 | |||
Xcel Energy | 13,845 | 281 | |||
| 34,838 | |||||
Total Common Stock | 871,155 | ||||
AFFILIATED PARTNERSHIP — 10.2% | |||||
SEI Liquidity Fund, L.P. 0.320% (B)** † | 98,067,520 | 97,301 | |||
Total Affiliated Partnership | 97,301 | ||||
Description | Shares/Face Amount ($ Thousands) | Market Value ($ Thousands) | |||
CASH EQUIVALENT — 2.4% | |||||
SEI Daily Income Trust, Prime Obligation Fund, Cl A, 0.130%**† | 22,595,219 | $ | 22,595 | ||
Total Cash Equivalent | 22,595 | ||||
U.S. TREASURY OBLIGATION (C) (D) — 0.5% | |||||
U.S. Treasury Bill | |||||
0.130%, 12/03/09 | $5,200 | 5,200 | |||
Total U.S. Treasury Obligation | 5,200 | ||||
Total Investments — 104.3% | $ | 996,251 | |||
A summary of the open futures contracts held by the Fund at November 30, 2009, is as follows:
Type of Contract | Number of Contracts Long (Short) | Expiration Date | Unrealized Appreciation ($ Thousands) | ||||
S&P 500 Composite Index | 263 | Dec-2009 | $ | 1,122 | |||
S&P Mid 400 E-Mini | 139 | Dec-2009 | 70 | ||||
| $ | 1,192 | ||||||
For the year ended November 30, 2009, the total amount of all open futures contracts, as presented in the table above, are representative of the volume of activity for this derivative type during the period.
Percentages are based on a Net Assets of $954,913 ($ Thousands).
| (A) | This security or a partial position of this security is on loan at November 30, 2009. The total value of securities on loan at November 30, 2009 was $96,118 ($ Thousands). |
| (B) | This security was purchased with cash collateral held from securities on loan (see Note 11). The total value of such securities as of November 30, 2009 was $97,301 ($ Thousands). |
| (C) | Security, or a portion thereof, has been pledged as collateral on open futures contracts. |
| (D) | The rate reported is the effective yield at time of purchase |
| * | Non-income producing security. |
| ** | The rate reported is the 7-day effective yield as of November 30, 2009. |
| † | Investment in Affiliated Security (see Note 5). |
| ‡ | Real Estate Investment Trust |
ADR — American Depositary Receipt
Cl — Class
L.P. — Limited Partnership
REIT — Real Estate Investment Trust
Ser — Series
S&P — Standard & Poor’s
| 8 | SEI Institutional Investments Trust / Semi-Annual Report / November 30, 2009 |
Table of Contents
SCHEDULE OF INVESTMENTS (Unaudited)
Large Cap Diversified Alpha Fund
November 30, 2009
Description | Shares | Market Value ($ Thousands) | |||
COMMON STOCK — 80.9% | |||||
Consumer Discretionary — 8.5% | |||||
99 Cents Only Stores* | 5,000 | $ | 60 | ||
Abercrombie & Fitch, Cl A | 900 | 36 | |||
Advance Auto Parts | 3,900 | 153 | |||
Aeropostale* | 400 | 13 | |||
Amazon.com* | 10,750 | 1,461 | |||
American Axle & Manufacturing Holdings | 7,800 | 49 | |||
American Eagle Outfitters | 4,100 | 63 | |||
American Greetings, Cl A | 5,000 | 104 | |||
Apollo Group, Cl A* | 2,000 | 114 | |||
Asbury Automotive Group* | 5,000 | 53 | |||
Autoliv | 11,073 | 450 | |||
AutoNation* | 600 | 11 | |||
AutoZone* | 900 | 133 | |||
Bed Bath & Beyond* | 1,500 | 56 | |||
Best Buy | 8,800 | 377 | |||
Black & Decker | 321 | 20 | |||
Bob Evans Farms | 1,400 | 35 | |||
BorgWarner | 2,500 | 75 | |||
Brinker International | 8,022 | 111 | |||
Brink’s Home Security Holdings* | 1,500 | 49 | |||
Cablevision Systems, Cl A | 2,900 | 72 | |||
Career Education* | 2,500 | 65 | |||
Carmax* | 5,200 | 103 | |||
Carmike Cinemas* | 600 | 4 | |||
Carnival | 1,000 | 32 | |||
CBS, Cl B | 1,300 | 16 | |||
Chico’s FAS* | 21,100 | 297 | |||
Chipotle Mexican Grill, Cl A* | 3,200 | 267 | |||
Coach | 32,900 | 1,143 | |||
Comcast, Cl A | 177,307 | 2,601 | |||
Cooper Tire & Rubber | 2,400 | 43 | |||
Core-Mark Holding* | 400 | 12 | |||
Darden Restaurants | 3,900 | 123 | |||
Dick’s Sporting Goods* | 2,700 | 56 | |||
DIRECTV, Cl A* | 40,273 | 1,274 | |||
Discovery Communications, Cl C* | 2,700 | 76 | |||
DISH Network, Cl A | 27,307 | 565 | |||
Dollar Tree* | 3,100 | 152 | |||
DR Horton | 1,400 | 14 | |||
Eastman Kodak | 79,700 | 323 | |||
Expedia* | 4,300 | 110 | |||
Family Dollar Stores | 7,400 | 226 | |||
Ford Motor* | 137,078 | 1,219 | |||
Fossil* | 9,400 | 290 | |||
Gannett | 900 | 9 | |||
Gap | 36,500 | 782 | |||
Garmin | 15,900 | 475 | |||
Gentex | 600 | 10 | |||
Genuine Parts | 600 | 22 | |||
Goodyear Tire & Rubber* | 4,800 | 66 | |||
H&R Block | 700 | 14 | |||
Hanesbrands* | 4,000 | 96 | |||
Harley-Davidson | 200 | 6 | |||
Harman International Industries | 700 | 26 | |||
Hasbro | 4,400 | 130 | |||
Helen of Troy* | 3,200 | 66 | |||
Home Depot | 17,600 | 482 | |||
International Game Technology | 7,000 | 132 | |||
Description | Shares | Market Value ($ Thousands) | |||
Interpublic Group* | 2,000 | $ | 13 | ||
J.C. Penney | 15,000 | 431 | |||
Jarden | 800 | 22 | |||
Johnson Controls | 1,000 | 27 | |||
KB Home | 2,700 | 37 | |||
Kenneth Cole Productions, Cl A | 1,700 | 16 | |||
Kohl’s* | 2,400 | 128 | |||
Lamar Advertising, Cl A* | 500 | 14 | |||
Las Vegas Sands* | 1,200 | 18 | |||
Leggett & Platt | 7,800 | 152 | |||
Lennar, Cl A | 3,400 | 43 | |||
Liberty Media - Capital, Ser A* | 1,900 | 42 | |||
Liberty Media - Interactive, Cl A* | 2,400 | 25 | |||
Liberty Media - Starz* | 410 | 19 | |||
Limited Brands | 15,900 | 264 | |||
Lithia Motors, Cl A | 1,600 | 12 | |||
Lowe’s | 28,800 | 628 | |||
Macy’s | 1,900 | 31 | |||
Marriott International, Cl A | 3,516 | 90 | |||
Marvel Entertainment* | 263 | 14 | |||
McDonald’s | 10,400 | 658 | |||
McGraw-Hill | 6,400 | 192 | |||
MDC Holdings | 700 | 21 | |||
MGM Mirage* | 5,900 | 62 | |||
NetFlix* | 4,400 | 258 | |||
Newell Rubbermaid | 500 | 7 | |||
News, Cl A | 8,700 | 100 | |||
NIKE, Cl B | 18,600 | 1,207 | |||
Nordstrom | 1,000 | 33 | |||
Office Depot* | 6,800 | 42 | |||
Omnicom Group | 1,500 | 55 | |||
O’Reilly Automotive* | 3,500 | 136 | |||
Oxford Industries | 2,000 | 43 | |||
Penn National Gaming* | 2,200 | 59 | |||
PetSmart | 1,900 | 49 | |||
Phillips-Van Heusen | 300 | 12 | |||
Polo Ralph Lauren, Cl A | 200 | 15 | |||
priceline.com* | 3,700 | 792 | |||
Pulte Homes | 1,645 | 15 | |||
RadioShack | 700 | 13 | |||
Regal Entertainment Group, Cl A | 1,900 | 26 | |||
Rent-A-Center, Cl A* | 500 | 9 | |||
Ross Stores | 19,200 | 844 | |||
Royal Caribbean Cruises* | 1,300 | 32 | |||
Sally Beauty Holdings* | 9,200 | 64 | |||
Scientific Games, Cl A* | 700 | 10 | |||
Scripps Networks Interactive, Cl A | 700 | 28 | |||
Sears Holdings* | 10,400 | 738 | |||
Service International | 1,500 | 12 | |||
Shaw Communications, Cl B | 13,000 | 251 | |||
Sherwin-Williams | 200 | 12 | |||
Signet Jewelers* | 600 | 15 | |||
Smith & Wesson Holding* | 13,400 | 66 | |||
Sonic Automotive, Cl A | 10,900 | 96 | |||
Stanley Works | 400 | 19 | |||
Staples | 40,200 | 937 | |||
Starbucks* | 6,800 | 149 | |||
Starwood Hotels & Resorts Worldwide | 1,400 | 45 | |||
Steven Madden* | 800 | 29 | |||
Strayer Education | 900 | 178 | |||
Target | 18,200 | 847 | |||
Tempur-Pedic International* | 5,700 | 123 | |||
Thor Industries | 1,900 | 54 | |||
| 1 | SEI Institutional Investments Trust / Semi-Annual Report / November 30, 2009 |
Table of Contents
SCHEDULE OF INVESTMENTS (Unaudited)
Large Cap Diversified Alpha Fund
November 30, 2009
Description | Shares | Market Value ($ Thousands) | |||
Time Warner | 44,066 | $ | 1,354 | ||
Time Warner Cable, Cl A | 8,233 | 345 | |||
TJX | 27,100 | 1,040 | |||
Toll Brothers* | 400 | 8 | |||
TRW Automotive Holdings* | 8,500 | 185 | |||
Universal Technical Institute* | 1,600 | 30 | |||
Urban Outfitters* | 1,000 | 32 | |||
VF | 900 | 65 | |||
Viacom, Cl B* | 9,700 | 287 | |||
Virgin Media | 4,300 | 71 | |||
WABCO Holdings | 600 | 14 | |||
Walt Disney | 11,190 | 338 | |||
Weight Watchers International | 9,400 | 260 | |||
Wendy’s, Cl A | 11,900 | 49 | |||
Whirlpool | 100 | 7 | |||
Williams-Sonoma | 2,300 | 47 | |||
WMS Industries* | 1,400 | 55 | |||
Wyndham Worldwide | 1,100 | 20 | |||
Wynn Resorts* | 600 | 39 | |||
Yum! Brands | 17,725 | 625 | |||
| 30,072 | |||||
Consumer Staples — 7.8% | |||||
Altria Group | 20,100 | 378 | |||
Andersons | 300 | 8 | |||
Archer-Daniels-Midland | 8,800 | 271 | |||
Avon Products | 8,600 | 295 | |||
BJ’s Wholesale Club* | 7,700 | 267 | |||
Brown-Forman, Cl B | 200 | 10 | |||
Bunge | 3,700 | 229 | |||
Campbell Soup | 500 | 18 | |||
Central European Distribution* | 700 | 20 | |||
Clorox | 3,600 | 217 | |||
Coca-Cola | 19,300 | 1,104 | |||
Coca-Cola Enterprises | 36,100 | 709 | |||
Colgate-Palmolive | 3,200 | 269 | |||
ConAgra Foods | 30,200 | 670 | |||
Costco Wholesale | 16,609 | 995 | |||
CVS Caremark | 13,979 | 434 | |||
Dean Foods* | 1,300 | 21 | |||
Del Monte Foods | 7,700 | 81 | |||
Dr Pepper Snapple Group | 5,700 | 149 | |||
Energizer Holdings* | 200 | 11 | |||
Estee Lauder, Cl A | 1,344 | 63 | |||
Flowers Foods | 400 | 9 | |||
General Mills | 3,100 | 211 | |||
Green Mountain Coffee Roasters* | 600 | 38 | |||
Hansen Natural* | 300 | 11 | |||
Herbalife | 12,400 | 520 | |||
Hershey | 4,900 | 173 | |||
HJ Heinz | 1,300 | 55 | |||
Hormel Foods | 1,900 | 71 | |||
JM Smucker | 1,000 | 59 | |||
Kellogg | 4,000 | 210 | |||
Kimberly-Clark | 17,200 | 1,135 | |||
Kraft Foods, Cl A | 14,960 | 398 | |||
Kroger | 27,100 | 616 | |||
Lorillard | 1,000 | 78 | |||
NBTY* | 1,500 | 60 | |||
Pepsi Bottling Group | 3,289 | 125 | |||
PepsiAmericas | 1,305 | 39 | |||
PepsiCo | 26,250 | 1,633 | |||
Philip Morris International | 58,895 | 2,832 | |||
Description | Shares | Market Value ($ Thousands) | |||
Prestige Brands Holdings* | 4,200 | $ | 29 | ||
Procter & Gamble | 61,700 | 3,847 | |||
Reynolds American | 11,700 | 585 | |||
Safeway | 1,125 | 25 | |||
Sanderson Farms | 2,600 | 104 | |||
Sara Lee | 131,955 | 1,602 | |||
Smithfield Foods* | 3,400 | 53 | |||
Supervalu | 900 | 12 | |||
Sysco | 90,448 | 2,446 | |||
Tyson Foods, Cl A | 86,880 | 1,044 | |||
Walgreen | 45,247 | 1,760 | |||
Wal-Mart Stores | 29,100 | 1,587 | |||
Weis Markets | 400 | 14 | |||
Whole Foods Market* | 3,300 | 85 | |||
| 27,685 | |||||
Energy — 8.3% | |||||
Alpha Natural Resources* | 1,233 | 46 | |||
Anadarko Petroleum | 3,900 | 232 | |||
Apache | 700 | 67 | |||
Arch Coal | 900 | 19 | |||
Atwood Oceanics* | 700 | 26 | |||
Baker Hughes | 200 | 8 | |||
BJ Services | 4,186 | 79 | |||
Cabot Oil & Gas | 2,300 | 88 | |||
Cameron International* | 600 | 23 | |||
Chesapeake Energy | 13,100 | 313 | |||
Chevron | 78,186 | 6,102 | |||
Concho Resources* | 900 | 37 | |||
ConocoPhillips | 43,029 | 2,228 | |||
Consol Energy | 500 | 23 | |||
Denbury Resources* | 1,200 | 16 | |||
Devon Energy | 5,900 | 397 | |||
Diamond Offshore Drilling | 200 | 20 | |||
Dresser-Rand Group* | 7,000 | 196 | |||
El Paso | 6,100 | 58 | |||
Encore Acquisition* | 1,097 | 49 | |||
ENSCO International | 300 | 13 | |||
EOG Resources | 11,800 | 1,021 | |||
Exxon Mobil | 139,348 | 10,461 | |||
FMC Technologies* | 1,800 | 98 | |||
Frontier Oil | 2,400 | 28 | |||
Halliburton | 11,300 | 332 | |||
Helix Energy Solutions Group* | 9,900 | 116 | |||
Hess | 823 | 48 | |||
Marathon Oil | 31,400 | 1,024 | |||
Massey Energy | 1,000 | 38 | |||
Murphy Oil | 10,200 | 575 | |||
Nabors Industries* | 900 | 19 | |||
National Oilwell Varco | 1,389 | 60 | |||
Newfield Exploration* | 1,100 | 46 | |||
Noble Energy | 1,500 | 98 | |||
Occidental Petroleum | 21,751 | 1,757 | |||
Oceaneering International* | 1,100 | 60 | |||
Patterson-UTI Energy | 24,500 | 377 | |||
Peabody Energy | 1,300 | 58 | |||
PetroHawk Energy* | 2,100 | 47 | |||
Pioneer Natural Resources | 600 | 25 | |||
Plains Exploration & Production* | 900 | 24 | |||
Pride International* | 400 | 13 | |||
Quicksilver Resources* | 3,400 | 45 | |||
Range Resources | 1,400 | 66 | |||
Rowan | 400 | 10 | |||
| 2 | SEI Institutional Investments Trust / Semi-Annual Report / November 30, 2009 |
Table of Contents
SCHEDULE OF INVESTMENTS (Unaudited)
Large Cap Diversified Alpha Fund
November 30, 2009
Description | Shares | Market Value ($ Thousands) | |||
SandRidge Energy* | 2,600 | $ | 24 | ||
Schlumberger | 8,900 | 569 | |||
SEACOR Holdings* | 3,900 | 299 | |||
Southern Union | 1,600 | 33 | |||
Southwestern Energy* | 1,400 | 62 | |||
Spectra Energy | 10,600 | 206 | |||
St. Mary Land & Exploration | 200 | 6 | |||
Stone Energy* | 6,500 | 123 | |||
Tesoro | 500 | 6 | |||
Tidewater | 1,300 | 58 | |||
Transocean* | 3,600 | 307 | |||
Unit* | 700 | 26 | |||
Valero Energy | 800 | 13 | |||
Walter Industries | 5,300 | 364 | |||
Western Refining* | 3,900 | 18 | |||
Whiting Petroleum* | 200 | 12 | |||
Williams | 8,400 | 167 | |||
XTO Energy | 13,350 | 567 | |||
| 29,346 | |||||
Financials — 11.7% | |||||
Affiliated Managers Group* | 900 | 59 | |||
Aflac | 45,825 | 2,109 | |||
Allied World Assurance Holdings | 3,900 | 186 | |||
Allstate | 31,000 | 881 | |||
AMB Property‡ | 600 | 14 | |||
American Equity Investment Life Holding | 3,200 | 23 | |||
American Express | 73,348 | 3,068 | |||
American Financial Group | 12,100 | 294 | |||
American International Group* | 1,700 | 48 | |||
AmeriCredit* | 3,000 | 55 | |||
Ameriprise Financial | 6,200 | 236 | |||
Annaly Capital Management‡ | 21,700 | 399 | |||
Anworth Mortgage Asset‡ | 7,700 | 55 | |||
Arch Capital Group* | 100 | 7 | |||
Argo Group International Holdings* | 3,000 | 88 | |||
Aspen Insurance Holdings | 1,400 | 36 | |||
Associated Banc | 3,500 | 40 | |||
Assurant | 1,300 | 40 | |||
AvalonBay Communities‡ | 103 | 7 | |||
Axis Capital Holdings | 10,500 | 294 | |||
Bancorpsouth | 1,300 | 30 | |||
Bank of America | 99,129 | 1,571 | |||
Bank of Hawaii | 100 | 5 | |||
Bank of New York Mellon | 40,550 | 1,080 | |||
BB&T | 3,000 | 75 | |||
BlackRock, Cl A | 1,200 | 273 | |||
Boston Properties‡ | 200 | 13 | |||
Brandywine Realty Trust‡ | 12,900 | 127 | |||
Brown & Brown | 300 | 5 | |||
Camden Property Trust‡ | 100 | 4 | |||
Capital One Financial | 27,100 | 1,040 | |||
CB Richard Ellis Group, Cl A* | 4,900 | 56 | |||
CBL & Associates Properties‡ | 15,000 | 139 | |||
Charles Schwab | 3,700 | 68 | |||
Chimera Investment‡ | 106,305 | 428 | |||
Chubb | 16,900 | 847 | |||
Cincinnati Financial | 2,600 | 66 | |||
Citigroup | 131,200 | 539 | |||
City National | 500 | 20 | |||
CME Group, Cl A | 3,440 | 1,129 | |||
Description | Shares | Market Value ($ Thousands) | |||
Comerica | 2,700 | $ | 77 | ||
Commerce Bancshares | 499 | 20 | |||
Compass Diversified Holdings | 700 | 8 | |||
Credicorp | 8,300 | 593 | |||
Cullen/Frost Bankers | 1,000 | 48 | |||
Dime Community Bancshares | 2,100 | 24 | |||
Discover Financial Services | 77,603 | 1,200 | |||
Duke Realty‡ | 500 | 6 | |||
Eaton Vance | 2,900 | 87 | |||
Endurance Specialty Holdings | 12,400 | 464 | |||
Equity Residential‡ | 100 | 3 | |||
Erie Indemnity, Cl A | 300 | 11 | |||
Everest Re Group | 4,200 | 357 | |||
Fairfax Financial Holdings | 600 | 212 | |||
Federal Realty Investment Trust‡ | 200 | 13 | |||
Federated Investors, Cl B | 4,000 | 103 | |||
Fidelity National Financial, Cl A | 1,200 | 17 | |||
Fifth Third Bancorp | 7,100 | 72 | |||
First American | 400 | 13 | |||
First Cash Financial Services* | 700 | 13 | |||
First Commonwealth Financial | 8,000 | 34 | |||
First Community Bancshares | 800 | 9 | |||
First Horizon National* | 3,203 | 43 | |||
Flagstone Reinsurance Holdings | 1,900 | 21 | |||
FNB (Pennsylvania) | 7,200 | 47 | |||
Forest City Enterprises, Cl A | 3,500 | 38 | |||
Franklin Resources | 7,600 | 821 | |||
Genworth Financial, Cl A* | 4,000 | 43 | |||
Goldman Sachs Group | 11,235 | 1,906 | |||
Greenhill | 500 | 41 | |||
Hartford Financial Services Group | 2,900 | 71 | |||
HCC Insurance Holdings | 3,300 | 86 | |||
HCP‡ | 1,700 | 53 | |||
Health Care REIT‡ | 100 | 4 | |||
Hospitality Properties Trust‡ | 1,000 | 19 | |||
Host Hotels & Resorts‡ | 6,000 | 63 | |||
HRPT Properties Trust‡ | 8,100 | 50 | |||
Hudson City Bancorp | 82,097 | 1,091 | |||
Huntington Bancshares | 19,700 | 75 | |||
IntercontinentalExchange* | 9,400 | 1,004 | |||
International Bancshares | 500 | 8 | |||
Invesco | 5,800 | 129 | |||
Invesco Mortgage Capital‡ | 500 | 11 | |||
Jefferies Group | 2,800 | 66 | |||
Jones Lang LaSalle | 1,300 | 66 | |||
JPMorgan Chase | 43,900 | 1,865 | |||
Keycorp | 11,100 | 65 | |||
Lazard, Cl A | 1,400 | 54 | |||
Legg Mason | 500 | 14 | |||
Liberty Property Trust‡ | 1,100 | 33 | |||
Lincoln National | 2,900 | 66 | |||
Loews | 5,200 | 184 | |||
M&T Bank | 400 | 26 | |||
Macerich‡ | 300 | 9 | |||
Mack-Cali Realty‡ | 100 | 3 | |||
Marshall & Ilsley | 13,800 | 79 | |||
MetLife | 3,100 | 106 | |||
MFA Mortgage Investments‡ | 18,400 | 139 | |||
Moody’s | 40,297 | 936 | |||
Morgan Stanley | 8,200 | 259 | |||
MSCI, Cl A* | 500 | 15 | |||
NASDAQ OMX Group* | 800 | 15 | |||
Nationwide Health Properties‡ | 400 | 14 | |||
| 3 | SEI Institutional Investments Trust / Semi-Annual Report / November 30, 2009 |
Table of Contents
SCHEDULE OF INVESTMENTS (Unaudited)
Large Cap Diversified Alpha Fund
November 30, 2009
Description | Shares | Market Value ($ Thousands) | |||
New York Community Bancorp | 41,500 | $ | 485 | ||
Northern Trust | 8,075 | 400 | |||
NYSE Euronext | 40,500 | 1,024 | |||
OceanFirst Financial | 900 | 9 | |||
Old Republic International | 2,300 | 25 | |||
OneBeacon Insurance Group, Cl A | 1,100 | 15 | |||
PartnerRe | 2,100 | 162 | |||
People’s United Financial | 2,100 | 34 | |||
Phoenix | 7,300 | 18 | |||
Platinum Underwriters Holdings | 12,400 | 438 | |||
PNC Financial Services Group | 6,143 | 350 | |||
Principal Financial Group | 3,600 | 91 | |||
Progressive | 5,500 | 92 | |||
Protective Life | 3,300 | 55 | |||
Provident Financial Services | 4,800 | 51 | |||
Prudential Financial | 9,200 | 459 | |||
Public Storage‡ | 1,000 | 80 | |||
Ramco-Gershenson Properties‡ | 2,000 | 18 | |||
Raymond James Financial | 900 | 22 | |||
Rayonier‡ | 600 | 24 | |||
Regions Financial | 9,150 | 54 | |||
Reinsurance Group of America, Cl A | 2,200 | 102 | |||
RenaissanceRe Holdings | 2,000 | 107 | |||
Senior Housing Properties Trust‡ | 2,200 | 46 | |||
Simon Property Group ‡ | 216 | 16 | |||
SL Green Realty‡ | 800 | 36 | |||
SLM* | 4,900 | 54 | |||
St. Joe* | 400 | 10 | |||
State Street | 17,850 | 737 | |||
SunTrust Banks | 1,200 | 28 | |||
Susquehanna Bancshares | 2,400 | 14 | |||
T. Rowe Price Group | 53,106 | 2,598 | |||
TCF Financial | 4,200 | 55 | |||
TD Ameritrade Holding* | 900 | 18 | |||
Torchmark | 3,706 | 161 | |||
Transatlantic Holdings | 300 | 16 | |||
Travelers | 19,100 | 1,001 | |||
Trustco Bank | 6,800 | 42 | |||
United America Indemnity, Cl A* | 1,100 | 8 | |||
Unum Group | 6,300 | 120 | |||
US Bancorp | 61,897 | 1,494 | |||
Validus Holdings | 600 | 16 | |||
Ventas‡ | 400 | 17 | |||
Waddell & Reed Financial, Cl A | 2,500 | 73 | |||
Webster Financial | 2,900 | 37 | |||
Wells Fargo | 81,987 | 2,299 | |||
WesBanco | 700 | 9 | |||
World Acceptance* | 1,200 | 35 | |||
WR Berkley | 1,500 | 37 | |||
XL Capital, Cl A | 4,500 | 82 | |||
Zions Bancorporation | 5,500 | 72 | |||
| 41,722 | |||||
Health Care — 10.6% | |||||
Abbott Laboratories | 10,000 | 545 | |||
Aetna | 40,000 | 1,164 | |||
Allergan | 32,700 | 1,901 | |||
Allscripts-Misys Healthcare Solutions* | 700 | 13 | |||
American Medical Systems Holdings* | 3,700 | 65 | |||
AmerisourceBergen | 69,493 | 1,716 | |||
Description | Shares | Market Value ($ Thousands) | |||
Amgen* | 53,063 | $ | 2,990 | ||
Amylin Pharmaceuticals* | 1,300 | 19 | |||
Baxter International | 3,200 | 175 | |||
Beckman Coulter | 200 | 13 | |||
Becton Dickinson | 100 | 8 | |||
Biogen Idec* | 36,116 | 1,695 | |||
Boston Scientific* | 13,900 | 116 | |||
Bristol-Myers Squibb | 35,900 | 909 | |||
Bruker* | 600 | 7 | |||
C.R. Bard | 1,200 | 99 | |||
Cardinal Health | 55,720 | 1,796 | |||
CareFusion* | 6,200 | 160 | |||
Celgene* | 400 | 22 | |||
Cephalon* | 100 | 6 | |||
Cerner* | 800 | 60 | |||
Charles River Laboratories International* | 800 | 26 | |||
CIGNA | 2,700 | 87 | |||
Community Health Systems* | 700 | 21 | |||
Cooper | 400 | 13 | |||
Coventry Health Care* | 3,200 | 72 | |||
DaVita* | 200 | 12 | |||
Dendreon* | 2,900 | 79 | |||
Edwards Lifesciences* | 1,400 | 115 | |||
Eli Lilly | 12,800 | 470 | |||
Endo Pharmaceuticals Holdings* | 2,000 | 44 | |||
Enzon Pharmaceuticals* | 2,800 | 27 | |||
Express Scripts* | 500 | 43 | |||
Forest Laboratories* | 5,700 | 175 | |||
Gen-Probe* | 200 | 8 | |||
Genzyme* | 6,425 | 326 | |||
Gilead Sciences* | 30,900 | 1,423 | |||
Health Management Associates, Cl A* | 2,600 | 16 | |||
Health Net* | 18,900 | 401 | |||
Hologic* | 2,700 | 39 | |||
Hospira* | 3,900 | 183 | |||
Humana* | 1,000 | 42 | |||
IMS Health | 1,673 | 36 | |||
Intuitive Surgical* | 1,200 | 337 | |||
Inverness Medical Innovations* | 1,000 | 42 | |||
Johnson & Johnson | 68,717 | 4,318 | |||
Kinetic Concepts* | 800 | 27 | |||
King Pharmaceuticals* | 3,200 | 38 | |||
Laboratory Corp of America Holdings* | 1,900 | 139 | |||
Life Technologies* | 800 | 40 | |||
LifePoint Hospitals* | 700 | 20 | |||
Lincare Holdings* | 12,700 | 451 | |||
McKesson | 22,547 | 1,398 | |||
Medco Health Solutions* | 25,500 | 1,611 | |||
Mednax* | 800 | 45 | |||
Medtronic | 26,925 | 1,143 | |||
Merck | 25,113 | 909 | |||
Meridian Bioscience | 2,000 | 41 | |||
Mettler Toledo International* | 1,500 | 149 | |||
Millipore* | 400 | 27 | |||
Mylan Laboratories* | 7,400 | 132 | |||
Novo Nordisk ADR | 12,000 | 801 | |||
Par Pharmaceutical* | 1,400 | 33 | |||
Perrigo | 600 | 24 | |||
Pfizer | 177,265 | 3,221 | |||
Quest Diagnostics | 7,700 | 446 | |||
| 4 | SEI Institutional Investments Trust / Semi-Annual Report / November 30, 2009 |
Table of Contents
SCHEDULE OF INVESTMENTS (Unaudited)
Large Cap Diversified Alpha Fund
November 30, 2009
Description | Shares | Market Value ($ Thousands) | |||
Quidel* | 2,600 | $ | 33 | ||
ResMed* | 600 | 30 | |||
St. Jude Medical* | 500 | 18 | |||
Stryker | 13,715 | 691 | |||
Tenet Healthcare* | 2,500 | 11 | |||
Thermo Fisher Scientific* | 7,800 | 368 | |||
UnitedHealth Group | 84,827 | 2,432 | |||
Universal Health Services, Cl B | 700 | 39 | |||
Valeant Pharmaceuticals International* | 6,100 | 199 | |||
Vertex Pharmaceuticals* | 100 | 4 | |||
Watson Pharmaceuticals* | 800 | 30 | |||
WellPoint* | 23,000 | 1,243 | |||
Zimmer Holdings* | 200 | 12 | |||
| 37,639 | |||||
Industrials — 7.1% | |||||
3M | 12,500 | 968 | |||
Aecom Technology* | 3,600 | 91 | |||
AGCO* | 500 | 15 | |||
Aircastle | 2,400 | 21 | |||
Alliant Techsystems* | 3,200 | 274 | |||
American Science & Engineering | 300 | 21 | |||
AO Smith | 500 | 21 | |||
AZZ* | 300 | 10 | |||
BE Aerospace* | 1,700 | 33 | |||
Boeing | 3,850 | 202 | |||
Brink’s | 1,300 | 29 | |||
Bucyrus International, Cl A | 300 | 16 | |||
Burlington Northern Santa Fe | 2,904 | 286 | |||
C.H. Robinson Worldwide | 7,000 | 390 | |||
Carlisle | 700 | 22 | |||
Caterpillar | 500 | 29 | |||
Cintas | 1,200 | 34 | |||
Con-way | 900 | 27 | |||
Copa Holdings, Cl A | 600 | 30 | |||
Corrections of America* | 600 | 15 | |||
Crane | 5,651 | 158 | |||
CSX | 2,700 | 128 | |||
Cummins | 100 | 4 | |||
Danaher | 100 | 7 | |||
Deere | 5,050 | 270 | |||
Donaldson | 17,551 | 746 | |||
Dover | 8,600 | 352 | |||
Dun & Bradstreet | 400 | 31 | |||
DynCorp International, Cl A* | 3,000 | 42 | |||
Eaton | 400 | 26 | |||
Emerson Electric | 800 | 33 | |||
Ennis | 1,200 | 17 | |||
Expeditors International Washington | 29,000 | 926 | |||
Fastenal | 100 | 4 | |||
FedEx | 2,300 | 194 | |||
First Solar* | 200 | 24 | |||
Flowserve | 400 | 40 | |||
Fluor | 25,512 | 1,084 | |||
Foster Wheeler* | 8,100 | 242 | |||
Gardner Denver | 7,600 | 284 | |||
General Cable* | 1,000 | 29 | |||
General Dynamics | 29,896 | 1,970 | |||
General Electric | 112,000 | 1,794 | |||
Goodrich | 8,500 | 504 | |||
Harsco | 1,900 | 59 | |||
Description | Shares | Market Value ($ Thousands) | |||
Hertz Global Holdings* | 3,500 | $ | 34 | ||
Honeywell International | 3,000 | 116 | |||
Hubbell, Cl B | 3,808 | 173 | |||
IDEX | 100 | 3 | |||
Illinois Tool Works | 19,969 | 971 | |||
Iron Mountain* | 3,200 | 77 | |||
ITT | 3,500 | 181 | |||
Jacobs Engineering Group* | 700 | 25 | |||
JB Hunt Transport Services | 400 | 13 | |||
Joy Global | 6,300 | 337 | |||
KBR | 44,174 | 823 | |||
Kirby* | 700 | 23 | |||
L-3 Communications Holdings, Cl 3 | 3,200 | 251 | |||
Lennox International | 400 | 15 | |||
Lockheed Martin | 18,620 | 1,438 | |||
Manpower | 2,900 | 143 | |||
Masco | 700 | 9 | |||
McDermott International* | 8,200 | 172 | |||
Monster Worldwide* | 3,400 | 50 | |||
Multi-Color | 400 | 4 | |||
Navistar International* | 400 | 13 | |||
Norfolk Southern | 200 | 10 | |||
Northrop Grumman | 20,300 | 1,113 | |||
Oshkosh Truck | 11,200 | 445 | |||
Owens Corning* | 11,500 | 272 | |||
Paccar | 500 | 19 | |||
Parker Hannifin | 500 | 27 | |||
Pitney Bowes | 200 | 5 | |||
Precision Castparts | 600 | 62 | |||
Quanta Services* | 15,000 | 281 | |||
Raytheon | 20,000 | 1,031 | |||
Robert Half International | 300 | 7 | |||
Rockwell Automation | 2,200 | 96 | |||
Rockwell Collins | 1,800 | 96 | |||
Roper Industries | 100 | 5 | |||
RR Donnelley & Sons | 13,000 | 268 | |||
Ryder System | 700 | 28 | |||
Schawk, Cl A | 1,000 | 11 | |||
Shaw Group* | 600 | 17 | |||
Southwest Airlines | 78,707 | 724 | |||
Spirit Aerosystems Holdings, Cl A* | 1,800 | 33 | |||
SPX | 200 | 11 | |||
Tennant | 600 | 16 | |||
Terex* | 1,600 | 30 | |||
Textron | 1,300 | 26 | |||
Thomas & Betts* | 900 | 33 | |||
Toro | 2,200 | 88 | |||
TransDigm Group | 700 | 30 | |||
Tyco International | 17,300 | 621 | |||
Union Pacific | 14,400 | 911 | |||
United Parcel Service, Cl B | 20,850 | 1,199 | |||
United Technologies | 9,300 | 625 | |||
URS* | 3,300 | 137 | |||
UTi Worldwide | 700 | 9 | |||
Waste Management | 4,700 | 154 | |||
Watson Wyatt Worldwide, Cl A | 2,500 | 103 | |||
Werner Enterprises | 3,300 | 62 | |||
WESCO International* | 500 | 13 | |||
WW Grainger | 3,200 | 313 | |||
| 25,304 | |||||
| 5 | SEI Institutional Investments Trust / Semi-Annual Report / November 30, 2009 |
Table of Contents
SCHEDULE OF INVESTMENTS (Unaudited)
Large Cap Diversified Alpha Fund
November 30, 2009
Description | Shares | Market Value ($ Thousands) | |||
Information Technology — 18.6% | |||||
Acme Packet* | 2,900 | $ | 30 | ||
Adobe Systems* | 24,300 | 852 | |||
Advanced Micro Devices* | 5,000 | 35 | |||
Affiliated Computer Services, Cl A* | 1,886 | 104 | |||
Akamai Technologies* | 600 | 14 | |||
Alliance Data Systems* | 700 | 43 | |||
Altera | 2,300 | 48 | |||
Amphenol, Cl A | 300 | 12 | |||
Analog Devices | 2,200 | 66 | |||
Apple* | 16,675 | 3,334 | |||
Applied Materials | 1,100 | 14 | |||
Arris Group* | 1,800 | 18 | |||
Arrow Electronics* | 1,900 | 50 | |||
Autodesk* | 11,900 | 279 | |||
Automatic Data Processing | 4,000 | 174 | |||
Avnet* | 15,800 | 431 | |||
BMC Software* | 8,700 | 337 | |||
Brightpoint* | 3,800 | 27 | |||
Broadcom, Cl A* | 8,400 | 245 | |||
Broadridge Financial Solutions | 4,800 | 105 | |||
Brocade Communications Systems* | 1,800 | 13 | |||
CA | 31,800 | 703 | |||
Cadence Design Systems* | 6,800 | 41 | |||
Celestica* | 29,600 | 242 | |||
Ciena* | 900 | 11 | |||
Cirrus Logic* | 3,000 | 16 | |||
Cisco Systems* | 131,100 | 3,068 | |||
Citrix Systems* | 800 | 31 | |||
Cognizant Technology Solutions, Cl A* | 2,900 | 127 | |||
CommScope* | 600 | 15 | |||
Computer Sciences* | 22,759 | 1,259 | |||
Convergys* | 1,400 | 16 | |||
Corning | 121,564 | 2,028 | |||
Cree* | 800 | 38 | |||
Cypress Semiconductor* | 3,400 | 33 | |||
DealerTrack Holdings* | 2,500 | 43 | |||
Dell* | 34,506 | 487 | |||
Dolby Laboratories, Cl A* | 700 | 31 | |||
DST Systems* | 2,000 | 85 | |||
eBay* | 45,040 | 1,102 | |||
Electronic Arts* | 14,300 | 241 | |||
EMC* | 68,900 | 1,160 | |||
Equinix* | 400 | 38 | |||
F5 Networks* | 1,000 | 47 | |||
Factset Research Systems | 800 | 58 | |||
Fidelity National Information Services | 7,859 | 178 | |||
Fiserv* | 5,600 | 259 | |||
Flextronics International* | 67,700 | 479 | |||
Google, Cl A* | 8,125 | 4,737 | |||
Harris | 13,100 | 575 | |||
Hewitt Associates, Cl A* | 9,600 | 386 | |||
Hewlett-Packard | 45,400 | 2,227 | |||
IAC* | 5,900 | 115 | |||
infoGROUP | 1,000 | 8 | |||
Ingram Micro, Cl A* | 56,459 | 959 | |||
Intel | 164,895 | 3,166 | |||
International Business Machines | 34,334 | 4,338 | |||
Description | Shares | Market Value ($ Thousands) | |||
Intersil, Cl A | 2,600 | $ | 34 | ||
Intuit* | 36,100 | 1,054 | |||
j2 Global Communications* | 600 | 12 | |||
Jabil Circuit | 18,300 | 244 | |||
JDS Uniphase* | 5,800 | 43 | |||
Juniper Networks* | 1,000 | 26 | |||
Kla-Tencor | 1,700 | 53 | |||
Lam Research* | 1,100 | 37 | |||
Lender Processing Services | 600 | 25 | |||
Linear Technology | 2,800 | 76 | |||
Loral Space & Communications* | 400 | 13 | |||
Marvell Technology Group* | 21,800 | 336 | |||
Mastercard, Cl A | 5,900 | 1,421 | |||
Maxim Integrated Products | 700 | 12 | |||
McAfee* | 3,400 | 130 | |||
MEMC Electronic Materials* | 1,700 | 20 | |||
Microchip Technology | 1,300 | 34 | |||
Micron Technology* | 3,900 | 29 | |||
Micros Systems* | 3,100 | 87 | |||
Microsoft | 264,436 | 7,777 | |||
Molex | 1,400 | 26 | |||
Motorola | 13,917 | 111 | |||
National Semiconductor | 500 | 7 | |||
NetApp* | 3,700 | 114 | |||
NeuStar, Cl A* | 17,600 | 412 | |||
Nokia ADR | 28,600 | 379 | |||
Novatel Wireless* | 7,800 | 65 | |||
Novellus Systems* | 3,400 | 70 | |||
Nuance Communications* | 900 | 14 | |||
NVE* | 200 | 8 | |||
Nvidia* | 16,600 | 217 | |||
ON Semiconductor* | 1,100 | 9 | |||
Oplink Communications* | 400 | 7 | |||
Oracle | 51,400 | 1,135 | |||
Paychex | 13,500 | 423 | |||
Pegasystems | 1,100 | 32 | |||
Qualcomm | 46,125 | 2,076 | |||
Rackspace Hosting* | 17,500 | 324 | |||
Rambus* | 1,000 | 18 | |||
Red Hat* | 9,300 | 248 | |||
Rovi* | 1,900 | 57 | |||
SAIC* | 300 | 5 | |||
Salesforce.com* | 600 | 38 | |||
SanDisk* | 300 | 6 | |||
Seagate Technology | 61,300 | 927 | |||
Semtech* | 3,300 | 53 | |||
Silicon Laboratories* | 1,600 | 68 | |||
Sun Microsystems* | 8,595 | 73 | |||
Sybase* | 2,200 | 88 | |||
Symantec* | 107,000 | 1,899 | |||
Synopsys* | 4,900 | 110 | |||
Tech Data* | 23,303 | 981 | |||
Technitrol | 2,900 | 15 | |||
Tellabs* | 7,000 | 39 | |||
Teradata* | 31,900 | 935 | |||
Teradyne* | 5,500 | 49 | |||
Texas Instruments | 136,088 | 3,442 | |||
Total System Services | 5,900 | 102 | |||
Trimble Navigation* | 400 | 9 | |||
Varian Semiconductor Equipment Associates* | 400 | 12 | |||
VeriSign* | 35,600 | 799 | |||
Visa, Cl A | 30,261 | 2,451 | |||
| 6 | SEI Institutional Investments Trust / Semi-Annual Report / November 30, 2009 |
Table of Contents
SCHEDULE OF INVESTMENTS (Unaudited)
Large Cap Diversified Alpha Fund
November 30, 2009
Description | Shares | Market Value ($ Thousands) | |||
Vishay Intertechnology* | 3,800 | $ | 28 | ||
VMware, Cl A* | 1,000 | 42 | |||
WebMD Health, Cl A* | 888 | 32 | |||
Western Digital* | 18,600 | 685 | |||
Western Union | 19,100 | 352 | |||
Xerox | 7,121 | 55 | |||
Xilinx | 3,600 | 81 | |||
Yahoo!* | 61,650 | 923 | |||
Zebra Technologies, Cl A* | 1,000 | 26 | |||
| 66,118 | |||||
Materials — 2.7% | |||||
Air Products & Chemicals | 1,400 | 116 | |||
Albemarle | 1,900 | 64 | |||
Alcoa | 1,400 | 18 | |||
Allegheny Technologies | 1,100 | 38 | |||
Ashland | 1,000 | 36 | |||
Ball | 3,100 | 153 | |||
Bemis | 15,100 | 443 | |||
Celanese, Cl A | 3,500 | 104 | |||
CF Industries Holdings | 271 | 23 | |||
Cliffs Natural Resources | 20,836 | 918 | |||
Commercial Metals | 1,200 | 19 | |||
Crown Holdings* | 4,300 | 108 | |||
E.I. Du Pont de Nemours | 3,600 | 125 | |||
Eagle Materials | 1,400 | 38 | |||
Eastman Chemical | 1,000 | 60 | |||
Ecolab | 4,600 | 207 | |||
FMC | 400 | 22 | |||
Freeport-McMoRan Copper & Gold, Cl B | 6,400 | 530 | |||
Greif, Cl A | 900 | 50 | |||
Huntsman | 53,820 | 512 | |||
International Flavors & Fragrances | 200 | 8 | |||
International Paper | 1,100 | 28 | |||
Intrepid Potash* | 100 | 3 | |||
Koppers Holdings | 1,300 | 37 | |||
Lubrizol | 8,800 | 638 | |||
MeadWestvaco | 2,200 | 60 | |||
Monsanto | 3,900 | 315 | |||
Mosaic | 100 | 6 | |||
Nalco Holding | 31,700 | 775 | |||
NewMarket | 1,300 | 136 | |||
Newmont Mining | 800 | 43 | |||
Nucor | 10,500 | 445 | |||
Owens-Illinois* | 2,500 | 78 | |||
Packaging of America | 200 | 4 | |||
Pactiv* | 6,500 | 158 | |||
PPG Industries | 900 | 54 | |||
Praxair | 11,000 | 902 | |||
Reliance Steel & Aluminum | 200 | 8 | |||
RPM International | 1,600 | 31 | |||
Schnitzer Steel Industries, Cl A | 500 | 22 | |||
Scotts Miracle-Gro, Cl A | 3,800 | 152 | |||
Sealed Air | 2,800 | 63 | |||
Sigma-Aldrich | 100 | 5 | |||
Solutia* | 9,200 | 99 | |||
Sonoco Products | 800 | 23 | |||
Southern Copper | 30,400 | 1,059 | |||
Spartech | 2,700 | 29 | |||
Steel Dynamics | 1,000 | 17 | |||
Stepan | 800 | 50 | |||
Syngenta ADR | 14,400 | 771 | |||
Description | Shares | Market Value ($ Thousands) | |||
Temple-Inland | 2,800 | $ | 50 | ||
Terra Industries | 533 | 21 | |||
Valspar | 1,500 | 39 | |||
Weyerhaeuser | 400 | 16 | |||
| 9,729 | |||||
Telecommunication Services — 2.7% | |||||
AT&T | 197,443 | 5,319 | |||
BCE | 9,700 | 257 | |||
CenturyTel | 8,473 | 302 | |||
Crown Castle International* | 32,800 | 1,203 | |||
MetroPCS Communications* | 3,900 | 25 | |||
NII Holdings* | 13,600 | 405 | |||
Qwest Communications International | 14,300 | 52 | |||
Rogers Communications, Cl B | 7,900 | 239 | |||
SBA Communications, Cl A* | 1,200 | 39 | |||
Sprint Nextel* | 178,284 | 661 | |||
tw telecom , Cl A* | 900 | 13 | |||
USA Mobility | 700 | 7 | |||
Verizon Communications | 35,800 | 1,126 | |||
Windstream | 150 | 2 | |||
| 9,650 | |||||
Utilities — 2.9% | |||||
AES* | 163,026 | 2,077 | |||
AGL Resources | 2,000 | 69 | |||
Allegheny Energy | 100 | 2 | |||
American Electric Power | 5,100 | 164 | |||
American Water Works | 1,600 | 36 | |||
Aqua America | 5,400 | 88 | |||
Atmos Energy | 2,400 | 66 | |||
Calpine* | 5,900 | 66 | |||
Centerpoint Energy | 200 | 3 | |||
CMS Energy | 9,200 | 131 | |||
Consolidated Edison | 3,200 | 137 | |||
Constellation Energy Group | 9,800 | 312 | |||
Dominion Resources | 2,800 | 102 | |||
DPL | 3,500 | 94 | |||
DTE Energy | 2,440 | 98 | |||
Duke Energy | 1,400 | 23 | |||
Edison International | 14,800 | 504 | |||
Energen | 6,110 | 266 | |||
Entergy | 300 | 24 | |||
Equities | 4,800 | 198 | |||
Exelon | 500 | 24 | |||
FirstEnergy | 28,185 | 1,214 | |||
FPL Group | 11,800 | 613 | |||
ITC Holdings | 300 | 13 | |||
Mirant* | 47,500 | 676 | |||
National Fuel Gas | 500 | 23 | |||
Northeast Utilities | 3,000 | 72 | |||
NRG Energy* | 500 | 12 | |||
NSTAR | 2,400 | 79 | |||
NV Energy | 44,400 | 517 | |||
OGE Energy | 1,000 | 35 | |||
Oneok | 100 | 4 | |||
PG&E | 3,200 | 135 | |||
Pinnacle West Capital | 5,400 | 190 | |||
PPL | 10,554 | 322 | |||
Progress Energy | 1,600 | 63 | |||
Public Service Enterprise Group | 21,300 | 668 | |||
Questar | 1,300 | 52 | |||
| 7 | SEI Institutional Investments Trust / Semi-Annual Report / November 30, 2009 |
Table of Contents
SCHEDULE OF INVESTMENTS (Unaudited)
Large Cap Diversified Alpha Fund
November 30, 2009
Description | Shares/Face Amount ($ Thousands) | Market Value ($ Thousands) | |||
SCANA | 1,200 | $ | 42 | ||
Sempra Energy | 14,300 | 760 | |||
Southern | 700 | 23 | |||
TECO Energy | 1,400 | 21 | |||
UGI | 7,900 | 185 | |||
Westar Energy | 700 | 14 | |||
Wisconsin Energy | 1,900 | 86 | |||
Xcel Energy | 7,500 | 152 | |||
| 10,455 | |||||
Total Common Stock | 287,720 | ||||
AFFILIATED PARTNERSHIP — 12.2% | |||||
SEI LIBOR Plus Portfolio† | 6,723,909 | 43,302 | |||
Total Affiliated Partnership | 43,302 | ||||
CASH EQUIVALENT — 4.5% | |||||
SEI Daily Income Trust, | 16,000,101 | 16,000 | |||
Total Cash Equivalent | 16,000 | ||||
U.S. TREASURY OBLIGATIONS (A) (B) — 2.1% | |||||
U.S. Treasury Bills | |||||
0.079%, 01/07/10 | $2,500 | 2,500 | |||
0.130%, 12/03/09 | 4,848 | 4,848 | |||
0.193%, 09/23/10 | 299 | 299 | |||
Total U.S. Treasury Obligations | 7,647 | ||||
Total Investments — 99.7% | $ | 354,669 | |||
A summary of the open futures contracts held by the Fund at November 30, 2009, is as follows:
Type of Contract | Number of Contracts Long (Short) | Expiration Date | Unrealized Appreciation ($ Thousands) | ||||
S&P 500 Composite Index | 240 | Dec-2009 | $ | 4,839 | |||
S&P 500 E-Mini | 20 | Dec-2009 | 58 | ||||
| $ | 4,897 | ||||||
For the year ended November 30, 2009, the total amount of all open futures contracts, as presented in the table above, are representative of the volume of activity for this derivative type during the period.
Percentages are based on a Net Assets of $355,676 ($ Thousands).
| (A) | The rate reported is the effective yield at time of purchase. |
| (B) | Security, or a portion thereof, has been pledged as collateral on open futures contracts. |
| * | Non-income producing security. |
| ** | Rate shown is the 7-day effective yield as of November 30, 2009. |
| † | Investment in Affiliated Security (see Note 5). |
| ‡ | Real Estate Investment Trust |
ADR — American Depositary Receipt
Cl — Class
LIBOR — London Interbank Offered Rate
REIT — Real Estate Investment Trust
Ser — Series
S&P — Standard & Poor’s
| 8 | SEI Institutional Investments Trust / Semi-Annual Report / November 30, 2009 |
Table of Contents
SCHEDULE OF INVESTMENTS (Unaudited)
Large Cap Disciplined Equity Fund
November 30, 2009
Description | Shares | Market Value ($ Thousands) | |||
COMMON STOCK — 83.7% | |||||
Consumer Discretionary — 8.0% | |||||
99 Cents Only Stores* | 22,900 | $ | 275 | ||
Abercrombie & Fitch, Cl A (A) | 20,300 | 811 | |||
Amazon.com* (A) | 102,905 | 13,986 | |||
American Greetings, Cl A | 22,500 | 466 | |||
Apollo Group, Cl A* (A) | 198,402 | 11,323 | |||
Autoliv (A) | 41,907 | 1,702 | |||
AutoNation* (A) | 77,300 | 1,364 | |||
AutoZone* (A) | 24,900 | 3,682 | |||
Bed Bath & Beyond* (A) | 33,100 | 1,237 | |||
Best Buy (A) | 220,500 | 9,444 | |||
Black & Decker | 10,319 | 626 | |||
Carnival | 52,800 | 1,691 | |||
CBS, Cl B | 64,000 | 820 | |||
Chico’s FAS* (A) | 368,700 | 5,188 | |||
Coach (A) | 417,600 | 14,512 | |||
Comcast, Cl A | 4,455,886 | 65,368 | |||
Cooper Tire & Rubber | 24,900 | 446 | |||
Darden Restaurants (A) | 562,170 | 17,669 | |||
DIRECTV, Cl A* (A) | 188,238 | 5,954 | |||
DISH Network, Cl A | 266,347 | 5,516 | |||
Dollar Tree* (A) | 40,000 | 1,959 | |||
DR Horton (A) | 50,500 | 519 | |||
Expedia* (A) | 105,300 | 2,683 | |||
Family Dollar Stores (A) | 211,900 | 6,465 | |||
Ford Motor* (A) | 2,235,005 | 19,869 | |||
GameStop, Cl A* (A) | 13,000 | 317 | |||
Gannett | 79,500 | 786 | |||
Gap | 94,700 | 2,028 | |||
Genuine Parts (A) | 27,600 | 989 | |||
Goodyear Tire & Rubber* (A) | 111,700 | 1,531 | |||
H&R Block | 26,100 | 530 | |||
Hanesbrands* | 29,500 | 708 | |||
Harley-Davidson (A) | 28,700 | 836 | |||
Harman International Industries (A) | 37,400 | 1,406 | |||
Hasbro (A) | 603,430 | 17,892 | |||
Helen of Troy* | 7,000 | 144 | |||
Home Depot (A) | 1,178,468 | 32,243 | |||
International Game Technology (A) | 137,900 | 2,605 | |||
Interpublic Group* | 44,200 | 280 | |||
J Crew Group* (A) | 206,090 | 8,819 | |||
J.C. Penney | 56,700 | 1,629 | |||
Johnson Controls | 740,656 | 20,035 | |||
KB Home (A) | 87,000 | 1,179 | |||
Kohl’s* (A) | 38,800 | 2,062 | |||
Las Vegas Sands* (A) | 239,338 | 3,667 | |||
Leggett & Platt | 381,900 | 7,432 | |||
Lennar, Cl A (A) | 137,100 | 1,737 | |||
Limited Brands | 64,200 | 1,065 | |||
Lowe’s | 255,900 | 5,581 | |||
Macy’s | 1,214,038 | 19,801 | |||
Maidenform Brands* | 9,100 | 132 | |||
Marriott International, Cl A (A) | 225,141 | 5,791 | |||
Mattel (A) | 12,600 | 245 | |||
McDonald’s | 387,532 | 24,511 | |||
McGraw-Hill | 145,400 | 4,356 | |||
Meredith (A) | 45,500 | 1,199 | |||
New York Times, Cl A (A) | 228,933 | 1,932 | |||
Newell Rubbermaid (A) | 137,200 | 1,991 | |||
News, Cl A (A) | 348,100 | 3,989 | |||
Description | Shares | Market Value ($ Thousands) | |||
NIKE, Cl B (A) | 34,400 | $ | 2,232 | ||
Nordstrom (A) | 256,616 | 8,584 | |||
NVR* (A) | 19,045 | 12,820 | |||
Office Depot* | 226,200 | 1,389 | |||
Omnicom Group | 87,800 | 3,224 | |||
O’Reilly Automotive* (A) | 77,500 | 3,005 | |||
Oxford Industries | 8,000 | 172 | |||
PetMed Express (A) | 29,300 | 481 | |||
Polo Ralph Lauren, Cl A (A) | 20,900 | 1,606 | |||
priceline.com* (A) | 75,430 | 16,151 | |||
Pulte Homes (A) | 15,865 | 145 | |||
RadioShack | 35,100 | 662 | |||
Ross Stores (A) | 104,400 | 4,592 | |||
Royal Caribbean Cruises* | 479,330 | 11,777 | |||
Sally Beauty Holdings* (A) | 92,300 | 644 | |||
Scripps Networks Interactive, Cl A | 16,800 | 664 | |||
Sears Holdings* (A) | 4,900 | 348 | |||
Sherwin-Williams (A) | 38,200 | 2,324 | |||
Smith & Wesson Holding* (A) | 184,500 | 911 | |||
Sonic Automotive, Cl A (A) | 125,200 | 1,108 | |||
Stanley Works (A) | 17,700 | 860 | |||
Staples | 23,300 | 543 | |||
Starbucks* | 935,134 | 20,479 | |||
Starwood Hotels & Resorts Worldwide (A) | 37,900 | 1,214 | |||
Steven Madden* | 9,900 | 353 | |||
Strayer Education (A) | 9,900 | 1,955 | |||
Target (A) | 423,662 | 19,726 | |||
Tempur-Pedic International* | 125,800 | 2,711 | |||
Thor Industries | 20,700 | 589 | |||
Tiffany (A) | 26,700 | 1,140 | |||
Time Warner | 581,335 | 17,859 | |||
Time Warner Cable, Cl A (A) | 366,812 | 15,366 | |||
TJX | 164,000 | 6,294 | |||
TRW Automotive Holdings* | 91,800 | 1,998 | |||
Universal Technical Institute* | 9,700 | 183 | |||
VF (A) | 18,400 | 1,338 | |||
Viacom, Cl B* (A) | 288,300 | 8,545 | |||
Walt Disney (A) | 806,083 | 24,360 | |||
Wyndham Worldwide | 75,000 | 1,393 | |||
Wynn Resorts* (A) | 23,100 | 1,491 | |||
Yum! Brands | 179,300 | 6,324 | |||
| 580,583 | |||||
Consumer Staples — 10.0% | |||||
Altria Group | 1,634,244 | 30,740 | |||
American Italian Pasta, Cl A* (A) | 13,400 | 427 | |||
Andersons | 5,400 | 141 | |||
Archer-Daniels-Midland | 1,085,978 | 33,459 | |||
Avon Products | 24,500 | 839 | |||
Brown-Forman, Cl B | 20,921 | 1,070 | |||
Clorox | 10,000 | 603 | |||
Coca-Cola (A) | 772,604 | 44,193 | |||
Coca-Cola Enterprises (A) | 951,617 | 18,699 | |||
Colgate-Palmolive | 72,900 | 6,138 | |||
Costco Wholesale (A) | 334,017 | 20,011 | |||
CVS Caremark | 540,678 | 16,766 | |||
Dean Foods* | 69,200 | 1,100 | |||
Dr Pepper Snapple Group | 16,100 | 422 | |||
Estee Lauder, Cl A (A) | 158,463 | 7,421 | |||
General Mills | 299,960 | 20,397 | |||
Hershey (A) | 75,700 | 2,678 | |||
| 1 | SEI Institutional Investments Trust / Semi-Annual Report / November 30, 2009 |
Table of Contents
SCHEDULE OF INVESTMENTS (Unaudited)
Large Cap Disciplined Equity Fund
November 30, 2009
Description | Shares | Market Value ($ Thousands) | |||
Hormel Foods (A) | 39,100 | $ | 1,467 | ||
JM Smucker | 9,000 | 532 | |||
Kellogg | 73,600 | 3,870 | |||
Kimberly-Clark | 315,741 | 20,829 | |||
Kraft Foods, Cl A | 544,183 | 14,465 | |||
Kroger | 821,717 | 18,686 | |||
Lorillard | 13,800 | 1,076 | |||
Medifast* | 15,100 | 407 | |||
Pepsi Bottling Group | 64,551 | 2,450 | |||
PepsiCo (A) | 901,097 | 56,066 | |||
Philip Morris International | 1,683,491 | 80,959 | |||
Procter & Gamble | 1,596,411 | 99,536 | |||
Reynolds American (A) | 146,300 | 7,309 | |||
Safeway | 9,200 | 207 | |||
Sanderson Farms (A) | 43,200 | 1,735 | |||
Sara Lee | 1,462,215 | 17,751 | |||
Supervalu (A) | 40,100 | 555 | |||
Sysco (A) | 1,021,351 | 27,617 | |||
Tyson Foods, Cl A (A) | 1,486,928 | 17,873 | |||
Walgreen (A) | 899,492 | 34,981 | |||
Wal-Mart Stores | 1,929,689 | 105,265 | |||
Whole Foods Market* (A) | 109,900 | 2,819 | |||
| 721,559 | |||||
Energy — 10.1% | |||||
Anadarko Petroleum (A) | 81,500 | 4,852 | |||
Apache (A) | 267,560 | 25,493 | |||
Baker Hughes (A) | 23,867 | 972 | |||
BJ Services (A) | 111,030 | 2,085 | |||
Cabot Oil & Gas (A) | 48,100 | 1,842 | |||
Cal Dive International* | 165,000 | 1,198 | |||
Cameron International* | 28,600 | 1,081 | |||
Chesapeake Energy (A) | 350,200 | 8,377 | |||
Chevron | 1,903,443 | 148,545 | |||
ConocoPhillips | 1,047,143 | 54,211 | |||
Consol Energy | 24,100 | 1,107 | |||
Denbury Resources* (A) | 63,200 | 839 | |||
Devon Energy | 197,700 | 13,315 | |||
Diamond Offshore Drilling (A) | 9,800 | 976 | |||
Dresser-Rand Group* | 61,000 | 1,713 | |||
El Paso | 456,200 | 4,361 | |||
ENSCO International | 32,300 | 1,421 | |||
EOG Resources | 15,200 | 1,315 | |||
Exxon Mobil | 3,400,086 | 255,244 | |||
FMC Technologies* (A) | 85,200 | 4,641 | |||
Halliburton | 434,770 | 12,765 | |||
Helix Energy Solutions Group* (A) | 211,000 | 2,481 | |||
Hess | 507,715 | 29,427 | |||
Marathon Oil (A) | 1,075,640 | 35,087 | |||
Massey Energy (A) | 45,300 | 1,706 | |||
Murphy Oil | 283,285 | 15,974 | |||
Nabors Industries* (A) | 46,900 | 969 | |||
National Oilwell Varco | 119,365 | 5,135 | |||
Noble Energy | 39,400 | 2,571 | |||
Occidental Petroleum | 252,906 | 20,432 | |||
Patterson-UTI Energy | 193,259 | 2,974 | |||
Peabody Energy | 59,900 | 2,663 | |||
Pioneer Natural Resources (A) | 56,100 | 2,320 | |||
Range Resources | 35,500 | 1,673 | |||
Rowan (A) | 18,000 | 444 | |||
Schlumberger (A) | 398,946 | 25,489 | |||
Description | Shares | Market Value ($ Thousands) | |||
Smith International (A) | 304,860 | $ | 8,286 | ||
Southwestern Energy* | 31,800 | 1,398 | |||
Spectra Energy | 302,300 | 5,868 | |||
Sunoco | 12,700 | 320 | |||
Tesoro (A) | 62,500 | 799 | |||
Valero Energy | 69,800 | 1,109 | |||
Walter Industries | 34,500 | 2,367 | |||
Western Refining* (A) | 170,600 | 793 | |||
Williams | 179,300 | 3,566 | |||
World Fuel Services (A) | 7,600 | 404 | |||
XTO Energy | 149,925 | 6,363 | |||
| 726,971 | |||||
Financials — 11.9% | |||||
Aflac | 160,177 | 7,373 | |||
Allied World Assurance Holdings | 29,800 | 1,424 | |||
Allstate | 105,947 | 3,010 | |||
American Express | 1,751,778 | 73,277 | |||
American International Group* (A) | 59,700 | 1,695 | |||
Ameriprise Financial | 115,436 | 4,400 | |||
Annaly Capital Management‡ | 430,989 | 7,934 | |||
Anworth Mortgage Asset‡ | 175,500 | 1,264 | |||
Argo Group International Holdings* | 5,100 | 149 | |||
Assurant | 50,200 | 1,535 | |||
Bank of America | 3,408,159 | 54,019 | |||
Bank of New York Mellon | 821,438 | 21,883 | |||
BB&T (A) | 34,900 | 869 | |||
BlackRock, Cl A (A) | 95,121 | 21,600 | |||
Boston Private Financial Holdings | 24,600 | 115 | |||
Boston Properties‡ (A) | 26,200 | 1,755 | |||
Brandywine Realty Trust‡ | 106,300 | 1,044 | |||
Capital One Financial (A) | 297,700 | 11,420 | |||
CB Richard Ellis Group, Cl A* (A) | 152,800 | 1,746 | |||
Charles Schwab (A) | 62,800 | 1,151 | |||
Chimera Investment‡ | 1,325,450 | 5,342 | |||
Chubb | 96,400 | 4,833 | |||
Cincinnati Financial | 88,800 | 2,266 | |||
Citigroup | 4,303,470 | 17,687 | |||
CME Group, Cl A | 30,530 | 10,021 | |||
Colonial Properties Trust‡ | 22,600 | 244 | |||
Comerica | 98,300 | 2,799 | |||
Community Bank System (A) | 22,700 | 421 | |||
Cullen/Frost Bankers | 68,996 | 3,313 | |||
Discover Financial Services | 1,568,565 | 24,250 | |||
Endurance Specialty Holdings (A) | 42,700 | 1,597 | |||
Equity Residential‡ (A) | 222,100 | 7,154 | |||
Federated Investors, Cl B (A) | 104,900 | 2,704 | |||
Fifth Third Bancorp | 238,400 | 2,403 | |||
First Horizon National* (A) | 99,362 | 1,346 | |||
FNB (Pennsylvania) | 25,200 | 164 | |||
Forest City Enterprises, Cl A (A) | 32,500 | 349 | |||
Franklin Resources | 36,709 | 3,966 | |||
Genworth Financial, Cl A* (A) | 140,200 | 1,510 | |||
Goldman Sachs Group (A) | 350,923 | 59,538 | |||
Hartford Financial Services Group (A) | 95,364 | 2,333 | |||
HCP‡ (A) | 68,000 | 2,128 | |||
Host Hotels & Resorts‡ (A) | 178,000 | 1,873 | |||
Hudson City Bancorp | 1,150,323 | 15,288 | |||
Huntington Bancshares (A) | 1,304,800 | 4,984 | |||
IntercontinentalExchange* (A) | 18,200 | 1,944 | |||
| 2 | SEI Institutional Investments Trust / Semi-Annual Report / November 30, 2009 |
Table of Contents
SCHEDULE OF INVESTMENTS (Unaudited)
Large Cap Disciplined Equity Fund
November 30, 2009
Description | Shares | Market Value ($ Thousands) | |||
International Bancshares (A) | 31,300 | $ | 525 | ||
Invesco | 214,300 | 4,768 | |||
JPMorgan Chase | 2,822,544 | 119,930 | |||
Keycorp (A) | 390,400 | 2,288 | |||
Legg Mason (A) | 29,000 | 820 | |||
Leucadia National (A) | 14,300 | 308 | |||
Lincoln National | 208,600 | 4,779 | |||
Loews | 92,100 | 3,262 | |||
M&T Bank (A) | 47,519 | 3,116 | |||
Marsh & McLennan | 31,800 | 717 | |||
Marshall & Ilsley | 450,100 | 2,588 | |||
MBIA* (A) | 160,600 | 556 | |||
MetLife | 825,493 | 28,224 | |||
MFA Mortgage Investments‡ | 545,200 | 4,127 | |||
Moody’s (A) | 888,148 | 20,632 | |||
Morgan Stanley | 244,216 | 7,712 | |||
NASDAQ OMX Group* | 56,900 | 1,063 | |||
Northern Trust | 135,424 | 6,704 | |||
NYSE Euronext (A) | 171,700 | 4,340 | |||
PartnerRe (A) | 9,669 | 745 | |||
People’s United Financial | 19,500 | 318 | |||
Platinum Underwriters Holdings | 31,800 | 1,122 | |||
PNC Financial Services Group (A) | 520,311 | 29,663 | |||
Principal Financial Group | 116,000 | 2,945 | |||
Progressive (A) | 173,616 | 2,911 | |||
Prudential Financial | 460,680 | 22,965 | |||
Public Storage‡ (A) | 21,600 | 1,719 | |||
Regions Financial | 780,000 | 4,571 | |||
Simon Property Group‡ (A) | 19,469 | 1,415 | |||
SLM* (A) | 159,600 | 1,751 | |||
State Street | 134,500 | 5,555 | |||
SunTrust Banks (A) | 83,400 | 1,971 | |||
Susquehanna Bancshares (A) | 37,400 | 215 | |||
T. Rowe Price Group (A) | 619,900 | 30,332 | |||
Torchmark (A) | 22,500 | 978 | |||
Travelers | 625,385 | 32,764 | |||
Unum Group | 82,600 | 1,573 | |||
US Bancorp (A) | 1,279,664 | 30,878 | |||
Ventas‡ (A) | 25,000 | 1,073 | |||
Vornado Realty Trust‡ (A) | 2,114 | 138 | |||
Webster Financial (A) | 65,800 | 838 | |||
Wells Fargo (A) | 2,229,655 | 62,519 | |||
Wintrust Financial (A) | 13,200 | 343 | |||
World Acceptance* (A) | 11,700 | 343 | |||
XL Capital, Cl A (A) | 130,100 | 2,382 | |||
Zions Bancorporation (A) | 194,500 | 2,558 | |||
| 859,164 | |||||
Health Care — 11.0% | |||||
Abbott Laboratories | 531,846 | 28,980 | |||
Aetna | 36,400 | 1,060 | |||
Allergan | 126,100 | 7,330 | |||
American Medical Systems Holdings* | 54,000 | 949 | |||
AmerisourceBergen | 878,307 | 21,685 | |||
Amgen* | 919,852 | 51,834 | |||
Baxter International | 238,900 | 13,032 | |||
Biogen Idec* | 530,613 | 24,907 | |||
Boston Scientific* | 123,900 | 1,037 | |||
Bristol-Myers Squibb | 1,152,247 | 29,163 | |||
Cardinal Health | 847,328 | 27,309 | |||
CareFusion* | 168,900 | 4,363 | |||
Description | Shares | Market Value ($ Thousands) | |||
Celgene* | 88,400 | $ | 4,902 | ||
Cephalon* (A) | 27,800 | 1,527 | |||
CIGNA | 100,700 | 3,231 | |||
Coventry Health Care* | 236,452 | 5,332 | |||
DaVita* | 7,900 | 468 | |||
Eli Lilly (A) | 606,752 | 22,286 | |||
Express Scripts* | 16,700 | 1,433 | |||
Forest Laboratories* | 56,500 | 1,732 | |||
Gilead Sciences* (A) | 456,171 | 21,007 | |||
Hospira* | 93,000 | 4,366 | |||
Humana* (A) | 287,067 | 11,916 | |||
IMS Health | 35,609 | 761 | |||
Intuitive Surgical* (A) | 31,900 | 8,949 | |||
Invacare (A) | 22,200 | 553 | |||
Johnson & Johnson | 2,179,694 | 136,972 | |||
King Pharmaceuticals* (A) | 139,000 | 1,644 | |||
Laboratory Corp of America Holdings* (A) | 11,700 | 854 | |||
Life Technologies* | 26,600 | 1,324 | |||
McKesson | 606,259 | 37,600 | |||
Medco Health Solutions* | 222,648 | 14,062 | |||
Medtronic | 795,269 | 33,751 | |||
Merck | 1,227,315 | 44,441 | |||
Meridian Bioscience | 12,300 | 255 | |||
Mettler Toledo International* (A) | 18,000 | 1,791 | |||
Millipore* | 38,000 | 2,588 | |||
Mylan Laboratories* (A) | 192,300 | 3,437 | |||
Par Pharmaceutical* | 14,000 | 332 | |||
Pfizer | 5,553,948 | 100,915 | |||
Quest Diagnostics (A) | 119,800 | 6,941 | |||
Quidel* | 13,600 | 171 | |||
St. Jude Medical* | 11,700 | 430 | |||
Stryker (A) | 195,048 | 9,830 | |||
Tenet Healthcare* | 298,400 | 1,358 | |||
Thermo Fisher Scientific* (A) | 356,180 | 16,822 | |||
UnitedHealth Group | 672,380 | 19,277 | |||
Valeant Pharmaceuticals International* (A) | 25,500 | 834 | |||
Waters* | 176,440 | 10,371 | |||
Watson Pharmaceuticals* (A) | 89,200 | 3,309 | |||
WellPoint* | 614,166 | 33,183 | |||
Zimmer Holdings* | 155,610 | 9,207 | |||
| 791,811 | |||||
Industrials — 8.4% | |||||
3M | 492,216 | 38,117 | |||
AGCO* (A) | 457,041 | 13,853 | |||
Alaska Air Group* | 11,000 | 329 | |||
Alliant Techsystems* (A) | 53,800 | 4,612 | |||
Avery Dennison (A) | 161,432 | 6,063 | |||
Boeing (A) | 191,218 | 10,022 | |||
Burlington Northern Santa Fe | 132,834 | 13,057 | |||
C.H. Robinson Worldwide (A) | 101,800 | 5,674 | |||
Caterpillar (A) | 139,188 | 8,127 | |||
Cintas (A) | 29,300 | 823 | |||
CSX | 69,600 | 3,305 | |||
Cummins | 14,040 | 630 | |||
Danaher (A) | 38,900 | 2,759 | |||
Deere | 62,900 | 3,366 | |||
Dollar Thrifty Automotive Group* (A) | 13,100 | 242 | |||
Dover | 135,000 | 5,519 | |||
| 3 | SEI Institutional Investments Trust / Semi-Annual Report / November 30, 2009 |
Table of Contents
SCHEDULE OF INVESTMENTS (Unaudited)
Large Cap Disciplined Equity Fund
November 30, 2009
Description | Shares | Market Value ($ Thousands) | |||
Dun & Bradstreet (A) | 24,700 | $ | 1,941 | ||
DynCorp International, Cl A* | 10,800 | 151 | |||
Eaton (A) | 244,610 | 15,631 | |||
Emerson Electric | 179,930 | 7,451 | |||
Equifax | 127,800 | 3,662 | |||
Expeditors International Washington (A) | 11,200 | 358 | |||
FedEx | 111,106 | 9,383 | |||
First Solar* (A) | 7,700 | 917 | |||
Flowserve | 9,400 | 935 | |||
Fluor (A) | 378,377 | 16,073 | |||
General Dynamics | 643,129 | 42,382 | |||
General Electric (A) | 4,056,486 | 64,985 | |||
Goodrich (A) | 76,400 | 4,534 | |||
Harsco | 104,949 | 3,257 | |||
Honeywell International | 161,553 | 6,215 | |||
Hubbell, Cl B | 54,198 | 2,461 | |||
Illinois Tool Works | 642,724 | 31,262 | |||
Iron Mountain* (A) | 78,300 | 1,879 | |||
ITT | 62,700 | 3,243 | |||
Jacobs Engineering Group* (A) | 31,900 | 1,116 | |||
Joy Global | 31,968 | 1,711 | |||
KBR | 405,178 | 7,549 | |||
L-3 Communications Holdings, Cl 3 | 58,700 | 4,600 | |||
Lockheed Martin | 745,887 | 57,605 | |||
Masco (A) | 55,200 | 750 | |||
McDermott International* | 13,600 | 285 | |||
Monster Worldwide* (A) | 113,500 | 1,658 | |||
Norfolk Southern | 9,100 | 468 | |||
Northrop Grumman | 527,846 | 28,926 | |||
Oshkosh Truck | 101,400 | 4,029 | |||
Owens Corning* | 17,200 | 406 | |||
Paccar (A) | 72,369 | 2,683 | |||
Parker Hannifin | 17,300 | 933 | |||
Precision Castparts | 122,580 | 12,709 | |||
Quanta Services* | 11,200 | 210 | |||
Raytheon | 383,004 | 19,736 | |||
Robert Half International (A) | 34,800 | 777 | |||
Rockwell Automation (A) | 54,700 | 2,379 | |||
Rockwell Collins | 34,200 | 1,828 | |||
RR Donnelley & Sons | 104,300 | 2,147 | |||
Ryder System | 26,300 | 1,066 | |||
Southwest Airlines | 1,299,529 | 11,955 | |||
Stericycle* (A) | 21,000 | 1,149 | |||
Textron (A) | 61,900 | 1,241 | |||
Thomas & Betts* | 14,945 | 546 | |||
Toro (A) | 32,200 | 1,283 | |||
Union Pacific (A) | 343,250 | 21,714 | |||
United Parcel Service, Cl B (A) | 648,657 | 37,278 | |||
United Technologies | 402,203 | 27,044 | |||
Waste Management (A) | 75,400 | 2,476 | |||
Watson Wyatt Worldwide, Cl A | 7,200 | 298 | |||
WESCO International* (A) | 206,419 | 5,388 | |||
WW Grainger (A) | 112,827 | 11,023 | |||
| 608,184 | |||||
Information Technology — 15.9% | |||||
Activision Blizzard* | 1,122,540 | 12,786 | |||
Adobe Systems* (A) | 655,850 | 23,007 | |||
Advanced Micro Devices* (A) | 131,000 | 918 | |||
Description | Shares | Market Value ($ Thousands) | |||
Affiliated Computer Services, Cl A* (A) | 55,157 | $ | 3,045 | ||
Akamai Technologies* (A) | 31,300 | 751 | |||
Altera (A) | 99,200 | 2,086 | |||
Amphenol, Cl A | 19,000 | 783 | |||
Analog Devices (A) | 101,900 | 3,056 | |||
Apple* | 462,850 | 92,528 | |||
Applied Materials | 33,800 | 416 | |||
Arris Group* (A) | 56,200 | 561 | |||
Aruba Networks* | 33,600 | 269 | |||
Autodesk* | 21,300 | 499 | |||
Automatic Data Processing | 139,753 | 6,072 | |||
BMC Software* (A) | 157,800 | 6,111 | |||
Broadcom, Cl A* (A) | 279,000 | 8,147 | |||
CA | 85,700 | 1,894 | |||
Ciena* (A) | 42,300 | 514 | |||
Cirrus Logic* | 26,800 | 146 | |||
Cisco Systems* | 2,824,408 | 66,091 | |||
Citrix Systems* | 7,300 | 279 | |||
Cognizant Technology Solutions, Cl A* | 545,960 | 23,984 | |||
Computer Sciences* | 136,356 | 7,542 | |||
Convergys* | 118,300 | 1,323 | |||
Corning | 2,406,450 | 40,140 | |||
DealerTrack Holdings* | 12,100 | 206 | |||
Dell* (A) | 2,200,163 | 31,066 | |||
Diodes* | 10,100 | 177 | |||
DST Systems* | 14,700 | 624 | |||
eBay* (A) | 967,623 | 23,678 | |||
EchoStar, Cl A* | 16,400 | 319 | |||
Electronic Arts* | 21,700 | 366 | |||
EMC* (A) | 830,400 | 13,976 | |||
Fidelity National Information Services | 161,600 | 3,652 | |||
Fiserv* | 123,500 | 5,711 | |||
Google, Cl A* | 118,577 | 69,130 | |||
Harris | 215,962 | 9,481 | |||
Hewlett-Packard | 1,218,544 | 59,782 | |||
IAC* | 47,800 | 930 | |||
Ingram Micro, Cl A* | 284,908 | 4,841 | |||
Intel | 5,290,370 | 101,575 | |||
International Business Machines | 973,190 | 122,963 | |||
Intuit* (A) | 11,100 | 324 | |||
j2 Global Communications* (A) | 28,700 | �� | 571 | ||
Jabil Circuit | 428,439 | 5,703 | |||
JDS Uniphase* | 150,500 | 1,112 | |||
Juniper Networks* (A) | 186,400 | 4,871 | |||
Kla-Tencor (A) | 82,900 | 2,590 | |||
Lexmark International, Cl A* | 81,642 | 2,055 | |||
Linear Technology (A) | 82,300 | 2,220 | |||
LSI* | 193,200 | 1,022 | |||
Marvell Technology Group* (A) | 698,700 | 10,774 | |||
Mastercard, Cl A (A) | 35,400 | 8,526 | |||
McAfee* (A) | 109,400 | 4,174 | |||
MEMC Electronic Materials* | 70,400 | 848 | |||
Mentor Graphics* | 26,700 | 197 | |||
Microchip Technology (A) | 49,100 | 1,289 | |||
Micron Technology* (A) | 167,600 | 1,260 | |||
Microsoft | 4,553,575 | 133,921 | |||
Molex (A) | 364,140 | 6,769 | |||
Motorola | 264,972 | 2,122 | |||
National Semiconductor (A) | 16,200 | 236 | |||
| 4 | SEI Institutional Investments Trust / Semi-Annual Report / November 30, 2009 |
Table of Contents
SCHEDULE OF INVESTMENTS (Unaudited)
Large Cap Disciplined Equity Fund
November 30, 2009
Description | Shares | Market Value ($ Thousands) | |||
NetApp* (A) | 72,300 | $ | 2,228 | ||
Novellus Systems* (A) | 98,200 | 2,032 | |||
Nvidia* (A) | 166,450 | 2,174 | |||
Oracle | 2,035,316 | 44,940 | |||
Paychex (A) | 83,600 | 2,621 | |||
Qualcomm | 264,800 | 11,916 | |||
Red Hat* (A) | 27,500 | 734 | |||
Salesforce.com* | 11,500 | 721 | |||
SanDisk* | 43,300 | 854 | |||
Seagate Technology (A) | 897,596 | 13,581 | |||
Semtech* | 19,100 | 306 | |||
Sun Microsystems* | 291,220 | 2,478 | |||
Symantec* | 400,000 | 7,100 | |||
Tech Data* | 88,318 | 3,719 | |||
Tellabs* | 141,400 | 793 | |||
Teradata* | 59,500 | 1,743 | |||
Teradyne* (A) | 159,500 | 1,413 | |||
Texas Instruments (A) | 1,613,888 | 40,815 | |||
Total System Services | 182,000 | 3,145 | |||
Tyco Electronics | 382,780 | 8,884 | |||
Visa, Cl A (A) | 323,897 | 26,236 | |||
Western Digital* | 226,100 | 8,330 | |||
Western Union | 460,400 | 8,494 | |||
Xerox (A) | 573,299 | 4,414 | |||
Xilinx (A) | 153,200 | 3,468 | |||
Yahoo!* (A) | 197,200 | 2,952 | |||
| 1,148,100 | |||||
Materials — 2.5% | |||||
Air Products & Chemicals | 43,200 | 3,583 | |||
Airgas | 11,000 | 509 | |||
AK Steel Holding | 7,200 | 144 | |||
Alcoa | 23,100 | 289 | |||
Allegheny Technologies (A) | 31,200 | 1,062 | |||
Ball | 94,500 | 4,669 | |||
Bemis | 44,000 | 1,289 | |||
Cabot | 37,737 | 865 | |||
Celanese, Cl A | 604,570 | 17,992 | |||
CF Industries Holdings (A) | 13,621 | 1,163 | |||
Cliffs Natural Resources (A) | 275,037 | 12,118 | |||
Dow Chemical (A) | 488,502 | 13,571 | |||
E.I. Du Pont de Nemours | 328,666 | 11,365 | |||
Eastman Chemical | 36,200 | 2,176 | |||
Ecolab | 59,000 | 2,650 | |||
FMC | 5,400 | 302 | |||
Freeport-McMoRan Copper & Gold, Cl B (A) | 198,733 | 16,455 | |||
Huntsman | 513,863 | 4,892 | |||
International Flavors & Fragrances | 11,400 | 464 | |||
International Paper | 28,400 | 723 | |||
MeadWestvaco | 52,800 | 1,445 | |||
Monsanto | 81,620 | 6,591 | |||
NewMarket (A) | 26,900 | 2,817 | |||
Newmont Mining | 132,700 | 7,118 | |||
Nucor (A) | 106,200 | 4,504 | |||
Owens-Illinois* | 492,260 | 15,393 | |||
Pactiv* | 338,100 | 8,233 | |||
PPG Industries | 286,550 | 17,030 | |||
Praxair | 117,900 | 9,671 | |||
Rock-Tenn, Cl A (A) | 4,900 | 221 | |||
Scotts Miracle-Gro, Cl A | 50,000 | 1,996 | |||
Sealed Air | 272,934 | 6,084 | |||
Description | Shares | Market Value ($ Thousands) | |||
Sigma-Aldrich (A) | 6,200 | $ | 331 | ||
Solutia* | 50,400 | 543 | |||
Southern Copper (A) | 49,600 | 1,728 | |||
United States Steel (A) | 28,600 | 1,277 | |||
Vulcan Materials (A) | 4,200 | 204 | |||
Weyerhaeuser | 25,700 | 1,001 | |||
WR Grace* | 34,300 | 784 | |||
| 183,252 | |||||
Telecommunication Services — 3.1% | |||||
AT&T | 5,262,332 | 141,767 | |||
CenturyTel (A) | 678,234 | 24,138 | |||
MetroPCS Communications* | 5,800 | 36 | |||
NII Holdings* (A) | 92,221 | 2,748 | |||
Qwest Communications International (A) | 354,300 | 1,293 | |||
Sprint Nextel* (A) | 3,454,940 | 12,818 | |||
Verizon Communications | 1,323,598 | 41,641 | |||
Windstream (A) | 67,313 | 668 | |||
| 225,109 | |||||
Utilities — 2.8% | |||||
AES* | 229,200 | 2,920 | |||
American Electric Power | 96,800 | 3,116 | |||
Centerpoint Energy | 4,800 | 64 | |||
CMS Energy (A) | 281,500 | 4,009 | |||
Consolidated Edison (A) | 43,400 | 1,862 | |||
Constellation Energy Group | 569,340 | 18,117 | |||
Dominion Resources | 86,400 | 3,143 | |||
DPL | 186,870 | 5,019 | |||
DTE Energy (A) | 115,849 | 4,647 | |||
Duke Energy | 52,500 | 876 | |||
Edison International | 114,800 | 3,909 | |||
Energen | 145,388 | 6,324 | |||
Entergy | 2,000 | 157 | |||
Equities (A) | 147,400 | 6,066 | |||
Exelon (A) | 289,772 | 13,961 | |||
FirstEnergy | 472,040 | 20,336 | |||
FPL Group | 348,400 | 18,106 | |||
Mirant* | 25,800 | 367 | |||
NiSource | 634,840 | 9,047 | |||
Northeast Utilities | 89,200 | 2,151 | |||
PG&E (A) | 434,224 | 18,385 | |||
Pinnacle West Capital | 70,900 | 2,488 | |||
PPL | 884,448 | 26,993 | |||
Progress Energy | 29,200 | 1,141 | |||
Public Service Enterprise Group | 410,006 | 12,858 | |||
Questar | 38,600 | 1,531 | |||
SCANA | 2,200 | 77 | |||
Sempra Energy | 85,800 | 4,559 | |||
Southern | 116,100 | 3,726 | |||
TECO Energy (A) | 80,700 | 1,190 | |||
UGI | 29,800 | 700 | |||
Wisconsin Energy | 15,800 | 713 | |||
Xcel Energy (A) | 172,200 | 3,499 | |||
| 202,057 | |||||
Total Common Stock | 6,046,790 | ||||
| 5 | SEI Institutional Investments Trust / Semi-Annual Report / November 30, 2009 |
Table of Contents
SCHEDULE OF INVESTMENTS (Unaudited)
Large Cap Disciplined Equity Fund
November 30, 2009
Description | Shares | Market Value ($ Thousands) | |||
AFFILIATED PARTNERSHIPS — 22.8% | |||||
SEI Liquidity Fund, L.P. 0.320%†** (B) | 856,147,343 | $ | 846,148 | ||
SEI LIBOR Plus Portfolio† | 124,403,038 | 801,156 | |||
Total Affiliated Partnerships | 1,647,304 | ||||
CASH EQUIVALENT — 3.8% | |||||
SEI Daily Income Trust, Prime Obligation Fund, Cl A, | 274,430,379 | 274,430 | |||
Total Cash Equivalent | 274,430 | ||||
U.S. TREASURY OBLIGATIONS (C) (D) — 1.9% | |||||
U.S. Treasury Bills | |||||
0.212%, 12/03/09 | 128,500 | 128,499 | |||
0.290%, 12/17/09 | 700 | 700 | |||
0.071%, 01/07/10 | 2,700 | 2,700 | |||
0.249%, 09/23/10 | 5,145 | 5,137 | |||
Total U.S. Treasury Obligations | 137,036 | ||||
Total Investments - 112.2% | $ | 8,105,560 | |||
A summary of the open futures contracts held by the Fund at November 30, 2009, is as follows:
Type of Contract | Number of Contracts Long (Short) | Expiration Date | Unrealized Appreciation ($ Thousands) | ||||
S&P 500 Composite Index | 4,163 | Dec-2009 | $ | 84,237 | |||
S&P 500 Composite Index | 13 | Dec-2009 | 242 | ||||
S&P 500 E-Mini | 740 | Dec-2009 | 1,818 | ||||
| $ | 86,297 | ||||||
For the year ended November 30, 2009, the total amount of all open futures contracts, as presented in the table above, are representative of the volume of activity for this derivative type during the period.
Percentages are based on a Net Assets of $7,221,501 ($ Thousands).
| (A) | This security or a partial position of this security is on loan at November 30, 2009. The total value of securities on loan at November 30, 2009 was $838,520 ($ Thousands). |
| (B) | This security was purchased with cash collateral held from securities on loan (see Note 11). The total value of such securities on November 30, 2009 was $846,148 ($ Thousands). |
| (C) | The rate reported is the effective yield at time of purchase. |
| * | Non-income producing security. |
| ** | Rate shown is the 7-day effective yield as of November 30, 2009. |
| † | Investment in Affiliated Security. |
| ‡ | Real Estate Investment Trust |
Cl — Class
REIT — Real Estate Investment Trust
LIBOR — London Interbank Offered Rate
L.P. — Limited Partnership
S&P — Standard & Poor’s
| 6 | SEI Institutional Investments Trust / Semi-Annual Report / November 30, 2009 |
Table of Contents
SCHEDULE OF INVESTMENTS (Unaudited)
Large Cap Index Fund
November 30, 2009
Description | Shares | Market Value ($ Thousands) | |||
COMMON STOCK — 98.6% | |||||
Consumer Discretionary — 9.9% | |||||
Aaron’s (A) | 1,800 | $ | 45 | ||
Abercrombie & Fitch, Cl A (A) | 4,302 | 172 | |||
Advance Auto Parts | 4,408 | 173 | |||
Aeropostale* | 3,200 | 101 | |||
Amazon.com* (A) | 15,189 | 2,064 | |||
American Eagle Outfitters | 7,171 | 110 | |||
Apollo Group, Cl A* (A) | 6,264 | 357 | |||
Autoliv (A) | 3,918 | 159 | |||
AutoNation* (A) | 2,832 | 50 | |||
AutoZone* (A) | 1,407 | 208 | |||
Barnes & Noble (A) | 1,238 | 29 | |||
Bed Bath & Beyond* | 12,415 | 464 | |||
Best Buy (A) | 15,147 | 649 | |||
Big Lots* | 3,500 | 81 | |||
Black & Decker (A) | 2,968 | 180 | |||
BorgWarner (A) | 5,382 | 163 | |||
Boyd Gaming* | 1,651 | 14 | |||
Brinker International | 4,483 | 62 | |||
Brink’s Home Security Holdings* | 2,200 | 72 | |||
Burger King Holdings | 5,000 | 85 | |||
Cablevision Systems, Cl A | 10,442 | 261 | |||
Career Education* (A) | 3,259 | 85 | |||
Carmax* (A) | 10,360 | 206 | |||
Carnival | 19,900 | 637 | |||
CBS, Cl B | 27,169 | 348 | |||
Central European Media Enterprises, Cl A* (A) | 1,800 | 45 | |||
Chico’s FAS* | 8,600 | 121 | |||
Chipotle Mexican Grill, Cl A* (A) | 1,500 | 125 | |||
Choice Hotels International (A) | 1,484 | 47 | |||
Clear Channel Outdoor Holdings, Cl A* | 700 | 7 | |||
Coach (A) | 15,067 | 524 | |||
Comcast, Cl A | 130,925 | 1,921 | |||
CTC Media* | 1,100 | 15 | |||
Darden Restaurants | 6,322 | 199 | |||
DeVry | 2,900 | 158 | |||
Dick’s Sporting Goods* | 4,258 | 88 | |||
DIRECTV, Cl A* | 44,429 | 1,405 | |||
Discovery Communications, Cl C* | 12,421 | 348 | |||
DISH Network, Cl A (A) | 9,862 | 204 | |||
Dollar Tree* (A) | 4,153 | 203 | |||
DR Horton | 12,868 | 132 | |||
DreamWorks Animation SKG, Cl A* | 3,434 | 115 | |||
Expedia* (A) | 8,134 | 207 | |||
Family Dollar Stores (A) | 6,462 | 197 | |||
Foot Locker | 6,869 | 65 | |||
Ford Motor* (A) | 141,884 | 1,261 | |||
Fortune Brands | 6,620 | 254 | |||
GameStop, Cl A* (A) | 7,700 | 188 | |||
Gannett | 9,359 | 93 | |||
Gap | 22,859 | 490 | |||
Garmin (A) | 5,300 | 158 | |||
Gentex | 6,132 | 102 | |||
Genuine Parts | 7,071 | 253 | |||
Goodyear Tire & Rubber* | 11,052 | 151 | |||
Guess? (A) | 2,900 | 107 | |||
H&R Block (A) | 15,025 | 305 | |||
Hanesbrands* | 4,143 | 99 | |||
Description | Shares | Market Value ($ Thousands) | |||
Harley-Davidson (A) | 10,803 | $ | 315 | ||
Harman International Industries (A) | 2,768 | 104 | |||
Hasbro | 5,867 | 174 | |||
Hillenbrand | 2,824 | 52 | |||
Home Depot (A) | 77,315 | 2,115 | |||
Interactive Data | 1,900 | 49 | |||
International Game Technology | 13,643 | 258 | |||
International Speedway, Cl A | 1,512 | 41 | |||
Interpublic Group* | 22,775 | 144 | |||
ITT Educational Services* | 1,921 | 175 | |||
J.C. Penney | 9,851 | 283 | |||
Jarden | 4,300 | 118 | |||
John Wiley & Sons, Cl A | 1,842 | 69 | |||
Johnson Controls | 26,845 | 726 | |||
KB Home (A) | 3,380 | 46 | |||
Kohl’s* | 13,719 | 729 | |||
Lamar Advertising, Cl A* (A) | 2,540 | 70 | |||
Las Vegas Sands* (A) | 13,793 | 211 | |||
Leggett & Platt | 7,819 | 152 | |||
Lennar, Cl A | 7,230 | 92 | |||
Liberty Global, Cl A* (A) | 11,871 | 229 | |||
Liberty Media - Capital, Ser A* | 3,492 | 77 | |||
Liberty Media - Interactive, Cl A* | 27,147 | 289 | |||
Liberty Media - Starz* (A) | 2,436 | 117 | |||
Limited Brands (A) | 12,057 | 200 | |||
LKQ* | 5,800 | 101 | |||
Lowe’s | 67,010 | 1,462 | |||
Macy’s | 19,330 | 315 | |||
Marriott International, Cl A (A) | 14,288 | 367 | |||
Marvel Entertainment* | 2,400 | 125 | |||
Mattel (A) | 15,842 | 308 | |||
McDonald’s | 50,380 | 3,187 | |||
McGraw-Hill | 15,039 | 451 | |||
MDC Holdings (A) | 1,516 | 45 | |||
Meredith (A) | 1,358 | 36 | |||
MGM Mirage* (A) | 8,439 | 89 | |||
Mohawk Industries* (A) | 2,266 | 93 | |||
Morningstar* | 900 | 42 | |||
NetFlix* (A) | 2,100 | 123 | |||
New York Times, Cl A (A) | 4,824 | 41 | |||
Newell Rubbermaid (A) | 13,065 | 190 | |||
News, Cl A (A) | 105,785 | 1,212 | |||
NIKE, Cl B (A) | 16,348 | 1,061 | |||
Nordstrom (A) | 7,412 | 248 | |||
NVR* (A) | 224 | 151 | |||
Office Depot* | 14,189 | 87 | |||
Omnicom Group (A) | 14,144 | 519 | |||
O'Reilly Automotive* (A) | 6,240 | 242 | |||
Panera Bread, Cl A* (A) | 1,162 | 73 | |||
Penn National Gaming* (A) | 2,989 | 80 | |||
Penske Auto Group (A) | 1,200 | 18 | |||
PetSmart | 5,273 | 136 | |||
Phillips-Van Heusen | 2,300 | 92 | |||
Polo Ralph Lauren, Cl A (A) | 2,680 | 206 | |||
priceline.com* (A) | 1,900 | 407 | |||
Pulte Homes (A) | 15,545 | 142 | |||
RadioShack | 5,571 | 105 | |||
Regal Entertainment Group, Cl A (A) | 4,188 | 58 | |||
Ross Stores | 5,771 | 254 | |||
Royal Caribbean Cruises* | 5,900 | 145 | |||
Scientific Games, Cl A* (A) | 2,366 | 33 | |||
| 1 | SEI Institutional Investments Trust / Semi-Annual Report / November 30, 2009 |
Table of Contents
SCHEDULE OF INVESTMENTS (Unaudited)
Large Cap Index Fund
November 30, 2009
Description | Shares | Market Value ($ Thousands) | |||
Scripps Networks Interactive, Cl A (A) | 4,072 | $ | 161 | ||
Sears Holdings* (A) | 2,328 | 165 | |||
Service International | 11,194 | 86 | |||
Sherwin-Williams | 4,437 | 270 | |||
Signet Jewelers* | 3,800 | 98 | |||
Snap-On (A) | 2,391 | 87 | |||
Stanley Works (A) | 3,709 | 180 | |||
Staples (A) | 32,364 | 755 | |||
Starbucks* | 33,406 | 732 | |||
Starwood Hotels & Resorts Worldwide | 8,684 | 278 | |||
Strayer Education (A) | 600 | 118 | |||
Target | 34,785 | 1,620 | |||
Thor Industries | 1,900 | 54 | |||
Tiffany (A) | 6,025 | 257 | |||
Time Warner | 55,379 | 1,701 | |||
Time Warner Cable, Cl A (A) | 15,984 | 670 | |||
TJX | 18,654 | 716 | |||
Toll Brothers* (A) | 6,051 | 118 | |||
TRW Automotive Holdings* | 2,793 | 61 | |||
Urban Outfitters* (A) | 5,920 | 187 | |||
VF | 3,917 | 285 | |||
Viacom, Cl B* | 24,469 | 725 | |||
Virgin Media (A) | 13,620 | 224 | |||
WABCO Holdings | 3,424 | 81 | |||
Walt Disney | 85,584 | 2,586 | |||
Warner Music Group* | 662 | 3 | |||
Washington Post, Cl B | 257 | 106 | |||
Weight Watchers International | 1,662 | 46 | |||
Wendy’s, Cl A | 14,000 | 57 | |||
Whirlpool (A) | 3,287 | 244 | |||
Williams-Sonoma (A) | 4,662 | 95 | |||
WMS Industries* | 2,600 | 101 | |||
Wyndham Worldwide | 8,668 | 161 | |||
Wynn Resorts* (A) | 3,096 | 200 | |||
Yum! Brands (A) | 20,848 | 735 | |||
| 49,404 | |||||
Consumer Staples — 10.8% | |||||
Alberto-Culver, Cl B | 3,687 | 104 | |||
Altria Group | 94,168 | 1,771 | |||
Archer-Daniels-Midland | 29,979 | 924 | |||
Avon Products | 19,306 | 661 | |||
BJ’s Wholesale Club* (A) | 2,672 | 93 | |||
Brown-Forman, Cl B | 4,418 | 226 | |||
Bunge (A) | 6,100 | 378 | |||
Campbell Soup | 8,678 | 303 | |||
Central European Distribution* | 2,300 | 64 | |||
Church & Dwight | 3,132 | 185 | |||
Clorox | 6,603 | 398 | |||
Coca-Cola (A) | 105,820 | 6,053 | |||
Coca-Cola Enterprises (A) | 14,215 | 279 | |||
Colgate-Palmolive (A) | 22,775 | 1,917 | |||
ConAgra Foods | 21,186 | 470 | |||
Constellation Brands, Cl A* | 9,131 | 156 | |||
Corn Products International | 3,000 | 84 | |||
Costco Wholesale (A) | 20,181 | 1,209 | |||
CVS Caremark | 66,352 | 2,058 | |||
Dean Foods* | 8,087 | 128 | |||
Del Monte Foods | 8,458 | 89 | |||
Dr Pepper Snapple Group | 11,300 | 296 | |||
Energizer Holdings* | 3,341 | 188 | |||
Description | Shares | Market Value ($ Thousands) | |||
Estee Lauder, Cl A | 4,954 | $ | 232 | ||
Flowers Foods | 3,000 | 69 | |||
General Mills | 14,896 | 1,013 | |||
Green Mountain Coffee Roasters* (A) | 1,700 | 107 | |||
Hansen Natural* | 2,900 | 102 | |||
Herbalife | 3,000 | 126 | |||
Hershey | 6,798 | 240 | |||
HJ Heinz | 14,837 | 630 | |||
Hormel Foods (A) | 3,339 | 125 | |||
JM Smucker | 5,211 | 308 | |||
Kellogg | 11,603 | 610 | |||
Kimberly-Clark | 19,218 | 1,268 | |||
Kraft Foods, Cl A | 67,015 | 1,781 | |||
Kroger | 29,473 | 670 | |||
Lorillard | 7,550 | 588 | |||
McCormick | 5,793 | 207 | |||
Mead Johnson Nutrition, Cl A (A) | 1,800 | 79 | |||
Molson Coors Brewing, Cl B | 5,662 | 256 | |||
NBTY* | 2,600 | 104 | |||
Pepsi Bottling Group | 6,282 | 238 | |||
PepsiAmericas | 2,594 | 77 | |||
PepsiCo | 71,137 | 4,426 | |||
Philip Morris International | 89,568 | 4,308 | |||
Procter & Gamble | 133,274 | 8,310 | |||
Ralcorp Holdings* | 2,600 | 151 | |||
Reynolds American | 8,010 | 400 | |||
Rite Aid* (A) | 19,101 | 24 | |||
Safeway | 20,320 | 457 | |||
Sara Lee | 33,251 | 404 | |||
Smithfield Foods* (A) | 5,975 | 92 | |||
Supervalu | 10,789 | 149 | |||
Sysco | 26,648 | 721 | |||
Tyson Foods, Cl A | 13,965 | 168 | |||
Walgreen | 45,125 | 1,755 | |||
Wal-Mart Stores | 100,979 | 5,508 | |||
Whole Foods Market* (A) | 5,052 | 130 | |||
| 53,867 | |||||
Energy — 11.5% | |||||
Alpha Natural Resources* (A) | 5,168 | 191 | |||
Anadarko Petroleum | 23,140 | 1,378 | |||
Apache | 15,259 | 1,454 | |||
Arch Coal | 7,712 | 161 | |||
Atwood Oceanics* | 2,800 | 106 | |||
Baker Hughes (A) | 14,501 | 591 | |||
BJ Services | 13,588 | 255 | |||
Cabot Oil & Gas | 5,100 | 195 | |||
Cameron International* | 11,444 | 433 | |||
Chesapeake Energy | 29,466 | 705 | |||
Chevron | 91,602 | 7,149 | |||
Cimarex Energy (A) | 4,000 | 187 | |||
CNX Gas* | 800 | 22 | |||
Comstock Resources* | 1,800 | 67 | |||
Concho Resources* | 3,700 | 151 | |||
ConocoPhillips | 67,576 | 3,498 | |||
Consol Energy | 8,244 | 379 | |||
Continental Resources* | 1,600 | 60 | |||
Denbury Resources* (A) | 11,648 | 155 | |||
Devon Energy (A) | 20,513 | 1,382 | |||
Diamond Offshore Drilling (A) | 3,309 | 329 | |||
Dresser-Rand Group* | 3,934 | 110 | |||
El Paso | 33,503 | 320 | |||
| 2 | SEI Institutional Investments Trust / Semi-Annual Report / November 30, 2009 |
Table of Contents
SCHEDULE OF INVESTMENTS (Unaudited)
Large Cap Index Fund
November 30, 2009
Description | Shares | Market Value ($ Thousands) | |||
Encore Acquisition* | 2,300 | $ | 104 | ||
ENSCO International | 6,523 | 287 | |||
EOG Resources | 11,645 | 1,007 | |||
EXCO Resources | 6,800 | 115 | |||
Exterran Holdings* (A) | 2,900 | 61 | |||
Exxon Mobil | 223,212 | 16,757 | |||
FMC Technologies* | 5,660 | 308 | |||
Forest Oil* (A) | 4,914 | 90 | |||
Frontier Oil | 4,600 | 53 | |||
Frontline (A) | 2,200 | 60 | |||
Halliburton | 41,597 | 1,221 | |||
Helix Energy Solutions Group* | 5,300 | 62 | |||
Helmerich & Payne | 5,150 | 193 | |||
Hess | 13,612 | 789 | |||
Holly | 2,000 | 51 | |||
Marathon Oil | 32,976 | 1,076 | |||
Mariner Energy* | 5,200 | 65 | |||
Massey Energy (A) | 3,761 | 142 | |||
Murphy Oil | 9,054 | 511 | |||
Nabors Industries* (A) | 13,100 | 271 | |||
National Oilwell Varco | 18,980 | 817 | |||
Newfield Exploration* | 6,099 | 258 | |||
Noble Energy | 7,862 | 513 | |||
Occidental Petroleum | 36,954 | 2,985 | |||
Oceaneering International* | 2,600 | 142 | |||
Oil States International* | 2,600 | 93 | |||
Overseas Shipholding Group | 727 | 28 | |||
Patterson-UTI Energy | 6,332 | 97 | |||
Peabody Energy | 12,674 | 563 | |||
PetroHawk Energy* (A) | 13,800 | 308 | |||
Pioneer Natural Resources | 5,544 | 229 | |||
Plains Exploration & Production* | 6,491 | 177 | |||
Pride International * | 8,029 | 254 | |||
Quicksilver Resources * (A) | 5,102 | 68 | |||
Range Resources | 7,439 | 351 | |||
Rowan (A) | 5,386 | 133 | |||
SandRidge Energy * (A) | 6,400 | 60 | |||
Schlumberger | 54,600 | 3,488 | |||
SEACOR Holdings * | 900 | 69 | |||
Seahawk Drilling * | 535 | 12 | |||
Smith International | 9,731 | 265 | |||
Southern Union | 5,368 | 111 | |||
Southwestern Energy * | 15,476 | 680 | |||
Spectra Energy | 30,509 | 592 | |||
St. Mary Land & Exploration | 2,700 | 87 | |||
Sunoco | 5,556 | 140 | |||
Superior Energy Services * | 3,500 | 74 | |||
Teekay | 2,100 | 50 | |||
Tesoro (A) | 6,846 | 87 | |||
Tidewater | 2,170 | 98 | |||
Unit * | 1,527 | 57 | |||
Valero Energy | 25,636 | 407 | |||
Walter Industries | 2,400 | 165 | |||
Whiting Petroleum * | 2,400 | 149 | |||
Williams | 27,446 | 546 | |||
XTO Energy | 26,988 | 1,145 | |||
| 57,799 | |||||
Financials — 14.6% | |||||
Affiliated Managers Group * | 1,733 | 113 | |||
Aflac | 21,156 | 974 | |||
Alexandria Real Estate Equities ‡ (A) | 2,000 | 113 | |||
Description | Shares | Market Value ($ Thousands) | |||
Alleghany* | 238 | $ | 64 | ||
Allied World Assurance Holdings | 2,000 | 96 | |||
Allstate | 25,225 | 717 | |||
AMB Property‡ (A) | 6,644 | 156 | |||
American Express | 46,234 | 1,934 | |||
American Financial Group | 4,214 | 102 | |||
American International Group* (A) | 6,023 | 171 | |||
American National Insurance | 722 | 78 | |||
AmeriCredit* (A) | 3,372 | 62 | |||
Ameriprise Financial | 12,200 | 465 | |||
Annaly Capital Management‡ | 25,811 | 475 | |||
AON | 13,150 | 509 | |||
Apartment Investment & Management, Cl A‡ (A) | 4,399 | 59 | |||
Arch Capital Group* | 2,400 | 168 | |||
Arthur J Gallagher | 4,804 | 108 | |||
Aspen Insurance Holdings | 3,700 | 96 | |||
Associated Banc (A) | 5,184 | 59 | |||
Assurant | 5,193 | 159 | |||
AvalonBay Communities‡ (A) | 3,541 | 256 | |||
Axis Capital Holdings | 6,400 | 179 | |||
Bancorpsouth (A) | 3,600 | 83 | |||
Bank of America | 395,318 | 6,266 | |||
Bank of Hawaii (A) | 1,982 | 90 | |||
Bank of New York Mellon | 54,309 | 1,447 | |||
BB&T | 32,206 | 802 | |||
BlackRock, Cl A | 885 | 201 | |||
BOK Financial (A) | 775 | 36 | |||
Boston Properties‡ (A) | 6,284 | 421 | |||
Brandywine Realty Trust‡ | 6,600 | 65 | |||
BRE Properties‡ | 2,020 | 63 | |||
Brown & Brown (A) | 4,724 | 84 | |||
Camden Property Trust‡ | 3,247 | 126 | |||
Capital One Financial | 20,425 | 784 | |||
CapitalSource | 11,382 | 42 | |||
Capitol Federal Financial (A) | 1,027 | 30 | |||
CB Richard Ellis Group, Cl A* (A) | 10,217 | 117 | |||
Charles Schwab (A) | 42,885 | 786 | |||
Chimera Investment‡ | 32,100 | 129 | |||
Chubb (A) | 15,918 | 798 | |||
Cincinnati Financial | 6,786 | 173 | |||
Citigroup | 692,745 | 2,847 | |||
City National (A) | 1,738 | 69 | |||
CME Group, Cl A | 3,074 | 1,009 | |||
CNA Financial* (A) | 700 | 16 | |||
Comerica | 7,053 | 201 | |||
Commerce Bancshares | 2,619 | 105 | |||
Corporate Office Properties Trust‡ | 2,800 | 96 | |||
Cullen/Frost Bankers | 2,368 | 114 | |||
Digital Realty Trust‡ (A) | 3,600 | 175 | |||
Discover Financial Services | 24,489 | 379 | |||
Douglas Emmett‡ (A) | 5,400 | 74 | |||
Duke Realty‡ (A) | 10,909 | 122 | |||
Eaton Vance (A) | 5,310 | 160 | |||
Endurance Specialty Holdings (A) | 2,200 | 82 | |||
Equity Residential‡ | 13,087 | 421 | |||
Erie Indemnity, Cl A | 1,119 | 41 | |||
Essex Property Trust‡ | 1,069 | 85 | |||
Everest Re Group | 2,700 | 230 | |||
Federal Realty Investment Trust ‡ (A) | 2,796 | 180 | |||
Federated Investors, Cl B (A) | 3,658 | 94 | |||
Fidelity National Financial, Cl A | 10,604 | 147 | |||
| 3 | SEI Institutional Investments Trust / Semi-Annual Report / November 30, 2009 |
Table of Contents
SCHEDULE OF INVESTMENTS (Unaudited)
Large Cap Index Fund
November 30, 2009
Description | Shares | Market Value ($ Thousands) | |||
Fifth Third Bancorp | 37,982 | $ | 383 | ||
First American (A) | 4,584 | 145 | |||
First Citizens BancShares, Cl A | 200 | 31 | |||
First Horizon National* | 10,855 | 147 | |||
First Niagara Financial Group | 9,400 | 124 | |||
Forest City Enterprises, Cl A (A) | 5,142 | 55 | |||
Franklin Resources | 6,803 | 735 | |||
Fulton Financial (A) | 8,095 | 70 | |||
Genworth Financial, Cl A* (A) | 23,292 | 251 | |||
GLG Partners (A) | 10,000 | 29 | |||
Goldman Sachs Group | 22,975 | 3,898 | |||
Greenhill | 800 | 65 | |||
Hanover Insurance Group | 2,193 | 91 | |||
Hartford Financial Services Group | 14,510 | 355 | |||
HCC Insurance Holdings (A) | 4,641 | 121 | |||
HCP ‡ (A) | 13,374 | 419 | |||
Health Care REIT‡ (A) | 5,783 | 258 | |||
Hospitality Properties Trust‡ | 5,966 | 116 | |||
Host Hotels & Resorts‡ (A) | 26,800 | 282 | |||
HRPT Properties Trust‡ | 11,302 | 69 | |||
Hudson City Bancorp | 21,328 | 283 | |||
Huntington Bancshares | 34,934 | 133 | |||
Interactive Brokers Group, Cl A* | 2,200 | 37 | |||
IntercontinentalExchange* (A) | 3,500 | 374 | |||
Invesco | 19,800 | 441 | |||
Investment Technology Group* | 1,500 | 27 | |||
Janus Capital Group | 7,265 | 95 | |||
Jefferies Group (A) | 5,414 | 127 | |||
Jones Lang LaSalle | 2,100 | 107 | |||
JPMorgan Chase | 171,834 | 7,301 | |||
Keycorp (A) | 40,695 | 238 | |||
Kimco Realty‡ | 16,944 | 209 | |||
Lazard, Cl A (A) | 3,800 | 147 | |||
Legg Mason (A) | 7,681 | 217 | |||
Leucadia National (A) | 8,420 | 181 | |||
Liberty Property Trust‡ | 5,006 | 148 | |||
Lincoln National | 13,788 | 316 | |||
Loews | 15,536 | 550 | |||
M&T Bank (A) | 3,583 | 235 | |||
Macerich‡ (A) | 4,742 | 141 | |||
Mack-Cali Realty‡ | 3,798 | 117 | |||
Markel* | 450 | 153 | |||
Marsh & McLennan | 24,665 | 556 | |||
Marshall & Ilsley | 25,860 | 149 | |||
MBIA* (A) | 4,859 | 17 | |||
Mercury General | 1,196 | 44 | |||
MetLife | 26,109 | 893 | |||
Moody’s (A) | 8,627 | 201 | |||
Morgan Stanley | 62,778 | 1,983 | |||
MSCI, Cl A* | 4,700 | 143 | |||
NASDAQ OMX Group* | 6,700 | 125 | |||
Nationwide Health Properties‡ | 4,900 | 167 | |||
New York Community Bancorp (A) | 16,072 | 188 | |||
Northern Trust (A) | 11,405 | 565 | |||
NYSE Euronext | 11,800 | 299 | |||
Old Republic International (A) | 11,490 | 122 | |||
OneBeacon Insurance Group, Cl A | 1,100 | 15 | |||
PartnerRe | 2,500 | 193 | |||
People’s United Financial | 15,334 | 250 | |||
Plum Creek Timber‡ (A) | 7,221 | 249 | |||
PNC Financial Services Group | 20,922 | 1,193 | |||
Popular (A) | 29,530 | 70 | |||
Principal Financial Group | 14,818 | 376 | |||
Description | Shares | Market Value ($ Thousands) | |||
Progressive (A) | 32,280 | $ | 541 | ||
ProLogis‡ | 19,888 | 260 | |||
Protective Life | 3,309 | 55 | |||
Prudential Financial | 21,463 | 1,070 | |||
Public Storage‡ (A) | 6,368 | 507 | |||
Raymond James Financial (A) | 4,221 | 103 | |||
Rayonier‡ (A) | 3,503 | 139 | |||
Realty Income‡ (A) | 4,600 | 116 | |||
Regency Centers‡ | 3,808 | 127 | |||
Regions Financial (A) | 51,487 | 302 | |||
Reinsurance Group of America, Cl A | 3,199 | 149 | |||
RenaissanceRe Holdings | 2,900 | 154 | |||
SEI (C) | 5,642 | 99 | |||
Senior Housing Properties Trust‡ | 5,400 | 112 | |||
Simon Property Group‡ (A) | 10,792 | 784 | |||
SL Green Realty‡ (A) | 3,668 | 163 | |||
SLM* (A) | 20,814 | 228 | |||
St. Joe* (A) | 3,761 | 93 | |||
StanCorp Financial Group | 2,042 | 76 | |||
State Street | 22,394 | 925 | |||
Student Loan | 102 | 5 | |||
SunTrust Banks (A) | 23,646 | 559 | |||
Synovus Financial | 19,972 | 39 | |||
T. Rowe Price Group (A) | 12,080 | 591 | |||
Taubman Centers‡ (A) | 2,200 | 76 | |||
TCF Financial (A) | 6,301 | 83 | |||
TD Ameritrade Holding* | 11,645 | 229 | |||
TFS Financial | 3,700 | 41 | |||
Torchmark | 3,750 | 163 | |||
Transatlantic Holdings | 1,355 | 73 | |||
Travelers | 24,844 | 1,302 | |||
UDR‡ | 7,393 | 111 | |||
Unitrin | 1,260 | 28 | |||
Unum Group | 14,705 | 280 | |||
US Bancorp | 87,643 | 2,115 | |||
Validus Holdings | 4,600 | 122 | |||
Valley National Bancorp (A) | 5,730 | 76 | |||
Ventas‡ | 6,944 | 298 | |||
Vornado Realty Trust‡ (A) | 7,268 | 476 | |||
Waddell & Reed Financial, Cl A | 4,100 | 119 | |||
Washington Federal (A) | 4,563 | 87 | |||
Weingarten Realty Investors ‡ (A) | 4,467 | 87 | |||
Wells Fargo (A) | 217,366 | 6,095 | |||
Wesco Financial | 41 | 14 | |||
White Mountains Insurance Group | 347 | 113 | |||
Whitney Holding (A) | 5,557 | 45 | |||
Wilmington Trust (A) | 2,292 | 28 | |||
WR Berkley (A) | 5,614 | 139 | |||
XL Capital, Cl A | 15,400 | 282 | |||
Zions Bancorporation (A) | 6,102 | 80 | |||
| 73,081 | |||||
Health Care — 12.4% | |||||
Abbott Laboratories | 70,576 | 3,846 | |||
Abraxis Bioscience* | 340 | 11 | |||
Aetna | 20,134 | 586 | |||
Alexion Pharmaceuticals * | 3,800 | 172 | |||
Allergan | 13,796 | 802 | |||
Allscripts-Misys Healthcare | |||||
Solutions* (A) | 2,400 | 46 | |||
AmerisourceBergen | 13,424 | 331 | |||
Amgen* | 46,667 | 2,630 | |||
| 4 | SEI Institutional Investments Trust / Semi-Annual Report / November 30, 2009 |
Table of Contents
SCHEDULE OF INVESTMENTS (Unaudited)
Large Cap Index Fund
November 30, 2009
Description | Shares | Market Value ($ Thousands) | |||
Amylin Pharmaceuticals* (A) | 5,800 | $ | 83 | ||
Baxter International | 27,975 | 1,526 | |||
Beckman Coulter | 3,212 | 209 | |||
Becton Dickinson | 10,844 | 811 | |||
Biogen Idec* | 13,600 | 638 | |||
BioMarin Pharmaceutical* (A) | 4,100 | 68 | |||
Bio-Rad Laboratories, Cl A* | 1,000 | 97 | |||
Boston Scientific* | 70,939 | 594 | |||
Bristol-Myers Squibb | 90,313 | 2,286 | |||
Brookdale Senior Living (A) | 2,500 | 39 | |||
C.R. Bard | 4,385 | 361 | |||
Cardinal Health | 16,129 | 520 | |||
CareFusion* | 7,864 | 203 | |||
Celgene* | 20,892 | 1,159 | |||
Cephalon* (A) | 3,348 | 184 | |||
Cerner* (A) | 3,074 | 232 | |||
Charles River Laboratories International* | 2,843 | 91 | |||
CIGNA | 12,455 | 400 | |||
Community Health Systems* | 4,062 | 124 | |||
Cooper (A) | 1,604 | 54 | |||
Covance* | 3,036 | 161 | |||
Coventry Health Care* | 6,262 | 141 | |||
DaVita* | 4,708 | 279 | |||
Dendreon* (A) | 5,500 | 150 | |||
Dentsply International (A) | 6,898 | 230 | |||
Edwards Lifesciences* | 2,607 | 215 | |||
Eli Lilly (A) | 46,161 | 1,695 | |||
Emdeon, Cl A* | 1,900 | 29 | |||
Endo Pharmaceuticals Holdings* | 4,797 | 106 | |||
Express Scripts* | 12,422 | 1,066 | |||
Forest Laboratories* | 14,373 | 441 | |||
Gen-Probe* | 2,227 | 93 | |||
Genzyme* | 12,153 | 616 | |||
Gilead Sciences* | 41,850 | 1,927 | |||
Health Management Associates, Cl A* (A) | 12,422 | 76 | |||
Health Net* | 4,702 | 100 | |||
Henry Schein* | 4,184 | 208 | |||
Hill-Rom Holdings | 2,724 | 60 | |||
Hologic* | 12,000 | 174 | |||
Hospira* (A) | 7,081 | 332 | |||
Humana* | 7,475 | 310 | |||
Idexx Laboratories* (A) | 2,552 | 128 | |||
Illumina* | 5,700 | 165 | |||
IMS Health | 8,861 | 189 | |||
Intuitive Surgical* (A) | 1,700 | 477 | |||
Inverness Medical Innovations* (A) | 3,600 | 151 | |||
Johnson & Johnson | 126,009 | 7,918 | |||
Kinetic Concepts* (A) | 2,413 | 81 | |||
King Pharmaceuticals* (A) | 10,126 | 120 | |||
Laboratory Corp of America Holdings* | 5,211 | 380 | |||
Life Technologies* | 8,370 | 417 | |||
LifePoint Hospitals* | 2,376 | 69 | |||
Lincare Holdings* | 3,027 | 108 | |||
McKesson | 12,266 | 761 | |||
Medco Health Solutions* | 21,920 | 1,385 | |||
Mednax* | 2,000 | 112 | |||
Medtronic | 50,985 | 2,164 | |||
Merck | 139,343 | 5,046 | |||
Mettler Toledo International* | 1,536 | 153 | |||
Description | Shares | Market Value ($ Thousands) | |||
Millipore* | 2,586 | $ | 176 | ||
Mylan Laboratories* (A) | 14,119 | 252 | |||
Myriad Genetics* | 4,500 | 104 | |||
Omnicare | 5,431 | 126 | |||
OSI Pharmaceuticals* | 2,600 | 87 | |||
Patterson* | 4,783 | 123 | |||
PerkinElmer | 4,834 | 91 | |||
Perrigo (A) | 3,800 | 153 | |||
Pfizer | 368,480 | 6,695 | |||
Pharmaceutical Product Development | 4,284 | 92 | |||
Quest Diagnostics | 7,444 | 431 | |||
ResMed* | 3,555 | 179 | |||
St. Jude Medical* | 16,346 | 600 | |||
Stryker | 15,304 | 771 | |||
Techne | 1,541 | 104 | |||
Teleflex | 1,640 | 85 | |||
Tenet Healthcare* | 23,094 | 105 | |||
Thermo Fisher Scientific* | 18,925 | 894 | |||
United Therapeutics* | 2,200 | 100 | |||
UnitedHealth Group | 54,129 | 1,552 | |||
Universal Health Services, Cl B | 2,188 | 122 | |||
Valeant Pharmaceuticals International* (A) | 3,400 | 111 | |||
Varian Medical Systems* | 5,630 | 263 | |||
VCA Antech* (A) | 3,539 | 80 | |||
Vertex Pharmaceuticals* (A) | 7,600 | 295 | |||
Waters* | 4,472 | 263 | |||
Watson Pharmaceuticals* (A) | 4,918 | 182 | |||
WellPoint* | 22,531 | 1,217 | |||
Zimmer Holdings* | 9,725 | 575 | |||
| 62,164 | |||||
Industrials — 10.2% | |||||
3M | 31,646 | 2,451 | |||
Aecom Technology* | 3,900 | 99 | |||
AGCO* | 3,800 | 115 | |||
Alexander & Baldwin (A) | 1,782 | 54 | |||
Alliant Techsystems* (A) | 1,336 | 115 | |||
Ametek | 5,047 | 185 | |||
AMR* (A) | 17,086 | 103 | |||
Armstrong World Industries* | 700 | 29 | |||
Avery Dennison | 5,310 | 199 | |||
BE Aerospace* | 3,600 | 69 | |||
Boeing | 33,091 | 1,734 | |||
Brink’s | 1,800 | 40 | |||
Bucyrus International, Cl A (A) | 3,600 | 186 | |||
Burlington Northern Santa Fe | 11,898 | 1,170 | |||
C.H. Robinson Worldwide (A) | 8,086 | 451 | |||
Carlisle | 2,666 | 86 | |||
Caterpillar (A) | 27,388 | 1,599 | |||
Cintas | 6,157 | 173 | |||
Continental Airlines, Cl B* (A) | 6,800 | 97 | |||
Con-way | 2,223 | 67 | |||
Copa Holdings, Cl A (A) | 1,100 | 55 | |||
Copart* | 3,213 | 104 | |||
Corrections of America* | 5,600 | 140 | |||
Covanta Holding* (A) | 6,200 | 106 | |||
Crane | 2,400 | 67 | |||
CSX | 17,732 | 842 | |||
Cummins | 9,612 | 432 | |||
Danaher | 11,651 | 826 | |||
Deere | 19,118 | 1,023 | |||
| 5 | SEI Institutional Investments Trust / Semi-Annual Report / November 30, 2009 |
Table of Contents
SCHEDULE OF INVESTMENTS (Unaudited)
Large Cap Index Fund
November 30, 2009
Description | Shares | Market Value ($ Thousands) | |||
Delta Air Lines* | 35,500 | $ | 291 | ||
Donaldson | 3,772 | 160 | |||
Dover | 8,257 | 338 | |||
Dun & Bradstreet | 2,456 | 193 | |||
Eaton | 7,826 | 500 | |||
Emerson Electric | 34,120 | 1,413 | |||
Equifax | 6,156 | 176 | |||
Expeditors International Washington (A) | 10,148 | 324 | |||
Fastenal (A) | 5,862 | 217 | |||
FedEx | 14,144 | 1,194 | |||
First Solar* (A) | 2,300 | 274 | |||
Flowserve | 2,600 | 259 | |||
Fluor (A) | 8,508 | 361 | |||
FTI Consulting* (A) | 2,400 | 111 | |||
Gardner Denver | 2,300 | 86 | |||
GATX (A) | 2,100 | 61 | |||
General Cable* (A) | 2,500 | 73 | |||
General Dynamics | 15,672 | 1,033 | |||
General Electric | 484,023 | 7,754 | |||
Goodrich | 5,492 | 326 | |||
Graco (A) | 2,624 | 74 | |||
Harsco | 3,470 | 108 | |||
Hertz Global Holdings* (A) | 7,200 | 71 | |||
Honeywell International | 33,790 | 1,300 | |||
Hubbell, Cl B | 2,292 | 104 | |||
IDEX | 3,593 | 107 | |||
IHS, Cl A* | 2,200 | 111 | |||
Illinois Tool Works | 20,380 | 991 | |||
Iron Mountain* (A) | 7,963 | 191 | |||
ITT | 8,602 | 445 | |||
Jacobs Engineering Group* | 5,502 | 193 | |||
JB Hunt Transport Services (A) | 3,972 | 126 | |||
Joy Global | 4,633 | 248 | |||
Kansas City Southern* | 3,700 | 106 | |||
KBR | 7,284 | 136 | |||
Kennametal | 3,300 | 74 | |||
Kirby* | 2,300 | 77 | |||
L-3 Communications Holdings, Cl 3 | 5,577 | 437 | |||
Landstar System | 2,165 | 81 | |||
Lennox International | 2,300 | 85 | |||
Lincoln Electric Holdings (A) | 1,700 | 87 | |||
Lockheed Martin | 14,429 | 1,114 | |||
Manitowoc (A) | 5,700 | 56 | |||
Manpower | 3,684 | 182 | |||
Masco | 16,009 | 218 | |||
McDermott International* | 10,200 | 213 | |||
Monster Worldwide* | 5,218 | 76 | |||
MSC Industrial Direct, Cl A (A) | 2,120 | 97 | |||
Navistar International* | 3,000 | 99 | |||
Norfolk Southern | 16,633 | 855 | |||
Northrop Grumman | 14,578 | 799 | |||
Oshkosh Truck (A) | 4,259 | 169 | |||
Owens Corning* (A) | 4,200 | 99 | |||
Paccar (A) | 16,470 | 611 | |||
Pall | 5,545 | 177 | |||
Parker Hannifin (A) | 7,604 | 410 | |||
Pentair | 4,061 | 122 | |||
Pitney Bowes | 9,185 | 212 | |||
Precision Castparts | 6,346 | 658 | |||
Quanta Services* | 9,200 | 172 | |||
Raytheon (A) | 17,868 | 921 | |||
Description | Shares | Market Value ($ Thousands) | |||
Republic Services, Cl A | 15,342 | $ | 433 | ||
Robert Half International | 6,876 | 154 | |||
Rockwell Automation | 6,504 | 283 | |||
Rockwell Collins | 7,562 | 404 | |||
Roper Industries | 4,200 | 219 | |||
RR Donnelley & Sons | 9,677 | 199 | |||
Ryder System | 2,306 | 93 | |||
Shaw Group* | 3,500 | 100 | |||
Southwest Airlines | 32,920 | 303 | |||
Spirit Aerosystems Holdings, Cl A* (A) | 4,700 | 86 | |||
SPX | 2,211 | 118 | |||
Stericycle* | 3,826 | 209 | |||
SunPower, Cl A* (A) | 4,400 | 91 | |||
Terex* | 4,248 | 80 | |||
Textron (A) | 13,222 | 265 | |||
Thomas & Betts* | 2,067 | 75 | |||
Timken | 4,260 | 105 | |||
Toro (A) | 1,560 | 62 | |||
TransDigm Group | 1,500 | 65 | |||
Trinity Industries (A) | 3,500 | 66 | |||
Union Pacific | 22,916 | 1,450 | |||
United Parcel Service, Cl B | 31,941 | 1,835 | |||
United Technologies | 38,566 | 2,593 | |||
URS* | 3,500 | 145 | |||
USG* (A) | 2,298 | 32 | |||
UTi Worldwide | 5,100 | 67 | |||
Valmont Industries | 1,000 | 77 | |||
Wabtec (A) | 2,400 | 92 | |||
Waste Connections* | 3,900 | 127 | |||
Waste Management | 22,194 | 729 | |||
WESCO International* | 2,000 | 52 | |||
WW Grainger (A) | 2,781 | 272 | |||
| 51,054 | |||||
Information Technology — 18.4% | |||||
Activision Blizzard* | 26,756 | 305 | |||
Adobe Systems* (A) | 23,702 | 831 | |||
Advanced Micro Devices* (A) | 23,634 | 166 | |||
Affiliated Computer Services, Cl A* | 4,447 | 246 | |||
Agilent Technologies* | 16,264 | 470 | |||
Akamai Technologies* (A) | 8,118 | 195 | |||
Alliance Data Systems* (A) | 2,612 | 159 | |||
Altera (A) | 13,073 | 275 | |||
Amdocs* | 8,900 | 235 | |||
Amphenol, Cl A | 7,892 | 325 | |||
Analog Devices | 13,912 | 417 | |||
Ansys* | 4,100 | 160 | |||
Apple* | 40,823 | 8,161 | |||
Applied Materials | 60,055 | 739 | |||
Arrow Electronics* | 5,089 | 134 | |||
Atmel* | 18,900 | 75 | |||
Autodesk* | 10,137 | 238 | |||
Automatic Data Processing (A) | 23,392 | 1,016 | |||
Avnet* | 6,410 | 175 | |||
AVX | 1,424 | 17 | |||
BMC Software* | 8,189 | 317 | |||
Broadcom, Cl A* (A) | 22,168 | 647 | |||
Broadridge Financial Solutions | 5,873 | 129 | |||
Brocade Communications Systems* | 17,600 | 125 | |||
CA (A) | 18,738 | 414 | |||
| 6 | SEI Institutional Investments Trust / Semi-Annual Report / November 30, 2009 |
Table of Contents
SCHEDULE OF INVESTMENTS (Unaudited)
Large Cap Index Fund
November 30, 2009
Description | Shares | Market Value ($ Thousands) | |||
Cadence Design Systems* (A) | 13,063 | $ | 78 | ||
Ciena* (A) | 4,114 | 50 | |||
Cisco Systems* | 263,527 | 6,166 | |||
Citrix Systems* | 7,987 | 305 | |||
Cognizant Technology Solutions, Cl A* | 13,788 | 606 | |||
CommScope* | 3,900 | 98 | |||
Computer Sciences* | 7,264 | 402 | |||
Compuware* | 11,951 | 83 | |||
Convergys* | 3,469 | 39 | |||
Corning | 70,558 | 1,177 | |||
Cree* (A) | 5,022 | 240 | |||
Cypress Semiconductor* (A) | 7,200 | 69 | |||
Dell* | 79,643 | 1,124 | |||
Diebold | 2,729 | 69 | |||
Dolby Laboratories, Cl A* (A) | 2,143 | 96 | |||
DST Systems* | 1,695 | 72 | |||
eBay* | 52,011 | 1,273 | |||
EchoStar, Cl A* | 2,132 | 41 | |||
Electronic Arts* | 14,265 | 241 | |||
EMC* (A) | 91,564 | 1,541 | |||
Equinix* (A) | 1,700 | 163 | |||
F5 Networks* | 3,738 | 176 | |||
Factset Research Systems (A) | 1,800 | 130 | |||
Fairchild Semiconductor International, Cl A* | 6,600 | 53 | |||
Fidelity National Information Services | 15,690 | 355 | |||
Fiserv* | 7,469 | 345 | |||
FLIR Systems* | 6,800 | 195 | |||
Genpact* | 3,100 | 40 | |||
Global Payments | 3,734 | 191 | |||
Google, Cl A* | 10,944 | 6,380 | |||
Harris | 6,189 | 272 | |||
Hewitt Associates, Cl A* | 3,863 | 155 | |||
Hewlett-Packard | 109,301 | 5,362 | |||
IAC* | 5,132 | 100 | |||
Ingram Micro, Cl A* | 7,023 | 119 | |||
Integrated Device Technology* | 5,600 | 32 | |||
Intel | 255,158 | 4,899 | |||
International Business Machines | 60,398 | 7,631 | |||
International Rectifier* | 3,355 | 63 | |||
Intersil, Cl A | 5,361 | 69 | |||
Intuit* (A) | 15,386 | 449 | |||
Itron* | 1,900 | 116 | |||
Jabil Circuit | 9,174 | 122 | |||
JDS Uniphase* | 10,640 | 79 | |||
Juniper Networks* (A) | 23,525 | 615 | |||
Kla-Tencor (A) | 7,809 | 244 | |||
Lam Research* (A) | 5,891 | 200 | |||
Lender Processing Services | 4,014 | 168 | |||
Lexmark International, Cl A* | 3,986 | 100 | |||
Linear Technology (A) | 9,857 | 266 | |||
LSI* | 31,948 | 169 | |||
Marvell Technology Group* | 24,500 | 378 | |||
Mastercard, Cl A (A) | 3,900 | 939 | |||
Maxim Integrated Products (A) | 13,600 | 239 | |||
McAfee* (A) | 6,873 | 262 | |||
MEMC Electronic Materials* | 10,338 | 125 | |||
Microchip Technology (A) | 8,422 | 221 | |||
Micron Technology* (A) | 37,816 | 284 | |||
Micros Systems* | 3,600 | 101 | |||
Microsoft | 352,400 | 10,364 | |||
Description | Shares | Market Value ($ Thousands) | |||
Molex (A) | 6,370 | $ | 119 | ||
Motorola | 103,734 | 831 | |||
National Instruments | 2,536 | 72 | |||
National Semiconductor (A) | 9,656 | 141 | |||
NCR* | 6,689 | 63 | |||
NetApp* (A) | 15,855 | 489 | |||
NeuStar, Cl A* | 2,700 | 63 | |||
Novell* | 15,326 | 60 | |||
Novellus Systems* | 4,377 | 91 | |||
Nuance Communications* | 10,000 | 152 | |||
Nvidia* | 26,056 | 340 | |||
ON Semiconductor* (A) | 19,200 | 149 | |||
Oracle | 174,467 | 3,852 | |||
Paychex (A) | 15,307 | 480 | |||
PMC - Sierra* | 8,700 | 69 | |||
QLogic* (A) | 5,980 | 107 | |||
Qualcomm | 75,550 | 3,400 | |||
Rambus* (A) | 4,500 | 80 | |||
Red Hat* (A) | 8,527 | 228 | |||
Rovi* (A) | 4,800 | 143 | |||
SAIC* | 9,700 | 173 | |||
Salesforce.com* | 4,838 | 303 | |||
SanDisk* | 10,543 | 208 | |||
Seagate Technology | 22,600 | 342 | |||
Silicon Laboratories* (A) | 2,200 | 93 | |||
Sohu.com* | 1,400 | 78 | |||
Sun Microsystems* | 32,969 | 281 | |||
Sybase* (A) | 3,900 | 157 | |||
Symantec* | 37,048 | 658 | |||
Synopsys* | 6,882 | 155 | |||
Tech Data* | 2,250 | 95 | |||
Tellabs* | 16,789 | 94 | |||
Teradata* | 7,989 | 234 | |||
Teradyne* (A) | 8,863 | 79 | |||
Texas Instruments | 57,908 | 1,465 | |||
Total System Services | 6,691 | 116 | |||
Trimble Navigation* | 4,914 | 110 | |||
Varian Semiconductor Equipment Associates* | 3,200 | 93 | |||
VeriSign* (A) | 8,985 | 202 | |||
Visa, Cl A (A) | 20,800 | 1,685 | |||
Vishay Intertechnology* (A) | 9,550 | 69 | |||
VMware, Cl A* | 2,500 | 105 | |||
WebMD Health, Cl A* (A) | 2,422 | 88 | |||
Western Digital* | 10,630 | 392 | |||
Western Union | 33,128 | 611 | |||
Xerox (A) | 41,251 | 318 | |||
Xilinx (A) | 12,157 | 275 | |||
Yahoo!* | 55,481 | 830 | |||
Zebra Technologies, Cl A* | 3,025 | 80 | |||
| 92,230 | |||||
Materials — 4.0% | |||||
Air Products & Chemicals | 9,494 | 787 | |||
Airgas | 4,015 | 186 | |||
AK Steel Holding | 5,300 | 106 | |||
Albemarle | 3,744 | 126 | |||
Alcoa | 44,202 | 553 | |||
Allegheny Technologies | 4,097 | 139 | |||
Aptargroup | 2,800 | 101 | |||
Ashland | 3,476 | 125 | |||
Ball | 4,575 | 226 | |||
Bemis | 4,774 | 140 | |||
| 7 | SEI Institutional Investments Trust / Semi-Annual Report / November 30, 2009 |
Table of Contents
SCHEDULE OF INVESTMENTS (Unaudited)
Large Cap Index Fund
November 30, 2009
Description | Shares | Market Value ($ Thousands) | |||
Cabot | 3,373 | $ | 77 | ||
Carpenter Technology | 2,300 | 53 | |||
Celanese, Cl A | 6,483 | 193 | |||
CF Industries Holdings (A) | 1,900 | 162 | |||
Cliffs Natural Resources (A) | 6,400 | 282 | |||
Commercial Metals | 4,900 | 78 | |||
Compass Minerals International | 1,600 | 104 | |||
Crown Holdings* | 7,451 | 187 | |||
Cytec Industries | 2,381 | 81 | |||
Dow Chemical (A) | 50,570 | 1,405 | |||
E.I. Du Pont de Nemours (A) | 41,792 | 1,445 | |||
Eagle Materials (A) | 2,000 | 54 | |||
Eastman Chemical | 3,142 | 189 | |||
Ecolab | 10,791 | 485 | |||
FMC | 3,460 | 194 | |||
Freeport-McMoRan Copper & Gold, Cl B (A) | 18,712 | 1,549 | |||
Greif, Cl A | 1,500 | 84 | |||
Huntsman | 8,329 | 79 | |||
International Flavors & Fragrances | 3,291 | 134 | |||
International Paper | 20,555 | 523 | |||
Intrepid Potash* (A) | 1,500 | 46 | |||
Lubrizol | 3,234 | 234 | |||
Martin Marietta Materials (A) | 1,963 | 167 | |||
MeadWestvaco | 8,258 | 226 | |||
Monsanto | 24,850 | 2,007 | |||
Mosaic | 7,578 | 413 | |||
Nalco Holding | 5,917 | 145 | |||
Newmont Mining | 21,733 | 1,166 | |||
Nucor | 14,790 | 627 | |||
Owens-Illinois* | 7,791 | 244 | |||
Packaging of America | 4,599 | 92 | |||
Pactiv* | 6,183 | 151 | |||
PPG Industries | 7,823 | 465 | |||
Praxair | 13,925 | 1,142 | |||
Reliance Steel & Aluminum | 2,900 | 119 | |||
Royal Gold (A) | 1,400 | 75 | |||
RPM International | 6,269 | 123 | |||
Schnitzer Steel Industries, Cl A | 1,000 | 45 | |||
Scotts Miracle-Gro, Cl A | 1,806 | 72 | |||
Sealed Air | 7,768 | 173 | |||
Sigma-Aldrich (A) | 5,348 | 285 | |||
Sonoco Products | 4,046 | 114 | |||
Southern Copper (A) | 7,848 | 274 | |||
Steel Dynamics | 10,100 | 171 | |||
Temple-Inland (A) | 4,075 | 73 | |||
Terra Industries | 4,900 | 189 | |||
Titanium Metals | 3,358 | 33 | |||
United States Steel (A) | 6,583 | 294 | |||
Valspar (A) | 4,764 | 125 | |||
Vulcan Materials | 5,757 | 279 | |||
Weyerhaeuser (A) | 10,078 | 393 | |||
| 19,809 | |||||
Telecommunication Services — 3.0% | |||||
American Tower, Cl A* | 17,922 | 734 | |||
AT&T | 269,633 | 7,264 | |||
CenturyTel | 13,275 | 472 | |||
Clearwire, Cl A* (A) | 2,500 | 14 | |||
Crown Castle International* | 13,796 | 506 | |||
Frontier Communications (A) | 12,955 | 102 | |||
Leap Wireless International* (A) | 2,900 | 42 | |||
Description | Shares | Market Value ($ Thousands) | |||
Level 3 Communications* (A) | 67,400 | $ | 84 | ||
MetroPCS Communications* (A) | 11,800 | 74 | |||
NII Holdings* | 7,720 | 230 | |||
Qwest Communications International (A) | 65,096 | 238 | |||
SBA Communications, Cl A* (A) | 5,300 | 170 | |||
Sprint Nextel* | 132,344 | 491 | |||
Telephone & Data Systems | 4,102 | 125 | |||
tw telecom , Cl A* | 7,400 | 108 | |||
US Cellular* | 831 | 31 | |||
Verizon Communications | 129,715 | 4,081 | |||
Windstream | 20,347 | 202 | |||
| 14,968 | |||||
Utilities — 3.8% | |||||
AES* | 31,624 | 403 | |||
AGL Resources | 3,247 | 112 | |||
Allegheny Energy | 7,566 | 166 | |||
Alliant Energy | 5,176 | 142 | |||
Ameren (A) | 11,290 | 293 | |||
American Electric Power | 21,550 | 694 | |||
American Water Works | 2,900 | 65 | |||
Aqua America (A) | 5,477 | 89 | |||
Atmos Energy | 3,691 | 101 | |||
Calpine* | 14,900 | 166 | |||
Centerpoint Energy | 18,715 | 248 | |||
CMS Energy (A) | 9,542 | 136 | |||
Consolidated Edison (A) | 13,016 | 558 | |||
Constellation Energy Group | 8,358 | 266 | |||
Dominion Resources | 27,512 | 1,001 | |||
DPL | 5,446 | 146 | |||
DTE Energy | 7,264 | 291 | |||
Duke Energy | 58,319 | 973 | |||
Dynegy, Cl A* | 22,518 | 41 | |||
Edison International | 15,479 | 527 | |||
Energen | 2,937 | 128 | |||
Entergy | 9,198 | 723 | |||
Equities (A) | 5,866 | 242 | |||
Exelon (A) | 29,929 | 1,442 | |||
FirstEnergy | 14,381 | 620 | |||
FPL Group | 19,173 | 996 | |||
Great Plains Energy | 6,471 | 115 | |||
Hawaiian Electric Industries (A) | 3,746 | 74 | |||
Integrys Energy Group (A) | 3,102 | 120 | |||
ITC Holdings | 2,400 | 107 | |||
MDU Resources Group | 8,621 | 195 | |||
Mirant* (A) | 6,461 | 92 | |||
National Fuel Gas | 3,289 | 154 | |||
NiSource | 12,821 | 183 | |||
Northeast Utilities | 7,907 | 191 | |||
NRG Energy* (A) | 12,700 | 304 | |||
NSTAR | 5,028 | 167 | |||
NV Energy | 10,800 | 126 | |||
OGE Energy (A) | 4,568 | 158 | |||
Oneok | 4,929 | 197 | |||
Ormat Technologies | 1,000 | 41 | |||
Pepco Holdings | 10,044 | 164 | |||
PG&E | 17,318 | 733 | |||
Pinnacle West Capital | 4,792 | 168 | |||
PPL | 17,126 | 523 | |||
Progress Energy | 13,261 | 518 | |||
Public Service Enterprise Group | 22,852 | 717 | |||
Questar | 7,746 | 307 | |||
| 8 | SEI Institutional Investments Trust / Semi-Annual Report / November 30, 2009 |
Table of Contents
SCHEDULE OF INVESTMENTS (Unaudited)
Large Cap Index Fund
November 30, 2009
Description | Shares | Market Value ($ Thousands) | |||
RRI Energy* | 14,659 | $ | 72 | ||
SCANA | 5,420 | 191 | |||
Sempra Energy | 11,523 | 612 | |||
Southern | 35,503 | 1,139 | |||
TECO Energy | 10,600 | 156 | |||
UGI | 4,850 | 114 | |||
Vectren | 3,491 | 82 | |||
Westar Energy | 5,300 | 109 | |||
Wisconsin Energy | 5,249 | 237 | |||
Xcel Energy | 21,681 | 441 | |||
| 19,076 | |||||
Total Common Stock | 493,452 | ||||
AFFILIATED PARTNERSHIP — 12.6% | |||||
SEI Liquidity Fund, L.P. 0.320% (B)** † | 63,613,253 | 62,795 | |||
Total Affiliated Partnership | 62,795 | ||||
CASH EQUIVALENT — 1.2% | |||||
SEI Daily Income Trust, Prime Obligation Fund, Cl A, | 6,208,971 | 6,209 | |||
Total Cash Equivalent | 6,209 | ||||
U.S. TREASURY OBLIGATION — 0.2% | |||||
U.S. Treasury Bill | 828 | 828 | |||
Total U.S. Treasury Obligation | 828 | ||||
Total Investments — 112.6% | $ | 563,284 | |||
A summary of the open futures contracts held by the Fund at November 30, 2009, is as follows:
Type of Contract | Number of Contracts Long (Short) | Expiration Date | Unrealized Appreciation ($ Thousands) | ||||
S&P 500 E-Mini | 146 | Dec-2009 | $ | 386 | |||
S&P Mid 400 E-Mini | 4 | Dec-2009 | 6 | ||||
| $ | 392 | ||||||
For the year ended November 30, 2009, the total amount of all open futures contracts, as presented in the table above, are representative of the volume of activity for this derivative type during the period.
Percentages are based on a Net Assets of $500,256 ($ Thousands).
| (A) | This security or a partial position of this security is on loan at November 30, 2009. The total value of securities on loan at November 30, 2009 was $62,407 ($ Thousands). |
| (B) | This security was purchased with cash collateral held from securities on loan (see Note 11). The total value of such securities on November 30, 2009 was $62,795 ($ Thousands). |
| (C) | The Fund may purchase securities of certain companies with which it is affiliated to the extent these companies are represented in its benchmark index. |
| (D) | Rate shown is the effective yield at time of purchase. |
| (E) | Security, or a portion thereof, has been pledged as collateral on open futures contracts. |
| * | Non-income producing security. |
| ** | The rate reported is the 7-day effective yield as of November 30, 2009. |
| † | Investment in Affiliated Security (see Note 5). |
| ‡ | Real Estate Investment Trust |
Cl — Class
L.P. — Limited Partnership
REIT — Real Estate Investment Trust
Ser — Series
S&P — Standard & Poor’s
| 9 | SEI Institutional Investments Trust / Semi-Annual Report / November 30, 2009 |
Table of Contents
SCHEDULE OF INVESTMENTS (Unaudited)
Small Cap Fund
November 30, 2009
Description | Shares | Market Value ($ Thousands) | |||
COMMON STOCK — 96.4% | |||||
Consumer Discretionary — 13.3% | |||||
Aaron’s | 18,700 | $ | 469 | ||
Abercrombie & Fitch, Cl A (A) | 8,160 | 326 | |||
American Axle & Manufacturing Holdings | 31,500 | 197 | |||
American Eagle Outfitters | 135,690 | 2,087 | |||
American Greetings, Cl A (A) | 98,800 | 2,045 | |||
American Public Education* | 84,802 | 2,716 | |||
America’s Car-Mart* | 21,200 | 513 | |||
Amerigon* (A) | 113,254 | 751 | |||
Ameristar Casinos | 45,900 | 798 | |||
AnnTaylor Stores* | 36,400 | 509 | |||
Arctic Cat | 54,500 | 368 | |||
ArvinMeritor | 30,400 | 247 | |||
Ascent Media, Cl A* | 2,100 | 48 | |||
Bally Technologies* | 4,900 | 203 | |||
Barnes & Noble | 107,700 | 2,514 | |||
Beazer Homes USA* | 56,000 | 241 | |||
Bebe Stores | 21,823 | 118 | |||
Belo, Cl A | 76,318 | 359 | |||
Big Lots* | 38,000 | 876 | |||
BJ’s Restaurants* (A) | 105,429 | 1,800 | |||
Bluegreen* | 15,899 | 37 | |||
Blyth | 11,031 | 359 | |||
Bob Evans Farms (A) | 19,500 | 493 | |||
Boyd Gaming* | 27,200 | 222 | |||
Brinker International | 20,200 | 279 | |||
Brink’s Home Security Holdings* | 39,050 | 1,278 | |||
Brown Shoe | 56,700 | 582 | |||
Brunswick | 3,000 | 30 | |||
Buckle | 9,400 | 257 | |||
Buffalo Wild Wings* | 19,298 | 771 | |||
Cabela’s* (A) | 74,100 | 894 | |||
California Pizza Kitchen* | 52,000 | 653 | |||
Callaway Golf (A) | 98,720 | 708 | |||
Capella Education* (A) | 41,467 | 2,956 | |||
Career Education* | 7,600 | 198 | |||
Carter’s* | 104,400 | 2,271 | |||
Casual Male Retail Group* | 248,400 | 648 | |||
Cato, Cl A (A) | 164,537 | 3,148 | |||
Century Casinos* | 236,817 | 597 | |||
Cheesecake Factory* | 19,100 | 360 | |||
Childrens Place Retail Stores* | 5,600 | 179 | |||
Christopher & Banks | 64,229 | 367 | |||
Citi Trends* | 6,700 | 183 | |||
CKE Restaurants | 34,600 | 292 | |||
CKX* | 6,300 | 34 | |||
Coldwater Creek* (A) | 55,880 | 237 | |||
Cooper Tire & Rubber | 80,066 | 1,435 | |||
Corinthian Colleges* | 48,000 | 711 | |||
Cracker Barrel Old Country Store (A) | 25,100 | 943 | |||
CSS Industries | 17,600 | 327 | |||
Dana Holdings* | 30,501 | 222 | |||
Dick’s Sporting Goods* (A) | 51,802 | 1,075 | |||
Dillard’s, Cl A | 33,900 | 576 | |||
DineEquity | 49,800 | 1,061 | |||
Domino’s Pizza* | 31,200 | 245 | |||
Dress Barn* | 52,334 | 1,124 | |||
DSW, Cl A* (A) | 84,600 | 1,975 | |||
Eastman Kodak | 257,500 | 1,043 | |||
Description | Shares | Market Value ($ Thousands) | |||
Ethan Allen Interiors (A) | 32,497 | $ | 377 | ||
Exide Technologies* | 100,200 | 751 | |||
Federal Mogul, Cl A* | 69,083 | 933 | |||
Finish Line, Cl A | 161,310 | 1,428 | |||
Foot Locker | 165,800 | 1,573 | |||
Fossil* | 11,200 | 345 | |||
Fred’s, Cl A | 47,700 | 466 | |||
Fuel Systems Solutions* (A) | 18,561 | 895 | |||
Furniture Brands International* | 41,008 | 172 | |||
Gaylord Entertainment* | 9,100 | 160 | |||
Grand Canyon Education* | 74,455 | 1,427 | |||
Group 1 Automotive | 6,500 | 164 | |||
Gymboree* | 9,500 | 379 | |||
Harte-Hanks | 42,400 | 407 | |||
hhgregg* | 23,216 | 449 | |||
Hibbett Sports* (A) | 83,345 | 1,576 | |||
Hillenbrand | 32,761 | 600 | |||
HOT Topic* | 325,000 | 1,865 | |||
HSN* | 38,300 | 686 | |||
Hyatt Hotels, Cl A* (A) | 4,650 | 134 | |||
Iconix Brand Group* | 248,360 | 2,796 | |||
Interactive Data | 52,159 | 1,332 | |||
International Speedway, Cl A | 58,400 | 1,575 | |||
Interval Leisure Group* | 1,600 | 18 | |||
J Crew Group* | 71,625 | 3,065 | |||
Jack in the Box* (A) | 97,500 | 1,820 | |||
Jackson Hewitt Tax Service | 81,900 | 339 | |||
Jakks Pacific* (A) | 24,500 | 295 | |||
Jarden | 125,766 | 3,452 | |||
Jo-Ann Stores* | 27,004 | 901 | |||
Jones Apparel Group | 102,990 | 1,746 | |||
Jos. A. Bank Clothiers* | 11,800 | 482 | |||
Journal Communications, Cl A | 152,400 | 532 | |||
K12* (A) | 34,379 | 616 | |||
Kirkland’s* | 69,400 | 1,057 | |||
Lakeland Industries* | 112,000 | 753 | |||
Landry’s Restaurants* (A) | 12,100 | 257 | |||
Life Time Fitness* (A) | 161,144 | 3,642 | |||
Lifetime Brands | 71,800 | 445 | |||
Lincoln Educational Services* | 88,200 | 1,951 | |||
Lions Gate Entertainment* | 144,500 | 721 | |||
Live Nation* | 59,585 | 427 | |||
Liz Claiborne | 59,700 | 249 | |||
LodgeNet Interactive* | 65,500 | 294 | |||
Lululemon Athletica* (A) | 77,469 | 2,027 | |||
Marvel Entertainment* | 20,300 | 1,057 | |||
Matthews International, Cl A | 40,200 | 1,393 | |||
MDC Holdings | 12,400 | 368 | |||
MDC Partners, Cl A* | 445,400 | 3,666 | |||
Men’s Wearhouse | 20,811 | 424 | |||
Meredith (A) | 53,200 | 1,402 | |||
Meritage Homes* | 77,500 | 1,382 | |||
Morningstar* (A) | 44,269 | 2,052 | |||
National CineMedia | 81,629 | 1,193 | |||
New Frontier Media* | 245,100 | 451 | |||
Nordstrom | 45,355 | 1,517 | |||
NutriSystem | 40,300 | 996 | |||
NVR* | 1,960 | 1,319 | |||
O’Charleys* | 27,900 | 179 | |||
Office Depot* | 167,185 | 1,026 | |||
OfficeMax | 146,600 | 1,551 | |||
Orient-Express Hotels, Cl A | 178,149 | 1,489 | |||
Oxford Industries | 17,200 | 369 | |||
| 1 | SEI Institutional Investments Trust / Semi-Annual Report / November 30, 2009 |
Table of Contents
SCHEDULE OF INVESTMENTS (Unaudited)
Small Cap Fund
November 30, 2009
Description | Shares | Market Value ($ Thousands) | |||
Pacific Sunwear of California* | 11,500 | $ | 38 | ||
Papa John’s International* | 2,400 | 53 | |||
Peet’s Coffee & Tea* (A) | 24,485 | 797 | |||
Penske Auto Group | 21,200 | 313 | |||
PetSmart (A) | 87,627 | 2,255 | |||
PF Chang’s China Bistro* (A) | 27,638 | 901 | |||
Phillips-Van Heusen | 15,200 | 608 | |||
Pinnacle Entertainment* | 273,945 | 2,896 | |||
Polaris Industries (A) | 22,200 | 969 | |||
Pre-Paid Legal Services* | 11,500 | 438 | |||
Princeton Review* | 400,000 | 1,552 | |||
Pulte Homes | 117,325 | 1,072 | |||
RadioShack (A) | 78,200 | 1,475 | |||
Red Robin Gourmet Burgers* | 64,900 | 1,013 | |||
Regis (A) | 160,751 | 2,517 | |||
Rent-A-Center, Cl A* | 114,700 | 2,029 | |||
Retail Ventures* | 153,767 | 1,198 | |||
Ruby Tuesday* (A) | 73,100 | 463 | |||
Rue21* | 61,500 | 1,520 | |||
Ryland Group | 24,800 | 454 | |||
Saks* | 217,790 | 1,331 | |||
Scholastic (A) | 48,300 | 1,218 | |||
Scientific Games, Cl A* (A) | 29,059 | 411 | |||
Sealy* | 80,000 | 214 | |||
Shutterfly* (A) | 62,300 | 893 | |||
Signet Jewelers* | 15,400 | 398 | |||
Sinclair Broadcast Group, Cl A | 39,677 | 146 | |||
Smith & Wesson Holding* | 37,600 | 186 | |||
Sonic Automotive, Cl A | 47,400 | 419 | |||
Sotheby’s | 28,093 | 533 | |||
Spartan Motors | 45,200 | 234 | |||
Spectrum Group International* | 9,759 | 24 | |||
Stage Stores | 149,500 | 1,807 | |||
Stamps.com* | 14,025 | 125 | |||
Standard Pacific* | 152,215 | 486 | |||
Steiner Leisure* | 30,100 | 1,190 | |||
Stewart Enterprises, Cl A | 92,104 | 431 | |||
Stoneridge* | 26,800 | 187 | |||
Sturm Ruger (A) | 92,300 | 993 | |||
Superior Industries International | 15,100 | 216 | |||
Systemax | 13,500 | 208 | |||
Tempur-Pedic International* | 94,900 | 2,045 | |||
Tenneco* | 50,793 | 732 | |||
Texas Roadhouse, Cl A* | 101,550 | 1,044 | |||
Thunderbird Resorts* (B) | 288,591 | 231 | |||
Tickeaster Entertainment* | 3,600 | 38 | |||
Timberland, Cl A* | 85,400 | 1,426 | |||
Tractor Supply* (A) | 13,059 | 610 | |||
TRW Automotive Holdings* | 6,000 | 131 | |||
Tupperware Brands | 14,000 | 652 | |||
Ulta Salon Cosmetics & Fragrance* | 53,168 | 874 | |||
Under Armour, Cl A* | 39,050 | 1,000 | |||
Universal Electronics* | 17,113 | 368 | |||
Urban Outfitters* | 39,990 | 1,265 | |||
Valassis Communications* | 35,100 | 520 | |||
Volcom* | 13,100 | 206 | |||
Warnaco Group* | 4,000 | 163 | |||
Wet Seal, Cl A* | 51,300 | 149 | |||
Williams-Sonoma | 22,900 | 465 | |||
World Wrestling Entertainment, Cl A | 32,900 | 529 | |||
Description | Shares | Market Value ($ Thousands) | |||
Zale* | 40,200 | $ | 189 | ||
| 160,216 | |||||
Consumer Staples — 3.5% | |||||
Alliance One International* | 328,100 | 1,565 | |||
American Italian Pasta, Cl A* | 12,000 | 383 | |||
American Oriental Bioengineering* (A) | 104,300 | 418 | |||
Andersons | 41,600 | 1,087 | |||
Cal-Maine Foods (A) | 36,600 | 1,004 | |||
Casey’s General Stores | 50,360 | 1,541 | |||
Central Garden and Pet* (A) | 35,415 | 309 | |||
Central Garden and Pet, Cl A* | 31,766 | 262 | |||
Chattem* (A) | 14,300 | 941 | |||
Chiquita Brands International* | 165,036 | 2,804 | |||
Corn Products International | 26,792 | 751 | |||
Cosan Industria e Comercio (Brazil)* | 98,700 | 1,164 | |||
Darling International* | 44,100 | 314 | |||
Dean Foods* | 53,944 | 858 | |||
Del Monte Foods | 283,800 | 2,977 | |||
Diedrich Coffee* | 3,300 | 109 | |||
Dole Food* | 38,148 | 438 | |||
Flowers Foods (A) | 77,300 | 1,769 | |||
Fresh Del Monte Produce* | 76,600 | 1,665 | |||
Great Atlantic & Pacific Tea* | 14,400 | 160 | |||
Herbalife | 56,217 | 2,358 | |||
Ingles Markets, Cl A | 25,700 | 401 | |||
Kulim Malaysia | 426,000 | 923 | |||
Lancaster Colony | 18,900 | 902 | |||
Lance (A) | 56,814 | 1,383 | |||
Nash Finch (A) | 16,900 | 554 | |||
NBTY* | 33,500 | 1,345 | |||
Nu Skin Enterprises, Cl A | 42,100 | 1,127 | |||
Pantry* | 157,729 | 2,331 | |||
Prestige Brands Holdings* | 56,700 | 395 | |||
Pricesmart | 7,400 | 139 | |||
Rite Aid* | 90,300 | 116 | |||
Ruddick | 52,600 | 1,400 | |||
Sanderson Farms (A) | 35,781 | 1,437 | |||
Saskatchewan Wheat Pool, Cl Common Subscription Recei* | 129,800 | 1,311 | |||
Smart Balance* | 327,008 | 1,763 | |||
Smithfield Foods* (A) | 23,407 | 362 | |||
TreeHouse Foods* | 300 | 11 | |||
United Natural Foods* | 6,700 | 169 | |||
Universal | 59,300 | 2,545 | |||
USANA Health Sciences* | 6,000 | 193 | |||
Village Super Market, Cl A | 3,000 | 91 | |||
Winn-Dixie Stores* | 45,600 | 492 | |||
| 42,267 | |||||
Energy — 5.7% | |||||
Allis-Chalmers Energy* (A) | 106,888 | 346 | |||
Alon USA Energy (A) | 26,200 | 188 | |||
Approach Resources* | 145,200 | 1,016 | |||
Arena Resources* (A) | 41,801 | 1,709 | |||
Atlas Energy | 20,300 | 522 | |||
ATP Oil & Gas* | 5,300 | 85 | |||
Basic Energy Services* | 78,100 | 537 | |||
Berry Petroleum, Cl A | 33,110 | 905 | |||
Boots & Coots International Control* | 108,110 | 155 | |||
| 2 | SEI Institutional Investments Trust / Semi-Annual Report / November 30, 2009 |
Table of Contents
SCHEDULE OF INVESTMENTS (Unaudited)
Small Cap Fund
November 30, 2009
Description | Shares | Market Value ($ Thousands) | |||
BPZ Energy PIPE* | 46,900 | $ | 341 | ||
BPZ Resources* (A) | 132,600 | 965 | |||
Bristow Group* | 8,000 | 275 | |||
Cal Dive International* | 470,737 | 3,418 | |||
Cameron International* | 3,910 | 148 | |||
CARBO Ceramics | 20,700 | 1,228 | |||
Clayton Williams Energy* | 7,828 | 221 | |||
Complete Production Services* | 1,700 | 18 | |||
Comstock Resources* | 74,393 | 2,762 | |||
Contango Oil & Gas* | 6,900 | 306 | |||
CVR Energy* | 10,300 | 76 | |||
Delek US Holdings | 18,134 | 125 | |||
Denbury Resources* | 16,000 | 212 | |||
DHT Maritime | 17,800 | 72 | |||
Dresser-Rand Group* | 74,355 | 2,088 | |||
Exterran Holdings* | 25,457 | 533 | |||
Forest Oil* (A) | 80,000 | 1,466 | |||
Frontier Oil | 36,500 | 421 | |||
GeoMet* | 279,191 | 316 | |||
Global Industries* | 90,000 | 528 | |||
GMX Resources* | 102,403 | 1,196 | |||
Goodrich Petroleum* (A) | 67,510 | 1,494 | |||
Gran Tierra Energy* | 75,900 | 433 | |||
Gulfmark Offshore* | 11,600 | 316 | |||
Gulfport Energy* | 37,900 | 360 | |||
Hercules Offshore* | 35,100 | 179 | |||
Holly | 98,300 | 2,502 | |||
Hornbeck Offshore Services* | 20,300 | 463 | |||
Infinity Bio-Energy* | 635,045 | — | |||
Key Energy Services* | 209,118 | 1,593 | |||
Kinder Morgan Management LLC* | 39,131 | 1,967 | |||
Knightsbridge Tankers | 47,300 | 618 | |||
Matrix Service* | 7,100 | 61 | |||
McMoRan Exploration* | 29,664 | 215 | |||
Newpark Resources* | 58,400 | 156 | |||
Northern Oil And Gas* (A) | 134,000 | 1,226 | |||
Oil States International* (A) | 12,300 | 441 | |||
Oilsands Quest* (A) | 1,055,600 | 1,277 | |||
Overseas Shipholding Group (A) | 40,000 | 1,532 | |||
Parker Drilling* (A) | 177,700 | 888 | |||
Patterson-UTI Energy | 85,300 | 1,313 | |||
PetroHawk Energy* | 145,232 | 3,245 | |||
Petroleum Development* | 33,400 | 600 | |||
Petroquest Energy* | 171,763 | 967 | |||
Quicksilver Resources* | 140,759 | 1,874 | |||
Rentech* (A) | 380,700 | 583 | |||
Rex Energy* | 14,687 | 133 | |||
Rosetta Resources* | 94,000 | 1,481 | |||
RPC (A) | 98,200 | 949 | |||
SandRidge Energy* | 175,891 | 1,650 | |||
SEACOR Holdings* (A) | 9,400 | 720 | |||
Seahawk Drilling* (A) | 39,700 | 855 | |||
Ship Finance International | 14,900 | 194 | |||
St. Mary Land & Exploration | 4,500 | 146 | |||
StealthGas | 125,400 | 756 | |||
Stone Energy* | 24,200 | 458 | |||
Superior Energy Services* (A) | 68,620 | 1,451 | |||
Swift Energy* (A) | 103,742 | 2,227 | |||
Teekay Tankers, Cl A | 31,200 | 749 | |||
Tesoro (A) | 49,600 | 634 | |||
Tidewater | 7,116 | 320 | |||
USEC* (A) | 238,600 | 873 | |||
Description | Shares | Market Value ($ Thousands) | |||
Vaalco Energy | 176,400 | $ | 739 | ||
W&T Offshore (A) | 123,900 | 1,282 | |||
Western Refining* | 41,500 | 193 | |||
Willbros Group* (A) | 100,544 | 1,584 | |||
World Fuel Services | 90,568 | 4,816 | |||
| 68,691 | |||||
Financials — 18.1% | |||||
Acadia Realty Trust‡ | 2,100 | 34 | |||
Advance America Cash Advance Centers | 106,625 | 667 | |||
Affiliated Managers Group* (A) | 39,614 | 2,583 | |||
Agree Realty‡ | 4,800 | 118 | |||
Alexander’s‡* | 100 | 28 | |||
Allied Capital | 158,700 | 562 | |||
Allied World Assurance Holdings | 44,600 | 2,131 | |||
AMB Property‡ | 104,050 | 2,450 | |||
American Campus Communities‡ | 25,500 | 687 | |||
American Capital Agency‡ | 10,600 | 281 | |||
American Equity Investment Life Holding | 67,431 | 494 | |||
American Physicians Capital | 33,999 | 928 | |||
Amerisafe* | 18,523 | 313 | |||
Amtrust Financial Services | 64,700 | 773 | |||
Annaly Capital Management‡ | 14,300 | 263 | |||
Anthracite Capital‡ (A) | 85,700 | 33 | |||
Anworth Mortgage Asset‡ | 366,059 | 2,636 | |||
Apartment Investment & Management, Cl A‡ (A) | 114,064 | 1,541 | |||
Apollo Investments* | 73,838 | 710 | |||
Ares Capital | 37,600 | 437 | |||
Argo Group International Holdings* | 15,200 | 443 | |||
Artio Global Investors, Cl A* | 57,400 | 1,314 | |||
Ashford Hospitality Trust‡ | 84,539 | 353 | |||
Aspen Insurance Holdings | 64,600 | 1,674 | |||
Associated Estates Realty‡ | 11,600 | 115 | |||
Assured Guaranty (A) | 50,400 | 1,143 | |||
Astoria Financial (A) | 40,718 | 423 | |||
AvalonBay Communities‡ (A) | 24,433 | 1,765 | |||
Banco Latinoamericano de Comercio Exterior, Cl E | 56,900 | 794 | |||
Bancorp Rhode Island | 15,177 | 383 | |||
Bancorpsouth (A) | 22,390 | 519 | |||
Bank Mutual | 35,700 | 250 | |||
Bank of Hawaii | 30,900 | 1,412 | |||
Bank of the Ozarks | 6,200 | 165 | |||
Berkshire Hills Bancorp | 34,900 | 658 | |||
BioMed Realty Trust‡ | 46,300 | 634 | |||
Boston Private Financial Holdings (A) | 15,170 | 71 | |||
Boston Properties‡ (A) | 62,050 | 4,156 | |||
Brasil Brokers Participacoes | 390,700 | 1,293 | |||
Calamos Asset Management, Cl A | 25,522 | 268 | |||
CapitalSource | 373,435 | 1,371 | |||
CapLease‡ | 13,400 | 58 | |||
Capstead Mortgage‡ | 151,600 | 2,165 | |||
Cardinal Financial | 43,759 | 371 | |||
Cardtronics* | 233,548 | 2,581 | |||
Cathay General Bancorp (A) | 10,600 | 83 | |||
| 3 | SEI Institutional Investments Trust / Semi-Annual Report / November 30, 2009 |
Table of Contents
SCHEDULE OF INVESTMENTS (Unaudited)
Small Cap Fund
November 30, 2009
Description | Shares | Market Value ($ Thousands) | |||
CBL & Associates Properties‡ (A) | 143,179 | $ | 1,326 | ||
Cedar Shopping Centers‡ | 7,700 | 47 | |||
Centerstate Banks | 42,690 | 352 | |||
Central Pacific Financial (A) | 29,400 | 24 | |||
Chemical Financial | 17,948 | 422 | |||
Chimera Investment‡ | 373,032 | 1,503 | |||
Citizens Republic Bancorp* (A) | 36,000 | 20 | |||
City Holding | 1,300 | 42 | |||
CNA Surety* | 26,160 | 352 | |||
Cogdell Spencer‡ | 262,500 | 1,326 | |||
Cohen & Steers | 13,600 | 260 | |||
Colonial Properties Trust ‡ | 11,100 | 120 | |||
Community Bank System | 51,188 | 950 | |||
Conseco* (A) | 248,500 | 1,190 | |||
Corporate Office Properties Trust‡ (A) | 29,950 | 1,024 | |||
Cousins Properties‡ | 3,134 | 23 | |||
Crawford, Cl B* | 17,124 | 66 | |||
CreXus Investment‡* | 40,400 | 537 | |||
CVB Financial | 58,900 | 457 | |||
Cypress Sharpridge Investments‡ | 1,200 | 16 | |||
DCT Industrial Trust‡ | 24,100 | 114 | |||
Delphi Financial Group, Cl A | 84,900 | 1,856 | |||
Developers Diversified Realty‡ | 29,500 | 299 | |||
DiamondRock Hospitality‡ | 13,000 | 105 | |||
Dime Community Bancshares | 33,400 | 375 | |||
Dollar Financial* (A) | 67,100 | 1,638 | |||
Douglas Emmett‡ (A) | 128,050 | 1,757 | |||
Duff & Phelps, Cl A | 74,134 | 1,258 | |||
DuPont Fabros Technology‡ | 15,300 | 245 | |||
Dynex Capital‡ | 8,600 | 69 | |||
E*Trade Financial* | 401,900 | 659 | |||
EastGroup Properties‡ | 3,200 | 121 | |||
Education Realty Trust‡ | 74,576 | 369 | |||
EMC Insurance Group | 4,871 | 101 | |||
Employers Holdings | 81,628 | 1,250 | |||
Encore Bancshares* | 73,100 | 611 | |||
Encore Capital Group* | 30,600 | 521 | |||
Endurance Specialty Holdings (A) | 42,053 | 1,572 | |||
Entertainment Properties Trust‡ (A) | 24,200 | 764 | |||
Equity Lifestyle Properties‡ | 3,400 | 163 | |||
Equity One‡ (A) | 79,786 | 1,289 | |||
Equity Residential‡ | 67,500 | 2,174 | |||
ESSA Bancorp | 33,800 | 428 | |||
Essex Property Trust‡ (A) | 31,500 | 2,512 | |||
Extra Space Storage‡ | 114,100 | 1,254 | |||
FBL Financial Group, Cl A (A) | 32,400 | 571 | |||
FBR Capital Markets* | 282,500 | 1,771 | |||
Federal Realty Investment Trust‡ (A) | 26,400 | 1,698 | |||
Federated Investors, Cl B (A) | 25,770 | 664 | |||
FelCor Lodging Trust‡ | 13,600 | 46 | |||
Financial Federal | 17,400 | 472 | |||
First Bancorp | 205,347 | 318 | |||
First Busey (A) | 126,178 | 414 | |||
First Commonwealth Financial | 39,204 | 167 | |||
First Financial Bancorp (A) | 166,631 | 2,215 | |||
First Financial Bankshares | 700 | 36 | |||
First Financial Holdings | 67,400 | 903 | |||
First Horizon National* (A) | 48,806 | 661 | |||
First Industrial Realty Trust‡ | 57,000 | 254 | |||
First Merchants | 9,500 | 57 | |||
Description | Shares | Market Value ($ Thousands) | |||
First Midwest Bancorp | 4,400 | $ | 46 | ||
First Potomac Realty Trust‡ | 9,000 | 106 | |||
FirstMerit | 22,496 | 471 | |||
Flushing Financial | 162,000 | 1,768 | |||
FNB (Pennsylvania) | 46,942 | 306 | |||
FPIC Insurance Group* (A) | 11,600 | 407 | |||
Franklin Street Properties‡ | 8,600 | 97 | |||
GAMCO Investors, Cl A | 2,400 | 110 | |||
General Shopping Brasil (Brazil)* | 246,600 | 1,143 | |||
Getty Realty‡ | 3,100 | 70 | |||
GFI Group | 98,500 | 479 | |||
Gladstone Capital | 19,782 | 155 | |||
Gladstone Commercial‡ | 3,600 | 48 | |||
Glimcher Realty Trust‡ | 5,200 | 15 | |||
Gluskin Sheff + Associates | 52,900 | 1,020 | |||
Great American Group* | 236,900 | 865 | |||
Great Southern Bancorp (A) | 900 | 20 | |||
Greenhill | 15,254 | 1,246 | |||
Grubb & Ellis* (A) | 888,460 | 1,306 | |||
Hancock Holding (A) | 34,883 | 1,444 | |||
Harleysville Group | 8,100 | 255 | |||
Hatteras Financial‡ | 42,600 | 1,304 | |||
HCP‡ | 108,100 | 3,384 | |||
Healthcare Realty Trust‡ | 9,700 | 214 | |||
Hercules Technology Growth Capital | 102,265 | 1,007 | |||
Hersha Hospitality Trust‡ | 101,200 | 266 | |||
Highwoods Properties‡ | 37,700 | 1,154 | |||
Home Bancshares | 37,700 | 863 | |||
Home Federal Bancorp | 34,800 | 424 | |||
Home Properties‡ | 5,900 | 265 | |||
Horace Mann Educators | 98,778 | 1,187 | |||
Horizon Financial (A) | 400 | — | |||
Hospitality Properties Trust‡ | 19,100 | 371 | |||
Host Hotels & Resorts‡ (A) | 162,150 | 1,706 | |||
HRPT Properties Trust‡ | 172,600 | 1,060 | |||
Hudson Valley Holding | 51,100 | 1,337 | |||
Iberiabank (A) | 6,656 | 378 | |||
Infinity Property & Casualty | 47,949 | 1,916 | |||
Inland Real Estate‡ | 63,500 | 498 | |||
International Assets Holding* | 16,454 | 272 | |||
International Bancshares (A) | 123,700 | 2,075 | |||
Investors Real Estate Trust‡ (A) | 176,100 | 1,551 | |||
iStar Financial‡ | 130,800 | 318 | |||
Janus Capital Group | 50,563 | 662 | |||
Jones Lang LaSalle | 33,155 | 1,687 | |||
Kansas City Life Insurance | 14,600 | 393 | |||
KBW* | 13,000 | 320 | |||
Kennedy-Wilson Holdings* | 41,200 | 375 | |||
Kilroy Realty‡ | 4,600 | 139 | |||
Kite Realty Group Trust‡ | 11,200 | 36 | |||
Knight Capital Group, Cl A* | 34,700 | 508 | |||
LaBranche* | 1,400 | 4 | |||
LaSalle Hotel Properties‡ | 5,200 | 97 | |||
Lexington Realty Trust‡ | 14,172 | 69 | |||
Life Partners Holdings | 9,600 | 179 | |||
LTC Properties‡ | 62,693 | 1,612 | |||
Macerich‡ (A) | 54,767 | 1,630 | |||
Mack-Cali Realty‡ | 26,300 | 807 | |||
MainSource Financial Group | 22,500 | 119 | |||
MarketAxess Holdings | 228,326 | 2,843 | |||
Max Capital Group | 119,000 | 2,593 | |||
MB Financial | 80,800 | 1,507 | |||
| 4 | SEI Institutional Investments Trust / Semi-Annual Report / November 30, 2009 |
Table of Contents
SCHEDULE OF INVESTMENTS (Unaudited)
Small Cap Fund
November 30, 2009
Description | Shares | Market Value ($ Thousands) | |||
Meadowbrook Insurance Group | 366,568 | $ | 2,511 | ||
Medical Properties Trust‡ | 111,500 | 1,079 | |||
MF Global* | 83,300 | 524 | |||
MFA Mortgage Investments‡ | 425,143 | 3,218 | |||
MGIC Investment* | 488,575 | 1,954 | |||
Mid-America Apartment Communities‡ (A) | 17,934 | 834 | |||
Montpelier Re Holdings (A) | 60,813 | 1,018 | |||
MSCI, Cl A* | 39,902 | 1,216 | |||
National Health Investors‡ | 4,200 | 139 | |||
National Penn Bancshares (A) | 55,095 | 304 | |||
National Retail Properties‡ | 14,600 | 293 | |||
Nationwide Health Properties‡ | 7,613 | 259 | |||
Nelnet, Cl A | 178,675 | 3,104 | |||
NewAlliance Bancshares (A) | 34,957 | 412 | |||
NorthStar Realty Finance‡ (A) | 38,144 | 129 | |||
NYSE Euronext | 6,900 | 174 | |||
OceanFirst Financial | 13,950 | 141 | |||
Old National Bancorp | 199,600 | 2,323 | |||
Omega Healthcare Investors‡ | 12,400 | 224 | |||
Oriental Financial Group | 113,000 | 1,096 | |||
Pacific Capital Bancorp | 118,300 | 111 | |||
PacWest Bancorp (A) | 46,717 | 860 | |||
Parkway Properties‡ | 32,800 | 612 | |||
Pennsylvania Real Estate Investment Trust‡ | 44,000 | 325 | |||
Pennymac Mortgage Investment Trust‡ * | 1,200 | 21 | |||
PHH* | 61,433 | 849 | |||
Phoenix | 201,800 | 500 | |||
Pico Holdings* | 40,558 | 1,214 | |||
Piper Jaffray* | 4,500 | 195 | |||
Platinum Underwriters Holdings | 136,696 | 4,824 | |||
PMA Capital, Cl A* | 101,179 | 645 | |||
Post Properties‡ (A) | 69,050 | 1,273 | |||
Potlatch‡ | 5,200 | 153 | |||
Presidential Life | 18,168 | 185 | |||
ProAssurance* (A) | 15,841 | 844 | |||
Prospect Capital (A) | 133,100 | 1,448 | |||
Prosperity Bancshares | 21,600 | 860 | |||
Provident Financial Services | 29,700 | 314 | |||
PS Business Parks‡ | 1,800 | 86 | |||
Public Storage‡ | 45,024 | 3,583 | |||
RAIT Financial Trust‡ (A) | 238,800 | 370 | |||
Ramco-Gershenson Properties‡ | 7,300 | 66 | |||
Raymond James Financial (A) | 12,700 | 309 | |||
Redwood Trust‡ | 19,500 | 280 | |||
Reinsurance Group of America, Cl A | 19,727 | 917 | |||
Renasant | 43,900 | 625 | |||
Republic Bancorp, Cl A | 42,800 | 807 | |||
Resource Capital‡ | 28,100 | 145 | |||
Riskmetrics Group* | 140,340 | 2,095 | |||
S&T Bancorp | 17,300 | 276 | |||
Safeguard Scientifics* | 26,200 | 242 | |||
Safety Insurance Group | 41,700 | 1,485 | |||
Sandy Spring Bancorp (A) | 8,500 | 79 | |||
Saul Centers‡ | 19,850 | 613 | |||
SCBT Financial | 28,900 | 751 | |||
SeaBright Insurance Holdings* | 57,100 | 628 | |||
Selective Insurance Group | 40,800 | 636 | |||
Senior Housing Properties Trust‡ | 76,550 | 1,590 | |||
Signature Bank NY* (A) | 35,310 | 1,094 | |||
Description | Shares | Market Value ($ Thousands) | |||
Simon Property Group‡ | 45,764 | $ | 3,325 | ||
SL Green Realty‡ | 10,000 | 444 | |||
South Financial Group (A) | 185,100 | 113 | |||
Sovran Self Storage‡ | 17,503 | 566 | |||
Starwood Property Trust‡ | 51,100 | 991 | |||
Stewart Information Services (A) | 90,160 | 935 | |||
Strategic Hotels & Resorts‡ * | 114,200 | 194 | |||
Student Loan | 18,200 | 904 | |||
Sun Communities‡ | 10,300 | 196 | |||
Sunstone Hotel Investors‡ | 46,450 | 376 | |||
Susquehanna Bancshares | 34,735 | 199 | |||
SVB Financial Group* | 34,320 | 1,299 | |||
SWS Group | 70,369 | 875 | |||
Synovus Financial | 208,769 | 407 | |||
Tanger Factory Outlet Centers‡ | 6,000 | 235 | |||
TCF Financial (A) | 34,600 | 455 | |||
TD Ameritrade Holding* | 26,331 | 517 | |||
Texas Capital Bancshares* | 47,000 | 682 | |||
Thomas Weisel Partners Group* | 92,700 | 417 | |||
Titanium Asset Management* (J) | 132,700 | 382 | |||
Tower Group | 24,088 | 595 | |||
TradeStation Group* | 43,400 | 319 | |||
Trustco Bank | 170,967 | 1,053 | |||
Trustmark (A) | 27,500 | 527 | |||
UMH Properties‡ | 2,100 | 16 | |||
Union Bankshares | 30,000 | 354 | |||
United Bankshares | 29,600 | 506 | |||
United Community Banks* | 46,939 | 182 | |||
United Financial Bancorp | 28,100 | 361 | |||
Universal Health Realty Income Trust‡ | 5,600 | 172 | |||
Uranium Participation* | 192,500 | 1,202 | |||
Urstadt Biddle Properties, Cl A‡ | 9,200 | 126 | |||
U-Store-It Trust‡ | 9,500 | 62 | |||
Validus Holdings | 71,247 | 1,888 | |||
Value Creation* (H) (I) (J) | 119,600 | 13 | |||
Ventas‡ (A) | 49,450 | 2,123 | |||
ViewPoint Financial Group | 39,200 | 513 | |||
Vornado Realty Trust‡ (A) | 23,054 | 1,509 | |||
Walter Investment Management‡ | 4,500 | 55 | |||
Washington Real Estate Investment Trust‡ | 21,200 | 553 | |||
Webster Financial (A) | 16,000 | 204 | |||
Weingarten Realty Investors‡ | 30,550 | 593 | |||
WesBanco | 24,100 | 311 | |||
Westamerica Bancorporation | 15,000 | 798 | |||
Whitney Holding (A) | 17,334 | 140 | |||
Willis Group Holdings (A) | 22,962 | 623 | |||
Wilshire Bancorp | 20,200 | 142 | |||
Winthrop Realty Trust‡ | 3,100 | 28 | |||
Wintrust Financial | 8,400 | 218 | |||
World Acceptance* (A) | 43,300 | 1,270 | |||
WSFS Financial | 28,500 | 760 | |||
Zenith National Insurance | 51,300 | 1,467 | |||
Zions Bancorporation (A) | 37,280 | 490 | |||
| 217,993 | |||||
Health Care — 11.7% | |||||
Abaxis* (A) | 76,183 | 1,712 | |||
Acadia Pharmaceuticals* (A) | 249,100 | 306 | |||
Achillion Pharmaceuticals* | 180,092 | 378 | |||
Acorda Therapeutics* | 60,974 | 1,468 | |||
Affymetrix* | 83,600 | 396 | |||
| 5 | SEI Institutional Investments Trust / Semi-Annual Report / November 30, 2009 |
Table of Contents
SCHEDULE OF INVESTMENTS (Unaudited)
Small Cap Fund
November 30, 2009
Description | Shares | Market Value ($ Thousands) | |||
Air Methods* | 18,600 | $ | 641 | ||
Albany Molecular Research* | 50,519 | 424 | |||
Alexion Pharmaceuticals* | 47,802 | 2,168 | |||
Align Technology* (A) | 61,963 | 1,014 | |||
Alkermes* (A) | 72,034 | 647 | |||
Alnylam Pharmaceuticals* (A) | 26,170 | 440 | |||
AMAG Pharmaceuticals* (A) | 85,780 | 3,207 | |||
Amedisys* | 45,951 | 1,702 | |||
American Medical Systems Holdings* | 22,700 | 399 | |||
AMERIGROUP* | 23,801 | 564 | |||
AMN Healthcare Services* | 208,900 | 1,669 | |||
Amsurg, Cl A* | 128,403 | 2,659 | |||
Analogic | 7,556 | 306 | |||
Angiodynamics* | 21,314 | 331 | |||
Arena Pharmaceuticals* (A) | 321,302 | 1,166 | |||
Array Biopharma* | 105,073 | 181 | |||
Assisted Living Concepts, Cl A* | 31,500 | 737 | |||
athenahealth* | 49,036 | 2,055 | |||
BioMarin Pharmaceutical* | 188,242 | 3,108 | |||
Cantel Medical* | 26,000 | 465 | |||
Cardiome Pharma* | 352,856 | 1,418 | |||
Catalyst Health Solutions* | 73,355 | 2,495 | |||
Centene* | 78,800 | 1,483 | |||
Cephalon* | 3,600 | 198 | |||
Cepheid* (A) | 41,727 | 517 | |||
Chemed | 37,095 | 1,676 | |||
Conceptus* (A) | 38,389 | 650 | |||
Conmed* | 166,047 | 3,452 | |||
Cooper (A) | 19,763 | 662 | |||
Covance* | 11,400 | 606 | |||
Cross Country Healthcare* | 133,800 | 1,139 | |||
CryoLife* | 12,100 | 69 | |||
Cubist Pharmaceuticals* | 14,300 | 239 | |||
Cyberonics* | 15,700 | 283 | |||
Cypress Bioscience* (A) | 88,077 | 467 | |||
Durect* | 447,774 | 1,007 | |||
Emergency Medical Services, Cl A* | 21,700 | 1,047 | |||
Enzo Biochem* | 26,656 | 138 | |||
eResearch Technology* | 51,503 | 304 | |||
Exactech* | 52,542 | 830 | |||
Exelixis* (A) | 91,526 | 626 | |||
Genoptix* | 49,840 | 1,807 | |||
Gen-Probe* | 30,296 | 1,263 | |||
Gentiva Health Services* | 19,600 | 463 | |||
Haemonetics* | 8,100 | 432 | |||
Halozyme Therapeutics* (A) | 71,403 | 390 | |||
Hanger Orthopedic Group* | 9,500 | 127 | |||
Healthsouth* | 33,900 | 595 | |||
Healthspring* | 59,200 | 980 | |||
HealthTronics* | 244,622 | 533 | |||
Healthways* | 8,000 | 137 | |||
Hill-Rom Holdings | 36,000 | 798 | |||
Human Genome Sciences* (A) | 39,498 | 1,099 | |||
ICU Medical* | 73,400 | 2,422 | |||
Idexx Laboratories* | 11,300 | 566 | |||
Illumina* | 5,000 | 145 | |||
Immucor* | 27,700 | 511 | |||
Incyte* (A) | 277,125 | 2,308 | |||
Inspire Pharmaceuticals* | 161,100 | 938 | |||
Integra LifeSciences Holdings* (A) | 14,129 | 463 | |||
Description | Shares | Market Value ($ Thousands) | |||
InterMune* (A) | 35,820 | $ | 385 | ||
Invacare | 21,200 | 528 | |||
inVentiv Health* | 1,300 | 21 | |||
Inverness Medical Innovations* | 8,900 | 374 | |||
IPC The Hospitalist* | 29,395 | 925 | |||
Isis Pharmaceuticals* (A) | 60,862 | 652 | |||
Kendle International* | 64,017 | 958 | |||
Kensey Nash* | 28,667 | 668 | |||
Kindred Healthcare* | 109,250 | 1,623 | |||
Kinetic Concepts* (A) | 21,300 | 718 | |||
King Pharmaceuticals* (A) | 132,900 | 1,572 | |||
LCA-Vision* | 10,700 | 59 | |||
LHC Group* (A) | 129,465 | 3,984 | |||
Lincare Holdings* (A) | 32,000 | 1,137 | |||
Magellan Health Services* | 27,900 | 1,026 | |||
Martek Biosciences* (A) | 90,378 | 1,573 | |||
Masimo* | 72,900 | 1,922 | |||
Maxygen* | 13,428 | 73 | |||
MedAssets* | 51,290 | 1,197 | |||
Medical Staffing Network Holdings* | 92,100 | 55 | |||
Medicines* | 223,300 | 1,751 | |||
Medicis Pharmaceutical, Cl A | 66,500 | 1,569 | |||
Medivation* (A) | 20,463 | 628 | |||
Mednax* | 58,433 | 3,284 | |||
Meridian Bioscience | 38,800 | 804 | |||
Merit Medical Systems* | 21,038 | 347 | |||
Molina Healthcare* | 16,000 | 334 | |||
MWI Veterinary Supply* | 42,528 | 1,577 | |||
Myriad Genetics* | 58,640 | 1,356 | |||
National Dentex* | 13,300 | 108 | |||
Neogen* | 25,200 | 820 | |||
Nighthawk Radiology Holdings* | 54,281 | 283 | |||
NovaMed* | 98,000 | 372 | |||
NPS Pharmaceuticals* | 18,400 | 58 | |||
NuVasive* | 53,532 | 1,737 | |||
Odyssey HealthCare* (A) | 87,800 | 1,276 | |||
Omnicell* | 136,349 | 1,391 | |||
OncoGenex Pharmaceutical* | 1,800 | 57 | |||
Onyx Pharmaceuticals* (A) | 28,357 | 811 | |||
Orthofix International* | 7,600 | 230 | |||
OSI Pharmaceuticals* | 21,652 | 721 | |||
Par Pharmaceutical* | 95,770 | 2,272 | |||
Parexel International* | 33,000 | 396 | |||
Patterson* (A) | 15,459 | 397 | |||
PDL BioPharma (A) | 436,094 | 2,835 | |||
PerkinElmer | 20,500 | 387 | |||
Pharmaceutical Product Development | 22,993 | 493 | |||
PharMerica* | 13,400 | 202 | |||
Phase Forward* | 222,175 | 3,390 | |||
Pozen* | 191,613 | 1,353 | |||
Providence Service* | 19,200 | 268 | |||
PSS World Medical* (A) | 45,566 | 882 | |||
Psychiatric Solutions* | 39,300 | 871 | |||
Quality Systems | 17,205 | 1,023 | |||
Questcor Pharmaceuticals* | 153,300 | 659 | |||
Quidel* (A) | 122,923 | 1,545 | |||
RehabCare Group* | 7,954 | 224 | |||
Res-Care* | 111,500 | 1,431 | |||
Rigel Pharmaceuticals* (A) | 236,100 | 1,787 | |||
Savient Pharmaceuticals* | 5,400 | 72 | |||
Seattle Genetics* | 54,506 | 506 | |||
| 6 | SEI Institutional Investments Trust / Semi-Annual Report / November 30, 2009 |
Table of Contents
SCHEDULE OF INVESTMENTS (Unaudited)
Small Cap Fund
November 30, 2009
Description | Shares | Market Value ($ Thousands) | |||
Sirona Dental Systems* | 12,100 | $ | 352 | ||
Skilled Healthcare Group, Cl A* | 50,800 | 345 | |||
Somanetics* | 27,136 | 389 | |||
SonoSite* | 18,700 | 422 | |||
STERIS | 45,300 | 1,464 | |||
Sun Healthcare Group* | 60,000 | 508 | |||
Symmetry Medical* | 8,000 | 64 | |||
Techne | 26,580 | 1,804 | |||
Teleflex | 25,966 | 1,353 | |||
Theravance* | 43,405 | 571 | |||
Thoratec* | 77,326 | 2,303 | |||
United Therapeutics* | 54,168 | 2,469 | |||
Universal American Financial* | 65,700 | 681 | |||
Universal Health Services, Cl B | 13,600 | 760 | |||
Valeant Pharmaceuticals International* | 11,600 | 379 | |||
Varian* | 33,300 | 1,705 | |||
Viropharma* | 56,242 | 425 | |||
Volcano* | 30,770 | 453 | |||
WellCare Health Plans* | 22,400 | 739 | |||
Wright Medical Group* | 26,873 | 484 | |||
Zoll Medical* | 12,800 | 315 | |||
| 141,368 | |||||
Industrials — 16.5% | |||||
AAR* | 11,100 | 207 | |||
ACCO Brands* | 119,700 | 782 | |||
Acuity Brands (A) | 50,200 | 1,621 | |||
Administaff | 36,400 | 811 | |||
Advisory Board* (A) | 43,185 | 1,131 | |||
Aegean Marine Petroleum Network | 175,830 | 4,726 | |||
AerCap Holdings* | 257,411 | 2,111 | |||
Aerovironment* | 40,183 | 1,155 | |||
Airtran Holdings* | 735,361 | 3,030 | |||
Alamo Group | 18,900 | 281 | |||
Alaska Air Group* | 28,500 | 852 | |||
Allen-Vanguard* | 1,478,300 | — | |||
Alliant Techsystems* | 16,675 | 1,429 | |||
American Ecology | 15,681 | 254 | |||
Ameron International | 20,800 | 1,185 | |||
Ampco-Pittsburgh | 19,200 | 561 | |||
AO Smith | 23,800 | 998 | |||
APAC Customer Services* | 102,000 | 533 | |||
Apogee Enterprises | 107,700 | 1,475 | |||
Applied Industrial Technologies | 85,800 | 1,781 | |||
Arkansas Best (A) | 67,800 | 1,669 | |||
Armstrong World Industries* | 16,900 | 700 | |||
Astec Industries* (A) | 56,200 | 1,403 | |||
ATC Technology* | 55,192 | 1,216 | |||
Atlas Air Worldwide Holdings* | 60,454 | 1,771 | |||
Avis Budget Group* | 128,900 | 1,257 | |||
Barnes Group | 130,970 | 2,031 | |||
BE Aerospace* | 67,310 | 1,297 | |||
Beacon Roofing Supply* | 50,700 | 779 | |||
Belden | 43,365 | 959 | |||
Bowne | 2,540 | 15 | |||
Brady, Cl A | 23,954 | 711 | |||
Briggs & Stratton | 69,415 | 1,309 | |||
Brink’s | 12,600 | 283 | |||
CAE | 11,100 | 252 | |||
Carlisle | 33,500 | 1,076 | |||
Celadon Group* | 160,939 | 1,540 | |||
Description | Shares | Market Value ($ Thousands) | |||
Cenveo* | 78,711 | $ | 604 | ||
Ceradyne* | 27,100 | 458 | |||
Chart Industries* | 48,300 | 802 | |||
Chicago Bridge & Iron | 27,595 | 485 | |||
CIRCOR International | 3,200 | 77 | |||
Clean Harbors* | 7,542 | 404 | |||
Columbus McKinnon* | 72,966 | 1,146 | |||
Comfort Systems USA (A) | 193,700 | 2,206 | |||
Continental Airlines, Cl B* | 95,100 | 1,356 | |||
Con-way | 14,569 | 442 | |||
Copa Holdings, Cl A | 18,672 | 930 | |||
Copart* (A) | 79,912 | 2,591 | |||
Cornell* | 57,630 | 1,266 | |||
CoStar Group* (A) | 112,929 | 4,487 | |||
Courier | 15,245 | 199 | |||
CRA International* | 105,224 | 2,617 | |||
Crane | 40,300 | 1,126 | |||
Cubic | 58,300 | 2,030 | |||
Deluxe | 60,100 | 775 | |||
Diamond Management & Technology Consultants, Cl A | 77,300 | 503 | |||
DryShips | 166,200 | 1,017 | |||
Dycom Industries* | 81,292 | 633 | |||
Dynamic Materials | 1,900 | 36 | |||
DynCorp International, Cl A* | 57,000 | 797 | |||
EMCOR Group* | 234,218 | 5,574 | |||
Encore Wire | 36,100 | 718 | |||
EnerNOC* | 32,375 | 857 | |||
EnerSys* | 49,500 | 1,127 | |||
Ennis | 28,321 | 410 | |||
EnPro Industries* (A) | 44,200 | 1,014 | |||
Esterline Technologies* | 25,500 | 1,030 | |||
Fastenal | 15,000 | 556 | |||
Federal Signal | 2,700 | 16 | |||
Force Protection* | 194,300 | 1,003 | |||
Forward Air | 53,455 | 1,211 | |||
FTI Consulting* | 48,950 | 2,264 | |||
G&K Services, Cl A | 46,715 | 1,032 | |||
Gardner Denver | 76,177 | 2,851 | |||
GATX (A) | 14,100 | 407 | |||
Genco Shipping & Trading (A) | 11,200 | 263 | |||
General Cable* (A) | 16,705 | 491 | |||
Genesee & Wyoming, Cl A* | 33,675 | 1,048 | |||
Geo Group* | 121,445 | 2,414 | |||
GeoEye* (A) | 98,071 | 3,057 | |||
Gibraltar Industries | 48,527 | 727 | |||
GrafTech International* | 8,100 | 119 | |||
Graham | 60,372 | 1,119 | |||
Granite Construction (A) | 78,400 | 2,350 | |||
Great Lakes Dredge & Dock | 211,400 | 1,245 | |||
Griffon* | 42,500 | 442 | |||
GT Solar International* | 24,500 | 116 | |||
H&E Equipment Services* (A) | 111,700 | 1,034 | |||
Hawaiian Holdings* | 53,700 | 336 | |||
Healthcare Services Group | 72,874 | 1,435 | |||
Heico, Cl A | 16,287 | 521 | |||
Hexcel* | 49,600 | 523 | |||
Hill International* | 5,500 | 34 | |||
HNI | 21,600 | 546 | |||
Horizon Lines, Cl A | 243,923 | 1,305 | |||
Hubbell, Cl B | 4,400 | 200 | |||
Hudson Highland Group* | 116,000 | 466 | |||
ICF International* | 55,019 | 1,486 | |||
| 7 | SEI Institutional Investments Trust / Semi-Annual Report / November 30, 2009 |
Table of Contents
SCHEDULE OF INVESTMENTS (Unaudited)
Small Cap Fund
November 30, 2009
Description | Shares | Market Value ($ Thousands) | |||
IDEX (A) | 58,707 | $ | 1,740 | ||
IHS, Cl A* | 35,570 | 1,789 | |||
II-VI* | 24,067 | 685 | |||
Innerworkings* (A) | 304,716 | 1,566 | |||
Insteel Industries | 8,700 | 99 | |||
Interface, Cl A | 47,382 | 364 | |||
John Bean Technologies | 19,400 | 333 | |||
Kadant* | 28,440 | 410 | |||
Kaman | 13,767 | 312 | |||
Kansas City Southern* (A) | 16,569 | 474 | |||
Kaydon (A) | 65,278 | 2,321 | |||
Kelly Services, Cl A (A) | 42,376 | 445 | |||
Kforce* | 57,900 | 750 | |||
Kirby* | 62,300 | 2,078 | |||
Knight Transportation (A) | 54,384 | 925 | |||
Knoll | 49,500 | 481 | |||
Korn/Ferry International* | 38,600 | 626 | |||
Ladish* | 3,300 | 46 | |||
Landstar System | 55,000 | 2,053 | |||
LB Foster, Cl A* | 13,200 | 362 | |||
LECG* | 249,100 | 760 | |||
Lincoln Electric Holdings | 9,800 | 504 | |||
LS Starrett, Cl A | 1,700 | 16 | |||
Lydall* | 26,660 | 151 | |||
Marten Transport* | 16,800 | 283 | |||
McDermott International* | 26,000 | 544 | |||
Mcgrath Rentcorp | 11,279 | 233 | |||
Michael Baker* | 41,200 | 1,568 | |||
Mine Safety Appliances | 32,928 | 815 | |||
Mistras Group* | 17,090 | 208 | |||
Monster Worldwide* (A) | 149,975 | 2,191 | |||
MPS Group* | 149,500 | 2,041 | |||
Mueller Industries | 107,000 | 2,516 | |||
MYR Group* (A) | 67,186 | 1,050 | |||
NACCO Industries, Cl A | 12,100 | 611 | |||
Navistar International* | 24,500 | 809 | |||
NCI Building Systems* | 116,200 | 216 | |||
Northwest Pipe* | 600 | 15 | |||
Old Dominion Freight Line* | 63,259 | 1,675 | |||
Orbital Sciences* | 58,100 | 728 | |||
Pacer International (A) | 144,595 | 411 | |||
Powell Industries* | 12,200 | 428 | |||
Quanex Building Products | 110,875 | 1,797 | |||
Quanta Services* | 29,016 | 544 | |||
Rand Logistics* | 34,000 | 107 | |||
Raven Industries | 20,700 | 559 | |||
Regal-Beloit | 7,700 | 365 | |||
Resources Connection* | 84,222 | 1,623 | |||
Ritchie Bros Auctioneers | 60,020 | 1,430 | |||
RSC Holdings* (A) | 161,000 | 1,024 | |||
Rush Enterprises, Cl A* | 91,393 | 984 | |||
Ryder System (A) | 37,700 | 1,528 | |||
Sauer-Danfoss | 18,200 | 157 | |||
School Specialty* (A) | 82,523 | 1,882 | |||
Silvercorp Metals* | 135,700 | 1,008 | |||
Silvercorp Metals PIPE* | 59,400 | 441 | |||
Skywest | 54,264 | 798 | |||
Spherion* | 44,400 | 232 | |||
Spirit Aerosystems Holdings, Cl A* (A) | 76,200 | 1,389 | |||
Standard Parking* | 99,429 | 1,601 | |||
Standard Register | 32,494 | 147 | |||
Stanley* | 30,275 | 808 | |||
Description | Shares | Market Value ($ Thousands) | |||
Steelcase, Cl A (A) | 41,300 | $ | 225 | ||
SYKES Enterprises* (A) | 40,400 | 992 | |||
TAL International Group (A) | 91,600 | 1,251 | |||
TBS International, Cl A* | 44,400 | 344 | |||
Teledyne Technologies* | 51,599 | 1,729 | |||
Terex* (A) | 141,177 | 2,658 | |||
Tetra Tech* | 48,952 | 1,289 | |||
Textainer Group Holdings | 81,500 | 1,300 | |||
Titan International | 132,295 | 1,095 | |||
Titan Machinery* | 85,644 | 962 | |||
TransDigm Group | 78,777 | 3,415 | |||
Tredegar | 37,805 | 545 | |||
Trex* | 6,700 | 120 | |||
Triumph Group (A) | 14,233 | 683 | |||
TrueBlue* | 115,100 | 1,400 | |||
Tutor Perini* | 20,506 | 341 | |||
UAL* | 177,400 | 1,377 | |||
United Rentals* | 20,200 | 186 | |||
Universal Forest Products | 21,100 | 758 | |||
US Airways Group* | 130,600 | 482 | |||
Viad | 4,600 | 85 | |||
Vitran, Cl A* | 72,810 | 647 | |||
Wabtec | 62,000 | 2,387 | |||
Watson Wyatt Worldwide, Cl A (A) | 68,984 | 2,852 | |||
Watts Water Technologies, Cl A (A) | 29,883 | 916 | |||
Werner Enterprises | 43,800 | 817 | |||
WESCO International* (A) | 136,074 | 3,552 | |||
Woodward Governor (A) | 68,800 | 1,600 | |||
YRC Worldwide* (A) | 65,300 | 74 | |||
| 199,663 | |||||
Information Technology — 18.3% | |||||
3Com* | 135,900 | 1,002 | |||
ACI Worldwide* | 5,000 | 82 | |||
Actel* | 103,500 | 1,207 | |||
Actuate* | 51,900 | 209 | |||
Acxiom* | 39,700 | 458 | |||
ADC Telecommunications* | 35,400 | 217 | |||
Advanced Energy Industries* | 193,779 | 2,118 | |||
Advent Software* (A) | 24,206 | 918 | |||
Akamai Technologies* (A) | 63,600 | 1,526 | |||
Amkor Technology* | 97,900 | 543 | |||
Ancestry.com* (A) | 90,478 | 1,190 | |||
Anixter International* (A) | 19,017 | 822 | |||
Ansys* | 15,896 | 619 | |||
Applied Micro Circuits* | 30,100 | 224 | |||
Archipelago Learning* | 39,649 | 733 | |||
Ariba* | 207,630 | 2,251 | |||
Arris Group* (A) | 304,360 | 3,040 | |||
Arrow Electronics* | 58,400 | 1,535 | |||
Art Technology Group* | 468,708 | 1,894 | |||
AsiaInfo Holdings* | 35,900 | 883 | |||
Atheros Communications* | 69,903 | 1,990 | |||
Atmel* | 407,330 | 1,617 | |||
ATMI* | 100,400 | 1,561 | |||
Avocent* | 15,407 | 385 | |||
Benchmark Electronics* | 199,600 | 3,599 | |||
Black Box | 38,864 | 1,096 | |||
Blackboard* | 76,545 | 3,194 | |||
Blue Coat Systems* | 11,300 | 299 | |||
Brightpoint* | 149,400 | 1,073 | |||
| 8 | SEI Institutional Investments Trust / Semi-Annual Report / November 30, 2009 |
Table of Contents
SCHEDULE OF INVESTMENTS (Unaudited)
Small Cap Fund
November 30, 2009
Description | Shares | Market Value ($ Thousands) | |||
Brocade Communications Systems* | 114,700 | $ | 813 | ||
CACI International, Cl A* | 37,912 | 1,760 | |||
CDC Software ADR* | 173,700 | 1,668 | |||
Checkpoint Systems* | 36,486 | 517 | |||
Ciber* | 416,234 | 1,319 | |||
Cirrus Logic* | 95,466 | 518 | |||
Cogent* | 4,800 | 41 | |||
Cognex | 38,992 | 642 | |||
Cogo Group* | 52,200 | 297 | |||
Coherent* | 69,227 | 1,760 | |||
CommScope* | 60,435 | 1,519 | |||
Compuware* | 110,700 | 768 | |||
comScore* | 1,243 | 20 | |||
Comtech Telecommunications* (A) | 35,492 | 1,020 | |||
Comverse Technology* | 169,600 | 1,492 | |||
Concur Technologies* (A) | 5,146 | 191 | |||
Convergys* | 17,600 | 197 | |||
CPI International* | 9,766 | 94 | |||
CSG Systems International* | 86,793 | 1,680 | |||
CTS | 105,957 | 982 | |||
Cypress Semiconductor* | 20,900 | 200 | |||
Daktronics | 25,500 | 216 | |||
DealerTrack Holdings* (A) | 166,387 | 2,839 | |||
Diebold | 24,484 | 616 | |||
Digi International* | 144,100 | 1,137 | |||
Digital River* | 66,115 | 1,668 | |||
Dolby Laboratories, Cl A* | 13,900 | 622 | |||
Double-Take Software* | 60,500 | 532 | |||
DragonWave* | 86,686 | 867 | |||
DSP Group* | 120,141 | 756 | |||
DTS* | 169,751 | 5,116 | |||
Earthlink (A) | 296,300 | 2,439 | |||
EF Johnson Technologies* | 93,700 | 103 | |||
Electro Rent | 12,171 | 123 | |||
Electronic Arts* | 19,967 | 337 | |||
Electronics for Imaging* | 23,457 | 282 | |||
Emulex* | 173,737 | 1,692 | |||
Epicor Software* | 3,600 | 27 | |||
EPIQ Systems* (A) | 52,056 | 674 | |||
Equinix* | 20,835 | 2,004 | |||
Euronet Worldwide* | 88,615 | 1,882 | |||
Fair Isaac (A) | 88,500 | 1,615 | |||
FLIR Systems* | 36,250 | 1,040 | |||
Formfactor* | 85,523 | 1,450 | |||
Forrester Research* | 14,300 | 358 | |||
Gartner* | 82,345 | 1,558 | |||
GSI Commerce* (A) | 100,937 | 2,255 | |||
Heartland Payment Systems | 154,952 | 1,656 | |||
Hittite Microwave* | 12,100 | 456 | |||
Hutchinson Technology* | 24,489 | 174 | |||
i2 Technologies* | 36,100 | 664 | |||
IAC* | 12,700 | 247 | |||
Imation (A) | 363,206 | 3,185 | |||
Insight Enterprises* | 89,000 | 903 | |||
Integral Systems* | 152,527 | 1,356 | |||
Integrated Device Technology* | 11,500 | 65 | |||
Intermec* | 130,351 | 1,602 | |||
IXYS | 22,800 | 147 | |||
j2 Global Communications* | 15,500 | 308 | |||
Jabil Circuit | 16,600 | 221 | |||
Jack Henry & Associates | 51,800 | 1,184 | |||
Description | Shares | Market Value ($ Thousands) | |||
JDA Software Group* | 68,500 | $ | 1,608 | ||
JDS Uniphase* | 3,800 | 28 | |||
Knot* (A) | 214,010 | 2,042 | |||
Lam Research* | 25,700 | 874 | |||
Lawson Software* (A) | 402,805 | 2,638 | |||
LeCroy* | 71,700 | 294 | |||
Lexmark International, Cl A* | 68,900 | 1,734 | |||
Linear Technology | 23,900 | 645 | |||
Littelfuse* (A) | 27,521 | 720 | |||
LivePerson* | 18,300 | 116 | |||
LTX-Credence* | 194,200 | 262 | |||
Manhattan Associates* | 128,700 | 3,032 | |||
Mantech International, Cl A* | 60,132 | 2,603 | |||
Marvell Technology Group* | 30,800 | 475 | |||
MAXIMUS | 78,500 | 3,650 | |||
Methode Electronics (A) | 176,292 | 1,403 | |||
Micrel | 34,000 | 243 | |||
Microsemi* (A) | 120,035 | 1,828 | |||
MicroStrategy, Cl A* | 28,641 | 2,508 | |||
MKS Instruments* | 59,835 | 906 | |||
ModusLink Global Solutions* | 24,817 | 200 | |||
MoneyGram International* | 76,000 | 189 | |||
Monotype Imaging Holdings* | 173,473 | 1,343 | |||
Move* | 140,503 | 216 | |||
MTS Systems | 17,599 | 454 | |||
Multi-Fineline Electronix* | 20,550 | 512 | |||
NCR* | 45,200 | 425 | |||
Ness Technologies* | 37,900 | 192 | |||
Net 1 UEPS Technologies* | 88,411 | 1,652 | |||
Netgear* | 123,200 | 2,445 | |||
Netlogic Microsystems* (A) | 48,653 | 1,985 | |||
NetSuite* | 79,758 | 1,114 | |||
Novatel Wireless* (A) | 158,800 | 1,331 | |||
Novell* | 323,200 | 1,264 | |||
Nuance Communications* (A) | 57,708 | 877 | |||
Omnivision Technologies* | 95,000 | 1,326 | |||
Openwave Systems* | 89,000 | 210 | |||
Orbotech* | 134,900 | 1,319 | |||
OSI Systems* | 71,200 | 1,455 | |||
Palm* | 19,500 | 213 | |||
Parametric Technology* | 73,226 | 1,103 | |||
Park Electrochemical | 68,400 | 1,618 | |||
Parkervision* (A) | 311,000 | 566 | |||
Plantronics | 25,600 | 593 | |||
Power Integrations | 42,811 | 1,438 | |||
Progress Software* | 57,900 | 1,395 | |||
QLogic* | 8,800 | 158 | |||
Quantum* | 671,424 | 1,638 | |||
Quest Software* | 80,523 | 1,355 | |||
Radisys* (A) | 82,900 | 773 | |||
RADWARE* | 33,500 | 438 | |||
RealNetworks* | 34,200 | 112 | |||
RF Micro Devices* | 96,900 | 419 | |||
Richardson Electronics | 25,765 | 153 | |||
RightNow Technologies* | 23,541 | 333 | |||
Riverbed Technology* | 7,300 | 149 | |||
Rogers* | 12,636 | 356 | |||
Rosetta Stone* | 71,448 | 1,260 | |||
Rubicon Technology* (A) | 49,226 | 857 | |||
Rudolph Technologies* (A) | 119,400 | 776 | |||
Sapient* | 315,760 | 2,324 | |||
SAVVIS* | 84,342 | 1,056 | |||
Scansource* | 31,200 | 726 | |||
| 9 | SEI Institutional Investments Trust / Semi-Annual Report / November 30, 2009 |
Table of Contents
SCHEDULE OF INVESTMENTS (Unaudited)
Small Cap Fund
November 30, 2009
Description | Shares | Market Value ($ Thousands) | |||
Seachange International* | 167,400 | $ | 934 | ||
Semtech* | 34,300 | 549 | |||
Sigma Designs* | 5,100 | 60 | |||
Silicon Image* | 94,000 | 206 | |||
Skyworks Solutions* | 19,600 | 241 | |||
Smith Micro Software* | 71,440 | 452 | |||
Solera Holdings | 66,628 | 2,329 | |||
Sourcefire* | 26,908 | 528 | |||
SRA International, Cl A* (A) | 153,227 | 2,766 | |||
Standard Microsystems* | 56,771 | 1,092 | |||
Starent Networks* | 2,500 | 86 | |||
STEC* | 19,800 | 245 | |||
Stratasys* (A) | 34,914 | 519 | |||
SuccessFactors* | 49,950 | 752 | |||
Sybase* (A) | 29,685 | 1,195 | |||
Synaptics* | 14,300 | 385 | |||
Synchronoss Technologies* | 101,275 | 1,365 | |||
SYNNEX* (A) | 35,700 | 1,011 | |||
Synopsys* | 13,266 | 298 | |||
Take-Two Interactive Software* | 32,600 | 367 | |||
Taleo, Cl A* | 101,806 | 2,103 | |||
Tech Data* | 47,200 | 1,988 | |||
Technitrol | 53,500 | 271 | |||
Techwell* | 48,300 | 563 | |||
Tekelec* | 28,614 | 407 | |||
TeleTech Holdings* | 31,000 | 598 | |||
Teradyne* | 352,213 | 3,121 | |||
Tessera Technologies* | 44,373 | 1,050 | |||
THQ* | 51,711 | 253 | |||
TIBCO Software* | 195,100 | 1,678 | |||
TiVo* | 17,200 | 170 | |||
Trimble Navigation* (A) | 124,350 | 2,777 | |||
TriQuint Semiconductor* | 40,300 | 219 | |||
TTM Technologies* (A) | 141,300 | 1,465 | |||
Tyler Technologies* (A) | 11,000 | 220 | |||
Ultra Clean Holdings* | 68,900 | 410 | |||
Ultratech* | 100,900 | 1,330 | |||
Unisys* | 43,780 | 1,405 | |||
United Online | 121,700 | 828 | |||
Valueclick* | 62,500 | 589 | |||
Varian Semiconductor Equipment Associates* (A) | 32,600 | 950 | |||
Vasco Data Security International* | 15,300 | 101 | |||
Veeco Instruments* (A) | 93,987 | 2,567 | |||
VeriFone Holdings* | 700 | 9 | |||
Verigy* | 151,897 | 1,580 | |||
Vishay Intertechnology* | 31,700 | 230 | |||
VistaPrint* | 104,055 | 5,934 | |||
Vocus* | 107,028 | 1,749 | |||
Volterra Semiconductor* | 13,800 | 228 | |||
Web.com Group* | 51,800 | 308 | |||
Websense* | 134,150 | 2,110 | |||
Wright Express* | 27,300 | 796 | |||
Xyratex* | 46,200 | 521 | |||
Zebra Technologies, Cl A* | 65,032 | 1,730 | |||
Zoran* | 174,186 | 1,592 | |||
| 221,316 | |||||
Materials — 4.2% | |||||
A. Schulman | 55,782 | 910 | |||
AEP Industries* | 9,800 | 370 | |||
AK Steel Holding | 33,275 | 665 | |||
Allied Nevada Gold* (A) | 136,300 | 1,772 | |||
Description | Shares | Market Value ($ Thousands) | |||
AM Castle | 30,669 | $ | 402 | ||
AMCOL International (A) | 27,400 | 747 | |||
Aptargroup | 48,631 | 1,757 | |||
Arch Chemicals | 25,818 | 692 | |||
Brush Engineered Materials* | 6,200 | 110 | |||
Buckeye Technologies* | 52,300 | 506 | |||
Cabot | 16,578 | 380 | |||
Carpenter Technology (A) | 81,300 | 1,885 | |||
Century Aluminum* | 28,500 | 278 | |||
Coeur d’Alene Mines* | 17,600 | 401 | |||
Commercial Metals | 68,415 | 1,088 | |||
Crown Holdings* | 57,420 | 1,445 | |||
Cytec Industries | 12,173 | 414 | |||
Domtar* | 8,900 | 502 | |||
Eagle Materials (A) | 18,500 | 499 | |||
Ferro | 26,506 | 171 | |||
Gammon Gold* | 50,800 | 587 | |||
General Steel Holdings* | 72,657 | 291 | |||
Glatfelter | 51,510 | 573 | |||
H.B. Fuller | 126,358 | 2,573 | |||
Haynes International | 29,000 | 777 | |||
Headwaters* | 78,875 | 372 | |||
Hecla Mining* | 43,500 | 288 | |||
Innophos Holdings | 22,600 | 560 | |||
Intrepid Potash* | 24,946 | 759 | |||
Jaguar Mining* (A) | 122,100 | 1,426 | |||
Kaiser Aluminum | 24,300 | 939 | |||
Koppers Holdings | 62,522 | 1,766 | |||
LSB Industries* | 6,000 | 73 | |||
Myers Industries | 68,193 | 564 | |||
Nalco Holding | 73,695 | 1,803 | |||
Neenah Paper | 23,994 | 334 | |||
New Gold* (A) | 425,500 | 1,523 | |||
NewMarket | 31,375 | 3,286 | |||
Olin (A) | 103,827 | 1,741 | |||
Olympic Steel | 7,400 | 205 | |||
OM Group* (A) | 90,064 | 2,759 | |||
PolyOne* | 104,700 | 752 | |||
Quaker Chemical | 28,200 | 550 | |||
Rock-Tenn, Cl A | 12,200 | 551 | |||
Rockwood Holdings* | 15,600 | 351 | |||
RTI International Metals* | 77,333 | 1,532 | |||
Schweitzer-Mauduit International | 6,800 | 419 | |||
Sensient Technologies (A) | 73,500 | 1,862 | |||
Silgan Holdings | 13,378 | 717 | |||
Solutia* | 23,500 | 253 | |||
Spartech | 36,390 | 396 | |||
Stepan | 700 | 44 | |||
Stillwater Mining* | 30,800 | 293 | |||
Universal Stainless & Alloy* | 71,000 | 1,152 | |||
US Gold* | 70,900 | 201 | |||
Wausau Paper | 14,400 | 146 | |||
Westlake Chemical | 2,400 | 63 | |||
Worthington Industries | 93,900 | 1,100 | |||
WR Grace* | 93,871 | 2,146 | |||
Zep | 200 | 3 | |||
| 50,724 | |||||
Telecommunication Services — 1.4% | |||||
Alaska Communications Systems Group | 51,464 | 376 | |||
Atlantic Telegraph-Network | 12,100 | 567 | |||
| 10 | SEI Institutional Investments Trust / Semi-Annual Report / November 30, 2009 |
Table of Contents
SCHEDULE OF INVESTMENTS (Unaudited)
Small Cap Fund
November 30, 2009
Description | Shares | Market Value ($ Thousands) | |||
Cbeyond* (A) | 47,506 | $ | 613 | ||
Cincinnati Bell* | 259,400 | 773 | |||
Cogent Communications Group* | 28,800 | 245 | |||
Consolidated Communications Holdings | 25,186 | 383 | |||
Global Crossing* | 27,900 | 315 | |||
Iowa Telecommunications Services | 37,979 | 604 | |||
Leap Wireless International* (A) | 101,800 | 1,469 | |||
Neutral Tandem* (A) | 169,966 | 3,921 | |||
SBA Communications, Cl A* | 135,441 | 4,340 | |||
Sprint Nextel* | 110,437 | 410 | |||
Syniverse Holdings* | 27,000 | 428 | |||
tw telecom , Cl A* | 133,320 | 1,940 | |||
USA Mobility | 83,700 | 835 | |||
| 17,219 | |||||
Utilities — 3.7% | |||||
AGL Resources | 23,975 | 828 | |||
Allete (A) | 66,340 | 2,218 | |||
Avista (A) | 37,000 | 770 | |||
Black Hills | 29,100 | 686 | |||
Central Vermont Public Service | 16,000 | 311 | |||
Cia de Saneamento de Minas Gerais-COPASA (Brazil) | 75,400 | 1,299 | |||
Cleco | 75,000 | 1,914 | |||
El Paso Electric* | 229,900 | 4,552 | |||
Empire District Electric | 96,492 | 1,750 | |||
Great Plains Energy | 108,981 | 1,940 | |||
Hawaiian Electric Industries | 21,900 | 435 | |||
IDACORP | 55,356 | 1,637 | |||
ITC Holdings | 24,651 | 1,096 | |||
Laclede Group | 4,000 | 125 | |||
Mirant* | 32,000 | 456 | |||
New Jersey Resources | 2,400 | 85 | |||
Nicor | 26,000 | 1,018 | |||
Northwest Natural Gas (A) | 15,400 | 661 | |||
NorthWestern | 226,981 | 5,854 | |||
Portland General Electric (A) | 307,075 | 6,022 | |||
RRI Energy* | 51,000 | 251 | |||
South Jersey Industries | 12,954 | 467 | |||
UGI | 42,700 | 1,003 | |||
UIL Holdings | 49,100 | 1,324 | |||
Unisource Energy | 119,458 | 3,562 | |||
Vectren | 89,800 | 2,109 | |||
Westar Energy | 92,626 | 1,907 | |||
WGL Holdings (A) | 8,300 | 261 | |||
| 44,541 | |||||
Total Common Stock | 1,163,998 | ||||
PREFERRED STOCK — 0.2% | |||||
Consumer Discretionary — 0.1% | |||||
Callaway Golf (B) | 11,100 | 1,307 | |||
Financials — 0.1% | |||||
Grubb & Ellis* | 6,600 | 660 | |||
Total Preferred Stock | 1,967 | ||||
Description | Shares | Market Value ($ Thousands) | |||
CONVERTIBLE BONDS — 0.3% | |||||
Consumer Discretionary — 0.0% | |||||
Eddie Bauer Holdings | |||||
5.250%, 04/01/14 (C) | 3,147 | $ | 315 | ||
Energy — 0.2% | |||||
Nova Biosource Fuels | |||||
10.000%, 09/30/12 (B) (C) | 3,332 | 333 | |||
Rentech | |||||
4.000%, 04/15/13 | 1,795 | 1,367 | |||
Scorpio Mining (H) (I) (J) | |||||
7.000%, 05/05/11 | 887 | 781 | |||
| 2,481 | |||||
Financials — 0.1% | |||||
World Acceptance | |||||
3.000%, 10/01/11 | 475 | 424 | |||
Total Convertible Bonds | 3,220 | ||||
AFFILIATED PARTNERSHIP — 16.2% | |||||
SEI Liquidity Fund, L.P. | |||||
0.320%** † (G) | 201,493,152 | 195,330 | |||
Total Affiliated Partnership | 195,330 | ||||
WARRANTS — 0.0% | |||||
Oilsands Quest, Expires 05/12/11* | 247,050 | 111 | |||
Oilsands Quest, Expires 12/08/09* | 17,500 | — | |||
Rentech, Expires 04/25/12* (H) (I) (J) | 16,100 | 6 | |||
Titanium Asset Management, Expires 06/21/11* (J) | 122,200 | — | |||
Washington Mutual (D) | 17,435 | 1 | |||
Total Warrants | 118 | ||||
EXCHANGE TRADED FUNDS — 0.0% | |||||
iShares Russell 2000 | 3,408 | 198 | |||
Midcap SPDR Trust Series 1 | 4,115 | 513 | |||
Total Exchange Traded Funds | 711 | ||||
Number Of Rights | |||||
RIGHT — 0.0% | |||||
United States — 0.0% | |||||
Ligand Pharma, | 64,529 | — | |||
Total Right | — | ||||
| 11 | SEI Institutional Investments Trust / Semi-Annual Report / November 30, 2009 |
Table of Contents
SCHEDULE OF INVESTMENTS (Unaudited)
Small Cap Fund
November 30, 2009
Description | Shares/Face Amount ($ Thousands) | Market Value ($ Thousands) | ||||
CASH EQUIVALENT — 3.3% | ||||||
SEI Daily Income Trust, Prime Obligation Fund, Cl A, 0.130%** † | 39,871 | $ | 39,871 | |||
Total Cash Equivalent | 39,871 | |||||
U.S. TREASURY OBLIGATIONS (E) (F) — 0.4% | ||||||
U.S. Treasury Bills | ||||||
0.142%, 12/03/09 | $ | 3,070 | 3,070 | |||
0.068%, 01/07/10 | 1,800 | 1,800 | ||||
Total U.S. Treasury Obligations | 4,870 | |||||
Total Investments — 116.8% | $ | 1,410,085 | ||||
A summary of the open futures contracts held by the Fund at November 30, 2009, is as follows:
Type of Contract | Number of Long (Short) | Expiration Date | Unrealized Appreciation ($ Thousands) | ||||
Russell 2000 Index E- Mini | 461 | Dec-2009 | $ | 369 | |||
For the year ended November 30, 2009, the total amount of all open futures contracts, as presented in the table above, are representative of the volume of activity for this derivative type during the period.
Percentages are based on a Net Assets of $1,206,896 ($ Thousands)
| (A) | This security or a partial position of this security is on loan at November 30, 2009. The total value of securities on loan at November 30, 2009 was $150,257 ($ Thousands). |
| (B) | Securities sold within terms of a private placement memorandum, exempt from registration under Section 144A of the Securities Act of 1933, as amended, and may be sold only to dealers in that program or other “accredited investors.” These securities have been determined to be liquid under guidelines established by the Board of Trustees. |
| (C) | Security in default on interest payments. Security is non-income producing. |
| (D) | This warrant represents a potential distribution settlement in a legal claim and does not have a strike price or expiration date. |
| (E) | Rate shown is the effective yield at time of purchase. |
| (F) | Security, or a portion thereof, has been pledged as collateral on open futures contracts. |
| (G) | This security was purchased with cash collateral held from securities on loan (see Note 11). The total value of such securities as of November 30, 2009 was $195,330 ($ Thousands). |
| (H) | Securities considered illiquid. The total value of such securities as of November 30, 2009 was $800 ($ Thousands) and represents 0.1% of net assets. |
| (I) | Securities considered restricted. The total value of such securities as of November 30, 2009 was $800 ($ Thousands) and represents 0.1% of net assets. |
| (J) | Security fair valued using methods determined in good faith by the Valuation Committee of the Board of Trustees. The total value of such securities as of November 30, 2009 was $1,182 ($ Thousands) and represents 0.1% of net assets. |
| * | Non-income producing security. |
| ** | The rate reported is the 7-day effective yield as of November 30, 2009. |
| † | Investment in Affiliated Security. |
| ‡ | Real Estate Investment Trust |
ADR — American Depositary Receipt
Cl — Class
CV — Convertible Security
LLC — Limited Liability Company
L.P. — Limited Partnership
PIPE — Private Investment in Public Entity
Restricted Securities — At November 30, 2009, the Fund owned private placement investments that were purchased through private offerings or acquired through initial public offerings and cannot be sold without prior registration under the Securities Act of 1933 or pursuant to an exemption there form. In addition, the Fund has generally agreed to further restrictions on the disposition of certain holdings as set forth in various agreements entered into in connection with the purchase of these investments. These investments are valued at fair value as determined in accordance with the procedures approved by the Board of Trustees. The acquisition dates of these investments, along with their cost and values at November 30, 2009, were as follows:
| Number of Warrants/ Face Amount ($Thousands)/ Shares | Acquisition Date | Right to Acquire Date | Cost ($Thousands) | Market Value ($Thousands) | % of Net Assets | ||||||||||
Rentech | 16,100 | 4/20/07 | 4/20/07 | $ | — | $ | 6 | 0.0 | % | ||||||
Scorpio Mining | 887 | 5/5/08 | 5/5/08 | 777 | 781 | 0.1 | % | ||||||||
Value Creation | 119,600 | 2/29/08 | 2/29/08 | 1,225 | 13 | 0.0 | % | ||||||||
| $ | 2,002 | $ | 800 | 0.1 | % | ||||||||||
| 12 | SEI Institutional Investments Trust / Semi-Annual Report / November 30, 2009 |
Table of Contents
SCHEDULE OF INVESTMENTS (Unaudited)
Small/Mid Cap Equity Fund
November 30, 2009
Description | Shares | Market Value ($ Thousands) | |||
COMMON STOCK — 97.6% | |||||
Consumer Discretionary — 14.8% | |||||
Aaron’s | 43,268 | $ | 1,085 | ||
Abercrombie & Fitch, Cl A | 24,077 | 961 | |||
Advance Auto Parts | 90,817 | 3,569 | |||
American Eagle Outfitters | 426,930 | 6,566 | |||
American Greetings, Cl A (A) | 33,400 | 691 | |||
AnnTaylor Stores* | 53,500 | 748 | |||
Apollo Group, Cl A* | 48,100 | 2,745 | |||
Arctic Cat | 68,000 | 459 | |||
ArvinMeritor | 83,100 | 674 | |||
Autoliv (A) | 36,100 | 1,466 | |||
AutoNation* | 30,858 | 545 | |||
Bally Technologies* | 65,430 | 2,717 | |||
Barnes & Noble | 23,071 | 538 | |||
Beazer Homes USA* (A) | 141,200 | 607 | |||
Bebe Stores | 45,936 | 248 | |||
Bed Bath & Beyond* | 50,300 | 1,879 | |||
Belo, Cl A | 163,911 | 772 | |||
Big 5 Sporting Goods | 44,882 | 733 | |||
Big Lots* (A) | 138,650 | 3,197 | |||
BJ’s Restaurants* (A) | 65,035 | 1,110 | |||
Black & Decker (A) | 25,900 | 1,572 | |||
Blyth | 9,087 | 296 | |||
Bob Evans Farms (A) | 61,900 | 1,564 | |||
Books-A-Million, Cl A | 10,529 | 74 | |||
BorgWarner | 60,552 | 1,829 | |||
Brinker International | 92,600 | 1,278 | |||
Brink’s Home Security Holdings* | 141,550 | 4,632 | |||
Brown Shoe | 114,396 | 1,174 | |||
Buckle | 11,900 | 325 | |||
Buffalo Wild Wings* | 23,010 | 919 | |||
Cabela’s* (A) | 74,000 | 892 | |||
Callaway Golf (A) | 272,702 | 1,955 | |||
Capella Education* | 58,770 | 4,189 | |||
Career Education* (A) | 82,923 | 2,158 | |||
Carmax* (A) | 73,131 | 1,454 | |||
Carter’s* | 202,551 | 4,406 | |||
Cato, Cl A | 189,974 | 3,634 | |||
CEC Entertainment* (A) | 71,408 | 2,082 | |||
Century Casinos* | 360,269 | 908 | |||
Cheesecake Factory* | 108,648 | 2,046 | |||
Chipotle Mexican Grill, Cl A* | 2,900 | 242 | |||
Christopher & Banks | 78,897 | 450 | |||
Citi Trends* | 48,520 | 1,324 | |||
CKE Restaurants | 18,006 | 152 | |||
Coinstar* | 38,600 | 1,034 | |||
Coldwater Creek* | 117,623 | 499 | |||
Cooper Tire & Rubber | 178,094 | 3,191 | |||
Corinthian Colleges* | 169,260 | 2,508 | |||
Cracker Barrel Old Country Store (A) | 83,908 | 3,152 | |||
Dana Holdings* | 40,202 | 293 | |||
Darden Restaurants | 64,059 | 2,013 | |||
DeVry | 24,364 | 1,323 | |||
Dick’s Sporting Goods* (A) | 304,324 | 6,318 | |||
Dillard’s, Cl A (A) | 116,300 | 1,976 | |||
DineEquity | 62,741 | 1,337 | |||
Discovery Communications, Cl C* | 17,419 | 488 | |||
Dollar Tree* | 2,900 | 142 | |||
Domino’s Pizza* | 44,698 | 352 | |||
DR Horton (A) | 127,850 | 1,314 | |||
Description | Shares | Market Value ($ Thousands) | |||
DreamWorks Animation SKG, Cl A* | 129,300 | $ | 4,328 | ||
DSW, Cl A* (A) | 89,400 | 2,087 | |||
Eastman Kodak | 402,119 | 1,629 | |||
Entercom Communications, Cl A* | 110,824 | 685 | |||
Ethan Allen Interiors | 68,412 | 794 | |||
Family Dollar Stores (A) | 66,600 | 2,032 | |||
Federal Mogul, Cl A* | 37,084 | 501 | |||
FGX International Holdings* | 59,300 | 979 | |||
Focus Media Holding ADR* | 214,460 | 2,694 | |||
Foot Locker | 253,101 | 2,402 | |||
Fossil* | 13,900 | 429 | |||
GameStop, Cl A* (A) | 189,365 | 4,622 | |||
Gannett (A) | 216,504 | 2,141 | |||
Garmin (A) | 28,384 | 848 | |||
Genesco* | 94,210 | 2,463 | |||
Goodyear Tire & Rubber* | 42,021 | 576 | |||
Grand Canyon Education* | 119,331 | 2,288 | |||
H&R Block | 159,539 | 3,239 | |||
Hanesbrands* | 255,900 | 6,144 | |||
Harley-Davidson (A) | 113,807 | 3,316 | |||
Hasbro | 63,700 | 1,889 | |||
hhgregg* | 48,873 | 946 | |||
Hibbett Sports* (A) | 132,454 | 2,505 | |||
Hillenbrand | 11,900 | 218 | |||
Hooker Furniture (A) | 11,300 | 138 | |||
HOT Topic* | 263,000 | 1,510 | |||
HSN* | 14,332 | 257 | |||
Hyatt Hotels, Cl A* (A) | 43,100 | 1,239 | |||
Iconix Brand Group* | 32,000 | 360 | |||
Interactive Data | 78,979 | 2,017 | |||
Interpublic Group* | 308,624 | 1,954 | |||
Interval Leisure Group* | 29,623 | 339 | |||
J Crew Group* | 108,535 | 4,644 | |||
Jackson Hewitt Tax Service | 26,500 | 110 | |||
Jarden | 173,425 | 4,761 | |||
Jo-Ann Stores* | 27,500 | 917 | |||
Jones Apparel Group | 300,677 | 5,096 | |||
Journal Communications, Cl A | 45,133 | 158 | |||
Landry’s Restaurants* (A) | 11,100 | 236 | |||
La-Z-Boy, Cl Z | 57,744 | 552 | |||
Liberty Global* | 31,046 | 602 | |||
Liberty Media - Interactive, Cl A* | 24,327 | 259 | |||
Life Time Fitness* (A) | 214,910 | 4,857 | |||
Lincoln Educational Services* | 91,600 | 2,026 | |||
Live Nation* | 563,196 | 4,032 | |||
Liz Claiborne | 96,385 | 402 | |||
LKQ* | 89,500 | 1,560 | |||
Lumber Liquidators* | 42,100 | 994 | |||
Maidenform Brands* | 13,628 | 197 | |||
Mattel | 98,926 | 1,925 | |||
MDC Holdings | 15,833 | 470 | |||
Men’s Wearhouse | 21,242 | 433 | |||
Meritage Homes* | 103,360 | 1,843 | |||
MGM Mirage* (A) | 147,137 | 1,555 | |||
Morningstar* (A) | 60,995 | 2,828 | |||
National CineMedia | 375,560 | 5,487 | |||
National Presto Industries | 1,635 | 152 | |||
Navitas | 161,443 | 556 | |||
NetFlix* | 23,600 | 1,384 | |||
New York Times, Cl A | 7,695 | 65 | |||
Newell Rubbermaid (A) | 56,800 | 824 | |||
Nordstrom | 126,601 | 4,235 | |||
NutriSystem | 69,500 | 1,716 | |||
| 1 | SEI Institutional Investments Trust / Semi-Annual Report / November 30, 2009 |
Table of Contents
SCHEDULE OF INVESTMENTS (Unaudited)
Small/Mid Cap Equity Fund
November 30, 2009
Description | Shares | Market Value ($ Thousands) | |||
NVR* | 4,136 | $ | 2,784 | ||
O’Charleys* | 37,572 | 241 | |||
Office Depot* | 79,544 | 488 | |||
OfficeMax (A) | 209,321 | 2,215 | |||
Oxford Industries | 49,747 | 1,067 | |||
Penn National Gaming* (A) | 85,285 | 2,285 | |||
Penske Auto Group | 62,900 | 930 | |||
Perry Ellis International* | 34,092 | 477 | |||
PetSmart | 325,507 | 8,379 | |||
PF Chang’s China Bistro* (A) | 47,683 | 1,555 | |||
Phillips-Van Heusen | 94,674 | 3,787 | |||
Pinnacle Entertainment* | 19,200 | 203 | |||
Polaris Industries | 67,625 | 2,950 | |||
Pre-Paid Legal Services* (A) | 9,200 | 350 | |||
priceline.com* | 8,300 | 1,777 | |||
Pulte Homes | 333,352 | 3,047 | |||
RadioShack (A) | 116,200 | 2,192 | |||
RC2* | 157,271 | 2,155 | |||
Red Robin Gourmet Burgers* (A) | 44,000 | 687 | |||
Regal Entertainment Group, Cl A | 107,097 | 1,467 | |||
Regis (A) | 161,740 | 2,533 | |||
Rent-A-Center, Cl A* | 84,962 | 1,503 | |||
Retail Ventures* | 183,106 | 1,426 | |||
Ross Stores | 20,144 | 886 | |||
Rossi Residencial | 308,980 | 2,600 | |||
Ruby Tuesday* (A) | 79,800 | 505 | |||
Rue21* | 93,210 | 2,303 | |||
Ryland Group (A) | 61,782 | 1,131 | |||
Saks* | 330,100 | 2,017 | |||
Scholastic (A) | 80,740 | 2,035 | |||
Scientific Games, Cl A* | 406,137 | 5,747 | |||
Sherwin-Williams | 9,442 | 574 | |||
Shutterfly* (A) | 144,480 | 2,072 | |||
Signet Jewelers* | 16,702 | 432 | |||
Sinclair Broadcast Group, Cl A | 93,100 | 342 | |||
Skechers U.S.A., Cl A* | 14,093 | 311 | |||
Sonic Automotive, Cl A | 87,698 | 776 | |||
Spartan Motors | 79,309 | 411 | |||
Spectrum Group International* | 3,929 | 10 | |||
Stage Stores | 95,604 | 1,156 | |||
Stamps.com* | 8,756 | 78 | |||
Standard Pacific* (A) | 368,681 | 1,176 | |||
Starwood Hotels & Resorts Worldwide (A) | 99,502 | 3,186 | |||
Stein Mart* | 21,173 | 217 | |||
Strayer Education (A) | 13,211 | 2,609 | |||
Systemax | 14,542 | 224 | |||
Tempur-Pedic International* | 65,145 | 1,404 | |||
Tenneco* (A) | 150,437 | 2,169 | |||
Thunderbird Resorts* (B) | 146,710 | 117 | |||
Tractor Supply* (A) | 20,808 | 972 | |||
TRW Automotive Holdings* | 83,312 | 1,813 | |||
Tupperware Brands | 45,610 | 2,123 | |||
Universal Electronics* | 7,100 | 153 | |||
Urban Outfitters* | 60,610 | 1,918 | |||
Valassis Communications* | 17,723 | 263 | |||
WABCO Holdings | 44,412 | 1,050 | |||
Warnaco Group* | 85,950 | 3,499 | |||
Weight Watchers International | 99,000 | 2,740 | |||
Westport Innovations* | 137,554 | 1,679 | |||
Whirlpool (A) | 21,994 | 1,631 | |||
Williams-Sonoma | 42,700 | 868 | |||
WMS Industries* | 103,836 | 4,037 | |||
Wyndham Worldwide | 13,800 | 256 | |||
Description | Shares | Market Value ($ Thousands) | |||
Zumiez* (A) | 59,435 | $ | 651 | ||
| 311,889 | |||||
Consumer Staples — 3.3% | |||||
Alliance One International* | 98,800 | 471 | |||
American Italian Pasta, Cl A* | 22,204 | 708 | |||
Andersons | 34,221 | 894 | |||
Avon Products | 38,469 | 1,317 | |||
Bare Escentuals* | 24,213 | 310 | |||
Brown-Forman, Cl B | 37,784 | 1,934 | |||
Cal-Maine Foods (A) | 31,900 | 875 | |||
Casey’s General Stores | 66,330 | 2,029 | |||
Central European Distribution* | 36,810 | 1,026 | |||
Central Garden and Pet* | 73,524 | 641 | |||
Central Garden and Pet, Cl A* | 66,227 | 547 | |||
Chiquita Brands International* | 118,410 | 2,012 | |||
Constellation Brands, Cl A* | 40,698 | 696 | |||
Corn Products International | 56,397 | 1,581 | |||
Cosan Industria e Comercio (Brazil)* | 147,400 | 1,738 | |||
Cullen Agricultural Holding* (A)(I) | 38,000 | 257 | |||
Dean Foods* | 346,302 | 5,506 | |||
Del Monte Foods | 226,521 | 2,376 | |||
Dole Food* | 80,303 | 923 | |||
Flowers Foods | 93,100 | 2,131 | |||
Green Mountain Coffee Roasters* | 35,320 | 2,224 | |||
Hansen Natural* | 16,300 | 570 | |||
Herbalife | 133,520 | 5,600 | |||
J&J Snack Foods | 9,404 | 340 | |||
JM Smucker | 40,962 | 2,420 | |||
Kulim Malaysia | 515,000 | 1,116 | |||
Lance (A) | 66,900 | 1,629 | |||
McCormick | 59,746 | 2,132 | |||
Medifast* | 57,150 | 1,542 | |||
Molson Coors Brewing, Cl B | 38,347 | 1,734 | |||
Nash Finch | 10,552 | 346 | |||
NBTY* | 38,300 | 1,537 | |||
Nu Skin Enterprises, Cl A | 10,480 | 281 | |||
Pantry* | 116,551 | 1,723 | |||
Pepsi Bottling Group | 40,800 | 1,548 | |||
PepsiAmericas | 28,200 | 835 | |||
Prestige Brands Holdings* | 35,444 | 247 | |||
Rite Aid* | 664,894 | 851 | |||
Sanderson Farms | 61,799 | 2,483 | |||
Sara Lee | 217,300 | 2,638 | |||
Saskatchewan Wheat Pool, Cl Common Subscription Recei* | 165,700 | 1,674 | |||
Smithfield Foods* | 67,575 | 1,046 | |||
Supervalu (A) | 80,500 | 1,113 | |||
Tyson Foods, Cl A | 123,803 | 1,488 | |||
Weis Markets | 14,789 | 515 | |||
Whole Foods Market* | 20,597 | 528 | |||
| 66,132 | |||||
Energy — 5.2% | |||||
Alpha Natural Resources* | 34,998 | 1,295 | |||
Arena Resources* (A) | 61,616 | 2,520 | |||
Berry Petroleum, Cl A | 122,570 | 3,350 | |||
BPZ Energy PIPE* | 52,200 | 380 | |||
BPZ Resources* (A) | 147,700 | 1,075 | |||
Cal Dive International* | 216,700 | 1,573 | |||
Cameron International* | 36,692 | 1,387 | |||
| 2 | SEI Institutional Investments Trust / Semi-Annual Report / November 30, 2009 |
Table of Contents
SCHEDULE OF INVESTMENTS (Unaudited)
Small/Mid Cap Equity Fund
November 30, 2009
Description | Shares | Market Value ($ Thousands) | |||
Carrizo Oil & Gas* (A) | 51,824 | $ | 1,091 | ||
Clayton Williams Energy* | 8,617 | 244 | |||
Complete Production Services* | 91,000 | 945 | |||
Comstock Resources* | 22,093 | 820 | |||
Concho Resources* (A) | 90,118 | 3,684 | |||
Contango Oil & Gas* | 6,862 | 305 | |||
Continental Resources* | 58,900 | 2,218 | |||
Denbury Resources* | 49,200 | 653 | |||
Dresser-Rand Group* | 142,175 | 3,992 | |||
Encore Acquisition* (A) | 44,966 | 2,024 | |||
ENSCO International | 17,773 | 782 | |||
Exterran Holdings* | 102,186 | 2,141 | |||
Frontier Oil | 68,857 | 794 | |||
Global Industries* | 53,801 | 316 | |||
Goodrich Petroleum* | 95,756 | 2,119 | |||
Gran Tierra Energy* | 32,448 | 185 | |||
Gulfmark Offshore* | 11,653 | 318 | |||
Gulfport Energy* | 135,261 | 1,286 | |||
Helix Energy Solutions Group* | 88,165 | 1,037 | |||
Hornbeck Offshore Services* | 48,454 | 1,105 | |||
Infinity Bio-Energy* (G) (H) | 792,118 | — | |||
James River Coal* | 11,539 | 212 | |||
Karoon Gas Australia* | 98,416 | 693 | |||
Key Energy Services* | 498,334 | 3,797 | |||
Kinder Morgan Escrow* (G) (H) | 24,428 | — | |||
Kinder Morgan Management LLC* | 59,514 | �� | 2,992 | ||
Massey Energy | 69,070 | 2,601 | |||
McMoRan Exploration* | 59,803 | 434 | |||
Murphy Oil | 51,390 | 2,898 | |||
Nabors Industries* | 87,568 | 1,808 | |||
Newfield Exploration* | 45,558 | 1,926 | |||
Nordic American Tanker Shipping | 36,900 | 1,180 | |||
Northern Oil And Gas* (A) | 162,000 | 1,482 | |||
Oceaneering International* | 15,125 | 826 | |||
Oil States International* | 4,763 | 171 | |||
Oilsands Quest* (A) | 1,387,000 | 1,678 | |||
Overseas Shipholding Group (A) | 81,510 | 3,123 | |||
PetroHawk Energy* | 98,564 | 2,202 | |||
Pioneer Natural Resources | 46,748 | 1,933 | |||
Pride International* | 5,577 | 176 | |||
Range Resources | 83,032 | 3,913 | |||
Rentech* (A) | 465,300 | 712 | |||
Rosetta Resources* | 91,200 | 1,436 | |||
SEACOR Holdings* | 17,300 | 1,325 | |||
Ship Finance International | 13,100 | 171 | |||
Southwestern Energy* | 39,913 | 1,755 | |||
Spectra Energy | 98,424 | 1,910 | |||
St. Mary Land & Exploration | 58,310 | 1,888 | |||
Sunoco | 36,200 | 912 | |||
Swift Energy* (A) | 155,281 | 3,334 | |||
T-3 Energy Services, Cl 3* (A) | 48,582 | 1,213 | |||
Teekay | 6,100 | 146 | |||
Tesoro (A) | 120,979 | 1,546 | |||
TGC Industries* | 7,658 | 31 | |||
Tidewater | 62,024 | 2,788 | |||
Unit* | 8,186 | 308 | |||
USEC* (A) | 61,099 | 224 | |||
W&T Offshore (A) | 158,444 | 1,640 | |||
Western Refining* (A) | 88,000 | 409 | |||
Whiting Petroleum* | 68,617 | 4,271 | |||
Willbros Group* (A) | 180,374 | 2,841 | |||
Williams | 20,925 | 416 | |||
Description | Shares | Market Value ($ Thousands) | |||
World Fuel Services | 124,249 | $ | 6,608 | ||
| 107,568 | |||||
Financials — 17.9% | |||||
1st Source | 800 | 11 | |||
Advance America Cash Advance Centers | 104,300 | 653 | |||
Affiliated Managers Group* (A) | 66,602 | 4,343 | |||
Alexander’s‡ * | 635 | 177 | |||
Alexandria Real Estate Equities‡ | 10,197 | 575 | |||
Allied Capital | 26,700 | 94 | |||
Allied World Assurance Holdings | 78,700 | 3,761 | |||
AMB Property‡ (A) | 189,500 | 4,463 | |||
Amcore Financial* (A) | 44,386 | 20 | |||
American Capital Agency‡ | 18,267 | 484 | |||
American Equity Investment Life Holding | 62,389 | 457 | |||
American Financial Group | 215,335 | 5,224 | |||
AmeriCredit* | 20,664 | 381 | |||
Ameriprise Financial | 85,057 | 3,242 | |||
AMERISAFE* | 29,500 | 498 | |||
Annaly Capital Management‡ | 152,000 | 2,798 | |||
Anthracite Capital‡ (A) | 70,500 | 27 | |||
Anworth Mortgage Asset‡ | 262,500 | 1,890 | |||
Apartment Investment & Management, Cl A‡ (A) | 207,758 | 2,807 | |||
Arch Capital Group* (A) | 42,166 | 2,945 | |||
Artio Global Investors, Cl A* | 66,900 | 1,532 | |||
Aspen Insurance Holdings (A) | 77,300 | 2,003 | |||
Associated Banc (A) | 36,400 | 413 | |||
Assured Guaranty (A) | 51,640 | 1,171 | |||
AvalonBay Communities‡ (A) | 44,463 | 3,212 | |||
Banco Latinoamericano de Comercio Exterior, Cl E | 80,200 | 1,120 | |||
Bancorpsouth | 47,408 | 1,100 | |||
Bank Mutual | 30,600 | 214 | |||
Bank of Hawaii | 14,334 | 655 | |||
BGC Partners, Cl A | 248,644 | 1,052 | |||
BioMed Realty Trust‡ | 65,700 | 899 | |||
BlackRock, Cl A | 1,859 | 422 | |||
Boston Private Financial Holdings | 31,618 | 148 | |||
Boston Properties‡ (A) | 144,995 | 9,712 | |||
Brandywine Realty Trust‡ | 10,159 | 100 | |||
Brasil Brokers Participacoes | 450,100 | 1,490 | |||
Calamos Asset Management, Cl A | 33,949 | 357 | |||
CapitalSource | 565,960 | 2,077 | |||
Capstead Mortgage‡ | 158,400 | 2,262 | |||
Cardinal Financial | 258,988 | 2,194 | |||
Cardtronics* | 355,224 | 3,925 | |||
CB Richard Ellis Group, Cl A* | 142,128 | 1,625 | |||
CBL & Associates Properties‡ | 100,253 | 928 | |||
Central Pacific Financial (A) | 45,600 | 37 | |||
Chemical Financial | 20,942 | 493 | |||
Cincinnati Financial | 31,800 | 811 | |||
CNA Surety* | 13,424 | 181 | |||
Cogdell Spencer‡ | 283,000 | 1,429 | |||
Colonial Properties Trust‡ | 105,150 | 1,137 | |||
Comerica | 127,747 | 3,637 | |||
Commerce Bancshares | 1 | — | |||
Community Bank System | 25,725 | 477 | |||
Conseco* | 15,854 | 76 | |||
Corporate Office Properties Trust‡ (A) | 54,550 | 1,865 | |||
| 3 | SEI Institutional Investments Trust / Semi-Annual Report / November 30, 2009 |
Table of Contents
SCHEDULE OF INVESTMENTS (Unaudited)
Small/Mid Cap Equity Fund
November 30, 2009
Description | Shares | Market Value ($ Thousands) | |||
CreXus Investment‡ * | 52,700 | $ | 701 | ||
Cullen/Frost Bankers | 13,384 | 643 | |||
CVB Financial | 53,000 | 411 | |||
Delphi Financial Group, Cl A | 38,448 | 840 | |||
Developers Diversified Realty‡ (A) | 106,620 | 1,079 | |||
DiamondRock Hospitality‡ | 50,030 | 402 | |||
Digital Realty Trust‡ (A) | 29,150 | 1,418 | |||
Dime Community Bancshares | 34,685 | 390 | |||
Dollar Financial* (A) | 61,200 | 1,495 | |||
Douglas Emmett‡ (A) | 233,200 | 3,199 | |||
Duff & Phelps, Cl A | 91,055 | 1,545 | |||
DuPont Fabros Technology‡ | 31,764 | 509 | |||
Eaton Vance | 41,747 | 1,258 | |||
Education Realty Trust‡ | 393,756 | 1,949 | |||
E-House China Holdings ADR* (A) | 49,628 | 965 | |||
EMC Insurance Group | 16,067 | 334 | |||
Employers Holdings | 180,856 | 2,769 | |||
Endurance Specialty Holdings | 105,241 | 3,935 | |||
Entertainment Properties Trust‡ (A) | 39,000 | 1,232 | |||
Equity Lifestyle Properties‡ | 28,959 | 1,390 | |||
Equity One‡ | 108,824 | 1,758 | |||
Equity Residential‡ | 122,900 | 3,959 | |||
Essex Property Trust‡ (A) | 57,350 | 4,574 | |||
Everest Re Group | 26,000 | 2,213 | |||
Extra Space Storage‡ | 189,750 | 2,085 | |||
Federal Realty Investment Trust‡ (A) | 64,290 | 4,135 | |||
Federated Investors, Cl B | 22,192 | 572 | |||
Fidelity National Financial, Cl A | 76,334 | 1,060 | |||
Fifth Third Bancorp | 179,499 | 1,809 | |||
Financial Federal | 49,700 | 1,347 | |||
First Bancorp | 152,148 | 236 | |||
First Busey (A) | 160,636 | 527 | |||
First Cash Financial Services* | 10,014 | 191 | |||
First Commonwealth Financial | 15,500 | 66 | |||
First Community Bancshares | 15,522 | 171 | |||
First Financial Bancorp | 275,521 | 3,662 | |||
First Financial Holdings | 62,400 | 836 | |||
First Horizon National* | 209,705 | 2,842 | |||
First Mercury Financial | 19,606 | 254 | |||
First Midwest Bancorp (A) | 48,500 | 506 | |||
First Niagara Financial Group | 24,200 | 319 | |||
FirstMerit (A) | 118,359 | 2,480 | |||
Flushing Financial | 234,700 | 2,561 | |||
General Shopping Brasil (Brazil)* | 159,200 | 738 | |||
General Shopping Brazil (Brazil)* | 148,600 | 689 | |||
Getty Realty‡ | 21,160 | 481 | |||
GFI Group | 413,285 | 2,009 | |||
Glimcher Realty Trust‡ | 89,019 | 262 | |||
Gluskin Sheff + Associates | 57,900 | 1,116 | |||
Great Southern Bancorp | 9,783 | 220 | |||
Greenlight Capital Re, Cl A* | 14,497 | 351 | |||
Grubb & Ellis* | 663,560 | 975 | |||
Hancock Holding (A) | 95,259 | 3,944 | |||
Hanover Insurance Group | 104,908 | 4,367 | |||
HCP‡ | 196,850 | 6,161 | |||
Health Care REIT‡ (A) | 77,196 | 3,439 | |||
Hercules Technology Growth Capital | 94,618 | 932 | |||
Highwoods Properties‡ (A) | 38,900 | 1,191 | |||
Description | Shares | Market Value ($ Thousands) | |||
Horace Mann Educators | 135,085 | $ | 1,624 | ||
Hospitality Properties Trust‡ | 79,800 | 1,549 | |||
Host Hotels & Resorts‡ (A) | 295,650 | 3,110 | |||
HRPT Properties Trust‡ | 466,731 | 2,866 | |||
Hudson City Bancorp | 44,884 | 596 | |||
Hudson Valley Holding | 61,600 | 1,611 | |||
Huntington Bancshares (A) | 245,800 | 939 | |||
Iberiabank (A) | 28,406 | 1,611 | |||
Independent Bank | 18,554 | 379 | |||
Infinity Property & Casualty | 53,189 | 2,125 | |||
Inland Real Estate‡ | 179,351 | 1,408 | |||
International Assets Holding* | 12,599 | 208 | |||
International Bancshares | 46,817 | 785 | |||
Investment Technology Group* (A) | 53,835 | 982 | |||
Investors Bancorp* | 56,825 | 626 | |||
Investors Real Estate Trust‡ (A) | 195,500 | 1,722 | |||
Jones Lang LaSalle | 66,302 | 3,373 | |||
Kansas City Life Insurance | 19,100 | 514 | |||
KBW* (A) | 29,146 | 717 | |||
Keycorp | 266,450 | 1,561 | |||
Kilroy Realty‡ | 17,400 | 524 | |||
Knight Capital Group, Cl A* | 108,380 | 1,587 | |||
Lazard, Cl A | 41,000 | 1,589 | |||
Liberty Property Trust‡ | 74,163 | 2,198 | |||
LTC Properties‡ | 22,000 | 566 | |||
Macerich‡ (A) | 107,724 | 3,206 | |||
Mack-Cali Realty‡ | 85,562 | 2,626 | |||
MarketAxess Holdings | 347,354 | 4,325 | |||
MB Financial | 55,100 | 1,028 | |||
Meadowbrook Insurance Group | 184,100 | 1,261 | |||
Medical Properties Trust‡ (A) | 134,300 | 1,300 | |||
MFA Mortgage Investments‡ | 577,287 | 4,370 | |||
MGIC Investment* (A) | 213,466 | 854 | |||
Mid-America Apartment Communities‡ | 28,281 | 1,315 | |||
Montpelier Re Holdings (A) | 75,900 | 1,270 | |||
MSCI, Cl A* | 76,977 | 2,345 | |||
National Health Investors‡ | 21,225 | 700 | |||
National Penn Bancshares (A) | 367,056 | 2,026 | |||
National Retail Properties‡ (A) | 69,093 | 1,385 | |||
Nationwide Health Properties‡ | 90,209 | 3,068 | |||
Navigators Group* | 9,963 | 464 | |||
New York Community Bancorp | 45,190 | 528 | |||
NewAlliance Bancshares | 180,171 | 2,122 | |||
NorthStar Realty Finance‡ | 81,624 | 277 | |||
NYSE Euronext | 9,425 | 238 | |||
Old National Bancorp | 176,800 | 2,058 | |||
Old Republic International | 17,564 | 187 | |||
Omega Healthcare Investors‡ | 29,519 | 534 | |||
optionsXpress Holdings | 28,113 | 430 | |||
Oriental Financial Group | 50,000 | 485 | |||
PacWest Bancorp (A) | 121,885 | 2,243 | |||
PartnerRe (A) | 35,673 | 2,748 | |||
Penson Worldwide* (A) | 54,630 | 490 | |||
People’s United Financial | 139,819 | 2,278 | |||
PHH* | 119,035 | 1,645 | |||
Piper Jaffray* | 9,911 | 430 | |||
Platinum Underwriters Holdings (A) | 97,535 | 3,442 | |||
Plum Creek Timber‡ | 7,900 | 272 | |||
Post Properties‡ (A) | 164,308 | 3,028 | |||
Presidential Life | 14,200 | 145 | |||
ProAssurance* | 33,332 | 1,775 | |||
Prospect Capital (A) | 159,800 | 1,739 | |||
| 4 | SEI Institutional Investments Trust / Semi-Annual Report / November 30, 2009 |
Table of Contents
SCHEDULE OF INVESTMENTS (Unaudited)
Small/Mid Cap Equity Fund
November 30, 2009
Description | Shares | Market Value ($ Thousands) | |||
Prosperity Bancshares | 28,252 | $ | 1,125 | ||
Protective Life | 45,279 | 749 | |||
PS Business Parks‡ | 23,426 | 1,114 | |||
Public Storage‡ (A) | 82,004 | 6,527 | |||
Radian Group (A) | 191,692 | 857 | |||
RAIT Financial Trust‡ (A) | 69,000 | 107 | |||
Raymond James Financial | 69,100 | 1,678 | |||
Rayonier‡ | 26,140 | 1,039 | |||
Redwood Trust‡ | 84,456 | 1,214 | |||
Regions Financial | 217,200 | 1,273 | |||
Reinsurance Group of America, Cl A | 110,034 | 5,117 | |||
Riskmetrics Group* (A) | 339,329 | 5,067 | |||
RLI | 8,700 | 439 | |||
S&T Bancorp | 23,500 | 375 | |||
Saul Centers‡ | 36,150 | 1,116 | |||
Selective Insurance Group | 41,000 | 640 | |||
Senior Housing Properties Trust‡ | 174,333 | 3,621 | |||
Signature Bank NY* | 155,492 | 4,817 | |||
Simmons First National, Cl A | 6,600 | 167 | |||
Simon Property Group‡ | 83,314 | 6,054 | |||
SL Green Realty‡ | 33,800 | 1,501 | |||
South Financial Group (A) | 162,244 | 99 | |||
Sovran Self Storage‡ (A) | 51,700 | 1,671 | |||
StanCorp Financial Group | 59,214 | 2,197 | |||
Stifel Financial* | 29,511 | 1,585 | |||
Strategic Hotels & Resorts‡* | 299,380 | 509 | |||
Sunstone Hotel Investors‡ (A) | 337,073 | 2,730 | |||
Susquehanna Bancshares (A) | 96,950 | 556 | |||
SVB Financial Group* | 45,725 | 1,731 | |||
SWS Group | 41,300 | 514 | |||
Synovus Financial | 953,371 | 1,859 | |||
Tanger Factory Outlet Centers‡ | 5,713 | 224 | |||
TCF Financial (A) | 61,600 | 809 | |||
TD Ameritrade Holding* | 54,324 | 1,067 | |||
Titanium Asset Management* | 42,000 | 104 | |||
Titanium Asset Management* (G) (H) (I) | 105,000 | 306 | |||
Tower Group | 23,200 | 573 | |||
Transatlantic Holdings | 30,446 | 1,645 | |||
Trustco Bank | 112,300 | 692 | |||
Trustmark (A) | 84,003 | 1,610 | |||
Unitrin | 73,100 | 1,631 | |||
Unum Group | 219,535 | 4,180 | |||
Uranium Participation* | 250,100 | 1,561 | |||
U-Store-It Trust‡ | 186,632 | 1,215 | |||
Validus Holdings | 62,341 | 1,652 | |||
Value Creation* (G) (H) (I) | 85,600 | 9 | |||
Ventas‡ (A) | 111,443 | 4,784 | |||
Vornado Realty Trust‡ (A) | 41,989 | 2,749 | |||
Waddell & Reed Financial, Cl A | 83,551 | 2,434 | |||
Washington Federal (A) | 128,610 | 2,450 | |||
Washington Real Estate Investment Trust‡ (A) | 16,340 | 426 | |||
Weingarten Realty Investors‡ (A) | 55,600 | 1,079 | |||
Westamerica Bancorporation | 8,200 | 436 | |||
Western Alliance Bancorp* (A) | 229,918 | 913 | |||
White Mountains Insurance Group | 3,510 | 1,144 | |||
Whitney Holding (A) | 219,790 | 1,769 | |||
Willis Group Holdings | 74,997 | 2,036 | |||
World Acceptance* (A) | 115,177 | 3,378 | |||
WR Berkley (A) | 48,300 | 1,193 | |||
Description | Shares | Market Value ($ Thousands) | |||
Zions Bancorporation (A) | 330,551 | $ | 4,347 | ||
| 372,977 | |||||
Health Care — 12.4% | |||||
Abaxis* | 14,286 | 321 | |||
Acadia Pharmaceuticals* | 351,200 | 432 | |||
Achillion Pharmaceuticals* | 273,967 | 575 | |||
Acorda Therapeutics* | 110,540 | 2,662 | |||
Affymax* | 41,700 | 850 | |||
Affymetrix* | 38,165 | 181 | |||
AGA Medical Holdings* (A) | 56,250 | 702 | |||
Albany Molecular Research* | 26,300 | 221 | |||
Alexion Pharmaceuticals* | 98,226 | 4,455 | |||
Align Technology* (A) | 45,868 | 751 | |||
Alkermes* | 132,600 | 1,191 | |||
Allscripts-Misys Healthcare Solutions* | 97,160 | 1,866 | |||
Almost Family* | 43,100 | 1,557 | |||
AMAG Pharmaceuticals* (A) | 39,551 | 1,479 | |||
Amedisys* | 10,400 | 385 | |||
American Medical Systems Holdings* | 35,697 | 627 | |||
AMERIGROUP* (A) | 79,537 | 1,886 | |||
AmerisourceBergen | 183,758 | 4,537 | |||
AMN Healthcare Services* | 116,938 | 934 | |||
Amsurg, Cl A* (A) | 206,177 | 4,270 | |||
Amylin Pharmaceuticals* | 110,307 | 1,573 | |||
Analogic | 5,005 | 203 | |||
Angiodynamics* | 39,346 | 612 | |||
Arena Pharmaceuticals* (A) | 374,145 | 1,358 | |||
Arqule* | 56,163 | 202 | |||
Array Biopharma* | 159,850 | 275 | |||
athenahealth* | 46,640 | 1,954 | |||
Auxilium Pharmaceuticals* | 58,900 | 2,054 | |||
Beckman Coulter | 17,493 | 1,136 | |||
Biogen Idec* | 18,800 | 882 | |||
BioMarin Pharmaceutical* (A) | 102,856 | 1,698 | |||
BioScrip* | 27,091 | 204 | |||
Boston Scientific* | 265,700 | 2,224 | |||
Bruker* | 18,900 | 214 | |||
Cadence Pharmaceuticals* (A) | 95,574 | 821 | |||
Catalyst Health Solutions* | 111,595 | 3,795 | |||
Centene* | 100,700 | 1,895 | |||
Cephalon* | 35,005 | 1,923 | |||
Cepheid* (A) | 56,783 | 703 | |||
Charles River Laboratories International* | 68,033 | 2,187 | |||
Chemed | 21,077 | 952 | |||
Community Health Systems* | 11,964 | 365 | |||
Conceptus* (A) | 128,725 | 2,179 | |||
Conmed* | 153,973 | 3,201 | |||
Cooper | 97,346 | 3,260 | |||
Corvel* | 3,162 | 95 | |||
Covance* | 32,225 | 1,711 | |||
Coventry Health Care* | 115,354 | 2,601 | |||
Cubist Pharmaceuticals* | 84,193 | 1,404 | |||
Dendreon* (A) | 112,962 | 3,088 | |||
Dentsply International | 50,000 | 1,666 | |||
Dyax* | 74,994 | 280 | |||
Electro-Optical Sciences* (A) | 87,515 | 919 | |||
Emergency Medical Services, Cl A* | 17,750 | 856 | |||
Endo Pharmaceuticals Holdings* | 99,273 | 2,187 | |||
Enzo Biochem* | 16,877 | 87 | |||
| 5 | SEI Institutional Investments Trust / Semi-Annual Report / November 30, 2009 |
Table of Contents
SCHEDULE OF INVESTMENTS (Unaudited)
Small/Mid Cap Equity Fund
November 30, 2009
Description | Shares | Market Value ($ Thousands) | |||
eResearch Technology* | 67,393 | $ | 398 | ||
ev3* | 304,300 | 3,865 | |||
Exelixis* | 47,419 | 324 | |||
Forest Laboratories* | 141,600 | 4,341 | |||
Genoptix* | 62,380 | 2,261 | |||
Gen-Probe* | 45,150 | 1,882 | |||
Genzyme* | 7,348 | 373 | |||
Greatbatch* | 79,319 | 1,459 | |||
Health Grades* | 23,959 | 105 | |||
Health Management Associates, Cl A* | 56,900 | 349 | |||
Health Net* | 171,445 | 3,638 | |||
Healthsouth* | 131,400 | 2,305 | |||
Henry Schein* | 30,201 | 1,500 | |||
Hill-Rom Holdings | 144,928 | 3,215 | |||
Hologic* | 85,603 | 1,239 | |||
Human Genome Sciences* (A) | 36,052 | 1,003 | |||
Humana* | 32,600 | 1,353 | |||
ICON ADR* | 132,100 | 2,999 | |||
ICU Medical* | 60,482 | 1,996 | |||
Idexx Laboratories* (A) | 51,183 | 2,562 | |||
Illumina* | 47,500 | 1,374 | |||
Impax Laboratories* | 40,374 | 457 | |||
Incyte* (A) | 471,780 | 3,930 | |||
Inspire Pharmaceuticals* | 226,398 | 1,318 | |||
Intuitive Surgical* | 2,585 | 725 | |||
inVentiv Health* | 37,487 | 594 | |||
Inverness Medical Innovations* | 104,113 | 4,378 | |||
Kendle International* | 32,551 | 487 | |||
Kensey Nash* | 37,329 | 869 | |||
Kindred Healthcare* | 42,127 | 626 | |||
Kinetic Concepts* (A) | 141,338 | 4,765 | |||
King Pharmaceuticals* (A) | 566,174 | 6,698 | |||
Laboratory Corp of America Holdings* | 21,200 | 1,547 | |||
LHC Group* (A) | 159,697 | 4,914 | |||
Life Technologies* | 5,200 | 259 | |||
LifePoint Hospitals* | 94,406 | 2,741 | |||
Ligand Pharmaceuticals, Cl B* | 163,147 | 323 | |||
Lincare Holdings* | 28,580 | 1,015 | |||
Martek Biosciences* | 40,238 | 700 | |||
Maxygen* | 40,179 | 219 | |||
MedAssets* | 78,035 | 1,821 | |||
Medicines* | 269,800 | 2,115 | |||
Medicis Pharmaceutical, Cl A | 19,669 | 464 | |||
Mednax* | 92,375 | 5,192 | |||
Meridian Bioscience | 35,400 | 733 | |||
Millipore* | 5,350 | 364 | |||
MWI Veterinary Supply* (A) | 83,022 | 3,079 | |||
Mylan Laboratories* | 226,029 | 4,039 | |||
Myriad Genetics* | 98,570 | 2,279 | |||
Neogen* (A) | 37,255 | 1,212 | |||
Nighthawk Radiology Holdings* | 44,105 | 230 | |||
NPS Pharmaceuticals* | 67,323 | 212 | |||
NuVasive* | 108,700 | 3,527 | |||
Odyssey HealthCare* | 106,200 | 1,543 | |||
Omnicell* | 177,444 | 1,810 | |||
Onyx Pharmaceuticals* | 130,850 | 3,744 | |||
OSI Pharmaceuticals* | 125,824 | 4,191 | |||
Osiris Therapeutics* | 24,770 | 167 | |||
Owens & Minor | 66,090 | 2,564 | |||
Par Pharmaceutical* | 76,062 | 1,804 | |||
Parexel International* | 179,400 | 2,155 | |||
Patterson* | 88,512 | 2,276 | |||
PDL BioPharma (A) | 344,195 | 2,237 | |||
Description | Shares | Market Value ($ Thousands) | |||
PerkinElmer | 199,491 | $ | 3,764 | ||
Perrigo | 47,800 | 1,919 | |||
Pharmaceutical Product Development | 65,793 | 1,411 | |||
Phase Forward* | 187,605 | 2,863 | |||
Providence Service* | 18,708 | 262 | |||
Psychiatric Solutions* | 71,330 | 1,581 | |||
Quality Systems (A) | 23,192 | 1,380 | |||
Questcor Pharmaceuticals* | 87,844 | 378 | |||
Quidel* (A) | 186,169 | 2,340 | |||
Regeneron Pharmaceuticals* | 82,600 | 1,516 | |||
Res-Care* | 141,800 | 1,819 | |||
ResMed* | 19,725 | 992 | |||
Rigel Pharmaceuticals* (A) | 289,700 | 2,193 | |||
Sciclone Pharmaceuticals* | 59,477 | 127 | |||
Seattle Genetics* | 109,340 | 1,015 | |||
Sirona Dental Systems* | 63,521 | 1,849 | |||
SonoSite* | 12,259 | 277 | |||
STERIS | 56,517 | 1,826 | |||
SXC Health Solutions* | 71,790 | 3,639 | |||
Symmetry Medical* | 61,133 | 490 | |||
Techne | 49,670 | 3,372 | |||
Teleflex | 48,186 | 2,510 | |||
Theravance* | 66,035 | 869 | |||
Thoratec* (A) | 53,084 | 1,581 | |||
United Therapeutics* (A) | 74,855 | 3,412 | |||
Universal Health Services, Cl B | 38,327 | 2,142 | |||
US Physical Therapy* | 466 | 7 | |||
Valeant Pharmaceuticals International* | 11,500 | 376 | |||
Vertex Pharmaceuticals* | 38,000 | 1,475 | |||
Vical* | 56,107 | 160 | |||
Viropharma* | 70,200 | 531 | |||
Virtual Radiologic* | 11,023 | 144 | |||
Volcano* | 89,900 | 1,324 | |||
Waters* | 8,025 | 472 | |||
Watson Pharmaceuticals* (A) | 55,390 | 2,054 | |||
Zimmer Holdings* | 24,461 | 1,447 | |||
Zoll Medical* | 3,905 | 95 | |||
| 257,122 | |||||
Industrials — 14.3% | |||||
Actuant, Cl A (A) | 80,962 | 1,322 | |||
Acuity Brands | 48,304 | 1,559 | |||
Administaff | 21,911 | 488 | |||
Aecom Technology* | 74,371 | 1,889 | |||
Aegean Marine Petroleum Network | 94,633 | 2,544 | |||
Air Transport Services Group* | 68,559 | 154 | |||
Aircastle | 56,400 | 500 | |||
Alaska Air Group* | 39,200 | 1,172 | |||
Alexander & Baldwin | 14,037 | 429 | |||
Allegiant Travel, Cl A* | 18,707 | 771 | |||
Allen-Vanguard* (G)(H) | 1,184,500 | — | |||
Alliant Techsystems* | 26,668 | 2,286 | |||
Ameron International | 27,100 | 1,544 | |||
Ametek | 51,366 | 1,878 | |||
AO Smith | 55,460 | 2,325 | |||
Apogee Enterprises | 49,100 | 672 | |||
Applied Industrial Technologies | 90,400 | 1,876 | |||
Arkansas Best | 11,900 | 293 | |||
ATC Technology* | 56,266 | 1,239 | |||
Avery Dennison | 54,937 | 2,063 | |||
Avis Budget Group* | 95,900 | 935 | |||
Baldor Electric (A) | 51,130 | 1,317 | |||
| 6 | SEI Institutional Investments Trust / Semi-Annual Report / November 30, 2009 |
Table of Contents
SCHEDULE OF INVESTMENTS (Unaudited)
Small/Mid Cap Equity Fund
November 30, 2009
Description | Shares | Market Value ($ Thousands) | |||
Barnes Group | 198,730 | $ | 3,082 | ||
BE Aerospace* | 344,225 | 6,633 | |||
Beacon Roofing Supply* | 81,400 | 1,251 | |||
Belden | 64,344 | 1,423 | |||
Bowne | 25,347 | 154 | |||
Brady, Cl A | 50,426 | 1,497 | |||
Briggs & Stratton | 97,215 | 1,833 | |||
Brink’s | 30,396 | 683 | |||
Bucyrus International, Cl A (A) | 59,920 | 3,103 | |||
C.H. Robinson Worldwide | 7,416 | 413 | |||
Carlisle | 72,845 | 2,339 | |||
Chart Industries* | 56,000 | 930 | |||
Chicago Bridge & Iron | 44,487 | 783 | |||
Cintas | 59,538 | 1,672 | |||
Clean Harbors* | 15,244 | 816 | |||
Columbus McKinnon* | 21,815 | 343 | |||
Consolidated Graphics* | 77,690 | 2,292 | |||
Continental Airlines, Cl B* (A) | 285,889 | 4,077 | |||
Con-way | 30,802 | 933 | |||
Copa Holdings, Cl A | 36,214 | 1,804 | |||
Copart* (A) | 132,511 | 4,296 | |||
Corporate Executive Board | 53,903 | 1,130 | |||
Corrections of America* (A) | 227,567 | 5,687 | |||
CoStar Group* (A) | 175,008 | 6,953 | |||
Courier | 32,335 | 422 | |||
CRA International* | 85,400 | 2,124 | |||
Crane (A) | 80,400 | 2,247 | |||
Cubic | 41,114 | 1,432 | |||
Delta Air Lines* | 92,634 | 759 | |||
Deluxe | 122,629 | 1,582 | |||
Dollar Thrifty Automotive Group* | 24,040 | 444 | |||
Dover | 56,985 | 2,330 | |||
Dycom Industries* | 330,379 | 2,574 | |||
EMCOR Group* (A) | 164,969 | 3,926 | |||
Ennis | 17,942 | 260 | |||
EnPro Industries* (A) | 43,700 | 1,003 | |||
Equifax | 50,414 | 1,444 | |||
Esterline Technologies* | 66,266 | 2,676 | |||
Fastenal | 31,527 | 1,169 | |||
Force Protection* | 239,300 | 1,235 | |||
Forward Air | 81,320 | 1,843 | |||
FTI Consulting* | 88,989 | 4,117 | |||
G&K Services, Cl A | 59,874 | 1,323 | |||
Gardner Denver | 280,453 | 10,497 | |||
GATX | 10,600 | 306 | |||
GenCorp* | 39,825 | 311 | |||
General Cable* (A) | 53,288 | 1,564 | |||
Geo Group* | 28,362 | 564 | |||
GeoEye* (A) | 127,214 | 3,965 | |||
Goodrich (A) | 27,800 | 1,650 | |||
Graham | 71,008 | 1,317 | |||
Granite Construction (A) | 33,629 | 1,008 | |||
Great Lakes Dredge & Dock | 495,668 | 2,919 | |||
H&E Equipment Services* | 139,038 | 1,288 | |||
Hansen Transmissions International* | 644,524 | 1,116 | |||
Heidrick & Struggles International (A) | 29,403 | 831 | |||
Hexcel* | 177,345 | 1,871 | |||
Horizon Lines, Cl A | 332,849 | 1,781 | |||
Houston Wire & Cable (A) | 71,300 | 792 | |||
Hubbell, Cl B | 58,884 | 2,674 | |||
ICF International* (A) | 88,208 | 2,382 | |||
ICT Group* | 10,264 | 164 | |||
IDEX | 33,912 | 1,005 | |||
Description | Shares | Market Value ($ Thousands) | |||
IHS, Cl A* | 122,210 | $ | 6,145 | ||
Interface, Cl A | 99,741 | 766 | |||
Interline Brands* | 22,596 | 380 | |||
ITT | 76,863 | 3,975 | |||
Jacobs Engineering Group* | 9,944 | 348 | |||
JB Hunt Transport Services (A) | 166,201 | 5,295 | |||
Joy Global | 8,315 | 445 | |||
Kadant* | 59,863 | 863 | |||
Kaman | 17,304 | 392 | |||
Kansas City Southern* | 34,285 | 982 | |||
Kaydon | 47,677 | 1,695 | |||
Kirby* (A) | 70,211 | 2,341 | |||
Knoll | 102,620 | 998 | |||
Landstar System | 83,455 | 3,115 | |||
Lennox International | 45,700 | 1,696 | |||
Lincoln Electric Holdings | 12,959 | 666 | |||
Localiza Rent a Car | 189,900 | 2,131 | |||
Lydall* | 24,242 | 137 | |||
Manitowoc (A) | 89,534 | 879 | |||
Manpower | 52,804 | 2,601 | |||
Michael Baker* | 38,500 | 1,465 | |||
Mine Safety Appliances | 28,000 | 693 | |||
Mueller Industries | 60,853 | 1,431 | |||
Mueller Water Products, Cl A | 287,812 | 1,451 | |||
MYR Group* (A) | 107,478 | 1,679 | |||
Navistar International* | 33,203 | 1,096 | |||
NCI Building Systems* | 149,200 | 278 | |||
NN* | 85,100 | 325 | |||
Old Dominion Freight Line* | 135,363 | 3,584 | |||
Oshkosh Truck | 42,606 | 1,693 | |||
Paccar | 50,367 | 1,868 | |||
Pacer International | 54,798 | 156 | |||
Pitney Bowes | 78,401 | 1,806 | |||
Quanta Services* | 95,574 | 1,792 | |||
RailAmerica* | 83,650 | 1,071 | |||
Regal-Beloit | 76,500 | 3,631 | |||
Resources Connection* | 334,303 | 6,442 | |||
Ritchie Bros Auctioneers | 90,975 | 2,167 | |||
Robbins & Myers (A) | 48,450 | 1,114 | |||
Rockwell Collins | 33,377 | 1,784 | |||
RR Donnelley & Sons | 130,802 | 2,692 | |||
RSC Holdings* (A) | 187,000 | 1,189 | |||
Rush Enterprises, Cl A* | 225,542 | 2,429 | |||
Ryder System | 17,100 | 693 | |||
Saia* | 26,033 | 375 | |||
School Specialty* | 44,751 | 1,020 | |||
Seaboard | 420 | 611 | |||
Shaw Group* | 37,433 | 1,068 | |||
Silvercorp Metals* | 109,600 | 814 | |||
Skywest | 49,700 | 731 | |||
SMA Solar Technology | 15,935 | 2,123 | |||
Spherion* | 79,420 | 415 | |||
Spirit Aerosystems Holdings, Cl A* | 107,167 | 1,954 | |||
Standard Parking* | 150,695 | 2,426 | |||
Standard Register | 28,668 | 130 | |||
Steelcase, Cl A (A) | 87,200 | 476 | |||
Stericycle* (A) | 22,734 | 1,244 | |||
SYKES Enterprises* | 359,093 | 8,816 | |||
TAL International Group (A) | 120,500 | 1,646 | |||
Tam ADR* | 144,440 | 2,532 | |||
Teledyne Technologies* | 46,631 | 1,563 | |||
Terex* | 149,011 | 2,806 | |||
Tetra Tech* (A) | 58,673 | 1,545 | |||
Textainer Group Holdings (A) | 96,900 | 1,546 | |||
| 7 | SEI Institutional Investments Trust / Semi-Annual Report / November 30, 2009 |
Table of Contents
SCHEDULE OF INVESTMENTS (Unaudited)
Small/Mid Cap Equity Fund
November 30, 2009
Description | Shares | Market Value ($ Thousands) | |||
Thomas & Betts* | 48,083 | $ | 1,755 | ||
Timken | 67,788 | 1,672 | |||
Titan Machinery* | 13,200 | 148 | |||
Toro | 3,724 | 148 | |||
TransDigm Group | 89,710 | 3,888 | |||
Trex* | 100,280 | 1,798 | |||
Triumph Group (A) | 50,697 | 2,433 | |||
Tutor Perini* | 17,100 | 284 | |||
Twin Disc | 15,315 | 145 | |||
UAL* | 281,400 | 2,184 | |||
United Rentals* | 77,894 | 718 | |||
United Stationers* | 30,557 | 1,557 | |||
URS* | 39,703 | 1,650 | |||
US Airways Group* | 323,030 | 1,192 | |||
UTi Worldwide | 85,100 | 1,112 | |||
Wabtec | 93,970 | 3,618 | |||
Silvercorp Metals PIPE* | 135,000 | 1,002 | |||
Waste Connections* | 8,696 | 282 | |||
Watson Wyatt Worldwide, Cl A | 52,590 | 2,174 | |||
Watts Water Technologies, Cl A | 33,572 | 1,029 | |||
WESCO International* | 201,267 | 5,253 | |||
WW Grainger | 3,802 | 371 | |||
| 298,931 | |||||
Information Technology — 17.8% | |||||
3Com* | 326,758 | 2,408 | |||
ADC Telecommunications* (A) | 157,079 | 963 | |||
Advanced Analogic Technologies* | 507,139 | 1,623 | |||
Advanced Energy Industries* | 104,310 | 1,140 | |||
Advanced Micro Devices* | 66,700 | 468 | |||
Akamai Technologies* (A) | 112,901 | 2,710 | |||
Alliance Data Systems* | 60,700 | 3,702 | |||
Amkor Technology* | 75,300 | 418 | |||
Analog Devices | 74,891 | 2,246 | |||
Ancestry.com* (A) | 138,468 | 1,821 | |||
Ansys* | 40,400 | 1,573 | |||
Ariba* | 115,981 | 1,257 | |||
Arris Group* (A) | 366,831 | 3,665 | |||
Arrow Electronics* | 127,309 | 3,346 | |||
Art Technology Group* | 666,348 | 2,692 | |||
Aruba Networks* | 5,427 | 43 | |||
AsiaInfo Holdings* | 44,100 | 1,084 | |||
Atheros Communications* (A) | 123,794 | 3,524 | |||
Atmel* | 846,617 | 3,361 | |||
ATMI* (A) | 102,847 | 1,599 | |||
Avnet* | 80,554 | 2,195 | |||
Baidu.com ADR* | 2,240 | 972 | |||
Benchmark Electronics* (A) | 185,320 | 3,341 | |||
Black Box | 69,585 | 1,962 | |||
Blackboard* | 82,510 | 3,443 | |||
Bottomline Technologies* | 30,177 | 486 | |||
Brightpoint* | 314,352 | 2,257 | |||
Broadridge Financial Solutions | 40,608 | 893 | |||
Brocade Communications Systems* | 148,500 | 1,053 | |||
CACI International, Cl A* | 25,288 | 1,174 | |||
Cavium Networks* | 41,960 | 846 | |||
Ceragon Networks* | 101,555 | 988 | |||
Checkpoint Systems* | 30,234 | 429 | |||
Ciber* | 113,005 | 358 | |||
Cirrus Logic* | 15,326 | 83 | |||
Cognex | 21,800 | 359 | |||
Cogo Group* | 43,200 | 246 | |||
Coherent* | 73,311 | 1,864 | |||
Description | Shares | Market Value ($ Thousands) | |||
CommScope* | 135,700 | $ | 3,410 | ||
Computer Sciences* | 50,835 | 2,812 | |||
Comtech Telecommunications* (A) | 38,500 | 1,106 | |||
Comverse Technology* | 204,900 | 1,803 | |||
Concur Technologies* (A) | 8,255 | 306 | |||
Constant Contact* | 72,150 | 1,289 | |||
Convergys* | 118,100 | 1,320 | |||
Cree* | 9,664 | 462 | |||
CSG Systems International* | 41,685 | 807 | |||
CTS | 127,190 | 1,179 | |||
Cymer* | 7,515 | 251 | |||
Cypress Semiconductor* (A) | 365,507 | 3,498 | |||
Daktronics | 22,500 | 191 | |||
DealerTrack Holdings* (A) | 255,276 | 4,355 | |||
Diebold | 185,695 | 4,668 | |||
Digital River* | 50,578 | 1,276 | |||
Diodes* | 104,739 | 1,837 | |||
Dolby Laboratories, Cl A* | 90,978 | 4,069 | |||
DSP Group* | 151,400 | 952 | |||
DST Systems* | 14,600 | 620 | |||
DTS* | 127,930 | 3,856 | |||
EchoStar, Cl A* | 16,166 | 314 | |||
EF Johnson Technologies* | 100,500 | 111 | |||
Electronics for Imaging* | 27,753 | 333 | |||
Emulex* | 255,496 | 2,488 | |||
Entegris* | 386,381 | 1,611 | |||
Equinix* (A) | 118,286 | 11,378 | |||
Euronet Worldwide* | 123,080 | 2,614 | |||
Factset Research Systems (A) | 21,130 | 1,529 | |||
Fairchild Semiconductor International, Cl A* | 162,424 | 1,316 | |||
Fidelity National Information Services | 20,393 | 461 | |||
FLIR Systems* | 37,280 | 1,070 | |||
Gartner* | 375,684 | 7,108 | |||
Gerber Scientific* | 112,900 | 564 | |||
Global Payments | 10,446 | 536 | |||
GSI Commerce* (A) | 574,579 | 12,836 | |||
Harris | 53,300 | 2,340 | |||
Harris Stratex Networks, Cl A* | 128,626 | 808 | |||
Heartland Payment Systems | 149,122 | 1,594 | |||
Hewitt Associates, Cl A* | 19,280 | 775 | |||
IAC* | 45,537 | 886 | |||
Imation (A) | 255,100 | 2,237 | |||
Ingram Micro, Cl A* | 80,745 | 1,372 | |||
Insight Enterprises* | 142,138 | 1,443 | |||
Integral Systems* | 191,118 | 1,699 | |||
Integrated Device Technology* | 335,816 | 1,901 | |||
Intermec* | 14,853 | 183 | |||
Internet Brands, Cl A* (A) | 202,676 | 1,400 | |||
Jabil Circuit | 488,360 | 6,500 | |||
Jack Henry & Associates | 42,799 | 978 | |||
JDA Software Group* | 126,260 | 2,965 | |||
JDS Uniphase* | 119,099 | 880 | |||
Keynote Systems (A) | 227,008 | 2,422 | |||
Knot* (A) | 278,915 | 2,661 | |||
Kulicke & Soffa Industries* (A) | 31,400 | 143 | |||
Lam Research* | 39,919 | 1,357 | |||
Lawson Software* | 621,878 | 4,073 | |||
Lexmark International, Cl A* | 82,634 | 2,080 | |||
Linear Technology | 31,100 | 839 | |||
Littelfuse* | 57,941 | 1,517 | |||
LSI* | 84,100 | 445 | |||
Mantech International, Cl A* | 28,424 | 1,230 | |||
| 8 | SEI Institutional Investments Trust / Semi-Annual Report / November 30, 2009 |
Table of Contents
SCHEDULE OF INVESTMENTS (Unaudited)
Small/Mid Cap Equity Fund
November 30, 2009
Description | Shares | Market Value ($ Thousands) | |||
MAXIMUS | 32,100 | $ | 1,492 | ||
Methode Electronics | 181,251 | 1,443 | |||
Micrel | 21,600 | 154 | |||
Microsemi* | 250,063 | 3,809 | |||
Microtune* | 31,650 | 55 | |||
MKS Instruments* | 164,867 | 2,498 | |||
Molex | 101,926 | 1,895 | |||
Monolithic Power Systems* | 25,686 | 552 | |||
Monotype Imaging Holdings* | 276,267 | 2,138 | |||
Move* | 222,716 | 343 | |||
MTS Systems | 10,255 | 264 | |||
National Semiconductor | 15,900 | 232 | |||
NCR* | 66,725 | 628 | |||
Net 1 UEPS Technologies* | 122,914 | 2,296 | |||
Netezza* | 33,400 | 339 | |||
Netgear* | 134,255 | 2,665 | |||
Netlogic Microsystems* (A) | 19,812 | 808 | |||
Netscout Systems* | 13,150 | 166 | |||
NeuStar, Cl A* | 194,304 | 4,547 | |||
Novatel Wireless* (A) | 215,118 | 1,803 | |||
Nuance Communications* (A) | 91,279 | 1,386 | |||
ON Semiconductor* | 339,140 | 2,632 | |||
OSI Systems* | 96,400 | 1,969 | |||
Parametric Technology* | 237,120 | 3,571 | |||
Park Electrochemical | 56,000 | 1,324 | |||
Parkervision* (A) | 378,200 | 689 | |||
Pericom Semiconductor* | 171,793 | 1,771 | |||
Plexus* (A) | 154,682 | 4,201 | |||
PMC - Sierra* | 411,000 | 3,259 | |||
Power Integrations | 62,916 | 2,113 | |||
Progress Software* | 36,784 | 886 | |||
QLogic* | 124,320 | 2,230 | |||
Quest Software* | 33,376 | 562 | |||
Rackspace Hosting* | 117,700 | 2,179 | |||
Red Hat* | 96,600 | 2,579 | |||
RF Micro Devices* | 553,170 | 2,390 | |||
Richardson Electronics | 57,494 | 341 | |||
Riverbed Technology* | 167,373 | 3,408 | |||
Rubicon Technology* (A) | 78,616 | 1,370 | |||
SAIC* | 162,831 | 2,902 | |||
Sapient* | 489,280 | 3,601 | |||
SAVVIS* | 128,348 | 1,607 | |||
Scansource* | 46,733 | 1,087 | |||
Seachange International* (A) | 194,500 | 1,085 | |||
Seagate Technology | 287,700 | 4,353 | |||
Sigma Designs* | 60,385 | 705 | |||
Silicon Laboratories* | 16,597 | 701 | |||
SkillSoft ADR* | 595,073 | 5,843 | |||
Skyworks Solutions* | 267,588 | 3,294 | |||
Sohu.com* | 9,532 | 531 | |||
Solera Holdings | 183,302 | 6,408 | |||
SRA International, Cl A* | 67,700 | 1,222 | |||
SuccessFactors* | 4,098 | 62 | |||
Sun Microsystems* | 45,500 | 387 | |||
Sybase* | 109,616 | 4,411 | |||
Symyx Technologies* | 43,413 | 184 | |||
Synaptics* | 13,800 | 372 | |||
Synchronoss Technologies* | 124,143 | 1,673 | |||
SYNNEX* | 33,732 | 955 | |||
Synopsys* | 184,144 | 4,138 | |||
Take-Two Interactive Software* | 201,750 | 2,270 | |||
Taleo, Cl A* | 132,285 | 2,733 | |||
Tech Data* | 71,686 | 3,019 | |||
Technitrol | 116,576 | 590 | |||
TeleTech Holdings* | 119,899 | 2,313 | |||
Description | Shares | Market Value ($ Thousands) | |||
Tellabs* | 65,720 | $ | 369 | ||
Teradata* | 64,610 | 1,893 | |||
TIBCO Software* | 64,617 | 556 | |||
TiVo* | 415,900 | 4,117 | |||
Total System Services | 186,600 | 3,224 | |||
Trimble Navigation* (A) | 253,488 | 5,660 | |||
TriQuint Semiconductor* | 337,330 | 1,835 | |||
TTM Technologies* (A) | 143,600 | 1,489 | |||
Unisys* | 57,350 | 1,840 | |||
United Online | 265,160 | 1,803 | |||
Valueclick* | 137,138 | 1,293 | |||
Varian Semiconductor Equipment Associates* | 23,625 | 688 | |||
Veeco Instruments* (A) | 138,025 | 3,770 | |||
VeriFone Holdings* | 102,809 | 1,363 | |||
Vishay Intertechnology* | 249,988 | 1,812 | |||
VistaPrint* | 238,619 | 13,608 | |||
Vocus* (A) | 350,804 | 5,732 | |||
WebMD Health, Cl A* (A) | 26,113 | 948 | |||
Western Digital* | 66,500 | 2,450 | |||
Wright Express* | 64,692 | 1,887 | |||
Xyratex* | 97,255 | 1,096 | |||
Zebra Technologies, Cl A* | 98,708 | 2,628 | |||
Zoran* | 105,659 | 966 | |||
| 376,116 | |||||
Materials — 6.3% | |||||
A. Schulman | 40,799 | 666 | |||
Airgas | 73,241 | 3,387 | |||
AK Steel Holding | 111,419 | 2,228 | |||
Albemarle (A) | 51,276 | 1,731 | |||
Allegheny Technologies | 97,707 | 3,325 | |||
Allied Nevada Gold* (A) | 154,000 | 2,002 | |||
AM Castle | 44,957 | 589 | |||
AMCOL International (A) | 40,100 | 1,093 | |||
Aptargroup | 119,036 | 4,300 | |||
Ashland | 111,033 | 3,990 | |||
Bemis | 8,331 | 244 | |||
Buckeye Technologies* | 71,300 | 690 | |||
Cabot | 58,664 | 1,345 | |||
Carpenter Technology (A) | 70,900 | 1,643 | |||
Celanese, Cl A | 162,071 | 4,823 | |||
Century Aluminum* | 81,000 | 790 | |||
CF Industries Holdings (A) | 14,230 | 1,215 | |||
Cliffs Natural Resources | 41,010 | 1,807 | |||
Commercial Metals (A) | 84,377 | 1,342 | |||
Crown Holdings* | 106,856 | 2,689 | |||
Cytec Industries | 103,573 | 3,519 | |||
Domtar* | 57,303 | 3,233 | |||
Eagle Materials | 38,770 | 1,045 | |||
Eastman Chemical | 33,100 | 1,990 | |||
FMC | 5,609 | 314 | |||
Gammon Gold* | 61,500 | 711 | |||
General Steel Holdings* | 91,227 | 366 | |||
H.B. Fuller | 50,700 | 1,032 | |||
Hawkins | 10,492 | 229 | |||
Headwaters* | 111,421 | 525 | |||
Innophos Holdings | 125,640 | 3,112 | |||
Innospec | 17,342 | 154 | |||
Intrepid Potash* (A) | 148,664 | 4,525 | |||
Jaguar Mining* (A) | 157,400 | 1,838 | |||
Kaiser Aluminum | 16,300 | 630 | |||
KapStone Paper and Packaging* | 40,323 | 286 | |||
Koppers Holdings | 31,211 | 882 | |||
| 9 | SEI Institutional Investments Trust / Semi-Annual Report / November 30, 2009 |
Table of Contents
SCHEDULE OF INVESTMENTS (Unaudited)
Small/Mid Cap Equity Fund
November 30, 2009
Description | Shares | Market Value ($ Thousands) | |||
LSB Industries* | 21,302 | $ | 260 | ||
Lubrizol | 37,900 | 2,749 | |||
Minerals Technologies | 9,961 | 526 | |||
Myers Industries | 88,402 | 731 | |||
Nalco Holding | 217,077 | 5,310 | |||
Neenah Paper | 89,768 | 1,250 | |||
New Gold* | 514,600 | 1,842 | |||
NewMarket | 33,836 | 3,543 | |||
Nucor | 39,985 | 1,696 | |||
Olin | 40,278 | 676 | |||
OM Group* | 36,137 | 1,107 | |||
Owens-Illinois* | 107,688 | 3,367 | |||
Packaging of America | 97,278 | 1,938 | |||
Pactiv* | 18,389 | 448 | |||
PolyOne* | 389,309 | 2,795 | |||
Quaker Chemical | 2,625 | 51 | |||
Reliance Steel & Aluminum (A) | 51,537 | 2,107 | |||
Rockwood Holdings* (A) | 218,580 | 4,920 | |||
RPM International | 15,203 | 298 | |||
RTI International Metals* | 40,284 | 798 | |||
Schnitzer Steel Industries, Cl A (A) | 31,866 | 1,422 | |||
Schweitzer-Mauduit International | 30,922 | 1,904 | |||
Scotts Miracle-Gro, Cl A | 73,800 | 2,947 | |||
Sensient Technologies | 24,400 | 618 | |||
Silgan Holdings | 96,606 | 5,175 | |||
Solutia* | 177,470 | 1,911 | |||
Sonoco Products | 57,700 | 1,626 | |||
Spartech (A) | 124,918 | 1,358 | |||
Steel Dynamics (A) | 112,460 | 1,903 | |||
Stepan | 9,957 | 625 | |||
Stillwater Mining* | 37,400 | 356 | |||
Temple-Inland | 91,089 | 1,639 | |||
Terra Industries | 21,209 | 818 | |||
Titanium Metals | 33,300 | 325 | |||
United States Steel (A) | 4,300 | 192 | |||
Universal Stainless & Alloy* | 78,700 | 1,277 | |||
Walter Industries | 14,550 | 998 | |||
Westlake Chemical | 11,130 | 291 | |||
Worthington Industries | 44,300 | 519 | |||
WR Grace* | 77,282 | 1,767 | |||
| 128,373 | |||||
Telecommunication Services — 1.9% | |||||
AboveNet* (A) | 17,292 | 887 | |||
Alaska Communications Systems Group | 104,525 | 764 | |||
Cbeyond* (A) | 54,401 | 702 | |||
CenturyTel | 111,110 | 3,954 | |||
Cincinnati Bell* | 880,443 | 2,624 | |||
Iowa Telecommunications Services | 23,850 | 379 | |||
Leap Wireless International* (A) | 122,700 | 1,771 | |||
MetroPCS Communications* | 221,600 | 1,396 | |||
Neutral Tandem* | 98,010 | 2,261 | |||
NII Holdings* | 224,795 | 6,699 | |||
PAETEC Holding* | 90,890 | 334 | |||
SBA Communications, Cl A* (A) | 444,441 | 14,240 | |||
Syniverse Holdings* | 33,608 | 533 | |||
Telephone & Data Systems | 9,716 | 296 | |||
tw telecom , Cl A* | 208,157 | 3,029 | |||
US Cellular* | 11,983 | 446 | |||
USA Mobility | 75,203 | 751 | |||
Description | Shares | Market Value ($ Thousands) | |||
Windstream | 31,404 | $ | 312 | ||
| 41,378 | |||||
Utilities — 3.7% | |||||
AGL Resources | 168,227 | 5,812 | |||
Alliant Energy | 43,300 | 1,190 | |||
Ameren | 42,000 | 1,091 | |||
American Water Works | 43,800 | 974 | |||
Atmos Energy | 31,497 | 863 | |||
Avista | 16,800 | 350 | |||
Black Hills | 13,417 | 316 | |||
Centerpoint Energy | 66,000 | 876 | |||
Cia de Saneamento de Minas Gerais-COPASA (Brazil) | 93,400 | 1,610 | |||
Cleco (A) | 57,922 | 1,478 | |||
CMS Energy (A) | 156,600 | 2,230 | |||
Consolidated Edison | 31,009 | 1,330 | |||
Edison International | 50,675 | 1,725 | |||
El Paso Electric* | 24,228 | 480 | |||
Empire District Electric | 40,548 | 736 | |||
Energen | 24,545 | 1,068 | |||
Equities | 2,926 | 120 | |||
Great Plains Energy | 303,648 | 5,405 | |||
Hawaiian Electric Industries | 70,100 | 1,392 | |||
IDACORP | 17,450 | 516 | |||
ITC Holdings | 39,649 | 1,763 | |||
Laclede Group | 9,825 | 308 | |||
MDU Resources Group | 116,443 | 2,632 | |||
Mirant* (A) | 50,600 | 720 | |||
Northeast Utilities (A) | 100,734 | 2,429 | |||
NorthWestern | 134,625 | 3,472 | |||
NV Energy | 60,365 | 703 | |||
OGE Energy (A) | 63,951 | 2,213 | |||
Pepco Holdings | 32,000 | 522 | |||
Piedmont Natural Gas | 23,600 | 559 | |||
Pinnacle West Capital | 88,349 | 3,100 | |||
PNM Resources (A) | 128,180 | 1,428 | |||
Portland General Electric | 373,658 | 7,327 | |||
RRI Energy* | 599,785 | 2,951 | |||
SCANA | 87,897 | 3,094 | |||
South Jersey Industries | 27,262 | 983 | |||
UGI | 169,251 | 3,974 | |||
Unisource Energy | 47,800 | 1,425 | |||
Vectren | 56,984 | 1,338 | |||
Westar Energy | 109,209 | 2,249 | |||
Wisconsin Energy | 56,562 | 2,551 | |||
Xcel Energy | 95,329 | 1,937 | |||
| 77,240 | |||||
Total Common Stock | 2,037,726 | ||||
AFFILIATED PARTNERSHIP — 14.3% | |||||
SEI Liquidity Fund, L.P., | 306,891,896 | 299,398 | |||
Total Affiliated Partnership | 299,398 | ||||
| 10 | SEI Institutional Investments Trust / Semi-Annual Report / November 30, 2009 |
Table of Contents
SCHEDULE OF INVESTMENTS (Unaudited)
Small/Mid Cap Equity Fund
November 30, 2009
Description | Shares/Face Amount ($ Thousands) | Market Value ($ Thousands) | ||||
PREFERRED STOCK — 0.2% | ||||||
Consumer Discretionary — 0.1% | ||||||
Callaway Golf | 14,000 | $ | 1,649 | |||
Financials — 0.1% | ||||||
Grubb & Ellis* | 14,400 | 1,440 | ||||
Total Preferred Stock | 3,089 | |||||
CONVERTIBLE BONDS — 0.1% | ||||||
Consumer Discretionary — 0.0% | ||||||
Eddie Bauer Holdings | ||||||
5.250%, 04/01/14 (C) | $ | 3,146 | 315 | |||
Energy — 0.1% | ||||||
Nova Biosource Fuels | ||||||
10.000%, 09/30/12 (C) | 1,679 | 168 | ||||
Rentech | ||||||
4.000%, 04/15/13 | 1,647 | 1,254 | ||||
Scorpio Mining | ||||||
7.000%, 05/05/11 (G)(H)(I) | 509 | 448 | ||||
| 1,870 | ||||||
Financials — 0.0% | ||||||
World Acceptance | ||||||
3.000%, 10/01/11 | 458 | 409 | ||||
Total Convertible Bonds | 2,594 | |||||
EXCHANGE TRADED FUND — 0.0% | ||||||
Midcap SPDR Trust Series 1 | 7,595 | 947 | ||||
Total Exchange Traded Fund | 947 | |||||
| Number of Warrants | ||||||
WARRANTS — 0.0% | ||||||
Cullen Agricultural Holding, Expires 2013 | 222,701 | 22 | ||||
Oilsands Quest, Expires 05/12/11* | 330,350 | 149 | ||||
Oilsands Quest, Expires 2009* | 20,000 | — | ||||
Rentech, Expires 04/25/12*(G)(H)(I) | 13,800 | 5 | ||||
Titanium Asset Management, | 105,000 | — | ||||
Total Warrants | 176 | |||||
Description | Face Amount ($ Thousands)/Shares | Market Value ($ Thousands) | ||||
U.S. TREASURY OBLIGATIONS — 0.5% | ||||||
U.S. Treasury Bills (D)(F) | ||||||
0.130%, 12/03/09 | $ | 8,970 | $ | 8,970 | ||
0.065%, 01/07/10 | 400 | 400 | ||||
Total U.S. Treasury Obligations | 9,370 | |||||
CASH EQUIVALENT — 2.3% | ||||||
SEI Daily Income Trust, Prime | 48,116,451 | 48,116 | ||||
Total Cash Equivalent | 48,116 | |||||
Total Investments — 115.0% | $ | 2,401,416 | ||||
A summary of the open futures contracts held by the Fund at November 30, 2009, is as follows:
Type of Contract | Number of Contracts Long (Short) | Expiration Date | Unrealized Appreciation ($ Thousands) | ||||
Russell Index E-Mini | 200 | Dec-2009 | $ | 208 | |||
S&P Mid 400 Index E-Mini | 128 | Dec-2009 | 264 | ||||
| $ | 472 | ||||||
For the year ended November 30, 2009, the total amount of all open futures contracts, as presented in the table above, are representative of the volume of activity for this derivative type during the period.
Percentages are based on a Net Assets of $2,087,757($ Thousands)
| * | Non-income producing security. |
| ** | The rate reported is the 7-day effective yield as of November 30, 2009. |
| † | Investment in Affiliated Security (see Note 5). |
| ‡ | Real Estate Investment Trust |
| (A) | This security or a partial position of this security is on loan at November 30, 2009 (See Note 11). The total value of securities on loan atNovember 30, 2009 was $239,050 ($ Thousands). |
| (B) | Securities sold within terms of a private placement memorandum, exempt from registration under Section 144A of the Securities Act of 1933, as amended, and may be sold only to dealers in that program or other “accredited investors.” These securities have been determined to be liquid under guidelines established by the board of Trustees. |
| (C) | Security in default on interest payments. |
| (D) | The rate reported on the Schedule of Investments is the effective yield at time of purchase. |
| (E) | This security was purchased with cash collateral held from securities on loan (See Note 11). The total value of such securities as of November 30, 2009 was $299,398 ($ Thousands). |
| (F) | Security, or a portion thereof, has been pledged as collateral on open futures contracts. |
| (G) | Securities considered illiquid. The total value of such securities as of November 30, 2009 was $768 ($ Thousands) and represented 0.04% of net assets. |
| (H) | Securities considered restricted. The total value of such securities as of November 30, 2009 was $768 ($ Thousands) and represented 0.04% of net assets. |
| (I) | Security was fair valued using methods determined in good faith by the Valuation Committee of the Board of Trustees. The total value of such securities as of November 30, 2009 was $1,025 ($ Thousands) and represented 0.05% of net assets. |
| 11 | SEI Institutional Investments Trust / Semi-Annual Report / November 30, 2009 |
Table of Contents
SCHEDULE OF INVESTMENTS (Unaudited)
Small/Mid Cap Equity Fund
November 30, 2009
ADR — American Depositary Receipt
Cl — Class
LLC — Limited Liability Company
L.P. — Limited Partnership
PIPE — Private Investment in Public Entity
S&P — Standard & Poor’s
Amounts designated as “—” are $O or have been rounded to $O.
| 12 | SEI Institutional Investments Trust / Semi-Annual Report / November 30, 2009 |
Table of Contents
SCHEDULE OF INVESTMENTS (Unaudited)
U.S. Managed Volatility Fund
November 30, 2009
Description | Shares | Market Value ($ Thousands) | |||
COMMON STOCK — 95.9% | |||||
Consumer Discretionary — 6.9% | |||||
Aaron’s | 29,300 | $ | 735 | ||
Amazon.com* | 7,092 | 964 | |||
Autoliv | 11,600 | 471 | |||
Buckle | 15,000 | 410 | |||
Burger King Holdings | 51,000 | 867 | |||
Career Education* | 41,800 | 1,088 | |||
Carter’s* | 29,900 | 650 | |||
Choice Hotels International | 30,000 | 941 | |||
Corinthian Colleges* | 56,400 | 836 | |||
DIRECTV, Cl A* | 42,100 | 1,332 | |||
Discovery Communications, Cl A* | 40,800 | 1,303 | |||
DreamWorks Animation SKG, Cl A* | 34,300 | 1,148 | |||
Eastman Kodak | 62,200 | 252 | |||
GameStop, Cl A* | 20,800 | 508 | |||
Genuine Parts | 23,200 | 831 | |||
Gildan Activewear, Cl A* | 26,200 | 506 | |||
H&R Block | 27,600 | 560 | |||
ITT Educational Services* | 10,500 | 956 | |||
Jarden | 18,800 | 516 | |||
John Wiley & Sons, Cl A | 30,900 | 1,157 | |||
priceline.com* | 7,078 | 1,515 | |||
Strayer Education | 8,304 | 1,640 | |||
Tractor Supply* | 19,800 | 924 | |||
| 20,110 | |||||
Consumer Staples — 15.5% | |||||
Alberto-Culver, Cl B | 28,708 | 808 | |||
Altria Group | 171,941 | 3,234 | |||
Brown-Forman, Cl B | 50,788 | 2,599 | |||
Campbell Soup | 55,513 | 1,941 | |||
Church & Dwight | 16,900 | 998 | |||
Coca-Cola | 25,068 | 1,434 | |||
Dean Foods* | 35,600 | 566 | |||
Del Monte Foods | 42,600 | 447 | |||
Flowers Foods | 33,300 | 762 | |||
General Mills | 20,600 | 1,401 | |||
Hansen Natural* | 11,600 | 405 | |||
Hershey | 35,000 | 1,238 | |||
Hormel Foods | 122,726 | 4,605 | |||
Kellogg | 25,900 | 1,362 | |||
Kimberly-Clark | 20,800 | 1,372 | |||
Kroger | 63,897 | 1,453 | |||
Lorillard | 44,766 | 3,488 | |||
McCormick | 27,485 | 981 | |||
Molson Coors Brewing, Cl B | 9,393 | 425 | |||
PepsiCo | 16,357 | 1,018 | |||
Philip Morris International | 71,620 | 3,444 | |||
Reynolds American | 72,368 | 3,616 | |||
Ruddick | 23,500 | 625 | |||
Safeway | 6,616 | 149 | |||
Sara Lee | 50,858 | 617 | |||
Sysco | 131,280 | 3,550 | |||
Tyson Foods, Cl A | 172,715 | 2,076 | |||
Wal-Mart Stores | 5,926 | 323 | |||
| 44,937 | |||||
Description | Shares | Market Value ($ Thousands) | |||
Energy — 4.5% | |||||
Chevron | 27,607 | $ | 2,154 | ||
CNX Gas* | 35,100 | 958 | |||
Dresser-Rand Group* | 34,900 | 980 | |||
Enbridge | 32,300 | 1,381 | |||
Exxon Mobil | 24,335 | 1,827 | |||
FMC Technologies* | 11,900 | 648 | |||
Murphy Oil | 14,888 | 840 | |||
PetroHawk Energy* | 31,300 | 699 | |||
Range Resources | 19,200 | 905 | |||
SEACOR Holdings* | 10,200 | 781 | |||
Teekay | 21,700 | 521 | |||
TransCanada | 44,700 | 1,442 | |||
| 13,136 | |||||
Financials — 13.2% | |||||
Alexandria Real Estate Equities‡ | 20,200 | 1,139 | |||
Arthur J Gallagher | 27,079 | 607 | |||
Associated Banc | 54,200 | 615 | |||
Bancorpsouth | 40,700 | 944 | |||
Bank of Hawaii | 58,591 | 2,678 | |||
BOK Financial | 20,596 | 957 | |||
Capitol Federal Financial | 48,335 | 1,411 | |||
Commerce Bancshares | 97,077 | 3,902 | |||
Corporate Office Properties Trust‡ | 28,600 | 978 | |||
Cullen/Frost Bankers | 59,594 | 2,862 | |||
Endurance Specialty Holdings | 32,800 | 1,226 | |||
Erie Indemnity, Cl A | 24,900 | 921 | |||
Essex Property Trust‡ | 14,800 | 1,180 | |||
Federated Investors, Cl B | 37,600 | 969 | |||
First Citizens BancShares, Cl A | 1,708 | 269 | |||
First Niagara Financial Group | 37,898 | 500 | |||
Health Care REIT‡ | 29,800 | 1,328 | |||
Hudson City Bancorp | 75,700 | 1,006 | |||
MFA Mortgage Investments‡ | 68,200 | 516 | |||
National Retail Properties‡ | 38,700 | 775 | |||
Nationwide Health Properties‡ | 12,900 | 439 | |||
PartnerRe | 9,859 | 759 | |||
People’s United Financial | 180,791 | 2,945 | |||
Platinum Underwriters Holdings | 21,800 | 769 | |||
ProAssurance* | 20,700 | 1,102 | |||
Prosperity Bancshares | 29,300 | 1,167 | |||
Realty Income‡ | 42,900 | 1,085 | |||
RenaissanceRe Holdings | 5,700 | 304 | |||
TFS Financial | 213,898 | 2,391 | |||
UMB Financial | 26,000 | 1,022 | |||
Valley National Bancorp | 34,100 | 451 | |||
Washington Real Estate | |||||
Investment Trust‡ | 38,200 | 997 | |||
Wesco Financial | 449 | 153 | |||
| 38,367 | |||||
Health Care — 21.8% | |||||
Abbott Laboratories | 83,042 | 4,525 | |||
Allscripts-Misys Healthcare | |||||
Solutions* | 5,648 | 108 | |||
AmerisourceBergen | 203,890 | 5,034 | |||
Amgen* | 65,222 | 3,675 | |||
Baxter International | 39,470 | 2,153 | |||
| 1 | SEI Institutional Investments Trust / Semi-Annual Report / November 30, 2009 |
Table of Contents
SCHEDULE OF INVESTMENTS (Unaudited)
U.S. Managed Volatility Fund
November 30, 2009
Description | Shares | Market Value ($ Thousands) | |||
Becton Dickinson | 41,209 | $ | 3,082 | ||
Biogen Idec * | 78,347 | 3,678 | |||
Bristol-Myers Squibb | 17,928 | 454 | |||
C.R. Bard | 30,751 | 2,528 | |||
Cardinal Health | 60,456 | 1,948 | |||
CareFusion * | 10,132 | 262 | |||
Celgene * | 12,500 | 693 | |||
Edwards Lifesciences * | 24,812 | 2,042 | |||
Eli Lilly | 30,072 | 1,104 | |||
Endo Pharmaceuticals Holdings * | 57,851 | 1,274 | |||
Forest Laboratories * | 89,323 | 2,739 | |||
Genzyme * | 70,659 | 3,582 | |||
Gilead Sciences * | 67,560 | 3,111 | |||
Haemonetics * | 12,600 | 673 | |||
Henry Schein * | 16,462 | 818 | |||
Hill-Rom Holdings | 7,226 | 160 | |||
Johnson & Johnson | 55,053 | 3,459 | |||
Kinetic Concepts * | 30,800 | 1,038 | |||
LifePoint Hospitals * | 14,500 | 421 | |||
McKesson | 76,878 | 4,768 | |||
Medco Health Solutions * | 251 | 16 | |||
Millipore * | 2,816 | 192 | |||
Onyx Pharmaceuticals * | 16,100 | 461 | |||
Owens & Minor | 24,100 | 935 | |||
Patterson * | 43,600 | 1,121 | |||
Perrigo | 33,500 | 1,345 | |||
STERIS | 26,500 | 856 | |||
Techne | 56,762 | 3,853 | |||
United Therapeutics * | 21,600 | 985 | |||
| 63,093 | |||||
Industrials — 4.1% | |||||
Alliant Techsystems * | 13,500 | 1,157 | |||
C.H. Robinson Worldwide | 23,036 | 1,284 | |||
Copa Holdings, Cl A | 19,308 | 962 | |||
FTI Consulting * | 21,800 | 1,008 | |||
Gardner Denver | 27,800 | 1,041 | |||
KBR | 60,800 | 1,133 | |||
Landstar System | 24,800 | 926 | |||
Lennox International | 29,100 | 1,080 | |||
Nordson | 12,800 | 686 | |||
Rollins | 47,200 | 839 | |||
Simpson Manufacturing | 6,800 | 169 | |||
TransDigm Group | 25,300 | 1,097 | |||
Valmont Industries | 5,900 | 452 | |||
| 11,834 | |||||
Information Technology — 12.0% | |||||
Adtran | 35,900 | 758 | |||
Analog Devices | 81,601 | 2,447 | |||
Atmel * | 12,932 | 51 | |||
AVX | 38,600 | 465 | |||
Broadcom, Cl A * | 22,948 | 670 | |||
Cree * | 12,231 | 585 | |||
Diebold | 24,600 | 619 | |||
FLIR Systems * | 19,100 | 548 | |||
Global Payments | 10,300 | 528 | |||
Google, Cl A * | 6,291 | 3,668 | |||
Harris | 28,400 | 1,247 | |||
Hewitt Associates, Cl A * | 32,900 | 1,322 | |||
Hewlett-Packard | 2,861 | 140 | |||
Description | Shares | Market Value ($ Thousands) | |||
IAC * | 64,754 | $ | 1,259 | ||
Ingram Micro, Cl A * | 76,912 | 1,307 | |||
Intel | 164,594 | 3,160 | |||
International Business Machines | 16,729 | 2,114 | |||
Mantech International, Cl A * | 22,300 | 965 | |||
Micros Systems * | 13,600 | 382 | |||
NeuStar, Cl A * | 16,300 | 381 | |||
SAIC * | 1,135 | 20 | |||
Silicon Laboratories * | 6,557 | 277 | |||
Sybase * | 27,500 | 1,107 | |||
Synopsys * | 22,589 | 507 | |||
Tech Data * | 67,553 | 2,845 | |||
Texas Instruments | 142,338 | 3,600 | |||
Visa, Cl A | 32,022 | 2,594 | |||
WebMD Health, Cl A * | 2,829 | 103 | |||
Xerox | 39,600 | 305 | |||
Xilinx | 2,244 | 51 | |||
Zebra Technologies, Cl A * | 31,383 | 835 | |||
| 34,860 | |||||
Materials — 3.6% | |||||
Aptargroup | 27,600 | 997 | |||
Bemis | 17,300 | 507 | |||
Compass Minerals International | 18,000 | 1,172 | |||
Greif, Cl A | 18,700 | 1,045 | |||
Newmont Mining | 64,067 | 3,436 | |||
Reliance Steel & Aluminum | 9,900 | 405 | |||
Royal Gold | 24,029 | 1,293 | |||
Sensient Technologies | 23,800 | 603 | |||
Silgan Holdings | 16,800 | 900 | |||
| 10,358 | |||||
Telecommunication Services — 2.6% | |||||
AT&T | 59,600 | 1,606 | |||
BCE | 29,600 | 784 | |||
MetroPCS Communications* | 184,900 | 1,165 | |||
Rogers Communications, Cl B | 44,500 | 1,347 | |||
SBA Communications, Cl A* | 15,800 | 506 | |||
Telephone & Data Systems | 11,300 | 344 | |||
Verizon Communications | 50,894 | 1,601 | |||
| 7,353 | |||||
Utilities — 11.7% | |||||
AGL Resources | 57,898 | 2,001 | |||
Alliant Energy | 49,091 | 1,349 | |||
Aqua America | 49,379 | 806 | |||
Atmos Energy | 82,948 | 2,272 | |||
Consolidated Edison | 28,700 | 1,232 | |||
DPL | 42,300 | 1,136 | |||
DTE Energy | 32,600 | 1,308 | |||
Edison International | 34,300 | 1,168 | |||
Energen | 11,800 | 513 | |||
Hawaiian Electric Industries | 20,421 | 405 | |||
IDACORP | 25,500 | 754 | |||
Nicor | 70,258 | 2,751 | |||
NSTAR | 58,287 | 1,931 | |||
OGE Energy | 35,300 | 1,221 | |||
Pepco Holdings | 56,000 | 913 | |||
PG&E | 20,300 | 859 | |||
Piedmont Natural Gas | 37,600 | 891 | |||
PPL | 34,926 | 1,066 | |||
| 2 | SEI Institutional Investments Trust / Semi-Annual Report / November 30, 2009 |
Table of Contents
SCHEDULE OF INVESTMENTS (Unaudited)
U.S. Managed Volatility Fund
November 30, 2009
Description | Shares | Market Value ($ Thousands) | |||
SCANA | 16,310 | $ | 574 | ||
Sempra Energy | 30,350 | 1,613 | |||
TECO Energy | 81,300 | 1,199 | |||
UGI | 62,796 | 1,475 | |||
Vectren | 82,749 | 1,944 | |||
Westar Energy | 30,200 | 622 | |||
WGL Holdings | 26,600 | 837 | |||
Wisconsin Energy | 66,796 | 3,012 | |||
Xcel Energy | 4,232 | 86 | |||
| 33,938 | |||||
Total Common Stock | 277,986 | ||||
U.S. TREASURY OBLIGATION — 0.4% | |||||
U.S. Treasury Bills | 1,200 | 1,200 | |||
Total U.S. Treasury Obligation | 1,200 | ||||
CASH EQUIVALENT — 3.7% | |||||
SEI Daily Income Trust, Prime | 10,718 | 10,718 | |||
Total Cash Equivalent | 10,718 | ||||
Total Investments — 100.0% | $ | 289,904 | |||
A summary of the open futures contracts held by the Fund at November 30, 2009, is as follows:
Type of Contract | Number of Contracts Long (Short) | Expiration Date | Unrealized Appreciation (Depreciation) ($ Thousands) | ||||
S&P 500 E-Mini | 45 | Dec-2009 | $ | 127 | |||
For the year ended November 30, 2009, the total amount of all open futures contracts, as presented in the table above, are representative of the volume of activity for this derivative type during the period.
Percentages are based on a Net Assets of $289,962($ Thousands)
| * | Non-income producing security. |
| ** | Rate shown is the 7-day effective yield as of November 30, 2009. |
| † | Investment in Affiliated Security (see Note 5). |
| ‡ | Real Estate Investment Trust |
| (A) | The rate reported on the Schedule of Investments is the effective yield at time of purchase. |
| (B) | Security, or a portion thereof, has been pledged as collateral on open futures contracts. |
| Cl | — Class |
Amounts designated as “—” are $O or have been rounded to $O.
| 3 | SEI Institutional Investments Trust / Semi-Annual Report / November 30, 2009 |
Table of Contents
SCHEDULE OF INVESTMENTS (Unaudited)
International Equity Fund
November 30, 2009
Description | Shares | Market Value ($ Thousands) | |||
COMMON STOCK — 89.7% | |||||
Argentina — 0.1% | |||||
Banco Macro ADR | 10,000 | $ | 273 | ||
BBVA Banco Frances ADR | 9,399 | 58 | |||
Grupo Financiero Galicia ADR* | 9,800 | 52 | |||
Petrobras Energia ADR | 1,974 | 33 | |||
Telecom Argentina ADR* | 8,200 | 133 | |||
Tenaris | 11,779 | 232 | |||
| 781 | |||||
Australia — 5.6% | |||||
AGL Energy | 8,938 | 113 | |||
Amcor | 27,516 | 149 | |||
AMP | 206,557 | 1,168 | |||
Aristocrat Leisure | 10,197 | 38 | |||
Arrow Energy* | 45,393 | 162 | |||
Asciano Group | 83,062 | 126 | |||
ASX | 5,053 | 153 | |||
Australia & New Zealand Banking Group | 138,654 | 2,811 | |||
Australian Infrastructure Fund | 24,593 | 39 | |||
AWB(A) | 46,838 | 51 | |||
Beach Petroleum | 5,836 | 5 | |||
Bendigo Bank | 7,901 | 64 | |||
BGP Holdings* | 39,545 | — | |||
BHP Billiton | 224,891 | 8,502 | |||
Billabong International | 11,878 | 114 | |||
BlueScope Steel | 229,263 | 569 | |||
Boral | 99,982 | 513 | |||
Brambles | 7,884 | 48 | |||
Caltex Australia | 8,484 | 75 | |||
CFS Retail Property Trust‡ | 58,410 | 105 | |||
Coca-Cola Amatil | 91,258 | 885 | |||
Cochlear | 2,978 | 173 | |||
Commonwealth Bank of Australia | 52,953 | 2,559 | |||
Computershare | 77,785 | 761 | |||
Crown | 17,350 | 124 | |||
CSL | 494 | 14 | |||
CSR | 23,600 | 37 | |||
David Jones (A) | – | — | |||
Dexus Property Group‡ | 45,614 | 34 | |||
Downer EDI | 13,200 | 103 | |||
Energy Resources of Australia | 3,618 | 79 | |||
Fairfax Media (A) | 227,393 | 340 | |||
Fortescue Metals Group* | 27,007 | 104 | |||
Foster’s Group | 190,415 | 980 | |||
Goodman Fielder | 229,614 | 322 | |||
GPT Group‡ | 70,403 | 38 | |||
GrainCorp | 24,079 | 134 | |||
Harvey Norman Holdings | 192,662 | 758 | |||
Incitec Pivot | 52,228 | 136 | |||
Insurance Australia Group | 36,255 | 130 | |||
JB Hi-Fi | 16,680 | 354 | |||
Kingsgate Consolidated | 3,100 | 27 | |||
Leighton Holdings (A) | 16,623 | 543 | |||
Lend Lease | 70,458 | 586 | |||
Macquarie Airports | 10,592 | 25 | |||
Macquarie Group (A) | 5,202 | 229 | |||
Macquarie Infrastructure Group | 438,565 | 522 | |||
Metcash | 70,432 | 302 | |||
National Australia Bank | 65,427 | 1,714 | |||
Description | Shares | Market Value ($ Thousands) | |||
Newcrest Mining | 10,116 | $ | 341 | ||
OneSteel | 27,245 | 75 | |||
Orica | 32,388 | 741 | |||
Origin Energy | 9,336 | 133 | |||
OZ Minerals | 218,272 | 244 | |||
Pacific Brands | 177,578 | 212 | |||
Paladin Energy* | 16,201 | 61 | |||
Perpetual | 611 | 18 | |||
Primary Health Care | 7,900 | 42 | |||
Programmed Maintenance Services | 8,232 | 29 | |||
Qantas Airways | 189,726 | 452 | |||
QBE Insurance Group | 7,641 | 156 | |||
Rio Tinto | 39,411 | 2,585 | |||
Santos | 152,185 | 2,051 | |||
Sims Group | 4,501 | 87 | |||
Sonic Healthcare | 11,209 | 146 | |||
SP AusNet, Cl Miscellaneous | 18,992 | 15 | |||
Stockland‡ | 9,650 | 36 | |||
Straits Resources | 64,525 | 97 | |||
Suncorp-Metway | 67,750 | 545 | |||
TABCORP Holdings | 48,062 | 316 | |||
Tatts Group | 135,215 | 298 | |||
Telstra | 123,100 | 384 | |||
Toll Holdings | 21,557 | 160 | |||
Transurban Group | 5,174 | 26 | |||
Wesfarmers | 79,594 | 2,171 | |||
Westfield Group‡ | 48,962 | 547 | |||
Westpac Banking | 82,151 | 1,816 | |||
Woodside Petroleum | 4,650 | 208 | |||
Woolworths | 44,706 | 1,148 | |||
WorleyParsons | 8,114 | 197 | |||
| 42,155 | |||||
Austria — 0.2% | |||||
Erste Group Bank (A) | 10,932 | 444 | |||
EVN | 895 | 17 | |||
OMV | 26,031 | 1,101 | |||
Raiffeisen International Bank Holding | 1,058 | 63 | |||
Strabag | 2,354 | 74 | |||
Vienna Insurance Group | 2,807 | 148 | |||
Voestalpine | 803 | 29 | |||
| 1,876 | |||||
Belgium — 1.3% | |||||
Banque Nationale de Belgique | 3 | 15 | |||
Delhaize Group | 32,266 | 2,442 | |||
Dexia(A) | 89,612 | 676 | |||
D'ieteren | 170 | 73 | |||
Fortis | 40,891 | 172 | |||
Groupe Bruxelles Lambert | 4,734 | 431 | |||
InBev | 51,591 | 2,575 | |||
KBC Groep | 19,365 | 862 | |||
Solvay | 6,767 | 714 | |||
Telenet Group Holding | 11,817 | 322 | |||
UCB (A) | 31,865 | 1,418 | |||
| 1 | SEI Institutional Investments Trust / Semi-Annual Report / November 30, 2009 |
Table of Contents
SCHEDULE OF INVESTMENTS (Unaudited)
International Equity Fund
November 30, 2009
Description | Shares | Market Value ($ Thousands) | |||
Umicore | 10,397 | $ | 354 | ||
| 10,054 | |||||
Brazil — 0.4% | |||||
BRF—Brasil Foods* | 31,400 | 737 | |||
Cia de Saneamento Basico do Estado de Sao Paulo ADR | 16,670 | 610 | |||
Cia Energetica de Minas Gerais ADR (A) | 55,050 | 990 | |||
Cyrela Brazil Realty | 38,400 | 543 | |||
Redecard | 25,600 | 392 | |||
| 3,272 | |||||
Canada — 1.7% | |||||
Agrium | 24,400 | 1,363 | |||
Barrick Gold | 31,700 | 1,353 | |||
Bombardier, Cl B | 136,100 | 578 | |||
Canadian National Railway | 20,800 | 1,091 | |||
CGI Group, Cl A* | 2,200 | 27 | |||
Domtar* | 6,400 | 362 | |||
EnCana | 29,430 | 1,584 | |||
Gildan Activewear* | 11,800 | 228 | |||
Goldcorp | 43,390 | 1,822 | |||
Husky Energy | 8,900 | 234 | |||
IAMGOLD | 25,685 | 485 | |||
Nexen | 15,800 | 372 | |||
Open Text* | 21,900 | 834 | |||
Pacific Rubiales Energy* (A) | 23,000 | 336 | |||
Royal Bank of Canada | 4,500 | 242 | |||
Sino-Forest, Cl A* | 56,900 | 997 | |||
Teck Cominco, Cl B* | 12,100 | 419 | |||
TELUS, Cl A | 0 | — | |||
Yamana Gold | 26,100 | 346 | |||
| 12,673 | |||||
Chile — 0.3% | |||||
Banco Santander Chile ADR | 8,109 | 493 | |||
Enersis ADR | 99,400 | 1,908 | |||
Madeco ADR | 3,200 | 21 | |||
| 2,422 | |||||
China — 0.5% | |||||
Bank of China | 1,608,000 | 907 | |||
Baoye Group, Cl H | 44,000 | 34 | |||
China Life Insurance, Cl H | 139,650 | 699 | |||
China Railway Group* | 711,000 | 561 | |||
Industrial & Commercial Bank of China | 1,838,000 | 1,553 | |||
Perfect World ADR* | 6,300 | 278 | |||
Qingling Motors, Cl H | 298,000 | 85 | |||
| 4,117 | |||||
Cyprus — 0.0% | |||||
Bank of Cyprus Public | 28,878 | 206 | |||
Denmark — 0.6% | |||||
AP Moller—Maersk | 94 | 668 | |||
Carlsberg, Cl B | 17,888 | 1,282 | |||
Danisco | 4,500 | 278 | |||
Description | Shares | Market Value ($ Thousands) | |||
Danske Bank | 41,336 | $ | 890 | ||
DSV | 3,187 | 57 | |||
FLSmidth | 1,570 | 102 | |||
Novo-Nordisk, Cl B | 15,307 | 1,027 | |||
PER Aarsleff, Cl B | 416 | 50 | |||
Sydbank | 4,963 | 119 | |||
Topdanmark* | 1,209 | 173 | |||
William Demant Holding* | 2,784 | 201 | |||
| 4,847 | |||||
Finland — 0.9% | |||||
Citycon | 18,697 | 79 | |||
Elisa, Cl A | 886 | 19 | |||
Fortum | 1,844 | 47 | |||
Huhtamaki | 6,904 | 93 | |||
Kesko, Cl B | 4,294 | 146 | |||
Kone, Cl B | 48,424 | 1,960 | |||
Metso | 15,554 | 500 | |||
Nokia | 42,623 | 561 | |||
Nokian Renkaat | 5,167 | 131 | |||
Outokumpu | 4,901 | 84 | |||
Sampo, Cl A | 47,251 | 1,121 | |||
Sanoma | 6,419 | 134 | |||
Stora Enso, Cl R | 130,310 | 996 | |||
UPM-Kymmene | 45,915 | 584 | |||
Wartsila, Cl B (A) | 10,645 | 397 | |||
| 6,852 | |||||
France — 7.2% | |||||
Accor | 17,122 | 916 | |||
Aeroports de Paris | 806 | 65 | |||
Air France-KLM | 15,515 | 246 | |||
Air Liquide | 773 | 90 | |||
Alcatel-Lucent | 153,849 | 517 | |||
Alstom | 12,302 | 861 | |||
Arkema | 2,929 | 110 | |||
Assystem* | 1,449 | 20 | |||
Atos Origin | 13,328 | 582 | |||
AXA | 36,532 | 871 | |||
BioMerieux | 519 | 60 | |||
BNP Paribas | 80,932 | 6,683 | |||
Bouygues | 15,633 | 778 | |||
Capital Gemini | 18,116 | 838 | |||
Carrefour | 1,782 | 87 | |||
Casino Guichard Perrachon | 2,693 | 231 | |||
Cegid Group | 1,081 | 27 | |||
Christian Dior(A) | 12,357 | 1,252 | |||
Cie de Saint-Gobain | 358 | 20 | |||
Cie Generale d’Optique Essilor International | 2,877 | 167 | |||
Ciments Francais | 336 | 35 | |||
CNP Assurances | 15,382 | 1,646 | |||
Compagnie Generale des Etablissements Michelin, Cl B | 4,581 | 347 | |||
Credit Agricole | 88,702 | 1,835 | |||
Danone | 534 | 32 | |||
Dassault Systemes | 1,113 | 64 | |||
Eiffage | 1,402 | 76 | |||
Electricite de France (A) | 15,315 | 883 | |||
Eurazeo | 1,082 | 76 | |||
Eutelsat Communications | 19,294 | 631 | |||
Fonciere Des Regions‡ | 2,876 | 296 | |||
| 2 | SEI Institutional Investments Trust / Semi-Annual Report / November 30, 2009 |
Table of Contents
SCHEDULE OF INVESTMENTS (Unaudited)
International Equity Fund
November 30, 2009
Description | Shares | Market Value ($ Thousands) | |||
France Telecom | 95,058 | $ | 2,473 | ||
Gaz de France | 4,891 | 204 | |||
Gecina ‡ | 2,803 | 308 | |||
Havas | 86,480 | 323 | |||
Hermes International | 92 | 13 | |||
Iliad (A) | 699 | 84 | |||
Ipsen | 1,742 | 95 | |||
JC Decaux | 743 | 17 | |||
Klepierre ‡ | 3,999 | 160 | |||
Lafarge | 8,931 | 734 | |||
Lagardere S.C.A. | 1,326 | 57 | |||
Legrand | 12,120 | 333 | |||
L’Oreal | 585 | 64 | |||
LVMH Moet Hennessy Louis Vuitton (A) | 2,640 | 275 | |||
M6-Metropole Television | 15,917 | 410 | |||
Natixis | 81,521 | 435 | |||
Neopost | 1,052 | 92 | |||
NetGem | 7,913 | 37 | |||
Nexity | 3,052 | 105 | |||
PagesJaunes Groupe | 6,175 | 73 | |||
Peugeot | 21,613 | 764 | |||
PPR | 18,301 | 2,215 | |||
Publicis Groupe | 30,508 | 1,175 | |||
Rallye | 462 | 16 | |||
Renault | 9,517 | 460 | |||
Safran | 21,877 | 366 | |||
Sanofi-Aventis | 121,621 | 9,188 | |||
Schneider Electric | 5,023 | 550 | |||
SCOR | 20,462 | 499 | |||
SES Global | 2,973 | 63 | |||
Societe BIC | 409 | 29 | |||
Societe Des Autoroutes Paris-Rhin-Rhone | 1,370 | 114 | |||
Societe Generale | 24,609 | 1,732 | |||
Societe Television Francaise 1 | 29,262 | 521 | |||
Suez Environnement | 1,484 | 33 | |||
Technip | 27,974 | 1,908 | |||
Total (A) | 74,550 | 4,612 | |||
Unibail-Rodamco ‡ | 5,346 | 1,204 | |||
Valeo | 10,749 | 308 | |||
Vallourec | 140 | 23 | |||
Veolia Environnement | 2,856 | 97 | |||
Vinci | 19,785 | 1,094 | |||
Vivendi | 24,860 | 716 | |||
Zodiac Aerospace | 1,569 | 53 | |||
| 54,374 | |||||
Germany — 6.6% | |||||
Adidas | 586 | 33 | |||
Aixtron | 23,060 | 830 | |||
Allianz | 19,760 | 2,427 | |||
BASF | 67,085 | 4,045 | |||
Bayer | 31,554 | 2,415 | |||
Bayerische Motoren Werke | 49,986 | 2,358 | |||
Bilfinger Berger | 1,964 | 145 | |||
Commerzbank | 37,741 | 353 | |||
DaimlerChrysler | 47,516 | 2,406 | |||
Deutsche Bank (A) | 53,410 | 3,853 | |||
Deutsche Boerse | 12,025 | 1,002 | |||
Deutsche Lufthansa | 112,011 | 1,788 | |||
Deutsche Post | 179,195 | 3,355 | |||
Description | Shares | Market Value ($ Thousands) | |||
Deutsche Postbank (A) | 4,616 | $ | 162 | ||
Deutsche Telekom | 10,677 | 157 | |||
E.ON | 126,993 | 5,022 | |||
GAGFAH | 17,053 | 154 | |||
Hannover Rueckversicherung | 30,201 | 1,439 | |||
HeidelbergCement | 27,030 | 1,794 | |||
Henkel | 1,957 | 84 | |||
Hochtief | 21,374 | 1,678 | |||
Infineon Technologies * | 180,954 | 867 | |||
K+S | 10,223 | 616 | |||
Linde | 4,111 | 505 | |||
MAN | 1,277 | 105 | |||
Merck KGaA | 270 | 26 | |||
Metro | 5,354 | 336 | |||
MTU Aero Engines Holding | 3,365 | 173 | |||
Muenchener Rueckversicherungs | 6,688 | 1,049 | |||
Puma Rudolf Dassler Sport | 290 | 100 | |||
RWE | 21,624 | 1,985 | |||
SAP | 5,298 | 253 | |||
Siemens | 62,742 | 6,147 | |||
Suedzucker | 28,307 | 618 | |||
TUI (A) | 65,467 | 518 | |||
United Internet | 35,548 | 480 | |||
Volkswagen (A) | 1,221 | 150 | |||
Wacker Chemie | 169 | 28 | |||
| 49,456 | |||||
Greece — 0.8% | |||||
Alpha Bank | 75,582 | 1,038 | |||
Coca Cola Hellenic Bottling | 12,045 | 267 | |||
EFG Eurobank Ergasias * | 7,977 | 106 | |||
Ellaktor | 1,970 | 16 | |||
National Bank of Greece | 42,301 | 1,245 | |||
OPAP | 14,508 | 348 | |||
Piraeus Bank * | 19,710 | 287 | |||
Public Power | 117,425 | 2,369 | |||
Titan Cement | 4,676 | 136 | |||
| 5,812 | |||||
Guernsey — 0.1% | |||||
Resolution * | 610,021 | 846 | |||
Hong Kong — 3.0% | |||||
ASM Pacific Technology | 24,900 | 204 | |||
Bank of East Asia | 37,400 | 162 | |||
BOC Hong Kong Holdings | 1,206,819 | 2,769 | |||
Cathay Pacific Airways | 49,028 | 84 | |||
Champion Technology Holdings | 564,000 | 19 | |||
Cheung Kong Holdings | 51,009 | 641 | |||
China Overseas Land & Investment (A) | 486,000 | 1,045 | |||
Chinese Estates Holdings | 85,000 | 143 | |||
Esprit Holdings | 161,200 | 1,084 | |||
Fairwood | 19,500 | 18 | |||
First Pacific (A) | 133,000 | 77 | |||
Genting Singapore * (A) | 947,400 | 732 | |||
Guoco Group | 11,000 | 128 | |||
Hang Lung Group | 40,000 | 196 | |||
Hang Lung Properties | 194,189 | 709 | |||
Hang Seng Bank | 34,645 | 507 | |||
Henderson Land Development | 51,900 | 366 | |||
| 3 | SEI Institutional Investment Trust / Semi-Annual Report / November 30, 2009 |
Table of Contents
SCHEDULE OF INVESTMENTS (Unaudited)
International Equity Fund
November 30, 2009
Description | Shares | Market Value ($ Thousands) | |||
Hengan International Group | 58,000 | $ | 416 | ||
Hong Kong & China Gas | 58,000 | 138 | |||
Hong Kong Exchanges and Clearing | 41,153 | 734 | |||
Hongkong & Shanghai Hotels | 51,000 | 76 | |||
Hongkong Land Holdings | 89,000 | 440 | |||
Hopewell Holdings | 77,500 | 244 | |||
Huabao International Holdings | 435,000 | 460 | |||
Hutchison Telecommunications Hong Kong Holdings | 228,000 | 38 | |||
Hutchison Whampoa | 189,803 | 1,283 | |||
Hysan Development | 104,635 | 300 | |||
Jardine Matheson Holdings | 10,600 | 313 | |||
Jardine Strategic Holdings | 7,000 | 122 | |||
Kerry Properties | 52,500 | 267 | |||
Lai Sun Development * | 1,739,000 | 29 | |||
Li & Fung | 72,000 | 290 | |||
Lifestyle International Holdings | 11,500 | 20 | |||
Link REIT ‡ | 25,000 | 63 | |||
MTR | 49,000 | 167 | |||
New World Development | 283,809 | 584 | |||
Noble Group | 384,000 | 859 | |||
Orient Overseas International | 10,500 | 48 | |||
Pacific Andes Holdings (SGD) * | 28,000 | 5 | |||
Pacific Basin Shipping | 333,000 | 252 | |||
Pacific Century Premium Developments | 145,000 | 40 | |||
Pico Far East Holdings | 202,000 | 39 | |||
RCG Holdings * | 31,166 | 44 | |||
Sino Land | 70,000 | 133 | |||
Sun Hung Kai Properties | 248,891 | 3,690 | |||
Swire Pacific, Cl A | 39,444 | 453 | |||
Television Broadcasts | 18,000 | 82 | |||
Vedan International Holdings | 220,000 | 24 | |||
VTech Holdings | 12,754 | 124 | |||
Wharf Holdings | 235,654 | 1,271 | |||
Wheelock | 44,383 | 143 | |||
Wing Hang Bank | 4,500 | 46 | |||
Wing On International | 4,000 | 5 | |||
Yue Yuen Industrial Holdings | 112,384 | 317 | |||
| 22,443 | |||||
India — 0.7% | |||||
HDFC Bank | 32,440 | 1,232 | |||
ICICI Bank ADR | 4,100 | 153 | |||
Infosys Technologies | 14,620 | 748 | |||
Larsen & Toubro | 20,410 | 708 | |||
Reliance Industries GDR (B) | 28,608 | 1,307 | |||
State Bank of India GDR | 2,927 | 283 | |||
Sterlite Industries India | 36,600 | 675 | |||
| 5,106 | |||||
Indonesia — 0.1% | |||||
Astra International | 117,700 | 403 | |||
Ireland — 0.1% | |||||
CRH | 1,959 | 49 | |||
DCC | 504 | 14 | |||
Experian | 60,358 | 568 | |||
Irish Life & Permanent | 27,681 | 135 | |||
Description | Shares | Market Value ($ Thousands) | |||
Kerry Group, Cl A | 4,360 | $ | 129 | ||
| 895 | |||||
Israel — 0.2% | |||||
Check Point Software Technologies * (A) | 14,700 | 464 | |||
Teva Pharmaceutical Industries ADR | 24,410 | 1,289 | |||
| 1,753 | |||||
Italy — 2.6% | |||||
ACEA (A) | 22,852 | 263 | |||
Assicurazioni Generali | 2,273 | 59 | |||
Atlantia | 31,991 | 826 | |||
Autogrill | 8,725 | 108 | |||
Banca Intesa | 644,144 | 2,790 | |||
Banca Intesa RNC | 81,035 | 265 | |||
Banca Monte dei Paschi di Siena | 12,209 | 23 | |||
Banca Popolare di Milano | 37,710 | 293 | |||
Banco Popolare Scarl | 23,888 | 196 | |||
Benetton Group | 10,814 | 99 | |||
CIR-Compagnie Industriali Riunite | 3,882 | 10 | |||
Danieli | 1,782 | 46 | |||
Edison | 35,904 | 55 | |||
Enel (A) | 667,376 | 3,993 | |||
ENI | 102,562 | 2,541 | |||
Exor | 989 | 19 | |||
Fiat | 41,615 | 614 | |||
Finmeccanica | 34,989 | 579 | |||
Iride (A) | 19,313 | 37 | |||
Luxottica Group | 4,409 | 110 | |||
Mediaset | 31,412 | 238 | |||
Mediobanca * | 47,011 | 561 | |||
Mediolanum (A) | 20,081 | 131 | |||
Milano Assicurazioni | 32,607 | 93 | |||
Parmalat | 209,988 | 611 | |||
Piccolo Credito Valtellinese | 3,239 | 27 | |||
Pirelli | 66,589 | 42 | |||
Saipem | 1,972 | 63 | |||
Saras | 228,054 | 697 | |||
Servizi Italia | 2,512 | 21 | |||
Snam Rete Gas | 63,199 | 317 | |||
Telecom Italia | 937,490 | 1,488 | |||
Terna Rete Elettrica Nazionale (A) | 70,810 | 294 | |||
UniCredito Italiano | 500,314 | 1,709 | |||
Unipol Gruppo Finanziario | 78,000 | 106 | |||
| 19,324 | |||||
Japan — 17.2% | |||||
77 Bank | 77,000 | 474 | |||
Able | 1,500 | 12 | |||
Advantest | 4,500 | 100 | |||
Aeon | 33,800 | 273 | |||
Aeon Fantasy | 200 | 2 | |||
Aichi Bank | 200 | 16 | |||
Aisin Seiki | 34,900 | 847 | |||
Ajinomoto | 35,000 | 329 | |||
Alfresa Holdings | 2,100 | 92 | |||
Alpen | 1,500 | 25 | |||
Alpine Electronics | 10,300 | 104 | |||
Alps Electric | 37,700 | 217 | |||
Amada | 22,000 | 128 | |||
| 4 | SEI Institutional Investment Trust / Semi-Annual Report / November 30, 2009 |
Table of Contents
SCHEDULE OF INVESTMENTS (Unaudited)
International Equity Fund
November 30, 2009
Description | Shares | Market Value ($ Thousands) | |||
AOKI Holdings | 1,900 | $ | 19 | ||
Aoyama Trading | 3,200 | 42 | |||
Arakawa Chemical Industries | 1,700 | 21 | |||
Asahi Breweries | 11,400 | 203 | |||
Asahi Glass | 241,000 | 2,112 | |||
Asahi Kasei | 49,000 | 239 | |||
Asset Managers Holdings | 176 | 15 | |||
Astellas Pharma | 66,300 | 2,455 | |||
Bando Chemical Industries | 16,000 | 43 | |||
Bank of Kyoto | 99,000 | 909 | |||
Bank of Nagoya | 9,000 | 35 | |||
Bank of Yokohama | 108,000 | 526 | |||
Belluna | 2,150 | 8 | |||
Benesse | 400 | 18 | |||
Best Denki | 2,500 | 9 | |||
BML | 800 | 26 | |||
Brother Industries | 8,500 | 93 | |||
Canon | 98,500 | 3,808 | |||
Canon Marketing Japan | 41,800 | 615 | |||
Casio Computer | 300 | 2 | |||
Catena | 4,669 | 10 | |||
Cawachi | 5,000 | 97 | |||
Central Japan Railway | 60 | 435 | |||
Century Tokyo Leasing | 5,300 | 55 | |||
Chiba Bank | 75,000 | 495 | |||
Chiba Kogyo Bank * | 1,900 | 15 | |||
Chuetsu Pulp & Paper | 8,000 | 14 | |||
Chugai Pharmaceutical | 26,500 | 505 | |||
Circle K Sunkus | 4,300 | 57 | |||
Citizen Holdings | 3,200 | 18 | |||
Cleanup | 100 | 1 | |||
COMSYS Holdings | 2,600 | 25 | |||
Corona | 200 | 3 | |||
Dai Nippon Printing | 79,000 | 979 | |||
Daicel Chemical Industries | 130,000 | 776 | |||
Daihatsu Motor | 7,000 | 66 | |||
Daiichi Jitsugyo | 5,000 | 13 | |||
Daiichi Sankyo | 66,700 | 1,311 | |||
Daiichikosho | 6,000 | 71 | |||
Daikin Industries | 700 | 25 | |||
Daikoku Denki | 2,800 | 55 | |||
Daimei Telecom Engineering | 800 | 6 | |||
Dainippon Screen Manufacturing (A) | 76,000 | 272 | |||
Dainippon Sumitomo Pharma | 50,000 | 514 | |||
Daishi Bank | 12,000 | 45 | |||
Daiwa House Industry | 27,000 | 272 | |||
Daiwa Securities Group | 201,000 | 1,085 | |||
DCM Japan Holdings | 4,000 | 25 | |||
Denki Kagaku Kogyo | 83,000 | 350 | |||
Denso | 54,500 | 1,528 | |||
Dentsu (A) | 20,900 | 451 | |||
Dowa Holdings | 10,000 | 53 | |||
eAccess | 33 | 23 | |||
East Japan Railway | 44,700 | 3,165 | |||
Eisai | 600 | 22 | |||
Eizo Nanao | 100 | 2 | |||
Elpida Memory * | 24,300 | 301 | |||
Fast Retailing | 4,700 | 856 | |||
Fuji Heavy Industries | 39,000 | 155 | |||
Fuji Media Holdings (A) | 796 | 1,194 | |||
Fuji Soft ABC | 1,200 | 21 | |||
Description | Shares | Market Value ($ Thousands) | |||
Fujicco | 1,000 | $ | 12 | ||
FUJIFILM Holdings | 87,700 | 2,398 | |||
Fujikura | 4,000 | 19 | |||
Fujishoji | 19 | 24 | |||
Fujitec | 1,000 | 6 | |||
Fujitsu | 395,000 | 2,357 | |||
Fukuda Denshi | 900 | 24 | |||
Fukuoka Financial Group | 170,000 | 620 | |||
Funai Electric | 200 | 11 | |||
Furuno Electric | 1,300 | 5 | |||
Gree | 800 | 43 | |||
GS Yuasa (A) | 21,000 | 148 | |||
Gunma Bank | 10,000 | 59 | |||
Hachijuni Bank | 8,000 | 51 | |||
Hakuhodo DY Holdings | 2,050 | 100 | |||
Hankyu Hanshin Holdings | 8,000 | 37 | |||
Heiwa | 7,300 | 76 | |||
Heiwado | 2,400 | 29 | |||
Higashi-Nippon Bank | 7,000 | 14 | |||
Hikari Tsushin | 2,300 | 40 | |||
HI-LEX | 1,500 | 13 | |||
Hino Motors | 258,000 | 773 | |||
Hitachi (A) | 125,000 | 340 | |||
Hitachi Chemical | 9,200 | 181 | |||
Hitachi Construction Machinery (A) | 6,200 | 145 | |||
Hitachi Metals | 5,000 | 44 | |||
Hokuhoku Financial Group | 52,000 | 122 | |||
Honda Motor | 156,400 | 4,902 | |||
Hosiden | 2,600 | 28 | |||
Hoya | 20,600 | 527 | |||
Ibiden | 13,100 | 444 | |||
Idemitsu Kosan | 4,500 | 277 | |||
IHI | 92,000 | 148 | |||
Iida Home Max | 3,600 | 57 | |||
Inabata | 31,800 | 105 | |||
Inpex | 53 | 415 | |||
Isetan Mitsukoshi Holdings | 31,100 | 268 | |||
Isuzu Motors | 25,000 | 43 | |||
IT Holdings | 2,900 | 34 | |||
Ito En | 5,300 | 86 | |||
Itochu | 146,000 | 1,005 | |||
Itochu Enex | 12,100 | 55 | |||
Itochu Techno-Solutions | 400 | 11 | |||
Itochu-Shokuhin | 500 | 17 | |||
Itoki | 9,000 | 17 | |||
J Front Retailing | 28,000 | 118 | |||
Japan Digital Laboratory | 300 | 4 | |||
Japan Retail Fund Investment, Cl A ‡ | 8 | 35 | |||
Japan Tobacco | 390 | 1,158 | |||
JBCC Holdings | 3,700 | 25 | |||
JFE Holdings | 71,400 | 2,354 | |||
JFE Shoji Holdings | 8,000 | 27 | |||
JGC | 2,000 | 38 | |||
JS Group | 17,600 | 289 | |||
JSP | 6,900 | 67 | |||
JSR | 21,300 | 410 | |||
JTEKT | 4,000 | 39 | |||
Jupiter Telecommunications | 52 | 49 | |||
Kamigumi | 35,000 | 277 | |||
Kaneka | 68,000 | 452 | |||
| 5 | SEI Institutional Investment Trust / Semi-Annual Report / November 30, 2009 |
Table of Contents
SCHEDULE OF INVESTMENTS (Unaudited)
International Equity Fund
November 30, 2009
Description | Shares | Market Value ($ Thousands) | |||
Kansai Electric Power | 12,600 | $ | 314 | ||
Kansai Paint | 18,000 | 156 | |||
Kanto Natural Gas Development | 3,000 | 16 | |||
Kasumi | 2,300 | 12 | |||
Kato Sangyo | 600 | 12 | |||
Kawasaki Heavy Industries | 40,000 | 97 | |||
Kawasumi Laboratories | 3,000 | 20 | |||
KDDI | 136 | 737 | |||
Keio | 33,000 | 210 | |||
Keisei Electric Railway | 23,000 | 130 | |||
Kikkoman | 2,000 | 23 | |||
Kintetsu World Express | 2,500 | 66 | |||
Kirin Holdings | 86,000 | 1,410 | |||
Kobe Steel | 38,000 | 65 | |||
Kohnan Shoji | 1,300 | 16 | |||
Komatsu | 1,500 | 30 | |||
Konica Minolta Holdings | 23,500 | 217 | |||
Konishi | 2,300 | 22 | |||
Kose | 1,300 | 28 | |||
K’s Holdings | 2,000 | 67 | |||
Kubota | 46,000 | 406 | |||
Kuraray | 27,500 | 332 | |||
Kyocera | 12,300 | 982 | |||
Kyoei Steel (A) | 1,500 | 28 | |||
Kyorin | 12,000 | 188 | |||
Kyowa Hakko Kirin | 13,000 | 140 | |||
Kyudenko | 5,000 | 30 | |||
Mabuchi Motor | 2,300 | 113 | |||
Maeda | 7,000 | 18 | |||
Maeda Road Construction | 4,000 | 32 | |||
Maezawa Kasei Industries | 800 | 8 | |||
Makino Milling Machine | 5,000 | 18 | |||
Makita | 16,200 | 549 | |||
Marubeni | 440,000 | 2,329 | |||
Marudai Food | 2,000 | 7 | |||
Marui Group | 22,700 | 128 | |||
Maruichi Steel Tube | 6,300 | 120 | |||
Maruzen Showa Unyu | 5,000 | 18 | |||
Matsumotokiyoshi Holdings | 3,400 | 88 | |||
Maxvalu Nishinihon | 200 | 3 | |||
Mazda Motor | 68,000 | 145 | |||
Mediceo Paltac Holdings | 32,100 | 445 | |||
MEIJI Holdings | 1,100 | 44 | |||
Mie Bank | 4,000 | 11 | |||
Mikuni Coca-Cola Bottling | 2,100 | 17 | |||
Millea Holdings | 25,600 | 739 | |||
Minebea | 14,000 | 70 | |||
Ministop | 800 | 10 | |||
Miraca Holdings | 3,400 | 109 | |||
Mitsubishi | 219,400 | 4,966 | |||
Mitsubishi Chemical Holdings | 61,000 | 222 | |||
Mitsubishi Electric | 32,000 | 227 | |||
Mitsubishi Gas Chemical | 33,000 | 151 | |||
Mitsubishi Heavy Industries | 109,000 | 357 | |||
Mitsubishi Materials | 8,000 | 19 | |||
Mitsubishi Motors * (A) | 68,000 | 92 | |||
Mitsubishi Rayon | 21,000 | 90 | |||
Mitsubishi UFJ Financial Group | 278,200 | 1,557 | |||
Mitsubishi UFJ Lease & Finance | 1,740 | 52 | |||
Mitsui | 122,700 | 1,630 | |||
Mitsui Chemicals | 40,000 | 101 | |||
Mitsui Engineering & Shipbuilding | 202,000 | 499 | |||
Description | Shares | Market Value ($ Thousands) | |||
Mitsui Home | 1,000 | $ | 5 | ||
Mitsui Mining & Smelting | 27,000 | 67 | |||
Mitsui Sumitomo Insurance Group Holdings | 19,200 | 506 | |||
Mitsumi Electric | 1,800 | 28 | |||
Mizuho Securities | 148,000 | 484 | |||
Morinaga Milk Industry | 11,000 | 51 | |||
Murata Manufacturing | 22,300 | 1,064 | |||
Nafco | 1,000 | 18 | |||
Nakanishi | 200 | 17 | |||
Namco Bandai Holdings | 11,200 | 112 | |||
NEC (A) | 158,000 | 400 | |||
NEC Fielding | 1,900 | 26 | |||
NEC Networks & System Integration | 6,900 | 85 | |||
NET One Systems | 20 | 24 | |||
NGK Insulators | 20,000 | 440 | |||
NGK Spark Plug | 3,000 | 32 | |||
NHK Spring | 27,000 | 242 | |||
Nidec | 9,900 | 872 | |||
Nihon Shokuhin Kako | 3,000 | 22 | |||
Nikon | 12,500 | 227 | |||
Nintendo | 1,000 | 246 | |||
Nippo | 5,000 | 37 | |||
Nippon Beet Sugar Manufacturing | 3,000 | 8 | |||
Nippon Electric Glass | 93,000 | 1,110 | |||
Nippon Express | 74,000 | 330 | |||
Nippon Konpo Unyu Soko | 2,000 | 21 | |||
Nippon Mining Holdings | 61,500 | 242 | |||
Nippon Oil | 170,000 | 726 | |||
Nippon Paper Group | 10,000 | 273 | |||
Nippon Shinyaku | 1,000 | 12 | |||
Nippon Soda | 40,000 | 137 | |||
Nippon Steel | 90,000 | 335 | |||
Nippon Telegraph & Telephone | 76,500 | 3,330 | |||
Nipponkoa Insurance | 22,000 | 131 | |||
Nipro | 1,600 | 34 | |||
Nishio Rent All | 2,900 | 20 | |||
Nissan Chemical Industries | 11,000 | 146 | |||
Nissan Motor | 561,000 | 4,077 | |||
Nissan Shatai | 6,000 | 51 | |||
Nisshin Oillio Group | 1,000 | 5 | |||
Nisshin Seifun Group | 5,500 | 75 | |||
Nisshinbo Holdings | 5,000 | 41 | |||
Nissin Food Products | 13,800 | 508 | |||
Nissin Healthcare Food Service | 1,700 | 22 | |||
Nitori | 9,056 | 761 | |||
Nitto Denko | 11,400 | 367 | |||
Nojima | 920 | 9 | |||
NOK | 9,200 | 107 | |||
Nomura Research Institute | 4,900 | 104 | |||
Noritz | 1,800 | 22 | |||
NSK | 14,000 | 87 | |||
NTN | 56,000 | 212 | |||
NTT Data | 78 | 222 | |||
NTT DoCoMo | 757 | 1,151 | |||
Obic | 540 | 90 | |||
Odakyu Electric Railway, Cl B | 10,000 | 83 | |||
Ohsho Food Service | 1,600 | 44 | |||
Okinawa Electric Power | 400 | 25 | |||
Okumura | 6,000 | 21 | |||
Okuwa | 3,000 | 29 | |||
| 6 | SEI Institutional Investment Trust / Semi-Annual Report / November 30, 2009 |
Table of Contents
SCHEDULE OF INVESTMENTS (Unaudited)
International Equity Fund
November 30, 2009
Description | Shares | Market Value ($ Thousands) | |||
Olympus | 2,400 | $ | 73 | ||
Omron | 11,000 | 185 | |||
Onward Holdings | 9,000 | 57 | |||
Oracle Japan | 600 | 27 | |||
ORIX | 4,770 | 331 | |||
Osaka Gas | 93,000 | 340 | |||
Osaka Steel | 1,200 | 21 | |||
Otsuka | 900 | 43 | |||
Panasonic | 75,400 | 972 | |||
Panasonic Electric Works | 17,000 | 195 | |||
Piolax | 1,000 | 16 | |||
Plenus | 400 | 6 | |||
Rakuten | 1,467 | 1,189 | |||
Rengo | 4,000 | 26 | |||
Resona Holdings | 19,100 | 205 | |||
Ricoh | 20,000 | 267 | |||
Rinnai | 1,500 | 75 | |||
Rohm | 8,700 | 574 | |||
Roland | 1,000 | 9 | |||
Ryoden Trading | 7,000 | 35 | |||
S Foods | 5,500 | 52 | |||
Sakai Chemical Industry | 5,000 | 21 | |||
Sammy NetWorks | 6 | 13 | |||
San-Ai Oil | 3,000 | 12 | |||
Sanki Engineering | 3,000 | 22 | |||
Sankyo | 800 | 45 | |||
Sanshin Electronics | 8,000 | 58 | |||
Santen Pharmaceutical | 10,700 | 363 | |||
Sanyo Electric* (A) | 73,000 | 131 | |||
Sapporo Hokuyo Holdings | 214,900 | 803 | |||
Sawai Pharmaceutical | 700 | 40 | |||
Sazaby League | 800 | 10 | |||
SBI Holdings (A) | 925 | 157 | |||
Secom | 900 | 42 | |||
Sega Sammy Holdings | 6,800 | 86 | |||
Seiko Epson | 14,100 | 219 | |||
Seino Holdings | 26,000 | 190 | |||
Sekisui House | 4,000 | 35 | |||
Senshu Ikeda Holdings* | 25,200 | 90 | |||
Seven & I Holdings | 27,500 | 617 | |||
Sharp | 64,000 | 734 | |||
Shimamura | 1,500 | 141 | |||
Shimano | 4,300 | 180 | |||
Shin-Etsu Chemical | 1,900 | 103 | |||
Shin-Etsu Polymer | 6,100 | 37 | |||
Shinko Electric Industries | 29,100 | 411 | |||
Shinmaywa Industries | 9,000 | 28 | |||
Shinsei Bank (A) | 174,000 | 214 | |||
Shionogi | 66,500 | 1,437 | |||
Shiseido | 2,700 | 54 | |||
Showa Denko | 25,000 | 44 | |||
Showa Shell Sekiyu | 10,400 | 88 | |||
Sinanen | 2,000 | 9 | |||
Sintokogio | 2,000 | 14 | |||
SMC | 200 | 23 | |||
Softbank | 4,100 | 99 | |||
Sohgo Security Services | 3,200 | 37 | |||
Sojitz | 137,100 | 240 | |||
So-net Entertainment | 8 | 17 | |||
Sony | 81,100 | 2,189 | |||
Sorun | 2,600 | 24 | |||
SRI Sports | 11 | 11 | |||
Description | Shares | Market Value ($ Thousands) | |||
Stanley Electric | 30,900 | $ | 614 | ||
Sumco | 6,300 | 108 | |||
Sumikin Bussan | 3,000 | 6 | |||
Sumitomo | 75,100 | 741 | |||
Sumitomo Chemical | 63,000 | 249 | |||
Sumitomo Electric Industries | 133,000 | 1,578 | |||
Sumitomo Metal Mining | 65,000 | 1,070 | |||
Sumitomo Mitsui Financial Group | 77,600 | 2,567 | |||
Sumitomo Realty & Development | 4,000 | 70 | |||
Sumitomo Rubber Industries | 2,400 | 19 | |||
Suncall | 4,000 | 15 | |||
Suzuken | 4,400 | 161 | |||
Suzuki Motor | 33,800 | 804 | |||
T&D Holdings | 4,450 | 103 | |||
T&K Toka | 2,100 | 22 | |||
Tadano | 2,000 | 9 | |||
Taisho Pharmaceutical | 10,000 | 184 | |||
Taiyo Nippon Sanso | 24,000 | 272 | |||
Taiyo Yuden | 20,000 | 206 | |||
Takeda Pharmaceutical | 37,800 | 1,580 | |||
TDK | 14,900 | 780 | |||
Teijin | 65,000 | 204 | |||
Terumo | 5,500 | 312 | |||
THK | 1,400 | 23 | |||
TKC | 1,200 | 24 | |||
Tobu Railway | 16,000 | 89 | |||
Toda | 11,000 | 33 | |||
Toei | 2,000 | 10 | |||
Toho Holdings | 3,100 | 43 | |||
Tohokushinsha Film | 1,900 | 11 | |||
Tokai Tokyo Securities | 10,000 | 36 | |||
Tokyo Broadcasting System HD | 6,100 | 95 | |||
Tokyo Electric Power | 700 | 19 | |||
Tokyo Electron | 9,800 | 537 | |||
Tokyo Steel Manufacturing | 3,500 | 40 | |||
Tokyo Style | 2,000 | 16 | |||
Tokyo Tekko | 11,000 | 32 | |||
Tokyu | 7,000 | 31 | |||
Tokyu Land | 6,000 | 22 | |||
Tomoku | 11,000 | 26 | |||
Toppan Forms | 4,000 | 44 | |||
Toppan Printing | 73,000 | 594 | |||
Topre | 100 | 1 | |||
Topy Industries | 9,288 | 16 | |||
Toray Industries | 3,000 | 16 | |||
Torii Pharmaceutical | 200 | 4 | |||
Toshiba | 294,000 | 1,563 | |||
Toshiba TEC | 20,000 | 71 | |||
Tosoh | 16,000 | 38 | |||
Totetsu Kogyo | 13,000 | 73 | |||
Toyo Kohan | 5,000 | 24 | |||
Toyo Seikan Kaisha | 9,200 | 138 | |||
Toyo Suisan Kaisha | 18,000 | 492 | |||
Toyoda Gosei | 11,500 | 317 | |||
Toyota Boshoku | 5,800 | 114 | |||
Toyota Industries | 4,900 | 135 | |||
Toyota Motor | 82,200 | 3,283 | |||
Toyota Tsusho | 45,000 | 604 | |||
Trend Micro | 200 | 7 | |||
Tsumura | 1,800 | 60 | |||
TV Asahi | 26 | 40 | |||
Unicharm | 1,700 | 174 | |||
| 7 | SEI Institutional Investments Trust / Semi-Annual Report / November 30, 2009 |
Table of Contents
SCHEDULE OF INVESTMENTS (Unaudited)
International Equity Fund
November 30, 2009
Description | Shares | Market Value ($ Thousands) | |||
Universe | 3,600 | $ | 52 | ||
UNY | 11,600 | 84 | |||
USS | 1,080 | 67 | |||
Valor | 1,600 | 13 | |||
VITAL KSK HOLDINGS | 400 | 3 | |||
West Japan Railway | 90 | 335 | |||
Yakult Honsha | 3,000 | 94 | |||
Yamada Denki | 14,920 | 899 | |||
Yamaguchi Financial Group | 8,000 | 84 | |||
Yamaha | 2,500 | 26 | |||
Yamaha Motor | 15,800 | 186 | |||
Yamato Holdings | 45,000 | 626 | |||
Yamato Kogyo | 12,700 | 399 | |||
Yaskawa Electric | 31,000 | 233 | |||
Yokogawa Electric | 18,000 | 128 | |||
Yurtec | 4,000 | 23 | |||
| 128,973 | |||||
Jersey — 0.0% | |||||
Randgold Resources | 2,055 | 174 | |||
Mauritius — 0.1% | |||||
Golden Agri-Resources | 1,345,332 | 447 | |||
Netherlands — 4.7% | |||||
Aegon | 36,719 | 264 | |||
Akzo Nobel | 39,628 | 2,513 | |||
ArcelorMittal (A) | 21,065 | 821 | |||
ASML Holding (A) | 32,367 | 994 | |||
Boskalis Westminster | 799 | 32 | |||
Corio‡ | 2,154 | 147 | |||
CSM | 12,869 | 338 | |||
European Aeronautic Defense and Space (A) | 95,402 | 1,707 | |||
Fugro | 2,844 | 161 | |||
Heineken | 13,250 | 623 | |||
Heineken Holding | 2,717 | 112 | |||
Imtech | 8,371 | 215 | |||
ING Groep (A) | 107,338 | 1,000 | |||
James Hardie Industries | 23,454 | 173 | |||
Koninklijke Ahold | 61,571 | 830 | |||
Koninklijke DSM | 30,702 | 1,510 | |||
Koninklijke Philips Electronics | 82,032 | 2,243 | |||
Koninklijke Vopak* | 9,468 | 742 | |||
Ordina | 8,408 | 61 | |||
QIAGEN* | 3,016 | 67 | |||
Randstad Holding | 8,125 | 354 | |||
Royal Dutch Shell, Cl B | 134,793 | 3,842 | |||
Royal Dutch Shell, Cl A (GBP) | 76,989 | 2,275 | |||
Royal Dutch Shell, Cl A | 168,571 | 5,009 | |||
Royal KPN | 134,873 | 2,393 | |||
SBM Offshore | 56,367 | 1,064 | |||
Teleplan International* | 9,136 | 27 | |||
TNT | 38,028 | 1,103 | |||
Unilever (A) | 144,258 | 4,419 | |||
| 35,039 | |||||
New Zealand — 0.1% | |||||
Air New Zealand | 45,100 | 39 | |||
Fletcher Building | 53,212 | 299 | |||
Description | Shares | Market Value ($ Thousands) | |||
Telecom of New Zealand | 461,050 | $ | 811 | ||
| 1,149 | |||||
Norway — 0.9% | |||||
Aker Kvaerner | 62,000 | 770 | |||
Atea | 11,500 | 86 | |||
DnB (A) | 170,696 | 1,918 | |||
Marine Harvest* (A) | 436,000 | 326 | |||
Norsk Hydro | 4,000 | 28 | |||
Seadrill | 31,400 | 725 | |||
Statoil | 38,310 | 938 | |||
Telenor | 131,200 | 1,785 | |||
| 6,576 | |||||
Papua New Guinea — 0.0% | |||||
Lihir Gold | 64,100 | 211 | |||
Portugal — 0.4% | |||||
Banco Comercial Portugues, Cl R | 278,800 | 369 | |||
Banco Espirito Santo | 38,983 | 273 | |||
Brisa Auto-Estradas de Portugal | 5,464 | 55 | |||
Cimpor Cimentos de Portugal | 20,997 | 160 | |||
Energias de Portugal | 141,734 | 650 | |||
Galp Energia SGPS, Cl B | 800 | 14 | |||
Jeronimo Martins | 39,914 | 391 | |||
Portugal Telecom | 78,812 | 953 | |||
| 2,865 | |||||
Russia — 0.3% | |||||
Gazprom OAO ADR | 53,741 | 1,221 | |||
Vimpel-Communications ADR | 42,600 | 813 | |||
| 2,034 | |||||
Singapore — 1.7% | |||||
CapitaCommercial Trust‡ | 366,000 | 304 | |||
CapitaLand | 37,000 | 108 | |||
CapitaMall Trust‡ | 218,000 | 271 | |||
City Developments | 15,000 | 108 | |||
DBS Group Holdings | 341,000 | 3,525 | |||
Fraser and Neave | 79,000 | 227 | |||
Jardine Cycle & Carriage | 34,000 | 596 | |||
Keppel | 25,000 | 146 | |||
Olam International | 500,000 | 949 | |||
Oversea-Chinese Banking | 299,000 | 1,809 | |||
SembCorp Industries | 97,000 | 259 | |||
SembCorp Marine | 15,000 | 38 | |||
SIA Engineering | 43,000 | 90 | |||
Singapore Airlines | 5,000 | 48 | |||
Singapore Airport Terminal Services | 44,000 | 81 | |||
Singapore Exchange | 55,000 | 312 | |||
Singapore Press Holdings | 35,000 | 94 | |||
Singapore Telecommunications | 258,000 | 546 | |||
United Overseas Bank | 15,000 | 204 | |||
UOB-Kay Hian Holdings | 13,000 | 14 | |||
UOL Group | 37,000 | 97 | |||
Wheelock Properties Singapore | 23,370 | 29 | |||
Wilmar International | 529,500 | 2,408 | |||
Wing Tai Holdings | 17,000 | 20 | |||
| 8 | SEI Institutional Investments Trust / Semi-Annual Report / November 30, 2009 |
Table of Contents
SCHEDULE OF INVESTMENTS (Unaudited)
International Equity Fund
November 30, 2009
Description | Shares | Market Value ($ Thousands) | |||
Yangzijiang Shipbuilding Holdings | 154,000 | $ | 137 | ||
| 12,420 | |||||
South Africa — 0.1% | |||||
Impala Platinum Holdings | 23,236 | 537 | |||
South Korea — 0.2% | |||||
Samsung Electronics | 2,220 | 1,375 | |||
Spain — 3.8% | |||||
Abengoa | 809 | 24 | |||
Abertis Infraestructuras | 13,024 | 297 | |||
Acerinox | 11,084 | 230 | |||
ACS Actividades Construcciones y Servicios | 5,773 | 287 | |||
Banco Bilbao Vizcaya Argentaria (A) | 249,832 | 4,705 | |||
Banco de Sabadell (A) | 3,680 | 24 | |||
Banco Popular Espanol (A) | 9,954 | 84 | |||
Banco Santander Central Hispano | 515,305 | 8,827 | |||
Bankinter | 20,579 | 221 | |||
Cintra Concesiones de Infraestructuras de Transporte | 6,987 | 75 | |||
Criteria Caixacorp (A) | 15,154 | 77 | |||
EDP Renovaveis* | 14,392 | 141 | |||
Enagas | 7,102 | 154 | |||
Financiera Alba | 1,688 | 91 | |||
Fomento de Construcciones y Contratas | 3,965 | 169 | |||
Gas Natural | 28,532 | 592 | |||
Gestevision Telecinco | 4,927 | 55 | |||
Grupo Catalana Occidente | 1,000 | 22 | |||
Grupo Ferrovial | 992 | 43 | |||
Iberdrola | 37,389 | 355 | |||
Inditex | 6,270 | 399 | |||
Mapfre (A) | 89,123 | 393 | |||
Obrascon Huarte Lain (A) | 3,542 | 97 | |||
Red Electrica | 16,487 | 901 | |||
Repsol | 77,744 | 2,136 | |||
Sacyr Vallehermoso (A) | 14,378 | 198 | |||
Sol Melia | 1,521 | 13 | |||
Telefonica | 280,160 | 8,042 | |||
Zardoya Otis | 2,453 | 51 | |||
| 28,703 | |||||
Sweden — 1.8% | |||||
Alliance Oil* | 7,059 | 102 | |||
Assa Abloy, Cl B | 11,793 | 216 | |||
Atlas Copco, Cl B | 2,477 | 31 | |||
Atlas Copco, Cl A | 10,118 | 143 | |||
Bilia, Cl A | 3,038 | 29 | |||
Boliden | 24,000 | 301 | |||
Electrolux, Cl B | 110,289 | 2,692 | |||
Eniro | 7,217 | 34 | |||
Getinge, Cl B | 3,899 | 79 | |||
Hennes & Mauritz, Cl B | 12,156 | 717 | |||
Husqvarna, Cl B | 2,813 | 20 | |||
Investor, Cl B | 3,369 | 61 | |||
Lundin Petroleum* | 18,902 | 157 | |||
Nordea Bank | 144,958 | 1,500 | |||
Description | Shares | Market Value ($ Thousands) | |||
Skandinaviska Enskilda Banken, Cl A | 2,858 | $ | 18 | ||
Skanska, Cl B | 13,307 | 224 | |||
SKF, Cl B | 9,897 | 163 | |||
Svenska Cellulosa, Cl A | 1,904 | 26 | |||
Svenska Cellulosa, Cl B | 185,565 | 2,549 | |||
Svenska Handelsbanken, Cl A | 17,868 | 511 | |||
Swedbank | 41,569 | 396 | |||
Swedish Match | 16,009 | 344 | |||
Tele2, Cl B | 5,364 | 82 | |||
Telefonaktiebolaget LM Ericsson, Cl B(A) | 193,756 | 1,857 | |||
TeliaSonera | 98,272 | 696 | |||
Trelleborg, Cl B | 18,474 | 126 | |||
Volvo, Cl A | 2,608 | 25 | |||
Volvo, Cl B | 6,463 | 61 | |||
| 13,160 | |||||
Switzerland — 8.1% | |||||
ABB | 115,345 | 2,113 | |||
ACE | 7,600 | 370 | |||
Actelion* | 7,664 | 451 | |||
Adecco | 16,046 | 800 | |||
Aryzta* | 1,128 | 43 | |||
Baloise Holding | 10,858 | 905 | |||
Banque Cantonale Vaudoise | 673 | 268 | |||
Clariant | 24,000 | 251 | |||
Coltene Holding | 472 | 25 | |||
Compagnie Financiere Richemont | 19,554 | 632 | |||
Credit Suisse Group | 136,879 | 7,088 | |||
Elektrizitaets-Gesellschaft Laufenburg | 24 | 23 | |||
Geberit | 1,714 | 296 | |||
Helvetia Holding | 770 | 235 | |||
Holcim* | 32,091 | 2,310 | |||
Julius Baer Group | 50,136 | 1,655 | |||
Julius Baer Holding | 1,900 | 23 | |||
Kuehne + Nagel International | 4,779 | 462 | |||
Lindt & Spruengli | 146 | 386 | |||
Micronas Semiconductor Holding* | 6,888 | 22 | |||
Nestle | 219,078 | 10,358 | |||
Nobel Biocare Holding | 6,246 | 186 | |||
Novartis | 154,627 | 8,584 | |||
Panalpina Welttransport Holding | 110 | 7 | |||
Roche Holding | 36,129 | 5,911 | |||
Schindler Holding | 2,911 | 219 | |||
SGS | 42 | 54 | |||
Sonova Holding | 3,633 | 431 | |||
STMicroelectronics | 15,900 | 128 | |||
Straumann Holding | 563 | 138 | |||
Sulzer | 822 | 65 | |||
Swatch Group, Cl B | 4,149 | 1,045 | |||
Swatch Group | 12,823 | 613 | |||
Swiss Life Holding | 4,271 | 525 | |||
Swiss Reinsurance | 16,211 | 771 | |||
Swisscom | 5,117 | 1,990 | |||
Syngenta | 2,778 | 737 | |||
Synthes | 2,589 | 340 | |||
UBS | 113,656 | 1,763 | |||
Valora Holding | 166 | 44 | |||
Vontobel Holding | 2,947 | 91 | |||
| 9 | SEI Institutional Investments Trust / Semi-Annual Report / November 30, 2009 |
Table of Contents
SCHEDULE OF INVESTMENTS (Unaudited)
International Equity Fund
November 30, 2009
Description | Shares | Market Value ($ Thousands) | |||
Xstrata | 264,593 | $ | 4,642 | ||
Zurich Financial Services | 17,434 | 3,757 | |||
| 60,757 | |||||
Taiwan — 0.6% | |||||
Chunghwa Telecom | 523,298 | 937 | |||
MediaTek | 54,000 | 851 | |||
Taishin Financial Holding | 1,123,000 | 419 | |||
Taiwan Semiconductor Manufacturing | 332,389 | 631 | |||
United Microelectronics ADR* (A) | 411,300 | 1,394 | |||
| 4,232 | |||||
Turkey — 0.2% | |||||
Turkcell Iletisim Hizmet | 113,577 | 687 | |||
Turkiye Garanti Bankasi | 224,350 | 747 | |||
| 1,434 | |||||
United Kingdom — 16.0% | |||||
3i Group* | 4,170 | 18 | |||
Admiral Group | 5,019 | 87 | |||
Aegis Group | 84,143 | 149 | |||
Amec | 65,905 | 858 | |||
Amlin | 46,838 | 285 | |||
Anglo American | 55,825 | 2,385 | |||
Antofagasta | 62,702 | 927 | |||
Arriva | 6,892 | 52 | |||
Associated British Foods | 16,129 | 213 | |||
AstraZeneca | 192,291 | 8,574 | |||
Autonomy* | 29,342 | 686 | |||
Aviva | 242,695 | 1,475 | |||
Babcock International Group | 41,267 | 422 | |||
Balfour Beatty | 12,227 | 51 | |||
Barclays | 896,865 | 4,303 | |||
Berkeley Group Holdings* | 10,607 | 151 | |||
BG Group | 185,035 | 3,349 | |||
BHP Billiton | 170,692 | 5,203 | |||
BP | 1,432,719 | 13,510 | |||
Brit Insurance Holdings | 7,410 | 23 | |||
British Airways | 11,878 | 38 | |||
British American Tobacco | 162,923 | 4,939 | |||
British Sky Broadcasting Group | 16,273 | 141 | |||
BT Group, Cl A | 296,185 | 682 | |||
Bunzl | 2,188 | 23 | |||
Burberry Group | 29,732 | 278 | |||
Cadbury | 68,180 | 902 | |||
Cape* | 41,170 | 154 | |||
Carnival | 11,786 | 394 | |||
Catlin Group | 62,295 | 314 | |||
Centrica | 430,000 | 1,797 | |||
Charter International | 18,807 | 224 | |||
Compass Group | 3,980 | 28 | |||
Computacenter | 4,925 | 20 | |||
Dairy Crest Group | 10,245 | 63 | |||
Davis Service Group PLC | 60,400 | 398 | |||
Delta | 12,138 | 27 | |||
Diageo | 37,479 | 630 | |||
Dimension Data Holdings | 110,939 | 135 | |||
DS Smith | 37,674 | 69 | |||
easyJet* | 145,975 | 879 | |||
Education Development International | 15,291 | 33 | |||
Description | Shares | Market Value ($ Thousands) | |||
Eurasian Natural Resources | 43,119 | $ | 610 | ||
Firstgroup | 55,376 | 355 | |||
Fresnillo | 40,552 | 561 | |||
GlaxoSmithKline | 269,954 | 5,569 | |||
Group 4 Securicor | 9,785 | 39 | |||
Hammerson‡ | 8,561 | 56 | |||
Healthcare Locums | 18,106 | 80 | |||
Hogg Robinson Group | 38,599 | 23 | |||
Home Retail Group | 189,739 | 916 | |||
HSBC Holdings | 875,347 | 10,156 | |||
ICAP | 133,540 | 947 | |||
Imperial Tobacco Group | 100,478 | 2,915 | |||
Inchcape | 1,468,305 | 670 | |||
Intercontinental Hotels Group | 15,690 | 217 | |||
International Power | 228,514 | 1,038 | |||
Interserve | 46,900 | 160 | |||
Invensys | 104,145 | 478 | |||
Investec | 29,589 | 209 | |||
ITV | 264,662 | 226 | |||
Johnson Matthey | 381 | 9 | |||
Kazakhmys | 46,235 | 935 | |||
Kingfisher | 378,749 | 1,474 | |||
Land Securities Group‡ | 2,108 | 23 | |||
Legal & General Group | 1,377,531 | 1,749 | |||
Lloyds Banking Group | 16,042 | 14 | |||
LogicaCMG | 110,747 | 213 | |||
London Stock Exchange Group | 7,867 | 97 | |||
Man Group | 9,506 | 50 | |||
Marks & Spencer Group | 119,969 | 760 | |||
Meggitt | 29,893 | 117 | |||
Millennium & Copthorne Hotels | 21,813 | 125 | |||
Mondi | 4,227 | 23 | |||
Morgan Sindall | 3,027 | 26 | |||
National Grid | 146,883 | 1,592 | |||
Next | 31,507 | 1,022 | |||
Old Mutual | 1,020,091 | 1,900 | |||
Pearson | 27,314 | 372 | |||
Persimmon | 102,978 | 699 | |||
Petrofac | 59,618 | 952 | |||
Prudential | 115,064 | 1,181 | |||
Reckitt Benckiser Group | 47,844 | 2,434 | |||
Rexam | 217,342 | 989 | |||
Rio Tinto | 64,660 | 3,277 | |||
Rolls-Royce Group | 190,815 | 1,486 | |||
Royal & Sun Alliance Insurance Group | 137,905 | 264 | |||
Royal Bank of Scotland Group | 267,581 | 146 | |||
SABMiller | 46,152 | 1,341 | |||
Sage Group | 341,576 | 1,196 | |||
Schroders | 17,472 | 330 | |||
Scottish & Southern Energy | 5,979 | 110 | |||
Segro‡ | 6,768 | 36 | |||
Serco Group | 20,383 | 173 | |||
Shire | 40,421 | 786 | |||
Smith & Nephew | 1,973 | 19 | |||
Standard Chartered | 150,361 | 3,662 | |||
Standard Life | 60,078 | 205 | |||
Taylor Woodrow | 408,123 | 238 | |||
Tesco | 221,017 | 1,534 | |||
Thomas Cook Group | 40,000 | 139 | |||
Tomkins | 115,139 | 325 | |||
Travis Perkins | 42,555 | 529 | |||
| 10 | SEI Institutional Investments Trust / Semi-Annual Report / November 30, 2009 |
Table of Contents
SCHEDULE OF INVESTMENTS (Unaudited)
International Equity Fund
November 30, 2009
Description | Shares | Market Value ($ Thousands) | |||
Tullett Prebon | 62,509 | $ | 327 | ||
Tullow Oil | 21,651 | 439 | |||
Unilever | 11,780 | 345 | |||
Vedanta Resources | 5,828 | 220 | |||
Vodafone Group | 1,599,902 | 3,600 | |||
Whitbread | 4,099 | 86 | |||
WM Morrison Supermarkets | 176,272 | 797 | |||
WPP | 179,649 | 1,675 | |||
| 120,155 | |||||
United States — 0.5% | |||||
American Safety Insurance | |||||
Holdings* | 1,527 | 23 | |||
A. Schulman | 3,000 | 49 | |||
Buckeye Technologies* | 2,900 | 28 | |||
Capital One Financial | 17,200 | 660 | |||
Clearwater Paper* | 1,900 | 93 | |||
Computer Sciences* | 300 | 17 | |||
ConocoPhillips | 13,700 | 709 | |||
EW Scripps, Cl A* | 6,500 | 41 | |||
Glatfelter | 5,800 | 65 | |||
HSN* | 6,700 | 120 | |||
Kemet* | 37,700 | 51 | |||
M&F Worldwide* | 1,500 | 50 | |||
MeadWestvaco | 13,900 | 380 | |||
Omnova Solutions* | 5,400 | 36 | |||
PS Business Parks‡ | 3,200 | 152 | |||
Thomson Reuters (CAD) | 14,624 | 463 | |||
TICC Capital | 12,600 | 70 | |||
Transatlantic Holdings | 3,400 | 184 | |||
| 3,191 | |||||
Total Common Stock | 673,099 | ||||
AFFILIATED PARTNERSHIP — 4.5% | |||||
SEI Liquidity Fund, L.P., | |||||
0.32%**†(I) | 34,392,748 | 33,521 | |||
Total Affiliated Partnership | 33,521 | ||||
MORTGAGE-BACKED SECURITIES — 1.9% | |||||
Agency Mortgage-Backed Obligations — 0.3% | |||||
FHLMC ARM (C) | |||||
5.830%, 03/01/36 | 285 | 299 | |||
5.262%, 10/01/35 | 233 | 244 | |||
4.778%, 06/01/35 | 252 | 261 | |||
FHLMC CMO, Ser 3335, Cl BF | |||||
0.389%, 07/15/19 (C) | 122 | 121 | |||
FHLMC CMO, Ser 3336, Cl FA | |||||
0.469%, 02/15/19 (C) | 389 | 388 | |||
FNMA | |||||
6.000%, 07/01/37 | 266 | 286 | |||
FNMA ARM (C) 5 | |||||
.118%, 10/01/35 | 323 | 338 | |||
4.496%, 05/01/35 | 260 | 271 | |||
| 2,208 | |||||
Non-Agency Mortgage-Backed Obligations — 1.6% | |||||
Banc of America Commercial Mortgage, Cl A2 | |||||
4.764%, 07/10/45 | 400 | 401 | |||
Description | Shares | Market Value ($ Thousands) | ||||
Banc of America Commercial Mortgage, | ||||||
5.185%, 09/10/47 | $ | 168 | $ | 171 | ||
Banc of America Funding, | ||||||
5.500%, 04/25/35 | 440 | 430 | ||||
Banc of America Funding, | ||||||
4.666%, 02/20/36 (C) | 118 | 27 | ||||
Banc of America Mortgage Securities, | ||||||
0.686%, 12/25/33 (C) | 96 | 92 | ||||
Banc of America Mortgage Securities, | ||||||
5.000%, 12/25/19 | 397 | 401 | ||||
BCAP LLC Trust, | ||||||
5.000%, 11/25/36 | 232 | 232 | ||||
Chase Mortgage Finance, | ||||||
4.593%, 02/25/37 (C) | 248 | 228 | ||||
Countrywide Home Loan Mortgage | ||||||
5.000%, 09/25/33 | 118 | 118 | ||||
Countrywide Home Loan Mortgage | ||||||
4.500%, 07/25/33 | 380 | 380 | ||||
Countrywide Home Loan Mortgage | ||||||
5.750%, 08/25/34 | 120 | 120 | ||||
Countrywide Home Loan Mortgage | ||||||
3.510%, 11/25/34 (C) | 376 | 304 | ||||
Credit Suisse First Boston Mortgage | ||||||
6.505%, 02/15/34 | 202 | 208 | ||||
Credit Suisse First Boston Mortgage | ||||||
3.382%, 05/15/38 | 132 | 133 | ||||
Credit Suisse First Boston Mortgage | ||||||
4.512%, 07/15/37 | 565 | 565 | ||||
Credit Suisse First Boston Mortgage | ||||||
5.017%, 08/15/38 | 190 | 191 | ||||
CS First Boston Mortgage | ||||||
4.609%, 02/15/38 | 127 | 127 | ||||
Deutsche ALT-A Securities Alternate Loan | ||||||
6.250%, 07/25/36 (C) | 390 | 288 | ||||
| 11 | SEI Institutional Investments Trust / Semi-Annual Report / November 30, 2009 |
Table of Contents
SCHEDULE OF INVESTMENTS (Unaudited)
International Equity Fund
November 30, 2009
Description | Shares | Market Value ($ Thousands) | ||||
DLJ Commercial Mortgage, | ||||||
7.620%, 06/10/33 | $ | 93 | $ | 94 | ||
DLJ Commercial Mortgage, | ||||||
7.180%, 11/10/33 | 289 | 295 | ||||
First Horizon Asset Securities, | ||||||
5.500%, 11/25/33 | 402 | 397 | ||||
First Horizon Asset Securities, | ||||||
5.640%, 11/25/36 (C) | 489 | 371 | ||||
First Union National Bank Commercial Mortgage, Ser 2000-C1, Cl A2 | ||||||
7.841%, 05/17/32 | 46 | 46 | ||||
GMAC Commercial Mortgage Securities, | ||||||
4.760%, 08/10/38 | 178 | 183 | ||||
GMAC Mortgage Loan Trust, | ||||||
5.250%, 04/25/34 | 316 | 315 | ||||
GMAC Mortgage Loan Trust, | ||||||
5.500%, 09/25/34 | 189 | 186 | ||||
Indymac Index Mortgage Loan Trust, | ||||||
3.624%, 10/25/34 (C) | 59 | 39 | ||||
JPMorgan Chase Commercial Mortgage | ||||||
7.371%, 08/15/32 (C) | 77 | 77 | ||||
JPMorgan Mortgage Trust, | ||||||
4.816%, 12/25/34 (C) | 115 | 113 | ||||
LB-UBS Commercial Mortgage Trust, | ||||||
7.370%, 08/15/26 | 122 | 125 | ||||
LB-UBS Commercial Mortgage Trust, | ||||||
6.510%, 12/15/26 | 187 | 193 | ||||
LB-UBS Commercial Mortgage Trust, | ||||||
6.530%, 07/14/16 | 200 | 210 | ||||
LB-UBS Commercial Mortgage Trust, | ||||||
4.064%, 09/15/27 (C) | 511 | 515 | ||||
Master Adjustable Rate Mortgages Trust, Ser 2004-6, Cl 2A1 | ||||||
4.134%, 07/25/34 (C) | 429 | 356 | ||||
Master Adjustable Rate Mortgages Trust, Ser 2005-2, Cl 3A1 | ||||||
4.020%, 03/25/35 (C) | 333 | 195 | ||||
Master Alternative Loans Trust, | ||||||
5.750%, 09/25/33 | 145 | 144 | ||||
Merrill Lynch Mortgage Trust, | ||||||
3.941%, 02/25/36 (C) | 843 | 614 | ||||
Morgan Stanley Capital I, | ||||||
4.809%, 01/14/42 | 47 | 47 | ||||
Description | Shares | Market Value ($ Thousands) | ||||
Nomura Asset Acceptance, | ||||||
6.500%, 03/25/34 | $ | 254 | $ | 246 | ||
Nomura Asset Acceptance, | ||||||
6.500%, 10/25/34 (C) | 290 | 272 | ||||
PNC Mortgage Acceptance, | ||||||
7.610%, 03/15/33 | 48 | 48 | ||||
PNC Mortgage Acceptance, | ||||||
7.300%, 10/12/33 | 141 | 145 | ||||
Residential Asset Securitization Trust, | ||||||
0.736%, 03/25/33 (C) | 85 | 77 | ||||
Residential Asset Securitization Trust, | ||||||
3.527%, 12/25/34 (C) | 857 | 681 | ||||
Residential Funding Mortgage Securities I, | ||||||
6.000%, 06/25/36 | 193 | 189 | ||||
Residential Funding Mortgage Securities I, | ||||||
5.500%, 03/25/34 | 201 | 201 | ||||
Salomon Brothers Mortgage Securities VII, | ||||||
7.520%, 02/18/32 (C) | 3 | 3 | ||||
Thornburg Mortgage Securities Trust, | ||||||
0.356%, 09/25/46 (C) | 524 | 479 | ||||
Wachovia Bank Commercial Mortgage Trust, Ser 2005-C17, Cl A2 | ||||||
4.782%, 03/15/42 | 229 | 230 | ||||
WaMu Mortgage Pass Through Certificates, Ser 2004-AR9, Cl A6 | ||||||
2.950%, 08/25/34 (C) | 8 | 8 | ||||
Washington Mutual Mortgage Pass-Through Certificates, Ser 2003-S4, Cl 2A5 | ||||||
4.500%, 06/25/33 | 179 | 179 | ||||
Washington Mutual Mortgage Pass-Through Certificates, Ser 2004-S2, Cl 2A1 | ||||||
5.500%, 06/25/34 | 185 | 184 | ||||
Wells Fargo Mortgage Backed Securities Trust, Ser 2004-6, Cl A5 | ||||||
3.219%, 08/25/34 (C) | 4 | 4 | ||||
Wells Fargo Mortgage Backed Securities Trust, Ser 2004-I, Cl B1 | ||||||
3.668%, 07/25/34 (C) | 47 | 17 | ||||
| 12 | SEI Institutional Investment Trust / Semi-Annual Report / November 30, 2009 |
Table of Contents
SCHEDULE OF INVESTMENTS (Unaudited)
International Equity Fund
November 30, 2009
Description | Shares | Market Value ($ Thousands) | ||||
Wells Fargo Mortgage Backed Securities Trust, Ser 2004-N, Cl A13 | ||||||
0.686%, 06/25/34 (C) | $ | 100 | $ | 96 | ||
| 11,990 | ||||||
Total Mortgage-Backed Securities | 14,198 | |||||
ASSET-BACKED SECURITIES — 1.4% | ||||||
Automotive — 0.4% | ||||||
Americredit Prime Automobile Receivable, Ser 2009-1, Cl A2 | ||||||
1.400%, 11/15/12 | 160 | 161 | ||||
Bank of America Auto Trust, | ||||||
2.130%, 09/15/13 | 365 | 371 | ||||
BMW Vehicle Lease Trust, Cl A2 | ||||||
2.040%, 04/15/11 | 390 | 393 | ||||
BMW Floorplan Master Owner Trust, Ser 2009-1A, Cl A | ||||||
1.389%, 09/15/14 (C) | 124 | 124 | ||||
Citifinancial Auto Issuance Trust, | ||||||
1.830%, 11/15/12 | 195 | 195 | ||||
Honda Auto Receivables Owner Trust, Ser 2008-1, Cl A3 | ||||||
4.470%, 01/18/12 | 155 | 158 | ||||
Honda Auto Receivables Owner Trust, Ser 2009-2, Cl A2 | ||||||
2.220%, 08/15/11 | 250 | 252 | ||||
Honda Auto Receivables Owner Trust, Ser 2009-S1, Cl A3 | ||||||
2.310%, 05/15/13 | 210 | 214 | ||||
Mercedes-Benz Auto Receivables Trust, Ser 2009-1, Cl A3 | ||||||
1.670%, 01/15/14 | 105 | 106 | ||||
Nissan Auto Lease Trust, Cl A2 | ||||||
2.010%, 04/15/11 | 310 | 312 | ||||
USAA Auto Owner Trust, | ||||||
2.640%, 08/15/11 | 600 | 604 | ||||
Volkswagen Auto Lease Trust, Cl A2 | ||||||
2.870%, 07/15/11 | 370 | 374 | ||||
| 3,264 | ||||||
Credit Cards — 0.6% | ||||||
American Express Credit Account Master Trust, Ser 2003-3, Cl A | ||||||
1.589%, 12/15/14 (C) | 785 | 801 | ||||
Bank of America Credit Card Trust, Ser 2006-A6, Cl A6 | ||||||
0.269%, 11/15/13 (C) | 200 | 197 | ||||
Capital One Multi-Asset Execution Trust, Ser 2008-A5, Cl A5 | ||||||
4.850%, 02/18/14 | 305 | 319 | ||||
Capital One Multi-Asset Execution Trust, Ser 2009-A1, Cl A1 | ||||||
1.339%, 04/15/13 (C) | 25 | 25 | ||||
Chase Issuance Trust, | ||||||
0.279%, 06/16/14 (C) | 305 | 300 | ||||
Description | Shares | Market Value ($ Thousands) | ||||
Chase Issuance Trust, | ||||||
1.089%, 07/16/12 (C) | $ | 450 | $ | 451 | ||
Chase Issuance Trust, | ||||||
0.989%, 06/15/12 (C) | 350 | 351 | ||||
Citibank Credit Card Issuance Trust, | ||||||
4.750%, 10/22/12 | 100 | 103 | ||||
Citibank Credit Card Issuance Trust, | ||||||
0.587%, 08/20/14 (C) | 320 | 315 | ||||
Citibank Credit Card Issuance Trust, Ser 2009-A1, Cl A1 | ||||||
1.989%, 03/17/14 (C) | 135 | 137 | ||||
Citibank Credit Card Issuance Trust, Ser 2009-A7, Cl A7 | ||||||
0.352%, 11/25/13 (C) | 420 | 415 | ||||
MBNA Credit Card Master Note Trust, Ser 2003-A4, Cl A4 | ||||||
0.459%, 09/17/12 (C) | 960 | 958 | ||||
MBNA Credit Card Master Note Trust, Ser 2003-A8 | ||||||
0.429%, 12/17/12 (C) | 700 | 698 | ||||
| 5,070 | ||||||
Mortgage Related Securities — 0.4% | ||||||
ACE Securities, | ||||||
1.406%, 07/25/33 (C) | 600 | 388 | ||||
Ameriquest Mortgage Securities, | ||||||
5.098%, 11/25/35 | 172 | 170 | ||||
Citicorp Residential Mortgage Securities, Ser 2006-2, Cl A4 | ||||||
5.775%, 09/25/36 | 400 | 377 | ||||
CNH Equipment Trust, | ||||||
4.060%, 10/17/11 | 115 | 116 | ||||
CNH Equipment Trust, | ||||||
2.400%, 05/16/11 | 94 | 94 | ||||
GSAMP Trust, | ||||||
0.706%, 06/25/35 (C) | 97 | 93 | ||||
Merrill Lynch First Franklin Mortgage Loan Trust, Ser 2007-5, Cl 2A1 | ||||||
0.936%, 10/25/37 (C) | 381 | 366 | ||||
Merrill Lynch Mortgage Investors, | ||||||
1.886%, 07/25/34 (C) | 37 | 8 | ||||
Morgan Stanley ABS Capital I, | ||||||
1.256%, 10/25/33 (C) | 501 | 333 | ||||
Residential Asset Mortgage Products, Ser 2003-RS11, Cl MII1 | ||||||
1.331%, 12/25/33 (C) | 54 | 31 | ||||
Resmae Mortgage Loan Trust, | ||||||
0.386%, 02/25/36 (C) | 896 | 355 | ||||
| 13 | SEI Institutional Investment Trust / Semi-Annual Report / November 30, 2009 |
Table of Contents
SCHEDULE OF INVESTMENTS (Unaudited)
International Equity Fund
November 30, 2009
Description | Shares | Market Value ($ Thousands) | ||||
Terwin Mortgage Trust, | ||||||
4.500%, 06/25/36 | $ | 207 | $ | 20 | ||
| 2,351 | ||||||
Total Asset-Backed Securities | 10,685 | |||||
PREFERRED STOCK — 0.8% | ||||||
Brazil — 0.4% | ||||||
Banco Bradesco | 63,000 | 1,316 | ||||
Petroleo Brasileiro | 72,200 | 1,604 | ||||
| 2,920 | ||||||
Germany — 0.4% | ||||||
Bayerische Motoren Werke | 5,349 | 176 | ||||
Draegerwerk | 1,189 | 50 | ||||
Henkel | 25,551 | 1,287 | ||||
Jungheinrich | 1,164 | 22 | ||||
KSB | 173 | 100 | ||||
Porsche Automobil Holding | 2,510 | 175 | ||||
ProSiebenSat.1 Media | 20,156 | 262 | ||||
RWE | 4,072 | 343 | ||||
STO | 300 | 27 | ||||
Volkswagen | 4,538 | 385 | ||||
| 2,827 | ||||||
Total Preferred Stock | 5,747 | |||||
| Number Of Rights | ||||||
RIGHTS — 0.1% | ||||||
Australia — 0.0% | ||||||
Programmed Maintenance, Expires 12/08/09 | 1,733 | — | ||||
CSR, Expires 12/07/09 | 2,207 | — | ||||
| — | ||||||
Belgium — 0.0% | ||||||
Fortis, Expires 07/01/14 (A) | 135,417 | — | ||||
Germany — 0.0% | ||||||
Kali und Salz, Expires 12/14/09 | 10,223 | 34 | ||||
Italy — 0.0% | ||||||
Piccolo Credito Valtellinese, Expires 01/02/10 | 3,239 | 1 | ||||
Netherlands — 0.1% | ||||||
ING Group, Expires 12/17/09 | 107,338 | 266 | ||||
Norway — 0.0% | ||||||
DnB, Expires 12/14/09 | 44,688 | 126 | ||||
Description | Shares | Market Value ($ Thousands) | |||
Spain — 0.0% | |||||
Obrascon Huarte Lain, Expires 12/15/09 | 3,542 | $ | 7 | ||
United Kingdom — 0.0% | |||||
Lloyds Banking Group, Expires 12/15/09 | 21,496 | 6 | |||
National Express Group, Expires 12/16/09 | 19,936 | 21 | |||
| 27 | |||||
Total Rights | 461 | ||||
| Number Of Warrants | |||||
WARRANTS — 0.0% | |||||
Singapore — 0.0% | |||||
Golden Agri-Resources, Expires 05/29/12 * | 73,972 | 15 | |||
Italy — 0.0% | |||||
Mediobanca, Expires 2011 | 40,475 | — | |||
Unione di Banche Italiane SCPA, Expires 2011 * | 14,619 | 1 | |||
| 1 | |||||
Total Warrants | 16 | ||||
CORPORATE OBLIGATION — 0.0% | |||||
Financials — 0.0% | |||||
Shinsei Finance Cayman | 490 | 284 | |||
Total Corporate Obligation | 284 | ||||
U.S. TREASURY OBLIGATIONS — 0.4% | |||||
U.S. Treasury Bills (D) (E) | |||||
0.130%, 12/03/09 | 685 | 685 | |||
0.107%, 12/17/09 | 600 | 600 | |||
0.065%, 01/07/10 | 1,500 | 1,500 | |||
0.000%, 01/14/10 | 35 | 35 | |||
| 2,820 | |||||
Total U.S. Treasury Obligations | 2,820 | ||||
| 14 | SEI Institutional Investment Trust / Semi-Annual Report / November 30, 2009 |
Table of Contents
SCHEDULE OF INVESTMENTS (Unaudited)
International Equity Fund
November 30, 2009
Description | Shares | Market Value ($ Thousands) | ||||
CASH EQUIVALENT — 2.5% | ||||||
SEI Daily Income Trust, Prime Obligation Fund, Cl A | ||||||
0.130%**† | $ | 18,774,658 | $ | 18,775 | ||
Total Cash Equivalent | 18,775 | |||||
Total Investments — 101.3% | $ | 759,606 | ||||
A summary of the open futures contracts held by the Fund at November 30, 2009, is as follows:
Type of Contract | Number of Contracts Long (Short) | Expiration Date | Unrealized Appreciation (Depreciation) ($ Thousands) | |||||
DJ Euro Stoxx 50 Index | 244 | Dec-2009 | $ | 159 | ||||
E-Mini MSCI EAFE | 4 | Dec-2009 | 2 | |||||
FTSE 100 Index | 73 | Dec-2009 | 216 | |||||
Hang Seng Index | 2 | Dec-2009 | 1 | |||||
Nikkei 225 Index | 13 | Dec-2009 | (47 | ) | ||||
SPI 200 Index | 11 | Dec-2009 | 28 | |||||
Topix Index | 24 | Dec-2009 | (90 | ) | ||||
| $ | 269 | |||||||
A summary of the outstanding forward foreign currency contracts held by the Fund at November 30, 2009, is as follows:
Maturity Date | Currency to Deliver (Thousands) | Currency to Receive (Thousands) | Unrealized (Depreciation) ($ Thousands) | |||||||||
1/25/10 | AUD | 2,.864 | USD | 2,567 | $ | (40 | ) | |||||
1/25/10 | USD | 2,631 | AUD | 2,864 | (25 | ) | ||||||
| (65 | ) | |||||||||||
A summary of outstanding swap agreements held by the Fund at August 31, 2009, is as follows:
Total Return Swaps | ||||||||||||||
Counterparty | Reference Entity/Obligation | Fund Pays | FundReceives | Termination Date | Notional Amount (Thousands) | Net Unrealized Appreciation ($ Thousands) | ||||||||
| JPMorgan Chase Bank | MSCI Daily TR Net EAFE USD Market Index | 3-Month LIBOR Minus 25 Bps | Price Return | 10/15/10 | 32,906 | $ | (197 | ) | ||||||
| 15 | SEI Institutional Investment Trust / Semi-Annual Report / November 30, 2009 |
Table of Contents
SCHEDULE OF INVESTMENTS (Unaudited)
International Equity Fund
November 30, 2009
Percentages are based on a Net Assets of $758,343($ Thousands)
| * | Non-income producing security. |
| ** | The rate reported is the 7-day effective yield as of August 31, 2009. |
| † | Investment in Affiliated Security (see Note 5). |
| ‡ | Real Estate Investment Trust |
| (A) | This security or a partial position of this security is on loan at November 30, 2009. (See Note 11) The total value of securities on loan at November 30, 2009 was $31,767 ($ Thousands). |
| (B) | Securities sold within terms of a private placement memorandum, exempt from registration under Section 144A of the Securities Act of 1933, as amended, and may be sold only to dealers in that program or other "accredited investors." These securities have been determined to be liquid under guidelines established by the Board of Trustees. |
| (C) | Variable Rate Security — The rate reported on the Schedule of Investments is the rate in effect as of November 30, 2009. The date reported is the final maturity date. |
| (D) | Security, or portion thereof, has been pledged as collateral on open futures contracts. |
| (E) | The rate reported on the Schedule of Investments is the effective yield at time of purchase. |
| (F) | Security considered restricted. The total value of such security as of November 30, 2009 was $0 ($ Thousands) and represents 0.0% of net assets. |
| (G) | Security considered illiquid. The total value of such securities as of August 31, 2009 was $0 ($ Thousands) and represents 0.0% of Net Assets. |
| (H) | Security fair valued using methods determined in good faith by the Valuation Committee of the Board of Trustees. The total value of such security as of November 30, 2009 was $0 and represents 0.0% of net assets. |
| (I) | This security was purchased with cash collateral held from securities on loan. (See Note 11) The total value of such securities as of November 30, 2009 was $33,521 ($ Thousands). |
ABS — Asset-Backed Security
ADR — American Depositary Receipt
AUD — Australian Dollar
CAD — Canadian Dollar
Cl — Class
CMO — Collateralized Mortgage Obligation
DJ — Dow Jones
FHLMC — Federal Home Loan Mortgage Corporation
FNMA — Federal National Mortgage Association
FTSE — Financial Times and the London Stock Exchange
GBP — British Pound Sterling
GDR — Global Depositary Receipt
LIBOR — London Interbank Offered Rate
LLC — Limited Liability Company
L.P. — Limited Partnership
MSCI EAFE — Morgan Stanley Capital International Europe, Australia, and the Far East
Ser — Series
SPI — Share Price Index
STRIPS — Separately Traded Registered Interest and Principal Securities
TBA — To Be Announced
USD — U.S. Dollar
Amounts designated as “—” are $O or have been rounded to $O.
| 16 | SEI Institutional Investment Trust / Semi-Annual Report / November 30, 2009 |
Table of Contents
SCHEDULE OF INVESTMENTS (Unaudited)
World Equity Ex-US Fund
November 30, 2009
Description | Shares | Market Value ($ Thousands) | |||
COMMON STOCK — 91.6% | |||||
Argentina — 0.2% | |||||
Banco Macro ADR | 2,419 | $ | 66 | ||
Telecom Argentina ADR * | 2,952 | 48 | |||
Tenaris | 8,852 | 175 | |||
Tenaris ADR (A) | 103,238 | 4,073 | |||
Ternium ADR | 28,700 | 903 | |||
| 5,265 | |||||
Australia — 4.2% | |||||
Aditya Birla Minerals | 166,691 | 211 | |||
AGL Energy | 20,414 | 259 | |||
Amcor | 111,217 | 602 | |||
AMP | 164,759 | 932 | |||
Aristocrat Leisure | 40,519 | 150 | |||
Arrow Energy * | 180,782 | 645 | |||
Asciano Group | 367,050 | 556 | |||
ASX | 29,882 | 904 | |||
Australia & New Zealand Banking Group | 409,889 | 8,310 | |||
Australian Infrastructure Fund | 60,205 | 95 | |||
AWB (A) | 120,275 | 131 | |||
Beach Petroleum | 1,033,673 | 795 | |||
Bendigo Bank | 29,122 | 237 | |||
BGP Holdings * | 239,898 | — | |||
BHP Billiton | 662,008 | 25,026 | |||
Billabong International | 48,009 | 461 | |||
Biota Holdings | 12,337 | 35 | |||
BlueScope Steel | 1,170,754 | 2,904 | |||
Boral (A) | 85,308 | 437 | |||
Brambles | 90,374 | 546 | |||
Caltex Australia | 33,914 | 302 | |||
CFS Retail Property Trust ‡ | 282,496 | 509 | |||
Coca-Cola Amatil | 397,021 | 3,852 | |||
Cochlear | 12,036 | 697 | |||
Commonwealth Bank of Australia | 182,909 | 8,840 | |||
Computershare | 315,355 | 3,086 | |||
Crown | 75,380 | 540 | |||
CSL | 1,747 | 50 | |||
CSR | 95,386 | 150 | |||
David Jones (A) | 62,300 | 329 | |||
Dexus Property Group ‡ | 122,737 | 91 | |||
Downer EDI | 40,300 | 315 | |||
Energy Resources of Australia | 14,461 | 317 | |||
Fairfax Media (A) | 674,885 | 1,010 | |||
Fortescue Metals Group * | 104,354 | 402 | |||
Foster’s Group | 771,144 | 3,967 | |||
Goodman Fielder | 684,055 | 958 | |||
Goodman Group ‡ | 265,073 | 146 | |||
GPT Group ‡ | 239,898 | 131 | |||
GrainCorp | 26,390 | 147 | |||
Harvey Norman Holdings | 578,506 | 2,277 | |||
Incitec Pivot | 233,455 | 609 | |||
ING Industrial Fund ‡ (A) | 329,700 | 128 | |||
Insurance Australia Group | 4,500 | 16 | |||
JB Hi-Fi | 67,189 | 1,427 | |||
Kingsgate Consolidated | 5,200 | 46 | |||
Leighton Holdings (A) | 70,999 | 2,320 | |||
Lend Lease | 259,641 | 2,158 | |||
Macquarie Group (A) | 23,672 | 1,040 | |||
Macquarie Infrastructure Group | 1,117,336 | 1,330 | |||
Description | Shares | Market Value ($ Thousands) | |||
Metcash | 302,361 | $ | 1,295 | ||
Monadelphous Group | 6,647 | 79 | |||
National Australia Bank | 271,499 | 7,113 | |||
New Hope | 252,430 | 994 | |||
Newcrest Mining | 35,993 | 1,212 | |||
OneSteel | 25,451 | 70 | |||
Orica | 104,132 | 2,381 | |||
Origin Energy | 115,469 | 1,650 | |||
OZ Minerals | 850,421 | 950 | |||
Pacific Brands | 269,642 | 322 | |||
Paladin Energy * | 64,759 | 244 | |||
Perpetual | 2,332 | 70 | |||
Primary Health Care | 16,200 | 87 | |||
Qantas Airways | 518,745 | 1,235 | |||
QBE Insurance Group | 21,044 | 428 | |||
Rio Tinto | 127,174 | 8,342 | |||
Santos | 454,095 | 6,118 | |||
Sigma Pharmaceuticals | 130,252 | 114 | |||
Sims Group (A) | 17,980 | 349 | |||
Sonic Healthcare | 45,304 | 588 | |||
Stockland ‡ | 39,003 | 144 | |||
Straits Resources | 127,254 | 192 | |||
Suncorp-Metway | 200,040 | 1,608 | |||
Super Cheap Auto Group | 13,600 | 67 | |||
TABCORP Holdings (A) | 134,291 | 883 | |||
Tatts Group | 517,778 | 1,142 | |||
Telstra | 452,198 | 1,411 | |||
Toll Holdings | 87,126 | 648 | |||
Transurban Group | 20,912 | 104 | |||
Wesfarmers | 319,360 | 8,711 | |||
Westfield Group ‡ | 322,012 | 3,599 | |||
Westpac Banking | 244,171 | 5,395 | |||
Woodside Petroleum | 16,019 | 715 | |||
Woolworths | 138,961 | 3,568 | |||
WorleyParsons | 36,843 | 895 | |||
| 143,149 | |||||
Austria — 0.2% | |||||
Erste Group Bank (A) | 52,987 | 2,154 | |||
OMV | 94,934 | 4,017 | |||
Raiffeisen International Bank Holding | 4,277 | 254 | |||
Strabag | 6,674 | 209 | |||
Vienna Insurance Group | 11,246 | 593 | |||
Voestalpine | 16,597 | 589 | |||
| 7,816 | |||||
Belgium — 1.1% | |||||
Banque Nationale de Belgique | 2 | 10 | |||
Barco | 1,730 | 73 | |||
Delhaize Group | 109,836 | 8,313 | |||
Dexia (A) | 372,807 | 2,813 | |||
D’ieteren | 556 | 238 | |||
Fortis | 162,498 | 684 | |||
Groupe Bruxelles Lambert | 13,857 | 1,262 | |||
InBev | 185,171 | 9,241 | |||
KBC Groep | 61,064 | 2,718 | |||
Nationale A Portefeuille | 8,499 | 448 | |||
Nyrstar | 99,479 | 1,256 | |||
Solvay | 23,130 | 2,441 | |||
Telenet Group Holding | 36,489 | 994 | |||
UCB | 122,186 | 5,439 | |||
| 1 | SEI Institutional Investments Trust / Semi-Annual Report / November 30, 2009 |
Table of Contents
SCHEDULE OF INVESTMENTS (Unaudited)
World Equity Ex-US Fund
November 30, 2009
Description | Shares | Market Value ($ Thousands) | |||
Umicore | 30,811 | $ | 1,048 | ||
| 36,978 | |||||
Brazil — 2.0% | |||||
Abyara Planejamento Imobiliario * | 37,900 | 99 | |||
All America Latina Logistica | 150,900 | 1,338 | |||
Amil Participacoes | 135,100 | 986 | |||
Banco do Brasil | 363,000 | 6,421 | |||
Banestes Banco do Estado do Espirito Santo | 22,600 | 91 | |||
BRF - Brasil Foods * | 127,000 | 2,982 | |||
CETIP - Balcao Organizado de Ativos e Derivativos * | 165,200 | 1,193 | |||
Cia de Saneamento Basico do Estado de Sao Paulo | 102,000 | 1,845 | |||
Cia de Saneamento Basico do Estado de Sao Paulo ADR | 46,900 | 1,716 | |||
Cia de Saneamento de Minas Gerais-COPASA (Brazil) | 56,500 | 974 | |||
Cia Energetica de Minas Gerais ADR (A) | 222,400 | 3,999 | |||
Cia Vale do Rio Doce | 193,100 | 5,419 | |||
Cia Vale do Rio Doce ADR, Cl B (A) | 178,790 | 5,126 | |||
Cyrela Brazil Realty | 127,100 | 1,797 | |||
Dufry South America | 70,200 | 1,423 | |||
EDP - Energias do Brasil | 71,600 | 1,270 | |||
Empresa Brasileira de Aeronautica * | 352,100 | 1,762 | |||
Eternit | 28,100 | 128 | |||
Ez Tec Empreendimentos e Participacoes | 59,400 | 275 | |||
Gerdau | 37,100 | 436 | |||
Grendene | 119,400 | 615 | |||
Hypermarcas * | 73,200 | 1,563 | |||
Iguatemi Empresa de Shopping Centers * | 44,000 | 727 | |||
Itau Unibanco Holding ADR | 132,251 | 2,943 | |||
Klabin Segall * | 27,300 | 78 | |||
Lojas Renner | 110,800 | 2,426 | |||
OGX Petroleo e Gas Participacoes | 4,933 | 4,194 | |||
Petroleo Brasileiro | 270,800 | 6,838 | |||
Petroleo Brasileiro ADR | 58,014 | 2,975 | |||
Redecard | 94,300 | 1,447 | |||
Rodobens Negocios Imobiliarios | 99,400 | 973 | |||
Santos Brasil Participacoes | 69,172 | 592 | |||
SLC Agricola | 78,421 | 598 | |||
Telegraph Norte Leste Participacoes | 47,100 | 1,186 | |||
Usinas Siderurgicas de Minas Gerais | 103,900 | 2,938 | |||
Wilson Sons, Cl BDR | 82,280 | 984 | |||
| 70,357 | |||||
Canada — 4.7% | |||||
Agrium (A) | 116,740 | 6,519 | |||
Alamos Gold * | 9,800 | 110 | |||
Description | Shares | Market Value ($ Thousands) | |||
Alimentation Couche Tard, Cl B | 118,900 | $ | 2,465 | ||
AltaGas Income Trust | 7,400 | 128 | |||
Astral Media, Cl A | 2,800 | 84 | |||
Atco | 13,900 | 589 | |||
Bank of Montreal (A) | 120,000 | 6,118 | |||
Bank of Nova Scotia | 103,180 | 4,747 | |||
Barrick Gold | 246,400 | 10,503 | |||
BCE (A) | 121,180 | 3,209 | |||
Biovail | 33,500 | 481 | |||
Bombardier, Cl B | 450,000 | 1,912 | |||
Brookfield Asset Management, Cl A | 71,300 | 1,498 | |||
Cameco | 10,200 | 293 | |||
Canadian Imperial Bank of Commerce | 16,770 | 1,093 | |||
Canadian National Railway | 72,510 | 3,804 | |||
Canadian Natural Resources | 63,010 | 4,212 | |||
Canadian Tire, Cl A (A) | 28,940 | 1,516 | |||
Canadian Utilities | 18,300 | 714 | |||
Capstone Mining * | 36,400 | 97 | |||
Celestica * | 45,700 | 372 | |||
CGI Group, Cl A * | 405,470 | 5,019 | |||
Compton Petroleum * | 28,962 | 26 | |||
Corus Entertainment, Cl B | 5,700 | 97 | |||
Domtar * | 1,800 | 102 | |||
Dorel Industries, Cl B | 20,100 | 622 | |||
Dundee, Cl A * | 6,800 | 78 | |||
Enbridge | 60,110 | 2,566 | |||
EnCana | 245,000 | 13,164 | |||
Endeavour Silver * | 24,900 | 93 | |||
Fairfax Financial Holdings | 900 | 321 | |||
First Quantum Minerals | 28,900 | 2,257 | |||
George Weston | 11,970 | 701 | |||
Gildan Activewear * | 57,800 | 1,116 | |||
Goldcorp | 158,760 | 6,664 | |||
Grande Cache Coal * | 132,000 | 518 | |||
Groupe Aeroplan | 94,700 | 848 | |||
Husky Energy | 45,200 | 1,188 | |||
IAMGOLD | 170,446 | 3,216 | |||
Industrial Alliance Insurance & Financial Services | 2,800 | 79 | |||
Inmet Mining | 15,900 | 955 | |||
Kinross Gold | 3,500 | 70 | |||
Laurentian Bank of Canada | 9,430 | 382 | |||
Linamar | 4,580 | 61 | |||
Loblaw | 5,500 | 173 | |||
Lundin Mining * | 132,500 | 578 | |||
Magna International, Cl A | 10,890 | 520 | |||
Manulife Financial | 21,700 | 380 | |||
Maple Leaf Foods | 26,700 | 289 | |||
Metro, Cl A | 113,600 | 3,914 | |||
Mullen Group | 7,840 | 115 | |||
National Bank of Canada | 79,390 | 4,758 | |||
Nexen | 108,543 | 2,556 | |||
Northgate Minerals * | 241,700 | 770 | |||
Open Text * | 88,900 | 3,384 | |||
Pacific Rubiales Energy * (A) | 106,200 | 1,548 | |||
Penn West Energy Trust (A) | 67,600 | 1,186 | |||
Potash Saskatchewan | 11,830 | 1,323 | |||
Power Financial | 11,030 | 288 | |||
Quebecor, Cl B | 15,620 | 387 | |||
Research In Motion * | 22,900 | 1,324 | |||
| 2 | SEI Institutional Investments Trust / Semi-Annual Report / November 30, 2009 |
Table of Contents
SCHEDULE OF INVESTMENTS (Unaudited)
World Equity Ex-US Fund
November 30, 2009
Description | Shares | Market Value ($ Thousands) | |||
Royal Bank of Canada (A) | 248,801 | $ | 13,407 | ||
Sherritt International | 214,900 | 1,368 | |||
Sierra Wireless * | 8,700 | 79 | |||
Sino-Forest, Cl A * | 280,300 | 4,911 | |||
Sun Life Financial | 58,000 | 1,604 | |||
Suncor Energy | 73,024 | 2,625 | |||
Talisman Energy | 161,900 | 2,795 | |||
Teck Cominco, Cl B * | 187,810 | 6,501 | |||
TELUS, Cl A | 7,300 | 222 | |||
Toronto-Dominion Bank | 119,000 | 7,502 | |||
TransCanada | 1,300 | 42 | |||
Transcontinental, Cl A | 18,400 | 215 | |||
West Fraser Timber | 8,000 | 239 | |||
Western Coal * | 232,800 | 561 | |||
Yamana Gold | 167,100 | 2,217 | |||
Yellow Pages Income Fund (A) | 220,840 | 1,094 | |||
| 159,482 | |||||
Chile — 0.3% | |||||
Banco de Chile ADR | 26,216 | 1,360 | |||
Banco Santander Chile ADR | 17,174 | 1,044 | |||
Cia Cervecerias Unidas | 137,120 | 1,002 | |||
Cia Cervecerias Unidas ADR | 30,300 | 1,093 | |||
CorpBanca ADR | 18,200 | 667 | |||
Embotelladora Andina ADR, Cl B | 600 | 11 | |||
Enersis ADR | 103,400 | 1,984 | |||
ENTEL Chile | 74,695 | 1,029 | |||
Sociedad Quimica y Minera de Chile ADR | 31,000 | 1,171 | |||
| 9,361 | |||||
China — 2.5% | |||||
AAC Acoustic Technologies Holdings | 72,000 | 100 | |||
AirMedia Group ADR * | 117,839 | 820 | |||
Ajisen China Holdings | 1,298,909 | 1,156 | |||
Anhui Conch Cement, Cl H (A) | 344,639 | 2,041 | |||
Bank of China | 28,105,000 | 15,847 | |||
Bank of Communications, Cl H | 1,833,000 | 2,185 | |||
Baoye Group, Cl H | 131,000 | 101 | |||
China BlueChemical | 925,000 | 492 | |||
China Citic Bank | 2,395,000 | 1,978 | |||
China Coal Energy | 1,111,000 | 1,884 | |||
China Communications Services, Cl H | 943,000 | 482 | |||
China Construction Bank, Cl H | 9,821,000 | 8,744 | |||
China Dongxiang Group | 2,521,000 | 1,841 | |||
China Life Insurance, Cl H | 703,100 | 3,520 | |||
China Petroleum & Chemical, Cl H | 2,110,000 | 1,756 | |||
China Railway Construction, Cl H | 668,000 | 881 | |||
China Railway Group * | 2,347,000 | 1,853 | |||
China Shineway Pharmaceutical Group | 17,000 | 29 | |||
China Shipping Development, Cl H (A) | 1,534,000 | 2,253 | |||
China Telecom, Cl H | 4,469,000 | 1,978 | |||
Chongqing Changan Automobile, Cl B | 1,187,300 | 1,168 | |||
Ctrip.com International ADR * | 35,000 | 2,567 | |||
Dongfeng Motor Group, Cl H | 1,130,000 | 1,735 | |||
Epure International | 2,883,000 | 1,228 | |||
Description | Shares | Market Value ($ Thousands) | |||
First Tractor, Cl H | 68,000 | $ | 35 | ||
Fosun International | 1,605,000 | 1,162 | |||
Great Wall Technology, Cl H | 462,000 | 174 | |||
Hangzhou Steam Turbine, Cl B | 81,000 | 179 | |||
Industrial & Commercial Bank of China | 16,176,000 | 13,671 | |||
Jiangling Motors, Cl B | 578,300 | 984 | |||
Mindray Medical International ADR | 43,936 | 1,330 | |||
New Oriental Education & Technology Group ADR * | 9,339 | 666 | |||
PetroChina, Cl H | 156,000 | 193 | |||
Perfect World ADR * (A) | 20,750 | 916 | |||
Ping An Insurance Group of China, Cl H | 332,000 | 3,097 | |||
Qingling Motors, Cl H | 564,000 | 160 | |||
Shandong Chenming Paper Holdings, Cl B | 1,180,100 | 894 | |||
Shanghai Friendship Group, Cl B | 241,620 | 346 | |||
Shanghai Mechanical and Electrical Industry, Cl B | 72,400 | 88 | |||
Shenzhou International Group Holdings | 478,000 | 564 | |||
Sichuan Expressway, Cl H | 268,000 | 136 | |||
Times | 25,000 | 17 | |||
Tingyi Cayman Islands Holding | 678,000 | 1,680 | |||
Weiqiao Textile, Cl H | 70,000 | 48 | |||
Yanzhou Coal Mining, Cl H | 458,000 | 912 | |||
Zhejiang Expressway, Cl H | 266,000 | 260 | |||
Zhuzhou CSR Times Electric, Cl H | 771,000 | 1,554 | |||
| 85,705 | |||||
Colombia — 0.0% | |||||
BanColombia ADR | 8,922 | 383 | |||
Cyprus — 0.0% | |||||
Bank of Cyprus Public | 130,480 | 930 | |||
Czech Republic — 0.1% | |||||
CEZ | 40,617 | 2,031 | |||
Komercni Banka | 1,077 | 235 | |||
Philip Morris CR | 640 | 291 | |||
| 2,557 | |||||
Denmark — 0.5% | |||||
A P Moeller - Maersk, Cl B | 47 | 334 | |||
Carlsberg, Cl B | 55,373 | 3,969 | |||
Danisco | 14,067 | 871 | |||
Danske Bank | 257,044 | 5,536 | |||
DSV | 12,881 | 229 | |||
FLSmidth | 5,190 | 338 | |||
H Lundbeck | 7,803 | 147 | |||
Novo-Nordisk, Cl B | 53,779 | 3,607 | |||
Sydbank | 12,784 | 305 | |||
Topdanmark * | 1,837 | 263 | |||
William Demant Holding * | 10,100 | 727 | |||
| 16,326 | |||||
| 3 | SEI Institutional Investments Trust / Semi-Annual Report / November 30, 2009 |
Table of Contents
SCHEDULE OF INVESTMENTS (Unaudited)
World Equity Ex-US Fund
November 30, 2009
Description | Shares | Market Value ($ Thousands) | |||
Egypt — 0.1% | |||||
Commercial International Bank | 73,508 | $ | 682 | ||
Egyptian Financial Group-Hermes Holding | 245,115 | 1,233 | |||
Egyptian International Pharmaceutical Industrial | 9,037 | 56 | |||
National Societe Generale Bank SAE | 21,811 | 113 | |||
Orascom Telecom Holding | 148,000 | 696 | |||
Talaat Moustafa Group * | 425,000 | 463 | |||
Telecom Egypt | 238,000 | 700 | |||
Torah Portland Cement | 4,200 | 24 | |||
| 3,967 | |||||
Finland — 0.7% | |||||
Citycon | 29,769 | 127 | |||
Elisa, Cl A | 3,541 | 76 | |||
Huhtamaki | 20,259 | 272 | |||
Kesko, Cl B | 15,167 | 516 | |||
Kone, Cl B | 162,608 | 6,579 | |||
Metso | 60,755 | 1,954 | |||
Nokia | 149,116 | 1,963 | |||
Nokian Renkaat | 20,531 | 519 | |||
Outokumpu | 19,589 | 338 | |||
Sampo, Cl A | 149,981 | 3,558 | |||
Sanoma | 25,509 | 535 | |||
Stora Enso, Cl R | 494,434 | 3,779 | |||
Tieto | 6,229 | 133 | |||
UPM-Kymmene | 134,339 | 1,708 | |||
Wartsila, Cl B (A) | 53,270 | 1,988 | |||
| 24,045 | |||||
France — 5.3% | |||||
Accor | 69,558 | 3,722 | |||
Aeroports de Paris | 1,505 | 120 | |||
Air France-KLM | 47,991 | 761 | |||
Air Liquide | 3,262 | 379 | |||
Alcatel-Lucent | 250,072 | 841 | |||
Alstom | 32,040 | 2,243 | |||
Arkema | 29,877 | 1,127 | |||
Atos Origin | 39,361 | 1,721 | |||
AXA | 122,420 | 2,917 | |||
BioMerieux | 1,939 | 225 | |||
BNP Paribas | 259,027 | 21,389 | |||
Bouygues | 69,918 | 3,478 | |||
Capital Gemini | 42,952 | 1,986 | |||
Carrefour | 7,123 | 346 | |||
Casino Guichard Perrachon | 3,431 | 294 | |||
Christian Dior (A) | 26,550 | 2,690 | |||
Cie de Saint-Gobain | 1,449 | 79 | |||
Cie Generale d’Optique Essilor International | 12,502 | 725 | |||
CNP Assurances | 36,546 | 3,912 | |||
Compagnie Generale des Etablissements Michelin, Cl B | 16,205 | 1,229 | |||
Credit Agricole | 241,462 | 4,995 | |||
Credit Industriel et Commercial | 65 | 11 | |||
Danone | 2,160 | 129 | |||
Dassault Systemes | 4,500 | 259 | |||
Eiffage | 10,283 | 558 | |||
Electricite de France (A) | 62,217 | 3,589 | |||
Eurazeo | 2,964 | 209 | |||
Eutelsat Communications | 39,537 | 1,294 | |||
Description | Shares | Market Value ($ Thousands) | |||
Fonciere Des Regions ‡ | 12,946 | $ | 1,333 | ||
France Telecom | 326,268 | 8,487 | |||
Gaz de France | 14,534 | 607 | |||
Gecina ‡ | 8,114 | 892 | |||
Groupe Steria SCA | 3,004 | 89 | |||
Havas | 276,941 | 1,035 | |||
Hermes International | 365 | 52 | |||
Iliad (A) | 2,795 | 336 | |||
Ipsen | 7,041 | 384 | |||
JC Decaux | 2,837 | 65 | |||
Klepierre ‡ | 16,163 | 647 | |||
Lafarge | 41,055 | 3,373 | |||
Lagardere S.C.A. | 5,359 | 228 | |||
Legrand | 44,557 | 1,224 | |||
L’Oreal | 2,366 | 257 | |||
LVMH Moet Hennessy Louis Vuitton (A) | 9,419 | 981 | |||
M6-Metropole Television | 56,867 | 1,465 | |||
Natixis | 292,244 | 1,558 | |||
Neopost | 1,990 | 174 | |||
Nexity | 12,361 | 426 | |||
PagesJaunes Groupe | 24,960 | 295 | |||
Peugeot | 89,583 | 3,168 | |||
PPR | 67,796 | 8,204 | |||
Publicis Groupe (A) | 96,505 | 3,715 | |||
Renault | 31,895 | 1,542 | |||
Rhodia | 48,080 | 835 | |||
Safran | 50,533 | 845 | |||
Sanofi-Aventis | 429,619 | 32,457 | |||
Schneider Electric | 18,348 | 2,008 | |||
SCOR | 75,262 | 1,834 | |||
SES Global | 103,298 | 2,197 | |||
Societe BIC | 3,047 | 213 | |||
Societe Des Autoroutes Paris-Rhin-Rhone | 3,972 | 331 | |||
Societe Generale | 74,586 | 5,251 | |||
Societe Television Francaise 1 | 80,665 | 1,436 | |||
Suez Environnement | 5,999 | 133 | |||
Technip | 104,146 | 7,105 | |||
Total (A) | 220,764 | 13,659 | |||
Unibail-Rodamco ‡ | 15,201 | 3,423 | |||
Valeo | 34,658 | 991 | |||
Vallourec | 557 | 93 | |||
Veolia Environnement | 10,044 | 340 | |||
Vinci | 56,889 | 3,145 | |||
Vivendi | 55,721 | 1,605 | |||
Zodiac Aerospace | 4,533 | 154 | |||
| 179,820 | |||||
Germany — 5.3% | |||||
Adidas | 2,329 | 133 | |||
ADVA Optical Networking * | 49,708 | 191 | |||
Aixtron | 76,821 | 2,764 | |||
Allianz | 89,402 | 10,982 | |||
BASF | 243,709 | 14,694 | |||
Bayer | 90,205 | 6,905 | |||
Bayerische Motoren Werke | 193,239 | 9,117 | |||
Bilfinger Berger | 4,808 | 355 | |||
Commerzbank | 15,950 | 149 | |||
DaimlerChrysler | 208,904 | 10,576 | |||
Deutsche Bank (A) | 185,250 | 13,365 | |||
Deutsche Boerse | 48,861 | 4,071 | |||
| 4 | SEI Institutional Investments Trust / Semi-Annual Report / November 30, 2009 |
Table of Contents
SCHEDULE OF INVESTMENTS (Unaudited)
World Equity Ex-US Fund
November 30, 2009
Description | Shares | Market Value ($ Thousands) | |||
Deutsche Lufthansa | 80,723 | $ | 1,288 | ||
Deutsche Post | 617,377 | �� | 11,558 | ||
Deutsche Postbank (A) | 18,345 | 645 | |||
Deutsche Telekom | 7,763 | 114 | |||
E.ON | 430,751 | 17,034 | |||
GAGFAH | 52,278 | 473 | |||
Hannover Rueckversicherung | 139,260 | 6,636 | |||
HeidelbergCement | 127,821 | 8,482 | |||
Henkel | 3,258 | 141 | |||
Hochtief | 78,170 | 6,138 | |||
Infineon Technologies* | 631,160 | 3,023 | |||
K+S | 41,355 | 2,491 | |||
Lanxess | 388 | 15 | |||
Linde | 14,159 | 1,741 | |||
MAN | 5,534 | 453 | |||
Merck KGaA | 1,078 | 102 | |||
Metro | 19,006 | 1,194 | |||
MTU Aero Engines Holding | 11,964 | 613 | |||
Muenchener Rueckversicherungs | 38,338 | 6,011 | |||
Puma Rudolf Dassler Sport | 1,172 | 403 | |||
RWE | 75,542 | 6,933 | |||
SAP | 65,983 | 3,152 | |||
Siemens | 222,746 | 21,824 | |||
Suedzucker (A) | 78,911 | 1,724 | |||
ThyssenKrupp | 26,620 | 970 | |||
TUI (A) | 113,187 | 896 | |||
United Internet | 70,833 | 956 | |||
Volkswagen (A) | 4,345 | 535 | |||
Wacker Chemie | 602 | 99 | |||
| 178,946 | |||||
Greece — 0.6% | |||||
Alpha Bank | 280,142 | 3,849 | |||
Coca Cola Hellenic Bottling | 63,998 | 1,416 | |||
EFG Eurobank Ergasias* | 31,697 | 420 | |||
Marfin Investment Group | 169,162 | 533 | |||
National Bank of Greece | 148,008 | 4,355 | |||
OPAP | 59,547 | 1,428 | |||
Piraeus Bank* | 46,999 | 685 | |||
Public Power | 426,761 | 8,611 | |||
Titan Cement | 18,579 | 542 | |||
| 21,839 | |||||
Guernsey — 0.1% | |||||
Resolution* | 2,477,144 | 3,435 | |||
Hong Kong — 3.5% | |||||
ASM Pacific Technology | 66,600 | 544 | |||
Bank of East Asia | 163,400 | 707 | |||
Beijing Enterprises Holdings | 198,000 | 1,345 | |||
Belle International Holdings | 1,736,000 | 2,157 | |||
BOC Hong Kong Holdings | 4,253,190 | 9,758 | |||
Cathay Pacific Airways | 166,000 | 284 | |||
Chaoda Modern Agriculture | 3,492,400 | 3,069 | |||
Cheung Kong Holdings | 109,000 | 1,370 | |||
Cheung Kong Infrastructure Holdings | 32,000 | 119 | |||
China Mobile | 1,052,000 | 9,855 | |||
China Overseas Land & Investment (A) | 2,386,000 | 5,129 | |||
Description | Shares | Market Value ($ Thousands) | |||
China Pharmaceutical Group | 654,000 | $ | 370 | ||
China Resources Power Holdings | 726,000 | 1,480 | |||
Chinese Estates Holdings | 310,000 | 522 | |||
CLP Holdings | 678,500 | 4,601 | |||
CNOOC | 2,708,500 | 4,173 | |||
COSCO Pacific | 1,190,000 | 1,658 | |||
Dairy Farm International Holdings | 7,700 | 46 | |||
Digital China Holdings | 371,000 | 437 | |||
Esprit Holdings | 626,690 | 4,213 | |||
First Pacific (A) | 468,000 | 271 | |||
Genting Singapore* (A) | 3,077,600 | 2,377 | |||
GOME Electrical Appliances Holdings | 5,935,300 | 2,244 | |||
Guangdong Investment | 1,420,000 | 790 | |||
Guoco Group | 36,000 | 418 | |||
Hang Lung Group | 159,000 | 779 | |||
Hang Lung Properties | 797,000 | 2,910 | |||
Hang Seng Bank | 97,800 | 1,431 | |||
Henderson Land Development | 168,000 | 1,186 | |||
Hengan International Group | 334,000 | 2,398 | |||
Hong Kong & China Gas | 234,000 | 555 | |||
Hong Kong Exchanges and Clearing | 243,200 | 4,337 | |||
Hongkong & Shanghai Hotels | 162,000 | 242 | |||
HongKong Electric Holdings | 121,000 | 657 | |||
Hongkong Land Holdings | 301,000 | 1,490 | |||
Hopewell Holdings | 259,500 | 819 | |||
Huabao International Holdings | 3,830,000 | 4,052 | |||
Hutchison Harbour Ring | 734,000 | 56 | |||
Hutchison Telecommunications Hong Kong Holdings | 1,170,000 | 195 | |||
Hutchison Telecommunications International* | 690,000 | 140 | |||
Hutchison Whampoa | 682,980 | 4,618 | |||
Hysan Development | 351,000 | 1,008 | |||
Industrial & Commercial Bank of China Asia | 405,000 | 936 | |||
Jardine Matheson Holdings | 42,400 | 1,252 | |||
Jardine Strategic Holdings | 43,500 | 757 | |||
Kerry Properties | 174,000 | 883 | |||
Lai Sun Development* | 5,616,000 | 94 | |||
Lenovo Group | 220,000 | 127 | |||
Li & Fung | 114,000 | 459 | |||
Link REIT‡ | 76,000 | 191 | |||
MTR | 206,500 | 702 | |||
New World Development | 1,106,000 | 2,275 | |||
Noble Group | 1,112,000 | 2,489 | |||
Orient Overseas International | 41,000 | 185 | |||
Pacific Andes Holdings (SGD)* | 28,000 | 5 | |||
Pacific Basin Shipping | 1,115,000 | 845 | |||
Pacific Century Premium Developments | 289,000 | 79 | |||
Polytec Asset Holdings | 390,000 | 85 | |||
RCG Holdings* | 148,979 | 210 | |||
Shanghai Industrial Holdings | 260,000 | 1,302 | |||
SIM Technology Group | 620,000 | 86 | |||
Sino Land | 178,000 | 338 | |||
Sinolink Worldwide Holdings | 524,000 | 99 | |||
Sun Hung Kai Properties | 872,000 | 12,928 | |||
Swire Pacific, Cl A | 153,500 | 1,762 | |||
Television Broadcasts | 63,000 | 288 | |||
| 5 | SEI Institutional Investments Trust / Semi-Annual Report / November 30, 2009 |
Table of Contents
SCHEDULE OF INVESTMENTS (Unaudited)
World Equity Ex-US Fund
November 30, 2009
Description | Shares | Market Value ($ Thousands) | |||
Texwinca Holdings | 2,000 | $ | 2 | ||
TPV Technology | 922,000 | 527 | |||
VTech Holdings | 72,000 | 699 | |||
Wharf Holdings | 681,000 | 3,673 | |||
Wheelock | 233,270 | 754 | |||
Wing Hang Bank | 16,500 | 171 | |||
Yue Yuen Industrial Holdings | 276,120 | 778 | |||
| 119,791 | |||||
Hungary — 0.1% | |||||
Egis Gyogyszergyar Nyrt | 2,402 | 248 | |||
Magyar Telekom Telecommunications | 55,000 | 220 | |||
MOL Hungarian Oil and Gas | 11,039 | 967 | |||
OTP Bank | 85,722 | 2,559 | |||
| 3,994 | |||||
India — 1.9% | |||||
Apollo Tyres | 8,123 | 8 | |||
Aurobindo Pharma | 10,000 | 184 | |||
Bank of India | 408,166 | 3,378 | |||
Bank of Maharashtra | 227,579 | 235 | |||
Bharat Electronics | 16,313 | 629 | |||
Bharat Petroleum | 43,520 | 552 | |||
Birla | 32,250 | 220 | |||
Cairn India* | 435,315 | 2,605 | |||
Container of India | 16,572 | 420 | |||
Dena Bank | 114,420 | 192 | |||
Dr Reddys Laboratories | 40,000 | 971 | |||
GAIL India | 515,061 | 4,636 | |||
Grasim Industries | 6,390 | 327 | |||
Great Eastern Shipping | 16,536 | 97 | |||
Gujarat Alkalies & Chemicals | 33,010 | 82 | |||
Gujarat Flourochemicals | 3,780 | 11 | |||
Gujarat Narmada Valley Fertilizers | 65,050 | 131 | |||
Gujarat State Fertilisers & Chemicals | 31,520 | 113 | |||
HCL Technologies | 40,022 | 290 | |||
HDFC Bank | 98,920 | 3,756 | |||
Hero Honda Motors | 68,689 | 2,548 | |||
Hindalco Industries | 160,000 | 475 | |||
Hindustan Zinc | 80,706 | 2,087 | |||
IDBI Bank | 60,307 | 158 | |||
Indian Bank | 189,020 | 670 | |||
Infosys Technologies | 63,400 | 3,243 | |||
Larsen & Toubro | 67,570 | 2,346 | |||
Mahindra & Mahindra | 25,000 | 553 | |||
Mangalore Refinery & Petrochemicals | 482,371 | 807 | |||
Maruti Udyog | 36,190 | 1,212 | |||
Mphasis | 16,079 | 234 | |||
Oil & Natural Gas | 85,460 | 2,204 | |||
Patni Computer Systems ADR | 7,700 | 148 | |||
Patni Computer Systems | 114,191 | 1,075 | |||
Piramal Healthcare | 131,475 | 1,122 | |||
Power Finance | 210,298 | 1,136 | |||
Reliance Industries | 35,564 | 813 | |||
Reliance Industries GDR (B) | 115,654 | 5,286 | |||
Sesa Goa* (C) | 54,684 | 433 | |||
Shipping Corp of India | 33,186 | 102 | |||
State Bank of India GDR | 4,006 | 388 | |||
Description | Shares | Market Value ($ Thousands) | |||
State Bank of India | 15,000 | $ | 722 | ||
Steel Authority of India | 245,870 | 1,042 | |||
Sterlite Industries India | 225,750 | 4,161 | |||
Syndicate Bank | 208,450 | 407 | |||
Tata Consultancy Services | 299,296 | 4,430 | |||
Tata Power | 38,980 | 1,135 | |||
Tata Steel | 85,765 | 1,068 | |||
UCO Bank | 184,518 | 222 | |||
Union Bank of India | 128,917 | 767 | |||
Welspun-Gujarat Stahl | 153,049 | 913 | |||
Zee Entertainment Enterprises | 455,165 | 2,488 | |||
| 63,232 | |||||
Indonesia — 0.4% | |||||
Adaro Energy* | 763,000 | 140 | |||
Astra International | 502,000 | 1,718 | |||
Bank Mandiri | 9,726,000 | 4,577 | |||
Bank Rakyat Indonesia | 1,576,500 | 1,234 | |||
Gudang Garam | 98,000 | 179 | |||
HM Sampoerna | 17,500 | 19 | |||
Indocement Tunggal Prakarsa | 1,204,420 | 1,414 | |||
Telekomunikasi Indonesia | 4,652,300 | 4,428 | |||
United Tractors | 278,000 | 440 | |||
| 14,149 | |||||
Ireland — 0.1% | |||||
CRH | 7,830 | 197 | |||
DCC | 1,166 | 32 | |||
Experian | 276,196 | 2,597 | |||
Irish Life & Permanent | 92,858 | 453 | |||
Kerry Group, Cl A | 17,621 | 522 | |||
| 3,801 | |||||
Israel — 0.7% | |||||
Bank Hapoalim* | 821,418 | 3,181 | |||
Bezeq Israeli Telecommunication | 1,707,684 | 3,869 | |||
Check Point Software Technologies* (A) | 90,646 | 2,864 | |||
Delek Group | 308 | 54 | |||
Discount Investment | 12,185 | 276 | |||
First International Bank of Israel* | 36,000 | 573 | |||
Formula Systems 1985 | 6,000 | 61 | |||
Gazit-Globe | 16,481 | 156 | |||
Israel Discount Bank, Cl A* | 490,680 | 1,048 | |||
Israel Land Development | 14,000 | 60 | |||
Koor Industries | 6,734 | 188 | |||
Makhteshim-Agan Industries | 98,187 | 476 | |||
Mizrahi Tefahot Bank* | 88,000 | 773 | |||
Teva Pharmaceutical Industries | 84,199 | 4,519 | |||
Teva Pharmaceutical Industries ADR (A) | 80,530 | 4,251 | |||
Union Bank of Israel* | 24,120 | 110 | |||
| 22,459 | |||||
Italy — 2.0% | |||||
ACEA (A) | 65,485 | 754 | |||
Amplifon | 54,260 | 243 | |||
Assicurazioni Generali | 9,186 | 237 | |||
Atlantia | 91,106 | 2,353 | |||
Autogrill | 34,420 | 426 | |||
Banca Intesa | 2,395,483 | 10,376 | |||
Banca Intesa RNC | 426,081 | 1,393 | |||
| 6 | SEI Institutional Investments Trust / Semi-Annual Report / November 30, 2009 |
Table of Contents
SCHEDULE OF INVESTMENTS (Unaudited)
World Equity Ex-US Fund
November 30, 2009
Description | Shares | Market Value ($ Thousands) | |||
Banca Monte dei Paschi di Siena | 48,517 | $ | 93 | ||
Banca Popolare di Milano | 213,227 | 1,655 | |||
Banco Popolare Scarl | 80,176 | 657 | |||
Benetton Group | 36,728 | 336 | |||
CIR-Compagnie Industriali Riunite | 73,639 | 179 | |||
Danieli | 16,400 | 420 | |||
DiaSorin | 3,723 | 135 | |||
Edison | 402,547 | 617 | |||
Enel (A) | 2,188,224 | 13,092 | |||
ENI | 350,033 | 8,671 | |||
Esprinet | 15,215 | 173 | |||
Exor | 3,931 | 75 | |||
Fiat (A) | 199,004 | 2,937 | |||
Finmeccanica | 109,984 | 1,821 | |||
Iride (A) | 142,196 | 271 | |||
Italmobiliare | 1,712 | 74 | |||
Luxottica Group | 17,820 | 443 | |||
Maire Tecnimont | 34,893 | 114 | |||
Mediaset (A) | 111,659 | 847 | |||
Mediobanca* | 133,682 | 1,596 | |||
Mediolanum (A) | 70,558 | 459 | |||
Milano Assicurazioni | 103,256 | 296 | |||
Parmalat | 494,210 | 1,438 | |||
Piccolo Credito Valtellinese | 6,212 | 53 | |||
Pirelli | 569,601 | 360 | |||
Saipem | 8,801 | 283 | |||
Saras (A) | 922,464 | 2,818 | |||
Snam Rete Gas | 211,856 | 1,063 | |||
Societa Iniziative Autostradali e Servizi | 3,261 | 30 | |||
Telecom Italia | 4,641,255 | 7,080 | |||
Terna Rete Elettrica Nazionale (A) | 253,768 | 1,054 | |||
UniCredito Italiano | 911,407 | 3,113 | |||
| 68,035 | |||||
Japan — 13.4% | |||||
77 Bank | 191,359 | 1,177 | |||
Advantest | 24,200 | 540 | |||
Aeon | 103,500 | 836 | |||
Aeon Fantasy | 5,800 | 66 | |||
Aichi Bank | 600 | 48 | |||
Aichi Steel | 15,000 | 66 | |||
Aida Engineering | 1,000 | 3 | |||
Aisin Seiki | 103,200 | 2,504 | |||
Ajinomoto | 111,000 | 1,045 | |||
Alfresa Holdings | 8,600 | 375 | |||
Alpen | 4,700 | 79 | |||
Alpine Electronics | 47,400 | 478 | |||
Alps Electric | 126,400 | 726 | |||
Amada | 91,000 | 528 | |||
AOKI Holdings | 4,000 | 41 | |||
Aoyama Trading | 18,600 | 245 | |||
Asahi Breweries | 61,900 | 1,104 | |||
Asahi Glass | 812,000 | 7,116 | |||
Asahi Kasei | 127,000 | 619 | |||
Astellas Pharma | 300,600 | 11,131 | |||
Bank of Kyoto | 13,000 | 119 | |||
Bank of Nagoya | 23,000 | 90 | |||
Bank of Saga | 5,000 | 16 | |||
Bank of Yokohama | 363,000 | 1,770 | |||
Belluna | 4,750 | 19 | |||
Description | Shares | Market Value ($ Thousands) | |||
Benesse | 6,600 | $ | 296 | ||
Best Denki | 10,000 | 36 | |||
BML | 3,200 | 104 | |||
Bridgestone | 96,900 | 1,547 | |||
Brother Industries | 32,300 | 355 | |||
Canon | 338,300 | 13,077 | |||
Canon Finetech | 1,100 | 13 | |||
Canon Marketing Japan | 78,900 | 1,161 | |||
Casio Computer | 10,300 | 75 | |||
Cawachi | 9,800 | 191 | |||
Central Japan Railway | 388 | 2,815 | |||
Chiba Bank | 257,000 | 1,698 | |||
Chiba Kogyo Bank* | 7,100 | 55 | |||
Chuetsu Pulp & Paper | 22,000 | 39 | |||
Chugai Pharmaceutical | 96,500 | 1,837 | |||
Circle K Sunkus | 12,200 | 161 | |||
Citizen Holdings | 33,000 | 183 | |||
Cleanup | 5,300 | 41 | |||
Coca-Cola Central Japan | 8,300 | 112 | |||
COMSYS Holdings | 16,100 | 157 | |||
Corona | 700 | 9 | |||
Cosmo Oil | 100,000 | 216 | |||
Create SD Holdings | 2,500 | 57 | |||
Crescendo Investment, Cl A‡ | 39 | 52 | |||
Dai Nippon Printing | 266,000 | 3,295 | |||
Daicel Chemical Industries | 416,000 | 2,482 | |||
Daihatsu Motor | 15,000 | 141 | |||
Daiichi Kigenso Kagaku-Kogyo | 2,600 | 86 | |||
Daiichi Sankyo | 281,000 | 5,522 | |||
Daiichikosho | 18,200 | 216 | |||
Daikin Industries | 2,800 | 100 | |||
Dainippon Screen Manufacturing (A) | 256,000 | 915 | |||
Dainippon Sumitomo Pharma | 104,800 | 1,078 | |||
Daishi Bank | 27,000 | 100 | |||
Daiwa House Industry | 130,000 | 1,311 | |||
Daiwa Securities Group | 560,000 | 3,023 | |||
DCM Japan Holdings | 23,700 | 148 | |||
Denki Kagaku Kogyo | 321,000 | 1,353 | |||
Denso | 185,300 | 5,195 | |||
Dentsu (A) | 78,800 | 1,700 | |||
Digital Garage | 41 | 71 | |||
Dowa Holdings | 42,000 | 225 | |||
eAccess | 90 | 64 | |||
East Japan Railway | 162,600 | 11,514 | |||
EDION | 8,700 | 71 | |||
Eisai | 2,500 | 92 | |||
Eizo Nanao | 1,300 | 31 | |||
Electric Power Development | 32,900 | 1,025 | |||
Elpida Memory* | 82,700 | 1,022 | |||
FamilyMart | 4,600 | 152 | |||
Fast Retailing | 13,400 | 2,439 | |||
Fuji Heavy Industries | 120,000 | 478 | |||
Fuji Media Holdings | 100 | 150 | |||
FUJIFILM Holdings | 304,600 | 8,327 | |||
Fujitec | 3,000 | 17 | |||
Fujitsu | 1,331,000 | 7,942 | |||
Fukuda Denshi | 1,900 | 51 | |||
Fukuoka Financial Group | 434,000 | 1,582 | |||
Funai Electric | 300 | 17 | |||
Furuno Electric | 4,100 | 17 | |||
GS Yuasa (A) | 85,000 | 600 | |||
| 7 | SEI Institutional Investments Trust / Semi-Annual Report / November 30, 2009 |
Table of Contents
SCHEDULE OF INVESTMENTS (Unaudited)
World Equity Ex-US Fund
November 30, 2009
Description | Shares | Market Value ($ Thousands) | |||
Hakuhodo DY Holdings | 4,050 | $ | 198 | ||
Hankyu Hanshin Holdings | 27,000 | 126 | |||
Heiwa | 2,800 | 29 | |||
Heiwado | 8,100 | 100 | |||
Higashi-Nippon Bank | 20,000 | 39 | |||
Higo Bank | 3,000 | 19 | |||
Hikari Tsushin | 7,800 | 135 | |||
HI-LEX | 4,300 | 38 | |||
Hino Motors | 1,011,000 | 3,028 | |||
Hitachi (A) | 520,000 | 1,413 | |||
Hitachi Cable | 146,000 | 363 | |||
Hitachi Chemical | 35,800 | 704 | |||
Hitachi Construction Machinery | 9,800 | 230 | |||
Hitachi Metals | 20,000 | 175 | |||
Hokuhoku Financial Group | 367,000 | 861 | |||
Honda Motor | 555,900 | 17,423 | |||
Hosiden | 28,500 | 305 | |||
House Foods | 13,500 | 215 | |||
Hoya | 47,800 | 1,224 | |||
Hyakugo Bank | 13,000 | 64 | |||
Ibiden | 45,700 | 1,549 | |||
Idemitsu Kosan | 8,100 | 498 | |||
IHI | 386,000 | 623 | |||
Inaba Denki Sangyo | 1,300 | 32 | |||
Inpex | 242 | 1,893 | |||
Isetan Mitsukoshi Holdings | 97,900 | 843 | |||
Isuzu Motors | 239,000 | 411 | |||
IT Holdings | 19,400 | 229 | |||
Ito En | 17,600 | 285 | |||
Itochu | 501,000 | 3,449 | |||
Itochu Enex | 35,800 | 162 | |||
Itochu Techno-Solutions | 6,300 | 174 | |||
Itochu-Shokuhin | 1,500 | 52 | |||
Izumiya | 3,000 | 13 | |||
J Front Retailing | 126,000 | 531 | |||
Japan Digital Laboratory | 1,800 | 20 | |||
Japan Pulp & Paper | 2,000 | 7 | |||
Japan Retail Fund Investment, Cl A‡ | 32 | 139 | |||
Japan Tobacco | 2,820 | 8,374 | |||
JFE Holdings | 241,000 | 7,945 | |||
JFE Shoji Holdings | 22,000 | 73 | |||
JGC | 9,000 | 169 | |||
JS Group | 35,200 | 577 | |||
JSR | 56,500 | 1,088 | |||
JTEKT | 15,500 | 152 | |||
Jupiter Telecommunications | 209 | 197 | |||
Kamigumi | 70,000 | 554 | |||
Kandenko | 70,000 | 477 | |||
Kaneka | 142,000 | 944 | |||
Kansai Electric Power | 79,600 | 1,987 | |||
Kansai Paint | 71,000 | 616 | |||
Kanto Natural Gas Development | 7,000 | 38 | |||
Kasumi | 9,200 | 47 | |||
Kato Sangyo | 7,200 | 143 | |||
Kawasaki Heavy Industries | 127,000 | 310 | |||
KDDI | 589 | 3,193 | |||
Keio | 144,000 | 914 | |||
Keisei Electric Railway | 90,000 | 510 | |||
Kikkoman | 12,000 | 140 | |||
Kinden | 59,000 | 532 | |||
Kinki Sharyo | 18,000 | 138 | |||
Description | Shares | Market Value ($ Thousands) | |||
Kirin Holdings | 259,000 | $ | 4,245 | ||
Kobe Steel | 114,000 | 195 | |||
Kohnan Shoji | 4,600 | 56 | |||
Komatsu | 14,200 | 280 | |||
Konica Minolta Holdings | 72,000 | 665 | |||
K's Holdings | 5,600 | 187 | |||
Kubota | 112,000 | 989 | |||
Kuraray | 119,500 | 1,441 | |||
Kurita Water Industries | 9,600 | 304 | |||
Kyocera | 42,300 | 3,378 | |||
Kyoei Steel (A) | 4,400 | 84 | |||
Kyorin | 47,000 | 736 | |||
Kyowa Hakko Kirin | 49,000 | 530 | |||
Kyudenko | 12,000 | 72 | |||
Lintec | 8,800 | 168 | |||
Mabuchi Motor | 7,600 | 374 | |||
Maeda | 21,000 | 55 | |||
Maeda Road Construction | 42,000 | 334 | |||
Makino Milling Machine | 13,000 | 46 | |||
Makita | 52,700 | 1,786 | |||
Marubeni | 1,272,000 | 6,733 | |||
Marubun | 11,700 | 72 | |||
Marudai Food | 11,000 | 37 | |||
Marui Group | 91,600 | 517 | |||
Maruichi Steel Tube | 11,400 | 217 | |||
Matsumotokiyoshi Holdings | 200 | 5 | |||
Maxvalu Nishinihon | 2,700 | 40 | |||
Mazda Motor | 220,000 | 470 | |||
Mediceo Paltac Holdings | 95,600 | 1,325 | |||
MEIJI Holdings | 7,200 | 287 | |||
Mie Bank | 13,000 | 35 | |||
Mikuni Coca-Cola Bottling | 4,600 | 38 | |||
Millea Holdings | 80,300 | 2,317 | |||
Minebea | 57,000 | 286 | |||
Ministop | 4,200 | 54 | |||
Miraca Holdings | 20,600 | 660 | |||
Mitsubishi | 793,200 | 17,955 | |||
Mitsubishi Chemical Holdings | 170,000 | 620 | |||
Mitsubishi Electric | 310,000 | 2,195 | |||
Mitsubishi Gas Chemical | 96,000 | 438 | |||
Mitsubishi Heavy Industries | 342,000 | 1,120 | |||
Mitsubishi Motors* (A) | 41,000 | 56 | |||
Mitsubishi Pencil | 100 | 1 | |||
Mitsubishi Rayon | 82,000 | 352 | |||
Mitsubishi Steel Manufacturing | 48,000 | 79 | |||
Mitsubishi UFJ Financial Group | 1,084,100 | 6,066 | |||
Mitsubishi UFJ Lease & Finance | 5,210 | 157 | |||
Mitsui | 502,500 | 6,673 | |||
Mitsui Chemicals (A) | 28,000 | 71 | |||
Mitsui Engineering & Shipbuilding (A) | 629,000 | 1,555 | |||
Mitsui Home | 12,000 | 61 | |||
Mitsui Mining & Smelting | 107,000 | 265 | |||
Mitsui Sugar | 3,000 | 10 | |||
Mitsui Sumitomo Insurance Group Holdings | 50,100 | 1,320 | |||
Mitsumi Electric | 26,900 | 420 | |||
Mitsuuroko | 400 | 3 | |||
Mizuho Securities | 351,000 | 1,149 | |||
Mochida Pharmaceutical | 9,000 | 87 | |||
Morinaga Milk Industry | 26,000 | 120 | |||
Murata Manufacturing | 82,300 | 3,927 | |||
| 8 | SEI Institutional Investments Trust / Semi-Annual Report / November 30, 2009 |
Table of Contents
SCHEDULE OF INVESTMENTS (Unaudited)
World Equity Ex-US Fund
November 30, 2009
Description | Shares | Market Value ($ Thousands) | |||
Musashi Seimitsu Industry | 11,600 | $ | 242 | ||
Nafco | 2,700 | 49 | |||
Nagase | 55,000 | 668 | |||
Nakanishi | 700 | 60 | |||
Namco Bandai Holdings | 36,400 | 364 | |||
NEC (A) | 554,000 | 1,402 | |||
NEC Fielding | 9,400 | 127 | |||
NEC Networks & System Integration | 29,300 | 363 | |||
NET One Systems | 58 | 70 | |||
NGK Insulators | 83,000 | 1,828 | |||
NGK Spark Plug | 14,000 | 151 | |||
NHK Spring | 111,000 | 995 | |||
Nidec | 41,600 | 3,665 | |||
Nihon Unisys | 13,700 | 107 | |||
Nihon Yamamura Glass | 29,000 | 98 | |||
Nikon | 6,000 | 109 | |||
Nintendo | 3,200 | 788 | |||
Nippo | 37,000 | 273 | |||
Nippon Beet Sugar Manufacturing | 13,000 | 33 | |||
Nippon Building Fund, Cl A‡ | 16 | 131 | |||
Nippon Densetsu Kogyo | 25,000 | 195 | |||
Nippon Electric Glass | 360,000 | 4,296 | |||
Nippon Flour Mills | 65,000 | 353 | |||
Nippon Konpo Unyu Soko | 3,000 | 32 | |||
Nippon Meat Packers | 29,000 | 360 | |||
Nippon Mining Holdings | 327,500 | 1,289 | |||
Nippon Oil | 729,000 | 3,114 | |||
Nippon Paper Group | 33,500 | 916 | |||
Nippon Seiki | 8,000 | 68 | |||
Nippon Soda | 124,000 | 423 | |||
Nippon Steel | 235,000 | 876 | |||
Nippon Steel Trading | 9,000 | 15 | |||
Nippon Synthetic Chemical Industry | 20,000 | 140 | |||
Nippon Telegraph & Telephone | 201,700 | 8,780 | |||
Nipponkoa Insurance | 84,000 | 501 | |||
Nipro | 8,600 | 184 | |||
Nissan Chemical Industries | 103,000 | 1,367 | |||
Nissan Motor | 2,024,300 | 14,710 | |||
Nissan Shatai | 17,000 | 144 | |||
Nisshin Seifun Group | 22,500 | 306 | |||
Nisshinbo Holdings | 20,000 | 164 | |||
Nissin Food Products | 36,500 | 1,343 | |||
Nissin Healthcare Food Service | 1,000 | 13 | |||
Nitori | 29,698 | 2,496 | |||
Nittetsu Mining | 11,000 | 48 | |||
Nitto Denko | 37,000 | 1,190 | |||
Nitto Kogyo | 300 | 3 | |||
Nojima | 4,500 | 42 | |||
NOK | 36,700 | 428 | |||
Nomura Holdings | 208,400 | 1,505 | |||
Nomura Research Institute | 17,200 | 364 | |||
Noritsu Koki | 8,200 | 57 | |||
NS Solutions | 4,200 | 73 | |||
NSD CO | 11,800 | 127 | |||
NSK | 13,000 | 81 | |||
NTN | 188,000 | 711 | |||
NTT Data | 245 | 697 | |||
NTT DoCoMo | 2,737 | 4,162 | |||
Obic | 1,630 | 272 | |||
Description | Shares | Market Value ($ Thousands) | |||
Odakyu Electric Railway, Cl B (A) | 38,000 | $ | 313 | ||
OJI Paper | 67,000 | 286 | |||
Okinawa Electric Power | 1,100 | 67 | |||
Okumura | 16,000 | 55 | |||
Okuwa | 6,000 | 58 | |||
Olympus | 9,800 | 299 | |||
Omron | 44,400 | 745 | |||
Onward Holdings (A) | 25,000 | 159 | |||
Oracle Japan | 4,100 | 187 | |||
ORIX | 16,270 | 1,129 | |||
Osaka Gas | 483,000 | 1,766 | |||
Osaka Steel | 12,300 | 212 | |||
Otsuka | 4,700 | 225 | |||
Panasonic | 246,800 | 3,183 | |||
Panasonic Electric Works | 68,000 | 781 | |||
Plenus | 4,800 | 65 | |||
Point | 2,240 | 125 | |||
Prospect Reit Investment‡ (A) | 40 | 32 | |||
Rakuten | 4,765 | 3,861 | |||
Resona Holdings | 36,100 | 387 | |||
Ricoh | 60,000 | 802 | |||
Ricoh Leasing | 300 | 6 | |||
Rinnai | 6,900 | 343 | |||
Rohm | 41,600 | 2,743 | |||
Roland | 2,100 | 20 | |||
Sakai Chemical Industry | 20,000 | 83 | |||
San-Ai Oil | 2,000 | 8 | |||
San-In Godo Bank | 20,000 | 180 | |||
Sanki Engineering | 33,000 | 241 | |||
Sankyo | 15,500 | 874 | |||
Sanoyas Hishino Meisho | 12,400 | 34 | |||
Santen Pharmaceutical | 35,200 | 1,195 | |||
Sanyo Chemical Industries | 13,000 | 71 | |||
Sanyo Electric* (A) | 291,000 | 523 | |||
Sapporo Hokuyo Holdings | 384,300 | 1,437 | |||
Sawai Pharmaceutical | 2,100 | 121 | |||
Sazaby League | 1,900 | 25 | |||
SBI Holdings (A) | 3,698 | 626 | |||
Secom | 24,500 | 1,149 | |||
Sega Sammy Holdings | 27,500 | 349 | |||
Seika | 23,000 | 52 | |||
Seiko Epson | 26,600 | 413 | |||
Seino Holdings | 108,000 | 790 | |||
Sekisui House | 13,000 | 115 | |||
Sekisui Jushi | 2,000 | 17 | |||
Senshu Ikeda Holdings* | 102,100 | 366 | |||
Seven & I Holdings | 92,100 | 2,067 | |||
Sharp | 175,000 | 2,007 | |||
Shimachu | 800 | 17 | |||
Shimamura | 5,100 | 479 | |||
Shimano | 12,400 | 520 | |||
Shin-Etsu Chemical | 7,200 | 392 | |||
Shinko Electric Industries | 100,500 | 1,420 | |||
Shinmaywa Industries | 23,000 | 71 | |||
Shinsei Bank (A) | 549,000 | 676 | |||
Shionogi | 257,100 | 5,557 | |||
Showa Denko | 111,000 | 197 | |||
Showa Shell Sekiyu | 41,500 | 352 | |||
Sinanen | 2,000 | 9 | |||
Sintokogio | 20,100 | 139 | |||
SMC | 800 | 90 | |||
Softbank | 16,200 | 389 | |||
| 9 | SEI Institutional Investments Trust / Semi-Annual Report / November 30, 2009 |
Table of Contents
SCHEDULE OF INVESTMENTS (Unaudited)
World Equity Ex-US Fund
November 30, 2009
Description | Shares | Market Value ($ Thousands) | |||
Sohgo Security Services | 8,400 | $ | 97 | ||
Sojitz | 404,400 | 709 | |||
So-net Entertainment | 25 | 55 | |||
Sony | 290,600 | 7,843 | |||
Sorun | 14,000 | 128 | |||
SRI Sports | 33 | 33 | |||
Stanley Electric | 88,800 | 1,765 | |||
Sumco | 48,400 | 830 | |||
Sumikin Bussan | 25,000 | 49 | |||
Sumisho Computer Systems | 6,700 | 98 | |||
Sumitomo | 302,100 | 2,981 | |||
Sumitomo Electric Industries | 352,100 | 4,177 | |||
Sumitomo Heavy Industries | 10,000 | 45 | |||
Sumitomo Metal Mining | 247,000 | 4,066 | |||
Sumitomo Mitsui Financial Group | 251,500 | 8,321 | |||
Sumitomo Realty & Development | 13,000 | 226 | |||
Sumitomo Rubber Industries | 33,300 | 262 | |||
Suzuken | 17,600 | 646 | |||
Suzuki Motor | 87,300 | 2,077 | |||
T&D Holdings | 27,950 | 649 | |||
Tadano | 5,000 | 22 | |||
Taiyo Nippon Sanso | 91,000 | 1,030 | |||
Taiyo Yuden | 67,000 | 690 | |||
Takeda Pharmaceutical | 90,500 | 3,782 | |||
Takeuchi Manufacturing | 200 | 2 | |||
Tanabe Seiyaku | 42,000 | 556 | |||
TDK | 48,000 | 2,513 | |||
Teijin | 225,000 | 705 | |||
Tenma | 1,800 | 20 | |||
Terumo | 11,400 | 647 | |||
THK | 5,600 | 92 | |||
TKC | 3,800 | 76 | |||
Tobu Railway (A) | 64,000 | 357 | |||
Toda | 27,000 | 81 | |||
Toei | 15,000 | 78 | |||
Tohoku Electric Power | 23,200 | 492 | |||
Tohokushinsha Film | 7,200 | 41 | |||
Tokai Tokyo Securities | 24,000 | 85 | |||
Tokyo Broadcasting System HD | 17,200 | 268 | |||
Tokyo Electric Power | 2,300 | 62 | |||
Tokyo Electron | 33,700 | 1,846 | |||
Tokyo Energy & Systems | 14,000 | 96 | |||
Tokyo Steel Manufacturing | 9,500 | 108 | |||
Tokyo Style | 4,000 | 32 | |||
Tokyo Tekko | 30,000 | 87 | |||
Tokyu | 39,000 | 171 | |||
Tokyu Land | 22,000 | 79 | |||
Toppan Forms | 11,800 | 129 | |||
Toppan Printing | 350,000 | 2,848 | |||
Topre | 300 | 2 | |||
Topy Industries | 33,000 | 56 | |||
Toray Industries | 10,000 | 53 | |||
Tosei | 57 | 14 | |||
Toshiba | 987,000 | 5,248 | |||
Toshiba TEC | 168,000 | 591 | |||
Toyo Ink Manufacturing | 36,000 | 132 | |||
Toyo Kohan | 10,000 | 47 | |||
Toyo Seikan Kaisha | 116,300 | 1,747 | |||
Toyo Suisan Kaisha | 54,000 | 1,476 | |||
Toyoda Gosei | 26,600 | 733 | |||
Toyota Boshoku | 23,400 | 462 | |||
Toyota Industries | 16,200 | 446 | |||
Description | Shares | Market Value ($ Thousands) | |||
Toyota Motor | 289,000 | $ | 11,541 | ||
Toyota Tsusho | 91,300 | 1,225 | |||
Trend Micro | 800 | 28 | |||
Tri-Stage* | 2,200 | 65 | |||
Tsumura | 7,300 | 244 | |||
Tsuruha Holdings | 15,000 | 592 | |||
TV Asahi | 137 | 208 | |||
Unicharm | 7,200 | 737 | |||
UNY | 30,000 | 218 | |||
USS | 2,800 | 174 | |||
Valor | 6,600 | 53 | |||
VITAL KSK HOLDINGS | 100 | 1 | |||
Warabeya Nichiyo | 6,500 | 80 | |||
Watabe Wedding | 9,200 | 105 | |||
West Japan Railway | 303 | 1,129 | |||
Yahoo! Japan | 1,636 | 490 | |||
Yakult Honsha | 12,200 | 382 | |||
Yamada Denki | 59,930 | 3,611 | |||
Yamaha Motor | 50,100 | 588 | |||
Yamanashi Chuo Bank | 2,000 | 9 | |||
Yamato Holdings | 419,500 | 5,834 | |||
Yamato Kogyo | 27,700 | 871 | |||
Yamazaki Baking | 17,000 | 211 | |||
Yaskawa Electric | 80,000 | 601 | |||
Yokogawa Electric | 77,100 | 551 | |||
Yonekyu | 3,000 | 28 | |||
Yurtec | 9,000 | 52 | |||
| 454,970 | |||||
Jersey — 0.0% | |||||
Randgold Resources | 7,128 | 603 | |||
Kazakhstan — 0.1% | |||||
KazMunaiGas Exploration Production GDR | 76,995 | 1,856 | |||
Malaysia — 0.5% | |||||
AMMB Holdings | 125,600 | 179 | |||
Bumiputra-Commerce Holdings | 1,993,700 | 7,428 | |||
Hong Leong Bank | 184,833 | 434 | |||
Hong Leong Financial Group | 36,000 | 74 | |||
KLCC Property Holdings | 103,700 | 101 | |||
OSK Holdings | 120,100 | 51 | |||
PPB Group | 275,000 | 1,281 | |||
Proton Holdings | 348,700 | 416 | |||
Public Bank | 664,000 | 2,130 | |||
RHB Capital | 311,300 | 487 | |||
Telekom Malaysia | 2,081,500 | 1,871 | |||
Tenaga Nasional | 732,000 | 1,817 | |||
Titan Chemicals* | 239,800 | 83 | |||
| 16,352 | |||||
Mauritius — 0.0% | |||||
Golden Agri-Resources | 4,282,390 | 1,422 | |||
Mexico — 1.3% | |||||
America Movil, Ser L | 6,485,309 | 15,690 | |||
America Movil ADR, Ser L | 68,500 | 3,314 | |||
Bolsa Mexicana de Valores* | 644,513 | 809 | |||
| 10 | SEI Institutional Investments Trust / Semi-Annual Report / November 30, 2009 |
Table of Contents
SCHEDULE OF INVESTMENTS (Unaudited)
World Equity Ex-US Fund
November 30, 2009
Description | Shares | Market Value ($ Thousands) | |||
Cemex ADR* | 261,700 | $ | 2,955 | ||
Coca-Cola Femsa, Ser L | 166,100 | 955 | |||
Desarrolladora Homex ADR* (A) | 64,119 | 2,230 | |||
Embotelladoras Arca | 328,800 | 980 | |||
Fomento Economico Mexicano | 306,836 | 1,397 | |||
Grupo Aeroportuario del Pacifico, Ser B, Cl B | 38,227 | 108 | |||
Grupo Carso, Ser A1 | 344,800 | 1,038 | |||
Grupo Continental | 124,900 | 288 | |||
Grupo Financiero Banorte, Ser O* | 1,012,355 | 3,491 | |||
Grupo Lamosa* | 17,900 | 14 | |||
Grupo Mexico, Ser B | 1,133,800 | 2,671 | |||
Grupo Simec, Ser B, Cl B* | 184,900 | 486 | |||
Grupo Televisa ADR | 128,500 | 2,643 | |||
Grupo Televisa | 366,836 | 1,514 | |||
Industrias, Ser B* | 173,500 | 544 | |||
Kimberly-Clark de Mexico, Cl A | 334,000 | 1,405 | |||
Urbi Desarrollos Urbanos* (A) | 1,219,532 | 2,504 | |||
Wal-Mart de Mexico | 166,100 | 685 | |||
| 45,721 | |||||
Netherlands — 3.8% | |||||
Aegon | 89,275 | 642 | |||
Akzo Nobel (A) | 128,096 | 8,122 | |||
ArcelorMittal (A) | 91,973 | 3,583 | |||
ASML Holding (A) | 116,278 | 3,572 | |||
Boskalis Westminster | 3,178 | 126 | |||
Corio‡ | 8,704 | 593 | |||
CSM | 43,158 | 1,133 | |||
European Aeronautic Defenseand Space (A) | 424,966 | 7,602 | |||
Fugro | 11,303 | 641 | |||
Heineken | 27,832 | 1,309 | |||
Heineken Holding | 26,305 | 1,084 | |||
Imtech | 28,074 | 722 | |||
ING Groep (A) | 368,935 | 3,436 | |||
James Hardie Industries | 93,756 | 693 | |||
Koninklijke Ahold | 170,301 | 2,296 | |||
Koninklijke DSM | 86,497 | 4,254 | |||
Koninklijke Philips Electronics | 234,631 | 6,416 | |||
Koninklijke Vopak* | 29,038 | 2,277 | |||
Ordina | 25,733 | 188 | |||
Plaza Centers | 573,505 | 1,355 | |||
QIAGEN* | 11,655 | 258 | |||
Randstad Holding | 63,352 | 2,764 | |||
Reed Elsevier | 21,615 | 251 | |||
Royal Dutch Shell, Cl A (GBP) | 304,836 | 9,007 | |||
Royal Dutch Shell, Cl B | 449,814 | 12,822 | |||
Royal Dutch Shell, Cl A | 552,025 | 16,402 | |||
Royal KPN | 501,526 | 8,900 | |||
SBM Offshore | 219,074 | 4,134 | |||
TNT | 162,993 | 4,728 | |||
Unilever (A) | 671,454 | 20,570 | |||
| 129,880 | |||||
New Zealand — 0.1% | |||||
Air New Zealand | 135,000 | 117 | |||
Fletcher Building | 206,294 | 1,157 | |||
Description | Shares | Market Value ($ Thousands) | |||
Telecom of New Zealand | 1,541,849 | $ | 2,713 | ||
| 3,987 | |||||
Norway — 0.8% | |||||
Aker Kvaerner | 250,400 | 3,109 | |||
Atea | 10,600 | 80 | |||
DnB (A) | 618,925 | 6,953 | |||
Marine Harvest* (A) | 1,458,000 | 1,091 | |||
Norsk Hydro | 14,800 | 104 | |||
Seadrill (A) | 108,100 | 2,497 | |||
Statoil | 340,632 | 8,338 | |||
Telenor | 451,200 | 6,138 | |||
| 28,310 | |||||
Pakistan — 0.1% | |||||
Oil & Gas Development | 1,424,749 | 1,815 | |||
Pakistan Telecommunication | 1,439,600 | 306 | |||
| 2,121 | |||||
Panama — 0.1% | |||||
Copa Holdings, Cl A | 41,700 | 2,078 | |||
Papua New Guinea — 0.0% | |||||
Lihir Gold | 195,300 | 644 | |||
Philippines — 0.1% | |||||
Philippine Long Distance Telephone | 21,240 | 1,164 | |||
Philippine Long Distance Telephone ADR | 23,517 | 1,299 | |||
San Miguel, Cl B | 10,000 | 15 | |||
| 2,478 | |||||
Poland — 0.2% | |||||
Cyfrowy Polsat | 179,329 | 894 | |||
Gant Development* | 8,467 | 74 | |||
Getin Holding* | 210,000 | 607 | |||
KGHM Polska Miedz | 42,487 | 1,654 | |||
Netia* | 107,362 | 171 | |||
Polish Oil & Gas | 798,000 | 1,087 | |||
Polski Koncern Naftowy Orlen | 143,217 | 1,609 | |||
Przedsiebiorstwo Eksportu i Importu Kopex* | 21,000 | 195 | |||
Synthos* | 380,000 | 162 | |||
Telekomunikacja Polska | 36,987 | 215 | |||
| 6,668 | |||||
Portugal — 0.3% | |||||
Banco BPI, Cl G | 2,329 | 8 | |||
Banco Comercial Portugues, Cl R | 839,348 | 1,111 | |||
Banco Espirito Santo | 174,347 | 1,220 | |||
Brisa Auto-Estradas de Portugal | 22,080 | 221 | |||
Cimpor Cimentos de Portugal | 81,644 | 622 | |||
Energias de Portugal | 382,830 | 1,755 | |||
Galp Energia SGPS, Cl B | 2,844 | 51 | |||
Inapa-Invest Particip Gesta* | 122,900 | 115 | |||
Jeronimo Martins | 102,540 | 1,005 | |||
| 11 | SEI Institutional Investments Trust / Semi-Annual Report / November 30, 2009 |
Table of Contents
SCHEDULE OF INVESTMENTS (Unaudited)
World Equity Ex-US Fund
November 30, 2009
Description | Shares | Market Value ($ Thousands) | |||
Portugal Telecom | 337,902 | $ | 4,084 | ||
| 10,192 | |||||
Russia — 1.5% | |||||
Comstar United Telesystems GDR | 15,251 | 79 | |||
Gazprom OAO ADR | 654,025 | 14,859 | |||
Globaltrans Investment GDR* | 186,743 | 1,589 | |||
Integra Group Holdings GDR* | 203,310 | 667 | |||
LSR Group GDR* | 57,348 | 419 | |||
Lukoil ADR | 171,661 | 9,965 | |||
Magnit OAO GDR | 55,970 | 691 | |||
MMC Norilsk Nickel ADR* | 187,278 | 2,575 | |||
Mobile Telesystems ADR | 26,893 | 1,347 | |||
Novolipetsk Steel GDR | 13,115 | 395 | |||
Novorossiysk Commercial Sea Port GDR | 40,117 | 459 | |||
Rosneft Oil GDR | 410,335 | 3,309 | |||
Sberbank GDR | 5,900 | 1,488 | |||
Sistema GDR | 18,767 | 334 | |||
Surgutneftegaz ADR | 341,573 | 3,009 | |||
Tatneft ADR | 58,077 | 1,757 | |||
Uralkali GDR | 97,687 | 2,235 | |||
Vimpel-Communications ADR | 141,000 | 2,691 | |||
VTB Bank GDR | 430,867 | 1,853 | |||
| 49,721 | |||||
Singapore — 1.1% | |||||
CapitaCommercial Trust‡ | 1,228,000 | 1,019 | |||
CapitaLand | 148,000 | 431 | |||
CapitaMall Trust‡ | 732,000 | 909 | |||
City Developments | 61,000 | 441 | |||
ComfortDelgro | 85,000 | 91 | |||
DBS Group Holdings | 569,000 | 5,882 | |||
Fraser and Neave | 246,000 | 707 | |||
Hi-P International, Cl P | 24,000 | 10 | |||
Ho Bee Investment | 71,000 | 74 | |||
Hong Leong Asia | 38,000 | 79 | |||
Jardine Cycle & Carriage | 115,000 | 2,016 | |||
Keppel | 181,000 | 1,059 | |||
Olam International | 2,024,000 | 3,843 | |||
OSIM International | 212,000 | 65 | |||
Oversea-Chinese Banking | 717,000 | 4,338 | |||
SembCorp Industries | 303,000 | 809 | |||
SembCorp Marine | 60,000 | 152 | |||
SIA Engineering | 128,000 | 269 | |||
Singapore Airlines | 50,000 | 480 | |||
Singapore Airport Terminal Services | 135,000 | 248 | |||
Singapore Exchange | 219,000 | 1,243 | |||
Singapore Press Holdings | 142,000 | 382 | |||
Singapore Telecommunications | 967,000 | 2,045 | |||
United Overseas Bank | 46,000 | 626 | |||
UOB-Kay Hian Holdings | 193,000 | 199 | |||
UOL Group | 170,000 | 444 | |||
Venture | 12,000 | 71 | |||
Wilmar International | 1,949,000 | 8,865 | |||
Yangzijiang Shipbuilding Holdings | 1,185,000 | 1,052 | |||
| 37,849 | |||||
South Africa — 1.3% | |||||
Description | Shares | Market Value ($ Thousands) | |||
ABSA Group | 112,232 | $ | 1,925 | ||
African Bank Investments | 295,699 | 1,149 | |||
African Rainbow Minerals | 12,925 | 276 | |||
AngloGold Ashanti | 44,000 | 1,918 | |||
Assore | 2,600 | 245 | |||
AST Group | 422,010 | 49 | |||
Aveng | 134,400 | 669 | |||
Barloworld | 122,002 | 764 | |||
Bidvest Group | 39,535 | 638 | |||
DataTec | 72,000 | 252 | |||
DRDGOLD | 3,974 | 2 | |||
Freeworld Coatings | 45,852 | 56 | |||
Gold Fields | 246,303 | 3,583 | |||
Grindrod | 514,961 | 1,233 | |||
Group | 306,893 | 4,906 | |||
Harmony Gold Mining | 209,103 | 2,307 | |||
Iliad Africa | 69,000 | 86 | |||
Impala Platinum Holdings | 262,512 | 6,066 | |||
Imperial Holdings | 13,030 | 142 | |||
Investec | 144,000 | 1,085 | |||
Medi-Clinic | 180,000 | 564 | |||
Mondi | 270,020 | 1,490 | |||
Mr Price Group | 157,587 | 691 | |||
Mvelaphanda Resources* | 15,333 | 91 | |||
Naspers, Cl N | 7,800 | 291 | |||
Nedbank Group | 98,000 | 1,490 | |||
Omnia Holdings | 1,261 | 10 | |||
Sanlam | 430,979 | 1,284 | |||
Sappi (A) | 538,180 | 2,333 | |||
Sasol | 95,696 | 3,744 | |||
Standard Bank Group | 204,000 | 2,630 | |||
Steinhoff International Holdings | 499,200 | 1,211 | |||
Wilson Bayly Holmes-Ovcon | 1,288 | 18 | |||
| 43,198 | |||||
South Korea — 3.0% | |||||
Busan Bank | 27,930 | 306 | |||
Daegu Bank | 16,860 | 239 | |||
Daewoo Shipbuilding & Marine Engineering | 67,120 | 828 | |||
Daou Technology | 14,800 | 88 | |||
GS Holdings | 29,500 | 804 | |||
GS Home Shopping | 2,880 | 205 | |||
Hana Financial Group | 136,390 | 3,947 | |||
Hyundai Development | 28,180 | 945 | |||
Hyundai Engineering & Construction | 52,523 | 2,995 | |||
Hyundai Mobis | 18,280 | 2,342 | |||
Hyundai Motor | 45,160 | 3,845 | |||
Industrial Bank of Korea | 15,410 | 178 | |||
KISCO Holdings | 4,036 | 247 | |||
KISWIRE | 4,190 | 123 | |||
Korea Development Financing | 2,340 | 64 | |||
Korea Electric Power | 88,480 | 2,427 | |||
Korea Zinc | 4,690 | 861 | |||
Korean Air Lines | 53,338 | 2,268 | |||
KT | 117,650 | 3,895 | |||
Kyeryong Construction Industrial | 900 | 15 | |||
LG | 134,652 | 7,365 | |||
LG Chemical | 15,260 | 2,749 | |||
LG Dacom | 17,880 | 281 | |||
LG Electronics | 84,145 | 7,454 | |||
| 12 | SEI Institutional Investments Trust / Semi-Annual Report / November 30, 2009 |
Table of Contents
SCHEDULE OF INVESTMENTS (Unaudited)
World Equity Ex-US Fund
November 30, 2009
Description | Shares | Market Value ($ Thousands) | |||
LG Hausys* | 1,304 | $ | 133 | ||
LG.Philips LCD | 178,000 | 4,906 | |||
Lotte Shopping | 1,790 | 554 | |||
MegaStudy | 6,215 | 1,283 | |||
POSCO | 12,358 | 5,931 | |||
Samsung Electronics | 39,024 | 24,164 | |||
Samsung Fire & Marine | |||||
Insurance | 13,839 | 2,404 | |||
SeAH Holdings | 317 | 16 | |||
Shinhan Financial Group | 146,060 | 5,722 | |||
Shinsegae | 8,863 | 4,063 | |||
SK Holdings | 55,456 | 4,016 | |||
SK Telecom | 1,640 | 239 | |||
Woori Finance Holdings | 222,150 | 2,780 | |||
Woori Investment & Securities | 34,370 | 440 | |||
Youngone Holdings | 3,524 | 91 | |||
| 101,213 | |||||
Spain — 2.9% | |||||
Abengoa | 2,233 | 65 | |||
Abertis Infraestructuras | 45,841 | 1,044 | |||
Acerinox | 48,488 | 1,004 | |||
ACS Actividades Construcciones y Servicios | 23,077 | 1,148 | |||
Banco Bilbao Vizcaya Argentaria (A) | 814,896 | 15,348 | |||
Banco de Sabadell (A) | 85,087 | 542 | |||
Banco Pastor | 3,915 | 29 | |||
Banco Popular Espanol (A) | 34,419 | 291 | |||
Banco Santander | 4,786 | 78 | |||
Banco Santander Central Hispano | 1,830,682 | 31,360 | |||
Bankinter | 99,706 | 1,068 | |||
Cintra Concesiones de Infraestructuras de Transporte | 27,766 | 301 | |||
Criteria Caixacorp (A) | 60,531 | 309 | |||
EDP Renovaveis* | 70,297 | 691 | |||
Financiera Alba | 15,634 | 839 | |||
Fomento de Construcciones y Contratas | 12,245 | 522 | |||
Gas Natural | 70,246 | 1,457 | |||
Gestevision Telecinco | 19,914 | 222 | |||
Grupo Ferrovial | 4,011 | 174 | |||
Iberdrola | 170,118 | 1,614 | |||
Inditex | 21,999 | 1,401 | |||
Mapfre (A) | 281,372 | 1,242 | |||
Obrascon Huarte Lain (A) | 7,004 | 192 | |||
Red Electrica | 66,961 | 3,659 | |||
Repsol | 294,957 | 8,104 | |||
Sacyr Vallehermoso (A) | 57,159 | 789 | |||
Telefonica | 896,220 | 25,727 | |||
Zardoya Otis | 9,804 | 205 | |||
| 99,425 | |||||
Sweden — 1.4% | |||||
Acando | 10,251 | 20 | |||
Alliance Oil* | 118,862 | 1,718 | |||
Assa Abloy, Cl B | 42,804 | 785 | |||
Atlas Copco, Cl B | 9,901 | 124 | |||
Atlas Copco, Cl A | 14,390 | 204 | |||
Billerud | 13,219 | 90 | |||
Boliden | 63,000 | 790 | |||
Description | Shares | Market Value ($ Thousands) | |||
Electrolux, Cl B | 383,231 | $ | 9,354 | ||
Eniro | 13,739 | 64 | |||
Getinge, Cl B | 15,758 | 319 | |||
Hennes & Mauritz, Cl B | 64,847 | 3,825 | |||
Husqvarna, Cl B | 11,237 | 78 | |||
Investor, Cl B | 13,457 | 245 | |||
Lundin Petroleum* | 49,863 | 414 | |||
Nordea Bank | 423,814 | 4,384 | |||
PA Resources* | 45,566 | 170 | |||
Skandinaviska Enskilda Banken, Cl A | 10,909 | 70 | |||
Skanska, Cl B | 61,249 | 1,031 | |||
SKF, Cl B | 39,559 | 654 | |||
Svenska Cellulosa, Cl B | 643,559 | 8,840 | |||
Svenska Handelsbanken, Cl A | 32,786 | 938 | |||
Swedbank | 95,066 | 906 | |||
Swedish Match | 98,064 | 2,105 | |||
Tele2, Cl B | 21,424 | 327 | |||
Telefonaktiebolaget LM Ericsson, Cl B (A) | 586,374 | 5,621 | |||
TeliaSonera | 370,903 | 2,627 | |||
Trelleborg, Cl B | 17,247 | 117 | |||
Volvo, Cl B | 24,976 | 237 | |||
Volvo, Cl A | 9,179 | 87 | |||
| 46,144 | |||||
Switzerland — 6.1% | |||||
ABB (A) | 376,564 | 6,899 | |||
ACE | 30,500 | 1,486 | |||
Actelion* | 28,038 | 1,650 | |||
Adecco | 52,509 | 2,620 | |||
Aryzta* | 4,559 | 173 | |||
Baloise Holding | 37,241 | 3,106 | |||
Banque Cantonale Vaudoise | 2,354 | 938 | |||
Clariant | 80,955 | 848 | |||
Compagnie Financiere Richemont | 68,080 | 2,202 | |||
Credit Suisse Group | 421,713 | 21,836 | |||
Elektrizitaets-Gesellschaft Laufenburg | 83 | 81 | |||
Geberit | 7,376 | 1,272 | |||
Helvetia Holding | 2,150 | 655 | |||
Holcim* | 121,360 | 8,737 | |||
Julius Baer Group | 196,984 | 6,503 | |||
Julius Baer Holding | 7,700 | 92 | |||
Kuehne + Nagel International | 7,973 | 770 | |||
Lindt & Spruengli | 408 | 1,167 | |||
Nestle | 689,804 | 32,613 | |||
Nobel Biocare Holding | 24,821 | 738 | |||
Novartis | 591,497 | 32,836 | |||
Roche Holding | 130,669 | 21,378 | |||
Schindler Holding | 12,890 | 967 | |||
SGS | 166 | 213 | |||
Sonova Holding | 14,858 | 1,765 | |||
STMicroelectronics | 64,265 | 516 | |||
Straumann Holding | 2,426 | 594 | |||
Sulzer | 3,147 | 251 | |||
Swatch Group, Cl B | 14,178 | 3,570 | |||
Swatch Group | 41,650 | 1,991 | |||
Swiss Life Holding | 14,151 | 1,739 | |||
Swiss Reinsurance | 13,205 | 628 | |||
Swisscom | 17,203 | 6,689 | |||
| 13 | SEI Institutional Investments Trust / Semi-Annual Report / November 30, 2009 |
Table of Contents
SCHEDULE OF INVESTMENTS (Unaudited)
World Equity Ex-US Fund
November 30, 2009
Description | Shares | Market Value ($ Thousands) | |||
Syngenta | 9,419 | $ | 2,498 | ||
Synthes | 7,700 | 1,013 | |||
UBS | 439,239 | 6,814 | |||
Valora Holding | 695 | 183 | |||
Vontobel Holding | 8,292 | 257 | |||
Xstrata | 906,614 | 15,905 | |||
Zurich Financial Services | 60,490 | 13,034 | |||
| 207,227 | |||||
Taiwan — 2.6% | |||||
Acer | 1,459,544 | 3,633 | |||
Advanced Semiconductor Engineering | 4,769,005 | 3,787 | |||
Asustek Computer | 1,180,356 | 2,344 | |||
AU Optronics | 2,236,540 | 2,301 | |||
Cathay Financial Holding | 854,000 | 1,486 | |||
Cheng Loong | 415,000 | 152 | |||
China Bills Finance* | 646,000 | 177 | |||
Chinatrust Financial Holding | 6,856,797 | 3,963 | |||
Chunghwa Telecom | 3,164,469 | 5,664 | |||
Compal Electronics | 1,407,050 | 1,867 | |||
Far Eastern Textile | 1,071,720 | 1,252 | |||
Far EasTone Telecommunications | 650,000 | 747 | |||
Formosa Chemicals & Fibre | 189,000 | 390 | |||
Fubon Financial Holding | 2,711,000 | 3,075 | |||
Gigabyte Technology | 244,000 | 221 | |||
High Tech Computer | 123,650 | 1,403 | |||
HON HAI Precision Industry | 2,736,708 | 11,566 | |||
Lite-On Technology | 1,062,020 | 1,423 | |||
MediaTek | 601,616 | 9,479 | |||
Mega Financial Holding | 616,000 | 348 | |||
POU Chen | 1,139,750 | 829 | |||
Quanta Computer | 844,260 | 1,705 | |||
Shihlin Electric & Engineering | 213,000 | 261 | |||
Siliconware Precision Industries ADR (A) | 401,700 | 2,699 | |||
Siliconware Precision Industries | 1,178,172 | 1,552 | |||
Taishin Financial Holding | 5,704,000 | 2,127 | |||
Taiwan Cooperative Bank | 1,672,850 | 1,040 | |||
Taiwan Fertilizer | 1,252,000 | 4,027 | |||
Taiwan Semiconductor Manufacturing ADR (A) | 244,705 | 2,543 | |||
Taiwan Semiconductor Manufacturing | 4,493,041 | 8,531 | |||
United Microelectronics | 5,776,000 | 2,836 | |||
United Microelectronics ADR* (A) | 653,300 | 2,215 | |||
Universal Scientific Industrial | 454,000 | 284 | |||
Wistron | 801,061 | 1,471 | |||
| 87,398 | |||||
Thailand — 0.7% | |||||
Advanced Info Service | 599,400 | 1,461 | |||
Airports of Thailand | 329,700 | 369 | |||
Bangkok Bank | 866,300 | 2,944 | |||
Bangkok Bank NVDR | 742,500 | 2,524 | |||
Bank of Ayudhya | 1,992,500 | 1,193 | |||
Bumrungrad Hospital | 928,400 | 782 | |||
Glow Energy | 773,354 | 698 | |||
Kasikornbank | 1,069,484 | 2,770 | |||
Krung Thai Bank | 6,025,900 | 1,649 | |||
Description | Shares | Market Value ($ Thousands) | |||
Krung Thai Bank NVDR | 1,478,000 | $ | 405 | ||
PTT NVDR | 264,000 | 1,779 | |||
Siam Cement | 205,000 | 1,394 | |||
Siam City Bank | 394,800 | 341 | |||
Siam Commercial Bank | 2,086,400 | 5,319 | |||
Thanachart Capital | 1,049,600 | 691 | |||
Total Access Communication | 587,400 | 543 | |||
| 24,862 | |||||
Turkey — 0.9% | |||||
Akbank | 135,929 | 706 | |||
Aksa Akrilik Kimya Sanayii* | 95,863 | 103 | |||
Anadolu Efes Biracilik Ve Malt Sanayii | 115,565 | 1,242 | |||
Arcelik* | 553,608 | 1,800 | |||
Aygaz | 57,143 | 190 | |||
Cimsa Cimento Sanayi VE Tica | 259,243 | 1,110 | |||
Eczacibasi Ilac Sanayi | 243,000 | 294 | |||
Ford Otomotiv Sanayi | 156,929 | 859 | |||
Global Yatirim Holding* | 51,000 | 23 | |||
Haci Omer Sabanci Holding | 1,101,869 | 3,793 | |||
KOC Holding* | 327,748 | 796 | |||
Petrol Ofisi* | 101,052 | 350 | |||
Tekfen Holding* | 261,556 | 689 | |||
Tupras Turkiye Petrol Rafine | 219,847 | 3,697 | |||
Turk Hava Yollari | 360,000 | 1,139 | |||
Turk Sise ve Cam Fabrikalari | 489,752 | 481 | |||
Turkcell Iletisim Hizmet | 692,220 | 4,185 | |||
Turkiye Garanti Bankasi | 998,150 | 3,326 | |||
Turkiye Sinai Kalkinma Bankasi* | 1,351,314 | 1,263 | |||
Turkiye Vakiflar Bankasi Tao, Cl D | 3,022,924 | 6,029 | |||
| 32,075 | |||||
United Kingdom — 12.2% | |||||
3i Group* | 70,046 | 309 | |||
Admiral Group | 20,284 | 353 | |||
Aegis Group | 263,977 | 468 | |||
Amec | 221,192 | 2,880 | |||
Amlin | 144,785 | 879 | |||
Anglo American | 264,324 | 11,291 | |||
Antofagasta | 360,695 | 5,330 | |||
Arriva | 1,032 | 8 | |||
Associated British Foods | 100,196 | 1,325 | |||
AstraZeneca | 661,895 | 29,513 | |||
Autonomy* | 104,154 | 2,436 | |||
Aviva | 1,029,675 | 6,259 | |||
Avocet Mining* | 97,930 | 153 | |||
Babcock International Group | 95,349 | 974 | |||
BAE Systems | 135,701 | 731 | |||
Balfour Beatty | 98,835 | 414 | |||
Barclays | 2,719,804 | 13,049 | |||
Barratt Developments | 4,301 | 8 | |||
Berkeley Group Holdings* | 35,400 | 505 | |||
BG Group | 632,356 | 11,447 | |||
BHP Billiton | 610,525 | 18,611 | |||
BP | 4,856,780 | 45,798 | |||
British Airways | 47,202 | 151 | |||
British American Tobacco | 559,766 | 16,967 | |||
British Sky Broadcasting Group | 66,200 | 575 | |||
BT Group, Cl A (D) | 719,155 | 1,655 | |||
Bunzl | 8,845 | 91 | |||
| 14 | SEI Institutional Investments Trust / Semi-Annual Report / November 30, 2009 |
Table of Contents
SCHEDULE OF INVESTMENTS (Unaudited)
World Equity Ex-US Fund
November 30, 2009
Description | Shares | Market Value ($ Thousands) | |||
Burberry Group | 104,633 | $ | 979 | ||
Cadbury | 158,184 | 2,092 | |||
Cape* | 138,165 | 517 | |||
Carnival | 52,905 | 1,769 | |||
Catlin Group | 192,628 | 971 | |||
Centrica | 1,336,000 | 5,582 | |||
Charter International | 63,044 | 749 | |||
Close Brothers Group | 12,966 | 146 | |||
Compass Group | 15,896 | 112 | |||
Dairy Crest Group | 27,800 | 171 | |||
Delta | 27,337 | 62 | |||
Diageo | 323,010 | 5,434 | |||
Dimension Data Holdings | 347,332 | 422 | |||
DS Smith | 173,654 | 318 | |||
easyJet* | 655,305 | 3,947 | |||
Eurasian Natural Resources | 142,401 | 2,013 | |||
Firstgroup | 252,582 | 1,622 | |||
Fresnillo | 106,028 | 1,467 | |||
GlaxoSmithKline | 905,580 | 18,681 | |||
Group 4 Securicor | 39,080 | 157 | |||
Hammerson‡ | 34,601 | 228 | |||
Hamworthy | 22,253 | 99 | |||
Healthcare Locums | 55,412 | 245 | |||
Home Retail Group | 419,541 | 2,025 | |||
HSBC Holdings | 2,893,887 | 33,577 | |||
ICAP | 150,542 | 1,068 | |||
Imperial Tobacco Group | 191,777 | 5,564 | |||
Inchcape | 4,168,132 | 1,901 | |||
Intercontinental Hotels Group | 62,347 | 861 | |||
Invensys | 383,251 | 1,761 | |||
Investec | 577,970 | 4,128 | |||
ITV | 887,326 | 758 | |||
Johnson Matthey | 1,523 | 37 | |||
Kazakhmys | 142,411 | 2,882 | |||
Kingfisher | 1,416,593 | 5,514 | |||
Land Securities Group‡ | 8,521 | 92 | |||
Legal & General Group | 3,605,133 | 4,576 | |||
Lloyds Banking Group | 710,713 | 643 | |||
LogicaCMG | 332,842 | 641 | |||
London Stock Exchange Group | 25,749 | 318 | |||
Man Group | 38,420 | 201 | |||
Marks & Spencer Group | 403,691 | 2,557 | |||
Meggitt | 112,394 | 441 | |||
Millennium & Copthorne Hotels | 74,000 | 423 | |||
Mondi | 29,765 | 162 | |||
National Express Group | 89,178 | 245 | |||
National Grid | 391,761 | 4,246 | |||
Next | 121,359 | 3,935 | |||
Old Mutual | 3,359,249 | 6,257 | |||
Pearson | 118,325 | 1,610 | |||
Persimmon | 369,456 | 2,508 | |||
Petrofac | 162,190 | 2,590 | |||
Prudential | 363,886 | 3,735 | |||
Reckitt Benckiser Group | 167,721 | 8,533 | |||
Rexam | 877,088 | 3,993 | |||
Rio Tinto | 237,535 | 12,038 | |||
Rolls-Royce Group | 823,422 | 6,412 | |||
Royal & Sun Alliance Insurance Group | 602,890 | 1,156 | |||
Royal Bank of Scotland Group | 942,138 | 513 | |||
SABMiller | 168,873 | 4,905 | |||
Sage Group | 1,102,721 | 3,860 | |||
Description | Shares | Market Value ($ Thousands) | |||
Schroders | 62,930 | $ | 1,187 | ||
Scottish & Southern Energy | 42,753 | 784 | |||
Segro‡ | 27,356 | 146 | |||
Serco Group | 122,618 | 1,041 | |||
Severn Trent | 27,806 | 479 | |||
Shire | 164,661 | 3,202 | |||
Smith & Nephew | 7,531 | 71 | |||
Standard Chartered | 558,233 | 13,595 | |||
Standard Life | 512,000 | 1,749 | |||
Taylor Woodrow | 1,369,786 | 798 | |||
Tesco | 749,784 | 5,205 | |||
Thomas Cook Group | 116,000 | 404 | |||
Tomkins | 396,333 | 1,118 | |||
Travis Perkins | 136,434 | 1,697 | |||
Tullett Prebon | 191,155 | 1,001 | |||
Tullow Oil | 86,717 | 1,756 | |||
Unilever | 80,178 | 2,347 | |||
Vedanta Resources | 22,584 | 854 | |||
Vodafone Group | 5,997,391 | 13,494 | |||
Whitbread | 16,566 | 349 | |||
WM Morrison Supermarkets | 547,588 | 2,474 | |||
WPP | 492,485 | 4,591 | |||
| 414,971 | |||||
United States — 0.5% | |||||
A. Schulman | 3,700 | 60 | |||
Capital One Financial | 59,800 | 2,294 | |||
Clearwater Paper* | 5,300 | 260 | |||
Computer Sciences* | 9,500 | 526 | |||
ConocoPhillips | 86,500 | 4,478 | |||
Dollar Thrifty Automotive Group* (A) | 6,300 | 116 | |||
Evraz Group GDR | 63,517 | 1,715 | |||
EW Scripps, Cl A* | 8,500 | 54 | |||
Gannett | 145,100 | 1,435 | |||
Gerdau Ameristeel | 15,900 | 131 | |||
IAC* | 12,900 | 251 | |||
International Business Machines | 6,700 | 846 | |||
KapStone Paper and Packaging* | 8,800 | 63 | |||
MeadWestvaco | 8,600 | 235 | |||
New York Times, Cl A | 8,300 | 70 | |||
Omnova Solutions* | 37,500 | 248 | |||
PolyOne* | 10,800 | 78 | |||
Spartech | 10,300 | 112 | |||
Thomson Reuters (CAD) | 119,323 | 3,781 | |||
Unisys* | 23,540 | 756 | |||
| 17,508 | |||||
Total Common Stock | 3,114,695 | ||||
PREFERRED STOCK — 1.9% | |||||
Brazil — 1.7% | |||||
Banco Bradesco | 323,300 | 6,756 | |||
Banco Daycoval | 41,800 | 209 | |||
Bombril* | 19,500 | 87 | |||
Centrais Eletricas Brasileiras, Cl B | 82,000 | 1,186 | |||
| 15 | SEI Institutional Investments Trust / Semi-Annual Report / November 30, 2009 |
Table of Contents
SCHEDULE OF INVESTMENTS (Unaudited)
World Equity Ex-US Fund
November 30, 2009
Description | Shares | Market Value ($ Thousands) | |||
Cia Energetica de Minas Gerais | 64,500 | $ | 1,111 | ||
Cia Paranaense de Energia | 97,000 | 1,879 | |||
Cia Vale do Rio Doce, Cl A | 362,400 | 8,791 | |||
Construtora Sultepa | 3,000 | 10 | |||
Gerdau | 114,147 | 1,771 | |||
Investimentos Itau | 5,700 | 36 | |||
Itau Unibanco Holding | 264,872 | 5,755 | |||
Marcopolo | 278,700 | 1,013 | |||
NET Servicos de Comunicacao* | 259,600 | 3,591 | |||
Parana Banco | 28,400 | 161 | |||
Petroleo Brasileiro | 838,500 | 18,625 | |||
Randon Participacoes | 89,000 | 763 | |||
Tekno Industria e Comercio | 434 | 21 | |||
Telecomunicacoes de Sao Paulo | 52,600 | 1,299 | |||
Telemar Norte Leste | 15,700 | 577 | |||
Tim Participacoes | 451,500 | 1,202 | |||
Universo Online | 31,300 | 168 | |||
Usinas Siderurgicas de Minas Gerais, Cl A | 7,100 | 208 | |||
Vivo Participacoes | 58,300 | 1,753 | |||
| 56,972 | |||||
France — 0.0% | |||||
Bureau Veritas | 11,204 | 560 | |||
Germany — 0.2% | |||||
Bayerische Motoren Werke | 17,850 | 588 | |||
Draegerwerk | 3,838 | 161 | |||
Henkel | 12,548 | 632 | |||
KSB | 304 | 176 | |||
Porsche Automobil Holding | 8,187 | 571 | |||
ProSiebenSat.1 Media | 110,477 | 1,433 | |||
RWE | 11,977 | 1,010 | |||
Volkswagen | 15,747 | 1,336 | |||
| 5,907 | |||||
Total Preferred Stock | 63,439 | ||||
MORTGAGE-BACKED SECURITIES — 0.9% | |||||
Agency Mortgage-Backed Obligations — 0.2% | |||||
FHLMC ARM (E) | |||||
5.830%, 03/01/36 | 697 | 729 | |||
5.262%, 10/01/35 | 565 | 591 | |||
4.778%, 06/01/35 | 630 | 652 | |||
FHLMC CMO, Ser 3335, Cl BF | |||||
0.389%, 07/15/19 (E) | 378 | 372 | |||
FHLMC CMO, Ser 3336, Cl FA | |||||
0.469%, 02/15/19 (E) | 852 | 850 | |||
FNMA | |||||
6.000%, 07/01/37 | 630 | 676 | |||
FNMA ARM (E) | |||||
5.118%, 10/01/35 | 908 | 950 | |||
4.496%, 05/01/35 | 650 | 678 | |||
| 5,498 | |||||
Non-Agency Mortgage-Backed Obligations — 0.7% | |||||
Adjustable Rate Mortgage Trust, Ser 2005-5, Cl 1A1 | |||||
3.382%, 09/25/35 (E) | 724 | 539 | |||
Banc of America Commercial Mortgage, Cl A2 | |||||
4.764%, 07/10/45 | 560 | 562 | |||
Description | Shares | Market Value ($ Thousands) | ||||
Banc of America Commercial Mortgage, Ser 2008-5, Cl A1 | ||||||
5.185%, 09/10/47 | $ | 365 | $ | 371 | ||
Banc of America Funding, Ser 2005-2, Cl 1A2 | ||||||
5.500%, 04/25/35 | 590 | 576 | ||||
Banc of America Funding, Ser 2006-A, Cl 2A2 | ||||||
4.666%, 02/20/36 (E) | 118 | 27 | ||||
Banc of America Mortgage Securities, Ser 2003-9, Cl 1A12 | ||||||
0.686%, 12/25/33 (E) | 239 | 229 | ||||
BCAP LLC Trust, Ser 2006-RR1, Cl PA | ||||||
5.000%, 11/25/36 | 600 | 600 | ||||
Chase Mortgage Finance, Ser 2007-A1, Cl 7A1 | ||||||
4.593%, 02/25/37 (E) | 550 | 506 | ||||
Citigroup Mortgage Loan Trust, Ser 2007-AR5, Cl 1A2A | ||||||
5.598%, 04/25/37 (E) | 1,980 | 1,080 | ||||
Countrywide Home Loan Mortgage Pass Through Trust, Ser 2003-34, Cl A3 | ||||||
5.000%, 09/25/33 | 250 | 250 | ||||
Countrywide Home Loan Mortgage Pass-Through Trust, Ser 2003-24, Cl A2 | ||||||
4.500%, 07/25/33 | 759 | 759 | ||||
Countrywide Home Loan Mortgage Pass-Through Trust, Ser 2004-13, Cl 2A17 | ||||||
5.750%, 08/25/34 | 284 | 284 | ||||
Countrywide Home Loan Mortgage Pass-Through Trust, Ser 2004-22, Cl A1 | ||||||
3.510%, 11/25/34 (E) | 405 | 327 | ||||
Credit Suisse First Boston Mortgage Securities, Ser 2001-CF2, Cl A4 | ||||||
6.505%, 02/15/34 | 486 | 500 | ||||
Credit Suisse First Boston Mortgage Securities, Ser 2003-C3 | ||||||
3.382%, 05/15/38 | 177 | 177 | ||||
Credit Suisse First Boston Mortgage Securities, Ser 2005-C3, Cl A2 | ||||||
4.512%, 07/15/37 | 690 | 690 | ||||
Credit Suisse First Boston Mortgage Securities, Ser 2005-C4, Cl A2 | ||||||
5.017%, 08/15/38 | 470 | 473 | ||||
CS First Boston Mortgage Securities, Ser 2005-C1, Cl A2 | ||||||
4.609%, 02/15/38 | 305 | 306 | ||||
Deutsche ALT-A Securities Alternate Loan Trust, Ser 2006-AB3, Cl A1 | ||||||
6.250%, 07/25/36 (E) | 390 | 288 | ||||
| 16 | SEI Institutional Investments Trust / Semi-Annual Report / November 30, 2009 |
Table of Contents
SCHEDULE OF INVESTMENTS (Unaudited)
World Equity Ex-US Fund
November 30, 2009
Description | Shares | Market Value ($ Thousands) | ||||
DLJ Commercial Mortgage, Ser 2000-CF1, Cl A1B | ||||||
7.620%, 06/10/33 | $ | 204 | $ | 206 | ||
DLJ Commercial Mortgage, Ser 2000-CKP1, Cl A1B | ||||||
7.180%, 11/10/33 | 681 | 697 | ||||
First Horizon Asset Securities, Ser 2003-9, Cl 1A3 | ||||||
5.500%, 11/25/33 | 981 | 969 | ||||
First Horizon Asset Securities, Ser 2006-AR3, Cl 1A1 | ||||||
5.640%, 11/25/36 (E) | 979 | 743 | ||||
First Union National Bank Commercial Mortgage, Ser 2000-C1, Cl A2 | ||||||
7.841%, 05/17/32 | 68 | 69 | ||||
GMAC Commercial Mortgage Securities, Ser 2004-C2, Cl A2 | ||||||
4.760%, 08/10/38 | 410 | 420 | ||||
GMAC Mortgage Loan Trust, Ser 2004-J1, Cl A2 | ||||||
5.250%, 04/25/34 | 700 | 697 | ||||
GMAC Mortgage Loan Trust, Ser 2004-J4, Cl A1 | ||||||
5.500%, 09/25/34 | 451 | 445 | ||||
Indymac Index Mortgage Loan Trust, Ser 2004-AR6, Cl 1A | ||||||
3.624%, 10/25/34 (E) | 66 | 43 | ||||
JPMorgan Chase Commercial Mortgage Securities, Ser 2000-C10, Cl A2 | ||||||
7.371%, 08/15/32 (E) | 219 | 220 | ||||
JPMorgan Mortgage Trust, Ser 2004-A5, Cl 4A2 | ||||||
4.816%, 12/25/34 (E) | 278 | 272 | ||||
LB-UBS Commercial Mortgage Trust, Ser 2000-C4, Cl A2 | ||||||
7.370%, 08/15/26 | 184 | 187 | ||||
LB-UBS Commercial Mortgage Trust, Ser 2000-C5, Cl A2 | ||||||
6.510%, 12/15/26 | 421 | 434 | ||||
LB-UBS Commercial Mortgage Trust, Ser 2001-WM, Cl A2 | ||||||
6.530%, 07/14/16 | 460 | 483 | ||||
LB-UBS Commercial Mortgage Trust, Ser 2003-C7, Cl A2 | ||||||
4.064%, 09/15/27 (E) | 505 | 509 | ||||
Master Adjustable Rate Mortgages Trust, Ser 2004-6, Cl 2A1 | ||||||
4.134%, 07/25/34 (E) | 537 | 445 | ||||
Master Adjustable Rate Mortgages Trust, Ser 2005-2, Cl 3A1 | ||||||
4.020%, 03/25/35 (E) | 666 | 390 | ||||
Master Alternative Loans Trust, Ser 2003-6, Cl 3A2 | ||||||
5.750%, 09/25/33 | 406 | 404 | ||||
Merrill Lynch Mortgage Trust, Ser 2006-1, Cl 1A | ||||||
3.941%, 02/25/36 (E) | 953 | 694 | ||||
Description | Shares | Market Value ($ Thousands) | ||||
Morgan Stanley Capital I, Ser 2005-HQ5, Cl A2 | ||||||
4.809%, 01/14/42 | $ | 112 | $ | 113 | ||
Nomura Asset Acceptance, Ser 2004-R1, Cl A1 | ||||||
6.500%, 03/25/34 | 254 | 246 | ||||
Nomura Asset Acceptance, Ser 2004-R2, Cl A1 | ||||||
6.500%, 10/25/34 (E) | 290 | 272 | ||||
PNC Mortgage Acceptance, Ser 2000-C1, Cl A2 | ||||||
7.610%, 03/15/33 | 117 | 117 | ||||
PNC Mortgage Acceptance, Ser 2000-C2, Cl A2 | ||||||
7.300%, 10/12/33 | 334 | 343 | ||||
Residential Asset Securitization Trust, Ser 2003-A1, Cl A2 | ||||||
0.736%, 03/25/33 (E) | 222 | 200 | ||||
Residential Asset Securitization Trust, Ser 2004-IP2, Cl 3A1 | ||||||
3.527%, 12/25/34 (E) | 857 | 681 | ||||
Residential Funding Mortgage Securities I, Ser 2004-S2, Cl A11 | ||||||
6.000%, 06/25/36 | 479 | 468 | ||||
Residential Funding Mortgage Securities I, Ser 2006-S5, Cl A4 | ||||||
5.500%, 03/25/34 | 915 | 917 | ||||
Salomon Brothers Mortgage Securities VII, Ser 2000-C1, Cl A2 | ||||||
7.520%, 02/18/32 (E) | 7 | 7 | ||||
Structured Adjustable Rate Mortgage Loan Trust, Ser 2007-9, Cl 2A1 | ||||||
5.890%, 10/25/47 (E) | 1,561 | 899 | ||||
Structured Asset Securities, Ser 2006-NC1, Cl A4 | ||||||
0.386%, 05/25/36 (E) | 300 | 117 | ||||
Thornburg Mortgage Securities Trust, Ser 2006-5, Cl A1 | ||||||
0.356%, 09/25/46 (E) | 1,510 | 1,381 | ||||
Wachovia Bank Commercial Mortgage Trust, Ser 2005- C17, Cl A2 | ||||||
4.782%, 03/15/42 | 452 | 453 | ||||
WaMu Mortgage Pass Through Certificates, Ser 2004-AR9, Cl A6 | ||||||
2.950%, 08/25/34 (E) | 116 | 113 | ||||
Washington Mutual Mortgage Pass-Through Certificates, Ser 2003-S4, Cl 2A5 | ||||||
4.500%, 06/25/33 | 396 | 396 | ||||
Washington Mutual Mortgage Pass-Through Certificates, Ser 2004-S2, Cl 2A1 | ||||||
5.500%, 06/25/34 | 471 | 470 | ||||
| 17 | SEI Institutional Investments Trust / Semi-Annual Report / November 30, 2009 |
Table of Contents
SCHEDULE OF INVESTMENTS (Unaudited)
World Equity Ex-US Fund
November 30, 2009
Description | Shares | Market Value ($ Thousands) | ||||
Wells Fargo Mortgage Backed Securities Trust, Ser 2004-6, Cl A5 | ||||||
3.219%, 08/25/34 (E) | $ | 78 | $ | 76 | ||
Wells Fargo Mortgage Backed Securities Trust, Ser 2004-I, Cl B1 | ||||||
3.668%, 07/25/34 (E) | 47 | 17 | ||||
Wells Fargo Mortgage Backed Securities Trust, Ser 2004-N, Cl A13 | ||||||
0.686%, 06/25/34 (E) | 243 | 232 | ||||
| 24,389 | ||||||
Total Mortgage-Backed Securities | 29,887 | |||||
ASSET-BACKED SECURITIES — 0.8% | ||||||
Automotive — 0.1% | ||||||
Americredit Prime Automobile Receivable, Ser 2009-1, Cl A2 | ||||||
1.400%, 11/15/12 | 150 | 151 | ||||
Bank of America Auto Trust, Ser 2009-2A, Cl A3 | ||||||
2.130%, 09/15/13 | 765 | 777 | ||||
BMW Floorplan Master Owner Trust, Ser 2009-1A, Cl A | ||||||
1.389%, 09/15/14 (F) | 355 | 355 | ||||
BMW Vehicle Lease Trust, Cl A2 | ||||||
2.040%, 04/15/11 | 655 | 659 | ||||
Citifinancial Auto Issuance Trust, Ser 2009-1, Cl A2 | ||||||
1.830%, 11/15/12 | 610 | 611 | ||||
Honda Auto Receivables Owner Trust, Ser 2008-1, Cl A3 | ||||||
4.470%, 01/18/12 | 375 | 382 | ||||
Honda Auto Receivables Owner Trust, Ser 2009-2, Cl A2 | ||||||
2.220%, 08/15/11 | 685 | 690 | ||||
Honda Auto Receivables Owner Trust, Ser 2009-S1, Cl A3 | ||||||
2.310%, 05/15/13 | 370 | 377 | ||||
Mercedes-Benz Auto Receivables Trust, Ser 2009- 1, Cl A3 | ||||||
1.670%, 01/15/14 | 295 | 297 | ||||
Nissan Auto Lease Trust, Cl A2 | ||||||
2.010%, 04/15/11 | 540 | 544 | ||||
USAA Auto Owner Trust, Ser 2009-I, Cl A2 | ||||||
2.640%, 08/15/11 | 950 | 957 | ||||
Volkswagen Auto Lease Trust, Cl A2 | ||||||
2.870%, 07/15/11 | 625 | 631 | ||||
| 6,431 | ||||||
Credit Cards — 0.4% | ||||||
American Express Credit Account Master Trust, Ser 2003-3, Cl A | ||||||
1.589%, 12/15/14 (E) | 2,195 | 2,238 | ||||
Description | Shares | Market Value ($ Thousands) | ||||
Bank of America Credit Card Trust, Ser 2006-A6, Cl A6 | ||||||
0.269%, 11/15/13 (E) | $ | 460 | $ | 453 | ||
Capital One Multi-Asset Execution Trust, Ser 2008-A5, Cl A5 | ||||||
4.850%, 02/18/14 | 655 | 686 | ||||
Capital One Multi-Asset Execution Trust, Ser 2009-A1, Cl A1 | ||||||
1.339%, 04/15/13 (E) | 400 | 401 | ||||
Chase Issuance Trust, Ser 2007- A10 | ||||||
0.279%, 06/16/14 (E) | 650 | 640 | ||||
Chase Issuance Trust, Ser 2009- A4, Cl A6 | ||||||
1.089%, 07/16/12 (E) | 1,050 | 1,053 | ||||
Chase Issuance Trust, Ser 2009- A6, Cl A4 | ||||||
0.989%, 06/15/12 (E) | 850 | 852 | ||||
Citibank Credit Card Issuance Trust, Ser 2005-A7, Cl A7 | ||||||
4.750%, 10/22/12 | 205 | 211 | ||||
Citibank Credit Card Issuance Trust, Ser 2007-A7, Cl A7 | ||||||
0.587%, 08/20/14 (E) | 630 | 620 | ||||
Citibank Credit Card Issuance Trust, Ser 2009-A1, Cl A1 | ||||||
1.989%, 03/17/14 (E) | 425 | 433 | ||||
Citibank Credit Card Issuance Trust, Ser 2009-A7, Cl A7 | ||||||
0.352%, 11/25/13 (E) | 865 | 854 | ||||
MBNA Credit Card Master Note Trust, Ser 2003-A4, Cl A4 | ||||||
0.459%, 09/17/12 (E) | 1,520 | 1,518 | ||||
MBNA Credit Card Master Note Trust, Ser 2003-A8 | ||||||
0.429%, 12/17/12 (E) | 1,050 | 1,046 | ||||
| 11,005 | ||||||
Mortgage Related Securities — 0.3% | ||||||
ACE Securities, Ser 2003-NC1, Cl M | ||||||
1.406%, 07/25/33 (E) | 650 | 420 | ||||
Ameriquest Mortgage Securities, Ser 2005-R9, Cl AF3 | ||||||
5.098%, 11/25/35 | 323 | 319 | ||||
Citicorp Residential Mortgage Securities, Ser 2006-2, Cl A4 | ||||||
5.775%, 09/25/36 | 920 | 867 | ||||
Citigroup Mortgage Loan Trust, Ser 2007-AMC2, Cl A3A | ||||||
0.316%, 01/25/37 (E) | 669 | 386 | ||||
CNH Equipment Trust, Ser 2009-A, Cl A2 | ||||||
4.060%, 10/17/11 | 281 | 284 | ||||
CNH Equipment Trust, Ser 2009-B, Cl A2 | ||||||
2.400%, 05/16/11 | 260 | 260 | ||||
Credit Suisse Asset-Backed Mortgage Backed Trust, Ser 2007-1, Cl 1A1A | ||||||
5.898%, 05/25/37 (E) | 2,156 | 1,375 | ||||
| 18 | SEI Institutional Investments Trust / Semi-Annual Report / November 30, 2009 |
Table of Contents
SCHEDULE OF INVESTMENTS (Unaudited)
World Equity Ex-US Fund
November 30, 2009
Description | Shares | Market Value ($ Thousands) | ||||
GSAMP Trust, Ser 2005-HE3, Cl M1 | ||||||
0.706%, 06/25/35 (E) | $ | 213 | $ | 204 | ||
First Franklin Mortgage Loan Asset Backed Certificates, Ser 2005-FF9, Cl A3 | ||||||
0.516%, 10/25/35 (E) | 534 | 488 | ||||
Home Equity Asset Trust, Ser 2006-5, Cl 2A3 | ||||||
0.386%, 10/25/36 (E) | 250 | 80 | ||||
Merrill Lynch First Franklin Mortgage Loan Trust, Ser 2007-5, Cl 2A1 | ||||||
0.936%, 10/25/37 (E) | 436 | 420 | ||||
Merrill Lynch Mortgage Investors, Ser 2003-HE1, Cl M2 | ||||||
1.886%, 07/25/34 (E) | 47 | 11 | ||||
Morgan Stanley ABS Capital I, Ser 2003-NC10, Cl M1 | ||||||
1.256%, 10/25/33 (E) | 543 | 361 | ||||
Morgan Stanley ABS Capital I, Ser 2005-HE6, Cl A2C | ||||||
0.556%, 11/25/35 (E) | 1,600 | 1,261 | ||||
Residential Asset Mortgage Products, Ser 2003-RS11, Cl MII1 | ||||||
1.331%, 12/25/33 (E) | 54 | 31 | ||||
Resmae Mortgage Loan Trust, Ser 2006-1, Cl A2B | ||||||
0.386%, 02/25/36 (E) | 642 | 254 | ||||
Structured Asset Securities, Ser 2007-BC1, Cl A4 | ||||||
0.366%, 02/25/37 (E) | 1,350 | 302 | ||||
Structured Asset Securities, Ser 2007-GEL2, Cl A1 | ||||||
0.386%, 05/25/37 (E) | 1,776 | 1,424 | ||||
Terwin Mortgage Trust, Ser 2006-6, Cl 2A1 | ||||||
4.500%, 06/25/36 | 207 | 20 | ||||
| 8,767 | ||||||
Total Asset-Backed Securities | 26,203 | |||||
| Number Of Warrants | ||||||
WARRANTS — 0.0% | ||||||
Singapore — 0.0% | ||||||
Golden Agri-Resources, Expires 05/29/12 * | 229,372 | 46 | ||||
Italy — 0.0% | ||||||
Mediobanca, Expires 2011 | 105,830 | — | ||||
Unione di Banche Italiane SCPA, Expires 2011 * | 51,612 | 4 | ||||
| 4 | ||||||
Total Warrants | 50 | |||||
Description | Shares | Market Value ($ Thousands) | |||
Number Of Rights | |||||
RIGHTS — 0.0% | |||||
Australia — 0.0% | |||||
CSR, Expires 12/07/09 | 7,767 | $ | — | ||
ING Industrial Fund , Expires 12/14/09 | 412,780 | — | |||
| — | |||||
Belgium — 0.0% | |||||
Fortis, Expires 07/01/14 (A)(G)(H)(I) | 261,082 | — | |||
Germany — 0.0% | |||||
Kali und Salz, Expires 12/14/09 | 41,355 | 138 | |||
Italy — 0.0% | |||||
Piccolo Credito Valtellinese, Expires 01/02/10 | 6,212 | 2 | |||
Netherlands — 0.0% | |||||
ING Group, Expires 12/17/09 | 368,935 | 914 | |||
Norway — 0.0% | |||||
DnB, Expires 12/14/09 | 137,539 | 388 | |||
Spain — 0.0% | |||||
Mapfre , Expires 12/04/09 | 227,100 | 3 | |||
Obrascon Huarte Lain, Expires 12/15/09 | 7,004 | 14 | |||
| 17 | |||||
United Kingdom — 0.0% | |||||
Lloyds Banking Group, Expires 12/15/09 | 952,356 | 278 | |||
National Express Group, Expires 12/16/09 | 208,082 | 215 | |||
| 493 | |||||
Total Rights | 1,952 | ||||
CORPORATE OBLIGATION — 0.0% | |||||
Financials — 0.0% | |||||
Shinsei Finance Cayman | |||||
6.418%, 01/29/49 (E) | 545 | 316 | |||
Total Corporate Obligation | 316 | ||||
| 19 | SEI Institutional Investments Trust / Semi-Annual Report / November 30, 2009 |
Table of Contents
SCHEDULE OF INVESTMENTS (Unaudited)
World Equity Ex-US Fund
November 30, 2009
Description | Shares | Market Value ($ Thousands) | |||
AFFILIATED PARTNERSHIP — 4.8% | |||||
SEI Liquidity Fund, L.P., | |||||
0.320% * * † (F) | 164,829,238 | $ | 162,670 | ||
Total Affiliated Partnership | 162,670 | ||||
U.S. TREASURY OBLIGATIONS — 0.8% | |||||
U.S. Treasury Bills (C)(D) | |||||
0.161%, 12/03/09 | 18,000 | 18,000 | |||
0.285%, 12/17/09 | 1,315 | 1,315 | |||
0.195%, 01/07/10 | 3,100 | 3,100 | |||
0.010%, 02/25/10 | 5,000 | 4,999 | |||
| 27,414 | |||||
Total U.S. Treasury Obligations | 27,414 | ||||
CASH EQUIVALENT — 2.0% | |||||
SEI Daily Income Trust, Prime Obligation Fund, Cl A | |||||
0.130% * * † | 68,711 | 68,711 | |||
Total Cash Equivalent | 68,711 | ||||
Total Investments — 102.8% | $ | 3,495,337 | |||
| 20 | SEI Institutional Investments Trust / Semi-Annual Report / November 30, 2009 |
Table of Contents
SCHEDULE OF INVESTMENTS (Unaudited)
World Equity Ex-US Fund
November 30, 2009
A summary of outstanding swap agreements held by the Fund at November 30, 2009, is as follows:
| Total Return Swaps | ||||||||||||||
| Counterparty | Reference Entity/Obligation | Fund Pays | Fund Receives | Termination Date | Notional Amount (Thousands) | Net Unrealized Appreciation ($Thousands) | ||||||||
| Morgan Stanley | MSCI Daily TR Net EAFE USD Market Index | 3-Month LIBOR | Price Return | 01/13/10 | 35,849 | $ | (81 | ) | ||||||
| Morgan Stanley | MSCI Daily TR Net EAFE USD Market Index | 1-Month LIBOR | Price Return | 08/03/10 | 17,365 | 617 | ||||||||
| $ | 536 | |||||||||||||
A summary of the open futures contracts held by the Fund at November 30, 2009, is as follows:
Type of Contract | Number of Contracts Long (Short) | Expiration Date | Unrealized Appreciation (Depreciation) ($ Thousands) | |||||
DJ Euro Stoxx 50 Index | 784 | Dec-2009 | $ | 432 | ||||
E-Mini MSCI EAFE | 28 | Dec-2009 | 45 | |||||
E-Mini MSCI Emerging Markets | 351 | Dec-2009 | 1,309 | |||||
FTSE 100 Index | 227 | Dec-2009 | 678 | |||||
Hang Seng Index | 15 | Dec-2009 | (2 | ) | ||||
Nikkei 225 Index | 53 | Dec-2009 | (279 | ) | ||||
S&P/TSE 60 Index | 111 | Dec-2009 | 416 | |||||
SPI 200 Index | 89 | Dec-2009 | 237 | |||||
Topix Index | 234 | Dec-2009 | (890 | ) | ||||
| $ | 1,946 | |||||||
For the year ended November 30, 2009, the total amount of all open futures contracts, as presented in the table above, are representative of the volume of activity for this derivative type during the period.
A summary of the outstanding forward foreign currency contracts held by the Fund at November 30, 2009, is as follows:
Maturity Date | Currency to Deliver | Currency to Receive (Thousands) | Unrealized (Depreciation) ($ Thousands) | ||||||||||
12/3/09 | USD | 5,607 | CAD | 5,910 | $ | (1 | ) | ||||||
1/25/10 | AUD | 11,589 | USD | 10,386 | (161 | ) | |||||||
1/25/10 | USD | 10,646 | AUD | 11,589 | (100 | ) | |||||||
| $ | (262 | ) | |||||||||||
Percentages are based on a Net Assets of $3,401,044 ($ Thousands)
| * | Non-income producing security. |
| ** | The rate reported is the 7-day effective yield as of November 30, 2009. |
| † | Investment in Affiliated Security (see Note 5). |
| ‡ | Real Estate Investment Trusts |
| (A) | This security or a partial position of this security is on loan at November 30, 2009. (See Note 11) The total value of securities on loan at November 30, 2009 was $154,501 ($ Thousands). |
| (B) | Securities sold within terms of a private placement memorandum, exempt from registration under Section 144A of the Securities Act of 1933, as amended, and may be sold only to dealers in that program or other “accredited investors.” These securities have been determined to be liquid under guidelines established by the Board of Trustees. |
| (C) | The rate reported is the effective yield at time of purchase. |
| (D) | Security, or portion thereof, has been pledged as collateral on open future contracts. |
| (E) | Variable Rate Security - The rate reported is the rate in effect as of November 30, 2009. The date reported is the final maturity date. |
| 21 | SEI Institutional Investments Trust / Semi-Annual Report / November 30, 2009 |
Table of Contents
SCHEDULE OF INVESTMENTS (Unaudited)
World Equity Ex-US Fund
November 30, 2009
| (F) | This security was purchased with cash collateral held from securities on loan (See Note 11). The total value of such securities as of November 30, 2009 was $160,170 ($ Thousands). |
| (G) | Security considered restricted. The total value of such security as of November 30, 2009 was $0 and represented 0.00% of net assets. |
| (H) | Security considered illiquid. The total value of such security as of November 30, 2009 was $0 and represented 0.00% of net assets. |
| (I) | Security fair valued using methods determined in good faith by the Valuation Committee of the Board of Trustees. The total value of such security as of November 30, 2009 was $0 and represented 0.00% of net assets. |
ABS — Asset-Backed Security
ADR — American Depositary Receipt
AUD — Australian Dollar
CAD — Canadian Dollar
Cl — Class
CMO — Collateralized Mortgage Obligation
FHLMC — Federal Home Loan Mortgage Corporation
FNMA — Federal National Mortgage Association
GDR — Global Depositary Receipt
LLC — Limited Liability Company
L.P. — Limited Partnership
MSCI EAFE — Morgan Stanley Capital International Europe, Australia, and the Far East
NVDR — Non-Voting Depositary Receipt
S&P — Standard & Poor’s
Ser — Series
STRIPS — Separately Traded Registered Interest and Principal Securities
TSE — Toronto Stock Exchange
USD — U.S. Dollar
Amounts designated as “—” are $0 or have been rounded to $0.
| 22 | SEI Institutional Investments Trust / Semi-Annual Report / November 30, 2009 |
Table of Contents
SCHEDULE OF INVESTMENTS (Unaudited)
Screened World Equity Ex-US Fund
November 30, 2009
Description | Shares | Market Value ($ Thousands) | |||
COMMON STOCK — 93.3% | |||||
Argentina — 0.0% | |||||
Tenaris | 1,369 | $ | 27 | ||
Australia — 4.4% | |||||
AMP | 7,756 | 44 | |||
ASX | 600 | 18 | |||
Austal | 3,354 | 7 | |||
Australia & New Zealand Banking Group | 13,948 | 283 | |||
BGP Holdings* | 4,500 | — | |||
BHP Billiton | 5,300 | 200 | |||
Biota Holdings | 1,000 | 3 | |||
BlueScope Steel | 35,723 | 89 | |||
CFS Retail Property Trust‡ | 1,900 | 3 | |||
Coca-Cola Amatil | 5,559 | 54 | |||
Commonwealth Bank of Australia | 6,169 | 298 | |||
Computershare | 4,263 | 42 | |||
Crown | 800 | 6 | |||
David Jones | 2,400 | 13 | |||
Dexus Property Group‡ | 3,700 | 3 | |||
Downer EDI | 13,700 | 107 | |||
Energy Developments | 3,321 | 8 | |||
Goodman Fielder | 8,600 | 12 | |||
GPT Group‡ | 4,500 | 2 | |||
Harvey Norman Holdings | 16,037 | 63 | |||
Incitec Pivot | 3,000 | 8 | |||
Insurance Australia Group | 5,900 | 21 | |||
JB Hi-Fi | 2,050 | 44 | |||
Kingsgate Consolidated | 500 | 4 | |||
Leighton Holdings | 1,562 | 51 | |||
Lend Lease | 4,777 | 40 | |||
Macquarie Group | 200 | 9 | |||
Macquarie Infrastructure Group | 51,043 | 61 | |||
Metcash | 2,000 | 9 | |||
National Australia Bank | 7,134 | 187 | |||
Newcrest Mining | 1,000 | 34 | |||
Orica | 2,588 | 59 | |||
Origin Energy | 2,245 | 32 | |||
Primary Health Care | 1,000 | 5 | |||
Qantas Airways | 9,506 | 23 | |||
QBE Insurance Group | 300 | 6 | |||
Rio Tinto | 5,035 | 330 | |||
Straits Resources | 22,787 | 34 | |||
Suncorp-Metway | 5,000 | 40 | |||
Super Cheap Auto Group | 600 | 3 | |||
TABCORP Holdings | 1,996 | 13 | |||
Tatts Group | 11,806 | 26 | |||
Telstra | 13,700 | 43 | |||
United Group | 700 | 8 | |||
Wesfarmers | 9,180 | 250 | |||
Westfield Group‡ | 7,826 | 87 | |||
Westpac Banking | 9,093 | 201 | |||
Woodside Petroleum | 1,288 | 58 | |||
Woolworths | 12,774 | 328 | |||
| 3,269 | |||||
Austria — 0.2% | |||||
Erste Group Bank | 1,539 | 63 | |||
OMV | 1,451 | 61 | |||
Description | Shares | Market Value ($ Thousands) | |||
Strabag | 1,067 | $ | 33 | ||
| 157 | |||||
Belgium — 1.0% | |||||
Belgacom | 144 | 5 | |||
Delhaize Group | 1,200 | 91 | |||
Dexia | 8,716 | 66 | |||
Groupe Bruxelles Lambert | 224 | 20 | |||
InBev | 7,418 | 370 | |||
Solvay | 511 | 54 | |||
Telenet Group Holding | 1,528 | 42 | |||
UCB | 640 | 29 | |||
Umicore | 1,800 | 61 | |||
| 738 | |||||
Brazil — 1.2% | |||||
Abyara Planejamento Imobiliario* | 2,300 | 6 | |||
Banco Bradesco ADR | 8,900 | 189 | |||
Banco do Brasil | 6,100 | 108 | |||
Banestes Banco do Estado do Espirito Santo | 3,400 | 14 | |||
Cia de Saneamento Basico do Estado de Sao Paulo | 5,000 | 90 | |||
Cia de Saneamento de Minas Gerais-COPASA (Brazil) | 2,500 | 43 | |||
Cia Siderurgica Nacional | 400 | 13 | |||
Cyrela Brazil Realty | 5,400 | 76 | |||
EDP-Energias do Brasil | 3,900 | 69 | |||
Empresa Brasileira de Aeronautica* | 15,200 | 76 | |||
Eternit | 1,500 | 7 | |||
Ez Tec Empreendimentos e Participacoes | 3,200 | 15 | |||
Grendene | 6,300 | 32 | |||
M Dias Branco | 2,100 | 47 | |||
Redecard | 3,500 | 54 | |||
Souza Cruz | 2,100 | 73 | |||
| 912 | |||||
Canada — 7.2% | |||||
Aastra Technologies | 200 | 6 | |||
Agrium | 100 | 6 | |||
Alimentation Couche Tard, Cl B | 2,700 | 56 | |||
AltaGas Income Trust | 800 | 14 | |||
Astral Media, Cl A | 400 | 12 | |||
Atco | 500 | 21 | |||
Bank of Montreal | 4,400 | 224 | |||
Bank of Nova Scotia | 4,000 | 184 | |||
Barrick Gold | 4,200 | 179 | |||
Baytex Energy Trust | 3,200 | 82 | |||
BCE | 1,400 | 37 | |||
Bombardier, Cl B | 33,200 | 141 | |||
Brookfield Asset Management, Cl A | 4,100 | 86 | |||
Cameco | 500 | 14 | |||
Canadian Imperial Bank of Commerce | 300 | 20 | |||
Canadian National Railway | 2,900 | 152 | |||
Canadian Natural Resources | 3,900 | 261 | |||
Canadian Oil Sands Trust | 2,800 | 78 | |||
Canadian Tire, Cl A | 600 | 31 | |||
Canadian Utilities | 500 | 20 | |||
| 1 | SEI Institutional Investments Trust / Semi-Annual Report / November 30, 2009 |
Table of Contents
SCHEDULE OF INVESTMENTS (Unaudited)
Screened World Equity Ex-US Fund
November 30, 2009
Description | Shares | Market Value ($ Thousands) | |||
Celestica* | 1,700 | $ | 14 | ||
CGI Group, Cl A* | 9,200 | 114 | |||
Dundee, Cl A* | 400 | 5 | |||
Enbridge | 4,600 | 196 | |||
EnCana | 9,419 | 506 | |||
First Quantum Minerals | 1,100 | 86 | |||
George Weston | 500 | 29 | |||
Gildan Activewear* | 2,400 | 46 | |||
Goldcorp | 6,420 | 270 | |||
Husky Energy | 4,300 | 113 | |||
IAMGOLD | 6,938 | 131 | |||
Imperial Oil | 200 | 8 | |||
Industrial Alliance Insurance & Financial Services | 200 | 6 | |||
Inmet Mining | 900 | 54 | |||
Linamar | 600 | 8 | |||
Magna International, Cl A | 930 | 44 | |||
Manulife Financial | 800 | 14 | |||
Maple Leaf Foods | 1,100 | 12 | |||
Metro, Cl A | 1,200 | 41 | |||
National Bank of Canada | 2,800 | 168 | |||
Nexen | 8,507 | 200 | |||
Pacific Rubiales Energy* | 7,600 | 111 | |||
Penn West Energy Trust | 2,170 | 38 | |||
Potash Saskatchewan | 400 | 45 | |||
Power Financial | 620 | 16 | |||
Provident Energy Trust | 2,900 | 19 | |||
Quebecor, Cl B | 700 | 17 | |||
Research In Motion* | 700 | 41 | |||
Rogers Communications, Cl B | 300 | 9 | |||
Royal Bank of Canada | 7,200 | 388 | |||
Sherritt International | 3,300 | 21 | |||
Sierra Wireless* | 600 | 5 | |||
Sino-Forest, Cl A* | 4,400 | 77 | |||
Sun Life Financial | 2,100 | 58 | |||
Suncor Energy | 4,732 | 170 | |||
Talisman Energy | 6,800 | 117 | |||
Teck Cominco, Cl B* | 6,400 | 222 | |||
Toronto-Dominion Bank | 3,370 | 212 | |||
TransCanada | 400 | 13 | |||
Transcontinental, Cl A | 700 | 8 | |||
West Fraser Timber | 400 | 12 | |||
Yamana Gold | 5,500 | 73 | |||
Yellow Pages Income Fund | 4,000 | 20 | |||
| 5,381 | |||||
Chile — 0.3% | |||||
Banco de Chile ADR | 187 | 10 | |||
Cia Cervecerias Unidas ADR | 1,400 | 51 | |||
CorpBanca ADR | 803 | 29 | |||
Enersis ADR | 5,000 | 96 | |||
Sociedad Quimica y Minera de Chile ADR | 1,700 | 64 | |||
| 250 | |||||
China — 3.2% | |||||
Anhui Conch Cement, Cl H | 16,000 | 95 | |||
Bank of China | 457,000 | 258 | |||
Bank of Communications, Cl H | 88,000 | 105 | |||
Baoye Group, Cl H | 16,000 | 12 | |||
China BlueChemical | 52,000 | 28 | |||
China Citic Bank | 46,000 | 38 | |||
Description | Shares | Market Value ($ Thousands) | |||
China Coal Energy | 60,000 | $ | 102 | ||
China Communications Services, Cl H | 54,000 | 28 | |||
China Construction Bank, Cl H | 280,000 | 249 | |||
China Life Insurance, Cl H | 35,000 | 175 | |||
China Shenhua Energy | 27,000 | 132 | |||
China Telecom, Cl H | 236,000 | 104 | |||
China Vanke, Cl B | 26,100 | 33 | |||
Chongqing Changan Automobile, Cl B | 65,800 | 65 | |||
First Tractor, Cl H | 22,000 | 11 | |||
Fosun International | 87,000 | 63 | |||
Great Wall Motor, Cl H | 26,000 | 31 | |||
Great Wall Technology, Cl H | 32,000 | 12 | |||
Industrial & Commercial Bank of China | 571,000 | 483 | |||
Jiangling Motors, Cl B | 34,800 | 59 | |||
Perfect World ADR* | 880 | 39 | |||
Qingling Motors, Cl H | 60,000 | 17 | |||
Shandong Chenming Paper Holdings, Cl B | 68,700 | 51 | |||
Shanghai Mechanical and Electrical Industry, Cl B | 34,500 | 42 | |||
Shenzhou International Group Holdings | 13,000 | 15 | |||
Sichuan Expressway, Cl H | 54,000 | 28 | |||
Times | 23,000 | 16 | |||
Yanzhou Coal Mining, Cl H | 30,000 | 60 | |||
| 2,351 | |||||
Colombia — 0.1% | |||||
BanColombia ADR | 1,669 | 72 | |||
Czech Republic — 0.1% | |||||
CEZ | 2,400 | 120 | |||
Denmark — 0.5% | |||||
A P Moeller-Maersk, Cl B | 3 | 21 | |||
Carlsberg, Cl B | 1,957 | 140 | |||
Coloplast, Cl B | 150 | 14 | |||
Danske Bank | 3,509 | 76 | |||
H Lundbeck | 226 | 4 | |||
Novo-Nordisk, Cl B | 1,232 | 83 | |||
Sydbank | 1,150 | 27 | |||
Topdanmark* | 180 | 26 | |||
William Demant Holding* | 180 | 13 | |||
| 404 | |||||
Egypt — 0.2% | |||||
Orascom Telecom Holding | 12,000 | 56 | |||
Talaat Moustafa Group* | 34,000 | 37 | |||
Telecom Egypt | 22,000 | 65 | |||
| 158 | |||||
Finland — 0.6% | |||||
Fortum | 1,388 | 35 | |||
Kone, Cl B | 3,841 | 155 | |||
Metso | 1,729 | 55 | |||
Sampo, Cl A | 4,918 | 117 | |||
| 2 | SEI Institutional Investments Trust / Semi-Annual Report / November 30, 2009 |
Table of Contents
SCHEDULE OF INVESTMENTS (Unaudited)
Screened World Equity Ex-US Fund
November 30, 2009
Description | Shares | Market Value ($ Thousands) | |||
Stora Enso, Cl R | 4,140 | $ | 32 | ||
UPM-Kymmene | 2,177 | 28 | |||
| 422 | |||||
France — 4.8% | |||||
Air France-KLM | 1,094 | 17 | |||
Air Liquide | 102 | 12 | |||
Arkema | 885 | 33 | |||
Atos Origin | 1,056 | 46 | |||
AXA | 5,305 | 126 | |||
BNP Paribas | 464 | 38 | |||
Bouygues | 3,971 | 198 | |||
Capital Gemini | 1,704 | 79 | |||
Christian Dior | 800 | 81 | |||
Cie de Saint-Gobain | 621 | 34 | |||
CNP Assurances | 1,723 | 184 | |||
Compagnie Generale des Etablissements Michelin, Cl B | 837 | 63 | |||
Credit Agricole | 1,645 | 34 | |||
Electricite de France | 1,051 | 61 | |||
Eutelsat Communications | 1,740 | 57 | |||
France Telecom | 12,024 | 313 | |||
Gaz de France | 2,237 | 93 | |||
Gecina‡ | 546 | 60 | |||
Legrand | 1,029 | 28 | |||
LVMH Moet Hennessy Louis Vuitton | 101 | 11 | |||
M6-Metropole Television | 1,447 | 37 | |||
Natixis | 7,385 | 39 | |||
Neopost | 126 | 11 | |||
Nexity | 646 | 22 | |||
Peugeot | 750 | 27 | |||
PPR | 1,866 | 226 | |||
Publicis Groupe | 3,093 | 119 | |||
Safran | 1,824 | 31 | |||
Sanofi-Aventis | 8,882 | 671 | |||
SCOR | 1,010 | 25 | |||
SES Global | 1,405 | 30 | |||
Societe BIC | 219 | 15 | |||
Societe de la Tour Eiffel‡ | 272 | 20 | |||
Societe Des Autoroutes Paris- Rhin-Rhone | 788 | 66 | |||
Societe Generale | 2,677 | 188 | |||
Societe Television Francaise 1 | 3,236 | 58 | |||
Unibail-Rodamco‡ | 656 | 148 | |||
Valeo | 2,352 | 67 | |||
Vallourec | 93 | 16 | |||
Vinci | 2,876 | 159 | |||
Vivendi | 2,129 | 61 | |||
Zodiac Aerospace | 60 | 2 | |||
| 3,606 | |||||
Germany — 4.1% | |||||
Aixtron | 3,120 | 112 | |||
Allianz | 2,197 | 270 | |||
BASF | 7,129 | 430 | |||
Bayer | 699 | 54 | |||
Bayerische Motoren Werke | 5,891 | 278 | |||
Bilfinger Berger | 235 | 17 | |||
DaimlerChrysler | 1,200 | 61 | |||
Deutsche Bank | 4,385 | 316 | |||
Deutsche Post | 13,160 | 246 | |||
Description | Shares | Market Value ($ Thousands) | |||
Deutsche Telekom | 1,022 | $ | 15 | ||
E.ON | 11,243 | 445 | |||
GAGFAH | 4,000 | 36 | |||
Hannover Rueckversicherung | 2,694 | 128 | |||
Henkel | 609 | 26 | |||
Hochtief | 1,199 | 94 | |||
Infineon Technologies* | 17,995 | 86 | |||
Lanxess | 263 | 10 | |||
Metro | 948 | 60 | |||
MTU Aero Engines Holding | 102 | 5 | |||
Muenchener Rueckversicherungs | 356 | 56 | |||
SAP | 1,269 | 61 | |||
Suedzucker | 637 | 14 | |||
TUI | 1,912 | 15 | |||
United Internet | 2,766 | 37 | |||
Volkswagen | 121 | 15 | |||
Wacker Chemie | 1,030 | 170 | |||
| 3,057 | |||||
Greece — 0.6% | |||||
Alpha Bank | 4,866 | 67 | |||
Coca Cola Hellenic Bottling | 2,106 | 47 | |||
Hellenic Petroleum | 6,176 | 72 | |||
National Bank of Greece | 5,270 | 155 | |||
OPAP | 1,197 | 29 | |||
Public Power | 4,920 | 99 | |||
| 469 | |||||
Hong Kong — 3.3% | |||||
ASM Pacific Technology | 1,400 | 12 | |||
Beijing Enterprises Holdings | 14,000 | 95 | |||
BOC Hong Kong Holdings | 36,500 | 84 | |||
Cathay Pacific Airways | 8,000 | 14 | |||
Chaoda Modern Agriculture | 62,000 | 55 | |||
Cheung Kong Holdings | 4,000 | 50 | |||
Cheung Kong Infrastructure Holdings | 3,000 | 11 | |||
China Mobile | 21,500 | 201 | |||
China Overseas Land & Investment | 68,000 | 146 | |||
Chinese Estates Holdings | 8,000 | 14 | |||
CLP Holdings | 500 | 3 | |||
CNOOC | 65,500 | 101 | |||
Dairy Farm International Holdings | 1,800 | 11 | |||
Esprit Holdings | 3,000 | 20 | |||
First Pacific | 16,000 | 9 | |||
Genting Singapore* | 124,000 | 96 | |||
Guangdong Investment | 76,000 | 42 | |||
Guoco Group | 2,000 | 23 | |||
Hang Lung Properties | 22,000 | 80 | |||
Hang Seng Bank | 4,200 | 62 | |||
Henderson Land Development | 3,000 | 21 | |||
Hengan International Group | 7,000 | 50 | |||
HKR International | 6,400 | 3 | |||
Hong Kong Exchanges and Clearing | 3,300 | 59 | |||
HongKong Electric Holdings | 1,000 | 6 | |||
Hongkong Land Holdings | 9,000 | 45 | |||
Hopewell Holdings | 5,500 | 17 | |||
Hutchison Whampoa | 20,000 | 135 | |||
Hysan Development | 5,000 | 14 | |||
Jardine Matheson Holdings | 400 | 12 | |||
| 3 | SEI Institutional Investments Trust / Semi-Annual Report / November 30, 2009 |
Table of Contents
SCHEDULE OF INVESTMENTS (Unaudited)
Screened World Equity Ex-US Fund
November 30, 2009
Description | Shares | Market Value ($ Thousands) | |||
Jardine Strategic Holdings | 1,000 | $ | 17 | ||
Kerry Properties | 1,000 | 5 | |||
Kingboard Laminates Holdings | 9,000 | 5 | |||
Li & Fung | 12,000 | 48 | |||
Link REIT‡ | 2,000 | 5 | |||
New World Development | 22,000 | 45 | |||
Noble Group | 55,000 | 123 | |||
Pacific Basin Shipping | 77,000 | 58 | |||
Pacific Century Premium Developments | 13,000 | 4 | |||
Road King Infrastructure | 4,000 | 3 | |||
Shanghai Industrial Holdings | 14,000 | 70 | |||
Sino Land | 4,000 | 8 | |||
Sun Hung Kai Properties | 18,000 | 267 | |||
Swire Pacific, Cl A | 3,000 | 34 | |||
Television Broadcasts | 2,000 | 9 | |||
Texwinca Holdings | 2,000 | 2 | |||
VTech Holdings | 3,000 | 29 | |||
Wharf Holdings | 15,000 | 81 | |||
Wheelock | 17,000 | 55 | |||
Yue Yuen Industrial Holdings | 4,000 | 12 | |||
| 2,371 | |||||
Hungary — 0.2% | |||||
Magyar Telekom | |||||
Telecommunications | 14,000 | 56 | |||
MOL Hungarian Oil and Gas | 1,000 | 88 | |||
| 144 | |||||
India — 2.2% | |||||
HDFC Bank ADR | 3,471 | 467 | |||
Infosys Technologies ADR | 13,222 | 674 | |||
ITC* | 26,822 | 149 | |||
Larsen & Toubro GDR | 7,628 | 267 | |||
Sterlite Industries India ADR | 5,520 | 101 | |||
| 1,658 | |||||
Indonesia — 0.6% | |||||
Adaro Energy* | 76,000 | 14 | |||
Astra International | 49,500 | 169 | |||
Bank Mandiri | 173,000 | 82 | |||
Bank Negara Indonesia Persero | 81,000 | 17 | |||
Bank Rakyat Indonesia | 92,000 | 72 | |||
United Tractors | 40,000 | 63 | |||
| 417 | |||||
Ireland — 0.1% | |||||
DCC | 395 | 11 | |||
Experian | 4,661 | 44 | |||
Irish Life & Permanent | 3,589 | 17 | |||
| 72 | |||||
Israel — 1.0% | |||||
Bezeq Israeli Telecommunication | 10,000 | 23 | |||
Check Point Software | |||||
Technologies* | 2,040 | 64 | |||
Delek Group | 100 | 18 | |||
Discount Investment | 2,000 | 45 | |||
First International Bank of Israel* | 2,000 | 32 | |||
Israel Land Development | 5,000 | 22 | |||
Koor Industries | 1,600 | 44 | |||
Description | Shares | Market Value ($ Thousands) | |||
Teva Pharmaceutical Industries | 4,646 | $ | 249 | ||
Teva Pharmaceutical Industries ADR | 3,560 | 188 | |||
Union Bank of Israel* | 18,000 | 82 | |||
| 767 | |||||
Italy — 2.0% | |||||
ACEA | 2,697 | 31 | |||
Atlantia | 3,564 | 92 | |||
Autogrill | 1,305 | 16 | |||
Banca Intesa | 48,413 | 210 | |||
Banca Intesa RNC | 11,927 | 39 | |||
Banca Popolare di Milano | 3,717 | 29 | |||
Banco Popolare Scarl | 4,593 | 38 | |||
Benetton Group | 3,132 | 29 | |||
CIR-Compagnie Industriali Riunite | 7,958 | 19 | |||
Edison | 4,712 | 7 | |||
Enel | 48,532 | 290 | |||
Fiat | 5,922 | 87 | |||
Fondiaria-Sai | 459 | 8 | |||
Milano Assicurazioni | 4,714 | 14 | |||
Piccolo Credito Valtellinese | 1,856 | 16 | |||
Pirelli | 22,605 | 14 | |||
Prysmian | 8,220 | 138 | |||
Snam Rete Gas | 3,239 | 16 | |||
Telecom Italia | 155,737 | 241 | |||
Terna Rete Elettrica Nazionale | 8,007 | 33 | |||
UniCredito Italiano | 19,656 | 67 | |||
Unipol Gruppo Finanziario | 16,000 | 22 | |||
| 1,456 | |||||
Japan — 13.3% | |||||
77 Bank | 2,000 | 12 | |||
Aeon | 3,200 | 26 | |||
Aisin Seiki | 2,900 | 70 | |||
Ajinomoto | 3,000 | 28 | |||
Alfresa Holdings | 300 | 13 | |||
Alpen | 300 | 5 | |||
Alps Electric | 4,900 | 28 | |||
Amada | 2,000 | 12 | |||
AOKI Holdings | 300 | 3 | |||
Aoyama Trading | 300 | 4 | |||
Asahi Breweries | 1,800 | 32 | |||
Asahi Glass | 31,000 | 272 | |||
Asahi Kasei | 3,000 | 15 | |||
Astellas Pharma | 1,500 | 56 | |||
Bank of Kyoto | 1,000 | 9 | |||
Bank of Nagoya | 2,000 | 8 | |||
Bank of Yokohama | 14,000 | 68 | |||
Bridgestone | 2,500 | 40 | |||
Brother Industries | 500 | 5 | |||
Canon | 9,000 | 348 | |||
Canon Finetech | 300 | 4 | |||
Casio Computer | 1,300 | 9 | |||
Central Japan Railway | 3 | 22 | |||
Chiba Bank | 15,000 | 99 | |||
Chiba Kogyo Bank* | 300 | 2 | |||
Chugai Pharmaceutical | 2,200 | 42 | |||
Circle K Sunkus | 400 | 5 | |||
Coca-Cola Central Japan | 300 | 4 | |||
Create SD Holdings | 100 | 2 | |||
Dai Nippon Printing | 6,000 | 74 | |||
| 4 | SEI Institutional Investments Trust / Semi-Annual Report / November 30, 2009 |
Table of Contents
SCHEDULE OF INVESTMENTS (Unaudited)
Screened World Equity Ex-US Fund
November 30, 2009
Description | Shares | Market Value ($ Thousands) | |||
Daicel Chemical Industries | 9,000 | $ | 54 | ||
Daiichikosho | 300 | 4 | |||
Dainippon Screen Manufacturing | 10,000 | 36 | |||
Dainippon Sumitomo Pharma | 1,600 | 16 | |||
Daishi Bank | 3,000 | 11 | |||
Daiwa Securities Group | 21,000 | 113 | |||
DCM Japan Holdings | 100 | 1 | |||
Denki Kagaku Kogyo | 8,000 | 34 | |||
Denso | 7,200 | 202 | |||
Dentsu | 700 | 15 | |||
eAccess | 1 | 1 | |||
East Japan Railway | 100 | 7 | |||
Electric Power Development | 800 | 25 | |||
Elpida Memory* | 2,900 | 36 | |||
FamilyMart | 400 | 13 | |||
Fast Retailing | 500 | 91 | |||
Fuji Heavy Industries | 5,000 | 20 | |||
FUJIFILM Holdings | 5,300 | 145 | |||
Fujikura | 1,000 | 5 | |||
Fujitsu | 18,000 | 107 | |||
Fukuoka Financial Group | 16,000 | 58 | |||
Gunma Bank | 3,000 | 18 | |||
Hakuhodo DY Holdings | 170 | 8 | |||
Higashi-Nippon Bank | 2,000 | 4 | |||
HI-LEX | 200 | 2 | |||
Hitachi | 17,000 | 46 | |||
Hokuhoku Financial Group | 27,000 | 63 | |||
Honda Motor | 14,235 | 446 | |||
Hosiden | 400 | 4 | |||
House Foods | 500 | 8 | |||
Hoya | 2,200 | 56 | |||
Ibiden | 4,100 | 139 | |||
Idemitsu Kosan | 1,000 | 62 | |||
IHI | 5,000 | 8 | |||
Inpex | 18 | 141 | |||
Isetan Mitsukoshi Holdings | 2,200 | 19 | |||
IT Holdings | 400 | 5 | |||
Itochu Enex | 600 | 3 | |||
Itochu Techno-Solutions | 200 | 6 | |||
Itochu-Shokuhin | 200 | 7 | |||
Izumiya | 1,000 | 4 | |||
Japan Radio | 10,000 | 17 | |||
Japan Tobacco | 22 | 65 | |||
JFE Holdings | 10,200 | 336 | |||
JFE Shoji Holdings | 1,000 | 3 | |||
JS Group | 1,300 | 21 | |||
JSR | 1,700 | 33 | |||
Kamigumi | 4,000 | 32 | |||
Kaneka | 5,000 | 33 | |||
Kansai Electric Power | 1,200 | 30 | |||
KDDI | 20 | 108 | |||
Kikkoman | 1,000 | 12 | |||
Kirin Holdings | 10,000 | 164 | |||
Kohnan Shoji | 200 | 2 | |||
Komatsu | 1,400 | 28 | |||
Konica Minolta Holdings | 3,000 | 28 | |||
Kubota | 7,000 | 62 | |||
Kuraray | 3,000 | 36 | |||
Kyocera | 200 | 16 | |||
Kyoei Steel | 300 | 6 | |||
Kyorin | 1,000 | 16 | |||
Maeda | 2,000 | 5 | |||
Description | Shares | Market Value ($ Thousands) | |||
Maeda Road Construction | 2,000 | $ | 16 | ||
Makino Milling Machine | 1,000 | 3 | |||
Makita | 1,700 | 58 | |||
Marubeni | 2,000 | 11 | |||
Marui Group | 1,400 | 8 | |||
Maruichi Steel Tube | 900 | 17 | |||
Maxvalu Nishinihon | 200 | 3 | |||
Mazda Motor | 8,000 | 17 | |||
Millea Holdings | 3,000 | 87 | |||
Mitsubishi | 20,800 | 471 | |||
Mitsubishi Chemical Holdings | 6,000 | 22 | |||
Mitsubishi Electric | 13,000 | 92 | |||
Mitsubishi Heavy Industries | 3,000 | 10 | |||
Mitsubishi Materials | 1,000 | 2 | |||
Mitsubishi UFJ Financial Group | 1,700 | 9 | |||
Mitsubishi UFJ Lease & Finance | 900 | 27 | |||
Mitsui | 1,100 | 15 | |||
Mitsui Engineering & Shipbuilding | 5,000 | 12 | |||
Mitsui Home | 1,000 | 5 | |||
Mitsui Sumitomo Insurance Group Holdings | 1,300 | 34 | |||
Mizuho Securities | 7,000 | 23 | |||
Morinaga Milk Industry | 2,000 | 9 | |||
Murata Manufacturing | 2,700 | 129 | |||
Nafco | 200 | 4 | |||
Namco Bandai Holdings | 1,500 | 15 | |||
NEC | 20,000 | 51 | |||
NEC Fielding | 200 | 3 | |||
NEC Networks & System Integration | 300 | 4 | |||
NET One Systems | 2 | 2 | |||
Nidec | 800 | 70 | |||
Nikon | 900 | 16 | |||
Nippo | 1,000 | 7 | |||
Nippon Electric Glass | 12,000 | 143 | |||
Nippon Meat Packers | 2,000 | 25 | |||
Nippon Mining Holdings | 5,500 | 22 | |||
Nippon Paper Group | 1,300 | 36 | |||
Nippon Soda | 2,000 | 7 | |||
Nippon Steel | 19,000 | 71 | |||
Nippon Telegraph & Telephone | 1,700 | 74 | |||
Nipponkoa Insurance | 3,000 | 18 | |||
Nishi-Nippon City Bank | 1,000 | 3 | |||
Nissan Chemical Industries | 1,000 | 13 | |||
Nissan Motor | 34,200 | 249 | |||
Nissin Food Products | 1,400 | 51 | |||
Nitori | 921 | 77 | |||
NSK | 1,000 | 6 | |||
NTN | 18,000 | 68 | |||
NTT Data | 9 | 26 | |||
NTT DoCoMo | 62 | 94 | |||
Obic | 120 | 20 | |||
OJI Paper | 2,000 | 9 | |||
Okuwa | 1,000 | 10 | |||
Omron | 1,100 | 18 | |||
Onward Holdings | 2,000 | 13 | |||
ORIX | 850 | 59 | |||
Osaka Gas | 13,000 | 48 | |||
Osaka Steel | 200 | 3 | |||
Panasonic | 9,100 | 117 | |||
Rakuten | 190 | 154 | |||
Resona Holdings | 1,800 | 19 | |||
| 5 | SEI Institutional Investments Trust / Semi-Annual Report / November 30, 2009 |
Table of Contents
SCHEDULE OF INVESTMENTS (Unaudited)
Screened World Equity Ex-US Fund
November 30, 2009
Description | Shares | Market Value ($ Thousands) | |||
Ricoh | 2,000 | $ | 27 | ||
Roland | 200 | 2 | |||
San-Ai Oil | 2,000 | 8 | |||
San-In Godo Bank | 1,000 | 9 | |||
Sanki Engineering | 2,000 | 15 | |||
Santen Pharmaceutical | 900 | 31 | |||
Sapporo Hokuyo Holdings | 6,900 | 26 | |||
Seiko Epson | 1,200 | 19 | |||
Sekisui Jushi | 1,000 | 8 | |||
Seven & I Holdings | 3,500 | 79 | |||
Sharp | 11,000 | 126 | |||
Shimano | 600 | 25 | |||
Shinko Electric Industries | 3,200 | 45 | |||
Shiseido | 700 | 14 | |||
Sohgo Security Services | 200 | 2 | |||
So-net Entertainment | 1 | 2 | |||
Sony | 4,200 | 113 | |||
SRI Sports | 2 | 2 | |||
Stanley Electric | 2,800 | 56 | |||
Sumikin Bussan | 2,000 | 4 | |||
Sumitomo | 20,400 | 201 | |||
Sumitomo Chemical | 7,000 | 28 | |||
Sumitomo Electric Industries | 15,000 | 178 | |||
Sumitomo Metal Mining | 7,000 | 115 | |||
Sumitomo Seika Chemicals | 2,000 | 8 | |||
Sumitomo Trust & Banking | 20,000 | 107 | |||
Suzuken | 800 | 29 | |||
Suzuki Motor | 1,700 | 40 | |||
T&D Holdings | 700 | 16 | |||
Tadano | 1,000 | 4 | |||
Taisho Pharmaceutical | 1,000 | 18 | |||
Taiyo Yuden | 3,000 | 31 | |||
Takeda Pharmaceutical | 2,700 | 113 | |||
Tanabe Seiyaku | 2,000 | 26 | |||
TDK | 1,600 | 84 | |||
Teijin | 5,000 | 16 | |||
Terumo | 100 | 6 | |||
Tohoku Electric Power | 1,300 | 28 | |||
Tokyo Broadcasting System HD | 600 | 9 | |||
Tokyo Electric Power | 1,800 | 49 | |||
Tokyo Electron | 1,300 | 71 | |||
Tokyo Steel Manufacturing | 300 | 3 | |||
Toppan Forms | 500 | 5 | |||
Toppan Printing | 7,000 | 57 | |||
Toshiba | 40,000 | 213 | |||
Toshiba TEC | 2,000 | 7 | |||
Toyo Kohan | 2,000 | 9 | |||
Toyo Seikan Kaisha | 300 | 4 | |||
Toyo Suisan Kaisha | 2,000 | 55 | |||
Toyoda Gosei | 200 | 5 | |||
Toyota Motor | 10,333 | 413 | |||
Toyota Tsusho | 2,200 | 30 | |||
TV Asahi | 5 | 8 | |||
West Japan Railway | 10 | 37 | |||
Yahoo! Japan | 83 | 25 | |||
Yamaha Motor | 1,700 | 20 | |||
Yamato Holdings | 5,500 | 76 | |||
Yamato Kogyo | 500 | 16 | |||
Description | Shares | Market Value ($ Thousands) | |||
Yamazaki Baking | 2,000 | $ | 25 | ||
| 9,916 | |||||
Malaysia — 0.5% | |||||
Bumiputra-Commerce Holdings | 34,000 | 127 | |||
Genting | 20,000 | 41 | |||
PPB Group | 16,000 | 74 | |||
Proton Holdings | 14,000 | 17 | |||
Tenaga Nasional | 38,000 | 94 | |||
Titan Chemicals* | 43,000 | 15 | |||
| 368 | |||||
Mauritius — 0.1% | |||||
Golden Agri-Resources | 153,398 | 51 | |||
Mexico — 1.1% | |||||
America Movil, Ser L | 116,200 | 281 | |||
Coca-Cola Femsa, Ser L | 11,500 | 66 | |||
Embotelladoras Arca | 16,300 | 48 | |||
Grupo Aeroportuario del Pacifico, Ser B, Cl B | 11,500 | 32 | |||
Grupo Carso, Ser A1 | 7,242 | 22 | |||
Grupo Continental | 16,000 | 37 | |||
Grupo Mexico, Ser B | 61,601 | 145 | |||
Grupo Simec, Ser B, Cl B* | 9,500 | 25 | |||
Industrias, Ser B* | 8,800 | 28 | |||
Kimberly-Clark de Mexico, Cl A | 19,400 | 82 | |||
Wal-Mart de Mexico | 9,000 | 37 | |||
| 803 | |||||
Netherlands — 2.2% | |||||
Aegon | 1,775 | 13 | |||
Akzo Nobel | 4,706 | 298 | |||
ArcelorMittal | 2,705 | 105 | |||
ASML Holding | 8,796 | 270 | |||
CSM | 1,671 | 44 | |||
European Aeronautic Defense and Space | 3,399 | 61 | |||
Fugro | 271 | 15 | |||
Heineken | 543 | 26 | |||
Imtech | 1,055 | 27 | |||
Koninklijke Ahold | 6,484 | 87 | |||
Koninklijke DSM | 1,008 | 50 | |||
Koninklijke Philips Electronics | 10,390 | 284 | |||
Koninklijke Vopak* | 1,044 | 82 | |||
Randstad Holding | 1,128 | 49 | |||
Royal KPN | 3,249 | 58 | |||
SBM Offshore | 2,481 | 47 | |||
TNT | 948 | 27 | |||
Unilever | 2,304 | 71 | |||
| 1,614 | |||||
New Zealand — 0.0% | |||||
Air New Zealand | 5,300 | 5 | |||
Norway — 0.8% | |||||
BW Offshore* | 6,000 | 9 | |||
DnB | 19,940 | 224 | |||
| 6 | SEI Institutional Investments Trust / Semi-Annual Report / November 30, 2009 |
Table of Contents
SCHEDULE OF INVESTMENTS (Unaudited)
Screened World Equity Ex-US Fund
November 30, 2009
Description | Shares | Market Value ($ Thousands) | |||
Marine Harvest* | 70,000 | $ | 52 | ||
Seadrill | 5,300 | 123 | |||
Telenor | 15,200 | 207 | |||
| 615 | |||||
Papua New Guinea — 0.0% | |||||
Lihir Gold | 7,800 | 26 | |||
Peru — 0.0% | |||||
Cia de Minas Buenaventura ADR | 300 | 12 | |||
Philippines — 0.1% | |||||
San Miguel, Cl B | 31,000 | 45 | |||
Poland — 0.4% | |||||
Asseco Poland | 2,000 | 42 | |||
Gant Development* | 1,600 | 14 | |||
KGHM Polska Miedz | 1,059 | 41 | |||
Polish Oil & Gas | 48,000 | 65 | |||
Polski Koncern Naftowy Orlen | 6,000 | 68 | |||
Przedsiebiorstwo Eksportu i Importu Kopex* | 3,000 | 28 | |||
Synthos* | 104,000 | 44 | |||
| 302 | |||||
Portugal — 0.7% | |||||
Banco Comercial Portugues, Cl R | 39,000 | 52 | |||
Banco Espirito Santo | 10,801 | 75 | |||
Energias de Portugal | 10,916 | 50 | |||
Galp Energia SGPS, Cl B | 12,420 | 224 | |||
Jeronimo Martins | 2,332 | 23 | |||
Portugal Telecom | 6,051 | 73 | |||
| 497 | |||||
Russia — 0.8% | |||||
MMC Norilsk Nickel ADR* | 10,000 | 138 | |||
Mobile Telesystems ADR | 485 | 24 | |||
Novolipetsk Steel GDR | 1,110 | 34 | |||
Rosneft Oil GDR | 3,900 | 31 | |||
Sberbank GDR | 200 | 51 | |||
Sistema GDR | 1,081 | 19 | |||
Surgutneftegaz ADR | 4,600 | 41 | |||
Tatneft ADR | 4,666 | 141 | |||
Vimpel-Communications ADR | 5,890 | 112 | |||
| 591 | |||||
Singapore — 1.3% | |||||
CapitaCommercial Trust‡ | 47,000 | 39 | |||
CapitaMall Trust‡ | 28,000 | 35 | |||
DBS Group Holdings | 21,000 | 217 | |||
Fraser and Neave | 8,000 | 23 | |||
Hi-P International, Cl P | 4,000 | 2 | |||
Hong Leong Asia | 3,000 | 6 | |||
Jardine Cycle & Carriage | 4,000 | 70 | |||
Keppel | 6,000 | 35 | |||
Oversea-Chinese Banking | 19,000 | 115 | |||
SembCorp Industries | 16,000 | 43 | |||
SIA Engineering | 5,000 | 10 | |||
Description | Shares | Market Value ($ Thousands) | |||
Singapore Airlines | 2,000 | $ | 19 | ||
Singapore Telecommunications | 31,000 | 66 | |||
United Overseas Bank | 3,000 | 41 | |||
UOL Group | 8,000 | 21 | |||
Wilmar International | 52,000 | 236 | |||
| 978 | |||||
South Africa — 1.6% | |||||
African Rainbow Minerals | 3,000 | 64 | |||
AngloGold Ashanti | 2,630 | 115 | |||
Aveng | 8,000 | 40 | |||
Bidvest Group | 6,060 | 98 | |||
DataTec | 16,000 | 56 | |||
FirstRand | 7,258 | 17 | |||
Gold Fields | 8,000 | 116 | |||
Group | 5,478 | 88 | |||
Harmony Gold Mining | 6,000 | 66 | |||
Iliad Africa | 9,808 | 12 | |||
Impala Platinum Holdings | 1,200 | 28 | |||
Investec | 5,000 | 38 | |||
Medi-Clinic | 22,000 | 69 | |||
Naspers, Cl N | 1,000 | 37 | |||
Nedbank Group | 4,000 | 61 | |||
Sanlam | 36,000 | 107 | |||
Standard Bank Group | 12,000 | 155 | |||
Steinhoff International Holdings | 16,640 | 40 | |||
| 1,207 | |||||
South Korea — 2.3% | |||||
GS Home Shopping | 160 | 11 | |||
Hana Financial Group | 3,160 | 91 | |||
Hanwha Chemical | 1,430 | 15 | |||
Hyundai Mobis | 949 | 122 | |||
Hyundai Securities | 1,760 | 21 | |||
Hyundai Steel | 1,280 | 85 | |||
KISWIRE | 240 | 7 | |||
Korea Electric Power | 4,300 | 118 | |||
Korea Zinc | 300 | 55 | |||
KT&G | 150 | 9 | |||
LG | 1,680 | 92 | |||
LG Chemical | 740 | 133 | |||
LG Dacom | 1,090 | 17 | |||
LG Electronics | 1,530 | 136 | |||
LG.Philips LCD | 3,890 | 107 | |||
Lotte Shopping | 240 | 74 | |||
Namyang Dairy Products | 30 | 13 | |||
POSCO | 100 | 48 | |||
Samsung Electronics | 520 | 322 | |||
Samsung SDI | 570 | 62 | |||
Shinhan Financial Group | 380 | 15 | |||
SK Energy | 1,050 | 98 | |||
SK Holdings | 670 | 49 | |||
Woori Investment & Securities | 2,560 | 33 | |||
| 1,733 | |||||
Spain — 3.7% | |||||
Banco Bilbao Vizcaya Argentaria | 27,711 | 522 | |||
Banco Popular Espanol | 3,058 | 26 | |||
Banco Santander Central Hispano | 56,283 | 964 | |||
Gas Natural | 1,837 | 38 | |||
Iberdrola | 5,101 | 48 | |||
Mapfre | 10,000 | 44 | |||
| 7 | SEI Institutional Investments Trust / Semi-Annual Report / November 30, 2009 |
Table of Contents
SCHEDULE OF INVESTMENTS (Unaudited)
Screened World Equity Ex-US Fund
November 30, 2009
Description | Shares | Market Value ($ Thousands) | |||
Repsol | 6,400 | $ | 176 | ||
Sacyr Vallehermoso | 900 | 13 | |||
Telefonica | 32,423 | 931 | |||
| 2,762 | |||||
Sweden — 2.1% | |||||
Alliance Oil* | 2,113 | 31 | |||
Assa Abloy, Cl B | 11,860 | 217 | |||
Boliden | 4,527 | 57 | |||
Electrolux, Cl B | 7,720 | 188 | |||
Hennes & Mauritz, Cl B | 609 | 36 | |||
Nordea Bank | 15,110 | 156 | |||
PA Resources* | 14,869 | 55 | |||
Svenska Cellulosa, Cl B | 20,793 | 286 | |||
Svenska Handelsbanken, Cl A | 4,424 | 127 | |||
Swedbank | 5,009 | 48 | |||
Swedish Match | 1,199 | 26 | |||
Telefonaktiebolaget LM Ericsson, Cl B | 21,808 | 209 | |||
TeliaSonera | 12,612 | 89 | |||
| 1,525 | |||||
Switzerland — 7.4% | |||||
Actelion* | 904 | 53 | |||
Adecco | 1,262 | 63 | |||
Baloise Holding | 945 | 79 | |||
Banque Cantonale Vaudoise | 40 | 16 | |||
Compagnie Financiere Richemont | 2,056 | 67 | |||
Credit Suisse Group | 15,610 | 808 | |||
Helvetia Holding | 123 | 38 | |||
Holcim* | 3,421 | 246 | |||
Julius Baer Group | 1,127 | 37 | |||
Kuehne + Nagel International | 194 | 19 | |||
Lindt & Spruengli | 6 | 14 | |||
Nestle | 16,750 | 792 | |||
Novartis | 19,768 | 1,097 | |||
Pargesa Holding | 184 | 15 | |||
Roche Holding | 3,452 | 565 | |||
Sonova Holding | 203 | 24 | |||
Swatch Group, Cl B | 485 | 122 | |||
Swatch Group | 920 | 44 | |||
Swiss Life Holding | 336 | 41 | |||
Swiss Reinsurance | 1,959 | 93 | |||
Swisscom | 446 | 174 | |||
Syngenta | 348 | 92 | |||
Synthes | 331 | 44 | |||
UBS | 2,785 | 43 | |||
Vontobel Holding | 614 | 19 | |||
Xstrata | 36,841 | 646 | |||
Zurich Financial Services | 1,010 | 218 | |||
| 5,469 | |||||
Taiwan — 2.7% | |||||
Acer | 43,430 | 108 | |||
Advanced Semiconductor Engineering | 41,000 | 32 | |||
Asustek Computer | 58,012 | 115 | |||
AU Optronics | 122,000 | 125 | |||
Cheng Loong | 25,000 | 9 | |||
China Bills Finance* | 40,000 | 11 | |||
Chunghwa Telecom | 138,358 | 248 | |||
Compal Electronics | 72,822 | 97 | |||
Description | Shares | Market Value ($ Thousands) | |||
CTCI | 15,204 | $ | 14 | ||
Far EasTone Telecommunications | 24,000 | 28 | |||
Gigabyte Technology | 15,000 | 14 | |||
HON HAI Precision Industry | 62,600 | 264 | |||
Lite-On Technology | 57,000 | 76 | |||
Mega Financial Holding | 160,000 | 90 | |||
POU Chen | 19,000 | 14 | |||
Quanta Computer | 44,853 | 91 | |||
Shihlin Electric & Engineering | 13,000 | 16 | |||
Siliconware Precision Industries | 18,000 | 24 | |||
Taishin Financial Holding | 158,000 | 59 | |||
Taiwan Cooperative Bank | 105,000 | 65 | |||
Taiwan Semiconductor Manufacturing | 156,769 | 298 | |||
United Microelectronics | 228,000 | 112 | |||
Universal Scientific Industrial | 27,000 | 17 | |||
Wistron | 41,734 | 77 | |||
Yageo | 53,000 | 15 | |||
| 2,019 | |||||
Thailand — 0.3% | |||||
Airports of Thailand | 33,000 | 37 | |||
Bangkok Bank NVDR | 29,000 | 99 | |||
Kasikornbank | 11,000 | 29 | |||
Krung Thai Bank NVDR | 82,000 | 22 | |||
Thanachart Capital | 37,000 | 24 | |||
| 211 | |||||
Turkey — 0.6% | |||||
Eczacibasi Ilac Sanayi | 48,000 | 58 | |||
Haci Omer Sabanci Holding | 7,920 | 27 | |||
KOC Holding* | 24,000 | 58 | |||
Petrol Ofisi* | 5,250 | 18 | |||
Turk Hava Yollari | 31,660 | 100 | |||
Turk Sise ve Cam Fabrikalari | 30,609 | 30 | |||
Turkiye Garanti Bankasi | 40,044 | 134 | |||
Turkiye Vakiflar Bankasi Tao, Cl D | 26,000 | 52 | |||
| 477 | |||||
United Kingdom — 13.3% | |||||
3i Group | 7,627 | 34 | |||
Aegis Group | 6,081 | 11 | |||
Amec | 8,605 | 112 | |||
Amlin | 5,703 | 35 | |||
Anglo American | 9,536 | 407 | |||
Antofagasta | 5,510 | 81 | |||
Arriva | 3,000 | 23 | |||
AstraZeneca | 16,606 | 740 | |||
Autonomy* | 2,624 | 61 | |||
Aviva | 30,523 | 185 | |||
Babcock International Group | 5,562 | 57 | |||
BAE Systems | 2,361 | 13 | |||
Balfour Beatty | 4,102 | 17 | |||
Barclays | 107,310 | 515 | |||
Berkeley Group Holdings* | 1,249 | 18 | |||
BG Group | 18,551 | 336 | |||
BHP Billiton | 13,930 | 425 | |||
BP | 101,507 | 957 | |||
British American Tobacco | 15,275 | 463 | |||
BT Group, Cl A(A) | 33,286 | 77 | |||
Cadbury | 2,064 | 27 | |||
Cape* | 2,000 | 7 | |||
| 8 | SEI Institutional Investments Trust / Semi-Annual Report / November 30, 2009 |
Table of Contents
SCHEDULE OF INVESTMENTS (Unaudited)
Screened World Equity Ex-US Fund
November 30, 2009
Description | Shares | Market Value ($ Thousands) | |||
Carnival | 1,397 | $ | 47 | ||
Catlin Group | 7,594 | 38 | |||
Centrica | 50,000 | 209 | |||
Charter International | 2,432 | 29 | |||
Diageo | 5,466 | 92 | |||
Dimension Data Holdings | 11,449 | 14 | |||
easyJet* | 4,000 | 24 | |||
Eurasian Natural Resources | 6,780 | 96 | |||
Firstgroup | 9,753 | 63 | |||
Fresnillo | 3,566 | 49 | |||
GlaxoSmithKline | 29,938 | 618 | |||
Home Retail Group | 15,954 | 77 | |||
HSBC Holdings | 8,000 | 93 | |||
Imperial Tobacco Group | 7,001 | 203 | |||
Inchcape | 169,550 | 77 | |||
Informa | 1,698 | 8 | |||
International Power | 11,033 | 50 | |||
Invensys | 9,299 | 43 | |||
Investec | 2,142 | 15 | |||
ITV | 34,255 | 29 | |||
Kazakhmys | 5,506 | 111 | |||
Kier Group | 313 | 5 | |||
Kingfisher | 34,653 | 135 | |||
Legal & General Group | 78,736 | 100 | |||
Lloyds Banking Group | 38,741 | 35 | |||
LogicaCMG | 13,639 | 26 | |||
London Stock Exchange Group | 1,250 | 15 | |||
Marks & Spencer Group | 7,125 | 45 | |||
Meggitt | 6,000 | 24 | |||
Millennium & Copthorne Hotels | 2,724 | 16 | |||
Mondi | 2,167 | 12 | |||
National Express Group | 1,615 | 4 | |||
National Grid | 11,562 | 125 | |||
Next | 1,745 | 57 | |||
Old Mutual | 109,539 | 204 | |||
Persimmon | 6,030 | 41 | |||
Prudential | 15,867 | 163 | |||
QinetiQ | 9,000 | 23 | |||
Reckitt Benckiser Group | 4,221 | 215 | |||
Rio Tinto | 10,791 | 547 | |||
Rolls-Royce Group | 4,911 | 38 | |||
Royal & Sun Alliance Insurance Group | 11,025 | 21 | |||
Royal Bank of Scotland Group | 61,610 | 34 | |||
SABMiller | 3,861 | 112 | |||
Sage Group | 27,606 | 97 | |||
Salamander Energy* | 1,836 | 8 | |||
Schroders | 1,834 | 35 | |||
Scottish & Southern Energy | 1,002 | 18 | |||
Severn Trent | 1,812 | 31 | |||
Shire | 5,227 | 102 | |||
Standard Life | 9,000 | 31 | |||
Taylor Woodrow | 54,055 | 31 | |||
Tesco | 26,340 | 183 | |||
Thomas Cook Group | 8,243 | 29 | |||
Tomkins | 12,809 | 36 | |||
Travis Perkins | 4,853 | 60 | |||
Unilever | 2,679 | 78 | |||
Vodafone Group | 169,129 | 380 | |||
WM Morrison Supermarkets | 9,844 | 44 | |||
Description | Shares | Market Value ($ Thousands) | |||
WPP | 13,900 | $ | 130 | ||
| 9,876 | |||||
United States — 0.1% | |||||
Thomson Reuters (CAD) | 2,100 | 67 | |||
Total Common Stock | 69,447 | ||||
PREFERRED STOCK — 2.7% | |||||
Brazil — 2.5% | |||||
Banco Bradesco | 6,600 | 138 | |||
Banco Daycoval | 1,800 | 9 | |||
Bombril* | 1,000 | 4 | |||
Centrais Eletricas Brasileiras, Cl B | 4,000 | 58 | |||
Cia de Bebidas das Americas | 2,000 | 192 | |||
Cia Paranaense de Energia | 5,000 | 97 | |||
Cia Vale do Rio Doce, Cl A | 21,900 | 531 | |||
Confab Industrial | 7,600 | 22 | |||
Ferbasa-Ferro Ligas DA Bahia | 1,700 | 11 | |||
Gerdau | 9,000 | 140 | |||
Investimentos Itau | 3,200 | 21 | |||
Itau Unibanco Holding | 8,000 | 174 | |||
NET Servicos de Comunicacao* | 6,200 | 86 | |||
Parana Banco | 1,300 | 7 | |||
Sao Paulo Alpargatas | 100 | 6 | |||
Telecomunicacoes de Sao Paulo | 2,300 | 57 | |||
Telegraph Norte Celular Participacoes | 300 | 5 | |||
Telemar Norte Leste | 2,300 | 84 | |||
Universo Online | 1,400 | 7 | |||
Usinas Siderurgicas de Minas Gerais, Cl A | 4,200 | 123 | |||
Vivo Participacoes | 3,100 | 93 | |||
| 1,865 | |||||
France — 0.0% | |||||
Bureau Veritas | 275 | 14 | |||
Germany — 0.2% | |||||
Bayerische Motoren Werke | 611 | 20 | |||
Porsche Automobil Holding | 466 | 33 | |||
ProSiebenSat.1 Media | 3,869 | 50 | |||
Volkswagen | 249 | 21 | |||
| 124 | |||||
Total Preferred Stock | 2,003 | ||||
Number Of | |||||
RIGHTS — 0.0% | |||||
Belgium — 0.0% | |||||
Fortis, Expires 07/01/14 (A)(C)(D) | 6,068 | — | |||
Italy — 0.0% | |||||
Piccolo Credito Valtellinese, Expires 01/02/10 | 1,856 | 1 | |||
| 9 | SEI Institutional Investments Trust / Semi-Annual Report / November 30, 2009 |
Table of Contents
SCHEDULE OF INVESTMENTS (Unaudited)
Screened World Equity Ex-US Fund
November 30, 2009
Description | Shares/Face Amount ($ Thousands) | Market Value ($ Thousands) | ||||
Norway — 0.0% | ||||||
DnB, Expires 12/14/09 | 4,430 | $ | 12 | |||
Spain — 0.0% | ||||||
Mapfre, Expires 12/04/09 | 10,000 | — | ||||
United Kingdom — 0.0% | ||||||
Lloyds Banking Group, Expires 12/15/09 | 51,912 | 15 | ||||
National Express Group, Expires 12/16/09 | 3,768 | 4 | ||||
| 19 | ||||||
Total Rights | 32 | |||||
| Number Of Warrants | ||||||
WARRANTS — 0.0% | ||||||
Singapore — 0.0% | ||||||
Golden Agri-Resources, Expires 05/29/12 * | 5,951 | 1 | ||||
Italy — 0.0% | ||||||
Mediobanca, Expires 2011 | 759 | — | ||||
Total Warrants | 1 | |||||
U.S. TREASURY OBLIGATION — 1.2% | ||||||
U.S. Treasury Bills 0.130%, 12/03/09 (B)(E) | $ | 925 | 925 | |||
Total U.S. Treasury Obligation | 925 | |||||
CASH EQUIVALENT — 1.5% | ||||||
SEI Daily Income Trust, Prime Obligation Fund, Cl A** † 0.130%, | 1,098,507 | 1,099 | ||||
Total Cash Equivalent | 1,099 | |||||
Total Investments — 98.7% | $ | 73,507 | ||||
A summary of the open futures contracts held by the Fund at November 30, 2009, is as follows:
| Type of Contract | Number of Contracts Long | Expiration Date | Unrealized Appreciation (Depreciation) ($ Thousands) | |||||
DJ Euro Stoxx 50 Index | 19 | Dec-2009 | $ | 20 | ||||
FTSE 100 Index | 6 | Dec-2009 | 18 | |||||
Hang Seng Index | 1 | Dec-2009 | 0 | |||||
S&P/TSE 60 Index | 1 | Dec-2009 | 7 | |||||
SPI 200 Index | 1 | Dec-2009 | 2 | |||||
Topix Index | 5 | Dec-2009 | (23 | ) | ||||
| $ | 24 | |||||||
For the year ended November 30, 2009, the total amount of all open futures contracts, as presented in the table above, are representative of the volume of activity for this derivative type during the period.
Percentages are based on a Net Assets of $74,441 ($ Thousands)
| * | Non-income producing security. |
| ** | Rate shown is the 7-day effective yield as of November 30, 2009. |
| † | Investment in Affiliated Security (See Note 5) |
| ‡ | Real Estate Investment Trust |
| (A) | Security fair valued using methods determined in good faith by the Valuation Committee of the Board of Trustees. The total market value of such securities as of November 30, 2009 was $77 ($ Thousands) and represented 0.10% of Net Assets. |
| (B) | The rate reported on the Schedule of Investments is the effective yield at time of purchase. |
| (C) | Security considered restricted. The total value of such security as of November 30, 2009 was $0 and represented 0.00% of net assets. |
| (D) | Security considered illiquid. The total value of such security as of November 30, 2009 was $0 and represented 0.00% of net assets. |
| (E) | Security, or a portion thereof, has been pledged as collateral on open futures contracts. |
ADR — American Depositary Receipt
CAD — Canadian Dollar
Cl — Class
GDR — Global Depositary Receipt
LIBOR — London Interbank Offered Rate
NVDR — Non-Voting Depositary Receipt
Ser — Series
USD — U.S. Dollar
Amounts designated as "—" are $O or have been rounded to $O.
DJ — Dow Jones
FTSE — Financial Times and the London Stock Exchange
S&P — Standard & Poor’s
SPI — Share Price Index
TSE — Toronto Stock Exchange
| 10 | SEI Institutional Investments Trust / Semi-Annual Report / November 30, 2009 |
Table of Contents
| Item 7. | Disclosure of Proxy Voting Policies and Procedures for Closed-End Management Investment Companies. |
Not applicable.
| Item 8. | Portfolio Managers of Closed-End Management Investment Companies. |
Not applicable.
| Item 9. | Purchases of Equity Securities by Closed-End Management Company and Affiliated Purchasers. |
Not applicable.
| Item 10. | Submission of Matters to a Vote of Security Holders. |
The Registrant has a standing Governance Committee (the “Committee”) currently consisting of the Independent Trustees. The Committee is responsible for evaluating and recommending nominees for election to the Registrant’s Board of Trustees (the “Board”). Pursuant to the Committee’s Charter, adopted on June 18th 2004, as amended, the Committee will review all shareholder recommendations for nominations to fill vacancies on the Board if such recommendations are submitted in writing and addressed to the Committee at the Registrant’s office.
| Item 11. | Controls and Procedures. |
(a) The Registrant’s principal executive and principal financial officers, or persons performing similar functions, have concluded that the Registrant’s disclosure controls and procedures (as defined in Rule 30a-3(c) under the Investment Company Act of 1940 (the “1940 Act”)) are effective, based on the evaluation of these controls and procedures required by Rule 30a-3(b) under the 1940 Act and Rules 13a-15(b) or 15d-15(b) under the Securities Exchange Act of 1934 as of a date within 90 days of the filing date of this report.
(b) There were no changes in the Registrant’s internal control over financial reporting (as defined in Rule 30a-3(d) under the 1940 Act) that occurred during the first fiscal quarter of the period covered by this report that have materially affected, or are reasonably likely to materially affect, the Registrants internal control over financial reporting.
| Items 12. | Exhibits. |
(a)(1) Not applicable for semi-annual report.
(a)(2) A separate certification for the principal executive officer and the principal financial officer of the Registrant as required by Rule 30a-2(a) under the Investment Company Act of 1940, as amended (17 CFR 270.30a-2(a)), are filed herewith.
(b) Officer certifications as required by Rule 30a-2(b) under the Investment Company Act of 1940, as amended (17 CFR 270.30a-2(b)) also accompany this filing as an exhibit.
Table of Contents
SIGNATURES
Pursuant to the requirements of the Securities Exchange Act of 1934 and the Investment Company Act of 1940, the Registrant has duly caused this report to be signed on its behalf by the undersigned, thereunto duly authorized.
| SEI Institutional Investments Trust | ||
| By | /S/ ROBERT A. NESHER | |
| Robert A. Nesher, President & CEO | ||
Date: January 29, 2010 | ||
Pursuant to the requirements of the Securities Exchange Act of 1934 and the Investment Company Act of 1940, this report has been signed below by the following persons on behalf of the registrant and in the capacities and on the dates indicated.
| By | /S/ ROBERT A. NESHER | |
| Robert A. Nesher, President & CEO | ||
| Date: January 29, 2010 | ||
| By | /S/ STEPHEN F. PANNER | |
| Stephen F. Panner, Controller & CFO | ||
| Date: January 29, 2010 | ||