UNITED STATES
SECURITIES AND EXCHANGE COMMISSION
Washington, D.C. 20549
FORM N-CSR
CERTIFIED SHAREHOLDER REPORT OF REGISTERED
MANAGEMENT INVESTMENT COMPANIES
Investment Company Act file number 811-07257
SEI Institutional Investments Trust
(Exact name of registrant as specified in charter)
SEI Investments
One Freedom Valley Drive
Oaks, PA 19456
(Address of principal executive offices) (Zip code)
CT Corporation
155 Federal Street
Boston, MA 02110
(Name and address of agent for service)
Registrant’s telephone number, including area code: 1-800-342-5734
Date of fiscal year end: May 31, 2017
Date of reporting period: November 30, 2016
| Item 1. | Reports to Stockholders. |

November 30, 2016
SEMI-ANNUAL REPORT
SEI Institutional Investments Trust
➤ Large Cap Fund
➤ Large Cap Diversified Alpha Fund
➤ Large Cap Disciplined Equity Fund
➤ Large Cap Index Fund
➤ S&P 500 Index Fund
➤ Extended Market Index Fund
➤ Small Cap Fund
➤ Small Cap II Fund
➤ Small/Mid Cap Equity Fund
➤ U.S. Managed Volatility Fund
➤ Global Managed Volatility Fund
➤ World Equity Ex-US Fund
➤ Screened World Equity Ex-US Fund
➤ Emerging Markets Equity Fund
➤ Opportunistic Income Fund
➤ Core Fixed Income Fund
➤ High Yield Bond Fund
➤ Long Duration Fund
➤ Long Duration Credit Fund
➤ Ultra Short Duration Bond Fund
➤ Emerging Markets Debt Fund
➤ Real Return Fund
➤ Limited Duration Bond Fund
➤ Intermediate Duration Credit Fund
➤ Dynamic Asset Allocation Fund
➤ Multi-Asset Real Return Fund

The Trust files its complete schedule of portfolio holdings with the Securities and Exchange Commission for the first and third quarter of each fiscal year on Form N-Q within sixty days after the end of the period. The Trust’s Forms N-Q are available on the Commission’s website at http://www.sec.gov, and may be reviewed and copied at the Commission’s Public Reference Room in Washington, DC. Information on the operation of the Public Reference Room may be obtained by calling 1-800-SEC-0330.
A description of the policies and procedures that the Trust uses to determine how to vote proxies relating to portfolio securities, as well as information relating to how a Fund voted proxies relating to portfolio securities during the most recent 12-month period ended June 30, is available (i) without charge, upon request, by calling 1-800-DIAL-SEI; and (ii) on the Commission’s website at http://www.sec.gov.
SUMMARY SCHEDULE OF INVESTMENTS (Unaudited)
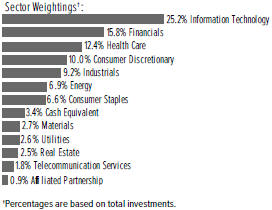
Large Cap Fund
November 30, 2016
| Description | Percentage of Net Assets (%) | Shares | Market Value ($ Thousands) | |||||||||
COMMON STOCK†† — 96.5% |
| |||||||||||
Consumer Discretionary — 10.1% |
| |||||||||||
Amazon.com* | 0.9 | % | 22,408 | $ | 16,819 | |||||||
Liberty Interactive QVC Group, Cl A* | 0.7 | 639,985 | 13,254 | |||||||||
Starbucks | 0.7 | 244,120 | 14,152 | |||||||||
TripAdvisor* | 0.8 | 334,988 | 16,173 | |||||||||
Other Securities (A) | 7.0 | 138,646 | ||||||||||
|
| |||||||||||
| 199,044 | ||||||||||||
|
| |||||||||||
Consumer Staples — 6.6% |
| |||||||||||
Costco Wholesale | 0.8 | 100,830 | 15,136 | |||||||||
Estee Lauder, Cl A | 0.5 | 134,721 | 10,468 | |||||||||
Philip Morris International | 0.6 | 127,588 | 11,263 | |||||||||
Other Securities (A) | 4.7 | 93,868 | ||||||||||
|
| |||||||||||
| 130,735 | ||||||||||||
|
| |||||||||||
Energy — 7.0% |
| |||||||||||
Chevron | 0.7 | 128,977 | 14,389 | |||||||||
Exxon Mobil | 1.0 | 224,103 | 19,564 | |||||||||
Halliburton | 0.6 | 207,489 | 11,016 | |||||||||
Valero Energy | 0.6 | 202,059 | 12,439 | |||||||||
Other Securities (A) | 4.1 | 80,515 | ||||||||||
|
| |||||||||||
| 137,923 | ||||||||||||
|
| |||||||||||
Financials — 15.9% |
| |||||||||||
American International Group | 0.9 | 286,415 | 18,139 | |||||||||
Bank of America | 1.3 | 1,213,408 | 25,627 | |||||||||
Citigroup | 1.2 | 406,368 | 22,915 | |||||||||
Intercontinental Exchange | 0.6 | 203,445 | 11,271 | |||||||||
JPMorgan Chase | 2.1 | 511,423 | 41,001 | |||||||||
SunTrust Banks | 0.6 | 223,032 | 11,586 | |||||||||
Wells Fargo | 0.7 | 277,680 | 14,695 | |||||||||
Other Securities‡ | 8.5 | 169,723 | ||||||||||
|
| |||||||||||
| 314,957 | ||||||||||||
|
| |||||||||||
Health Care — 12.5% |
| |||||||||||
Alexion Pharmaceuticals* | 0.9 | 139,228 | 17,068 | |||||||||
Allergan | 0.8 | 75,752 | 14,719 | |||||||||
Biogen* | 0.6 | 42,368 | 12,459 | |||||||||
Celgene* | 0.9 | 149,897 | 17,764 | |||||||||
Danaher | 0.6 | 157,841 | 12,338 | |||||||||
| Description | Percentage of Net Assets (%) | Shares | Market Value ($ Thousands) | |||||||||
Intuitive Surgical* | 0.6 | % | 17,511 | $ | 11,272 | |||||||
Johnson & Johnson | 1.3 | 234,096 | 26,055 | |||||||||
Pfizer | 0.9 | 580,362 | 18,653 | |||||||||
Shire ADR | 0.5 | 61,108 | 10,669 | |||||||||
Other Securities | 5.4 | 106,667 | ||||||||||
|
| |||||||||||
| 247,664 | ||||||||||||
|
| |||||||||||
Industrials — 9.2% |
| |||||||||||
United Continental Holdings* | 0.5 | 153,960 | 10,616 | |||||||||
Other Securities | 8.7 | 172,058 | ||||||||||
|
| |||||||||||
| 182,674 | ||||||||||||
|
| |||||||||||
Information Technology — 25.4% |
| |||||||||||
Adobe Systems* | 0.9 | 176,248 | 18,120 | |||||||||
Alphabet, Cl A* | 1.4 | 35,275 | 27,369 | |||||||||
Alphabet, Cl C* | 1.1 | 27,839 | 21,103 | |||||||||
Amphenol, Cl A | 0.6 | 179,870 | 12,278 | |||||||||
Applied Materials | 0.7 | 419,554 | 13,510 | |||||||||
Cisco Systems | 0.5 | 347,170 | 10,353 | |||||||||
eBay* | 0.9 | 651,944 | 18,131 | |||||||||
Electronic Arts* | 0.6 | 149,230 | 11,825 | |||||||||
Facebook, Cl A* | 1.7 | 289,249 | 34,253 | |||||||||
Intel | 0.8 | 483,826 | 16,789 | |||||||||
Intuit | 0.6 | 97,053 | 11,033 | |||||||||
MasterCard, Cl A | 1.0 | 202,168 | 20,662 | |||||||||
Microsoft | 1.9 | 607,971 | 36,636 | |||||||||
NXP Semiconductor* | 0.6 | 111,819 | 11,087 | |||||||||
PayPal Holdings* | 1.3 | 659,264 | 25,896 | |||||||||
QUALCOMM | 1.1 | 309,660 | 21,097 | |||||||||
salesforce.com* | 0.5 | 142,060 | 10,228 | |||||||||
Visa, Cl A | 1.9 | 479,850 | 37,102 | |||||||||
Other Securities (A) | 7.3 | 145,928 | ||||||||||
|
| |||||||||||
| 503,400 | ||||||||||||
|
| |||||||||||
Materials — 2.7% |
| |||||||||||
Ecolab | 0.6 | 94,609 | 11,044 | |||||||||
Other Securities | 2.1 | 42,657 | ||||||||||
|
| |||||||||||
| 53,701 | ||||||||||||
|
| |||||||||||
Real Estate — 2.6% |
| |||||||||||
Crown Castle International‡ | 0.7 | 157,567 | 13,150 | |||||||||
Other Securities‡ | 1.9 | 37,539 | ||||||||||
|
| |||||||||||
| 50,689 | ||||||||||||
|
| |||||||||||
Telecommunication Services — 1.9% |
| |||||||||||
AT&T | 0.7 | 335,262 | 12,951 | |||||||||
Verizon Communications | 0.8 | 295,546 | 14,748 | |||||||||
Other Securities | 0.4 | 9,160 | ||||||||||
|
| |||||||||||
| 36,859 | ||||||||||||
|
| |||||||||||
Utilities — 2.6% |
| |||||||||||
Other Securities | 2.6 | 51,304 | ||||||||||
|
| |||||||||||
Total Common Stock | 1,908,950 | |||||||||||
|
| |||||||||||
| SEI Institutional Investments Trust / Semi-Annual Report / November 30, 2016 | 1 |
SUMMARY SCHEDULE OF INVESTMENTS (Unaudited)
Large Cap Fund (Concluded)
November 30, 2016
| Description | Percentage of Net Assets (%) | Shares | Market Value ($ Thousands) | |||||||||
AFFILIATED PARTNERSHIP — 0.9% |
| |||||||||||
SEI Liquidity Fund, L.P. | ||||||||||||
0.470%**† (B) | 0.9 | % | 19,233,399 | $ | 19,234 | |||||||
|
| |||||||||||
Total Affiliated Partnership | 19,234 | |||||||||||
|
| |||||||||||
CASH EQUIVALENT — 3.4% |
| |||||||||||
SEI Daily Income Trust, Government Fund, Cl A | ||||||||||||
0.210%**† | 3.4 | 67,937,184 | 67,937 | |||||||||
|
| |||||||||||
Total Cash Equivalent | 67,937 | |||||||||||
|
| |||||||||||
Total Investments — 100.8% |
| $ | 1,996,121 | |||||||||
|
| |||||||||||
A list of the open futures contracts held by the Fund at November 30, 2016, is as follows:
| Type of Contract | Number of Contracts Long | Expiration Date | Unrealized Appreciation ($ Thousands) | |||||||||
S&P 500 Index E-MINI | 77 | Dec-2016 | $ | 323 | ||||||||
S&P Mid Cap 400 Index E-MINI | 6 | Dec-2016 | 77 | |||||||||
|
| |||||||||||
| $ | 400 | |||||||||||
|
| |||||||||||
Percentages are based on a Net Assets of $1,979,550 ($ Thousands).
| * | Non-income producing security. |
| ** | The rate reported is the 7-day effective yield as of November 30, 2016. |
| ‡ | Real Estate Investment Trust. |
| † | Investment in Affiliated Security (see Note 6). |
| †† | Narrow Industries are utilized for compliance purposes, whereas broad sectors are utilized for reporting purposes. |
| (A) | Certain securities or partial positions of certain securities are on loan at November 30, 2016, (see Note 12). The total market value of securities on loan at November 30, 2016, was $19,084 ($ Thousands). |
| (B) | This security was purchased with cash collateral held from securities on loan (see Note 12). The total market value of such securities as of November 30, 2016 was $19,234 ($ Thousands). |
ADR — American Depositary Receipt
Cl — Class
L.P. — Limited Partnership
S&P — Standard & Poor’s
The Summary Schedule of Investments does not reflect the complete portfolio holdings. It includes the Fund’s 50 largest holdings and each investment of any issuer that exceeds 1% of the Fund’s net assets. “Other Securities” represent all issues not required to be disclosed under the rules adopted by the U.S. Securities and Exchange Commission (“SEC”). In certain instances, securities for which footnotes listed above may otherwise apply are included in the Other Securities caption. The complete schedule of portfolio holdings is available (i) without charge, upon request, by calling (800) 342-5734; and (ii) on the SEC’s website at http://www.sec.gov.
The following is a list of the level of inputs used as of November 30, 2016, in valuing the Fund’s investments carried at value ($ Thousands):
| Investments in Securities | Level 1 | Level 2 | Level 3 | Total | ||||||||||||
Common Stock | $ | 1,908,950 | $ | — | $ | — | $ | 1,908,950 | ||||||||
Affiliated Partnership | — | 19,234 | — | 19,234 | ||||||||||||
Cash Equivalent | 67,937 | — | — | 67,937 | ||||||||||||
|
|
|
|
|
|
|
| |||||||||
Total Investments in Securities | $ | 1,976,887 | $ | 19,234 | $ | — | $ | 1,996,121 | ||||||||
|
|
|
|
|
|
|
| |||||||||
| Other Financial Instruments | Level 1 | Level 2 | Level 3 | Total | ||||||||||||
Futures Contracts* | ||||||||||||||||
Unrealized Appreciation | $ | 400 | $ | — | $ | — | $ | 400 | ||||||||
|
|
|
|
|
|
|
| |||||||||
| * | Futures contracts are valued at the unrealized appreciation on the instrument. |
For the period ended November 30, 2016, there were no transfers between Level 1 and Level 2 assets and liabilities.
For the period ended November 30, 2016, there were no transfers between Level 2 and Level 3 assets and liabilities.
For more information on valuation inputs, see Note 2 — Significant Accounting Policies in Notes to Financial Statements.
Amounts designated as “—” are either $0 or have been rounded to $0.
The accompanying notes are an integral part of the financial statements
| 2 | SEI Institutional Investments Trust / Semi-Annual Report / November 30, 2016 |
SUMMARY SCHEDULE OF INVESTMENTS (Unaudited)
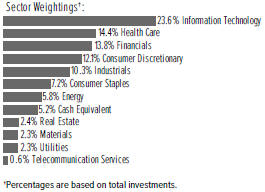
Large Cap Diversified Alpha Fund
November 30, 2016
| Description | Percentage of Net Assets (%) | Shares | Market Value ($ Thousands) | |||||||||
COMMON STOCK — 94.6% |
| |||||||||||
Consumer Discretionary — 12.1% |
| |||||||||||
Dollar General | 1.1 | % | 7,573 | $ | 586 | |||||||
General Motors | 0.6 | 9,892 | 342 | |||||||||
L Brands | 1.0 | 7,528 | 529 | |||||||||
Liberty Interactive QVC Group, Cl A* | 0.9 | 23,640 | 490 | |||||||||
Omnicom Group | 0.9 | 5,995 | 521 | |||||||||
TripAdvisor* | 0.6 | 7,274 | 351 | |||||||||
Other Securities | 7.0 | 3,854 | ||||||||||
|
| |||||||||||
| 6,673 | ||||||||||||
|
| |||||||||||
Consumer Staples — 7.2% |
| |||||||||||
CVS Health | 0.9 | 6,093 | 469 | |||||||||
JM Smucker | 0.7 | 2,992 | 377 | |||||||||
Kroger | 0.8 | 13,247 | 428 | |||||||||
Procter & Gamble | 0.9 | 6,022 | 497 | |||||||||
Other Securities | 3.9 | 2,207 | ||||||||||
|
| |||||||||||
| 3,978 | ||||||||||||
|
| |||||||||||
Energy — 5.8% |
| |||||||||||
BP PLC ADR | 0.9 | 14,637 | 513 | |||||||||
Occidental Petroleum | 0.9 | 7,105 | 507 | |||||||||
Other Securities | 4.0 | 2,161 | ||||||||||
|
| |||||||||||
| 3,181 | ||||||||||||
|
| |||||||||||
Financials — 13.8% |
| |||||||||||
Aflac | 0.6 | 4,892 | 349 | |||||||||
Bank of America | 1.6 | 41,104 | 868 | |||||||||
Citigroup | 1.4 | 13,498 | 761 | |||||||||
Intercontinental Exchange | 1.0 | 10,000 | 554 | |||||||||
JPMorgan Chase | 1.2 | 8,513 | 683 | |||||||||
KKR (A) | 0.6 | 23,028 | 352 | |||||||||
State Street | 1.2 | 8,708 | 686 | |||||||||
Other Securities‡ (A) | 6.2 | 3,367 | ||||||||||
|
| |||||||||||
| 7,620 | ||||||||||||
|
| |||||||||||
Health Care — 14.3% |
| |||||||||||
Allergan | 1.0 | 2,937 | 571 | |||||||||
Baxter International | 0.6 | 7,783 | 345 | |||||||||
Becton Dickinson | 0.9 | 2,974 | 503 | |||||||||
Biogen* | 1.4 | 2,663 | 783 | |||||||||
Celgene* | 1.5 | 7,062 | 837 | |||||||||
| Description | Percentage of Net Assets (%) | Shares | Market Value ($ Thousands) | |||||||||
Gilead Sciences | 1.0 | % | 7,372 | $ | 543 | |||||||
Johnson & Johnson | 1.3 | 6,447 | 718 | |||||||||
Merck | 0.7 | 6,690 | 409 | |||||||||
Quintiles IMS Holdings* | 1.0 | 7,011 | 539 | |||||||||
UnitedHealth Group | 1.1 | 3,747 | 593 | |||||||||
Other Securities | 3.8 | 2,069 | ||||||||||
|
| |||||||||||
| 7,910 | ||||||||||||
|
| |||||||||||
Industrials — 10.3% |
| |||||||||||
3M | 1.0 | 3,295 | 566 | |||||||||
Delta Air Lines | 0.9 | 10,638 | 513 | |||||||||
Illinois Tool Works | 0.8 | 3,506 | 439 | |||||||||
Nielsen Holdings | 0.8 | 9,900 | 427 | |||||||||
WW Grainger | 1.2 | 2,898 | 668 | |||||||||
Other Securities | 5.6 | 3,046 | ||||||||||
|
| |||||||||||
| 5,659 | ||||||||||||
|
| |||||||||||
Information Technology — 23.5% |
| |||||||||||
Alphabet, Cl A* | 1.7 | 1,239 | 961 | |||||||||
Alphabet, Cl C* | 0.6 | 400 | 303 | |||||||||
Applied Materials | 0.7 | 11,556 | 372 | |||||||||
Automatic Data Processing | 0.6 | 3,657 | 351 | |||||||||
Cisco Systems | 0.7 | 13,621 | 406 | |||||||||
eBay* | 1.3 | 25,315 | 704 | |||||||||
Electronic Arts* | 0.9 | 6,304 | 500 | |||||||||
Facebook, Cl A* | 1.1 | 5,273 | 624 | |||||||||
Intel | 0.8 | 12,321 | 428 | |||||||||
Intuit | 0.6 | 3,004 | 342 | |||||||||
MasterCard, Cl A | 1.0 | 5,431 | 555 | |||||||||
Microsoft | 2.0 | 18,212 | 1,097 | |||||||||
PayPal Holdings* | 1.3 | 18,728 | 736 | |||||||||
Qualcomm | 1.6 | 13,251 | 903 | |||||||||
Symantec | 0.9 | 21,191 | 517 | |||||||||
Visa, Cl A | 1.4 | 9,773 | 756 | |||||||||
Other Securities | 6.3 | 3,444 | ||||||||||
|
| |||||||||||
| 12,999 | ||||||||||||
|
| |||||||||||
Materials — 2.3% |
| |||||||||||
Other Securities | 2.3 | 1,271 | ||||||||||
|
| |||||||||||
Real Estate — 2.4% |
| |||||||||||
Crown Castle International‡ | 1.3 | 8,780 | 733 | |||||||||
Other Securities‡ | 1.1 | 577 | ||||||||||
|
| |||||||||||
| 1,310 | ||||||||||||
|
| |||||||||||
Telecommunication Services — 0.6% |
| |||||||||||
Other Securities | 0.6 | 351 | ||||||||||
|
| |||||||||||
Utilities — 2.3% |
| |||||||||||
Other Securities | 2.3 | 1,267 | ||||||||||
|
| |||||||||||
Total Common Stock |
| 52,219 | ||||||||||
|
| |||||||||||
| SEI Institutional Investments Trust / Semi-Annual Report / November 30, 2016 | 3 |
SUMMARY SCHEDULE OF INVESTMENTS (Unaudited)
Large Cap Diversified Alpha Fund (Concluded)
November 30, 2016
| Description | Percentage of Net Assets (%) | Shares | Market Value ($ Thousands) | |||||||||
CASH EQUIVALENT — 5.2% |
| |||||||||||
SEI Daily Income Trust, Government Fund, Cl A 0.210%**† | 5.2 | % | 2,861,536 | $ | 2,862 | |||||||
|
| |||||||||||
Total Cash Equivalent |
| 2,862 | ||||||||||
|
| |||||||||||
Total Investments — 99.8% |
| $ | 55,081 | |||||||||
|
| |||||||||||
A list of the open futures contracts held by the Fund at November 30, 2016, is as follows:
| Type of Contract | Number of Contracts Long | Expiration Date | Unrealized Appreciation ($ Thousands) | |||||||||
S&P 500 Index E-MINI | 1 | Dec-2016 | $ | 1 | ||||||||
|
| |||||||||||
For the period ended November 30, 2016, the total amount of all open futures contracts, as presented in the table above, are representative of the volume of activity for this derivative type during the period.
Percentages are based on a Net Assets of $55,190 ($ Thousands).
| * | Non-income producing security. |
| ** | The rate reported is the 7-day effective yield as of November 30, 2016. |
| ‡ | Real Estate Investment Trust. |
| † | Investment in Affiliated Security (see Note 6). |
| (A) | Certain securities are Master Limited Partnerships. At November 30, 2016, such securities amounted to $552 ($ Thousands), or 1.00% of Net Assets (See Note 2). |
ADR — American Depositary Receipt
Cl — Class
PLC — Public Limited Company
S&P — Standard & Poor’s
The Summary Schedule of Investments does not reflect the complete portfolio holdings. It includes the Fund’s 50 largest holdings and each investment of any issuer that exceeds 1% of the Fund’s net assets. “Other Securities” represent all issues not required to be disclosed under the rules adopted by the U.S. Securities and Exchange Commission (“SEC”). In certain instances, securities for which footnotes listed above may otherwise apply are included in the Other Securities caption. The complete schedule of portfolio holdings is available (i) without charge, upon request, by calling (800) 342-5734; and (ii) on the SEC’s website at http://www.sec.gov.
The following is a list of the level of inputs used as of November 30, 2016, in valuing the Fund’s investments and other financial instruments carried at value ($ Thousands):
| Investments in Securities | Level 1 | Level 2 | Level 3 | Total | ||||||||||||
Common Stock | $ | 52,219 | $ | — | $ | — | $ | 52,219 | ||||||||
Cash Equivalent | 2,862 | — | — | 2,862 | ||||||||||||
|
|
|
|
|
|
|
| |||||||||
Total Investments in Securities | $ | 55,081 | $ | — | $ | — | $ | 55,081 | ||||||||
|
|
|
|
|
|
|
| |||||||||
| Other Financial Instruments | Level 1 | Level 2 | Level 3 | Total | ||||||||||||
Futures Contracts * | ||||||||||||||||
Unrealized Appreciation | $ | 1 | $ | — | $ | — | $ | 1 | ||||||||
|
|
|
|
|
|
|
| |||||||||
| * | Futures contracts are valued at the unrealized appreciation on the instrument. |
For the period ended November 30, 2016, there were no transfers between Level 1 and Level 2 assets and liabilities.
For the period ended November 30, 2016, there were no transfers between Level 2 and Level 3 assets and liabilities.
For more information on valuation inputs, see Note 2 — Significant Accounting Policies in Notes to Financial Statements.
Amounts designated as “—” are either $0 or have been rounded to $0.
The accompanying notes are an integral part of the financial statements
| 4 | SEI Institutional Investments Trust / Semi-Annual Report / November 30, 2016 |
SUMMARY SCHEDULE OF INVESTMENTS (Unaudited)
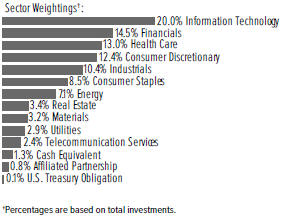
Large Cap Disciplined Equity Fund
November 30, 2016
| Description | Percentage of Net Assets (%) | Shares | Market Value ($ Thousands) | |||||||||
COMMON STOCK — 96.5% |
| |||||||||||
Consumer Discretionary — 10.5% |
| |||||||||||
Amazon.com* | 0.7 | % | 33,118 | $ | 24,857 | |||||||
AutoZone* | 0.6 | 26,512 | 20,764 | |||||||||
Comcast, Cl A | 1.7 | 848,420 | 58,974 | |||||||||
Home Depot | 0.9 | 250,411 | 32,403 | |||||||||
McDonald’s | 0.9 | 268,346 | 32,006 | |||||||||
Other Securities (A) | 5.7 | 202,714 | ||||||||||
|
| |||||||||||
| 371,718 | ||||||||||||
|
| |||||||||||
Consumer Staples — 9.9% |
| |||||||||||
Altria Group | 1.0 | 523,627 | 33,476 | |||||||||
Coca-Cola | 0.6 | 529,422 | 21,362 | |||||||||
Kraft Heinz | 0.5 | 225,962 | 18,450 | |||||||||
Molson Coors Brewing, Cl B | 0.5 | 175,795 | 17,233 | |||||||||
Mondelez International, Cl A | 0.7 | 550,450 | 22,701 | |||||||||
PepsiCo | 1.5 | 527,918 | 52,845 | |||||||||
Philip Morris International | 0.9 | 373,067 | 32,934 | |||||||||
Procter & Gamble | 0.9 | 385,411 | 31,781 | |||||||||
Wal-Mart Stores | 0.6 | 298,412 | 21,017 | |||||||||
Other Securities (A) | 2.7 | 98,089 | ||||||||||
|
| |||||||||||
| 349,888 | ||||||||||||
|
| |||||||||||
Energy — 6.2% |
| |||||||||||
Chevron | 0.8 | 251,824 | 28,094 | |||||||||
ConocoPhillips | 0.5 | 385,704 | 18,714 | |||||||||
Exxon Mobil | 0.8 | 343,863 | 30,019 | |||||||||
Schlumberger | 0.6 | 233,553 | 19,630 | |||||||||
Other Securities (A) (B) | 3.5 | 123,292 | ||||||||||
|
| |||||||||||
| 219,749 | ||||||||||||
|
| |||||||||||
Financials — 12.9% |
| |||||||||||
Bank of America | 1.5 | 2,504,500 | 52,895 | |||||||||
Berkshire Hathaway, Cl B* | 1.2 | 265,214 | 41,755 | |||||||||
Citigroup | 1.2 | 768,332 | 43,326 | |||||||||
CME Group, Cl A | 0.6 | 187,619 | 21,184 | |||||||||
JPMorgan Chase | 0.8 | 348,455 | 27,936 | |||||||||
US Bancorp | 0.7 | 464,639 | 23,055 | |||||||||
Other Securities‡ | 6.9 | 247,364 | ||||||||||
|
| |||||||||||
| 457,515 | ||||||||||||
|
| |||||||||||
| Description | Percentage of Net Assets (%) | Shares | Market Value ($ Thousands) | |||||||||
Health Care — 13.8% |
| |||||||||||
Amgen | 0.7 | % | 161,669 | $ | 23,292 | |||||||
Celgene* | 0.7 | 212,520 | 25,186 | |||||||||
Express Scripts Holding* | 0.7 | 327,428 | 24,845 | |||||||||
Johnson & Johnson | 1.8 | 588,969 | 65,552 | |||||||||
Merck | 0.9 | 521,651 | 31,920 | |||||||||
Pfizer | 1.5 | 1,602,205 | 51,495 | |||||||||
UnitedHealth Group | 1.2 | 263,864 | 41,775 | |||||||||
Other Securities (A) | 6.3 | 226,819 | ||||||||||
|
| |||||||||||
| 490,884 | ||||||||||||
|
| |||||||||||
Industrials — 11.2% |
| |||||||||||
3M | 0.6 | 128,562 | 22,079 | |||||||||
General Electric | 1.2 | 1,369,934 | 42,139 | |||||||||
Honeywell International | 0.8 | 239,797 | 27,322 | |||||||||
United Technologies | 0.6 | 205,801 | 22,169 | |||||||||
Other Securities (A) | 8.0 | 284,558 | ||||||||||
|
| |||||||||||
| 398,267 | ||||||||||||
|
| |||||||||||
Information Technology — 21.2% |
| |||||||||||
Accenture, Cl A | 0.6 | 168,595 | 20,135 | |||||||||
Alphabet, Cl A* | 1.4 | 63,409 | 49,198 | |||||||||
Alphabet, Cl C* | 1.6 | 74,725 | 56,645 | |||||||||
Amdocs | 0.5 | 310,381 | 18,303 | |||||||||
Apple | 3.1 | 985,841 | 108,955 | |||||||||
Applied Materials | 0.7 | 746,684 | 24,043 | |||||||||
Cisco Systems | 1.4 | 1,630,247 | 48,614 | |||||||||
eBay* | 0.7 | 882,535 | 24,543 | |||||||||
Facebook, Cl A* | 1.4 | 424,755 | 50,300 | |||||||||
Intel | 0.9 | 872,549 | 30,277 | |||||||||
Microsoft | 1.7 | 996,974 | 60,078 | |||||||||
Oracle | 0.8 | 662,100 | 26,610 | |||||||||
Other Securities (A) | 6.4 | 235,618 | ||||||||||
|
| |||||||||||
| 753,319 | ||||||||||||
|
| |||||||||||
Materials — 2.6% |
| |||||||||||
Other Securities (A) | 2.6 | 92,716 | ||||||||||
|
| |||||||||||
Real Estate — 2.3% |
| |||||||||||
Other Securities‡ (A) | 2.3 | 81,797 | ||||||||||
|
| |||||||||||
Telecommunication Services — 2.7% |
| |||||||||||
AT&T | 1.2 | 1,128,925 | 43,610 | |||||||||
Verizon Communications | 1.5 | 1,028,433 | 51,319 | |||||||||
Other Securities (A) | 0.0 | 1,158 | ||||||||||
|
| |||||||||||
| 96,087 | ||||||||||||
|
| |||||||||||
Utilities — 3.2% |
| |||||||||||
PG&E | 0.5 | 317,291 | 18,657 | |||||||||
Other Securities (B) | 2.7 | 96,462 | ||||||||||
|
| |||||||||||
| 115,119 | ||||||||||||
|
| |||||||||||
| SEI Institutional Investments Trust / Semi-Annual Report / November 30, 2016 | 5 |
SUMMARY SCHEDULE OF INVESTMENTS (Unaudited)
Large Cap Disciplined Equity Fund (Concluded)
November 30, 2016
| Description | Percentage of Net Assets (%) | Shares | Market Value ($ Thousands) | |||||||||
Total Common Stock |
| $ | 3,427,059 | |||||||||
|
| |||||||||||
RIGHTS — 0.0% |
| |||||||||||
United States — 0.0% |
| |||||||||||
Other Securities | 0.0 | % | 91 | |||||||||
|
| |||||||||||
Total Rights |
| 91 | ||||||||||
|
| |||||||||||
U.S. TREASURY OBLIGATION — 0.0% |
| |||||||||||
Other Securities (C) | 0.0 | 200 | ||||||||||
|
| |||||||||||
Total U.S. Treasury Obligation |
| 200 | ||||||||||
|
| |||||||||||
AFFILIATED PARTNERSHIP — 0.6% |
| |||||||||||
SEI Liquidity Fund, L.P. | 0.5 | 20,864,164 | 20,865 | |||||||||
|
| |||||||||||
Total Affiliated Partnership |
| 20,865 | ||||||||||
|
| |||||||||||
CASH EQUIVALENT — 4.6% |
| |||||||||||
SEI Daily Income Trust, Government Fund, Cl A 0.210%**† | 4.7 | 165,409,465 | 165,409 | |||||||||
|
| |||||||||||
Total Cash Equivalent |
| 165,409 | ||||||||||
|
| |||||||||||
Total Investments — 101.7% |
| $ | 3,613,624 | |||||||||
|
| |||||||||||
A list of the open futures contracts held by the Fund at November 30, 2016, is as follows:
| Type of Contract | Number of Contracts Long | Expiration Date | Unrealized Appreciation ($ Thousands) | |||||||||
S&P 500 Index E-MINI | 160 | Dec-2016 | $ | 356 | ||||||||
|
| |||||||||||
For the period ended November 30, 2016, the total amount of all open futures contracts, as presented in the table above, are representative of the volume of activity for this derivative type during the year.
Percentages are based on a Net Assets of $3,551,854 ($ Thousands).
| * | Non-income producing security. |
| ** | The rate reported is the 7-day effective yield as of November 30, 2016. |
| ‡ | Real Estate Investment Trust. |
| † | Investment in Affiliated Security (see Note 6). |
| (A) | Certain securities or partial positions of certain securities are on loan at November 30, 2016, (see Note 12). The total market value of securities on loan at November 30, 2016, was $20,511 ($ Thousands). |
| (B) | Certain securities are Master Limited Partnerships. At November 30, 2016, such securities amounted to $9,181 ($ Thousands), or 0.26% of Net Assets (See Note 2). |
| (C) | Security, or portion thereof, has been pledged as collateral on open futures contracts. |
| (D) | This security was purchased with cash collateral held from securities on loan (see Note 12). The total market value of such securities as of November 30, 2016 was $20,865 ($ Thousands). |
Cl — Class
L.P. — Limited Partnership
S&P — Standard & Poor’s
The Summary Schedule of Investments does not reflect the complete portfolio holdings. It includes the Fund’s 50 largest holdings and each investment of any issuer that exceeds 1% of the Fund’s net assets. “Other Securities” represent all issues not required to be disclosed under the rules adopted by the U.S. Securities and Exchange Commission (“SEC”). In certain instances, securities for which footnotes listed above may otherwise apply are included in the Other Securities caption. The complete schedule of portfolio holdings is available (i) without charge, upon request, by calling (800) 342-5734; and (ii) on the SEC’s website at http://www.sec.gov.
The following is a list of the level of inputs used as of November 30, 2016, in valuing the Fund’s investments and other financial instruments carried at value ($ Thousands):
| Investments in Securities | Level 1 | Level 2 | Level 3 | Total | ||||||||||||
Common Stock | $ | 3,427,059 | $ | — | $ | — | $ | 3,427,059 | ||||||||
Rights | — | 91 | — | 91 | ||||||||||||
U.S. Treasury Obligation | — | 200 | — | 200 | ||||||||||||
Affiliated Partnership | — | 20,865 | — | 20,865 | ||||||||||||
Cash Equivalent | 165,409 | — | — | 165,409 | ||||||||||||
|
|
|
|
|
|
|
| |||||||||
Total Investments in Securities | $ | 3,592,468 | $ | 21,156 | $ | — | $ | 3,613,624 | ||||||||
|
|
|
|
|
|
|
| |||||||||
| Other Financial Instruments | Level 1 | Level 2 | Level 3 | Total | ||||||||||||
Futures Contracts* | ||||||||||||||||
Unrealized Appreciation | $ | 356 | $ | — | $ | — | $ | 356 | ||||||||
|
|
|
|
|
|
|
| |||||||||
| * | Futures contracts are valued at the unrealized appreciation on the instrument. |
For the period ended November 30, 2016, there were no transfers between Level 1 and Level 2 assets and liabilities.
For the period ended November 30, 2016, there were no transfers between Level 2 and Level 3 assets and liabilities.
For more information on valuation inputs, see Note 2 — Significant Accounting Policies in Notes to Financial Statements.
Amounts designated as “—” are either $0 or have been rounded to $0.
The accompanying notes are an integral part of the financial statements
| 6 | SEI Institutional Investments Trust / Semi-Annual Report / November 30, 2016 |
SUMMARY SCHEDULE OF INVESTMENTS (Unaudited)
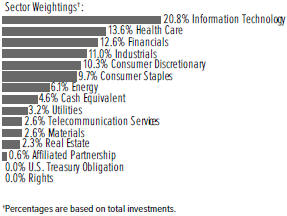
Large Cap Index Fund
November 30, 2016
| Description | Percentage of Net Assets (%) | Shares | Market Value ($ Thousands) | |||||||||
COMMON STOCK — 98.0% |
| |||||||||||
Consumer Discretionary — 12.4% |
| |||||||||||
Amazon.com* | 1.4 | % | 39,889 | $ | 29,940 | |||||||
Comcast, Cl A | 0.8 | 247,625 | 17,212 | |||||||||
Home Depot | 0.8 | 127,915 | 16,552 | |||||||||
McDonald’s | 0.5 | 90,680 | 10,815 | |||||||||
Walt Disney | 0.8 | 166,772 | 16,530 | |||||||||
Other Securities (A) | 8.1 | 183,826 | ||||||||||
|
| |||||||||||
| 274,875 | ||||||||||||
|
| |||||||||||
Consumer Staples — 8.5% |
| |||||||||||
Altria Group | 0.6 | 201,440 | 12,878 | |||||||||
Coca-Cola | 0.7 | 400,540 | 16,162 | |||||||||
PepsiCo | 0.7 | 148,552 | 14,870 | |||||||||
Philip Morris International | 0.6 | 159,468 | 14,078 | |||||||||
Procter & Gamble | 1.0 | 262,754 | 21,667 | |||||||||
Wal-Mart Stores | 0.5 | 155,979 | 10,986 | |||||||||
Other Securities (A) | 4.4 | 96,801 | ||||||||||
|
| |||||||||||
| 187,442 | ||||||||||||
|
| |||||||||||
Energy — 7.1% |
| |||||||||||
Chevron | 1.0 | 193,002 | 21,531 | |||||||||
Exxon Mobil | 1.7 | 427,138 | 37,289 | |||||||||
Schlumberger | 0.6 | 143,455 | 12,057 | |||||||||
Other Securities (A) | 3.8 | 86,628 | ||||||||||
|
| |||||||||||
| 157,505 | ||||||||||||
|
| |||||||||||
Financials — 14.5% |
| |||||||||||
Bank of America | 1.0 | 1,055,063 | 22,283 | |||||||||
Berkshire Hathaway, Cl B* | 1.4 | 193,800 | 30,512 | |||||||||
Citigroup | 0.8 | 301,804 | 17,019 | |||||||||
Goldman Sachs Group | 0.4 | 39,875 | 8,744 | |||||||||
JPMorgan Chase | 1.4 | 373,234 | 29,922 | |||||||||
SEI† | 0.0 | 13,042 | 615 | |||||||||
Wells Fargo | 1.1 | 468,766 | 24,807 | |||||||||
Other Securities‡ (A) | 8.4 | 187,512 | ||||||||||
|
| |||||||||||
| 321,414 | ||||||||||||
|
| |||||||||||
Health Care — 13.0% |
| |||||||||||
AbbVie | 0.5 | 166,961 | 10,151 | |||||||||
Amgen | 0.5 | 77,458 | 11,159 | |||||||||
| Description | Percentage of Net Assets (%) | Shares | Market Value ($ Thousands) | |||||||||
Bristol-Myers Squibb | 0.4 | % | 172,459 | $ | 9,734 | |||||||
Celgene* | 0.4 | 79,360 | 9,405 | |||||||||
Gilead Sciences | 0.5 | 136,734 | 10,077 | |||||||||
Johnson & Johnson | 1.4 | 281,609 | 31,343 | |||||||||
Medtronic | 0.5 | 144,726 | 10,566 | |||||||||
Merck | 0.8 | 284,743 | 17,423 | |||||||||
Pfizer | 0.9 | 617,122 | 19,834 | |||||||||
UnitedHealth Group | 0.7 | 96,420 | 15,265 | |||||||||
Other Securities (A) | 6.4 | 142,631 | ||||||||||
|
| |||||||||||
| 287,588 | ||||||||||||
|
| |||||||||||
Industrials — 10.5% |
| |||||||||||
3M | 0.5 | 60,733 | 10,430 | |||||||||
Boeing | 0.4 | 61,591 | 9,273 | |||||||||
General Electric | 1.3 | 943,406 | 29,019 | |||||||||
Honeywell International | 0.4 | 78,690 | 8,966 | |||||||||
Union Pacific | 0.4 | 87,232 | 8,839 | |||||||||
United Technologies | 0.4 | 80,290 | 8,649 | |||||||||
Other Securities (A) | 7.1 | 155,694 | ||||||||||
|
| |||||||||||
| 230,870 | ||||||||||||
|
| |||||||||||
Information Technology — 20.0% |
| |||||||||||
Alphabet, Cl A* | 1.1 | 30,129 | 23,376 | |||||||||
Alphabet, Cl C* | 1.1 | 30,399 | 23,044 | |||||||||
Apple | 2.8 | 560,825 | 61,982 | |||||||||
Cisco Systems | 0.7 | 517,727 | 15,439 | |||||||||
Facebook, Cl A* | 1.2 | 230,100 | 27,248 | |||||||||
Intel | 0.8 | 485,758 | 16,856 | |||||||||
International Business Machines | 0.7 | 90,498 | 14,681 | |||||||||
MasterCard, Cl A | 0.5 | 99,500 | 10,169 | |||||||||
Microsoft | 2.1 | 775,400 | 46,726 | |||||||||
Oracle | 0.6 | 304,720 | 12,247 | |||||||||
QUALCOMM | 0.5 | 151,659 | 10,333 | |||||||||
Visa, Cl A | 0.7 | 196,000 | 15,155 | |||||||||
Other Securities (A) | 7.2 | 164,428 | ||||||||||
|
| |||||||||||
| 441,684 | ||||||||||||
|
| |||||||||||
Materials — 3.2% |
| |||||||||||
Other Securities (A) | 3.2 | 70,228 | ||||||||||
|
| |||||||||||
Real Estate — 3.5% |
| |||||||||||
Other Securities‡ | 3.5 | 76,425 | ||||||||||
|
| |||||||||||
Telecommunication Services — 2.4% |
| |||||||||||
AT&T | 1.1 | 632,051 | 24,416 | |||||||||
Verizon Communications | 0.9 | 418,876 | 20,902 | |||||||||
Other Securities (A) | 0.4 | 7,536 | ||||||||||
|
| |||||||||||
| 52,854 | ||||||||||||
|
| |||||||||||
Utilities — 2.9% |
| |||||||||||
Other Securities | 2.9 | 64,731 | ||||||||||
|
| |||||||||||
Total Common Stock | 2,165,616 | |||||||||||
|
| |||||||||||
| SEI Institutional Investments Trust / Semi-Annual Report / November 30, 2016 | 7 |
SUMMARY SCHEDULE OF INVESTMENTS (Unaudited)
Large Cap Index Fund (Concluded)
November 30, 2016
| Description | Percentage of Net Assets (%) | Shares | Market Value ($ Thousands) | |||||||||
U.S. TREASURY OBLIGATION — 0.1% |
| |||||||||||
Other Securities (B) | 0.1 | % | $ | 2,362 | ||||||||
|
| |||||||||||
Total U.S. Treasury Obligation |
| 2,362 | ||||||||||
|
| |||||||||||
AFFILIATED PARTNERSHIP — 0.8% |
| |||||||||||
SEI Liquidity Fund, L.P. 0.470%**† (C) | 0.8 | 18,469,274 | 18,470 | |||||||||
|
| |||||||||||
Total Affiliated Partnership |
| 18,470 | ||||||||||
|
| |||||||||||
CASH EQUIVALENT — 1.3% |
| |||||||||||
SEI Daily Income Trust, Government Fund, Cl A 0.210%**† | 1.3 | 28,105,926 | 28,106 | |||||||||
|
| |||||||||||
Total Cash Equivalent |
| 28,106 | ||||||||||
|
| |||||||||||
Total Investments — 100.2% |
| $ | 2,214,554 | |||||||||
|
| |||||||||||
A list of the open futures contracts held by the Fund at November 30, 2016, is as follows:
| Type of Contract | Number of Contracts Long | Expiration Date | Unrealized Appreciation ($ Thousands) | |||||||||
S&P 500 Index E-MINI | 358 | Dec-2016 | $ | 969 | ||||||||
S&P Mid Cap 400 Index E-MINI | 29 | Dec-2016 | 244 | |||||||||
|
| |||||||||||
| $ | 1,213 | |||||||||||
|
| |||||||||||
For the period ended November 30, 2016, the total amount of all open futures contracts, as presented in the table above, are representative of the volume of activity for this derivative type during the period.
Percentages are based on a Net Assets of $2,208,536 ($ Thousands).
| * | Non-income producing security. |
| ** | The rate reported is the 7-day effective yield as of November 30, 2016. |
| ‡ | Real Estate Investment Trust. |
| † | Investment in Affiliated Security (see Note 6). |
| (A) | Certain securities or partial positions of certain securities are on loan at November 30, 2016, (see Note 12). The total market value of securities on loan at November 30, 2016, was $18,216 ($ Thousands). |
| (B) | Security, or portion thereof, has been pledged as collateral on open futures contracts. |
| (C) | This security was purchased with cash collateral held from securities on loan (see Note 12). The total market value of such securities as of November 30, 2016 was $18,470 ($ Thousands). |
Cl — Class
L.P. — Limited Partnership
S&P — Standard & Poor’s
The Summary Schedule of Investments does not reflect the complete portfolio holdings. It includes the Fund’s 50 largest holdings and each investment of any issuer that exceeds 1% of the Fund’s net assets. “Other Securities” represent all issues not required to be disclosed under the rules adopted by the U.S. Securities and Exchange Commission (“SEC”). In certain instances, securities for which footnotes listed above may otherwise apply are included in the Other Securities caption. The complete schedule of portfolio holdings is available (i) without charge, upon request, by calling (800) 342-5734; and (ii) on the SEC’s website at http://www.sec.gov.
The following is a list of the level of inputs used as of November 30, 2016, in valuing the Fund’s investments and other financial instruments carried at value ($ Thousands):
| Investments in Securities | Level 1 | Level 2 | Level 3 | Total | ||||||||||||
Common Stock | $ | 2,165,616 | $ | — | $ | — | $ | 2,165,616 | ||||||||
U.S. Treasury Obligation | — | 2,362 | — | 2,362 | ||||||||||||
Affiliated Partnership | — | 18,470 | — | 18,470 | ||||||||||||
Cash Equivalent | 28,106 | — | — | 28,106 | ||||||||||||
|
|
|
|
|
|
|
| |||||||||
Total Investments in Securities | $ | 2,193,722 | $ | 20,832 | $ | — | $ | 2,214,554 | ||||||||
|
|
|
|
|
|
|
| |||||||||
| Other Financial Instruments | Level 1 | Level 2 | Level 3 | Total | ||||||||||||
Futures Contracts * | ||||||||||||||||
Unrealized Appreciation | $ | 1,213 | $ | — | $ | — | $ | 1,213 | ||||||||
|
|
|
|
|
|
|
| |||||||||
| * | Futures contracts are valued at the unrealized appreciation on the instrument. |
For the period ended November 30, 2016, there were no transfers between Level 1 and Level 2 assets and liabilities.
For the period ended November 30, 2016, there were no transfers between Level 2 and Level 3 assets and liabilities.
For more information on valuation inputs, see Note 2 — Significant Accounting Policies in Notes to Financial Statements.
Amounts designated as “—” are either $0 or have been rounded to $0.
The accompanying notes are an integral part of the financial statements
| 8 | SEI Institutional Investments Trust / Semi-Annual Report / November 30, 2016 |
SUMMARY SCHEDULE OF INVESTMENTS (Unaudited)
S&P 500 Index Fund
November 30, 2016

| Description | Percentage of Net Assets (%) | Shares | Market Value ($ Thousands) | |||||||||
COMMON STOCK — 97.4% |
| |||||||||||
Consumer Discretionary — 12.0% |
| |||||||||||
Amazon.com* | 1.5 | % | 73,860 | $ | 55,437 | |||||||
Comcast, Cl A | 0.9 | 450,974 | 31,347 | |||||||||
Home Depot | 0.8 | 231,987 | 30,019 | |||||||||
McDonald’s | 0.5 | 160,187 | 19,106 | |||||||||
Starbucks | 0.4 | 275,182 | 15,952 | |||||||||
Walt Disney | 0.8 | 277,583 | 27,514 | |||||||||
Other Securities (A) | 7.1 | 260,156 | ||||||||||
|
| |||||||||||
| 439,531 | ||||||||||||
|
| |||||||||||
Consumer Staples — 9.0% |
| |||||||||||
Altria Group | 0.6 | 366,783 | 23,448 | |||||||||
Coca-Cola | 0.8 | 729,257 | 29,426 | |||||||||
PepsiCo | 0.7 | 270,178 | 27,045 | |||||||||
Philip Morris International | 0.7 | 291,178 | 25,705 | |||||||||
Procter & Gamble | 1.1 | 501,067 | 41,318 | |||||||||
Wal-Mart Stores | 0.5 | 284,483 | 20,036 | |||||||||
Other Securities | 4.6 | 163,176 | ||||||||||
|
| |||||||||||
| 330,154 | ||||||||||||
|
| |||||||||||
Energy — 7.3% |
| |||||||||||
Chevron | 1.1 | 354,178 | 39,512 | |||||||||
Exxon Mobil | 1.9 | 778,700 | 67,981 | |||||||||
Schlumberger | 0.6 | 261,066 | 21,943 | |||||||||
Other Securities (A) | 3.7 | 138,611 | ||||||||||
|
| |||||||||||
| 268,047 | ||||||||||||
|
| |||||||||||
Financials — 14.3% |
| |||||||||||
Bank of America | 1.1 | 1,915,983 | 40,466 | |||||||||
Berkshire Hathaway, Cl B* | 1.5 | 356,528 | 56,132 | |||||||||
Citigroup | 0.8 | 545,457 | 30,758 | |||||||||
JPMorgan Chase | 1.5 | 678,257 | 54,376 | |||||||||
Wells Fargo | 1.2 | 852,648 | 45,122 | |||||||||
Other Securities | 8.2 | 295,342 | ||||||||||
|
| |||||||||||
| 522,196 | ||||||||||||
|
| |||||||||||
Health Care — 13.4% |
| |||||||||||
AbbVie | 0.5 | 305,678 | 18,585 | |||||||||
Amgen | 0.5 | 140,491 | 20,241 | |||||||||
Bristol-Myers Squibb | 0.5 | 313,583 | 17,699 | |||||||||
| Description | Percentage of Net Assets (%) | Shares | Market Value ($ Thousands) | |||||||||
Celgene* | 0.5 | % | 145,487 | $ | 17,242 | |||||||
Gilead Sciences | 0.5 | 247,678 | 18,254 | |||||||||
Johnson & Johnson | 1.6 | 513,770 | 57,183 | |||||||||
Medtronic | 0.5 | 259,361 | 18,936 | |||||||||
Merck | 0.9 | 519,170 | 31,768 | |||||||||
Pfizer | 1.0 | 1,138,835 | 36,602 | |||||||||
UnitedHealth Group | 0.8 | 178,787 | 28,306 | |||||||||
Other Securities | 6.1 | 224,926 | ||||||||||
|
| |||||||||||
| 489,742 | ||||||||||||
|
| |||||||||||
Industrials — 10.2% |
| |||||||||||
3M | 0.5 | 113,391 | 19,474 | |||||||||
Boeing | 0.4 | 108,891 | 16,395 | |||||||||
General Electric | 1.4 | 1,682,688 | 51,759 | |||||||||
Honeywell International | 0.4 | 142,787 | 16,269 | |||||||||
Union Pacific | 0.4 | 156,287 | 15,837 | |||||||||
United Technologies | 0.4 | 146,091 | 15,737 | |||||||||
Other Securities (A) | 6.7 | 237,516 | ||||||||||
|
| |||||||||||
| 372,987 | ||||||||||||
|
| |||||||||||
Information Technology — 20.3% |
| |||||||||||
Alphabet, Cl A* | 1.2 | 55,341 | 42,938 | |||||||||
Alphabet, Cl C* | 1.1 | 55,463 | 42,043 | |||||||||
Apple | 3.1 | 1,011,946 | 111,840 | |||||||||
Cisco Systems | 0.8 | 944,243 | 28,157 | |||||||||
Facebook, Cl A* | 1.4 | 436,178 | 51,652 | |||||||||
Intel | 0.8 | 888,152 | 30,819 | |||||||||
International Business Machines | 0.7 | 163,251 | 26,483 | |||||||||
MasterCard, Cl A | 0.5 | 179,947 | 18,391 | |||||||||
Microsoft | 2.4 | 1,463,404 | 88,185 | |||||||||
Oracle | 0.6 | 564,965 | 22,706 | |||||||||
QUALCOMM | 0.5 | 276,578 | 18,843 | |||||||||
Visa, Cl A | 0.7 | 354,170 | 27,384 | |||||||||
Other Securities (A) | 6.5 | 232,451 | ||||||||||
|
| |||||||||||
| 741,892 | ||||||||||||
|
| |||||||||||
Materials — 2.8% |
| |||||||||||
Other Securities | 2.8 | 103,843 | ||||||||||
|
| |||||||||||
Real Estate — 2.7% |
| |||||||||||
Other Securities‡ | 2.7 | 98,208 | ||||||||||
|
| |||||||||||
Telecommunication Services — 2.4% |
| |||||||||||
AT&T | 1.2 | 1,155,143 | 44,623 | |||||||||
Verizon Communications | 1.0 | 765,352 | 38,191 | |||||||||
Other Securities (A) | 0.2 | 6,238 | ||||||||||
|
| |||||||||||
| 89,052 | ||||||||||||
|
| |||||||||||
Utilities — 3.0% |
| |||||||||||
Other Securities | 3.0 | 109,700 | ||||||||||
|
| |||||||||||
Total Common Stock |
| 3,565,352 | ||||||||||
|
| |||||||||||
| SEI Institutional Investments Trust / Semi-Annual Report / November 30, 2016 | 9 |
SUMMARY SCHEDULE OF INVESTMENTS (Unaudited)
S&P 500 Index Fund (Concluded)
November 30, 2016
| Description | Percentage of Net Assets (%) | Shares | Market Value ($ Thousands) | |||||||||
U.S. TREASURY OBLIGATIONS — 0.1% |
| |||||||||||
Other Securities (B) | 0.1 | % | $ | 4,136 | ||||||||
|
| |||||||||||
Total U.S. Treasury Obligations (Cost $4,137) ($ Thousands) | 4,136 | |||||||||||
|
| |||||||||||
AFFILIATED PARTNERSHIP — 0.4% |
| |||||||||||
SEI Liquidity Fund, L.P. | 0.4 | 17,631,607 | 17,633 | |||||||||
|
| |||||||||||
Total Affiliated Partnership |
| 17,633 | ||||||||||
|
| |||||||||||
CASH EQUIVALENT — 2.0% |
| |||||||||||
SEI Daily Income Trust, Government Fund, Cl A | 2.0 | 74,343,418 | 74,343 | |||||||||
|
| |||||||||||
Total Cash Equivalent |
| 74,343 | ||||||||||
|
| |||||||||||
Total Investments — 99.9% |
| $ | 3,661,464 | |||||||||
|
| |||||||||||
A list of the open futures contracts held by the Fund at November 30, 2016, is as follows:
| Type of Contract | Number of Contracts Long | Expiration Date | Unrealized Appreciation ($ Thousands) | |||||||||
S&P 500 Index E-MINI | 861 | Dec-2016 | $ | 2,016 | ||||||||
|
| |||||||||||
For the period ended November 30, 2016, the total amount of all open futures contracts, as presented in the table above, are representative of the volume of activity for this derivative type during the period.
Percentages are based on a Net Assets of $3,662,764 ($ Thousands).
| * | Non-income producing security. |
| ** | The rate reported is the 7-day effective yield as of November 30, 2016. |
| ‡ | Real Estate Investment Trust. |
| † | Investment in Affiliated Security (see Note 6). |
| (A) | Certain securities or partial positions of certain securities are on loan at November 30, 2016, (see Note 12). The total market value of securities on loan at November 30, 2016, was $17,503 ($ Thousands). |
| (B) | Security, or portion thereof, has been pledged as collateral on open futures contracts. |
| (C) | This security was purchased with cash collateral held from securities on loan (see Note 12). The total market value of such securities as of November 30, 2016 was $17,633 ($ Thousands). |
Cl — Class
L.P. — Limited Partnership
S&P — Standard & Poor’s
The Summary Schedule of Investments does not reflect the complete portfolio holdings. It includes the Fund’s 50 largest holdings and each investment of any issuer that exceeds 1% of the Fund’s net assets. “Other Securities” represent all issues not required to be disclosed under the rules adopted by the U.S. Securities and Exchange Commission (“SEC”). In certain instances, securities for which footnotes listed above may otherwise apply are included in the Other Securities caption. The complete schedule of portfolio holdings is available (i) without charge, upon request, by calling (800) 342-5734; and (ii) on the SEC’s website at http://www.sec.gov.
The following is a list of the level of inputs used as of November 30, 2016, in valuing the Fund’s investments and other financial instruments carried at value ($ Thousands):
| Investments in Securities | Level 1 | Level 2 | Level 3 | Total | ||||||||||||
Common Stock | $ | 3,565,352 | $ | — | $ | — | $ | 3,565,352 | ||||||||
U.S. Treasury Obligations | — | 4,136 | — | 4,136 | ||||||||||||
Affiliated Partnership | — | 17,633 | — | 17,633 | ||||||||||||
Cash Equivalent | 74,343 | — | — | 74,343 | ||||||||||||
|
|
|
|
|
|
|
| |||||||||
Total Investments in Securities | $ | 3,639,695 | $ | 21,769 | $ | — | $ | 3,661,464 | ||||||||
|
|
|
|
|
|
|
| |||||||||
| Other Financial Instruments | Level 1 | Level 2 | Level 3 | Total | ||||||||||||
Futures Contracts * | ||||||||||||||||
Unrealized Appreciation | $ | 2,016 | $ | — | $ | — | $ | 2,016 | ||||||||
|
|
|
|
|
|
|
| |||||||||
| * | Futures contracts are valued at the unrealized appreciation on the instrument. |
For the period ended November 30, 2016, there were no transfers between Level 1 and Level 2 assets and liabilities.
For the period ended November 30, 2016, there were no transfers between Level 2 and Level 3 assets and liabilities.
For more information on valuation inputs, see Note 2 — Significant Accounting Policies in Notes to Financial Statements.
Amounts designated as “—” are either $0 or have been rounded to $0.
The accompanying notes are an integral part of the financial statements
| 10 | SEI Institutional Investments Trust / Semi-Annual Report / November 30, 2016 |
SUMMARY SCHEDULE OF INVESTMENTS (Unaudited)
Extended Market Index Fund
November 30, 2016
| Description | Percentage of Net Assets (%) | Shares | Market Value ($ Thousands) | |||||||||
COMMON STOCK — 97.3% |
| |||||||||||
Consumer Discretionary — 13.6% |
| |||||||||||
DISH Network, Cl A* | 0.3 | % | 42,219 | $ | 2,425 | |||||||
Domino’s Pizza | 0.2 | 9,558 | 1,606 | |||||||||
Hilton Worldwide Holdings | 0.3 | 100,800 | 2,527 | |||||||||
Las Vegas Sands | 0.5 | 70,404 | 4,412 | |||||||||
Lear | 0.2 | 14,071 | 1,822 | |||||||||
Liberty Interactive, Cl A* | 0.2 | 84,844 | 1,757 | |||||||||
MGM Resorts International* | 0.3 | 91,274 | 2,620 | |||||||||
Tesla Motors* (A) | 0.6 | 24,058 | 4,557 | |||||||||
Yum China Holdings* | 0.2 | 69,600 | 1,957 | |||||||||
Other Securities (A) | 10.8 | 89,734 | ||||||||||
|
| |||||||||||
| 113,417 | ||||||||||||
|
| |||||||||||
Consumer Staples — 3.3% |
| |||||||||||
Bunge | 0.2 | 26,543 | 1,812 | |||||||||
Ingredion | 0.2 | 13,665 | 1,604 | |||||||||
Rite Aid* | 0.2 | 201,827 | 1,607 | |||||||||
WhiteWave Foods* | 0.2 | 33,252 | 1,832 | |||||||||
Other Securities (A) | 2.5 | 21,125 | ||||||||||
|
| |||||||||||
| 27,980 | ||||||||||||
|
| |||||||||||
Energy — 4.2% | ||||||||||||
Other Securities (A) | 4.2 | 35,466 | ||||||||||
|
| |||||||||||
Financials — 17.4% | ||||||||||||
Alleghany* | 0.2 | 2,967 | 1,685 | |||||||||
Ally Financial | 0.2 | 84,600 | 1,643 | |||||||||
Annaly Capital Management‡ | 0.3 | 195,015 | 1,993 | |||||||||
Arch Capital Group* | 0.2 | 21,936 | 1,815 | |||||||||
Everest Re Group | 0.2 | 8,144 | 1,715 | |||||||||
First Republic Bank | 0.3 | 28,043 | 2,297 | |||||||||
Markel* | 0.3 | 2,713 | 2,437 | |||||||||
Raymond James Financial | 0.2 | 24,081 | 1,732 | |||||||||
SEI† | 0.1 | 24,119 | 1,138 | |||||||||
TD Ameritrade Holding | 0.2 | 47,573 | 1,951 | |||||||||
Thomson Reuters | 0.3 | 57,785 | 2,497 | |||||||||
Other Securities (A) | 14.9 | 124,373 | ||||||||||
|
| |||||||||||
| 145,276 | ||||||||||||
|
| |||||||||||
| Description | Percentage of Net Assets (%) | Shares | Market Value ($ Thousands) | |||||||||
Health Care — 10.3% |
| |||||||||||
Alkermes* | 0.2 | % | 28,653 | $ | 1,628 | |||||||
BioMarin Pharmaceutical* | 0.4 | 32,946 | 2,821 | |||||||||
Idexx Laboratories* | 0.3 | 17,002 | 2,000 | |||||||||
Incyte* | 0.4 | 31,371 | 3,209 | |||||||||
Quintiles IMS Holdings* | 0.3 | 26,997 | 2,074 | |||||||||
ResMed | 0.2 | 26,599 | 1,635 | |||||||||
Other Securities (A) | 8.5 | 72,747 | ||||||||||
|
| |||||||||||
| 86,114 | ||||||||||||
|
| |||||||||||
Industrials — 12.9% |
| |||||||||||
Huntington Ingalls Industries | 0.2 | 9,159 | 1,637 | |||||||||
Other Securities (A) | 12.7 | 105,972 | ||||||||||
|
| |||||||||||
| 107,609 | ||||||||||||
|
| |||||||||||
Information Technology — 17.2% |
| |||||||||||
Amdocs | 0.2 | 28,268 | 1,667 | |||||||||
CDK Global | 0.2 | 29,700 | 1,714 | |||||||||
CDW | 0.2 | 32,000 | 1,640 | |||||||||
Computer Sciences | 0.2 | 26,400 | 1,601 | |||||||||
Dell Technologies, Cl V* | 0.3 | 41,700 | 2,233 | |||||||||
FleetCor Technologies* | 0.3 | 17,673 | 2,639 | |||||||||
LinkedIn, Cl A* | 0.5 | 22,806 | 4,453 | |||||||||
Maxim Integrated Products | 0.3 | 54,204 | 2,129 | |||||||||
Palo Alto Networks* | 0.3 | 16,733 | 2,248 | |||||||||
ServiceNow* | 0.3 | 30,369 | 2,525 | |||||||||
Synopsys* | 0.2 | 28,852 | 1,745 | |||||||||
Twitter* (A) | 0.3 | 121,700 | 2,250 | |||||||||
Vantiv, Cl A* | 0.2 | 29,608 | 1,671 | |||||||||
Workday, Cl A* | 0.2 | 22,289 | 1,879 | |||||||||
Other Securities (A) | 13.5 | 113,465 | ||||||||||
|
| |||||||||||
| 143,859 | ||||||||||||
|
| |||||||||||
Materials — 5.5% |
| |||||||||||
Celanese, Cl A | 0.3 | 28,292 | 2,244 | |||||||||
Steel Dynamics | 0.2 | 46,237 | 1,640 | |||||||||
Other Securities (A) | 5.0 | 42,413 | ||||||||||
|
| |||||||||||
| 46,297 | ||||||||||||
|
| |||||||||||
Real Estate — 8.6% |
| |||||||||||
Alexandria Real Estate Equities‡ | 0.2 | 14,661 | 1,607 | |||||||||
Duke Realty‡ | 0.2 | 65,995 | 1,678 | |||||||||
Other Securities‡ (A) | 8.2 | 68,866 | ||||||||||
|
| |||||||||||
| 72,151 | ||||||||||||
|
| |||||||||||
Telecommunication Services — 1.3% |
| |||||||||||
SBA Communications, Cl A* | 0.3 | 23,919 | 2,367 | |||||||||
T-Mobile US* | 0.4 | 55,105 | 2,987 | |||||||||
Other Securities (A) | 0.6 | 5,636 | ||||||||||
|
| |||||||||||
| 10,990 | ||||||||||||
|
| |||||||||||
| SEI Institutional Investments Trust / Semi-Annual Report / November 30, 2016 | 11 |
SUMMARY SCHEDULE OF INVESTMENTS (Unaudited)
Extended Market Index Fund (Concluded)
November 30, 2016
| Description | Percentage of Net Assets (%) | Shares | Market Value ($ Thousands) | |||||||||
Utilities — 3.0% |
| |||||||||||
Other Securities (A) | 3.0 | % | $ | 25,328 | ||||||||
|
| |||||||||||
Total Common Stock |
| 814,487 | ||||||||||
|
| |||||||||||
RIGHTS — 0.0% |
| |||||||||||
Bermuda — 0.0% |
| |||||||||||
Other Securities | 0.0 | — | ||||||||||
|
| |||||||||||
United States — 0.0% |
| |||||||||||
Other Securities | 0.0 | — | ||||||||||
|
| |||||||||||
Total Rights |
| — | ||||||||||
|
| |||||||||||
U.S. TREASURY OBLIGATIONS — 0.1% |
| |||||||||||
Other Securities | 0.1 | 1,294 | ||||||||||
|
| |||||||||||
Total U.S. Treasury Obligations |
| 1,294 | ||||||||||
|
| |||||||||||
AFFILIATED PARTNERSHIP — 6.8% |
| |||||||||||
SEI Liquidity Fund, L.P. 0.470%**† (B) | 6.8 | 57,202,268 | 57,203 | |||||||||
|
| |||||||||||
Total Affiliated Partnership |
| 57,203 | ||||||||||
|
| |||||||||||
CASH EQUIVALENT — 2.8% |
| |||||||||||
SEI Daily Income Trust, Government Fund, Cl A 0.210%**† | 2.8 | 23,376,930 | 23,377 | |||||||||
|
| |||||||||||
Total Cash Equivalent |
| 23,377 | ||||||||||
|
| |||||||||||
Total Investments — 107.0% |
| $ | 896,361 | |||||||||
|
| |||||||||||
A list of the open futures contracts held by the Fund at November 30, 2016, is as follows:
| Type of Contract | Number of Contracts Long | Expiration Date | Unrealized Appreciation ($ Thousands) | |||||||||
Russell 2000 Index E-MINI | 66 | Dec-2016 | $ | 740 | ||||||||
S&P Mid Cap 400 Index E-MINI | 72 | Dec-2016 | 614 | |||||||||
|
| |||||||||||
| $ | 1,354 | |||||||||||
|
| |||||||||||
For the period ended November 30, 2016, the total amount of all open futures contracts, as presented in the table above, are representative of the volume of activity for this derivative type during the period.
Percentages are based on a Net Assets of $837,403 ($ Thousands).
| * | Non-income producing security. |
| ** | The rate reported is the 7-day effective yield as of November 30, 2016. |
| ‡ | Real Estate Investment Trust. |
| † | Investment in Affiliated Security (see Note 6). |
| (A) | Certain securities or partial positions of certain securities are on loan at November 30, 2016, (see Note 12). The total market value of securities on loan at November 30, 2016, was $56,542 ($ Thousands). |
| (B) | This security was purchased with cash collateral held from securities on loan (see Note 10). The total market value of such securities as of November 30, 2016 was $57,203 ($ Thousands). |
Cl — Class
L.P. — Limited Partnership
S&P — Standard & Poor’s
The Summary Schedule of Investments does not reflect the complete portfolio holdings. It includes the Fund’s 50 largest holdings and each investment of any issuer that exceeds 1% of the Fund’s net assets. “Other Securities” represent all issues not required to be disclosed under the rules adopted by the U.S. Securities and Exchange Commission (“SEC”). In certain instances, securities for which footnotes listed above may otherwise apply are included in the Other Securities caption. The complete schedule of portfolio holdings is available (i) without charge, upon request, by calling (800) 342-5734; and (ii) on the SEC’s website at http://www.sec.gov.
The following is a list of the level of inputs used as of November 30, 2016, in valuing the Fund’s investments and other financial instruments carried at value ($ Thousands):
| Investments in Securities | Level 1 | Level 2 | Level 3 | Total | ||||||||||||
Common Stock | $ | 814,487 | $ | — | $ | — | $ | 814,487 | ||||||||
Rights | — | — | — | — | ||||||||||||
U.S. Treasury Obligations | — | 1,294 | — | 1,294 | ||||||||||||
Affiliated Partnership | — | 57,203 | — | 57,203 | ||||||||||||
Cash Equivalent | 23,377 | — | — | 23,377 | ||||||||||||
|
|
|
|
|
|
|
| |||||||||
Total Investments in Securities | $ | 837,864 | $ | 58,497 | $ | — | $ | 896,361 | ||||||||
|
|
|
|
|
|
|
| |||||||||
| Other Financial Instruments | Level 1 | Level 2 | Level 3 | Total | ||||||||||||
Futures Contracts* | ||||||||||||||||
Unrealized Appreciation | $ | 1,354 | $ | — | $ | — | $ | 1,354 | ||||||||
|
|
|
|
|
|
|
| |||||||||
Total Other Financial Instruments | $ | 1,354 | $ | — | $ | — | $ | 1,354 | ||||||||
|
|
|
|
|
|
|
| |||||||||
| * | Futures contracts are valued at the unrealized appreciation on the instrument. |
For the period ended November 30, 2016, there were no transfers between Level 1 and Level 2 assets and liabilities.
For the period ended November 30, 2016, there were no transfers between Level 2 and Level 3 assets and liabilities.
For more information on valuation inputs, see Note 2 — Significant Accounting Policies in Notes to Financial Statements.
Amounts designated as “—” are either $0 or have been rounded to $0.
The accompanying notes are an integral part of the financial statements
| 12 | SEI Institutional Investments Trust / Semi-Annual Report / November 30, 2016 |
SUMMARY SCHEDULE OF INVESTMENTS (Unaudited)
Small Cap Fund
November 30, 2016
| Description | Percentage of Net Assets (%) | Shares | Market Value ($ Thousands) | |||||||||
COMMON STOCK — 95.8% |
| |||||||||||
Consumer Discretionary — 10.2% |
| |||||||||||
Core-Mark Holding | 0.4 | % | 61,049 | $ | 2,229 | |||||||
Fiesta Restaurant Group* | 0.6 | 111,671 | 3,199 | |||||||||
Jack in the Box | 0.5 | 28,296 | 2,943 | |||||||||
Libbey | 0.4 | 125,475 | 2,400 | |||||||||
MDC Partners, Cl A | 0.4 | 356,408 | 2,210 | |||||||||
Other Securities (A) | 7.9 | 41,604 | ||||||||||
|
| |||||||||||
| 54,585 | ||||||||||||
|
| |||||||||||
Consumer Staples — 3.4% |
| |||||||||||
Snyder’s-Lance | 0.5 | 62,973 | 2,346 | |||||||||
SpartanNash | 0.4 | 54,680 | 1,980 | |||||||||
Other Securities (A) | 2.5 | 13,834 | ||||||||||
|
| |||||||||||
| 18,160 | ||||||||||||
|
| |||||||||||
Energy — 4.0% |
| |||||||||||
Other Securities (A) | 4.0 | 21,280 | ||||||||||
|
| |||||||||||
Financials — 18.8% | ||||||||||||
Central Pacific Financial | 0.4 | 69,200 | 2,045 | |||||||||
Customers Bancorp* | 0.4 | 62,500 | 1,906 | |||||||||
Fulton Financial | 0.4 | 128,257 | 2,277 | |||||||||
Hancock Holding | 0.3 | 42,374 | 1,761 | |||||||||
Kemper | 0.4 | 48,600 | 1,990 | |||||||||
National Bank Holdings, Cl A | 0.4 | 86,365 | 2,349 | |||||||||
Popular | 0.6 | 80,967 | 3,291 | |||||||||
United Community Banks | 0.4 | 84,390 | 2,294 | |||||||||
Other Securities‡ (A) | 15.5 | 82,169 | ||||||||||
|
| |||||||||||
| 100,082 | ||||||||||||
|
| |||||||||||
Health Care — 9.8% |
| |||||||||||
AMAG Pharmaceuticals* | 0.7 | 120,151 | 3,989 | |||||||||
AMN Healthcare Services* | 0.7 | 104,859 | 3,492 | |||||||||
Cynosure, Cl A* | 0.5 | 59,757 | 2,710 | |||||||||
Integra LifeSciences Holdings* | 0.4 | 25,627 | 2,071 | |||||||||
Ligand Pharmaceuticals* (A) | 0.5 | 25,740 | 2,687 | |||||||||
Molina Healthcare* | 0.4 | 41,623 | 2,200 | |||||||||
| Description | Percentage of Net Assets (%) | Shares | Market Value ($ Thousands) | |||||||||
Prestige Brands Holdings* | 0.7 | % | 73,323 | $ | 3,488 | |||||||
Other Securities (A) | 5.9 | 31,792 | ||||||||||
|
| |||||||||||
| 52,429 | ||||||||||||
|
| |||||||||||
Industrials — 16.8% |
| |||||||||||
Apogee Enterprises | 0.7 | 72,999 | 3,482 | |||||||||
BWX Technologies | 0.4 | 48,458 | 1,898 | |||||||||
Deluxe | 0.6 | 49,428 | 3,346 | |||||||||
Huron Consulting Group* | 0.4 | 39,483 | 2,083 | |||||||||
ICF International* | 0.4 | 35,267 | 1,952 | |||||||||
John Bean Technologies | 0.3 | 20,715 | 1,869 | |||||||||
MasTec* | 0.5 | 64,063 | 2,431 | |||||||||
On Assignment* | 0.5 | 68,036 | 2,809 | |||||||||
Tutor Perini* | 0.4 | 75,423 | 1,969 | |||||||||
WageWorks* | 0.5 | 36,443 | 2,691 | |||||||||
Other Securities (A) | 12.1 | 65,319 | ||||||||||
|
| |||||||||||
| 89,849 | ||||||||||||
|
| |||||||||||
Information Technology — 17.1% |
| |||||||||||
Acxiom* | 0.7 | 140,478 | 3,727 | |||||||||
Booz Allen Hamilton Holding | 0.4 | 59,382 | 2,245 | |||||||||
CalAmp* | 0.5 | 191,206 | 2,780 | |||||||||
Callidus Software* | 0.5 | 158,473 | 2,488 | |||||||||
Cavium* | 0.6 | 59,758 | 3,408 | |||||||||
Cornerstone OnDemand* | 0.3 | 48,766 | 1,751 | |||||||||
Exar* | 0.3 | 177,367 | 1,772 | |||||||||
FireEye* | 0.5 | 190,199 | 2,442 | |||||||||
Littelfuse | 0.4 | 12,939 | 1,886 | |||||||||
Lumentum Holdings* | 0.5 | 64,380 | 2,582 | |||||||||
MAXIMUS | 0.3 | 32,110 | 1,775 | |||||||||
PDF Solutions* | 0.5 | 119,050 | 2,804 | |||||||||
Perficient* | 0.3 | 102,566 | 1,846 | |||||||||
Proofpoint* | 0.4 | 27,831 | 2,143 | |||||||||
Other Securities (A) | 10.9 | 57,667 | ||||||||||
|
| |||||||||||
| 91,316 | ||||||||||||
|
| |||||||||||
Materials — 5.3% | ||||||||||||
Berry Plastics Group* | 0.7 | 73,014 | 3,634 | |||||||||
Other Securities (A) | 4.6 | 24,402 | ||||||||||
|
| |||||||||||
| 28,036 | ||||||||||||
|
| |||||||||||
Real Estate — 6.1% |
| |||||||||||
Equity Commonwealth*‡ | 0.4 | 69,251 | 2,014 | |||||||||
Other Securities‡ (A) | 5.7 | 30,290 | ||||||||||
|
| |||||||||||
| 32,304 | ||||||||||||
|
| |||||||||||
Telecommunication Services — 0.8% |
| |||||||||||
Other Securities (A) | 0.8 | 4,057 | ||||||||||
|
| |||||||||||
Utilities — 3.5% |
| |||||||||||
Portland General Electric | 0.4 | 50,323 | 2,093 | |||||||||
Southwest Gas | 0.5 | 33,480 | 2,482 | |||||||||
Other Securities (A) | 2.6 | 14,184 | ||||||||||
|
| |||||||||||
| 18,759 | ||||||||||||
|
| |||||||||||
Total Common Stock |
| 510,857 | ||||||||||
|
| �� | ||||||||||
| SEI Institutional Investments Trust / Semi-Annual Report / November 30, 2016 | 13 |
SUMMARY SCHEDULE OF INVESTMENTS (Unaudited)
Small Cap Fund (Concluded)
November 30, 2016
| Description | Percentage of Net Assets (%) | Shares | Market Value ($ Thousands) | |||||||||
EXCHANGE TRADED FUND — 0.3% |
| |||||||||||
Other Securities (A) | 0.3 | % | $ | 1,505 | ||||||||
|
| |||||||||||
Total Exchange Traded Fund |
| 1,505 | ||||||||||
|
| |||||||||||
CONVERTIBLE BOND — 0.0% |
| |||||||||||
Consumer Discretionary — 0.0% |
| |||||||||||
Other Securities (B) (C) | 0.0 | 4 | ||||||||||
|
| |||||||||||
Total Convertible Bond |
| 4 | ||||||||||
|
| |||||||||||
RIGHTS — 0.0% |
| |||||||||||
Other Securities | 0.0 | — | ||||||||||
|
| |||||||||||
Total Rights |
| — | ||||||||||
|
| |||||||||||
AFFILIATED PARTNERSHIP — 4.9% |
| |||||||||||
SEI Liquidity Fund, L.P. 0.470%**† (D) | 4.9 | 26,279,711 | 26,280 | |||||||||
|
| |||||||||||
Total Affiliated Partnership |
| 26,280 | ||||||||||
|
| |||||||||||
CASH EQUIVALENT — 4.0% |
| |||||||||||
SEI Daily Income Trust, Government Fund, Cl A 0.210%**† | 4.0 | 21,418,038 | 21,418 | |||||||||
|
| |||||||||||
Total Cash Equivalent |
| 21,418 | ||||||||||
|
| |||||||||||
Total Investments — 105.0% |
| $ | 560,064 | |||||||||
|
| |||||||||||
Percentages are based on a Net Assets of $533,241 ($ Thousands).
| * | Non-income producing security. |
| ** | The rate reported is the 7-day effective yield as of November 30, 2016. |
| ‡ | Real Estate Investment Trust. |
| † | Investment in Affiliated Security (see Note 6). |
| (A) | Certain securities or partial positions of certain securities are on loan at November 30, 2016 (see Note 12). The total market value of securities on loan at November 30, 2016, was $21,824 ($ Thousands). |
| (B) | Security fair valued using methods determined in good faith by the Valuation Committee of the Board of Trustees. The total market value of such securities as of November 30, 2016 was $4 ($ Thousands) and represented 0.0% of Net Assets. |
| (C) | Security is in default on interest payment. |
| (D) | This security was purchased with cash collateral held from securities on loan (see Note 12). The total market value of such securities as of November 30, 2016 was $26,280 ($ Thousands). |
Cl — Class
L.P. — Limited Partnership
The Summary Schedule of Investments does not reflect the complete portfolio holdings. It includes the Fund’s 50 largest holdings and each investment of any issuer that exceeds 1% of the Fund’s net assets. “Other Securities” represent all issues not required to be disclosed under the rules adopted by the U.S. Securities and Exchange Commission (“SEC”). In certain instances, securities for which footnotes listed above may otherwise apply are included in the Other Securities caption. The complete schedule of portfolio holdings is available (i) without charge, upon request, by calling (800) 342-5734; and (ii) on the SEC’s website at http://www.sec.gov.
The following is a list of the level of inputs used as of November 30, 2016, in valuing the Fund’s investments and other financial instruments carried at value ($ Thousands):
| Investments in Securities | Level 1 | Level 2 | Level 3(1) | Total | ||||||||||||
Common Stock | $ | 510,857 | $ | — | $ | — | $ | 510,857 | ||||||||
Exchange Traded Fund | 1,505 | — | — | 1,505 | ||||||||||||
Convertible Bond | — | — | 4 | 4 | ||||||||||||
Rights | — | — | — | — | ||||||||||||
Affiliated Partnership | — | 26,280 | — | 26,280 | ||||||||||||
Cash Equivalent | 21,418 | — | — | 21,418 | ||||||||||||
|
|
|
|
|
|
|
| |||||||||
Total Investments in Securities | $ | 533,780 | $ | 26,280 | $ | 4 | $ | 560,064 | ||||||||
|
|
|
|
|
|
|
| |||||||||
| (1) | A reconciliation of Level 3 investments is presented when the Fund has a significant amount of Level 3 investments at the beginning and/or end of the period in relation to the net assets. |
For the period ended November 30, 2016, there were no transfers between Level 1 and Level 2 assets and liabilities.
For the period ended November 30, 2016, there were no transfers between Level 2 and Level 3 assets and liabilities.
For more information on valuation inputs, see Note 2 — Significant Accounting Policies in Notes to Financial Statements.
Amounts designated as “—” are either $0 or have been rounded to $0.
The accompanying notes are an integral part of the financial statements
| 14 | SEI Institutional Investments Trust / Semi-Annual Report / November 30, 2016 |
SUMMARY SCHEDULE OF INVESTMENTS (Unaudited)
Small Cap II Fund
November 30, 2016
| Description | Percentage of Net Assets (%) | Shares | Market Value ($ Thousands) | |||||||||
COMMON STOCK — 94.3% |
| |||||||||||
Consumer Discretionary — 10.3% |
| |||||||||||
Big Lots (A) | 0.6 | % | 54,145 | $ | 2,740 | |||||||
Fiesta Restaurant Group* | 0.5 | 89,583 | 2,567 | |||||||||
Jack in the Box | 0.5 | 22,830 | 2,375 | |||||||||
Wolverine World Wide | 0.4 | 87,066 | 1,962 | |||||||||
Other Securities (A) | 8.3 | 39,800 | ||||||||||
|
| |||||||||||
| 49,444 | ||||||||||||
|
| |||||||||||
Consumer Staples — 3.4% |
| |||||||||||
Snyder’s-Lance | 0.7 | 86,258 | 3,214 | |||||||||
Other Securities (A) | 2.7 | 13,067 | ||||||||||
|
| |||||||||||
| 16,281 | ||||||||||||
|
| |||||||||||
Energy — 4.7% |
| |||||||||||
Carrizo Oil & Gas* | 0.5 | 53,599 | 2,269 | |||||||||
PBF Energy, Cl A (A) | 0.6 | 121,929 | 2,925 | |||||||||
Southwestern Energy* | 0.5 | 216,705 | 2,460 | |||||||||
Whiting Petroleum* | 0.5 | 187,156 | 2,287 | |||||||||
Other Securities (A) | 2.6 | 12,440 | ||||||||||
|
| |||||||||||
| 22,381 | ||||||||||||
|
| |||||||||||
Financials — 15.1% |
| |||||||||||
American Equity Investment Life Holding | 0.5 | 123,280 | 2,556 | |||||||||
Argo Group International Holdings | 0.4 | 28,686 | 1,820 | |||||||||
First Commonwealth Financial | 0.5 | 186,116 | 2,349 | |||||||||
FNB (Pennsylvania) | 0.9 | 273,715 | 4,182 | |||||||||
Green Dot, Cl A* | 0.5 | 88,645 | 2,137 | |||||||||
IBERIABANK | 0.4 | 21,966 | 1,820 | |||||||||
OFG Bancorp (A) | 0.7 | 242,362 | 3,272 | |||||||||
Voya Financial | 0.4 | 46,800 | 1,819 | |||||||||
Wintrust Financial | 0.6 | 40,547 | 2,670 | |||||||||
Zions Bancorporation | 0.7 | 77,468 | 3,082 | |||||||||
Other Securities‡ (A) | 9.5 | 46,410 | ||||||||||
|
| |||||||||||
| 72,117 | ||||||||||||
|
| |||||||||||
Health Care — 12.5% |
| |||||||||||
AMAG Pharmaceuticals* (A) | 0.7 | 96,321 | 3,198 | |||||||||
AMN Healthcare Services* | 0.5 | 66,558 | 2,216 | |||||||||
| Description | Percentage of Net Assets (%) | Shares | Market Value ($ Thousands) | |||||||||
Cynosure, Cl A* | 0.4 | % | 47,927 | $ | 2,173 | |||||||
Integra LifeSciences Holdings* | 0.8 | 47,979 | 3,877 | |||||||||
Lannett* (A) | 0.7 | 149,632 | 3,427 | |||||||||
Ligand Pharmaceuticals* (A) | 0.6 | 27,625 | 2,884 | |||||||||
Prestige Brands Holdings* | 0.7 | 74,403 | 3,539 | |||||||||
Other Securities (A) | 8.1 | 38,762 | ||||||||||
|
| |||||||||||
| 60,076 | ||||||||||||
|
| |||||||||||
Industrials — 18.2% |
| |||||||||||
ACCO Brands* | 0.4 | 156,794 | 1,952 | |||||||||
Apogee Enterprises | 0.6 | 55,126 | 2,630 | |||||||||
Atlas Air Worldwide Holdings* | 0.6 | 58,750 | 2,902 | |||||||||
Crane | 0.4 | 24,434 | 1,796 | |||||||||
EMCOR Group | 0.5 | 35,047 | 2,431 | |||||||||
Heritage-Crystal Clean* | 0.4 | 111,353 | 1,815 | |||||||||
Huron Consulting Group* | 0.5 | 41,575 | 2,193 | |||||||||
MasTec* | 0.4 | 53,246 | 2,021 | |||||||||
On Assignment* | 0.6 | 65,742 | 2,715 | |||||||||
Triumph Group | 0.5 | 93,221 | 2,592 | |||||||||
WageWorks* | 0.5 | 29,885 | 2,207 | |||||||||
Other Securities (A) | 12.8 | 61,677 | ||||||||||
|
| |||||||||||
| 86,931 | ||||||||||||
|
| |||||||||||
Information Technology — 18.9% |
| |||||||||||
Acxiom* | 0.5 | 88,330 | 2,343 | |||||||||
CalAmp* | 0.5 | 153,284 | 2,229 | |||||||||
Callidus Software* | 0.5 | 166,645 | 2,616 | |||||||||
Cavium* | 0.6 | 46,452 | 2,649 | |||||||||
FireEye* (A) | 0.4 | 152,611 | 1,960 | |||||||||
Keysight Technologies* | 0.5 | 66,315 | 2,442 | |||||||||
Lumentum Holdings* | 0.4 | 46,019 | 1,845 | |||||||||
PDF Solutions* | 0.5 | 95,439 | 2,248 | |||||||||
VeriFone Systems* | 0.5 | 149,560 | 2,526 | |||||||||
Zebra Technologies, Cl A* | 0.6 | 36,235 | 2,864 | |||||||||
Other Securities (A) | 13.9 | 66,797 | ||||||||||
|
| |||||||||||
| 90,519 | ||||||||||||
|
| |||||||||||
Materials — 5.7% |
| |||||||||||
A. Schulman | 0.5 | 68,428 | 2,279 | |||||||||
Berry Plastics Group* | 0.6 | 55,829 | 2,779 | |||||||||
United States Steel | 0.4 | 63,570 | 2,056 | |||||||||
Other Securities (A) | 4.2 | 20,023 | ||||||||||
|
| |||||||||||
| 27,137 | ||||||||||||
|
| |||||||||||
Real Estate — 2.8% |
| |||||||||||
Other Securities‡ (A) | 2.8 | 13,387 | ||||||||||
|
| |||||||||||
Telecommunication Services — 0.3% |
| |||||||||||
Other Securities (A) | 0.3 | 1,581 | ||||||||||
|
| |||||||||||
| SEI Institutional Investments Trust / Semi-Annual Report / November 30, 2016 | 15 |
SUMMARY SCHEDULE OF INVESTMENTS (Unaudited)
Small Cap II Fund (Concluded)
November 30, 2016
| Description | Percentage of Net Assets (%) | Shares | Market Value ($ Thousands) | |||||||||
Utilities — 2.4% |
| |||||||||||
Other Securities (A) | 2.4 | % | $ | 11,300 | ||||||||
|
| |||||||||||
Total Common Stock |
| 451,154 | ||||||||||
|
| |||||||||||
RIGHTS — 0.0% |
| |||||||||||
Other Securities | 0.0 | — | ||||||||||
|
| |||||||||||
Total Rights |
| — | ||||||||||
|
| |||||||||||
AFFILIATED PARTNERSHIP — 9.1% |
| |||||||||||
SEI Liquidity Fund, L.P. 0.470%**† (B) | 9.1 | 43,485,830 | 43,486 | |||||||||
|
| |||||||||||
Total Affiliated Partnership |
| 43,486 | ||||||||||
|
| |||||||||||
CASH EQUIVALENT — 5.1% |
| |||||||||||
SEI Daily Income Trust, Government Fund, Cl A 0.210%**† | 5.1 | 24,353,812 | 24,354 | |||||||||
|
| |||||||||||
Total Cash Equivalent |
| 24,354 | ||||||||||
|
| |||||||||||
Total Investments — 108.5% |
| $ | 518,994 | |||||||||
|
| |||||||||||
A list of the open futures contracts held by the Fund at November 30, 2016, is as follows:
| Type of Contract | Number of Contracts Long | Expiration Date | Unrealized Appreciation ($ Thousands) | |||||||||
Russell 2000 Index E-MINI | 17 | Dec-2016 | $ | 240 | ||||||||
|
| |||||||||||
For the period ended November 30, 2016, the total amount of all open futures contracts, as presented in the table above, are representative of the volume of activity for this derivative type during the period.
Percentages are based on a Net Assets of $478,370 ($ Thousands).
| * | Non-income producing security. |
| ** | The rate reported is the 7-day effective yield as of November 30, 2016. |
| ‡ | Real Estate Investment Trust. |
| † | Investment in Affiliated Security (see Note 6). |
| (A) | Certain securities or partial positions of certain securities are on loan at November 30, 2016 (see Note 12). The total market value of securities on loan at November 30, 2016, was $42,854 ($ Thousands). |
| (B) | This security was purchased with cash collateral held from securities on loan (see Note 12). The total market value of such securities as of November 30, 2016 was $43,486 ($ Thousands). |
Cl — Class
L.P. — Limited Partnership
The Summary Schedule of Investments does not reflect the complete portfolio holdings. It includes the Fund’s 50 largest holdings and each investment of any issuer that exceeds 1% of the Fund’s net assets. “Other Securities” represent all issues not required to be disclosed under the rules adopted by the U.S. Securities and Exchange Commission (“SEC”). In certain instances, securities for which footnotes listed above may otherwise apply are included in the Other Securities caption. The complete schedule of portfolio holdings is available (i) without charge, upon request, by calling (800) 342-5734; and (ii) on the SEC’s website at http://www.sec.gov.
The following is a list of the level of inputs used as of November 30, 2016, in valuing the Fund’s investments and other financial instruments carried at value ($ Thousands):
| Investments in Securities | Level 1 | Level 2 | Level 3 | Total | ||||||||||||
Common Stock | $ | 451,154 | $ | — | $ | — | $ | 451,154 | ||||||||
Rights | — | | — | | — | — | ||||||||||
Affiliated Partnership | — | 43,486 | — | 43,486 | ||||||||||||
Cash Equivalent | 24,354 | — | | — | | 24,354 | ||||||||||
|
|
|
|
|
|
|
| |||||||||
Total Investments in Securities | $ | 475,508 | $ | 43,486 | $ | — | $ | 518,994 | ||||||||
|
|
|
|
|
|
|
| |||||||||
| Other Financial Instruments | Level 1 | Level 2 | Level 3 | Total | ||||||||||||
Futures Contracts* | ||||||||||||||||
Unrealized Appreciation | $ | 240 | $ | — | $ | — | $ | 240 | ||||||||
|
|
|
|
|
|
|
| |||||||||
Total Other Financial Instruments | $ | 240 | $ | — | $ | — | $ | 240 | ||||||||
|
|
|
|
|
|
|
| |||||||||
| * | Futures contracts are valued at the unrealized appreciation on the instrument. |
For the period ended November 30, 2016, there were no transfers between Level 1 and Level 2 assets and liabilities.
For the period ended November 30, 2016, there were no transfers between Level 2 and Level 3 assets and liabilities.
For more information on valuation inputs, see Note 2 — Significant Accounting Policies in Notes to Financial Statements.
Amounts designated as “—” are either $0 or have been rounded to $0.
The accompanying notes are an integral part of the financial statements
| 16 | SEI Institutional Investments Trust / Semi-Annual Report / November 30, 2016 |
SUMMARY SCHEDULE OF INVESTMENTS (Unaudited)
Small/Mid Cap Equity Fund
November 30, 2016
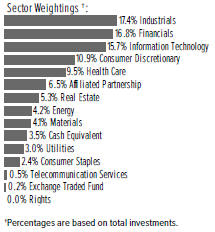
| Description | Percentage of Net Assets (%) | Shares | Market Value ($ Thousands) | |||||||||
COMMON STOCK — 95.2% |
| |||||||||||
Consumer Discretionary — 11.5% |
| |||||||||||
Bright Horizons Family Solutions* | 0.3 | % | 81,709 | $ | 5,623 | |||||||
Carter’s | 0.3 | 57,880 | 5,284 | |||||||||
Grand Canyon Education* | 0.3 | 87,370 | 4,989 | |||||||||
Hibbett Sports* (A) | 0.3 | 125,755 | 5,062 | |||||||||
Jack in the Box | 0.3 | 49,969 | 5,198 | |||||||||
National CineMedia | 0.3 | 379,157 | 5,816 | |||||||||
Sally Beauty Holdings* | 0.4 | 271,430 | 7,109 | |||||||||
ServiceMaster Global Holdings* | 0.4 | 196,574 | 7,513 | |||||||||
Other Securities (A) | 8.9 | 154,609 | ||||||||||
|
| |||||||||||
| 201,203 | ||||||||||||
|
| |||||||||||
Consumer Staples — 2.6% |
| |||||||||||
Other Securities (A) | 2.6 | 44,534 | ||||||||||
|
| |||||||||||
Energy — 4.4% |
| |||||||||||
Other Securities (A) | 4.4 | 77,605 | ||||||||||
|
| |||||||||||
Financials — 17.8% |
| |||||||||||
American Financial Group | 0.4 | 81,749 | 6,722 | |||||||||
Central Pacific Financial | 0.3 | 185,945 | 5,495 | |||||||||
Eagle Bancorp* | 0.3 | 87,237 | 5,125 | |||||||||
Everest Re Group | 0.3 | 25,677 | 5,406 | |||||||||
Fulton Financial | 0.3 | 297,983 | 5,289 | |||||||||
Hancock Holding | 0.3 | 128,955 | 5,358 | |||||||||
Hanover Insurance Group | 0.3 | 62,177 | 5,384 | |||||||||
Huntington Bancshares | 0.4 | 594,663 | 7,410 | |||||||||
Kemper | 0.3 | 123,900 | 5,074 | |||||||||
LPL Financial Holdings | 0.5 | 192,581 | 7,932 | |||||||||
National Bank Holdings, Cl A | 0.3 | 180,200 | 4,901 | |||||||||
Popular | 0.4 | 170,139 | 6,916 | |||||||||
Synovus Financial | 0.4 | 163,185 | 6,317 | |||||||||
United Community Banks | 0.4 | 261,040 | 7,095 | |||||||||
Unum Group | 0.3 | 119,066 | 5,033 | |||||||||
| Description | Percentage of Net Assets (%) | Shares | Market Value ($ Thousands) | |||||||||
Other Securities‡ (A) | 12.6 | % | $ | 221,414 | ||||||||
|
| |||||||||||
| 310,871 | ||||||||||||
|
| |||||||||||
Health Care — 10.1% |
| |||||||||||
AMAG Pharmaceuticals* | 0.4 | 184,715 | 6,133 | |||||||||
AMN Healthcare Services* | 0.4 | 181,577 | 6,047 | |||||||||
INC Research Holdings, Cl A* | 0.4 | 142,832 | 7,070 | |||||||||
Ligand Pharmaceuticals* (A) | 0.3 | 49,346 | 5,152 | |||||||||
Prestige Brands Holdings* | 0.3 | 121,896 | 5,799 | |||||||||
Other Securities (A) | 8.3 | 146,170 | ||||||||||
|
| |||||||||||
| 176,371 | ||||||||||||
|
| |||||||||||
Industrials — 18.5% |
| |||||||||||
Apogee Enterprises | 0.3 | 111,876 | 5,336 | |||||||||
BWX Technologies | 0.3 | 139,009 | 5,444 | |||||||||
CEB | 0.3 | 99,795 | 5,883 | |||||||||
Clean Harbors* | 0.5 | 148,387 | 7,842 | |||||||||
Deluxe | 0.5 | 121,405 | 8,219 | |||||||||
Forward Air | 0.3 | 100,985 | 4,886 | |||||||||
HEICO, Cl A | 0.3 | 77,096 | 5,181 | |||||||||
Huntington Ingalls Industries | 0.3 | 31,363 | 5,606 | |||||||||
John Bean Technologies | 0.3 | 61,324 | 5,531 | |||||||||
Mercury Systems* | 0.3 | 172,025 | 5,111 | |||||||||
Sensata Technologies Holding* | 0.3 | 147,869 | 5,526 | |||||||||
Tennant | 0.3 | 71,157 | 5,344 | |||||||||
TriNet Group* | 0.4 | 254,837 | 6,429 | |||||||||
Other Securities (A) | 14.1 | 245,909 | ||||||||||
|
| |||||||||||
| 322,247 | ||||||||||||
|
| |||||||||||
Information Technology — 16.7% |
| |||||||||||
Cadence Design Systems* | 0.5 | 336,945 | 8,855 | |||||||||
Euronet Worldwide* | 0.3 | 72,037 | 5,166 | |||||||||
Littelfuse | 0.4 | 45,807 | 6,678 | |||||||||
LogMeIn | 0.4 | 74,437 | 7,507 | |||||||||
MAXIMUS | 0.3 | 104,251 | 5,764 | |||||||||
Microsemi* | 0.3 | 101,760 | 5,571 | |||||||||
Other Securities (A) | 14.5 | 250,966 | ||||||||||
|
| |||||||||||
| 290,507 | ||||||||||||
|
| |||||||||||
Materials — 4.3% |
| |||||||||||
Berry Plastics Group* | 0.4 | 158,195 | 7,873 | |||||||||
Other Securities (A) | 3.9 | 67,405 | ||||||||||
|
| |||||||||||
| 75,278 | ||||||||||||
|
| |||||||||||
Real Estate — 5.6% |
| |||||||||||
Other Securities‡ (A) | 5.6 | 97,699 | ||||||||||
|
| |||||||||||
Telecommunication Services — 0.5% |
| |||||||||||
Other Securities (A) | 0.5 | 8,244 | ||||||||||
|
| |||||||||||
Utilities — 3.2% |
| |||||||||||
Pinnacle West Capital | 0.3 | 67,902 | 5,020 | |||||||||
Portland General Electric | 0.3 | 123,307 | 5,130 | |||||||||
| SEI Institutional Investments Trust / Semi-Annual Report / November 30, 2016 | 17 |
SUMMARY SCHEDULE OF INVESTMENTS (Unaudited)
Small/Mid Cap Equity Fund (Concluded)
November 30, 2016
| Description | Percentage of Net Assets (%) | Shares | Market Value ($ Thousands) | |||||||||
Other Securities (A) | 2.6 | % | $ | 46,054 | ||||||||
|
| |||||||||||
| 56,204 | ||||||||||||
|
| |||||||||||
Total Common Stock |
| 1,660,763 | ||||||||||
|
| |||||||||||
EXCHANGE TRADED FUND — 0.2% |
| |||||||||||
Other Securities (A) | 0.2 | 3,836 | ||||||||||
|
| |||||||||||
Total Exchange Traded Fund |
| 3,836 | ||||||||||
|
| |||||||||||
RIGHTS — 0.0% |
| |||||||||||
Other Securities | 0.0 | — | ||||||||||
|
| |||||||||||
Total Rights |
| — | ||||||||||
|
| |||||||||||
AFFILIATED PARTNERSHIP — 6.9% |
| |||||||||||
SEI Liquidity Fund, L.P. | 6.9 | 119,958,088 | 119,961 | |||||||||
|
| |||||||||||
Total Affiliated Partnership |
| 119,961 | ||||||||||
|
| |||||||||||
CASH EQUIVALENT — 3.7% |
| |||||||||||
SEI Daily Income Trust, Government Fund, Cl A | 3.7 | 65,438,489 | 65,438 | |||||||||
|
| |||||||||||
Total Cash Equivalent |
| 65,438 | ||||||||||
|
| |||||||||||
Total Investments — 106.0% |
| $ | 1,849,998 | |||||||||
|
| |||||||||||
Percentages are based on a Net Assets of $1,744,846 ($ Thousands).
| * | Non-income producing security. |
| ** | The rate reported is the 7-day effective yield as of November 30, 2016. |
| ‡ | Real Estate Investment Trust. |
| † | Investment in Affiliated Security (see Note 6). |
| (A) | Certain securities or partial positions of certain securities are on loan at November 30, 2016 (see Note 12). The total market value of securities on loan at November 30, 2016, was $116,897 ($ Thousands). |
| (B) | This security was purchased with cash collateral held from securities on loan (see Note 12). The total market value of such securities as of November 30, 2016 was $119,961 ($ Thousands). |
Cl — Class
L.P. — Limited Partnership
The Summary Schedule of Investments does not reflect the complete portfolio holdings. It includes the Fund’s 50 largest holdings and each investment of any issuer that exceeds 1% of the Fund’s net assets. “Other Securities” represent all issues not required to be disclosed under the rules adopted by the U.S. Securities and Exchange Commission (“SEC”). In certain instances, securities for which footnotes listed above may otherwise apply are included in the Other Securities caption. The complete schedule of portfolio holdings is available (i) without charge, upon request, by calling (800) 342-5734; and (ii) on the SEC’s website at http://www.sec.gov.
The following is a list of the level of inputs used as of November 30, 2016, in valuing the Fund’s investments and other financial instruments carried at value ($ Thousands):
| Investments in Securities | Level 1 | Level 2 | Level 3 | Total | ||||||||||||
Common Stock | $ | 1,660,763 | $ | — | $ | — | $ | 1,660,763 | ||||||||
Exchange Traded Fund | 3,836 | — | — | 3,836 | ||||||||||||
Rights | — | — | — | — | ||||||||||||
Affiliated Partnership | — | 119,961 | — | 119,961 | ||||||||||||
Cash Equivalent | 65,438 | — | — | 65,438 | ||||||||||||
|
|
|
|
|
|
|
| |||||||||
Total Investments in Securities | $ | 1,730,037 | $ | 119,961 | $ | — | $ | 1,849,998 | ||||||||
|
|
|
|
|
|
|
| |||||||||
For the period ended November 30, 2016, there were no transfers between Level 1 and Level 2 assets and liabilities.
For the period ended November 30, 2016, there were no transfers between Level 2 and Level 3 assets and liabilities.
For more information on valuation inputs, see Note 2 — Significant Accounting Policies in Notes to Financial Statements.
Amounts designated as “—” are either $0 or have been rounded to $0.
The accompanying notes are an integral part of the financial statements
| 18 | SEI Institutional Investments Trust / Semi-Annual Report / November 30, 2016 |
SUMMARY SCHEDULE OF INVESTMENTS (Unaudited)
U.S. Managed Volatility Fund
November 30, 2016
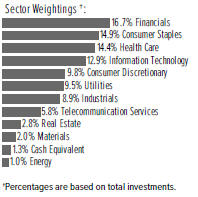
| Description | Percentage of Net Assets (%) | Shares | Market Value ($ Thousands) | |||||||||
COMMON STOCK — 97.5% |
| |||||||||||
Consumer Discretionary — 9.6% |
| |||||||||||
McDonald’s | 0.6 | % | 71,466 | $ | 8,524 | |||||||
Target | 1.4 | 275,941 | 21,314 | |||||||||
Other Securities | 7.6 | 113,063 | ||||||||||
|
| |||||||||||
| 142,901 | ||||||||||||
|
| |||||||||||
Consumer Staples — 14.7% |
| |||||||||||
Altria Group | 1.6 | 360,004 | 23,015 | |||||||||
Bunge | 0.6 | 132,400 | 9,040 | |||||||||
Dr. Pepper Snapple Group | 1.5 | 253,888 | 22,022 | |||||||||
Kroger | 0.6 | 265,337 | 8,570 | |||||||||
PepsiCo | 0.6 | 94,565 | 9,466 | |||||||||
Philip Morris International | 0.6 | 102,076 | 9,011 | |||||||||
Sysco | 0.6 | 171,356 | 9,125 | |||||||||
Tyson Foods, Cl A | 0.7 | 190,686 | 10,833 | |||||||||
Wal-Mart Stores | 1.9 | 397,859 | 28,021 | |||||||||
Other Securities | 6.0 | 89,698 | ||||||||||
|
| |||||||||||
| 218,801 | ||||||||||||
|
| |||||||||||
Energy — 1.0% |
| |||||||||||
Exxon Mobil | 0.7 | 131,600 | 11,489 | |||||||||
Other Securities | 0.3 | 3,849 | ||||||||||
|
| |||||||||||
| 15,338 | ||||||||||||
|
| |||||||||||
Financials — 16.5% |
| |||||||||||
Allstate | 0.8 | 168,703 | 11,796 | |||||||||
American Financial Group | 0.7 | 125,284 | 10,302 | |||||||||
Axis Capital Holdings | 0.8 | 183,105 | 11,171 | |||||||||
Berkshire Hathaway, Cl B* | 1.0 | 95,700 | 15,067 | |||||||||
Everest Re Group | 1.3 | 94,442 | 19,885 | |||||||||
PNC Financial Services Group | 0.9 | 125,700 | 13,895 | |||||||||
RenaissanceRe Holdings | 0.8 | 89,597 | 11,698 | |||||||||
Travelers | 1.4 | 175,938 | 19,943 | |||||||||
Validus Holdings | 1.0 | 263,700 | 14,329 | |||||||||
Other Securities‡ | 7.8 | 116,179 | ||||||||||
|
| |||||||||||
| 244,265 | ||||||||||||
|
| |||||||||||
Health Care — 14.3% |
| |||||||||||
Cardinal Health | 0.7 | 153,790 | 10,921 | |||||||||
Johnson & Johnson | 2.4 | 312,884 | 34,824 | |||||||||
Merck | 2.0 | 494,377 | 30,251 | |||||||||
Pfizer | 1.8 | 825,299 | 26,525 | |||||||||
| Description | Percentage of Net Assets (%) | Shares | Market Value ($ Thousands) | |||||||||
Quest Diagnostics | 0.7 | % | 112,832 | $ | 9,868 | |||||||
Other Securities | 6.7 | 99,236 | ||||||||||
|
| |||||||||||
| 211,625 | ||||||||||||
|
| |||||||||||
Industrials — 8.8% |
| |||||||||||
Deere | 0.7 | 102,600 | 10,281 | |||||||||
Northrop Grumman | 1.0 | 61,187 | 15,275 | |||||||||
Raytheon | 0.6 | 59,559 | 8,906 | |||||||||
Republic Services | 0.7 | 189,955 | 10,541 | |||||||||
United Parcel Service, Cl B | 0.6 | 76,878 | 8,912 | |||||||||
United Technologies | 0.7 | 92,000 | 9,910 | |||||||||
Waste Management | 1.0 | 215,180 | 14,959 | |||||||||
Other Securities | 3.5 | 52,196 | ||||||||||
|
| |||||||||||
| 130,980 | ||||||||||||
|
| |||||||||||
Information Technology — 12.8% |
| |||||||||||
Amdocs | 1.4 | 353,913 | 20,870 | |||||||||
Apple | 0.6 | 84,600 | 9,350 | |||||||||
Cisco Systems | 1.0 | 495,700 | 14,782 | |||||||||
Intel | 0.7 | 301,252 | 10,453 | |||||||||
International Business Machines | 0.9 | 85,681 | 13,899 | |||||||||
Motorola Solutions | 0.6 | 113,300 | 9,092 | |||||||||
QUALCOMM | 0.6 | 129,600 | 8,830 | |||||||||
Other Securities | 7.0 | 102,075 | ||||||||||
|
| |||||||||||
| 189,351 | ||||||||||||
|
| |||||||||||
Materials — 2.0% |
| |||||||||||
Sonoco Products | 0.6 | 158,200 | 8,563 | |||||||||
Other Securities | 1.4 | 20,375 | ||||||||||
|
| |||||||||||
| 28,938 | ||||||||||||
|
| |||||||||||
Real Estate — 2.7% |
| |||||||||||
Other Securities‡ | 2.7 | 40,374 | ||||||||||
|
| |||||||||||
Telecommunication Services — 5.7% |
| |||||||||||
AT&T | 2.1 | 799,995 | 30,904 | |||||||||
Verizon Communications | 2.2 | 660,536 | 32,961 | |||||||||
Other Securities | 1.4 | 21,053 | ||||||||||
|
| |||||||||||
| 84,918 | ||||||||||||
|
| |||||||||||
Utilities — 9.4% |
| |||||||||||
American Electric Power | 0.9 | 221,567 | 13,084 | |||||||||
Edison International | 0.8 | 166,298 | 11,436 | |||||||||
Entergy | 0.9 | 187,506 | 12,887 | |||||||||
Exelon | 0.9 | 391,190 | 12,718 | |||||||||
FirstEnergy | 0.6 | 286,777 | 8,973 | |||||||||
Pinnacle West Capital | 0.6 | 122,118 | 9,028 | |||||||||
Public Service Enterprise Group | 1.1 | 376,170 | 15,540 | |||||||||
Other Securities | 3.6 | 55,076 | ||||||||||
|
| |||||||||||
| 138,742 | ||||||||||||
|
| |||||||||||
Total Common Stock |
| 1,446,233 | ||||||||||
|
| |||||||||||
| SEI Institutional Investments Trust / Semi-Annual Report / November 30, 2016 | 19 |
SUMMARY SCHEDULE OF INVESTMENTS (Unaudited)
U.S. Managed Volatility Fund (Concluded)
November 30, 2016
| Description | Percentage of Net Assets (%) | Shares | Market Value ($ Thousands) | |||||||||
CASH EQUIVALENT — 1.3% |
| |||||||||||
SEI Daily Income Trust, Government Fund, Cl A 0.210% **† | 1.3 | % | 19,117,467 | $ | 19,117 | |||||||
|
| |||||||||||
Total Cash Equivalent |
| 19,117 | ||||||||||
|
| |||||||||||
Total Investments — 98.8% |
| $ | 1,465,350 | |||||||||
|
| |||||||||||
A list of the open futures contracts held by the Fund at November 30, 2016, is as follows:
| Type of Contract | Number of Contracts Long | Expiration Date | Unrealized Appreciation ($ Thousands) | |||||||||
S&P 500 Index E-MINI | 198 | Dec-2016 | $ | 466 | ||||||||
|
| |||||||||||
For the period ended November 30, 2016, the total amount of all open futures contracts, as presented in the table above, are representative of the volume of activity for this derivative type during the period.
Percentages are based on a Net Assets of $1,483,505 ($ Thousands).
| * | Non-income producing security. |
| ** | The rate reported is the 7-day effective yield as of November 30, 2016. |
| ‡ | Real Estate Investment Trust. |
| † | Investment in Affiliated Security (see Note 6). |
Cl — Class
S&P — Standard & Poor’s
The Summary Schedule of Investments does not reflect the complete portfolio holdings. It includes the Fund’s 50 largest holdings and each investment of any issuer that exceeds 1% of the Fund’s net assets. “Other Securities” represent all issues not required to be disclosed under the rules adopted by the U.S. Securities and Exchange Commission (“SEC”). In certain instances, securities for which footnotes listed above may otherwise apply are included in the Other Securities caption. The complete schedule of portfolio holdings is available (i) without charge, upon request, by calling (800) 342-5734; and (ii) on the SEC’s website at http://www.sec.gov.
As of November 30, 2016, all of the Fund’s investments were considered level 1, in accordance with the authoritative guidance on fair value measurements and disclosure under U.S. GAAP.
The following is a list of the level of inputs used as of November 30, 2016, in valuing other financial instruments carried at value ($ Thousands):
| Other Financial Instruments | Level 1 | Level 2 | Level 3 | Total | ||||||||||||
Futures Contracts * | ||||||||||||||||
Unrealized Appreciation | $ | 466 | $ | — | $ | — | $ | 466 | ||||||||
|
|
|
|
|
|
|
| |||||||||
Total Other Financial Instruments | $ | 466 | $ | — | $ | — | $ | 466 | ||||||||
|
|
|
|
|
|
|
| |||||||||
| * | Futures contracts are valued at the unrealized appreciation on the instrument. |
For the period ended November 30, 2016, there were no transfers between Level 1 and Level 2 assets and liabilities.
For the period ended November 30, 2016, there were no transfers between Level 2 and Level 3 assets and liabilities.
For more information on valuation inputs, see Note 2 — Significant Accounting Policies in Notes to Financial Statements.
Amounts designated as “—” are either $0 or have been rounded to $0.
The accompanying notes are an integral part of the financial statements.
| 20 | SEI Institutional Investments Trust / Semi-Annual Report / November 30, 2016 |
SUMMARY SCHEDULE OF INVESTMENTS (Unaudited)
Global Managed Volatility Fund
November 30, 2016
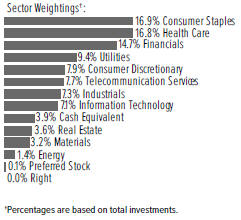
| Description | Percentage of Net Assets (%) | Shares | Market Value ($ Thousands) | |||||||||
COMMON STOCK — 96.0% |
| |||||||||||
Australia — 2.4% |
| |||||||||||
Other Securities‡ | 2.4 | % | $ | 25,481 | ||||||||
|
| |||||||||||
Austria — 0.5% |
| |||||||||||
Other Securities | 0.5 | 5,160 | ||||||||||
|
| |||||||||||
Belgium — 0.4% |
| |||||||||||
Other Securities | 0.4 | 4,025 | ||||||||||
|
| |||||||||||
Canada — 7.5% |
| |||||||||||
Bank of Montreal | 0.6 | 102,193 | 6,729 | |||||||||
BCE | 0.6 | 139,491 | 6,009 | |||||||||
Canadian Tire, Cl A | 0.7 | 71,772 | 7,469 | |||||||||
Rogers Communications, Cl B | 0.5 | 137,863 | 5,321 | |||||||||
Toronto-Dominion Bank | 0.5 | 107,194 | 5,068 | |||||||||
Other Securities‡ | 4.6 | 48,764 | ||||||||||
|
| |||||||||||
| 79,360 | ||||||||||||
|
| |||||||||||
Denmark — 0.5% |
| |||||||||||
Other Securities | 0.5 | 4,853 | ||||||||||
|
| |||||||||||
Finland — 0.0% |
| |||||||||||
Other Securities | 0.0 | 152 | ||||||||||
|
| |||||||||||
France — 1.7% |
| |||||||||||
Atos | 0.7 | 68,900 | 7,128 | |||||||||
Sanofi-Aventis | 0.5 | 62,000 | 5,006 | |||||||||
Other Securities | 0.5 | 6,225 | ||||||||||
|
| |||||||||||
| 18,359 | ||||||||||||
|
| |||||||||||
Germany — 1.1% |
| |||||||||||
Other Securities (A) | 1.1 | 11,476 | ||||||||||
|
| |||||||||||
Hong Kong — 2.8% |
| |||||||||||
CLP Holdings | 1.1 | 1,154,301 | 11,288 | |||||||||
Other Securities‡ (A) | 1.7 | 18,460 | ||||||||||
|
| |||||||||||
| 29,748 | ||||||||||||
|
| |||||||||||
Ireland — 0.0% |
| |||||||||||
Other Securities‡ | 0.0 | 407 | ||||||||||
|
| |||||||||||
| Description | Percentage of Net Assets (%) | Shares | Market Value ($ Thousands) | |||||||||
Israel — 2.1% |
| |||||||||||
Bank Hapoalim | 0.7 | % | 1,171,644 | $ | 7,047 | |||||||
Bank Leumi Le-Israel* | 0.5 | 1,223,266 | 4,977 | |||||||||
Other Securities | 0.9 | 9,656 | ||||||||||
|
| |||||||||||
| 21,680 | ||||||||||||
|
| |||||||||||
Italy — 0.3% |
| |||||||||||
Other Securities | 0.3 | 3,074 | ||||||||||
|
| |||||||||||
Japan — 9.0% | ||||||||||||
Mitsubishi Tanabe Pharma | 0.5 | 284,300 | 5,367 | |||||||||
Nippon Telegraph & Telephone | 0.9 | 235,200 | 9,547 | |||||||||
NTT DoCoMo | 0.6 | 247,250 | 5,694 | |||||||||
Other Securities | 7.0 | 74,850 | ||||||||||
|
| |||||||||||
| 95,458 | ||||||||||||
|
| |||||||||||
Luxembourg — 0.0% |
| |||||||||||
Other Securities | 0.0 | 425 | ||||||||||
|
| |||||||||||
Netherlands — 0.3% |
| |||||||||||
Other Securities | 0.3 | 2,735 | ||||||||||
|
| |||||||||||
New Zealand — 1.9% |
| |||||||||||
Fletcher Building | 0.5 | 690,413 | 5,031 | |||||||||
Other Securities‡ | 1.4 | 15,015 | ||||||||||
|
| |||||||||||
| 20,046 | ||||||||||||
|
| |||||||||||
Norway — 1.2% |
| |||||||||||
Other Securities | 1.2 | 12,433 | ||||||||||
|
| |||||||||||
Portugal — 0.2% |
| |||||||||||
Other Securities | 0.2 | 1,901 | ||||||||||
|
| |||||||||||
Singapore — 1.9% |
| |||||||||||
Other Securities‡ | 1.9 | 20,025 | ||||||||||
|
| |||||||||||
Spain — 0.4% |
| |||||||||||
Other Securities | 0.4 | 4,500 | ||||||||||
|
| |||||||||||
Sweden — 0.6% |
| |||||||||||
Other Securities | 0.6 | 6,295 | ||||||||||
|
| |||||||||||
Switzerland — 3.1% |
| |||||||||||
Nestle | 0.7 | 102,031 | 6,851 | |||||||||
Other Securities | 2.4 | 26,185 | ||||||||||
|
| |||||||||||
| 33,036 | ||||||||||||
|
| |||||||||||
United Kingdom — 4.1% |
| |||||||||||
GlaxoSmithKline | 0.5 | 288,672 | 5,394 | |||||||||
Imperial Brands | 0.7 | 159,831 | 6,856 | |||||||||
Other Securities‡ (A) | 2.9 | 30,821 | ||||||||||
|
| |||||||||||
| 43,071 | ||||||||||||
|
| |||||||||||
United States — 54.0% |
| |||||||||||
Altria Group | 0.8 | 131,961 | 8,436 | |||||||||
Amdocs | 1.0 | 171,085 | 10,089 | |||||||||
American Electric Power | 0.5 | 85,300 | 5,037 | |||||||||
Annaly Capital Management‡ | 0.5 | 524,157 | 5,357 | |||||||||
AT&T | 1.2 | 319,799 | 12,354 | |||||||||
| SEI Institutional Investments Trust / Semi-Annual Report / November 30, 2016 | 21 |
SUMMARY SCHEDULE OF INVESTMENTS (Unaudited)
Global Managed Volatility Fund (Concluded)
November 30, 2016
| Description | Percentage of Net Assets (%) | Shares | Market Value ($ Thousands) | |||||||||
Berkshire Hathaway, Cl B* | 1.0 | % | 65,000 | $ | 10,234 | |||||||
Cardinal Health | 0.5 | 71,337 | 5,066 | |||||||||
Cisco Systems | 0.5 | 191,600 | 5,714 | |||||||||
Clorox | 0.6 | 56,702 | 6,552 | |||||||||
Consolidated Edison | 0.7 | 100,471 | 7,010 | |||||||||
Edison International | 0.6 | 95,600 | 6,574 | |||||||||
Entergy | 0.5 | 82,900 | 5,698 | |||||||||
Everest Re Group | 0.7 | 34,100 | 7,180 | |||||||||
FirstEnergy | 0.6 | 199,500 | 6,242 | |||||||||
General Mills | 0.5 | 89,935 | 5,481 | |||||||||
Intel | 0.5 | 150,500 | 5,222 | |||||||||
International Business Machines | 0.6 | 36,200 | 5,872 | |||||||||
Johnson & Johnson | 1.8 | 171,087 | 19,042 | |||||||||
Kaiser Aluminum | 0.5 | 59,374 | 4,892 | |||||||||
Kimberly-Clark | 0.6 | 53,717 | 6,210 | |||||||||
McDonald’s | 0.6 | 54,069 | 6,449 | |||||||||
Merck | 1.7 | 285,824 | 17,490 | |||||||||
Pfizer | 1.2 | 406,211 | 13,056 | |||||||||
Procter & Gamble | 0.5 | 67,576 | 5,572 | |||||||||
Public Service Enterprise Group | 0.6 | 152,900 | 6,316 | |||||||||
Quest Diagnostics | 0.8 | 96,868 | 8,472 | |||||||||
Republic Services, Cl A | 0.9 | 162,390 | 9,011 | |||||||||
Sysco | 0.8 | 157,184 | 8,370 | |||||||||
Target | 1.0 | 137,233 | 10,600 | |||||||||
Travelers | 0.8 | 77,500 | 8,785 | |||||||||
Verizon Communications | 1.1 | 230,900 | 11,522 | |||||||||
Wal-Mart Stores | 1.8 | 264,009 | 18,594 | |||||||||
Waste Management | 0.9 | 130,690 | 9,086 | |||||||||
Other Securities‡ | 27.1 | 287,199 | ||||||||||
|
| |||||||||||
| 568,784 | ||||||||||||
|
| |||||||||||
Total Common Stock |
| 1,012,484 | ||||||||||
|
| |||||||||||
PREFERRED STOCK — 0.1% |
| |||||||||||
Germany — 0.1% |
| |||||||||||
Other Securities | 0.1 | 858 | ||||||||||
|
| |||||||||||
Sweden — 0.0% |
| |||||||||||
Other Securities | 0.0 | 324 | ||||||||||
|
| |||||||||||
Total Preferred Stock (Cost $1,297) ($ Thousands) |
| 1,182 | ||||||||||
|
| |||||||||||
Number of Rights | ||||||||||||
RIGHT — 0.0% |
| |||||||||||
Canada — 0.0% |
| |||||||||||
Yamana Gold, Expires 12/15/16* | 0.0 | 4 | 1 | |||||||||
|
| |||||||||||
Total Right |
| 1 | ||||||||||
|
| |||||||||||
| Description | Percentage of Net Assets (%) | Shares | Market Value ($ Thousands) | |||||||||
CASH EQUIVALENT — 3.9% |
| |||||||||||
SEI Daily Income Trust, Government Fund, Cl A 0.210%**† | 3.9 | % | 40,662,039 | $ | 40,662 | |||||||
|
| |||||||||||
Total Cash Equivalent |
| 40,662 | ||||||||||
|
| |||||||||||
Total Investments — 100.0% |
| $ | 1,054,329 | |||||||||
|
| |||||||||||
A list of the open futures contracts held by the Fund at November 30, 2016, is as follows:
| Type of Contract | Number of Contracts Long | Expiration Date | Unrealized Appreciation (Depreciation) ($ Thousands) | |||||||||
DJ Euro Stoxx 50 Index | 76 | Dec-2016 | $ | 8 | ||||||||
FTSE 100 Index | 17 | Dec-2016 | (41 | ) | ||||||||
Hang Seng Index | 3 | Dec-2016 | 2 | |||||||||
S&P 500 Index E-MINI | 102 | Dec-2016 | 90 | |||||||||
SPI 200 Index | 10 | Dec-2016 | 2 | |||||||||
Topix Index | 18 | Dec-2016 | 127 | |||||||||
|
| |||||||||||
| $ | 188 | |||||||||||
|
| |||||||||||
For the period ended November 30, 2016, the total amount of all open futures contracts, as presented in the table above, are representative of the volume of activity for this derivative type during the period.
A list of the open forward foreign currency contracts held by the Fund at November 30, 2016, is as follows:
Settlement Date | Currency to Deliver (Thousands) | Currency To Receive (Thousands) | Unrealized Appreciation (Depreciation) ($ Thousands) | |||||||||||||
12/16/16 | USD | 30 | DKK | 213 | $ | — | ||||||||||
12/16/16 | USD | 7 | DKK | 52 | — | |||||||||||
12/16/16 | USD | 31 | SEK | 283 | — | |||||||||||
12/16/16 | USD | 24 | SEK | 225 | — | |||||||||||
12/16/16 | USD | 68 | HKD | 530 | — | |||||||||||
12/16/16 | USD | 81 | SGD | 116 | — | |||||||||||
12/16/16 | USD | 82 | NOK | 704 | 1 | |||||||||||
12/16/16 | USD | 160 | CHF | 162 | (1 | ) | ||||||||||
12/16/16 | USD | 57 | AUD | 78 | — | |||||||||||
12/16/16 | USD | 127 | AUD | 170 | (1 | ) | ||||||||||
12/16/16 | USD | 149 | NZD | 211 | 1 | |||||||||||
12/16/16 | USD | 80 | NZD | 112 | (1 | ) | ||||||||||
12/16/16 | USD | 320 | JPY | 35,784 | (5 | ) | ||||||||||
12/16/16 | USD | 497 | EUR | 469 | — | |||||||||||
12/16/16 | USD | 124 | EUR | 116 | — | |||||||||||
12/16/16 | USD | 466 | GBP | 373 | — | |||||||||||
12/16/16 | USD | 189 | GBP | 151 | — | |||||||||||
12/16/16 | USD | 690 | CAD | 926 | (1 | ) | ||||||||||
12/16/16 | SGD | 15,240 | USD | 10,702 | 61 | |||||||||||
12/16/16 | SGD | 122 | USD | 85 | — | |||||||||||
12/16/16 | NZD | 15,866 | USD | 11,213 | (25 | ) | ||||||||||
12/16/16 | CHF | 16,937 | USD | 16,790 | 138 | |||||||||||
| 22 | SEI Institutional Investments Trust / Semi-Annual Report / November 30, 2016 |
Settlement Date | Currency to Deliver (Thousands) | Currency To Receive (Thousands) | Unrealized Appreciation (Depreciation) ($ Thousands) | |||||||||||||
12/16/16 | DKK | 17,313 | USD | 2,473 | $ | 1 | ||||||||||
12/16/16 | DKK | 328 | USD | 47 | — | |||||||||||
12/16/16 | AUD | 33 | USD | 25 | — | |||||||||||
12/16/16 | AUD | 18,726 | USD | 13,792 | (37 | ) | ||||||||||
12/16/16 | GBP | 19,671 | USD | 24,543 | (46 | ) | ||||||||||
12/16/16 | SEK | 35,725 | USD | 3,873 | (2 | ) | ||||||||||
12/16/16 | EUR | 37,943 | USD | 40,328 | 41 | |||||||||||
12/16/16 | EUR | 723 | USD | 764 | (3 | ) | ||||||||||
12/16/16 | CAD | 53,679 | USD | 40,062 | 129 | |||||||||||
12/16/16 | CAD | 637 | USD | 472 | (2 | ) | ||||||||||
12/16/16 | NOK | 55,182 | USD | 6,459 | (25 | ) | ||||||||||
12/16/16 | HKD | 124,862 | USD | 16,100 | — | |||||||||||
12/16/16 | HKD | 331 | USD | 43 | — | |||||||||||
12/16/16 | JPY | 6,226,598 | USD | 56,127 | 1,417 | |||||||||||
|
| |||||||||||||||
| $ | 1,640 | |||||||||||||||
|
| |||||||||||||||
A list of the counterparties for the open forward foreign currency contracts held by the Fund at November 30, 2016, is as follows:
| Counterparty | Currency to Deliver ($ Thousands) | Currency to Receive ($ Thousands) | Unrealized Appreciation ($ Thousands) | |||||||||
Brown Brothers Harriman | $ | (245,432 | ) | $ | 247,072 | $ | 1,640 | |||||
|
| |||||||||||
| $ | 1,640 | |||||||||||
|
| |||||||||||
For the period ended period, the total amount of all open forward foreign currency contracts, as presented in the table above, are representative of the volume of activity for this derivative type during the period.
Percentages are based on a Net Assets of $1,054,060 ($ Thousands).
| * | Non-income producing security. |
| ** | The rate reported is the 7-day effective yield as of November 30, 2016. |
| ‡ | Real Estate Investment Trust. |
| † | Investment in Affiliated Security (see Note 6). |
| (A) | Security exempt from registration under Rule 144A of the Securities Act of 1933. These securities may be resold in transactions exempt from registration normally to qualified institutions. On November 30, 2016, the value of these securities amounted to $2,101 ($ Thousands), representing 0.2% of the net assets of the Fund. |
AUD — Australian Dollar
CAD — Canadian Dollar
CHF — Swiss Franc
Cl — Class
DJ — Dow Jones
DKK — Danish Krone
EUR — Euro
FTSE — Financial Times and Stock Exchange
GBP — British Pound Sterling
HKD — Hong Kong Dollar
JPY — Japanese Yen
NOK — Norwegian Krone
NZD — New Zealand Dollar
S&P — Standard & Poor’s
SGD — Singapore Dollar
SEK — Swedish Krona
SPI — Share Price Index
USD — United States Dollar
The Summary Schedule of Investments does not reflect the complete portfolio holdings. It includes the Fund’s 50 largest holdings and each investment of any issuer that exceeds 1% of the Fund’s net assets. “Other Securities” represent all issues not required to be disclosed under the rules adopted by the U.S. Securities and Exchange Commission (“SEC”). In certain instances, securities for which footnotes listed above may otherwise apply are included in the Other Securities caption. The complete schedule of portfolio holdings is available (i) without charge, upon request, by calling (800) 342-5734; and (ii) on the SEC’s website at http://www.sec.gov.
The following is a list of the level of inputs used as of November 30, 2016, in valuing the Fund’s investments and other financial instruments carried at value ($ Thousands):
| Investments in Securities | Level 1 | Level 2 | Level 3 | Total | ||||||||||||
Common Stock | $ | 1,008,718 | $ | 3,766 | $ | — | $ | 1,012,484 | ||||||||
Preferred Stock | 1,182 | — | — | 1,182 | ||||||||||||
Right | 1 | — | — | 1 | ||||||||||||
Cash Equivalent | 40,662 | — | — | 40,662 | ||||||||||||
|
|
|
|
|
|
|
| |||||||||
Total Investments in Securities | $ | 1,050,563 | $ | 3,766 | $ | — | $ | 1,054,329 | ||||||||
|
|
|
|
|
|
|
| |||||||||
| Other Financial Instruments | Level 1 | Level 2 | Level 3 | Total | ||||||||||||
Futures Contracts* | ||||||||||||||||
Unrealized Appreciation | $ | 229 | $ | — | $ | — | $ | 229 | ||||||||
Unrealized Depreciation | (41 | ) | — | — | (41 | ) | ||||||||||
Forwards Contracts* | ||||||||||||||||
Unrealized Appreciation | — | 1,789 | — | 1,789 | ||||||||||||
Unrealized Depreciation | — | (149 | ) | — | (149 | ) | ||||||||||
|
|
|
|
|
|
|
| |||||||||
Total Other Financial Instruments | $ | 188 | $ | 1,640 | $ | — | $ | 1,828 | ||||||||
|
|
|
|
|
|
|
| |||||||||
| * | Futures contracts and forwards contracts are valued at the unrealized appreciation (depreciation) on the instrument. |
For the period ended November 30, 2016, there were transfers between Level 1 and Level 2 assets and liabilities. The primary reason for changes in the classifications between Levels 1 and 2 occurs when foreign equity securities are fair valued using other observable market-based inputs in place of the closing exchange price due to events occurring after the close of the exchange or market on which the investment is principally traded.
For the period ended November 30, 2016, there were no transfers between Level 2 and Level 3 assets and liabilities.
For more information on valuation inputs, see Note 2 — Significant Accounting Policies in Notes to Financial Statements.
Amounts designated as “—” are either $0 or have been rounded to $0.
The accompanying notes are an integral part of the financial statements.
| SEI Institutional Investments Trust / Semi-Annual Report / November 30, 2016 | 23 |
SUMMARY SCHEDULE OF INVESTMENTS (Unaudited)
World Equity Ex-US Fund
November 30, 2016
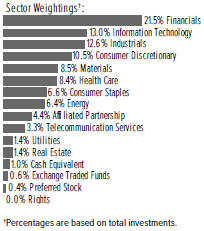
| Description | Percentage of Net Assets (%) | Shares | Market Value ($ Thousands) | |||||||||
COMMON STOCK — 94.6% |
| |||||||||||
Argentina — 0.7% | ||||||||||||
Other Securities | 0.7 | % | $ | 48,144 | ||||||||
|
| |||||||||||
Australia — 4.9% | ||||||||||||
Boral* | 0.0 | 344,728 | 1,223 | |||||||||
Other Securities‡ (A) | 4.9 | 349,695 | ||||||||||
|
| |||||||||||
Austria — 1.0% | ||||||||||||
Other Securities (A) | 1.0 | 67,955 | ||||||||||
|
| |||||||||||
Belgium — 0.4% | ||||||||||||
Other Securities | 0.4 | 27,395 | ||||||||||
|
| |||||||||||
Brazil — 2.3% | ||||||||||||
Other Securities (A) | 2.3 | 160,659 | ||||||||||
|
| |||||||||||
Canada — 5.5% | ||||||||||||
Bank of Montreal | 0.5 | 522,300 | 34,389 | |||||||||
Magna International, Cl A | 0.4 | 727,752 | 29,378 | |||||||||
Toronto-Dominion Bank | 0.5 | 707,400 | 33,523 | |||||||||
Other Securities (A) | 4.1 | 296,558 | ||||||||||
|
| |||||||||||
| 393,848 | ||||||||||||
|
| |||||||||||
Chile — 0.0% | ||||||||||||
Other Securities | 0.0 | 2,921 | ||||||||||
|
| |||||||||||
China — 1.8% | ||||||||||||
Alibaba Group Holding ADR* (A) | 0.4 | 319,061 | 29,998 | |||||||||
China Life Insurance | 0.4 | 10,045,000 | 29,203 | |||||||||
Other Securities (A) | 1.0 | 66,095 | ||||||||||
|
| |||||||||||
| 125,296 | ||||||||||||
|
| |||||||||||
Colombia — 0.3% | ||||||||||||
Other Securities (A) | 0.3 | 22,975 | ||||||||||
|
| |||||||||||
Czech Republic — 0.1% | ||||||||||||
Other Securities | 0.1 | 9,907 | ||||||||||
|
| |||||||||||
| Description | Percentage of Net Assets (%) | Shares | Market Value ($ Thousands) | |||||||||
Denmark — 1.5% | ||||||||||||
Other Securities (B) | 1.5 | % | $ | 106,252 | ||||||||
|
| |||||||||||
Finland — 1.1% | ||||||||||||
Other Securities (A) | 1.1 | 81,394 | ||||||||||
|
| |||||||||||
France — 5.3% | ||||||||||||
TOTAL | 0.5 | 726,184 | 34,631 | |||||||||
Other Securities (A) | 4.8 | 342,546 | ||||||||||
|
| |||||||||||
| 377,177 | ||||||||||||
|
| |||||||||||
Germany — 5.5% | ||||||||||||
Deutsche Boerse | 0.7 | 624,803 | 48,457 | |||||||||
Merck KGaA | 0.4 | 281,046 | 28,186 | |||||||||
SAP | 0.6 | 469,356 | 39,274 | |||||||||
Siemens | 0.7 | 431,267 | 48,768 | |||||||||
Other Securities | 3.1 | 226,544 | ||||||||||
|
| |||||||||||
| 391,229 | ||||||||||||
|
| |||||||||||
Hong Kong — 4.7% | ||||||||||||
AIA Group | 0.6 | 6,479,400 | 39,511 | |||||||||
China Mobile | 0.4 | 2,882,100 | 31,453 | |||||||||
Hong Kong Exchanges and Clearing | 0.6 | 1,641,671 | 43,176 | |||||||||
Tencent Holdings | 0.4 | 1,261,172 | 31,494 | |||||||||
Other Securities (B) | 2.7 | 188,919 | ||||||||||
|
| |||||||||||
| 334,553 | ||||||||||||
|
| |||||||||||
Hungary — 0.2% | ||||||||||||
Other Securities | 0.2 | 12,908 | ||||||||||
|
| |||||||||||
India — 1.2% | ||||||||||||
Other Securities | 1.2 | 84,831 | ||||||||||
|
| |||||||||||
Indonesia — 0.8% | ||||||||||||
Other Securities (A) | 0.8 | 56,607 | ||||||||||
|
| |||||||||||
Ireland — 1.2% | ||||||||||||
Ryanair Holdings ADR* | 0.4 | 354,564 | 28,309 | |||||||||
Other Securities | 0.8 | 60,157 | ||||||||||
|
| |||||||||||
| 88,466 | ||||||||||||
|
| |||||||||||
Israel — 1.2% | ||||||||||||
Teva Pharmaceutical Industries ADR | 0.6 | 1,165,470 | 43,938 | |||||||||
Other Securities (A) | 0.6 | 40,039 | ||||||||||
|
| |||||||||||
| 83,977 | ||||||||||||
|
| |||||||||||
Italy — 1.2% | ||||||||||||
Other Securities (A) | 1.2 | 83,810 | ||||||||||
|
| |||||||||||
Japan — 12.2% | ||||||||||||
Denso | 0.7 | 1,155,400 | 50,497 | |||||||||
KDDI | 0.6 | 1,515,585 | 39,890 | |||||||||
Olympus | 0.4 | 810,400 | 28,591 | |||||||||
Omron | 0.4 | 775,600 | 28,725 | |||||||||
Recruit Holdings | 0.5 | 849,062 | 32,526 | |||||||||
| 24 | SEI Institutional Investments Trust / Semi-Annual Report / November 30, 2016 |
| Description | Percentage of Net Assets (%) | Shares | Market Value ($ Thousands) | |||||||||
Other Securities | 9.6 | % | $ | 688,984 | ||||||||
|
| |||||||||||
| 869,213 | ||||||||||||
|
| |||||||||||
Malaysia — 0.5% | ||||||||||||
Other Securities | 0.5 | 34,106 | ||||||||||
|
| |||||||||||
Mexico — 0.5% | ||||||||||||
Other Securities | 0.5 | 37,999 | ||||||||||
|
| |||||||||||
Netherlands — 3.2% | ||||||||||||
Heineken | 0.4 | 393,420 | 29,515 | |||||||||
ING Groep | 0.4 | 2,066,231 | 28,166 | |||||||||
Koninklijke Ahold Delhaize | 0.5 | 1,664,512 | 32,860 | |||||||||
Other Securities (A) (B) | 1.9 | 140,740 | ||||||||||
|
| |||||||||||
| 231,281 | ||||||||||||
|
| |||||||||||
Norway — 1.6% | ||||||||||||
DnB | 0.4 | 1,999,351 | 29,451 | |||||||||
Other Securities (A) | 1.2 | 84,393 | ||||||||||
|
| |||||||||||
| 113,844 | ||||||||||||
|
| |||||||||||
Panama — 0.2% | ||||||||||||
Other Securities (A) | 0.2 | 12,993 | ||||||||||
|
| |||||||||||
Peru — 0.3% | ||||||||||||
Other Securities | 0.3 | 24,675 | ||||||||||
|
| |||||||||||
Poland — 0.1% | ||||||||||||
Other Securities | 0.1 | 7,286 | ||||||||||
|
| |||||||||||
Portugal — 0.4% | ||||||||||||
Other Securities | 0.4 | 26,175 | ||||||||||
|
| |||||||||||
Russia — 1.2% | ||||||||||||
Lukoil PJSC ADR (A) | 0.5 | 690,100 | 33,960 | |||||||||
Other Securities | 0.7 | 49,605 | ||||||||||
|
| |||||||||||
| 83,565 | ||||||||||||
|
| |||||||||||
Singapore — 1.0% | ||||||||||||
DBS Group Holdings | 0.4 | 2,364,900 | 28,975 | |||||||||
Other Securities | 0.6 | 40,019 | ||||||||||
|
| |||||||||||
| 68,994 | ||||||||||||
|
| |||||||||||
South Africa — 1.3% | ||||||||||||
Naspers, Cl N | 0.5 | 256,094 | 37,518 | |||||||||
Other Securities (A) | 0.8 | 55,932 | ||||||||||
|
| |||||||||||
| 93,450 | ||||||||||||
|
| |||||||||||
South Korea — 3.5% | ||||||||||||
NAVER | 0.5 | 50,587 | 34,531 | |||||||||
Samsung Electronics | 1.6 | 74,406 | 111,127 | |||||||||
Other Securities | 1.4 | 101,685 | ||||||||||
|
| |||||||||||
| 247,343 | ||||||||||||
|
| |||||||||||
Spain — 1.8% | ||||||||||||
Amadeus IT Group, Cl A | 0.5 | 794,270 | 36,028 | |||||||||
Banco Bilbao Vizcaya Argentaria | 0.4 | 4,605,928 | 28,466 | |||||||||
| Description | Percentage of Net Assets (%) | Shares | Market Value ($ Thousands) | |||||||||
Other Securities | 0.9 | % | $ | 65,361 | ||||||||
|
| |||||||||||
| 129,855 | ||||||||||||
|
| |||||||||||
Sweden — 1.9% | ||||||||||||
Other Securities | 1.9 | 137,266 | ||||||||||
|
| |||||||||||
Switzerland — 4.4% | ||||||||||||
Actelion | 0.6 | 201,241 | 38,721 | |||||||||
Cie Financiere Richemont (A) | 0.6 | 694,205 | 45,285 | |||||||||
Nestle | 0.4 | 462,378 | 31,048 | |||||||||
Other Securities (A) | 2.8 | 199,329 | ||||||||||
|
| |||||||||||
| 314,383 | ||||||||||||
|
| |||||||||||
Taiwan — 3.4% | ||||||||||||
Hon Hai Precision Industry | 0.7 | 18,029,779 | 46,385 | |||||||||
Taiwan Semiconductor Manufacturing | 0.4 | 5,565,000 | 31,952 | |||||||||
Taiwan Semiconductor Manufacturing ADR | 1.1 | 2,615,744 | 77,661 | |||||||||
Other Securities (A) | 1.2 | 88,249 | ||||||||||
|
| |||||||||||
| 244,247 | ||||||||||||
|
| |||||||||||
Thailand — 0.5% | ||||||||||||
Other Securities | 0.5 | 38,752 | ||||||||||
|
| |||||||||||
Turkey — 0.7% | ||||||||||||
Other Securities | 0.7 | 49,594 | ||||||||||
|
| |||||||||||
United Arab Emirates — 0.3% | ||||||||||||
Other Securities | 0.3 | 20,441 | ||||||||||
|
| |||||||||||
United Kingdom — 11.3% | ||||||||||||
Barclays | 0.5 | 13,978,612 | 37,716 | |||||||||
BT Group, Cl A | 0.5 | 8,152,909 | 36,375 | |||||||||
HSBC Holdings | 0.4 | 3,539,948 | 28,094 | |||||||||
Imperial Brands | 0.4 | 650,428 | 27,898 | |||||||||
Kingfisher | 0.4 | 7,159,864 | 31,587 | |||||||||
Rio Tinto | 0.6 | 1,102,506 | 41,187 | |||||||||
Royal Dutch Shell ADR, Cl A | 0.3 | 435,300 | 22,244 | |||||||||
Royal Dutch Shell, Cl A (GBP) (A) | 0.0 | 120,089 | 3,040 | |||||||||
Royal Dutch Shell, Cl A (A) | 0.9 | 2,575,497 | 65,516 | |||||||||
Shire | 0.6 | 785,083 | 45,709 | |||||||||
Other Securities (A) | 6.7 | 469,599 | ||||||||||
|
| |||||||||||
| 808,965 | ||||||||||||
|
| |||||||||||
United States — 3.4% | ||||||||||||
Carnival, Cl A | 0.4 | 573,380 | 29,477 | |||||||||
Core Laboratories (A) | 0.4 | 264,870 | 29,602 | |||||||||
ICON* | 0.8 | 757,455 | 57,294 | |||||||||
Other Securities | 1.8 | 127,506 | ||||||||||
|
| |||||||||||
| 243,879 | ||||||||||||
|
| |||||||||||
Total Common Stock (Cost $6,475,308) ($ Thousands) | 6,749,528 | |||||||||||
|
| |||||||||||
| SEI Institutional Investments Trust / Semi-Annual Report / November 30, 2016 | 25 |
SUMMARY SCHEDULE OF INVESTMENTS (Unaudited)
World Equity Ex-US Fund (Concluded)
November 30, 2016
| Description | Percentage of Net Assets (%) | Shares | Market Value ($ Thousands) | |||||||||
EXCHANGE TRADED FUNDS — 0.6% |
| |||||||||||
United States — 0.4% | 0.4 | % | 490 | $ | 27,830 | |||||||
|
| |||||||||||
Other Securities | 0.2 | 12,323 | ||||||||||
|
| |||||||||||
Total Exchange Traded Funds (Cost $40,311) ($ Thousands) | 40,153 | |||||||||||
|
| |||||||||||
PREFERRED STOCK — 0.4% |
| |||||||||||
Brazil — 0.4% | ||||||||||||
Other Securities | 0.4 | 28,677 | ||||||||||
|
| |||||||||||
Total Preferred Stock (Cost $34,194) ($ Thousands) | 28,677 | |||||||||||
|
| |||||||||||
| Number of Rights | ||||||||||||
RIGHTS — 0.0% | ||||||||||||
Australia — 0.0% | ||||||||||||
Other Securities | 0.0 | 60 | ||||||||||
|
| |||||||||||
Canada — 0.0% | ||||||||||||
Yamana Gold, Expires 12/15/16 | 0.0 | 70 | 17 | |||||||||
|
| |||||||||||
Total Rights (Cost $30) ($ Thousands) | 77 | |||||||||||
|
| |||||||||||
| Shares | ||||||||||||
AFFILIATED PARTNERSHIP — 4.2% |
| |||||||||||
SEI Liquidity Fund, L.P. 0.470%**† (C) | 4.4 | 301,753,669 | 301,754 | |||||||||
|
| |||||||||||
Total Affiliated Partnership (Cost $301,754) ($ Thousands) | 301,754 | |||||||||||
|
| |||||||||||
CASH EQUIVALENT — 1.0% |
| |||||||||||
SEI Daily Income Trust, Government Fund, Cl A 0.210%**† | 1.0 | 73,582,079 | 73,582 | |||||||||
|
| |||||||||||
Total Cash Equivalent (Cost $73,582) ($ Thousands) | 73,582 | |||||||||||
|
| |||||||||||
Total Investments — 100.8% (Cost $6,925,179)($ Thousands) | $ | 7,193,771 | ||||||||||
|
| |||||||||||
A list of the open futures contracts held by the Fund at November 30, 2016, is as follows:
| Type of Contract | Number of Contracts Long | Expiration Date | Unrealized Appreciation (Depreciation) ($ Thousands) | |||||||||
DJ Euro Stoxx 50 Index | 1,366 | Dec-2016 | $ | 313 | ||||||||
FTSE 100 Index | 303 | Dec-2016 | (25 | ) | ||||||||
Hang Seng Index | 43 | Dec-2016 | 16 | |||||||||
S&P TSX 60 Index | 100 | Dec-2016 | 241 | |||||||||
SPI 200 Index | 114 | Dec-2016 | 172 | |||||||||
Topix Index | 262 | Dec-2016 | 1,610 | |||||||||
|
| |||||||||||
| $ | 2,327 | |||||||||||
|
| |||||||||||
For the period ended November 30, 2016, the total amount of all open futures contracts, as presented in the table above, are representative of the volume of activity for this derivative type during the period.
Percentages are based on a Net Assets of $7,134,635 ($ Thousands).
| * | Non-income producing security. |
| ** | The rate reported is the 7-day effective yield as of November 30, 2016. |
| † | Investment in Affiliated Security (see Note 6). |
| (A) | Certain securities or partial positions of certain securities are on loan at November 30, 2016, (see Note 12). The total market value of securities on loan at November 30, 2016, was $289,406 ($ Thousands). |
| (B) | Security exempt from registration under Rule 144A of the Securities Act of 1933. These securities may be resold in transactions exempt from registration normally to qualified institutions. On November 30, 2016, the value of these securities amounted to $42,241 ($ Thousands), representing 0.6% of the net assets of the Fund. |
| (C) | This security was purchased with cash collateral held from securities on loan. The total value of such securities as of November 30, 2016 was $301,754 ($ Thousands). |
| ADR | — American Depositary Receipt |
| Cl | — Class |
| DJ | — Dow Jones |
| EAFE | — Europe, Australasia and Far East |
| ETF | — Exchange Traded Fund |
| FTSE | — Financial Times and Stock Exchange |
| GBP | — Great British Pound |
| L.P. | — Limited Partnership |
| MSCI | — Morgan Stanley Capital International |
| S&P | — Standard & Poor’s |
| SPI | — Share Price Index |
| TSX | — Toronto Stock Exchange |
The Summary Schedule of Investments does not reflect the complete portfolio holdings. It includes the Fund’s 50 largest holdings and each investment of any issuer that exceeds 1% of the Fund’s net assets. “Other Securities” represent all issues not required to be disclosed under the rules adopted by the U.S. Securities and Exchange Commission (“SEC”). In certain instances, securities for which footnotes listed above may otherwise apply are included in the Other Securities caption. The complete schedule of portfolio holdings is available (i) without charge, upon request, by calling (800) 342-5734; and (ii) on the SEC’s website at http://www.sec.gov.
| 26 | SEI Institutional Investments Trust / Semi-Annual Report / November 30, 2016 |
The following is a list of the level of inputs used as of November 30, 2016, in valuing the Fund’s investments and other financial instruments carried at value ($ Thousands):
| Investments in Securities | Level 1 | Level 2 | Level 3 | Total | ||||||||||||
Common Stock | $ | 6,748,874 | $ | 654 | $ | — | $ | 6,749,528 | ||||||||
Exchange Traded Funds | 40,153 | — | — | 40,153 | ||||||||||||
Preferred Stock | 28,677 | — | — | 28,677 | ||||||||||||
Rights | 77 | — | — | 77 | ||||||||||||
Affiliated Partnership | — | 301,754 | — | 301,754 | ||||||||||||
Cash Equivalent | 73,582 | — | — | 73,582 | ||||||||||||
|
|
|
|
|
|
|
| |||||||||
Total Investments in Securities | $ | 6,891,363 | $ | 302,408 | $ | — | $ | 7,193,771 | ||||||||
|
|
|
|
|
|
|
| |||||||||
| Other Financial Instruments | Level 1 | Level 2 | Level 3 | Total | ||||||||||||
Futures Contracts* | ||||||||||||||||
Unrealized Appreciation | $ | 2,352 | $ | — | $ | — | $ | 2,352 | ||||||||
Unrealized Depreciation | (25 | ) | — | — | (25 | ) | ||||||||||
|
|
|
|
|
|
|
| |||||||||
Total Other Financial Instruments | $ | 2,327 | $ | — | $ | — | $ | 2,327 | ||||||||
|
|
|
|
|
|
|
| |||||||||
| * | Futures contracts are valued at the unrealized appreciation (depreciation) on the instrument. |
For the period ended November 30, 2016, there were transfers between Level 1 and Level 2 assets and liabilities. The primary reason for changes in the classifications between Levels 1 and 2 occurs when foreign equity securities are fair valued using other observable market-based inputs in place of the closing exchange price due to events occurring after the close of the exchange or market on which the investment is principally traded.
For the period ended November 30, 2016, there were no transfers between Level 2 and Level 3 assets and liabilities.
For more information on valuation inputs, see Note 2 —Significant Accounting Policies in Notes to Financial Statements.
Amounts designated as “—” are either $0 or have been rounded to $0.
The accompanying notes are an integral part of the financial statements.
| SEI Institutional Investments Trust / Semi-Annual Report / November 30, 2016 | 27 |
SUMMARY SCHEDULE OF INVESTMENTS (Unaudited)
Screened World Equity Ex-US Fund
November 30, 2016
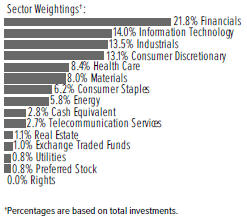
| Description | Percentage of Net Assets (%) | Shares | Market Value ($ Thousands) | |||||||||
COMMON STOCK — 92.5% |
| |||||||||||
Argentina — 0.6% | ||||||||||||
MercadoLibre | 0.5 | % | 2,936 | $ | 463 | |||||||
Other Securities | 0.1 | % | 27 | |||||||||
|
| |||||||||||
| 490 | ||||||||||||
|
| |||||||||||
Australia — 3.3% | ||||||||||||
Cochlear | 0.5 | 5,158 | 452 | |||||||||
Commonwealth Bank of Australia | 0.6 | 9,650 | 561 | |||||||||
Rio Tinto | 0.3 | 5,991 | 256 | |||||||||
Other Securities‡ | 1.9 | 1,598 | ||||||||||
|
| |||||||||||
| 2,867 | ||||||||||||
|
| |||||||||||
Austria — 2.3% | ||||||||||||
Other Securities | 2.3 | 2,023 | ||||||||||
|
| |||||||||||
Belgium — 0.2% | ||||||||||||
Other Securities | 0.2 | 129 | ||||||||||
|
| |||||||||||
Brazil — 0.7% | ||||||||||||
Other Securities | 0.7 | 576 | ||||||||||
|
| |||||||||||
Canada — 6.4% | ||||||||||||
Bank of Montreal | 0.8 | 10,900 | 718 | |||||||||
Fairfax Financial Holdings | 0.5 | 840 | 399 | |||||||||
Royal Bank of Canada | 0.6 | 8,200 | 531 | |||||||||
Toronto-Dominion Bank | 0.6 | 11,200 | 529 | |||||||||
Other Securities | 3.9 | 3,418 | ||||||||||
|
| |||||||||||
| 5,595 | ||||||||||||
|
| |||||||||||
China — 2.3% | ||||||||||||
Alibaba Group Holding ADR* | 0.5 | 4,611 | 433 | |||||||||
China Life Insurance | 0.7 | 207,000 | 602 | |||||||||
Other Securities | 1.1 | 1,002 | ||||||||||
|
| |||||||||||
| 2,037 | ||||||||||||
|
| |||||||||||
| Description | Percentage of Net Assets (%) | Shares | Market Value ($ Thousands) | |||||||||
Colombia — 0.3% |
| |||||||||||
Other Securities | 0.3 | % | $ | 282 | ||||||||
|
| |||||||||||
Czech Republic — 0.2% |
| |||||||||||
Other Securities | 0.2 | 201 | ||||||||||
|
| |||||||||||
Denmark — 1.3% |
| |||||||||||
Other Securities | 1.3 | 1,113 | ||||||||||
|
| |||||||||||
Finland — 1.6% |
| |||||||||||
Other Securities | 1.6 | 1,411 | ||||||||||
|
| |||||||||||
France — 5.4% |
| |||||||||||
Other Securities | 5.4 | 4,753 | ||||||||||
|
| |||||||||||
Germany — 3.7% |
| |||||||||||
Continental | 0.6 | 2,802 | 498 | |||||||||
Other Securities | 3.1 | 2,708 | ||||||||||
|
| |||||||||||
| 3,206 | ||||||||||||
|
| |||||||||||
Hong Kong — 3.7% |
| |||||||||||
China Construction Bank | 0.5 | 556,000 | 414 | |||||||||
Hong Kong Exchanges and | ||||||||||||
Clearing | 0.5 | 15,300 | 402 | |||||||||
Other Securities | 2.7 | 2,452 | ||||||||||
|
| |||||||||||
| 3,268 | ||||||||||||
|
| |||||||||||
Hungary — 0.2% |
| |||||||||||
Other Securities | 0.2 | 198 | ||||||||||
|
| |||||||||||
India — 1.3% |
| |||||||||||
HDFC Bank ADR | 0.5 | 7,406 | 478 | |||||||||
ICICI Bank ADR | 0.5 | 58,826 | 461 | |||||||||
Other Securities | 0.3 | 233 | ||||||||||
|
| |||||||||||
| 1,172 | ||||||||||||
|
| |||||||||||
Indonesia — 1.0% |
| |||||||||||
Other Securities | 1.0 | 915 | ||||||||||
|
| |||||||||||
Ireland — 1.0% | ||||||||||||
Ryanair Holdings ADR* | 0.6 | 6,690 | 534 | |||||||||
Other Securities | 0.4 | 332 | ||||||||||
|
| |||||||||||
| 866 | ||||||||||||
|
| |||||||||||
Israel — 1.0% |
| |||||||||||
Other Securities | 1.0 | 888 | ||||||||||
|
| |||||||||||
Italy — 1.3% |
| |||||||||||
Prysmian | 0.5 | 18,503 | 443 | |||||||||
Other Securities | 0.8 | 684 | ||||||||||
|
| |||||||||||
| 1,127 | ||||||||||||
|
| |||||||||||
Japan — 10.7% |
| |||||||||||
Denso | 1.2 | 23,600 | 1,031 | |||||||||
Japan Exchange Group | 0.6 | 33,300 | 495 | |||||||||
Mitsui Sumitomo Insurance | ||||||||||||
Group Holdings | 0.5 | 14,500 | 452 | |||||||||
Secom | 0.6 | 6,700 | 489 | |||||||||
| 28 | SEI Institutional Investments Trust / Semi-Annual Report / November 30, 2016 |
| Description | Percentage of Net Assets (%) | Shares | Market Value ($ Thousands) | |||||||||
Toyota Motor | 0.5 | % | 8,100 | $ | 473 | |||||||
Other Securities | 7.3 | 6,408 | ||||||||||
|
| |||||||||||
| 9,348 | ||||||||||||
|
| |||||||||||
Malaysia — 0.3% |
| |||||||||||
Other Securities | 0.3 | 293 | ||||||||||
|
| |||||||||||
Mexico — 0.4% |
| |||||||||||
Other Securities | 0.4 | 367 | ||||||||||
|
| |||||||||||
Netherlands — 1.6% |
| |||||||||||
Unilever | 0.9 | 19,595 | 787 | |||||||||
Other Securities | 0.7 | 632 | ||||||||||
|
| |||||||||||
| 1,419 | ||||||||||||
|
| |||||||||||
New Zealand — 0.1% |
| |||||||||||
Other Securities | 0.1 | 48 | ||||||||||
|
| |||||||||||
Norway — 1.8% |
| |||||||||||
DnB | 0.7 | 41,581 | 613 | |||||||||
Other Securities | 1.1 | 958 | ||||||||||
|
| |||||||||||
| 1,571 | ||||||||||||
|
| |||||||||||
Panama — 0.3% |
| |||||||||||
Other Securities | 0.3 | 250 | ||||||||||
|
| |||||||||||
Peru — 0.4% |
| |||||||||||
Other Securities | 0.4 | 319 | ||||||||||
|
| |||||||||||
Philippines — 0.1% |
| |||||||||||
Other Securities | 0.1 | 53 | ||||||||||
|
| |||||||||||
Poland — 0.2% |
| |||||||||||
Other Securities | 0.2 | 186 | ||||||||||
|
| |||||||||||
Portugal — 0.2% |
| |||||||||||
Other Securities | 0.2 | 142 | ||||||||||
|
| |||||||||||
Qatar — 0.2% |
| |||||||||||
Other Securities | 0.2 | 200 | ||||||||||
|
| |||||||||||
Russia — 1.8% |
| |||||||||||
Rosneft PJSC GDR | 0.5 | 76,108 | 401 | |||||||||
Other Securities | 1.3 | 1,133 | ||||||||||
|
| |||||||||||
| 1,534 | ||||||||||||
|
| |||||||||||
Singapore — 1.3% |
| |||||||||||
DBS Group Holdings | 0.5 | 37,400 | 458 | |||||||||
Other Securities | 0.8 | 712 | ||||||||||
|
| |||||||||||
| 1,170 | ||||||||||||
|
| |||||||||||
South Africa — 1.6% |
| |||||||||||
Naspers, Cl N | 0.8 | 4,831 | 708 | |||||||||
Other Securities | 0.8 | 725 | ||||||||||
|
| |||||||||||
| 1,433 | ||||||||||||
|
| |||||||||||
South Korea — 3.8% |
| |||||||||||
Samsung Electronics | 2.5 | 1,459 | 2,179 | |||||||||
Other Securities | 1.3 | 1,111 | ||||||||||
|
| |||||||||||
| 3,290 | ||||||||||||
|
| |||||||||||
| Description | Percentage of Net Assets (%) | Shares | Market Value ($ Thousands) | |||||||||
Spain — 1.9% |
| |||||||||||
Amadeus IT Group, Cl A | 0.8 | % | 15,768 | $ | 715 | |||||||
Industria de Diseno Textil | 0.5 | 12,785 | 438 | |||||||||
Other Securities | 0.6 | 521 | ||||||||||
|
| |||||||||||
| 1,674 | ||||||||||||
|
| |||||||||||
Sweden — 2.7% |
| |||||||||||
Atlas Copco, Cl B | 0.6 | 18,313 | 492 | |||||||||
Svenska Handelsbanken, Cl A | 0.6 | 37,335 | 518 | |||||||||
Other Securities | 1.5 | 1,380 | ||||||||||
|
| |||||||||||
| 2,390 | ||||||||||||
|
| |||||||||||
Switzerland — 3.9% |
| |||||||||||
Nestle | 0.8 | 10,287 | 691 | |||||||||
Novartis ADR | 0.6 | 7,202 | 495 | |||||||||
Roche Holding | 0.6 | 2,511 | 559 | |||||||||
Other Securities | 1.9 | 1,640 | ||||||||||
|
| |||||||||||
| 3,385 | ||||||||||||
|
| |||||||||||
Taiwan — 4.4% |
| |||||||||||
Hon Hai Precision Industry | 0.8 | 289,411 | 745 | |||||||||
Hon Hai Precision Industry GDR | 0.4 | 65,921 | 330 | |||||||||
Taiwan Semiconductor | ||||||||||||
Manufacturing ADR | 1.8 | 52,810 | 1,568 | |||||||||
Taiwan Semiconductor | ||||||||||||
Manufacturing | 0.9 | 134,000 | 769 | |||||||||
Other Securities | 0.5 | 466 | ||||||||||
|
| |||||||||||
| 3,878 | ||||||||||||
|
| |||||||||||
Thailand — 0.9% |
| |||||||||||
Other Securities | 0.9 | 804 | ||||||||||
|
| |||||||||||
Turkey — 1.0% |
| |||||||||||
Akbank | 0.6 | 234,170 | 516 | |||||||||
Other Securities | 0.4 | 396 | ||||||||||
|
| |||||||||||
| 912 | ||||||||||||
|
| |||||||||||
United Kingdom — 11.6% |
| |||||||||||
Barclays | 0.9 | 298,822 | 806 | |||||||||
British American Tobacco | 0.8 | 12,063 | 662 | |||||||||
Diageo | 0.6 | 21,032 | 527 | |||||||||
Glencore* | 0.5 | 123,897 | 432 | |||||||||
HSBC Holdings | 1.1 | 115,664 | 918 | |||||||||
Rio Tinto | 0.5 | 10,792 | 403 | |||||||||
Rio Tinto ADR | 0.4 | 9,654 | 366 | |||||||||
Shire | 1.1 | 16,871 | 982 | |||||||||
Other Securities | 5.7 | 5,063 | ||||||||||
|
| |||||||||||
| 10,159 | ||||||||||||
|
| |||||||||||
United States — 3.5% |
| |||||||||||
Carnival, Cl A | 0.7 | 11,882 | 611 | |||||||||
Core Laboratories | 0.7 | 5,481 | 612 | |||||||||
Everest Re Group | 0.6 | 2,478 | 522 | |||||||||
| SEI Institutional Investments Trust / Semi-Annual Report / November 30, 2016 | 29 |
SUMMARY SCHEDULE OF INVESTMENTS (Unaudited)
Screened World Equity Ex-US Fund (Concluded)
November 30, 2016
| Description | Percentage of Net Assets (%) | Shares | Market Value ($ Thousands) | |||||||||
ICON* | 1.3 | % | 15,322 | $ | 1,159 | |||||||
Other Securities | 0.2 | 199 | ||||||||||
|
| |||||||||||
| 3,103 | ||||||||||||
|
| |||||||||||
Total Common Stock | 81,045 | |||||||||||
|
| |||||||||||
EXCHANGE TRADED FUNDS — 0.9% |
| |||||||||||
United States — 0.6% | ||||||||||||
iShares MSCI EAFE ETF | 0.6 | 10 | 575 | |||||||||
|
| |||||||||||
Other Securities | 0.3 | 256 | ||||||||||
|
| |||||||||||
Total Exchange Traded Funds | 831 | |||||||||||
|
| |||||||||||
PREFERRED STOCK — 0.8% |
| |||||||||||
Brazil — 0.7% |
| |||||||||||
Other Securities | 0.7 | 608 | ||||||||||
|
| |||||||||||
Germany — 0.1% |
| |||||||||||
Other Securities | 0.1 | 76 | ||||||||||
|
| |||||||||||
Total Preferred Stock | 684 | |||||||||||
|
| |||||||||||
RIGHTS — 0.0% |
| |||||||||||
Italy — 0.0% | ||||||||||||
Other Securities | 0.0 | — | ||||||||||
|
| |||||||||||
Total Rights | — | |||||||||||
|
| |||||||||||
CASH EQUIVALENT — 2.7% |
| |||||||||||
SEI Daily Income Trust, | ||||||||||||
Government Fund, Cl A 0.210%**† | 2.7 | 2,348,522 | 2,349 | |||||||||
|
| |||||||||||
Total Cash Equivalent | 2,349 | |||||||||||
|
| |||||||||||
Total Investments — 96.9% (Cost $84,069)($ Thousands) | $ | 84,909 | ||||||||||
|
| |||||||||||
A list of the open futures contracts held by the Fund at November 30, 2016, is as follows:
| Type of Contract | Number of Contracts Long | Expiration Date | Unrealized Appreciation | |||||||||
DJ Euro Stoxx 50 Index | 25 | Dec-2016 | $ | 6 | ||||||||
FTSE 100 Index | 6 | Dec-2016 | (1 | ) | ||||||||
Hang Seng Index | 1 | Dec-2016 | 1 | |||||||||
S&P TSX 60 Index | 2 | Dec-2016 | — | |||||||||
SPI 200 Index | 3 | Dec-2016 | 3 | |||||||||
Topix Index | 4 | Dec-2016 | 14 | |||||||||
|
| |||||||||||
| $ | 23 | |||||||||||
|
| |||||||||||
For the period ended November 30, 2016, the total amount of all open futures contracts, as presented in the table above, are representative of the volume of activity for this derivative type during the period.
Percentages are based on a Net Assets of $87,654 ($ Thousands).
| * | Non-income producing security. |
| ** | The rate reported is the 7-day effective yield as of November 30, 2016. |
| ‡ | Real Estate Investment Trust. |
| † | Investment in Affiliated Security (see Note 6). |
ADR — American Depositary Receipt
Cl — Class
DJ — Dow Jones
EAFE — Europe, Australasia and Far East
ETF — Exchange Traded Fund
FTSE— Financial Times and Stock Exchange
GDR — Global Depositary Receipt
MSCI — Morgan Stanley Capital International
S&P— Standard & Poor’s
SPI — Share Price Index
TSX — Toronto Stock Exchange
The Summary Schedule of Investments does not reflect the complete portfolio holdings. It includes the Fund’s 50 largest holdings and each investment of any issuer that exceeds 1% of the Fund’s net assets. “Other Securities” represent all issues not required to be disclosed under the rules adopted by the U.S. Securities and Exchange Commission (“SEC”). In certain instances, securities for which footnotes listed above may otherwise apply are included in the Other Securities caption. The complete schedule of portfolio holdings is available (i) without charge, upon request, by calling (800) 342-5734; and (ii) on the SEC’s website at http://www.sec.gov.
The following is a list of the level of inputs used as of November 30, 2016, in valuing the Fund’s investments and other financial instruments carried at value ($ Thousands):
| Investments in Securities | Level 1 | Level 2 | Level 3 | Total | ||||||||||||
Common Stock | $ | 81,001 | $ | 44 | $ | — | $ | 81,045 | ||||||||
Exchange Traded Funds | 831 | — | — | 831 | ||||||||||||
Preferred Stock | 684 | — | — | 684 | ||||||||||||
Rights | — | — | — | — | ||||||||||||
Cash Equivalent | 2,349 | — | — | 2,349 | ||||||||||||
|
|
|
|
|
|
|
| |||||||||
Total Investments in Securities | $ | 84,865 | $ | 44 | $ | — | $ | 84,909 | ||||||||
|
|
|
|
|
|
|
| |||||||||
| Other Financial Instruments | Level 1 | Level 2 | Level 3 | Total | ||||||||||||
Futures Contracts* | ||||||||||||||||
Unrealized Appreciation | $ | 24 | $ | — | $ | — | $ | 24 | ||||||||
Unrealized Depreciation | (1 | ) | — | — | (1 | ) | ||||||||||
|
|
|
|
|
|
|
| |||||||||
Total Other Financial Instruments | $ | 23 | $ | — | $ | — | $ | 23 | ||||||||
|
|
|
|
|
|
|
| |||||||||
| * | Futures contracts are valued at the unrealized appreciation (depreciation) on the instrument. |
| 30 | SEI Institutional Investments Trust / Semi-Annual Report / November 30, 2016 |
For the period ended November 30, 2016, there were transfers between Level 1 and Level 2 assets and liabilities. The primary reason for changes in the classifications between Levels 1 and 2 occurs when foreign equity securities are fair valued using other observable market-based inputs in place of the closing exchange price due to events occurring after the close of the exchange or market on which the investment is principally traded.
For the period ended November 30, 2016, there were no transfers between Level 2 and Level 3 assets and liabilities.
For more information on valuation inputs, see Note 2 — Significant Accounting Policies in Notes to Financial Statements.
Amounts designated as “—” are either $0 or have been rounded to $0.
The accompanying notes are an integral part of the financial statements.
| SEI Institutional Investments Trust / Semi-Annual Report / November 30, 2016 | 31 |
SUMMARY SCHEDULE OF INVESTMENTS (Unaudited)
Emerging Markets Equity Fund
November 30, 2016
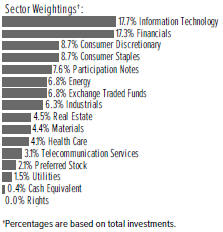
| Description | Percentage of Net Assets (%) | Shares | Market Value ($ Thousands) | |||||||||
COMMON STOCK — 81.5% |
| |||||||||||
Argentina — 2.3% | ||||||||||||
Grupo Financiero Galicia ADR | 0.5 | % | 205,192 | $ | 5,579 | |||||||
MercadoLibre | 0.8 | 53,210 | 8,398 | |||||||||
Other Securities | 1.0 | 9,560 | ||||||||||
|
| |||||||||||
| 23,537 | ||||||||||||
|
| |||||||||||
Bangladesh — 0.4% | ||||||||||||
Other Securities | 0.4 | 4,579 | ||||||||||
|
| |||||||||||
Botswana — 0.0% | ||||||||||||
Other Securities | 0.0 | 317 | ||||||||||
|
| |||||||||||
Brazil — 3.3% | ||||||||||||
Ambev ADR | 0.5 | 1,118,013 | 5,579 | |||||||||
Banco do Brasil* | 0.5 | 574,000 | 4,836 | |||||||||
Raia Drogasil* | 0.4 | 214,865 | 4,097 | |||||||||
Other Securities | 1.9 | 19,687 | ||||||||||
|
| |||||||||||
| 34,199 | ||||||||||||
|
| |||||||||||
Canada — 0.9% | ||||||||||||
Other Securities | 0.9 | 9,332 | ||||||||||
|
| |||||||||||
Chile — 0.6% | ||||||||||||
Other Securities | 0.6 | 5,803 | ||||||||||
|
| |||||||||||
China — 7.5% | ||||||||||||
Alibaba Group Holding ADR* | 0.7 | 76,400 | 7,183 | |||||||||
China Biologic Products* | 0.5 | 40,887 | 4,895 | |||||||||
China Petroleum & Chemical | 0.4 | 6,562,000 | 4,585 | |||||||||
Ctrip.com International ADR* | 0.7 | 164,178 | 7,426 | |||||||||
NetEase ADR | 0.6 | 26,250 | 5,883 | |||||||||
Other Securities (A) | 4.6 | 47,680 | ||||||||||
|
| |||||||||||
| 77,652 | ||||||||||||
|
| |||||||||||
Colombia — 1.1% | ||||||||||||
Bancolombia ADR, Cl R | 0.4 | 119,033 | 3,987 | |||||||||
| Description | Percentage of Net Assets (%) | Shares | Market Value ($ Thousands) | |||||||||
Other Securities | 0.7 | % | $ | 7,533 | ||||||||
|
| |||||||||||
| 11,520 | ||||||||||||
|
| |||||||||||
Czech Republic — 0.2% | ||||||||||||
Other Securities (A) | 0.2 | 2,050 | ||||||||||
|
| |||||||||||
Egypt — 0.7% | ||||||||||||
Other Securities (A) | 0.7 | 7,445 | ||||||||||
|
| |||||||||||
France — 0.1% | ||||||||||||
Other Securities | 0.1 | 897 | ||||||||||
|
| |||||||||||
Georgia — 0.2% | ||||||||||||
Other Securities | 0.2 | 2,294 | ||||||||||
|
| |||||||||||
Greece — 0.5% | ||||||||||||
Other Securities | 0.5 | 5,598 | ||||||||||
|
| |||||||||||
Hong Kong — 9.2% | ||||||||||||
Bank of China | 0.7 | 15,715,000 | 7,152 | |||||||||
China Construction Bank | 1.2 | 17,201,000 | 12,818 | |||||||||
Industrial & Commercial Bank of China | 0.6 | 10,894,000 | 6,671 | |||||||||
Tencent Holdings | 1.5 | 614,900 | 15,355 | |||||||||
Other Securities (A) | 5.2 | 53,616 | ||||||||||
|
| |||||||||||
| 95,612 | ||||||||||||
|
| |||||||||||
Hungary — 0.4% | ||||||||||||
Other Securities | 0.4 | 3,958 | ||||||||||
|
| |||||||||||
India — 3.1% | ||||||||||||
HDFC Bank ADR | 0.7 | 107,986 | 6,967 | |||||||||
Infosys Technologies | 0.4 | 302,719 | 4,315 | |||||||||
Other Securities | 2.0 | 20,800 | ||||||||||
|
| |||||||||||
| 32,082 | ||||||||||||
|
| |||||||||||
Indonesia — 3.9% | ||||||||||||
Kalbe Farma | 0.4 | 39,820,195 | 4,407 | |||||||||
Pakuwon Jati | 0.5 | 104,712,303 | 5,293 | |||||||||
Other Securities | 3.0 | 31,160 | ||||||||||
|
| |||||||||||
| 40,860 | ||||||||||||
|
| |||||||||||
Isle of Man — 0.0% | ||||||||||||
Other Securities | 0.0 | 416 | ||||||||||
|
| |||||||||||
Israel — 0.1% | ||||||||||||
Other Securities | 0.1 | 725 | ||||||||||
|
| |||||||||||
Ivory Coast — 0.2% | ||||||||||||
Other Securities | 0.2 | 1,525 | ||||||||||
|
| |||||||||||
Kashmiri — 0.1% | ||||||||||||
Other Securities | 0.1 | 958 | ||||||||||
|
| |||||||||||
Kazakhstan — 0.6% | ||||||||||||
Halyk Savings Bank of | ||||||||||||
Kazakhstan JSC GDR* | 0.4 | 720,960 | 4,030 | |||||||||
| 32 | SEI Institutional Investments Trust / Semi-Annual Report / November 30, 2016 |
| Description | Percentage of Net Assets (%) | Shares | Market Value ($ Thousands) | |||||||||
Other Securities | 0.2 | % | $ | 1,841 | ||||||||
|
| |||||||||||
| 5,871 | ||||||||||||
|
| |||||||||||
Kenya — 0.4% | ||||||||||||
Other Securities | 0.4 | 4,340 | ||||||||||
|
| |||||||||||
Malaysia — 0.8% | ||||||||||||
IHH Healthcare | 0.4 | 2,754,595 | 4,071 | |||||||||
Other Securities | 0.4 | 4,593 | ||||||||||
|
| |||||||||||
| 8,664 | ||||||||||||
|
| |||||||||||
Mauritius — 0.1% | ||||||||||||
Other Securities | 0.1 | 1,454 | ||||||||||
|
| |||||||||||
Mexico — 2.8% | ||||||||||||
Banregio Grupo Financiero | 0.4 | 856,980 | 4,611 | |||||||||
Wal-Mart de Mexico | 0.5 | 3,064,130 | 5,662 | |||||||||
Other Securities | 1.9 | 19,022 | ||||||||||
|
| |||||||||||
| 29,295 | ||||||||||||
�� |
| |||||||||||
Morocco — 0.4% | ||||||||||||
Other Securities | 0.4 | 3,901 | ||||||||||
|
| |||||||||||
Nigeria — 0.2% | ||||||||||||
Other Securities | 0.2 | 2,134 | ||||||||||
|
| |||||||||||
Oman — 0.1% | ||||||||||||
Other Securities | 0.1 | 1,257 | ||||||||||
|
| |||||||||||
Pakistan — 1.3% | ||||||||||||
Engro Fertilizers | 0.4 | 7,410,000 | 4,554 | |||||||||
Other Securities | 0.9 | 9,275 | ||||||||||
|
| |||||||||||
| 13,829 | ||||||||||||
|
| |||||||||||
Panama — 0.6% | ||||||||||||
Other Securities | 0.6 | 6,128 | ||||||||||
|
| |||||||||||
Peru — 1.3% | ||||||||||||
Credicorp | 0.5 | 34,668 | 5,432 | |||||||||
Other Securities (A) | 0.8 | 8,012 | ||||||||||
|
| |||||||||||
| 13,444 | ||||||||||||
|
| |||||||||||
Philippines — 3.2% | ||||||||||||
BDO Unibank | 0.5 | 2,110,881 | 4,749 | |||||||||
Universal Robina | 0.5 | 1,362,315 | 4,664 | |||||||||
Other Securities | 2.2 | 23,445 | ||||||||||
|
| |||||||||||
| 32,858 | ||||||||||||
|
| |||||||||||
Poland — 1.8% | ||||||||||||
Eurocash | 0.4 | 447,262 | 4,152 | |||||||||
Polski Koncern Naftowy ORLEN | 0.4 | 220,482 | 4,021 | |||||||||
Other Securities | 1.0 | 10,153 | ||||||||||
|
| |||||||||||
| 18,326 | ||||||||||||
|
| |||||||||||
Qatar — 0.4% | ||||||||||||
Other Securities | 0.4 | 4,564 | ||||||||||
|
| |||||||||||
| Description | Percentage of Net Assets (%) | Shares | Market Value ($ Thousands) | |||||||||
Romania — 0.9% | ||||||||||||
Banca Transilvania | 0.6 | % | 10,746,043 | $ | 5,953 | |||||||
Other Securities | 0.3 | 3,623 | ||||||||||
|
| |||||||||||
| 9,576 | ||||||||||||
|
| |||||||||||
Russia — 2.8% | ||||||||||||
Lukoil PJSC ADR | 0.5 | 106,081 | 5,198 | |||||||||
Yandex, Cl A* | 0.7 | 392,136 | 7,455 | |||||||||
Other Securities | 1.6 | 16,082 | ||||||||||
|
| |||||||||||
| 28,735 | ||||||||||||
|
| |||||||||||
Singapore — 0.2% | ||||||||||||
Other Securities | 0.2 | 2,054 | ||||||||||
|
| |||||||||||
South Africa — 2.7% | ||||||||||||
FirstRand | 0.4 | 1,122,146 | 4,040 | |||||||||
Other Securities | 2.3 | 24,207 | ||||||||||
|
| |||||||||||
| 28,247 | ||||||||||||
|
| |||||||||||
South Korea — 7.2% | ||||||||||||
Kia Motors | 0.4 | 133,604 | 4,274 | |||||||||
Samsung Electronics | 1.3 | 9,296 | 13,884 | |||||||||
Other Securities | 5.5 | 56,276 | ||||||||||
|
| |||||||||||
| 74,434 | ||||||||||||
|
| |||||||||||
Switzerland — 0.1% | ||||||||||||
Other Securities (A) | 0.1 | 1,178 | ||||||||||
|
| |||||||||||
Taiwan — 9.2% | ||||||||||||
Hon Hai Precision Industry | 0.7 | 2,786,375 | 7,169 | |||||||||
Pegatron | 0.4 | 1,767,000 | 4,208 | |||||||||
Powertech Technology | 0.4 | 1,667,000 | 4,283 | |||||||||
Taiwan Semiconductor Manufacturing ADR | 1.9 | 663,402 | 19,696 | |||||||||
Taiwan Semiconductor Manufacturing | 0.5 | 852,000 | 4,892 | |||||||||
Other Securities | 5.3 | 54,896 | ||||||||||
|
| |||||||||||
| 95,144 | ||||||||||||
|
| |||||||||||
Thailand — 3.1% | ||||||||||||
PTT | 0.5 | 559,900 | 5,477 | |||||||||
Other Securities | 2.6 | 26,583 | ||||||||||
|
| |||||||||||
| 32,060 | ||||||||||||
|
| |||||||||||
Turkey — 1.2% | ||||||||||||
Other Securities‡ | 1.2 | 12,210 | ||||||||||
|
| |||||||||||
Ukraine — 0.1% | ||||||||||||
Other Securities | 0.1 | 628 | ||||||||||
|
| |||||||||||
United Arab Emirates — 2.1% |
| |||||||||||
Emaar Properties | 0.7 | 3,927,429 | 7,293 | |||||||||
Other Securities | 1.4 | 14,178 | ||||||||||
|
| |||||||||||
| 21,471 | ||||||||||||
|
| |||||||||||
United Kingdom — 1.2% | ||||||||||||
Other Securities (A) | 1.2 | 12,236 | ||||||||||
|
| |||||||||||
| SEI Institutional Investments Trust / Semi-Annual Report / November 30, 2016 | 33 |
SUMMARY SCHEDULE OF INVESTMENTS (Unaudited)
Emerging Markets Equity Fund (Concluded)
November 30, 2016
| Description | Percentage of Net Assets (%) | Shares | Market Value ($ Thousands) | |||||||||
United States — 1.9% | ||||||||||||
Kansas City Southern | 0.5 | % | 54,996 | $ | 4,879 | |||||||
Luxoft Holding, Cl A* | 0.4 | 73,292 | 4,020 | |||||||||
PriceSmart | 0.8 | 91,950 | 8,395 | |||||||||
Other Securities | 0.2 | 2,330 | ||||||||||
|
| |||||||||||
| 19,624 | ||||||||||||
|
| |||||||||||
Total Common Stock (Cost $857,385) ($ Thousands) | 845,021 | |||||||||||
|
| |||||||||||
Number of Participation Notes | ||||||||||||
PARTICIPATION NOTES* — 7.5% |
| |||||||||||
Cayman Islands — 0.3% | ||||||||||||
Other Securities | 0.3 | 2,541 | ||||||||||
|
| |||||||||||
Chile — 0.2% | ||||||||||||
Other Securities | 0.2 | 2,343 | ||||||||||
|
| |||||||||||
China — 0.2% | ||||||||||||
Other Securities | 0.2 | 1,569 | ||||||||||
|
| |||||||||||
Colombia — 0.1% | ||||||||||||
Other Securities | 0.1 | 1,409 | ||||||||||
|
| |||||||||||
Egypt — 0.3% | ||||||||||||
Emaar Misr for Development, Expires 05/02/18 | 0.1 | 8,585 | 1,460 | |||||||||
Palm Hills Developments, Expires 05/02/18 | 0.2 | 9,418 | 1,638 | |||||||||
|
| |||||||||||
| 3,098 | ||||||||||||
|
| |||||||||||
India — 1.5% | ||||||||||||
Bharat Financial Inclusion, Expires 11/05/18 | 0.0 | 25 | 273 | |||||||||
LIC Housing Finance, Expires 03/28/19 | 0.0 | 1 | 4 | |||||||||
LIC Housing Finance, Expires 03/08/19 | 0.1 | 173 | 1,426 | |||||||||
Rural Electrification, Expires 09/29/21 | 0.2 | 894 | 1,784 | |||||||||
SKS Microfinance, Expires 11/05/18 | 0.2 | 182 | 1,962 | |||||||||
Other Securities | 1.0 | 10,308 | ||||||||||
|
| |||||||||||
| 15,757 | ||||||||||||
|
| |||||||||||
Kuwait — 0.4% | ||||||||||||
Kuwait Food Americana SAK, Expires 02/14/19 | 0.1 | 121 | 1,032 | |||||||||
National Bank of Kuwait SAKP, Expires 11/20/18 | 0.2 | 803 | 1,647 | |||||||||
Other Securities | 0.1 | 1,109 | ||||||||||
|
| |||||||||||
| 3,788 | ||||||||||||
|
| |||||||||||
| Description | Percentage of Net Assets (%) | Number of Participation Notes | Market Value ($ Thousands) | |||||||||
Pakistan — 0.6% | ||||||||||||
United Bank, Expires 10/31/16 | 0.5 | % | 2,526 | $ | 5,023 | |||||||
Other Securities | 0.1 | 1,327 | ||||||||||
|
| |||||||||||
| 6,350 | ||||||||||||
|
| |||||||||||
Saudi Arabia — 1.4% | ||||||||||||
CO For Cooperative Insurance, Expires 07/31/17 | 0.5 | 185 | 4,951 | |||||||||
Fawaz Abdulaziz Al Hokair, Expires 03/02/17 | 0.1 | 171 | 1,586 | |||||||||
Mouwasat Medical Services, Expires 09/20/17 | 0.0 | 11 | 396 | |||||||||
Mouwasat Medical Services, Expires 09/20/17 | 0.2 | 60 | 2,165 | |||||||||
National Industrialization, Expires 07/12/17 | 0.3 | 591 | 2,642 | |||||||||
Other Securities | 0.3 | 2,993 | ||||||||||
|
| |||||||||||
| 14,733 | ||||||||||||
|
| |||||||||||
Sri Lanka — 0.3% | 0.3 | 2,955 | ||||||||||
|
| |||||||||||
Turkey — 0.1% | ||||||||||||
Other Securities | 0.1 | 1,022 | ||||||||||
|
| |||||||||||
United States — 1.2% | ||||||||||||
National Industrialization, Expires 07/12/17 | 0.4 | 841 | 3,764 | |||||||||
Other Securities | 0.8 | 8,104 | ||||||||||
|
| |||||||||||
| 11,868 | ||||||||||||
|
| |||||||||||
Vietnam — 0.9% | ||||||||||||
Other Securities | 0.9 | 9,666 | ||||||||||
|
| |||||||||||
Total Participation Notes | ||||||||||||
(Cost $78,160) ($ Thousands) | 77,099 | |||||||||||
|
| |||||||||||
Shares | ||||||||||||
EXCHANGE TRADED FUNDS — 6.6% |
| |||||||||||
United States — 6.6% |
| |||||||||||
iShares MSCI Emerging Markets Index Fund | 5.4 | 1,577 | 55,986 | |||||||||
iShares MSCI Frontier 100 ETF | 0.0 | 25 | 610 | |||||||||
WisdomTree India Earnings Fund | 1.2 | 595 | 12,045 | |||||||||
|
| |||||||||||
Total Exchange Traded Funds (Cost $69,931) ($ Thousands) |
| 68,641 | ||||||||||
|
| |||||||||||
PREFERRED STOCK — 2.0% | ||||||||||||
Brazil — 1.5% | ||||||||||||
Itausa—Investimentos Itau | 0.5 | 2,134,390 | 5,433 | |||||||||
| 34 | SEI Institutional Investments Trust / Semi-Annual Report / November 30, 2016 |
| Description | Percentage of Net Assets (%) | Shares | Market Value ($ Thousands) | |||||||||
Other Securities | 1.0 | % | $ | 10,263 | ||||||||
|
| |||||||||||
| 15,696 | ||||||||||||
|
| |||||||||||
Colombia — 0.4% | ||||||||||||
Other Securities | 0.4 | 4,402 | ||||||||||
|
| |||||||||||
South Korea — 0.1% | ||||||||||||
Other Securities | 0.1 | 981 | ||||||||||
|
| |||||||||||
Total Preferred Stock (Cost $18,742) ($ Thousands) | 21,079 | |||||||||||
|
| |||||||||||
RIGHTS — 0.0% | ||||||||||||
South Korea — 0.0% | ||||||||||||
Other Securities | 0.0 | 6 | ||||||||||
|
| |||||||||||
Taiwan — 0.0% | ||||||||||||
Other Securities | 0.0 | — | ||||||||||
|
| |||||||||||
Total Rights | 6 | |||||||||||
|
| |||||||||||
CASH EQUIVALENT — 0.4% | ||||||||||||
SEI Daily Income Trust, Government Fund, Cl A 0.210%**† | 0.4 | 3,965,930 | 3,966 | |||||||||
|
| |||||||||||
Total Cash Equivalent (Cost $3,966) ($ Thousands) | 3,966 | |||||||||||
|
| |||||||||||
Total Investments — 98.0% (Cost $1,028,184)($ Thousands) | $ | 1,015,812 | ||||||||||
|
| |||||||||||
Percentages are based on a Net Assets of $1,036,477 ($ Thousands).
| * | Non-income producing security. |
| ** | The rate reported is the 7-day effective yield as of November 30, 2016. |
| ‡ | Real Estate Investment Trust. |
| † | Investment in Affiliated Security (see Note 6). |
| (A) | Security exempt from registration under Rule 144A of the Securities Act of 1933. These securities may be resold in transactions exempt from registration normally to qualified institutions. On November 30, 2016, the value of these securities amounted to $9,094 ($ Thousands), representing 0.7% of the net assets of the Fund. |
ADR — American Depositary Receipt
Cl — Class
GDR — Global Depositary Receipt
ETF — Exchange Traded Fund
MSCI — Morgan Stanley Capital International
The Summary Schedule of Investments does not reflect the complete portfolio holdings. It includes the Fund’s 50 largest holdings and each investment of any issuer that exceeds 1% of the Fund’s net assets. “Other Securities” represent all issues not required to be disclosed under the rules adopted by the U.S. Securities and Exchange Commission (“SEC”). In certain instances, securities for which footnotes listed above may otherwise apply are included in the Other Securities caption. The complete schedule of portfolio holdings is available (i) without charge, upon request, by calling (800) 342-5734; and (ii) on the SEC’s website at http://www.sec.gov.
The following is a list of the level of inputs used as of November 30, 2016, in valuing the Fund's investments carried at value ($ Thousands):
| Investments in Securities | Level 1 | Level 2 | Level 3 | Total | ||||||||||||
Common Stock | $ | 843,706 | $ | 1,315 | $ | — | $ | 845,021 | ||||||||
Participation Notes | — | 77,099 | — | 77,099 | ||||||||||||
Exchange Traded Funds | 68,641 | — | — | 68,641 | ||||||||||||
Preferred Stock | 20,815 | 264 | — | 21,079 | ||||||||||||
Right | 6 | — | — | 6 | ||||||||||||
Cash Equivalent | 3,966 | — | — | 3,966 | ||||||||||||
|
|
|
|
|
|
|
| |||||||||
Total Investments in Securities | $ | 937,134 | $ | 78,678 | $ | — | $ | 1,015,812 | ||||||||
|
|
|
|
|
|
|
| |||||||||
For the period ended November 30, 2016, there were transfers between Level 1 and Level 2 assets and liabilities. The primary reason for changes in the classifications between Levels 1 and 2 occurs when foreign equity securities are fair valued using other observable market-based inputs in place of the closing exchange price due to events occurring after the close of the exchange or market on which the investment is principally traded.
For the period ended November 30, 2016, there were no transfers between Level 2 and Level 3 assets and liabilities.
For more information on valuation inputs, see Note 2 — Significant Accounting Policies in Notes to Financial Statements.
Amounts designated as “—” are either $0 or have been rounded to $0.
The accompanying notes are an integral part of the financial statements.
| SEI Institutional Investments Trust / Semi-Annual Report / November 30, 2016 | 35 |
SCHEDULE OF INVESTMENTS (Unaudited)
Opportunistic Income Fund
November 30, 2016
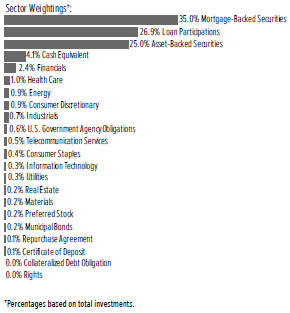
| Description | Face Amount ($ Thousands) | Market Value ($ Thousands) | ||||||
MORTGAGE-BACKED SECURITIES — 35.4% |
| |||||||
Agency Mortgage-Backed Obligations — 5.1% |
| |||||||
FHLMC ARM | ||||||||
3.611%, 03/01/2036 (A) | $ | 2,186 | $ | 2,333 | ||||
2.775%, 06/01/2035 (A) | 2,013 | 2,127 | ||||||
2.535%, 10/01/2035 (A) | 1,005 | 1,051 | ||||||
FHLMC CMO, Ser 2007-3311, Cl FN | ||||||||
0.838%, 05/15/2037 (A) | 750 | 746 | ||||||
FHLMC CMO, Ser 2010-3721, Cl FB | ||||||||
1.038%, 09/15/2040 (A) | 2,446 | 2,449 | ||||||
FHLMC CMO, Ser 2011-3891, Cl BF | ||||||||
1.088%, 07/15/2041 (A) | 1,709 | 1,710 | ||||||
FHLMC Multifamily Structured Pass Through Certificates, Ser K011, Cl X1, IO | ||||||||
0.283%, 11/25/2020 (A) | 111,631 | 1,075 | ||||||
FHLMC Multifamily Structured Pass-Through Certificates CMO, Ser 2011-K010, Cl A1 | ||||||||
3.320%, 07/25/2020 | 996 | 1,011 | ||||||
FHLMC Multifamily Structured Pass-Through Certificates, Ser K703, Cl X1, IO | ||||||||
2.022%, 05/25/2018 (A) | 28,903 | 668 | ||||||
FHLMC Multifamily Structured Pass-Through Certificates, Ser K708, Cl X1, IO | ||||||||
1.593%, 01/25/2019 (A) | 82,153 | 2,182 | ||||||
FHLMC Multifamily Structured Pass-Through Certificates, Ser K710, Cl X1, IO | ||||||||
1.760%, 05/25/2019 (A) | 30,056 | 1,042 | ||||||
FHLMC REMIC, Ser 2007-3335, Cl BF | ||||||||
0.688%, 07/15/2019 (A) | 156 | 156 | ||||||
FHLMC REMIC, Ser 2010-83, Cl BA | ||||||||
5.000%, 08/25/2040 | 544 | 575 | ||||||
| Description | Face Amount ($ Thousands) | Market Value ($ Thousands) | ||||||
FNMA | ||||||||
4.500%, 10/01/2024 | $ | 1,707 | $ | 1,809 | ||||
6.000%, 09/01/2039 to 04/01/2040 | 1,008 | 1,147 | ||||||
3.000%, 05/01/2022 to 12/01/2030 | 4,156 | 4,305 | ||||||
FNMA ARM | ||||||||
3.084%, 10/01/2033 (A) | 475 | 506 | ||||||
3.050%, 05/01/2034 (A) | 506 | 533 | ||||||
3.027%, 09/01/2034 (A) | 665 | 703 | ||||||
2.951%, 10/01/2033 (A) | 445 | 469 | ||||||
2.911%, 06/01/2035 (A) | 683 | 720 | ||||||
2.863%, 05/01/2035 (A) | 1,012 | 1,074 | ||||||
2.858%, 04/01/2034 (A) | 1,192 | 1,262 | ||||||
2.810%, 09/01/2033 (A) | 1,082 | 1,127 | ||||||
2.759%, 04/01/2033 (A) | 297 | 314 | ||||||
2.741%, 08/01/2034 (A) | 1,299 | 1,376 | ||||||
2.735%, 05/01/2035 (A) | 754 | 799 | ||||||
2.734%, 10/01/2035 (A) | 1,261 | 1,335 | ||||||
2.718%, 07/01/2036 (A) | 1,734 | 1,833 | ||||||
2.702%, 06/01/2035 (A) | 516 | 539 | ||||||
2.695%, 10/01/2024 (A) | 179 | 192 | ||||||
2.675%, 10/01/2033 (A) | 309 | 322 | ||||||
2.670%, 05/01/2037 (A) | 2,273 | 2,383 | ||||||
2.617%, 10/01/2033 (A) | 811 | 857 | ||||||
2.526%, 07/01/2034 (A) | 554 | 582 | ||||||
2.489%, 07/01/2034 (A) | 1,187 | 1,244 | ||||||
2.477%, 01/01/2034 (A) | 704 | 738 | ||||||
2.467%, 03/01/2035 (A) | 1,892 | 1,967 | ||||||
2.405%, 02/01/2035 (A) | 1,351 | 1,405 | ||||||
FNMA CMO, Ser 2005-92, Cl UF | ||||||||
0.934%, 10/25/2025 (A) | 1,470 | 1,468 | ||||||
FNMA CMO, Ser 2010-87, Cl PF | ||||||||
0.984%, 06/25/2040 (A) | 2,049 | 2,044 | ||||||
FNMA CMO, Ser 2011-63, Cl FG | ||||||||
1.034%, 07/25/2041 (A) | 1,618 | 1,621 | ||||||
FNMA CMO, Ser 2011-88, Cl AB | ||||||||
2.500%, 09/25/2026 | 1,026 | 1,032 | ||||||
FNMA CMO, Ser 2011-M7, Cl A2 | ||||||||
2.578%, 09/25/2018 | 2,443 | 2,473 | ||||||
FNMA CMO, Ser 2012-112, Cl BI, IO | ||||||||
3.000%, 09/25/2031 | 10,462 | 1,096 | ||||||
FNMA CMO, Ser 2013-96, Cl FW | ||||||||
0.984%, 09/25/2043 (A) | 1,675 | 1,672 | ||||||
FNMA REMIC, Ser 2011-406, Cl 6, IO | ||||||||
4.000%, 01/25/2041 (A) | 859 | 159 | ||||||
FNMA TBA | ||||||||
3.500%, 12/01/2040 | 1,150 | 1,198 | ||||||
3.000%, 12/25/2028 | 1,475 | 1,517 | ||||||
FREMF Mortgage Trust, Ser 2012-K705, Cl C | ||||||||
4.302%, 09/25/2044 (A) (B) | 595 | 605 | ||||||
FREMF Mortgage Trust, Ser 2013-K502, Cl B | ||||||||
2.609%, 10/25/2017 (A) (B) | 1,040 | 1,042 | ||||||
| 36 | SEI Institutional Investments Trust / Semi-Annual Report / November 30, 2016 |
| Description | Face Amount ($ Thousands) | Market Value ($ Thousands) | ||||||
FREMF Mortgage Trust, Ser 2013-K502, Cl C | ||||||||
3.035%, 03/25/2045 (A) (B) | $ | 360 | $ | 360 | ||||
FREMF Mortgage Trust, Ser 2014-K503, Cl C | ||||||||
3.002%, 10/25/2047 (A) (B) | 230 | 223 | ||||||
GNMA ARM | ||||||||
2.200%, 12/20/2060 (A) | 2,857 | 2,953 | ||||||
1.671%, 11/20/2060 (A) | 2,520 | 2,565 | ||||||
1.571%, 12/20/2060 (A) | 2,998 | 3,038 | ||||||
1.940%, 09/20/2060 to 11/20/2060 (A) | 2,657 | 2,716 | ||||||
GNMA CMO, Ser 2002-66, Cl FC | ||||||||
0.942%, 07/16/2031 (A) | 1,079 | 1,084 | ||||||
Mortgage-Linked Amortizing Notes CMO, Ser 2012-1, Cl A10 | ||||||||
2.060%, 01/15/2022 | 1,179 | 1,175 | ||||||
NCUA Guaranteed Notes CMO, Ser 2010-A1, Cl A | ||||||||
0.879%, 12/07/2020 (A) | 4,747 | 4,735 | ||||||
NCUA Guaranteed Notes CMO, Ser 2010-R1, Cl 1A | ||||||||
0.977%, 10/07/2020 (A) | 5,562 | 5,568 | ||||||
NCUA Guaranteed Notes CMO, Ser 2010-R2, Cl 2A | ||||||||
0.995%, 11/05/2020 (A) | 5,946 | 5,955 | ||||||
NCUA Guaranteed Notes CMO, Ser 2010-R3, Cl 2A | ||||||||
1.087%, 12/08/2020 (A) | 410 | 412 | ||||||
NCUA Guaranteed Notes CMO, Ser 2010-R3, Cl 1A | ||||||||
1.087%, 12/08/2020 (A) | 6,718 | 6,727 | ||||||
NCUA Guaranteed Notes CMO, Ser 2011-R1, Cl 1A | ||||||||
0.976%, 01/08/2020 (A) | 3,667 | 3,673 | ||||||
NCUA Guaranteed Notes CMO, Ser 2011-R2, Cl 1A | ||||||||
0.927%, 02/06/2020 (A) | 4,408 | 4,408 | ||||||
NCUA Guaranteed Notes CMO, Ser 2011-R3, Cl 1A | ||||||||
0.930%, 03/11/2020 (A) | 4,370 | 4,366 | ||||||
NCUA Guaranteed Notes CMO, Ser 2011-R4, Cl 1A | ||||||||
0.907%, 03/06/2020 (A) | 333 | 333 | ||||||
|
| |||||||
| 112,884 | ||||||||
|
| |||||||
Non-Agency Mortgage-Backed Obligations — 30.3% |
| |||||||
A10 Term Asset Financing LLC, Ser 2013-2, Cl A | ||||||||
2.620%, 11/15/2027 (B) | 803 | 799 | ||||||
Adjustable Rate Mortgage Trust, Ser 2005-2, Cl 1A2 | ||||||||
2.815%, 06/25/2035 (A) | 357 | 324 | ||||||
Adjustable Rate Mortgage Trust, Ser 2005-4, Cl 7A2 | ||||||||
0.994%, 08/25/2035 (A) | 135 | 134 | ||||||
American General Mortgage Loan Trust, Ser 2010-1A, Cl A4 | ||||||||
5.650%, 03/25/2058 (A) (B) | 296 | 296 | ||||||
| Description | Face Amount ($ Thousands) | Market Value ($ Thousands) | ||||||
American Home Mortgage Investment Trust, Ser 2005-2, Cl 4A1 | ||||||||
2.748%, 09/25/2045 (A) | $ | 1,310 | $ | 1,292 | ||||
BAMLL Commercial Mortgage | ||||||||
3.135%, 09/15/2026 (A) (B) | 2,180 | 2,175 | ||||||
BAMLL Commercial Mortgage Securities | ||||||||
2.435%, 06/15/2028 (A) (B) | 2,500 | 2,447 | ||||||
Banc of America Commercial Mortgage | ||||||||
6.437%, 12/10/2017 (A) | 5,090 | 5,238 | ||||||
Banc of America Commercial Mortgage Trust, Ser 2007-1, Cl A4 | ||||||||
5.451%, 01/15/2049 | 320 | 319 | ||||||
Banc of America Commercial Mortgage Trust, Ser 2007-4, Cl AM | ||||||||
5.811%, 02/10/2051 (A) | 600 | 614 | ||||||
Banc of America Commercial Mortgage Trust, Ser 2007-5, Cl AM | ||||||||
5.772%, 02/10/2051 (A) | 120 | 122 | ||||||
Banc of America Commercial Mortgage Trust, Ser 2008-1, Cl A1A | ||||||||
6.393%, 01/10/2018 (A) | 2,926 | 3,011 | ||||||
Banc of America Commercial Mortgage, Ser 2007-3, Cl AJ | ||||||||
5.552%, 06/10/2049 (A) | 4,030 | 4,081 | ||||||
Banc of America Commercial Mortgage, Ser 2007-3, Cl AM | ||||||||
5.552%, 06/10/2049 (A) | 500 | 507 | ||||||
Banc of America Commercial Mortgage, Ser 2007-3, Cl AMF | ||||||||
5.317%, 06/10/2049 | 4,125 | 4,169 | ||||||
Banc of America Commercial Mortgage, Ser 2007-4, Cl A4 | ||||||||
5.940%, 02/10/2051 (A) | 4,183 | 4,249 | ||||||
Banc of America Funding, | ||||||||
3.360%, 12/20/2034 (A) | 614 | 596 | ||||||
Banc of America Funding, | ||||||||
3.222%, 09/20/2035 (A) | 164 | 140 | ||||||
Banc of America Funding, | ||||||||
3.243%, 05/20/2036 (A) | 107 | 94 | ||||||
Banc of America Funding, | ||||||||
2.855%, 12/20/2036 (A) | 6,187 | 6,214 | ||||||
Banc of America Funding, | ||||||||
2.790%, 08/26/2036 (A)(B) | 1,912 | 1,886 | ||||||
Banc of America Mortgage 2003-I Trust, Ser 2003-I, Cl 2A6 | ||||||||
3.282%, 10/25/2033 (A) | 4,788 | 4,844 | ||||||
| SEI Institutional Investments Trust / Semi-Annual Report / November 30, 2016 | 37 |
SCHEDULE OF INVESTMENTS (Unaudited)
Opportunistic Income Fund (Continued)
November 30, 2016
| Description | Face Amount ($ Thousands) | Market Value ($ Thousands) | ||||||
Banc of America Mortgage Securities, Ser 2003-E, Cl 2A2 | ||||||||
3.276%, 06/25/2033 (A) | $ | 4,399 | $ | 4,384 | ||||
Banc of America Mortgage Securities, Ser 2005-A, Cl 2A1 | ||||||||
2.965%, 02/25/2035 (A) | 58 | 58 | ||||||
Banc of America Mortgage Trust, Ser 2003-F, Cl 2A3 | ||||||||
3.248%, 07/25/2033 (A) | 2,368 | 2,371 | ||||||
Banc of America Mortgage Trust, Ser 2003-K, Cl 2A1 | ||||||||
2.983%, 12/25/2033 (A) | 2,196 | 2,169 | ||||||
Banc of America Mortgage Trust, Ser 2004-A, Cl 2A2 | ||||||||
2.947%, 02/25/2034 (A) | 3,006 | 2,961 | ||||||
Banc of America Mortgage Trust, Ser 2004-C, Cl 2A1 | ||||||||
3.201%, 04/25/2034 (A) | 1,150 | 1,142 | ||||||
Banc of America Mortgage Trust, Ser 2004-L, Cl 1A1 | ||||||||
2.976%, 01/25/2035 (A) | 714 | 711 | ||||||
Bayview Commercial Asset Trust, Ser 2003-2, Cl A | ||||||||
1.462%, 12/25/2033 (A) (B) | 1,818 | 1,687 | ||||||
Bayview Commercial Asset Trust, Ser 2004-1, Cl A | ||||||||
0.952%, 04/25/2034 (A) (B) | 3,886 | 3,683 | ||||||
Bayview Commercial Asset Trust, Ser 2004-2, Cl A | ||||||||
1.022%, 08/25/2034 (A) (B) | 2,303 | 2,108 | ||||||
Bayview Commercial Asset Trust, Ser 2005-1A, Cl A2 | ||||||||
0.942%, 04/25/2035 (A) (B) | 2,519 | 2,307 | ||||||
Bear Stearns Alt-A Trust, Ser 2003-5, Cl 2A1 | ||||||||
2.825%, 12/25/2033 (A) | 2,778 | 2,773 | ||||||
Bear Stearns Alt-A Trust, Ser 2004-7, Cl 2A1 | ||||||||
3.122%, 08/25/2034 (A) | 3,564 | 3,626 | ||||||
Bear Stearns ARM Trust, Ser 2003-8, Cl 4A1 | ||||||||
3.206%, 01/25/2034 (A) | 5,010 | 5,012 | ||||||
Bear Stearns ARM Trust, Ser 2004-1, Cl 12A3 | ||||||||
2.855%, 04/25/2034 (A) | 2,724 | 2,695 | ||||||
Bear Stearns ARM Trust, Ser 2004-1, Cl 21A1 | ||||||||
2.750%, 04/25/2034 (A) | 734 | 728 | ||||||
Bear Stearns ARM Trust, Ser 2004-5, Cl 2A | ||||||||
3.487%, 07/25/2034 (A) | 2,877 | 2,860 | ||||||
Bear Stearns ARM Trust, Ser 2004-9, Cl 22A1 | ||||||||
3.598%, 11/25/2034 (A) | 986 | 968 | ||||||
Bear Stearns ARM Trust, Ser 2005-2, Cl A2 | ||||||||
3.128%, 03/25/2035 (A) | 2,562 | 2,579 | ||||||
Bear Stearns ARM Trust, Ser 2005-2, Cl A1 | ||||||||
2.920%, 03/25/2035 (A) | 3,004 | 3,019 | ||||||
Bear Stearns ARM Trust, Ser 2005-5, Cl A2 | ||||||||
2.460%, 08/25/2035 (A) | 5,462 | 5,437 | ||||||
| Description | Face Amount ($ Thousands) | Market Value ($ Thousands) | ||||||
Bear Stearns Commercial Mortgage Securities Trust, Ser 2006-PW11, Cl AM | ||||||||
5.621%, 03/11/2039 (A) | $ | 1 | $ | 1 | ||||
Bear Stearns Commercial Mortgage Securities Trust, Ser 2007-PW17, Cl A1A | ||||||||
5.650%, 08/11/2017 (A) | 3,663 | 3,742 | ||||||
Bear Stearns Commercial Mortgage Securities Trust, Ser 2007-T26, Cl AM | ||||||||
5.513%, 01/12/2045 (A) | 4,000 | 4,032 | ||||||
Bear Stearns Commercial Mortgage Securities, Ser 2007-PW16, Cl A4 | ||||||||
5.901%, 06/11/2040 (A) | 2,313 | 2,337 | ||||||
Bear Stearns Mortgage Funding Trust, Ser 2006-SL5, Cl 1A | ||||||||
0.834%, 12/25/2036 (A) | 33 | 64 | ||||||
BHMS Mortgage Trust, | ||||||||
2.478%, 07/05/2033 (A) (B) | 2,000 | 1,996 | ||||||
BXHTL Mortgage Trust, | ||||||||
3.385%, 05/15/2029 (A)(B) | 5,800 | 5,749 | ||||||
CD Commercial Mortgage Trust, Ser 2007-CD4, Cl AMFX | ||||||||
5.366%, 12/11/2049 (A) | 5,500 | 5,521 | ||||||
CD Mortgage Trust, | ||||||||
5.886%, 11/15/2044 (A) | 2,906 | 2,961 | ||||||
CGBAM Commercial Mortgage Trust, Ser 2014- HD, Cl D | ||||||||
2.535%, 02/15/2031 (A) (B) | 2,000 | 1,954 | ||||||
Chase Mortgage Finance Trust, Ser 2005-A1, Cl 2A3 | ||||||||
2.759%, 12/25/2035 (A) | 1,324 | 1,231 | ||||||
Chase Mortgage Finance Trust, Ser 2007-A1, Cl 7A1 | ||||||||
3.053%, 02/25/2037 (A) | 1,151 | 1,149 | ||||||
Chase Mortgage Finance Trust, Ser 2007-A1, Cl 1A3 | ||||||||
3.063%, 02/25/2037 (A) | 1,157 | 1,143 | ||||||
Chase Mortgage Finance Trust, Ser 2007-A2, Cl 2A3 | ||||||||
3.062%, 07/25/2037 (A) | 1,603 | 1,618 | ||||||
CHL Mortgage Pass-Through Trust, Ser 2003- 46, Cl 2A1 | ||||||||
3.197%, 01/19/2034 (A) | 2,133 | 2,106 | ||||||
CHL Mortgage Pass-Through Trust, Ser 2004- 11, Cl 2A1 | ||||||||
2.634%, 07/25/2034 (A) | 1,838 | 1,834 | ||||||
CHL Mortgage Pass-Through Trust, Ser 2004-8, Cl 2A1 | ||||||||
4.500%, 06/25/2019 | 244 | 248 | ||||||
Citicorp Mortgage Securities REMIC Pass- Through Certificates Trust, Ser 2005-4, Cl 2A1 | ||||||||
5.000%, 07/25/2020 | 62 | 64 | ||||||
| 38 | SEI Institutional Investments Trust / Semi-Annual Report / November 30, 2016 |
| Description | Face Amount ($ Thousands) | Market Value ($ Thousands) | ||||||
Citigroup Commercial Mortgage Trust, Ser 2008-C7, Cl A4 | ||||||||
6.129%, 12/10/2049 (A) | $ | 615 | $ | 628 | ||||
Citigroup Commercial Mortgage Trust, Ser 2012-GC8, Cl A1 | ||||||||
0.685%, 09/10/2045 | 10 | 10 | ||||||
Citigroup Commercial Mortgage Trust, Ser 2013-375P, Cl C | ||||||||
3.635%, 05/11/2035 (A) (B) | 3,280 | 3,303 | ||||||
Citigroup Deutsche Bank Commercial Mortgage, Ser 2007-CD4, Cl A4 | ||||||||
5.322%, 12/11/2049 | 60 | 60 | ||||||
Citigroup Mortgage Loan Trust, Ser 2007-AR5, Cl 1A2A | ||||||||
3.029%, 04/25/2037 (A) | 852 | 732 | ||||||
Citigroup Mortgage Loan Trust, Ser 2008-AR4, Cl 2A1A | ||||||||
3.129%, 11/25/2038 (A) (B) | 1,573 | 1,579 | ||||||
COBALT CMBS Commercial Mortgage Trust, Ser 2007-C2, Cl AMFX | ||||||||
5.526%, 04/15/2047 (A) | 1,800 | 1,812 | ||||||
COLT Mortgage Loan Trust, | ||||||||
3.000%, 05/25/2046 (B) | 801 | 808 | ||||||
COLT Mortgage Loan Trust, | ||||||||
2.750%, 09/25/2046 (A) (B) | 1,556 | 1,565 | ||||||
COMM Mortgage Trust, | ||||||||
5.347%, 12/10/2046 | 2,202 | 2,200 | ||||||
COMM Mortgage Trust, | ||||||||
1.177%, 07/10/2017 | 2,048 | 2,024 | ||||||
COMM Mortgage Trust, | ||||||||
6.007%, 12/10/2049 (A) | 5,390 | 5,465 | ||||||
COMM Mortgage Trust, | ||||||||
1.227%, 12/10/2049 (A) (B) | 11,710 | 11,380 | ||||||
COMM Mortgage Trust, | ||||||||
0.704%, 10/15/2045 | 11 | 11 | ||||||
COMM Mortgage Trust, | ||||||||
0.933%, 08/10/2046 (A) | 47,184 | 1,764 | ||||||
COMM Mortgage Trust, | ||||||||
1.278%, 08/10/2046 | 100 | 100 | ||||||
COMM Mortgage Trust, | ||||||||
1.335%, 03/15/2029 (A) (B) | 4,480 | 4,459 | ||||||
COMM Mortgage Trust, | ||||||||
2.928%, 02/10/2047 | 1,325 | 1,352 | ||||||
COMM Mortgage Trust, | ||||||||
2.177%, 08/13/2027 (A) (B) | 2,000 | 1,958 | ||||||
COMM Mortgage Trust, | ||||||||
2.781%, 02/13/2032 (A) (B) | 3,435 | 3,407 | ||||||
COMM Mortgage Trust, | ||||||||
1.389%, 02/13/2032 (A) (B) | 5,000 | 5,000 | ||||||
COMM Mortgage Trust, | ||||||||
2.270%, 10/15/2018 | 3,000 | 3,008 | ||||||
| Description | Face Amount ($ Thousands) | Market Value ($ Thousands) | ||||||
Commercial Mortgage Pass-Through Certificates, Ser 2014-CR14, Cl XA, IO | ||||||||
0.988%, 02/10/2047 (A) | $ | 36,173 | $ | 1,224 | ||||
Commercial Mortgage Trust, | ||||||||
5.867%, 12/10/2049 (A) | 3,300 | 3,383 | ||||||
Credit Suisse Commercial Mortgage Trust, Ser 2007-C2, Cl AMFL | ||||||||
0.765%, 01/15/2049 (A) | 7,110 | 7,085 | ||||||
Credit Suisse Commercial Mortgage Trust, Ser 2007-C2, Cl AM | ||||||||
5.615%, 01/15/2049 (A) | 2,652 | 2,680 | ||||||
Credit Suisse Commercial Mortgage Trust, Ser 2007-C4, Cl A4 | ||||||||
6.134%, 09/15/2039 (A) | 1,208 | 1,228 | ||||||
Credit Suisse Commercial Mortgage Trust, Ser 2007-C4, Cl A1AM | ||||||||
6.134%, 07/15/2017 (A) | 5,000 | 5,103 | ||||||
Credit Suisse Commercial Mortgage Trust, Ser 2008-C1, Cl AM | ||||||||
6.266%, 02/15/2041 (A) (B) | 3,000 | 3,080 | ||||||
Credit Suisse First Boston Mortgage Securities, Ser 2004-AR5, Cl 6A1 | ||||||||
2.965%, 06/25/2034 (A) | 6,326 | 6,347 | ||||||
Credit Suisse First Boston Mortgage Securities, Ser 2004-AR8, Cl 6A1 | ||||||||
2.911%, 09/25/2034 (A) | 1,659 | 1,662 | ||||||
Credit Suisse First Boston Mortgage Securities, Ser 2004-C4, Cl E | ||||||||
5.135%, 10/15/2039 (A) (B) | 902 | 947 | ||||||
Credit Suisse First Boston Mortgage Securities, Ser 2005-5, Cl 3A2 | ||||||||
0.892%, 07/25/2035 (A) | 2,917 | 2,752 | ||||||
CSMC Trust, Ser 2015-SAND, Cl D | ||||||||
3.385%, 08/15/2030 (A) (B) | 1,847 | 1,833 | ||||||
CSMC Trust, Ser 2015-SAND, Cl C | ||||||||
2.685%, 08/15/2030 (A) (B) | 1,000 | 981 | ||||||
CW Capital Cobalt, Ser 2007-C3, Cl A4 | ||||||||
5.954%, 05/15/2046 (A) | 613 | 622 | ||||||
DBUBS Mortgage Trust, | ||||||||
1.146%, 07/10/2044 (A) (B) | 26,375 | 980 | ||||||
Deutsche Mortgage Securities Mortgage Loan Trust, Ser 2004-4, Cl 2AR1 | ||||||||
1.074%, 06/25/2034 (A) | 3,438 | 3,271 | ||||||
DSLA Mortgage Loan Trust, | ||||||||
1.348%, 09/19/2044 (A) | 2,008 | 1,916 | ||||||
DSLA Mortgage Loan Trust, | ||||||||
1.368%, 09/19/2044 (A) | 823 | 763 | ||||||
| SEI Institutional Investments Trust / Semi-Annual Report / November 30, 2016 | 39 |
SCHEDULE OF INVESTMENTS (Unaudited)
Opportunistic Income Fund (Continued)
November 30, 2016
| Description | Face Amount ($ Thousands) | Market Value ($ Thousands) | ||||||
DSLA Mortgage Loan Trust, | ||||||||
0.888%, 01/19/2045 (A) | $ | 1,349 | $ | 1,158 | ||||
FDIC Guaranteed Notes Trust, Ser 2010-S2, Cl 1A | ||||||||
1.023%, 11/29/2037 (A) (B) | 595 | 594 | ||||||
FHLMC Structured Agency Credit Risk Debt Notes, Ser 2013-DN1, Cl M1 | ||||||||
3.934%, 07/25/2023 (A) | 382 | 388 | ||||||
FHLMC Structured Agency Credit Risk Debt Notes, Ser 2014-DN2, Cl M2 | ||||||||
2.184%, 04/25/2024 (A) | 538 | 540 | ||||||
FHLMC Structured Agency Credit Risk Debt Notes, Ser 2015-DN1, Cl M2 | ||||||||
2.934%, 01/25/2025 (A) | 683 | 687 | ||||||
FHLMC Structured Agency Credit Risk Debt Notes, Ser 2015-DNA3, Cl M1 | ||||||||
1.884%, 04/25/2028 (A) | 817 | 818 | ||||||
FHLMC Structured Agency Credit Risk Debt Notes, Ser 2016-DNA1, Cl M1 | ||||||||
2.034%, 07/25/2028 (A) | 1,178 | 1,182 | ||||||
FHLMC Structured Agency Credit Risk Debt Notes, Ser 2016-DNA2, Cl M1 | ||||||||
1.784%, 10/25/2028 (A) | 3,307 | 3,312 | ||||||
FHLMC Structured Agency Credit Risk Debt Notes, Ser 2016-DNA3, Cl M1 | ||||||||
1.692%, 12/25/2028 (A) | 2,894 | 2,897 | ||||||
FHLMC Structured Agency Credit Risk Debt Notes, Ser 2016-DNA4, Cl M1 | ||||||||
1.392%, 03/25/2029 (A) | 3,353 | 3,351 | ||||||
FHLMC Structured Agency Credit Risk Debt Notes, Ser 2016-HQA1, Cl M1 | ||||||||
2.342%, 09/25/2028 (A) | 3,426 | 3,435 | ||||||
FHLMC Structured Agency Credit Risk Debt Notes, Ser 2016-HQA2, Cl M1 | ||||||||
1.734%, 11/25/2028 (A) | 3,765 | 3,769 | ||||||
First Horizon Alternative Mortgage Securities Trust, Ser 2005-AA3, Cl 3A1 | ||||||||
2.924%, 05/25/2035 (A) | 308 | 277 | ||||||
FNMA Connecticut Avenue Securities, Ser 2014- C02, Cl 1M1 | ||||||||
1.484%, 05/25/2024 (A) | 230 | 230 | ||||||
FNMA Connecticut Avenue Securities, Ser 2014- C02, Cl 2M1 | ||||||||
1.484%, 05/25/2024 (A) | 110 | 110 | ||||||
FNMA Connecticut Avenue Securities, Ser 2014- C03, Cl 1M1 | ||||||||
1.784%, 07/25/2024 (A) | 2,717 | 2,721 | ||||||
FNMA Connecticut Avenue Securities, Ser 2014- C03, Cl 2M1 | ||||||||
1.734%, 07/25/2024 (A) | 1,567 | 1,569 | ||||||
FNMA Connecticut Avenue Securities, Ser 2015-C02, Cl 1M1 | ||||||||
1.684%, 05/25/2025 (A) | 29 | 29 | ||||||
| Description | Face Amount ($ Thousands) | Market Value ($ Thousands) | ||||||
FNMA Connecticut Avenue Securities, Ser 2015-C04, Cl 1M1 | ||||||||
2.134%, 04/25/2028 (A) | $ | 2,324 | $ | 2,328 | ||||
FNMA Connecticut Avenue Securities, Ser 2016-C01, Cl 1M1 | ||||||||
2.484%, 08/25/2028 (A) | 5,712 | 5,751 | ||||||
FNMA Connecticut Avenue Securities, Ser 2016-C03, Cl 1M1 | ||||||||
2.534%, 10/25/2028 (A) | 3,582 | 3,623 | ||||||
FNMA Connecticut Avenue Securities, Ser 2016-C04, Cl 1M1 | ||||||||
1.984%, 01/25/2029 (A) | 3,923 | 3,937 | ||||||
FNMA Connecticut Avenue Securities, Ser 2016-C05, Cl 2M1 | ||||||||
1.884%, 01/25/2029 (A) | 3,910 | 3,918 | ||||||
FNMA Connecticut Avenue Securities, Ser 2016-C06, Cl 1M1 | ||||||||
1.892%, 04/25/2029 (A) | 4,976 | 4,976 | ||||||
GAHR Commercial Mortgage Trust, Ser 2015- NRF, Cl AFL1 | ||||||||
1.835%, 12/15/2016 (A) (B) | 7,629 | 7,670 | ||||||
GE Commercial Mortgage Trust, Ser 2007-C1, Cl A1A | ||||||||
5.483%, 12/10/2049 (A) | 2,552 | 2,566 | ||||||
GMAC Mortgage Loan Trust, Ser 2003-AR2, Cl 4A1 | ||||||||
3.471%, 12/19/2033 (A) | 707 | 698 | ||||||
GS Mortgage Securities Trust, Ser 2010-C2, Cl XA, IO | ||||||||
0.154%, 12/10/2043 (A) (B) | 36,079 | 199 | ||||||
GS Mortgage Securities Trust, Ser 2010-C2, Cl A1 | ||||||||
3.849%, 12/10/2043 (B) | 15 | 15 | ||||||
GS Mortgage Securities Trust, Ser 2011-GC3, Cl X, IO | ||||||||
0.679%, 03/10/2044 (A) (B) | 27,112 | 640 | ||||||
GS Mortgage Securities Trust, Ser 2012-GCJ9, Cl A1 | ||||||||
0.662%, 11/10/2045 | 4 | 4 | ||||||
GS Mortgage Securities Trust, Ser 2013-GC13, Cl A1 | ||||||||
1.206%, 07/10/2046 | 32 | 32 | ||||||
GS Mortgage Securities Trust, Ser 2013-GC14, Cl A1 | ||||||||
1.217%, 08/10/2046 | 67 | 67 | ||||||
GS Mortgage Securities Trust, Ser 2016-ICE2, Cl A | ||||||||
2.468%, 02/15/2033 (A) (B) | 4,000 | 4,021 | ||||||
GSR Mortgage Loan Trust, Ser 2003-7F, Cl 5A1 | ||||||||
0.934%, 10/25/2032 (A) | 18 | 18 | ||||||
| 40 | SEI Institutional Investments Trust / Semi-Annual Report / November 30, 2016 |
| Description | Face Amount ($ Thousands) | Market Value ($ Thousands) | ||||||
GSR Mortgage Loan Trust, Ser 2005-AR1, Cl 1A1 | ||||||||
3.334%, 01/25/2035 (A) | $ | 275 | $ | 261 | ||||
GSR Mortgage Loan Trust, Ser 2005-AR2, Cl 1A2 | ||||||||
3.045%, 04/25/2035 (A) | 793 | 758 | ||||||
GSR Mortgage Loan Trust, Ser 2005-AR6, Cl 3A1 | ||||||||
3.054%, 09/25/2035 (A) | 734 | 729 | ||||||
GSR Mortgage Loan Trust, Ser 2006-AR1, Cl 2A1 | ||||||||
2.972%, 01/25/2036 (A) | 1,770 | 1,644 | ||||||
HarborView Mortgage Loan Trust, Ser 2004-6, Cl 4A | ||||||||
3.180%, 08/19/2034 (A) | 3,220 | 3,259 | ||||||
HarborView Mortgage Loan Trust, Ser 2004-7, Cl 2A1 | ||||||||
2.880%, 11/19/2034 (A) | 114 | 105 | ||||||
HarborView Mortgage Loan Trust, Ser 2005-9, Cl 2A1A | ||||||||
0.866%, 06/20/2035 (A) | 3,346 | 3,131 | ||||||
Hilton USA Trust, Ser 2016-HHV, Cl D | ||||||||
4.194%, 11/05/2026 (A) (B) | 3,910 | 3,694 | ||||||
Hudsons Bay Simon JV Trust, Ser 2015-HBFL, Cl BFL | ||||||||
2.678%, 08/05/2034 (A) (B) | 2,000 | 1,995 | ||||||
Hudsons Bay Simon JV Trust, Ser 2015-HBFL, Cl CFL | ||||||||
3.078%, 08/05/2034 (A) (B) | 3,435 | 3,392 | ||||||
Hyatt Hotel Portfolio Trust, Ser 2015-HYT, Cl E | ||||||||
4.335%, 11/15/2029 (A) (B) | 5,280 | 5,267 | ||||||
Impac CMB Trust Series, | ||||||||
1.372%, 10/25/2034 (A) | 2,725 | 2,572 | ||||||
Impac CMB Trust, Ser 2004-10, Cl 4M1 | ||||||||
1.434%, 03/25/2035 (A) | 192 | 159 | ||||||
Impac Secured Assets Trust, | ||||||||
0.784%, 04/25/2037 (A) | 1,272 | 1,152 | ||||||
IndyMac INDA Mortgage Loan Trust, Ser 2007- AR3, Cl 1A1 | ||||||||
3.407%, 07/25/2037 (A) | 2,927 | 2,562 | ||||||
JPMorgan Chase Commercial Mortgage Securities, | ||||||||
5.440%, 06/12/2047 | 1,968 | 1,969 | ||||||
JPMorgan Chase Commercial Mortgage Securities, | ||||||||
6.164%, 02/12/2051 (A) | 778 | 800 | ||||||
JPMorgan Chase Commercial Mortgage Securities, | ||||||||
5.794%, 02/12/2051 (A) | 640 | 652 | ||||||
JPMorgan Chase Commercial Mortgage Securities, | ||||||||
5.882%, 02/15/2051 (A) | 541 | 550 | ||||||
| Description | Face Amount ($ Thousands) | Market Value ($ Thousands) | ||||||
JPMorgan Chase Commercial Mortgage Securities, Ser 2010-CNTR, Cl XA, IO | ||||||||
1.982%, 08/05/2032 (A) (B) | $ | 13,794 | $ | 725 | ||||
JPMorgan Chase Commercial Mortgage Securities, Ser 2011-C3, Cl XA, IO | ||||||||
1.038%, 02/15/2046 (A) (B) | 28,103 | 782 | ||||||
JPMorgan Chase Commercial Mortgage Securities, Ser 2012-C8, Cl XA, IO | ||||||||
2.184%, 10/15/2045 (A) | 11,043 | 756 | ||||||
JPMorgan Chase Commercial Mortgage Securities, | ||||||||
1.303%, 01/15/2046 | 46 | 46 | ||||||
JPMorgan Chase Commercial Mortgage Securities, | ||||||||
1.438%, 04/15/2027 (A) (B) | 3,075 | 3,013 | ||||||
JPMorgan Chase Commercial Mortgage Securities, | ||||||||
2.888%, 06/15/2029 (A)(B) | 3,000 | 2,944 | ||||||
JPMorgan Mortgage Trust, | ||||||||
4.500%, 09/25/2034 | 348 | 353 | ||||||
JPMorgan Mortgage Trust, | ||||||||
3.022%, 06/25/2035 (A) | 1,341 | 1,303 | ||||||
JPMorgan Mortgage Trust, | ||||||||
3.022%, 06/25/2035 (A) | 1,355 | 1,316 | ||||||
JPMorgan Mortgage Trust, | ||||||||
3.201%, 07/25/2035 (A) | 4,621 | 4,587 | ||||||
JPMorgan Mortgage Trust, | ||||||||
2.971%, 11/25/2033 (A) | 600 | 608 | ||||||
JPMorgan Mortgage Trust, | ||||||||
2.996%, 07/25/2035 (A) | 2,029 | 2,054 | ||||||
JPMorgan Mortgage Trust, | ||||||||
3.218%, 07/25/2035 (A) | 3,822 | 3,794 | ||||||
JPMorgan Mortgage Trust, | ||||||||
3.185%, 07/25/2035 (A) | 844 | 843 | ||||||
JPMorgan Mortgage Trust, | ||||||||
2.968%, 06/25/2037 (A) | 105 | 91 | ||||||
JPMorgan Resecuritization Trust, Ser 2009-12, Cl 6A1 | ||||||||
3.074%, 10/26/2035 (A) (B) | 1,424 | 1,429 | ||||||
LB Commercial Mortgage Trust, Ser 2007-C3, Cl A4 | ||||||||
6.116%, 07/15/2044 (A) | 1,877 | 1,913 | ||||||
LB-UBS Commercial Mortgage Trust, Ser 2007- C2, Cl A3 | ||||||||
5.430%, 02/15/2040 | 1,049 | 1,053 | ||||||
LB-UBS Commercial Mortgage Trust, Ser 2007- C2, Cl AM | ||||||||
5.493%, 02/15/2040 (A) | 1,927 | 1,948 | ||||||
| SEI Institutional Investments Trust / Semi-Annual Report / November 30, 2016 | 41 |
SCHEDULE OF INVESTMENTS (Unaudited)
Opportunistic Income Fund (Continued)
November 30, 2016
| Description | Face Amount ($ Thousands) | Market Value ($ Thousands) | ||||||
LB-UBS Commercial Mortgage Trust, Ser 2007- C6, Cl AM | ||||||||
6.114%, 07/15/2040 (A) | $ | 2,570 | $ | 2,648 | ||||
LB-UBS Commercial Mortgage Trust, Ser 2007- C6, Cl A4 | ||||||||
5.858%, 07/15/2040 (A) | 425 | 428 | ||||||
LB-UBS Commercial Mortgage Trust, Ser 2007- C7, Cl A3 | ||||||||
5.866%, 09/15/2045 (A) | 704 | 723 | ||||||
LB-UBS Commercial Mortgage Trust, Ser 2008- C1, Cl A2 | ||||||||
6.114%, 04/15/2041 (A) | 1,084 | 1,128 | ||||||
MASTR Adjustable Rate Mortgages Trust, Ser 2005-6, Cl 5A1 | ||||||||
2.905%, 07/25/2035 (A) | 102 | 88 | ||||||
MASTR Alternative Loan Trust, Ser 2003-5, Cl 4A1 | ||||||||
5.500%, 07/25/2033 | 3,027 | 3,160 | ||||||
Mellon Residential Funding, | ||||||||
2.610%, 10/20/2029 (A) | 389 | 388 | ||||||
Mellon Residential Funding, | ||||||||
1.238%, 11/15/2031 (A) | 2,528 | 2,349 | ||||||
Merrill Lynch Mortgage Investors Trust, Ser 2003-D, Cl A | ||||||||
1.154%, 08/25/2028 (A) | 2,113 | 2,019 | ||||||
Merrill Lynch Mortgage Investors Trust, Ser 2003-G, Cl A1 | ||||||||
1.174%, 01/25/2029 (A) | 797 | 761 | ||||||
Merrill Lynch Mortgage Investors Trust, Ser 2004-1, Cl 2A1 | ||||||||
2.720%, 12/25/2034 (A) | 2,649 | 2,650 | ||||||
Merrill Lynch Mortgage Investors Trust, Ser 2005-2, Cl 2A | ||||||||
2.710%, 10/25/2035 (A) | 2,324 | 2,326 | ||||||
Merrill Lynch Mortgage Investors Trust, Ser 2005-A2, Cl A5 | ||||||||
2.651%, 02/25/2035 (A) | 1,376 | 1,376 | ||||||
Merrill Lynch Mortgage Investors Trust, Ser 2005-A2, Cl A2 | ||||||||
2.655%, 02/25/2035 (A) | 3,030 | 3,029 | ||||||
Merrill Lynch Mortgage Investors Trust, Ser 2005-A4, Cl 1A | ||||||||
3.102%, 07/25/2035 (A) | 831 | 644 | ||||||
ML-CFC Commercial Mortgage Trust, Ser 2006- 4, Cl AM | ||||||||
5.204%, 12/12/2049 | 30 | 30 | ||||||
ML-CFC Commercial Mortgage Trust, Ser 2007- 5, Cl AMFL | ||||||||
0.718%, 08/12/2048 (A) (B) | 2,690 | 2,668 | ||||||
| Description | Face Amount ($ Thousands) | Market Value ($ Thousands) | ||||||
ML-CFC Commercial Mortgage Trust, Ser 2007- 5, Cl AM | ||||||||
5.419%, 08/12/2048 | $ | 4,150 | $ | 4,161 | ||||
ML-CFC Commercial Mortgage Trust, Ser 2007- 5, Cl A4 | ||||||||
5.378%, 08/12/2048 | 304 | 304 | ||||||
ML-CFC Commercial Mortgage Trust, Ser 2007- 7, Cl A4 | ||||||||
5.810%, 06/12/2050 (A) | 3,309 | 3,342 | ||||||
Morgan Stanley Capital I Trust, Ser 2007-HQ11, Cl A4 | ||||||||
5.447%, 02/12/2044 (A) | 762 | 762 | ||||||
Morgan Stanley Capital I Trust, Ser 2007-IQ14, Cl A1A | ||||||||
5.665%, 04/15/2049 (A) | 3,781 | 3,817 | ||||||
Morgan Stanley Capital I Trust, Ser 2008-T29, Cl A4 | ||||||||
6.477%, 01/11/2043 (A) | 2,145 | 2,229 | ||||||
Morgan Stanley Capital I Trust, Ser 2015-XLF1, Cl B | ||||||||
2.285%, 08/14/2031 (A) (B) | 2,750 | 2,739 | ||||||
Morgan Stanley Capital I, | ||||||||
5.692%, 04/15/2049 (A) | 1,138 | 1,143 | ||||||
Morgan Stanley Capital I, | ||||||||
5.809%, 12/12/2049 | 4,405 | 4,496 | ||||||
Morgan Stanley Capital I, Ser 2007-T25, Cl AJ | ||||||||
5.574%, 11/12/2049 (A) | 5,000 | 4,998 | ||||||
Morgan Stanley Mortgage Loan Trust, Ser 2004-10AR, Cl 1A | ||||||||
3.482%, 11/25/2034 (A) | 1,537 | 1,519 | ||||||
Morgan Stanley Mortgage Loan Trust, Ser 2004-8AR, Cl 4A2 | ||||||||
2.963%, 10/25/2034 (A) | 2,922 | 2,913 | ||||||
Morgan Stanley Mortgage Loan Trust, Ser 2005-5AR, Cl 1A1 | ||||||||
0.804%, 09/25/2035 (A) | 1,673 | 1,658 | ||||||
Morgan Stanley Re-REMIC Trust, Ser 2012-IO, Cl AXA | ||||||||
1.000%, 03/27/2051 (B) | 38 | 38 | ||||||
MRFC Mortgage Pass-Through Trust, Ser 2002- TBC2, Cl A | ||||||||
1.395%, 08/15/2032 (A) | 935 | 885 | ||||||
Nomura Asset Acceptance Alternative Loan Trust, Ser 2004-AP3, Cl A6 | ||||||||
5.293%, 10/25/2034 | 397 | 407 | ||||||
Nomura Asset Acceptance Alternative Loan Trust, Ser 2004-AR4, Cl M1 | ||||||||
1.192%, 12/25/2034 (A) | 4,463 | 4,152 | ||||||
Nomura Resecuritization Trust, Ser 2014-6R, Cl 5A1 | ||||||||
2.565%, 04/26/2037 (A) (B) | 2,377 | 2,435 | ||||||
| 42 | SEI Institutional Investments Trust / Semi-Annual Report / November 30, 2016 |
| Description | Face Amount ($ Thousands) | Market Value ($ Thousands) | ||||||
Nomura Resecuritization Trust, Ser 2015-1R, Cl 5A1 | ||||||||
1.497%, 06/26/2046 (A) (B) | $ | 4,044 | $ | 3,973 | ||||
Nomura Resecuritization Trust, Ser 2015-2R, Cl 5A1 | ||||||||
1.277%, 04/26/2047 (A) (B) | 1,844 | 1,806 | ||||||
Nomura Resecuritization Trust, Ser 2015-4R, Cl 3A2 | ||||||||
2.475%, 01/26/2036 (A) (B) | 6,384 | 6,333 | ||||||
PHH Mortgage Capital LLC, | ||||||||
2.777%, 07/25/2038 (A) | 1,765 | 1,711 | ||||||
Provident Funding Mortgage Loan Trust, Ser 2003-1, Cl A | ||||||||
2.910%, 08/25/2033 (A) | 2,012 | 2,009 | ||||||
Provident Funding Mortgage Loan Trust, Ser 2005-2, Cl 2A1A | ||||||||
3.034%, 10/25/2035 (A) | 1,555 | 1,541 | ||||||
Provident Funding Mortgage Loan Trust, Ser 2005-2, Cl 3A | ||||||||
3.108%, 10/25/2035 (A) | 1,695 | 1,681 | ||||||
RALI Trust, Ser 2006-QO10, Cl A1 | ||||||||
0.694%, 01/25/2037 (A) | 4,678 | 3,944 | ||||||
RALI Trust, Ser 2007-QO3, Cl A1 | ||||||||
0.694%, 03/25/2047 (A) | 1,335 | 1,119 | ||||||
RBSSP Resecuritization Trust, Ser 2009-7, Cl 2A5 | ||||||||
4.013%, 09/26/2035 (A) (B) | 1,188 | 1,192 | ||||||
Residential Asset Securitization Trust, Ser 2007-A8, Cl 3A1 | ||||||||
6.239%, 08/25/2022 (A) | 854 | 736 | ||||||
Sequoia Mortgage Trust, Ser 2002-10, Cl 1A | ||||||||
1.326%, 10/20/2027 (A) | 1,508 | 1,470 | ||||||
Sequoia Mortgage Trust, Ser 2002-9, Cl 1A | ||||||||
1.226%, 09/20/2032 (A) | 379 | 356 | ||||||
Sequoia Mortgage Trust, Ser 2004-3, Cl A | ||||||||
1.761%, 05/20/2034 (A) | 2,936 | 2,794 | ||||||
Sequoia Mortgage Trust, Ser 2004-5, Cl A1 | ||||||||
2.229%, 06/20/2034 (A) | 2,080 | 2,005 | ||||||
Sequoia Mortgage Trust, Ser 2012-1, Cl 1A1 | ||||||||
2.865%, 01/25/2042 (A) | 726 | 731 | ||||||
Sequoia Mortgage Trust, Ser 2013-1, Cl 1A1 | ||||||||
1.450%, 02/25/2043 (A) | 1,671 | 1,623 | ||||||
Springleaf Mortgage Loan Trust, Ser 2013-2A, Cl A | ||||||||
1.780%, 12/25/2065 (A) (B) | 2,363 | 2,353 | ||||||
Springleaf Mortgage Loan Trust, Ser 2013-3A, Cl A | ||||||||
1.870%, 09/25/2057 (A) (B) | 13,350 | 13,340 | ||||||
Structured Adjustable Rate Mortgage Loan Trust, Ser 2004-2, Cl 4A2 | ||||||||
2.980%, 03/25/2034 (A) | 2,328 | 2,327 | ||||||
| Description | Face Amount ($ Thousands) | Market Value ($ Thousands) | ||||||
Structured Adjustable Rate Mortgage Loan Trust, Ser 2004-3AC, Cl A1 | ||||||||
2.930%, 03/25/2034 (A) | $ | 2,511 | $ | 2,503 | ||||
Structured Adjustable Rate Mortgage Loan Trust, Ser 2004-9XS, Cl A | ||||||||
0.904%, 07/25/2034 (A) | 5,298 | 5,094 | ||||||
Structured Adjustable Rate Mortgage Loan Trust, Ser 2005-1, Cl 5A1 | ||||||||
2.956%, 02/25/2035 (A) | 2,647 | 2,619 | ||||||
Structured Adjustable Rate Mortgage Loan Trust, Ser 2005-7, Cl 1A3 | ||||||||
3.045%, 04/25/2035 (A) | 2,044 | 1,877 | ||||||
Structured Asset Mortgage Investments, Ser 2004-AR5, Cl 1A1 | ||||||||
1.188%, 10/19/2034 (A) | 2,027 | 1,933 | ||||||
Structured Asset Securities Mortgage Pass- Through Certificates, Ser 2003-17A, Cl 2A1 | ||||||||
2.909%, 05/25/2033 (A) | 3,333 | 3,337 | ||||||
Thornburg Mortgage Securities Trust, Ser 2003-4, Cl A1 | ||||||||
1.174%, 09/25/2043 (A) | 1,896 | 1,824 | ||||||
Thornburg Mortgage Securities Trust, Ser 2007-1, Cl A2B | ||||||||
2.872%, 03/25/2037 (A) | 2,292 | 2,012 | ||||||
Thornburg Mortgage Securities Trust, Ser 2007-4, Cl 3A1 | ||||||||
5.920%, 09/25/2037 (A) | 1,880 | 1,904 | ||||||
Towd Point Mortgage Trust, | ||||||||
3.750%, 11/25/2057 (A) (B) | 2,517 | 2,581 | ||||||
Towd Point Mortgage Trust, | ||||||||
2.750%, 04/25/2055 (A) (B) | 182 | 183 | ||||||
Towd Point Mortgage Trust, | ||||||||
2.750%, 05/25/2055 (A) (B) | 215 | 216 | ||||||
Towd Point Mortgage Trust, | ||||||||
2.750%, 02/25/2055 (A) (B) | 178 | 180 | ||||||
Towd Point Mortgage Trust, | ||||||||
2.250%, 08/25/2055 (A) (B) | 443 | 441 | ||||||
Towd Point Mortgage Trust, | ||||||||
2.250%, 07/25/2056 (A) (B) | 5,585 | 5,586 | ||||||
UBS Commercial Mortgage Trust, Ser 2012-C1, Cl XA, IO | ||||||||
2.089%, 05/10/2045 (A) (B) | 10,875 | 987 | ||||||
UBS-Barclays Commercial Mortgage Trust, Ser 2012-C3, Cl A1 | ||||||||
0.726%, 08/10/2049 | 21 | 21 | ||||||
UBS-Barclays Commercial Mortgage Trust, Ser 2012-C4, Cl A1 | ||||||||
0.673%, 12/10/2045 | 7 | 7 | ||||||
UBS-Barclays Commercial Mortgage Trust, Ser 2013-C5, Cl A1 | ||||||||
0.779%, 03/10/2046 | 63 | 62 | ||||||
| SEI Institutional Investments Trust / Semi-Annual Report / November 30, 2016 | 43 |
SCHEDULE OF INVESTMENTS (Unaudited)
Opportunistic Income Fund (Continued)
November 30, 2016
| Description | Face Amount ($ Thousands) | Market Value ($ Thousands) | ||||||
Velocity Commercial Capital Loan Trust, Ser 2016-2, Cl AFL | ||||||||
2.334%, 10/25/2046 (A) | $ | 1,995 | $ | 1,995 | ||||
Wachovia Bank Commercial Mortgage Trust, Ser 2007-C30, Cl AM | ||||||||
5.383%, 12/15/2043 | 2,028 | 2,032 | ||||||
Wachovia Bank Commercial Mortgage Trust, Ser 2007-C30, Cl A5 | ||||||||
5.342%, 12/15/2043 | 1,232 | 1,233 | ||||||
Wachovia Bank Commercial Mortgage Trust, Ser 2007-C31, Cl A4 | ||||||||
5.509%, 04/15/2047 | 1,671 | 1,677 | ||||||
Wachovia Bank Commercial Mortgage Trust, Ser 2007-C31, Cl AM | ||||||||
5.591%, 04/15/2047 (A) | 3,500 | 3,531 | ||||||
Wachovia Bank Commercial Mortgage Trust, Ser 2007-C33, Cl AJ | ||||||||
5.959%, 02/15/2051 (A) | 4,130 | 4,124 | ||||||
Waldorf Astoria Boca Raton Trust, Ser 2016- BOCA, Cl B | ||||||||
2.585%, 06/15/2029 (A) (B) | 3,000 | 3,001 | ||||||
Waldorf Astoria Boca Raton Trust, Ser 2016- BOCA, Cl E | ||||||||
4.885%, 06/15/2018 (A) (B) | 4,000 | 4,000 | ||||||
WaMu Mortgage Pass-Through Certificates, Ser 2003-AR10, Cl A7 | ||||||||
2.821%, 10/25/2033 (A) | 2,933 | 2,984 | ||||||
WaMu Mortgage Pass-Through Certificates, Ser 2003-AR7, Cl A7 | ||||||||
2.675%, 08/25/2033 (A) | 1,979 | 1,981 | ||||||
WaMu Mortgage Pass-Through Certificates, Ser 2003-AR9, Cl 1A6 | ||||||||
2.784%, 09/25/2033 (A) | 2,697 | 2,714 | ||||||
WaMu Mortgage Pass-Through Certificates, Ser 2004-AR1, Cl A | ||||||||
2.789%, 03/25/2034 (A) | 8,392 | 8,396 | ||||||
WaMu Mortgage Pass-Through Certificates, Ser 2004-AR10, Cl A1B | ||||||||
0.954%, 07/25/2044 (A) | 3,902 | 3,708 | ||||||
WaMu Mortgage Pass-Through Certificates, Ser 2004-AR11, Cl A | ||||||||
2.839%, 10/25/2034 (A) | 2,059 | 2,070 | ||||||
WaMu Mortgage Pass-Through Certificates, Ser 2004-AR13, Cl A1A | ||||||||
1.254%, 11/25/2034 (A) | 1,954 | 1,854 | ||||||
WaMu Mortgage Pass-Through Certificates, Ser 2004-AR13, Cl A2A | ||||||||
1.274%, 11/25/2034 (A) | 2,708 | 2,423 | ||||||
WaMu Mortgage Pass-Through Certificates, Ser 2004-AR14, Cl A1 | ||||||||
2.628%, 01/25/2035 (A) | 4,029 | 4,026 | ||||||
WaMu Mortgage Pass-Through Certificates, Ser 2004-AR2, Cl A | ||||||||
1.924%, 04/25/2044 (A) | 4,932 | 4,751 | ||||||
| Description | Face Amount ($ Thousands) | Market Value ($ Thousands) | ||||||
WaMu Mortgage Pass-Through Certificates, Ser 2004-AR8, Cl A2 | ||||||||
0.934%, 06/25/2044 (A) | $ | 2,626 | $ | 2,441 | ||||
WaMu Mortgage Pass-Through Certificates, Ser 2004-CB2, Cl 1A | ||||||||
5.000%, 07/25/2034 | 1,084 | 1,125 | ||||||
WaMu Mortgage Pass-Through Certificates, Ser 2004-CB4, Cl 22A | ||||||||
6.000%, 12/25/2019 | 127 | 129 | ||||||
WaMu Mortgage Pass-Through Certificates, Ser 2005-AR1, Cl A2A3 | ||||||||
1.334%, 01/25/2045 (A) | 1,005 | 923 | ||||||
WaMu Mortgage Pass-Through Certificates, Ser 2005-AR1, Cl A1A | ||||||||
1.174%, 01/25/2045 (A) | 1,916 | 1,794 | ||||||
WaMu Mortgage Pass-Through Certificates, Ser 2005-AR11, Cl A1A | ||||||||
0.854%, 08/25/2045 (A) | 2,603 | 2,499 | ||||||
WaMu Mortgage Pass-Through Certificates, Ser 2005-AR13, Cl A1A1 | ||||||||
0.824%, 10/25/2045 (A) | 2,743 | 2,623 | ||||||
WaMu Mortgage Pass-Through Certificates, Ser 2005-AR13, Cl A1A2 | ||||||||
1.974%, 10/25/2045 (A) | 505 | 504 | ||||||
WaMu Mortgage Pass-Through Certificates, Ser 2005-AR14, Cl 1A4 | ||||||||
2.659%, 12/25/2035 (A) | 134 | 129 | ||||||
WaMu Mortgage Pass-Through Certificates, Ser 2005-AR17, Cl A1A1 | ||||||||
0.804%, 12/25/2045 (A) | 2,711 | 2,544 | ||||||
WaMu Mortgage Pass-Through Certificates, Ser 2005-AR19, Cl A1A1 | ||||||||
0.804%, 12/25/2045 (A) | 228 | 216 | ||||||
WaMu Mortgage Pass-Through Certificates, Ser 2005-AR2, Cl 1A1A | ||||||||
0.922%, 01/25/2045 (A) | 2,570 | 2,458 | ||||||
WaMu Mortgage Pass-Through Certificates, Ser 2005-AR2, Cl 2A21 | ||||||||
0.864%, 01/25/2045 (A) | 1,451 | 1,356 | ||||||
WaMu Mortgage Pass-Through Certificates, Ser 2005-AR6, Cl 2A1A | ||||||||
0.764%, 04/25/2045 (A) | 5,336 | 5,008 | ||||||
WaMu Mortgage Pass-Through Certificates, Ser 2005-AR8, Cl 2A1A | ||||||||
0.824%, 07/25/2045 (A) | 3,010 | 2,858 | ||||||
WaMu Mortgage Pass-Through Certificates, Ser 2005-AR9, Cl A1A | ||||||||
1.174%, 07/25/2045 (A) | 2,030 | 1,950 | ||||||
| 44 | SEI Institutional Investments Trust / Semi-Annual Report / November 30, 2016 |
| Description | Face Amount ($ Thousands) | Market Value ($ Thousands) | ||||||
WaMu Mortgage Pass-Through Certificates, Ser 2006-AR1, Cl 2A1A | ||||||||
1.594%, 01/25/2046 (A) | $ | 2,216 | $ | 2,152 | ||||
WaMu Mortgage Pass-Through Certificates, Ser 2006-AR13, Cl 2A | ||||||||
2.203%, 10/25/2046 (A) | 694 | 643 | ||||||
WaMu Mortgage Pass-Through Certificates, Ser 2006-AR17, Cl 1A | ||||||||
1.327%, 12/25/2046 (A) | 1,137 | 881 | ||||||
WaMu Mortgage Pass-Through Certificates, Ser 2007-OA3, Cl 5A | ||||||||
1.953%, 04/25/2047 (A) | 3,640 | 2,966 | ||||||
Wells Fargo Commercial Mortgage Trust, Ser 2012-LC5, Cl A1 | ||||||||
0.687%, 10/15/2045 | 16 | 16 | ||||||
Wells Fargo Mortgage Backed Securities Trust, Ser 2004-R, Cl 2A1 | ||||||||
3.029%, 09/25/2034 (A) | 236 | 241 | ||||||
Wells Fargo Mortgage Backed Securities Trust, Ser 2004-Z, Cl 1A2 | ||||||||
2.965%, 12/25/2034 (A) | 1,199 | 1,185 | ||||||
Wells Fargo Mortgage Backed Securities Trust, Ser 2005-AR2, Cl 3A1 | ||||||||
2.850%, 03/25/2035 (A) | 1,502 | 1,513 | ||||||
Wells Fargo Mortgage-Backed Securities Trust, Ser 2003-H, Cl A1 | ||||||||
3.024%, 09/25/2033 (A) | 1,583 | 1,575 | ||||||
Wells Fargo Mortgage-Backed Securities Trust, Ser 2003-K, Cl 1A1 | ||||||||
2.902%, 11/25/2033 (A) | 1,108 | 1,109 | ||||||
Wells Fargo Mortgage-Backed Securities Trust, Ser 2004-E, Cl A1 | ||||||||
3.084%, 05/25/2034 (A) | 318 | 321 | ||||||
Wells Fargo Mortgage-Backed Securities Trust, Ser 2004-K, Cl 1A2 | ||||||||
3.110%, 07/25/2034 (A) | 1,140 | 1,137 | ||||||
Wells Fargo Mortgage-Backed Securities Trust, Ser 2004-N, Cl A7 | ||||||||
3.009%, 08/25/2034 (A) | 2,731 | 2,724 | ||||||
Wells Fargo Mortgage-Backed Securities Trust, Ser 2004-O, Cl A1 | ||||||||
3.020%, 08/25/2034 (A) | 1,941 | 1,967 | ||||||
Wells Fargo Mortgage-Backed Securities Trust, Ser 2004-Q, Cl 1A2 | ||||||||
3.002%, 09/25/2034 (A) | 2,630 | 2,650 | ||||||
Wells Fargo Mortgage-Backed Securities Trust, Ser 2004-R, Cl 1A1 | ||||||||
3.031%, 09/25/2034 (A) | 3,049 | 3,074 | ||||||
Wells Fargo Mortgage-Backed Securities Trust, Ser 2004-S, Cl A1 | ||||||||
3.034%, 09/25/2034 (A) | 656 | 667 | ||||||
| Description | Face Amount ($ Thousands) | Market Value ($ Thousands) | ||||||
Wells Fargo Mortgage-Backed Securities Trust, Ser 2004-U, Cl A1 | ||||||||
3.067%, 10/25/2034 (A) | $ | 4,809 | $ | 4,780 | ||||
Wells Fargo Mortgage-Backed Securities Trust, Ser 2004-Y, Cl 3A1 | ||||||||
2.957%, 11/25/2034 (A) | 3,335 | 3,344 | ||||||
Wells Fargo Mortgage-Backed Securities Trust, Ser 2004-Z, Cl 2A1 | ||||||||
2.878%, 12/25/2034 (A) | 3,076 | 3,127 | ||||||
Wells Fargo Mortgage-Backed Securities Trust, Ser 2005-AR1, Cl 1A1 | ||||||||
2.766%, 02/25/2035 (A) | 4,174 | 4,227 | ||||||
Wells Fargo Mortgage-Backed Securities Trust, Ser 2005-AR10, Cl 1A1 | ||||||||
2.993%, 06/25/2035 (A) | 3,958 | 4,095 | ||||||
Wells Fargo Mortgage-Backed Securities Trust, Ser 2005-AR10, Cl 2A2 | ||||||||
2.981%, 06/25/2035 (A) | 2,874 | 2,952 | ||||||
Wells Fargo Mortgage-Backed Securities Trust, Ser 2005-AR10, Cl 2A17 | ||||||||
2.981%, 06/25/2035 (A) | 939 | 966 | ||||||
Wells Fargo Mortgage-Backed Securities Trust, Ser 2005-AR11, Cl 1A1 | ||||||||
2.992%, 06/25/2035 (A) | 782 | 780 | ||||||
Wells Fargo Mortgage-Backed Securities Trust, Ser 2005-AR12, Cl 2A5 | ||||||||
2.958%, 06/25/2035 (A) | 910 | 931 | ||||||
Wells Fargo Mortgage-Backed Securities Trust, Ser 2005-AR16, Cl 2A1 | ||||||||
2.888%, 02/25/2034 (A) | 783 | 794 | ||||||
Wells Fargo Mortgage-Backed Securities Trust, Ser 2005-AR3, Cl 2A1 | ||||||||
3.096%, 03/25/2035 (A) | 1,268 | 1,275 | ||||||
Wells Fargo Mortgage-Backed Securities Trust, Ser 2005-AR7, Cl 2A1 | ||||||||
3.078%, 05/25/2035 (A) | 260 | 256 | ||||||
Wells Fargo Mortgage-Backed Securities Trust, Ser 2005-AR8, Cl 1A1 | ||||||||
3.041%, 06/25/2035 (A) | 1,424 | 1,442 | ||||||
Wells Fargo Mortgage-Backed Securities Trust, Ser 2005-AR8, Cl 3A2 | ||||||||
3.076%, 06/25/2035 (A) | 1,465 | 1,498 | ||||||
Wells Fargo Mortgage-Backed Securities Trust, Ser 2005-AR9, Cl 3A1 | ||||||||
3.027%, 06/25/2034 (A) | 1,708 | 1,737 | ||||||
Wells Fargo Mortgage-Backed Securities Trust, Ser 2006-4, Cl 2A2 | ||||||||
5.500%, 04/25/2036 | 726 | 676 | ||||||
WFCG Commercial Mortgage Trust, Ser 2015- BXRP, Cl C | ||||||||
2.296%, 11/15/2029 (A) (B) | 1,607 | 1,595 | ||||||
| SEI Institutional Investments Trust / Semi-Annual Report / November 30, 2016 | 45 |
SCHEDULE OF INVESTMENTS (Unaudited)
Opportunistic Income Fund (Continued)
November 30, 2016
| Description | Face Amount ($ Thousands) | Market Value ($ Thousands) | ||||||
WFRBS Commercial Mortgage Trust, Ser 2011- C2, Cl XA, IO | ||||||||
0.803%, 02/15/2044 (A) (B) | $ | 18,116 | $ | 479 | ||||
WFRBS Commercial Mortgage Trust, Ser 2012- C6, Cl A2 | ||||||||
2.191%, 04/15/2045 | 125 | 125 | ||||||
WFRBS Commercial Mortgage Trust, Ser 2012- C9, Cl A1 | ||||||||
0.673%, 11/15/2045 | 14 | 14 | ||||||
|
| |||||||
| 664,595 | ||||||||
|
| |||||||
Total Mortgage-Backed Securities |
| 777,479 | ||||||
|
| |||||||
LOAN PARTICIPATIONS — 27.2% |
| |||||||
ABC Supply, Term Loan B | ||||||||
3.500%, 09/23/2023 | 6,345 | 6,369 | ||||||
Academy Sports Ltd., 1st Lien | ||||||||
5.000%, 07/01/2022 | 828 | 762 | ||||||
Academy, Ltd. Term Loan | ||||||||
5.000%, 07/01/2022 | 544 | 500 | ||||||
Acadia Healthcare Company, 1st Lien | ||||||||
3.750%, 02/11/2022 | 1,376 | 1,373 | ||||||
3.750%, 02/16/2023 | 3,275 | 3,284 | ||||||
Acosta, Term Loan B, 1st Lien | ||||||||
4.250%, 09/26/2021 | 1,359 | 1,286 | ||||||
Advance Pierre Foods, Cov-Lite, 1st Lien | ||||||||
4.500%, 06/02/2023 | 1,593 | 1,599 | ||||||
Advanced Group, Lien 2 | ||||||||
3.500%, 11/10/2023 | 1,405 | 1,404 | ||||||
AdvancePierre Foods, Inc., Effective Date Loan, 2nd Lien | ||||||||
4.750%, 06/02/2023 | 7 | 7 | ||||||
Affinion Group Holdings | ||||||||
6.750%, 04/30/2018 | 2 | 2 | ||||||
Affinion Group Holdings, Tranche B | ||||||||
6.750%, 04/30/2018 | 3,353 | 3,272 | ||||||
Affinion Group, 2nd Lien | ||||||||
8.500%, 10/31/2018 | 740 | 696 | ||||||
Air Medical, Cov-Lite, Term Loan, 1st Lien | ||||||||
4.250%, 04/28/2022 | 5,756 | 5,692 | ||||||
Albertson's LLC, Term B-6 Loan, 1st Lien | ||||||||
4.750%, 06/22/2023 | 1,067 | 1,069 | ||||||
Alere, Term Loan B, 1st Lien | ||||||||
4.250%, 06/20/2022 | 5,982 | 5,925 | ||||||
Alinta Energy Finance, Delayed Term Loan | ||||||||
6.375%, 08/13/2018 | 192 | 192 | ||||||
Alinta Ltd., Cov-Lite, 1st Lien | ||||||||
6.375%, 08/13/2019 | 2,889 | 2,889 | ||||||
Allison Transmission, Term Loan B-3 | ||||||||
3.250%, 08/23/2019 | 2,355 | 2,374 | ||||||
| Description | Face Amount ($ Thousands) | Market Value ($ Thousands) | ||||||
Altice France S.A., USD Term Loan B-7, 1st Lien | ||||||||
5.137%, 01/15/2024 | $ | 1,731 | $ | 1,746 | ||||
AMC Entertainment, Term Loan | ||||||||
4.000%, 12/15/2022 | 6,306 | 6,341 | ||||||
American Renal Holdings, Term Loan, 1st Lien | ||||||||
4.750%, 08/20/2019 | 5,116 | 5,060 | ||||||
American Tire Distributors, Cov-Lite, 2nd Lien | ||||||||
5.250%, 09/01/2021 | 1,881 | 1,849 | ||||||
Amsurg, Cov-Lite, Term Loan | ||||||||
3.500%, 07/16/2021 | 4,047 | 4,047 | ||||||
Applied Systems, Term Loan, 1st Lien | ||||||||
4.000%, 01/25/2021 | 5,844 | 5,864 | ||||||
Aramark, 1st Lien, Term Loan F | ||||||||
3.338%, 02/24/2021 (A) | 4,998 | 5,037 | ||||||
Arcient Technologies, 4th Lien | ||||||||
5.500%, 04/14/2021 | 628 | 581 | ||||||
Ardagh Holdings USA, Term Loan, 1st Lien | ||||||||
3.000%, 12/17/2019 | 5,911 | 5,966 | ||||||
Aricent Technologies, 1st Lien | ||||||||
5.500%, 04/14/2021 | 625 | 579 | ||||||
Aricent Technologies, Term Loan, 1st Lien | ||||||||
5.500%, 04/14/2021 | 1,400 | 1,297 | ||||||
Asurion, LLC, Incremental Term Loan B-4, 1st Lien | ||||||||
5.000%, 08/04/2022 | 1,441 | 1,449 | ||||||
Asurion, LLC, Term Loan B | ||||||||
4.250%, 07/08/2020 | 981 | 983 | ||||||
Asurion, LLC, Term Loan B-1 | ||||||||
5.000%, 05/24/2019 | 319 | 320 | ||||||
Asurion, LLC, Term Loan, 2nd Lien | ||||||||
8.500%, 03/03/2021 | 5,650 | 5,705 | ||||||
Asurion, Term Loan B | ||||||||
4.750%, 10/31/2023 | 1,401 | 1,410 | ||||||
Auris Luxembourg II, Term Loan B-4 | ||||||||
4.250%, 01/17/2022 | 2,772 | 2,785 | ||||||
Avago Technologies Cayman Holdings Ltd., Term B-3 Loan, 1st Lien | ||||||||
3.538%, 02/01/2023 | 4,723 | 4,766 | ||||||
Avast Software, 1st Lien | ||||||||
5.000%, 08/03/2022 | 1,000 | 1,010 | ||||||
Berry Plastics Corporation, Term G Loan, 2nd Lien | ||||||||
3.500%, 01/06/2021 | 1,000 | 1,002 | ||||||
Berry Plastics Corporation, Term H Loan, 1st Lien | ||||||||
3.750%, 10/01/2022 | 1,106 | 1,112 | ||||||
Berry Plastics, Term Loan D | ||||||||
3.500%, 02/08/2020 | 1,930 | 1,935 | ||||||
Black Knight, Cov-Lite, Term Loan, 1st Lien | ||||||||
3.750%, 05/27/2022 | 437 | 440 | ||||||
Booz Allen, Lien 1 | ||||||||
3.312%, 06/30/2023 | 781 | 788 | ||||||
| 46 | SEI Institutional Investments Trust / Semi-Annual Report / November 30, 2016 |
| Description | Face Amount ($ Thousands) | Market Value ($ Thousands) | ||||||
Boyd Gaming, 1st Lien | ||||||||
3.526%, 09/15/2023 | $ | 2,750 | $ | 2,764 | ||||
Boyd Gaming, Term Loan B | ||||||||
4.000%, 08/14/2020 | 1,218 | 1,224 | ||||||
BPA Laboratories, 2nd Lien | ||||||||
0.060%, 07/03/2017 | 357 | 232 | ||||||
Bright Horizons Family Solutions, Lien 1 | ||||||||
3.500%, 11/30/2023 | 1,501 | 1,504 | ||||||
0.000%, 11/30/2023 (C) | 1,069 | 1,069 | ||||||
Burger King, Term Loan B-2, 1st Lien | ||||||||
3.750%, 12/10/2021 | 1,492 | 1,501 | ||||||
Cable & Wireless Communications | ||||||||
5.830%, 12/02/2022 | 218 | 220 | ||||||
5.500%, 12/02/2022 | 266 | 268 | ||||||
California Resources, 1st Lien | ||||||||
11.375%, 12/31/2021 | 1,190 | 1,294 | ||||||
Calpine, Term Loan, 1st Lien | ||||||||
3.590%, 05/27/2022 | 5,035 | 5,044 | ||||||
Camping World, Lien 1 | ||||||||
4.500%, 11/03/2023 | 1,248 | 1,259 | ||||||
Catalina Marketing, Cov-Lite, Term Loan | ||||||||
4.500%, 04/09/2021 | 985 | 830 | ||||||
Cavium, 1st Lien | ||||||||
3.750%, 08/16/2022 | 1,478 | 1,487 | ||||||
CCM Merger, Term Loan | ||||||||
4.500%, 08/06/2021 | 1,695 | 1,702 | ||||||
Ceramtec Acquisition, Term Loan B1 | ||||||||
4.250%, 08/30/2020 | 1,952 | 1,960 | ||||||
Ceramtec Acquisition, Term Loan B2 | ||||||||
4.250%, 08/30/2020 | 216 | 217 | ||||||
Ceramtec Acquisition, Term Loan B3 | ||||||||
4.250%, 08/30/2020 | 597 | 599 | ||||||
Ceridian, Cov-Lite | ||||||||
4.500%, 09/15/2020 | 1 | 1 | ||||||
Ceridian, Cov-Lite, 1st Lien | ||||||||
4.500%, 09/15/2020 | 98 | 96 | ||||||
Charter Communication Operating LLC, Term Loan E | ||||||||
3.000%, 07/01/2020 | 2,975 | 2,983 | ||||||
Charter Communications Operating, LLC (aka CCO Safari LLC), Term I Loan (2016), 1st Lien | ||||||||
3.500%, 01/24/2023 | 90 | 90 | ||||||
Chesapeake Energy, 1st Lien | ||||||||
8.500%, 08/23/2021 | 1,495 | 1,597 | ||||||
Chief Exploration, Term Loan | ||||||||
7.753%, 05/16/2021 | 2,026 | 1,920 | ||||||
Clubcorp Club Operations, Term Loan, 1st Lien | ||||||||
4.000%, 12/15/2022 | 1,832 | 1,844 | ||||||
Commscope, Inc., Tranche 5 Term Loan (2015) | ||||||||
3.250%, 12/29/2022 | 3,945 | 3,980 | ||||||
| Description | Face Amount ($ Thousands) | Market Value ($ Thousands) | ||||||
Communication Sales and Leasing, Term Loan, 1st Lien | ||||||||
4.500%, 10/24/2022 | $ | 5,581 | $ | 5,614 | ||||
Conduent, Term Loan B | ||||||||
0.000%, 11/22/2023 (C) | 2,350 | 2,356 | ||||||
Constantia Flexibles, Initial Term Loan | ||||||||
4.000%, 04/30/2022 | 290 | 290 | ||||||
Constantia Flexibles, Lien 1 | ||||||||
4.000%, 04/30/2022 | 1,488 | 1,488 | ||||||
COTY, Term Loan | ||||||||
3.750%, 01/26/2023 | 3,552 | 3,562 | ||||||
CSC Holdings, Lien 1 | ||||||||
3.876%, 10/11/2024 | 41 | 42 | ||||||
Cumulus Media, 1st Lien | ||||||||
4.250%, 12/23/2020 | 4,163 | 2,504 | ||||||
DaVita HealthCare Partners, Term Loan B | ||||||||
3.500%, 06/24/2021 | 3,947 | 3,957 | ||||||
Dell, Cov Lite, Term Loan B, 1st Lien | ||||||||
4.000%, 09/07/2023 | 3,255 | 3,285 | ||||||
Dex Media West, Term Loan | ||||||||
8.000%, 12/30/2016 | 1,675 | 687 | ||||||
Diebold, Dollar Term Loan B, 1st Lien | ||||||||
5.250%, 11/06/2023 | 1,448 | 1,469 | ||||||
Digital Globe, Term Loan B, 1st Lien | ||||||||
4.750%, 01/31/2020 | 724 | 728 | ||||||
DJO Finance 4/15 TL | ||||||||
4.250%, 06/08/2020 | 3,180 | 3,045 | ||||||
DJO Finance LLC, Initial Term Loan | ||||||||
4.250%, 06/08/2020 | 1,566 | 1,500 | ||||||
Emerald Performance Materials, LLC, Term Loan, 1st Lien | ||||||||
4.500%, 07/30/2021 | 3,861 | 3,877 | ||||||
Emergency Medical Services, Cov-Lite, Term Loan | ||||||||
4.250%, 05/25/2018 | 171 | 171 | ||||||
Emergency Medical Services, Initial Term Loan | ||||||||
4.250%, 05/25/2018 | 4,170 | 4,165 | ||||||
EMI Publishing | ||||||||
0.000%, 08/19/2022 (C) | 2,459 | 2,463 | ||||||
Endurance International, Term Loan B, 1st Lien | ||||||||
6.480%, 11/09/2019 | 5,221 | 5,126 | ||||||
Energy & Exploration Partners, 1st Lien | ||||||||
6.000%, 05/13/2022 | 210 | 139 | ||||||
0.500%, 11/12/2021 | 145 | 9 | ||||||
Energy & Exploration, 1st Lien | ||||||||
13.000%, 11/12/2021 | 376 | 354 | ||||||
Energy Transfer Equity, Term Loan B, 1st Lien | ||||||||
3.387%, 12/02/2019 | 4,685 | 4,666 | ||||||
Engility Coporation, Term Loan B-2, 1st Lien | ||||||||
5.750%, 08/14/2023 | 2,838 | 2,866 | ||||||
Entegris, Term Loan B, 1st Lien | ||||||||
3.500%, 04/30/2021 | 5,531 | 5,559 | ||||||
| SEI Institutional Investments Trust / Semi-Annual Report / November 30, 2016 | 47 |
SCHEDULE OF INVESTMENTS (Unaudited)
Opportunistic Income Fund (Continued)
November 30, 2016
| Description | Face Amount ($ Thousands) | Market Value ($ Thousands) | ||||||
Envigo Holdings, Lien 1 | ||||||||
9.390%, 10/28/2021 | $ | 1,454 | $ | 1,432 | ||||
Environmental Resources | ||||||||
5.000%, 05/14/2021 | 435 | 402 | ||||||
Envision Healthcare, Term Loan B | ||||||||
3.750%, 12/01/2023 | 6,670 | 6,678 | ||||||
Epicor, Cov-Lite, Term Loan, 1st Lien | ||||||||
4.750%, 06/01/2022 | 3,508 | 3,499 | ||||||
Equinox Fitness Clubs, Term Loan B | ||||||||
5.000%, 01/31/2020 | 6,800 | 6,828 | ||||||
ESH Hospitality, 1st Lien | ||||||||
3.750%, 08/30/2023 | 3,000 | 3,019 | ||||||
Evergreen Skillsoft, 1st Lien | ||||||||
5.837%, 04/28/2021 | 5,508 | 5,088 | ||||||
First Data, Lien 1 | ||||||||
3.524%, 03/24/2021 | 4,335 | 4,352 | ||||||
First Data, Term Loan, 1st Lien | ||||||||
4.274%, 07/08/2022 | 466 | 468 | ||||||
FMG RESOURCES AUG 2006 | ||||||||
3.750%, 06/30/2019 (A) | 405 | 405 | ||||||
Focus Brands, Lien 1 | ||||||||
5.000%, 10/03/2023 | 1,075 | 1,089 | ||||||
Fort Dearborn Company, Lien 1 | ||||||||
5.000%, 10/06/2023 | 717 | 719 | ||||||
Four Seasons Holdings, Term Loan | ||||||||
3.588%, 06/27/2020 | 4,878 | 4,883 | ||||||
Four Seasons, Term Loan B | ||||||||
0.000%, 11/21/2023 (C) | 4,878 | 4,918 | ||||||
Freeport-McMoran C & G, Term Loan A - 2020 | ||||||||
3.040%, 02/28/2020 | 1,380 | 1,366 | ||||||
Generac Power Systems, Term Loan B | ||||||||
3.596%, 05/31/2020 | 2,353 | 2,362 | ||||||
Genesys Telecom, Term Loan | ||||||||
4.000%, 02/08/2020 | 5,625 | 5,634 | ||||||
GNC, Term Loan, 1st Lien | ||||||||
3.250%, 03/04/2019 | 5,178 | 4,932 | ||||||
GO Daddy, Cov-Lite, Term Loan B, 1st Lien | ||||||||
4.250%, 05/13/2021 | 1,173 | 1,180 | ||||||
Gray Television, Cov-Lite, Term B, 1st Lien | ||||||||
3.938%, 06/13/2021 | 632 | 636 | ||||||
Greeneden US Holdings, Delayed Draw, Term Loan, 1st Lien, Ser 2 | ||||||||
4.500%, 11/13/2020 | 1,702 | 1,701 | ||||||
Grifols Worldwide Operations, Term Loan B, 2nd Lien | ||||||||
3.460%, 02/27/2021 | 3,653 | 3,681 | ||||||
Gulf Finance LLC, 1st Lien | ||||||||
6.250%, 08/25/2023 | 877 | 863 | ||||||
Hanson Building, Lien 1 | ||||||||
6.000%, 10/20/2023 | 1,925 | 1,924 | ||||||
Harbor Freight Tools, Cov-Lite, 1st Lien | ||||||||
4.137%, 08/18/2023 | 6,413 | 6,464 | ||||||
| Description | Face Amount ($ Thousands) | Market Value ($ Thousands) | ||||||
Headwaters | ||||||||
4.000%, 03/24/2022 | $ | 4,280 | $ | 4,297 | ||||
Hilton Hotels, Cov-Lite, Term Loan B, 1st Lien | ||||||||
3.500%, 10/26/2020 (A) | 103 | 104 | ||||||
HILTON WORLDWIDE FINANCE | ||||||||
3.500%, 10/26/2020 (A) | 63 | 63 | ||||||
Hilton Worldwide Finance LLC, Series B-2 Term Loan, | ||||||||
3.084%, 10/25/2023 | 1,055 | 1,062 | ||||||
3.034%, 10/25/2023 | 646 | 650 | ||||||
Houghton Mifflin Harcourt Publishers, Term Loan, 1st Lien | ||||||||
4.000%, 05/28/2021 | 2,864 | 2,679 | ||||||
HUB International, Ltd., Term Loan B, 1st Lien | ||||||||
4.000%, 10/02/2020 | 8,394 | 8,400 | ||||||
Hyperion Insurance, Term Loan, 1st Lien | ||||||||
5.500%, 04/29/2022 | 1,660 | 1,648 | ||||||
Immucor, Term Loan B | ||||||||
5.000%, 08/19/2018 | 2,900 | 2,820 | ||||||
IMS Health | ||||||||
3.500%, 10/03/2021 | 508 | 511 | ||||||
IMS Health, Lien 1 | ||||||||
3.500%, 10/03/2021 | 2,483 | 2,498 | ||||||
Ineos Holdings Ltd, Cov-Lite, Term Loan, 1st Lien | ||||||||
4.250%, 03/31/2022 | 857 | 862 | ||||||
Ineos US Finance LLC, 2020 Dollar Term Loan | ||||||||
3.750%, 12/15/2020 | 1,472 | 1,475 | ||||||
Infinity Acquisition, 1st Lien | ||||||||
4.250%, 08/06/2021 | 4 | 4 | ||||||
Infinity Acquisition, LLC, Term Loan B, 1st Lien | ||||||||
4.250%, 08/06/2021 | 1,649 | 1,567 | ||||||
Infoblox, Lien 1 | ||||||||
6.000%, 11/03/2023 | 2,086 | 2,049 | ||||||
Informatica, Term Loan B, 1st Lien | ||||||||
4.500%, 08/05/2022 | 2,313 | 2,261 | ||||||
Intelsat Jackson Holdings, Term Loan B-2 | ||||||||
3.750%, 06/30/2019 (A) | 3,698 | 3,563 | ||||||
ION Trading Technologies, Term Loan, Tranche B-1 | ||||||||
4.250%, 08/11/2023 | 5,871 | 5,915 | ||||||
J.C. Penney Corporation, Inc. , Loan (2016), | ||||||||
5.250%, 06/09/2023 | 368 | 370 | ||||||
Jeld-Wen, Lien 1 | ||||||||
4.750%, 07/01/2022 | 6,840 | 6,894 | ||||||
Kenan Advantage, Cov-Lite, Initial Term Loan, 1st Lien | ||||||||
4.000%, 07/29/2022 | 1,307 | 1,303 | ||||||
Kenan Advantage, Delayed Draw Term Loan | ||||||||
1.500%, 01/31/2017 (D) | 103 | — | ||||||
Kenan Advantage, Delayed Term Loan | ||||||||
1.500%, 01/31/2017 | 71 | 70 | ||||||
| 48 | SEI Institutional Investments Trust / Semi-Annual Report / November 30, 2016 |
| Description | Face Amount ($ Thousands) | Market Value ($ Thousands) | ||||||
Kenan Advantage, Initial | ||||||||
4.000%, 07/29/2022 | $ | 425 | $ | 424 | ||||
KFC Holding, Term Loan B | ||||||||
3.305%, 06/16/2023 | 1,850 | 1,867 | ||||||
Klockner Pentaplast | ||||||||
4.250%, 04/28/2020 | 892 | 901 | ||||||
Kraton Polymers LLC, Initial Term Loan, 1st Lien | ||||||||
6.000%, 01/06/2022 | 1,715 | 1,724 | ||||||
Kronos, Term Loan B | ||||||||
5.000%, 10/20/2023 | 1,894 | 1,898 | ||||||
Landry's, Term Loan B (2016) | ||||||||
4.000%, 09/21/2023 | 1,150 | 1,156 | ||||||
LBM, Term Loan Lien 1 | ||||||||
6.250%, 08/20/2022 | 1,026 | 1,016 | ||||||
Learfield Communications, Lien 1 | ||||||||
0.000%, 11/17/2023 (C) | 1,520 | 1,530 | ||||||
Lee Enterprises, Term Loan B | ||||||||
7.250%, 03/31/2019 | 1,035 | 1,035 | ||||||
Leslie's Poolmart, 1st Lien | ||||||||
5.250%, 08/16/2023 | 2,057 | 2,073 | ||||||
Level 3 Financing, Term Loan B-I | ||||||||
4.000%, 01/15/2020 | 2,500 | 2,519 | ||||||
Level 3 Financing, Term Loan B-II | ||||||||
3.500%, 05/31/2022 | 1,071 | 1,079 | ||||||
Level 3 Financing, Term Loan B-III | ||||||||
4.000%, 08/01/2019 | 2,000 | 2,020 | ||||||
Life Time Fitness, Closing Date Term Loan | ||||||||
4.250%, 06/10/2022 | 1 | 1 | ||||||
Life Time Fitness, Term Loan B | ||||||||
4.250%, 06/10/2022 | 4,658 | 4,657 | ||||||
Light Tower Fiber, LLC, Term Loan B | ||||||||
4.088%, 04/13/2020 | 4,874 | 4,880 | ||||||
LPL Holdings, 2021 Tranche B Term Loan | ||||||||
4.250%, 03/29/2021 | 1,693 | 1,702 | ||||||
MA Financeco., LLC, Initial Tranche B-2 Term Loan, 1st Lien | ||||||||
4.500%, 11/19/2021 | 4,233 | 4,259 | ||||||
Media General, Delayed Term Loan | ||||||||
4.000%, 07/31/2020 | 569 | 569 | ||||||
Mediacom Broadbank, 1st Lien | ||||||||
3.250%, 01/29/2021 | 3,048 | 3,064 | ||||||
MEG Energy, Term Loan | ||||||||
3.750%, 03/31/2020 | 1,600 | 1,503 | ||||||
MGM Growth Properties Operating Partnership LP, Term B Loan, 1st Lien | ||||||||
3.500%, 04/25/2023 | 569 | 572 | ||||||
Michaels Stores, Initial Term Loan | ||||||||
3.750%, 01/30/2023 | 2,368 | 2,384 | ||||||
Michaels Stores, Term Lona B | ||||||||
3.750%, 01/30/2023 | 3,501 | 3,525 | ||||||
| Description | Face Amount ($ Thousands) | Market Value ($ Thousands) | ||||||
Millennium Labs | ||||||||
7.500%, 12/21/2020 | $ | 695 | $ | 393 | ||||
Minimax GmbH, Term Loan B, 1st Lien | ||||||||
4.000%, 08/14/2020 | 3,803 | 3,813 | ||||||
Mission Broadcasting, Term Loan B | ||||||||
3.000%, 09/26/2023 | 430 | 431 | ||||||
MKS Instruments, Tranche B-1 Term Loan, 2nd Lien | ||||||||
4.250%, 05/01/2023 | 1,049 | 1,054 | ||||||
Mohegan Tribal Gaming, Term Loan B (2016) | ||||||||
5.500%, 09/30/2023 | 5,585 | 5,575 | ||||||
Mueller Water Products, Term Loan, 1st Lien | ||||||||
4.000%, 11/24/2021 | 577 | 580 | ||||||
Multiplan Cov-Lite, 1st Lien | ||||||||
5.000%, 06/07/2023 | 2,793 | 2,824 | ||||||
Murray Energy, Cov-Lite, Term Loan B, 2nd Lien | ||||||||
8.250%, 04/16/2020 | 3,430 | 3,108 | ||||||
NBTY, 1st Lien | ||||||||
5.000%, 05/05/2023 | 3,805 | 3,807 | ||||||
NCI Building Systems, Term Loan | ||||||||
4.250%, 06/24/2019 | 1,058 | 1,058 | ||||||
Nelson Education | ||||||||
0.000%, 10/01/2020 *(C) | 92 | 4 | ||||||
Nelson Education, 1st Lien | ||||||||
12.000%, 10/01/2020 | 560 | 307 | ||||||
Nexstar Broadcasting, Term Loan B | ||||||||
3.000%, 09/26/2023 | 4,820 | 4,841 | ||||||
NXP BV/NXP Funding LLC, Term Loan F | ||||||||
3.405%, 12/07/2020 | 723 | 725 | ||||||
On Semiconductor Term Loan | ||||||||
3.783%, 03/31/2023 | 3,416 | 3,437 | ||||||
Peabody Energy, Commitment, 1st Lien | ||||||||
10.000%, 04/18/2017 | 664 | 685 | ||||||
Peabody Energy, Cov-Lite, Term Loan B, 1st Lien | ||||||||
4.250%, 09/24/2020 | 669 | 629 | ||||||
Petsmart, Term Loan B | ||||||||
4.000%, 03/11/2022 | 1,387 | 1,391 | ||||||
Pharmaceutical Prodiuct Cov-Lite | ||||||||
4.250%, 08/18/2022 | 54 | 54 | ||||||
Pharmaceutical Product, Cov-Lite, Initial Term Loan, 1st Lien | ||||||||
4.250%, 08/18/2022 | 6,214 | 6,228 | ||||||
Pinnacle Foods Group, LLC, Term Loan H | ||||||||
3.250%, 04/29/2020 | 1,280 | 1,285 | ||||||
PQ, Tranche B-1 Term Loan, 1st Lien | ||||||||
5.750%, 11/04/2022 | 905 | 912 | ||||||
Press Ganey, Term Loan | ||||||||
4.250%, 09/29/2023 | 500 | 500 | ||||||
Quebecor Media, Term Loan B | ||||||||
3.250%, 08/17/2020 | 1,117 | 1,113 | ||||||
| SEI Institutional Investments Trust / Semi-Annual Report / November 30, 2016 | 49 |
SCHEDULE OF INVESTMENTS (Unaudited)
Opportunistic Income Fund (Continued)
November 30, 2016
| Description | Face Amount ($ Thousands) | Market Value ($ Thousands) | ||||||
Radnet Management, Restatement Effective Date Term Loan, 1st Lien | ||||||||
6.250%, 06/30/2023 | $ | 6 | $ | 6 | ||||
4.750%, 06/30/2023 | 5,709 | 5,709 | ||||||
RE/MAX International, Term Loan | ||||||||
4.000%, 07/31/2020 | 2,344 | 2,337 | ||||||
Redtop Acquisitions, Ltd., Term Loan, 1st Lien | ||||||||
4.500%, 12/03/2020 | 608 | 606 | ||||||
Regal Cinemas Corporation, Refinancing Term Loan, 1st Lien | ||||||||
3.500%, 04/01/2022 | 2,085 | 2,090 | ||||||
Rexnord, LLC, Cov-Lite, Term Loan B, 1st Lien | ||||||||
4.000%, 08/21/2020 | 498 | 499 | ||||||
Rexnord, LLC, Term Loan B | ||||||||
4.000%, 08/21/2020 | 2,054 | 2,060 | ||||||
Reynolds Group Holdings Inc., U.S. Term Loan, 1st Lien | ||||||||
4.250%, 02/05/2023 | 5,332 | 5,358 | ||||||
Rocket Software, Lien 1 | ||||||||
5.250%, 10/11/2023 | 1,347 | 1,350 | ||||||
Rocket Software, Lien 2 | ||||||||
10.500%, 10/11/2024 | 400 | 401 | ||||||
Royal Adhesives & Sealants, | ||||||||
4.500%, 06/20/2022 | 5,678 | 5,707 | ||||||
Ryman Hospitality Properties, | ||||||||
3.590%, 01/15/2021 | 518 | 521 | ||||||
Salem Communications, Term Loan B | ||||||||
4.500%, 03/13/2020 | 627 | 608 | ||||||
Samsonite International S.A., Initial Tranche B Term Loan , 1st Lien | ||||||||
4.000%, 05/15/2023 | 857 | 866 | ||||||
SBA Finance, Incremental Term Loan, 1st Lien | ||||||||
3.340%, 06/10/2022 | 5,447 | 5,446 | ||||||
Seadrill Partners, LLC, Term Loan B, 1st Lien | ||||||||
4.000%, 02/21/2021 | 4,815 | 2,724 | ||||||
Seaworld, Term Loan B-2 | ||||||||
3.088%, 05/14/2020 | 1,992 | 1,939 | ||||||
Seminole Hard Rock Entertainment, Term Loan B | ||||||||
3.588%, 05/14/2020 | 3,175 | 3,182 | ||||||
Signode (USD) Cov-Lite, Term Loan | ||||||||
3.750%, 05/01/2021 | 1,911 | 1,909 | ||||||
Signode Industrial | ||||||||
3.750%, 05/01/2021 | 459 | 458 | ||||||
Sinclair Television Group, Term Loan B1, 1st Lien | ||||||||
3.508%, 07/30/2021 | 2,985 | 2,993 | ||||||
Six Flags Theme Parks, Term Loan, 1st Lien | ||||||||
3.340%, 06/30/2022 | 2,047 | 2,063 | ||||||
3.250%, 06/30/2022 | 3,525 | 3,554 | ||||||
| Description | Face Amount ($ Thousands) | Market Value ($ Thousands) | ||||||
Six Flags Theme Parks, Term Loan, 3rd Lien | ||||||||
5.000%, 06/30/2022 | $ | 3 | $ | 3 | ||||
SS&C Technologies, | ||||||||
4.000%, 07/08/2022 | 2,832 | 2,852 | ||||||
SS&C Technologies, | ||||||||
4.000%, 07/08/2022 | 400 | 402 | ||||||
SS&C Technologies, Term Loan, 1st Lien | ||||||||
4.000%, 07/08/2022 | 227 | 229 | ||||||
Starwood Property Trust, Term Loan B | ||||||||
3.500%, 04/17/2020 | 1,190 | 1,191 | ||||||
Station Casinos, 1st Lien | ||||||||
3.750%, 06/08/2023 | 2,768 | 2,791 | ||||||
Sterigenics-Nordion, Cov-Lite, Term Loan, 1st Lien | ||||||||
4.250%, 05/16/2022 | 2,208 | 2,200 | ||||||
Surgical Care Affiliates, Lien 1 | ||||||||
3.750%, 03/17/2022 | 3,928 | 3,936 | ||||||
Syncreon Holdings Ltd., Term Loan B, 1st Lien | ||||||||
5.250%, 10/28/2020 | 4,660 | 4,180 | ||||||
Syniverse Holdings | ||||||||
4.000%, 04/23/2019 | 1,660 | 1,496 | ||||||
Syniverse Holdings, 1st Lien | ||||||||
4.000%, 04/23/2019 | 696 | 622 | ||||||
Telenet International Finance, Lien 1 | ||||||||
3.549%, 01/31/2025 | 3,050 | 3,044 | ||||||
Texas Competitive, Extended Term Loan | ||||||||
5.000%, 10/10/2017 (E) | — | — | ||||||
4.970%, 10/10/2017 (E) | — | — | ||||||
Townsquare Media, Term Loan | ||||||||
4.250%, 04/01/2022 | 2,121 | 2,121 | ||||||
Trans Union LLC, Replacement Term Loan | ||||||||
3.588%, 04/09/2021 | 6,344 | 6,373 | ||||||
TransDigm, Term Loan C, 1st Lien | ||||||||
3.750%, 02/28/2020 | 3,458 | 3,464 | ||||||
TransDigm, Term Loan D, 1st Lien | ||||||||
3.838%, 06/04/2021 | 1,000 | 1,003 | ||||||
Tribune Media, Term Loan, 1st Lien | ||||||||
3.750%, 12/27/2020 | 2,678 | 2,684 | ||||||
Tricobraun | ||||||||
0.000%, 11/29/2017 (C) | 148 | 148 | ||||||
0.000%, 11/29/2023 (C) | 1,483 | 1,482 | ||||||
Tronox, Term Loan B | ||||||||
4.500%, 03/19/2020 | 966 | 965 | ||||||
True Religion Apparel, 1st Lien | ||||||||
5.875%, 07/30/2019 | 1,351 | 350 | ||||||
TXU/Tech, 1st Lien | ||||||||
5.000%, 08/04/2023 | 4,636 | 4,679 | ||||||
UFC Holdings LLC, 1st Lien | ||||||||
5.000%, 08/18/2023 | 1,546 | 1,555 | ||||||
Univar, Cov-Lite, Initial Term Loan | ||||||||
4.250%, 07/01/2022 | 2,170 | 2,178 | ||||||
| 50 | SEI Institutional Investments Trust / Semi-Annual Report / November 30, 2016 |
| Description | Face Amount ($ Thousands) | Market Value ($ Thousands) | ||||||
Univar, Term Loan, 1st Lien | ||||||||
4.250%, 07/01/2022 | $ | 2,215 | $ | 2,223 | ||||
Univision Communications, Extended Term Loan C-3 | ||||||||
4.000%, 03/01/2020 (A) | 1,545 | 1,546 | ||||||
Univision Communications, Term Loan, 1st Lien | ||||||||
4.000%, 03/01/2020 | 4,835 | 4,833 | ||||||
UPC Finance Partnership | ||||||||
3.250%, 06/30/2021 | 1,000 | 1,005 | ||||||
UPC Financing Partnership , Facility AN, | ||||||||
4.080%, 08/31/2024 | 5,952 | 5,975 | ||||||
US Renal Care, Cov-Lite, 1st Lien | ||||||||
5.250%, 12/30/2022 | 6,088 | 5,700 | ||||||
Valeant Pharmaceuticals International, Term Loan B, 1st Lien, Ser C-2 | ||||||||
4.750%, 12/11/2019 | 1,235 | 1,222 | ||||||
Valeant Pharmaceuticals International, Term Loan B, 1st Lien, Ser D-2 | ||||||||
5.000%, 02/13/2019 | 123 | 122 | ||||||
Valeant Pharmaceuticals International, Term Loan B, 1st Lien, Ser E-1 | ||||||||
5.250%, 08/05/2020 | 1,544 | 1,525 | ||||||
Valeant, Term Loan B | ||||||||
5.500%, 04/01/2022 | 650 | 644 | ||||||
Vantiv, LLC, Term Loan B, 1st Lien | ||||||||
3.250%, 06/13/2021 | 409 | 411 | ||||||
Verint Systems, Term Loan B, 1st Lien | ||||||||
3.636%, 09/06/2019 | 2,511 | 2,526 | ||||||
Veritas Bermuda, 1st Lien | ||||||||
6.625%, 01/27/2023 | 378 | 340 | ||||||
Versum Materials, Term Loan B | ||||||||
3.340%, 09/21/2023 | 3,145 | 3,166 | ||||||
Vertafore, Term Loan B, 1st Lien | ||||||||
4.750%, 06/30/2023 | 2,909 | 2,916 | ||||||
VF Holding Corp., Initial Term Loan, 1st Lien | ||||||||
4.750%, 06/30/2023 | 291 | 292 | ||||||
Virgin Media, Term Loan, 1st Lien | ||||||||
3.500%, 06/30/2023 | 6,024 | 6,056 | ||||||
Warner Music Group, Term Loan | ||||||||
3.750%, 07/01/2020 | 4,162 | 4,162 | ||||||
Waste Industries USA, Inc., Term B Loan, 1st Lien | ||||||||
3.500%, 02/27/2020 | 2,807 | 2,813 | ||||||
WaveDivision Holdings, Term Loan, Tranche 1 | ||||||||
4.000%, 10/15/2019 | 3,906 | 3,913 | ||||||
WCA Waste Corporation, 1st Lien | ||||||||
4.000%, 08/11/2023 | 4,020 | 4,015 | ||||||
Weight Watchers International, Term Loan B2, 1st Lien | ||||||||
4.000%, 04/02/2020 | 3 | 3 | ||||||
Weight Watchers International, Term Loan, Tranche B-2 | ||||||||
4.100%, 04/02/2020 | 1,317 | 1,004 | ||||||
| Description | Face Amount ($ Thousands) | Market Value ($ Thousands) | ||||||
West Corporation, Term Loan B-12, 1st Lien | ||||||||
3.750%, 06/17/2023 | $ | 1,860 | $ | 1,867 | ||||
WideOpenWest Finance LLC, Lien 1 | ||||||||
4.500%, 08/18/2023 | 15 | 15 | ||||||
WideOpenWest Finance LLC, Term Loan B | ||||||||
4.500%, 08/18/2023 | 5,793 | 5,799 | ||||||
Wilsonart International Holdings LLC, Term Loan, 1st Lien | ||||||||
4.000%, 10/31/2019 | 6,348 | 6,352 | ||||||
XPO Logistics | ||||||||
4.250%, 11/01/2021 | 2,497 | 2,520 | ||||||
York Risk Services Holding, Term Loan B | ||||||||
4.750%, 10/01/2021 | 4,020 | 3,713 | ||||||
York Risk Services, Cov-Lite, 1st Lien | ||||||||
4.750%, 10/01/2021 | 435 | 401 | ||||||
Zekelman Industries, 1st Lien | ||||||||
6.000%, 06/14/2021 | 988 | 991 | ||||||
Ziggo, Term Loan B1, 1st Lien | ||||||||
3.500%, 01/15/2022 | 2,022 | 2,022 | ||||||
Ziggo, Term Loan B2, 1st Lien | ||||||||
3.701%, 01/15/2022 | — | — | ||||||
3.500%, 01/15/2022 | 1,198 | 1,198 | ||||||
Ziggo, Term Loan B3, 1st Lien | ||||||||
3.701%, 01/15/2022 | 372 | 372 | ||||||
|
| |||||||
Total Loan Participations |
| 597,070 | ||||||
|
| |||||||
ASSET-BACKED SECURITIES — 25.2% |
| |||||||
Automotive — 3.0% | ||||||||
Ally Auto Receivables Trust, | ||||||||
1.210%, 12/20/2017 | 383 | 383 | ||||||
AmeriCredit Automobile Receivables Trust, Ser 2013-4, Cl C | ||||||||
2.720%, 09/09/2019 | 1,150 | 1,159 | ||||||
AmeriCredit Automobile Receivables Trust, Ser 2014-2, Cl A3 | ||||||||
0.940%, 02/08/2019 | 711 | 710 | ||||||
AmeriCredit Automobile Receivables Trust, Ser 2014-3, Cl A3 | ||||||||
1.150%, 06/10/2019 | 950 | 950 | ||||||
AmeriCredit Automobile Receivables Trust, Ser 2015-1, Cl A3 | ||||||||
1.260%, 11/08/2019 | 679 | 679 | ||||||
AmeriCredit Automobile Receivables Trust, Ser 2015-4, Cl A2A | ||||||||
1.260%, 04/08/2019 | 225 | 225 | ||||||
AmeriCredit Automobile Receivables Trust, Ser 2015-4, Cl A2B | ||||||||
1.279%, 04/08/2019 (A) | 1,572 | 1,575 | ||||||
| SEI Institutional Investments Trust / Semi-Annual Report / November 30, 2016 | 51 |
SCHEDULE OF INVESTMENTS (Unaudited)
Opportunistic Income Fund (Continued)
November 30, 2016
| Description | Face Amount ($ Thousands) | Market Value ($ Thousands) | ||||||
AmeriCredit Automobile Receivables Trust, Ser 2016-1, Cl A2A | ||||||||
1.520%, 06/10/2019 | $ | 301 | $ | 301 | ||||
AmeriCredit Automobile Receivables Trust, Ser 2016-1, Cl A2B | ||||||||
1.280%, 06/10/2019 (A) | 1,857 | 1,862 | ||||||
AmeriCredit Automobile Receivables Trust, Ser 2016-2, Cl A2A | ||||||||
1.420%, 10/08/2019 | 3,667 | 3,667 | ||||||
AmeriCredit Automobile Receivables Trust, Ser 2016-3, Cl A3 | ||||||||
1.460%, 05/10/2021 | 140 | 139 | ||||||
Americredit Automobile Receivables Trust, Ser 2016-4, Cl A2A | ||||||||
1.340%, 04/08/2020 | 495 | 495 | ||||||
ARI Fleet Lease Trust, Ser 2014-A, Cl A2 | ||||||||
0.810%, 11/15/2022 (B) | 26 | 26 | ||||||
Capital Auto Receivables Asset Trust, Ser 2014- 1, Cl A3 | ||||||||
1.320%, 06/20/2018 | 480 | 480 | ||||||
Capital Auto Receivables Asset Trust, Ser 2015- 1, Cl A3 | ||||||||
1.610%, 06/20/2019 | 900 | 902 | ||||||
Capital Auto Receivables Asset Trust, Ser 2015- 4, Cl A2 | ||||||||
1.620%, 03/20/2019 | 750 | 749 | ||||||
CarMax Auto Owner Trust, | ||||||||
0.840%, 11/15/2018 | 806 | 805 | ||||||
CarMax Auto Owner Trust, | ||||||||
1.320%, 07/15/2019 | 980 | 981 | ||||||
CarMax Auto Owner Trust, | ||||||||
1.160%, 06/17/2019 | 3,591 | 3,590 | ||||||
CarMax Auto Owner Trust, | ||||||||
1.090%, 04/15/2019 | 442 | 441 | ||||||
CarMax Auto Owner Trust, | ||||||||
1.560%, 11/16/2020 | 850 | 853 | ||||||
CarMax Auto Owner Trust, | ||||||||
1.210%, 11/15/2019 | 3,000 | 2,995 | ||||||
Chesapeake Funding II LLC, | ||||||||
1.538%, 06/15/2028 (A) (B) | 1,000 | 1,005 | ||||||
Chesapeake Funding LLC, Ser 2015-1A, Cl A | ||||||||
1.033%, 02/07/2027 (A) (B) | 1,049 | 1,049 | ||||||
Chrysler Capital Auto Receivables Trust, Ser 2014-AA, Cl A4 | ||||||||
1.310%, 05/15/2019 (B) | 110 | 110 | ||||||
Chrysler Capital Auto Receivables Trust, Ser 2016-BA, Cl A3 | ||||||||
1.640%, 07/15/2021 (B) | 915 | 910 | ||||||
CPS Auto Receivables Trust, Ser 2013-D, Cl A | ||||||||
1.540%, 07/16/2018 (B) | 14 | 14 | ||||||
CPS Auto Receivables Trust, Ser 2014-A, Cl A | ||||||||
1.210%, 08/15/2018 (B) | 17 | 17 | ||||||
| Description | Face Amount ($ Thousands) | Market Value ($ Thousands) | ||||||
Credit Acceptance Auto Loan Trust, Ser 2014- 1A, Cl A | ||||||||
1.550%, 10/15/2021 (B) | $ | 178 | $ | 178 | ||||
Enterprise Fleet Financing LLC, Ser 2013-2, Cl A3 | ||||||||
1.510%, 03/20/2019 (B) | 190 | 190 | ||||||
Enterprise Fleet Financing LLC, Ser 2016-2, Cl A2 | ||||||||
1.740%, 02/22/2022 (B) | 380 | 380 | ||||||
First Investors Auto Owner Trust, Ser 2014-1A, Cl A3 | ||||||||
1.490%, 01/15/2020 (B) | 348 | 348 | ||||||
First Investors Auto Owner Trust, Ser 2016-2A, Cl A2 | ||||||||
1.870%, 11/15/2021 (B) | 1,000 | 993 | ||||||
Flagship Credit Auto Trust, Ser 2014-2, Cl A | ||||||||
1.430%, 12/16/2019 (B) | 581 | 579 | ||||||
Ford Credit Auto Lease Trust, Ser 2014-B, Cl A4 | ||||||||
1.100%, 11/15/2017 | 18 | 18 | ||||||
Ford Credit Auto Lease Trust, Ser 2015-B, Cl B | ||||||||
1.920%, 03/15/2019 | 465 | 465 | ||||||
Ford Credit Floorplan Master Owner Trust, Ser 2014-1, Cl B | ||||||||
1.400%, 02/15/2019 | 135 | 135 | ||||||
GLS Auto Receivables Trust, Ser 2016-1A, Cl A | ||||||||
2.730%, 10/15/2020 (B) | 330 | 329 | ||||||
GM Financial Automobile Leasing Trust, Ser 2015-1, Cl B | ||||||||
2.140%, 06/20/2019 | 670 | 672 | ||||||
GM Financial Automobile Leasing Trust, Ser 2015-2, Cl A2A | ||||||||
1.180%, 04/20/2018 | 597 | 597 | ||||||
GM Financial Automobile Leasing Trust, Ser 2015-3, Cl A2A | ||||||||
1.170%, 06/20/2018 | 677 | 677 | ||||||
GM Financial Automobile Leasing Trust, Ser 2016-2, Cl A3 | ||||||||
1.620%, 09/20/2019 | 325 | 325 | ||||||
GM Financial Automobile Leasing Trust, Ser 2016-3, Cl A2B | ||||||||
0.922%, 02/20/2019 (A) | 1,000 | 1,000 | ||||||
Hertz Fleet Lease Funding, Ser 2013-3, Cl A | ||||||||
1.079%, 12/10/2027 (A) (B) | 454 | 455 | ||||||
Hertz Fleet Lease Funding, Ser 2014-1, Cl A | ||||||||
0.929%, 04/10/2028 (A) (B) | 642 | 642 | ||||||
Honda Auto Receivables Owner Trust, Ser 2014-1, Cl A4 | ||||||||
1.040%, 02/21/2020 | 3,480 | 3,478 | ||||||
Huntington Auto Trust, Ser 2015-1, Cl A3 | ||||||||
1.240%, 09/16/2019 | 886 | 886 | ||||||
Huntington Auto Trust, Ser 2016-1, Cl A2 | ||||||||
1.290%, 05/15/2019 | 600 | 600 | ||||||
| 52 | SEI Institutional Investments Trust / Semi-Annual Report / November 30, 2016 |
| Description | Face Amount ($ Thousands) | Market Value ($ Thousands) | ||||||
Hyundai Auto Lease Securitization Trust, Ser 2016-B, Cl A3 | ||||||||
1.520%, 10/15/2019 (B) | $ | 265 | $ | 265 | ||||
Hyundai Auto Receivables Trust, Ser 2012-C, Cl B | ||||||||
1.060%, 06/15/2018 | 651 | 651 | ||||||
Hyundai Auto Receivables Trust, Ser 2015-A, Cl A3 | ||||||||
1.050%, 04/15/2019 | 3,096 | 3,095 | ||||||
Mercedes Benz Auto Lease Trust, Ser 2015-A, Cl A4 | ||||||||
1.210%, 10/15/2020 | 250 | 250 | ||||||
Mercedes Benz Auto Lease Trust, Ser 2015-B, Cl A3 | ||||||||
1.340%, 07/16/2018 | 755 | 756 | ||||||
Mercedes-Benz Auto Lease Trust, Ser 2016-B, Cl A2 | ||||||||
1.150%, 01/15/2019 | 1,000 | 999 | ||||||
Nissan Auto Lease Trust, | ||||||||
0.818%, 12/17/2018 (A) | 1,000 | 1,000 | ||||||
Prestige Auto Receivables Trust, Ser 2016-1A, Cl A2 | ||||||||
1.780%, 08/15/2019 (B) | 351 | 351 | ||||||
Santander Drive Auto Receivables Trust, Ser 2012-3, Cl D | ||||||||
3.640%, 05/15/2018 | 509 | 509 | ||||||
Santander Drive Auto Receivables Trust, Ser 2015-5, Cl A2A | ||||||||
1.120%, 12/17/2018 | 2,039 | 2,039 | ||||||
Santander Drive Auto Receivables Trust, Ser 2015-5, Cl A3 | ||||||||
1.580%, 09/16/2019 | 535 | 535 | ||||||
Santander Drive Auto Receivables Trust, Ser 2016-1, Cl A2B | ||||||||
1.315%, 07/15/2019 (A) | 2,397 | 2,397 | ||||||
Toyota Auto Receivables Owner Trust, Ser 2016-B, Cl A2A | ||||||||
1.020%, 10/15/2018 | 4,000 | 3,998 | ||||||
Toyota Auto Receivables Owner Trust, Ser 2016-B, Cl A3 | ||||||||
1.300%, 04/15/2020 | 130 | 130 | ||||||
Volkswagen Auto Loan Enhanced Trust, Ser 2013-2, Cl A4 | ||||||||
1.160%, 03/20/2020 | 525 | 524 | ||||||
Volvo Financial Equipment LLC, Ser 2014-1A, Cl A3 | ||||||||
0.820%, 04/16/2018 (B) | 117 | 117 | ||||||
Westlake Automobile Receivables Trust, Ser 2015-2A, Cl A2A | ||||||||
1.280%, 07/16/2018 (B) | 208 | 208 | ||||||
Westlake Automobile Receivables Trust, Ser 2016-2A, Cl A2 | ||||||||
1.570%, 06/17/2019 (B) | 265 | 265 | ||||||
| Description | Face Amount ($ Thousands) | Market Value ($ Thousands) | ||||||
Westlake Automobile Receivables Trust, Ser 2016-2A, Cl B | ||||||||
2.300%, 11/15/2019 (B) | $ | 545 | $ | 546 | ||||
Wheels SPV 2 LLC, Ser 2014-1A, Cl A3 | ||||||||
1.460%, 03/20/2023 (B) | 950 | 950 | ||||||
Wheels SPV 2 LLC, Ser 2015-1A, Cl A2 | ||||||||
1.270%, 04/22/2024 (B) | 2,084 | 2,083 | ||||||
Wheels SPV 2 LLC, Ser 2016-1A, Cl A2 | ||||||||
1.590%, 05/20/2025 (B) | 2,500 | 2,497 | ||||||
Wheels SPV LLC, Ser 2014-1A, Cl A2 | ||||||||
0.840%, 03/20/2023 (B) | 891 | 890 | ||||||
World Omni Auto Receivables Trust, Ser 2015-B, Cl A2A | ||||||||
0.960%, 07/15/2019 | 461 | 461 | ||||||
World Omni Auto Receivables Trust, Ser 2016-B, Cl A2 | ||||||||
1.100%, 01/15/2020 | 540 | 539 | ||||||
World Omni Automobile Lease Securitization Trust, Ser 2014-A, Cl A4 | ||||||||
1.370%, 01/15/2020 | 1,215 | 1,216 | ||||||
|
| |||||||
| 67,290 | ||||||||
|
| |||||||
Credit Cards — 4.9% | ||||||||
American Express Credit Account Master Trust, Ser 2013-1, Cl A | ||||||||
0.958%, 02/16/2021 (A) | 310 | 311 | ||||||
American Express Credit Account Master Trust, Ser 2014-1, Cl A | ||||||||
0.905%, 12/15/2021 (A) | 5,000 | 5,013 | ||||||
American Express Credit Account Master Trust, Ser 2014-2, Cl A | ||||||||
1.260%, 01/15/2020 | 8,479 | 8,488 | ||||||
BA Credit Card Trust, Ser 2014-A1, Cl A | ||||||||
0.915%, 06/15/2021 (A) | 4,000 | 4,010 | ||||||
BA Credit Card Trust, Ser 2015-A1, Cl A | ||||||||
0.865%, 06/15/2020 (A) | 5,000 | 5,010 | ||||||
Cabela's Credit Card Master Note Trust, Ser 2012-2A, Cl A2 | ||||||||
1.018%, 06/15/2020 (A) (B) | 3,500 | 3,499 | ||||||
Cabela's Credit Card Master Note Trust, Ser 2013-2A, Cl A2 | ||||||||
1.188%, 08/16/2021 (A) (B) | 750 | 753 | ||||||
Cabela's Credit Card Master Note Trust, Ser 2014-1, Cl A | ||||||||
0.885%, 03/16/2020 (A) | 2,670 | 2,671 | ||||||
Cabela's Credit Card Master Note Trust, Ser 2014-2, Cl A | ||||||||
0.985%, 07/15/2022 (A) | 5,000 | 4,996 | ||||||
Cabela's Credit Card Master Note Trust, Ser 2016-1, Cl A1 | ||||||||
1.780%, 06/15/2022 | 640 | 639 | ||||||
| SEI Institutional Investments Trust / Semi-Annual Report / November 30, 2016 | 53 |
SCHEDULE OF INVESTMENTS (Unaudited)
Opportunistic Income Fund (Continued)
November 30, 2016
| Description | Face Amount ($ Thousands) | Market Value ($ Thousands) | ||||||
Cabela's Credit Card Master Note Trust, Ser 2016-1, Cl A2 | ||||||||
1.388%, 06/15/2022 (A) | $ | 2,000 | $ | 2,022 | ||||
Capital One Multi-Asset Execution Trust, Ser 2007-A5, Cl A5 | ||||||||
0.578%, 07/15/2020 (A) | 6,000 | 5,993 | ||||||
Capital One Multi-Asset Execution Trust, Ser 2014-A4, Cl A | ||||||||
0.802%, 06/15/2022 | 4,000 | 4,003 | ||||||
Capital One Multi-Asset Execution Trust, Ser 2014-A5, Cl A5 | ||||||||
1.480%, 07/15/2020 | 3,000 | 3,008 | ||||||
CARDS II Trust, Ser 2016-1A, Cl A | ||||||||
1.238%, 07/15/2021 (A) (B) | 415 | 417 | ||||||
Chase Issuance Trust, Ser 2007-A12, Cl A12 | ||||||||
0.588%, 08/15/2019 (A) | 3,500 | 3,497 | ||||||
Chase Issuance Trust, Ser 2013-A9, Cl A | ||||||||
0.958%, 11/16/2020 (A) | 4,850 | 4,867 | ||||||
Chase Issuance Trust, Ser 2014-A5, Cl A5 | ||||||||
0.908%, 04/15/2021 (A) | 5,620 | 5,643 | ||||||
Chase Issuance Trust, Ser 2014-A6, Cl A6 | ||||||||
1.260%, 07/15/2019 | 11,100 | 11,110 | ||||||
Chase Issuance Trust, Ser 2016-A5, Cl A5 | ||||||||
1.270%, 07/15/2021 | 850 | 842 | ||||||
Chase Issuance Trust, Ser 2016-A6, Cl A6 | ||||||||
1.100%, 01/15/2020 | 2,278 | 2,274 | ||||||
Citibank Credit Card Issuance Trust, Ser 2008-A2, Cl A2 | ||||||||
1.718%, 01/23/2020 (A) | 5,000 | 5,056 | ||||||
Citibank Credit Card Issuance Trust, Ser 2013- A2, Cl A2 | ||||||||
0.872%, 05/26/2020 (A) | 6,915 | 6,927 | ||||||
Discover Card Execution Note Trust, Ser 2012-A4, Cl A4 | ||||||||
0.908%, 11/15/2019 (A) | 4,000 | 4,004 | ||||||
Discover Card Execution Note Trust, Ser 2014-A1, Cl A1 | ||||||||
0.965%, 07/15/2021 (A) | 5,000 | 5,018 | ||||||
Evergreen Credit Card Trust Series, Ser 2016-1, Cl A | ||||||||
1.255%, 04/15/2020 (A) (B) | 1,800 | 1,807 | ||||||
Golden Credit Card Trust, | ||||||||
0.988%, 03/15/2021 (A) (B) | 1,000 | 1,000 | ||||||
Synchrony Credit Card Master Note Trust, Ser 2014-1, Cl A | ||||||||
1.610%, 11/15/2020 | 1,000 | 1,003 | ||||||
Synchrony Credit Card Master Note Trust, Ser 2015-2, Cl A | ||||||||
1.600%, 04/15/2021 | 1,100 | 1,103 | ||||||
Trillium Credit Card Trust II, | ||||||||
1.254%, 05/26/2021 (A) (B) | 950 | 955 | ||||||
| Description | Face Amount ($ Thousands) | Market Value ($ Thousands) | ||||||
World Financial Network Credit Card Master Trust, Ser 2015-C, Cl A | ||||||||
1.260%, 03/15/2021 | $ | 985 | $ | 986 | ||||
|
| |||||||
| 106,925 | ||||||||
|
| |||||||
Mortgage Related Securities — 2.5% |
| |||||||
ABFC Trust, Ser 2005-OPT1, Cl M1 | ||||||||
0.994%, 07/25/2035 (A) | 3,570 | 3,488 | ||||||
ABFC Trust, Ser 2005-WF1, Cl A2C | ||||||||
1.154%, 12/25/2034 (A) | 1,862 | 1,861 | ||||||
Accredited Mortgage Loan Trust, Ser 2005-2, Cl M1 | ||||||||
1.134%, 07/25/2035 (A) | 711 | 709 | ||||||
Accredited Mortgage Loan Trust, Ser 2005-2, Cl M2 | ||||||||
1.194%, 07/25/2035 (A) | 3,000 | 2,944 | ||||||
Accredited Mortgage Loan Trust, Ser 2006-2, Cl M1 | ||||||||
0.862%, 09/25/2036 (A) | 1,230 | 826 | ||||||
Aegis Asset-Backed Securities Trust Mortgage Pass-Through Certificates, Ser 2005-3, Cl M1 | ||||||||
1.004%, 08/25/2035 (A) | 2,762 | 2,735 | ||||||
Asset Backed Securities Home Equity Loan Trust Series, Ser 2004-HE1, Cl M1 | ||||||||
1.588%, 01/15/2034 (A) | 2,456 | 2,381 | ||||||
Bear Stearns Second Lien Trust, Ser 2007-SV1A, Cl A2 | ||||||||
1.174%, 12/25/2036 (A) (B) | 1,029 | 1,009 | ||||||
BNC Mortgage Loan Trust, Ser 2007-2, Cl A2 | ||||||||
0.634%, 05/25/2037 (A) | 257 | 252 | ||||||
Countrywide Asset-Backed Certificates, Ser 2006-S8, Cl A3 | ||||||||
5.555%, 04/25/2036 (A) | 2,117 | 2,104 | ||||||
Credit-Based Asset Servicing & Securitization LLC, | ||||||||
0.862%, 05/25/2036 (A)(B) | 349 | 346 | ||||||
Home Equity Asset Trust, | ||||||||
1.042%, 01/25/2036 (A) | 4,660 | 4,492 | ||||||
Home Equity Asset Trust, | ||||||||
1.022%, 02/25/2036 (A) | 3,300 | 3,228 | ||||||
Home Equity Asset Trust, | ||||||||
0.924%, 07/25/2036 (A) | 4,060 | 3,434 | ||||||
IXIS Real Estate Capital Trust, Ser 2005-HE1, Cl M3 | ||||||||
1.314%, 06/25/2035 (A) | 318 | 320 | ||||||
Master Asset Backed Securities Trust, Ser 2005-NC2, Cl A3 | ||||||||
1.034%, 11/25/2035 (A) | 5,408 | 3,603 | ||||||
Master Asset Backed Securities Trust, Ser 2005-WF1, Cl M2 | ||||||||
0.964%, 06/25/2035 (A) | 6,100 | 6,006 | ||||||
| 54 | SEI Institutional Investments Trust / Semi-Annual Report / November 30, 2016 |
| Description | Face Amount ($ Thousands) | Market Value ($ Thousands) | ||||||
Merrill Lynch Mortgage Investors Trust, Ser 2006-FF1, Cl A1 | ||||||||
0.639%, 08/25/2036 (A) | $ | 680 | $ | 680 | ||||
Merrill Lynch Mortgage Investors Trust, Ser 2006-FF1, Cl M4 | ||||||||
0.962%, 08/25/2036 (A) | 2,460 | 2,373 | ||||||
Morgan Stanley ABS Capital I Trust, Ser 2004-HE7, Cl M1 | ||||||||
1.492%, 08/25/2034 (A) | 2,949 | 2,804 | ||||||
New Century Home Equity Loan Trust, Ser 2005-4, Cl M2 | ||||||||
1.044%, 09/25/2035 (A) | 5,000 | 4,735 | ||||||
RASC Trust, Ser 2005-EMX3, Cl M3 | ||||||||
1.052%, 09/25/2035 (A) | 3,000 | 2,920 | ||||||
Terwin Mortgage Trust, Ser 2006-1, Cl 1A3 | ||||||||
0.972%, 01/25/2037 (A)(B) | 2,663 | 2,562 | ||||||
|
| |||||||
| 55,812 | ||||||||
|
| |||||||
Other Asset-Backed Securities — 14.8% |
| |||||||
1776 CLO, Ser 2006-1A, Cl B | ||||||||
1.238%, 05/08/2020 (A) (B) | 5,000 | 4,960 | ||||||
AB CLO, Ser 2007-1A, Cl D | ||||||||
4.580%, 04/15/2021 (A) (B) | 222 | 222 | ||||||
ABFC Trust, Ser 2004-OPT5, Cl M1 | ||||||||
1.659%, 03/25/2034 (A) | 147 | 124 | ||||||
Accredited Mortgage Loan Trust, Ser 2004-4, Cl A1A | ||||||||
1.214%, 01/25/2035 (A) | 104 | 103 | ||||||
Accredited Mortgage Loan Trust, Ser 2006-2, Cl A4 | ||||||||
0.794%, 09/25/2036 (A) | 8,100 | 7,114 | ||||||
Aegis Asset-Backed Securities Trust Mortgage Pass-Through Certificates, Ser 2004-3, Cl A2B | ||||||||
1.634%, 09/25/2034 (A) | 168 | 168 | ||||||
Aegis Asset-Backed Securities Trust Mortgage Pass-Through Certificates, Ser 2004-4, Cl A1 | ||||||||
1.254%, 10/25/2034 (A) | 339 | 335 | ||||||
Aegis Asset-Backed Securities Trust Mortgage Pass-Through Certificates, Ser 2005-4, Cl M1 | ||||||||
0.984%, 10/25/2035 (A) | 2,914 | 2,753 | ||||||
Aircraft Lease Securitisation Ltd., Ser 2007-1A, Cl G3 | ||||||||
0.796%, 05/10/2032 (A)(B) | 34 | 34 | ||||||
Ally Master Owner Trust, | ||||||||
1.540%, 09/15/2019 | 1,100 | 1,102 | ||||||
Ally Master Owner Trust, | ||||||||
1.430%, 06/17/2019 | 1,100 | 1,101 | ||||||
Ally Master Owner Trust, | ||||||||
1.600%, 10/15/2019 | 1,000 | 1,003 | ||||||
Alterna Funding I LLC, | ||||||||
1.639%, 02/15/2021 (B) | 678 | 661 | ||||||
| Description | Face Amount ($ Thousands) | Market Value ($ Thousands) | ||||||
Ameriquest Mortgage Securities Asset-Backed Pass-Through Certificates, Ser 2004-R11, Cl A1 | ||||||||
1.139%, 11/25/2034 (A) | $ | 638 | $ | 636 | ||||
Ameriquest Mortgage Securities Asset-Backed Pass-Through Certificates, Ser 2004-R2, Cl A1A | ||||||||
1.224%, 04/25/2034 (A) | 2,585 | 2,558 | ||||||
Ameriquest Mortgage Securities Asset-Backed Pass-Through Certificates, Ser 2005-R11, Cl M1 | ||||||||
0.984%, 01/25/2036 (A) | 3,310 | 3,139 | ||||||
Ameriquest Mortgage Securities Asset-Backed Pass-Through Certificates, Ser 2005-R5, Cl M1 | ||||||||
0.964%, 07/25/2035 (A) | 234 | 234 | ||||||
Ameriquest Mortgage Securities Asset-Backed Pass-Through Certificates, Ser 2005-R7, Cl M2 | ||||||||
1.034%, 09/25/2035 (A) | 1,645 | 1,539 | ||||||
Ameriquest Mortgage Securities Asset-Backed Pass-Through Certificates, Ser 2005-R9, Cl AF6 | ||||||||
5.325%, 11/25/2035 | 237 | 241 | ||||||
AMMC CLO XII, Ser 2013-12A, Cl C | ||||||||
3.682%, 05/10/2025 (A) (B) | 1,500 | 1,503 | ||||||
Apidos CLO XII, Ser 2013-12A, Cl A | ||||||||
1.780%, 04/15/2025 (A) (B) | 500 | 497 | ||||||
Apidos CLO XVII, Ser 2014-17A, Cl A1A | ||||||||
2.179%, 04/17/2026 (A) (B) | 995 | 995 | ||||||
Apidos CLO XVII, Ser 2016-17A, Cl A1R | ||||||||
2.193%, 04/17/2026 (A) (B) | 1,000 | 1,000 | ||||||
Argent Securities, Ser 2006-W2, Cl A2B | ||||||||
0.724%, 03/25/2036 (A) | 1,311 | 685 | ||||||
ARL First LLC, Ser 2012-1A, Cl A1 | ||||||||
2.285%, 12/15/2042 (A) (B) | 1,741 | 1,690 | ||||||
Baker Street CLO II, Ser 2006-1A, Cl C | ||||||||
1.410%, 10/15/2019 (A) (B) | 3,000 | 2,967 | ||||||
Battalion CLO, Ser 2007-1A, Cl C | ||||||||
1.681%, 07/14/2022 (A) (B) | 2,500 | 2,451 | ||||||
Battalion CLO, Ser 2007-1A, Cl D | ||||||||
3.031%, 07/14/2022 (A) (B) | 1,500 | 1,487 | ||||||
Bear Stearns Asset-Backed Securities I Trust, | ||||||||
0.944%, 12/25/2035 (A) | 2,001 | 1,977 | ||||||
Blackbird Capital Aircraft Lease Securitization, Ser 2016-1A, Cl AA | ||||||||
2.487%, 12/16/2041 (B) | 1,850 | 1,853 | ||||||
Bluemountain CLO, Ser 2014-4A, Cl A1R | ||||||||
2.200%, 11/30/2026 | 3,500 | 3,500 | ||||||
| SEI Institutional Investments Trust / Semi-Annual Report / November 30, 2016 | 55 |
SCHEDULE OF INVESTMENTS (Unaudited)
Opportunistic Income Fund (Continued)
November 30, 2016
| Description | Face Amount ($ Thousands) | Market Value ($ Thousands) | ||||||
BlueMountain CLO, Ser 2015-1A, Cl A1 | ||||||||
2.179%, 04/13/2027 (A) (B) | $ | 1,280 | $ | 1,282 | ||||
BlueMountain CLO, Ser 2015-4A, Cl A1 | ||||||||
2.329%, 11/30/2026 (A) (B) | 3,500 | 3,501 | ||||||
Canaras Summit CLO, Ser 2007-1A, Cl D | ||||||||
3.107%, 06/19/2021 (A) (B) | 1,000 | 987 | ||||||
Canaras Summit CLO, Ser 2007-1A, Cl E | ||||||||
5.207%, 06/19/2021 (A) (B) | 1,500 | 1,483 | ||||||
Carlyle High Yield Partners IX, Ser 2006-9A, Cl A1 | ||||||||
0.896%, 08/01/2021 (A) (B) | 1,028 | 1,027 | ||||||
Cent CLO 22, Ser 2016-22A, Cl A1R | ||||||||
2.291%, 11/07/2026 (A) (B) | 3,100 | 3,100 | ||||||
Cent CLO, Ser 2014-20A, Cl A | ||||||||
2.195%, 01/25/2026 (A) (B) | 1,250 | 1,249 | ||||||
CIFC Funding, Ser 2013-1A, Cl A1 | ||||||||
1.829%, 04/16/2025 (A) (B) | 265 | 265 | ||||||
CIFC Funding, Ser 2016-3A, Cl A2R | ||||||||
2.632%, 01/29/2025 (A) (B) | 745 | 745 | ||||||
Citigroup Mortgage Loan Trust, Ser 2007- WFH2, Cl A4 | ||||||||
0.934%, 03/25/2037 (A) | 3,000 | 2,890 | ||||||
Clear Lake CLO, Ser 2007-1A, Cl C | ||||||||
2.307%, 12/20/2020 (A) (B) | 1,000 | 1,000 | ||||||
CNH Equipment Trust, Ser 2016-B, Cl A2A | ||||||||
1.310%, 10/15/2019 | 315 | 315 | ||||||
CNH Equipment Trust, Ser 2016-C, Cl A2 | ||||||||
1.260%, 02/18/2020 | 605 | 604 | ||||||
COA Summit CLO, Ser 2014-1A, Cl B | ||||||||
3.681%, 04/20/2023 (A) (B) | 1,500 | 1,498 | ||||||
Conseco Financial, Ser 1995-6, Cl B1 | ||||||||
7.700%, 09/15/2026 | 1,160 | 1,217 | ||||||
Conseco Financial, Ser 1997-2, Cl A6 | ||||||||
7.240%, 06/15/2028 (A) | 277 | 276 | ||||||
Conseco Financial, Ser 1997-3, Cl A5 | ||||||||
7.140%, 03/15/2028 | 100 | 103 | ||||||
Conseco Financial, Ser 1997-3, Cl A6 | ||||||||
7.320%, 03/15/2028 | 33 | 34 | ||||||
Conseco Financial, Ser 1997-6, Cl A9 | ||||||||
7.550%, 01/15/2029 (A) | 41 | 41 | ||||||
Conseco Financial, Ser 1997-7, Cl A7 | ||||||||
6.960%, 07/15/2028 (A) | 84 | 85 | ||||||
Conseco Financial, Ser 1997-8, Cl A | ||||||||
6.780%, 10/15/2027 | 1,996 | 2,059 | ||||||
CWABS Asset-Backed Certificates Trust, Ser 2004-5, Cl 3A | ||||||||
0.994%, 09/25/2034 (A) | 17 | 17 | ||||||
CWABS Asset-Backed Certificates Trust, Ser 2006-11, Cl 3AV2 | ||||||||
0.694%, 09/25/2046 (A) | 4,048 | 3,778 | ||||||
| Description | Face Amount ($ Thousands) | Market Value ($ Thousands) | ||||||
CWHEQ Revolving Home Equity Loan Trust Series, Ser 2006-I, Cl 2A | ||||||||
0.678%, 01/15/2037 (A) | $ | 3,565 | $ | 3,171 | ||||
Dryden 37 Senior Loan Fund, | ||||||||
2.380%, 04/15/2027 (A) (B) | 4,360 | 4,363 | ||||||
Dryden 41 Senior Loan Fund, | ||||||||
2.380%, 01/15/2028 (A) (B) | 3,000 | 3,006 | ||||||
Dryden XXXI Senior Loan Fund, | ||||||||
2.029%, 04/18/2026 (A) (B) | 1,215 | 1,215 | ||||||
Eastland CLO, Ser 2007-1A, Cl A3 | ||||||||
1.286%, 05/01/2022 (A) (B) | 5,000 | 4,751 | ||||||
Encore Credit Receivables Trust, Ser 2005-3, Cl M2 | ||||||||
1.327%, 10/25/2035 (A) | 618 | 615 | ||||||
Encore Credit Receivables Trust, Ser 2005-3, Cl M3 | ||||||||
1.299%, 10/25/2035 (A) | 2,600 | 2,438 | ||||||
Encore Credit Receivables Trust, Ser 2005-4, Cl M2 | ||||||||
1.032%, 01/25/2036 (A) | 3,444 | 3,379 | ||||||
FFMLT Trust, Ser 2005-FF8, Cl M1 | ||||||||
1.269%, 09/25/2035 (A) | 3,386 | 3,329 | ||||||
Figueroa CLO, Ser 2013-1A, Cl C | ||||||||
4.561%, 03/21/2024 (A) (B) | 2,000 | 1,838 | ||||||
First Franklin Mortgage Loan Trust, Ser 2004-FF11, Cl M2 | ||||||||
1.417%, 01/25/2035 (A) | 3,378 | 3,343 | ||||||
First Franklin Mortgage Loan Trust, Ser 2005-FF3, Cl M4 | ||||||||
1.434%, 04/25/2035 (A) | 2,188 | 2,120 | ||||||
First Franklin Mortgage Loan Trust, Ser 2006-FF1, Cl 2A3 | ||||||||
0.774%, 01/25/2036 (A) | 260 | 258 | ||||||
First Franklin Mortgage Loan Trust, Ser 2006-FF9, Cl M1 | ||||||||
0.784%, 06/25/2036 (A) | 9,473 | 353 | ||||||
First Franklin Mortgage Loan Trust, Ser 2006-FFA, Cl A3 | ||||||||
0.774%, 09/25/2026 (A) | 229 | 122 | ||||||
First Franklin Mortgage Loan Trust, Ser 2006-FFB, Cl A2 | ||||||||
0.794%, 12/25/2026 (A) | 69 | 48 | ||||||
Flatiron CLO, Ser 2011-1A, Cl D | ||||||||
4.480%, 01/15/2023 (A) (B) | 3,000 | 3,000 | ||||||
Flatiron CLO, Ser 2013-1A, Cl B | ||||||||
3.630%, 01/17/2026 (A) (B) | 500 | 500 | ||||||
Ford Credit Floorplan Master Owner Trust, Ser 2016-4, Cl A | ||||||||
1.065%, 07/15/2020 (A) | 580 | 581 | ||||||
Franklin CLO VI, Ser 2007-6A, Cl A | ||||||||
1.022%, 08/09/2019 (A) (B) | 2,811 | 2,796 | ||||||
| 56 | SEI Institutional Investments Trust / Semi-Annual Report / November 30, 2016 |
| Description | Face Amount ($ Thousands) | Market Value ($ Thousands) | ||||||
Fraser Sullivan CLO II, Ser 2006-2A, Cl D | ||||||||
2.357%, 12/20/2020 (A) (B) | $ | 1,961 | $ | 1,941 | ||||
Gale Force CLO, Ser 2007-3A, Cl A1 | ||||||||
0.928%, 04/19/2021 (A) (B) | 330 | 330 | ||||||
Gleneagles CLO, Ser 2005-1A, Cl D | ||||||||
2.786%, 11/01/2017 (A) (B) | 582 | 578 | ||||||
GMACM Home Equity Loan Trust, Ser 2007-HE2, Cl A2 | ||||||||
6.054%, 12/25/2037 (A) | 1,690 | 1,654 | ||||||
GMACM Home Equity Loan Trust, Ser 2007-HE2, Cl A3 | ||||||||
6.193%, 12/25/2037 (A) | 630 | 618 | ||||||
GMF Floorplan Owner Revolving Trust, Ser 2015-1, Cl A2 | ||||||||
1.035%, 05/15/2020 (A) (B) | 575 | 575 | ||||||
Gramercy Park CLO, Ser 2014-1AR, Cl A1R | ||||||||
1.979%, 07/17/2023 (A) (B) | 684 | 684 | ||||||
Grayson CLO, Ser 2006-1A, Cl B | ||||||||
1.586%, 11/01/2021 (A) (B) | 1,000 | 940 | ||||||
GreatAmerica Leasing Receivables Funding LLC, Ser 2015-1, Cl A2 | ||||||||
1.120%, 06/20/2017 (B) | 3 | 3 | ||||||
GreatAmerica Leasing Receivables Funding LLC, Ser 2016-1, Cl A2 | ||||||||
1.570%, 05/21/2018 (B) | 635 | 635 | ||||||
Greenpoint Manufactured Housing, Ser 1999-5, Cl M1A | ||||||||
8.300%, 10/15/2026 (A) | 1,588 | 1,738 | ||||||
GSAMP Trust, Ser 2005-HE6, Cl M1 | ||||||||
0.974%, 11/25/2035 (A) | 250 | 246 | ||||||
GSAMP Trust, Ser 2005-SEA2, Cl M1 | ||||||||
1.054%, 01/25/2045 (A) (B) | 1,980 | 1,938 | ||||||
GSAMP Trust, Ser 2006-HE8, Cl A2C | ||||||||
0.704%, 01/25/2037 (A) | 3,969 | 3,291 | ||||||
Hilton Grand Vacations Trust, | ||||||||
1.770%, 11/25/2026 (B) | 2,399 | 2,361 | ||||||
Home Equity Mortgage Loan Asset-Backed Trust Series INABS, | ||||||||
0.904%, 10/25/2035 (A) | 1,543 | 1,521 | ||||||
Home Equity Mortgage Trust, Ser 2006-5, Cl A1 | ||||||||
6.000%, 01/25/2037 | 10,270 | 4,167 | ||||||
HSBC Home Equity Loan Trust, | ||||||||
0.716%, 07/20/2036 (A) | 2,266 | 2,253 | ||||||
HSI Asset Securitization Trust, | ||||||||
0.824%, 11/25/2035 (A) | 768 | 754 | ||||||
Irwin Home Equity Loan Trust, | ||||||||
5.770%, 09/25/2035 (B) | 3,339 | 3,387 | ||||||
Kubota Credit Owner Trus, | ||||||||
1.250%, 04/15/2019 (B) | 220 | 220 | ||||||
Kubota Credit Owner Trust, | ||||||||
0.940%, 12/15/2017 (B) | 95 | 95 | ||||||
| Description | Face Amount ($ Thousands) | Market Value ($ Thousands) | ||||||
KVK CLO, Ser 2012-1A, Cl A | ||||||||
2.050%, 07/15/2023 (A) (B) | $ | 976 | $ | 976 | ||||
Lehman ABS Manufactured Housing Contract Trust, Ser 2001-B, Cl A3 | ||||||||
4.350%, 04/15/2040 | 877 | 893 | ||||||
Lehman ABS Manufactured Housing Contract Trust, Ser 2001-B, Cl A4 | ||||||||
5.270%, 04/15/2040 | 120 | 123 | ||||||
Lehman ABS Manufactured Housing Contract Trust, Ser 2001-B, Cl A6 | ||||||||
6.467%, 04/15/2040 (A) | 200 | 208 | ||||||
Limerock CLO I, Ser 2007-1A, Cl B | ||||||||
1.512%, 04/24/2023 (A) (B) | 5,000 | 4,933 | ||||||
Limerock CLO II, Ser 2014-2A, Cl A | ||||||||
2.179%, 04/18/2026 (A) (B) | 850 | 850 | ||||||
Magnetite CLO IX, Ser 2014-9A, Cl A1 | ||||||||
2.135%, 07/25/2026 (A) (B) | 940 | 941 | ||||||
Master Asset-Backed Securities Trust, Ser 2005-AB1, Cl A3B | ||||||||
5.233%, 11/25/2035 | 822 | 821 | ||||||
Master Asset-Backed Securities Trust, Ser 2006-HE5, Cl A3 | ||||||||
0.694%, 11/25/2036 (A) | 736 | 474 | ||||||
Master Asset-Backed Securities Trust, Ser 2006-NC3, Cl A3 | ||||||||
0.634%, 10/25/2036 (A) | 3,028 | 1,844 | ||||||
Master Asset-Backed Securities Trust, Ser 2006-NC3, Cl A5 | ||||||||
0.744%, 10/25/2036 (A) | 1,805 | 1,118 | ||||||
Michigan Finance Authority, | ||||||||
1.285%, 04/29/2030 (A) | 4,463 | 4,352 | ||||||
Mid-State Capital Trust, | ||||||||
6.497%, 08/15/2037 | 1,124 | 1,209 | ||||||
MMAF Equipment Finance LLC, Ser 2014-AA, Cl A3 | ||||||||
0.870%, 01/08/2019 (B) | 726 | 725 | ||||||
MMAF Equipment Finance LLC, Ser 2015-AA, Cl A2 | ||||||||
0.960%, 09/18/2017 (B) | 28 | 28 | ||||||
Morgan Stanley Asset-Backed Security Capital I Trust, | ||||||||
0.854%, 11/25/2035 (A) | 589 | 589 | ||||||
Morgan Stanley Asset-Backed Security Capital I Trust, | ||||||||
1.164%, 03/25/2035 (A) | 1,472 | 1,468 | ||||||
Morgan Stanley Asset-Backed Security Capital I Trust, | ||||||||
1.179%, 02/25/2035 (A) | 1,665 | 1,648 | ||||||
Morgan Stanley Asset-Backed Security Capital I Trust, | ||||||||
0.634%, 10/25/2036 (A) | 2,767 | 1,549 | ||||||
| SEI Institutional Investments Trust / Semi-Annual Report / November 30, 2016 | 57 |
SCHEDULE OF INVESTMENTS (Unaudited)
Opportunistic Income Fund (Continued)
November 30, 2016
| Description | Face Amount ($ Thousands) | Market Value ($ Thousands) | ||||||
Morgan Stanley Capital I Trust, Ser 2003-NC4, Cl M2 | ||||||||
3.584%, 04/25/2033 (A) | $ | 15 | $ | 14 | ||||
Morgan Stanley Dean Witter Capital I Trust, Ser 2002-AM3, Cl M1 | ||||||||
1.959%, 02/25/2033 (A) | 35 | 34 | ||||||
MVW Owner Trust, Ser 2014-1A, Cl A | ||||||||
2.250%, 09/22/2031 (B) | 3,536 | 3,505 | ||||||
MVW Owner Trust, Ser 2015-1A, Cl A | ||||||||
2.520%, 12/20/2032 (B) | 5,817 | 5,797 | ||||||
Nationstar HECM Loan Trust, Ser 2015-2A, Cl A | ||||||||
2.883%, 11/25/2025 (B) | 105 | 105 | ||||||
Nationstar HECM Loan Trust, Ser 2016-1A, Cl A | ||||||||
2.981%, 02/25/2026 (B) | 125 | 125 | ||||||
Nationstar HECM Loan Trust, Ser 2016-2A, Cl A | ||||||||
2.239%, 06/25/2026 (B) | 222 | 222 | ||||||
Nationstar HECM Loan Trust, Ser 2016-3A, Cl A | ||||||||
2.013%, 08/25/2026 (B) | 119 | 118 | ||||||
Nationstar Home Equity Loan Trust, Ser 2006-B, Cl AV4 | ||||||||
0.814%, 09/25/2036 (A) | 5,200 | 4,914 | ||||||
Navient Student Loan Trust, | ||||||||
0.844%, 03/27/2023 (A) | 2,893 | 2,890 | ||||||
Navient Student Loan Trust, | ||||||||
1.000%, 03/25/2066 (A) (B) | 510 | 510 | ||||||
New Century Home Equity Loan Trust, Ser 2005-C, Cl A2C | ||||||||
0.784%, 12/25/2035 (A) | 3,693 | 3,658 | ||||||
New Residential Advance Receivables Trust Advance Receivables Backed Notes, Ser 2016-T2, Cl AT2 | ||||||||
2.575%, 10/15/2049 (B) | 750 | 748 | ||||||
Newcastle Mortgage Securities Trust, Ser 2006-1, Cl M3 | ||||||||
0.924%, 03/25/2036 (A) | 5,593 | 4,537 | ||||||
NewMark Capital Funding CLO, Ser 2013-1A, Cl A2 | ||||||||
1.959%, 06/02/2025 (A)(B) | 3,553 | 3,546 | ||||||
NRZ Advance Receivables Trust Advance Receivables Backed, Ser 2015-T4, Cl AT4 | ||||||||
3.196%, 11/15/2047 (B) | 700 | 703 | ||||||
NYCTL Trust, Ser 2015-A, Cl A | ||||||||
1.340%, 11/10/2028 (B) | 242 | 241 | ||||||
NYCTL Trust, Ser 2016-A, Cl A | ||||||||
1.470%, 11/10/2029 (B) | 189 | 190 | ||||||
OCP CLO, Ser 2015-8A, Cl A1 | ||||||||
2.410%, 04/17/2027 (A) (B) | 650 | 651 | ||||||
Octagon Investment Partners XI, Ser 2007-1A, Cl C | ||||||||
2.825%, 08/25/2021 (A) (B) | 3,000 | 2,869 | ||||||
Octagon Investment Partners XVI, Ser 2013-1A, Cl A | ||||||||
1.799%, 07/17/2025 (A)(B) | 300 | 300 | ||||||
| Description | Face Amount ($ Thousands) | Market Value ($ Thousands) | ||||||
Octagon Investment Partners XX, | ||||||||
2.258%, 08/12/2026 (A) (B) | $ | 3,230 | $ | 3,230 | ||||
OHA Credit Partners VIII, | ||||||||
2.000%, 04/20/2025 (A)(B) | 3,200 | 3,194 | ||||||
Option One Mortgage Loan Trust Asset-Backed Certificates, Ser 2005-5, Cl A3 | ||||||||
0.744%, 12/25/2035 (A) | 541 | 538 | ||||||
Option One Mortgage Loan Trust, Ser 2005-1, Cl A1A | ||||||||
1.034%, 02/25/2035 (A) | 172 | 171 | ||||||
Option One Mortgage Loan Trust, Ser 2006-3, Cl 2A2 | ||||||||
0.634%, 02/25/2037 (A) | 525 | 318 | ||||||
Origen Manufactured Housing Contract Trust, Ser 2005-B, Cl A4 | ||||||||
5.910%, 01/15/2037 | 541 | 556 | ||||||
Origen Manufactured Housing Contract Trust, Ser 2005-B, Cl M1 | ||||||||
5.990%, 01/15/2037 | 61 | 63 | ||||||
Park Place Securities Asset-Backed | ||||||||
1.479%, 02/25/2035 (A) | 2,579 | 2,585 | ||||||
Park Place Securities Asset-Backed | ||||||||
1.672%, 03/25/2035 (A) | 1,300 | 1,272 | ||||||
Park Place Securities Asset-Backed | ||||||||
1.659%, 03/25/2035 (A) | 4,242 | 3,785 | ||||||
Park Place Securities Asset-Backed | ||||||||
1.222%, 05/25/2035 (A) | 290 | 290 | ||||||
Popular ABS Mortgage Pass-Through Trust, Ser 2006-D, Cl A2 | ||||||||
0.694%, 11/25/2046 (A) | 2,085 | 2,052 | ||||||
Prospect Park CDO, Ser 2006-1A, Cl B | ||||||||
1.350%, 07/15/2020 (A) (B) | 1,509 | 1,498 | ||||||
RAAC Trust, Ser 2005-SP3, Cl M1 | ||||||||
1.122%, 12/25/2035 (A) | 3,000 | 2,891 | ||||||
Race Point VI CLO, Ser 2014-6RA, Cl BR | ||||||||
3.080%, 05/24/2023 (A) (B) | 725 | 725 | ||||||
RAMP Trust, Ser 2004-RS6, Cl MII1 | ||||||||
1.464%, 06/25/2034 (A) | 1,648 | 1,576 | ||||||
RASC Trust, Ser 2005-KS12, Cl A3 | ||||||||
0.854%, 01/25/2036 (A) | 568 | 565 | ||||||
SACO I Trust, Ser 2005-GP1, Cl A1 | ||||||||
0.894%, 08/28/2030 (A) | 1,570 | 1,510 | ||||||
SACO I, Ser 2005-9, Cl A1 | ||||||||
1.034%, 12/25/2035 (A) | 690 | 660 | ||||||
| 58 | SEI Institutional Investments Trust / Semi-Annual Report / November 30, 2016 |
| Description | Face Amount ($ Thousands) | Market Value ($ Thousands) | ||||||
SACO I, Ser 2005-WM3, Cl A1 | ||||||||
1.054%, 09/25/2035 (A) | $ | 524 | $ | 489 | ||||
Saxon Asset Securities Trust, Ser 2003-3, Cl AF6 | ||||||||
4.921%, 12/25/2033 | 120 | 121 | ||||||
Saxon Asset Securities Trust, Ser 2006-2, Cl A3C | ||||||||
0.684%, 09/25/2036 (A) | 3,099 | 3,005 | ||||||
Saxon Asset Securities Trust, Ser 2007-2, Cl A2A | ||||||||
0.634%, 05/25/2047 (A) | 804 | 564 | ||||||
Schiller Park CLO, Ser 2007-1A, Cl C | ||||||||
1.612%, 04/25/2021 (A) (B) | 2,500 | 2,420 | ||||||
Schiller Park CLO, Ser 2007-1A, Cl D | ||||||||
2.632%, 04/25/2021 (A) (B) | 2,000 | 2,004 | ||||||
Securitized Asset-Backed Receivables LLC, | ||||||||
0.684%, 09/25/2036 (A) | 3,960 | 1,984 | ||||||
Securitized Asset-Backed Receivables LLC, Ser 2007-BR5, Cl A2A | ||||||||
0.664%, 05/25/2037 (A) | 983 | 755 | ||||||
Sierra Timeshare Receivables Funding LLC, Ser 2013-3A, Cl A | ||||||||
2.200%, 10/20/2030 (B) | 739 | 740 | ||||||
Sierra Timeshare Receivables Funding LLC, Ser 2014-1A, Cl A | ||||||||
2.070%, 03/20/2030 (B) | 1,197 | 1,189 | ||||||
Sierra Timeshare Receivables Funding LLC, Ser 2014-2A, Cl A | ||||||||
2.050%, 06/20/2031 (B) | 831 | 831 | ||||||
Sierra Timeshare Receivables Funding LLC, Ser 2014-3A, Cl A | ||||||||
2.300%, 10/20/2031 (B) | 667 | 667 | ||||||
Sierra Timeshare Receivables Funding LLC, Ser 2015-1A, Cl A | ||||||||
2.400%, 03/22/2032 (B) | 1,930 | 1,927 | ||||||
SLM Student Loan Trust, | ||||||||
1.092%, 04/25/2023 (A) | 636 | 635 | ||||||
SLM Student Loan Trust, | ||||||||
1.052%, 07/25/2023 (A) | 439 | 437 | ||||||
SLM Student Loan Trust, | ||||||||
0.972%, 10/25/2024 (A) | 918 | 913 | ||||||
SLM Student Loan Trust, | ||||||||
1.002%, 01/25/2027 (A) | 23 | 23 | ||||||
SLM Student Loan Trust, | ||||||||
0.834%, 05/26/2020 (A) | 2,901 | 2,894 | ||||||
SLM Student Loan Trust, | ||||||||
1.034%, 02/25/2021 (A) | 1,795 | 1,796 | ||||||
SLM Student Loan Trust, | ||||||||
0.914%, 07/26/2021 (A) | 1,195 | 1,195 | ||||||
Soundview Home Equity Loan Trust, Ser 2005-4, Cl M2 | ||||||||
1.004%, 03/25/2036 (A) | 3,458 | 3,093 | ||||||
Soundview Home Equity Loan Trust, Ser 2006-EQ1, Cl A3 | ||||||||
0.694%, 10/25/2036 (A) | — | — | ||||||
| Description | Face Amount ($ Thousands) | Market Value ($ Thousands) | ||||||
Specialty Underwriting & Residential Finance Trust, Ser 2005-AB1, Cl M1 | ||||||||
1.179%, 03/25/2036 (A) | $ | 716 | $ | 712 | ||||
Springleaf Funding Trust, | ||||||||
2.410%, 12/15/2022 (B) | 289 | 289 | ||||||
SPS Servicer Advance Receivables Trust, Ser 2016-T1, Cl AT1 | ||||||||
2.530%, 11/16/2048 (B) | 830 | 830 | ||||||
Stone Tower CLO VI, Ser 2007-6A, Cl C | ||||||||
2.230%, 04/17/2021 (A) (B) | 1,500 | 1,461 | ||||||
Stone Tower CLO VII, | ||||||||
2.000%, 08/30/2021 (A) (B) | 1,771 | 1,768 | ||||||
Stoney Lane Funding I, | ||||||||
0.919%, 04/18/2022 (A) (B) | 542 | 537 | ||||||
Structured Asset Investment Loan Trust, Ser 2003-BC11, Cl A3 | ||||||||
1.542%, 10/25/2033 (A) | 3,755 | 3,617 | ||||||
Structured Asset Investment Loan Trust, Ser 2006-2, Cl A3 | ||||||||
0.714%, 04/25/2036 (A) | 1,697 | 1,531 | ||||||
Structured Asset Securities Mortgage Loan Trust, Ser 2005-WF3, Cl M1 | ||||||||
1.014%, 07/25/2035 (A) | 1,500 | 1,447 | ||||||
Structured Asset Securities Mortgage Loan Trust, Ser 2006-GEL3, Cl A2 | ||||||||
0.764%, 07/25/2036 (A) (B) | 240 | 239 | ||||||
Structured Asset Securities Mortgage Loan Trust, Ser 2006-WF1, Cl A1 | ||||||||
0.684%, 02/25/2036 (A) | 57 | 57 | ||||||
Structured Asset Securities Mortgage Loan Trust, Ser 2006-WF3, Cl A4 | ||||||||
0.844%, 09/25/2036 (A) | 1,820 | 1,732 | ||||||
Structured Asset Securities Mortgage Loan Trust, Ser 2007-BC1, Cl A4 | ||||||||
0.664%, 02/25/2037 (A) | 4,965 | 4,513 | ||||||
Structured Asset Securities Mortgage Loan Trust, Ser 2008-BC4, Cl A3 | ||||||||
0.834%, 11/25/2037 (A) | 21 | 21 | ||||||
Symphony CLO III, Ser 2007-3A, Cl C | ||||||||
1.477%, 05/15/2019 (A) (B) | 2,500 | 2,478 | ||||||
Symphony CLO V, Ser 2007-5A, Cl A1 | ||||||||
1.430%, 01/15/2024 (A) (B) | 1,446 | 1,436 | ||||||
Telos CLO, Ser 2007-2A, Cl D | ||||||||
2.880%, 04/15/2022 (A) (B) | 3,000 | 2,809 | ||||||
Tralee CDO, Ser 2007-1A, Cl B | ||||||||
1.580%, 04/16/2022 (A) (B) | 4,800 | 4,585 | ||||||
Trimaran CLO VII, Ser 2007-1A, Cl A2L | ||||||||
1.023%, 06/15/2021 (A) (B) | 5,500 | 5,465 | ||||||
Utah State Board of Regents, Ser 2016-1, Cl A | ||||||||
1.281%, 09/25/2056 (A) | 595 | 591 | ||||||
| SEI Institutional Investments Trust / Semi-Annual Report / November 30, 2016 | 59 |
SCHEDULE OF INVESTMENTS (Unaudited)
Opportunistic Income Fund (Continued)
November 30, 2016
| Description | Face Amount ($ Thousands) | Market Value ($ Thousands) | ||||||
Venture VIII CDO, Ser 2007-8A, Cl B | ||||||||
1.122%, 07/22/2021 (A) (B) | $ | 5,000 | $ | 4,809 | ||||
Verizon Owner Trust, Ser 2016-1A, Cl A | ||||||||
1.420%, 01/20/2021 (B) | 6,000 | 5,975 | ||||||
Verizon Owner Trust, Ser 2016-2A, Cl B | ||||||||
2.150%, 05/20/2021 (B) | 3,000 | 2,990 | ||||||
Volvo Financial Equipment LLC, Ser 2015-1A, Cl A2 | ||||||||
0.950%, 11/15/2017 (B) | 157 | 157 | ||||||
Voya CLO V, Ser 2007-5A, Cl C | ||||||||
3.736%, 05/01/2022 (A) (B) | 1,000 | 1,002 | ||||||
Voya CLO, Ser 2013-1A, Cl A1 | ||||||||
1.820%, 04/15/2024 (A) (B) | 3,555 | 3,552 | ||||||
Voya CLO, Ser 2013-2A, Cl C | ||||||||
4.382%, 04/25/2025 (A) (B) | 1,000 | 990 | ||||||
Voya CLO, Ser 2014-1RA, Cl A1R | ||||||||
1.856%, 03/14/2022 (A) (B) | 434 | 434 | ||||||
Voya CLO, Ser 2014-1RA, Cl A2R | ||||||||
2.506%, 03/14/2022 (A)(B) | 600 | 601 | ||||||
Wendys Funding LLC, Ser 2015-1A, Cl A2I | ||||||||
3.371%, 06/15/2045 (B) | 3,218 | 3,216 | ||||||
Westgate Resorts LLC, Ser 2015-1A, Cl A | ||||||||
2.750%, 05/20/2027 (B) | 1,549 | 1,549 | ||||||
Westgate Resorts LLC, Ser 2015-2A, Cl B | ||||||||
4.000%, 07/20/2028 (B) | 493 | 488 | ||||||
|
| |||||||
| 324,811 | ||||||||
|
| |||||||
Total Asset-Backed Securities |
| 554,838 | ||||||
|
| |||||||
CORPORATE OBLIGATIONS — 7.8% |
| |||||||
Consumer Discretionary — 0.9% | ||||||||
AutoZone | ||||||||
1.625%, 04/21/2019 | 90 | 89 | ||||||
CCO Holdings LLC | ||||||||
5.250%, 09/30/2022 | 1,545 | 1,603 | ||||||
5.125%, 02/15/2023 | 700 | 719 | ||||||
Daimler Finance North America LLC | ||||||||
1.650%, 05/18/2018 (B) | 300 | 299 | ||||||
1.500%, 07/05/2019 (B) | 625 | 615 | ||||||
1.259%, 03/02/2018 (A) (B) | 1,000 | 1,002 | ||||||
Ford Motor Credit LLC | ||||||||
1.897%, 08/12/2019 | 500 | 492 | ||||||
1.816%, 01/09/2018 (A) | 750 | 751 | ||||||
1.724%, 12/06/2017 | 500 | 499 | ||||||
1.675%, 03/12/2019 (A) | 500 | 501 | ||||||
General Motors Financial | ||||||||
2.400%, 04/10/2018 | 1,000 | 1,000 | ||||||
NBCUniversal Enterprise | ||||||||
1.565%, 04/15/2018 (A) (B) | 400 | 403 | ||||||
Nissan Motor Acceptance MTN | ||||||||
1.500%, 03/02/2018 (B) | 550 | 549 | ||||||
| Description | Face Amount ($ Thousands) | Market Value ($ Thousands) | ||||||
Seminole Hard Rock Entertainment | ||||||||
5.875%, 05/15/2021 (B) | $ | 1,023 | $ | 1,008 | ||||
Sinclair Television Group | ||||||||
5.625%, 08/01/2024 (B) | 2,600 | 2,568 | ||||||
Sirius XM Radio | ||||||||
5.375%, 04/15/2025 (B) | 385 | 384 | ||||||
5.375%, 07/15/2026 (B) | 1,665 | 1,649 | ||||||
4.625%, 05/15/2023 (B) | 800 | 786 | ||||||
Time Warner Cable | ||||||||
5.850%, 05/01/2017 | 350 | 356 | ||||||
Toyota Motor Credit MTN | ||||||||
1.322%, 10/18/2019 (A) | 1,000 | 1,005 | ||||||
Tribune Media | ||||||||
5.875%, 07/15/2022 | 2,400 | 2,340 | ||||||
Volkswagen Group of America Finance LLC | ||||||||
1.386%, 05/22/2018 (A) (B) | 500 | 497 | ||||||
1.250%, 05/23/2017 (B) | 500 | 499 | ||||||
|
| |||||||
| 19,614 | ||||||||
|
| |||||||
Consumer Staples — 0.4% | ||||||||
Anheuser-Busch InBev Finance | ||||||||
2.146%, 02/01/2021 (A) | 450 | 462 | ||||||
1.900%, 02/01/2019 | 360 | 360 | ||||||
BAT International Finance | ||||||||
2.125%, 06/07/2017 (B) | 1,000 | 1,004 | ||||||
1.360%, 06/15/2018 (A) (B) | 800 | 800 | ||||||
Baxalta | ||||||||
1.646%, 06/22/2018 (A) | 850 | 850 | ||||||
Bayer US Finance LLC | ||||||||
1.144%, 10/06/2017 (A) (B) | 700 | 699 | ||||||
Catholic Health Initiatives | ||||||||
1.600%, 11/01/2017 | 550 | 550 | ||||||
CVS Health | ||||||||
1.900%, 07/20/2018 | 500 | 501 | ||||||
JM Smucker | ||||||||
1.750%, 03/15/2018 | 265 | 266 | ||||||
Kroger MTN | ||||||||
1.500%, 09/30/2019 | 470 | 463 | ||||||
Kroger | ||||||||
2.000%, 01/15/2019 | 245 | 245 | ||||||
Molson Coors Brewing | ||||||||
1.450%, 07/15/2019 | 190 | 187 | ||||||
Mondelez International | ||||||||
1.406%, 02/01/2019 (A) | 1,000 | 1,000 | ||||||
Reynolds American | ||||||||
2.300%, 06/12/2018 | 890 | 897 | ||||||
SABMiller Holdings | ||||||||
1.576%, 08/01/2018 (A) (B) | 600 | 601 | ||||||
Skandinaviska Enskilda Banken | ||||||||
1.422%, 09/13/2019 (A) (B) | 475 | 475 | ||||||
| 60 | SEI Institutional Investments Trust / Semi-Annual Report / November 30, 2016 |
| Description | Face Amount ($ Thousands) | Market Value ($ Thousands) | ||||||
Walgreens Boots Alliance | ||||||||
1.750%, 05/30/2018 | $ | 600 | $ | 601 | ||||
|
| |||||||
| 9,961 | ||||||||
|
| |||||||
Energy — 0.9% | ||||||||
Anadarko Petroleum | ||||||||
6.950%, 06/15/2019 | 311 | 343 | ||||||
Atwood Oceanics | ||||||||
6.500%, 02/01/2020 | 1,700 | 1,326 | ||||||
Blue Racer Midstream LLC | ||||||||
6.125%, 11/15/2022 (B) | 917 | 894 | ||||||
BP Capital Markets (A) | ||||||||
1.487%, 09/26/2018 | 850 | 853 | ||||||
1.392%, 05/10/2018 | 400 | 401 | ||||||
1.327%, 02/13/2018 | 600 | 601 | ||||||
Canadian Natural Resources | ||||||||
5.700%, 05/15/2017 | 150 | 153 | ||||||
ConocoPhillips | ||||||||
1.500%, 05/15/2018 | 525 | 523 | ||||||
Enbridge | ||||||||
1.289%, 06/02/2017 (A) | 900 | 899 | ||||||
Energy Transfer Partners | ||||||||
2.500%, 06/15/2018 | 525 | 525 | ||||||
Genesis Energy | ||||||||
6.750%, 08/01/2022 | 2,654 | 2,714 | ||||||
6.000%, 05/15/2023 | 795 | 795 | ||||||
Gibson Energy | ||||||||
6.750%, 07/15/2021 (B) | 599 | 621 | ||||||
Halcon Resources | ||||||||
8.625%, 02/01/2020 (B) | 1,360 | 1,395 | ||||||
Kinder Morgan | ||||||||
2.000%, 12/01/2017 | 345 | 345 | ||||||
Noble Energy | ||||||||
8.250%, 03/01/2019 | 325 | 365 | ||||||
Sabine Pass Liquefaction LLC | ||||||||
6.250%, 03/15/2022 | 2,500 | 2,694 | ||||||
Schlumberger Holdings | ||||||||
1.900%, 12/21/2017 (B) | 800 | 803 | ||||||
Shell International Finance | ||||||||
1.375%, 05/10/2019 | 600 | 593 | ||||||
Suncor Energy | ||||||||
6.100%, 06/01/2018 | 475 | 503 | ||||||
Targa Resources Partners | ||||||||
6.750%, 03/15/2024 | 1,300 | 1,378 | ||||||
Total Capital International | ||||||||
1.452%, 08/10/2018 (A) | 400 | 401 | ||||||
TransCanada PipeLines | ||||||||
1.664%, 01/12/2018 (A) | 1,100 | 1,104 | ||||||
|
| |||||||
| 20,229 | ||||||||
|
| |||||||
| Description | Face Amount ($ Thousands) | Market Value ($ Thousands) | ||||||
Financials — 2.5% | ||||||||
ABN AMRO Bank | ||||||||
4.250%, 02/02/2017 (B) | $ | 565 | $ | 568 | ||||
American Honda Finance MTN | ||||||||
1.500%, 03/13/2018 | 600 | 600 | ||||||
Australia & New Zealand Banking Group | ||||||||
1.466%, 05/15/2018 (A) | 250 | 251 | ||||||
Bank of America MTN | ||||||||
2.061%, 10/21/2022 (A) | 625 | 630 | ||||||
Bank of America (A) | ||||||||
1.920%, 01/15/2019 | 700 | 705 | ||||||
1.285%, 06/05/2017 | 500 | 501 | ||||||
Bank of Montreal MTN | ||||||||
1.476%, 04/09/2018 (A) | 350 | 351 | ||||||
Bank of New York Mellon MTN | ||||||||
1.275%, 03/06/2018 (A) | 325 | 326 | ||||||
Bank of Nova Scotia | ||||||||
1.650%, 06/14/2019 | 500 | 496 | ||||||
Bank of Tokyo-Mitsubishi UFJ (A) | ||||||||
1.385%, 03/05/2018 (B) | 900 | 899 | ||||||
1.151%, 09/08/2017 (B) | 500 | 499 | ||||||
Barclays Bank MTN | ||||||||
6.050%, 12/04/2017 (B) | 575 | 596 | ||||||
Berkshire Hathaway | ||||||||
1.150%, 08/15/2018 | 550 | 547 | ||||||
Branch Banking & Trust | ||||||||
1.450%, 05/10/2019 | 425 | 421 | ||||||
1.350%, 10/01/2017 | 450 | 450 | ||||||
Capital One (A) | ||||||||
1.617%, 09/13/2019 | 2,000 | 2,006 | ||||||
1.561%, 02/05/2018 | 750 | 752 | ||||||
Capital One Bank USA | ||||||||
1.300%, 06/05/2017 | 850 | 850 | ||||||
Citigroup | ||||||||
2.150%, 07/30/2018 | 500 | 502 | ||||||
1.642%, 04/08/2019 (A) | 650 | 651 | ||||||
1.576%, 04/27/2018 (A) | 450 | 451 | ||||||
Citizens Bank MTN | ||||||||
1.600%, 12/04/2017 | 1,000 | 998 | ||||||
Commonwealth Bank of Australia MTN | ||||||||
1.245%, 03/12/2018 (A) (B) | 850 | 850 | ||||||
Credit Agricole MTN | ||||||||
1.815%, 06/10/2020 (A) (B) | 1,000 | 1,003 | ||||||
Credit Suisse NY | ||||||||
1.700%, 04/27/2018 | 850 | 847 | ||||||
Danske Bank | ||||||||
1.522%, 09/06/2019 (A) (B) | 600 | 600 | ||||||
Deutsche Bank | ||||||||
1.582%, 02/13/2018 (A) | 650 | 640 | ||||||
Fifth Third Bank | ||||||||
1.625%, 09/27/2019 | 3,000 | 2,959 | ||||||
1.443%, 09/27/2019 (A) | 1,250 | 1,250 | ||||||
| SEI Institutional Investments Trust / Semi-Annual Report / November 30, 2016 | 61 |
SCHEDULE OF INVESTMENTS (Unaudited)
Opportunistic Income Fund (Continued)
November 30, 2016
| Description | Face Amount ($ Thousands) | Market Value ($ Thousands) | ||||||
General Electric MTN | ||||||||
1.556%, 04/02/2018 (A) | $ | 275 | $ | 277 | ||||
Goldman Sachs Group (A) | ||||||||
2.241%, 11/15/2021 | 930 | 933 | ||||||
2.042%, 04/23/2020 | 725 | 735 | ||||||
Hartford Financial Services Group | ||||||||
5.375%, 03/15/2017 | 1,000 | 1,011 | ||||||
HSBC Bank | ||||||||
1.546%, 05/15/2018 (A) (B) | 200 | 200 | ||||||
HSBC USA | ||||||||
1.737%, 09/24/2018 (A) | 300 | 301 | ||||||
Huntington National Bank | ||||||||
1.700%, 02/26/2018 | 800 | 800 | ||||||
Hutchison Whampoa International | ||||||||
1.625%, 10/31/2017 (B) | 600 | 599 | ||||||
Hyundai Capital America MTN | ||||||||
2.000%, 03/19/2018 (B) | 375 | 375 | ||||||
2.000%, 07/01/2019 (B) | 400 | 397 | ||||||
ING Bank | ||||||||
1.650%, 08/15/2019 (B) | 300 | 296 | ||||||
1.536%, 10/01/2019 (A) (B) | 500 | 502 | ||||||
Jackson National Life Global Funding | ||||||||
1.875%, 10/15/2018 (B) | 600 | 602 | ||||||
JPMorgan Chase (A) | ||||||||
1.837%, 01/23/2020 | 500 | 505 | ||||||
1.782%, 01/25/2018 | 200 | 201 | ||||||
1.520%, 01/28/2019 | 700 | 703 | ||||||
KeyBank | ||||||||
2.350%, 03/08/2019 | 1,000 | 1,008 | ||||||
Manufacturers & Traders Trust | ||||||||
1.400%, 07/25/2017 | 700 | 701 | ||||||
Metropolitan Life Global Funding I | ||||||||
1.500%, 01/10/2018 (B) | 260 | 260 | ||||||
1.190%, 09/14/2018 (A) (B) | 500 | 500 | ||||||
Mizuho Bank | ||||||||
1.497%, 03/26/2018 (A) (B) | 800 | 800 | ||||||
Morgan Stanley MTN | ||||||||
5.950%, 12/28/2017 | 245 | 256 | ||||||
Morgan Stanley | ||||||||
1.732%, 01/24/2019 (A) | 650 | 654 | ||||||
MSCI | ||||||||
5.750%, 08/15/2025 (B) | 1,117 | 1,173 | ||||||
5.250%, 11/15/2024 (B) | 955 | 987 | ||||||
National Australia Bank | ||||||||
1.269%, 12/02/2016 (A) (B) | 750 | 750 | ||||||
Nordea Bank MTN | ||||||||
1.458%, 09/30/2019 (A) (B) | 1,000 | 1,002 | ||||||
PNC Bank MTN | ||||||||
1.850%, 07/20/2018 | 500 | 502 | ||||||
1.262%, 06/01/2018 (A) | 850 | 851 | ||||||
Principal Life Global Funding II | ||||||||
1.500%, 04/18/2019 (B) | 650 | 642 | ||||||
| Description | Face Amount ($ Thousands) | Market Value ($ Thousands) | ||||||
Protective Life Global Funding | ||||||||
1.722%, 04/15/2019 (B) | $ | 515 | $ | 513 | ||||
Prudential Financial MTN | ||||||||
1.686%, 08/15/2018 (A) | 700 | 699 | ||||||
Reinsurance Group of America | ||||||||
5.625%, 03/15/2017 | 200 | 202 | ||||||
Royal Bank of Canada MTN | ||||||||
1.545%, 12/10/2018 (A) | 650 | 653 | ||||||
Santander Bank | ||||||||
1.804%, 01/12/2018 (A) | 1,250 | 1,250 | ||||||
Societe Generale MTN | ||||||||
1.926%, 10/01/2018 (A) | 500 | 503 | ||||||
Standard Chartered MTN | ||||||||
1.520%, 04/17/2018 (A) (B) | 1,000 | 996 | ||||||
Sumitomo Mitsui Banking (A) | ||||||||
1.548%, 10/19/2018 | 450 | 452 | ||||||
1.460%, 01/16/2018 | 500 | 500 | ||||||
Svenska Handelsbanken MTN | ||||||||
1.432%, 09/06/2019 (A) | 670 | 670 | ||||||
Synchrony Financial | ||||||||
2.111%, 02/03/2020 (A) | 1,000 | 988 | ||||||
1.875%, 08/15/2017 | 455 | 456 | ||||||
Toronto-Dominion Bank MTN | ||||||||
1.450%, 08/13/2019 | 400 | 394 | ||||||
1.152%, 03/13/2018 (A) | 700 | 700 | ||||||
UBS MTN | ||||||||
1.692%, 06/01/2020 (A) | 1,000 | 1,000 | ||||||
Unitrin | ||||||||
6.000%, 05/15/2017 | 110 | 112 | ||||||
US Bank MTN | ||||||||
1.450%, 01/29/2018 | 500 | 500 | ||||||
WEA Finance LLC | ||||||||
1.750%, 09/15/2017 (B) | 1,250 | 1,254 | ||||||
Wells Fargo MTN | ||||||||
1.567%, 01/30/2020 (A) | 1,000 | 1,000 | ||||||
Westpac Banking | ||||||||
1.490%, 01/17/2019 (A) | 550 | 551 | ||||||
|
| |||||||
| 54,115 | ||||||||
|
| |||||||
Health Care — 1.0% | ||||||||
Abbott Laboratories | ||||||||
2.350%, 11/22/2019 | 3,000 | 3,003 | ||||||
AbbVie | ||||||||
1.800%, 05/14/2018 | 650 | 650 | ||||||
Actavis Funding SCS | ||||||||
1.925%, 03/12/2018 (A) | 4,100 | 4,134 | ||||||
1.300%, 06/15/2017 | 800 | 801 | ||||||
Aetna | ||||||||
1.700%, 06/07/2018 | 850 | 850 | ||||||
Becton Dickinson | ||||||||
1.800%, 12/15/2017 | 1,000 | 1,002 | ||||||
| 62 | SEI Institutional Investments Trust / Semi-Annual Report / November 30, 2016 |
| Description | Face Amount ($ Thousands) | Market Value ($ Thousands) | ||||||
Catholic Health Initiatives | ||||||||
2.600%, 08/01/2018 | $ | 430 | $ | 434 | ||||
Celgene | ||||||||
2.125%, 08/15/2018 | 400 | 402 | ||||||
Centene | ||||||||
4.750%, 01/15/2025 | 3,660 | 3,504 | ||||||
DaVita | ||||||||
5.000%, 05/01/2025 | 2,913 | 2,840 | ||||||
LifePoint Health | ||||||||
5.500%, 12/01/2021 | 1,225 | 1,253 | ||||||
Medtronic | ||||||||
1.500%, 03/15/2018 | 425 | 425 | ||||||
Teva Pharmaceutical Finance Netherlands III BV | ||||||||
1.400%, 07/20/2018 | 900 | 891 | ||||||
Zimmer Holdings | ||||||||
1.450%, 04/01/2017 | 950 | 950 | ||||||
|
| |||||||
| 21,139 | ||||||||
|
| |||||||
Industrials — 0.7% | ||||||||
Air Lease | ||||||||
2.125%, 01/15/2018 | 310 | 311 | ||||||
2.125%, 01/15/2020 | 500 | 492 | ||||||
Fortive | ||||||||
1.800%, 06/15/2019 (B) | 445 | 441 | ||||||
GATX | ||||||||
1.250%, 03/04/2017 | 345 | 345 | ||||||
General Electric MTN(A) | ||||||||
1.496%, 01/09/2020 | 1,000 | 1,007 | ||||||
1.391%, 01/14/2019 | 400 | 402 | ||||||
Honeywell International | ||||||||
1.167%, 10/30/2019 (A) | 1,000 | 1,000 | ||||||
Nielsen Finance LLC | ||||||||
5.000%, 04/15/2022 (B) | 5,040 | 5,141 | ||||||
Norbord | ||||||||
5.375%, 12/01/2020 (B) | 3,409 | 3,511 | ||||||
PACCAR Financial MTN | ||||||||
1.300%, 05/10/2019 | 255 | 253 | ||||||
Sensata Technologies | ||||||||
5.000%, 10/01/2025 (B) | 1,112 | 1,095 | ||||||
TTX MTN | ||||||||
2.250%, 02/01/2019 (B) | 270 | 270 | ||||||
United Technologies | ||||||||
1.236%, 11/01/2019 (A) | 700 | 702 | ||||||
|
| |||||||
| 14,970 | ||||||||
|
| |||||||
Information Technology — 0.3% | ||||||||
Bankrate | ||||||||
6.125%, 08/15/2018 (B) | 3,145 | 3,165 | ||||||
Cisco Systems | ||||||||
1.197%, 09/20/2019 (A) | 1,000 | 1,003 | ||||||
| Description | Face Amount ($ Thousands) | Market Value ($ Thousands) | ||||||
eBay | ||||||||
2.500%, 03/09/2018 | $ | 400 | $ | 403 | ||||
Fidelity National Information Services | ||||||||
2.850%, 10/15/2018 | 400 | 407 | ||||||
1.450%, 06/05/2017 | 295 | 295 | ||||||
Hewlett Packard Enterprise | ||||||||
2.700%, 10/05/2017 (B) | 850 | 859 | ||||||
|
| |||||||
| 6,132 | ||||||||
|
| |||||||
Materials — 0.2% | ||||||||
Air Liquide Finance | ||||||||
1.375%, 09/27/2019 (B) | 700 | 689 | ||||||
Ball | ||||||||
5.250%, 07/01/2025 | 1,054 | 1,097 | ||||||
Boart Longyear Management | ||||||||
10.000%, 10/01/2018 (B) | 2,417 | 1,644 | ||||||
Owens-Brockway Glass Container | ||||||||
5.875%, 08/15/2023 (B) | 760 | 794 | ||||||
|
| |||||||
| 4,224 | ||||||||
|
| |||||||
Real Estate — 0.2% | ||||||||
Equinix | ||||||||
5.750%, 01/01/2025 | 3,535 | 3,645 | ||||||
RHP Hotel Properties | ||||||||
5.000%, 04/15/2023 | 1,035 | 1,048 | ||||||
Ventas Realty | ||||||||
1.250%, 04/17/2017 | 170 | 170 | ||||||
|
| |||||||
| 4,863 | ||||||||
|
| |||||||
Telecommunication Services — 0.5% |
| |||||||
AT&T | ||||||||
1.768%, 06/30/2020 (A) | 750 | 751 | ||||||
British Telecommunications | ||||||||
1.250%, 02/14/2017 | 415 | 415 | ||||||
CommScope | ||||||||
5.000%, 06/15/2021 (B) | 1,000 | 1,012 | ||||||
Inmarsat Finance | ||||||||
6.500%, 10/01/2024 (B) | 2,775 | 2,782 | ||||||
4.875%, 05/15/2022 (B) | 300 | 286 | ||||||
SFR Group | ||||||||
7.375%, 05/01/2026 (B) | 3,800 | 3,790 | ||||||
SoftBank Group | ||||||||
4.500%, 04/15/2020 (B) | 751 | 766 | ||||||
Thomson Reuters | ||||||||
1.650%, 09/29/2017 | 395 | 396 | ||||||
1.300%, 02/23/2017 | 400 | 400 | ||||||
Verizon Communications | ||||||||
2.606%, 09/14/2018 (A) | 435 | 445 | ||||||
1.375%, 08/15/2019 | 585 | 574 | ||||||
|
| |||||||
| 11,617 | ||||||||
|
| |||||||
| SEI Institutional Investments Trust / Semi-Annual Report / November 30, 2016 | 63 |
SCHEDULE OF INVESTMENTS (Unaudited)
Opportunistic Income Fund (Continued)
November 30, 2016
| Description | Face Amount ($ Thousands) | Market Value ($ Thousands) | ||||||
Utilities — 0.2% | ||||||||
DTE Energy | ||||||||
1.500%, 10/01/2019 | $ | 435 | $ | 427 | ||||
Emera US Finance | ||||||||
2.150%, 06/15/2019 (B) | 230 | 231 | ||||||
Eversource Energy | ||||||||
1.600%, 01/15/2018 | 290 | 290 | ||||||
Exelon | ||||||||
1.550%, 06/09/2017 | 270 | 270 | ||||||
NextEra Energy Capital Holdings | ||||||||
1.649%, 09/01/2018 | 145 | 145 | ||||||
Sempra Energy | ||||||||
1.625%, 10/07/2019 | 260 | 256 | ||||||
Southern | ||||||||
1.550%, 07/01/2018 | 450 | 449 | ||||||
1.300%, 08/15/2017 | 545 | 545 | ||||||
Talen Energy Supply LLC | ||||||||
4.625%, 07/15/2019 (B) | 1,755 | 1,669 | ||||||
TCEH | ||||||||
0.000%, 12/31/2034 (C) | 63 | 32 | ||||||
WEC Energy Group | ||||||||
1.650%, 06/15/2018 | 700 | 700 | ||||||
|
| |||||||
| 5,014 | ||||||||
|
| |||||||
Total Corporate Obligations |
| 171,878 | ||||||
|
| |||||||
U.S. GOVERNMENT AGENCY OBLIGATIONS — 0.6% |
| |||||||
FFCB | ||||||||
0.850%, 10/20/2017 | 1,000 | 1,000 | ||||||
0.670%, 10/18/2017 | 1,000 | 998 | ||||||
FHLB | ||||||||
0.875%, 05/24/2017 | 1,500 | 1,502 | ||||||
0.750%, 08/28/2017 to 09/08/2017 | 6,000 | 5,996 | ||||||
0.625%, 05/30/2017 | 3,000 | 2,999 | ||||||
|
| |||||||
Total U.S. Government Agency Obligations |
| 12,495 | ||||||
|
| |||||||
Shares | ||||||||
PREFERRED STOCK — 0.2% | ||||||||
Public Storage, 5.900% | 75,000 | 1,871 | ||||||
TE Holdcorp, 0.000% * | 149,588 | 1,795 | ||||||
|
| |||||||
Total Preferred Stock |
| 3,666 | ||||||
|
| |||||||
| Description | Face Amount ($ Thousands) | Market Value ($ Thousands) | ||||||
MUNICIPAL BONDS — 0.1% | ||||||||
California — 0.0% | ||||||||
University of California, Ser Y-1, RB Callable 01/01/2017 @ 100 | ||||||||
1.117%, 07/01/2041 (A) | $ | 755 | $ | 755 | ||||
|
| |||||||
Florida — 0.1% | ||||||||
Florida State, Board of Administration Finance, Ser A, RB | ||||||||
2.163%, 07/01/2019 | 500 | 505 | ||||||
Orlando Utilities Commission, | ||||||||
0.590%, 10/01/2033 (A) | 1,500 | 1,500 | ||||||
|
| |||||||
| 2,005 | ||||||||
|
| |||||||
North Carolina — 0.0% | ||||||||
North Carolina State, Eastern Municipal Power Agency, RB | ||||||||
1.561%, 07/01/2017 | 655 | 655 | ||||||
|
| |||||||
Total Municipal Bonds |
| 3,415 | ||||||
|
| |||||||
Shares | ||||||||
COMMON STOCK — 0.1% | ||||||||
Energy & Exploration Partners* | 540 | 211 | ||||||
TCEH* | 38,580 | 602 | ||||||
TE Holdcorp* | 102,547 | 654 | ||||||
|
| |||||||
Total Common Stock |
| 1,467 | ||||||
|
| |||||||
Face Amount | ||||||||
COLLATERALIZED DEBT OBLIGATION — 0.0% |
| |||||||
Battalion CLO, Ser 2007-1A, Cl E | ||||||||
4.923%, 07/14/2022 (A)(B) | $ | 600 | 601 | |||||
|
| |||||||
Total Collateralized Debt Obligation |
| 601 | ||||||
|
| |||||||
Number of Rights | ||||||||
RIGHTS — 0.0% | ||||||||
United States — 0.0% | ||||||||
TXU/Tech ‡‡ | 38,580 | 52 | ||||||
|
| |||||||
Total Rights |
| 52 | ||||||
|
| |||||||
| 64 | SEI Institutional Investments Trust / Semi-Annual Report / November 30, 2016 |
| Description | Face Amount ($ Thousands) | Market Value ($ Thousands) | ||||||
CERTIFICATE OF DEPOSIT — 0.0% | ||||||||
Credit Suisse | ||||||||
1.750%, 11/14/2017 | $ | 1,250 | $ | 1,250 | ||||
|
| |||||||
Total Certificate of Deposit | 1,250 | |||||||
|
| |||||||
Shares | ||||||||
CASH EQUIVALENT — 4.2% | ||||||||
SEI Daily Income Trust, Government Fund, Cl A | ||||||||
0.210%**† | 91,540,508 | 91,541 | ||||||
|
| |||||||
Total Cash Equivalent | 91,541 | |||||||
|
| |||||||
Face Amount | ||||||||
REPURCHASE AGREEMENT(F) — 0.1% |
| |||||||
BNP Paribas | ||||||||
0.290%, dated 11/30/2016, to be repurchased on 12/01/2016, repurchase price $2,500,020 (collateralized by various FNMA and GNMA obligations, 2.000% - 4.000%, 05/20/2024 - 12/01/2044; par value ranging from $65,426 - $69,491,024; total market value $2,550,001) | $ | 2,500 | 2,500 | |||||
|
| |||||||
Total Repurchase Agreement | 2,500 | |||||||
|
| |||||||
Total Investments — 100.9% | $ | 2,218,252 | ||||||
|
| |||||||
A list of the open futures contracts held by the Fund at November 30, 2016, is as follows:
| Type of Contract | Number of Contracts Long (Short) | Expiration Date | Unrealized Appreciation (Depreciation) ($ Thousands) | |||||||||
U.S. 10-Year Treasury Note | (16 | ) | Mar-2017 | $ | 6 | |||||||
U.S. 10-Year Treasury Note | (29 | ) | Mar-2017 | (2 | ) | |||||||
U.S. 2-Year Treasury Note | (75 | ) | Apr-2017 | (5 | ) | |||||||
U.S. 5-Year Treasury Note | 30 | Mar-2017 | (1 | ) | ||||||||
U.S. Long Treasury Bond | (1 | ) | Mar-2017 | 1 | ||||||||
|
| |||||||||||
| $ | (1 | ) | ||||||||||
|
| |||||||||||
For the period ended November 30, 2016, the total amount of all open futures contracts, as presented in the table above, are representative of the volume of activity for the derivative type during the period.
Percentages are based on Net Assets of $2,197,916 ($ Thousands).
| * | Non-income producing security. |
| ** | Rate shown is the 7-day effective yield as of November 30, 2016. |
| † | Investment in Affiliated Security (see Note 6). |
| ‡‡ | Expiration date unavailable. |
| (A) | Variable Rate Security — The rate reported on the Schedule of Investments is the rate in effect as of November 30, 2016. |
| (B) | Security exempt from registration under Rule 144A of the Securities Act of 1933. These securities may be resold in transactions exempt from registration normally to qualified institutions. On November 30, 2016, the value of these securities amounted to $419,789 ($ Thousands), representing 19.1% of the net assets of the Fund. |
| (C) | Unsettled bank loan. Interest rate not available. |
| (D) | Unfunded bank loan. |
| (E) | Security is in default on interest payment. |
| (F) | Tri-Party Repurchase Agreement. |
ABS — Asset-Backed Security
ARM — Adjustable Rate Mortgage
CDO — Collateralized Debt Obligation
Cl — Class
CLO — Collateralized Loan Obligation
CMBS — Commercial Mortgage-Backed Securities
CMO — Collateralized Mortgage Obligation
FFCB — Federal Farm Credit Bank
FDIC — Federal Deposit Insurance Corporation
FHLB — Federal Home Loan Bank
FHLMC — Federal Home Loan Mortgage Corporation
FNMA — Federal National Mortgage Association
FREMF — Freddie Mac Multi-Family
GNMA — Government National Mortgage Association
IO — Interest Only — face amount represents notional amount.
LLC — Limited Liability Company
LP — Limited Partnership
Ltd. — Limited
MTN — Medium Term Note
NCUA — National Credit Union Association
RB — Revenue Bond
REMIC — Real Estate Mortgage Investment Conduit
Ser — Series
TBA — To Be Announced
USD — U.S. Dollar
The following is a list of the level of inputs used as of November 30, 2016, in valuing the Fund’s investments and other financial instruments carried at value ($ Thousands):
| Investments in Securities | Level 1 | Level 2 | Level 3† | Total | ||||||||||||
Mortgage-Backed Securities | $ | — | $ | 777,479 | $ | — | $ | 777,479 | ||||||||
Loan Participations | — | 596,931 | 139 | 597,070 | ||||||||||||
Asset-Backed Securities | — | 554,838 | — | 554,838 | ||||||||||||
Corporate Obligations | — | 171,878 | — | 171,878 | ||||||||||||
U.S. Government Agency Obligations | — | 12,495 | — | 12,495 | ||||||||||||
Preferred Stock | 1,871 | 1,795 | — | 3,666 | ||||||||||||
Municipal Bonds | — | 3,415 | — | 3,415 | ||||||||||||
Repurchase Agreement | — | 2,500 | — | 2,500 | ||||||||||||
Common Stock | 602 | 654 | 211 | 1,467 | ||||||||||||
Certificate of Deposit | — | 1,250 | — | 1,250 | ||||||||||||
Collateralized Debt Obligation | — | 601 | — | 601 | ||||||||||||
Rights | — | 52 | — | 52 | ||||||||||||
Cash Equivalent | 91,541 | — | — | 91,541 | ||||||||||||
|
|
|
|
|
|
|
| |||||||||
Total Investments in Securities | $ | 94,014 | $ | 2,123,888 | $ | 350 | $ | 2,218,252 | ||||||||
|
|
|
|
|
|
|
| |||||||||
| SEI Institutional Investments Trust / Semi-Annual Report / November 30, 2016 | 65 |
SCHEDULE OF INVESTMENTS (Unaudited)
Opportunistic Income Fund (Concluded)
November 30, 2016
| Other Financial Instruments | Level 1 | `Level 2 | Level 3 | Total | ||||||||||||
Futures Contracts* | ||||||||||||||||
Unrealized Appreciation | $ | 7 | $ | — | $ | — | $ | 7 | ||||||||
Unrealized Depreciation | (8 | ) | — | — | (8 | ) | ||||||||||
|
|
|
|
|
|
|
| |||||||||
Total Other Financial Instruments | $ | (1 | ) | $ | — | $ | — | $ | (1 | ) | ||||||
|
|
|
|
|
|
|
| |||||||||
| † | A reconciliation of Level 3 investments and disclosures of significant unobservable inputs are presented when the Fund has significant amount of Level 3 investments at the beginning and/or end of the period in relation to net assets. Management has concluded that Level 3 investments are not material in relation to net assets. |
| * | Futures contracts are valued at the unrealized appreciation (depreciation) on the instrument. |
For the period ended November 30, 2016, there were no transfers between Level 1 and Level 2 assets and liabilities.
For the period ended November 30, 2016, there were transfers between Level 2 and Level 3 assets and liabilities. The transfers were due to changes in the availability of observable inputs used to determine fair value.
For more information on valuation inputs, see Note 2 — Significant Accounting Policies in Notes to Financial Statements.
Amounts designated as “—” are $0 or have been rounded to $0.
The accompanying notes are an integral part of the financial statements.
| 66 | SEI Institutional Investments Trust / Semi-Annual Report / November 30, 2016 |
SCHEDULE OF INVESTMENTS (Unaudited)
Core Fixed Income Fund
November 30, 2016
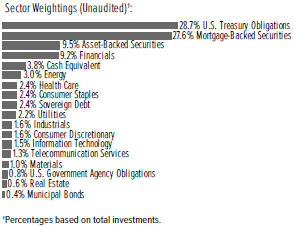
| Description | Face Amount ($ Thousands) | Market Value ($ Thousands) | ||||||
U.S. TREASURY OBLIGATIONS — 31.1% |
| |||||||
U.S. Treasury Bills | ||||||||
0.508%, 04/06/2017 (A) | $ | 11,075 | $ | 11,055 | ||||
0.435%, 02/23/2017 (A) | 59,695 | 59,631 | ||||||
0.313%, 12/08/2016 (A) | 812 | 812 | ||||||
0.159%, 01/19/2017 (A) | 4,847 | 4,845 | ||||||
U.S. Treasury Bonds | ||||||||
4.250%, 05/15/2039 | 230 | 282 | ||||||
3.875%, 08/15/2040 | 150 | 174 | ||||||
3.750%, 11/15/2043 | 5,520 | 6,315 | ||||||
3.000%, 11/15/2044 | 943 | 940 | ||||||
3.000%, 05/15/2045 | 60,551 | 60,238 | ||||||
3.000%, 11/15/2045 | 50,157 | 49,859 | ||||||
2.875%, 08/15/2045 | 66,035 | 64,051 | ||||||
2.875%, 11/15/2046 | 34,246 | 33,284 | ||||||
2.750%, 08/15/2042 | 9,025 | 8,612 | ||||||
2.750%, 11/15/2042 | 90 | 86 | ||||||
2.500%, 02/15/2045 | 103,153 | 92,632 | ||||||
2.500%, 02/15/2046 | 72,128 | 64,563 | ||||||
2.500%, 05/15/2046 | 57,222 | 51,209 | ||||||
0.351%, 08/15/2046 | 63,745 | 53,944 | ||||||
U.S. Treasury Inflation Indexed Bonds | ||||||||
0.125%, 07/15/2026 | 13,839 | 13,454 | ||||||
U.S. Treasury Inflation-Protected Securities | ||||||||
2.375%, 01/15/2025 | 460 | 679 | ||||||
1.375%, 02/15/2044 | 12,990 | 14,383 | ||||||
0.750%, 02/15/2042 | 2,265 | 2,177 | ||||||
0.750%, 02/15/2045 | 9,878 | 9,441 | ||||||
0.625%, 01/15/2024 | 2,412 | 2,459 | ||||||
0.625%, 02/15/2043 | 14,617 | 13,611 | ||||||
0.375%, 07/15/2023 | 1,556 | 1,573 | ||||||
0.375%, 07/15/2025 | 20,382 | 20,336 | ||||||
U.S. Treasury Notes | ||||||||
3.500%, 05/15/2020 | 2,155 | 2,295 | ||||||
2.750%, 11/15/2023 | 500 | 518 | ||||||
2.625%, 11/15/2020 | 51,010 | 52,827 | ||||||
| Description | Face Amount ($ Thousands) | Market Value ($ Thousands) | ||||||
2.375%, 08/15/2024 | $ | 110 | $ | 111 | ||||
2.125%, 08/31/2020 | 45,170 | 45,952 | ||||||
2.125%, 08/15/2021 | 59,684 | 60,381 | ||||||
2.125%, 09/30/2021 | 5,490 | 5,552 | ||||||
2.125%, 06/30/2022 | 1,110 | 1,117 | ||||||
2.125%, 11/30/2023 | 5,102 | 5,083 | ||||||
2.000%, 05/31/2021 | 8,300 | 8,367 | ||||||
2.000%, 08/31/2021 | 11,639 | 11,708 | ||||||
2.000%, 10/31/2021 | 19,128 | 19,224 | ||||||
2.000%, 11/30/2022 | 35,640 | 35,487 | ||||||
2.000%, 02/15/2025 | 500 | 488 | ||||||
2.000%, 11/15/2026 | 19,902 | 19,256 | ||||||
1.875%, 05/31/2022 | 660 | 656 | ||||||
1.750%, 12/31/2020 | 6,305 | 6,310 | ||||||
1.750%, 11/30/2021 | 83,442 | 83,113 | ||||||
1.750%, 03/31/2022 | 90 | 89 | ||||||
1.750%, 05/15/2022 | 18,115 | 17,894 | ||||||
1.625%, 04/30/2019 | 11,110 | 11,210 | ||||||
1.625%, 06/30/2020 | 280 | 280 | ||||||
1.625%, 11/30/2020 | 28,975 | 28,881 | ||||||
1.625%, 11/15/2022 | 250 | 244 | ||||||
1.625%, 05/15/2026 | 2,491 | 2,332 | ||||||
1.500%, 12/31/2018 | 44,905 | 45,231 | ||||||
1.500%, 01/31/2022 | 30,760 | 30,115 | ||||||
1.500%, 08/15/2026 | 78,225 | 72,248 | ||||||
1.375%, 02/29/2020 | 5,667 | 5,644 | ||||||
1.375%, 10/31/2020 | 110 | 109 | ||||||
1.375%, 01/31/2021 | 46,068 | 45,382 | ||||||
1.375%, 04/30/2021 | 18,739 | 18,407 | ||||||
1.250%, 12/15/2018 | 6,546 | 6,559 | ||||||
1.250%, 10/31/2021 | 52,290 | 50,791 | ||||||
1.125%, 06/15/2018 | 6,429 | 6,437 | ||||||
1.125%, 06/30/2021 | 18,815 | 18,239 | ||||||
1.125%, 07/31/2021 | 5,694 | 5,513 | ||||||
1.125%, 08/31/2021 | 19,430 | 18,805 | ||||||
1.125%, 09/30/2021 | 17,397 | 16,811 | ||||||
1.000%, 05/15/2018 | 5,510 | 5,508 | ||||||
1.000%, 11/30/2018 | 37,215 | 37,128 | ||||||
1.000%, 10/15/2019 | 30,480 | 30,153 | ||||||
1.000%, 11/15/2019 | 78,402 | 77,514 | ||||||
0.875%, 07/15/2018 | 5,225 | 5,210 | ||||||
0.875%, 06/15/2019 | 2 | 2 | ||||||
0.875%, 09/15/2019 | 32,617 | 32,192 | ||||||
0.750%, 10/31/2017 | 27,825 | 27,800 | ||||||
0.750%, 02/28/2018 | 21,860 | 21,799 | ||||||
0.750%, 03/31/2018 | 3,350 | 3,339 | ||||||
0.750%, 09/30/2018 | 22,355 | 22,210 | ||||||
0.750%, 10/31/2018 | 32,541 | 32,311 | ||||||
U.S. Treasury STRIPS | ||||||||
5.285%, 08/15/2045 (A) | 7,195 | 2,942 | ||||||
| SEI Institutional Investments Trust / Semi-Annual Report / November 30, 2016 | 67 |
SCHEDULE OF INVESTMENTS (Unaudited)
Core Fixed Income Fund (Continued)
November 30, 2016
| Description | Face Amount ($ Thousands) | Market Value ($ Thousands) | ||||||
3.812%, 02/15/2045 (A) | $ | 13,435 | $ | 5,572 | ||||
|
| |||||||
Total U.S. Treasury Obligations | 1,703,991 | |||||||
|
| |||||||
MORTGAGE-BACKED SECURITIES — 29.9% |
| |||||||
Agency Mortgage-Backed Obligations — 25.2% |
| |||||||
FHLMC | ||||||||
10.000%, 03/17/2026 | 184 | 188 | ||||||
7.500%, 08/01/2030 to 12/01/2036 | 729 | 850 | ||||||
7.000%, 05/01/2024 to 03/01/2039 | 213 | 245 | ||||||
6.500%, 06/01/2017 to 09/01/2039 | 1,976 | 2,235 | ||||||
6.000%, 11/01/2017 to 08/01/2038 | 2,590 | 2,910 | ||||||
5.500%, 02/01/2035 to 12/01/2038 | 3,816 | 4,363 | ||||||
5.000%, 04/01/2020 to 06/01/2044 | 5,204 | 5,634 | ||||||
4.500%, 08/01/2020 to 06/01/2044 | 21,296 | 23,071 | ||||||
4.000%, 10/01/2025 to 06/01/2046 | 79,383 | 84,331 | ||||||
3.500%, 11/01/2029 to 12/01/2046 | 117,782 | 122,166 | ||||||
3.000%, 03/01/2030 to 10/01/2046 | 47,622 | 47,891 | ||||||
FHLMC ARM | ||||||||
3.439%, 05/01/2036 (B) | 180 | 192 | ||||||
3.090%, 02/01/2045 (B) | 1,147 | 1,177 | ||||||
2.891%, 12/01/2036 (B) | 233 | 249 | ||||||
2.845%, 10/01/2036 (B) | 70 | 74 | ||||||
2.810%, 05/01/2045 (B) | 971 | 996 | ||||||
2.794%, 12/01/2041 (B) | 323 | 333 | ||||||
2.547%, 07/01/2042 (B) | 1,233 | 1,269 | ||||||
FHLMC CMO, Ser 1988-1, Cl Z | ||||||||
9.300%, 04/15/2019 | 1 | 1 | ||||||
FHLMC CMO, Ser 1999-2174, Cl PN | ||||||||
6.000%, 07/15/2029 | 25 | 27 | ||||||
FHLMC CMO, Ser 2001-2312, Cl Z | ||||||||
6.500%, 05/15/2031 | 245 | 278 | ||||||
FHLMC CMO, Ser 2002-2399, Cl XG | ||||||||
6.500%, 01/15/2032 | 73 | 81 | ||||||
FHLMC CMO, Ser 2003-2671, Cl S | ||||||||
13.772%, 09/15/2033 (B) | 103 | 134 | ||||||
FHLMC CMO, Ser 2003-2684, Cl ZN | ||||||||
4.000%, 10/15/2033 | 204 | 214 | ||||||
FHLMC CMO, Ser 2004-2733, Cl ME | ||||||||
5.000%, 01/15/2034 | 479 | 525 | ||||||
FHLMC CMO, Ser 2005-2945, Cl SA | ||||||||
11.325%, 03/15/2020 (B) | 182 | 193 | ||||||
FHLMC CMO, Ser 2005-2950, Cl JO, PO (A) | ||||||||
0.000%, 03/15/2020 (A) | 17 | 16 | ||||||
FHLMC CMO, Ser 2007-3316, Cl JO, PO (A) | ||||||||
0.000%, 05/15/2037 (A) | 21 | 20 | ||||||
FHLMC CMO, Ser 2007-3346, Cl FA | ||||||||
0.768%, 02/15/2019 (B) | 505 | 504 | ||||||
FHLMC CMO, Ser 2008-3451, Cl SB, IO | ||||||||
5.492%, 05/15/2038 (B) | 645 | 82 | ||||||
| Description | Face Amount ($ Thousands) | Market Value ($ Thousands) | ||||||
FHLMC CMO, Ser 2009-3546, Cl A | ||||||||
2.502%, 02/15/2039 (B) | $ | 166 | $ | 170 | ||||
FHLMC CMO, Ser 2010-3621, Cl SB, IO | ||||||||
5.692%, 01/15/2040 (B) | 194 | 34 | ||||||
FHLMC CMO, Ser 2012-4030, Cl HS, IO | ||||||||
6.072%, 04/15/2042 (B) | 112 | 21 | ||||||
FHLMC CMO, Ser 2012-4076, Cl SW, IO | ||||||||
5.512%, 07/15/2042 (B) | 258 | 59 | ||||||
FHLMC CMO, Ser 2012-4092, Cl AI, IO | ||||||||
3.000%, 09/15/2031 | 2,251 | 235 | ||||||
FHLMC CMO, Ser 2012-4102, Cl TC | ||||||||
2.500%, 09/15/2041 | 4,553 | 4,568 | ||||||
FHLMC CMO, Ser 2012-4119, Cl IN, IO | ||||||||
3.500%, 10/15/2032 | 962 | 127 | ||||||
FHLMC CMO, Ser 2012-4136, Cl SJ, IO | ||||||||
5.612%, 11/15/2042 (B) | 266 | 50 | ||||||
FHLMC CMO, Ser 2012-4136, Cl SE, IO | ||||||||
5.612%, 11/15/2042 (B) | 242 | 50 | ||||||
FHLMC CMO, Ser 2013-4161, Cl BA | ||||||||
2.500%, 12/15/2041 | 9,971 | 9,927 | ||||||
FHLMC CMO, Ser 2013-4194, Cl BI, IO | ||||||||
3.500%, 04/15/2043 | 1,525 | 220 | ||||||
FHLMC CMO, Ser 2013-4210, Cl Z | ||||||||
3.000%, 05/15/2043 | 1,523 | 1,401 | ||||||
FHLMC CMO, Ser 2013-4227, Cl VA | ||||||||
3.500%, 10/15/2037 | 1,300 | 1,333 | ||||||
FHLMC CMO, Ser 2015-4425, Cl A | ||||||||
4.000%, 09/15/2040 | 1,750 | 1,853 | ||||||
FHLMC Multifamily Structured Pass-Through Certificates, Ser K015, Cl X1, IO | ||||||||
1.783%, 07/25/2021 (B) | 2,910 | 181 | ||||||
FHLMC Multifamily Structured Pass-Through Certificates, Ser K016, Cl X1, IO | ||||||||
1.542%, 10/25/2021 (B) | 519 | 32 | ||||||
FHLMC Multifamily Structured Pass-Through Certificates, Ser K027, Cl A2 | ||||||||
2.637%, 01/25/2023 | 1,030 | 1,047 | ||||||
FHLMC Multifamily Structured Pass-Through Certificates, Ser K151, Cl A3 | ||||||||
3.511%, 04/25/2030 | 3,220 | 3,319 | ||||||
FHLMC Multifamily Structured Pass-Through Certificates, Ser KJ03, Cl A2 | ||||||||
2.328%, 06/25/2021 | 950 | 953 | ||||||
FHLMC Reference REMIC CMO, Ser 2006-R007, Cl ZA | ||||||||
6.000%, 05/15/2036 | 703 | 790 | ||||||
FHLMC REMIC CMO, | ||||||||
5.412%, 05/15/2041 (B) | 1,201 | 164 | ||||||
FHLMC STRIPS CMO, | ||||||||
3.000%, 01/15/2043 | 3,176 | 3,193 | ||||||
FHLMC TBA | ||||||||
3.500%, 12/01/2040 | 26,000 | 26,688 | ||||||
| 68 | SEI Institutional Investments Trust / Semi-Annual Report / November 30, 2016 |
| Description | Face Amount ($ Thousands) | Market Value ($ Thousands) | ||||||
3.000%, 12/15/2044 | $ | 42,100 | $ | 41,912 | ||||
FNMA | ||||||||
4.338%, 11/01/2021 | 5,546 | 5,973 | ||||||
4.250%, 04/01/2021 | 2,000 | 2,165 | ||||||
4.120%, 04/01/2020 | 1,092 | 1,163 | ||||||
4.060%, 07/01/2021 | 2,230 | 2,400 | ||||||
4.050%, 01/01/2021 | 1,430 | 1,533 | ||||||
4.040%, 10/01/2020 | 2,120 | 2,266 | ||||||
3.980%, 08/01/2021 | 4,420 | 4,739 | ||||||
3.762%, 12/01/2020 | 2,497 | 2,641 | ||||||
3.740%, 07/01/2020 | 1,284 | 1,356 | ||||||
3.730%, 03/01/2026 | 2,541 | 2,693 | ||||||
3.619%, 12/01/2020 | 3,495 | 3,684 | ||||||
3.583%, 09/01/2020 | 5,684 | 5,980 | ||||||
3.290%, 10/01/2020 | 949 | 990 | ||||||
3.230%, 11/01/2020 | 1,397 | 1,455 | ||||||
3.010%, 05/01/2028 | 2,950 | 2,958 | ||||||
2.950%, 05/01/2031 | 3,389 | 3,354 | ||||||
2.870%, 08/01/2026 | 1,865 | 1,826 | ||||||
2.830%, 06/01/2022 | 2,507 | 2,571 | ||||||
2.820%, 06/01/2022 | 2,851 | 2,923 | ||||||
2.810%, 04/01/2025 | 250 | 251 | ||||||
2.560%, 10/01/2028 | 3,000 | 2,859 | ||||||
2.490%, 09/01/2028 | 3,045 | 2,883 | ||||||
8.000%, 05/01/2023 to 06/01/2031 | 75 | 88 | ||||||
7.500%, 06/01/2030 to 04/01/2039 | 673 | 818 | ||||||
7.000%, 11/01/2017 to 02/01/2039 | 2,045 | 2,380 | ||||||
6.500%, 05/01/2017 to 10/01/2037 | 1,307 | 1,479 | ||||||
6.000%, 10/01/2019 to 10/01/2040 | 5,793 | 6,616 | ||||||
5.500%, 06/01/2020 to 08/01/2038 | 7,612 | 8,328 | ||||||
5.000%, 02/01/2020 to 07/01/2044 | 12,117 | 13,427 | ||||||
4.540%, 01/01/2020 to 05/01/2021 | 2,778 | 2,997 | ||||||
4.500%, 01/01/2020 to 06/01/2046 | 56,517 | 61,606 | ||||||
4.000%, 07/01/2020 to 11/01/2046 | 120,946 | 128,189 | ||||||
3.850%, 08/01/2025 | 3,440 | 3,686 | ||||||
3.500%, 12/01/2029 to 12/31/2050 | 75,555 | 78,614 | ||||||
3.000%, 04/01/2031 to 11/01/2046 | 60,621 | 61,890 | ||||||
2.500%, 10/01/2026 to 10/01/2042 | 12,142 | 12,063 | ||||||
FNMA ARM | ||||||||
5.508%, 05/01/2037 (B) | 10 | 10 | ||||||
4.370%, 04/01/2040 (B) | 769 | 804 | ||||||
2.980%, 06/01/2041 (B) | 2,100 | 2,215 | ||||||
2.837%, 05/01/2043 (B) | 513 | 525 | ||||||
2.754%, 01/01/2045 (B) | 1,793 | 1,837 | ||||||
2.751%, 01/01/2045 (B) | 1,172 | 1,201 | ||||||
2.668%, 01/01/2042 (B) | 1,469 | 1,519 | ||||||
2.616%, 02/01/2042 (B) | 2,828 | 2,969 | ||||||
2.482%, 12/01/2035 (B) | 36 | 37 | ||||||
2.416%, 06/01/2042 (B) | 1,083 | 1,114 | ||||||
1.705%, 04/01/2043 (B) | 1,517 | 1,562 | ||||||
FNMA CMO, Ser 1992-143, Cl M | ||||||||
8.000%, 09/25/2022 | 124 | 136 | ||||||
| Description | Face Amount ($ Thousands) | Market Value ($ Thousands) | ||||||
FNMA CMO, Ser 1992-69, Cl Z | ||||||||
8.000%, 05/25/2022 | $ | 127 | $ | 140 | ||||
FNMA CMO, Ser 1992-96, Cl B, PO (A) | ||||||||
0.000%, 05/25/2022 (A) | — | — | ||||||
FNMA CMO, Ser 1993-149, Cl SH | ||||||||
11.500%, 08/25/2023 (B) | 69 | 85 | ||||||
FNMA CMO, Ser 1993-99, Cl Z | ||||||||
7.000%, 07/25/2023 | 336 | 364 | ||||||
FNMA CMO, Ser 1994-31, Cl ZC | ||||||||
6.500%, 02/25/2024 | 274 | 299 | ||||||
FNMA CMO, Ser 1994-63, Cl PK | ||||||||
7.000%, 04/25/2024 | 240 | 268 | ||||||
FNMA CMO, Ser 1997-32, Cl PG | ||||||||
6.500%, 04/25/2027 | 205 | 233 | ||||||
FNMA CMO, Ser 1999-11, Cl Z | ||||||||
5.500%, 03/25/2029 | 176 | 194 | ||||||
FNMA CMO, Ser 2001-52, Cl YZ | ||||||||
6.500%, 10/25/2031 | 28 | 31 | ||||||
FNMA CMO, Ser 2002-10, Cl SB | ||||||||
17.798%, 03/25/2017 (B) | — | 1 | ||||||
FNMA CMO, Ser 2003-124, Cl TS | ||||||||
9.800%, 01/25/2034 (B) | 17 | 21 | ||||||
FNMA CMO, Ser 2005-29, Cl ZA | ||||||||
5.500%, 04/25/2035 | 469 | 519 | ||||||
FNMA CMO, Ser 2005-74, Cl CS | ||||||||
18.413%, 05/25/2035 (B) | 177 | 238 | ||||||
FNMA CMO, Ser 2006-104, Cl MI, IO | ||||||||
6.166%, 11/25/2036 (B) | 1,857 | 253 | ||||||
FNMA CMO, Ser 2006-125, Cl SM, IO | ||||||||
6.616%, 01/25/2037 (B) | 806 | 147 | ||||||
FNMA CMO, Ser 2006-33, Cl LS | ||||||||
27.521%, 05/25/2036 (B) | 121 | 211 | ||||||
FNMA CMO, Ser 2006-46, Cl SW | ||||||||
22.057%, 06/25/2036 (B) | 101 | 145 | ||||||
FNMA CMO, Ser 2006-51, Cl SP, IO | ||||||||
6.066%, 03/25/2036 (B) | 142 | 23 | ||||||
FNMA CMO, Ser 2007-108, Cl AN | ||||||||
8.204%, 11/25/2037 (B) | 324 | 389 | ||||||
FNMA CMO, Ser 2007-64, Cl FA | ||||||||
1.054%, 07/25/2037 (B) | 22 | 22 | ||||||
FNMA CMO, Ser 2007-68, Cl SC, IO | ||||||||
6.116%, 07/25/2037 (B) | 359 | 65 | ||||||
FNMA CMO, Ser 2008-22, Cl SI, IO | ||||||||
5.846%, 03/25/2037 (B) | 3,671 | 199 | ||||||
FNMA CMO, Ser 2008-24, Cl NA | ||||||||
6.750%, 06/25/2037 | 72 | 80 | ||||||
FNMA CMO, Ser 2009-103, Cl MB | ||||||||
2.948%, 12/25/2039 (B) | 399 | 424 | ||||||
FNMA CMO, Ser 2009-86, Cl BO, PO (A) | ||||||||
0.000%, 03/25/2037 (A) | 2,803 | 2,570 | ||||||
FNMA CMO, Ser 2010-123, Cl PM | ||||||||
4.000%, 07/25/2040 | 3,600 | 3,824 | ||||||
| SEI Institutional Investments Trust / Semi-Annual Report / November 30, 2016 | 69 |
SCHEDULE OF INVESTMENTS (Unaudited)
Core Fixed Income Fund (Continued)
November 30, 2016
| Description | Face Amount ($ Thousands) | Market Value ($ Thousands) | ||||||
FNMA CMO, Ser 2010-150, Cl SK, IO | ||||||||
6.345%, 01/25/2041 (B) | $ | 1,098 | $ | 191 | ||||
FNMA CMO, Ser 2010-27, Cl AS, IO | ||||||||
5.896%, 04/25/2040 (B) | 1,406 | 298 | ||||||
FNMA CMO, Ser 2011-2, Cl WA | ||||||||
5.820%, 02/25/2051 (B) | 200 | 217 | ||||||
FNMA CMO, Ser 2011-75, Cl FA | ||||||||
1.134%, 08/25/2041 (B) | 257 | 261 | ||||||
FNMA CMO, Ser 2011-90, Cl QI, IO | ||||||||
5.000%, 05/25/2034 | 1,789 | 144 | ||||||
FNMA CMO, Ser 2011-96, Cl SA, IO | ||||||||
5.966%, 10/25/2041 (B) | 2,611 | 487 | ||||||
FNMA CMO, Ser 2012-133, Cl SA, IO | ||||||||
5.566%, 12/25/2042 (B) | 259 | 51 | ||||||
FNMA CMO, Ser 2012-133, Cl CS, IO | ||||||||
5.566%, 12/25/2042 (B) | 1,490 | 268 | ||||||
FNMA CMO, Ser 2012-134, Cl MS, IO | ||||||||
5.566%, 12/25/2042 (B) | 723 | 164 | ||||||
FNMA CMO, Ser 2012-134, Cl LC | ||||||||
3.000%, 12/25/2042 | 1,508 | 1,514 | ||||||
FNMA CMO, Ser 2012-139, Cl DI, IO | ||||||||
3.000%, 12/25/2027 | 1,502 | 143 | ||||||
FNMA CMO, Ser 2012-28, Cl B | ||||||||
6.500%, 06/25/2039 | 77 | 85 | ||||||
FNMA CMO, Ser 2012-46, Cl BA | ||||||||
6.000%, 05/25/2042 | 1,025 | 1,168 | ||||||
FNMA CMO, Ser 2012-70, Cl YS, IO | ||||||||
6.066%, 02/25/2041 (B) | 443 | 65 | ||||||
FNMA CMO, Ser 2012-74, Cl OA, PO (A) | ||||||||
0.000%, 03/25/2042 (A) | 85 | 75 | ||||||
FNMA CMO, Ser 2012-74, Cl SA, IO | ||||||||
6.066%, 03/25/2042 (B) | 1,233 | 224 | ||||||
FNMA CMO, Ser 2012-75, Cl AO, PO (A) | ||||||||
0.000%, 03/25/2042 (A) | 170 | 150 | ||||||
FNMA CMO, Ser 2012-75, Cl NS, IO | ||||||||
6.016%, 07/25/2042 (B) | 442 | 86 | ||||||
FNMA CMO, Ser 2012-93, Cl IB, IO | ||||||||
3.000%, 09/25/2027 | 5,800 | 591 | ||||||
FNMA CMO, Ser 2012-M14, Cl X1, IO | ||||||||
4.179%, 02/25/2017 (B) | 1,123 | 5 | ||||||
FNMA CMO, Ser 2013-101, Cl CO, PO (A) | ||||||||
0.000%, 10/25/2043 (A) | 4,061 | 3,246 | ||||||
FNMA CMO, Ser 2013-101, Cl BO, PO (A) | ||||||||
0.000%, 10/25/2043 (A) | 1,783 | 1,424 | ||||||
FNMA CMO, Ser 2013-26, Cl HI, IO | ||||||||
3.000%, 04/25/2032 | 1,457 | 124 | ||||||
FNMA CMO, Ser 2013-9, Cl BC | ||||||||
6.500%, 07/25/2042 | 2,330 | 2,666 | ||||||
FNMA CMO, Ser 2013-9, Cl CB | ||||||||
5.500%, 04/25/2042 | 2,435 | 2,718 | ||||||
FNMA CMO, Ser 2013-M3, Cl FA | ||||||||
0.752%, 06/25/2018 (B) | 3,205 | 3,205 | ||||||
| Description | Face Amount ($ Thousands) | Market Value ($ Thousands) | ||||||
FNMA CMO, Ser 2014-M12, Cl FA | ||||||||
0.814%, 10/25/2021 (B) | $ | 2,216 | $ | 2,207 | ||||
FNMA CMO, Ser 2014-M3, Cl X2, IO | ||||||||
0.103%, 01/25/2024 (B) | 65,010 | 360 | ||||||
FNMA CMO, Ser 2015-M8, Cl X2, IO | ||||||||
0.179%, 01/25/2025 (B) | 89,017 | 1,050 | ||||||
FNMA CMO, Ser 2016-59, Cl CA | ||||||||
3.500%, 09/25/2043 | 5,740 | 6,002 | ||||||
FNMA CMO, Ser 2016-60, Cl QS, IO | ||||||||
5.516%, 09/25/2046 (B) | 2,421 | 453 | ||||||
FNMA Interest STRIPS CMO, | ||||||||
7.000%, 01/25/2032 | 287 | 56 | ||||||
FNMA Interest STRIPS CMO, | ||||||||
6.500%, 02/01/2033 | 388 | 73 | ||||||
FNMA Interest STRIPS CMO, | ||||||||
4.000%, 11/25/2041 | 1,479 | 310 | ||||||
FNMA Interest STRIPS CMO, | ||||||||
3.000%, 04/25/2027 | 2,185 | 189 | ||||||
FNMA Interest STRIPS CMO, | ||||||||
4.500%, 11/25/2039 | 1,544 | 305 | ||||||
FNMA Interest STRIPS CMO, | ||||||||
3.000%, 11/25/2026 | 3,047 | 259 | ||||||
FNMA Interest STRIPS CMO, | ||||||||
3.500%, 11/25/2041 | 1,322 | 240 | ||||||
FNMA Multifamily Megas, Ser 141, Cl 1 | ||||||||
2.966%, 05/01/2027 (B) | 4,931 | 4,970 | ||||||
FNMA TBA | ||||||||
2.500%, 12/01/2027 | 24,455 | 24,562 | ||||||
4.000%, 11/15/2034 to 12/14/2039 | 52,950 | 55,751 | ||||||
3.500%, 12/01/2040 to 01/01/2041 | 55,290 | 56,770 | ||||||
3.000%, 12/25/2028 to 01/15/2043 | 104,875 | 104,417 | ||||||
FNMA, Ser M11, Cl AL | ||||||||
2.944%, 07/25/2039 | 1,636 | 1,584 | ||||||
FNMA, Ser M11, Cl A2 | ||||||||
2.369%, 07/25/2026 (B) | 1,120 | 1,071 | ||||||
GNMA | ||||||||
9.500%, 12/15/2020 | 1 | 1 | ||||||
3.000%, 04/15/2045 | 4,970 | 5,052 | ||||||
7.000%, 04/15/2026 to 05/15/2033 | 1,000 | 1,109 | ||||||
6.500%, 01/15/2024 to 07/15/2035 | 1,904 | 2,179 | ||||||
6.000%, 12/15/2023 to 10/20/2040 | 7,076 | 8,176 | ||||||
5.000%, 12/20/2039 to 11/20/2045 | 898 | 1,000 | ||||||
4.500%, 01/20/2040 to 09/20/2046 | 14,579 | 15,974 | ||||||
4.000%, 12/15/2040 to 08/20/2046 | 18,194 | 19,635 | ||||||
3.500%, 03/20/2046 to 09/20/2046 | 21,251 | 22,156 | ||||||
| 70 | SEI Institutional Investments Trust / Semi-Annual Report / November 30, 2016 |
| Description | Face Amount ($ Thousands) | Market Value ($ Thousands) | ||||||
GNMA ARM | ||||||||
1.970%, 01/20/2060 (B) | $ | 1,000 | $ | 1,025 | ||||
1.625%, 07/20/2034 (B) | 12 | 13 | ||||||
GNMA CMO, Ser 2001-22, Cl PS | ||||||||
19.578%, 03/17/2031 (B) | 296 | 469 | ||||||
GNMA CMO, Ser 2002-57, Cl SB | ||||||||
104.369%, 08/16/2032 | 37 | 152 | ||||||
GNMA CMO, Ser 2003-60, Cl GS | ||||||||
11.513%, 05/16/2033 (B) | 33 | 39 | ||||||
GNMA CMO, Ser 2004-93, Cl PC | ||||||||
5.000%, 04/16/2034 | 24 | 25 | ||||||
GNMA CMO, Ser 2005-7, Cl JM | ||||||||
15.528%, 05/18/2034 (B) | 9 | 11 | ||||||
GNMA CMO, Ser 2006-16, Cl GS, IO | ||||||||
6.428%, 04/20/2036 (B) | 788 | 150 | ||||||
GNMA CMO, Ser 2007-78, Cl SA, IO | ||||||||
5.995%, 12/16/2037 (B) | 4,638 | 753 | ||||||
GNMA CMO, Ser 2009-106, Cl KS, IO | ||||||||
5.874%, 11/20/2039 (B) | 6,081 | 1,082 | ||||||
GNMA CMO, Ser 2009-66, Cl XS, IO | ||||||||
6.265%, 07/16/2039 (B) | 58 | 8 | ||||||
GNMA CMO, Ser 2009-66, Cl LC | ||||||||
6.000%, 08/16/2039 | 2,245 | 2,530 | ||||||
GNMA CMO, Ser 2009-8, Cl PS, IO | ||||||||
5.765%, 08/16/2038 (B) | 53 | 7 | ||||||
GNMA CMO, Ser 2010-14, Cl AO, PO (A) | ||||||||
0.000%, 12/20/2032 (A) | 140 | 134 | ||||||
GNMA CMO, Ser 2010-31, Cl GS, IO | ||||||||
5.938%, 03/20/2039 (B) | 238 | 23 | ||||||
GNMA CMO, Ser 2010-4, Cl NS, IO | ||||||||
5.855%, 01/16/2040 (B) | 8,342 | 1,529 | ||||||
GNMA CMO, Ser 2010-4, Cl SL, IO | ||||||||
5.858%, 01/16/2040 (B) | 175 | 33 | ||||||
GNMA CMO, Ser 2010-59, Cl LB | ||||||||
4.500%, 10/20/2039 | 2,343 | 2,475 | ||||||
GNMA CMO, Ser 2010-85, Cl HS, IO | ||||||||
6.088%, 01/20/2040 (B) | 646 | 96 | ||||||
GNMA CMO, Ser 2010-H10, Cl FC | ||||||||
1.522%, 05/20/2060 (B) | 3,583 | 3,622 | ||||||
GNMA CMO, Ser 2010-H26, Cl LF | ||||||||
0.873%, 08/20/2058 (B) | 4,781 | 4,733 | ||||||
GNMA CMO, Ser 2011-142, Cl IO, IO | ||||||||
0.810%, 09/16/2046 (B) | 22,931 | 634 | ||||||
GNMA CMO, Ser 2011-146, Cl EI, IO | ||||||||
5.000%, 11/16/2041 | 86 | 19 | ||||||
GNMA CMO, Ser 2011-H09, Cl AF | ||||||||
1.031%, 03/20/2061 (B) | 1,353 | 1,347 | ||||||
GNMA CMO, Ser 2012-112, Cl IO, IO | ||||||||
0.359%, 02/16/2053 (B) | 7,178 | 201 | ||||||
GNMA CMO, Ser 2012-124, Cl AS, IO | ||||||||
5.658%, 10/16/2042 (B) | 1,195 | 228 | ||||||
GNMA CMO, Ser 2012-142, Cl IO, IO | ||||||||
1.077%, 04/16/2054 (B) | 20,322 | 987 | ||||||
| Description | Face Amount ($ Thousands) | Market Value ($ Thousands) | ||||||
GNMA CMO, Ser 2012-27, Cl IO, IO | ||||||||
1.072%, 04/16/2053 (B) | $ | 11,343 | $ | 484 | ||||
GNMA CMO, Ser 2012-66, Cl CI, IO | ||||||||
3.500%, 02/20/2038 | 1,490 | 139 | ||||||
GNMA CMO, Ser 2012-98, Cl SA, IO | ||||||||
5.666%, 08/16/2042 (B) | 993 | 161 | ||||||
GNMA CMO, Ser 2013-145, Cl IO, IO | ||||||||
1.073%, 09/16/2044 (B) | 9,598 | 532 | ||||||
GNMA CMO, Ser 2013-163, Cl IO, IO | ||||||||
1.166%, 02/16/2046 (B) | 12,635 | 789 | ||||||
GNMA CMO, Ser 2013-178, Cl IO, IO | ||||||||
0.793%, 06/16/2055 (B) | 5,861 | 240 | ||||||
GNMA CMO, Ser 2013-63, Cl IO, IO | ||||||||
0.769%, 09/16/2051 (B) | 8,541 | 457 | ||||||
GNMA CMO, Ser 2013-H01, Cl TA | ||||||||
1.031%, 01/20/2063 (B) | 1,293 | 1,294 | ||||||
GNMA CMO, Ser 2013-H01, Cl JA | ||||||||
0.851%, 01/20/2063 (B) | 1,173 | 1,159 | ||||||
GNMA CMO, Ser 2014-124, Cl IE, IO | ||||||||
0.796%, 05/16/2054 (B) | 9,733 | 471 | ||||||
GNMA CMO, Ser 2014-186, Cl IO, IO | ||||||||
0.823%, 08/16/2054 (B) | 15,640 | 886 | ||||||
GNMA CMO, Ser 2014-47, Cl IA, IO | ||||||||
0.872%, 02/16/2048 (B) | 2,999 | 139 | ||||||
GNMA CMO, Ser 2014-50, Cl IO, IO | ||||||||
0.936%, 09/16/2055 (B) | 9,303 | 540 | ||||||
GNMA CMO, Ser 2014-H04, Cl FB | ||||||||
1.173%, 02/20/2064 (B) | 2,538 | 2,540 | ||||||
GNMA CMO, Ser 2015-167, Cl OI, IO | ||||||||
4.000%, 04/16/2045 | 697 | 156 | ||||||
GNMA CMO, Ser 2016-128, Cl IO, IO | ||||||||
1.034%, 09/16/2056 (B) | 15,444 | 1,290 | ||||||
GNMA CMO, Ser 2016-135, Cl SB, IO | ||||||||
5.558%, 10/16/2046 (B) | 700 | 197 | ||||||
GNMA CMO, Ser 2016-84, Cl IG, IO | ||||||||
4.500%, 11/15/2045 | 93 | 19 | ||||||
GNMA TBA | ||||||||
4.000%, 12/01/2039 | 2,600 | 2,759 | ||||||
3.500%, 12/15/2041 | 34,700 | 36,129 | ||||||
3.000%, 12/01/2042 | 81,965 | 83,233 | ||||||
NCUA Guaranteed Notes CMO, | ||||||||
0.977%, 10/07/2020 (B) | 5,169 | 5,175 | ||||||
NCUA Guaranteed Notes CMO, | ||||||||
0.877%, 11/06/2017 (B) | 1,886 | 1,886 | ||||||
NCUA Guaranteed Notes CMO, | ||||||||
1.087%, 12/08/2020 (B) | 370 | 370 | ||||||
| SEI Institutional Investments Trust / Semi-Annual Report / November 30, 2016 | 71 |
SCHEDULE OF INVESTMENTS (Unaudited)
Core Fixed Income Fund (Continued)
November 30, 2016
| Description | Face Amount ($ Thousands) | Market Value ($ Thousands) | ||||||
NCUA Guaranteed Notes CMO, | ||||||||
1.087%, 12/08/2020 (B) | $ | 333 | $ | 335 | ||||
NCUA Guaranteed Notes CMO, | ||||||||
0.976%, 01/08/2020 (B) | 40 | 40 | ||||||
NCUA Guaranteed Notes CMO, | ||||||||
0.927%, 02/06/2020 (B) | 492 | 492 | ||||||
|
| |||||||
| 1,383,812 | ||||||||
|
| |||||||
Non-Agency Mortgage-Backed Obligations — 4.7% |
| |||||||
Alternative Loan Trust, | ||||||||
0.000%, 11/25/2031 (A) | 91 | 80 | ||||||
American Home Mortgage Investment | ||||||||
1.094%, 06/25/2045 (B) | 5,300 | 5,076 | ||||||
ASG Resecuritization Trust, | ||||||||
2.428%, 03/26/2037 (B) (C) | 330 | 328 | ||||||
ASG Resecuritization Trust, | ||||||||
3.197%, 11/28/2035 (B) (C) | 200 | 197 | ||||||
Banc of America Alternative Loan Trust, Ser 2006-8, Cl 3A1 | ||||||||
6.022%, 11/25/2021 (B) | 55 | 51 | ||||||
Banc of America Alternative Loan Trust, Ser 2007-1, Cl 2A1 | ||||||||
6.244%, 04/25/2037 (B) | 182 | 163 | ||||||
Banc of America Funding, | ||||||||
6.500%, 06/25/2032 | 15 | 16 | ||||||
Banc of America Funding, | ||||||||
5.750%, 09/20/2034 | 177 | 183 | ||||||
Banc of America Funding, | ||||||||
3.083%, 12/20/2034 (B) | 73 | 71 | ||||||
Banc of America Funding, | ||||||||
3.235%, 04/20/2035 (B) | 2,218 | 1,951 | ||||||
Banc of America Funding, | ||||||||
0.852%, 07/20/2036 (B) | 6,325 | 6,197 | ||||||
Banc of America Funding, | ||||||||
5.003%, 08/26/2035 (B) (C) | 95 | 95 | ||||||
Banc of America Funding, | ||||||||
0.749%, 03/27/2036 (B) (C) | 5,177 | 4,996 | ||||||
Banc of America Mortgage Securities, Ser 2003-A, Cl 2A2 | ||||||||
3.286%, 02/25/2033 (B) | 2 | 2 | ||||||
Banc of America Mortgage Securities, Ser 2003-E, Cl 2A2 | ||||||||
3.276%, 06/25/2033 (B) | 125 | 125 | ||||||
Banc of America Mortgage Securities, Ser 2003-I, Cl 2A6 | ||||||||
3.282%, 10/25/2033 (B) | 4,795 | 4,851 | ||||||
| Description | Face Amount ($ Thousands) | Market Value ($ Thousands) | ||||||
Banc of America Re-Remic Trust, | ||||||||
2.959%, 12/10/2030 (C) | $ | 242 | $ | 245 | ||||
Bayview Commercial Asset Trust, | ||||||||
0.822%, 12/25/2036 (B) (C) | 1,268 | 1,088 | ||||||
BB-UBS Trust, Ser 2012-TFT, Cl A | ||||||||
2.892%, 06/05/2030 (C) | 1,500 | 1,488 | ||||||
BCAP LLC Trust, | ||||||||
5.500%, 11/26/2034 (C) | 210 | 216 | ||||||
BCAP LLC Trust, | ||||||||
3.041%, 04/26/2035 (B) (C) | 11 | 11 | ||||||
BCAP LLC Trust, | ||||||||
3.087%, 05/26/2035 (B) (C) | 249 | 246 | ||||||
BCAP LLC Trust, | ||||||||
0.684%, 05/28/2036 (B) (C) | 57 | 56 | ||||||
Bear Stearns Adjustable Rate Mortgage Trust, Ser 2004-2, Cl 14A | ||||||||
3.367%, 05/25/2034 (B) | 46 | 46 | ||||||
Bear Stearns Adjustable Rate Mortgage Trust, | ||||||||
2.808%, 05/25/2034 (B) | 132 | 122 | ||||||
Bear Stearns Adjustable Rate Mortgage Trust, | ||||||||
2.580%, 08/25/2035 (B) | 165 | 166 | ||||||
Bear Stearns Alt-A Trust, | ||||||||
1.274%, 11/25/2034 (B) | 20 | 19 | ||||||
Bear Stearns Commercial Mortgage Securities, Ser 2005-PWR8, Cl X1, IO | ||||||||
0.402%, 06/11/2041 (B) (C) | 153 | — | ||||||
CD Commercial Mortgage Trust, | ||||||||
0.023%, 01/15/2046 (B) (C) | 5,319 | — | ||||||
CD Commercial Mortgage Trust, | ||||||||
0.387%, 12/11/2049 (B) (C) | 12,286 | 6 | ||||||
CD Commercial Mortgage Trust, | ||||||||
1.443%, 08/10/2021 | 534 | 528 | ||||||
CD Commercial Mortgage Trust, | ||||||||
2.622%, 07/10/2026 | 1,686 | 1,654 | ||||||
CD Commercial Mortgage Trust, | ||||||||
3.526%, 11/01/2049 | 1,280 | 1,318 | ||||||
CFCRE Commercial Mortgage Trust, | ||||||||
4.961%, 04/15/2044 (B) (C) | 1,329 | 1,441 | ||||||
CFCRE Commercial Mortgage Trust, | ||||||||
1.793%, 01/10/2021 | 915 | 916 | ||||||
| 72 | SEI Institutional Investments Trust / Semi-Annual Report / November 30, 2016 |
| Description | Face Amount ($ Thousands) | Market Value ($ Thousands) | ||||||
CFCRE Commercial Mortgage Trust, | ||||||||
3.091%, 05/10/2058 | $ | 665 | $ | 667 | ||||
CGBAM Commercial Mortgage Trust, | ||||||||
5.938%, 11/15/2021 (B) (C) | 4,030 | 4,066 | ||||||
CG-CCRE Commercial Mortgage Trust, Ser 2014-FL1, Cl A | ||||||||
1.485%, 06/15/2031 (B) (C) | 1,042 | 1,041 | ||||||
Chase Mortgage Finance, | ||||||||
3.023%, 02/25/2037 (B) | 95 | 94 | ||||||
Chase Mortgage Finance, | ||||||||
3.088%, 02/25/2037 (B) | 107 | 107 | ||||||
Chase Mortgage Finance, | ||||||||
3.105%, 07/25/2037 (B) | 172 | 171 | ||||||
Chevy Chase Funding LLC Mortgage-Backed Certificates, | ||||||||
0.924%, 10/25/2034 (B) | 3,971 | 3,681 | ||||||
Chevy Chase Funding LLC Mortgage-Backed Certificates, | ||||||||
0.922%, 01/25/2035 (B) (C) | 3,721 | 3,356 | ||||||
CHL Mortgage Pass-Through Trust, | ||||||||
2.947%, 08/25/2034 (B) | 185 | 178 | ||||||
CHL Mortgage Pass-Through Trust, | ||||||||
5.250%, 12/25/2027 | 293 | 279 | ||||||
Citigroup Commercial Mortgage Trust, Ser 2013-375P, Cl A | ||||||||
3.251%, 05/10/2035 (C) | 1,465 | 1,501 | ||||||
Citigroup Commercial Mortgage Trust, Ser 2013-GC11, Cl A2 | ||||||||
1.987%, 04/10/2046 | 1,402 | 1,409 | ||||||
Citigroup Commercial Mortgage Trust, Ser 2014-GC25, Cl AS | ||||||||
4.017%, 10/10/2047 | 1,290 | 1,346 | ||||||
Citigroup Commercial Mortgage Trust, Ser 2016-GC36, Cl A5 | ||||||||
3.616%, 02/10/2049 | 1,642 | 1,694 | ||||||
Citigroup Global Markets Mortgage Securities VII, | ||||||||
3.240%, 09/25/2033 (B) | 180 | 179 | ||||||
Citigroup Mortgage Loan Trust, | ||||||||
3.257%, 02/25/2034 (B) | 36 | 35 | ||||||
Citigroup Mortgage Loan Trust, | ||||||||
2.976%, 05/25/2034 (B) (C) | 283 | 285 | ||||||
Citigroup Mortgage Loan Trust, | ||||||||
2.796%, 08/25/2034 (B) | 94 | 90 | ||||||
| Description | Face Amount ($ Thousands) | Market Value ($ Thousands) | ||||||
Citigroup Mortgage Loan Trust, | ||||||||
3.000%, 11/25/2038 (B) (C) | $ | 216 | $ | 215 | ||||
Citigroup Mortgage Loan Trust, | ||||||||
2.784%, 09/25/2033 (B) (C) | 230 | 231 | ||||||
COMM Mortgage Trust, | ||||||||
3.830%, 07/10/2046 (C) | 202 | 206 | ||||||
COMM Mortgage Trust, | ||||||||
1.801%, 10/15/2045 | 465 | 466 | ||||||
COMM Mortgage Trust, | ||||||||
2.350%, 05/15/2045 | 1,344 | 1,347 | ||||||
COMM Mortgage Trust, | ||||||||
3.147%, 08/15/2045 | 209 | 217 | ||||||
COMM Mortgage Trust, | ||||||||
4.353%, 08/10/2030 (C) | 1,345 | 1,463 | ||||||
COMM Mortgage Trust, | ||||||||
4.046%, 10/10/2046 | 155 | 166 | ||||||
COMM Mortgage Trust, | ||||||||
2.972%, 08/10/2046 | 533 | 545 | ||||||
COMM Mortgage Trust, | ||||||||
4.300%, 10/10/2046 | 220 | 235 | ||||||
COMM Mortgage Trust, | ||||||||
4.762%, 10/10/2046 (B) | 190 | 206 | ||||||
COMM Mortgage Trust, | ||||||||
5.083%, 10/10/2046 (B) | 90 | 94 | ||||||
COMM Mortgage Trust, | ||||||||
0.719%, 03/10/2046 | 180 | 179 | ||||||
COMM Mortgage Trust, | ||||||||
2.122%, 03/10/2046 | 2,975 | 2,996 | ||||||
COMM Mortgage Trust, | ||||||||
5.009%, 08/10/2046 (B) (C) | 1,150 | 1,258 | ||||||
COMM Mortgage Trust, | ||||||||
2.928%, 02/10/2047 | 119 | 121 | ||||||
COMM Mortgage Trust, | ||||||||
1.559%, 03/10/2047 (B) | 15,312 | 998 | ||||||
COMM Mortgage Trust, | ||||||||
3.694%, 08/10/2047 | 1,980 | 2,053 | ||||||
COMM Mortgage Trust, | ||||||||
3.548%, 09/10/2047 | 504 | 528 | ||||||
COMM Mortgage Trust, | ||||||||
3.387%, 12/10/2047 | 292 | 303 | ||||||
COMM Mortgage Trust, | ||||||||
4.048%, 12/10/2047 | 1,653 | 1,705 | ||||||
COMM Mortgage Trust, | ||||||||
3.178%, 02/10/2035 (C) | 1,460 | 1,470 | ||||||
COMM Mortgage Trust, | ||||||||
3.373%, 04/10/2025 | 718 | 741 | ||||||
COMM Mortgage Trust, | ||||||||
2.870%, 02/10/2048 | 135 | 138 | ||||||
| SEI Institutional Investments Trust / Semi-Annual Report / November 30, 2016 | 73 |
SCHEDULE OF INVESTMENTS (Unaudited)
Core Fixed Income Fund (Continued)
November 30, 2016
| Description | Face Amount ($ Thousands) | Market Value ($ Thousands) | ||||||
COMM Mortgage Trust, | ||||||||
3.545%, 02/10/2036 (C) | $ | 1,470 | $ | 1,514 | ||||
COMM Mortgage Trust, | ||||||||
2.972%, 10/10/2049 | 728 | 729 | ||||||
COMM Mortgage Trust, | ||||||||
2.270%, 10/15/2018 | 1,700 | 1,704 | ||||||
Commercial Mortgage Pass-Through Certificates, Ser 2012-CR3, Cl A3 | ||||||||
2.822%, 11/15/2045 | 90 | 91 | ||||||
Commercial Mortgage Pass-Through Certificates, Ser 2013-CR12, Cl A1 | ||||||||
1.295%, 10/10/2046 | 111 | 111 | ||||||
Commercial Mortgage Pass-Through Certificates, Ser 2013-WWP, Cl A2 | ||||||||
3.424%, 03/10/2031 (C) | 471 | 487 | ||||||
Commercial Mortgage Pass-Through Certificates, Ser 2014-277P, Cl A | ||||||||
3.732%, 08/10/2049 (B) (C) | 1,350 | 1,407 | ||||||
Commercial Mortgage Pass-Through Certificates, Ser 2014-CR19, Cl A5 | ||||||||
3.796%, 08/10/2047 | 3,343 | 3,507 | ||||||
Commercial Mortgage Trust, | ||||||||
1.468%, 10/10/2046 | 319 | 318 | ||||||
Countrywide Alternative Loan Trust, Ser 2004- 27CB, Cl A1 | ||||||||
6.000%, 12/25/2034 | 908 | 898 | ||||||
Countrywide Alternative Loan Trust, Ser 2004- J6, Cl 2A1 | ||||||||
6.500%, 11/25/2031 | 382 | 399 | ||||||
Countrywide Alternative Loan Trust, Ser 2005- 27, Cl 3A2 | ||||||||
1.624%, 08/25/2035 (B) | 391 | 236 | ||||||
Credit Suisse First Boston Mortgage Securities, Ser 2003-27, Cl 5A3 | ||||||||
5.250%, 11/25/2033 | 280 | 283 | ||||||
Credit Suisse First Boston Mortgage Securities, Ser 2003-29, Cl 5A1 | ||||||||
7.000%, 12/25/2033 | 138 | 146 | ||||||
Credit Suisse Mortgage Capital Certificates, Ser 2011-16R, Cl 7A3 | ||||||||
3.249%, 12/27/2036 (B) (C) | 48 | 48 | ||||||
Credit Suisse Mortgage Capital Certificates, Ser 2011-6R, Cl 3A1 | ||||||||
3.243%, 07/28/2036 (B) (C) | 83 | 83 | ||||||
CSAIL Commercial Mortgage Trust, Ser 2015- C4, Cl A4 | ||||||||
3.808%, 11/15/2048 | 639 | 668 | ||||||
CSAIL Commercial Mortgage Trust, Ser 2016- C5, Cl ASB | ||||||||
3.533%, 11/15/2048 | 327 | 339 | ||||||
| Description | Face Amount ($ Thousands) | Market Value ($ Thousands) | ||||||
CSAIL Commercial Mortgage Trust, Ser 2016- C7, Cl A5 | ||||||||
3.196%, 11/15/2049 | $ | 684 | $ | 692 | ||||
CSMC Trust, Ser 2015-5R, Cl 1A1 | ||||||||
1.066%, 09/27/2046 (C) | 5,760 | 5,589 | ||||||
CSMC Trust, Ser 2015-GLPA, Cl A | ||||||||
3.881%, 11/15/2037 (C) | 210 | 222 | ||||||
CSMC Trust, Ser 2016-BDWN, Cl A | ||||||||
3.435%, 02/15/2029 (B) (C) | 4,260 | 4,283 | ||||||
CSMC Trust, Ser 2016-BDWN, Cl B | ||||||||
5.008%, 02/15/2029 (B) (C) | 1,720 | 1,732 | ||||||
DBRR Trust, Ser 2011-LC2, Cl A4A | ||||||||
4.537%, 07/12/2044 (B) (C) | 2,845 | 3,027 | ||||||
DSLA Mortgage Loan Trust, | ||||||||
1.328%, 11/19/2044 (B) | 926 | 807 | ||||||
FHLMC Structured Agency Credit Risk Debt Notes, Ser 2014-DN2, Cl M2 | ||||||||
2.184%, 04/25/2024 (B) | 12,890 | 12,950 | ||||||
FHLMC Structured Agency Credit Risk Debt Notes, Ser 2014-DN3, Cl M2 | ||||||||
2.984%, 08/25/2024 (B) | 718 | 720 | ||||||
FHLMC Structured Agency Credit Risk Debt Notes, Ser 2016-DNA1, Cl M2 | ||||||||
3.325%, 07/25/2028 (B) | 3,030 | 3,110 | ||||||
First Horizon Alternative Mortgage Securities, Ser 2004-AA3, Cl A1 | ||||||||
2.779%, 09/25/2034 (B) | 225 | 218 | ||||||
FREMF Mortgage Trust, | ||||||||
0.200%, 05/25/2045 (C) | 27,385 | 233 | ||||||
GE Business Loan Trust, | ||||||||
0.708%, 04/16/2035 (B) (C) | 898 | 847 | ||||||
GMAC Commercial Mortgage Securities, Ser 2006-C1, Cl AM | ||||||||
5.290%, 11/10/2045 (B) | 910 | 909 | ||||||
GS Mortgage Securities II, | ||||||||
2.999%, 08/10/2044 | 83 | 83 | ||||||
GS Mortgage Securities II, | ||||||||
2.706%, 12/10/2027 (C) | 266 | 270 | ||||||
GS Mortgage Securities Trust, | ||||||||
0.652%, 11/10/2039 (B) (C) | 1,790 | — | ||||||
GS Mortgage Securities Trust, | ||||||||
1.372%, 08/10/2044 (B) (C) | 1,321 | 67 | ||||||
GS Mortgage Securities Trust, | ||||||||
2.935%, 05/10/2045 | 206 | 210 | ||||||
GS Mortgage Securities Trust, | ||||||||
2.318%, 05/10/2045 | 759 | 761 | ||||||
| 74 | SEI Institutional Investments Trust / Semi-Annual Report / November 30, 2016 |
| Description | Face Amount ($ Thousands) | Market Value ($ Thousands) | ||||||
GS Mortgage Securities Trust, | ||||||||
3.033%, 11/10/2018 | $ | 647 | $ | 662 | ||||
GS Mortgage Securities Trust, | ||||||||
1.264%, 11/10/2046 | 36 | 36 | ||||||
GS Mortgage Securities Trust, | ||||||||
5.161%, 11/10/2046 (B) | 390 | 432 | ||||||
GS Mortgage Securities Trust, | ||||||||
1.034%, 07/10/2048 (B) | 38,687 | 1,984 | ||||||
GS Mortgage Securities Trust, | ||||||||
3.278%, 10/10/2048 | 760 | 779 | ||||||
GS Mortgage Securities Trust, | ||||||||
2.777%, 10/10/2049 | 1,102 | 1,096 | ||||||
GS Mortgage Securities Trust, | ||||||||
2.850%, 10/10/2049 | 734 | 716 | ||||||
GS Mortgage Securities Trust, | ||||||||
3.442%, 11/10/2049 | 949 | 977 | ||||||
GSMPS Mortgage Loan Trust, | ||||||||
8.000%, 09/19/2027 (B) (C) | 2 | 2 | ||||||
GSMPS Mortgage Loan Trust, | ||||||||
4.173%, 09/25/2035 (B) (C) | 278 | 32 | ||||||
GSR Mortgage Loan Trust, | ||||||||
6.000%, 09/25/2034 | 151 | 154 | ||||||
GSR Mortgage Loan Trust, | ||||||||
5.500%, 01/25/2037 | 37 | 35 | ||||||
Homestar Mortgage Acceptance, | ||||||||
0.984%, 10/25/2034 (B) | 207 | 205 | ||||||
Hudson Yards, Ser 2016-10HY, Cl A | ||||||||
2.835%, 08/10/2026 | 1,200 | 1,165 | ||||||
Impac CMB Trust, Ser 2005-4, Cl 2A1 | ||||||||
1.184%, 05/25/2035 (B) | 171 | 164 | ||||||
Impac CMB Trust, Ser 2007-A, Cl M1 | ||||||||
0.934%, 05/25/2037 (B)(C) | 2,018 | 1,874 | ||||||
Impac Secured Assets Trust, | ||||||||
0.884%, 08/25/2036 (B) | 199 | 196 | ||||||
Impact Funding Affordable Multifamily Housing Mortgage Loan Trust, Ser 2010-1, Cl A1 | ||||||||
5.314%, 01/25/2051 (C) | 4,075 | 4,558 | ||||||
Indymac Index Mortgage Loan Trust, Ser 2004- AR7, Cl A2 | ||||||||
1.394%, 09/25/2034 (B) | 24 | 22 | ||||||
Indymac Index Mortgage Loan Trust, Ser 2004- AR8, Cl 2A2A | ||||||||
1.334%, 11/25/2034 (B) | 40 | 34 | ||||||
| Description | Face Amount ($ Thousands) | Market Value ($ Thousands) | ||||||
JPMBB Commercial Mortgage Securities Trust, | ||||||||
3.761%, 08/15/2046 (B) | $ | 530 | $ | 562 | ||||
JPMBB Commercial Mortgage Securities Trust, | ||||||||
2.977%, 11/15/2045 | 619 | 633 | ||||||
JPMBB Commercial Mortgage Securities Trust, | ||||||||
5.046%, 11/15/2045 (B) | 410 | 436 | ||||||
JPMBB Commercial Mortgage Securities Trust, | ||||||||
4.887%, 01/15/2047 (B) | 230 | 252 | ||||||
JPMBB Commercial Mortgage Securities Trust, | ||||||||
3.775%, 08/15/2047 | 1,077 | 1,131 | ||||||
JPMBB Commercial Mortgage Securities Trust, | ||||||||
4.560%, 09/15/2047 (B) | 750 | 740 | ||||||
JPMBB Commercial Mortgage Securities Trust, | ||||||||
2.912%, 10/15/2048 | 2,901 | 2,866 | ||||||
JPMBB Commercial Mortgage Securities Trust, | ||||||||
4.226%, 07/15/2048 (B) | 1,296 | 1,370 | ||||||
JPMBB Commercial Mortgage Securities Trust, | ||||||||
3.822%, 07/15/2048 | 1,330 | 1,394 | ||||||
JPMBB Commercial Mortgage Securities Trust, | ||||||||
3.801%, 08/15/2048 | 4,230 | 4,424 | ||||||
JPMBB Commercial Mortgage Securities Trust, | ||||||||
3.316%, 03/15/2049 | 1,391 | 1,429 | ||||||
JPMDB Commercial Mortgage Securities Trust, | ||||||||
2.954%, 06/15/2049 | 1,340 | 1,345 | ||||||
JPMDB Commercial Mortgage Securities Trust, | ||||||||
3.141%, 12/15/2049 | 745 | 743 | ||||||
JPMorgan Chase Commercial Mortgage Securities Trust, | ||||||||
5.115%, 07/15/2041 | 20 | 20 | ||||||
JPMorgan Chase Commercial Mortgage Securities Trust, | ||||||||
0.261%, 06/12/2043 (B) | 7,810 | 12 | ||||||
JPMorgan Chase Commercial Mortgage Securities Trust, | ||||||||
5.372%, 05/15/2047 | 2,000 | 1,999 | ||||||
JPMorgan Chase Commercial Mortgage Securities Trust, | ||||||||
0.693%, 05/15/2047 (B) | 251 | 249 | ||||||
| SEI Institutional Investments Trust / Semi-Annual Report / November 30, 2016 | 75 |
SCHEDULE OF INVESTMENTS (Unaudited)
Core Fixed Income Fund (Continued)
November 30, 2016
| Description | Face Amount ($ Thousands) | Market Value ($ Thousands) | ||||||
JPMorgan Chase Commercial Mortgage Securities Trust, | ||||||||
3.616%, 11/15/2043 (C) | $ | 521 | $ | 529 | ||||
JPMorgan Chase Commercial Mortgage Securities Trust, | ||||||||
4.311%, 08/05/2032 (C) | 2,601 | 2,744 | ||||||
JPMorgan Chase Commercial Mortgage Securities Trust, | ||||||||
3.300%, 08/05/2032 (C) | 524 | 535 | ||||||
JPMorgan Chase Commercial Mortgage Securities Trust, | ||||||||
4.106%, 07/15/2046 (C) | 2,965 | 3,058 | ||||||
JPMorgan Chase Commercial Mortgage Securities Trust, | ||||||||
1.677%, 12/15/2047 | 509 | 509 | ||||||
JPMorgan Chase Commercial Mortgage Securities Trust, | ||||||||
3.414%, 01/15/2046 | 978 | 1,022 | ||||||
JPMorgan Chase Commercial Mortgage Securities Trust, | ||||||||
2.872%, 07/15/2047 | 635 | 651 | ||||||
JPMorgan Chase Commercial Mortgage Securities Trust, | ||||||||
3.733%, 01/15/2049 | 315 | 332 | ||||||
JPMorgan Chase Commercial Mortgage Securities Trust, | ||||||||
2.713%, 09/15/2025 | 993 | 982 | ||||||
JPMorgan Chase Commercial Mortgage Securities Trust, | ||||||||
1.324%, 08/15/2049 | 716 | 709 | ||||||
JPMorgan Chase Commercial Mortgage Securities Trust, | ||||||||
2.870%, 08/15/2026 | 1,310 | 1,276 | ||||||
JPMorgan Mortgage Trust, | ||||||||
2.641%, 06/25/2034 (B) | 729 | 721 | ||||||
JPMorgan Mortgage Trust, | ||||||||
3.100%, 02/25/2035 (B) | 264 | 269 | ||||||
JPMorgan Mortgage Trust, | ||||||||
3.129%, 04/25/2035 (B) | 96 | 96 | ||||||
JPMorgan Mortgage Trust, | ||||||||
2.971%, 11/25/2033 (B) | 412 | 417 | ||||||
JPMorgan Mortgage Trust, | ||||||||
3.182%, 08/25/2034 (B) | 387 | 388 | ||||||
JPMorgan Resecuritization Trust, Ser 2009-6, Cl 4A1 | ||||||||
3.079%, 09/26/2036 (B) (C) | 19 | 19 | ||||||
LB-UBS Commercial Mortgage Trust, Ser 2006- C1, Cl XCL, IO | ||||||||
0.265%, 02/15/2041 (B) (C) | 3,789 | — | ||||||
| Description | Face Amount ($ Thousands) | Market Value ($ Thousands) | ||||||
LB-UBS Commercial Mortgage Trust, | ||||||||
6.114%, 04/15/2041 (B) | $ | 78 | $ | 81 | ||||
Liberty Street Trust, Ser 2016-225L, Cl A | ||||||||
3.597%, 02/10/2036 (C) | 1,465 | 1,514 | ||||||
Master Adjustable Rate Mortgages Trust, Ser 2004-13, Cl 3A7A | ||||||||
3.048%, 11/21/2034 (B) | 4,448 | 4,552 | ||||||
Master Adjustable Rate Mortgages Trust, Ser 2004-13, Cl 3A7 | ||||||||
3.048%, 11/21/2034 (B) | 605 | 617 | ||||||
Master Alternative Loans Trust, | ||||||||
5.500%, 05/25/2034 | 694 | 694 | ||||||
Master Resecuritization Trust, | ||||||||
0.000%, 05/28/2035 (A) (C) | 39 | 31 | ||||||
MASTR Adjustable Rate Mortgages Trust, Ser 2004-5, Cl 3A1 | ||||||||
1.625%, 06/25/2034 (B) | 8 | 7 | ||||||
MASTR Alternative Loan Trust, | ||||||||
6.250%, 07/25/2036 | 346 | 293 | ||||||
MASTR Reperforming Loan Trust, | ||||||||
6.000%, 08/25/2034 (C) | 1,761 | 1,662 | ||||||
MASTR Reperforming Loan Trust, | ||||||||
0.884%, 05/25/2035 (B) (C) | 345 | 268 | ||||||
MASTR Seasoned Securitization | ||||||||
3.051%, 10/25/2032 (B) | 7 | 7 | ||||||
MASTR Seasoned Securitization Trust, Ser 2005-1, Cl 4A1 | ||||||||
2.856%, 10/25/2032 (B) | 62 | 62 | ||||||
Merrill Lynch Mortgage Investors Trust, Ser 2003-A4, Cl 2A | ||||||||
3.173%, 07/25/2033 (B) | 72 | 70 | ||||||
Merrill Lynch Mortgage Investors Trust, Ser 2004-1, Cl 2A1 | ||||||||
2.720%, 12/25/2034 (B) | 265 | 265 | ||||||
Merrill Lynch Mortgage Investors Trust, Ser 2004-A1, Cl 4A | ||||||||
2.875%, 02/25/2034 (B) | 345 | 346 | ||||||
Merrill Lynch Mortgage Investors Trust, Ser 2004-A1, Cl 2A1 | ||||||||
2.896%, 02/25/2034 (B) | 89 | 89 | ||||||
Merrill Lynch Mortgage Investors Trust, Ser 2004-A4, Cl A2 | ||||||||
2.854%, 08/25/2034 (B) | 135 | 138 | ||||||
Merrill Lynch Mortgage Investors Trust, Ser 2004-D, Cl A2 | ||||||||
1.949%, 09/25/2029 (B) | 175 | 168 | ||||||
| 76 | SEI Institutional Investments Trust / Semi-Annual Report / November 30, 2016 |
| Description | Face Amount ($ Thousands) | Market Value ($ Thousands) | ||||||
Merrill Lynch Mortgage Investors Trust, Ser 2006-1, Cl 1A | ||||||||
2.975%, 02/25/2036 (B) | $ | 170 | $ | 157 | ||||
ML-CFC Commercial Mortgage Trust, Ser 2006- 4, Cl XC, IO | ||||||||
0.666%, 12/12/2049 (B) (C) | 1,472 | 2 | ||||||
Morgan Stanley Bank of America Merrill Lynch Trust, Ser 2012-C5, Cl XA, IO | ||||||||
1.722%, 08/15/2045 (B) (C) | 4,582 | 251 | ||||||
Morgan Stanley Bank of America Merrill Lynch Trust, Ser 2013-C10, Cl A2 | ||||||||
2.964%, 06/15/2018 | 418 | 424 | ||||||
Morgan Stanley Bank of America Merrill Lynch Trust, Ser 2013-C10, Cl A1 | ||||||||
1.394%, 07/15/2046 | 222 | 222 | ||||||
Morgan Stanley Bank of America Merrill Lynch Trust, Ser 2013-C10, Cl A4 | ||||||||
4.084%, 07/15/2046 (B) | 1,600 | 1,726 | ||||||
Morgan Stanley Bank of America Merrill Lynch Trust, Ser 2013-C7, Cl AS | ||||||||
3.214%, 02/15/2046 | 207 | 209 | ||||||
Morgan Stanley Bank of America Merrill Lynch Trust, Ser 2013-C9, Cl A2 | ||||||||
1.970%, 05/15/2046 | 536 | 538 | ||||||
Morgan Stanley Bank of America Merrill Lynch Trust, Ser 2016-C28, Cl ASB | ||||||||
3.288%, 01/15/2049 | 680 | 699 | ||||||
Morgan Stanley Bank of America Merrill Lynch Trust, Ser 2016-C30, Cl ASB | ||||||||
2.729%, 10/15/2025 | 3,493 | 3,439 | ||||||
Morgan Stanley Capital I Trust, | ||||||||
3.476%, 06/15/2044 (C) | 193 | 193 | ||||||
Morgan Stanley Capital I Trust, | ||||||||
1.130%, 11/15/2049 (B) | 16,510 | 1,256 | ||||||
Morgan Stanley Capital I Trust, | ||||||||
1.445%, 04/15/2021 | 1,641 | 1,626 | ||||||
Morgan Stanley Capital I Trust, | ||||||||
2.606%, 01/15/2021 | 756 | 741 | ||||||
Morgan Stanley Capital I Trust, | ||||||||
1.711%, 03/15/2049 | 889 | 882 | ||||||
Morgan Stanley Capital I, | ||||||||
0.179%, 02/12/2044 (B) (C) | 15,103 | 1 | ||||||
Morgan Stanley Mortgage Loan Trust, Ser 2004-3, Cl 4A | ||||||||
5.672%, 04/25/2034 (B) | 251 | 262 | ||||||
| Description | Face Amount ($ Thousands) | Market Value ($ Thousands) | ||||||
Morgan Stanley Mortgage Loan Trust, | ||||||||
5.858%, 01/25/2047 | $ | 20 | $ | 13 | ||||
Mortgage Loan Resecuritization Trust, Ser 2009-RS1, Cl A85 | ||||||||
0.875%, 04/16/2036 (B) (C) | 5,954 | 4,918 | ||||||
Mortgage Repurchase Agreement Financing Trust Series, Ser 2016-4, Cl A1 | ||||||||
1.737%, 05/10/2019 (B) (C) | 2,040 | 2,040 | ||||||
MSCG Trust, Ser 2015-ALDR, Cl A2 | ||||||||
3.577%, 06/07/2035 (B) (C) | 2,030 | 2,029 | ||||||
New York Mortgage Trust, | ||||||||
3.011%, 05/25/2036 (B) | 261 | 235 | ||||||
Nomura Resecuritization Trust, | ||||||||
0.304%, 07/26/2036 (B) (C) | 815 | 809 | ||||||
OBP Depositor LLC Trust, | ||||||||
4.646%, 07/15/2045 (C) | 1,195 | 1,276 | ||||||
Opteum Mortgage Acceptance Asset-Backed Pass-Through Certificates, | ||||||||
1.897%, 02/25/2035 (B) | 4,462 | 4,181 | ||||||
Prime Mortgage Trust, | ||||||||
0.000%, 02/25/2034 (A) | 17 | 14 | ||||||
Prime Mortgage Trust, | ||||||||
6.000%, 02/25/2034 | 94 | 98 | ||||||
Prime Mortgage Trust, | ||||||||
5.500%, 05/25/2035 (C) | 1,621 | 1,506 | ||||||
RALI Trust, Ser 2004-QS7, Cl A4 | ||||||||
5.500%, 05/25/2034 | 1,016 | 1,032 | ||||||
RALI Trust, Ser 2005-QO2, Cl A1 | ||||||||
1.884%, 09/25/2045 (B) | 591 | 510 | ||||||
RALI Trust, Ser 2005-QO5, Cl A1 | ||||||||
1.524%, 01/25/2046 (B) | 860 | 638 | ||||||
RAMP Trust, Ser 2004-SL1, Cl A8 | ||||||||
6.500%, 11/25/2031 | 269 | 273 | ||||||
RAMP Trust, Ser 2005-SL1, Cl A5 | ||||||||
6.500%, 05/25/2032 | 24 | 23 | ||||||
RBS Commercial Funding Trust, | ||||||||
3.834%, 01/13/2032 (B) (C) | 1,380 | 1,452 | ||||||
Residential Asset Mortgage Products, | ||||||||
7.000%, 11/25/2031 | 69 | 72 | ||||||
Residential Asset Mortgage Products, | ||||||||
6.500%, 12/25/2031 | 362 | 367 | ||||||
Residential Asset Securitization Trust, | ||||||||
3.107%, 12/25/2034 (B) | 662 | 660 | ||||||
Sequoia Mortgage Trust, | ||||||||
1.245%, 01/20/2035 (B) | 276 | 253 | ||||||
| SEI Institutional Investments Trust / Semi-Annual Report / November 30, 2016 | 77 |
SCHEDULE OF INVESTMENTS (Unaudited)
Core Fixed Income Fund (Continued)
November 30, 2016
| Description | Face Amount ($ Thousands) | Market Value ($ Thousands) | ||||||
Springleaf Mortgage Loan Trust, | ||||||||
1.780%, 12/25/2065 (B) (C) | $ | 445 | $ | 443 | ||||
Structured Adjustable Rate Mortgage Loan Trust, Ser 2004-6, Cl 5A4 | ||||||||
2.811%, 06/25/2034 (B) | 1 | 1 | ||||||
Structured Adjustable Rate Mortgage Loan Trust, Ser 2005-19XS, Cl 1A1 | ||||||||
0.854%, 10/25/2035 (B) | 2,437 | 2,031 | ||||||
Structured Agency Credit Risk Debt Notes, Ser 2014-DN1, Cl M2 | ||||||||
2.734%, 02/25/2024 (B) | 1,580 | 1,607 | ||||||
Structured Asset Mortgage Investments II Trust, Ser 2005-AR1, Cl A1 | ||||||||
1.008%, 04/19/2035 (B) | 2,388 | 2,265 | ||||||
Structured Asset Mortgage Investments, | ||||||||
1.188%, 10/19/2034 (B) | 180 | 172 | ||||||
Structured Asset Securities Mortgage Pass- Through Certificates, | ||||||||
2.684%, 10/25/2031 (B) | 44 | 44 | ||||||
Structured Asset Securities Mortgage Pass- Through Certificates, | ||||||||
5.222%, 11/25/2033 (B) | 48 | 48 | ||||||
Structured Asset Securities Mortgage Pass- Through Certificates, | ||||||||
5.540%, 12/25/2033 | 315 | 322 | ||||||
Structured Asset Securities, | ||||||||
2.921%, 10/25/2033 (B) | 3,922 | 3,942 | ||||||
Structured Asset Securities, | ||||||||
2.856%, 12/25/2033 (B) | 90 | 90 | ||||||
Thornburg Mortgage Securities Trust, Ser 2003-4, Cl A1 | ||||||||
1.174%, 09/25/2043 (B) | 374 | 360 | ||||||
UBS Commercial Mortgage Trust, Ser 2012-C1, Cl XA, IO | ||||||||
2.089%, 05/10/2045 (B) (C) | 4,832 | 438 | ||||||
UBS-Barclays Commercial Mortgage Trust, Ser 2012-C2, Cl A2 | ||||||||
2.113%, 05/10/2063 | 930 | 934 | ||||||
UBS-Barclays Commercial Mortgage Trust, Ser 2012-C4, Cl A2 | ||||||||
1.712%, 12/10/2017 | 1,062 | 1,065 | ||||||
UBS-Barclays Commercial Mortgage Trust, Ser 2013-C6, Cl A2 | ||||||||
2.067%, 04/10/2046 | 250 | 250 | ||||||
VNO Mortgage Trust, | ||||||||
2.996%, 11/15/2030 (C) | 100 | 102 | ||||||
Wachovia Bank Commercial Mortgage Trust, Ser 2006-C26, Cl XC, IO | ||||||||
0.063%, 06/15/2045 (B) (C) | 29,812 | — | ||||||
WaMu Mortgage Pass-Through Certificates Trust, | ||||||||
2.789%, 01/25/2033 (B) | 148 | 141 | ||||||
| Description | Face Amount ($ Thousands) | Market Value ($ Thousands) | ||||||
WaMu Mortgage Pass-Through Certificates Trust, | ||||||||
2.821%, 10/25/2033 (B) | $ | 196 | $ | 199 | ||||
WaMu Mortgage Pass-Through Certificates Trust, | ||||||||
2.900%, 06/25/2033 (B) | 177 | 176 | ||||||
WaMu Mortgage Pass-Through Certificates Trust, | ||||||||
2.675%, 08/25/2033 (B) | 154 | 155 | ||||||
WaMu Mortgage Pass-Through Certificates Trust, | ||||||||
2.694%, 08/25/2033 (B) | 112 | 113 | ||||||
WaMu Mortgage Pass-Through Certificates Trust, | ||||||||
2.848%, 09/25/2033 (B) | 115 | 112 | ||||||
WaMu Mortgage Pass-Through Certificates Trust, | ||||||||
2.784%, 09/25/2033 (B) | 349 | 351 | ||||||
WaMu Mortgage Pass-Through Certificates Trust, | ||||||||
5.000%, 02/25/2018 | 8 | 8 | ||||||
WaMu Mortgage Pass-Through Certificates Trust, | ||||||||
15.916%, 06/25/2033 (B) | 27 | 32 | ||||||
WaMu Mortgage Pass-Through Certificates Trust, | ||||||||
5.250%, 10/25/2033 | 542 | 564 | ||||||
WaMu Mortgage Pass-Through Certificates Trust, | ||||||||
2.792%, 06/25/2034 (B) | 125 | 125 | ||||||
WaMu Mortgage Pass-Through Certificates Trust, | ||||||||
5.500%, 05/25/2035 | 361 | 72 | ||||||
WaMu Mortgage Pass-Through Certificates Trust, | ||||||||
0.824%, 12/25/2045 (B) | 2,818 | 2,625 | ||||||
WaMu Mortgage Pass-Through Certificates Trust, | ||||||||
1.594%, 01/25/2046 (B) | 2,129 | 1,154 | ||||||
WaMu Mortgage Pass-Through Certificates Trust, | ||||||||
2.203%, 10/25/2046 (B) | 692 | 642 | ||||||
WaMu Mortgage Pass-Through Certificates Trust, | ||||||||
2.338%, 11/25/2036 (B) | 220 | 195 | ||||||
WaMu Mortgage Pass-Through Certificates Trust, | ||||||||
2.193%, 12/25/2046 (B) | 306 | 282 | ||||||
| 78 | SEI Institutional Investments Trust / Semi-Annual Report / November 30, 2016 |
| Description | Face Amount ($ Thousands) | Market Value ($ Thousands) | ||||||
WaMu Mortgage Pass-Through Certificates Trust, | ||||||||
1.317%, 12/25/2046 (B) | $ | 295 | $ | 144 | ||||
WaMu MSC Mortgage Pass-Through Certificates Trust, Ser 2003-MS8, Cl 1P, PO(A) | ||||||||
0.000%, 05/25/2033 (A) | 47 | 42 | ||||||
WaMu MSC Mortgage Pass-Through Certificates Trust, | ||||||||
0.000%, 04/25/2033 (A) | 94 | 89 | ||||||
Washington Mutual MSC Mortgage Pass- Through Certificates Trust, | ||||||||
5.750%, 02/25/2033 | 45 | 47 | ||||||
Wells Fargo Commercial Mortgage Trust, | ||||||||
3.065%, 11/15/2059 | 1,310 | 1,295 | ||||||
Wells Fargo Mortgage-Backed Securities Trust, Ser 2004-B, Cl A1 | ||||||||
2.784%, 02/25/2034 (B) | 141 | 140 | ||||||
Wells Fargo Mortgage-Backed Securities Trust, Ser 2004-E, Cl A2 | ||||||||
3.084%, 05/25/2034 (B) | 30 | 30 | ||||||
Wells Fargo Mortgage-Backed Securities Trust, Ser 2004-EE, Cl 3A2 | ||||||||
3.179%, 12/25/2034 (B) | 125 | 129 | ||||||
Wells Fargo Mortgage-Backed Securities Trust, Ser 2004-EE, Cl 2A1 | ||||||||
3.028%, 12/25/2034 (B) | 213 | 214 | ||||||
Wells Fargo Mortgage-Backed Securities Trust, Ser 2004-I, Cl 1A1 | ||||||||
3.003%, 07/25/2034 (B) | 295 | 299 | ||||||
Wells Fargo Mortgage-Backed Securities Trust, Ser 2004-O, Cl A1 | ||||||||
3.020%, 08/25/2034 (B) | 58 | 59 | ||||||
Wells Fargo Mortgage-Backed Securities Trust, Ser 2005-AR14, Cl A1 | ||||||||
3.008%, 08/25/2035 (B) | 143 | 143 | ||||||
Wells Fargo Mortgage-Backed Securities Trust, Ser 2005-AR8, Cl 2A1 | ||||||||
3.019%, 06/25/2035 (B) | 306 | 311 | ||||||
Wells Fargo Mortgage-Backed Securities Trust, Ser 2005-AR9, Cl 2A1 | ||||||||
3.072%, 10/25/2033 (B) | 99 | 99 | ||||||
Wells Fargo Mortgage-Backed Securities Trust, Ser 2006-AR18, Cl 1A1 | ||||||||
3.143%, 11/25/2036 (B) | 223 | 206 | ||||||
Wells Fargo Mortgage-Backed Securities Trust, Ser 2006-AR8, Cl 1A3 | ||||||||
3.047%, 04/25/2036 (B) | 238 | 235 | ||||||
| Description | Face Amount ($ Thousands) | Market Value ($ Thousands) | ||||||
Wells Fargo Mortgage-Backed Securities Trust, Ser 2006-AR8, Cl 3A1 | ||||||||
2.854%, 04/25/2036 (B) | $ | 4,806 | $ | 4,828 | ||||
WFRBS Commercial Mortgage Trust, | ||||||||
1.710%, 12/15/2045 (B) (C) | 4,035 | 286 | ||||||
WFRBS Commercial Mortgage Trust, | ||||||||
1.504%, 06/15/2045 (B) (C) | 2,938 | 180 | ||||||
WFRBS Commercial Mortgage Trust, | ||||||||
1.384%, 03/15/2048 (B) (C) | 14,089 | 786 | ||||||
WFRBS Commercial Mortgage Trust, | ||||||||
4.153%, 08/15/2046 (B) | 150 | 162 | ||||||
WFRBS Commercial Mortgage Trust, | ||||||||
4.023%, 12/15/2046 | 120 | 128 | ||||||
WFRBS Commercial Mortgage Trust, | ||||||||
1.243%, 03/15/2047 (B) | 5,169 | 302 | ||||||
WFRBS Commercial Mortgage Trust, | ||||||||
4.723%, 03/15/2047 (B) | 210 | 226 | ||||||
WFRBS Commercial Mortgage Trust, | ||||||||
3.891%, 08/15/2047 | 1,320 | 1,355 | ||||||
WFRBS Commercial Mortgage Trust, | ||||||||
1.162%, 08/15/2047 (B) | 15,799 | 950 | ||||||
WFRBS Commercial Mortgage Trust, | ||||||||
4.213%, 08/15/2047 (B) | 2,180 | 2,274 | ||||||
WFRBS Commercial Mortgage Trust, | ||||||||
0.694%, 10/15/2057 (B) | 27,400 | 975 | ||||||
WFRBS Commercial Mortgage Trust, | ||||||||
3.931%, 11/15/2047 | 1,330 | 1,353 | ||||||
WFRBS Commercial Mortgage Trust, | ||||||||
3.607%, 11/15/2047 | 110 | 114 | ||||||
|
| |||||||
| 255,043 | ||||||||
|
| |||||||
Total Mortgage-Backed Securities | 1,638,855 | |||||||
|
| |||||||
| SEI Institutional Investments Trust / Semi-Annual Report / November 30, 2016 | 79 |
SCHEDULE OF INVESTMENTS (Unaudited)
Core Fixed Income Fund (Continued)
November 30, 2016
| Description | Face Amount ($ Thousands) | Market Value ($ Thousands) | ||||||
CORPORATE OBLIGATIONS — 28.8% |
| |||||||
Consumer Discretionary — 1.7% | ||||||||
21st Century Fox America | ||||||||
8.875%, 04/26/2023 | $ | 150 | $ | 196 | ||||
6.650%, 11/15/2037 | 310 | 384 | ||||||
6.200%, 12/15/2034 | 265 | 314 | ||||||
Advance Auto Parts | ||||||||
5.750%, 05/01/2020 | 175 | 188 | ||||||
Amazon.com | ||||||||
4.950%, 12/05/2044 | 600 | 663 | ||||||
4.800%, 12/05/2034 | 187 | 204 | ||||||
American Honda Finance MTN | ||||||||
3.875%, 09/21/2020 (C) | 1,425 | 1,505 | ||||||
AutoZone | ||||||||
2.500%, 04/15/2021 | 44 | 44 | ||||||
BMW US Capital LLC | ||||||||
2.800%, 04/11/2026 (C) | 1,110 | 1,067 | ||||||
Charter Communications Operating LLC | ||||||||
6.484%, 10/23/2045 (C) | 2,900 | 3,258 | ||||||
6.384%, 10/23/2035 (C) | 380 | 424 | ||||||
4.464%, 07/23/2022 (C) | 3,840 | 3,989 | ||||||
Comcast | ||||||||
7.050%, 03/15/2033 | 680 | 908 | ||||||
6.950%, 08/15/2037 | 30 | 41 | ||||||
6.550%, 07/01/2039 | 30 | 39 | ||||||
6.400%, 03/01/2040 | 280 | 362 | ||||||
4.750%, 03/01/2044 | 120 | 127 | ||||||
4.400%, 08/15/2035 | 4,015 | 4,163 | ||||||
4.250%, 01/15/2033 | 420 | 432 | ||||||
4.200%, 08/15/2034 | 570 | 582 | ||||||
3.375%, 02/15/2025 | 800 | 809 | ||||||
3.200%, 07/15/2036 | 1,710 | 1,534 | ||||||
Comcast Cable Communications Holdings | ||||||||
9.455%, 11/15/2022 | 660 | 894 | ||||||
Daimler Finance North America LLC | ||||||||
2.375%, 08/01/2018 (C) | 2,620 | 2,640 | ||||||
1.125%, 03/10/2017 (C) | 2,585 | 2,584 | ||||||
Discovery Communications | ||||||||
4.950%, 05/15/2042 | 395 | 354 | ||||||
Discovery Communications LLC | ||||||||
4.875%, 04/01/2043 | 815 | 728 | ||||||
Ford Motor | ||||||||
4.750%, 01/15/2043 | 240 | 224 | ||||||
Ford Motor Credit LLC | ||||||||
8.125%, 01/15/2020 | 520 | 600 | ||||||
5.875%, 08/02/2021 | 2,400 | 2,651 | ||||||
5.000%, 05/15/2018 | 206 | 214 | ||||||
3.219%, 01/09/2022 | 1,565 | 1,550 | ||||||
3.157%, 08/04/2020 | 200 | 201 | ||||||
3.000%, 06/12/2017 | 2,000 | 2,015 | ||||||
2.597%, 11/04/2019 | 2,520 | 2,520 | ||||||
1.724%, 12/06/2017 | 2,000 | 1,998 | ||||||
| Description | Face Amount ($ Thousands) | Market Value ($ Thousands) | ||||||
General Motors | ||||||||
6.750%, 04/01/2046 | $ | 450 | $ | 519 | ||||
6.600%, 04/01/2036 | 1,510 | 1,693 | ||||||
6.250%, 10/02/2043 | 940 | 1,012 | ||||||
General Motors Financial | ||||||||
5.250%, 03/01/2026 | 995 | 1,039 | ||||||
4.750%, 08/15/2017 | 2,250 | 2,299 | ||||||
3.700%, 05/09/2023 | 2,585 | 2,542 | ||||||
3.200%, 07/13/2020 | 159 | 159 | ||||||
Grupo Televisa | ||||||||
6.125%, 01/31/2046 | 850 | 835 | ||||||
Hyundai Capital America | ||||||||
2.875%, 08/09/2018 (C) | 95 | 96 | ||||||
2.125%, 10/02/2017 (C) | 140 | 141 | ||||||
Lowe's | ||||||||
5.125%, 11/15/2041 | 48 | 54 | ||||||
Lowe's MTN | ||||||||
7.110%, 05/15/2037 | 250 | 329 | ||||||
McDonald's MTN | ||||||||
4.875%, 12/09/2045 | 2,020 | 2,127 | ||||||
3.700%, 01/30/2026 | 840 | 853 | ||||||
2.750%, 12/09/2020 | 870 | 880 | ||||||
NBCUniversal Media LLC | ||||||||
4.375%, 04/01/2021 | 820 | 885 | ||||||
Newell Brands | ||||||||
5.500%, 04/01/2046 | 949 | 1,075 | ||||||
4.200%, 04/01/2026 | 2,105 | 2,195 | ||||||
3.850%, 04/01/2023 | 700 | 719 | ||||||
3.150%, 04/01/2021 | 370 | 376 | ||||||
QVC | ||||||||
5.950%, 03/15/2043 | 50 | 45 | ||||||
Scripps Networks Interactive | ||||||||
3.900%, 11/15/2024 | 660 | 664 | ||||||
3.500%, 06/15/2022 | 770 | 778 | ||||||
2.800%, 06/15/2020 | 950 | 951 | ||||||
Time Warner | ||||||||
7.700%, 05/01/2032 | 2,530 | 3,342 | ||||||
7.625%, 04/15/2031 | 2,985 | 3,948 | ||||||
6.250%, 03/29/2041 | 355 | 410 | ||||||
5.375%, 10/15/2041 | 562 | 589 | ||||||
4.850%, 07/15/2045 | 810 | 794 | ||||||
4.750%, 03/29/2021 | 780 | 840 | ||||||
4.700%, 01/15/2021 | 670 | 719 | ||||||
4.650%, 06/01/2044 | 110 | 104 | ||||||
3.800%, 02/15/2027 | 1,780 | 1,771 | ||||||
3.550%, 06/01/2024 | 1,000 | 994 | ||||||
Time Warner Cable | ||||||||
8.250%, 04/01/2019 | 2,890 | 3,262 | ||||||
7.300%, 07/01/2038 | 100 | 119 | ||||||
6.550%, 05/01/2037 | 630 | 703 | ||||||
5.875%, 11/15/2040 | 480 | 500 | ||||||
| 80 | SEI Institutional Investments Trust / Semi-Annual Report / November 30, 2016 |
| Description | Face Amount ($ Thousands) | Market Value ($ Thousands) | ||||||
Time Warner Cable LLC | ||||||||
5.500%, 09/01/2041 | $ | 49 | $ | 49 | ||||
Time Warner Entertainment | ||||||||
8.375%, 07/15/2033 | 1,380 | 1,775 | ||||||
TJX | ||||||||
2.250%, 09/15/2026 | 830 | 764 | ||||||
Toyota Motor Credit MTN | ||||||||
2.250%, 10/18/2023 | 1,995 | 1,921 | ||||||
Viacom | ||||||||
4.850%, 12/15/2034 | 943 | 902 | ||||||
4.250%, 09/01/2023 | 200 | 206 | ||||||
3.875%, 04/01/2024 | 230 | 230 | ||||||
3.450%, 10/04/2026 | 755 | 722 | ||||||
2.250%, 02/04/2022 | 1,120 | 1,073 | ||||||
Wal-Mart Stores | ||||||||
4.300%, 04/22/2044 | 3,925 | 4,120 | ||||||
3.300%, 04/22/2024 | 175 | 180 | ||||||
|
| |||||||
| 92,709 | ||||||||
|
| |||||||
Consumer Staples — 2.5% | ||||||||
Altria Group | ||||||||
9.250%, 08/06/2019 | 2,120 | 2,516 | ||||||
5.375%, 01/31/2044 | 40 | 46 | ||||||
4.750%, 05/05/2021 | 1,260 | 1,373 | ||||||
2.850%, 08/09/2022 | 1,690 | 1,688 | ||||||
Anheuser-Busch InBev Finance | ||||||||
4.900%, 02/01/2046 | 5,857 | 6,267 | ||||||
3.650%, 02/01/2026 | 9,370 | 9,443 | ||||||
3.300%, 02/01/2023 | 6,440 | 6,506 | ||||||
2.650%, 02/01/2021 | 850 | 853 | ||||||
Anheuser-Busch InBev Worldwide | ||||||||
7.750%, 01/15/2019 | 105 | 117 | ||||||
5.375%, 01/15/2020 | 2,360 | 2,576 | ||||||
2.500%, 07/15/2022 | 2,086 | 2,055 | ||||||
Coca-Cola | ||||||||
3.300%, 09/01/2021 | 52 | 54 | ||||||
Coca-Cola Femsa | ||||||||
2.375%, 11/26/2018 | 2,020 | 2,038 | ||||||
CVS Health | ||||||||
5.125%, 07/20/2045 | 656 | 719 | ||||||
3.875%, 07/20/2025 | 1,039 | 1,066 | ||||||
3.500%, 07/20/2022 | 325 | 334 | ||||||
2.875%, 06/01/2026 | 880 | 834 | ||||||
2.750%, 12/01/2022 | 230 | 226 | ||||||
CVS Pass-Through Trust | ||||||||
6.036%, 12/10/2028 | 1,967 | 2,212 | ||||||
5.926%, 01/10/2034 (C) | 175 | 201 | ||||||
5.880%, 01/10/2028 | 131 | 145 | ||||||
5.789%, 01/10/2026 (C) | 1,163 | 1,275 | ||||||
Danone | ||||||||
2.947%, 11/02/2026 (C) | 2,060 | 1,962 | ||||||
2.589%, 11/02/2023 (C) | 1,950 | 1,883 | ||||||
| Description | Face Amount ($ Thousands) | Market Value ($ Thousands) | ||||||
2.077%, 11/02/2021 (C) | $ | 1,550 | $ | 1,512 | ||||
Diageo Capital | ||||||||
1.125%, 04/29/2018 | 150 | 149 | ||||||
Diageo Investment | ||||||||
2.875%, 05/11/2022 | 3,730 | 3,772 | ||||||
EMD Finance LLC | ||||||||
2.400%, 03/19/2020 (C) | 3,365 | 3,360 | ||||||
ERAC USA Finance LLC | ||||||||
4.500%, 02/15/2045 (C) | 350 | 331 | ||||||
3.300%, 12/01/2026 (C) | 2,085 | 2,004 | ||||||
Imperial Brands Finance | ||||||||
2.050%, 02/11/2018 (C) | 790 | 791 | ||||||
Kraft Heinz Foods | ||||||||
6.500%, 02/09/2040 | 700 | 860 | ||||||
6.125%, 08/23/2018 | 100 | 107 | ||||||
5.375%, 02/10/2020 | 847 | 917 | ||||||
5.200%, 07/15/2045 | 140 | 149 | ||||||
5.000%, 07/15/2035 | 560 | 592 | ||||||
5.000%, 06/04/2042 | 100 | 103 | ||||||
4.375%, 06/01/2046 | 4,410 | 4,194 | ||||||
3.950%, 07/15/2025 | 1,570 | 1,601 | ||||||
3.500%, 06/06/2022 | 3,495 | 3,579 | ||||||
3.500%, 07/15/2022 | 1,595 | 1,634 | ||||||
3.000%, 06/01/2026 | 1,755 | 1,658 | ||||||
2.800%, 07/02/2020 | 2,725 | 2,746 | ||||||
1.600%, 06/30/2017 | 2,190 | 2,192 | ||||||
Kroger | ||||||||
7.500%, 04/01/2031 | 160 | 215 | ||||||
5.400%, 07/15/2040 | 45 | 49 | ||||||
2.950%, 11/01/2021 | 1,215 | 1,229 | ||||||
Molson Coors Brewing | ||||||||
3.500%, 05/01/2022 | 220 | 227 | ||||||
3.000%, 07/15/2026 | 1,665 | 1,569 | ||||||
Mondelez International Holdings Netherlands BV | ||||||||
2.000%, 10/28/2021 (C) | 6,815 | 6,580 | ||||||
1.625%, 10/28/2019 (C) | 4,890 | 4,811 | ||||||
Northwell Healthcare | ||||||||
3.979%, 11/01/2046 | 3,000 | 2,741 | ||||||
PepsiCo | ||||||||
3.600%, 03/01/2024 | 150 | 156 | ||||||
Pernod Ricard | ||||||||
5.500%, 01/15/2042 (C) | 1,180 | 1,296 | ||||||
Philip Morris International | ||||||||
5.650%, 05/16/2018 | 265 | 280 | ||||||
2.900%, 11/15/2021 | 550 | 559 | ||||||
2.500%, 08/22/2022 | 1,530 | 1,510 | ||||||
Providence St. Joseph Health Obligated Group | ||||||||
2.746%, 10/01/2026 | 3,295 | 3,134 | ||||||
Reynolds American | ||||||||
8.125%, 06/23/2019 | 570 | 655 | ||||||
6.150%, 09/15/2043 | 640 | 776 | ||||||
| SEI Institutional Investments Trust / Semi-Annual Report / November 30, 2016 | 81 |
SCHEDULE OF INVESTMENTS (Unaudited)
Core Fixed Income Fund (Continued)
November 30, 2016
| Description | Face Amount ($ Thousands) | Market Value ($ Thousands) | ||||||
5.850%, 08/15/2045 | $ | 2,888 | $ | 3,407 | ||||
5.700%, 08/15/2035 | 885 | 1,015 | ||||||
3.250%, 06/12/2020 | 386 | 397 | ||||||
RWJ Barnabas Health | ||||||||
3.949%, 07/01/2046 | 2,445 | 2,248 | ||||||
Shire Acquisitions Investments Ireland DAC | ||||||||
2.875%, 09/23/2023 | 1,715 | 1,630 | ||||||
1.900%, 09/23/2019 | 4,000 | 3,948 | ||||||
Skandinaviska Enskilda Banken | ||||||||
1.875%, 09/13/2021 | 2,645 | 2,559 | ||||||
Tyson Foods | ||||||||
5.150%, 08/15/2044 | 220 | 228 | ||||||
4.875%, 08/15/2034 | 24 | 25 | ||||||
3.950%, 08/15/2024 | 680 | 694 | ||||||
UBM | ||||||||
5.750%, 11/03/2020 (C) | 850 | 897 | ||||||
University of Southern California | ||||||||
3.028%, 10/01/2039 | 2,500 | 2,201 | ||||||
Walgreens | ||||||||
5.250%, 01/15/2019 | 50 | 53 | ||||||
Walgreens Boots Alliance | ||||||||
4.800%, 11/18/2044 | 1,430 | 1,432 | ||||||
3.450%, 06/01/2026 | 3,525 | 3,454 | ||||||
3.300%, 11/18/2021 | 2,003 | 2,043 | ||||||
3.100%, 06/01/2023 | 1,000 | 987 | ||||||
Wm Wrigley Jr | ||||||||
3.375%, 10/21/2020 (C) | 1,905 | 1,959 | ||||||
2.900%, 10/21/2019 (C) | 3,258 | 3,318 | ||||||
2.400%, 10/21/2018 (C) | 1,160 | 1,173 | ||||||
2.000%, 10/20/2017 (C) | 550 | 553 | ||||||
|
| |||||||
| 138,648 | ||||||||
|
| |||||||
Energy — 3.2% | ||||||||
Anadarko Petroleum | ||||||||
6.600%, 03/15/2046 | 1,105 | 1,288 | ||||||
6.375%, 09/15/2017 | 307 | 319 | ||||||
4.500%, 07/15/2044 | 1,000 | 886 | ||||||
Apache | ||||||||
6.900%, 09/15/2018 | 180 | 194 | ||||||
5.100%, 09/01/2040 | 520 | 523 | ||||||
4.750%, 04/15/2043 | 420 | 416 | ||||||
4.250%, 01/15/2044 | 2,025 | 1,860 | ||||||
3.250%, 04/15/2022 | 56 | 56 | ||||||
BG Energy Capital | ||||||||
4.000%, 10/15/2021 (C) | 2,775 | 2,947 | ||||||
BP Capital Markets | ||||||||
3.723%, 11/28/2028 | 2,205 | 2,219 | ||||||
3.561%, 11/01/2021 | 110 | 115 | ||||||
3.506%, 03/17/2025 | 490 | 494 | ||||||
3.245%, 05/06/2022 | 950 | 969 | ||||||
3.216%, 11/28/2023 | 7,740 | 7,735 | ||||||
3.119%, 05/04/2026 | 400 | 388 | ||||||
| Description | Face Amount ($ Thousands) | Market Value ($ Thousands) | ||||||
3.062%, 03/17/2022 | $ | 1,859 | $ | 1,879 | ||||
1.674%, 02/13/2018 | 434 | 434 | ||||||
Buckeye Partners | ||||||||
3.950%, 12/01/2026 | 1,645 | 1,577 | ||||||
Canadian Natural Resources | ||||||||
6.750%, 02/01/2039 | 590 | 658 | ||||||
6.450%, 06/30/2033 | 200 | 216 | ||||||
Chevron | ||||||||
3.191%, 06/24/2023 | 95 | 97 | ||||||
2.954%, 05/16/2026 | 1,550 | 1,516 | ||||||
2.355%, 12/05/2022 | 290 | 284 | ||||||
2.100%, 05/16/2021 | 3,120 | 3,085 | ||||||
1.961%, 03/03/2020 | 81 | 80 | ||||||
1.561%, 05/16/2019 | 2,424 | 2,410 | ||||||
Cimarex Energy | ||||||||
4.375%, 06/01/2024 | 1,125 | 1,154 | ||||||
CNOOC Finance 2013 | ||||||||
3.000%, 05/09/2023 | 253 | 245 | ||||||
CNOOC Finance 2015 USA LLC | ||||||||
3.500%, 05/05/2025 | 2,900 | 2,824 | ||||||
Colorado Interstate Gas LLC | ||||||||
4.150%, 08/15/2026 (C) | 1,045 | 995 | ||||||
Conoco Funding | ||||||||
6.950%, 04/15/2029 | 995 | 1,219 | ||||||
ConocoPhillips | ||||||||
5.750%, 02/01/2019 | 175 | 188 | ||||||
4.950%, 03/15/2026 | 1,310 | 1,426 | ||||||
4.150%, 11/15/2034 | 2,343 | 2,218 | ||||||
3.350%, 05/15/2025 | 100 | 98 | ||||||
Devon Energy | ||||||||
5.850%, 12/15/2025 | 880 | 977 | ||||||
5.600%, 07/15/2041 | 510 | 494 | ||||||
5.000%, 06/15/2045 | 1,070 | 999 | ||||||
4.750%, 05/15/2042 | 127 | 113 | ||||||
3.250%, 05/15/2022 | 670 | 650 | ||||||
Devon Financing | ||||||||
7.875%, 09/30/2031 | 520 | 634 | ||||||
Ecopetrol | ||||||||
5.875%, 05/28/2045 | 2,650 | 2,169 | ||||||
4.125%, 01/16/2025 | 167 | 152 | ||||||
Enbridge | ||||||||
5.500%, 12/01/2046 | 885 | 908 | ||||||
4.250%, 12/01/2026 | 1,110 | 1,120 | ||||||
Enbridge Energy Partners | ||||||||
5.875%, 10/15/2025 | 1,500 | 1,666 | ||||||
Energy Transfer Partners | ||||||||
8.250%, 11/15/2029 | 4,295 | 5,197 | ||||||
6.125%, 12/15/2045 | 1,670 | 1,685 | ||||||
5.150%, 03/15/2045 | 67 | 60 | ||||||
4.900%, 02/01/2024 | 250 | 257 | ||||||
4.750%, 01/15/2026 | 760 | 766 | ||||||
3.903%, 11/01/2066 (B) | 485 | 372 | ||||||
| 82 | SEI Institutional Investments Trust / Semi-Annual Report / November 30, 2016 |
| Description | Face Amount ($ Thousands) | Market Value ($ Thousands) | ||||||
2.500%, 06/15/2018 | $ | 1,190 | $ | 1,191 | ||||
Enterprise Products Operating LLC | ||||||||
6.450%, 09/01/2040 | 200 | 229 | ||||||
6.300%, 09/15/2017 | 75 | 78 | ||||||
5.950%, 02/01/2041 | 330 | 359 | ||||||
5.100%, 02/15/2045 | 765 | 759 | ||||||
4.050%, 02/15/2022 | 14 | 15 | ||||||
1.650%, 05/07/2018 | 58 | 58 | ||||||
EOG Resources | ||||||||
4.150%, 01/15/2026 | 490 | 510 | ||||||
Exxon Mobil | ||||||||
4.114%, 03/01/2046 | 910 | 914 | ||||||
3.567%, 03/06/2045 | 629 | 574 | ||||||
3.043%, 03/01/2026 | 1,230 | 1,219 | ||||||
Florida Gas Transmission LLC | ||||||||
7.900%, 05/15/2019 (C) | 1,850 | 2,074 | ||||||
3.875%, 07/15/2022 (C) | 2,170 | 2,192 | ||||||
Halliburton | ||||||||
5.000%, 11/15/2045 | 1,077 | 1,099 | ||||||
3.800%, 11/15/2025 | 1,070 | 1,069 | ||||||
Hess | ||||||||
5.800%, 04/01/2047 | 745 | 720 | ||||||
4.300%, 04/01/2027 | 740 | 702 | ||||||
HollyFrontier | ||||||||
5.875%, 04/01/2026 | 1,700 | 1,704 | ||||||
Kerr-McGee | ||||||||
6.950%, 07/01/2024 | 1,665 | 1,935 | ||||||
Kinder Morgan | ||||||||
5.550%, 06/01/2045 | 1,120 | 1,107 | ||||||
4.300%, 06/01/2025 | 6,230 | 6,308 | ||||||
3.050%, 12/01/2019 | 93 | 94 | ||||||
Kinder Morgan Energy Partners | ||||||||
6.500%, 04/01/2020 | 3,327 | 3,661 | ||||||
5.400%, 09/01/2044 | 755 | 722 | ||||||
5.000%, 03/01/2043 | 50 | 46 | ||||||
Marathon Oil | ||||||||
5.200%, 06/01/2045 | 547 | 479 | ||||||
3.850%, 06/01/2025 | 370 | 344 | ||||||
Marathon Petroleum | ||||||||
5.850%, 12/15/2045 | 450 | 415 | ||||||
5.000%, 09/15/2054 | 180 | 141 | ||||||
Noble Energy | ||||||||
6.000%, 03/01/2041 | 539 | 566 | ||||||
5.250%, 11/15/2043 | 150 | 146 | ||||||
5.050%, 11/15/2044 | 186 | 177 | ||||||
4.150%, 12/15/2021 | 2,080 | 2,153 | ||||||
3.900%, 11/15/2024 | 1,200 | 1,192 | ||||||
Occidental Petroleum | ||||||||
4.625%, 06/15/2045 | 400 | 408 | ||||||
4.100%, 02/15/2047 | 920 | 877 | ||||||
3.400%, 04/15/2026 | 100 | 100 | ||||||
3.125%, 02/15/2022 | 810 | 826 | ||||||
| Description | Face Amount ($ Thousands) | Market Value ($ Thousands) | ||||||
3.000%, 02/15/2027 | $ | 1,550 | $ | 1,498 | ||||
2.700%, 02/15/2023 | 150 | 147 | ||||||
Panhandle Eastern Pipeline | ||||||||
8.125%, 06/01/2019 | 1,161 | 1,281 | ||||||
Petrobras Global Finance | ||||||||
6.850%, 06/05/2115 | 1,290 | 1,014 | ||||||
6.250%, 03/17/2024 | 1,930 | 1,853 | ||||||
Petrobras International Finance | ||||||||
5.750%, 01/20/2020 | 1,127 | 1,130 | ||||||
5.375%, 01/27/2021 | 6,010 | 5,851 | ||||||
Petroleos Mexicanos MTN | ||||||||
6.875%, 08/04/2026 (C) | 470 | 481 | ||||||
6.750%, 09/21/2047 (C) | 1,330 | 1,167 | ||||||
5.625%, 01/23/2046 | 1,305 | 1,014 | ||||||
Petroleos Mexicanos | ||||||||
6.625%, 06/15/2035 | 5,602 | 5,140 | ||||||
4.875%, 01/18/2024 | 81 | 76 | ||||||
3.500%, 01/30/2023 | 785 | 697 | ||||||
2.460%, 12/15/2025 | 2,974 | 3,004 | ||||||
2.378%, 04/15/2025 | 1,479 | 1,490 | ||||||
Phillips 66 Partners | ||||||||
4.900%, 10/01/2046 | 745 | 696 | ||||||
3.550%, 10/01/2026 | 745 | 711 | ||||||
Plains All American Pipeline | ||||||||
3.650%, 06/01/2022 | 100 | 100 | ||||||
Pride International | ||||||||
6.875%, 08/15/2020 | 150 | 153 | ||||||
Sabine Pass Liquefaction LLC | ||||||||
5.000%, 03/15/2027 (C) | 1,175 | 1,160 | ||||||
Schlumberger Holdings | ||||||||
4.000%, 12/21/2025 (C) | 660 | 683 | ||||||
3.000%, 12/21/2020 (C) | 4,860 | 4,951 | ||||||
Schlumberger Investment | ||||||||
3.650%, 12/01/2023 | 100 | 104 | ||||||
3.300%, 09/14/2021 (C) | 317 | 326 | ||||||
Shell International Finance | ||||||||
6.375%, 12/15/2038 | 840 | 1,062 | ||||||
4.375%, 03/25/2020 | 70 | 75 | ||||||
4.375%, 05/11/2045 | 990 | 976 | ||||||
4.300%, 09/22/2019 | 500 | 531 | ||||||
4.125%, 05/11/2035 | 8,470 | 8,422 | ||||||
4.000%, 05/10/2046 | 1,751 | 1,625 | ||||||
3.400%, 08/12/2023 | 2,145 | 2,187 | ||||||
2.875%, 05/10/2026 | 2,111 | 2,033 | ||||||
Sinopec Group Overseas Development 2012 | ||||||||
2.750%, 05/17/2017 (C) | 900 | 904 | ||||||
Sinopec Group Overseas Development 2014 | ||||||||
4.375%, 04/10/2024 (C) | 480 | 503 | ||||||
Spectra Energy Partners | ||||||||
4.500%, 03/15/2045 | 1,025 | 935 | ||||||
Statoil | ||||||||
5.250%, 04/15/2019 | 200 | 215 | ||||||
| SEI Institutional Investments Trust / Semi-Annual Report / November 30, 2016 | 83 |
SCHEDULE OF INVESTMENTS (Unaudited)
Core Fixed Income Fund (Continued)
November 30, 2016
| Description | Face Amount ($ Thousands) | Market Value ($ Thousands) | ||||||
3.700%, 03/01/2024 | $ | 1,085 | $ | 1,134 | ||||
Suncor Energy | ||||||||
3.600%, 12/01/2024 | 3,121 | 3,127 | ||||||
TC PipeLines | ||||||||
4.650%, 06/15/2021 | 477 | 497 | ||||||
Tennessee Gas Pipeline | ||||||||
8.375%, 06/15/2032 | 2,000 | 2,418 | ||||||
Texas Eastern Transmission | ||||||||
2.800%, 10/15/2022 (C) | 375 | 364 | ||||||
Total Capital International | ||||||||
2.875%, 02/17/2022 | 2,515 | 2,541 | ||||||
TransCanada PipeLines | ||||||||
4.625%, 03/01/2034 | 2,405 | 2,541 | ||||||
Transcontinental Gas PipeLine LLC | ||||||||
7.850%, 02/01/2026 (C) | 3,235 | 4,033 | ||||||
Transocean | ||||||||
6.800%, 12/15/2016 | 360 | 361 | ||||||
4.250%, 10/15/2017 | 1,720 | 1,719 | ||||||
Valero Energy | ||||||||
3.400%, 09/15/2026 | 1,875 | 1,775 | ||||||
Williams | ||||||||
8.750%, 03/15/2032 | 1,284 | 1,502 | ||||||
7.875%, 09/01/2021 | 1,324 | 1,513 | ||||||
7.750%, 06/15/2031 | 339 | 378 | ||||||
7.500%, 01/15/2031 | 9 | 10 | ||||||
Williams Partners | ||||||||
5.100%, 09/15/2045 | 220 | 200 | ||||||
4.500%, 11/15/2023 | 1,065 | 1,081 | ||||||
4.000%, 09/15/2025 | 710 | 685 | ||||||
3.600%, 03/15/2022 | 124 | 122 | ||||||
XTO Energy | ||||||||
5.500%, 06/15/2018 | 500 | 529 | ||||||
|
| |||||||
| 179,119 | ||||||||
|
| |||||||
Financials — 9.9% | ||||||||
Aegon | ||||||||
1.698%, 07/29/2049 (B) | 2,180 | 1,526 | ||||||
AIG Global Funding MTN | ||||||||
1.650%, 12/15/2017 (C) | 97 | 97 | ||||||
Allstate | ||||||||
3.150%, 06/15/2023 | 1,375 | 1,399 | ||||||
American Express Credit MTN | ||||||||
2.375%, 03/24/2017 | 120 | 121 | ||||||
2.250%, 08/15/2019 | 3,165 | 3,180 | ||||||
1.800%, 07/31/2018 | 195 | 195 | ||||||
American International Group | ||||||||
6.250%, 05/01/2036 | 1,085 | 1,295 | ||||||
6.250%, 03/15/2037 (B) | 2,578 | 2,620 | ||||||
4.375%, 01/15/2055 | 260 | 233 | ||||||
3.900%, 04/01/2026 | 3,123 | 3,169 | ||||||
Anadarko Finance | ||||||||
7.500%, 05/01/2031 | 240 | 298 | ||||||
| Description | Face Amount ($ Thousands) | Market Value ($ Thousands) | ||||||
Aon | ||||||||
4.600%, 06/14/2044 | $ | 330 | $ | 326 | ||||
Australia & New Zealand Banking Group | ||||||||
1.431%, 10/29/2049 (B) | 1,400 | 893 | ||||||
Bank of America | ||||||||
6.875%, 11/15/2018 | 125 | 136 | ||||||
6.100%, 06/15/2017 | 6,825 | 6,992 | ||||||
6.000%, 09/01/2017 | 4,675 | 4,827 | ||||||
5.750%, 12/01/2017 | 235 | 244 | ||||||
5.700%, 05/02/2017 | 1,870 | 1,902 | ||||||
5.420%, 03/15/2017 | 4,230 | 4,276 | ||||||
5.300%, 03/15/2017 | 1,995 | 2,017 | ||||||
1.150%, 06/15/2017 (B) | 2,710 | 2,710 | ||||||
Bank of America MTN | ||||||||
6.400%, 08/28/2017 | 1,350 | 1,397 | ||||||
5.650%, 05/01/2018 | 2,040 | 2,143 | ||||||
5.625%, 07/01/2020 | 180 | 198 | ||||||
5.000%, 05/13/2021 | 75 | 82 | ||||||
5.000%, 01/21/2044 | 2,680 | 2,903 | ||||||
4.450%, 03/03/2026 | 4,822 | 4,955 | ||||||
4.200%, 08/26/2024 | 3,720 | 3,782 | ||||||
4.183%, 11/25/2027 | 2,185 | 2,180 | ||||||
4.100%, 07/24/2023 | 305 | 318 | ||||||
4.000%, 04/01/2024 | 6,110 | 6,317 | ||||||
4.000%, 01/22/2025 | 1,825 | 1,825 | ||||||
3.875%, 08/01/2025 | 1,180 | 1,201 | ||||||
3.500%, 04/19/2026 | 2,747 | 2,712 | ||||||
3.300%, 01/11/2023 | 1,313 | 1,314 | ||||||
3.248%, 10/21/2027 | 6,135 | 5,847 | ||||||
2.625%, 04/19/2021 | 2,455 | 2,442 | ||||||
2.503%, 10/21/2022 | 3,650 | 3,545 | ||||||
2.000%, 01/11/2018 | 70 | 70 | ||||||
Bank of Montreal MTN | ||||||||
2.550%, 11/06/2022 | 200 | 198 | ||||||
2.375%, 01/25/2019 | 50 | 50 | ||||||
1.400%, 09/11/2017 | 50 | 50 | ||||||
Bank of New York Mellon | ||||||||
3.550%, 09/23/2021 | 144 | 150 | ||||||
3.400%, 05/15/2024 | 5,665 | 5,771 | ||||||
1.969%, 06/20/2017 (D) | 20 | 20 | ||||||
Bank of New York Mellon MTN | ||||||||
3.650%, 02/04/2024 | 150 | 156 | ||||||
3.250%, 09/11/2024 | 270 | 272 | ||||||
2.450%, 08/17/2026 | 1,660 | 1,549 | ||||||
2.200%, 08/16/2023 | 1,770 | 1,686 | ||||||
Bank of Nova Scotia | ||||||||
1.450%, 04/25/2018 | 300 | 299 | ||||||
Bank of Tokyo-Mitsubishi UFJ | ||||||||
2.350%, 02/23/2017 (C) | 295 | 296 | ||||||
Barclays Bank MTN | ||||||||
6.050%, 12/04/2017 (C) | 850 | 881 | ||||||
| 84 | SEI Institutional Investments Trust / Semi-Annual Report / November 30, 2016 |
| Description | Face Amount ($ Thousands) | Market Value ($ Thousands) | ||||||
Barclays Bank | ||||||||
2.250%, 05/10/2017 (C) | $ | 221 | $ | 222 | ||||
Bear Stearns | ||||||||
7.250%, 02/01/2018 | 3,670 | 3,898 | ||||||
6.400%, 10/02/2017 | 3,370 | 3,506 | ||||||
4.650%, 07/02/2018 | 3,000 | 3,127 | ||||||
Berkshire Hathaway | ||||||||
4.500%, 02/11/2043 | 2,200 | 2,326 | ||||||
3.750%, 08/15/2021 | 488 | 520 | ||||||
3.125%, 03/15/2026 | 4,980 | 4,941 | ||||||
1.550%, 02/09/2018 | 85 | 85 | ||||||
BNP Paribas MTN | ||||||||
2.375%, 09/14/2017 | 1,490 | 1,500 | ||||||
BPCE | ||||||||
5.150%, 07/21/2024 (C) | 1,550 | 1,568 | ||||||
BPCE MTN | ||||||||
2.750%, 12/02/2021 | 2,540 | 2,531 | ||||||
1.625%, 01/26/2018 | 300 | 300 | ||||||
Branch Banking & Trust | ||||||||
3.800%, 10/30/2026 | 250 | 257 | ||||||
Capital One Bank USA | ||||||||
3.375%, 02/15/2023 | 300 | 298 | ||||||
Capital One Financial | ||||||||
4.200%, 10/29/2025 | 1,679 | 1,681 | ||||||
3.750%, 07/28/2026 | 1,175 | 1,132 | ||||||
Chubb INA Holdings | ||||||||
4.350%, 11/03/2045 | 1,305 | 1,363 | ||||||
3.350%, 05/03/2026 | 2,116 | 2,130 | ||||||
2.300%, 11/03/2020 | 310 | 309 | ||||||
Citigroup | ||||||||
8.125%, 07/15/2039 | 1,307 | 1,920 | ||||||
5.500%, 09/13/2025 | 1,370 | 1,498 | ||||||
5.300%, 05/06/2044 | 330 | 351 | ||||||
4.750%, 05/18/2046 | 150 | 148 | ||||||
4.650%, 07/30/2045 | 1,630 | 1,682 | ||||||
4.600%, 03/09/2026 | 2,785 | 2,871 | ||||||
4.500%, 01/14/2022 | 50 | 54 | ||||||
4.450%, 09/29/2027 | 5,510 | 5,586 | ||||||
4.400%, 06/10/2025 | 2,040 | 2,084 | ||||||
4.300%, 11/20/2026 | 590 | 594 | ||||||
3.875%, 10/25/2023 | 151 | 156 | ||||||
3.700%, 01/12/2026 | 4,060 | 4,052 | ||||||
3.500%, 05/15/2023 | 930 | 930 | ||||||
3.200%, 10/21/2026 | 3,580 | 3,431 | ||||||
2.500%, 09/26/2018 | 2,545 | 2,570 | ||||||
2.150%, 07/30/2018 | 164 | 165 | ||||||
1.800%, 02/05/2018 | 4,130 | 4,129 | ||||||
1.550%, 08/14/2017 | 3,085 | 3,086 | ||||||
1.480%, 08/25/2036 (B) | 3,239 | 2,423 | ||||||
Citigroup Capital III | ||||||||
7.625%, 12/01/2036 | 2,000 | 2,345 | ||||||
| Description | Face Amount ($ Thousands) | Market Value ($ Thousands) | ||||||
CME Group | ||||||||
3.000%, 09/15/2022 | $ | 400 | $ | 410 | ||||
Commonwealth Bank of Australia MTN | ||||||||
5.000%, 10/15/2019 (C) | 900 | 971 | ||||||
Compass Bank | ||||||||
3.875%, 04/10/2025 | 910 | 862 | ||||||
Cooperatieve Rabobank UA | ||||||||
11.000%, 12/31/2049 (B) (C) | 1,893 | 2,246 | ||||||
5.250%, 08/04/2045 | 380 | 414 | ||||||
4.625%, 12/01/2023 | 2,060 | 2,157 | ||||||
4.375%, 08/04/2025 | 1,330 | 1,355 | ||||||
3.750%, 07/21/2026 | 1,055 | 1,019 | ||||||
Cooperatieve Rabobank UA MTN | ||||||||
3.875%, 02/08/2022 | 300 | 317 | ||||||
Credit Agricole | ||||||||
8.375%, 12/31/2049 (B) (C) | 2,270 | 2,503 | ||||||
Credit Suisse Group Funding Guernsey | ||||||||
4.875%, 05/15/2045 | 1,340 | 1,341 | ||||||
3.800%, 06/09/2023 | 3,570 | 3,505 | ||||||
3.450%, 04/16/2021 (C) | 1,293 | 1,293 | ||||||
Credit Suisse NY MTN | ||||||||
5.400%, 01/14/2020 | 130 | 139 | ||||||
3.625%, 09/09/2024 | 1,360 | 1,367 | ||||||
Deutsche Bank | ||||||||
4.250%, 10/14/2021 (C) | 4,540 | 4,464 | ||||||
Discover Bank | ||||||||
4.200%, 08/08/2023 | 1,000 | 1,038 | ||||||
3.100%, 06/04/2020 | 1,000 | 1,011 | ||||||
2.000%, 02/21/2018 | 2,000 | 2,001 | ||||||
Farmers Exchange Capital | ||||||||
7.200%, 07/15/2048 (C) | 1,788 | 2,010 | ||||||
Farmers Exchange Capital II | ||||||||
6.151%, 11/01/2053 (B) (C) | 5,120 | 5,242 | ||||||
Fifth Third Bank | ||||||||
2.875%, 10/01/2021 | 200 | 203 | ||||||
General Electric | ||||||||
2.100%, 12/11/2019 | 356 | 358 | ||||||
General Electric MTN | ||||||||
6.875%, 01/10/2039 | 1,546 | 2,157 | ||||||
6.150%, 08/07/2037 | 537 | 685 | ||||||
5.875%, 01/14/2038 | 579 | 725 | ||||||
5.550%, 05/04/2020 | 269 | 298 | ||||||
5.500%, 01/08/2020 | 288 | 317 | ||||||
5.300%, 02/11/2021 | 230 | 255 | ||||||
4.650%, 10/17/2021 | 543 | 599 | ||||||
4.625%, 01/07/2021 | 184 | 200 | ||||||
4.375%, 09/16/2020 | 60 | 64 | ||||||
1.386%, 08/15/2036 (B) | 3,035 | 2,591 | ||||||
General Motors Financial | ||||||||
4.200%, 03/01/2021 | 3,565 | 3,665 | ||||||
Goldman Sachs Capital II | ||||||||
4.000%, 06/01/2043 (B) | 595 | 473 | ||||||
| SEI Institutional Investments Trust / Semi-Annual Report / November 30, 2016 | 85 |
SCHEDULE OF INVESTMENTS (Unaudited)
Core Fixed Income Fund (Continued)
November 30, 2016
| Description | Face Amount ($ Thousands) | Market Value ($ Thousands) | ||||||
Goldman Sachs Group MTN | ||||||||
7.500%, 02/15/2019 | $ | 1,520 | $ | 1,693 | ||||
6.000%, 06/15/2020 | 2,795 | 3,111 | ||||||
Goldman Sachs Group | ||||||||
6.750%, 10/01/2037 | 3,207 | 3,952 | ||||||
6.450%, 05/01/2036 | 70 | 83 | ||||||
6.250%, 02/01/2041 | 1,290 | 1,586 | ||||||
6.150%, 04/01/2018 | 7,500 | 7,911 | ||||||
5.250%, 07/27/2021 | 9,460 | 10,414 | ||||||
5.150%, 05/22/2045 | 1,870 | 1,926 | ||||||
4.750%, 10/21/2045 | 2,282 | 2,384 | ||||||
4.250%, 10/21/2025 | 1,090 | 1,106 | ||||||
3.750%, 02/25/2026 | 1,445 | 1,454 | ||||||
3.625%, 01/22/2023 | 508 | 520 | ||||||
3.500%, 11/16/2026 | 4,970 | 4,884 | ||||||
2.625%, 01/31/2019 | 100 | 101 | ||||||
2.350%, 11/15/2027 | 3,370 | 3,275 | ||||||
Guardian Life Global Funding | ||||||||
1.950%, 10/27/2021 (C) | 2,790 | 2,720 | ||||||
Guardian Life Global Funding MTN | ||||||||
2.000%, 04/26/2021 (C) | 3,000 | 2,929 | ||||||
HBOS MTN | ||||||||
6.750%, 05/21/2018 (C) | 5,100 | 5,396 | ||||||
Hongkong & Shanghai Banking | ||||||||
1.125%, 07/22/2049 (B) | 195 | 138 | ||||||
HSBC Bank | ||||||||
4.750%, 01/19/2021 (C) | 250 | 268 | ||||||
4.125%, 08/12/2020 (C) | 261 | 274 | ||||||
1.500%, 05/15/2018 (C) | 100 | 99 | ||||||
1.038%, 06/29/2049 (B) | 1,160 | 820 | ||||||
HSBC Finance | ||||||||
6.676%, 01/15/2021 | 1,530 | 1,719 | ||||||
HSBC Holdings | ||||||||
5.100%, 04/05/2021 | 170 | 184 | ||||||
4.375%, 11/23/2026 | 2,085 | 2,076 | ||||||
4.300%, 03/08/2026 | 5,345 | 5,491 | ||||||
4.250%, 03/14/2024 | 1,715 | 1,720 | ||||||
4.250%, 08/18/2025 | 1,520 | 1,514 | ||||||
4.000%, 03/30/2022 | 390 | 404 | ||||||
3.400%, 03/08/2021 | 360 | 365 | ||||||
2.650%, 01/05/2022 | 4,790 | 4,668 | ||||||
ING Bank | ||||||||
5.800%, 09/25/2023 (C) | 1,800 | 1,967 | ||||||
3.750%, 03/07/2017 (C) | 457 | 460 | ||||||
Intesa Sanpaolo MTN | ||||||||
5.017%, 06/26/2024 (C) | 3,370 | 2,998 | ||||||
John Deere Capital MTN | ||||||||
2.250%, 04/17/2019 | 150 | 152 | ||||||
John Deere Capital | ||||||||
1.700%, 01/15/2020 | 340 | 336 | ||||||
JPMorgan Chase MTN | ||||||||
2.295%, 08/15/2021 | 3,370 | 3,309 | ||||||
| Description | Face Amount ($ Thousands) | Market Value ($ Thousands) | ||||||
JPMorgan Chase | ||||||||
6.400%, 05/15/2038 | $ | 385 | $ | 494 | ||||
6.000%, 07/05/2017 | 3,365 | 3,455 | ||||||
6.000%, 10/01/2017 | 9,155 | 9,485 | ||||||
4.950%, 06/01/2045 | 1,510 | 1,601 | ||||||
4.500%, 01/24/2022 | 1,287 | 1,388 | ||||||
4.350%, 08/15/2021 | 510 | 546 | ||||||
4.250%, 10/01/2027 | 2,590 | 2,662 | ||||||
4.125%, 12/15/2026 | 3,220 | 3,304 | ||||||
3.875%, 09/10/2024 | 440 | 445 | ||||||
3.625%, 05/13/2024 | 1,490 | 1,522 | ||||||
3.625%, 12/01/2027 | 4,735 | 4,611 | ||||||
3.250%, 09/23/2022 | 80 | 81 | ||||||
2.950%, 10/01/2026 | 3,041 | 2,901 | ||||||
2.700%, 05/18/2023 | 2,625 | 2,558 | ||||||
2.250%, 01/23/2020 | 5,665 | 5,647 | ||||||
KKR Group Finance II | ||||||||
5.500%, 02/01/2043 (C) | 120 | 118 | ||||||
Kreditanstalt fuer Wiederaufbau | ||||||||
4.000%, 01/27/2020 | 1,646 | 1,761 | ||||||
1.000%, 07/15/2019 | 10,019 | 9,868 | ||||||
Lazard Group LLC | ||||||||
3.750%, 02/13/2025 | 2,250 | 2,210 | ||||||
Lloyds Bank | ||||||||
3.500%, 05/14/2025 | 100 | 102 | ||||||
Lloyds Bank MTN | ||||||||
5.800%, 01/13/2020 (C) | 200 | 219 | ||||||
Lloyds Banking Group | ||||||||
3.100%, 07/06/2021 | 2,610 | 2,636 | ||||||
M&T Bank | ||||||||
6.875%, 12/29/2049 | 2,770 | 2,776 | ||||||
Macquarie Bank | ||||||||
5.000%, 02/22/2017 (C) | 150 | 151 | ||||||
Macquarie Bank MTN | ||||||||
1.516%, 10/27/2017 (B) (C) | 2,605 | 2,611 | ||||||
Macquarie Group | ||||||||
6.250%, 01/14/2021 (C) | 200 | 222 | ||||||
Marsh & McLennan | ||||||||
3.750%, 03/14/2026 | 1,625 | 1,663 | ||||||
Massachusetts Mutual Life Insurance | ||||||||
8.875%, 06/01/2039 (C) | 1,650 | 2,447 | ||||||
MassMutual Global Funding II | ||||||||
2.500%, 10/17/2022 (C) | 261 | 256 | ||||||
MetLife | ||||||||
6.400%, 12/15/2036 | 1,400 | 1,516 | ||||||
4.600%, 05/13/2046 | 1,144 | 1,188 | ||||||
4.368%, 09/15/2023 | 510 | 550 | ||||||
Metropolitan Life Global Funding I | ||||||||
3.875%, 04/11/2022 (C) | 1,125 | 1,195 | ||||||
1.950%, 09/15/2021 (C) | 2,405 | 2,342 | ||||||
1.550%, 09/13/2019 (C) | 1,615 | 1,592 | ||||||
| 86 | SEI Institutional Investments Trust / Semi-Annual Report / November 30, 2016 |
| Description | Face Amount ($ Thousands) | Market Value ($ Thousands) | ||||||
Mitsubishi UFJ Financial Group | ||||||||
2.757%, 09/13/2026 | $ | 2,785 | $ | 2,630 | ||||
Morgan Stanley MTN | ||||||||
7.300%, 05/13/2019 | 1,875 | 2,094 | ||||||
6.625%, 04/01/2018 | 4,710 | 4,998 | ||||||
5.950%, 12/28/2017 | 2,507 | 2,619 | ||||||
5.625%, 09/23/2019 | 1,145 | 1,244 | ||||||
5.550%, 04/27/2017 | 514 | 523 | ||||||
5.500%, 07/24/2020 | 2,080 | 2,280 | ||||||
5.500%, 07/28/2021 | 200 | 222 | ||||||
5.450%, 01/09/2017 | 1,600 | 1,607 | ||||||
4.350%, 09/08/2026 | 235 | 240 | ||||||
4.100%, 05/22/2023 | 110 | 113 | ||||||
4.000%, 07/23/2025 | 580 | 594 | ||||||
3.950%, 04/23/2027 | 660 | 653 | ||||||
3.875%, 04/29/2024 | 1,250 | 1,281 | ||||||
3.750%, 02/25/2023 | 179 | 184 | ||||||
3.125%, 07/27/2026 | 2,805 | 2,687 | ||||||
2.625%, 11/17/2021 | 9,500 | 9,396 | ||||||
2.500%, 04/21/2021 | 7,399 | 7,318 | ||||||
Morgan Stanley | ||||||||
1.875%, 01/05/2018 | 172 | 172 | ||||||
Murray Street Investment Trust I | ||||||||
4.647%, 03/09/2017 (D) | 2,705 | 2,726 | ||||||
National City Bank | ||||||||
1.203%, 06/07/2017 (B) | 3,000 | 3,001 | ||||||
National City Bank MTN | ||||||||
5.800%, 06/07/2017 | 525 | 536 | ||||||
Nationwide Building Society MTN | ||||||||
2.450%, 07/27/2021 (C) | 950 | 941 | ||||||
Nationwide Financial Services | ||||||||
5.375%, 03/25/2021 (C) | 150 | 164 | ||||||
Nationwide Mutual Insurance | ||||||||
3.140%, 12/15/2024 (B) (C) | 4,407 | 4,337 | ||||||
Navient MTN | ||||||||
8.450%, 06/15/2018 | 530 | 571 | ||||||
New York Life Global Funding | ||||||||
2.150%, 06/18/2019 (C) | 293 | 295 | ||||||
2.100%, 01/02/2019 (C) | 1,625 | 1,635 | ||||||
1.550%, 11/02/2018 (C) | 2,500 | 2,493 | ||||||
New York Life Insurance | ||||||||
6.750%, 11/15/2039 (C) | 1,355 | 1,787 | ||||||
Nordea Bank | ||||||||
4.875%, 05/13/2021 (C) | 1,730 | 1,867 | ||||||
Northern Trust | ||||||||
2.375%, 08/02/2022 | 300 | 298 | ||||||
Northwestern Mutual Life Insurance | ||||||||
6.063%, 03/30/2040 (C) | 2,470 | 3,027 | ||||||
Pacific Life Global Funding MTN | ||||||||
5.000%, 05/15/2017 (C) | 170 | 173 | ||||||
PNC Bank | ||||||||
6.875%, 04/01/2018 | 250 | 266 | ||||||
| Description | Face Amount ($ Thousands) | Market Value ($ Thousands) | ||||||
2.250%, 07/02/2019 | $ | 1,600 | $ | 1,612 | ||||
PNC Bank MTN | ||||||||
2.400%, 10/18/2019 | 2,140 | 2,164 | ||||||
Pricoa Global Funding I MTN | ||||||||
2.550%, 11/24/2020 (C) | 2,875 | 2,877 | ||||||
1.600%, 05/29/2018 (C) | 150 | 150 | ||||||
Private Export Funding | ||||||||
4.375%, 03/15/2019 | 4,660 | 4,973 | ||||||
Progressive | ||||||||
2.450%, 01/15/2027 | 1,015 | 944 | ||||||
Protective Life Global Funding MTN | ||||||||
2.700%, 11/25/2020 (C) | 1,500 | 1,507 | ||||||
Protective Life Global Funding | ||||||||
1.722%, 04/15/2019 (C) | 2,800 | 2,787 | ||||||
Prudential Insurance of America | ||||||||
8.300%, 07/01/2025 (C) | 250 | 326 | ||||||
Royal Bank of Canada | ||||||||
2.300%, 03/22/2021 | 70 | 70 | ||||||
1.875%, 02/05/2020 | 3,200 | 3,183 | ||||||
1.200%, 09/19/2017 | 300 | 300 | ||||||
1.063%, 06/29/2085 (B) | 860 | 569 | ||||||
Royal Bank of Scotland | ||||||||
4.650%, 06/04/2018 | 2,280 | 2,324 | ||||||
Royal Bank of Scotland Group MTN | ||||||||
6.400%, 10/21/2019 | 320 | 349 | ||||||
Royal Bank of Scotland Group | ||||||||
6.100%, 06/10/2023 | 1,650 | 1,677 | ||||||
Santander Holdings USA | ||||||||
3.450%, 08/27/2018 | 55 | 56 | ||||||
Santander UK Group Holdings | ||||||||
5.625%, 09/15/2045 (C) | 210 | 203 | ||||||
2.875%, 08/05/2021 | 4,600 | 4,491 | ||||||
Societe Generale | ||||||||
1.368%, 11/29/2049 (B) | 860 | 533 | ||||||
Stadshypotek | ||||||||
1.875%, 10/02/2019 (C) | 4,015 | 3,998 | ||||||
Standard Chartered | ||||||||
5.700%, 03/26/2044 (C) | 2,007 | 1,975 | ||||||
5.200%, 01/26/2024 (C) | 410 | 421 | ||||||
State Street | ||||||||
4.956%, 03/15/2018 | 2,390 | 2,480 | ||||||
3.300%, 12/16/2024 | 310 | 314 | ||||||
Sumitomo Mitsui Financial Group | ||||||||
3.010%, 10/19/2026 | 2,995 | 2,859 | ||||||
Svenska Handelsbanken MTN | ||||||||
1.875%, 09/07/2021 | 2,655 | 2,570 | ||||||
Synchrony Financial | ||||||||
3.700%, 08/04/2026 | 2,105 | 2,022 | ||||||
Teachers Insurance & Annuity Association of America | ||||||||
6.850%, 12/16/2039 (C) | 1,740 | 2,231 | ||||||
4.900%, 09/15/2044 (C) | 1,205 | 1,286 | ||||||
| SEI Institutional Investments Trust / Semi-Annual Report / November 30, 2016 | 87 |
SCHEDULE OF INVESTMENTS (Unaudited)
Core Fixed Income Fund (Continued)
November 30, 2016
| Description | Face Amount ($ Thousands) | Market Value ($ Thousands) | ||||||
Toronto-Dominion Bank | ||||||||
2.250%, 03/15/2021 (C) | $ | 4,630 | $ | 4,620 | ||||
Travelers | ||||||||
4.600%, 08/01/2043 | 50 | 54 | ||||||
UBS Group Funding Jersey | ||||||||
4.125%, 09/24/2025 (C) | 1,010 | 1,018 | ||||||
4.125%, 04/15/2026 (C) | 1,460 | 1,482 | ||||||
2.650%, 02/01/2022 (C) | 3,260 | 3,167 | ||||||
US Bancorp MTN | ||||||||
3.600%, 09/11/2024 | 160 | 164 | ||||||
2.950%, 07/15/2022 | 497 | 501 | ||||||
US Bank | ||||||||
2.125%, 10/28/2019 | 1,320 | 1,329 | ||||||
Voya Financial | ||||||||
2.900%, 02/15/2018 | 267 | 270 | ||||||
Wachovia Capital Trust III | ||||||||
5.570%, 12/31/2049 (B) | 4,442 | 4,331 | ||||||
WEA Finance LLC | ||||||||
4.750%, 09/17/2044 (C) | 750 | 741 | ||||||
3.750%, 09/17/2024 (C) | 1,370 | 1,387 | ||||||
1.750%, 09/15/2017 (C) | 2,100 | 2,106 | ||||||
Wells Fargo MTN | ||||||||
4.900%, 11/17/2045 | 1,310 | 1,355 | ||||||
4.650%, 11/04/2044 | 560 | 558 | ||||||
4.600%, 04/01/2021 | 500 | 540 | ||||||
4.400%, 06/14/2046 | 220 | 212 | ||||||
4.300%, 07/22/2027 | 3,100 | 3,205 | ||||||
4.100%, 06/03/2026 | 359 | 365 | ||||||
3.500%, 03/08/2022 | 250 | 258 | ||||||
3.450%, 02/13/2023 | 685 | 684 | ||||||
3.000%, 01/22/2021 | 3,020 | 3,072 | ||||||
1.650%, 01/22/2018 | 3,635 | 3,638 | ||||||
Wells Fargo | ||||||||
6.000%, 11/15/2017 | 3,370 | 3,509 | ||||||
5.625%, 12/11/2017 | 830 | 864 | ||||||
5.606%, 01/15/2044 | 700 | 795 | ||||||
5.375%, 11/02/2043 | 220 | 245 | ||||||
4.480%, 01/16/2024 | 392 | 412 | ||||||
3.000%, 04/22/2026 | 2,075 | 1,991 | ||||||
3.000%, 10/23/2026 | 5,180 | 4,957 | ||||||
2.100%, 07/26/2021 | 5,215 | 5,098 | ||||||
Wells Fargo Capital X | ||||||||
5.950%, 12/15/2036 | 520 | 552 | ||||||
Welltower | ||||||||
4.250%, 04/01/2026 | 1,100 | 1,136 | ||||||
|
| |||||||
| 544,458 | ||||||||
|
| |||||||
Health Care — 2.7% | ||||||||
Abbott Laboratories | ||||||||
4.900%, 11/30/2046 | 1,885 | 1,901 | ||||||
4.750%, 11/30/2036 | 830 | 839 | ||||||
3.750%, 11/30/2026 | 6,155 | 6,086 | ||||||
| Description | Face Amount ($ Thousands) | Market Value ($ Thousands) | ||||||
3.400%, 11/30/2023 | $ | 7,785 | $ | 7,724 | ||||
2.900%, 11/30/2021 | 1,965 | 1,956 | ||||||
AbbVie | ||||||||
4.700%, 05/14/2045 | 34 | 33 | ||||||
4.500%, 05/14/2035 | 1,800 | 1,760 | ||||||
4.450%, 05/14/2046 | 1,525 | 1,430 | ||||||
3.600%, 05/14/2025 | 2,435 | 2,406 | ||||||
3.200%, 05/14/2026 | 2,730 | 2,594 | ||||||
2.900%, 11/06/2022 | 350 | 345 | ||||||
2.500%, 05/14/2020 | 2,639 | 2,633 | ||||||
1.800%, 05/14/2018 | 1,500 | 1,499 | ||||||
1.750%, 11/06/2017 | 2,120 | 2,125 | ||||||
Actavis | ||||||||
3.250%, 10/01/2022 | 112 | 112 | ||||||
Actavis Funding SCS | ||||||||
4.750%, 03/15/2045 | 3,551 | 3,513 | ||||||
4.550%, 03/15/2035 | 1,010 | 996 | ||||||
3.800%, 03/15/2025 | 6,153 | 6,201 | ||||||
3.450%, 03/15/2022 | 2,935 | 2,977 | ||||||
Aetna | ||||||||
4.375%, 06/15/2046 | 250 | 246 | ||||||
3.200%, 06/15/2026 | 920 | 900 | ||||||
2.800%, 06/15/2023 | 7,898 | 7,720 | ||||||
2.400%, 06/15/2021 | 730 | 724 | ||||||
2.200%, 03/15/2019 | 945 | 950 | ||||||
Amgen | ||||||||
5.150%, 11/15/2041 | 2,020 | 2,133 | ||||||
4.663%, 06/15/2051 (C) | 3,939 | 3,821 | ||||||
4.400%, 05/01/2045 | 2,905 | 2,774 | ||||||
3.875%, 11/15/2021 | 200 | 210 | ||||||
3.625%, 05/22/2024 | 220 | 224 | ||||||
2.600%, 08/19/2026 | 1,550 | 1,436 | ||||||
2.125%, 05/01/2020 | 84 | 84 | ||||||
Anthem | ||||||||
5.875%, 06/15/2017 | 350 | 358 | ||||||
4.625%, 05/15/2042 | 219 | 217 | ||||||
3.700%, 08/15/2021 | 290 | 300 | ||||||
3.300%, 01/15/2023 | 133 | 133 | ||||||
3.125%, 05/15/2022 | 740 | 738 | ||||||
AstraZeneca | ||||||||
5.900%, 09/15/2017 | 100 | 103 | ||||||
3.375%, 11/16/2025 | 1,000 | 996 | ||||||
Baxalta | ||||||||
3.600%, 06/23/2022 | 2,920 | 2,959 | ||||||
Becton Dickinson | ||||||||
4.875%, 05/15/2044 | 95 | 98 | ||||||
4.685%, 12/15/2044 | 668 | 685 | ||||||
3.734%, 12/15/2024 | 989 | 1,013 | ||||||
2.675%, 12/15/2019 | 1,551 | 1,579 | ||||||
Biogen | ||||||||
5.200%, 09/15/2045 | 900 | 962 | ||||||
3.625%, 09/15/2022 | 815 | 840 | ||||||
| 88 | SEI Institutional Investments Trust / Semi-Annual Report / November 30, 2016 |
| Description | Face Amount ($ Thousands) | Market Value ($ Thousands) | ||||||
Catholic Health Initiatives | ||||||||
4.350%, 11/01/2042 | $ | 190 | $ | 169 | ||||
Celgene | ||||||||
5.000%, 08/15/2045 | 5,397 | 5,579 | ||||||
3.875%, 08/15/2025 | 1,380 | 1,403 | ||||||
3.625%, 05/15/2024 | 166 | 167 | ||||||
3.550%, 08/15/2022 | 550 | 564 | ||||||
1.900%, 08/15/2017 | 175 | 176 | ||||||
Express Scripts Holding | ||||||||
4.800%, 07/15/2046 | 1,073 | 1,028 | ||||||
3.400%, 03/01/2027 | 2,300 | 2,178 | ||||||
Forest Laboratories | ||||||||
5.000%, 12/15/2021 (C) | 173 | 187 | ||||||
Gilead Sciences | ||||||||
4.750%, 03/01/2046 | 540 | 555 | ||||||
4.500%, 02/01/2045 | 95 | 94 | ||||||
4.150%, 03/01/2047 | 4,890 | 4,580 | ||||||
3.700%, 04/01/2024 | 2,660 | 2,732 | ||||||
3.650%, 03/01/2026 | 890 | 898 | ||||||
3.250%, 09/01/2022 | 1,344 | 1,374 | ||||||
GlaxoSmithKline Capital | ||||||||
5.650%, 05/15/2018 | 1,590 | 1,680 | ||||||
2.850%, 05/08/2022 | 410 | 413 | ||||||
Humana | ||||||||
7.200%, 06/15/2018 | 1,950 | 2,111 | ||||||
3.850%, 10/01/2024 | 2,530 | 2,584 | ||||||
Johnson & Johnson | ||||||||
4.500%, 12/05/2043 | 1,500 | 1,687 | ||||||
3.700%, 03/01/2046 | 970 | 959 | ||||||
Medtronic | ||||||||
4.625%, 03/15/2045 | 860 | 913 | ||||||
4.375%, 03/15/2035 | 176 | 183 | ||||||
3.625%, 03/15/2024 | 1,140 | 1,184 | ||||||
3.500%, 03/15/2025 | 700 | 718 | ||||||
3.150%, 03/15/2022 | 150 | 154 | ||||||
Merck | ||||||||
2.750%, 02/10/2025 | 520 | 511 | ||||||
2.350%, 02/10/2022 | 2,245 | 2,234 | ||||||
Novartis Securities Investment | ||||||||
5.125%, 02/10/2019 | 94 | 101 | ||||||
Perrigo Finance Unlimited | ||||||||
4.375%, 03/15/2026 | 1,240 | 1,239 | ||||||
Pfizer | ||||||||
4.000%, 12/15/2036 | 2,285 | 2,293 | ||||||
3.000%, 12/15/2026 | 1,315 | 1,296 | ||||||
2.200%, 12/15/2021 | 2,635 | 2,617 | ||||||
Shire Acquisitions Investments Ireland DAC | ||||||||
3.200%, 09/23/2026 | 3,785 | 3,550 | ||||||
Teva Pharmaceutical Finance | ||||||||
3.650%, 11/10/2021 | 184 | 186 | ||||||
Teva Pharmaceutical Finance Netherlands III | ||||||||
3.150%, 10/01/2026 | 4,100 | 3,782 | ||||||
| Description | Face Amount ($ Thousands) | Market Value ($ Thousands) | ||||||
2.800%, 07/21/2023 | $ | 2,830 | $ | 2,667 | ||||
Thermo Fisher Scientific | ||||||||
3.600%, 08/15/2021 | 710 | 737 | ||||||
3.300%, 02/15/2022 | 905 | 919 | ||||||
2.950%, 09/19/2026 | 1,990 | 1,877 | ||||||
UnitedHealth Group | ||||||||
6.625%, 11/15/2037 | 200 | 263 | ||||||
5.800%, 03/15/2036 | 560 | 674 | ||||||
4.625%, 07/15/2035 | 2,235 | 2,410 | ||||||
3.875%, 10/15/2020 | 870 | 917 | ||||||
3.375%, 11/15/2021 | 400 | 416 | ||||||
3.100%, 03/15/2026 | 1,680 | 1,666 | ||||||
2.875%, 12/15/2021 | 1,895 | 1,928 | ||||||
2.875%, 03/15/2023 | 150 | 150 | ||||||
Wyeth LLC | ||||||||
6.450%, 02/01/2024 | 365 | 447 | ||||||
5.950%, 04/01/2037 | 320 | 398 | ||||||
Zimmer Biomet Holdings | ||||||||
2.700%, 04/01/2020 | 70 | 70 | ||||||
|
| |||||||
| 146,951 | ||||||||
|
| |||||||
Industrials — 1.7% | ||||||||
ABB Finance USA | ||||||||
4.375%, 05/08/2042 | 180 | 189 | ||||||
AerCap Ireland Capital | ||||||||
4.500%, 05/15/2021 | 590 | 608 | ||||||
Air 2 US | ||||||||
8.027%, 10/01/2019 (C) | 344 | 361 | ||||||
American Airlines, Pass-Through Trust, Ser 2011-1, Cl A | ||||||||
5.250%, 01/31/2021 | 59 | 64 | ||||||
American Airlines, Pass-Through Trust, Ser 2013-2, Cl A | ||||||||
4.950%, 01/15/2023 | 3,237 | 3,468 | ||||||
Aviation Capital Group | ||||||||
6.750%, 04/06/2021 (C) | 720 | 841 | ||||||
BAE Systems | ||||||||
4.750%, 10/11/2021 (C) | 3,955 | 4,261 | ||||||
Boeing | ||||||||
7.250%, 06/15/2025 | 107 | 139 | ||||||
4.875%, 02/15/2020 | 2,440 | 2,662 | ||||||
0.950%, 05/15/2018 | 40 | 40 | ||||||
Burlington Northern Santa Fe LLC | ||||||||
7.290%, 06/01/2036 | 200 | 274 | ||||||
4.900%, 04/01/2044 | 115 | 127 | ||||||
4.550%, 09/01/2044 | 1,115 | 1,173 | ||||||
4.150%, 04/01/2045 | 1,140 | 1,136 | ||||||
4.100%, 06/01/2021 | 449 | 479 | ||||||
3.050%, 09/01/2022 | 300 | 307 | ||||||
Canadian Pacific Railway | ||||||||
6.125%, 09/15/2115 | 34 | 39 | ||||||
| SEI Institutional Investments Trust / Semi-Annual Report / November 30, 2016 | 89 |
SCHEDULE OF INVESTMENTS (Unaudited)
Core Fixed Income Fund (Continued)
November 30, 2016
| Description | Face Amount ($ Thousands) | Market Value ($ Thousands) | ||||||
Caterpillar | ||||||||
7.900%, 12/15/2018 | $ | 50 | $ | 56 | ||||
4.300%, 05/15/2044 | 50 | 52 | ||||||
Caterpillar Financial Services MTN | ||||||||
2.750%, 08/20/2021 | 1,915 | 1,927 | ||||||
1.250%, 11/06/2017 | 21 | 21 | ||||||
Continental Airlines, Pass-Through Trust, Ser 1997-4, Cl A | ||||||||
6.900%, 01/02/2018 | 28 | 29 | ||||||
Continental Airlines, Pass-Through Trust, Ser 1999-1, Cl A | ||||||||
6.545%, 02/02/2019 | 312 | 328 | ||||||
Continental Airlines, Pass-Through Trust, Ser 1999-2, Cl A | ||||||||
7.256%, 03/15/2020 | 631 | 675 | ||||||
Continental Airlines, Pass-Through Trust, Ser 2000-1, Cl A | ||||||||
8.048%, 11/01/2020 | 1,229 | 1,364 | ||||||
Continental Airlines, Pass-Through Trust, Ser 2007-1, Cl A | ||||||||
5.983%, 04/19/2022 | 2,207 | 2,427 | ||||||
CSX | ||||||||
4.250%, 06/01/2021 | 65 | 70 | ||||||
Delta Air Lines, Pass-Through Trust, Ser 2007- 1, Cl A | ||||||||
6.821%, 08/10/2022 | 1,166 | 1,364 | ||||||
Delta Air Lines, Pass-Through Trust, Ser 2010- 2, Cl A | ||||||||
4.950%, 05/23/2019 | 34 | 35 | ||||||
Eaton | ||||||||
7.625%, 04/01/2024 | 325 | 392 | ||||||
4.150%, 11/02/2042 | 530 | 516 | ||||||
4.000%, 11/02/2032 | 99 | 98 | ||||||
2.750%, 11/02/2022 | 1,460 | 1,443 | ||||||
1.500%, 11/02/2017 | 82 | 82 | ||||||
FedEx | ||||||||
4.550%, 04/01/2046 | 1,755 | 1,749 | ||||||
GE Capital International Funding Unlimited | ||||||||
4.418%, 11/15/2035 | 2,970 | 3,092 | ||||||
2.342%, 11/15/2020 | 1,670 | 1,669 | ||||||
General Electric | ||||||||
5.250%, 12/06/2017 | 91 | 95 | ||||||
4.500%, 03/11/2044 | 1,310 | 1,380 | ||||||
4.125%, 10/09/2042 | 91 | 91 | ||||||
ILFC E-Capital Trust II | ||||||||
4.250%, 12/21/2065 (B) (C) | 1,200 | 984 | ||||||
Illinois Tool Works | ||||||||
2.650%, 11/15/2026 | 1,015 | 975 | ||||||
Ingersoll-Rand Luxembourg Finance | ||||||||
2.625%, 05/01/2020 | 133 | 133 | ||||||
International Lease Finance | ||||||||
7.125%, 09/01/2018 (C) | 4,025 | 4,357 | ||||||
| Description | Face Amount ($ Thousands) | Market Value ($ Thousands) | ||||||
L-3 Communications | ||||||||
4.950%, 02/15/2021 | $ | 212 | $ | 228 | ||||
3.850%, 12/15/2026 | 715 | 714 | ||||||
Lockheed Martin | ||||||||
4.700%, 05/15/2046 | 1,035 | 1,118 | ||||||
3.550%, 01/15/2026 | 4,150 | 4,247 | ||||||
3.350%, 09/15/2021 | 1,885 | 1,954 | ||||||
3.100%, 01/15/2023 | 110 | 111 | ||||||
2.500%, 11/23/2020 | 1,770 | 1,782 | ||||||
Mexico City Airport Trust | ||||||||
5.500%, 10/31/2046 (C) | 2,720 | 2,400 | ||||||
Northrop Grumman | ||||||||
3.850%, 04/15/2045 | 638 | 604 | ||||||
3.250%, 08/01/2023 | 7,270 | 7,443 | ||||||
3.200%, 02/01/2027 | 2,655 | 2,642 | ||||||
Penske Truck Leasing LP | ||||||||
3.400%, 11/15/2026 (C) | 2,895 | 2,789 | ||||||
3.375%, 02/01/2022 (C) | 1,267 | 1,276 | ||||||
3.200%, 07/15/2020 (C) | 1,485 | 1,500 | ||||||
Raytheon | ||||||||
3.125%, 10/15/2020 | 720 | 745 | ||||||
Siemens Financieringsmaatschappij | ||||||||
2.900%, 05/27/2022 (C) | 2,940 | 2,976 | ||||||
2.350%, 10/15/2026 (C) | 2,325 | 2,155 | ||||||
Union Pacific | ||||||||
4.050%, 03/01/2046 | 1,290 | 1,283 | ||||||
United Parcel Service | ||||||||
3.125%, 01/15/2021 | 90 | 94 | ||||||
United Technologies | ||||||||
8.875%, 11/15/2019 | 400 | 476 | ||||||
5.400%, 05/01/2035 | 640 | 750 | ||||||
1.950%, 11/01/2021 | 1,475 | 1,442 | ||||||
1.800%, 06/01/2017 | 350 | 351 | ||||||
1.778%, 05/04/2018 (D) | 4,500 | 4,499 | ||||||
US Airways, Pass-Through Trust, Ser 2012-1, Cl A | ||||||||
5.900%, 10/01/2024 | 39 | 43 | ||||||
US Airways, Pass-Through Trust, Ser 2012-2, Cl A | ||||||||
4.625%, 06/03/2025 | 4,196 | 4,490 | ||||||
Valmont Industries | ||||||||
5.250%, 10/01/2054 | 925 | 805 | ||||||
Wabtec | ||||||||
3.450%, 11/15/2026 (C) | 1,590 | 1,530 | ||||||
Waste Management | ||||||||
3.900%, 03/01/2035 | 39 | 38 | ||||||
3.500%, 05/15/2024 | 650 | 668 | ||||||
|
| |||||||
| 92,725 | ||||||||
|
| |||||||
Information Technology — 1.6% | ||||||||
Apple | ||||||||
4.650%, 02/23/2046 | 2,460 | 2,604 | ||||||
| 90 | SEI Institutional Investments Trust / Semi-Annual Report / November 30, 2016 |
| Description | Face Amount ($ Thousands) | Market Value ($ Thousands) | ||||||
4.375%, 05/13/2045 | $ | 1,625 | $ | 1,661 | ||||
3.850%, 05/04/2043 | 2,545 | 2,403 | ||||||
3.850%, 08/04/2046 | 1,645 | 1,539 | ||||||
3.450%, 05/06/2024 | 350 | 361 | ||||||
3.450%, 02/09/2045 | 156 | 137 | ||||||
2.450%, 08/04/2026 | 2,560 | 2,407 | ||||||
2.150%, 02/09/2022 | 90 | 88 | ||||||
1.131%, 05/03/2018 (B) | 273 | 274 | ||||||
Cisco Systems | ||||||||
2.200%, 09/20/2023 | 3,260 | 3,133 | ||||||
1.850%, 09/20/2021 | 6,825 | 6,648 | ||||||
1.400%, 09/20/2019 | 3,975 | 3,929 | ||||||
Diamond 1 Finance | ||||||||
6.020%, 06/15/2026 (C) | 1,200 | 1,263 | ||||||
4.420%, 06/15/2021 (C) | 2,150 | 2,212 | ||||||
3.480%, 06/01/2019 (C) | 1,890 | 1,925 | ||||||
Fidelity National Information Services | ||||||||
4.500%, 08/15/2046 | 718 | 668 | ||||||
3.625%, 10/15/2020 | 1,640 | 1,693 | ||||||
2.850%, 10/15/2018 | 2,050 | 2,085 | ||||||
2.250%, 08/15/2021 | 1,165 | 1,136 | ||||||
Harris | ||||||||
5.054%, 04/27/2045 | 480 | 498 | ||||||
4.854%, 04/27/2035 | 210 | 214 | ||||||
Hewlett Packard Enterprise | ||||||||
6.600%, 10/15/2045 (C) | 2,625 | 2,588 | ||||||
5.150%, 10/15/2025 (C) | 925 | 946 | ||||||
HP | ||||||||
4.650%, 12/09/2021 | 58 | 62 | ||||||
Intel | ||||||||
4.900%, 07/29/2045 | 110 | 123 | ||||||
3.700%, 07/29/2025 | 300 | 316 | ||||||
3.300%, 10/01/2021 | 75 | 78 | ||||||
3.100%, 07/29/2022 | 75 | 77 | ||||||
International Business Machines | ||||||||
5.700%, 09/14/2017 | 210 | 218 | ||||||
3.625%, 02/12/2024 | 355 | 369 | ||||||
KLA-Tencor | ||||||||
4.125%, 11/01/2021 | 2,450 | 2,555 | ||||||
Lam Research | ||||||||
3.800%, 03/15/2025 | 150 | 151 | ||||||
2.750%, 03/15/2020 | 95 | 95 | ||||||
Mastercard | ||||||||
3.375%, 04/01/2024 | 720 | 743 | ||||||
Microsoft | ||||||||
4.450%, 11/03/2045 | 1,000 | 1,055 | ||||||
4.200%, 11/03/2035 | 1,165 | 1,215 | ||||||
3.950%, 08/08/2056 | 685 | 637 | ||||||
3.750%, 02/12/2045 | 2,195 | 2,062 | ||||||
3.700%, 08/08/2046 | 2,165 | 2,015 | ||||||
3.500%, 02/12/2035 | 2,294 | 2,197 | ||||||
3.450%, 08/08/2036 | 1,025 | 967 | ||||||
| Description | Face Amount ($ Thousands) | Market Value ($ Thousands) | ||||||
2.400%, 08/08/2026 | $ | 2,510 | $ | 2,383 | ||||
2.375%, 02/12/2022 | 50 | 50 | ||||||
2.375%, 05/01/2023 | 50 | 49 | ||||||
2.000%, 08/08/2023 | 3,905 | 3,721 | ||||||
0.875%, 11/15/2017 | 54 | 54 | ||||||
National Semiconductor | ||||||||
6.600%, 06/15/2017 | 280 | 288 | ||||||
Oracle | ||||||||
5.750%, 04/15/2018 | 200 | 212 | ||||||
3.900%, 05/15/2035 | 3,995 | 3,908 | ||||||
3.850%, 07/15/2036 | 810 | 785 | ||||||
2.400%, 09/15/2023 | 7,345 | 7,095 | ||||||
1.900%, 09/15/2021 | 2,025 | 1,979 | ||||||
1.200%, 10/15/2017 | 104 | 104 | ||||||
TSMC Global | ||||||||
1.625%, 04/03/2018 (C) | 3,415 | 3,404 | ||||||
Visa | ||||||||
4.300%, 12/14/2045 | 810 | 845 | ||||||
3.150%, 12/14/2025 | 820 | 821 | ||||||
2.800%, 12/14/2022 | 4,980 | 5,017 | ||||||
2.200%, 12/14/2020 | 480 | 480 | ||||||
|
| |||||||
| 86,542 | ||||||||
|
| |||||||
Materials — 1.0% | ||||||||
Air Liquide Finance | ||||||||
2.500%, 09/27/2026 (C) | 1,520 | 1,430 | ||||||
2.250%, 09/27/2023 (C) | 2,735 | 2,622 | ||||||
1.750%, 09/27/2021 (C) | 1,780 | 1,717 | ||||||
1.375%, 09/27/2019 (C) | 2,110 | 2,077 | ||||||
Barrick Gold | ||||||||
6.950%, 04/01/2019 | 662 | 726 | ||||||
5.250%, 04/01/2042 | 675 | 679 | ||||||
4.100%, 05/01/2023 | 477 | 495 | ||||||
Barrick North America Finance LLC | ||||||||
5.700%, 05/30/2041 | 520 | 549 | ||||||
4.400%, 05/30/2021 | 2,020 | 2,145 | ||||||
BHP Billiton Finance USA | ||||||||
6.750%, 10/19/2075 (B) (C) | 1,610 | 1,775 | ||||||
6.500%, 04/01/2019 | 445 | 491 | ||||||
5.000%, 09/30/2043 | 815 | 907 | ||||||
3.250%, 11/21/2021 | 2,850 | 2,944 | ||||||
2.875%, 02/24/2022 | 160 | 162 | ||||||
Celulosa Arauco y Constitucion | ||||||||
4.750%, 01/11/2022 | 1,050 | 1,079 | ||||||
CF Industries | ||||||||
4.500%, 12/01/2026 (C) | 1,785 | 1,752 | ||||||
3.400%, 12/01/2021 (C) | 1,425 | 1,413 | ||||||
Chevron Phillips Chemical LLC | ||||||||
3.400%, 12/01/2026 (C) | 1,050 | 1,044 | ||||||
Dow Chemical | ||||||||
8.550%, 05/15/2019 | 113 | 130 | ||||||
4.125%, 11/15/2021 | 219 | 232 | ||||||
| SEI Institutional Investments Trust / Semi-Annual Report / November 30, 2016 | 91 |
SCHEDULE OF INVESTMENTS (Unaudited)
Core Fixed Income Fund (Continued)
November 30, 2016
| Description | Face Amount ($ Thousands) | Market Value ($ Thousands) | ||||||
3.000%, 11/15/2022 | $ | 5,005 | $ | 5,008 | ||||
Eastman Chemical | ||||||||
2.700%, 01/15/2020 | 2,295 | 2,303 | ||||||
Ecolab | ||||||||
4.350%, 12/08/2021 | 420 | 452 | ||||||
Equate Petrochemical BV | ||||||||
3.000%, 03/03/2022 (C) | 1,900 | 1,796 | ||||||
Equate Petrochemical BV MTN | ||||||||
4.250%, 11/03/2026 (C) | 3,105 | 2,936 | ||||||
Freeport-McMoRan | ||||||||
4.000%, 11/14/2021 | 1,280 | 1,254 | ||||||
Freeport-McMoran Oil & Gas LLC | ||||||||
6.875%, 02/15/2023 | 49 | 52 | ||||||
6.500%, 11/15/2020 | 227 | 234 | ||||||
Georgia-Pacific LLC | ||||||||
8.875%, 05/15/2031 | 230 | 344 | ||||||
Glencore Finance Canada | ||||||||
2.700%, 10/25/2017 (C) | 1,900 | 1,904 | ||||||
Glencore Funding LLC | ||||||||
2.875%, 04/16/2020 (C) | 1,350 | 1,336 | ||||||
International Paper | ||||||||
5.150%, 05/15/2046 | 1,465 | 1,478 | ||||||
5.000%, 09/15/2035 | 1,155 | 1,192 | ||||||
Mosaic | ||||||||
5.625%, 11/15/2043 | 470 | 443 | ||||||
OCP | ||||||||
4.500%, 10/22/2025 (C) | 1,860 | 1,762 | ||||||
Potash Corp of Saskatchewan | ||||||||
4.875%, 03/30/2020 | 10 | 11 | ||||||
PPG Industries | ||||||||
6.650%, 03/15/2018 | 94 | 100 | ||||||
Praxair | ||||||||
4.050%, 03/15/2021 | 73 | 78 | ||||||
Rio Tinto Finance USA | ||||||||
7.125%, 07/15/2028 | 20 | 26 | ||||||
3.750%, 09/20/2021 | 290 | 304 | ||||||
Rock-Tenn | ||||||||
4.000%, 03/01/2023 | 330 | 342 | ||||||
3.500%, 03/01/2020 | 570 | 581 | ||||||
Southern Copper | ||||||||
5.250%, 11/08/2042 | 3,610 | 3,279 | ||||||
Stauffer Chemical (A) (E) | ||||||||
8.887%, 04/15/2018 | 860 | 602 | ||||||
8.610%, 04/15/2017 | 350 | 245 | ||||||
Vale Overseas | ||||||||
6.875%, 11/21/2036 | 3,323 | 3,200 | ||||||
6.250%, 08/10/2026 | 705 | 734 | ||||||
5.875%, 06/10/2021 | 700 | 733 | ||||||
|
| |||||||
| 57,098 | ||||||||
|
| |||||||
| Description | Face Amount ($ Thousands) | Market Value ($ Thousands) | ||||||
Real Estate — 0.7% | ||||||||
Alexandria Real Estate Equities | ||||||||
2.750%, 01/15/2020 | $ | 3,000 | $ | 2,990 | ||||
AvalonBay Communities MTN | ||||||||
3.950%, 01/15/2021 | 1,500 | 1,578 | ||||||
Boston Properties | ||||||||
3.800%, 02/01/2024 | 2,000 | 2,033 | ||||||
DDR | ||||||||
4.625%, 07/15/2022 | 2,355 | 2,494 | ||||||
3.375%, 05/15/2023 | 1,525 | 1,479 | ||||||
ERP Operating | ||||||||
5.750%, 06/15/2017 | 100 | 102 | ||||||
4.625%, 12/15/2021 | 200 | 218 | ||||||
First Industrial MTN | ||||||||
7.500%, 12/01/2017 | 1,765 | 1,857 | ||||||
HCP | ||||||||
3.875%, 08/15/2024 | 4,611 | 4,576 | ||||||
2.625%, 02/01/2020 | 100 | 100 | ||||||
Health Care | ||||||||
4.500%, 01/15/2024 | 183 | 193 | ||||||
Healthcare Realty Trust | ||||||||
5.750%, 01/15/2021 | 60 | 66 | ||||||
3.750%, 04/15/2023 | 75 | 75 | ||||||
Highwoods Properties | ||||||||
7.500%, 04/15/2018 | 1,339 | 1,435 | ||||||
Mid-America Apartments | ||||||||
4.300%, 10/15/2023 | 625 | 654 | ||||||
4.000%, 11/15/2025 | 695 | 704 | ||||||
3.750%, 06/15/2024 | 1,585 | 1,590 | ||||||
Piedmont Operating Partnership | ||||||||
4.450%, 03/15/2024 | 125 | 125 | ||||||
Post Apartment Homes | ||||||||
4.750%, 10/15/2017 | 70 | 71 | ||||||
Realty Income | ||||||||
3.250%, 10/15/2022 | 150 | 152 | ||||||
2.000%, 01/31/2018 | 2,115 | 2,122 | ||||||
Simon Property Group | ||||||||
3.250%, 11/30/2026 | 1,310 | 1,290 | ||||||
2.350%, 01/30/2022 | 985 | 974 | ||||||
SL Green Realty | ||||||||
7.750%, 03/15/2020 | 2,000 | 2,268 | ||||||
Tanger Properties | ||||||||
3.875%, 12/01/2023 | 790 | 803 | ||||||
3.750%, 12/01/2024 | 865 | 867 | ||||||
Ventas Realty | ||||||||
4.125%, 01/15/2026 | 45 | 46 | ||||||
2.700%, 04/01/2020 | 2,950 | 2,972 | ||||||
Welltower | ||||||||
4.950%, 01/15/2021 | 3,340 | 3,606 | ||||||
4.700%, 09/15/2017 | 225 | 230 | ||||||
|
| |||||||
| 37,670 | ||||||||
|
| |||||||
| 92 | SEI Institutional Investments Trust / Semi-Annual Report / November 30, 2016 |
| Description | Face Amount ($ Thousands) | Market Value ($ Thousands) | ||||||
Telecommunication Services — 1.4% | ||||||||
America Movil | ||||||||
5.625%, 11/15/2017 | $ | 1,450 | $ | 1,503 | ||||
5.000%, 03/30/2020 | 540 | 579 | ||||||
AT&T | ||||||||
6.000%, 08/15/2040 | 2,220 | 2,442 | ||||||
5.800%, 02/15/2019 | 675 | 726 | ||||||
5.500%, 02/01/2018 | 130 | 135 | ||||||
4.750%, 05/15/2046 | 5,385 | 5,030 | ||||||
4.500%, 03/09/2048 (C) | 2,218 | 1,976 | ||||||
4.450%, 05/15/2021 | 440 | 465 | ||||||
4.450%, 04/01/2024 | 4,045 | 4,205 | ||||||
4.350%, 06/15/2045 | 2,257 | 1,979 | ||||||
3.950%, 01/15/2025 | 2,510 | 2,508 | ||||||
3.900%, 03/11/2024 | 1,000 | 1,005 | ||||||
3.875%, 08/15/2021 | 350 | 363 | ||||||
3.800%, 03/15/2022 | 1,340 | 1,367 | ||||||
3.400%, 05/15/2025 | 10,569 | 10,154 | ||||||
3.000%, 02/15/2022 | 700 | 694 | ||||||
3.000%, 06/30/2022 | 3,086 | 3,028 | ||||||
2.450%, 06/30/2020 | 64 | 63 | ||||||
1.750%, 01/15/2018 | 150 | 150 | ||||||
Bharti Airtel | ||||||||
4.375%, 06/10/2025 (C) | 1,870 | 1,838 | ||||||
British Telecommunications | ||||||||
5.950%, 01/15/2018 | 1,011 | 1,057 | ||||||
Comcast Cable Holdings LLC | ||||||||
10.125%, 04/15/2022 | 190 | 247 | ||||||
Cox Communications | ||||||||
4.800%, 02/01/2035 (C) | 365 | 334 | ||||||
4.700%, 12/15/2042 (C) | 10 | 9 | ||||||
Deutsche Telekom International Finance | ||||||||
2.250%, 03/06/2017 (C) | 2,310 | 2,315 | ||||||
Grupo Televisa | ||||||||
5.000%, 05/13/2045 | 695 | 586 | ||||||
Nippon Telegraph & Telephone | ||||||||
1.400%, 07/18/2017 | 200 | 200 | ||||||
Rogers Communications | ||||||||
4.100%, 10/01/2023 | 133 | 140 | ||||||
Sprint Capital | ||||||||
8.750%, 03/15/2032 | 390 | 410 | ||||||
Sprint Spectrum LLC | ||||||||
3.360%, 09/20/2021 (C) | 2,150 | 2,155 | ||||||
Telefonica Emisiones SAU | ||||||||
6.221%, 07/03/2017 | 100 | 103 | ||||||
5.877%, 07/15/2019 | 180 | 195 | ||||||
5.462%, 02/16/2021 | 69 | 75 | ||||||
5.134%, 04/27/2020 | 1,160 | 1,241 | ||||||
Verizon Communications | ||||||||
6.400%, 09/15/2033 | 1,994 | 2,382 | ||||||
5.850%, 09/15/2035 | 150 | 170 | ||||||
5.150%, 09/15/2023 | 2,230 | 2,469 | ||||||
| Description | Face Amount ($ Thousands) | Market Value ($ Thousands) | ||||||
5.050%, 03/15/2034 | $ | 308 | $ | 322 | ||||
4.862%, 08/21/2046 | 3,821 | 3,831 | ||||||
4.522%, 09/15/2048 | 1,430 | 1,364 | ||||||
4.400%, 11/01/2034 | 7,080 | 6,896 | ||||||
4.272%, 01/15/2036 | 3,830 | 3,660 | ||||||
4.150%, 03/15/2024 | 880 | 923 | ||||||
4.125%, 08/15/2046 | 1,870 | 1,668 | ||||||
3.850%, 11/01/2042 | 800 | 692 | ||||||
Vodafone Group | ||||||||
2.950%, 02/19/2023 | 1,850 | 1,802 | ||||||
|
| |||||||
| 75,456 | ||||||||
|
| |||||||
Utilities — 2.4% | ||||||||
AEP Texas Central Transition Funding II LLC | ||||||||
5.170%, 01/01/2018 | 439 | 448 | ||||||
Alabama Power | ||||||||
5.500%, 10/15/2017 | 100 | 104 | ||||||
Alabama Power Capital Trust V | ||||||||
3.946%, 10/01/2042 (B) | 100 | 96 | ||||||
American Electric Power | ||||||||
1.650%, 12/15/2017 | 1,920 | 1,921 | ||||||
Appalachian Power | ||||||||
4.450%, 06/01/2045 | 1,600 | 1,616 | ||||||
Arizona Public Service | ||||||||
2.550%, 09/15/2026 | 995 | 941 | ||||||
Berkshire Hathaway Energy | ||||||||
6.500%, 09/15/2037 | 3,200 | 4,099 | ||||||
4.500%, 02/01/2045 | 1,500 | 1,545 | ||||||
3.750%, 11/15/2023 | 488 | 511 | ||||||
Boston Gas | ||||||||
4.487%, 02/15/2042 (C) | 140 | 142 | ||||||
CenterPoint Energy Resources | ||||||||
6.125%, 11/01/2017 | 320 | 333 | ||||||
4.500%, 01/15/2021 | 246 | 258 | ||||||
CMS Energy | ||||||||
2.950%, 02/15/2027 | 740 | 703 | ||||||
Comision Federal de Electricidad | ||||||||
4.750%, 02/23/2027 (C) | 1,875 | 1,744 | ||||||
Commonwealth Edison | ||||||||
3.700%, 03/01/2045 | 355 | 334 | ||||||
Consolidated Edison of New York | ||||||||
6.650%, 04/01/2019 | 650 | 719 | ||||||
5.850%, 04/01/2018 | 236 | 250 | ||||||
4.450%, 03/15/2044 | 2,475 | 2,579 | ||||||
3.850%, 06/15/2046 | 625 | 593 | ||||||
Dominion Resources | ||||||||
4.700%, 12/01/2044 | 505 | 511 | ||||||
2.962%, 07/01/2019 | 640 | 649 | ||||||
2.850%, 08/15/2026 | 1,015 | 950 | ||||||
2.500%, 12/01/2019 | 1,985 | 2,009 | ||||||
2.000%, 08/15/2021 | 1,015 | 985 | ||||||
1.600%, 08/15/2019 | 1,335 | 1,318 | ||||||
| SEI Institutional Investments Trust / Semi-Annual Report / November 30, 2016 | 93 |
SCHEDULE OF INVESTMENTS (Unaudited)
Core Fixed Income Fund (Continued)
November 30, 2016
| Description | Face Amount ($ Thousands) | Market Value ($ Thousands) | ||||||
DTE Energy | ||||||||
1.500%, 10/01/2019 | $ | 1,805 | $ | 1,774 | ||||
Duke Energy | ||||||||
4.800%, 12/15/2045 | 320 | 335 | ||||||
3.750%, 09/01/2046 | 840 | 751 | ||||||
3.550%, 09/15/2021 | 722 | 750 | ||||||
2.650%, 09/01/2026 | 1,940 | 1,800 | ||||||
1.800%, 09/01/2021 | 1,550 | 1,494 | ||||||
Duke Energy Carolinas LLC | ||||||||
5.250%, 01/15/2018 | 326 | 339 | ||||||
4.250%, 12/15/2041 | 1,000 | 1,016 | ||||||
4.000%, 09/30/2042 | 1,512 | 1,486 | ||||||
3.875%, 03/15/2046 | 670 | 648 | ||||||
2.500%, 03/15/2023 | 1,415 | 1,403 | ||||||
Duke Energy Florida LLC | ||||||||
3.850%, 11/15/2042 | 1,360 | 1,286 | ||||||
3.400%, 10/01/2046 | 665 | 589 | ||||||
Duquesne Light Holdings | ||||||||
6.400%, 09/15/2020 (C) | 2,525 | 2,830 | ||||||
Electricite de France | ||||||||
6.000%, 01/22/2114 (C) | 310 | 304 | ||||||
5.250%, 10/13/2055 (C) | 770 | 773 | ||||||
Entergy Louisiana LLC | ||||||||
6.500%, 09/01/2018 | 500 | 539 | ||||||
Exelon | ||||||||
5.625%, 06/15/2035 | 1,720 | 1,907 | ||||||
3.950%, 06/15/2025 | 1,840 | 1,888 | ||||||
FirstEnergy | ||||||||
4.250%, 03/15/2023 | 2,040 | 2,115 | ||||||
2.750%, 03/15/2018 | 650 | 655 | ||||||
FirstEnergy, Ser C | ||||||||
7.375%, 11/15/2031 | 4,905 | 6,131 | ||||||
Florida Power & Light | ||||||||
4.050%, 10/01/2044 | 3,600 | 3,651 | ||||||
3.250%, 06/01/2024 | 360 | 368 | ||||||
Fortis | ||||||||
3.055%, 10/04/2026 (C) | 2,385 | 2,237 | ||||||
2.100%, 10/04/2021 (C) | 1,195 | 1,156 | ||||||
Georgia Power | ||||||||
5.950%, 02/01/2039 | 50 | 60 | ||||||
Indiana Michigan Power | ||||||||
4.550%, 03/15/2046 | 710 | 731 | ||||||
IPALCO Enterprises | ||||||||
5.000%, 05/01/2018 | 2,380 | 2,477 | ||||||
Jersey Central Power & Light | ||||||||
7.350%, 02/01/2019 | 100 | 110 | ||||||
Kansas City Power & Light | ||||||||
5.300%, 10/01/2041 | 250 | 266 | ||||||
KCP&L Greater Missouri Operations | ||||||||
8.270%, 11/15/2021 | 2,894 | 3,475 | ||||||
KeySpan Gas East | ||||||||
5.819%, 04/01/2041 (C) | 2,500 | 2,934 | ||||||
| Description | Face Amount ($ Thousands) | Market Value ($ Thousands) | ||||||
2.742%, 08/15/2026 (C) | $ | 1,175 | $ | 1,119 | ||||
Majapahit Holding | ||||||||
7.750%, 01/20/2020 | 660 | 746 | ||||||
Metropolitan Edison | ||||||||
3.500%, 03/15/2023 (C) | 5,050 | 5,043 | ||||||
MidAmerican Energy | ||||||||
4.250%, 05/01/2046 | 905 | 932 | ||||||
3.500%, 10/15/2024 | 990 | 1,029 | ||||||
2.400%, 03/15/2019 | 115 | 117 | ||||||
NiSource Finance | ||||||||
6.800%, 01/15/2019 | 3,547 | 3,886 | ||||||
5.800%, 02/01/2042 | 471 | 551 | ||||||
Oncor Electric Delivery | ||||||||
6.800%, 09/01/2018 | 4,135 | 4,493 | ||||||
Pacific Gas & Electric | ||||||||
8.250%, 10/15/2018 | 1,570 | 1,751 | ||||||
6.050%, 03/01/2034 | 710 | 883 | ||||||
5.800%, 03/01/2037 | 560 | 676 | ||||||
5.400%, 01/15/2040 | 156 | 182 | ||||||
4.450%, 04/15/2042 | 2,360 | 2,454 | ||||||
3.250%, 09/15/2021 | 35 | 36 | ||||||
2.950%, 03/01/2026 | 1,213 | 1,190 | ||||||
PacifiCorp | ||||||||
5.650%, 07/15/2018 | 500 | 532 | ||||||
PECO Energy | ||||||||
4.150%, 10/01/2044 | 1,985 | 1,988 | ||||||
3.150%, 10/15/2025 | 1,485 | 1,491 | ||||||
PPL Electric Utilities | ||||||||
4.150%, 10/01/2045 | 1,075 | 1,072 | ||||||
Progress Energy | ||||||||
6.000%, 12/01/2039 | 200 | 240 | ||||||
Public Service of New Hampshire | ||||||||
3.500%, 11/01/2023 | 960 | 985 | ||||||
Public Service of New Mexico | ||||||||
7.950%, 05/15/2018 | 3,000 | 3,252 | ||||||
Sierra Pacific Power | ||||||||
2.600%, 05/01/2026 | 1,560 | 1,490 | ||||||
Southern | ||||||||
4.400%, 07/01/2046 | 1,385 | 1,358 | ||||||
2.150%, 09/01/2019 | 1,920 | 1,922 | ||||||
Southern California Edison | ||||||||
3.500%, 10/01/2023 | 1,015 | 1,059 | ||||||
Southern California Gas | ||||||||
2.600%, 06/15/2026 | 1,780 | 1,713 | ||||||
Southern Gas Capital | ||||||||
3.250%, 06/15/2026 | 1,550 | 1,517 | ||||||
2.450%, 10/01/2023 | 665 | 631 | ||||||
Southern Power | ||||||||
4.950%, 12/15/2046 | 1,340 | 1,296 | ||||||
Southwestern Electric Power | ||||||||
6.450%, 01/15/2019 | 672 | 732 | ||||||
3.900%, 04/01/2045 | 925 | 852 | ||||||
| 94 | SEI Institutional Investments Trust / Semi-Annual Report / November 30, 2016 |
| Description | Face Amount ($ Thousands) | Market Value ($ Thousands) | ||||||
2.750%, 10/01/2026 | $ | 2,400 | $ | 2,253 | ||||
Virginia Electric & Power | ||||||||
4.650%, 08/15/2043 | 1,475 | 1,585 | ||||||
4.000%, 11/15/2046 | 990 | 983 | ||||||
3.150%, 01/15/2026 | 995 | 990 | ||||||
2.950%, 11/15/2026 | 990 | 968 | ||||||
Virginia Electric and Power | ||||||||
2.950%, 01/15/2022 | 1,720 | 1,751 | ||||||
Xcel Energy | ||||||||
2.600%, 03/15/2022 | 1,435 | 1,432 | ||||||
|
| |||||||
| 130,816 | ||||||||
|
| |||||||
Total Corporate Obligations (Cost $1,569,314) ($ Thousands) | 1,582,192 | |||||||
|
| |||||||
ASSET-BACKED SECURITIES — 10.3% |
| |||||||
Automotive — 2.2% | ||||||||
Ally Auto Receivables Trust, Ser 2014-1, Cl A4 | ||||||||
1.530%, 04/15/2019 | 1,290 | 1,293 | ||||||
Ally Auto Receivables Trust, Ser 2015-1, Cl A3 | ||||||||
1.390%, 09/16/2019 | 1,985 | 1,986 | ||||||
Ally Auto Receivables Trust, Ser 2016-1, Cl A2A | ||||||||
1.200%, 08/15/2018 | 757 | 756 | ||||||
Ally Master Owner Trust, Ser 2014-1, Cl A2 | ||||||||
1.290%, 01/15/2019 | 1,010 | 1,010 | ||||||
AmeriCredit Automobile Receivables Trust, Ser 2016-3, Cl A2A | ||||||||
1.370%, 11/08/2019 | 1,029 | 1,029 | ||||||
Americredit Automobile Receivables Trust, Ser 2016-4, Cl A3 | ||||||||
1.530%, 07/08/2021 | 2,291 | 2,281 | ||||||
Avis Budget Rental Car Funding AESOP LLC, Ser 2012-3A, Cl A | ||||||||
2.100%, 03/20/2019 (C) | 1,421 | 1,424 | ||||||
Avis Budget Rental Car Funding AESOP LLC, Ser 2013-2A, Cl A | ||||||||
2.970%, 02/20/2020 (C) | 430 | 436 | ||||||
Avis Budget Rental Car Funding AESOP LLC, Ser 2014-2A, Cl A | ||||||||
2.500%, 02/20/2021 (C) | 3,014 | 3,003 | ||||||
Avis Budget Rental Car Funding AESOP LLC, Ser 2016-2A, Cl A | ||||||||
2.720%, 11/20/2022 (C) | 2,591 | 2,577 | ||||||
Avis Budget Rental Car Funding LLC, Ser 2014- 1A, Cl A | ||||||||
2.460%, 07/20/2020 (C) | 2,514 | 2,518 | ||||||
Bank of The West Auto Trust, Ser 2014-1, Cl A3 | ||||||||
1.090%, 03/15/2019 (C) | 576 | 576 | ||||||
California Republic Auto Receivables Trust, Ser 2014-2, Cl A4 | ||||||||
1.570%, 12/16/2019 | 717 | 718 | ||||||
| Description | Face Amount ($ Thousands) | Market Value ($ Thousands) | ||||||
California Republic Auto Receivables Trust, Ser 2015-1, Cl A4 | ||||||||
1.820%, 09/15/2020 | $ | 1,665 | $ | 1,667 | ||||
California Republic Auto Receivables Trust, Ser 2015-2, Cl A3 | ||||||||
1.310%, 08/15/2019 | 711 | 710 | ||||||
California Republic Auto Receivables Trust, Ser 2015-4, Cl A2 | ||||||||
1.600%, 09/17/2018 (C) | 452 | 453 | ||||||
California Republic Auto Receivables Trust, Ser 2015-4, Cl A4 | ||||||||
2.580%, 06/15/2021 (C) | 1,945 | 1,968 | ||||||
California Republic Auto Receivables Trust, Ser 2016-1, Cl A3 | ||||||||
1.890%, 05/15/2020 | 2,005 | 2,018 | ||||||
California Republic Auto Receivables Trust, Ser 2016-1, Cl A4 | ||||||||
2.240%, 10/15/2021 | 1,116 | 1,119 | ||||||
California Republic Auto Receivables Trust, Ser 2016-2, Cl A2 | ||||||||
1.340%, 03/15/2019 | 1,054 | 1,054 | ||||||
California Republic Auto Receivables Trust, Ser 2016-2, Cl A4 | ||||||||
1.830%, 12/15/2021 | 1,852 | 1,838 | ||||||
Capital Auto Receivables Asset Trust, Ser 2013- 3, Cl A4 | ||||||||
1.680%, 04/20/2018 | 90 | 90 | ||||||
Capital Auto Receivables Asset Trust, Ser 2013- 4, Cl A4 | ||||||||
1.470%, 07/20/2018 | 1,128 | 1,128 | ||||||
Capital Auto Receivables Asset Trust, Ser 2014- 1, Cl A4 | ||||||||
1.690%, 10/22/2018 | 1,629 | 1,632 | ||||||
Capital Auto Receivables Asset Trust, Ser 2015- 1, Cl A3 | ||||||||
1.610%, 06/20/2019 | 1,888 | 1,891 | ||||||
Capital Auto Receivables Asset Trust, Ser 2015- 2, Cl A2 | ||||||||
1.390%, 09/20/2018 | 924 | 924 | ||||||
Capital Auto Receivables Asset Trust, Ser 2015- 2, Cl A3 | ||||||||
1.730%, 09/20/2019 | 1,622 | 1,627 | ||||||
Capital Auto Receivables Asset Trust, Ser 2015- 2, Cl A4 | ||||||||
1.970%, 01/21/2020 | 2,404 | 2,396 | ||||||
Capital Auto Receivables Asset Trust, Ser 2015- 3, Cl A1A | ||||||||
1.390%, 02/20/2018 (C) | 2,333 | 2,334 | ||||||
Capital Auto Receivables Asset Trust, Ser 2015- 3, Cl A3 | ||||||||
1.940%, 01/21/2020 | 1,731 | 1,740 | ||||||
| SEI Institutional Investments Trust / Semi-Annual Report / November 30, 2016 | 95 |
SCHEDULE OF INVESTMENTS (Unaudited)
Core Fixed Income Fund (Continued)
November 30, 2016
| Description | Face Amount ($ Thousands) | Market Value ($ Thousands) | ||||||
Capital Auto Receivables Asset Trust, Ser 2015- 4, Cl A2 | ||||||||
1.620%, 03/20/2019 | $ | 1,065 | $ | 1,064 | ||||
Capital Auto Receivables Asset Trust, Ser 2015- 4, Cl A3 | ||||||||
1.830%, 03/20/2020 | 2,117 | 2,112 | ||||||
Capital Auto Receivables Asset Trust, Ser 2015- 4, Cl A4 | ||||||||
2.010%, 07/20/2020 | 874 | 871 | ||||||
Capital Auto Receivables Asset Trust, Ser 2016- 1, Cl A2A | ||||||||
1.500%, 11/20/2018 | 2,040 | 2,039 | ||||||
Capital Auto Receivables Asset Trust, Ser 2016- 1, Cl A3 | ||||||||
1.730%, 04/20/2020 | 2,120 | 2,109 | ||||||
Capital Auto Receivables Asset Trust, Ser 2016- 1, Cl A4 | ||||||||
1.980%, 10/20/2020 | 955 | 953 | ||||||
Capital Auto Receivables Asset Trust, Ser 2016- 2, Cl A2A | ||||||||
1.320%, 01/20/2019 | 643 | 642 | ||||||
Capital Auto Receivables Asset Trust, Ser 2016- 2, Cl A3 | ||||||||
1.460%, 06/20/2020 | 1,543 | 1,535 | ||||||
Capital Auto Receivables Asset Trust, Ser 2016- 3, Cl A2A | ||||||||
1.360%, 04/22/2019 | 1,199 | 1,198 | ||||||
Capital Auto Receivables Asset Trust, Ser 2016- 3, Cl A3 | ||||||||
1.540%, 08/20/2020 | 1,033 | 1,029 | ||||||
Capital Auto Receivables Asset Trust, Ser 2016- 3, Cl A4 | ||||||||
1.690%, 03/22/2021 | 866 | 861 | ||||||
Chrysler Capital Auto Receivables Trust, Ser 2016-AA, Cl A3 | ||||||||
1.770%, 10/15/2020 (C) | 3,302 | 3,303 | ||||||
Flagship Credit Auto Trust, | ||||||||
2.050%, 11/15/2020 (C) | 1,060 | 1,058 | ||||||
Ford Credit Auto Owner Trust, Ser 2014-1, Cl A | ||||||||
2.260%, 11/15/2025 (C) | 6,212 | 6,289 | ||||||
Ford Credit Auto Owner Trust, Ser 2015-1, Cl A | ||||||||
2.120%, 07/15/2026 (C) | 3,465 | 3,488 | ||||||
Ford Credit Auto Owner Trust, Ser 2015-2, Cl A | ||||||||
2.440%, 01/15/2027 (C) | 3,487 | 3,537 | ||||||
Ford Credit Auto Owner Trust, Ser 2016-1, Cl A | ||||||||
2.310%, 08/15/2027 (C) | 1,769 | 1,773 | ||||||
Ford Credit Floorplan Master Owner Trust, Ser 2012-2, Cl A | ||||||||
1.920%, 01/15/2019 | 2,653 | 2,655 | ||||||
Ford Credit Floorplan Master Owner Trust, Ser 2014-1, Cl A1 | ||||||||
1.200%, 02/15/2019 | 767 | 767 | ||||||
| Description | Face Amount ($ Thousands) | Market Value ($ Thousands) | ||||||
Ford Credit Floorplan Master Owner Trust, Ser 2014-2, Cl A | ||||||||
1.035%, 02/15/2021 (B) | $ | 180 | $ | 180 | ||||
Ford Credit Floorplan Master Owner Trust, Ser 2014-4, Cl A1 | ||||||||
1.400%, 08/15/2019 | 3,800 | 3,805 | ||||||
Ford Credit Floorplan Master Owner Trust, Ser 2015-2, Cl A2 | ||||||||
1.105%, 01/15/2022 (B) | 988 | 992 | ||||||
Hertz Vehicle Financing LLC, Ser 2013-1A, Cl A2 | ||||||||
1.830%, 08/25/2019 (C) | 886 | 878 | ||||||
Hertz Vehicle Financing LLC, Ser 2016-3A, Cl A | ||||||||
2.270%, 07/25/2020 (C) | 2,072 | 2,057 | ||||||
Hertz Vehicle Financing LLC, Ser 2016-4A, Cl A | ||||||||
2.650%, 07/15/2022 (C) | 1,878 | 1,839 | ||||||
Hertz Vehicle Financing, | ||||||||
2.730%, 03/25/2021 (C) | 6,137 | 6,127 | ||||||
Honda Auto Receivables Owner Trust, Ser 2016-1, Cl A2 | ||||||||
1.010%, 06/18/2018 | 247 | 247 | ||||||
Honda Auto Receivables Owner Trust, Ser 2016-2, Cl A2 | ||||||||
1.130%, 09/17/2018 | 2,645 | 2,646 | ||||||
Nissan Auto Receivables Owner Trust, Ser 2013-C, Cl A3 | ||||||||
0.670%, 08/15/2018 | 29 | 29 | ||||||
Nissan Auto Receivables Owner Trust, Ser 2015-C, Cl A2A | ||||||||
0.870%, 11/15/2018 | 2,236 | 2,234 | ||||||
Nissan Auto Receivables Owner Trust, Ser 2016-C, Cl A2A | ||||||||
1.070%, 05/15/2019 | 3,510 | 3,506 | ||||||
Nissan Auto Receivables Owner Trust, Ser 2016-C, Cl A3 | ||||||||
1.180%, 01/15/2021 | 1,609 | 1,600 | ||||||
Santander Drive Auto Receivables Trust, Ser 2016-2, Cl A2A | ||||||||
1.380%, 07/15/2019 | 2,325 | 2,326 | ||||||
TCF Auto Receivables Owner Trust, Ser 2016- 1A, Cl A2 | ||||||||
1.390%, 11/15/2019 (C) | 2,002 | 2,000 | ||||||
TCF Auto Receivables Owner Trust, Ser 2016- 1A, Cl A3 | ||||||||
1.710%, 04/15/2021 (C) | 801 | 796 | ||||||
TCF Auto Receivables Owner Trust, Ser 2016- 1A, Cl A4 | ||||||||
2.030%, 02/15/2022 (C) | 596 | 589 | ||||||
Toyota Auto Receivables, | ||||||||
1.000%, 01/15/2019 | 1,495 | 1,492 | ||||||
Toyota Auto Receivables, | ||||||||
1.140%, 08/17/2020 | 1,993 | 1,982 | ||||||
| 96 | SEI Institutional Investments Trust / Semi-Annual Report / November 30, 2016 |
| Description | Face Amount ($ Thousands) | Market Value ($ Thousands) | ||||||
World Omni Auto Receivables Trust, Ser 2016- B, Cl A3 | ||||||||
1.300%, 02/15/2022 | $ | 1,966 | $ | 1,950 | ||||
|
| |||||||
| 118,754 | ||||||||
|
| |||||||
Credit Cards — 0.7% | ||||||||
American Express Credit Account Master Trust, Ser 2014-2, Cl A | ||||||||
1.260%, 01/15/2020 | 1,570 | 1,572 | ||||||
BA Credit Card Trust, Ser 2007-A1, Cl A1 | ||||||||
5.170%, 06/15/2019 | 920 | 925 | ||||||
Capital One Multi-Asset Execution Trust, Ser 2007-A7, Cl A7 | ||||||||
5.750%, 07/15/2020 | 1,615 | 1,673 | ||||||
Capital One Multi-Asset Execution Trust, Ser 2014-A2, Cl A2 | ||||||||
1.260%, 01/15/2020 | 1,110 | 1,111 | ||||||
Capital One Multi-Asset Execution Trust, Ser 2014-A5, Cl A5 | ||||||||
1.480%, 07/15/2020 | 2,770 | 2,777 | ||||||
Capital One Multi-Asset Execution Trust, Ser 2015-A1, Cl A1 | ||||||||
1.390%, 01/15/2021 | 198 | 198 | ||||||
Capital One Multi-Asset Execution Trust, Ser 2016-A1, Cl A1 | ||||||||
0.988%, 02/15/2022 (B) | 2,021 | 2,030 | ||||||
Capital One Multi-Asset Execution Trust, Ser 2016-A2, Cl A2 | ||||||||
1.165%, 02/15/2024 (B) | 1,769 | 1,778 | ||||||
Chase Issuance Trust, Ser 2014, Cl A1 | ||||||||
1.150%, 01/15/2019 | 1,460 | 1,460 | ||||||
Chase Issuance Trust, Ser 2014-A6, Cl A6 | ||||||||
1.260%, 07/15/2019 | 1,250 | 1,251 | ||||||
Citibank Credit Card Issuance Trust, Ser 2013- A2, Cl A2 | ||||||||
0.872%, 05/26/2020 (B) | 1,424 | 1,427 | ||||||
Citibank Credit Card Issuance Trust, Ser 2014- A2, Cl A2 | ||||||||
1.020%, 02/22/2019 | 3,510 | 3,511 | ||||||
Citibank Credit Card Issuance Trust, Ser 2014- A4, Cl A4 | ||||||||
1.230%, 04/24/2019 | 2,870 | 2,872 | ||||||
Citibank Credit Card Issuance Trust, Ser 2014- A8, Cl A8 | ||||||||
1.730%, 04/09/2020 | 823 | 827 | ||||||
Discover Card Execution Note Trust, Ser 2013- A1, Cl A1 | ||||||||
0.838%, 08/17/2020 (B) | 1,392 | 1,394 | ||||||
Synchrony Credit Card Master Note Trust, Ser 2016-2, Cl A | ||||||||
2.210%, 05/15/2024 | 1,769 | 1,772 | ||||||
Synchrony Credit Card Master Note Trust, Ser 2016-3, Cl A | ||||||||
1.580%, 09/15/2022 | 2,295 | 2,276 | ||||||
World Financial Network Credit Card Master Trust, Ser 2012-B, Cl A | ||||||||
1.760%, 05/17/2021 | 1,537 | 1,542 | ||||||
| Description | Face Amount ($ Thousands) | Market Value ($ Thousands) | ||||||
World Financial Network Credit Card Master Trust, | ||||||||
1.540%, 08/16/2021 | $ | 332 | $ | 333 | ||||
World Financial Network Credit Card Master Trust, | ||||||||
2.030%, 04/15/2025 | 1,632 | 1,601 | ||||||
World Financial Network Credit Card Master Trust, | ||||||||
1.440%, 06/15/2022 | 2,418 | 2,412 | ||||||
World Financial Network Credit Card Master Trust, | ||||||||
1.720%, 08/15/2023 | 3,129 | 3,107 | ||||||
|
| |||||||
| 37,849 | ||||||||
|
| |||||||
Mortgage Related Securities — 0.6% | ||||||||
Aames Mortgage Trust, | ||||||||
7.396%, 06/25/2032 | 39 | 37 | ||||||
Argent Securities Asset-Backed Pass-Through Certificates, | ||||||||
1.574%, 04/25/2034 (B) | 1,113 | 1,026 | ||||||
Argent Securities Asset-Backed Pass-Through Certificates, | ||||||||
0.794%, 10/25/2035 (B) | 4,618 | 4,540 | ||||||
Asset-Backed Funding Certificates, | ||||||||
5.010%, 06/25/2035 | 320 | 327 | ||||||
Asset-Backed Securities Home Equity Loan Trust, Ser 2003-HE7, Cl M1 | ||||||||
1.510%, 12/15/2033 (B) | 1,717 | 1,617 | ||||||
Asset-Backed Securities Home Equity Loan Trust, | ||||||||
1.299%, 07/25/2035 (B) | 191 | 191 | ||||||
Centex Home Equity, Ser 2003-B, Cl AF4 | ||||||||
3.735%, 02/25/2032 | 94 | 94 | ||||||
Centex Home Equity, Ser 2003-B, Cl AF6 | ||||||||
3.173%, 06/25/2033 (B) | 19 | 19 | ||||||
Centex Home Equity, Ser 2005-A, Cl M1 | ||||||||
1.014%, 01/25/2035 (B) | 4,495 | 4,262 | ||||||
Centex Home Equity, Ser 2006-A, Cl AV4 | ||||||||
0.842%, 06/25/2036 (B) | 65 | 63 | ||||||
Citigroup Global Markets Mortgage Securities VII, Ser 2003-UP1, Cl A | ||||||||
3.950%, 04/25/2032 (C) | 40 | 39 | ||||||
Contimortgage Home Equity Trust, Ser 1997-2, Cl A9 | ||||||||
7.090%, 04/15/2028 | — | — | ||||||
| SEI Institutional Investments Trust / Semi-Annual Report / November 30, 2016 | 97 |
SCHEDULE OF INVESTMENTS (Unaudited)
Core Fixed Income Fund (Continued)
November 30, 2016
| Description | Face Amount ($ Thousands) | Market Value ($ Thousands) | ||||||
Delta Funding Home Equity Loan Trust, Ser 1999-3, Cl A1A | ||||||||
1.358%, 09/15/2029 (B) | $ | 254 | $ | 236 | ||||
EMC Mortgage Loan Trust, | ||||||||
1.532%, 05/25/2039 (B) (C) | 197 | 187 | ||||||
GSAA Trust, Ser 2005-6, Cl A3 | ||||||||
0.904%, 06/25/2035 (B) | 1,508 | 1,495 | ||||||
GSAMP Trust, Ser 2006-HE2, Cl A3 | ||||||||
0.852%, 03/25/2046 (B) | 8,000 | 7,558 | ||||||
JPMorgan Mortgage Acquisition, Ser 05-OPT1, Cl M1 | ||||||||
0.984%, 06/25/2035 (B) | 1,319 | 1,315 | ||||||
Master Asset-Backed Securities Trust, Ser 2006-WMC3, Cl A4 | ||||||||
0.694%, 08/25/2036 (B) | 943 | 442 | ||||||
Morgan Stanley ABS Capital I Trust, Ser 2005- WMC3, Cl M4 | ||||||||
1.464%, 03/25/2035 (B) | 5,500 | 5,421 | ||||||
Renaissance Home Equity Loan Trust, Ser 2005-2, Cl AF3 | ||||||||
4.499%, 08/25/2035 | 104 | 103 | ||||||
Saxon Asset Securities Trust, Ser 2003-1, Cl AF6 | ||||||||
4.795%, 06/25/2033 | 66 | 67 | ||||||
Security National Mortgage Loan Trust, Ser 2007-1A, Cl 2A | ||||||||
0.884%, 04/25/2037 (B) (C) | 363 | 319 | ||||||
Structured Asset Security Pass-Through Certificates, | ||||||||
3.450%, 02/25/2032 | 160 | 159 | ||||||
UCFC Home Equity Loan, | ||||||||
6.905%, 04/15/2030 | 253 | 256 | ||||||
Wells Fargo Home Equity | ||||||||
1.534%, 10/25/2034 (B) | 6,637 | 6,502 | ||||||
|
| |||||||
| 36,275 | ||||||||
|
| |||||||
Other Asset-Backed Securities — 6.8% |
| |||||||
Academic Loan Funding Trust, Ser 2012-1A, Cl A1 | ||||||||
1.384%, 12/27/2022 (B) (C) | 137 | 138 | ||||||
Access Group, Ser 2006-1, Cl A2 | ||||||||
0.935%, 08/25/2023 (B) | 385 | 382 | ||||||
Ally Master Owner Trust, Ser 2012-4, Cl A | ||||||||
1.720%, 07/15/2019 | 125 | 125 | ||||||
Ally Master Owner Trust, Ser 2012-5, Cl A | ||||||||
1.540%, 09/15/2019 | 6,585 | 6,598 | ||||||
Ally Master Owner Trust, Ser 2014-3, Cl A | ||||||||
1.330%, 03/15/2019 | 3,428 | 3,429 | ||||||
Ally Master Owner Trust, Ser 2014-4, Cl A2 | ||||||||
1.430%, 06/17/2019 | 4,290 | 4,294 | ||||||
Ameriquest Mortgage Securities Asset-Backed Pass-Through Certificates, Ser 2005-R5, Cl M1 | ||||||||
0.964%, 07/25/2035 (B) | 22 | 22 | ||||||
Apidos CLO XVI, Ser 2014-16A, Cl B | ||||||||
3.488%, 01/19/2025 (B) (C) | 500 | 500 | ||||||
| Description | Face Amount ($ Thousands) | Market Value ($ Thousands) | ||||||
Apidos CLO XVIII, Ser 2014-18A, Cl A1 | ||||||||
2.114%, 07/22/2026 (B) (C) | $ | 1,500 | $ | 1,501 | ||||
Apidos CLO XXII, Ser 2015-22A, Cl A1 | ||||||||
2.381%, 10/20/2027 (B) (C) | 3,000 | 3,009 | ||||||
Arrowpoint CLO, Ser 2014-2A, Cl A1L | ||||||||
2.156%, 03/12/2026 (B) (C) | 1,900 | 1,900 | ||||||
Babson CLO, Ser 2014-IIA, Cl A | ||||||||
2.069%, 10/17/2026 (B) (C) | 1,000 | 996 | ||||||
Ballyrock CLO, Ser 2014-1A, Cl A1 | ||||||||
2.176%, 10/20/2026 (B) (C) | 1,620 | 1,622 | ||||||
Bear Stearns Asset-Backed Securities Trust, Ser 2005-SD1, Cl 1A3 | ||||||||
0.934%, 08/25/2043 (B) | 952 | 943 | ||||||
Brazos Education Loan Authority, Ser 2012-1, Cl A1 | ||||||||
1.234%, 12/26/2035 (B) | 2,912 | 2,864 | ||||||
Brazos Higher Education Authority, Ser 2010-1, Cl A2 | ||||||||
2.125%, 02/25/2035 (B) | 4,835 | 4,745 | ||||||
Brazos Higher Education Authority, Ser 2011-1, Cl A2 | ||||||||
1.625%, 02/25/2030 (B) | 1,507 | 1,506 | ||||||
Brazos Higher Education Authority, Ser 2011-2, Cl A3 | ||||||||
1.715%, 10/27/2036 (B) | 3,520 | 3,377 | ||||||
Business Loan Express Business Loan Trust, Ser 2004-A, Cl A | ||||||||
0.964%, 02/25/2031 (B) (C) | 896 | 807 | ||||||
Carlyle Global Market Strategies CLO, Ser 2013-4A, Cl C | ||||||||
3.480%, 10/15/2025 (B) (C) | 300 | 300 | ||||||
Carlyle Global Market Strategies Commodities Funding, | ||||||||
2.717%, 10/15/2021 (B) (C) | 382 | 299 | ||||||
Cent CLO 17, Ser 2013-17A, Cl A1 | ||||||||
2.187%, 01/30/2025 (B) (C) | 500 | 500 | ||||||
CenterPoint Energy Transition Bond LLC, Ser 2008-A, Cl A1 | ||||||||
4.192%, 02/01/2020 | 4 | 4 | ||||||
Chase Funding Mortgage Loan Asset-Backed Certificates, Ser 2003-6, Cl 1A5 | ||||||||
5.164%, 11/25/2034 | 347 | 360 | ||||||
Chase Funding Mortgage Loan Asset-Backed Certificates, Ser 2003-6, Cl 1A7 | ||||||||
4.277%, 11/25/2034 | 344 | 351 | ||||||
CIFC Funding, Ser 2014-1A, Cl B1 | ||||||||
2.679%, 04/18/2025 (B) (C) | 1,500 | 1,500 | ||||||
| 98 | SEI Institutional Investments Trust / Semi-Annual Report / November 30, 2016 |
| Description | Face Amount ($ Thousands) | Market Value ($ Thousands) | ||||||
CIFC Funding, Ser 2014-2A, Cl A1L | ||||||||
2.410%, 05/24/2026 (B) (C) | $ | 1,000 | $ | 1,002 | ||||
CIT Education Loan Trust, | ||||||||
0.730%, 03/25/2042 (B) (C) | 2,554 | 2,382 | ||||||
Citicorp Residential Mortgage Securities, Ser 2006-2, Cl A4 | ||||||||
5.775%, 09/25/2036 | 1,355 | 1,386 | ||||||
Citicorp Residential Mortgage Securities, Ser 2006-2, Cl A5 | ||||||||
6.036%, 09/25/2036 | 6,465 | 6,659 | ||||||
Citicorp Residential Mortgage Securities, Ser 2007-1, Cl A5 | ||||||||
5.755%, 03/25/2037 | 990 | 1,024 | ||||||
Commonbond Student Loan Trust, Ser 2015-A, Cl A | ||||||||
3.200%, 06/25/2032 (C) | 419 | 420 | ||||||
Community Funding CLO, | ||||||||
5.750%, 11/01/2027 (C) | 2,990 | 2,846 | ||||||
Conseco Financial, Ser 1997-2, Cl A6 | ||||||||
7.240%, 06/15/2028 (B) | 2 | 2 | ||||||
Conseco Financial, Ser 1998-2, Cl A5 | ||||||||
6.240%, 12/01/2028 (B) | 47 | 49 | ||||||
Consumer Credit Origination Loan Trust, Ser 2015-1, Cl A | ||||||||
2.820%, 03/15/2021 (C) | 42 | 43 | ||||||
COOF Securitization Trust, Ser 2014-1, Cl A, IO | ||||||||
3.015%, 06/25/2040 (B) (C) | 850 | 96 | ||||||
Countrywide Asset-Backed Certificates, Ser 2004-6, Cl 1A1 | ||||||||
1.074%, 12/25/2034 (B) | 4,474 | 4,235 | ||||||
Countrywide Asset-Backed Certificates, Ser 2006-15, Cl A3 | ||||||||
4.947%, 10/25/2046 (B) | 125 | 116 | ||||||
Countrywide Asset-Backed Certificates, Ser 2006-SD3, Cl A1 | ||||||||
0.864%, 07/25/2036 (B) (C) | 157 | 130 | ||||||
Countrywide Asset-Backed Certificates, Ser 2007-13, Cl 2A1 | ||||||||
1.434%, 10/25/2047 (B) | 464 | 429 | ||||||
Countrywide Asset-Backed Certificates, Ser 2007-4, Cl A4W | ||||||||
5.217%, 04/25/2047 | 3,045 | 3,012 | ||||||
Credit-Based Asset Servicing & Securitization LLC, Ser 2003-CB3, Cl AF1 | ||||||||
3.379%, 12/25/2032 | 57 | 56 | ||||||
Credit-Based Asset Servicing & Securitization LLC, Ser 2006-CB2, Cl AF2 | ||||||||
3.473%, 12/25/2036 | 521 | 386 | ||||||
Credit-Based Asset Servicing & Securitization LLC, Ser 2006-CB2, Cl AF4 | ||||||||
3.473%, 12/25/2036 | 736 | 549 | ||||||
| Description | Face Amount ($ Thousands) | Market Value ($ Thousands) | ||||||
CWABS Revolving Home Equity Loan Trust, Ser 2004-K, Cl 2A | ||||||||
0.838%, 02/15/2034 (B) | $ | 197 | $ | 182 | ||||
CWHEQ Revolving Home Equity Loan Trust, Ser 2007-A, Cl A | ||||||||
0.658%, 04/15/2037 (B) | 5,609 | 5,002 | ||||||
Dryden 37 Senior Loan Fund, Ser 2015-37A, Cl A | ||||||||
2.180%, 04/15/2027 (B) (C) | 3,860 | 3,863 | ||||||
Educational Funding of the South, Ser 2011-1, Cl A2 | ||||||||
1.365%, 04/25/2035 (B) | 2,372 | 2,337 | ||||||
EFS Volunteer No. 3 LLC, Ser 2012-1, Cl A3 | ||||||||
1.584%, 04/25/2033 (B) (C) | 4,600 | 4,464 | ||||||
Equity One Mortgage Pass-Through Trust, Ser 2003-2, Cl M1 | ||||||||
5.050%, 09/25/2033 (B) | 83 | 84 | ||||||
First Franklin Mortgage Loan Trust, Ser 2002- FF3, Cl A1 | ||||||||
1.452%, 08/25/2032 (B) | 3,462 | 3,263 | ||||||
First Franklin Mortgage Loan Trust, Ser 2005- FFH3, Cl M1 | ||||||||
1.044%, 09/25/2035 (B) | 1,730 | 1,728 | ||||||
Flatiron CLO, Ser 2014-1A, Cl A1 | ||||||||
2.059%, 07/17/2026 (B) (C) | 1,510 | 1,510 | ||||||
Ford Credit Floorplan Master Owner Trust, Ser 2012-5, Cl A | ||||||||
1.490%, 09/15/2019 | 274 | 275 | ||||||
Ford Credit Floorplan Master Owner Trust, Ser 2014-4, Cl A2 | ||||||||
0.888%, 08/15/2019 (B) | 2,450 | 2,451 | ||||||
Ford Credit Floorplan Master Owner Trust, Ser 2015-1, Cl A1 | ||||||||
1.420%, 01/15/2020 | 119 | 119 | ||||||
Galaxy XIX CLO, Ser 2015-19A, Cl A1A | ||||||||
2.265%, 01/24/2027 (B) (C) | 1,500 | 1,500 | ||||||
Global SC Finance II SRL, | ||||||||
3.090%, 07/17/2029 (C) | 2,112 | 1,994 | ||||||
Greenpoint Manufactured Housing, Ser 2001- 2, Cl IA2 | ||||||||
4.029%, 02/20/2032 (B) | 650 | 583 | ||||||
Greenpoint Manufactured Housing, Ser 2001- 2, Cl IIA2 | ||||||||
4.028%, 03/13/2032 (B) | 1,100 | 988 | ||||||
GT Loan Financing I, | ||||||||
2.013%, 10/28/2024 (B) (C) | 1,250 | 1,249 | ||||||
Higher Education Funding I, | ||||||||
1.875%, 05/25/2034 (B) (C) | 3,405 | 3,280 | ||||||
HSI Asset Securitization Trust, Ser 2006-OPT3, Cl 3A3 | ||||||||
0.714%, 02/25/2036 (B) | 831 | 800 | ||||||
JFIN CLO, Ser 2016-1A, Cl A2A | ||||||||
1.557%, 07/27/2028 (B) (C) | 1,500 | 1,448 | ||||||
| SEI Institutional Investments Trust / Semi-Annual Report / November 30, 2016 | 99 |
SCHEDULE OF INVESTMENTS (Unaudited)
Core Fixed Income Fund (Continued)
November 30, 2016
| Description | Face Amount ($ Thousands) | Market Value ($ Thousands) | ||||||
JGWPT XXX LLC, Ser 2013-3A, Cl A | ||||||||
4.080%, 01/17/2073 (C) | $ | 1,957 | $ | 1,984 | ||||
JGWPT XXXI LLC, Ser 2014-1A, Cl A | ||||||||
3.960%, 03/15/2063 (C) | 985 | 987 | ||||||
JGWPT XXXII LLC, Ser 2014-2A, Cl A | ||||||||
3.610%, 01/17/2073 (C) | 2,587 | 2,480 | ||||||
JGWPT XXXIII LLC, Ser 2014-3A, Cl A | ||||||||
3.500%, 06/15/2077 (C) | 1,218 | 1,178 | ||||||
KGS-Alpha SBA COOF Trust, Ser 2012-A, Cl A, IO | ||||||||
0.859%, 08/25/2038 (B) (C) | 4,145 | 110 | ||||||
KGS-Alpha SBA COOF Trust, Ser 2014-2, Cl A, IO | ||||||||
3.226%, 04/25/2040 (B) (C) | 652 | 75 | ||||||
Lehman ABS Manufactured Housing Contract Trust, Ser 2001-B, Cl A4 | ||||||||
5.270%, 04/15/2040 | 100 | 103 | ||||||
Long Beach Mortgage Loan Trust, Ser 2005-1, Cl M2 | ||||||||
1.329%, 02/25/2035 (B) | 3,738 | 3,732 | ||||||
Magnetite CLO IX, Ser 2014-9A, Cl A1 | ||||||||
2.302%, 07/25/2026 (B) (C) | 1,000 | 1,001 | ||||||
Magnetite VI, Ser 2015-6A, Cl CR | ||||||||
3.253%, 09/15/2023 (B) (C) | 1,500 | 1,501 | ||||||
Magnetite XVIII, Ser 2016-18A, Cl A | ||||||||
2.263%, 11/15/2028 (B) (C) | 2,040 | 2,041 | ||||||
Mid-State Trust, Ser 2003-11, Cl A1 | ||||||||
4.864%, 07/15/2038 | 2,458 | 2,615 | ||||||
Mid-State Trust, Ser 2004-1, Cl A | ||||||||
6.005%, 08/15/2037 | 359 | 389 | ||||||
Mid-State Trust, Ser 2006-1, Cl A | ||||||||
5.787%, 10/15/2040 (C) | 4,301 | 4,589 | ||||||
Navient Private Education Loan Trust, Ser 2014-AA, Cl A2B | ||||||||
1.788%, 02/15/2029 (B) (C) | 1,545 | 1,557 | ||||||
Navient Private Education Loan Trust, Ser 2014-CTA, Cl A | ||||||||
1.235%, 09/16/2024 (B) (C) | 1,553 | 1,553 | ||||||
Navient Private Education Loan Trust, Ser 2015-AA, Cl A2A | ||||||||
2.650%, 12/15/2028 (C) | 1,191 | 1,191 | ||||||
Navient Private Education Loan Trust, Ser 2015-AA, Cl A2B | ||||||||
1.738%, 12/15/2028 (B) (C) | 548 | 553 | ||||||
Navient Private Education Loan Trust, Ser 2015-CA, Cl B | ||||||||
3.250%, 05/15/2040 (C) | 1,035 | 1,002 | ||||||
Navient Private Education Loan Trust, Ser 2016-AA, Cl A2A | ||||||||
3.910%, 12/15/2045 (C) | 2,890 | 3,030 | ||||||
Navient Student Loan Trust, | ||||||||
1.044%, 06/25/2031 (B) | 6,707 | 6,499 | ||||||
Navient Student Loan Trust, | ||||||||
1.224%, 03/25/2083 (B) | 5,847 | 5,659 | ||||||
Navient Student Loan Trust, | ||||||||
1.154%, 03/25/2083 (B) | 5,897 | 5,707 | ||||||
Navient Student Loan Trust, | ||||||||
1.204%, 03/25/2083 (B) | 4,144 | 4,011 | ||||||
| Description | Face Amount ($ Thousands) | Market Value ($ Thousands) | ||||||
Navient Student Loan Trust, | ||||||||
1.024%, 04/25/2023 (B) | $ | 1,162 | $ | 1,161 | ||||
Navient Student Loan Trust, | ||||||||
1.184%, 05/27/2031 (B) | 300 | 290 | ||||||
Navient Student Loan Trust, | ||||||||
2.084%, 07/26/2049 (B) | 134 | 120 | ||||||
Navient Student Loan Trust, | ||||||||
1.670%, 03/25/2066 (B) (C) | 2,366 | 2,390 | ||||||
Nelnet Student Loan Trust, | ||||||||
1.062%, 10/27/2036 (B) | 1,861 | 1,795 | ||||||
Nelnet Student Loan Trust, | ||||||||
1.042%, 01/25/2037 (B) | 1,595 | 1,555 | ||||||
Nelnet Student Loan Trust, | ||||||||
0.992%, 10/25/2033 (B) | 2,091 | 2,031 | ||||||
Nelnet Student Loan Trust, | ||||||||
0.747%, 03/23/2037 (B) | 1,848 | 1,743 | ||||||
Nelnet Student Loan Trust, | ||||||||
0.767%, 12/24/2035 (B) | 5,777 | 5,463 | ||||||
Nelnet Student Loan Trust, | ||||||||
1.046%, 03/22/2032 (B) | 1,078 | 993 | ||||||
Nelnet Student Loan Trust, | ||||||||
1.384%, 04/25/2046 (B) (C) | 657 | 655 | ||||||
Nelnet Student Loan Trust, | ||||||||
1.484%, 11/25/2043 (B) (C) | 3,735 | 3,456 | ||||||
Nelnet Student Loan Trust, | ||||||||
1.134%, 09/25/2042 (B) (C) | 6,081 | 5,970 | ||||||
Nelnet Student Loan Trust, | ||||||||
1.377%, 09/25/2065 (B) (C) | 4,440 | 4,440 | ||||||
Northstars Education Finance Authority, Ser 2007-1, Cl A2 | ||||||||
1.493%, 01/29/2046 (B) | 50 | 48 | ||||||
OHA Loan Funding, | ||||||||
2.226%, 10/20/2026 (B) (C) | 1,500 | 1,500 | ||||||
Park Place Securities Asset-Backed | ||||||||
1.314%, 01/25/2036 (B) | 806 | 803 | ||||||
Park Place Securities Asset-Backed | ||||||||
1.034%, 07/25/2035 (B) | 5,992 | 5,946 | ||||||
RAMP Trust, Ser 2002-RS4, Cl AI5 | ||||||||
6.163%, 08/25/2032 | 3 | 3 | ||||||
RAMP Trust, Ser 2003-RS10, Cl AI6 | ||||||||
5.798%, 11/25/2033 | 381 | 403 | ||||||
RAMP Trust, Ser 2003-RS11, Cl AI6A | ||||||||
5.879%, 12/25/2033 | 351 | 369 | ||||||
RAMP Trust, Ser 2006-RZ1, Cl A3 | ||||||||
0.834%, 03/25/2036 (B) | 189 | 188 | ||||||
| 100 | SEI Institutional Investments Trust / Semi-Annual Report / November 30, 2016 |
| Description | Face Amount ($ Thousands) | Market Value ($ Thousands) | ||||||
RAMP Trust, Ser 2006-RZ3, Cl A2 | ||||||||
0.694%, 08/25/2036 (B) | $ | 564 | $ | 563 | ||||
Regatta VII Funding, Ser 2016-1A, Cl B2 | ||||||||
2.654%, 12/20/2028 (B) (C) | 2,000 | 1,968 | ||||||
RSB BondCo LLC, Ser 2007-A, Cl A3 | ||||||||
5.820%, 06/28/2019 | 855 | 869 | ||||||
Saranac CLO II, Ser 2014-2A, Cl B | ||||||||
2.861%, 02/20/2025 (B) (C) | 1,750 | 1,731 | ||||||
SBA Small Business Investment, Ser 2015-10A, Cl 1 | ||||||||
2.517%, 03/10/2025 | 647 | 654 | ||||||
Shackleton CLO, Ser 2013-4A, Cl B1 | ||||||||
2.669%, 01/13/2025 (B) (C) | 1,450 | 1,450 | ||||||
SLC Student Loan Trust, | ||||||||
1.217%, 05/15/2028 (B) | 596 | 592 | ||||||
SLM Private Education Loan Trust, Ser 2012-B, Cl A2 | ||||||||
3.480%, 10/15/2030 (C) | 702 | 713 | ||||||
SLM Private Education Loan Trust, Ser 2012-D, Cl A2 | ||||||||
2.950%, 02/15/2046 (C) | 3,438 | 3,461 | ||||||
SLM Private Education Loan Trust, Ser 2013-A, Cl A2B | ||||||||
1.585%, 05/17/2027 (B) (C) | 1,342 | 1,352 | ||||||
SLM Private Education Loan Trust, Ser 2013-B, Cl A1 | ||||||||
1.185%, 07/15/2022 (B) (C) | 420 | 421 | ||||||
SLM Private Education Loan Trust, Ser 2013-B, Cl A2A | ||||||||
1.850%, 06/17/2030 (C) | 2,622 | 2,615 | ||||||
SLM Private Education Loan Trust, Ser 2013-B, Cl A2B | ||||||||
1.638%, 06/17/2030 (B) (C) | 377 | 379 | ||||||
SLM Private Education Loan Trust, Ser 2013-C, Cl A2A | ||||||||
2.940%, 10/15/2031 (C) | 1,158 | 1,174 | ||||||
SLM Private Education Loan Trust, Ser 2014-A, Cl A2A | ||||||||
2.590%, 01/15/2026 (C) | 1,128 | 1,131 | ||||||
SLM Private Education Loan Trust, Ser 2014-A, Cl A2B | ||||||||
1.688%, 01/15/2026 (B) (C) | 2,612 | 2,635 | ||||||
SLM Student Loan Trust, | ||||||||
1.403%, 03/15/2033 (B) (C) | 1,571 | 1,492 | ||||||
SLM Student Loan Trust, | ||||||||
1.432%, 04/27/2026 (B) (C) | 3,200 | 3,178 | ||||||
SLM Student Loan Trust, | ||||||||
1.632%, 10/25/2029 (B) (C) | 1,813 | 1,760 | ||||||
SLM Student Loan Trust, | ||||||||
0.885%, 07/25/2023 (B) | 1,816 | 1,809 | ||||||
SLM Student Loan Trust, | ||||||||
1.342%, 01/25/2040 (B) | 398 | 328 | ||||||
SLM Student Loan Trust, Ser 2004-8A, Cl A5 | ||||||||
1.382%, 04/25/2024 (B) (C) | 3,811 | 3,819 | ||||||
SLM Student Loan Trust, Ser 2005-5, Cl A3 | ||||||||
0.815%, 04/25/2025 (B) | 154 | 153 | ||||||
SLM Student Loan Trust, Ser 2005-5, Cl A4 | ||||||||
1.022%, 10/25/2028 (B) | 3,633 | 3,534 | ||||||
| Description | Face Amount ($ Thousands) | Market Value ($ Thousands) | ||||||
SLM Student Loan Trust, Ser 2005-6, Cl A5B | ||||||||
1.915%, 07/27/2026 (B) | $ | 595 | $ | 598 | ||||
SLM Student Loan Trust, Ser 2005-6, Cl A6 | ||||||||
1.022%, 10/27/2031 (B) | 4,167 | 4,060 | ||||||
SLM Student Loan Trust, Ser 2005-7, Cl A4 | ||||||||
1.032%, 10/25/2029 (B) | 1,657 | 1,621 | ||||||
SLM Student Loan Trust, Ser 2006-2, Cl A6 | ||||||||
0.885%, 01/25/2041 (B) | 4,250 | 3,974 | ||||||
SLM Student Loan Trust, Ser 2006-3, Cl A5 | ||||||||
0.982%, 01/25/2021 (B) | 2,551 | 2,463 | ||||||
SLM Student Loan Trust, Ser 2006-8, Cl A6 | ||||||||
0.875%, 01/25/2041 (B) | 4,250 | 3,814 | ||||||
SLM Student Loan Trust, Ser 2007-2, Cl A4 | ||||||||
0.942%, 07/25/2022 (B) | 2,920 | 2,757 | ||||||
SLM Student Loan Trust, Ser 2007-2, Cl B | ||||||||
1.052%, 07/25/2025 (B) | 934 | 758 | ||||||
SLM Student Loan Trust, Ser 2007-3, Cl A3 | ||||||||
0.922%, 04/25/2019 (B) | 2,681 | 2,664 | ||||||
SLM Student Loan Trust, Ser 2007-5, Cl A5 | ||||||||
0.962%, 01/25/2024 (B) | 1,772 | 1,766 | ||||||
SLM Student Loan Trust, Ser 2007-6, Cl B | ||||||||
1.732%, 04/27/2043 (B) | 894 | 783 | ||||||
SLM Student Loan Trust, Ser 2008-2, Cl B | ||||||||
2.082%, 01/25/2083 (B) | 1,155 | 1,005 | ||||||
SLM Student Loan Trust, Ser 2008-3, Cl B | ||||||||
2.082%, 04/26/2083 (B) | 1,155 | 992 | ||||||
SLM Student Loan Trust, Ser 2008-4, Cl B | ||||||||
2.732%, 04/25/2029 (B) | 1,155 | 1,078 | ||||||
SLM Student Loan Trust, Ser 2008-5, Cl A4 | ||||||||
2.415%, 07/25/2023 (B) | 2,628 | 2,673 | ||||||
SLM Student Loan Trust, Ser 2008-5, Cl B | ||||||||
2.732%, 07/25/2029 (B) | 1,155 | 1,105 | ||||||
SLM Student Loan Trust, Ser 2008-6, Cl B | ||||||||
2.732%, 07/26/2083 (B) | 1,155 | 1,072 | ||||||
SLM Student Loan Trust, Ser 2008-7, Cl B | ||||||||
2.732%, 07/26/2083 (B) | 1,155 | 1,073 | ||||||
SLM Student Loan Trust, Ser 2008-8, Cl B | ||||||||
3.132%, 10/25/2029 (B) | 1,155 | 1,114 | ||||||
SLM Student Loan Trust, Ser 2008-9, Cl A | ||||||||
2.382%, 04/25/2023 (B) | 4,834 | 4,875 | ||||||
SLM Student Loan Trust, Ser 2008-9, Cl B | ||||||||
3.132%, 10/25/2083 (B) | 1,155 | 1,127 | ||||||
SLM Student Loan Trust, Ser 2010-1, Cl A | ||||||||
0.934%, 03/25/2025 (B) | 244 | 238 | ||||||
SLM Student Loan Trust, Ser 2011-2, Cl A2 | ||||||||
1.784%, 10/25/2034 (B) | 495 | 499 | ||||||
| SEI Institutional Investments Trust / Semi-Annual Report / November 30, 2016 | 101 |
SCHEDULE OF INVESTMENTS (Unaudited)
Core Fixed Income Fund (Continued)
November 30, 2016
| Description | Face Amount ($ Thousands) | Market Value ($ Thousands) | ||||||
SLM Student Loan Trust, | ||||||||
1.284%, 05/26/2026 (B) | $ | 1,094 | $ | 1,059 | ||||
SLM Student Loan Trust, | ||||||||
1.534%, 04/27/2043 (B) | 937 | 832 | ||||||
SLM Student Loan Trust, | ||||||||
1.285%, 10/16/2023 (B) (C) | 95 | 95 | ||||||
SLM Student Loan Trust, | ||||||||
2.334%, 11/25/2043 (B) | 487 | 434 | ||||||
SLM Student Loan Trust, | ||||||||
2.034%, 09/25/2043 (B) | 768 | 665 | ||||||
SLM Student Loan Trust, | ||||||||
1.084%, 06/25/2027 (B) | 2,045 | 1,979 | ||||||
SLM Student Loan Trust, | ||||||||
1.184%, 06/25/2055 (B) | 2,974 | 2,948 | ||||||
SLM Student Loan Trust, | ||||||||
1.770%, 05/17/2027 (C) | 621 | 614 | ||||||
SLM Student Loan Trust, | ||||||||
3.500%, 10/28/2029 (C) | 2,310 | 2,265 | ||||||
SLM Student Loan Trust, | ||||||||
1.124%, 03/25/2055 (B) | 1,895 | 1,873 | ||||||
SMB Private Education Loan Trust, | ||||||||
2.490%, 06/15/2027 (C) | 2,370 | 2,355 | ||||||
SMB Private Education Loan Trust, | ||||||||
1.538%, 06/15/2027 (B) (C) | 2,190 | 2,171 | ||||||
SMB Private Education Loan Trust, Ser 2015-B, Cl A2A | ||||||||
2.980%, 07/15/2027 (C) | 974 | 985 | ||||||
SMB Private Education Loan Trust, Ser 2015-B, Cl A2B | ||||||||
1.738%, 07/15/2027 (B) (C) | 3,146 | 3,176 | ||||||
SMB Private Education Loan Trust, Ser 2015-C, Cl A2A | ||||||||
2.750%, 07/15/2027 (C) | 1,368 | 1,375 | ||||||
SMB Private Education Loan Trust, Ser 2015-C, Cl A2B | ||||||||
1.938%, 07/15/2027 (B) (C) | 1,368 | 1,392 | ||||||
SMB Private Education Loan Trust, Ser 2016-A, Cl A2A | ||||||||
2.700%, 05/15/2031 (C) | 3,903 | 3,800 | ||||||
SMB Private Education Loan Trust, Ser 2016-A, Cl A2B | ||||||||
2.038%, 05/15/2031 (B) (C) | 2,981 | 2,981 | ||||||
SMB Private Education Loan Trust, Ser 2016-B, Cl A2A | ||||||||
2.430%, 02/17/2032 (C) | 4,938 | 4,833 | ||||||
SMB Private Education Loan Trust, Ser 2016-B, Cl A2B | ||||||||
1.988%, 02/17/2032 (B) (C) | 2,930 | 2,930 | ||||||
SMB Private Education Loan Trust, Ser 2016-C, Cl A2A | ||||||||
2.340%, 09/15/2034 (C) | 5,150 | 5,093 | ||||||
| Description | Face Amount ($ Thousands) | Market Value ($ Thousands) | ||||||
SMB Private Education Loan Trust, Ser 2016-C, Cl A2B | ||||||||
1.622%, 09/15/2034 (B) (C) | $ | 3,631 | $ | 3,631 | ||||
Sofi Professional Loan Program, Ser 2016-A, Cl A2 | ||||||||
2.760%, 12/26/2036 (C) | 1,921 | 1,944 | ||||||
Sofi Professional Loan Program, Ser 2016-D, Cl A2A | ||||||||
1.530%, 04/25/2033 (C) | 1,488 | 1,485 | ||||||
Sofi Professional Loan Program, Ser 2016-D, Cl A2B | ||||||||
2.340%, 04/25/2033 (C) | 1,666 | 1,628 | ||||||
Sofi Professional Loan Program, Ser 2016-E, Cl A1 | ||||||||
1.380%, 07/25/2039 (B) (C) | 3,393 | 3,393 | ||||||
Sofi Professional Loan Program, Ser 2016-E, Cl A2A | ||||||||
1.630%, 01/25/2036 (C) | 1,350 | 1,350 | ||||||
Sofi Professional Loan Program, Ser 2016-E, Cl A2B | ||||||||
2.490%, 01/25/2036 (C) | 2,190 | 2,186 | ||||||
Structured Asset Investment Loan Trust, Ser 2004-8, Cl A2 | ||||||||
1.084%, 09/25/2034 (B) | 3,364 | 3,094 | ||||||
Structured Asset Securities Mortgage Loan Trust, Ser 2005-WF2, Cl A3 | ||||||||
1.134%, 05/25/2035 (B) | 4,325 | 4,326 | ||||||
Symphony CLO XVII, Ser 2016-17A, Cl A1 | ||||||||
2.380%, 04/15/2028 (B) (C) | 1,250 | 1,253 | ||||||
TCI-FLATIRON CLO, Ser 2016-1A, Cl A | ||||||||
2.212%, 07/17/2028 (B) (C) | 2,500 | 2,509 | ||||||
Trade MAPS 1, Ser 2013-1A, Cl A | ||||||||
1.237%, 12/10/2018 (B) (C) | 3,109 | 3,108 | ||||||
U.S. Small Business Administration, Ser 2013- 20L, Cl 1 | ||||||||
3.380%, 12/01/2033 | 999 | 1,041 | ||||||
Venture XXIV CLO, Ser 2016-24A, Cl A1D | ||||||||
2.240%, 10/20/2028 (B) (C) | 2,500 | 2,495 | ||||||
Verizon Owner Trust, Ser 2016-1A, Cl A | ||||||||
1.420%, 01/20/2021 (C) | 4,294 | 4,276 | ||||||
Verizon Owner Trust, Ser 2016-2A, Cl A | ||||||||
1.680%, 05/20/2021 (C) | 4,797 | 4,790 | ||||||
Voya CLO, Ser 2014-2A, Cl A1 | ||||||||
2.129%, 07/17/2026 (B) (C) | 500 | 500 | ||||||
Voya CLO, Ser 2016-1A, Cl A1R | ||||||||
2.015%, 04/18/2026 (B) (C) | 1,950 | 1,949 | ||||||
Zais CLO 2, Ser 2014-2A, Cl A1B | ||||||||
3.570%, 07/25/2026 (C) | 3,000 | 3,005 | ||||||
| 102 | SEI Institutional Investments Trust / Semi-Annual Report / November 30, 2016 |
| Description | Face Amount ($ Thousands) | Market Value ($ Thousands) | ||||||
Ziggurat CLO, Ser 2014-1A, Cl B1 | ||||||||
2.779%, 10/17/2026 (B) (C) | $ | 1,000 | $ | 995 | ||||
|
| |||||||
| 371,586 | ||||||||
|
| |||||||
Total Asset-Backed Securities (Cost $562,602) ($ Thousands) | 564,464 | |||||||
|
| |||||||
SOVEREIGN DEBT — 2.6% | ||||||||
Abu Dhabi Government International Bond | ||||||||
2.125%, 05/03/2021 (C) | 1,660 | 1,635 | ||||||
China Government Bond | ||||||||
3.390%, 05/21/2025 | CNY | 5,000 | 720 | |||||
3.380%, 11/21/2024 | 3,000 | 433 | ||||||
3.310%, 11/30/2025 | 23,000 | 3,278 | ||||||
FMS Wertmanagement AoeR | ||||||||
1.000%, 11/21/2017 | $ | 1,660 | 1,655 | |||||
Israel Government AID Bond | ||||||||
5.500%, 09/18/2033 | 1,000 | 1,307 | ||||||
3.687%, 11/01/2024 (A) | 1,000 | 802 | ||||||
3.144%, 02/15/2025 (A) | 1,000 | 784 | ||||||
3.071%, 08/15/2025 (A) | 1,000 | 770 | ||||||
Israel Government International Bond | ||||||||
4.500%, 01/30/2043 | 1,510 | 1,514 | ||||||
Japan Bank for International Cooperation | ||||||||
2.000%, 11/04/2021 | 1,048 | 1,023 | ||||||
1.875%, 04/20/2021 | 2,234 | 2,183 | ||||||
1.500%, 07/21/2021 | 3,308 | 3,176 | ||||||
Japan Finance Organization for Municipalities | ||||||||
4.000%, 01/13/2021 | 3,600 | 3,808 | ||||||
Japan Treasury Discount Bill (A) | ||||||||
0.000%, 12/12/2016 | JPY | 2,230,000 | 19,570 | |||||
0.000%, 01/23/2017 | 2,570,000 | 22,562 | ||||||
0.000%, 02/27/2017 | 2,200,000 | 19,320 | ||||||
Province of Ontario Canada | ||||||||
1.625%, 01/18/2019 | $ | 2,250 | 2,250 | |||||
Province of Quebec Canada | ||||||||
2.625%, 02/13/2023 | 5,600 | 5,627 | ||||||
Qatar Government International Bond | ||||||||
3.250%, 06/02/2026 (C) | 1,355 | 1,321 | ||||||
2.375%, 06/02/2021 (C) | 2,460 | 2,426 | ||||||
Republic of Colombia | ||||||||
5.625%, 02/26/2044 | 4,070 | 4,060 | ||||||
5.000%, 06/15/2045 | 200 | 184 | ||||||
Republic of Indonesia MTN | ||||||||
5.875%, 03/13/2020 | 190 | 208 | ||||||
5.875%, 01/15/2024 (C) | 1,264 | 1,419 | ||||||
4.875%, 05/05/2021 | 500 | 532 | ||||||
3.750%, 04/25/2022 (C) | 360 | 362 | ||||||
3.750%, 04/25/2022 | 500 | 502 | ||||||
Republic of Paraguay | ||||||||
6.100%, 08/11/2044 (C) | 975 | 968 | ||||||
| Description | Face Amount ($ Thousands) | Market Value ($ Thousands) | ||||||
Republic of Peru | ||||||||
6.550%, 03/14/2037 | $ | 300 | $ | 380 | ||||
5.625%, 11/18/2050 | 2,460 | 2,804 | ||||||
Republic of Poland | ||||||||
5.000%, 03/23/2022 | 380 | 416 | ||||||
Republic of Poland Government International Bond | ||||||||
4.000%, 01/22/2024 | 7,630 | 7,872 | ||||||
Republic of Slovenia | ||||||||
5.850%, 05/10/2023 (C) | 1,560 | 1,775 | ||||||
5.500%, 10/26/2022 (C) | 1,871 | 2,082 | ||||||
5.250%, 02/18/2024 (C) | 4,125 | 4,572 | ||||||
Republic of South Africa | ||||||||
4.300%, 10/12/2028 | 1,745 | 1,616 | ||||||
United Mexican States MTN | ||||||||
5.750%, 10/12/2110 | 2,177 | 1,954 | ||||||
5.550%, 01/21/2045 | 5,566 | 5,538 | ||||||
4.350%, 01/15/2047 | 2,375 | 1,977 | ||||||
4.000%, 10/02/2023 | 2,955 | 2,947 | ||||||
3.600%, 01/30/2025 | 3,190 | 3,058 | ||||||
|
| |||||||
Total Sovereign Debt (Cost $147,242) ($ Thousands) | 141,390 | |||||||
|
| |||||||
U.S. GOVERNMENT AGENCY OBLIGATIONS — 0.8% |
| |||||||
FHLB | ||||||||
1.875%, 03/13/2020 | 75 | 76 | ||||||
1.375%, 11/15/2019 | 6,040 | 6,025 | ||||||
1.250%, 06/28/2030 (D) | 7,510 | 7,479 | ||||||
0.875%, 05/24/2017 | 100 | 100 | ||||||
FHLMC | ||||||||
1.000%, 03/08/2017 to 07/28/2017 | 310 | 311 | ||||||
0.750%, 01/12/2018 | 250 | 249 | ||||||
FICO STRIPS, PO(A) | ||||||||
1.386%, 11/02/2018 (A) | 3,410 | 3,330 | ||||||
1.315%, 05/11/2018 (A) | 3,620 | 3,558 | ||||||
1.302%, 04/06/2018 (A) | 2,920 | 2,869 | ||||||
FNMA(A) | ||||||||
1.250%, 01/30/2017 | 200 | 200 | ||||||
1.147%, 10/09/2019 (A) | 14,005 | 13,281 | ||||||
1.125%, 04/27/2017 | 150 | 150 | ||||||
0.875%, 05/21/2018 | 250 | 249 | ||||||
Tennessee Valley Authority | ||||||||
3.875%, 02/15/2021 | 3,090 | 3,339 | ||||||
2.875%, 09/15/2024 | 3,748 | 3,847 | ||||||
| SEI Institutional Investments Trust / Semi-Annual Report / November 30, 2016 | 103 |
SCHEDULE OF INVESTMENTS (Unaudited)
Core Fixed Income Fund (Continued)
November 30, 2016
| Description | Face Amount ($ Thousands) | Market Value ($ Thousands) | ||||||
Tennessee Valley Authority Principal STRIPS, PO (A) | ||||||||
0.000%, 11/01/2025 (A) | $ | 1,000 | $ | 764 | ||||
|
| |||||||
Total U.S. Government Agency Obligations | 45,827 | |||||||
|
| |||||||
MUNICIPAL BONDS — 0.4% | ||||||||
California — 0.1% | ||||||||
California State, Build America Project, GO | ||||||||
7.600%, 11/01/2040 | 1,215 | 1,820 | ||||||
6.650%, 03/01/2022 | 70 | 83 | ||||||
Los Angeles, Community College District, Build America Project, GO | ||||||||
6.750%, 08/01/2049 | 1,695 | 2,437 | ||||||
|
| |||||||
| 4,340 | ||||||||
|
| |||||||
Nevada — 0.0% | ||||||||
Clark County, Airport System Revenue, Build America Project, Ser C-BUILD, RB | ||||||||
6.820%, 07/01/2045 | 1,570 | 2,207 | ||||||
|
| |||||||
New Jersey — 0.0% | ||||||||
New Jersey State, Turnpike Authority, Build America Project, RB | ||||||||
7.102%, 01/01/2041 | 1,383 | 1,936 | ||||||
|
| |||||||
New York — 0.2% | ||||||||
New York City, Build America Project, GO | ||||||||
5.047%, 10/01/2024 | 4,000 | 4,505 | ||||||
New York City, Build America Project, GO Callable 12/01/2020 @ 100 | ||||||||
6.646%, 12/01/2031 | 2,000 | 2,293 | ||||||
New York City, Municipal Water Finance Authority, Build America Project, RB | ||||||||
5.440%, 06/15/2043 | 1,000 | 1,230 | ||||||
Port Authority of New York & New Jersey, RB | ||||||||
4.458%, 10/01/2062 | 2,310 | 2,322 | ||||||
|
| |||||||
| 10,350 | ||||||||
|
| |||||||
Ohio — 0.0% | ||||||||
Ohio State University, Build America Project, Ser A, RB | ||||||||
4.800%, 06/01/2111 | 689 | 681 | ||||||
|
| |||||||
Texas — 0.1% | ||||||||
Brazos, Higher Education Authority, Ser 2006- 2, Cl A9, RB, GTD STD LNS | ||||||||
0.867%, 12/26/2024 (B) | 1,155 | 1,110 | ||||||
| Description | Face Amount ($ Thousands) | Market Value ($ Thousands) | ||||||
North Texas, Tollway Authority, Build America Project, RB | ||||||||
6.718%, 01/01/2049 | $ | 1,829 | $ | 2,555 | ||||
|
| |||||||
| 3,665 | ||||||||
|
| |||||||
Virginia — 0.0% | ||||||||
Virginia State, Housing Development Authority, Ser C, RB | ||||||||
6.000%, 06/25/2034 | 180 | 189 | ||||||
|
| |||||||
Total Municipal Bonds | 23,368 | |||||||
|
| |||||||
Shares | ||||||||
CASH EQUIVALENT — 4.2% | ||||||||
SEI Daily Income Trust, Government Fund, Cl A | ||||||||
0.210%**† | 227,805,925 | 227,806 | ||||||
|
| |||||||
Total Cash Equivalent | 227,806 | |||||||
|
| |||||||
Total Investments — 108.1% | $ | 5,927,893 | ||||||
Contracts | ||||||||
PURCHASED OPTION (F) — 0.0% | ||||||||
January 2017, U.S. 5 Year Future Option Call, Expires 12/17/2016, Strike Price $118.75* | 95 | 12 | ||||||
|
| |||||||
Total Purchased Option | $ | 12 | ||||||
|
| |||||||
WRITTEN OPTIONS (F) — 0.0% | ||||||||
February 2017, U.S. 10 Year Future Option Call, | (47 | ) | (10 | ) | ||||
February 2017, U.S. 10 Year Future Option Call, | (47 | ) | (18 | ) | ||||
February 2017, U.S. 10 Year Future Option Call, | (47 | ) | (25 | ) | ||||
February 2017, U.S. 5 Year Future Option Call, | (286 | ) | (20 | ) | ||||
February 2017, U.S. Bond Future Option Put, | (71 | ) | (52 | ) | ||||
January 2017, U.S. 10 Year Future Option Call, | (48 | ) | (1 | ) | ||||
| 104 | SEI Institutional Investments Trust / Semi-Annual Report / November 30, 2016 |
| Description | Contracts | Market Value ($ Thousands) | ||||||
January 2017, U.S. 10 Year Future Option Call, | (190 | ) | $ | (3 | ) | |||
January 2017, U.S. 10 Year Future Option Call, | (95 | ) | (3 | ) | ||||
January 2017, U.S. 10 Year Future Option Call, | (142 | ) | (2 | ) | ||||
January 2017, U.S. 5 Year Future Option Call, | (274 | ) | (2 | ) | ||||
January 2017, U.S. Bond Future Option Put, | (95 | ) | (131 | ) | ||||
March 2017, U.S. 10 Year Future Option Call, | (95 | ) | (36 | ) | ||||
|
| |||||||
Total Written Options | $ | (303 | ) | |||||
|
| |||||||
A list of the open futures contracts held by the Fund at November 30, 2016, is as follows:
| Type of Contract | Number of Contracts Long (Short) | Expiration Date | Unrealized Appreciation (Depreciation) ($ Thousands) | |||||||||
90-Day Euro$ | (1,323 | ) | Mar-2017 | $ | 24 | |||||||
Euro | (40 | ) | Dec-2016 | 339 | ||||||||
Euro-Bund | (175 | ) | Dec-2016 | 665 | ||||||||
U.S. 10-Year Treasury Note | 2,292 | Mar-2017 | (1,118 | ) | ||||||||
U.S. 2-Year Treasury Note | 27 | Mar-2017 | (2 | ) | ||||||||
U.S. 2-Year Treasury Note | 172 | Mar-2017 | 9 | |||||||||
U.S. 5-Year Treasury Note | 1,508 | Mar-2017 | (387 | ) | ||||||||
U.S. Long Treasury Bond | (767 | ) | Mar-2017 | 265 | ||||||||
U.S. Ultra Long Treasury Bond | (702 | ) | Mar-2017 | 556 | ||||||||
Ultra 10-Year U.S. Treasury Bond | (345 | ) | Mar-2017 | 148 | ||||||||
|
| |||||||||||
| $ | 499 | |||||||||||
|
| |||||||||||
For the period ended November 30, 2016, the total amount of all open futures contracts, as presented in the table above, are representative of the volume of activity for the derivative type during the period.
A list of the open forward foreign currency contracts held by the Fund at November 30, 2016, is as follows:
Settlement Date | Currency to Deliver (Thousands) | Currency To Receive | Unrealized Appreciation (Depreciation) ($ Thousands) | |||||||||||||||
12/12/16-02/27/17 | JPY | 9,212,996 | USD | 88,561 | $ | 7,463 | ||||||||||||
01/20/17-02/13/17 | USD | 7,332 | EUR | 6,541 | (373 | ) | ||||||||||||
01/20/17 | CNY | 30,890 | USD | 4,579 | 130 | |||||||||||||
02/13/17-02/13/17 | EUR | 12,887 | USD | 14,332 | 610 | |||||||||||||
|
| |||||||||||||||||
| $ | 7,830 | |||||||||||||||||
|
| |||||||||||||||||
A list of the counterparties for the outstanding forward foreign currency contracts held by the Fund at November 30, 2016, is as follows:
| Counterparty | Currency to ($ Thousands) | Currency to ($ Thousands) | Unrealized Appreciation (Depreciation) ($ Thousands) | |||||||||
Bank of America | $ | (921 | ) | $ | 880 | $ | (41 | ) | ||||
Barclays PLC | (3,357 | ) | 3,507 | 150 | ||||||||
Citigroup | (39,597 | ) | 41,793 | 2,197 | ||||||||
JPMorgan Chase Bank | (38,986 | ) | 42,228 | 3,241 | ||||||||
U.S. Bank | (22,629 | ) | 24,859 | 2,230 | ||||||||
UBS | (1,112 | ) | 1,165 | 53 | ||||||||
|
| |||||||||||
| $ | 7,830 | |||||||||||
|
| |||||||||||
For the period ended November 30, 2016 the total amount of all open forward foreign currency contracts, as presented in the table above, are representative of the volume of activity for the derivative type during the period.
| SEI Institutional Investments Trust / Semi-Annual Report / November 30, 2016 | 105 |
SCHEDULE OF INVESTMENTS (Unaudited)
Core Fixed Income Fund (Concluded)
November 30, 2016
A list of the open OTC swap agreements held by the Fund at November 30, 2016 is as follows:
| Interest Rate Swaps | ||||||||||||||||
| Counterparty | Fund Pays | Fund Receives | Termination Date | Notional Amount ($ Thousands) | Net Unrealized Depreciation ($ Thousands) | |||||||||||
| Citigroup | 2.71% | 3 Month USD - LIBOR | 08/15/42 | $ | 8,210 | $ | (467 | ) | ||||||||
|
| |||||||||||||||
| $ | (467 | ) | ||||||||||||||
|
| |||||||||||||||
| Credit Default Swaps | ||||||||||||||||||||||||
| Counterparty | Reference Entity/Obligation | Buy/Sell Protection | (Pays)/Receives Rate | Termination Date | Notional Amount ($ Thousands) | Net Unrealized ($ Thousands) | ||||||||||||||||||
Goldman Sachs | Metlife Inc. | SELL | 1.00% | 06/20/21 | $ | (1,660 | ) | $ | (3 | ) | ||||||||||||||
Goldman Sachs | Metlife Inc. | SELL | 1.00% | 06/20/21 | (260 | ) | — | |||||||||||||||||
|
| |||||||||||||||||||||||
| $ | (3 | ) | ||||||||||||||||||||||
|
| |||||||||||||||||||||||
A list of the open centrally cleared swap agreements held by the Fund at November 30, 2016 is as follows:
| Interest Rate Swaps | ||||||||||||||||||
| Counterparty | Fund Pays | Fund Receives | Termination Date | Notional Amount ($ Thousands) | Net Unrealized Appreciation (Depreciation) ($ Thousands) | |||||||||||||
BNP Paribas | 3M LIBOR | 1.58% | 06/13/26 | $ | 19,640 | $ | 1,080 | |||||||||||
BNP Paribas | 1.19% | 3M LIBOR | 06/13/21 | 19,690 | (502 | ) | ||||||||||||
Citigroup | 3.68% | 3 Month USD - LIBOR | 11/15/43 | 5,080 | (1,222 | ) | ||||||||||||
Merrill Lynch | 1.27% | 3-Month | 05/15/23 | 47,232 | 2,052 | |||||||||||||
UBS | PAY 1.90% | REC 3-Month USD LIBOR | 11/30/22 | 69,440 | 140 | |||||||||||||
UBS | PAY 1.897% | REC 3-Month USD LIBOR | 08/31/22 | 45,600 | 22 | |||||||||||||
|
| |||||||||||||||||
| $ | 1,570 | |||||||||||||||||
|
| |||||||||||||||||
For the period ended November 30, 2016, the total amount of open swap agreements, as presented in the tables above, are representative of the volume of activity for this derivative type during the period.
Percentages are based on Net Assets of $5,481,897 ($ Thousands).
| * | Non-income producing security. |
| ** | Rate shown is the 7-day effective yield as of November 30, 2016. |
| † | Investment in Affiliated Security (see Note 6). |
| (A) | Zero coupon security. The rate shown on the schedule of investments represents the security's effective yield at the time of purchase. |
| (B) | Variable Rate Security — The rate reported on the Schedule of Investments is the rate in effect as of November 30, 2016. |
| (C) | Security exempt from registration under Rule 144A of the Securities Act of 1933. These securities may be resold in transactions exempt from registration normally to qualified institutions. On November 30, 2016, the value of these securities amounted to $595,060 ($ Thousands), representing 10.9% of the net assets of the Fund. |
| (D) | Step Bonds — The rate reflected on the Schedule of Investments is the effective yield on November 30, 2016. The coupon on a step bond changes on a specified date. |
| (E) | Security fair valued using methods determined in good faith by the Valuation Committee of the Board of Trustees. The total market value of such securities as of November 30, 2016 was $847 ($ Thousands) and represented 0.0% of Net Assets. |
| (F) | For the period ended November 30, 2016, the total amount of open purchased swaptions, written options and written swaptions, as presented in the Schedule of Investments, are representative of the volume of activity for these derivative types during the period. |
ABS — Asset-Backed Security
AID — Agency for International Development
ARM — Adjustable Rate Mortgage
Cl — Class
CLO — Collateralized Loan Obligation
CMO — Collateralized Mortgage Obligation
CNY — Chinese Yuan
EUR — Euro
FHLB — Federal Home Loan Bank
FHLMC — Federal Home Loan Mortgage Corporation
FICO — Financing Corporation
FNMA — Federal National Mortgage Association
FREMF — Freddie Mac Multi-Family
GNMA — Government National Mortgage Association
GO — General Obligation
IO — Interest Only — face amount represents notional amount.
JPY — Japanese Yen
LIBOR — London Interbank Offered Rate
LLC — Limited Liability Company
LP — Limited Partnership
MTN — Medium Term Note
NCUA — National Credit Union Association
PO — Principal Only
RB — Revenue Bond
REMIC — Real Estate Mortgage Investment Conduit
Ser — Series
STRIPS — Separately Traded Registered Interest and Principal Securities
TBA — To Be Announced
USD — United States Dollar
| 106 | SEI Institutional Investments Trust / Semi-Annual Report / November 30, 2016 |
The following is a list of the level of inputs used as of November 30, 2016, in valuing the Fund’s investments and other financial instruments carried at value ($ Thousands):
| Investments in Securities | Level 1 | Level 2 | Level 3(1) | Total | ||||||||||||
U.S. Treasury Obligations | $ | — | $ | 1,703,991 | $ | — | $ | 1,703,991 | ||||||||
Mortgage-Backed Securities | — | 1,638,855 | — | 1,638,855 | ||||||||||||
Corporate Obligations | — | 1,581,345 | 847 | 1,582,192 | ||||||||||||
Asset-Backed Securities | — | 564,464 | — | 564,464 | ||||||||||||
Sovereign Debt | — | 141,390 | — | 141,390 | ||||||||||||
U.S. Government Agency Obligations | — | 45,827 | — | 45,827 | ||||||||||||
Municipal Bonds | — | 23,368 | — | 23,368 | ||||||||||||
Cash Equivalent | 227,806 | — | — | 227,806 | ||||||||||||
|
|
|
|
|
|
|
| |||||||||
Total Investments in Securities | $ | 227,806 | $ | 5,699,240 | $ | 847 | $ | 5,927,893 | ||||||||
|
|
|
|
|
|
|
| |||||||||
| Other Financial Instruments | Level 1 | Level 2 | Level 3 | Total | ||||||||||||
Purchased Options | $ | 12 | $ | — | $ | — | $ | 12 | ||||||||
Written Options | (303 | ) | — | — | (303 | ) | ||||||||||
Futures Contracts* | ||||||||||||||||
Unrealized Appreciation | 2,006 | — | — | 2,006 | ||||||||||||
Unrealized Depreciation | (1,507 | ) | — | — | (1,507 | ) | ||||||||||
Forwards Contracts* | ||||||||||||||||
Unrealized Appreciation | — | 8,203 | — | 8,203 | ||||||||||||
Unrealized Depreciation | — | (373 | ) | — | (373 | ) | ||||||||||
OTC Swaps | ||||||||||||||||
Credit Default Swaps* | ||||||||||||||||
Unrealized Depreciation | — | (3 | ) | — | (3 | ) | ||||||||||
Interest Rate Swaps* | ||||||||||||||||
Unrealized Depreciation | — | (467 | ) | — | (467 | ) | ||||||||||
Centrally Cleared Swaps | ||||||||||||||||
Interest Rate Swaps* | ||||||||||||||||
Unrealized Appreciation | — | 3,294 | — | 3,294 | ||||||||||||
Unrealized Depreciation | — | (1,724 | ) | — | (1,724 | ) | ||||||||||
|
|
|
|
|
|
|
| |||||||||
Total Other Financial Instruments | $ | 208 | $ | 8,930 | $ | — | $ | 9,138 | ||||||||
|
|
|
|
|
|
|
| |||||||||
| (1) | A reconciliation of Level 3 investments is presented when the Fund has a significant amount of Level 3 investments at the beginning and/or end of the period in relation to net assets. Management has concluded that Level 3 investments are not material in relation to net assets. |
| * | Futures contracts, forward contracts and swaps are valued at the unrealized appreciation (depreciation) on the instrument. |
For the period ended November 30, 2016, there were no transfers between Level 1 and Level 2 assets and liabilities.
For the period ended November 30, 2016, there were no transfers between Level 2 and Level 3 assets and liabilities.
For more information on valuation inputs, see Note 2 — Significant Accounting Policies in Notes to Financial Statements.
Amounts designated as “—” are $0 or have been rounded to $0.
The accompanying notes are an integral part of the financial statements.
| SEI Institutional Investments Trust / Semi-Annual Report / November 30, 2016 | 107 |
SCHEDULE OF INVESTMENTS (Unaudited)
High Yield Bond Fund
November 30, 2016
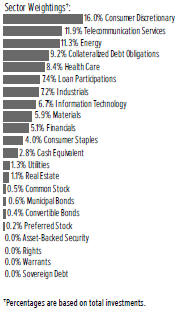
| Description | Face Amount ($ Thousands) | Market Value ($ Thousands) | ||||||
CORPORATE OBLIGATIONS — 78.6% |
| |||||||
Consumer Discretionary — 15.9% |
| |||||||
Adelphia Communications (escrow security) (A) | ||||||||
10.250%, 06/15/2011 | $ | 125 | $ | 1 | ||||
7.875%, 01/15/2009 | 250 | — | ||||||
7.750%, 05/01/2009 | 75 | — | ||||||
Adelphia Communications (escrow security), Ser B | ||||||||
9.500%, 02/15/2004 | 25 | — | ||||||
Adient Global Holdings | ||||||||
4.875%, 08/15/2026 (B) | 3,898 | 3,742 | ||||||
Algeco Scotsman Global Finance | ||||||||
8.500%, 10/15/2018 (B) | 2,750 | 2,482 | ||||||
AMC Entertainment | ||||||||
5.875%, 02/15/2022 | 1,000 | 1,043 | ||||||
5.750%, 06/15/2025 | 3,265 | 3,290 | ||||||
AMC Entertainment Holdings | ||||||||
5.875%, 11/15/2026 (B) | 205 | 207 | ||||||
AMC Networks | ||||||||
5.000%, 04/01/2024 | 2,615 | 2,622 | ||||||
4.750%, 12/15/2022 | 3,305 | 3,309 | ||||||
American Axle & Manufacturing | ||||||||
6.625%, 10/15/2022 | 685 | 689 | ||||||
6.250%, 03/15/2021 | 605 | 617 | ||||||
American Builders & Contractors Supply | ||||||||
5.750%, 12/15/2023 (B) | 900 | 924 | ||||||
5.625%, 04/15/2021 (B) | 1,210 | 1,249 | ||||||
American Greetings | ||||||||
7.375%, 12/01/2021 | 390 | 400 | ||||||
Aramark Services | ||||||||
4.750%, 06/01/2026 (B) | 1,400 | 1,356 | ||||||
| Description | Face Amount ($ Thousands) | Market Value ($ Thousands) | ||||||
Argos Merger Sub | ||||||||
7.125%, 03/15/2023 (B) | $ | 2,865 | $ | 2,933 | ||||
Belo | ||||||||
7.750%, 06/01/2027 | 2,025 | 2,167 | ||||||
Bon-Ton Department Stores | ||||||||
8.000%, 06/15/2021 | 13,507 | 6,686 | ||||||
Boyd Gaming | ||||||||
6.875%, 05/15/2023 | 1,385 | 1,472 | ||||||
6.375%, 04/01/2026 (B) | 3,370 | 3,513 | ||||||
Brookfield Residential Properties | ||||||||
6.375%, 05/15/2025 (B) | 632 | 629 | ||||||
Burger King Worldwide | ||||||||
6.000%, 04/01/2022 (B) | 1,435 | 1,496 | ||||||
Cablevision Systems | ||||||||
7.750%, 04/15/2018 | 900 | 946 | ||||||
5.875%, 09/15/2022 | 1,947 | 1,816 | ||||||
Caesars Entertainment Operating (A) | ||||||||
11.250%, 06/01/2017 | 1,645 | 1,653 | ||||||
9.000%, 02/15/2020 | 4,990 | 5,140 | ||||||
8.500%, 02/15/2020 | 1,595 | 1,643 | ||||||
CBS Radio | ||||||||
7.250%, 11/01/2024 (B) | 3,390 | 3,562 | ||||||
CCO Holdings LLC | ||||||||
6.625%, 01/31/2022 | 1,585 | 1,641 | ||||||
5.875%, 04/01/2024 (B) | 1,845 | 1,953 | ||||||
5.750%, 02/15/2026 (B) | 2,860 | 2,939 | ||||||
5.500%, 05/01/2026 (B) | 1,925 | 1,944 | ||||||
5.375%, 05/01/2025 (B) | 5,703 | 5,796 | ||||||
5.125%, 02/15/2023 | 2,000 | 2,055 | ||||||
5.125%, 05/01/2023 (B) | 710 | 727 | ||||||
CEC Entertainment | ||||||||
8.000%, 02/15/2022 | 1,901 | 1,906 | ||||||
Cedar Fair | ||||||||
5.375%, 06/01/2024 | 2,070 | 2,153 | ||||||
Cengage Learning | ||||||||
9.500%, 06/15/2024 (B) | 4,170 | 3,638 | ||||||
Century Communities | ||||||||
6.875%, 05/15/2022 | 2,605 | 2,638 | ||||||
Charter Communications Operating LLC | ||||||||
6.384%, 10/23/2035 (B) | 425 | 474 | ||||||
4.908%, 07/23/2025 (B) | 1,860 | 1,942 | ||||||
Chester Downs & Marina LLC | ||||||||
9.250%, 02/01/2020 (B) | 6,030 | 5,804 | ||||||
Chinos Intermediate Holdings A, Cl A PIK | ||||||||
7.750%, 05/01/2019 (B) | 761 | 240 | ||||||
Cinemark USA | ||||||||
5.125%, 12/15/2022 | 1,100 | 1,130 | ||||||
4.875%, 06/01/2023 | 1,420 | 1,434 | ||||||
Claire's Stores | ||||||||
9.000%, 03/15/2019 (B) | 2,235 | 1,084 | ||||||
8.875%, 03/15/2019 (A) | 554 | 83 | ||||||
| 108 | SEI Institutional Investments Trust / Semi-Annual Report / November 30, 2016 |
| Description | Face Amount ($ Thousands) | Market Value ($ Thousands) | ||||||
Clear Channel Worldwide Holdings | ||||||||
7.625%, 03/15/2020 | $ | 5,755 | $ | 5,643 | ||||
6.500%, 11/15/2022 | 5,550 | 5,575 | ||||||
ClubCorp Club Operations | ||||||||
8.250%, 12/15/2023 (B) | 2,350 | 2,473 | ||||||
Cooper-Standard Automotive | ||||||||
5.625%, 11/15/2026 (B) | 435 | 423 | ||||||
CSC Holdings LLC | ||||||||
8.625%, 02/15/2019 | 2,375 | 2,619 | ||||||
6.750%, 11/15/2021 | 1,000 | 1,051 | ||||||
5.250%, 06/01/2024 | 3,373 | 3,162 | ||||||
Cumulus Media Holdings | ||||||||
7.750%, 05/01/2019 | 5,505 | 2,147 | ||||||
Dana Financing Luxembourg Sarl | ||||||||
6.500%, 06/01/2026 (B) | 245 | 253 | ||||||
Dana Holding | ||||||||
6.000%, 09/15/2023 | 1,650 | 1,716 | ||||||
5.500%, 12/15/2024 | 1,060 | 1,068 | ||||||
Deck Chassis Acquisition | ||||||||
10.000%, 06/15/2023 (B) | 1,235 | 1,275 | ||||||
DISH DBS | ||||||||
7.750%, 07/01/2026 | 405 | 447 | ||||||
6.750%, 06/01/2021 | 1,530 | 1,645 | ||||||
5.875%, 07/15/2022 | 7,059 | 7,306 | ||||||
5.875%, 11/15/2024 | 9,813 | 9,948 | ||||||
5.000%, 03/15/2023 | 5,920 | 5,846 | ||||||
Dollar Tree | ||||||||
5.750%, 03/01/2023 | 2,460 | 2,626 | ||||||
Eldorado Resorts | ||||||||
7.000%, 08/01/2023 | 3,830 | 4,050 | ||||||
EMI Music Publishing Group North America Holdings | ||||||||
7.625%, 06/15/2024 (B) | 2,053 | 2,197 | ||||||
Empire Today LLC | ||||||||
11.375%, 02/01/2017 (B) | 1,841 | 1,841 | ||||||
ESH Hospitality | ||||||||
5.250%, 05/01/2025 (B) | 6,150 | 5,950 | ||||||
Ferrellgas | ||||||||
6.500%, 05/01/2021 | 1,350 | 1,276 | ||||||
Fiat Chrysler Automobiles | ||||||||
5.250%, 04/15/2023 | 775 | 769 | ||||||
Fontainebleau Las Vegas | ||||||||
10.250%, 06/15/2015 (A) (B) | 3,481 | — | ||||||
General Motors | ||||||||
4.875%, 10/02/2023 | 965 | 1,008 | ||||||
General Motors Financial | ||||||||
4.250%, 05/15/2023 | 575 | 577 | ||||||
Goodyear Tire & Rubber | ||||||||
8.750%, 08/15/2020 | 445 | 532 | ||||||
5.125%, 11/15/2023 | 285 | 291 | ||||||
5.000%, 05/31/2026 | 405 | 402 | ||||||
| Description | Face Amount ($ Thousands) | Market Value ($ Thousands) | ||||||
Gray Television | ||||||||
5.125%, 10/15/2024 (B) | $ | 1,548 | $ | 1,447 | ||||
Group 1 Automotive | ||||||||
5.250%, 12/15/2023 (B) | 1,530 | 1,496 | ||||||
Guitar Center | ||||||||
9.625%, 04/15/2020 (B) | 7,915 | 5,778 | ||||||
6.500%, 04/15/2019 (B) | 5,620 | 4,960 | ||||||
Hanesbrands | ||||||||
4.875%, 05/15/2026 (B) | 455 | 454 | ||||||
4.625%, 05/15/2024 (B) | 455 | 454 | ||||||
HD Supply | ||||||||
5.750%, 04/15/2024 (B) | 1,805 | 1,846 | ||||||
5.250%, 12/15/2021 (B) | 1,025 | 1,081 | ||||||
Hillman Group | ||||||||
6.375%, 07/15/2022 (B) | 4,410 | 4,123 | ||||||
Hilton Domestic Operating | ||||||||
4.250%, 09/01/2024 (B) | 5,060 | 4,959 | ||||||
Hilton Grand Vacations Borrower LLC | ||||||||
6.125%, 12/01/2024 (B) | 225 | 231 | ||||||
Hilton Worldwide Finance LLC | ||||||||
5.625%, 10/15/2021 | 420 | 434 | ||||||
iHeartCommunications | ||||||||
10.625%, 03/15/2023 | 1,305 | 969 | ||||||
9.000%, 12/15/2019 | 4,001 | 3,151 | ||||||
9.000%, 03/01/2021 | 1,120 | 826 | ||||||
9.000%, 09/15/2022 | 3,846 | 2,846 | ||||||
iHeartCommunications PIK | ||||||||
14.000%, 02/01/2021 | 4,917 | 1,955 | ||||||
IHO Verwaltungs GmbH PIK | ||||||||
4.500%, 09/15/2023 (B) | 380 | 370 | ||||||
Inn of the Mountain Gods Resort & Casino | ||||||||
9.250%, 11/30/2020 (B) (C) | 7,723 | 6,950 | ||||||
International Game Technology | ||||||||
6.500%, 02/15/2025 (B) | 1,320 | 1,402 | ||||||
6.250%, 02/15/2022 (B) | 1,120 | 1,190 | ||||||
Interval Acquisition | ||||||||
5.625%, 04/15/2023 | 3,810 | 3,905 | ||||||
Isle of Capri Casinos | ||||||||
5.875%, 03/15/2021 | 740 | 770 | ||||||
Jack Ohio Finance LLC | ||||||||
6.750%, 11/15/2021 (B) | 825 | 827 | ||||||
JC Penney | ||||||||
6.375%, 10/15/2036 | 1,160 | 945 | ||||||
5.875%, 07/01/2023 (B) | 1,744 | 1,788 | ||||||
KFC Holding | ||||||||
5.250%, 06/01/2026 (B) | 1,150 | 1,162 | ||||||
5.000%, 06/01/2024 (B) | 1,150 | 1,161 | ||||||
L Brands | ||||||||
6.950%, 03/01/2033 | 1,174 | 1,156 | ||||||
6.875%, 11/01/2035 | 3,310 | 3,310 | ||||||
6.750%, 07/01/2036 | 3,935 | 3,886 | ||||||
6.625%, 04/01/2021 | 975 | 1,080 | ||||||
| SEI Institutional Investments Trust / Semi-Annual Report / November 30, 2016 | 109 |
SCHEDULE OF INVESTMENTS (Unaudited)
High Yield Bond Fund (Continued)
November 30, 2016
| Description | Face Amount ($ Thousands) | Market Value ($ Thousands) | ||||||
5.625%, 02/15/2022 | $ | 1,995 | $ | 2,115 | ||||
Landry's | ||||||||
6.750%, 10/15/2024 (B) | 296 | 296 | ||||||
Lear | ||||||||
5.375%, 03/15/2024 | 204 | 213 | ||||||
5.250%, 01/15/2025 | 810 | 852 | ||||||
Lee Enterprises | ||||||||
9.500%, 03/15/2022 (B) | 2,170 | 2,278 | ||||||
LG FinanceCo | ||||||||
5.875%, 11/01/2024 (B) | 3,482 | 3,465 | ||||||
Liberty Interactive LLC | ||||||||
8.250%, 02/01/2030 | 2,725 | 2,888 | ||||||
LIN Television | ||||||||
5.875%, 11/15/2022 | 1,089 | 1,105 | ||||||
Live Nation Entertainment | ||||||||
4.875%, 11/01/2024 (B) | 2,593 | 2,580 | ||||||
LTF Merger Sub | ||||||||
8.500%, 06/15/2023 (B) | 4,653 | 4,746 | ||||||
M/I Homes | ||||||||
6.750%, 01/15/2021 | 1,775 | 1,846 | ||||||
McClatchy | ||||||||
9.000%, 12/15/2022 | 3,560 | 3,711 | ||||||
MGM Resorts International | ||||||||
7.750%, 03/15/2022 | 3,105 | 3,548 | ||||||
6.750%, 10/01/2020 | 350 | 383 | ||||||
6.625%, 12/15/2021 | 3,625 | 3,960 | ||||||
6.000%, 03/15/2023 | 5,456 | 5,865 | ||||||
5.250%, 03/31/2020 | 1,295 | 1,359 | ||||||
4.625%, 09/01/2026 | 2,000 | 1,905 | ||||||
Mohegan Tribal Gaming Authority | ||||||||
7.875%, 10/15/2024 (B) | 3,703 | 3,708 | ||||||
Monitronics International | ||||||||
9.125%, 04/01/2020 | 9,865 | 9,224 | ||||||
Neiman Marcus Group LLC PIK | ||||||||
8.750%, 10/15/2021 (B) | 1,215 | 917 | ||||||
Neiman Marcus Group LLC | ||||||||
8.000%, 10/15/2021 (B) | 1,545 | 1,213 | ||||||
Netflix | ||||||||
5.875%, 02/15/2025 | 2,315 | 2,478 | ||||||
5.500%, 02/15/2022 | 544 | 582 | ||||||
4.375%, 11/15/2026 (B) | 1,858 | 1,809 | ||||||
New Albertsons | ||||||||
8.700%, 05/01/2030 | 1,870 | 1,870 | ||||||
8.000%, 05/01/2031 | 11,990 | 11,630 | ||||||
7.750%, 06/15/2026 | 135 | 134 | ||||||
7.450%, 08/01/2029 | 3,095 | 2,933 | ||||||
Nexstar Broadcasting | ||||||||
6.875%, 11/15/2020 | 1,270 | 1,308 | ||||||
6.125%, 02/15/2022 (B) | 4,429 | 4,518 | ||||||
Nexstar Escrow | ||||||||
5.625%, 08/01/2024 (B) | 3,470 | 3,435 | ||||||
| Description | Face Amount ($ Thousands) | Market Value ($ Thousands) | ||||||
Nine West Holdings | ||||||||
8.250%, 03/15/2019 (B) | $ | 7,880 | $ | 1,418 | ||||
PF Chang's China Bistro | ||||||||
10.250%, 06/30/2020 (B) | 2,769 | 2,637 | ||||||
Pinnacle Entertainment | ||||||||
5.625%, 05/01/2024 (B) | 1,100 | 1,097 | ||||||
PulteGroup | ||||||||
5.000%, 01/15/2027 | 1,452 | 1,367 | ||||||
Quebecor Media (escrow security) (A) | ||||||||
0.000%, 11/15/2013 | 1,800 | 2 | ||||||
0.000%, 03/15/2016 | 2,175 | 3 | ||||||
Radio One | ||||||||
9.250%, 02/15/2020 (B) | 4,785 | 4,283 | ||||||
7.375%, 04/15/2022 (B) | 7,646 | 7,531 | ||||||
Radio Systems | ||||||||
8.375%, 11/01/2019 (B) | 1,830 | 1,899 | ||||||
RCN, Bridge Loan | ||||||||
0.000%, 10/18/2017 | 2,000 | 2,000 | ||||||
Regal Entertainment Group | ||||||||
5.750%, 03/15/2022 | 1,540 | 1,617 | ||||||
5.750%, 06/15/2023 | 395 | 401 | ||||||
Rivers Pittsburgh Borrower | ||||||||
6.125%, 08/15/2021 (B) | 298 | 303 | ||||||
RSI Home Products | ||||||||
6.500%, 03/15/2023 (B) | 1,590 | 1,658 | ||||||
Sally Holdings LLC | ||||||||
5.750%, 06/01/2022 | 380 | 394 | ||||||
5.625%, 12/01/2025 | 2,900 | 3,008 | ||||||
Schaeffler Finance | ||||||||
4.750%, 05/15/2023 (B) | 865 | 873 | ||||||
Scientific Games International | ||||||||
10.000%, 12/01/2022 | 6,010 | 5,634 | ||||||
Service International | ||||||||
7.500%, 04/01/2027 | 2,065 | 2,395 | ||||||
ServiceMaster LLC | ||||||||
5.125%, 11/15/2024 (B) | 1,197 | 1,200 | ||||||
Sinclair Television Group | ||||||||
6.125%, 10/01/2022 | 1,260 | 1,307 | ||||||
5.875%, 03/15/2026 (B) | 365 | 362 | ||||||
5.625%, 08/01/2024 (B) | 3,850 | 3,802 | ||||||
5.375%, 04/01/2021 | 3,525 | 3,631 | ||||||
5.125%, 02/15/2027 (B) | 2,366 | 2,200 | ||||||
Sirius XM Radio | ||||||||
6.000%, 07/15/2024 (B) | 1,240 | 1,290 | ||||||
5.750%, 08/01/2021 (B) | 395 | 412 | ||||||
5.375%, 04/15/2025 (B) | 9,415 | 9,392 | ||||||
5.375%, 07/15/2026 (B) | 3,190 | 3,158 | ||||||
4.625%, 05/15/2023 (B) | 1,100 | 1,081 | ||||||
Six Flags Entertainment | ||||||||
4.875%, 07/31/2024 (B) | 835 | 810 | ||||||
Spanish Broadcasting System | ||||||||
12.500%, 04/15/2017 (B) | 1,641 | 1,633 | ||||||
| 110 | SEI Institutional Investments Trust / Semi-Annual Report / November 30, 2016 |
| Description | Face Amount ($ Thousands) | Market Value ($ Thousands) | ||||||
Taylor Morrison Communities | ||||||||
5.625%, 03/01/2024 (B) | $ | 2,460 | $ | 2,478 | ||||
Tegna | ||||||||
5.500%, 09/15/2024 (B) | 510 | 518 | ||||||
4.875%, 09/15/2021 (B) | 565 | 581 | ||||||
Tempur Sealy International | ||||||||
5.625%, 10/15/2023 | 1,090 | 1,112 | ||||||
5.500%, 06/15/2026 | 825 | 821 | ||||||
Tenneco | ||||||||
5.000%, 07/15/2026 | 510 | 501 | ||||||
TI Group Automotive Systems LLC | ||||||||
8.750%, 07/15/2023 (B) | 7,063 | 7,275 | ||||||
Time | ||||||||
5.750%, 04/15/2022 (B) | 1,190 | 1,202 | ||||||
Time Warner Cable LLC | ||||||||
6.750%, 06/15/2039 | 720 | 814 | ||||||
5.500%, 09/01/2041 | 975 | 973 | ||||||
Townsquare Media | ||||||||
6.500%, 04/01/2023 (B) | 4,246 | 4,012 | ||||||
Tribune Media | ||||||||
5.875%, 07/15/2022 | 3,665 | 3,574 | ||||||
TRU Taj LLC | ||||||||
12.000%, 08/15/2021 (B) | 3,763 | 3,791 | ||||||
UCI International LLC | ||||||||
8.625%, 02/15/2019 (A) | 1,645 | 341 | ||||||
Univision Communications | ||||||||
5.125%, 02/15/2025 (B) | 6,874 | 6,513 | ||||||
Viking Cruises | ||||||||
8.500%, 10/15/2022 (B) | 3,000 | 3,060 | ||||||
6.250%, 05/15/2025 (B) | 5,790 | 5,225 | ||||||
Vista Outdoor | ||||||||
5.875%, 10/01/2023 | 1,145 | 1,191 | ||||||
VTR Finance | ||||||||
6.875%, 01/15/2024 (B) | 2,365 | 2,400 | ||||||
WMG Acquisition | ||||||||
5.625%, 04/15/2022 (B) | 495 | 510 | ||||||
5.000%, 08/01/2023 (B) | 610 | 610 | ||||||
4.875%, 11/01/2024 (B) | 310 | 307 | ||||||
Wynn Las Vegas LLC | ||||||||
5.500%, 03/01/2025 (B) | 3,650 | 3,600 | ||||||
4.250%, 05/30/2023 (B) | 487 | 463 | ||||||
Yum! Brands | ||||||||
6.875%, 11/15/2037 | 5,070 | 4,968 | ||||||
5.350%, 11/01/2043 | 180 | 147 | ||||||
ZF North America Capital | ||||||||
4.750%, 04/29/2025 (B) | 1,545 | 1,548 | ||||||
4.500%, 04/29/2022 (B) | 795 | 821 | ||||||
|
| |||||||
| 453,224 | ||||||||
|
| |||||||
Consumer Staples — 4.0% |
| |||||||
Albea Beauty Holdings | ||||||||
8.375%, 11/01/2019 (B) | 1,185 | 1,232 | ||||||
| Description | Face Amount ($ Thousands) | Market Value ($ Thousands) | ||||||
Albertsons LLC | ||||||||
6.625%, 06/15/2024 (B) | $ | 1,480 | $ | 1,530 | ||||
5.750%, 03/15/2025 (B) | 1,800 | 1,766 | ||||||
AMN Healthcare | ||||||||
5.125%, 10/01/2024 (B) | 3,995 | 3,955 | ||||||
APX Group | ||||||||
8.750%, 12/01/2020 | 4,640 | 4,547 | ||||||
Ashtead Capital | ||||||||
6.500%, 07/15/2022 (B) | 4,540 | 4,750 | ||||||
5.625%, 10/01/2024 (B) | 390 | 406 | ||||||
B&G Foods | ||||||||
4.625%, 06/01/2021 | 700 | 714 | ||||||
Bumble Bee Holdco PIK | ||||||||
9.625%, 03/15/2018 (B) | 3,022 | 2,962 | ||||||
Bumble Bee Holdings | ||||||||
9.000%, 12/15/2017 (B) | 964 | 952 | ||||||
Central Garden & Pet | ||||||||
6.125%, 11/15/2023 | 745 | 777 | ||||||
Ceridian HCM Holding | ||||||||
11.000%, 03/15/2021 (B) | 1,022 | 1,048 | ||||||
Cott Beverages | ||||||||
5.375%, 07/01/2022 | 1,730 | 1,736 | ||||||
Crimson Merger Sub | ||||||||
6.625%, 05/15/2022 (B) | 8,310 | 6,939 | ||||||
CVS Health | ||||||||
5.000%, 12/01/2024 | 800 | 879 | ||||||
Energizer Holdings | ||||||||
5.500%, 06/15/2025 (B) | 1,170 | 1,170 | ||||||
Fresenius Medical Care US Finance II | ||||||||
4.750%, 10/15/2024 (B) | 800 | 800 | ||||||
4.125%, 10/15/2020 (B) | 2,250 | 2,301 | ||||||
Fresh Market | ||||||||
9.750%, 05/01/2023 (B) | 3,107 | 2,618 | ||||||
Global A&T Electronics | ||||||||
10.000%, 02/01/2019 (B) | 415 | 324 | ||||||
Harland Clarke Holdings | ||||||||
9.750%, 08/01/2018 (B) | 1,515 | 1,549 | ||||||
9.250%, 03/01/2021 (B) | 11,721 | 9,948 | ||||||
Herc Rentals | ||||||||
7.750%, 06/01/2024 (B) | 1,225 | 1,259 | ||||||
7.500%, 06/01/2022 (B) | 720 | 742 | ||||||
HRG Group | ||||||||
7.750%, 01/15/2022 | 2,546 | 2,641 | ||||||
Jaguar Holding II | ||||||||
6.375%, 08/01/2023 (B) | 716 | 737 | ||||||
KeHE Distributors LLC | ||||||||
7.625%, 08/15/2021 (B) | 1,900 | 1,890 | ||||||
Lamb Weston Holdings | ||||||||
4.875%, 11/01/2026 (B) | 1,796 | 1,787 | ||||||
4.625%, 11/01/2024 (B) | 1,796 | 1,788 | ||||||
Laureate Education | ||||||||
10.000%, 09/01/2019 (B) | 3,225 | 3,100 | ||||||
| SEI Institutional Investments Trust / Semi-Annual Report / November 30, 2016 | 111 |
SCHEDULE OF INVESTMENTS (Unaudited)
High Yield Bond Fund (Continued)
November 30, 2016
| Description | Face Amount ($ Thousands) | Market Value ($ Thousands) | ||||||
NBTY | ||||||||
7.625%, 05/15/2021 (B) | $ | 1,300 | $ | 1,282 | ||||
Post Holdings | ||||||||
8.000%, 07/15/2025 (B) | 595 | 668 | ||||||
7.750%, 03/15/2024 (B) | 2,535 | 2,795 | ||||||
6.750%, 12/01/2021 (B) | 155 | 165 | ||||||
6.000%, 12/15/2022 (B) | 365 | 379 | ||||||
5.000%, 08/15/2026 (B) | 4,675 | 4,424 | ||||||
Prestige Brands | ||||||||
5.375%, 12/15/2021 (B) | 1,755 | 1,803 | ||||||
Prime Security Services Borrower LLC | ||||||||
9.250%, 05/15/2023 (B) | 12,014 | 12,915 | ||||||
Rite Aid | ||||||||
7.700%, 02/15/2027 | 3,225 | 3,983 | ||||||
6.875%, 12/15/2028 (B) | 210 | 250 | ||||||
6.125%, 04/01/2023 (B) | 6,757 | 7,222 | ||||||
Spectrum Brands | ||||||||
6.625%, 11/15/2022 | 1,115 | 1,182 | ||||||
6.125%, 12/15/2024 | 1,930 | 2,046 | ||||||
5.750%, 07/15/2025 | 1,285 | 1,333 | ||||||
Sterigenics-Nordion Holdings LLC | ||||||||
6.500%, 05/15/2023 (B) | 1,790 | 1,799 | ||||||
SuperValu | ||||||||
6.750%, 06/01/2021 | 5,325 | 5,272 | ||||||
TreeHouse Foods | ||||||||
6.000%, 02/15/2024 (B) | 415 | 431 | ||||||
|
| |||||||
| 114,796 | ||||||||
|
| |||||||
Energy — 11.3% | ||||||||
Alberta Energy | ||||||||
8.125%, 09/15/2030 | 200 | 231 | ||||||
7.375%, 11/01/2031 | 165 | 180 | ||||||
Antero Midstream Partners | ||||||||
5.375%, 09/15/2024 (B) | 525 | 536 | ||||||
Antero Resources | ||||||||
5.625%, 06/01/2023 | 1,795 | 1,829 | ||||||
5.125%, 12/01/2022 | 825 | 837 | ||||||
Antero Resources Finance | ||||||||
6.000%, 12/01/2020 | 495 | 511 | ||||||
5.375%, 11/01/2021 | 1,160 | 1,190 | ||||||
Archrock Partners | ||||||||
6.000%, 04/01/2021 | 525 | 501 | ||||||
Atwood Oceanics | ||||||||
6.500%, 02/01/2020 | 438 | 342 | ||||||
Bellatrix Exploration | ||||||||
8.500%, 05/15/2020 (B) | 2,206 | 2,096 | ||||||
Berry Petroleum LLC (A) | ||||||||
6.750%, 11/01/2020 | 1,408 | 789 | ||||||
6.375%, 09/15/2022 | 2,999 | 1,664 | ||||||
Blue Racer Midstream LLC | ||||||||
6.125%, 11/15/2022 (B) | 6,362 | 6,203 | ||||||
| Description | Face Amount ($ Thousands) | Market Value ($ Thousands) | ||||||
Boardwalk Pipelines | ||||||||
5.950%, 06/01/2026 | $ | 645 | $ | 689 | ||||
Calfrac Holdings | ||||||||
7.500%, 12/01/2020 (B) | 2,764 | 2,059 | ||||||
California Resources | ||||||||
8.000%, 12/15/2022 (B) | 8,560 | 6,848 | ||||||
Callon Petroleum | ||||||||
6.125%, 10/01/2024 (B) | 3,629 | 3,720 | ||||||
Calumet Specialty Products Partners | ||||||||
7.625%, 01/15/2022 | 2,385 | 1,944 | ||||||
Carrizo Oil & Gas | ||||||||
6.250%, 04/15/2023 | 270 | 275 | ||||||
CHC Helicopter | ||||||||
9.250%, 10/15/2020 (A) | 501 | 246 | ||||||
Chesapeake Energy | ||||||||
8.000%, 12/15/2022 (B) | 6,590 | 6,820 | ||||||
6.875%, 11/15/2020 | 525 | 491 | ||||||
6.125%, 02/15/2021 | 6,607 | 6,062 | ||||||
Cloud Peak Energy Resources LLC | ||||||||
12.000%, 11/01/2021 | 1,027 | 979 | ||||||
Concho Resources | ||||||||
6.500%, 01/15/2022 | 80 | 83 | ||||||
5.500%, 10/01/2022 | 815 | 837 | ||||||
5.500%, 04/01/2023 | 980 | 1,008 | ||||||
Consol Energy | ||||||||
5.875%, 04/15/2022 | 5,364 | 5,149 | ||||||
Continental Resources | ||||||||
5.000%, 09/15/2022 | 1,340 | 1,337 | ||||||
4.500%, 04/15/2023 | 2,602 | 2,530 | ||||||
Contura Energy | ||||||||
10.000%, 08/01/2021 (B) | 2,674 | 2,808 | ||||||
Crestwood Midstream Partners | ||||||||
6.250%, 04/01/2023 | 555 | 563 | ||||||
6.125%, 03/01/2022 | 360 | 364 | ||||||
CSI Compressco | ||||||||
7.250%, 08/15/2022 | 215 | 198 | ||||||
DCP Midstream LLC | ||||||||
5.850%, 05/21/2043 (B) (D) | 967 | 822 | ||||||
Denbury Resources | ||||||||
9.000%, 05/15/2021 (B) | 935 | 970 | ||||||
5.500%, 05/01/2022 | 805 | 658 | ||||||
4.625%, 07/15/2023 | 1,823 | 1,404 | ||||||
Diamondback Energy | ||||||||
4.750%, 11/01/2024 (B) | 885 | 886 | ||||||
Enable Midstream Partners | ||||||||
3.900%, 05/15/2024 | 2,276 | 2,111 | ||||||
Encana | ||||||||
7.200%, 11/01/2031 | 315 | 340 | ||||||
6.625%, 08/15/2037 | 635 | 656 | ||||||
Encana, Ser 2004 | ||||||||
6.500%, 08/15/2034 | 2,016 | 2,066 | ||||||
| 112 | SEI Institutional Investments Trust / Semi-Annual Report / November 30, 2016 |
| Description | Face Amount ($ Thousands) | Market Value ($ Thousands) | ||||||
Endeavor Energy Resources | ||||||||
7.000%, 08/15/2021 (B) | $ | 2,148 | $ | 2,202 | ||||
Energy Transfer Equity | ||||||||
7.500%, 10/15/2020 | 1,511 | 1,689 | ||||||
5.875%, 01/15/2024 | 5,895 | 6,042 | ||||||
5.500%, 06/01/2027 | 1,741 | 1,697 | ||||||
Energy Transfer Partners | ||||||||
6.625%, 10/15/2036 | 920 | 965 | ||||||
6.500%, 02/01/2042 | 155 | 161 | ||||||
6.125%, 12/15/2045 | 1,705 | 1,720 | ||||||
6.050%, 06/01/2041 | 160 | 158 | ||||||
5.150%, 02/01/2043 | 255 | 229 | ||||||
4.900%, 03/15/2035 | 840 | 765 | ||||||
EnLink Midstream Partners | ||||||||
5.050%, 04/01/2045 | 2,303 | 1,949 | ||||||
4.400%, 04/01/2024 | 805 | 784 | ||||||
4.150%, 06/01/2025 | 2,278 | 2,158 | ||||||
2.700%, 04/01/2019 | 1,195 | 1,186 | ||||||
EP Energy LLC | ||||||||
9.375%, 05/01/2020 | 2,228 | 1,867 | ||||||
8.000%, 11/29/2024 (B) | 350 | 360 | ||||||
7.750%, 09/01/2022 | 700 | 490 | ||||||
Extraction Oil & Gas Holdings LLC | ||||||||
7.875%, 07/15/2021 (B) | 3,255 | 3,426 | ||||||
FTS International | ||||||||
8.350%, 06/15/2020 (B) (D) | 1,613 | 1,532 | ||||||
6.250%, 05/01/2022 | 529 | 352 | ||||||
Genesis Energy | ||||||||
6.750%, 08/01/2022 | 3,531 | 3,610 | ||||||
6.000%, 05/15/2023 | 2,294 | 2,294 | ||||||
5.750%, 02/15/2021 | 370 | 372 | ||||||
Gibson Energy | ||||||||
6.750%, 07/15/2021 (B) | 5,550 | 5,758 | ||||||
Globe Luxembourg SCA | ||||||||
9.625%, 05/01/2018 (B) | 2,385 | 2,276 | ||||||
Gulfport Energy | ||||||||
6.000%, 10/15/2024 (B) | 2,213 | 2,252 | ||||||
Halcon Resources | ||||||||
8.625%, 02/01/2020 (B) | 2,398 | 2,459 | ||||||
Hiland Partners Holdings LLC | ||||||||
5.500%, 05/15/2022 (B) | 2,569 | 2,656 | ||||||
IronGate Energy Services LLC | ||||||||
11.000%, 07/01/2018 (A) (B) | 500 | 140 | ||||||
Jones Energy Holdings LLC | ||||||||
9.250%, 03/15/2023 | 1,756 | 1,732 | ||||||
Jupiter Resources | ||||||||
8.500%, 10/01/2022 (B) | 6,820 | 5,627 | ||||||
Kosmos Energy | ||||||||
7.875%, 08/01/2021 | 4,505 | 4,336 | ||||||
Laredo Petroleum | ||||||||
7.375%, 05/01/2022 | 585 | 608 | ||||||
| Description | Face Amount ($ Thousands) | Market Value ($ Thousands) | ||||||
Linn Energy LLC | ||||||||
6.250%, 11/01/2019 (A) | $ | 5,110 | $ | 1,699 | ||||
McDermott International | ||||||||
8.000%, 05/01/2021 (B) | 3,645 | 3,581 | ||||||
MEG Energy | ||||||||
7.000%, 03/31/2024 (B) | 5,500 | 4,799 | ||||||
6.500%, 03/15/2021 (B) | 2,558 | 2,302 | ||||||
6.375%, 01/30/2023 (B) | 3,450 | 3,045 | ||||||
Memorial Production Partners | ||||||||
7.625%, 05/01/2021 (A) | 1,500 | 527 | ||||||
6.875%, 08/01/2022 | 6,775 | 2,363 | ||||||
Midstates Petroleum (A) | ||||||||
10.750%, 10/01/2020 | 3,459 | 34 | ||||||
10.000%, 06/01/2020 | 1,250 | 986 | ||||||
9.250%, 06/01/2021 | 485 | 5 | ||||||
Milagro Oil & Gas | ||||||||
10.500%, 05/15/2016 (A) | 1,950 | 687 | ||||||
MPLX | ||||||||
5.500%, 02/15/2023 | 970 | 1,006 | ||||||
4.875%, 12/01/2024 | 3,735 | 3,763 | ||||||
4.875%, 06/01/2025 | 2,800 | 2,817 | ||||||
Murphy Oil | ||||||||
6.875%, 08/15/2024 | 600 | 632 | ||||||
Murray Energy | ||||||||
11.250%, 04/15/2021 (B) | 2,397 | 1,702 | ||||||
Newfield Exploration | ||||||||
5.750%, 01/30/2022 | 985 | 1,020 | ||||||
5.625%, 07/01/2024 | 1,325 | 1,366 | ||||||
5.375%, 01/01/2026 | 2,820 | 2,862 | ||||||
NGL Energy Partners | ||||||||
7.500%, 11/01/2023 (B) | 3,830 | 3,820 | ||||||
Noble Holding International | ||||||||
5.250%, 03/16/2018 | 3,260 | 3,231 | ||||||
Northern Oil and Gas | ||||||||
8.000%, 06/01/2020 | 1,837 | 1,359 | ||||||
Oasis Petroleum | ||||||||
6.875%, 03/15/2022 | 2,145 | 2,209 | ||||||
6.875%, 01/15/2023 | 990 | 1,015 | ||||||
6.500%, 11/01/2021 | 415 | 419 | ||||||
ONEOK | ||||||||
7.500%, 09/01/2023 | 2,055 | 2,326 | ||||||
Parker Drilling | ||||||||
6.750%, 07/15/2022 | 8,470 | 6,437 | ||||||
Parsley Energy LLC | ||||||||
6.250%, 06/01/2024 (B) | 165 | 171 | ||||||
PBF Holding LLC | ||||||||
7.000%, 11/15/2023 (B) | 1,073 | 1,025 | ||||||
PDC Energy | ||||||||
7.750%, 10/15/2022 | 1,000 | 1,055 | ||||||
6.125%, 09/15/2024 (B) | 357 | 366 | ||||||
Peabody Energy | ||||||||
6.250%, 11/15/2021 (A) | 660 | 421 | ||||||
| SEI Institutional Investments Trust / Semi-Annual Report / November 30, 2016 | 113 |
SCHEDULE OF INVESTMENTS (Unaudited)
High Yield Bond Fund (Continued)
November 30, 2016
| Description | Face Amount ($ Thousands) | Market Value ($ Thousands) | ||||||
Permian Resources LLC | ||||||||
8.000%, 06/15/2020 (B) | $ | 2,628 | $ | 2,602 | ||||
Precision Drilling | ||||||||
7.750%, 12/15/2023 (B) | 896 | 909 | ||||||
Pride International | ||||||||
8.500%, 06/15/2019 | 1,359 | 1,463 | ||||||
Range Resources | ||||||||
4.875%, 05/15/2025 | 610 | 576 | ||||||
Regency Energy Partners | ||||||||
5.875%, 03/01/2022 | 2,195 | 2,427 | ||||||
5.500%, 04/15/2023 | 550 | 568 | ||||||
5.000%, 10/01/2022 | 1,845 | 1,952 | ||||||
Rice Energy | ||||||||
7.250%, 05/01/2023 | 1,700 | 1,785 | ||||||
Rose Rock Midstream | ||||||||
5.625%, 07/15/2022 | 5,980 | 5,741 | ||||||
5.625%, 11/15/2023 | 2,085 | 1,981 | ||||||
Rowan | ||||||||
5.850%, 01/15/2044 | 1,649 | 1,196 | ||||||
RSP Permian | ||||||||
6.625%, 10/01/2022 | 340 | 357 | ||||||
Sabine Pass Liquefaction LLC | ||||||||
6.250%, 03/15/2022 | 1,685 | 1,816 | ||||||
5.875%, 06/30/2026 (B) | 2,070 | 2,186 | ||||||
5.750%, 05/15/2024 | 6,200 | 6,541 | ||||||
5.625%, 02/01/2021 | 5,000 | 5,300 | ||||||
5.625%, 04/15/2023 | 2,070 | 2,163 | ||||||
5.625%, 03/01/2025 | 3,050 | 3,180 | ||||||
5.000%, 03/15/2027 (B) | 1,570 | 1,550 | ||||||
Sanchez Energy | ||||||||
7.750%, 06/15/2021 | 150 | 142 | ||||||
6.125%, 01/15/2023 | 820 | 718 | ||||||
SandRidge Energy | ||||||||
8.750%, 01/15/2020 | 280 | — | ||||||
8.750%, 06/01/2020 | 3,366 | — | ||||||
8.125%, 10/15/2022 | 2,535 | — | ||||||
7.500%, 02/15/2023 | 4,790 | — | ||||||
SemGroup | ||||||||
7.500%, 06/15/2021 | 1,970 | 2,009 | ||||||
SESI LLC | ||||||||
7.125%, 12/15/2021 | 8,933 | 8,732 | ||||||
Seventy Seven Energy | ||||||||
6.500%, 07/15/2022 (A) | 395 | — | ||||||
Seventy Seven Operating LLC | ||||||||
6.625%, 11/15/2019 (A) | 2,787 | — | ||||||
SM Energy | ||||||||
6.750%, 09/15/2026 | 2,187 | 2,247 | ||||||
6.500%, 01/01/2023 | 425 | 427 | ||||||
6.125%, 11/15/2022 | 628 | 630 | ||||||
5.625%, 06/01/2025 | 405 | 389 | ||||||
Southwestern Energy | ||||||||
6.700%, 01/23/2025 | 4,580 | 4,534 | ||||||
| Description | Face Amount ($ Thousands) | Market Value ($ Thousands) | ||||||
4.100%, 03/15/2022 | $ | 180 | $ | 166 | ||||
Summit Midstream Holdings LLC | ||||||||
7.500%, 07/01/2021 | 1,200 | 1,257 | ||||||
5.500%, 08/15/2022 | 2,028 | 1,982 | ||||||
Targa Resources Partners | ||||||||
6.750%, 03/15/2024 | 3,320 | 3,519 | ||||||
5.250%, 05/01/2023 | 1,000 | 995 | ||||||
5.125%, 02/01/2025 (B) | 250 | 247 | ||||||
4.250%, 11/15/2023 | 4,609 | 4,344 | ||||||
Tesoro Logistics | ||||||||
6.375%, 05/01/2024 | 465 | 501 | ||||||
6.250%, 10/15/2022 | 355 | 380 | ||||||
6.125%, 10/15/2021 | 1,207 | 1,263 | ||||||
5.875%, 10/01/2020 | 969 | 1,000 | ||||||
5.250%, 01/15/2025 | 395 | 400 | ||||||
Transocean | ||||||||
9.000%, 07/15/2023 (B) | 1,678 | 1,699 | ||||||
7.500%, 04/15/2031 | 992 | 759 | ||||||
6.000%, 03/15/2018 | 3,295 | 3,316 | ||||||
5.550%, 10/15/2022 | 4,625 | 4,081 | ||||||
Tullow Oil | ||||||||
6.000%, 11/01/2020 (B) | 947 | 863 | ||||||
Tullow Oil PLC | ||||||||
6.250%, 04/15/2022 (B) | 1,892 | 1,684 | ||||||
Unit | ||||||||
6.625%, 05/15/2021 | 2,719 | 2,474 | ||||||
Weatherford International | ||||||||
9.875%, 02/15/2024 (B) | 190 | 196 | ||||||
8.250%, 06/15/2023 | 3,509 | 3,421 | ||||||
6.750%, 09/15/2040 | 3,310 | 2,556 | ||||||
5.950%, 04/15/2042 | 3,865 | 2,861 | ||||||
Western Refining | ||||||||
6.250%, 04/01/2021 | 954 | 993 | ||||||
Western Refining Logistics | ||||||||
7.500%, 02/15/2023 | 1,565 | 1,682 | ||||||
Whiting Petroleum | ||||||||
6.500%, 10/01/2018 | 670 | 671 | ||||||
6.250%, 04/01/2023 | 5,302 | 5,176 | ||||||
5.750%, 03/15/2021 | 1,305 | 1,286 | ||||||
5.000%, 03/15/2019 | 2,481 | 2,450 | ||||||
Williams | ||||||||
7.500%, 01/15/2031 | 260 | 287 | ||||||
4.550%, 06/24/2024 | 1,193 | 1,163 | ||||||
Williams Partners | ||||||||
6.300%, 04/15/2040 | 350 | 354 | ||||||
6.125%, 07/15/2022 | 625 | 641 | ||||||
5.800%, 11/15/2043 | 670 | 644 | ||||||
5.400%, 03/04/2044 | 415 | 385 | ||||||
4.900%, 01/15/2045 | 1,455 | 1,273 | ||||||
4.875%, 05/15/2023 | 120 | 122 | ||||||
4.875%, 03/15/2024 | 430 | 433 | ||||||
| 114 | SEI Institutional Investments Trust / Semi-Annual Report / November 30, 2016 |
| Description | Face Amount ($ Thousands) | Market Value ($ Thousands) | ||||||
WPX Energy | ||||||||
8.250%, 08/01/2023 | $ | 1,090 | $ | 1,202 | ||||
6.000%, 01/15/2022 | 2,200 | 2,254 | ||||||
5.250%, 09/15/2024 | 220 | 214 | ||||||
|
| |||||||
| 320,049 | ||||||||
|
| |||||||
Financials — 5.0% | ||||||||
AAF Holdings LLC PIK | ||||||||
12.000%, 07/01/2019 (B) | 1,107 | 1,134 | ||||||
Ally Financial | ||||||||
8.000%, 03/15/2020 | 528 | 589 | ||||||
8.000%, 11/01/2031 | 500 | 567 | ||||||
5.750%, 11/20/2025 | 3,990 | 3,950 | ||||||
5.125%, 09/30/2024 | 12,254 | 12,254 | ||||||
4.625%, 05/19/2022 | 1,150 | 1,146 | ||||||
4.625%, 03/30/2025 | 1,540 | 1,494 | ||||||
4.250%, 04/15/2021 | 710 | 701 | ||||||
4.125%, 03/30/2020 | 1,200 | 1,200 | ||||||
3.500%, 01/27/2019 | 2,715 | 2,715 | ||||||
American Equity Investment Life Holding | ||||||||
6.625%, 07/15/2021 | 1,900 | 1,981 | ||||||
Aventine (escrow security) | ||||||||
0.000%, 10/15/2049 (A) (E) (F) (G) | 2,600 | — | ||||||
Bank of America (D) | ||||||||
8.000%, 12/29/2049 | 2,385 | 2,421 | ||||||
6.500%, 12/31/2049 | 3,435 | 3,575 | ||||||
5.125%, 12/31/2049 | 1,947 | 1,908 | ||||||
Care Capital Properties | ||||||||
5.125%, 08/15/2026 (B) | 5,091 | 4,897 | ||||||
CIT Group | ||||||||
5.500%, 02/15/2019 (B) | 1,671 | 1,764 | ||||||
3.875%, 02/19/2019 | 1,445 | 1,470 | ||||||
Citigroup (D) | ||||||||
6.250%, 12/29/2049 | 1,235 | 1,269 | ||||||
5.950%, 12/29/2049 | 1,950 | 1,952 | ||||||
City National Bank | ||||||||
9.000%, 08/12/2019 | 4,062 | 4,764 | ||||||
Credit Acceptance | ||||||||
7.375%, 03/15/2023 | 5,395 | 5,516 | ||||||
6.125%, 02/15/2021 | 640 | 645 | ||||||
Credit Suisse Group | ||||||||
7.500%, 12/11/2048 (B) (D) | 1,365 | 1,384 | ||||||
CTR Partnership | ||||||||
5.875%, 06/01/2021 | 3,640 | 3,749 | ||||||
FBM Finance | ||||||||
8.250%, 08/15/2021 (B) | 1,040 | 1,076 | ||||||
First Data | ||||||||
5.375%, 08/15/2023 (B) | 2,951 | 3,054 | ||||||
HUB International | ||||||||
9.250%, 02/15/2021 (B) | 1,710 | 1,762 | ||||||
7.875%, 10/01/2021 (B) | 5,470 | 5,586 | ||||||
| Description | Face Amount ($ Thousands) | Market Value ($ Thousands) | ||||||
Infinity Acquisition LLC | ||||||||
7.250%, 08/01/2022 (B) | $ | 805 | $ | 694 | ||||
James Hardie International Finance | ||||||||
5.875%, 02/15/2023 (B) | 2,515 | 2,619 | ||||||
Jefferies Finance LLC | ||||||||
6.875%, 04/15/2022 (B) | 3,785 | 3,558 | ||||||
JPMorgan Chase (D) | ||||||||
7.900%, 04/29/2049 | 1,967 | 2,009 | ||||||
6.750%, 08/29/2049 | 3,515 | 3,779 | ||||||
6.000%, 12/29/2049 | 4,870 | 4,848 | ||||||
5.150%, 12/29/2049 | 395 | 382 | ||||||
Lloyds Banking Group | ||||||||
7.500%, 12/01/2099 (D) | 3,250 | 3,315 | ||||||
Mattamy Group | ||||||||
6.500%, 11/15/2020 (B) | 1,635 | 1,627 | ||||||
MGIC Investment | ||||||||
5.750%, 08/15/2023 | 3,025 | 3,138 | ||||||
MGM Growth Properties Operating Partnership | ||||||||
5.625%, 05/01/2024 (B) | 5,260 | 5,510 | ||||||
4.500%, 09/01/2026 (B) | 3,955 | 3,787 | ||||||
Millennium (escrow security) | ||||||||
7.625%, 11/15/2026 (A) | 200 | — | ||||||
MSCI | ||||||||
5.750%, 08/15/2025 (B) | 918 | 964 | ||||||
5.250%, 11/15/2024 (B) | 1,670 | 1,726 | ||||||
4.750%, 08/01/2026 (B) | 1,270 | 1,242 | ||||||
National Life Insurance | ||||||||
10.500%, 09/15/2039 (B) | 1,100 | 1,648 | ||||||
Nationstar Mortgage LLC | ||||||||
6.500%, 08/01/2018 | 1,350 | 1,365 | ||||||
6.500%, 07/01/2021 | 1,000 | 1,003 | ||||||
6.500%, 06/01/2022 | 1,982 | 1,942 | ||||||
Navient | ||||||||
7.250%, 09/25/2023 | 3,267 | 3,308 | ||||||
6.625%, 07/26/2021 | 4,805 | 5,015 | ||||||
Opal Acquisition | ||||||||
8.875%, 12/15/2021 (B) | 3,328 | 2,604 | ||||||
Popular | ||||||||
7.000%, 07/01/2019 | 2,718 | 2,786 | ||||||
Royal Bank of Scotland Group | ||||||||
8.000%, 12/29/2049 (D) | 2,020 | 1,849 | ||||||
5.125%, 05/28/2024 | 780 | 758 | ||||||
USI | ||||||||
7.750%, 01/15/2021 (B) | 1,690 | 1,715 | ||||||
Voya Financial | ||||||||
5.650%, 05/15/2053 (D) | 2,050 | 2,019 | ||||||
Wells Fargo | ||||||||
7.980%, 03/29/2049 (D) | 1,950 | 2,011 | ||||||
York Risk Services Holding | ||||||||
8.500%, 10/01/2022 (B) | 2,000 | 1,640 | ||||||
|
| |||||||
| 143,384 | ||||||||
|
| |||||||
| SEI Institutional Investments Trust / Semi-Annual Report / November 30, 2016 | 115 |
SCHEDULE OF INVESTMENTS (Unaudited)
High Yield Bond Fund (Continued)
November 30, 2016
| Description | Face Amount ($ Thousands) | Market Value ($ Thousands) | ||||||
Health Care — 8.4% | ||||||||
21st Century Oncology PIK | ||||||||
11.000%, 05/01/2023 (A) (B) | $ | 870 | $ | 518 | ||||
Acadia Healthcare | ||||||||
6.125%, 03/15/2021 | 1,100 | 1,136 | ||||||
5.625%, 02/15/2023 | 925 | 911 | ||||||
5.125%, 07/01/2022 | 2,080 | 2,012 | ||||||
Alere | ||||||||
6.500%, 06/15/2020 | 230 | 229 | ||||||
6.375%, 07/01/2023 (B) | 2,770 | 2,794 | ||||||
Amsurg | ||||||||
5.625%, 07/15/2022 | 2,385 | 2,436 | ||||||
Aurora Diagnostics Holdings LLC | ||||||||
10.750%, 01/15/2018 | 6,040 | 5,043 | ||||||
BioScrip | ||||||||
8.875%, 02/15/2021 | 3,779 | 2,900 | ||||||
Centene | ||||||||
6.125%, 02/15/2024 | 985 | 1,001 | ||||||
5.625%, 02/15/2021 | 985 | 1,014 | ||||||
4.750%, 01/15/2025 | 8,314 | 7,961 | ||||||
CHS | ||||||||
8.000%, 11/15/2019 | 2,791 | 2,198 | ||||||
6.875%, 02/01/2022 | 2,300 | 1,534 | ||||||
Concordia International | ||||||||
9.500%, 10/21/2022 (B) | 3,569 | 1,552 | ||||||
9.000%, 04/01/2022 (B) | 353 | 327 | ||||||
DaVita | ||||||||
5.125%, 07/15/2024 | 4,405 | 4,350 | ||||||
5.000%, 05/01/2025 | 5,808 | 5,663 | ||||||
DJO Finco | ||||||||
8.125%, 06/15/2021 (B) | 3,241 | 2,828 | ||||||
Endo | ||||||||
6.000%, 07/15/2023 (B) | 3,761 | 3,347 | ||||||
Endo Finance LLC | ||||||||
6.500%, 02/01/2025 (B) | 2,862 | 2,443 | ||||||
Grifols Worldwide Operations | ||||||||
5.250%, 04/01/2022 | 3,365 | 3,466 | ||||||
HCA | ||||||||
7.500%, 02/15/2022 | 5,620 | 6,252 | ||||||
5.875%, 03/15/2022 | 2,050 | 2,201 | ||||||
5.875%, 05/01/2023 | 7,145 | 7,342 | ||||||
5.875%, 02/15/2026 | 4,435 | 4,418 | ||||||
5.375%, 02/01/2025 | 18,159 | 17,773 | ||||||
5.250%, 04/15/2025 | 8,378 | 8,441 | ||||||
5.250%, 06/15/2026 | 2,869 | 2,872 | ||||||
5.000%, 03/15/2024 | 1,640 | 1,644 | ||||||
4.500%, 02/15/2027 | 685 | 646 | ||||||
HealthSouth | ||||||||
5.750%, 11/01/2024 | 855 | 857 | ||||||
5.750%, 09/15/2025 | 2,986 | 2,978 | ||||||
5.125%, 03/15/2023 | 620 | 611 | ||||||
| Description | Face Amount ($ Thousands) | Market Value ($ Thousands) | ||||||
Hill-Rom Holdings | ||||||||
5.750%, 09/01/2023 (B) | $ | 4,265 | $ | 4,393 | ||||
Hologic | ||||||||
5.250%, 07/15/2022 (B) | 980 | 1,017 | ||||||
IASIS Healthcare LLC | ||||||||
8.375%, 05/15/2019 | 6,956 | 6,087 | ||||||
inVentiv Group Holdings | ||||||||
7.500%, 10/01/2024 (B) | 1,295 | 1,311 | ||||||
inVentiv Health | ||||||||
9.000%, 01/15/2018 (B) | 1,360 | 1,370 | ||||||
Ironwood Pharmaceuticals | ||||||||
11.000%, 06/15/2024 (B) | 3,310 | 3,322 | ||||||
Kindred Healthcare | ||||||||
8.750%, 01/15/2023 | 1,685 | 1,500 | ||||||
8.000%, 01/15/2020 | 1,895 | 1,805 | ||||||
6.375%, 04/15/2022 | 5,620 | 4,791 | ||||||
Kinetic Concepts | ||||||||
12.500%, 11/01/2019 | 860 | 802 | ||||||
9.625%, 10/01/2021 (B) | 4,800 | 4,500 | ||||||
7.875%, 02/15/2021 (B) | 580 | 612 | ||||||
LifePoint Health | ||||||||
5.500%, 12/01/2021 | 4,000 | 4,090 | ||||||
Mallinckrodt International Finance | ||||||||
5.750%, 08/01/2022 (B) | 285 | 266 | ||||||
5.625%, 10/15/2023 (B) | 1,185 | 1,072 | ||||||
5.500%, 04/15/2025 (B) | 2,694 | �� | 2,290 | |||||
4.750%, 04/15/2023 | 6,748 | 5,702 | ||||||
Molina Healthcare | ||||||||
5.375%, 11/15/2022 | 533 | 534 | ||||||
MPH Acquisition Holdings LLC | ||||||||
7.125%, 06/01/2024 (B) | 1,724 | 1,812 | ||||||
New Amethyst | ||||||||
6.250%, 12/01/2024 (B) | 3,628 | 3,755 | ||||||
Prestige Brands | ||||||||
6.375%, 03/01/2024 (B) | 330 | 345 | ||||||
Quintiles Transnational | ||||||||
4.875%, 05/15/2023 (B) | 2,680 | 2,732 | ||||||
Quorum Health | ||||||||
11.625%, 04/15/2023 (B) | 867 | 681 | ||||||
RegionalCare Hospital Partners Holdings | ||||||||
8.250%, 05/01/2023 (B) | 1,157 | 1,153 | ||||||
Select Medical | ||||||||
6.375%, 06/01/2021 | 5,960 | 5,718 | ||||||
Surgical Care Affiliates | ||||||||
6.000%, 04/01/2023 (B) | 894 | 912 | ||||||
Team Health | ||||||||
7.250%, 12/15/2023 (B) | 890 | 1,002 | ||||||
Tenet Healthcare | ||||||||
8.125%, 04/01/2022 | 7,425 | 6,794 | ||||||
8.000%, 08/01/2020 | 1,960 | 1,878 | ||||||
7.500%, 01/01/2022 (B) | 2,015 | 2,072 | ||||||
6.750%, 02/01/2020 | 1,997 | 1,872 | ||||||
| 116 | SEI Institutional Investments Trust / Semi-Annual Report / November 30, 2016 |
| Description | Face Amount ($ Thousands) | Market Value ($ Thousands) | ||||||
6.750%, 06/15/2023 | $ | 10,125 | $ | 8,657 | ||||
6.000%, 10/01/2020 | 550 | 560 | ||||||
5.500%, 03/01/2019 | 2,704 | 2,569 | ||||||
4.500%, 04/01/2021 | 755 | 732 | ||||||
4.350%, 06/15/2020 (D) | 733 | 733 | ||||||
Valeant Pharmaceuticals International | ||||||||
7.250%, 07/15/2022 (B) | 2,370 | 1,943 | ||||||
7.000%, 10/01/2020 (B) | 4,300 | 3,720 | ||||||
6.750%, 08/15/2021 (B) | 1,165 | 961 | ||||||
6.375%, 10/15/2020 (B) | 1,000 | 850 | ||||||
6.125%, 04/15/2025 (B) | 11,292 | 8,356 | ||||||
5.875%, 05/15/2023 (B) | 3,127 | 2,330 | ||||||
5.500%, 03/01/2023 (B) | 3,967 | 2,916 | ||||||
5.375%, 03/15/2020 (B) | 3,760 | 3,158 | ||||||
Valeant Pharmaceuticals International (escrow security) | ||||||||
7.500%, 07/15/2021 (B) | 12,165 | 10,280 | ||||||
6.750%, 08/15/2018 (B) | 1,155 | 1,094 | ||||||
Vizient | ||||||||
10.375%, 03/01/2024 (B) | 1,387 | 1,498 | ||||||
|
| |||||||
| 238,245 | ||||||||
|
| |||||||
Industrials — 7.1% | ||||||||
ACCO Brands | ||||||||
6.750%, 04/30/2020 | 1,150 | 1,199 | ||||||
Actuant | ||||||||
5.625%, 06/15/2022 | 4,000 | 4,115 | ||||||
ADT | ||||||||
3.500%, 07/15/2022 | 1,540 | 1,451 | ||||||
AECOM | ||||||||
5.875%, 10/15/2024 | 445 | 465 | ||||||
5.750%, 10/15/2022 | 175 | 183 | ||||||
AerCap Ireland Capital | ||||||||
4.625%, 10/30/2020 | 420 | 437 | ||||||
4.625%, 07/01/2022 | 380 | 393 | ||||||
4.500%, 05/15/2021 | 3,780 | 3,898 | ||||||
3.750%, 05/15/2019 | 375 | 382 | ||||||
Air Medical Merger Sub | ||||||||
6.375%, 05/15/2023 (B) | 4,868 | 4,606 | ||||||
Aircastle | ||||||||
7.625%, 04/15/2020 | 720 | 809 | ||||||
5.000%, 04/01/2023 | 370 | 372 | ||||||
Allegiant Travel | ||||||||
5.500%, 07/15/2019 | 2,640 | 2,680 | ||||||
Allegion | ||||||||
5.875%, 09/15/2023 | 645 | 685 | ||||||
Allegion US Holding | ||||||||
5.750%, 10/01/2021 | 255 | 265 | ||||||
Allison Transmission | ||||||||
5.000%, 10/01/2024 (B) | 4,274 | 4,306 | ||||||
Apex Tool Group LLC | ||||||||
7.000%, 02/01/2021 (B) | 2,165 | 1,948 | ||||||
| Description | Face Amount ($ Thousands) | Market Value ($ Thousands) | ||||||
ARD Finance PIK | ||||||||
7.125%, 09/15/2023 (B) | $ | 856 | $ | 849 | ||||
Ardagh Packaging Finance | ||||||||
7.250%, 05/15/2024 (B) | 6,476 | 6,767 | ||||||
6.750%, 01/31/2021 (B) | 235 | 239 | ||||||
6.000%, 06/30/2021 (B) | 4,814 | 4,856 | ||||||
3.850%, 12/15/2019 (B) (D) | 715 | 728 | ||||||
Avis Budget Car Rental LLC | ||||||||
6.375%, 04/01/2024 (B) | 1,275 | 1,265 | ||||||
5.500%, 04/01/2023 | 4,699 | 4,540 | ||||||
5.125%, 06/01/2022 (B) | 70 | 68 | ||||||
Beacon Roofing Supply | ||||||||
6.375%, 10/01/2023 | 1,345 | 1,429 | ||||||
BMC East LLC | ||||||||
5.500%, 10/01/2024 (B) | 2,195 | 2,190 | ||||||
Bombardier | ||||||||
7.500%, 03/15/2025 (B) | 1,605 | 1,427 | ||||||
6.000%, 10/15/2022 (B) | 6,850 | 6,011 | ||||||
Builders FirstSource | ||||||||
5.625%, 09/01/2024 (B) | 3,975 | 3,995 | ||||||
BWAY Holding | ||||||||
9.125%, 08/15/2021 (B) | 2,104 | 2,188 | ||||||
CEB | ||||||||
5.625%, 06/15/2023 (B) | 914 | 887 | ||||||
Cenveo | ||||||||
8.500%, 09/15/2022 (B) | 5,190 | 3,607 | ||||||
6.000%, 08/01/2019 (B) | 6,192 | 5,495 | ||||||
CEVA Group | ||||||||
7.000%, 03/01/2021 (B) | 950 | 769 | ||||||
Clean Harbors | ||||||||
5.250%, 08/01/2020 | 1,871 | 1,913 | ||||||
5.125%, 06/01/2021 | 380 | 388 | ||||||
Cloud Crane LLC | ||||||||
10.125%, 08/01/2024 (B) | 4,558 | 4,809 | ||||||
CNH Industrial Capital LLC | ||||||||
4.875%, 04/01/2021 | 1,060 | 1,092 | ||||||
4.375%, 11/06/2020 | 815 | 828 | ||||||
Cortes NP Acquisition | ||||||||
9.250%, 10/15/2024 (B) | 126 | 127 | ||||||
DigitalGlobe | ||||||||
5.250%, 02/01/2021 (B) | 6,507 | 6,507 | ||||||
FGI Operating LLC | ||||||||
7.875%, 05/01/2020 | 1,590 | 1,320 | ||||||
Florida East Coast Holdings | ||||||||
6.750%, 05/01/2019 (B) | 2,955 | 3,044 | ||||||
Gardner Denver | ||||||||
6.875%, 08/15/2021 (B) | 420 | 414 | ||||||
Gates Global LLC | ||||||||
6.000%, 07/15/2022 (B) | 900 | 860 | ||||||
GCP Applied Technologies | ||||||||
9.500%, 02/01/2023 (B) | 1,953 | 2,212 | ||||||
| SEI Institutional Investments Trust / Semi-Annual Report / November 30, 2016 | 117 |
SCHEDULE OF INVESTMENTS (Unaudited)
High Yield Bond Fund (Continued)
November 30, 2016
| Description | Face Amount ($ Thousands) | Market Value ($ Thousands) | ||||||
General Cable | ||||||||
5.750%, 10/01/2022 | $ | 1,535 | $ | 1,466 | ||||
Gibraltar Industries | ||||||||
6.250%, 02/01/2021 | 661 | 679 | ||||||
Great Lakes Dredge & Dock | ||||||||
7.375%, 02/01/2019 | 1,625 | 1,601 | ||||||
H&E Equipment Services | ||||||||
7.000%, 09/01/2022 | 1,145 | 1,205 | ||||||
Hertz | ||||||||
7.375%, 01/15/2021 | 610 | 613 | ||||||
6.250%, 10/15/2022 | 2,400 | 2,262 | ||||||
5.500%, 10/15/2024 (B) | 1,210 | 1,054 | ||||||
Icahn Enterprises | ||||||||
6.000%, 08/01/2020 | 3,400 | 3,385 | ||||||
5.875%, 02/01/2022 | 3,813 | 3,670 | ||||||
4.875%, 03/15/2019 | 2,961 | 2,983 | ||||||
International Lease Finance | ||||||||
6.250%, 05/15/2019 | 675 | 726 | ||||||
5.875%, 04/01/2019 | 2,110 | 2,247 | ||||||
4.625%, 04/15/2021 | 180 | 187 | ||||||
Jack Cooper Enterprises PIK | ||||||||
10.500%, 03/15/2019 (B) | 602 | 66 | ||||||
Jack Cooper Holdings | ||||||||
9.250%, 06/01/2020 | 1,510 | 525 | ||||||
KLX | ||||||||
5.875%, 12/01/2022 (B) | 3,155 | 3,226 | ||||||
Kratos Defense & Security Solutions | ||||||||
7.000%, 05/15/2019 | 1,057 | 1,028 | ||||||
Manitowoc Foodservice | ||||||||
9.500%, 02/15/2024 | 360 | 410 | ||||||
Masonite International | ||||||||
5.625%, 03/15/2023 (B) | 1,135 | 1,155 | ||||||
Nielsen Finance LLC | ||||||||
5.000%, 04/15/2022 (B) | 6,844 | 6,981 | ||||||
4.500%, 10/01/2020 | 1,425 | 1,450 | ||||||
Nielsen Luxembourg | ||||||||
5.500%, 10/01/2021 (B) | 300 | 312 | ||||||
Novelis | ||||||||
6.250%, 08/15/2024 (B) | 360 | 373 | ||||||
5.875%, 09/30/2026 (B) | 1,135 | 1,133 | ||||||
Oshkosh | ||||||||
5.375%, 03/01/2022 | 575 | 599 | ||||||
5.375%, 03/01/2025 | 588 | 606 | ||||||
PaperWorks Industries | ||||||||
9.500%, 08/15/2019 (B) | 3,846 | 3,154 | ||||||
Reynolds Group Issuer | ||||||||
8.250%, 02/15/2021 | 1,276 | 1,318 | ||||||
7.000%, 07/15/2024 (B) | 1,270 | 1,340 | ||||||
6.875%, 02/15/2021 | 146 | 150 | ||||||
5.750%, 10/15/2020 | 6,328 | 6,510 | ||||||
RR Donnelley & Sons | ||||||||
7.625%, 06/15/2020 | 1,297 | 1,342 | ||||||
| Description | Face Amount ($ Thousands) | Market Value ($ Thousands) | ||||||
Sensata Technologies | ||||||||
5.000%, 10/01/2025 (B) | $ | 2,980 | $ | 2,935 | ||||
4.875%, 10/15/2023 (B) | 1,400 | 1,439 | ||||||
Sensata Technologies UK Financing | ||||||||
6.250%, 02/15/2026 (B) | 3,030 | 3,174 | ||||||
SPX FLOW | ||||||||
5.875%, 08/15/2026 (B) | 1,097 | 1,072 | ||||||
5.625%, 08/15/2024 (B) | 917 | 901 | ||||||
Standard Industries | ||||||||
6.000%, 10/15/2025 (B) | 516 | 536 | ||||||
5.500%, 02/15/2023 (B) | 245 | 252 | ||||||
StandardAero Aviation Holdings | ||||||||
10.000%, 07/15/2023 (B) | 8,475 | 8,952 | ||||||
Syniverse Holdings | ||||||||
9.125%, 01/15/2019 | 1,465 | 1,058 | ||||||
Terex | ||||||||
6.500%, 04/01/2020 | 975 | 989 | ||||||
6.000%, 05/15/2021 | 3,750 | 3,797 | ||||||
TransDigm | ||||||||
6.500%, 07/15/2024 | 915 | 948 | ||||||
6.500%, 05/15/2025 | 1,710 | 1,762 | ||||||
6.375%, 06/15/2026 (B) | 929 | 945 | ||||||
Triumph Group | ||||||||
4.875%, 04/01/2021 | 1,345 | 1,231 | ||||||
United Rentals North America | ||||||||
7.625%, 04/15/2022 | 229 | 242 | ||||||
6.125%, 06/15/2023 | 1,020 | 1,076 | ||||||
5.875%, 09/15/2026 | 3,565 | 3,636 | ||||||
5.750%, 11/15/2024 | 2,780 | 2,878 | ||||||
5.500%, 07/15/2025 | 805 | 811 | ||||||
5.500%, 05/15/2027 | 770 | 770 | ||||||
West | ||||||||
5.375%, 07/15/2022 (B) | 980 | 941 | ||||||
Xerium Technologies | ||||||||
9.500%, 08/15/2021 (B) | 3,480 | 3,402 | ||||||
XPO Logistics | ||||||||
6.500%, 06/15/2022 (B) | 1,240 | 1,285 | ||||||
6.125%, 09/01/2023 (B) | 1,050 | 1,074 | ||||||
Zekelman Industries | ||||||||
9.875%, 06/15/2023 (B) | 3,620 | 3,882 | ||||||
|
| |||||||
| 202,762 | ||||||||
|
| |||||||
Information Technology — 6.7% | ||||||||
ACI Worldwide | ||||||||
6.375%, 08/15/2020 (B) | 830 | 851 | ||||||
Alliance Data Systems | ||||||||
5.375%, 08/01/2022 (B) | 1,542 | 1,469 | ||||||
Alliance Data Systems MTN | ||||||||
5.875%, 11/01/2021 (B) | 1,778 | 1,782 | ||||||
Amkor Technology | ||||||||
6.625%, 06/01/2021 | 1,215 | 1,242 | ||||||
6.375%, 10/01/2022 | 3,025 | 3,112 | ||||||
| 118 | SEI Institutional Investments Trust / Semi-Annual Report / November 30, 2016 |
| Description | Face Amount ($ Thousands) | Market Value ($ Thousands) | ||||||
Anixter | ||||||||
5.500%, 03/01/2023 | $ | 1,390 | $ | 1,435 | ||||
5.125%, 10/01/2021 | 3,432 | 3,570 | ||||||
Aspect Software | ||||||||
3.000%, 05/23/2023 | 402 | 402 | ||||||
Bankrate | ||||||||
6.125%, 08/15/2018 (B) | 3,170 | 3,190 | ||||||
Belden | ||||||||
5.500%, 09/01/2022 (B) | 1,425 | 1,454 | ||||||
BMC Software Finance | ||||||||
8.125%, 07/15/2021 (B) | 9,156 | 8,240 | ||||||
Boxer Parent PIK | ||||||||
9.000%, 10/15/2019 (B) | 4,220 | 3,851 | ||||||
Camelot Finance | ||||||||
7.875%, 10/15/2024 (B) | 99 | 101 | ||||||
Cardtronics | ||||||||
5.125%, 08/01/2022 | 3,676 | 3,713 | ||||||
CDW LLC | ||||||||
5.500%, 12/01/2024 | 1,650 | 1,692 | ||||||
5.000%, 09/01/2023 | 2,250 | 2,261 | ||||||
Cimpress | ||||||||
7.000%, 04/01/2022 (B) | 1,078 | 1,103 | ||||||
CommScope Technologies Finance LLC | ||||||||
6.000%, 06/15/2025 (B) | 4,165 | 4,342 | ||||||
Diamond 1 Finance | ||||||||
8.350%, 07/15/2046 (B) | 3,400 | 3,987 | ||||||
8.100%, 07/15/2036 (B) | 2,885 | 3,286 | ||||||
7.125%, 06/15/2024 (B) | 6,728 | 7,350 | ||||||
6.020%, 06/15/2026 (B) | 5,160 | 5,429 | ||||||
5.875%, 06/15/2021 (B) | 1,508 | 1,588 | ||||||
5.450%, 06/15/2023 (B) | 1,350 | 1,408 | ||||||
Donnelley Financial Solutions | ||||||||
8.250%, 10/15/2024 (B) | 1,871 | 1,904 | ||||||
Entegris | ||||||||
6.000%, 04/01/2022 (B) | 4,015 | 4,176 | ||||||
First Data | ||||||||
7.000%, 12/01/2023 (B) | 5,124 | 5,364 | ||||||
6.750%, 11/01/2020 (B) | 3,735 | 3,875 | ||||||
5.750%, 01/15/2024 (B) | 7,035 | 7,123 | ||||||
5.000%, 01/15/2024 (B) | 4,690 | 4,731 | ||||||
Genesys Telecommunications Laboratories | ||||||||
10.000%, 11/30/2024 (B) | 2,704 | 2,832 | ||||||
Hughes Satellite Systems | ||||||||
6.625%, 08/01/2026 (B) | 200 | 192 | ||||||
5.250%, 08/01/2026 (B) | 3,110 | 2,943 | ||||||
Infor Software Parent LLC PIK | ||||||||
7.125%, 05/01/2021 (B) | 1,665 | 1,669 | ||||||
Infor US | ||||||||
6.500%, 05/15/2022 | 2,990 | 3,072 | ||||||
Informatica LLC | ||||||||
7.125%, 07/15/2023 (B) | 3,526 | 3,332 | ||||||
| Description | Face Amount ($ Thousands) | Market Value ($ Thousands) | ||||||
Magnachip Semiconductor | ||||||||
6.625%, 07/15/2021 | $ | 1,170 | $ | 1,012 | ||||
Micron Technology | ||||||||
7.500%, 09/15/2023 (B) | 5,380 | 5,945 | ||||||
5.250%, 08/01/2023 (B) | 3,935 | 3,886 | ||||||
5.250%, 01/15/2024 (B) | 1,965 | 1,921 | ||||||
Microsemi | ||||||||
9.125%, 04/15/2023 (B) | 1,105 | 1,279 | ||||||
NCR | ||||||||
5.000%, 07/15/2022 | 2,731 | 2,731 | ||||||
NeuStar | ||||||||
4.500%, 01/15/2023 | 2,365 | 2,167 | ||||||
NXP | ||||||||
5.750%, 02/15/2021 (B) | 3,050 | 3,164 | ||||||
5.750%, 03/15/2023 (B) | 905 | 957 | ||||||
4.625%, 06/01/2023 (B) | 2,591 | 2,734 | ||||||
4.125%, 06/01/2021 (B) | 1,563 | 1,629 | ||||||
3.875%, 09/01/2022 (B) | 2,000 | 2,050 | ||||||
Open Text | ||||||||
5.875%, 06/01/2026 (B) | 2,358 | 2,452 | ||||||
Plantronics | ||||||||
5.500%, 05/31/2023 (B) | 4,913 | 4,925 | ||||||
Qorvo | ||||||||
7.000%, 12/01/2025 | 1,787 | 1,939 | ||||||
6.750%, 12/01/2023 | 1,429 | 1,542 | ||||||
Quintiles IMS | ||||||||
5.000%, 10/15/2026 (B) | 9,975 | 9,850 | ||||||
Rackspace | ||||||||
8.625%, 11/15/2024 (B) | 875 | 875 | ||||||
Riverbed Technology | ||||||||
8.875%, 03/01/2023 (B) | 1,530 | 1,595 | ||||||
RP Crown Parent LLC | ||||||||
7.375%, 10/15/2024 (B) | 415 | 426 | ||||||
Sabre Global | ||||||||
5.375%, 04/15/2023 (B) | 895 | 906 | ||||||
5.250%, 11/15/2023 (B) | 5,370 | 5,437 | ||||||
Sensata Technologies | ||||||||
5.625%, 11/01/2024 (B) | 200 | 209 | ||||||
Solera LLC | ||||||||
10.500%, 03/01/2024 (B) | 1,400 | 1,547 | ||||||
VeriSign | ||||||||
4.625%, 05/01/2023 | 2,777 | 2,822 | ||||||
Veritas US | ||||||||
7.500%, 02/01/2023 (B) | 2,634 | 2,397 | ||||||
Western Digital | ||||||||
10.500%, 04/01/2024 (B) | 5,941 | 6,877 | ||||||
7.375%, 04/01/2023 (B) | 1,665 | 1,798 | ||||||
WEX | ||||||||
4.750%, 02/01/2023 (B) | 1,564 | 1,537 | ||||||
| SEI Institutional Investments Trust / Semi-Annual Report / November 30, 2016 | 119 |
SCHEDULE OF INVESTMENTS (Unaudited)
High Yield Bond Fund (Continued)
November 30, 2016
| Description | Face Amount ($ Thousands) | Market Value ($ Thousands) | ||||||
Zebra Technologies | ||||||||
7.250%, 10/15/2022 | $ | 4,809 | $ | 5,200 | ||||
|
| |||||||
| 189,880 | ||||||||
|
| |||||||
Materials — 5.9% | ||||||||
AK Steel | ||||||||
7.500%, 07/15/2023 | 1,850 | 2,012 | ||||||
Alcoa Nederland Holding | ||||||||
7.000%, 09/30/2026 (B) | 3,999 | 4,239 | ||||||
6.750%, 09/30/2024 (B) | 2,942 | 3,155 | ||||||
Aleris International | ||||||||
9.500%, 04/01/2021 (B) | 1,732 | 1,858 | ||||||
7.875%, 11/01/2020 | 452 | 443 | ||||||
Allegheny Technologies | ||||||||
9.375%, 06/01/2019 | 2,155 | 2,268 | ||||||
7.875%, 08/15/2023 | 2,700 | 2,504 | ||||||
Ashland LLC | ||||||||
4.750%, 08/15/2022 | 2,510 | 2,582 | ||||||
Axalta Coating Systems LLC | ||||||||
4.875%, 08/15/2024 (B) | 425 | 423 | ||||||
Ball | ||||||||
5.250%, 07/01/2025 | 4,774 | 4,968 | ||||||
5.000%, 03/15/2022 | 3,050 | 3,210 | ||||||
Berry Plastics | ||||||||
6.000%, 10/15/2022 | 265 | 278 | ||||||
5.125%, 07/15/2023 | 75 | 76 | ||||||
Blue Cube Spinco | ||||||||
10.000%, 10/15/2025 | 1,295 | 1,541 | ||||||
9.750%, 10/15/2023 | 5,115 | 6,010 | ||||||
BlueScope Steel Finance | ||||||||
6.500%, 05/15/2021 (B) | 940 | 989 | ||||||
Boart Longyear Management | ||||||||
10.000%, 10/01/2018 (B) | 2,500 | 1,700 | ||||||
7.000%, 04/01/2021 (B) | 4,040 | 646 | ||||||
Boise Cascade | ||||||||
5.625%, 09/01/2024 (B) | 747 | 730 | ||||||
CF Industries | ||||||||
5.150%, 03/15/2034 | 1,440 | 1,210 | ||||||
3.450%, 06/01/2023 | 2,504 | 2,254 | ||||||
Chemours | ||||||||
7.000%, 05/15/2025 | 270 | 266 | ||||||
6.625%, 05/15/2023 | 1,580 | 1,560 | ||||||
Compass Minerals International | ||||||||
4.875%, 07/15/2024 (B) | 1,931 | 1,825 | ||||||
Constellium | ||||||||
7.875%, 04/01/2021 (B) | 2,750 | 2,956 | ||||||
5.750%, 05/15/2024 (B) | 950 | 884 | ||||||
Cornerstone Chemical | ||||||||
9.375%, 03/15/2018 (B) | 8,520 | 8,563 | ||||||
CVR Partners | ||||||||
9.250%, 06/15/2023 (B) | 1,966 | 1,946 | ||||||
| Description | Face Amount ($ Thousands) | Market Value ($ Thousands) | ||||||
Eldorado | ||||||||
6.125%, 12/15/2020 (B) | $ | 1,350 | $ | 1,360 | ||||
First Quantum Minerals | ||||||||
7.250%, 10/15/2019 (B) | 4,590 | 4,618 | ||||||
7.000%, 02/15/2021 (B) | 4,416 | 4,350 | ||||||
6.750%, 02/15/2020 (B) | 3,750 | 3,708 | ||||||
Freeport-McMoRan | ||||||||
5.400%, 11/14/2034 | 1,360 | 1,190 | ||||||
4.550%, 11/14/2024 | 205 | 195 | ||||||
3.875%, 03/15/2023 | 7,984 | 7,505 | ||||||
Freeport-McMoRan Oil & Gas LLC | ||||||||
6.500%, 11/15/2020 | 574 | 591 | ||||||
5.450%, 03/15/2043 | 6,245 | 5,339 | ||||||
Graphic Packaging International | ||||||||
4.750%, 04/15/2021 | 1,346 | 1,417 | ||||||
Hecla Mining | ||||||||
6.875%, 05/01/2021 | 2,875 | 2,929 | ||||||
Hexion | ||||||||
10.000%, 04/15/2020 | 4,788 | 4,668 | ||||||
Hexion US Finance | ||||||||
8.875%, 02/01/2018 | 905 | 876 | ||||||
6.625%, 04/15/2020 | 5,053 | 4,345 | ||||||
HudBay Minerals | ||||||||
9.500%, 10/01/2020 | 1,377 | 1,449 | ||||||
Huntsman International LLC | ||||||||
5.125%, 11/15/2022 | 1,960 | 1,989 | ||||||
4.875%, 11/15/2020 | 95 | 98 | ||||||
Ineos Group Holdings | ||||||||
5.875%, 02/15/2019 (B) | 2,578 | 2,617 | ||||||
INEOS Group Holdings | ||||||||
5.625%, 08/01/2024 (B) | 1,985 | 1,940 | ||||||
Kaiser Aluminum | ||||||||
5.875%, 05/15/2024 | 1,588 | 1,640 | ||||||
Kraton Polymers LLC | ||||||||
10.500%, 04/15/2023 (B) | 870 | 964 | ||||||
LSB Industries | ||||||||
8.500%, 08/01/2019 (C) | 1,403 | 1,298 | ||||||
Mirabela Nickel | ||||||||
1.000%, 07/31/2044 | 23 | — | ||||||
New Gold | ||||||||
7.000%, 04/15/2020 (B) | 1,425 | 1,464 | ||||||
6.250%, 11/15/2022 (B) | 2,658 | 2,671 | ||||||
Noranda Aluminum Acquisition | ||||||||
11.000%, 06/01/2019 (A) | 385 | — | ||||||
NOVA Chemicals | ||||||||
5.000%, 05/01/2025 (B) | 6,377 | 6,218 | ||||||
Owens-Brockway Glass Container | ||||||||
6.375%, 08/15/2025 (B) | 815 | 861 | ||||||
5.875%, 08/15/2023 (B) | 1,288 | 1,346 | ||||||
Perstorp Holding | ||||||||
8.500%, 06/30/2021 (B) | 3,624 | 3,574 | ||||||
| 120 | SEI Institutional Investments Trust / Semi-Annual Report / November 30, 2016 |
| Description | Face Amount ($ Thousands) | Market Value ($ Thousands) | ||||||
Platform Specialty Products | ||||||||
10.375%, 05/01/2021 (B) | $ | 3,398 | $ | 3,712 | ||||
6.500%, 02/01/2022 (B) | 2,690 | 2,650 | ||||||
Rain CII Carbon LLC | ||||||||
8.250%, 01/15/2021 (B) | 9,540 | 9,206 | ||||||
8.000%, 12/01/2018 (B) | 2,325 | 2,302 | ||||||
Reichhold Holdings (E) | ||||||||
15.000%, 03/13/2017 | 621 | 622 | ||||||
12.000%, 03/31/2017 | 1,019 | 1,019 | ||||||
Reichhold Industries | ||||||||
12.000%, 03/31/2017 (E) | 385 | 385 | ||||||
9.000%, 05/08/2017 (A) (B) | 1,056 | — | ||||||
Sappi Papier Holding GmbH | ||||||||
7.750%, 07/15/2017 (B) | 400 | 406 | ||||||
Scotts Miracle-Gro | ||||||||
6.000%, 10/15/2023 (B) | 915 | 968 | ||||||
Sealed Air | ||||||||
5.125%, 12/01/2024 (B) | 500 | 507 | ||||||
Teck Resources | ||||||||
8.500%, 06/01/2024 (B) | 2,600 | 3,036 | ||||||
8.000%, 06/01/2021 (B) | 259 | 284 | ||||||
TPC Group | ||||||||
8.750%, 12/15/2020 (B) | 3,716 | 3,010 | ||||||
Trinseo Materials Operating SCA | ||||||||
6.750%, 05/01/2022 (B) | 400 | 417 | ||||||
US Concrete | ||||||||
6.375%, 06/01/2024 | 436 | 455 | ||||||
Valvoline | ||||||||
5.500%, 07/15/2024 (B) | 115 | 119 | ||||||
Versum Materials | ||||||||
5.500%, 09/30/2024 (B) | 5,570 | 5,681 | ||||||
WR Grace | ||||||||
5.625%, 10/01/2024 (B) | 105 | 111 | ||||||
|
| |||||||
| 167,206 | ||||||||
|
| |||||||
Real Estate — 1.1% | ||||||||
Communications Sales & Leasing | ||||||||
8.250%, 10/15/2023 | 3,895 | 4,090 | ||||||
6.000%, 04/15/2023 (B) | 3,165 | 3,284 | ||||||
Corrections Corp of America | ||||||||
5.000%, 10/15/2022 | 340 | 336 | ||||||
4.625%, 05/01/2023 | 1,575 | 1,531 | ||||||
4.125%, 04/01/2020 | 695 | 690 | ||||||
Equinix | ||||||||
5.875%, 01/15/2026 | 2,165 | 2,246 | ||||||
5.750%, 01/01/2025 | 1,060 | 1,093 | ||||||
5.375%, 01/01/2022 | 255 | 266 | ||||||
5.375%, 04/01/2023 | 600 | 616 | ||||||
FelCor Lodging | ||||||||
6.000%, 06/01/2025 | 148 | 151 | ||||||
GEO Group | ||||||||
6.000%, 04/15/2026 | 2,815 | 2,702 | ||||||
| Description | Face Amount ($ Thousands) | Market Value ($ Thousands) | ||||||
5.875%, 01/15/2022 | $ | 1,715 | $ | 1,711 | ||||
5.125%, 04/01/2023 | 45 | 43 | ||||||
GLP Capital | ||||||||
5.375%, 04/15/2026 | 870 | 890 | ||||||
4.875%, 11/01/2020 | 429 | 450 | ||||||
Iron Mountain | ||||||||
6.000%, 08/15/2023 | 790 | 837 | ||||||
Kennedy-Wilson | ||||||||
5.875%, 04/01/2024 | 500 | 504 | ||||||
Lamar Media | ||||||||
5.750%, 02/01/2026 | 1,689 | 1,783 | ||||||
MPT Operating Partnership | ||||||||
5.250%, 08/01/2026 | 350 | 328 | ||||||
Realogy Group LLC | ||||||||
4.875%, 06/01/2023 (B) | 3,517 | 3,376 | ||||||
RHP Hotel Properties | ||||||||
5.000%, 04/15/2021 | 2,381 | 2,417 | ||||||
5.000%, 04/15/2023 | 2,850 | 2,885 | ||||||
|
| |||||||
| 32,229 | ||||||||
|
| |||||||
Telecommunication Services — 11.9% | ||||||||
Aegis Merger Sub | ||||||||
10.250%, 02/15/2023 (B) | 7,632 | 8,338 | ||||||
Altice Financing | ||||||||
7.500%, 05/15/2026 (B) | 10,441 | 10,584 | ||||||
6.625%, 02/15/2023 (B) | 998 | 1,013 | ||||||
6.500%, 01/15/2022 (B) | 1,000 | 1,031 | ||||||
Altice Finco | ||||||||
8.125%, 01/15/2024 (B) | 840 | 863 | ||||||
Altice Finco MTN | ||||||||
7.625%, 02/15/2025 (B) | 280 | 275 | ||||||
Altice Luxembourg | ||||||||
7.750%, 05/15/2022 (B) | 9,388 | 9,834 | ||||||
7.625%, 02/15/2025 (B) | 670 | 687 | ||||||
Altice US Finance I | ||||||||
5.375%, 07/15/2023 (B) | 4,875 | 4,930 | ||||||
Avaya | ||||||||
10.500%, 03/01/2021 (B) | 699 | 316 | ||||||
9.000%, 04/01/2019 (B) | 1,237 | 1,095 | ||||||
7.000%, 04/01/2019 (B) | 2,389 | 2,081 | ||||||
CenturyLink | ||||||||
7.500%, 04/01/2024 | 840 | 867 | ||||||
6.750%, 12/01/2023 | 5,985 | 5,985 | ||||||
5.800%, 03/15/2022 | 490 | 483 | ||||||
5.625%, 04/01/2020 | 1,319 | 1,373 | ||||||
5.625%, 04/01/2025 | 3,431 | 3,206 | ||||||
Cequel Communications Holdings I LLC | ||||||||
7.750%, 07/15/2025 (B) | 1,325 | 1,418 | ||||||
5.125%, 12/15/2021 (B) | 929 | 916 | ||||||
Cogeco Cable | ||||||||
4.875%, 05/01/2020 (B) | 555 | 572 | ||||||
| SEI Institutional Investments Trust / Semi-Annual Report / November 30, 2016 | 121 |
SCHEDULE OF INVESTMENTS (Unaudited)
High Yield Bond Fund (Continued)
November 30, 2016
| Description | Face Amount ($ Thousands) | Market Value ($ Thousands) | ||||||
Cogent Communications Finance | ||||||||
5.625%, 04/15/2021 (B) | $ | 2,500 | $ | 2,506 | ||||
Cogent Communications Group | ||||||||
5.375%, 03/01/2022 (B) | 2,609 | 2,638 | ||||||
Columbus Cable Barbados | ||||||||
7.375%, 03/30/2021 (B) | 830 | 883 | ||||||
CommScope | ||||||||
5.500%, 06/15/2024 (B) | 1,693 | 1,733 | ||||||
5.000%, 06/15/2021 (B) | 1,000 | 1,012 | ||||||
CSC Holdings LLC | ||||||||
10.875%, 10/15/2025 (B) | 6,807 | 7,930 | ||||||
10.125%, 01/15/2023 (B) | 8,691 | 10,017 | ||||||
6.625%, 10/15/2025 (B) | 400 | 432 | ||||||
Digicel Group | ||||||||
8.250%, 09/30/2020 (B) | 5,361 | 4,490 | ||||||
7.125%, 04/01/2022 (B) | 1,200 | 891 | ||||||
6.750%, 03/01/2023 (B) | 5,325 | 4,579 | ||||||
6.000%, 04/15/2021 (B) | 3,250 | 2,823 | ||||||
Frontier Communications | ||||||||
11.000%, 09/15/2025 | 12,332 | 12,363 | ||||||
10.500%, 09/15/2022 | 6,047 | 6,244 | ||||||
8.875%, 09/15/2020 | 1,356 | 1,415 | ||||||
7.625%, 04/15/2024 | 863 | 744 | ||||||
7.125%, 01/15/2023 | 260 | 226 | ||||||
6.875%, 01/15/2025 | 440 | 356 | ||||||
GCI | ||||||||
6.750%, 06/01/2021 | 1,024 | 1,051 | ||||||
Hughes Satellite Systems | ||||||||
7.625%, 06/15/2021 | 2,029 | 2,181 | ||||||
Inmarsat Finance | ||||||||
6.500%, 10/01/2024 (B) | 3,750 | 3,759 | ||||||
4.875%, 05/15/2022 (B) | 1,755 | 1,672 | ||||||
Intelsat Jackson Holdings | ||||||||
9.500%, 09/30/2022 (B) | 252 | 278 | ||||||
8.000%, 02/15/2024 (B) | 3,148 | 3,172 | ||||||
7.500%, 04/01/2021 | 4,636 | 3,358 | ||||||
7.250%, 04/01/2019 | 670 | 526 | ||||||
7.250%, 10/15/2020 | 8,525 | 6,212 | ||||||
5.500%, 08/01/2023 | 4,067 | 2,654 | ||||||
Intelsat Luxembourg | ||||||||
7.750%, 06/01/2021 | 4,855 | 1,681 | ||||||
Level 3 Communications | ||||||||
5.750%, 12/01/2022 | 705 | 721 | ||||||
Level 3 Financing | ||||||||
5.625%, 02/01/2023 | 100 | 101 | ||||||
5.375%, 01/15/2024 | 1,618 | 1,626 | ||||||
5.375%, 05/01/2025 | 6,595 | 6,562 | ||||||
5.125%, 05/01/2023 | 2,535 | 2,532 | ||||||
McGraw-Hill Global Education Holdings LLC | ||||||||
7.875%, 05/15/2024 (B) | 240 | 236 | ||||||
| Description | Face Amount ($ Thousands) | Market Value ($ Thousands) | ||||||
Midcontinent Communications & Midcontinent Finance | ||||||||
6.875%, 08/15/2023 (B) | $ | 5,379 | $ | 5,655 | ||||
6.250%, 08/01/2021 (B) | 440 | 459 | ||||||
Nortel Networks | ||||||||
9.003%, 07/15/2011 (A) | 3,532 | 3,382 | ||||||
Numericable-SFR | ||||||||
6.250%, 05/15/2024 (B) | 4,028 | 3,983 | ||||||
6.000%, 05/15/2022 (B) | 6,655 | 6,705 | ||||||
Outfront Media Capital LLC | ||||||||
5.875%, 03/15/2025 | 2,800 | 2,877 | ||||||
5.250%, 02/15/2022 | 190 | 197 | ||||||
Quebecor Media | ||||||||
5.750%, 01/15/2023 | 2,400 | 2,466 | ||||||
Qwest Capital Funding | ||||||||
7.750%, 02/15/2031 | 730 | 692 | ||||||
RCN Telecom Services LLC | ||||||||
8.500%, 08/15/2020 (B) | 1,175 | 1,245 | ||||||
Sable International Finance | ||||||||
6.875%, 08/01/2022 (B) | 935 | 970 | ||||||
SBA Communications | ||||||||
4.875%, 09/01/2024 (B) | 850 | 819 | ||||||
SFR Group | ||||||||
7.375%, 05/01/2026 (B) | 12,336 | 12,305 | ||||||
SoftBank Group | ||||||||
6.000%, 07/30/2025 | 515 | 535 | ||||||
5.375%, 07/30/2022 | 245 | 253 | ||||||
4.500%, 04/15/2020 (B) | 3,056 | 3,117 | ||||||
Sprint | ||||||||
7.875%, 09/15/2023 | 24,188 | 24,974 | ||||||
7.625%, 02/15/2025 | 5,373 | 5,460 | ||||||
7.250%, 09/15/2021 | 4,069 | 4,171 | ||||||
7.125%, 06/15/2024 | 4,865 | 4,838 | ||||||
Sprint Capital | ||||||||
8.750%, 03/15/2032 | 5,020 | 5,271 | ||||||
6.900%, 05/01/2019 | 545 | 568 | ||||||
6.875%, 11/15/2028 | 6,585 | 6,334 | ||||||
Sprint Communications | ||||||||
9.000%, 11/15/2018 (B) | 1,780 | 1,956 | ||||||
7.000%, 03/01/2020 (B) | 655 | 704 | ||||||
Sprint Spectrum LLC | ||||||||
3.360%, 09/20/2021 (B) | 2,175 | 2,180 | ||||||
Telecom Italia | ||||||||
5.303%, 05/30/2024 (B) | 1,125 | 1,108 | ||||||
Telesat Canada | ||||||||
8.875%, 11/15/2024 (B) | 4,828 | 4,931 | ||||||
TIBCO Software | ||||||||
11.375%, 12/01/2021 (B) | 1,588 | 1,521 | ||||||
T-Mobile USA | ||||||||
6.731%, 04/28/2022 | 2,695 | 2,816 | ||||||
6.633%, 04/28/2021 | 595 | 621 | ||||||
6.625%, 04/01/2023 | 300 | 317 | ||||||
| 122 | SEI Institutional Investments Trust / Semi-Annual Report / November 30, 2016 |
| Description | Face Amount ($ Thousands) | Market Value ($ Thousands) | ||||||
6.500%, 01/15/2024 | $ | 400 | $ | 427 | ||||
6.500%, 01/15/2026 | 6,971 | 7,529 | ||||||
6.375%, 03/01/2025 | 4,430 | 4,734 | ||||||
6.000%, 03/01/2023 | 565 | 592 | ||||||
6.000%, 04/15/2024 | 2,975 | 3,124 | ||||||
U.S. Cellular | ||||||||
6.700%, 12/15/2033 | 955 | 936 | ||||||
Unitymedia GmbH | ||||||||
6.125%, 01/15/2025 (B) | 1,195 | 1,216 | ||||||
Unitymedia Hessen GmbH & KG | ||||||||
5.500%, 01/15/2023 (B) | 2,500 | 2,562 | ||||||
5.000%, 01/15/2025 (B) | 2,600 | 2,555 | ||||||
UPCB Finance IV | ||||||||
5.375%, 01/15/2025 (B) | 3,440 | 3,391 | ||||||
Videotron | ||||||||
5.375%, 06/15/2024 (B) | 420 | 429 | ||||||
5.000%, 07/15/2022 | 3,705 | 3,779 | ||||||
Virgin Media Finance | ||||||||
5.750%, 01/15/2025 (B) | 869 | 860 | ||||||
Virgin Media Secured Finance | ||||||||
5.500%, 08/15/2026 (B) | 985 | 965 | ||||||
5.375%, 04/15/2021 (B) | 2,741 | 2,826 | ||||||
5.250%, 01/15/2026 (B) | 4,195 | 4,059 | ||||||
Wave Holdco LLC PIK | ||||||||
8.250%, 07/15/2019 (B) | 829 | 835 | ||||||
WideOpenWest Finance LLC | ||||||||
10.250%, 07/15/2019 | 1,975 | 2,079 | ||||||
Wind Acquisition Finance | ||||||||
7.375%, 04/23/2021 (B) | 2,475 | 2,524 | ||||||
4.750%, 07/15/2020 (B) | 600 | 601 | ||||||
Windstream | ||||||||
7.750%, 10/01/2021 | 2,585 | 2,572 | ||||||
7.500%, 06/01/2022 | 1,965 | 1,856 | ||||||
7.500%, 04/01/2023 | 185 | 173 | ||||||
Windstream Services LLC | ||||||||
6.375%, 08/01/2023 | 810 | 705 | ||||||
Zayo Group LLC | ||||||||
6.375%, 05/15/2025 | 1,000 | 1,040 | ||||||
6.000%, 04/01/2023 | 5,852 | 6,101 | ||||||
Ziggo Bond Finance | ||||||||
6.000%, 01/15/2027 (B) | 1,744 | 1,674 | ||||||
5.875%, 01/15/2025 (B) | 435 | 428 | ||||||
Ziggo Secured Finance | ||||||||
5.500%, 01/15/2027 (B) | 8,252 | 7,922 | ||||||
|
| |||||||
| 337,395 | ||||||||
|
| |||||||
Utilities — 1.3% | ||||||||
AES | ||||||||
7.375%, 07/01/2021 | 800 | 878 | ||||||
6.000%, 05/15/2026 | 305 | 300 | ||||||
4.875%, 05/15/2023 | 290 | 281 | ||||||
| Description | Face Amount ($ Thousands) | Market Value ($ Thousands) | ||||||
AmeriGas Finance LLC | ||||||||
7.000%, 05/20/2022 | $ | 3,021 | $ | 3,172 | ||||
Calpine | ||||||||
5.750%, 01/15/2025 | 920 | 879 | ||||||
5.500%, 02/01/2024 | 810 | 773 | ||||||
5.375%, 01/15/2023 | 965 | 932 | ||||||
5.250%, 06/01/2026 (B) | 677 | 660 | ||||||
Dynegy | ||||||||
8.000%, 01/15/2025 (B) | 440 | 405 | ||||||
7.625%, 11/01/2024 | 1,415 | 1,302 | ||||||
7.375%, 11/01/2022 | 1,265 | 1,201 | ||||||
5.875%, 06/01/2023 | 903 | 788 | ||||||
Ferrellgas | ||||||||
6.750%, 06/15/2023 | 1,000 | 930 | ||||||
GenOn Americas Generation LLC | ||||||||
9.125%, 05/01/2031 | 1,013 | 820 | ||||||
8.500%, 10/01/2021 | 4,725 | 3,922 | ||||||
LBC Tank Terminals Holding Netherlands | ||||||||
6.875%, 05/15/2023 (B) | 2,800 | 2,800 | ||||||
NRG Energy | ||||||||
7.875%, 05/15/2021 | 61 | 63 | ||||||
7.250%, 05/15/2026 (B) | 323 | 316 | ||||||
6.625%, 01/15/2027 (B) | 930 | 860 | ||||||
6.250%, 07/15/2022 | 530 | 532 | ||||||
6.250%, 05/01/2024 | 2,798 | 2,707 | ||||||
NSG Holdings LLC | ||||||||
7.750%, 12/15/2025 (B) | 1,854 | 1,988 | ||||||
Talen Energy Supply LLC | ||||||||
6.500%, 06/01/2025 | 221 | 175 | ||||||
4.625%, 07/15/2019 (B) | 2,950 | 2,806 | ||||||
TCEH | ||||||||
0.000%, 12/31/2034 | 226 | 115 | ||||||
TerraForm Power Operating LLC (C) | ||||||||
6.625%, 06/15/2025 (B) | 3,138 | 3,256 | ||||||
6.375%, 02/01/2023 (B) | 3,077 | 3,147 | ||||||
|
| |||||||
| 36,008 | ||||||||
|
| |||||||
Total Corporate Obligations | 2,235,178 | |||||||
|
| |||||||
COLLATERALIZED DEBT OBLIGATIONS — 9.2% |
| |||||||
B&M CLO Ltd., Ser 2014-1A, Cl D | ||||||||
5.630%, 04/16/2026 (B) (D) | 3,529 | 2,798 | ||||||
B&M CLO Ltd., Ser 2014-1A, Cl C | ||||||||
4.630%, 04/16/2026 (B) (D) | 2,142 | 1,985 | ||||||
B&M CLO Ltd., Ser 2014-1A, Cl E | ||||||||
6.630%, 04/16/2026 (B) (D) | 2,520 | 1,471 | ||||||
Battalion CLO III Ltd., Ser 2012-3A, Cl SUB | ||||||||
0.000%, 01/18/2025 (B) | 2,697 | 1,414 | ||||||
Battalion CLO IV Ltd., Ser 2013-4A, Cl SUB | ||||||||
0.000%, 10/22/2025 (B) | 1,560 | 577 | ||||||
| SEI Institutional Investments Trust / Semi-Annual Report / November 30, 2016 | 123 |
SCHEDULE OF INVESTMENTS (Unaudited)
High Yield Bond Fund (Continued)
November 30, 2016
| Description | Face Amount ($ Thousands) | Market Value ($ Thousands) | ||||||
Battalion CLO V Ltd., Ser 2014-5A, Cl SUB | ||||||||
0.000%, 04/17/2026 (B) | $ | 3,445 | $ | 1,309 | ||||
Battalion CLO VII Ltd., Ser 2014-7A, Cl D | ||||||||
6.180%, 10/17/2026 (B) (D) | 2,323 | 1,857 | ||||||
Battalion CLO VII Ltd., Ser 2014-7A, Cl SUB | ||||||||
0.000%, 10/17/2026 (B) | 4,118 | 2,059 | ||||||
Battalion CLO VIII Ltd., Ser 2015-8A, Cl D | ||||||||
6.332%, 04/18/2027 (B) (D) | 1,268 | 1,082 | ||||||
Battalion CLO VIII Ltd., Ser 2015-8A, Cl SUB | ||||||||
0.000%, 04/18/2027 (B) (E) | 4,720 | 3,682 | ||||||
Battalion CLO X Ltd. Warehouse Note | ||||||||
0.000% (H) | 53 | 5,403 | ||||||
Battalion CLO X Ltd., Ser 2016-10A, Cl SUB | ||||||||
0.000%, 01/24/2029 (B) | 64 | 6,380 | ||||||
Benefit Street Partners CLO III, Ser 2013-IIIA, Cl SUB | ||||||||
0.000%, 01/20/2026 (B) (E) | 2,640 | 1,531 | ||||||
Benefit Street Partners CLO IV | ||||||||
0.000%, 07/20/2026 (B) | 3 | 2,395 | ||||||
Benefit Street Partners CLO IX | ||||||||
0.000%, 07/20/2025 (B) | 31 | 2,915 | ||||||
Benefit Street Partners CLO V | ||||||||
0.000%, 10/20/2026 (B) | 6,413 | 4,011 | ||||||
Benefit Street Partners CLO VIII | ||||||||
0.000%, 01/20/2028 (B) (E) | 90 | 8,190 | ||||||
Benefit Street Partners CLO X | ||||||||
0.000%, 01/15/2029 (H) | 89 | 8,120 | ||||||
Benefit Street Partners CLO X Warehouse Note | ||||||||
0.000% (H) | 71 | �� | 7,316 | |||||
Benefit Street Partners CLO, | ||||||||
7.382%, 10/15/2025 (B) (D) | 1,556 | 1,537 | ||||||
Benefit Street Partners CLO, | ||||||||
0.000%, 4/18/2027 | 9,535 | 7,800 | ||||||
Benefit Street Partners CLO, | ||||||||
0.000%, 07/18/2027 | 9,035 | 7,477 | ||||||
Carlyle Global Market Strategies CLO Ltd., Ser 14-3A, Cl SUB | ||||||||
0.000%, 07/27/2026 (B) | 3,953 | 2,965 | ||||||
Cathedral Lake CLO III Ltd. | ||||||||
0.000%, 01/15/2026 (B) | 2,506 | 2,080 | ||||||
Cathedral Lake CLO Ltd., | ||||||||
8.432%, 01/15/2026 (B) (D) | 1,575 | 1,579 | ||||||
CIFC Funding, Ser 2012-2A, Cl SUB | ||||||||
0.000%, 12/05/2024 (B) | 23 | 1,246 | ||||||
CVP Cascade CLO Ltd., | ||||||||
5.682%, 07/18/2026 (B) (D) | 1,752 | 1,331 | ||||||
CVP Cascade CLO Ltd., | ||||||||
6.682%, 07/18/2026 (B) (D) | 2,531 | 1,525 | ||||||
| Description | Face Amount ($ Thousands) | Market Value ($ Thousands) | ||||||
Fifth Street Senior Loan Fund I LLC, Ser 2015- 1A, Cl E | ||||||||
8.081%, 01/20/2027 (B)(D) | $ | 5,110 | $ | 4,458 | ||||
Fifth Street Senior Loan Fund II, Ser 2015-2A, Cl SUB | ||||||||
0.000%, 09/29/2027 (B) | 6,200 | 5,512 | ||||||
Fifth Street Senior Loan Fund II, Ser 2015-2A, Cl D | ||||||||
8.187%, 09/29/2027 (B) (D) | 6,350 | 5,631 | ||||||
Figueroa CLO, Ser 2013-1I, Cl SUB | ||||||||
0.000%, 3/21/2024 | 7,644 | 3,113 | ||||||
Figueroa CLO, Ser 2013-2A, Cl SUB | ||||||||
0.000%, 12/18/2025 (B) | 3,070 | 1,749 | ||||||
Fortress Credit Opportunities III CLO LP, Ser 2014-3A, Cl E | ||||||||
7.118%, 04/28/2026 (B) (D) | 3,518 | 3,141 | ||||||
Fortress Credit Opportunities VI CLO, Ser 2015- 6A, Cl F | ||||||||
7.595%, 03/31/2027 (B) (D) | 2,270 | 2,081 | ||||||
Great Lakes CLO Ltd., Ser 2012-1A, Cl SUB | ||||||||
0.000%, 01/15/2023 (B) | 2,877 | 1,933 | ||||||
Great Lakes CLO Ltd., Ser 2012-1A, Cl E | ||||||||
6.380%, 01/15/2023 (B) (D) | 3,292 | 2,815 | ||||||
Great Lakes CLO Ltd., Ser 2014-1A, Cl F | ||||||||
6.880%, 04/15/2025 (B) (D) | 2,520 | 1,600 | ||||||
Great Lakes CLO Ltd., Ser 2014-1A, Cl SUB | ||||||||
0.000%, 04/15/2025 (B) (D) | 7,057 | 4,982 | ||||||
Great Lakes CLO Ltd., Ser 2015-1, Cl SUB | ||||||||
0.000%, 07/15/2026 (B) (D) | 5,593 | 4,206 | ||||||
Great Lakes CLO Ltd., Ser 2015-1A, Cl E | ||||||||
7.580%, 07/15/2026 (B) (D) | 3,854 | 3,237 | ||||||
Great Lakes CLO Ltd., Ser 2015-1A, Cl F | ||||||||
8.380%, 07/15/2026 (B) (D) | 1,756 | 1,150 | ||||||
Hildene CLO Ltd., Ser 2014-2A, Cl D | ||||||||
4.578%, 07/19/2026 (B) (D) | 2,013 | 1,931 | ||||||
Hildene CLO Ltd., Ser 2014-2A, Cl E | ||||||||
5.978%, 07/19/2026 (B) (D) | 1,007 | 874 | ||||||
Jamestown CLO VII, Ser 2015-7A, Cl E | ||||||||
7.632%, 07/25/2027 (B) (D) | 2,291 | 1,813 | ||||||
Jamestown CLO VII, Ser 2015-7A, Cl D | ||||||||
6.382%, 07/25/2027 (B) (D) | 2,291 | �� | 1,945 | |||||
JFIN CLO 2015-II, Ser 2015-2A, Cl E | ||||||||
7.880%, 10/19/2026 (B) (D) | 5,000 | 4,525 | ||||||
JFIN Revolver CLO Ltd., | ||||||||
2.881%, 01/20/2021 (B) (D) | 2,010 | 2,010 | ||||||
JFIN Revolver CLO Ltd., | ||||||||
3.561%, 02/20/2022 (B) (D) | 2,049 | 1,998 | ||||||
KVK CLO, Ser 2012-2A, Cl SUB | ||||||||
0.000%, 02/10/2025 (B) | 2,956 | 1,079 | ||||||
Lockwood Grove CLO Ltd., | ||||||||
0.000%, 01/25/2024 (B) | 4,865 | 3,843 | ||||||
| 124 | SEI Institutional Investments Trust / Semi-Annual Report / November 30, 2016 |
| Description | Face Amount ($ Thousands) | Market Value ($ Thousands) | ||||||
Lockwood Grove CLO, Ser 2014-1A, Cl ER | ||||||||
8.610%, 04/25/2025 | $ | 2,808 | $ | 2,808 | ||||
Nelder Grove CLO Ltd., Ser 2014-1A, Cl D1 | ||||||||
5.457%, 08/28/2026 (B) (D) | 1,844 | 1,798 | ||||||
Nelder Grove CLO Ltd., | ||||||||
7.687%, 08/28/2026 (B) (D) | 3,074 | 2,705 | ||||||
Neuberger Berman CLO XIII, Ser 2012-13A, Cl SUB | ||||||||
0.000%, 01/23/2024 (B) | 542 | 157 | ||||||
Neuberger Berman CLO XVI, Ser 2014-16A, Cl SUB | ||||||||
0.000%, 04/15/2026 (B) | 2,625 | 1,385 | ||||||
Neuberger Berman CLO XVI, Ser 2014-16A, Cl SFN | ||||||||
0.150%, 04/15/2026 (B) | 175 | 64 | ||||||
Neuberger Berman CLO XXII, Ser 2016-22A, Cl SUBF | ||||||||
0.100%, 10/17/2027 (B) (D) | 2 | 137 | ||||||
Neuberger Berman CLO XXII, Ser 2016-22A, Cl SUB | ||||||||
0.000%, 10/17/2027 (B) (D) | 52 | 4,300 | ||||||
NewStar Arlington Senior Loan Program LLC, | ||||||||
6.982%, 07/25/2025 (B) (D) | 2,026 | 1,707 | ||||||
NewStar Berkeley Fund CLO LLC, Ser 2016-1A, Cl E | ||||||||
8.632%, 10/25/2028 (B) (D) | 15,428 | 13,513 | ||||||
NewStar Berkeley Fund CLO LLC, Ser 2016-1A, Cl D | ||||||||
5.982%, 10/25/2028 (B) (D) | 1,110 | 1,065 | ||||||
NewStar Berkeley Fund CLO LLC, Ser 2016-1A, Cl SUB | ||||||||
0.000%, 10/25/2028 (B) (D) | 218 | 21,812 | ||||||
NewStar Clarendon Fund CLO LLC, Ser 2015-1A, Cl E | ||||||||
6.932%, 01/25/2027 (B) (D) | 4,470 | 3,740 | ||||||
NXT Capital CLO LLC, | ||||||||
8.381%, 07/20/2022 (B) (D) | 3,047 | 3,024 | ||||||
OCP CLO, Ser 2012-2A, Cl SUB | ||||||||
0.000%, 11/22/2023 (B) | 2,940 | 1,506 | ||||||
Peaks CLO Ltd., Ser 2014-1A, Cl D | ||||||||
5.380%, 06/15/2026 (B) (D) | 1,015 | 903 | ||||||
Shackleton CLO Ltd., Ser 2014-6A, Cl SUB | ||||||||
0.000%, 07/17/2026 (B) (D) | 7,965 | 3,266 | ||||||
TCP CLO III Warehouse Note | ||||||||
0.000% (H) | 118 | 11,817 | ||||||
Trinitas CLO Ltd., Ser 2014-2A, Cl D | ||||||||
4.680%, 07/15/2026 (B) (D) | 2,481 | 2,134 | ||||||
Venture CDO Ltd., Ser 2015-25A, Cl SUB | ||||||||
0.000%, 04/20/2029 (H) | 30 | 2,685 | ||||||
Venture X CLO, Ser 2012-10A, Cl SUB | ||||||||
0.000%, 07/20/2022 (B) | 7,029 | 3,515 | ||||||
| Description | Face Amount ($ Thousands) | Market Value ($ Thousands) | ||||||
Venture XI CLO, Ser 2012-11A, Cl SUB | ||||||||
0.000%, 11/14/2022 (B) | $ | 7,097 | $ | 3,123 | ||||
Venture XIV CLO, Ser 2013-14A, Cl SUB | ||||||||
0.000%, 08/28/2025 (B) | 1,842 | 1,032 | ||||||
Venture XIV CLO, Ser 2013-14A, Cl SFN | ||||||||
0.100%, 08/28/2025 (B) | 113 | 52 | ||||||
Venture XV CLO, Ser 2013-15A, Cl SUB | ||||||||
0.000%, 07/15/2025 (B) | 3,475 | 1,894 | ||||||
Venture XV CLO, Ser 2016-15A, Cl ER | ||||||||
7.990%, 07/15/2028 (B) (D) | 1,277 | 1,181 | ||||||
Venture XXII CLO, Ser 2016-22A, Cl F | ||||||||
8.730%, 01/15/2028 (B) (D) | 1,108 | 997 | ||||||
Venture XXII CLO, Ser 2016-22A, Cl SUB | ||||||||
0.000%, 01/15/2028 (B) (D) | 30 | 2,351 | ||||||
Venture XXIV CLO, Ser 2016-24A, Cl SUB | ||||||||
0.000%, 10/20/2028 (B) (D) | 41 | 4,126 | ||||||
Venture XXV CLO Warehouse Note | ||||||||
0.000% (H) | 53 | 5,332 | ||||||
|
| |||||||
Total Collateralized Debt Obligations | 261,790 | |||||||
|
| |||||||
LOAN PARTICIPATIONS — 7.4% | ||||||||
21st Century Oncology, 1st Lien | ||||||||
7.125%, 04/30/2022 | 1,262 | 1,139 | ||||||
Academy Sports, 1st Lien | ||||||||
5.000%, 07/01/2022 | 707 | 651 | ||||||
Academy, Ltd. Term Loan | ||||||||
5.000%, 07/01/2022 | 705 | 649 | ||||||
Accudyne Industries | ||||||||
4.000%, 12/13/2019 (D) | 1,099 | 982 | ||||||
Affinion Group Holdings, Tranche B | ||||||||
6.750%, 04/30/2018 | 2,022 | 1,973 | ||||||
Affinion Group, 2nd Lien | ||||||||
8.500%, 10/31/2018 | 750 | 706 | ||||||
Air Medical, Cov-Lite, Term Loan, | ||||||||
4.250%, 04/28/2022 | 1,985 | 1,963 | ||||||
Albertson's LLC, 2016-1 Term B-4 Loan, 1st Lien | ||||||||
4.500%, 08/25/2021 | 1,373 | 1,374 | ||||||
Alinta Energy Finance, Delayed Term Loan | ||||||||
6.375%, 08/13/2018 | 165 | 165 | ||||||
Alinta Ltd., Cov-Lite, 1st Lien | ||||||||
6.375%, 08/13/2019 | 2,477 | 2,477 | ||||||
American Renal Holdings, Term Loan, 1st Lien | ||||||||
4.750%, 08/20/2019 | 2,179 | 2,155 | ||||||
American Tire Distributors, Cov-Lite, | ||||||||
5.250%, 09/01/2021 | 1,310 | 1,288 | ||||||
Amplify Snack Brands, 1st Lien | ||||||||
6.500%, 09/02/2023 | 1,378 | 1,347 | ||||||
ANVS Merger, 1st Lien | ||||||||
9.250%, 08/18/2021 | 1,300 | 1,176 | ||||||
5.500%, 02/18/2021 | 566 | 555 | ||||||
| SEI Institutional Investments Trust / Semi-Annual Report / November 30, 2016 | 125 |
SCHEDULE OF INVESTMENTS (Unaudited)
High Yield Bond Fund (Continued)
November 30, 2016
| Description | Face Amount ($ Thousands) | Market Value ($ Thousands) | ||||||
Applied Systems, 2nd Lien | ||||||||
7.500%, 01/24/2022 | $ | 1,825 | $ | 1,841 | ||||
Ascena Retail Group, Cov-Lite, 1st Lien | ||||||||
5.250%, 08/21/2022 | 116 | 113 | ||||||
Ascena Retail Group, Cov-Lite, Term Loan, 1st Lien | ||||||||
5.250%, 08/21/2022 | 2,025 | 1,970 | ||||||
Asurion, Cov-Lite, Term Loan B, | ||||||||
4.750%, 10/31/2023 | 413 | 416 | ||||||
Asurion, LLC, Incremental Term Loan B-4, 1st Lien | ||||||||
5.000%, 08/04/2022 | 976 | 982 | ||||||
Asurion, LLC, Term Loan B-1 | ||||||||
5.000%, 05/24/2019 | 94 | 94 | ||||||
Asurion, LLC, Term Loan, 2nd Lien | ||||||||
8.500%, 03/03/2021 | 4,240 | 4,282 | ||||||
Atlas Iron, Term Loan, Tranche 1 | ||||||||
5.580%, 12/07/2017 | 457 | 229 | ||||||
Avago Technologies Cayman, Term Loan B-3, 1st Lien | ||||||||
3.538%, 02/01/2023 | 2,868 | 2,894 | ||||||
Blount International, Initial Term Loan | ||||||||
7.250%, 04/12/2023 | 1,820 | 1,843 | ||||||
Blue Ribbon, LLC, 1st Lien | ||||||||
5.000%, 11/15/2021 | 1,816 | 1,760 | ||||||
BMC Foreign Holding, Initial Term Loan | ||||||||
5.000%, 09/10/2020 | 1,490 | 1,454 | ||||||
BMC Software, Term Loan | ||||||||
5.000%, 09/10/2020 | 1,894 | 1,849 | ||||||
BPA Laboratories, 2nd Lien | ||||||||
0.000%, 07/03/2017 | 273 | 178 | ||||||
Bway Intermediate, 1st Lien | ||||||||
5.500%, 08/14/2020 | 659 | 659 | ||||||
Bway Intermediate, Initial Term Loan | ||||||||
5.500%, 08/14/2020 | 9 | 9 | ||||||
California Resources, 1st Lien | ||||||||
11.375%, 12/31/2021 | 5,562 | 6,049 | ||||||
0.000%, 09/24/2019 (I) | 1,665 | 1,594 | ||||||
Carestream Health, Cov-Lite, 1st Lien | ||||||||
5.000%, 06/05/2019 | 1,091 | 968 | ||||||
Carestream Health, Cov-Lite, 2nd Lien | ||||||||
9.500%, 12/05/2019 | 7,304 | 5,861 | ||||||
Cengage Term Loan B | ||||||||
5.250%, 06/07/2023 | 1,862 | 1,786 | ||||||
Ceva Group, PLC, 1st Lien | ||||||||
6.500%, 03/19/2021 | 493 | 392 | ||||||
Ceva Intercompany, 1st Lien | ||||||||
6.500%, 03/19/2021 | 210 | 167 | ||||||
Ceva Logistics Canada, 1st Lien | ||||||||
6.500%, 03/19/2021 | 36 | 29 | ||||||
Chesapeake Energy, 1st Lien | ||||||||
8.500%, 08/23/2021 | 5,938 | 6,343 | ||||||
| Description | Face Amount ($ Thousands) | Market Value ($ Thousands) | ||||||
Chief Exploration, Term Loan | ||||||||
7.753%, 05/16/2021 | $ | 654 | $ | 620 | ||||
Claire's Store, 1st Lien | ||||||||
9.000%, 09/20/2021 | 223 | 112 | ||||||
Claire's Store, Limited Term Loan | ||||||||
9.000%, 09/20/2021 | 335 | 87 | ||||||
Claire's Store, Term Loan | ||||||||
9.000%, 09/20/2021 | 725 | 362 | ||||||
Clear Channel Communications, Extended Term Loan, 1st Lien | ||||||||
7.274%, 01/22/2019 | 3,698 | 2,863 | ||||||
Clubcorp, 1st Lien | ||||||||
4.000%, 12/15/2022 | 387 | 390 | ||||||
Conduent, Term Loan B, 1st Lien | ||||||||
0.000%, 11/22/2023 (I) | 2,450 | 2,456 | ||||||
Cowlitz Tribal Gaming Authority | ||||||||
11.500%, 12/06/2021 (D) | 4,500 | 4,815 | ||||||
CTI Foods, 2nd Lien | ||||||||
8.250%, 06/28/2021 | 950 | 845 | ||||||
Cumulus Media, 1st Lien | ||||||||
4.250%, 12/23/2020 | 6,942 | 4,175 | ||||||
Dex Media, 1st Lien | ||||||||
11.000%, 07/29/2021 | 476 | 474 | ||||||
Diebold, 1st Lien | ||||||||
5.250%, 11/06/2023 | 980 | 994 | ||||||
Empire Generating, 1st Lien | ||||||||
5.250%, 03/12/2021 | 151 | 139 | ||||||
Empire Generating, Term Loan | ||||||||
5.250%, 03/12/2021 | 1,903 | 1,750 | ||||||
Endurance International, | ||||||||
6.480%, 11/09/2019 | 1,618 | 1,589 | ||||||
Energy & Exploration Partners, | ||||||||
6.000%, 05/13/2022 | 136 | 90 | ||||||
0.500%, 11/12/2021 | 94 | 6 | ||||||
Energy & Exploration, 1st Lien | ||||||||
13.000%, 11/12/2021 | 244 | 230 | ||||||
Engility, Term Loan B2 | ||||||||
5.750%, 08/14/2023 | 63 | 63 | ||||||
Engility, Term Loan B-2, 1st Lien | ||||||||
5.750%, 08/14/2023 | 1,257 | 1,270 | ||||||
EP Energy, Cov-Lite | ||||||||
9.750%, 06/30/2021 | 970 | 982 | ||||||
Evergreen Skillsoft, 1st Lien | ||||||||
5.837%, 04/28/2021 | 2,958 | 2,732 | ||||||
FMG Resources (August 2006) Pty Ltd., 1st Lien | ||||||||
3.750%, 06/30/2019 (D) | 106 | 106 | ||||||
Foxwoods, 1st Lien | ||||||||
5.000%, 07/01/2018 | 3,106 | 2,749 | ||||||
Gardner Denver, Initial Dollar Term Loan | ||||||||
4.250%, 07/30/2020 (D) | 1,741 | 1,693 | ||||||
Greenway Medical Technologies, | ||||||||
6.000%, 11/04/2020 | 978 | 953 | ||||||
| 126 | SEI Institutional Investments Trust / Semi-Annual Report / November 30, 2016 |
| Description | Face Amount ($ Thousands) | Market Value ($ Thousands) | ||||||
Gulf Finance, 1st Lien | ||||||||
6.250%, 08/25/2023 | $ | 882 | $ | 867 | ||||
Gymboree, Cov-Lite, 1st Lien | ||||||||
5.000%, 02/23/2018 | 6,324 | 3,802 | ||||||
Harrah's Entertainment, Term Loan B6 | ||||||||
5.400%, 03/01/2017 (D) | 166 | 182 | ||||||
Indivior Finance, Initial Term Loan | ||||||||
7.000%, 12/19/2019 | 2,097 | 2,092 | ||||||
Integra Telecom, 1st Lien | ||||||||
5.250%, 08/14/2020 | 1,266 | 1,266 | ||||||
Intelsat Jackson Holdings, Term Loan B-2 | ||||||||
3.750%, 06/30/2019 (D) | 880 | 848 | ||||||
Internet Brands, Cov-Lite, 2nd Lien | ||||||||
8.500%, 07/08/2022 | 2,347 | 2,335 | ||||||
J. Crew Group, 1st Lien | ||||||||
4.000%, 03/05/2021 | 2,157 | 1,383 | ||||||
J. Crew Group, Term Loan B | ||||||||
4.000%, 03/05/2021 | 2,387 | 1,531 | ||||||
KAR Auction Services, | ||||||||
4.375%, 03/09/2023 | 1,791 | 1,812 | ||||||
KCA Deutag Drilling Ltd., | ||||||||
6.250%, 05/15/2020 | 1,000 | 855 | ||||||
KCA Deutag Drilling, Ltd., | ||||||||
6.250%, 05/18/2020 | 3 | 2 | ||||||
KIK Custom Products, Initial Loans | ||||||||
6.000%, 08/26/2022 | 3 | 3 | ||||||
Kraton Polymers, 1st Lien | ||||||||
6.000%, 01/06/2022 | 21 | 21 | ||||||
Kraton Polymers, Ist Lien | ||||||||
6.000%, 01/06/2022 | 324 | 326 | ||||||
Laureate Education, 1st Lien | ||||||||
5.000%, 06/15/2018 | 432 | 427 | ||||||
Ligado Networks, LLC, 2nd Lien | ||||||||
13.500%, 12/07/2020 | 3,033 | 2,085 | ||||||
LightSquared L.P., 1st Lien | ||||||||
9.750%, 06/15/2020 | 2,829 | 2,631 | ||||||
Lions Gate, Bridge Loan | ||||||||
0.000%, 03/27/2017 | 1,210 | 1,210 | ||||||
Lonestar Interm Super Holdings, Term Loan B | ||||||||
10.000%, 08/31/2021 | 1,105 | 1,114 | ||||||
Maple, Cov-Lite, Term Loan B, | ||||||||
5.250%, 03/03/2023 | 3,213 | 3,250 | ||||||
Mashantucket Pequot Tribe, 1st Lien | ||||||||
9.375%, 06/30/2020 | 10,293 | 9,007 | ||||||
Medical Card System, Term Loan | ||||||||
1.500%, 05/31/2019 | 1,975 | 1,262 | ||||||
Medical Card Systems, Term Loan | ||||||||
0.000%, 04/15/2022 | 368 | — | ||||||
Metroflag, 2nd Lien | ||||||||
14.000%, 01/06/2009 (A) | 325 | — | ||||||
Misys, 1st Lien | ||||||||
5.000%, 12/12/2018 | 970 | 973 | ||||||
| Description | Face Amount ($ Thousands) | Market Value ($ Thousands) | ||||||
Misys, 2nd Lien | ||||||||
12.000%, 06/12/2019 | $ | 1,550 | $ | 1,625 | ||||
MKS Instruments, Tranche B-1 Term Loan, 2nd Lien | ||||||||
4.250%, 05/01/2023 | 727 | 730 | ||||||
MMI, Term Loan | ||||||||
9.000%, 01/31/2020 | 3,451 | 3,223 | ||||||
Moneygram International, Term Loan | ||||||||
0.000%, 03/26/2020 | 1,832 | 1,788 | ||||||
Murray Energy, Cov-Lite, Term Loan B, 2nd Lien | ||||||||
8.250%, 04/16/2020 | 5,556 | 5,034 | ||||||
Nana Development, 1st Lien | ||||||||
8.000%, 03/13/2018 | 200 | 192 | ||||||
Nelson Education Equity, Term Loan | ||||||||
0.000%, 03/15/2021 (I) | 173 | 7 | ||||||
Nelson Education, 1st Lien | ||||||||
12.000%, 10/01/2020 | 1,050 | 575 | ||||||
New Millennium Holdco, LLC, Term Loan | ||||||||
7.500%, 12/21/2020 | 155 | 88 | ||||||
Nine West, Cov-Lite, Unsecured Guaranteed Term Loan | ||||||||
6.250%, 01/08/2020 | 8,228 | 1,851 | ||||||
Ocean Rig, Term Loan B | ||||||||
5.500%, 07/25/2021 | 2,567 | 1,833 | ||||||
Ocean, Cov-Lite, Term Loan B1, 1st Lien | ||||||||
6.000%, 03/31/2021 | 2,149 | 1,115 | ||||||
Ortho-Clinical Diagnostics, 1st Lien | ||||||||
4.750%, 06/30/2021 | 143 | 140 | ||||||
Ortho-Clinical Diagnostics, | ||||||||
4.750%, 06/30/2021 | 310 | 304 | ||||||
Ortho-Clinical Diagnostics, | ||||||||
4.750%, 06/30/2021 | 468 | 458 | ||||||
Oxbow Carbon & Minerals Holdings, 2nd Lien | ||||||||
8.000%, 01/17/2020 | 1,908 | 1,857 | ||||||
P2 Energy, 1st Lien | ||||||||
5.250%, 10/30/2020 | 1,078 | 1,014 | ||||||
5.000%, 10/30/2020 | 6 | 5 | ||||||
Panda Temple Power, 1st Lien | ||||||||
7.250%, 04/03/2019 | 349 | 319 | ||||||
Peabody Energy, 1st Lien | ||||||||
0.000%, 09/24/2018 (I) | 5,487 | 5,059 | ||||||
Peak, Cov-Lite, 2nd Lien | ||||||||
8.250%, 06/17/2022 | 2,335 | 2,201 | ||||||
Petco Animal Supplies, Term Loan B-1, 1st Lien | ||||||||
5.000%, 01/26/2023 | 3,176 | 3,198 | ||||||
PQ, Term Loan | ||||||||
5.250%, 11/04/2022 | 623 | 624 | ||||||
Quorum Health, 1st Lien | ||||||||
6.750%, 04/29/2022 | 1,457 | 1,403 | ||||||
| SEI Institutional Investments Trust / Semi-Annual Report / November 30, 2016 | 127 |
SCHEDULE OF INVESTMENTS (Unaudited)
High Yield Bond Fund (Continued)
November 30, 2016
| Description | Face Amount ($ Thousands) | Market Value ($ Thousands) | ||||||
Revlon, Cove-Lite, Initial | ||||||||
4.250%, 09/07/2023 | $ | 222 | $ | 222 | ||||
Revlon, Cov-Lite, Initial Term Loan B | ||||||||
4.250%, 09/07/2023 | 667 | 667 | ||||||
Revlon, Cov-Lite, Initial Term Loan B | ||||||||
4.250%, 09/07/2023 | 11 | 11 | ||||||
Riverbed Technology, 1st Lien | ||||||||
5.000%, 04/25/2022 | 1,698 | 1,712 | ||||||
Royal Holdings Inc, 2nd Lien | ||||||||
8.500%, 06/19/2023 | 436 | 431 | ||||||
Rue 21, Term Loan B, 1st Lien | ||||||||
5.625%, 10/09/2020 | 2,094 | 903 | ||||||
Seadrill Partners, LLC, Term Loan B, 1st Lien | ||||||||
4.000%, 02/21/2021 | 1,087 | 615 | ||||||
Skillsoft, Cov-Lite, 2nd Lien | ||||||||
9.250%, 04/28/2022 | 930 | 687 | ||||||
Solarwinds, 1st Lien | ||||||||
5.500%, 02/03/2023 | 2,109 | 2,123 | ||||||
Starwood Property Trust, | ||||||||
3.500%, 04/17/2020 | 836 | 836 | ||||||
Steinway Musical Instruments, | ||||||||
4.750%, 09/19/2019 | 1,170 | 1,126 | ||||||
Syncreon Holdings Ltd., | ||||||||
5.250%, 10/28/2020 | 1,086 | 974 | ||||||
Syniverse Holdings, 1st Lien | ||||||||
4.000%, 04/23/2019 | 2,223 | 2,000 | ||||||
Texas Competitive, Extended | ||||||||
5.000%, 10/10/2017 (A) | 12,628 | 3,662 | ||||||
The Hillman Companies, | ||||||||
4.500%, 06/30/2021 | 309 | 309 | ||||||
The Neiman Marcus Group, | ||||||||
4.250%, 10/25/2020 | 1,878 | 1,704 | ||||||
True Religion Apparel, 1st Lien | ||||||||
5.875%, 07/30/2019 | 783 | 203 | ||||||
TSAM LLC, 1st Lien | ||||||||
7.750%, 09/12/2019 | 776 | 772 | ||||||
TXU/Tech, 1st Lien | ||||||||
5.000%, 08/04/2023 | 1,593 | 1,608 | ||||||
UFC Holdings, 1st Lien | ||||||||
5.000%, 08/18/2023 | 1,380 | 1,388 | ||||||
US Renal Care, Cov-Lite, 1st Lien | ||||||||
5.250%, 12/30/2022 | 2,853 | 2,671 | ||||||
Valeant, Term Loan B | ||||||||
5.500%, 04/01/2022 | 751 | 744 | ||||||
Varsity Brands, Cov-Lite, 1st Lien | ||||||||
5.000%, 12/10/2021 | 1,510 | 1,523 | ||||||
Veritas Bermuda, 1st Lien | ||||||||
6.625%, 01/27/2023 | 2,882 | 2,588 | ||||||
Vizient, Cov-Lite, 1st Lien | ||||||||
6.250%, 02/13/2023 | 1,593 | 1,606 | ||||||
| Description | Face Amount ($ Thousands) | Market Value ($ Thousands) | ||||||
Walter Investment Management, | ||||||||
4.750%, 12/18/2020 | $ | 1,530 | $ | 1,438 | ||||
Weight Watchers International, | ||||||||
4.100%, 04/02/2020 | 446 | 340 | ||||||
Weight Watchers International, | ||||||||
4.000%, 04/02/2020 | 156 | 119 | ||||||
Western Digital, 1st Lien | ||||||||
4.500%, 04/29/2023 | 2,480 | 2,507 | ||||||
Wilton Brands, 1st Lien | ||||||||
8.500%, 08/30/2018 | 4,229 | 3,806 | ||||||
York Risk Services Holding, | ||||||||
4.750%, 10/01/2021 | 556 | 513 | ||||||
York Risk Services, Cov-Lite, 1st Lien | ||||||||
4.750%, 10/01/2021 | 98 | 90 | ||||||
Zekelman Industries, 1st Lien | ||||||||
6.000%, 06/14/2021 | 953 | 956 | ||||||
|
| |||||||
Total Loan Participations | 209,688 | |||||||
|
| |||||||
MUNICIPAL BONDS — 0.6% | ||||||||
Connecticut — 0.2% | ||||||||
Mohegan Tribal Finance Authority, RB Callable 02/01/2023 @ 100 | ||||||||
7.000%, 02/01/2045 (B) | 4,850 | 4,943 | ||||||
|
| |||||||
Puerto Rico — 0.2% | ||||||||
Commonwealth of Puerto Rico, Ser A, GO Callable 07/01/2017 @ 100 | ||||||||
5.250%, 07/01/2037 (A) | 185 | 121 | ||||||
Commonwealth of Puerto Rico, Ser A, GO Callable 07/01/2020 @ 100 | ||||||||
8.000%, 07/01/2035 (A) | 4,965 | 3,488 | ||||||
Commonwealth of Puerto Rico, Ser A, GO Callable 07/01/2022 @ 100 | ||||||||
5.125%, 07/01/2037 (A) | 1,065 | 687 | ||||||
5.000%, 07/01/2041 (A) | 855 | 550 | ||||||
|
| |||||||
| 4,846 | ||||||||
|
| |||||||
Texas — 0.2% | ||||||||
Texas State, Public Finance Authority, Texas Windstorm Insurance Association, RB Callable 07/01/2019 @ 100 | ||||||||
8.250%, 07/01/2024 | 5,455 | 5,731 | ||||||
|
| |||||||
Total Municipal Bonds | 15,520 | |||||||
|
| |||||||
| 128 | SEI Institutional Investments Trust / Semi-Annual Report / November 30, 2016 |
| Description | Shares | Market Value ($ Thousands) | ||||||
Aspect Software CR1* | 40,500 | $ | 320 | |||||
Aspect Software CR2* | 2,248 | 18 | ||||||
Cengage Learning Holdings II | 2,860 | 53 | ||||||
Ceva Holdings* | 561 | 196 | ||||||
CUI Acquisition* | 3 | 249 | ||||||
Dana Holding | 118,652 | 2,004 | ||||||
Dex Media* | 97,026 | 233 | ||||||
Energy & Exploration* | 351 | 137 | ||||||
Global Aviation Holdings, Cl A* | 101,199 | — | ||||||
Halcon Resources* | 93,809 | 892 | ||||||
Houghton Mifflin Harcourt* | 37,762 | 417 | ||||||
Mirabela Nickel* (E) | 4,317,306 | — | ||||||
MModal* | 43,639 | 698 | ||||||
NII Holdings* | 109,107 | 186 | ||||||
Reichhold Industries* (E) | 1,755 | 1,123 | ||||||
SandRidge Energy* | 30,024 | 688 | ||||||
Seventy Seven Energy* | 91,890 | 2,238 | ||||||
TCEH* | 295,903 | 4,616 | ||||||
TE Holdcorp* | 67,771 | 432 | ||||||
Titan Energy LLC* | 22,243 | 512 | ||||||
|
| |||||||
Total Common Stock | 15,012 | |||||||
|
| |||||||
Face Amount | ||||||||
CONVERTIBLE BONDS — 0.5% |
| |||||||
Advanced Micro Devices CV to 125.0031 | ||||||||
2.125%, 09/01/2026 | $ | 1,440 | 1,869 | |||||
Cheniere Energy CV to 7.2265 | ||||||||
4.250%, 03/15/2045 | 908 | 552 | ||||||
Liberty Media CV to 16.7764 | ||||||||
3.750%, 02/15/2030 | 7,877 | 4,716 | ||||||
Liberty Media CV to 22.9469 | ||||||||
4.000%, 11/15/2029 | 3,912 | 2,328 | ||||||
MGIC Investment CV to 74.0741 | ||||||||
9.000%, 04/01/2063 (B) | 1,210 | 1,492 | ||||||
Mirabela Nickel | ||||||||
9.500%, 06/24/2019 (A) (B) (E) (F) | 1,133 | 209 | ||||||
Mirant CV to 14.7167 | ||||||||
0.000%, 06/15/2021 (A) | 1,950 | — | ||||||
SandRidge Energy | ||||||||
0.000%, 10/04/2020 | 723 | 879 | ||||||
Walter Investment Management CV to 17.0068 | ||||||||
4.500%, 11/01/2019 | 704 | 479 | ||||||
|
| |||||||
Total Convertible Bonds | 12,524 | |||||||
|
| |||||||
Shares | ||||||||
PREFERRED STOCK — 0.2% | ||||||||
Aspen Insurance Holdings Ltd., 5.950% (D) | 92,000 | 2,428 | ||||||
Ceva Holdings, 0.000%* | 1,214 | 425 | ||||||
| Description | Shares | Market Value ($ Thousands) | ||||||
GMAC Capital Trust I, 8.125% (D) | 28,000 | $ | 704 | |||||
SLM, 2.037% (D) | 22,927 | 1,244 | ||||||
TE Holdcorp, 0.000%* | 98,860 | 1,186 | ||||||
|
| |||||||
Total Preferred Stock | 5,987 | |||||||
|
| |||||||
Face Amount | ||||||||
SOVEREIGN DEBT — 0.0% |
| |||||||
Seminole Tribe | ||||||||
6.535%, 10/01/2020 (B) | $ | 895 | 899 | |||||
|
| |||||||
Total Sovereign Debt (Cost $836) ($ Thousands) | 899 | |||||||
|
| |||||||
ASSET-BACKED SECURITY — 0.0% |
| |||||||
Other Asset-Backed Securities — 0.0% |
| |||||||
Airplanes, Pass-Through Trust, Ser 2001-1A, Cl A9 | ||||||||
1.074%, 03/15/2019 (B) (D) | 1,509 | 490 | ||||||
|
| |||||||
Total Asset-Backed Security | 490 | |||||||
|
| |||||||
Number of Rights | ||||||||
RIGHTS — 0.0% | ||||||||
TXU/Tech*‡‡ | 295,903 | 399 | ||||||
|
| |||||||
Total Rights | 399 | |||||||
|
| |||||||
Number of Warrants | ||||||||
WARRANTS — 0.0% | ||||||||
MModal A, Expires 07/31/2017 | ||||||||
Strike Price $40.00* | 15,753 | 4 | ||||||
MModal B, Expires 07/31/2017 | ||||||||
Strike Price $47.50* | 20,773 | 2 | ||||||
SandRidge Energy, Expires 10/04/2022 | ||||||||
Strike Price $41.34* | 14,900 | 56 | ||||||
SandRidge Energy, Expires 10/04/2022 | ||||||||
Strike Price $42.03* | 6,273 | 23 | ||||||
| SEI Institutional Investments Trust / Semi-Annual Report / November 30, 2016 | 129 |
SCHEDULE OF INVESTMENTS (Unaudited)
High Yield Bond Fund (Concluded)
November 30, 2016
| Description | Number of Warrants | Market Value ($ Thousands) | ||||||
Seventy Seven Energy, Expires 01/01/2021 | ||||||||
Strike Price $23.82* | 3,407 | $ | 22 | |||||
|
| |||||||
Total Warrants | 107 | |||||||
|
| |||||||
| Description | Shares | Market Value ($ Thousands) | ||||||
CASH EQUIVALENT — 2.8% |
| |||||||
SEI Daily Income Trust, Government Fund, Cl A | ||||||||
0.210%**† | 79,955,366 | $ | 79,955 | |||||
|
| |||||||
Total Cash Equivalent | 79,955 | |||||||
|
| |||||||
Total Investments — 99.8% | $ | 2,837,549 | ||||||
|
| |||||||
A list of open centrally cleared swap agreements held by the Fund at November 30, 2016, are as follows:
| Credit Default Swaps | ||||||||||||||||||||||||
| Counterparty | Reference Entity/Obligation | Buy/Sell Protection | (Pays)/Receives Rate | Termination Date | Notional Amount ($ Thousands) | Net Unrealized Appreciation (Depreciation) ($ Thousands) | ||||||||||||||||||
JPMorgan Chase Bank | CDX.NA.HY Series 26 | SELL | 5.00% | 6/20/21 | $ | (6,700 | ) | $ | 133 | |||||||||||||||
JPMorgan Chase Bank | CDX.NA.HY Series 27 | SELL | 5.00% | 12/20/21 | (7,400 | ) | (7 | ) | ||||||||||||||||
|
| |||||||||||||||||||||||
| $ | 126 | |||||||||||||||||||||||
|
| |||||||||||||||||||||||
For the period ended November 30, 2016, the total amount of open swap agreements, as presented in the table above, are representative of the volume of activity for this derivative types during the period.
Percentages are based on Net Assets of $2,844,164 ($ Thousands).
| * | Non-income producing security. |
| ** | Rate shown is the 7-day effective yield as of November 30, 2016. |
| † | Investment in Affiliated Security (see Note 6). |
| ‡‡ | Expiration date unavailable. |
| (A) | Security is in default on interest payment. |
| (B) | Security exempt from registration under Rule 144A of the Securities Act of 1933. These securities may be resold in transactions exempt from registration normally to qualified institutions. On November 30, 2016, the value of these securities amounted to $1,320,154 ($ Thousands), representing 46.4% of the net assets of the Fund. |
| (C) | Step Bonds — The rate reflected on the Schedule of Investments is the effective yield on November 30, 2016. The coupon on a step bond changes on a specified date. |
| (D) | Variable Rate Security — The rate reported on the Schedule of Investments is the rate in effect as of November 30, 2016. |
| (E) | Security fair valued using methods determined in good faith by the Valuation Committee of the Board of Trustees. The total market value of such securities as of November 30, 2016 was $16,761 ($ Thousands) and represented 0.6% of net assets of the Fund. |
| (F) | Securities considered illiquid. The total value of such securities as of November 30, 2016 was $209 ($ Thousands) and represented 0.0% of the net assets of the Fund. |
| (G) | Securities considered restricted. The total market value of such securities as of November 30, 2016 was $0 ($ Thousands) and represented 0.0% of the net assets of the Fund. |
| (H) | Warehouse Note — Interest rate and maturity date are not available. |
| (I) | Unsettled bank loan. Interest rate not available. |
CDO — Collateralized Debt Obligation
Cl — Class
CLO — Collateralized Loan Obligation
CV — Convertible Security
GO — General Obligation
LLC — Limited Liability Company
LP — Limited Partnership
Ltd. — Limited
MTN — Medium Term Note
PIK — Payment-in-Kind
PLC — Public Limited Company
Pty — Proprietary
RB — Revenue Bond
Ser — Series
The following is a list of the level of inputs used as of November 30, 2016, in valuing the Fund's investments and other financial instruments carried at value ($ Thousands):
| Investments in Securities | Level 1 | Level 2 | Level 3 | Total | ||||||||||||
Corporate Obligations | $ | — | $ | 2,228,382 | $ | 6,796 | $ | 2,235,178 | ||||||||
Collateralized Debt | ||||||||||||||||
Obligations | — | 57,253 | 204,537 | 261,790 | ||||||||||||
Loan Participations | — | 190,002 | 19,686 | 209,688 | ||||||||||||
Municipal Bonds | — | 4,846 | 10,674 | 15,520 | ||||||||||||
Common Stock | 11,606 | 665 | 2,741 | 15,012 | ||||||||||||
Convertible Bonds | — | 12,315 | 209 | 12,524 | ||||||||||||
Preferred Stock | 3,132 | 2,430 | 425 | 5,987 | ||||||||||||
Sovereign Debt | — | 899 | — | 899 | ||||||||||||
Asset-Backed Security | — | 490 | — | 490 | ||||||||||||
Rights | — | 399 | — | 399 | ||||||||||||
Warrants | — | 101 | 6 | 107 | ||||||||||||
Cash Equivalent | 79,955 | — | — | 79,955 | ||||||||||||
|
|
|
|
|
|
|
| |||||||||
Total Investments in Securities | $ | 94,693 | $ | 2,497,782 | $ | 245,074 | $ | 2,837,549 | ||||||||
|
|
|
|
|
|
|
| |||||||||
| Other Financial Instruments | Level 1 | Level 2 | Level 3 | Total | ||||||||||||
Centrally Cleared Swaps | ||||||||||||||||
Credit Default Swaps* | ||||||||||||||||
Unrealized Appreciation | $ | — | $ | 133 | $ | — | $ | 133 | ||||||||
Unrealized Depreciation | — | (7 | ) | — | (7 | ) | ||||||||||
|
|
|
|
|
|
|
| |||||||||
Total Other Financial Instruments | $ | — | $ | 126 | $ | — | $ | 126 | ||||||||
|
|
|
|
|
|
|
| |||||||||
| * | Swaps are valued at the unrealized appreciation (depreciation) on the instrument. |
| 130 | SEI Institutional Investments Trust / Semi-Annual Report / November 30, 2016 |
The following is a reconciliation of investments in which significant unobservable inputs (Level 3) were used in determining value ($ Thousands).
Investments in Corporate | Investments in Collateralized Debt | Investments in Loan Participations | Investments in Municipal Bonds | Investments in Common Stock | Investments in Convertible Bonds | Investments in Preferred Stock | Investments in Warrants | |||||||||||||||||||||||||||||||||
Balance as of May 31, 2016 | $ | 10,474 | $ | 180,633 | $ | 7,848 | $ | 10,476 | $ | 2,086 | $ | 270 | $ | 486 | $ | — | ||||||||||||||||||||||||
Accrued discounts/premiums | 29 | (791 | ) | (341 | ) | — | — | (1 | ) | — | — | |||||||||||||||||||||||||||||
Realized gain/(loss) | — | 3,603 | 308 | — | 534 | — | — | — | ||||||||||||||||||||||||||||||||
Change in unrealized appreciation/depreciation | (108 | ) | 23,863 | 1,025 | 198 | (275 | ) | (111 | ) | (61 | ) | 6 | ||||||||||||||||||||||||||||
Purchases | 51 | 41,226 | — | — | 396 | 51 | — | — | ||||||||||||||||||||||||||||||||
Sales | — | (43,997 | ) | (12 | ) | — | — | — | — | — | ||||||||||||||||||||||||||||||
Net transfer into Level 3 | — | — | 10,858 | — | — | — | — | — | ||||||||||||||||||||||||||||||||
Net transfer out of Level 3 | (3,650 | ) | — | — | — | — | — | — | — | |||||||||||||||||||||||||||||||
|
| |||||||||||||||||||||||||||||||||||||||
Ending Balance as of November 30, 2016 | $ | 6,796 | $ | 204,537 | $ | 19,686 | $ | 10,674 | $ | 2,741 | $ | 209 | $ | 425 | $ | 6 | ||||||||||||||||||||||||
|
| |||||||||||||||||||||||||||||||||||||||
Changes in unrealized gains/(losses)included in earnings related to securities still held at reporting date | $ | (108 | ) | $ | 25,119 | $ | (2,623 | ) | $ | 198 | $ | (275 | ) | $ | (672 | ) | $ | (61 | ) | $ | 6 | |||||||||||||||||||
|
| |||||||||||||||||||||||||||||||||||||||
For the period ended November 30, 2016, there were no transfers between Level 1 and Level 2 assets and liabilities.
For the period ended November 30, 2016, there were transfers between Level 2 and Level 3 assets and liabilities. The transfers were due to changes in the availability of observable inputs used to determine fair value.
For more information on valuation inputs, see Note 2 — Significant Accounting Policies in Notes to Financial Statements.
Amounts designated as “—” are either $0 or have been rounded to $0.
The accompanying notes are an integral part of the financial statements
| SEI Institutional Investments Trust / Semi-Annual Report / November 30, 2016 | 131 |
SCHEDULE OF INVESTMENTS (Unaudited)
Long Duration Fund
November 30, 2016
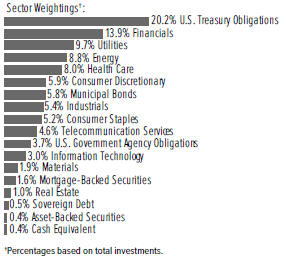
| Description | Face Amount ($ Thousands) | Market Value ($ Thousands) | ||||||
CORPORATE OBLIGATIONS — 67.8% |
| |||||||
Consumer Discretionary — 5.9% | ||||||||
21st Century Fox America | ||||||||
8.150%, 10/17/2036 | $ | 2,015 | $ | 2,739 | ||||
7.850%, 03/01/2039 | 3,900 | 5,168 | ||||||
7.750%, 01/20/2024 | 125 | 153 | ||||||
7.625%, 11/30/2028 | 2,411 | 3,103 | ||||||
7.430%, 10/01/2026 | 775 | 977 | ||||||
6.900%, 08/15/2039 | 2,450 | 3,098 | ||||||
6.750%, 01/09/2038 | 360 | 427 | ||||||
6.550%, 03/15/2033 | 2,170 | 2,631 | ||||||
6.400%, 12/15/2035 | 875 | 1,051 | ||||||
6.150%, 02/15/2041 | 3,000 | 3,552 | ||||||
Amazon.com | ||||||||
4.950%, 12/05/2044 | 2,015 | 2,227 | ||||||
Charter Communications Operating LLC | ||||||||
6.484%, 10/23/2045 (A) | 2,878 | 3,233 | ||||||
6.384%, 10/23/2035 (A) | 6,370 | 7,109 | ||||||
Comcast | ||||||||
6.950%, 08/15/2037 | 1,655 | 2,238 | ||||||
6.450%, 03/15/2037 | 3,470 | 4,438 | ||||||
6.400%, 05/15/2038 | 7,298 | 9,312 | ||||||
5.700%, 07/01/2019 | 100 | 110 | ||||||
5.650%, 06/15/2035 | 1,035 | 1,221 | ||||||
4.650%, 07/15/2042 | 1,650 | 1,728 | ||||||
4.600%, 08/15/2045 | 1,645 | 1,706 | ||||||
4.400%, 08/15/2035 | 500 | 519 | ||||||
4.250%, 01/15/2033 | 4,805 | 4,948 | ||||||
4.200%, 08/15/2034 | 1,910 | 1,949 | ||||||
Cox Communications | ||||||||
7.625%, 06/15/2025 | 300 | 348 | ||||||
6.950%, 06/01/2038 (A) | 3,328 | 3,524 | ||||||
Cox Enterprises | ||||||||
7.375%, 07/15/2027 (A) | 1,300 | 1,503 | ||||||
| Description | Face Amount ($ Thousands) | Market Value ($ Thousands) | ||||||
Discovery Communications LLC | ||||||||
4.875%, 04/01/2043 | $ | 1,070 | $ | 956 | ||||
Ford Holdings | ||||||||
9.300%, 03/01/2030 | 2,525 | 3,406 | ||||||
Ford Motor | ||||||||
7.450%, 07/16/2031 | 2,908 | 3,606 | ||||||
7.400%, 11/01/2046 | 625 | 825 | ||||||
4.750%, 01/15/2043 | 950 | 888 | ||||||
General Motors | ||||||||
6.750%, 04/01/2046 | 1,700 | 1,962 | ||||||
6.600%, 04/01/2036 | 1,445 | 1,620 | ||||||
6.250%, 10/02/2043 | 2,005 | 2,159 | ||||||
Grupo Televisa | ||||||||
6.125%, 01/31/2046 | 1,965 | 1,930 | ||||||
Home Depot | ||||||||
4.250%, 04/01/2046 | 1,545 | 1,590 | ||||||
4.200%, 04/01/2043 | 1,035 | 1,053 | ||||||
Johnson Controls | ||||||||
4.950%, 07/02/2064 | 1,645 | 1,536 | ||||||
4.625%, 07/02/2044 | 770 | 768 | ||||||
3.625%, 07/02/2024 | 1,095 | 1,123 | ||||||
Lowe's | ||||||||
5.125%, 11/15/2041 | 2,175 | 2,453 | ||||||
4.375%, 09/15/2045 | 975 | 993 | ||||||
McDonald's MTN | ||||||||
4.700%, 12/09/2035 | 1,165 | 1,211 | ||||||
4.600%, 05/26/2045 | 850 | 855 | ||||||
NBCUniversal Media LLC | ||||||||
6.400%, 04/30/2040 | 1,006 | 1,294 | ||||||
5.950%, 04/01/2041 | 2,075 | 2,538 | ||||||
Newell Brands | ||||||||
5.500%, 04/01/2046 | 350 | 397 | ||||||
Target | ||||||||
6.650%, 08/01/2028 | 435 | 538 | ||||||
TCI Communications | ||||||||
7.875%, 02/15/2026 | 3,070 | 4,118 | ||||||
Thomson Reuters | ||||||||
4.300%, 11/23/2023 | 1,075 | 1,126 | ||||||
Time Warner | ||||||||
7.700%, 05/01/2032 | 4,322 | 5,710 | ||||||
7.625%, 04/15/2031 | 7,745 | 10,242 | ||||||
6.250%, 03/29/2041 | 1,245 | 1,438 | ||||||
6.100%, 07/15/2040 | 3,375 | 3,824 | ||||||
3.800%, 02/15/2027 | 1,035 | 1,030 | ||||||
Time Warner Cable | ||||||||
7.300%, 07/01/2038 | 755 | 900 | ||||||
6.550%, 05/01/2037 | 1,000 | 1,116 | ||||||
5.875%, 11/15/2040 | 2,365 | 2,463 | ||||||
Time Warner Cable LLC | ||||||||
6.750%, 06/15/2039 | 775 | 875 | ||||||
5.500%, 09/01/2041 | 2,935 | 2,930 | ||||||
4.500%, 09/15/2042 | 595 | 524 | ||||||
| 132 | SEI Institutional Investments Trust / Semi-Annual Report / November 30, 2016 |
| Description | Face Amount ($ Thousands) | Market Value ($ Thousands) | ||||||
Viacom | ||||||||
5.850%, 09/01/2043 | $ | 3,755 | $ | 3,994 | ||||
5.250%, 04/01/2044 | 255 | 255 | ||||||
4.850%, 12/15/2034 | 2,180 | 2,086 | ||||||
3.450%, 10/04/2026 | 450 | 430 | ||||||
Walt Disney | ||||||||
4.125%, 12/01/2041 | 475 | 479 | ||||||
|
| |||||||
| 146,253 | ||||||||
|
| |||||||
Consumer Staples — 5.2% |
| |||||||
Altria Group | ||||||||
5.375%, 01/31/2044 | 1,710 | 1,955 | ||||||
3.875%, 09/16/2046 | 770 | 713 | ||||||
Anheuser-Busch InBev Finance | ||||||||
4.900%, 02/01/2046 | 22,090 | 23,634 | ||||||
4.700%, 02/01/2036 | 10,000 | 10,487 | ||||||
Anheuser-Busch InBev Worldwide | ||||||||
6.375%, 01/15/2040 | 1,075 | 1,352 | ||||||
Bowdoin College | ||||||||
4.693%, 07/01/2112 | 5,584 | 5,074 | ||||||
Coca-Cola Femsa | ||||||||
3.875%, 11/26/2023 | 3,310 | 3,362 | ||||||
CVS Health | ||||||||
5.125%, 07/20/2045 | 5,415 | 5,941 | ||||||
CVS Pass-Through Trust | ||||||||
8.353%, 07/10/2031 (A) | 6,670 | 8,786 | ||||||
General Mills | ||||||||
5.400%, 06/15/2040 | 815 | 929 | ||||||
Kraft Heinz Foods | ||||||||
6.875%, 01/26/2039 | 865 | 1,094 | ||||||
5.200%, 07/15/2045 | 2,780 | 2,956 | ||||||
5.000%, 07/15/2035 | 660 | 698 | ||||||
5.000%, 06/04/2042 | 3,430 | 3,542 | ||||||
4.375%, 06/01/2046 | 5,485 | 5,216 | ||||||
Massachusetts Institute of Technology | ||||||||
5.600%, 07/01/2111 | 665 | 815 | ||||||
4.678%, 07/01/2114 | 2,483 | 2,517 | ||||||
Molson Coors Brewing | ||||||||
4.200%, 07/15/2046 | 3,150 | 2,909 | ||||||
Northwestern University | ||||||||
4.643%, 12/01/2044 | 150 | 169 | ||||||
PepsiCo | ||||||||
3.600%, 08/13/2042 | 545 | 503 | ||||||
3.450%, 10/06/2046 | �� | 2,375 | 2,119 | |||||
Pernod Ricard | ||||||||
4.450%, 01/15/2022 (A) | 675 | 716 | ||||||
Philip Morris International | ||||||||
6.375%, 05/16/2038 | 325 | 415 | ||||||
4.500%, 03/20/2042 | 3,665 | 3,740 | ||||||
4.250%, 11/10/2044 | 1,245 | 1,227 | ||||||
4.125%, 03/04/2043 | 1,125 | 1,083 | ||||||
3.875%, 08/21/2042 | 1,710 | 1,593 | ||||||
| Description | Face Amount ($ Thousands) | Market Value ($ Thousands) | ||||||
SABMiller Holdings | ||||||||
4.950%, 01/15/2042 (A) | $ | 1,380 | $ | 1,490 | ||||
Tufts University | ||||||||
5.017%, 04/15/2112 | 1,367 | 1,388 | ||||||
University of Southern California | ||||||||
5.250%, 10/01/2111 | 1,590 | 1,815 | ||||||
3.028%, 10/01/2039 | 1,250 | 1,101 | ||||||
Walgreens Boots Alliance | ||||||||
4.800%, 11/18/2044 | 4,335 | 4,341 | ||||||
4.650%, 06/01/2046 | 1,300 | 1,278 | ||||||
3.450%, 06/01/2026 | 3,800 | 3,723 | ||||||
Wal-Mart Stores | ||||||||
6.200%, 04/15/2038 | 2,650 | 3,492 | ||||||
5.625%, 04/01/2040 | 3,040 | 3,776 | ||||||
5.625%, 04/15/2041 | 1,635 | 2,011 | ||||||
5.000%, 10/25/2040 | 430 | 491 | ||||||
4.750%, 10/02/2043 | 5,045 | 5,631 | ||||||
4.300%, 04/22/2044 | 5,200 | 5,458 | ||||||
|
| |||||||
| 129,540 | ||||||||
|
| |||||||
Energy — 8.9% |
| |||||||
Alta Wind Holdings | ||||||||
7.000%, 06/30/2035 (A) | 1,446 | 1,480 | ||||||
Anadarko Finance | ||||||||
7.500%, 05/01/2031 | 1,465 | 1,818 | ||||||
Anadarko Holding | ||||||||
7.150%, 05/15/2028 | 3,290 | 3,876 | ||||||
Anadarko Petroleum | ||||||||
6.600%, 03/15/2046 | 970 | 1,131 | ||||||
5.115%, 10/10/2036 (B) | 18,000 | 7,088 | ||||||
4.500%, 07/15/2044 | 2,575 | 2,281 | ||||||
Apache | ||||||||
5.250%, 02/01/2042 | 310 | 317 | ||||||
5.100%, 09/01/2040 | 400 | 402 | ||||||
4.750%, 04/15/2043 | 2,695 | 2,666 | ||||||
4.250%, 01/15/2044 | 665 | 611 | ||||||
BG Energy Capital | ||||||||
5.125%, 10/15/2041 (A) | 2,430 | 2,573 | ||||||
Burlington Resources Finance | ||||||||
7.200%, 08/15/2031 | 25 | 31 | ||||||
Canadian Natural Resources | ||||||||
5.850%, 02/01/2035 | 150 | 153 | ||||||
Cenovus Energy | ||||||||
5.200%, 09/15/2043 | 1,030 | 937 | ||||||
3.800%, 09/15/2023 | 250 | 240 | ||||||
Columbia Pipeline Group | ||||||||
5.800%, 06/01/2045 | 570 | 641 | ||||||
4.500%, 06/01/2025 | 1,045 | 1,086 | ||||||
Conoco Funding | ||||||||
7.250%, 10/15/2031 | 620 | 787 | ||||||
6.950%, 04/15/2029 | 1,700 | 2,083 | ||||||
| SEI Institutional Investments Trust / Semi-Annual Report / November 30, 2016 | 133 |
SCHEDULE OF INVESTMENTS (Unaudited)
Long Duration Fund (Continued)
November 30, 2016
| Description | Face Amount ($ Thousands) | Market Value ($ Thousands) | ||||||
ConocoPhillips | ||||||||
6.500%, 02/01/2039 | $ | 1,370 | $ | 1,686 | ||||
5.950%, 03/15/2046 | 2,560 | 3,030 | ||||||
5.900%, 05/15/2038 | 4,038 | 4,576 | ||||||
4.300%, 11/15/2044 | 4,080 | 3,922 | ||||||
Devon Energy | ||||||||
7.950%, 04/15/2032 | 285 | 344 | ||||||
5.600%, 07/15/2041 | 2,160 | 2,093 | ||||||
4.750%, 05/15/2042 | 2,790 | 2,491 | ||||||
Ecopetrol | ||||||||
5.875%, 05/28/2045 | 2,050 | 1,678 | ||||||
El Paso Natural Gas | ||||||||
8.375%, 06/15/2032 | 475 | 577 | ||||||
7.500%, 11/15/2026 | 2,145 | 2,488 | ||||||
Encana | ||||||||
6.500%, 02/01/2038 | 3,350 | 3,420 | ||||||
Energy Transfer Partners | ||||||||
8.250%, 11/15/2029 | 1,825 | 2,208 | ||||||
6.125%, 12/15/2045 | 2,493 | 2,515 | ||||||
5.950%, 10/01/2043 | 2,995 | 2,951 | ||||||
5.150%, 02/01/2043 | 1,000 | 896 | ||||||
5.150%, 03/15/2045 | 884 | 797 | ||||||
4.900%, 03/15/2035 | 1,000 | 910 | ||||||
Eni | ||||||||
5.700%, 10/01/2040 (A) | 2,930 | 2,915 | ||||||
Enterprise Products Operating LLC | ||||||||
6.650%, 10/15/2034 | 2,140 | 2,455 | ||||||
6.125%, 10/15/2039 | 360 | 400 | ||||||
5.700%, 02/15/2042 | 1,870 | 1,981 | ||||||
5.100%, 02/15/2045 | 2,775 | 2,755 | ||||||
4.950%, 10/15/2054 | 1,130 | 1,039 | ||||||
4.900%, 05/15/2046 | 3,610 | 3,496 | ||||||
4.850%, 03/15/2044 | 1,955 | 1,864 | ||||||
4.450%, 02/15/2043 | 2,780 | 2,535 | ||||||
Exxon Mobil | ||||||||
3.567%, 03/06/2045 | 1,555 | 1,420 | ||||||
Halliburton | ||||||||
5.000%, 11/15/2045 | 850 | 867 | ||||||
4.850%, 11/15/2035 | 750 | 764 | ||||||
Hess | ||||||||
5.600%, 02/15/2041 | 1,960 | 1,816 | ||||||
Kinder Morgan | ||||||||
5.550%, 06/01/2045 | 1,830 | 1,809 | ||||||
5.300%, 12/01/2034 | 4,891 | 4,802 | ||||||
Kinder Morgan Energy Partners | ||||||||
6.375%, 03/01/2041 | 2,414 | 2,479 | ||||||
5.500%, 03/01/2044 | 145 | 140 | ||||||
Lasmo | ||||||||
7.300%, 11/15/2027 | 3,255 | 3,922 | ||||||
Marathon Oil | ||||||||
6.600%, 10/01/2037 | 2,435 | 2,458 | ||||||
5.200%, 06/01/2045 | 1,475 | 1,290 | ||||||
| Description | Face Amount ($ Thousands) | Market Value ($ Thousands) | ||||||
Marathon Petroleum | ||||||||
6.500%, 03/01/2041 | $ | 1,823 | $ | 1,844 | ||||
4.750%, 09/15/2044 | 2,553 | 2,092 | ||||||
Motiva Enterprises | ||||||||
6.850%, 01/15/2040 (A) | 2,755 | 3,241 | ||||||
Nexen Energy ULC | ||||||||
7.400%, 05/01/2028 | 1,605 | 2,048 | ||||||
Noble Energy | ||||||||
5.250%, 11/15/2043 | 4,390 | 4,273 | ||||||
5.050%, 11/15/2044 | 3,560 | 3,384 | ||||||
Panhandle Eastern Pipeline | ||||||||
8.125%, 06/01/2019 | 725 | 800 | ||||||
Petro-Canada | ||||||||
7.875%, 06/15/2026 | 45 | 56 | ||||||
6.800%, 05/15/2038 | 1,510 | 1,880 | ||||||
Petroleos Mexicanos | ||||||||
6.500%, 06/02/2041 | 3,280 | 2,887 | ||||||
6.375%, 01/23/2045 | 8,330 | 7,070 | ||||||
5.500%, 06/27/2044 | 470 | 364 | ||||||
Petroleos Mexicanos MTN | ||||||||
6.875%, 08/04/2026 (A) | 1,310 | 1,341 | ||||||
6.750%, 09/21/2047 (A) | 2,578 | 2,261 | ||||||
5.625%, 01/23/2046 | 1,840 | 1,430 | ||||||
Phillips 66 | ||||||||
5.875%, 05/01/2042 | 1,860 | 2,152 | ||||||
4.875%, 11/15/2044 | 4,560 | 4,694 | ||||||
Phillips 66 Partners | ||||||||
4.900%, 10/01/2046 | 2,409 | 2,252 | ||||||
Schlumberger Holdings | ||||||||
4.000%, 12/21/2025 (A) | 2,800 | 2,898 | ||||||
Shell International Finance | ||||||||
6.375%, 12/15/2038 | 2,427 | 3,070 | ||||||
4.550%, 08/12/2043 | 6,405 | 6,445 | ||||||
4.375%, 05/11/2045 | 1,365 | 1,346 | ||||||
4.125%, 05/11/2035 | 1,905 | 1,894 | ||||||
4.000%, 05/10/2046 | 3,110 | 2,886 | ||||||
Southern Natural Gas | ||||||||
7.350%, 02/15/2031 | 1,223 | 1,411 | ||||||
Spectra Energy Capital | ||||||||
6.750%, 02/15/2032 | 1,510 | 1,676 | ||||||
Statoil | ||||||||
6.800%, 01/15/2028 | 150 | 193 | ||||||
6.500%, 12/01/2028 (A) | 1,140 | 1,414 | ||||||
4.800%, 11/08/2043 | 455 | 487 | ||||||
3.950%, 05/15/2043 | 1,875 | 1,749 | ||||||
Suncor Energy | ||||||||
6.500%, 06/15/2038 | 1,465 | 1,794 | ||||||
Sunoco Logistics Partners Operations | ||||||||
5.350%, 05/15/2045 | 1,375 | 1,282 | ||||||
5.300%, 04/01/2044 | 1,750 | 1,634 | ||||||
TC PipeLines | ||||||||
4.375%, 03/13/2025 | 1,000 | 994 | ||||||
| 134 | SEI Institutional Investments Trust / Semi-Annual Report / November 30, 2016 |
| Description | Face Amount ($ Thousands) | Market Value ($ Thousands) | ||||||
Tennessee Gas Pipeline | ||||||||
8.375%, 06/15/2032 | $ | 2,705 | $ | 3,270 | ||||
7.000%, 10/15/2028 | 6,662 | 7,734 | ||||||
Texas Eastern Transmission | ||||||||
7.000%, 07/15/2032 | 2,010 | 2,406 | ||||||
TransCanada PipeLines | ||||||||
7.250%, 08/15/2038 | 1,395 | 1,871 | ||||||
4.625%, 03/01/2034 | 5,930 | 6,266 | ||||||
Transcontinental Gas Pipe Line | ||||||||
7.250%, 12/01/2026 | 1,450 | 1,696 | ||||||
5.400%, 08/15/2041 | 1,695 | 1,652 | ||||||
4.450%, 08/01/2042 | 1,075 | 937 | ||||||
Transcontinental Gas Pipe Line LLC | ||||||||
7.850%, 02/01/2026 (A) | 2,690 | 3,354 | ||||||
Valero Energy | ||||||||
10.500%, 03/15/2039 | 3,312 | 4,937 | ||||||
Williams Partners | ||||||||
4.300%, 03/04/2024 | 3,000 | 2,987 | ||||||
|
| |||||||
| 220,342 | ||||||||
|
| |||||||
Financials — 13.8% | ||||||||
Aflac | ||||||||
6.900%, 12/17/2039 | 1,423 | 1,868 | ||||||
AIG SunAmerica Global Financing X | ||||||||
6.900%, 03/15/2032 (A) | 2,412 | 3,056 | ||||||
American International Group | ||||||||
4.700%, 07/10/2035 | 485 | 502 | ||||||
4.500%, 07/16/2044 | 4,300 | 4,176 | ||||||
3.875%, 01/15/2035 | 3,857 | 3,602 | ||||||
Bank of America | ||||||||
6.110%, 01/29/2037 | 2,405 | 2,816 | ||||||
6.000%, 10/15/2036 | 5,225 | 6,255 | ||||||
5.750%, 12/01/2017 | 5,750 | 5,974 | ||||||
Bank of America MTN | ||||||||
8.950%, 05/18/2017 (C) | 1,340 | 1,276 | ||||||
8.633%, 05/02/2017 (C) | 1,305 | 1,241 | ||||||
5.875%, 02/07/2042 | 1,470 | 1,770 | ||||||
5.000%, 01/21/2044 | 2,250 | 2,438 | ||||||
4.875%, 04/01/2044 | 1,770 | 1,898 | ||||||
4.450%, 03/03/2026 | 140 | 144 | ||||||
4.100%, 07/24/2023 | 5,180 | 5,401 | ||||||
4.000%, 01/22/2025 | 225 | 225 | ||||||
3.300%, 01/11/2023 | 725 | 725 | ||||||
3.248%, 10/21/2027 | 2,265 | 2,158 | ||||||
Berkshire Hathaway | ||||||||
4.500%, 02/11/2043 | 1,858 | 1,964 | ||||||
Berkshire Hathaway Finance | ||||||||
4.400%, 05/15/2042 | 1,300 | 1,346 | ||||||
Blackstone Holdings Finance LLC | ||||||||
6.250%, 08/15/2042 (A) | 5,042 | 5,796 | ||||||
Carlyle Holdings II Finance LLC | ||||||||
5.625%, 03/30/2043 (A) | 4,975 | 4,912 | ||||||
| Description | Face Amount ($ Thousands) | Market Value ($ Thousands) | ||||||
CDP Financial | ||||||||
5.600%, 11/25/2039 (A) | $ | 2,331 | $ | 2,884 | ||||
Chubb | ||||||||
6.500%, 05/15/2038 | 1,174 | 1,564 | ||||||
Chubb INA Holdings | ||||||||
6.700%, 05/15/2036 | 1,527 | 2,027 | ||||||
Cincinnati Financial | ||||||||
6.920%, 05/15/2028 | 4,484 | 5,598 | ||||||
Citigroup | ||||||||
8.125%, 07/15/2039 | 1,131 | 1,662 | ||||||
6.875%, 02/15/2098 | 2,461 | 3,153 | ||||||
6.625%, 06/15/2032 | 2,070 | 2,483 | ||||||
5.875%, 01/30/2042 | 360 | 427 | ||||||
4.750%, 05/18/2046 | 3,305 | 3,263 | ||||||
4.600%, 03/09/2026 | 1,000 | 1,031 | ||||||
4.450%, 09/29/2027 | 1,390 | 1,409 | ||||||
4.400%, 06/10/2025 | 3,015 | 3,080 | ||||||
4.125%, 07/25/2028 | 4,530 | 4,443 | ||||||
3.200%, 10/21/2026 | 4,045 | 3,877 | ||||||
1.480%, 08/25/2036 (C) | 850 | 636 | ||||||
Cooperatieve Rabobank UA MTN | ||||||||
5.250%, 05/24/2041 | 2,632 | 3,041 | ||||||
Cooperatieve Rabobank UA | ||||||||
5.800%, 09/30/2110 (A) | 2,401 | 2,683 | ||||||
Devon OEI Operating | ||||||||
7.500%, 09/15/2027 | 1,160 | 1,354 | ||||||
Discover Bank | ||||||||
8.700%, 11/18/2019 | 1,014 | 1,164 | ||||||
Discover Financial Services | ||||||||
3.850%, 11/21/2022 | 3,261 | 3,302 | ||||||
Farmers Exchange Capital | ||||||||
7.200%, 07/15/2048 (A) | 1,000 | 1,124 | ||||||
Farmers Exchange Capital II | ||||||||
6.151%, 11/01/2053 (A) (C) | 7,040 | 7,207 | ||||||
FMR | ||||||||
5.150%, 02/01/2043 (A) | 2,750 | 2,856 | ||||||
General Electric MTN | ||||||||
5.875%, 01/14/2038 | 5,734 | 7,179 | ||||||
General Electric Capital MTN | ||||||||
1.386%, 08/15/2036 (C) | 1,250 | 1,067 | ||||||
Goldman Sachs Group MTN | ||||||||
4.800%, 07/08/2044 | 2,305 | 2,392 | ||||||
Goldman Sachs Group | ||||||||
6.750%, 10/01/2037 | 8,820 | 10,869 | ||||||
6.250%, 02/01/2041 | 6,934 | 8,526 | ||||||
6.125%, 02/15/2033 | 6,380 | 7,639 | ||||||
5.150%, 05/22/2045 | 1,945 | 2,003 | ||||||
4.750%, 10/21/2045 | 2,475 | 2,586 | ||||||
3.500%, 11/16/2026 | 1,590 | 1,562 | ||||||
Guardian Life Insurance of America | ||||||||
4.875%, 06/19/2064 (A) | 5,845 | 5,710 | ||||||
| SEI Institutional Investments Trust / Semi-Annual Report / November 30, 2016 | 135 |
SCHEDULE OF INVESTMENTS (Unaudited)
Long Duration Fund (Continued)
November 30, 2016
| Description | Face Amount ($ Thousands) | Market Value ($ Thousands) | ||||||
Hartford Financial Services Group | ||||||||
6.625%, 03/30/2040 | $ | 725 | $ | 879 | ||||
HBOS MTN | ||||||||
6.750%, 05/21/2018 (A) | 4,050 | 4,285 | ||||||
HSBC Bank USA | ||||||||
7.000%, 01/15/2039 | 955 | 1,222 | ||||||
HSBC Bank USA MTN | ||||||||
5.625%, 08/15/2035 | 780 | 877 | ||||||
HSBC Holdings | ||||||||
6.500%, 09/15/2037 | 4,060 | 4,869 | ||||||
5.250%, 03/14/2044 | 2,175 | 2,298 | ||||||
International Lease Finance | ||||||||
7.125%, 09/01/2018 (A) | 95 | 103 | ||||||
JPMorgan Chase | ||||||||
6.300%, 04/23/2019 | 1,775 | 1,948 | ||||||
5.600%, 07/15/2041 | 4,505 | 5,311 | ||||||
4.950%, 06/01/2045 | 1,055 | 1,119 | ||||||
4.250%, 10/01/2027 | 920 | 945 | ||||||
3.900%, 07/15/2025 | 2,200 | 2,270 | ||||||
3.875%, 09/10/2024 | 2,000 | 2,024 | ||||||
3.625%, 12/01/2027 | 1,295 | 1,261 | ||||||
3.300%, 04/01/2026 | 1,410 | 1,387 | ||||||
3.200%, 06/15/2026 | 1,270 | 1,237 | ||||||
KKR Group Finance II | ||||||||
5.500%, 02/01/2043 (A) | 8,552 | 8,378 | ||||||
Liberty Mutual Group | ||||||||
6.500%, 03/15/2035 (A) | 265 | 316 | ||||||
6.500%, 05/01/2042 (A) | 5,443 | 6,436 | ||||||
Marsh & McLennan | ||||||||
3.500%, 06/03/2024 | 1,635 | 1,670 | ||||||
Massachusetts Mutual Life Insurance | ||||||||
8.875%, 06/01/2039 (A) | 1,820 | 2,699 | ||||||
MetLife | ||||||||
6.400%, 12/15/2036 | 3,186 | 3,449 | ||||||
5.875%, 02/06/2041 | 1,240 | 1,478 | ||||||
4.875%, 11/13/2043 | 2,905 | 3,107 | ||||||
4.050%, 03/01/2045 | 2,431 | 2,320 | ||||||
Metropolitan Life Global Funding I | ||||||||
3.875%, 04/11/2022 (A) | 435 | 462 | ||||||
3.000%, 01/10/2023 (A) | 640 | 643 | ||||||
Metropolitan Life Insurance | ||||||||
7.800%, 11/01/2025 (A) | 3,520 | 4,462 | ||||||
Moody's | ||||||||
5.250%, 07/15/2044 | 6,899 | 7,549 | ||||||
Morgan Stanley MTN | ||||||||
6.375%, 07/24/2042 | 2,699 | 3,461 | ||||||
6.250%, 08/09/2026 | 4,210 | 5,038 | ||||||
5.625%, 09/23/2019 | 5,775 | 6,276 | ||||||
4.350%, 09/08/2026 | 345 | 353 | ||||||
4.300%, 01/27/2045 | 3,915 | 3,877 | ||||||
3.875%, 04/29/2024 | 1,670 | 1,711 | ||||||
3.700%, 10/23/2024 | 1,410 | 1,428 | ||||||
| Description | Face Amount ($ Thousands) | Market Value ($ Thousands) | ||||||
Nationwide Mutual Insurance | ||||||||
4.950%, 04/22/2044 (A) | $ | 2,580 | $ | 2,528 | ||||
New York Life Insurance | ||||||||
6.750%, 11/15/2039 (A) | 4,410 | 5,817 | ||||||
5.875%, 05/15/2033 (A) | 3,852 | 4,557 | ||||||
Northwestern Mutual Life Insurance | ||||||||
6.063%, 03/30/2040 (A) | 2,216 | 2,716 | ||||||
Prudential Financial MTN | ||||||||
5.800%, 11/16/2041 | 995 | 1,152 | ||||||
5.700%, 12/14/2036 | 3,607 | 4,160 | ||||||
Prudential Insurance of America | ||||||||
8.300%, 07/01/2025 (A) | 4,500 | 5,862 | ||||||
Raymond James Financial | ||||||||
4.950%, 07/15/2046 | 780 | 719 | ||||||
Santander UK Group Holdings | ||||||||
5.625%, 09/15/2045 (A) | 1,200 | 1,158 | ||||||
Teachers Insurance & Annuity Association of America | ||||||||
6.850%, 12/16/2039 (A) | 3,225 | 4,135 | ||||||
4.900%, 09/15/2044 (A) | 2,780 | 2,968 | ||||||
UBS Group Funding Jersey | ||||||||
4.125%, 09/24/2025 (A) | 1,665 | 1,679 | ||||||
Ventas Realty | ||||||||
5.700%, 09/30/2043 | 5,465 | 6,073 | ||||||
4.375%, 02/01/2045 | 3,750 | 3,489 | ||||||
VEREIT Operating Partnership | ||||||||
4.600%, 02/06/2024 | 4,150 | 4,239 | ||||||
WEA Finance LLC | ||||||||
4.750%, 09/17/2044 (A) | 1,395 | 1,378 | ||||||
Wells Fargo | ||||||||
3.000%, 04/22/2026 | 1,295 | 1,243 | ||||||
3.000%, 10/23/2026 | 1,275 | 1,220 | ||||||
Wells Fargo MTN | ||||||||
4.900%, 11/17/2045 | 430 | 444 | ||||||
4.650%, 11/04/2044 | 2,670 | 2,662 | ||||||
4.400%, 06/14/2046 | 2,195 | 2,115 | ||||||
4.300%, 07/22/2027 | 795 | 822 | ||||||
Wells Fargo Bank | ||||||||
6.000%, 11/15/2017 | 300 | 312 | ||||||
5.950%, 08/26/2036 | 1,000 | 1,190 | ||||||
5.850%, 02/01/2037 | 5,620 | 6,587 | ||||||
Welltower | ||||||||
5.125%, 03/15/2043 | 6,564 | 6,730 | ||||||
4.250%, 04/01/2026 | 960 | 992 | ||||||
|
| |||||||
| 343,439 | ||||||||
|
| |||||||
Health Care — 8.1% | ||||||||
Abbott Laboratories | ||||||||
4.900%, 11/30/2046 | 6,570 | 6,626 | ||||||
AbbVie | ||||||||
4.700%, 05/14/2045 | 5,880 | 5,769 | ||||||
4.500%, 05/14/2035 | 2,905 | 2,841 | ||||||
| 136 | SEI Institutional Investments Trust / Semi-Annual Report / November 30, 2016 |
| Description | Face Amount ($ Thousands) | Market Value ($ Thousands) | ||||||
4.450%, 05/14/2046 | $ | 845 | $ | 793 | ||||
4.400%, 11/06/2042 | 1,670 | 1,567 | ||||||
4.300%, 05/14/2036 | 600 | 572 | ||||||
Actavis | ||||||||
4.625%, 10/01/2042 | 1,790 | 1,724 | ||||||
Actavis Funding SCS | ||||||||
4.750%, 03/15/2045 | 4,285 | 4,239 | ||||||
4.550%, 03/15/2035 | 2,545 | 2,508 | ||||||
3.850%, 06/15/2024 | 2,160 | 2,185 | ||||||
Aetna | ||||||||
4.750%, 03/15/2044 | 1,220 | 1,264 | ||||||
4.375%, 06/15/2046 | 3,520 | 3,469 | ||||||
4.250%, 06/15/2036 | 4,905 | 4,872 | ||||||
Amgen | ||||||||
4.950%, 10/01/2041 | 825 | 844 | ||||||
4.663%, 06/15/2051 (A) | 2,830 | 2,745 | ||||||
4.563%, 06/15/2048 (A) | 5,889 | 5,699 | ||||||
4.400%, 05/01/2045 | 2,520 | 2,406 | ||||||
Anthem | ||||||||
5.100%, 01/15/2044 | 845 | 886 | ||||||
4.650%, 01/15/2043 | 1,080 | 1,075 | ||||||
4.650%, 08/15/2044 | 250 | 249 | ||||||
3.500%, 08/15/2024 | 4,360 | 4,355 | ||||||
AstraZeneca | ||||||||
6.450%, 09/15/2037 | 3,107 | 4,006 | ||||||
Baxalta | ||||||||
5.250%, 06/23/2045 | 1,240 | 1,310 | ||||||
Becton Dickinson | ||||||||
4.875%, 05/15/2044 | 400 | 413 | ||||||
4.685%, 12/15/2044 | 1,630 | 1,672 | ||||||
3.875%, 05/15/2024 | 1,750 | 1,807 | ||||||
Biogen | ||||||||
5.200%, 09/15/2045 | 1,280 | 1,368 | ||||||
4.050%, 09/15/2025 | 735 | 757 | ||||||
Cardinal Health | ||||||||
4.900%, 09/15/2045 | 925 | 974 | ||||||
4.500%, 11/15/2044 | 1,830 | 1,787 | ||||||
Celgene | ||||||||
5.000%, 08/15/2045 | 1,450 | 1,499 | ||||||
4.625%, 05/15/2044 | 3,600 | 3,511 | ||||||
Cleveland Clinic Foundation | ||||||||
4.858%, 01/01/2114 | 2,799 | 2,702 | ||||||
EMD Finance LLC | ||||||||
3.250%, 03/19/2025 (A) | 3,690 | 3,620 | ||||||
Express Scripts Holding | ||||||||
4.800%, 07/15/2046 | 6,449 | 6,181 | ||||||
3.400%, 03/01/2027 | 850 | 805 | ||||||
Gilead Sciences | ||||||||
4.800%, 04/01/2044 | 2,460 | 2,534 | ||||||
4.750%, 03/01/2046 | 2,950 | 3,032 | ||||||
4.600%, 09/01/2035 | 1,845 | 1,898 | ||||||
4.500%, 02/01/2045 | 3,545 | 3,500 | ||||||
| Description | Face Amount ($ Thousands) | Market Value ($ Thousands) | ||||||
4.150%, 03/01/2047 | $ | 3,475 | $ | 3,254 | ||||
GlaxoSmithKline Capital | ||||||||
6.375%, 05/15/2038 | 1,175 | 1,546 | ||||||
Hartford HealthCare | ||||||||
5.746%, 04/01/2044 | 4,200 | 4,842 | ||||||
Highmark | ||||||||
6.125%, 05/15/2041 (A) | 3,705 | 3,397 | ||||||
Humana | ||||||||
4.950%, 10/01/2044 | 3,065 | 3,137 | ||||||
4.625%, 12/01/2042 | 385 | 371 | ||||||
Johnson & Johnson | ||||||||
4.500%, 12/05/2043 | 759 | 853 | ||||||
Medtronic | ||||||||
4.625%, 03/15/2045 | 7,679 | 8,151 | ||||||
4.375%, 03/15/2035 | 4,422 | 4,588 | ||||||
Merck | ||||||||
4.150%, 05/18/2043 | 3,895 | 3,954 | ||||||
3.600%, 09/15/2042 | 1,595 | 1,498 | ||||||
Merck Sharp & Dohme MTN | ||||||||
5.760%, 05/03/2037 | 2,236 | 2,714 | ||||||
New York and Presbyterian Hospital | ||||||||
4.763%, 08/01/2116 | 2,248 | 2,120 | ||||||
4.063%, 08/01/2056 | 2,375 | 2,271 | ||||||
North Shore-Long Island Jewish Health Care | ||||||||
4.800%, 11/01/2042 | 4,615 | 4,691 | ||||||
Novartis Capital | ||||||||
4.400%, 05/06/2044 | 3,815 | 4,097 | ||||||
NYU Hospitals Center | ||||||||
5.750%, 07/01/2043 | 710 | 831 | ||||||
4.428%, 07/01/2042 | 4,230 | 4,063 | ||||||
Pfizer | ||||||||
4.400%, 05/15/2044 | 1,280 | 1,335 | ||||||
4.125%, 12/15/2046 | 1,900 | 1,900 | ||||||
4.000%, 12/15/2036 | 3,225 | 3,236 | ||||||
Providence St. Joseph Health Obligated Group | ||||||||
3.744%, 10/01/2047 | 765 | 711 | ||||||
Shire Acquisitions Investments Ireland DAC | ||||||||
3.200%, 09/23/2026 | 3,620 | 3,395 | ||||||
St. Barnabas | ||||||||
4.000%, 07/01/2028 | 4,375 | 4,364 | ||||||
Stryker | ||||||||
4.625%, 03/15/2046 | 1,885 | 1,880 | ||||||
4.100%, 04/01/2043 | 1,425 | 1,311 | ||||||
3.375%, 05/15/2024 | 1,145 | 1,150 | ||||||
Teva Pharmaceutical Finance Netherlands III | ||||||||
3.150%, 10/01/2026 | 1,830 | 1,688 | ||||||
Teva Pharmaceutical Finance Netherlands III BV | ||||||||
4.100%, 10/01/2046 | 6,803 | 5,895 | ||||||
Thermo Fisher Scientific | ||||||||
3.150%, 01/15/2023 | 3,020 | 3,001 | ||||||
| SEI Institutional Investments Trust / Semi-Annual Report / November 30, 2016 | 137 |
SCHEDULE OF INVESTMENTS (Unaudited)
Long Duration Fund (Continued)
November 30, 2016
| Description | Face Amount ($ Thousands) | Market Value ($ Thousands) | ||||||
Toledo Hospital | ||||||||
4.982%, 11/15/2045 | $ | 2,371 | $ | 2,611 | ||||
UnitedHealth Group | ||||||||
6.875%, 02/15/2038 | 2,010 | 2,714 | ||||||
6.625%, 11/15/2037 | 555 | 730 | ||||||
4.625%, 07/15/2035 | 1,265 | 1,364 | ||||||
Wyeth | ||||||||
6.000%, 02/15/2036 | 2,985 | 3,670 | ||||||
Wyeth LLC | ||||||||
5.950%, 04/01/2037 | 936 | 1,162 | ||||||
Zimmer Biomet Holdings | ||||||||
4.450%, 08/15/2045 | 1,670 | 1,575 | ||||||
|
| |||||||
| 200,134 | ||||||||
|
| |||||||
Industrials — 5.4% | ||||||||
American Airlines, Pass-Through Trust, Ser 2011-1, Cl A | ||||||||
5.250%, 01/31/2021 | 3 | 3 | ||||||
American Airlines, Pass-Through Trust, Ser 2013-2, Cl A | ||||||||
4.950%, 01/15/2023 | 639 | 685 | ||||||
American Airlines, Pass-Through Trust, Ser 2014-1, Cl A | ||||||||
3.700%, 10/01/2026 | 2,445 | 2,481 | ||||||
BAE Systems Holdings | ||||||||
4.750%, 10/07/2044 (A) | 6,620 | 6,696 | ||||||
BAE Systems PLC | ||||||||
5.800%, 10/11/2041 (A) | 1,145 | 1,296 | ||||||
Boeing | ||||||||
3.375%, 06/15/2046 | 3,470 | 3,150 | ||||||
Burlington Northern Santa Fe LLC | ||||||||
6.200%, 08/15/2036 | 3,150 | 4,014 | ||||||
6.150%, 05/01/2037 | 985 | 1,251 | ||||||
5.750%, 05/01/2040 | 555 | 667 | ||||||
5.150%, 09/01/2043 | 1,365 | 1,545 | ||||||
4.900%, 04/01/2044 | 1,920 | 2,114 | ||||||
4.400%, 03/15/2042 | 3,270 | 3,344 | ||||||
4.375%, 09/01/2042 | 1,430 | 1,457 | ||||||
Canadian Pacific Railway | ||||||||
6.125%, 09/15/2115 | 4,880 | 5,637 | ||||||
Caterpillar | ||||||||
4.750%, 05/15/2064 | 2,765 | 2,905 | ||||||
3.803%, 08/15/2042 | 1,220 | 1,179 | ||||||
Continental Airlines, Pass-Through Trust, Ser 2007-1, Cl A | ||||||||
5.983%, 04/19/2022 | 4,458 | 4,904 | ||||||
CSX | ||||||||
4.750%, 05/30/2042 | 3,410 | 3,499 | ||||||
Deere | ||||||||
3.900%, 06/09/2042 | 2,220 | 2,230 | ||||||
| Description | Face Amount ($ Thousands) | Market Value ($ Thousands) | ||||||
Delta Air Lines, Pass-Through Trust, Ser 2011-1, Cl A | ||||||||
5.300%, 04/15/2019 | $ | 5 | $ | 5 | ||||
FedEx | ||||||||
7.600%, 07/01/2097 | 2,095 | 2,581 | ||||||
5.100%, 01/15/2044 | 275 | 294 | ||||||
4.100%, 02/01/2045 | 275 | 255 | ||||||
4.000%, 01/15/2024 | 515 | 546 | ||||||
3.900%, 02/01/2035 | 700 | 663 | ||||||
3.875%, 08/01/2042 | 2,715 | 2,447 | ||||||
Fortive | ||||||||
4.300%, 06/15/2046 (A) | 1,595 | 1,540 | ||||||
GE Capital International Funding Unlimited | ||||||||
4.418%, 11/15/2035 | 26,326 | 27,404 | ||||||
Lockheed Martin | ||||||||
4.700%, 05/15/2046 | 1,620 | 1,750 | ||||||
4.500%, 05/15/2036 | 565 | 600 | ||||||
4.070%, 12/15/2042 | 2,243 | 2,197 | ||||||
3.600%, 03/01/2035 | 4,155 | 3,952 | ||||||
Norfolk Southern | ||||||||
6.000%, 03/15/2105 | 3,403 | 3,678 | ||||||
6.000%, 05/23/2111 | 4,332 | 4,694 | ||||||
4.800%, 08/15/2043 | 1,410 | 1,495 | ||||||
4.450%, 06/15/2045 | 480 | 488 | ||||||
3.850%, 01/15/2024 | 2,115 | 2,210 | ||||||
Northrop Grumman | ||||||||
4.750%, 06/01/2043 | 4,330 | 4,644 | ||||||
Northwest Airlines, Pass-Through Trust, Ser 2001-1, Cl A1 | ||||||||
7.041%, 04/01/2022 | 219 | 252 | ||||||
Parker-Hannifin MTN | ||||||||
4.450%, 11/21/2044 | 1,145 | 1,233 | ||||||
Republic Services | ||||||||
2.900%, 07/01/2026 | 465 | 445 | ||||||
Siemens Financieringsmaatschappij 4.400%, 05/27/2045 (A) | 4,025 | 4,205 | ||||||
Union Pacific | ||||||||
4.050%, 03/01/2046 | 2,120 | 2,109 | ||||||
United Airlines, Pass-Through Trust, Ser 2014-2, Cl A | ||||||||
3.750%, 09/03/2026 | 3,147 | 3,210 | ||||||
United Technologies | ||||||||
5.700%, 04/15/2040 | 2,565 | 3,100 | ||||||
4.500%, 06/01/2042 | 3,985 | 4,218 | ||||||
3.750%, 11/01/2046 | 2,735 | 2,567 | ||||||
US Airways, Pass-Through Trust, Ser 2011-1A, Cl A | ||||||||
7.125%, 10/22/2023 | 1,392 | 1,601 | ||||||
WW Grainger | ||||||||
4.600%, 06/15/2045 | 1,170 | 1,242 | ||||||
|
| |||||||
| 134,682 | ||||||||
|
| |||||||
| 138 | SEI Institutional Investments Trust / Semi-Annual Report / November 30, 2016 |
| Description | Face Amount ($ Thousands) | Market Value ($ Thousands) | ||||||
Information Technology — 3.0% |
| |||||||
Analog Devices | ||||||||
3.900%, 12/15/2025 | $ | 875 | $ | 899 | ||||
Apple | ||||||||
4.650%, 02/23/2046 | 160 | 169 | ||||||
4.500%, 02/23/2036 | 2,110 | 2,244 | ||||||
4.450%, 05/06/2044 | 1,150 | 1,165 | ||||||
4.375%, 05/13/2045 | 7,500 | 7,669 | ||||||
3.850%, 08/04/2046 | 1,170 | 1,095 | ||||||
Cisco Systems | ||||||||
5.900%, 02/15/2039 | 2,620 | 3,305 | ||||||
Diamond 1 Finance | ||||||||
8.350%, 07/15/2046 (A) | 1,760 | 2,064 | ||||||
Hewlett Packard Enterprise | ||||||||
6.600%, 10/15/2045 (A) | 3,774 | 3,721 | ||||||
Intel | ||||||||
4.900%, 07/29/2045 | 3,995 | 4,449 | ||||||
4.800%, 10/01/2041 | 1,755 | 1,917 | ||||||
4.000%, 12/15/2032 | 655 | 662 | ||||||
Juniper Networks | ||||||||
5.950%, 03/15/2041 | 4,430 | 4,436 | ||||||
Microsoft | ||||||||
4.875%, 12/15/2043 | 3,822 | 4,207 | ||||||
4.750%, 11/03/2055 | 1,135 | 1,213 | ||||||
4.000%, 02/12/2055 | 5,346 | 4,951 | ||||||
3.950%, 08/08/2056 | 1,685 | 1,567 | ||||||
3.750%, 02/12/2045 | 1,000 | 939 | ||||||
3.700%, 08/08/2046 | 5,490 | 5,110 | ||||||
3.500%, 02/12/2035 | 720 | 689 | ||||||
3.450%, 08/08/2036 | 2,160 | 2,038 | ||||||
Oracle | ||||||||
4.500%, 07/08/2044 | 1,805 | 1,843 | ||||||
4.375%, 05/15/2055 | 4,180 | 4,080 | ||||||
4.300%, 07/08/2034 | 4,860 | 5,000 | ||||||
4.125%, 05/15/2045 | 870 | 840 | ||||||
4.000%, 07/15/2046 | 1,585 | 1,503 | ||||||
Visa | ||||||||
4.300%, 12/14/2045 | 3,215 | 3,355 | ||||||
4.150%, 12/14/2035 | 3,275 | 3,407 | ||||||
|
| |||||||
| 74,537 | ||||||||
|
| |||||||
Materials — 1.9% | ||||||||
Air Liquide Finance | ||||||||
2.500%, 09/27/2026 (A) | 1,310 | 1,232 | ||||||
Amcor Finance USA | ||||||||
3.625%, 04/28/2026 (A) | 1,250 | 1,217 | ||||||
Barrick North America Finance LLC | ||||||||
5.750%, 05/01/2043 | 2,140 | 2,277 | ||||||
BHP Billiton Finance USA | ||||||||
5.000%, 09/30/2043 | 2,420 | 2,694 | ||||||
Dow Chemical | ||||||||
4.625%, 10/01/2044 | 1,000 | 985 | ||||||
| Description | Face Amount ($ Thousands) | Market Value ($ Thousands) | ||||||
4.375%, 11/15/2042 | $ | 5,245 | $ | 5,044 | ||||
4.250%, 10/01/2034 | 2,110 | 2,045 | ||||||
Eastman Chemical | ||||||||
4.650%, 10/15/2044 | 1,305 | 1,262 | ||||||
Glencore Finance Canada | ||||||||
6.000%, 11/15/2041 (A) | 5,144 | 4,990 | ||||||
International Paper | ||||||||
5.150%, 05/15/2046 | 1,290 | 1,302 | ||||||
LYB International Finance | ||||||||
4.875%, 03/15/2044 | 2,575 | 2,637 | ||||||
LyondellBasell Industries | ||||||||
4.625%, 02/26/2055 | 1,000 | 902 | ||||||
Monsanto | ||||||||
4.200%, 07/15/2034 | 745 | 706 | ||||||
3.950%, 04/15/2045 | 500 | 436 | ||||||
Nacional del Cobre de Chile | ||||||||
4.875%, 11/04/2044 (A) | 2,355 | 2,240 | ||||||
4.250%, 07/17/2042 (A) | 1,845 | 1,610 | ||||||
Newcrest Finance | ||||||||
5.750%, 11/15/2041 (A) | 2,530 | 2,432 | ||||||
Newmont Mining | ||||||||
6.250%, 10/01/2039 | 1,135 | 1,255 | ||||||
5.875%, 04/01/2035 | 355 | 387 | ||||||
4.875%, 03/15/2042 | 2,280 | 2,176 | ||||||
Rio Tinto Finance USA | ||||||||
4.125%, 08/21/2042 | 120 | 117 | ||||||
Rohm & Haas | ||||||||
7.850%, 07/15/2029 | 3,710 | 4,996 | ||||||
Southern Copper | ||||||||
7.500%, 07/27/2035 | 2,974 | 3,413 | ||||||
5.875%, 04/23/2045 | 1,500 | 1,431 | ||||||
|
| |||||||
| 47,786 | ||||||||
|
| |||||||
Real Estate — 1.1% | ||||||||
Alexandria Real Estate Equities | ||||||||
3.900%, 06/15/2023 | 3,050 | 3,094 | ||||||
AvalonBay Communities MTN | ||||||||
3.900%, 10/15/2046 | 1,855 | 1,705 | ||||||
Boston Properties | ||||||||
2.750%, 10/01/2026 | 3,180 | 2,934 | ||||||
HCP | ||||||||
6.750%, 02/01/2041 | 970 | 1,117 | ||||||
4.250%, 11/15/2023 | 4,370 | 4,460 | ||||||
Healthcare Realty Trust | ||||||||
5.750%, 01/15/2021 | 525 | 580 | ||||||
Healthcare Trust of America Holdings | ||||||||
3.500%, 08/01/2026 | 1,740 | 1,664 | ||||||
Kimco Realty | ||||||||
4.125%, 12/01/2046 | 1,900 | 1,783 | ||||||
Nationwide Health Properties MTN | ||||||||
6.590%, 07/07/2038 | 1,310 | 1,482 | ||||||
| SEI Institutional Investments Trust / Semi-Annual Report / November 30, 2016 | 139 |
SCHEDULE OF INVESTMENTS (Unaudited)
Long Duration Fund (Continued)
November 30, 2016
| Description | Face Amount ($ Thousands) | Market Value ($ Thousands) | ||||||
Simon Property Group | ||||||||
6.750%, 02/01/2040 | $ | 1,634 | $ | 2,188 | ||||
4.750%, 03/15/2042 | 1,385 | 1,472 | ||||||
4.250%, 11/30/2046 | 1,708 | 1,676 | ||||||
SL Green Realty | ||||||||
7.750%, 03/15/2020 | 775 | 879 | ||||||
5.000%, 08/15/2018 | 1,000 | 1,038 | ||||||
|
| |||||||
| 26,072 | ||||||||
|
| |||||||
Telecommunication Services — 4.7% |
| |||||||
America Movil | ||||||||
6.375%, 03/01/2035 | 480 | 550 | ||||||
4.375%, 07/16/2042 | 2,805 | 2,546 | ||||||
AT&T | ||||||||
6.000%, 08/15/2040 | 4,845 | 5,329 | ||||||
5.550%, 08/15/2041 | 3,020 | 3,128 | ||||||
5.350%, 09/01/2040 | 1,588 | 1,603 | ||||||
4.800%, 06/15/2044 | 6,703 | 6,282 | ||||||
4.750%, 05/15/2046 | 2,986 | 2,789 | ||||||
4.550%, 03/09/2049 (A) | 2,645 | 2,362 | ||||||
4.500%, 05/15/2035 | 8,280 | 7,851 | ||||||
4.500%, 03/09/2048 (A) | 6,703 | 5,972 | ||||||
4.350%, 06/15/2045 | 9,080 | 7,961 | ||||||
British Telecommunications | ||||||||
9.625%, 12/15/2030 | 2,070 | 3,152 | ||||||
Deutsche Telekom International Finance | ||||||||
8.750%, 06/15/2030 | 610 | 890 | ||||||
4.875%, 03/06/2042 (A) | 1,255 | 1,333 | ||||||
Koninklijke | ||||||||
8.375%, 10/01/2030 | 1,620 | 2,142 | ||||||
Rogers Communications | ||||||||
5.000%, 03/15/2044 | 2,010 | 2,119 | ||||||
SES GLOBAL Americas Holdings GP | ||||||||
5.300%, 03/25/2044 (A) | 6,578 | 5,657 | ||||||
Verizon Communications | ||||||||
6.400%, 09/15/2033 | 86 | 103 | ||||||
6.250%, 04/01/2037 | 760 | 890 | ||||||
6.000%, 04/01/2041 | 1,500 | 1,729 | ||||||
5.850%, 09/15/2035 | 69 | 78 | ||||||
5.050%, 03/15/2034 | 4,175 | 4,367 | ||||||
5.012%, 08/21/2054 | 7,888 | 7,807 | ||||||
4.862%, 08/21/2046 | 7,128 | 7,147 | ||||||
4.750%, 11/01/2041 | 825 | 806 | ||||||
4.672%, 03/15/2055 | 10,780 | 10,056 | ||||||
4.522%, 09/15/2048 | 10,133 | 9,662 | ||||||
4.400%, 11/01/2034 | 3,000 | 2,922 | ||||||
4.272%, 01/15/2036 | 4,385 | 4,190 | ||||||
3.850%, 11/01/2042 | 3,450 | 2,982 | ||||||
Vodafone Group | ||||||||
4.375%, 02/19/2043 | 1,520 | 1,356 | ||||||
|
| |||||||
| 115,761 | ||||||||
|
| |||||||
| Description | Face Amount ($ Thousands) | Market Value ($ Thousands) | ||||||
Utilities — 9.8% | ||||||||
AEP Texas Central | ||||||||
3.850%, 10/01/2025 (A) | $ | 1,000 | $ | 1,029 | ||||
Appalachian Power | ||||||||
4.450%, 06/01/2045 | 560 | 566 | ||||||
Baltimore Gas & Electric | ||||||||
5.200%, 06/15/2033 | 3,178 | 3,476 | ||||||
Berkshire Hathaway Energy | ||||||||
6.500%, 09/15/2037 | 1,715 | 2,197 | ||||||
6.125%, 04/01/2036 | 6,910 | 8,592 | ||||||
5.150%, 11/15/2043 | 2,250 | 2,506 | ||||||
Black Hills | ||||||||
4.200%, 09/15/2046 | 500 | 476 | ||||||
Bruce Mansfield Unit 1 2007 Pass-Through Trust | ||||||||
6.850%, 06/01/2034 | 1,279 | 403 | ||||||
CenterPoint Energy Resources | ||||||||
6.250%, 02/01/2037 | 2,991 | 3,427 | ||||||
Commonwealth Edison | ||||||||
3.700%, 03/01/2045 | 3,149 | 2,966 | ||||||
Consolidated Edison of New York | ||||||||
6.750%, 04/01/2038 | 1,725 | 2,291 | ||||||
6.300%, 08/15/2037 | 1,440 | 1,830 | ||||||
4.450%, 03/15/2044 | 2,000 | 2,084 | ||||||
Dominion Resources | ||||||||
5.250%, 08/01/2033 | 3,830 | 4,083 | ||||||
4.900%, 08/01/2041 | 2,715 | 2,805 | ||||||
Duke Energy | ||||||||
3.750%, 04/15/2024 | 535 | 549 | ||||||
3.050%, 08/15/2022 | 1,420 | 1,436 | ||||||
Duke Energy Carolinas | ||||||||
6.100%, 06/01/2037 | 3,090 | 3,808 | ||||||
4.000%, 09/30/2042 | 1,890 | 1,857 | ||||||
Duke Energy Carolinas LLC | ||||||||
5.300%, 02/15/2040 | 7,420 | 8,638 | ||||||
4.250%, 12/15/2041 | 1,500 | 1,525 | ||||||
3.875%, 03/15/2046 | 1,000 | 967 | ||||||
Duke Energy Florida | ||||||||
6.400%, 06/15/2038 | 450 | 587 | ||||||
6.350%, 09/15/2037 | 900 | 1,165 | ||||||
Duke Energy Indiana LLC | ||||||||
6.350%, 08/15/2038 | 800 | 1,030 | ||||||
4.900%, 07/15/2043 | 1,395 | 1,549 | ||||||
Duke Energy Progress LLC | ||||||||
4.375%, 03/30/2044 | 3,320 | 3,424 | ||||||
Duquesne Light Holdings | ||||||||
6.250%, 08/15/2035 | 3,125 | 3,316 | ||||||
5.900%, 12/01/2021 (A) | 750 | 841 | ||||||
Electricite de France | ||||||||
6.000%, 01/22/2114 (A) | 5,165 | 5,054 | ||||||
4.950%, 10/13/2045 (A) | 3,095 | 3,111 | ||||||
4.750%, 10/13/2035 (A) | 1,385 | 1,395 | ||||||
| 140 | SEI Institutional Investments Trust / Semi-Annual Report / November 30, 2016 |
| Description | Face Amount ($ Thousands) | Market Value ($ Thousands) | ||||||
Elm Road Generating Station Supercritical | ||||||||
5.848%, 01/19/2041 (A) | $ | 2,007 | $ | 2,176 | ||||
Entergy Louisiana | ||||||||
4.440%, 01/15/2026 | 2,990 | 3,156 | ||||||
Eversource Energy | ||||||||
2.800%, 05/01/2023 | 2,120 | 2,076 | ||||||
Exelon | ||||||||
5.625%, 06/15/2035 | 1,250 | 1,386 | ||||||
4.950%, 06/15/2035 | 2,800 | 2,939 | ||||||
Exelon Generation LLC | ||||||||
5.750%, 10/01/2041 | 4,531 | 4,231 | ||||||
5.600%, 06/15/2042 | 4,070 | 3,911 | ||||||
FirstEnergy Transmission LLC | ||||||||
5.450%, 07/15/2044 (A) | 2,670 | 2,815 | ||||||
Florida Power & Light | ||||||||
5.960%, 04/01/2039 | 2,920 | 3,716 | ||||||
5.690%, 03/01/2040 | 4,600 | 5,729 | ||||||
5.650%, 02/01/2037 | 2,500 | 3,036 | ||||||
5.400%, 09/01/2035 | 3,200 | 3,773 | ||||||
Georgia Power | ||||||||
5.950%, 02/01/2039 | 3,850 | 4,621 | ||||||
5.400%, 06/01/2040 | 5,780 | 6,494 | ||||||
4.300%, 03/15/2042 | 1,660 | 1,661 | ||||||
Indianapolis Power & Light | ||||||||
6.050%, 10/01/2036 (A) | 1,291 | 1,522 | ||||||
4.875%, 11/01/2041 (A) | 1,860 | 1,922 | ||||||
4.700%, 09/01/2045 (A) | 1,530 | 1,607 | ||||||
4.500%, 06/01/2044 (A) | 2,375 | 2,374 | ||||||
ITC Holdings | ||||||||
5.300%, 07/01/2043 | 1,970 | 2,103 | ||||||
3.250%, 06/30/2026 | 1,000 | 966 | ||||||
Jersey Central Power & Light | ||||||||
6.400%, 05/15/2036 | 1,425 | 1,579 | ||||||
KCP&L Greater Missouri Operations | ||||||||
8.270%, 11/15/2021 | 2,600 | 3,122 | ||||||
Kentucky Utilities | ||||||||
5.125%, 11/01/2040 | 1,835 | 2,096 | ||||||
KeySpan Gas East | ||||||||
5.819%, 04/01/2041 (A) | 7,485 | 8,784 | ||||||
Metropolitan Edison | ||||||||
7.700%, 01/15/2019 | 350 | 387 | ||||||
MidAmerican Energy MTN | ||||||||
5.800%, 10/15/2036 | 765 | 924 | ||||||
MidAmerican Energy | ||||||||
6.750%, 12/30/2031 | 720 | 973 | ||||||
4.800%, 09/15/2043 | 1,725 | 1,913 | ||||||
4.400%, 10/15/2044 | 1,450 | 1,525 | ||||||
MidAmerican Funding | ||||||||
6.927%, 03/01/2029 | 170 | 225 | ||||||
Monongahela Power | ||||||||
5.400%, 12/15/2043 (A) | 740 | 858 | ||||||
| Description | Face Amount ($ Thousands) | Market Value ($ Thousands) | ||||||
Narragansett Electric | ||||||||
4.170%, 12/10/2042 (A) | $ | 1,990 | $ | 1,938 | ||||
Niagara Mohawk Power | ||||||||
4.119%, 11/28/2042 (A) | 2,000 | 1,917 | ||||||
2.721%, 11/28/2022 (A) | 700 | 686 | ||||||
NiSource Finance | ||||||||
5.950%, 06/15/2041 | 545 | 635 | ||||||
Northern States Power | ||||||||
6.250%, 06/01/2036 | 1,813 | 2,354 | ||||||
5.350%, 11/01/2039 | 2,695 | 3,201 | ||||||
3.400%, 08/15/2042 | 920 | 842 | ||||||
NSTAR Electric | ||||||||
4.400%, 03/01/2044 | 655 | 682 | ||||||
Oncor Electric Delivery | ||||||||
7.500%, 09/01/2038 | 600 | 849 | ||||||
Oncor Electric Delivery LLC | ||||||||
5.300%, 06/01/2042 | 5,145 | 6,031 | ||||||
Pacific Gas & Electric | ||||||||
6.350%, 02/15/2038 | 1,000 | 1,282 | ||||||
6.250%, 03/01/2039 | 1,910 | 2,450 | ||||||
6.050%, 03/01/2034 | 4,540 | 5,648 | ||||||
4.600%, 06/15/2043 | 1,770 | 1,879 | ||||||
4.500%, 12/15/2041 | 1,660 | 1,731 | ||||||
PacifiCorp | ||||||||
6.000%, 01/15/2039 | 1,010 | 1,284 | ||||||
5.750%, 04/01/2037 | 2,972 | 3,585 | ||||||
Pennsylvania Electric | ||||||||
6.150%, 10/01/2038 | 2,690 | 3,006 | ||||||
Public Service Electric & Gas MTN | ||||||||
4.000%, 06/01/2044 | 1,000 | 1,013 | ||||||
Public Service of Colorado | ||||||||
6.500%, 08/01/2038 | 725 | 957 | ||||||
6.250%, 09/01/2037 | 1,500 | 1,925 | ||||||
Sempra Energy | ||||||||
6.000%, 10/15/2039 | 3,565 | 4,220 | ||||||
Southern California Edison | ||||||||
6.050%, 03/15/2039 | 4,355 | 5,506 | ||||||
4.500%, 09/01/2040 | 2,295 | 2,439 | ||||||
Southern California Gas | ||||||||
3.750%, 09/15/2042 | 1,180 | 1,151 | ||||||
Southern Gas Capital | ||||||||
5.875%, 03/15/2041 | 2,593 | 2,991 | ||||||
4.400%, 06/01/2043 | 1,000 | 985 | ||||||
3.950%, 10/01/2046 | 1,000 | 918 | ||||||
Southwestern Electric Power | ||||||||
6.200%, 03/15/2040 | 3,335 | 4,021 | ||||||
3.900%, 04/01/2045 | 2,000 | 1,843 | ||||||
Tucson Electric Power | ||||||||
5.000%, 03/15/2044 | 5,025 | 5,246 | ||||||
Union Electric | ||||||||
8.450%, 03/15/2039 | 2,010 | 3,112 | ||||||
| SEI Institutional Investments Trust / Semi-Annual Report / November 30, 2016 | 141 |
SCHEDULE OF INVESTMENTS (Unaudited)
Long Duration Fund (Continued)
November 30, 2016
| Description | Face Amount ($ Thousands) | Market Value ($ Thousands) | ||||||
Virginia Electric & Power | ||||||||
4.450%, 02/15/2044 | $ | 2,500 | $ | 2,608 | ||||
3.450%, 02/15/2024 | 530 | 547 | ||||||
|
| |||||||
| 243,065 | ||||||||
|
| |||||||
Total Corporate Obligations (Cost $1,626,524) ($ Thousands) | 1,681,611 | |||||||
|
| |||||||
U.S. TREASURY OBLIGATIONS — 20.3% |
| |||||||
U.S. Treasury Bills | ||||||||
0.482%, 04/06/2017 (B) (D) | 10,690 | 10,671 | ||||||
0.426%, 04/13/2017 (B) (D) | 11,020 | 10,999 | ||||||
0.308%, 12/08/2016 (B) (D) | 3,225 | 3,225 | ||||||
U.S. Treasury Bonds | ||||||||
4.500%, 02/15/2036 | 8,550 | 10,890 | ||||||
4.250%, 05/15/2039 | 610 | 747 | ||||||
3.875%, 08/15/2040 | 1,075 | 1,244 | ||||||
3.750%, 08/15/2041 | 7,345 | 8,344 | ||||||
3.750%, 11/15/2043 | 16,080 | 18,397 | ||||||
3.625%, 08/15/2043 | 14,522 | 16,251 | ||||||
3.625%, 02/15/2044 | 38,896 | 43,524 | ||||||
3.125%, 11/15/2041 | 13,150 | 13,460 | ||||||
3.125%, 02/15/2043 | 26,570 | 27,173 | ||||||
3.000%, 11/15/2044 | 3,425 | 3,413 | ||||||
3.000%, 05/15/2045 | 73,509 | 73,130 | ||||||
3.000%, 11/15/2045 | 1,480 | 1,471 | ||||||
2.875%, 08/15/2045 | 40,225 | 39,017 | ||||||
2.875%, 11/15/2046 | 34,975 | 33,993 | ||||||
2.750%, 08/15/2042 | 5,780 | 5,515 | ||||||
2.500%, 02/15/2045 | 22,511 | 20,215 | ||||||
2.500%, 02/15/2046 | 21,655 | 19,384 | ||||||
2.500%, 05/15/2046 | 71,542 | 64,024 | ||||||
2.250%, 08/15/2046 | 28,500 | 24,118 | ||||||
U.S. Treasury Inflation Indexed Bonds | ||||||||
1.375%, 02/15/2044 | 1,175 | 1,348 | ||||||
0.750%, 02/15/2045 | 8,635 | 8,460 | ||||||
U.S. Treasury Notes | ||||||||
2.000%, 11/15/2026 | 1,150 | 1,112 | ||||||
1.625%, 02/15/2026 | 10,058 | 9,437 | ||||||
U.S. Treasury STRIPS (B) | ||||||||
2.880%, 05/15/2030 | 8,400 | 5,947 | ||||||
2.775%, 05/15/2039 | 43,500 | 22,342 | ||||||
2.775%, 08/15/2045 | 6,740 | 2,756 | ||||||
3.810%, 02/15/2045 | 8,205 | 3,403 | ||||||
|
| |||||||
Total U.S. Treasury Obligations (Cost $515,573) ($ Thousands) | 504,010 | |||||||
|
| |||||||
| Description | Face Amount ($ Thousands) | Market Value ($ Thousands) | ||||||
MUNICIPAL BONDS — 5.8% |
| |||||||
California — 2.3% | ||||||||
Bay Area, Toll Authority, Build America Project, RB | ||||||||
6.263%, 04/01/2049 | $ | 1,200 | $ | 1,631 | ||||
California State, Build America Project, GO | ||||||||
7.550%, 04/01/2039 | 295 | 436 | ||||||
7.500%, 04/01/2034 | 5,300 | 7,463 | ||||||
City of Sacramento, Municipal Utility District, Build America Project, RB | ||||||||
6.156%, 05/15/2036 | 100 | 122 | ||||||
City of San Francisco, Public Utilities Commission Water Revenue, Build America Project, Ser DE, RB | ||||||||
6.000%, 11/01/2040 | 3,705 | 4,523 | ||||||
Los Angeles Unified School District, Build America Project, GO | ||||||||
5.750%, 07/01/2034 | 1,875 | 2,337 | ||||||
Los Angeles, Community College District, Build America Project, GO | ||||||||
6.750%, 08/01/2049 | 990 | 1,423 | ||||||
Los Angeles, Community College District, Ser D, GO | ||||||||
6.680%, 08/01/2036 | 2,965 | 3,917 | ||||||
Los Angeles, Department of Water & Power, Build America Project, RB | ||||||||
6.574%, 07/01/2045 | 600 | 824 | ||||||
6.008%, 07/01/2039 | 5,000 | 6,220 | ||||||
Los Angeles, Unified School District, Build America Project, Ser RY, GO | ||||||||
6.758%, 07/01/2034 | 2,360 | 3,205 | ||||||
Regents of the University of California Medical Center Pooled Revenue, Build America Project, Ser H, RB | ||||||||
6.548%, 05/15/2048 | 1,480 | 1,943 | ||||||
San Diego County, Water Authority, Build America Project, RB | ||||||||
6.138%, 05/01/2049 | 1,175 | 1,527 | ||||||
Santa Clara Valley, Transportation Authority, Build America Project, RB | ||||||||
5.876%, 04/01/2032 | 1,580 | 1,924 | ||||||
State of California, Build America Project, GO | ||||||||
7.625%, 03/01/2040 | 1,540 | 2,261 | ||||||
7.350%, 11/01/2039 | 3,770 | 5,348 | ||||||
7.300%, 10/01/2039 | 1,000 | 1,410 | ||||||
University of California, Ser AD, RB | ||||||||
4.858%, 05/15/2112 | 11,775 | 11,264 | ||||||
|
| |||||||
| 57,778 | ||||||||
|
| |||||||
District of Columbia — 0.1% | ||||||||
District of Columbia Water & Sewer Authority, RB | ||||||||
4.814%, 10/01/2114 | 2,005 | 2,023 | ||||||
|
| |||||||
| 142 | SEI Institutional Investments Trust / Semi-Annual Report / November 30, 2016 |
| Description | Face Amount ($ Thousands) | Market Value ($ Thousands) | ||||||
Florida — 0.2% | ||||||||
City of Gainesville, Build America Project, RB | ||||||||
6.024%, 10/01/2040 | $ | 3,650 | $ | 4,408 | ||||
|
| |||||||
Georgia — 0.2% | ||||||||
Municipal Electric Authority of Georgia, Build America Project, RB | ||||||||
6.637%, 04/01/2057 | 3,511 | 4,342 | ||||||
|
| |||||||
Illinois — 0.5% | ||||||||
Illinois State, GO | ||||||||
5.100%, 06/01/2033 | 8,180 | 7,325 | ||||||
Illinois, Finance Authority, RB Callable 06/01/2022 @ 100 | ||||||||
4.000%, 06/01/2047 | 1,260 | 1,205 | ||||||
Metropolitan Water Reclamation District of Greater Chicago, GO | ||||||||
5.720%, 12/01/2038 | 2,630 | 3,169 | ||||||
|
| |||||||
| 11,699 | ||||||||
|
| |||||||
Indiana — 0.1% | ||||||||
Indianapolis, Local Public Improvement Bond Bank, Build America Project, RB | ||||||||
6.116%, 01/15/2040 | 1,860 | 2,377 | ||||||
|
| |||||||
Massachusetts — 0.1% | ||||||||
Commonwealth of Massachusetts, Build America Project, GO | ||||||||
4.910%, 05/01/2029 | 1,210 | 1,407 | ||||||
Commonwealth of Massachusetts, Build America Project, RB | ||||||||
5.731%, 06/01/2040 | 1,080 | 1,368 | ||||||
Commonwealth of Massachusetts, Ser D, GO | ||||||||
4.500%, 08/01/2031 | 1,000 | 1,117 | ||||||
|
| |||||||
| 3,892 | ||||||||
|
| |||||||
Michigan — 0.1% | ||||||||
Michigan State University, Build America Project, Ser B, RB Callable 02/15/2030 @ 100 | ||||||||
6.173%, 02/15/2050 | 2,000 | 2,385 | ||||||
|
| |||||||
Missouri — 0.1% | ||||||||
Health & Educational Facilities Authority of the State of Missouri, RB | ||||||||
3.086%, 09/15/2051 | 1,315 | 1,114 | ||||||
Missouri, Joint Municipal Electric Utility Commission, Build America Project, Ser A, RB | ||||||||
6.890%, 01/01/2042 | 600 | 739 | ||||||
|
| |||||||
| 1,853 | ||||||||
|
| |||||||
| Description | Face Amount ($ Thousands) | Market Value ($ Thousands) | ||||||
New Jersey — 0.1% | ||||||||
New Jersey State, Turnpike Authority, Build America Project, RB | ||||||||
7.414%, 01/01/2040 | $ | 60 | $ | 86 | ||||
7.102%, 01/01/2041 | 1,300 | 1,820 | ||||||
|
| |||||||
| 1,906 | ||||||||
|
| |||||||
New York — 1.5% | ||||||||
City of New York, Build America Project, GO | ||||||||
5.517%, 10/01/2037 | 1,000 | 1,214 | ||||||
City of New York, Build America Project, GO Callable 10/01/2020 @ 100 | ||||||||
5.817%, 10/01/2031 | 2,950 | 3,300 | ||||||
New York City, Municipal Water Finance Authority, Build America Project, RB | ||||||||
5.440%, 06/15/2043 | 2,360 | 2,903 | ||||||
New York City, Municipal Water Finance Authority, Build America Project, RB Callable 06/15/2020 @ 100 | ||||||||
6.491%, 06/15/2042 | 6,630 | 7,433 | ||||||
New York City, Municipal Water Finance Authority, RB Callable 12/15/2020 @ 100 | ||||||||
5.375%, 06/15/2043 | 600 | 673 | ||||||
New York City, Municipal Water Finance Authority, Sub-Ser GG, RB Callable 06/15/2021 @ 100 | ||||||||
5.000%, 06/15/2043 | 710 | 782 | ||||||
New York City, Transitional Finance Authority, Build America Project, RB | ||||||||
5.572%, 11/01/2038 | 2,195 | 2,658 | ||||||
New York State, Dormitory Authority, Build America Project, RB | �� | |||||||
5.500%, 03/15/2030 | 3,295 | 3,900 | ||||||
5.289%, 03/15/2033 | 1,550 | 1,822 | ||||||
Port Authority of New York & New Jersey, RB | ||||||||
4.926%, 10/01/2051 | 725 | 806 | ||||||
4.458%, 10/01/2062 | 1,450 | 1,457 | ||||||
State of New York, Build America Project, RB | ||||||||
5.770%, 03/15/2039 | 8,820 | 10,601 | ||||||
|
| |||||||
| 37,549 | ||||||||
|
| |||||||
Ohio — 0.1% | ||||||||
American Municipal Power, Build America Project, RB | ||||||||
6.053%, 02/15/2043 | 2,940 | 3,513 | ||||||
Ohio State University, Build America Project, Ser A, RB | ||||||||
4.800%, 06/01/2111 | 115 | 114 | ||||||
|
| |||||||
| 3,627 | ||||||||
|
| |||||||
| SEI Institutional Investments Trust / Semi-Annual Report / November 30, 2016 | 143 |
SCHEDULE OF INVESTMENTS (Unaudited)
Long Duration Fund (Continued)
November 30, 2016
| Description | Face Amount ($ Thousands) | Market Value ($ Thousands) | ||||||
Pennsylvania — 0.1% | ||||||||
Commonwealth of Pennsylvania, Build America Project, Ser B, GO | ||||||||
5.450%, 02/15/2030 | $ | 1,915 | $ | 2,237 | ||||
|
| |||||||
Texas — 0.3% | ||||||||
Dallas, Convention Center Hotel Development, Build America Project, RB | ||||||||
7.088%, 01/01/2042 | 600 | 793 | ||||||
Grand Parkway Transportation, Sub-Ser E, RB | ||||||||
5.184%, 10/01/2042 | 930 | 1,092 | ||||||
North Texas, Tollway Authority, Build America Project, RB | ||||||||
6.718%, 01/01/2049 | 690 | 964 | ||||||
Texas Transportation Commission State Highway Fund, Build America Project, Ser B, RB | ||||||||
5.178%, 04/01/2030 | 2,725 | 3,224 | ||||||
University of Texas Permanent University Fund, Build America Project, RB | ||||||||
5.262%, 07/01/2039 | 1,505 | 1,833 | ||||||
|
| |||||||
| 7,906 | ||||||||
|
| |||||||
Total Municipal Bonds (Cost $133,125) ($ Thousands) | 143,982 | |||||||
|
| |||||||
U.S. GOVERNMENT AGENCY OBLIGATIONS — 3.7% |
| |||||||
FHLB | ||||||||
5.625%, 06/11/2021 | 960 | 1,112 | ||||||
FHLMC | ||||||||
6.750%, 03/15/2031 | 7,545 | 10,782 | ||||||
6.250%, 07/15/2032 | 6,735 | 9,451 | ||||||
FNMA | ||||||||
2.625%, 09/06/2024 | 12,405 | 12,593 | ||||||
1.875%, 09/24/2026 | 2,900 | 2,685 | ||||||
FNMA, PO MTN | ||||||||
0.000%, 05/15/2030 (B) | 8,380 | 5,374 | ||||||
Residual Funding STRIPS | ||||||||
3.490%, 04/15/2030 (B) | 17,770 | 11,592 | ||||||
Tennessee Valley Authority | ||||||||
5.500%, 06/15/2038 | 305 | 394 | ||||||
5.375%, 04/01/2056 | 12,593 | 15,700 | ||||||
5.250%, 09/15/2039 | 7,900 | 9,896 | ||||||
4.875%, 01/15/2048 | 635 | 735 | ||||||
4.625%, 09/15/2060 | 7,645 | 8,540 | ||||||
4.250%, 09/15/2065 | 2,380 | 2,460 | ||||||
Tennessee Valley Authority | ||||||||
0.000%, 01/15/2038 (B) | 3,700 | 1,615 | ||||||
|
| |||||||
| Description | Face Amount ($ Thousands) | Market Value ($ Thousands) | ||||||
Total U.S. Government Agency Obligations (Cost $91,980) ($ Thousands) |
| $ | 92,929 | |||||
|
| |||||||
MORTGAGE-BACKED SECURITIES — 1.6% |
| |||||||
Agency Mortgage-Backed Obligations — 1.6% |
| |||||||
FHLMC CMO, Ser 2004-2733, Cl ME | ||||||||
5.000%, 01/15/2034 | 193 | 211 | ||||||
FHLMC CMO, Ser 2004-2748, Cl ZT | ||||||||
5.500%, 02/15/2024 | 759 | 842 | ||||||
FHLMC CMO, Ser 2010-3756, Cl PZ | ||||||||
4.000%, 11/15/2040 | 6,354 | 6,857 | ||||||
FHLMC CMO, Ser 2013-4150, Cl JZ | ||||||||
3.000%, 01/15/2043 | 3,141 | 2,819 | ||||||
FHLMC Multifamily Structured Pass-Through |
| |||||||
2.637%, 01/25/2023 | 4,380 | 4,453 | ||||||
FNMA | ||||||||
3.841%, 09/01/2020 | 3,609 | 3,825 | ||||||
3.762%, 12/01/2020 | 3,442 | 3,640 | ||||||
3.665%, 10/01/2020 | 3,292 | 3,475 | ||||||
3.583%, 09/01/2020 | 1,671 | 1,758 | ||||||
FNMA CMO, Ser 2004-12, Cl ZX | ||||||||
6.000%, 03/25/2034 | 1,030 | 1,216 | ||||||
FNMA CMO, Ser 2004-80, Cl XZ | ||||||||
5.000%, 11/25/2034 | 566 | 625 | ||||||
FNMA CMO, Ser 2007-68, Cl SC, IO | ||||||||
6.116%, 07/25/2037 (C) | 49 | 9 | ||||||
GNMA ARM | ||||||||
2.125%, 06/20/2032 (C) | 69 | 72 | ||||||
GNMA CMO, Ser 2004-93, Cl PC | ||||||||
5.000%, 04/16/2034 | 53 | 55 | ||||||
GNMA CMO, Ser 2009-8, Cl PS, IO | ||||||||
5.765%, 08/16/2038 (C) | 120 | 16 | ||||||
GNMA CMO, Ser 2010-4, Cl NS, IO | ||||||||
5.855%, 01/16/2040 (C) | 142 | 26 | ||||||
GNMA CMO, Ser 2011-70, Cl BO, PO | ||||||||
0.000%, 05/20/2041 (B) | 10,228 | 8,494 | ||||||
|
| |||||||
| 38,393 | ||||||||
|
| |||||||
Non-Agency Mortgage-Backed Obligations — 0.0% |
| |||||||
DSLA Mortgage Loan Trust, Ser 2005-AR2, Cl 2A1A | ||||||||
0.738%, 03/19/2045 (C) | 135 | 119 | ||||||
Harborview Mortgage Loan Trust, Ser 2004-8, Cl 2A4A | ||||||||
1.328%, 11/19/2034 (C) | 205 | 182 | ||||||
Harborview Mortgage Loan Trust, Ser 2005-11, Cl 2A1A | ||||||||
0.838%, 08/19/2045 (C) | 264 | 244 | ||||||
| 144 | SEI Institutional Investments Trust / Semi-Annual Report / November 30, 2016 |
| Description | Face Amount ($ Thousands) | Market Value ($ Thousands) | ||||||
Indymac Index Mortgage Loan Trust, Ser 2004- AR12, Cl A1 | ||||||||
1.314%, 12/25/2034 (C) | $ | 109 | $ | 91 | ||||
Indymac Index Mortgage Loan Trust, Ser 2004- AR5, Cl 2A1B | ||||||||
1.334%, 08/25/2034 (C) | 45 | 37 | ||||||
Indymac Index Mortgage Loan Trust, Ser 2004- AR6, Cl 6A1 | ||||||||
3.268%, 10/25/2034 (C) | 53 | 51 | ||||||
Indymac Index Mortgage Loan Trust, Ser 2004- AR7, Cl A2 | ||||||||
1.394%, 09/25/2034 (C) | 22 | 20 | ||||||
Indymac Index Mortgage Loan Trust, Ser 2005- AR18, Cl 2A1A | ||||||||
0.844%, 10/25/2036 (C) | 14 | 10 | ||||||
Residential Asset Mortgage Products, Ser 2004-SL1, Cl A7 | ||||||||
7.000%, 11/25/2031 | 20 | 21 | ||||||
Residential Asset Mortgage Products, Ser 2004-SL3, Cl A2 | ||||||||
6.500%, 12/25/2031 | 24 | 24 | ||||||
Residential Asset Securitization Trust, Ser 2004-IP2, Cl 2A1 | ||||||||
3.107%, 12/25/2034 (C) | 46 | 46 | ||||||
WaMu Mortgage Pass-Through Certificates, Ser 2005-AR2, Cl 2A21 | ||||||||
0.864%, 01/25/2045 (C) | 133 | 124 | ||||||
Wells Fargo Mortgage-Backed Securities Trust, Ser 2006-AR8, Cl 1A3 | ||||||||
3.047%, 04/25/2036 (C) | 93 | 92 | ||||||
|
| |||||||
| 1,061 | ||||||||
|
| |||||||
Total Mortgage-Backed Securities (Cost $33,637) ($ Thousands) | 39,454 | |||||||
|
| |||||||
SOVEREIGN DEBT — 0.5% | ||||||||
Israel Government AID Bond | ||||||||
5.500%, 09/18/2033 | 1,400 | 1,829 | ||||||
Republic of Colombia | ||||||||
5.625%, 02/26/2044 | 1,215 | 1,212 | ||||||
Republic of Uruguay | ||||||||
5.100%, 06/18/2050 | 2,095 | 1,875 | ||||||
Saudi Government International Bond MTN | ||||||||
4.500%, 10/26/2046 (A) | 1,460 | 1,407 | ||||||
United Mexican States MTN | ||||||||
6.050%, 01/11/2040 | 236 | 250 | ||||||
5.750%, 10/12/2110 | 504 | 452 | ||||||
5.550%, 01/21/2045 | 1,670 | 1,662 | ||||||
4.750%, 03/08/2044 | 780 | 692 | ||||||
4.600%, 01/23/2046 | 1,015 | 880 | ||||||
4.350%, 01/15/2047 | 1,770 | 1,474 | ||||||
| Description | Face Amount ($ Thousands) | Market Value ($ Thousands) | ||||||
4.000%, 10/02/2023 | $ | 1,288 | $ | 1,285 | ||||
|
| |||||||
Total Sovereign Debt (Cost $13,705) ($ Thousands) | 13,018 | |||||||
|
| |||||||
ASSET-BACKED SECURITIES — 0.4% |
| |||||||
Mortgage Related Securities — 0.0% |
| |||||||
Citicorp Residential Mortgage Securities, Ser 2007-1, Cl A5 | ||||||||
5.755%, 03/25/2037 | 180 | 186 | ||||||
Conseco Financial, Ser 1998-2, Cl A5 | ||||||||
6.240%, 12/01/2028 (C) | 39 | 41 | ||||||
|
| |||||||
| 227 | ||||||||
|
| |||||||
Other Asset-Backed Securities — 0.4% |
| |||||||
Education Loan Asset-Backed Trust I, |
| |||||||
1.334%, 04/26/2032 (A) (C) | 2,765 | 2,678 | ||||||
JGWPT XXX LLC, Ser 2013-3A, Cl A | ||||||||
4.080%, 01/17/2073 (A) | 1,322 | 1,341 | ||||||
Nelnet Student Loan Trust, Ser 2014-2A, Cl A3 | ||||||||
1.384%, 07/27/2037 (A) (C) | 2,745 | 2,555 | ||||||
SLM Student Loan Trust, Ser 2011-1, Cl A2 | ||||||||
1.684%, 10/25/2034 (C) | 2,620 | 2,611 | ||||||
|
| |||||||
| 9,185 | ||||||||
|
| |||||||
Total Asset-Backed Securities (Cost $9,629) ($ Thousands) | 9,412 | |||||||
|
| |||||||
| Shares | ||||||||
CASH EQUIVALENT — 0.4% |
| |||||||
SEI Daily Income Trust, Government Fund, Cl A | ||||||||
0.210%**† | 9,355,178 | 9,355 | ||||||
|
| |||||||
Total Cash Equivalent (Cost $9,355) ($ Thousands) | 9,355 | |||||||
|
| |||||||
Total Investments — 100.5% |
| $ | 2,493,771 | |||||
|
| |||||||
| SEI Institutional Investments Trust / Semi-Annual Report / November 30, 2016 | 145 |
SCHEDULE OF INVESTMENTS (Unaudited)
Long Duration Fund (Concluded)
November 30, 2016
A list of the open futures contracts held by the Fund at November 30, 2016, is as follows:
| Type of Contract | Number of (Short) | Expiration Date | Unrealized Appreciation (Depreciation) ($ Thousands) | |||||||||
U.S. 10-Year Treasury Note | (129 | ) | Mar-2017 | $ | 78 | |||||||
U.S. 2-Year Treasury Note | (155 | ) | Apr-2017 | (10 | ) | |||||||
U.S. 5-Year Treasury Note | 287 | Mar-2017 | (99 | ) | ||||||||
U.S. Long Treasury Bond | (502 | ) | Mar-2017 | 193 | ||||||||
| Type of Contract | Number of (Short) | Expiration Date | Unrealized Appreciation (Depreciation) ($ Thousands) | |||||||||
U.S. Ultra Long Treasury Bond | 951 | Mar-2017 | $ | (262 | ) | |||||||
Ultra 10-Year U.S. Treasury Bond | (88 | ) | Mar-2017 | 46 | ||||||||
|
| |||||||||||
| $ | (54 | ) | ||||||||||
|
| |||||||||||
For the period ended November 30, 2016, the total amount of all open futures contracts, as presented in the table above, are representative of the volume of activity for the derivative type during the period.
A list of the OTC swap agreements held by the Fund at November 30, 2016, is as follows:
| Interest Rate Swaps | ||||||||||||
| Counterparty | Fund Pays | Fund Receives | Termination Date | Notional Amount ($ Thousands) | Net Unrealized Depreciation ($ Thousands) | |||||||
| Citigroup | 2.71% | 3 Month USD - LIBOR | 08/15/42 | 5,255 | $ | (309 | ) | |||||
|
| |||||||||||
A list of the open centrally cleared swap agreements held by the Fund at November 30, 2016, is as follows:
| Interest Rate Swaps | ||||||||||||
| Counterparty | Fund Pays | Fund Receives | Termination Date | Notional Amount ($ Thousands) | Net Unrealized Depreciation ($ Thousands) | |||||||
| Citigroup | 3.68 | 3 Month USD - LIBOR | 11/15/43 | 3,570 | $ | (859 | ) | |||||
|
| |||||||||||
For the period ended November 30, 2016, the total amount of all swap agreements, as presented in the table above, are representative of the volume of activity for this derivative type during the period.
Percentages are based on Net Assets of $2,480,616 ($ Thousands).
| ** | Rate shown is the 7-day effective yield as of November 30, 2016. |
| † | Investment in Affiliated Security (see Note –). |
| (A) | Security exempt from registration under Rule 144A of the Securities Act of 1933. These securities may be resold in transactions exempt from registration normally to qualified institutions. On November 30, 2016, the value of these securities amounted to $254,686 ($ Thousands), representing 10.3% of the net assets of the Fund. |
| (B) | The rate reported is the effective yield at the time of purchase. |
| (C) | Variable Rate Security — The rate reported on the Schedule of Investments is the rate in effect as of November 30, 2016. |
| (D) | Security, or portion thereof, has been pledged as collateral on open futures contracts. |
AID — Agency for International Development
ARM — Adjustable Rate Mortgage
Cl — Class
CMO — Collateralized Mortgage Obligation
FHLB — Federal Home Loan Bank
FHLMC — Federal Home Loan Mortgage Corporation
FNMA — Federal National Mortgage Association
GNMA — Government National Mortgage Association
GO — General Obligation
GP — General Partnership
IO — Interest Only — face amount represents notional amount.
LIBOR — London Interbank Offered Rate
LLC — Limited Liability Company
MTN — Medium Term Note
PLC — Public Limited Company
PO — Principal Only
RB — Revenue Bond
Ser — Series
STRIPS — Separately Traded Registered Interest and Principal Securities
USD — United States Dollar
The following is a list of the level of inputs used as of November 30, 2016, in valuing the Fund’s investments and other financial instruments carried at value ($ Thousands):
| Investments in Securities | Level 1 | `Level 2 | Level 3 | Total | ||||||||||||
Corporate Obligations | $ | — | $ | 1,681,611 | $ | — | $ | 1,681,611 | ||||||||
U.S. Treasury Obligations | — | 504,010 | — | 504,010 | ||||||||||||
Municipal Bonds | — | 143,982 | — | 143,982 | ||||||||||||
U.S. Government Agency Obligations | — | 92,929 | — | 92,929 | ||||||||||||
Mortgage-Backed Securities | — | 39,454 | — | 39,454 | ||||||||||||
Sovereign Debt | — | 13,018 | — | 13,018 | ||||||||||||
Asset-Backed Securities | — | 9,412 | — | 9,412 | ||||||||||||
Cash Equivalent | 9,355 | — | — | 9,355 | ||||||||||||
|
|
|
|
|
|
|
| |||||||||
Total Investments in Securities | $ | 9,355 | $ | 2,484,416 | $ | — | $ | 2,493,771 | ||||||||
|
|
|
|
|
|
|
| |||||||||
| Other Financial Instruments | Level 1 | Level 2 | Level 3 | Total | ||||||||||||
Futures Contracts* | ||||||||||||||||
Unrealized Appreciation | $ | 317 | $ | — | $ | — | $ | 317 | ||||||||
Unrealized Depreciation | (371 | ) | — | — | (371 | ) | ||||||||||
OTC Swaps | ||||||||||||||||
Interest Rate Swaps* | ||||||||||||||||
Unrealized Depreciation | — | (859 | ) | — | (859 | ) | ||||||||||
Centrally Cleared Swaps | ||||||||||||||||
Interest Rate Swaps* | ||||||||||||||||
Unrealized Depreciation | — | (309 | ) | — | (309 | ) | ||||||||||
|
|
|
|
|
|
|
| |||||||||
Total Other Financial Instruments | $ | (54 | ) | $ | (1,168 | ) | $ | — | $ | (1,222 | ) | |||||
|
|
|
|
|
|
|
| |||||||||
| * | Futures contracts and swaps are valued at the unrealized appreciation (depreciation) on the instrument. |
For the period ended November 30, 2016, there were no transfers between Level 1 and Level 2 assets and liabilities.
| 146 | SEI Institutional Investments Trust / Semi-Annual Report / November 30, 2016 |
For the period ended November 30, 2016, there were no transfers between Level 2 and Level 3 assets and liabilities.
For more information on valuation inputs, see Note 2 – Significant Accounting Policies in Notes to Financial Statements.
Amounts designated as “—” are $0 or have been rounded to $0.
The accompanying notes are an integral part of the financial statements.
| SEI Institutional Investments Trust / Semi-Annual Report / November 30, 2016 | 147 |
SCHEDULE OF INVESTMENTS (Unaudited)
Long Duration Credit Fund
November 30, 2016
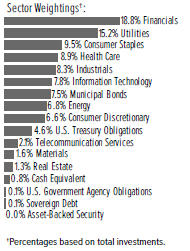
| Description | Face Amount ($ Thousands) | Market Value ($ Thousands) | ||||||
CORPORATE OBLIGATIONS — 86.0% |
| |||||||
Consumer Discretionary — 6.5% | ||||||||
21st Century Fox America | ||||||||
7.125%, 04/08/2028 | $ | 400 | $ | 496 | ||||
6.900%, 08/15/2039 | 1,500 | 1,897 | ||||||
6.750%, 01/09/2038 | 1,125 | 1,333 | ||||||
6.650%, 11/15/2037 | 2,280 | 2,826 | ||||||
6.200%, 12/15/2034 | 2,114 | 2,500 | ||||||
CBS | ||||||||
5.900%, 10/15/2040 | 40 | 45 | ||||||
Charter Communications Operating LLC | ||||||||
6.834%, 10/23/2055 (A) | 2,494 | 2,814 | ||||||
6.484%, 10/23/2045 (A) | 435 | 489 | ||||||
Comcast | ||||||||
6.950%, 08/15/2037 | 9,029 | 12,211 | ||||||
6.550%, 07/01/2039 | 295 | 384 | ||||||
6.450%, 03/15/2037 | 4,030 | 5,154 | ||||||
6.400%, 05/15/2038 | 16,091 | 20,532 | ||||||
5.650%, 06/15/2035 | 4,455 | 5,257 | ||||||
4.750%, 03/01/2044 | 2,000 | 2,114 | ||||||
4.650%, 07/15/2042 | 3,580 | 3,750 | ||||||
4.600%, 08/15/2045 | 8,600 | 8,917 | ||||||
4.500%, 01/15/2043 | 3,700 | 3,757 | ||||||
4.250%, 01/15/2033 | 6,375 | 6,564 | ||||||
4.200%, 08/15/2034 | 18,015 | 18,386 | ||||||
Cox Communications | ||||||||
8.375%, 03/01/2039 (A) | 2,528 | 3,102 | ||||||
Cox Enterprises | ||||||||
7.375%, 07/15/2027 (A) | 500 | 578 | ||||||
Darden Restaurants | ||||||||
6.800%, 10/15/2037 | 2,005 | 2,264 | ||||||
Discovery Communications LLC | ||||||||
6.350%, 06/01/2040 | 907 | 942 | ||||||
4.875%, 04/01/2043 | 460 | 411 | ||||||
| Description | Face Amount ($ Thousands) | Market Value ($ Thousands) | ||||||
Ford Holdings | ||||||||
9.300%, 03/01/2030 | $ | 2,279 | $ | 3,074 | ||||
General Motors | ||||||||
5.200%, 04/01/2045 | 3,195 | 3,033 | ||||||
Grupo Televisa | ||||||||
6.625%, 01/15/2040 | 20 | 21 | ||||||
Home Depot | ||||||||
5.950%, 04/01/2041 | 690 | 873 | ||||||
5.875%, 12/16/2036 | 2,383 | 2,988 | ||||||
4.875%, 02/15/2044 | 855 | 961 | ||||||
4.400%, 03/15/2045 | 7,390 | 7,793 | ||||||
4.250%, 04/01/2046 | 6,451 | 6,640 | ||||||
4.200%, 04/01/2043 | 4,575 | 4,655 | ||||||
3.750%, 02/15/2024 | 4,660 | 4,904 | ||||||
3.350%, 09/15/2025 | 2,200 | 2,251 | ||||||
Johnson Controls | ||||||||
5.700%, 03/01/2041 | 55 | 62 | ||||||
4.950%, 07/02/2064 | 695 | 649 | ||||||
Kohl's | ||||||||
5.550%, 07/17/2045 | 1,669 | 1,569 | ||||||
Lowe's MTN | ||||||||
7.110%, 05/15/2037 | 3,092 | 4,066 | ||||||
Lowe's | ||||||||
6.650%, 09/15/2037 | 2,360 | 3,112 | ||||||
5.800%, 10/15/2036 | 1,260 | 1,507 | ||||||
5.125%, 11/15/2041 | 2,525 | 2,849 | ||||||
5.000%, 09/15/2043 | 1,050 | 1,152 | ||||||
4.375%, 09/15/2045 | 2,615 | 2,663 | ||||||
4.250%, 09/15/2044 | 3,750 | 3,764 | ||||||
NBCUniversal Media LLC | ||||||||
5.950%, 04/01/2041 | 1,950 | 2,385 | ||||||
4.450%, 01/15/2043 | 1,750 | 1,771 | ||||||
4.375%, 04/01/2021 | 65 | 70 | ||||||
2.875%, 01/15/2023 | 225 | 225 | ||||||
Newell Brands | ||||||||
5.375%, 04/01/2036 | 1,240 | 1,377 | ||||||
NIKE | ||||||||
3.625%, 05/01/2043 | 1,560 | 1,466 | ||||||
QVC | ||||||||
5.950%, 03/15/2043 | 2,590 | 2,308 | ||||||
5.450%, 08/15/2034 | 495 | 435 | ||||||
Target | ||||||||
6.650%, 08/01/2028 | 355 | 439 | ||||||
6.500%, 10/15/2037 | 2,601 | 3,445 | ||||||
4.000%, 07/01/2042 | 5,930 | 5,827 | ||||||
Thomson Reuters | ||||||||
4.500%, 05/23/2043 | 290 | 272 | ||||||
Time Warner | ||||||||
7.700%, 05/01/2032 | 2,332 | 3,081 | ||||||
7.625%, 04/15/2031 | 2,100 | 2,777 | ||||||
6.500%, 11/15/2036 | 1,450 | 1,751 | ||||||
6.200%, 03/15/2040 | 220 | 250 | ||||||
| 148 | SEI Institutional Investments Trust / Semi-Annual Report / November 30, 2016 |
| Description | Face Amount ($ Thousands) | Market Value ($ Thousands) | ||||||
6.100%, 07/15/2040 | $ | 1,480 | $ | 1,677 | ||||
Time Warner Cable | ||||||||
6.550%, 05/01/2037 | 10 | 11 | ||||||
5.875%, 11/15/2040 | 150 | 156 | ||||||
Time Warner Entertainment | ||||||||
8.375%, 07/15/2033 | 1,040 | 1,338 | ||||||
Viacom | ||||||||
4.875%, 06/15/2043 | 190 | 181 | ||||||
4.850%, 12/15/2034 | 300 | 287 | ||||||
4.500%, 02/27/2042 | 1,360 | 1,212 | ||||||
Walt Disney MTN | ||||||||
1.850%, 07/30/2026 | 1,520 | 1,363 | ||||||
Walt Disney | ||||||||
4.125%, 12/01/2041 | 40 | 40 | ||||||
4.125%, 06/01/2044 | 4,440 | 4,519 | ||||||
|
| |||||||
| 203,972 | ||||||||
|
| |||||||
Consumer Staples — 9.2% | ||||||||
Altria Group | ||||||||
10.200%, 02/06/2039 | 2,501 | 4,362 | ||||||
9.950%, 11/10/2038 | 1,665 | 2,823 | ||||||
4.250%, 08/09/2042 | 420 | 412 | ||||||
3.875%, 09/16/2046 | 4,708 | 4,356 | ||||||
Anheuser-Busch | ||||||||
6.450%, 09/01/2037 | 975 | 1,242 | ||||||
Anheuser-Busch InBev Finance | ||||||||
4.900%, 02/01/2046 | 50,888 | 54,446 | ||||||
4.700%, 02/01/2036 | 35,306 | 37,025 | ||||||
Anheuser-Busch InBev Worldwide | ||||||||
8.200%, 01/15/2039 | 1,245 | 1,865 | ||||||
8.000%, 11/15/2039 | 300 | 443 | ||||||
6.375%, 01/15/2040 | 210 | 264 | ||||||
3.750%, 07/15/2042 | 670 | 611 | ||||||
Bowdoin College | ||||||||
4.693%, 07/01/2112 | 4,071 | 3,699 | ||||||
California Institute of Technology | ||||||||
4.700%, 11/01/2111 | 1,000 | 936 | ||||||
Coca-Cola | ||||||||
2.250%, 09/01/2026 | 3,020 | 2,816 | ||||||
Coca-Cola Femsa | ||||||||
5.250%, 11/26/2043 | 3,070 | 3,297 | ||||||
CVS Health | ||||||||
5.125%, 07/20/2045 | 1,000 | 1,097 | ||||||
CVS Pass-Through Trust | ||||||||
8.353%, 07/10/2031 (A) | 2,920 | 3,847 | ||||||
Diageo Capital | ||||||||
5.875%, 09/30/2036 | 485 | 594 | ||||||
3.875%, 04/29/2043 | 4,560 | 4,349 | ||||||
Duke University | ||||||||
3.299%, 10/01/2046 | 2,335 | 2,124 | ||||||
Hamilton College | ||||||||
4.750%, 07/01/2113 | 3,516 | 3,280 | ||||||
| Description | Face Amount ($ Thousands) | Market Value ($ Thousands) | ||||||
Hershey | ||||||||
3.375%, 08/15/2046 | $ | 2,215 | $ | 1,948 | ||||
Kimberly-Clark | ||||||||
5.300%, 03/01/2041 | 555 | 669 | ||||||
Kraft Heinz Foods | ||||||||
6.750%, 03/15/2032 | 415 | 505 | ||||||
4.375%, 06/01/2046 | 1,060 | 1,008 | ||||||
Land O' Lakes | ||||||||
6.000%, 11/15/2022 (A) | 1,325 | 1,454 | ||||||
Massachusetts Institute of Technology | ||||||||
5.600%, 07/01/2111 | 3,400 | 4,167 | ||||||
3.959%, 07/01/2038 | 1,927 | 2,030 | ||||||
Northwestern University | ||||||||
3.688%, 12/01/2038 | 1,570 | 1,573 | ||||||
PepsiCo | ||||||||
4.600%, 07/17/2045 | 4,280 | 4,634 | ||||||
4.250%, 10/22/2044 | 1,000 | 1,017 | ||||||
3.600%, 03/01/2024 | 3,445 | 3,594 | ||||||
3.450%, 10/06/2046 | 14,420 | 12,865 | ||||||
3.000%, 08/25/2021 | 16 | 16 | ||||||
Pernod Ricard | ||||||||
5.500%, 01/15/2042 (A) | 150 | 165 | ||||||
Philip Morris International | ||||||||
6.375%, 05/16/2038 | 420 | 537 | ||||||
4.875%, 11/15/2043 | 765 | 821 | ||||||
4.500%, 03/20/2042 | 8,840 | 9,020 | ||||||
4.375%, 11/15/2041 | 1,750 | 1,758 | ||||||
4.250%, 11/10/2044 | 2,792 | 2,752 | ||||||
4.125%, 03/04/2043 | 7,895 | 7,600 | ||||||
3.875%, 08/21/2042 | 2,795 | 2,603 | ||||||
President and Fellows of Harvard College | ||||||||
6.500%, 01/15/2039 (A) | 1,700 | 2,418 | ||||||
3.619%, 10/01/2037 | 400 | 396 | ||||||
3.300%, 07/15/2056 | 2,520 | 2,248 | ||||||
3.150%, 07/15/2046 | 2,515 | 2,268 | ||||||
Princeton University | ||||||||
5.700%, 03/01/2039 | 1,399 | 1,831 | ||||||
Reynolds American | ||||||||
7.250%, 06/15/2037 | 480 | 628 | ||||||
6.150%, 09/15/2043 | 20 | 24 | ||||||
Roche Holdings | ||||||||
2.375%, 01/28/2027 (A) | 3,815 | 3,559 | ||||||
SABMiller Holdings | ||||||||
4.950%, 01/15/2042 (A) | 4,120 | 4,447 | ||||||
Tufts University | ||||||||
5.017%, 04/15/2112 | 1,212 | 1,231 | ||||||
University of Chicago | ||||||||
4.411%, 10/01/2044 | 715 | 735 | ||||||
University of Southern California | ||||||||
3.028%, 10/01/2039 | 1,100 | 969 | ||||||
Walgreen | ||||||||
4.400%, 09/15/2042 | 30 | 29 | ||||||
| SEI Institutional Investments Trust / Semi-Annual Report / November 30, 2016 | 149 |
SCHEDULE OF INVESTMENTS (Unaudited)
Long Duration Credit Fund (Continued)
November 30, 2016
| Description | Face Amount ($ Thousands) | Market Value ($ Thousands) | ||||||
Walgreens Boots Alliance | ||||||||
4.800%, 11/18/2044 | $ | 1,190 | $ | 1,192 | ||||
4.650%, 06/01/2046 | 945 | 929 | ||||||
Wal-Mart Stores | ||||||||
6.500%, 08/15/2037 | 6,889 | 9,332 | ||||||
6.200%, 04/15/2038 | 5,625 | 7,413 | ||||||
5.625%, 04/01/2040 | 5,750 | 7,141 | ||||||
5.625%, 04/15/2041 | 1,800 | 2,214 | ||||||
5.000%, 10/25/2040 | 19,320 | 22,070 | ||||||
4.750%, 10/02/2043 | 7,200 | 8,035 | ||||||
4.300%, 04/22/2044 | 4,330 | 4,545 | ||||||
4.000%, 04/11/2043 | 7,960 | 7,967 | ||||||
Wesleyan University | ||||||||
4.781%, 07/01/2116 | 3,550 | 3,387 | ||||||
|
| |||||||
| 289,632 | ||||||||
|
| |||||||
Energy — 6.7% | ||||||||
Anadarko Petroleum | ||||||||
6.450%, 09/15/2036 | 5,225 | 5,883 | ||||||
6.200%, 03/15/2040 | 263 | 285 | ||||||
4.929%, 10/10/2036 (B) | 15,000 | 5,906 | ||||||
Apache | ||||||||
6.900%, 09/15/2018 | 10 | 11 | ||||||
BG Energy Capital | ||||||||
5.125%, 10/15/2041 (A) | 5,840 | 6,184 | ||||||
BP Capital Markets | ||||||||
3.994%, 09/26/2023 | 2,035 | 2,137 | ||||||
3.723%, 11/28/2028 | 3,865 | 3,889 | ||||||
3.535%, 11/04/2024 | 4,390 | 4,431 | ||||||
Buckeye Partners | ||||||||
5.850%, 11/15/2043 | 70 | 70 | ||||||
Canadian Oil Sands | ||||||||
6.000%, 04/01/2042 (A) | 2,375 | 2,252 | ||||||
Cenovus Energy | ||||||||
5.200%, 09/15/2043 | 1,145 | 1,042 | ||||||
Chevron | ||||||||
2.954%, 05/16/2026 | 2,430 | 2,377 | ||||||
Conoco Funding | ||||||||
6.950%, 04/15/2029 | 3,188 | 3,905 | ||||||
ConocoPhillips | ||||||||
6.500%, 02/01/2039 | 12,421 | 15,287 | ||||||
5.950%, 03/15/2046 | 495 | 586 | ||||||
5.900%, 05/15/2038 | 2,400 | 2,720 | ||||||
4.300%, 11/15/2044 | 9,120 | 8,765 | ||||||
ConocoPhillips Canada Funding I | ||||||||
5.950%, 10/15/2036 | 1,040 | 1,171 | ||||||
Devon Energy | ||||||||
5.600%, 07/15/2041 | 900 | 872 | ||||||
Devon Financing | ||||||||
7.875%, 09/30/2031 | 2,825 | 3,445 | ||||||
Energy Transfer Partners | ||||||||
8.250%, 11/15/2029 | 750 | 907 | ||||||
| Description | Face Amount ($ Thousands) | Market Value ($ Thousands) | ||||||
6.050%, 06/01/2041 | $ | 1,010 | $ | 998 | ||||
4.900%, 03/15/2035 | 82 | 75 | ||||||
Eni | ||||||||
5.700%, 10/01/2040 (A) | 2,620 | 2,606 | ||||||
Enterprise Products Operating LLC | ||||||||
6.450%, 09/01/2040 | 705 | 806 | ||||||
5.950%, 02/01/2041 | 1,970 | 2,146 | ||||||
5.750%, 03/01/2035 | 185 | 195 | ||||||
5.700%, 02/15/2042 | 3,102 | 3,287 | ||||||
Exxon Mobil | ||||||||
4.114%, 03/01/2046 | 7,780 | 7,810 | ||||||
3.567%, 03/06/2045 | 12,045 | 10,996 | ||||||
Hess | ||||||||
5.800%, 04/01/2047 | 1,170 | 1,131 | ||||||
Kinder Morgan | ||||||||
5.550%, 06/01/2045 | 1,815 | 1,794 | ||||||
Marathon Petroleum | ||||||||
5.000%, 09/15/2054 | 1,030 | 807 | ||||||
Motiva Enterprises | ||||||||
6.850%, 01/15/2040 (A) | 5,710 | 6,718 | ||||||
Noble Energy | ||||||||
6.000%, 03/01/2041 | 360 | 378 | ||||||
5.250%, 11/15/2043 | 400 | 389 | ||||||
Occidental Petroleum | ||||||||
4.400%, 04/15/2046 | 3,060 | 3,036 | ||||||
4.100%, 02/15/2047 | 3,880 | 3,699 | ||||||
Petroleos Mexicanos MTN | ||||||||
6.750%, 09/21/2047 (A) | 465 | 408 | ||||||
5.625%, 01/23/2046 | 516 | 401 | ||||||
Phillips 66 | ||||||||
4.650%, 11/15/2034 | 2,642 | 2,677 | ||||||
Schlumberger Holdings | ||||||||
4.000%, 12/21/2025 (A) | 3,000 | 3,105 | ||||||
Shell International Finance | ||||||||
6.375%, 12/15/2038 | 6,636 | 8,393 | ||||||
5.500%, 03/25/2040 | 2,500 | 2,848 | ||||||
4.550%, 08/12/2043 | 6,145 | 6,183 | ||||||
4.375%, 05/11/2045 | 5,450 | 5,374 | ||||||
4.125%, 05/11/2035 | 4,631 | 4,605 | ||||||
4.000%, 05/10/2046 | 7,235 | 6,715 | ||||||
Shell International Finance BV | ||||||||
3.750%, 09/12/2046 | 2,735 | 2,454 | ||||||
Southern Natural Gas | ||||||||
7.350%, 02/15/2031 | 2,215 | 2,556 | ||||||
Spectra Energy Capital | ||||||||
6.750%, 02/15/2032 | 800 | 888 | ||||||
Spectra Energy Partners | ||||||||
5.950%, 09/25/2043 | 160 | 176 | ||||||
Statoil | ||||||||
6.500%, 12/01/2028 (A) | 2,325 | 2,885 | ||||||
5.250%, 04/15/2019 | 50 | 54 | ||||||
5.100%, 08/17/2040 | 1,415 | 1,557 | ||||||
| 150 | SEI Institutional Investments Trust / Semi-Annual Report / November 30, 2016 |
| Description | Face Amount ($ Thousands) | Market Value ($ Thousands) | ||||||
4.800%, 11/08/2043 | $ | 1,534 | $ | 1,640 | ||||
3.950%, 05/15/2043 | 1,430 | 1,334 | ||||||
Suncor Energy | ||||||||
5.950%, 12/01/2034 | 2,205 | 2,511 | ||||||
Sunoco Logistics Partners Operations | ||||||||
5.350%, 05/15/2045 | 2,447 | 2,282 | ||||||
5.300%, 04/01/2044 | 1,309 | 1,222 | ||||||
TC PipeLines | ||||||||
4.375%, 03/13/2025 | 1,300 | 1,293 | ||||||
Tengizchevroil Finance International | ||||||||
4.000%, 08/15/2026 (A) | 1,165 | 1,081 | ||||||
Tennessee Gas Pipeline | ||||||||
8.375%, 06/15/2032 | 2,200 | 2,660 | ||||||
TransCanada PipeLines | ||||||||
7.250%, 08/15/2038 | 1,765 | 2,367 | ||||||
6.100%, 06/01/2040 | 1,660 | 1,991 | ||||||
5.000%, 10/16/2043 | 1,275 | 1,385 | ||||||
4.625%, 03/01/2034 | 12,148 | 12,838 | ||||||
Valero Energy | ||||||||
10.500%, 03/15/2039 | 2,476 | 3,691 | ||||||
Williams Partners | ||||||||
6.300%, 04/15/2040 | 50 | 50 | ||||||
5.800%, 11/15/2043 | 1,435 | 1,380 | ||||||
5.400%, 03/04/2044 | 1,600 | 1,484 | ||||||
|
| |||||||
| 209,484 | ||||||||
|
| |||||||
Financials — 18.4% | ||||||||
AIA Group MTN | ||||||||
4.875%, 03/11/2044 (A) | 2,572 | 2,722 | ||||||
AIG SunAmerica Global Financing X | ||||||||
6.900%, 03/15/2032 (A) | 5,570 | 7,057 | ||||||
American Express | ||||||||
4.050%, 12/03/2042 | 750 | 721 | ||||||
American International Group | ||||||||
4.700%, 07/10/2035 | 630 | 652 | ||||||
Bank of America | ||||||||
7.750%, 05/14/2038 | 1,275 | 1,773 | ||||||
6.500%, 07/15/2018 | 265 | 284 | ||||||
6.110%, 01/29/2037 | 3,965 | 4,642 | ||||||
6.000%, 10/15/2036 | 2,590 | 3,100 | ||||||
Bank of America MTN | ||||||||
5.875%, 02/07/2042 | 4,200 | 5,057 | ||||||
5.000%, 01/21/2044 | 4,455 | 4,826 | ||||||
4.875%, 04/01/2044 | 1,675 | 1,796 | ||||||
4.450%, 03/03/2026 | 690 | 709 | ||||||
4.183%, 11/25/2027 | 2,610 | 2,604 | ||||||
4.100%, 07/24/2023 | 340 | 355 | ||||||
3.950%, 04/21/2025 | 300 | 298 | ||||||
3.500%, 04/19/2026 | 1,125 | 1,111 | ||||||
3.300%, 01/11/2023 | 710 | 710 | ||||||
Bank of New York Mellon MTN | ||||||||
4.600%, 01/15/2020 | 50 | 53 | ||||||
| Description | Face Amount ($ Thousands) | Market Value ($ Thousands) | ||||||
Bank One Capital III | ||||||||
8.750%, 09/01/2030 | $ | 620 | $ | 883 | ||||
Berkshire Hathaway | ||||||||
4.500%, 02/11/2043 | 8,988 | 9,500 | ||||||
3.400%, 01/31/2022 | 56 | 59 | ||||||
Berkshire Hathaway Finance | ||||||||
5.750%, 01/15/2040 | 2,080 | 2,541 | ||||||
4.400%, 05/15/2042 | 2,250 | 2,330 | ||||||
4.300%, 05/15/2043 | 2,390 | 2,447 | ||||||
Blackstone Holdings Finance | ||||||||
5.000%, 06/15/2044 (A) | 5,935 | 5,900 | ||||||
4.450%, 07/15/2045 (A) | 700 | 643 | ||||||
Blackstone Holdings Finance LLC | ||||||||
6.250%, 08/15/2042 (A) | 4,839 | 5,562 | ||||||
Carlyle Holdings II Finance LLC | ||||||||
5.625%, 03/30/2043 (A) | 6,476 | 6,395 | ||||||
CDP Financial | ||||||||
5.600%, 11/25/2039 (A) | 4,178 | 5,169 | ||||||
Chubb | ||||||||
6.500%, 05/15/2038 | 2,485 | 3,311 | ||||||
Chubb INA Holdings | ||||||||
6.700%, 05/15/2036 | 4,870 | 6,465 | ||||||
4.350%, 11/03/2045 | 5,000 | 5,221 | ||||||
Cincinnati Financial | ||||||||
6.920%, 05/15/2028 | 2,518 | 3,144 | ||||||
6.125%, 11/01/2034 | 3,553 | 4,142 | ||||||
Citigroup | ||||||||
8.125%, 07/15/2039 | 1,673 | 2,458 | ||||||
6.875%, 02/15/2098 | 2,435 | 3,119 | ||||||
6.675%, 09/13/2043 | 2,601 | 3,303 | ||||||
6.125%, 08/25/2036 | 345 | 394 | ||||||
4.750%, 05/18/2046 | 1,165 | 1,150 | ||||||
4.650%, 07/30/2045 | 2,910 | 3,004 | ||||||
4.450%, 09/29/2027 | 7,630 | 7,736 | ||||||
4.400%, 06/10/2025 | 500 | 511 | ||||||
Citigroup Capital III | ||||||||
7.625%, 12/01/2036 | 895 | 1,049 | ||||||
CME Group | ||||||||
5.300%, 09/15/2043 | 5,030 | 5,859 | ||||||
Cooperatieve Rabobank UA MTN | ||||||||
5.250%, 05/24/2041 | 2,671 | 3,086 | ||||||
Cooperatieve Rabobank UA | ||||||||
11.000%, 12/31/2049 (A) (C) | 650 | 771 | ||||||
5.800%, 09/30/2110 (A) | 3,164 | 3,536 | ||||||
5.250%, 08/04/2045 | 2,695 | 2,934 | ||||||
4.625%, 12/01/2023 | 1,670 | 1,749 | ||||||
4.375%, 08/04/2025 | 1,200 | 1,222 | ||||||
Credit Suisse Group Funding Guernsey | ||||||||
4.550%, 04/17/2026 (A) | 1,140 | 1,160 | ||||||
Daimler Finance North America LLC | ||||||||
1.375%, 08/01/2017 (A) | 9,450 | 9,455 | ||||||
| SEI Institutional Investments Trust / Semi-Annual Report / November 30, 2016 | 151 |
SCHEDULE OF INVESTMENTS (Unaudited)
Long Duration Credit Fund (Continued)
November 30, 2016
| Description | Face Amount ($ Thousands) | Market Value ($ Thousands) | ||||||
DaimlerChrysler | ||||||||
8.500%, 01/18/2031 | $ | 150 | $ | 227 | ||||
Farmers Exchange Capital | ||||||||
7.200%, 07/15/2048 (A) | 800 | 899 | ||||||
Farmers Exchange Capital II | ||||||||
6.151%, 11/01/2053 (A) (C) | 5,720 | 5,856 | ||||||
Farmers Exchange Capital III | ||||||||
5.454%, 10/15/2054 (A) (C) | 1,000 | 945 | ||||||
First Union Capital II | ||||||||
7.950%, 11/15/2029 | 605 | 773 | ||||||
FMR | ||||||||
5.150%, 02/01/2043 (A) | 260 | 270 | ||||||
4.950%, 02/01/2033 (A) | 250 | 259 | ||||||
General Electric MTN | ||||||||
6.875%, 01/10/2039 | 1,315 | 1,834 | ||||||
6.750%, 03/15/2032 | 106 | 140 | ||||||
6.150%, 08/07/2037 | 81 | 103 | ||||||
5.875%, 01/14/2038 | 11,535 | 14,443 | ||||||
Goldman Sachs Group MTN | ||||||||
5.375%, 03/15/2020 | 175 | 190 | ||||||
4.800%, 07/08/2044 | 3,850 | 3,996 | ||||||
Goldman Sachs Group | ||||||||
6.750%, 10/01/2037 | 8,620 | 10,622 | ||||||
6.345%, 02/15/2034 | 2,555 | 2,981 | ||||||
6.250%, 02/01/2041 | 7,564 | 9,300 | ||||||
6.125%, 02/15/2033 | 16,195 | 19,392 | ||||||
5.950%, 01/18/2018 | 1,000 | 1,045 | ||||||
4.750%, 10/21/2045 | 4,660 | 4,868 | ||||||
3.750%, 05/22/2025 | 2,250 | 2,265 | ||||||
3.625%, 01/22/2023 | 215 | 220 | ||||||
3.500%, 11/16/2026 | 840 | 826 | ||||||
Guardian Life Insurance of America | ||||||||
4.875%, 06/19/2064 (A) | 7,070 | 6,906 | ||||||
Hartford Financial Services Group | ||||||||
6.625%, 03/30/2040 | 1,794 | 2,175 | ||||||
HSBC Bank USA | ||||||||
7.650%, 05/01/2025 | 2,115 | 2,568 | ||||||
7.000%, 01/15/2039 | 2,580 | 3,303 | ||||||
5.875%, 11/01/2034 | 7,530 | 8,652 | ||||||
HSBC Holdings | ||||||||
6.800%, 06/01/2038 | 1,350 | 1,686 | ||||||
6.500%, 09/15/2037 | 8,530 | 10,230 | ||||||
6.100%, 01/14/2042 | 965 | 1,201 | ||||||
5.250%, 03/14/2044 | 10,630 | 11,232 | ||||||
4.375%, 11/23/2026 | 2,180 | 2,171 | ||||||
Intercontinental Exchange | ||||||||
3.750%, 12/01/2025 | 2,460 | 2,521 | ||||||
JPMorgan Chase | ||||||||
6.400%, 05/15/2038 | 10,223 | 13,110 | ||||||
5.600%, 07/15/2041 | 6,880 | 8,111 | ||||||
5.500%, 10/15/2040 | 9,100 | 10,644 | ||||||
5.400%, 01/06/2042 | 9,160 | 10,636 | ||||||
| Description | Face Amount ($ Thousands) | Market Value ($ Thousands) | ||||||
4.950%, 06/01/2045 | $ | 3,450 | $ | 3,659 | ||||
4.250%, 10/15/2020 | 300 | 318 | ||||||
3.900%, 07/15/2025 | 500 | 516 | ||||||
3.875%, 09/10/2024 | 750 | 759 | ||||||
3.625%, 12/01/2027 | 2,210 | 2,152 | ||||||
3.375%, 05/01/2023 | 250 | 249 | ||||||
3.300%, 04/01/2026 | 3,910 | 3,845 | ||||||
3.200%, 01/25/2023 | 200 | 202 | ||||||
3.200%, 06/15/2026 | 3,510 | 3,419 | ||||||
KKR Group Finance II LLC | ||||||||
5.500%, 02/01/2043 (A) | 7,712 | 7,555 | ||||||
KKR Group Finance III | ||||||||
5.125%, 06/01/2044 (A) | 7,197 | 6,759 | ||||||
Liberty Mutual Group | ||||||||
6.500%, 05/01/2042 (A) | 3,132 | 3,703 | ||||||
Lincoln National | ||||||||
6.300%, 10/09/2037 | 100 | 115 | ||||||
6.150%, 04/07/2036 | 45 | 50 | ||||||
Lloyds Banking Group | ||||||||
5.300%, 12/01/2045 (A) | 1,789 | 1,778 | ||||||
Macquarie Bank | ||||||||
5.000%, 02/22/2017 (A) | 65 | 66 | ||||||
Macquarie Group | ||||||||
6.250%, 01/14/2021 (A) | 40 | 44 | ||||||
6.000%, 01/14/2020 (A) | 100 | 109 | ||||||
Massachusetts Mutual Life Insurance | ||||||||
8.875%, 06/01/2039 (A) | 2,010 | 2,981 | ||||||
MetLife | ||||||||
10.750%, 08/01/2039 | 1,215 | 1,896 | ||||||
6.500%, 12/15/2032 | 350 | 437 | ||||||
5.875%, 02/06/2041 | 2,315 | 2,760 | ||||||
5.700%, 06/15/2035 | 8,975 | 10,531 | ||||||
4.875%, 11/13/2043 | 4,465 | 4,775 | ||||||
4.721%, 12/15/2044 | 3,910 | 4,098 | ||||||
4.050%, 03/01/2045 | 1,225 | 1,169 | ||||||
MetLife Capital Trust IV | ||||||||
7.875%, 12/15/2037 (A) | 220 | 268 | ||||||
Metropolitan Life Insurance | ||||||||
7.800%, 11/01/2025 (A) | 2,000 | 2,535 | ||||||
Morgan Stanley | ||||||||
7.250%, 04/01/2032 | 155 | 207 | ||||||
Morgan Stanley MTN | ||||||||
6.375%, 07/24/2042 | 1,845 | 2,366 | ||||||
6.250%, 08/09/2026 | 8,221 | 9,838 | ||||||
4.300%, 01/27/2045 | 8,585 | 8,502 | ||||||
4.000%, 07/23/2025 | 5,665 | 5,804 | ||||||
3.875%, 04/29/2024 | 635 | 650 | ||||||
3.875%, 01/27/2026 | 970 | 983 | ||||||
3.700%, 10/23/2024 | 3,405 | 3,448 | ||||||
3.125%, 07/27/2026 | 3,460 | 3,315 | ||||||
2.282%, 10/24/2023 (C) | 1,485 | 1,489 | ||||||
| 152 | SEI Institutional Investments Trust / Semi-Annual Report / November 30, 2016 |
| Description | Face Amount ($ Thousands) | Market Value ($ Thousands) | ||||||
Mutual of Omaha Insurance | ||||||||
4.297%, 07/15/2054 (A) (C) | $ | 1,300 | $ | 1,297 | ||||
National Rural Utilities Cooperative Finance | ||||||||
4.023%, 11/01/2032 | 4,517 | 4,617 | ||||||
Nationwide Building Society | ||||||||
4.000%, 09/14/2026 (A) | 1,165 | 1,090 | ||||||
Nationwide Financial Services | ||||||||
5.300%, 11/18/2044 (A) | 1,450 | 1,484 | ||||||
Nationwide Mutual Insurance | ||||||||
9.375%, 08/15/2039 (A) | 1,510 | 2,261 | ||||||
4.950%, 04/22/2044 (A) | 1,905 | 1,866 | ||||||
New York Life Insurance | ||||||||
6.750%, 11/15/2039 (A) | 5,615 | 7,406 | ||||||
5.875%, 05/15/2033 (A) | 4,447 | 5,261 | ||||||
Northwestern Mutual Life Insurance | ||||||||
6.063%, 03/30/2040 (A) | 2,415 | 2,959 | ||||||
Pacific Life Insurance | ||||||||
9.250%, 06/15/2039 (A) | 1,040 | 1,517 | ||||||
PNC Bank | ||||||||
3.800%, 07/25/2023 | 450 | 467 | ||||||
PNC Bank MTN | ||||||||
3.250%, 06/01/2025 | 4,615 | 4,619 | ||||||
PNC Funding | ||||||||
6.700%, 06/10/2019 | 100 | 112 | ||||||
Prudential Financial MTN | ||||||||
6.625%, 06/21/2040 | 285 | 355 | ||||||
5.700%, 12/14/2036 | 5,149 | 5,939 | ||||||
Prudential Insurance of America | ||||||||
8.300%, 07/01/2025 (A) | 1,000 | 1,303 | ||||||
Swiss Re Treasury US | ||||||||
4.250%, 12/06/2042 (A) | 6,581 | 6,301 | ||||||
Teachers Insurance & Annuity Association of America | ||||||||
6.850%, 12/16/2039 (A) | 3,187 | 4,086 | ||||||
4.900%, 09/15/2044 (A) | 8,280 | 8,841 | ||||||
Toronto-Dominion Bank | ||||||||
3.625%, 09/15/2031 (C) | 1,250 | 1,203 | ||||||
Travelers MTN | ||||||||
6.250%, 06/15/2037 | 125 | 160 | ||||||
Travelers | ||||||||
6.750%, 06/20/2036 | 3,148 | 4,216 | ||||||
5.350%, 11/01/2040 | 1,565 | 1,835 | ||||||
3.750%, 05/15/2046 | 2,340 | 2,204 | ||||||
Trinity Acquisition | ||||||||
6.125%, 08/15/2043 | 50 | 53 | ||||||
US Bancorp MTN | ||||||||
4.125%, 05/24/2021 | 22 | 24 | ||||||
Validus Holdings | ||||||||
8.875%, 01/26/2040 | 1,300 | 1,697 | ||||||
Wachovia | ||||||||
5.750%, 06/15/2017 | 150 | 153 | ||||||
| Description | Face Amount ($ Thousands) | Market Value ($ Thousands) | ||||||
WEA Finance LLC | ||||||||
4.750%, 09/17/2044 (A) | $ | 1,330 | $ | 1,313 | ||||
Wells Fargo MTN | ||||||||
4.900%, 11/17/2045 | 3,305 | 3,418 | ||||||
4.600%, 04/01/2021 | 40 | 43 | ||||||
4.400%, 06/14/2046 | 6,675 | 6,431 | ||||||
4.300%, 07/22/2027 | 2,500 | 2,585 | ||||||
3.500%, 03/08/2022 | 235 | 242 | ||||||
Wells Fargo | ||||||||
5.606%, 01/15/2044 | 10,633 | 12,084 | ||||||
3.900%, 05/01/2045 | 10,782 | 10,135 | ||||||
3.000%, 04/22/2026 | 2,160 | 2,072 | ||||||
3.000%, 10/23/2026 | 4,225 | 4,043 | ||||||
Wells Fargo Bank | ||||||||
6.600%, 01/15/2038 | 5,445 | 6,941 | ||||||
5.950%, 08/26/2036 | 3,390 | 4,033 | ||||||
5.850%, 02/01/2037 | 8,581 | 10,057 | ||||||
XLIT | ||||||||
5.250%, 12/15/2043 | 2,770 | 2,814 | ||||||
ZFS Finance USA Trust I | ||||||||
6.500%, 05/09/2037 (A) (C) | 640 | 646 | ||||||
|
| |||||||
| 574,811 | ||||||||
|
| |||||||
Health Care — 9.1% | ||||||||
Abbott Laboratories | ||||||||
4.900%, 11/30/2046 | 4,605 | 4,644 | ||||||
AbbVie | ||||||||
4.700%, 05/14/2045 | 680 | 667 | ||||||
4.400%, 11/06/2042 | 5,020 | 4,712 | ||||||
Actavis | ||||||||
4.625%, 10/01/2042 | 25 | 24 | ||||||
Actavis Funding SCS | ||||||||
4.850%, 06/15/2044 | 625 | 622 | ||||||
4.750%, 03/15/2045 | 945 | 935 | ||||||
4.550%, 03/15/2035 | 3,830 | 3,774 | ||||||
Aetna | ||||||||
4.750%, 03/15/2044 | 3,440 | 3,564 | ||||||
4.375%, 06/15/2046 | 6,095 | 6,008 | ||||||
4.250%, 06/15/2036 | 2,045 | 2,031 | ||||||
4.125%, 11/15/2042 | 1,885 | 1,740 | ||||||
Allina Health System | ||||||||
4.805%, 11/15/2045 | 1,616 | 1,739 | ||||||
Amgen | ||||||||
4.663%, 06/15/2051 (A) | 616 | 598 | ||||||
4.563%, 06/15/2048 (A) | 1,425 | 1,379 | ||||||
4.400%, 05/01/2045 | 1,060 | 1,012 | ||||||
Anthem | ||||||||
4.650%, 08/15/2044 | 1,600 | 1,591 | ||||||
4.625%, 05/15/2042 | 300 | 297 | ||||||
2.375%, 02/15/2017 | 20 | 20 | ||||||
Ascension Health | ||||||||
4.847%, 11/15/2053 | 520 | 563 | ||||||
| SEI Institutional Investments Trust / Semi-Annual Report / November 30, 2016 | 153 |
SCHEDULE OF INVESTMENTS (Unaudited)
Long Duration Credit Fund (Continued)
November 30, 2016
| Description | Face Amount ($ Thousands) | Market Value ($ Thousands) | ||||||
3.945%, 11/15/2046 | $ | 2,105 | $ | 2,026 | ||||
AstraZeneca | ||||||||
6.450%, 09/15/2037 | 6,145 | 7,923 | ||||||
4.000%, 09/18/2042 | 1,435 | 1,361 | ||||||
Baylor Scott & White Holdings | ||||||||
4.185%, 11/15/2045 | 3,435 | 3,355 | ||||||
Becton Dickinson | ||||||||
4.875%, 05/15/2044 | 1,000 | 1,033 | ||||||
Biogen | ||||||||
4.050%, 09/15/2025 | 715 | 736 | ||||||
Celgene | ||||||||
5.250%, 08/15/2043 | 670 | 708 | ||||||
4.625%, 05/15/2044 | 780 | 761 | ||||||
Cigna | ||||||||
5.875%, 03/15/2041 | 65 | 74 | ||||||
City of Hope | ||||||||
5.623%, 11/15/2043 | 850 | 995 | ||||||
Cleveland Clinic Foundation | ||||||||
4.858%, 01/01/2114 | 3,656 | 3,530 | ||||||
Covidien International Finance | ||||||||
6.550%, 10/15/2037 | 705 | 900 | ||||||
Express Scripts Holding | ||||||||
4.800%, 07/15/2046 | 900 | 863 | ||||||
Gilead Sciences | ||||||||
4.800%, 04/01/2044 | 4,380 | 4,512 | ||||||
4.750%, 03/01/2046 | 8,695 | 8,935 | ||||||
4.600%, 09/01/2035 | 3,810 | 3,919 | ||||||
4.500%, 02/01/2045 | 10,385 | 10,253 | ||||||
4.150%, 03/01/2047 | 4,475 | 4,191 | ||||||
4.000%, 09/01/2036 | 2,775 | 2,652 | ||||||
2.950%, 03/01/2027 | 1,775 | 1,685 | ||||||
GlaxoSmithKline Capital | ||||||||
6.375%, 05/15/2038 | 6,599 | 8,682 | ||||||
Hartford HealthCare | ||||||||
5.746%, 04/01/2044 | 2,130 | 2,455 | ||||||
Highmark | ||||||||
6.125%, 05/15/2041 (A) | 1,560 | 1,430 | ||||||
4.750%, 05/15/2021 (A) | 1,330 | 1,324 | ||||||
Humana | ||||||||
8.150%, 06/15/2038 | 1,510 | 2,048 | ||||||
4.625%, 12/01/2042 | 55 | 53 | ||||||
Johns Hopkins Health System | ||||||||
3.837%, 05/15/2046 | 640 | 610 | ||||||
Johnson & Johnson | ||||||||
4.500%, 12/05/2043 | 1,000 | 1,124 | ||||||
4.375%, 12/05/2033 | 7,300 | 8,048 | ||||||
Medtronic | ||||||||
4.625%, 03/15/2044 | 6,416 | 6,741 | ||||||
4.625%, 03/15/2045 | 16,008 | 16,992 | ||||||
4.375%, 03/15/2035 | 12,336 | 12,798 | ||||||
Merck | ||||||||
6.550%, 09/15/2037 | 1,000 | 1,320 | ||||||
| Description | Face Amount ($ Thousands) | Market Value ($ Thousands) | ||||||
4.150%, 05/18/2043 | $ | 3,050 | $ | 3,096 | ||||
3.700%, 02/10/2045 | 14,700 | 14,011 | ||||||
3.600%, 09/15/2042 | 850 | 798 | ||||||
2.750%, 02/10/2025 | 2,035 | 1,999 | ||||||
Merck Sharp & Dohme MTN | ||||||||
5.760%, 05/03/2037 | 1,276 | 1,549 | ||||||
Mylan | ||||||||
5.250%, 06/15/2046 (A) | 1,695 | 1,565 | ||||||
New York and Presbyterian Hospital | ||||||||
4.763%, 08/01/2116 | 2,962 | 2,793 | ||||||
4.063%, 08/01/2056 | 2,200 | 2,104 | ||||||
North Shore-Long Island Jewish Health Care | ||||||||
4.800%, 11/01/2042 | 2,400 | 2,439 | ||||||
Novartis Capital | ||||||||
4.400%, 05/06/2044 | 5,500 | 5,907 | ||||||
NYU Hospitals Center | ||||||||
4.428%, 07/01/2042 | 2,650 | 2,545 | ||||||
Perrigo Finance Unlimited | ||||||||
4.375%, 03/15/2026 | 990 | 989 | ||||||
Pfizer | ||||||||
7.200%, 03/15/2039 | 1,480 | 2,122 | ||||||
4.400%, 05/15/2044 | 4,895 | 5,106 | ||||||
4.300%, 06/15/2043 | 2,640 | 2,717 | ||||||
4.125%, 12/15/2046 | 3,790 | 3,790 | ||||||
4.000%, 12/15/2036 | 11,136 | 11,173 | ||||||
Pharmacia | ||||||||
6.600%, 12/01/2028 | 1,145 | 1,471 | ||||||
Providence St. Joseph Health Obligated Group | ||||||||
3.744%, 10/01/2047 | 1,315 | 1,221 | ||||||
Roche Holdings | ||||||||
7.000%, 03/01/2039 (A) | 735 | 1,043 | ||||||
4.000%, 11/28/2044 (A) | 230 | 230 | ||||||
Shands Teaching Hospital and Clinics | ||||||||
4.741%, 12/01/2042 | 1,750 | 1,729 | ||||||
St. Barnabas | ||||||||
4.000%, 07/01/2028 | 2,240 | 2,234 | ||||||
Stryker | ||||||||
4.625%, 03/15/2046 | 615 | 613 | ||||||
4.375%, 05/15/2044 | 1,220 | 1,174 | ||||||
4.100%, 04/01/2043 | 785 | 723 | ||||||
Sutter Health | ||||||||
2.286%, 08/15/2053 | 2,000 | 1,956 | ||||||
Teva Pharmaceutical Finance Netherlands III | ||||||||
3.150%, 10/01/2026 | 1,035 | 955 | ||||||
Teva Pharmaceutical Finance Netherlands III BV | ||||||||
4.100%, 10/01/2046 | 1,620 | 1,404 | ||||||
Toledo Hospital | ||||||||
4.982%, 11/15/2045 | 3,425 | 3,772 | ||||||
Trinity Health | ||||||||
4.125%, 12/01/2045 | 2,524 | 2,464 | ||||||
| 154 | SEI Institutional Investments Trust / Semi-Annual Report / November 30, 2016 |
| Description | Face Amount ($ Thousands) | Market Value ($ Thousands) | ||||||
UnitedHealth Group | ||||||||
6.875%, 02/15/2038 | $ | 2,396 | $ | 3,235 | ||||
6.625%, 11/15/2037 | 4,315 | 5,677 | ||||||
6.500%, 06/15/2037 | 3,210 | 4,145 | ||||||
5.950%, 02/15/2041 | 95 | 116 | ||||||
5.800%, 03/15/2036 | 325 | 391 | ||||||
5.700%, 10/15/2040 | 1,005 | 1,205 | ||||||
4.750%, 07/15/2045 | 12,390 | 13,621 | ||||||
4.625%, 07/15/2035 | 1,100 | 1,186 | ||||||
4.375%, 03/15/2042 | 30 | 30 | ||||||
3.950%, 10/15/2042 | 1,075 | 1,027 | ||||||
Wyeth LLC | ||||||||
6.500%, 02/01/2034 | 3,390 | 4,303 | ||||||
5.950%, 04/01/2037 | 4,425 | 5,495 | ||||||
|
| |||||||
| 286,080 | ||||||||
|
| |||||||
Industrials — 8.3% | ||||||||
3M MTN | ||||||||
3.125%, 09/19/2046 | 2,275 | 1,990 | ||||||
Air Canada, Pass-Through Trust, Ser 2013-1, Cl A | ||||||||
4.125%, 05/15/2025 (A) | 463 | 483 | ||||||
Air Canada, Pass-Through Trust, Ser 2015-1, Cl A | ||||||||
3.600%, 03/15/2027 (A) | 5,281 | 5,292 | ||||||
American Airlines, Pass-Through Trust, Ser 2013-2, Cl A | ||||||||
4.950%, 01/15/2023 | 1,139 | 1,220 | ||||||
American Airlines, Pass-Through Trust, Ser 2014-1, Cl A | ||||||||
3.700%, 10/01/2026 | 1,945 | 1,973 | ||||||
American Airlines, Pass-Through Trust, Ser 2016-2, Cl AA | ||||||||
3.200%, 06/15/2028 | 3,765 | 3,718 | ||||||
BAE Systems Holdings | ||||||||
4.750%, 10/07/2044 (A) | 3,098 | 3,134 | ||||||
Boeing | ||||||||
3.300%, 03/01/2035 | 5,670 | 5,316 | ||||||
Burlington Northern Santa Fe LLC | ||||||||
5.150%, 09/01/2043 | 495 | 560 | ||||||
4.950%, 09/15/2041 | 140 | 154 | ||||||
4.900%, 04/01/2044 | 5,800 | 6,385 | ||||||
4.550%, 09/01/2044 | 5,100 | 5,365 | ||||||
4.450%, 03/15/2043 | 1,250 | 1,293 | ||||||
4.400%, 03/15/2042 | 2,825 | 2,889 | ||||||
3.900%, 08/01/2046 | 3,000 | 2,878 | ||||||
Canadian National Railway | ||||||||
6.250%, 08/01/2034 | 2,393 | 3,067 | ||||||
6.200%, 06/01/2036 | 5,665 | 7,350 | ||||||
4.500%, 11/07/2043 | 3,800 | 4,055 | ||||||
3.200%, 08/02/2046 | 3,775 | 3,310 | ||||||
| Description | Face Amount ($ Thousands) | Market Value ($ Thousands) | ||||||
Caterpillar | ||||||||
5.200%, 05/27/2041 | $ | 640 | $ | 736 | ||||
4.750%, 05/15/2064 | 4,770 | 5,012 | ||||||
3.803%, 08/15/2042 | 5,890 | 5,692 | ||||||
CSX | ||||||||
4.750%, 05/30/2042 | 1,670 | 1,714 | ||||||
4.500%, 08/01/2054 | 900 | 878 | ||||||
Deere | ||||||||
3.900%, 06/09/2042 | 12,095 | 12,150 | ||||||
Eaton | ||||||||
4.000%, 11/02/2032 | 2,780 | 2,758 | ||||||
FedEx | ||||||||
7.600%, 07/01/2097 | 1,403 | 1,728 | ||||||
GE Capital International Funding Unlimited | ||||||||
4.418%, 11/15/2035 | 60,674 | 63,160 | ||||||
General Electric | ||||||||
4.500%, 03/11/2044 | 3,965 | 4,177 | ||||||
2.700%, 10/09/2022 | 1,010 | 1,014 | ||||||
Honeywell International | ||||||||
5.700%, 03/15/2037 | 300 | 367 | ||||||
5.375%, 03/01/2041 | 4,435 | 5,345 | ||||||
Lockheed Martin | ||||||||
3.600%, 03/01/2035 | 3,035 | 2,887 | ||||||
Norfolk Southern | ||||||||
6.000%, 03/15/2105 | 2,536 | 2,741 | ||||||
6.000%, 05/23/2111 | 345 | 374 | ||||||
Parker-Hannifin MTN | ||||||||
4.450%, 11/21/2044 | 1,755 | 1,890 | ||||||
Raytheon | ||||||||
4.700%, 12/15/2041 | 560 | 619 | ||||||
Siemens Financieringsmaatschappij | ||||||||
4.400%, 05/27/2045 (A) | 9,350 | 9,767 | ||||||
3.300%, 09/15/2046 (A) | 11,330 | 9,818 | ||||||
2.350%, 10/15/2026 (A) | 1,775 | 1,645 | ||||||
Stanley Black & Decker | ||||||||
5.200%, 09/01/2040 | 280 | 310 | ||||||
Tyco International Finance | ||||||||
5.125%, 09/14/2045 | 1,880 | 2,010 | ||||||
Union Pacific | ||||||||
4.375%, 11/15/2065 | 4,355 | 4,310 | ||||||
4.050%, 03/01/2046 | 1,395 | 1,388 | ||||||
3.875%, 02/01/2055 | 4,730 | 4,255 | ||||||
3.799%, 10/01/2051 (A) | 5,205 | 4,804 | ||||||
United Airlines, Pass-Through Trust, Ser 2014- 2, Cl A | ||||||||
3.750%, 09/03/2026 | 2,567 | 2,618 | ||||||
United Parcel Service | ||||||||
8.375%, 04/01/2030 (D) | 710 | 985 | ||||||
6.200%, 01/15/2038 | 3,152 | 4,135 | ||||||
3.625%, 10/01/2042 | 2,500 | 2,379 | ||||||
3.400%, 11/15/2046 | 3,925 | 3,531 | ||||||
| SEI Institutional Investments Trust / Semi-Annual Report / November 30, 2016 | 155 |
SCHEDULE OF INVESTMENTS (Unaudited)
Long Duration Credit Fund (Continued)
November 30, 2016
| Description | Face Amount ($ Thousands) | Market Value ($ Thousands) | ||||||
United Technologies | ||||||||
5.700%, 04/15/2040 | $ | 1,520 | $ | 1,837 | ||||
4.500%, 06/01/2042 | 17,140 | 18,144 | ||||||
4.150%, 05/15/2045 | 3,410 | 3,416 | ||||||
3.750%, 11/01/2046 | 6,560 | 6,156 | ||||||
US Airways, Pass-Through Trust, Ser 2012-1, Cl A | ||||||||
5.900%, 10/01/2024 | 1,934 | 2,157 | ||||||
WW Grainger | ||||||||
4.600%, 06/15/2045 | 1,185 | 1,258 | ||||||
|
| |||||||
| 258,597 | ||||||||
|
| |||||||
Information Technology — 7.7% | ||||||||
Apple | ||||||||
4.650%, 02/23/2046 | 9,285 | 9,827 | ||||||
4.500%, 02/23/2036 | 3,105 | 3,302 | ||||||
4.450%, 05/06/2044 | 780 | 790 | ||||||
4.375%, 05/13/2045 | 15,845 | 16,202 | ||||||
3.850%, 05/04/2043 | 3,350 | 3,163 | ||||||
3.850%, 08/04/2046 | 13,630 | 12,750 | ||||||
3.450%, 02/09/2045 | 6,850 | 6,020 | ||||||
Applied Materials | ||||||||
5.850%, 06/15/2041 | 90 | 105 | ||||||
Cisco Systems | ||||||||
5.900%, 02/15/2039 | 7,439 | 9,383 | ||||||
5.500%, 01/15/2040 | 7,095 | 8,618 | ||||||
Diamond 1 Finance | ||||||||
8.350%, 07/15/2046 (A) | 2,295 | 2,691 | ||||||
Hewlett Packard Enterprise | ||||||||
6.200%, 10/15/2035 (A) | 3,615 | 3,521 | ||||||
Intel | ||||||||
4.900%, 07/29/2045 | 13,815 | 15,385 | ||||||
4.800%, 10/01/2041 | 6,095 | 6,657 | ||||||
4.100%, 05/19/2046 | 3,624 | 3,539 | ||||||
4.000%, 12/15/2032 | 520 | 526 | ||||||
International Business Machines | ||||||||
3.625%, 02/12/2024 | 4,160 | 4,328 | ||||||
Intuit | ||||||||
5.750%, 03/15/2017 | 25 | 25 | ||||||
Mastercard | ||||||||
3.800%, 11/21/2046 | 2,605 | 2,532 | ||||||
Microsoft | ||||||||
5.300%, 02/08/2041 | 475 | 564 | ||||||
4.875%, 12/15/2043 | 1,200 | 1,321 | ||||||
4.750%, 11/03/2055 | 3,545 | 3,790 | ||||||
4.450%, 11/03/2045 | 1,315 | 1,387 | ||||||
4.000%, 02/12/2055 | 13,098 | 12,130 | ||||||
3.750%, 02/12/2045 | 14,235 | 13,372 | ||||||
3.700%, 08/08/2046 | 24,093 | 22,423 | ||||||
3.500%, 02/12/2035 | 2,235 | 2,140 | ||||||
3.500%, 11/15/2042 | 670 | 608 | ||||||
3.450%, 08/08/2036 | 12,200 | 11,513 | ||||||
| Description | Face Amount ($ Thousands) | Market Value ($ Thousands) | ||||||
2.400%, 08/08/2026 | $ | 1,255 | $ | 1,192 | ||||
Oracle | ||||||||
6.500%, 04/15/2038 | 7,067 | 9,235 | ||||||
6.125%, 07/08/2039 | 2,870 | 3,584 | ||||||
4.500%, 07/08/2044 | 980 | 1,001 | ||||||
4.375%, 05/15/2055 | 3,515 | 3,431 | ||||||
4.300%, 07/08/2034 | 15,695 | 16,148 | ||||||
4.125%, 05/15/2045 | 8,810 | 8,509 | ||||||
4.000%, 07/15/2046 | 7,174 | 6,804 | ||||||
2.650%, 07/15/2026 | 4,710 | 4,470 | ||||||
Visa | ||||||||
4.300%, 12/14/2045 | 5,220 | 5,448 | ||||||
4.150%, 12/14/2035 | 3,835 | 3,989 | ||||||
|
| |||||||
| 242,423 | ||||||||
|
| |||||||
Materials — 1.6% | ||||||||
Air Liquide Finance | ||||||||
3.500%, 09/27/2046 (A) | 1,855 | 1,686 | ||||||
Albemarle | ||||||||
5.450%, 12/01/2044 | 1,449 | 1,536 | ||||||
Barrick North America Finance LLC | ||||||||
7.500%, 09/15/2038 | 15 | 18 | ||||||
5.750%, 05/01/2043 | 2,085 | 2,218 | ||||||
5.700%, 05/30/2041 | 1,380 | 1,456 | ||||||
5.250%, 04/01/2042 | 550 | 553 | ||||||
BHP Billiton Finance USA | ||||||||
5.000%, 09/30/2043 | 7,120 | 7,925 | ||||||
Dow Chemical | ||||||||
5.250%, 11/15/2041 | 755 | 808 | ||||||
4.625%, 10/01/2044 | 825 | 813 | ||||||
4.250%, 10/01/2034 | 2,870 | 2,782 | ||||||
Georgia-Pacific LLC | ||||||||
8.875%, 05/15/2031 | 1,785 | 2,672 | ||||||
7.250%, 06/01/2028 | 330 | 425 | ||||||
Glencore Finance Canada | ||||||||
6.000%, 11/15/2041 (A) | 2,878 | 2,792 | ||||||
International Paper | ||||||||
8.700%, 06/15/2038 | 1,000 | 1,407 | ||||||
LYB International Finance | ||||||||
5.250%, 07/15/2043 | 775 | 813 | ||||||
LyondellBasell Industries | ||||||||
4.625%, 02/26/2055 | 65 | 58 | ||||||
Monsanto | ||||||||
4.700%, 07/15/2064 | 2,310 | 2,031 | ||||||
4.400%, 07/15/2044 | 225 | 209 | ||||||
4.200%, 07/15/2034 | 3,550 | 3,364 | ||||||
Nacional del Cobre de Chile | ||||||||
4.500%, 09/16/2025 (A) | 1,360 | 1,368 | ||||||
Newmont Mining | ||||||||
5.875%, 04/01/2035 | 100 | 109 | ||||||
Nucor | ||||||||
6.400%, 12/01/2037 | 40 | 49 | ||||||
| 156 | SEI Institutional Investments Trust / Semi-Annual Report / November 30, 2016 |
| Description | Face Amount ($ Thousands) | Market Value ($ Thousands) | ||||||
Rio Tinto Alcan | ||||||||
7.250%, 03/15/2031 | $ | 4,290 | $ | 5,088 | ||||
Rio Tinto Finance USA | ||||||||
9.000%, 05/01/2019 | 60 | 70 | ||||||
5.200%, 11/02/2040 | 20 | 22 | ||||||
4.750%, 03/22/2042 | 120 | 128 | ||||||
4.125%, 08/21/2042 | 6,910 | 6,755 | ||||||
Southern Copper | ||||||||
5.875%, 04/23/2045 | 1,245 | 1,188 | ||||||
Union Carbide | ||||||||
7.750%, 10/01/2096 | 25 | 30 | ||||||
Westlake Chemical | ||||||||
5.000%, 08/15/2046 (A) | 760 | 718 | ||||||
|
| |||||||
| 49,091 | ||||||||
|
| |||||||
Real Estate — 1.3% | ||||||||
Alexandria Real Estate Equities | ||||||||
3.900%, 06/15/2023 | 400 | 406 | ||||||
American Tower Trust I | ||||||||
3.070%, 03/15/2023 (A) | 3,034 | 2,995 | ||||||
Boston Properties | ||||||||
2.750%, 10/01/2026 | 840 | 775 | ||||||
Crown Castle Towers LLC | ||||||||
3.663%, 05/15/2025 (A) | 4,075 | 4,120 | ||||||
ERP Operating | ||||||||
4.625%, 12/15/2021 | 33 | 36 | ||||||
4.500%, 07/01/2044 | 4,000 | 4,036 | ||||||
4.500%, 06/01/2045 | 1,450 | 1,459 | ||||||
Federal Realty Investment Trust | ||||||||
3.625%, 08/01/2046 | 3,595 | 3,141 | ||||||
HCP | ||||||||
6.750%, 02/01/2041 | 1,080 | 1,244 | ||||||
4.250%, 11/15/2023 | 740 | 755 | ||||||
Health Care | ||||||||
3.750%, 03/15/2023 | 180 | 183 | ||||||
Kimco Realty | ||||||||
4.125%, 12/01/2046 | 3,260 | 3,059 | ||||||
Nationwide Health Properties MTN | ||||||||
6.900%, 10/01/2037 | 1,600 | 1,869 | ||||||
Simon Property Group | ||||||||
6.750%, 02/01/2040 | 4,465 | 5,980 | ||||||
4.750%, 03/15/2042 | 3,805 | 4,044 | ||||||
4.375%, 03/01/2021 | 40 | 43 | ||||||
3.300%, 01/15/2026 | 560 | 558 | ||||||
Ventas Realty | ||||||||
5.700%, 09/30/2043 | 3,910 | 4,345 | ||||||
Welltower | ||||||||
6.500%, 03/15/2041 | 775 | 926 | ||||||
5.125%, 03/15/2043 | 1,020 | 1,046 | ||||||
|
| |||||||
| 41,020 | ||||||||
|
| |||||||
| Description | Face Amount ($ Thousands) | Market Value ($ Thousands) | ||||||
Telecommunication Services — 2.1% |
| |||||||
America Movil | ||||||||
6.375%, 03/01/2035 | $ | 50 | $ | 57 | ||||
6.125%, 11/15/2037 | 50 | 55 | ||||||
6.125%, 03/30/2040 | 2,375 | 2,681 | ||||||
4.375%, 07/16/2042 | 3,900 | 3,540 | ||||||
AT&T | ||||||||
8.250%, 11/15/2031 | 1,391 | 1,923 | ||||||
6.375%, 03/01/2041 | 1,495 | 1,718 | ||||||
6.350%, 03/15/2040 | 1,830 | 2,083 | ||||||
5.600%, 05/15/2018 | 40 | 42 | ||||||
5.550%, 08/15/2041 | 200 | 207 | ||||||
5.350%, 09/01/2040 | 2,669 | 2,694 | ||||||
4.800%, 06/15/2044 | 4,130 | 3,871 | ||||||
4.550%, 03/09/2049 (A) | 2,066 | 1,845 | ||||||
4.500%, 05/15/2035 | 5,835 | 5,533 | ||||||
4.350%, 06/15/2045 | 3,129 | 2,743 | ||||||
3.000%, 02/15/2022 | 20 | 20 | ||||||
Centel Capital | ||||||||
9.000%, 10/15/2019 | 25 | 29 | ||||||
Deutsche Telekom International Finance | ||||||||
9.250%, 06/01/2032 | 2,536 | 3,891 | ||||||
Rogers Communications | ||||||||
5.450%, 10/01/2043 | 4,000 | 4,451 | ||||||
SES Global Americas Holdings | ||||||||
5.300%, 03/25/2044 (A) | 6,621 | 5,694 | ||||||
Verizon Communications | ||||||||
7.350%, 04/01/2039 | 2,275 | 2,938 | ||||||
6.550%, 09/15/2043 | 815 | 1,016 | ||||||
6.000%, 04/01/2041 | 1,420 | 1,636 | ||||||
5.012%, 08/21/2054 | 9,502 | 9,404 | ||||||
4.272%, 01/15/2036 | 4,535 | 4,334 | ||||||
Vodafone Group | ||||||||
7.875%, 02/15/2030 | 1,605 | 2,099 | ||||||
|
| |||||||
| 64,504 | ||||||||
|
| |||||||
Utilities — 15.1% | ||||||||
AEP Transmission LLC | ||||||||
4.000%, 12/01/2046 (A) | 5,703 | 5,668 | ||||||
AGL Capital | ||||||||
5.875%, 03/15/2041 | 600 | 692 | ||||||
Alabama Power | ||||||||
5.200%, 06/01/2041 | 155 | 176 | ||||||
5.125%, 02/15/2019 | 195 | 208 | ||||||
4.150%, 08/15/2044 | 135 | 135 | ||||||
Appalachian Power | ||||||||
6.700%, 08/15/2037 | 50 | 64 | ||||||
5.800%, 10/01/2035 | 125 | 142 | ||||||
4.600%, 03/30/2021 | 70 | 74 | ||||||
Arizona Public Service | ||||||||
8.750%, 03/01/2019 | 455 | 521 | ||||||
5.050%, 09/01/2041 | 50 | 56 | ||||||
| SEI Institutional Investments Trust / Semi-Annual Report / November 30, 2016 | 157 |
SCHEDULE OF INVESTMENTS (Unaudited)
Long Duration Credit Fund (Continued)
November 30, 2016
| Description | Face Amount ($ Thousands) | Market Value ($ Thousands) | ||||||
4.500%, 04/01/2042 | $ | 12 | $ | 12 | ||||
Baltimore Gas & Electric | ||||||||
6.350%, 10/01/2036 | 125 | 160 | ||||||
5.200%, 06/15/2033 | 1,620 | 1,772 | ||||||
3.500%, 08/15/2046 | 3,135 | 2,834 | ||||||
Berkshire Hathaway Energy | ||||||||
6.500%, 09/15/2037 | 2,377 | 3,045 | ||||||
6.125%, 04/01/2036 | 2,301 | 2,861 | ||||||
5.950%, 05/15/2037 | 635 | 774 | ||||||
5.150%, 11/15/2043 | 470 | 523 | ||||||
Black Hills | ||||||||
4.200%, 09/15/2046 | 1,100 | 1,048 | ||||||
Boston Gas | ||||||||
4.487%, 02/15/2042 (A) | 3,472 | 3,528 | ||||||
CenterPoint Energy Houston Electric | ||||||||
4.500%, 04/01/2044 | 2,310 | 2,493 | ||||||
CenterPoint Energy Resources | ||||||||
6.250%, 02/01/2037 | 1,095 | 1,255 | ||||||
4.500%, 01/15/2021 | 40 | 42 | ||||||
Cleco Power | ||||||||
6.000%, 12/01/2040 | 650 | 793 | ||||||
Commonwealth Edison | ||||||||
4.700%, 01/15/2044 | 2,870 | 3,096 | ||||||
4.600%, 08/15/2043 | 1,220 | 1,311 | ||||||
3.700%, 03/01/2045 | 11,570 | 10,896 | ||||||
Connecticut Light & Power | ||||||||
4.150%, 06/01/2045 | 4,250 | 4,300 | ||||||
Consolidated Edison of New York | ||||||||
6.750%, 04/01/2038 | 5,026 | 6,674 | ||||||
6.200%, 06/15/2036 | 65 | 82 | ||||||
5.850%, 04/01/2018 | 180 | 190 | ||||||
5.700%, 06/15/2040 | 40 | 48 | ||||||
5.500%, 12/01/2039 | 75 | 88 | ||||||
4.625%, 12/01/2054 | 1,075 | 1,124 | ||||||
4.450%, 03/15/2044 | 650 | 677 | ||||||
3.950%, 03/01/2043 | 5,840 | 5,624 | ||||||
3.850%, 06/15/2046 | 1,490 | 1,415 | ||||||
Consumers Energy | ||||||||
4.350%, 08/31/2064 | 4,250 | 4,284 | ||||||
Dominion Resources | ||||||||
5.250%, 08/01/2033 | 20 | 21 | ||||||
4.900%, 08/01/2041 | 2,885 | 2,980 | ||||||
4.050%, 09/15/2042 | 450 | 419 | ||||||
DTE Electric | ||||||||
3.950%, 06/15/2042 | 80 | 79 | ||||||
3.900%, 06/01/2021 | 30 | 32 | ||||||
3.700%, 03/15/2045 | 7,575 | 7,271 | ||||||
Duke Energy | ||||||||
3.550%, 09/15/2021 | 17 | 18 | ||||||
Duke Energy Carolinas LLC | ||||||||
6.450%, 10/15/2032 | 110 | 140 | ||||||
6.100%, 06/01/2037 | 2,010 | 2,477 | ||||||
| Description | Face Amount ($ Thousands) | Market Value ($ Thousands) | ||||||
6.050%, 04/15/2038 | $ | 2,035 | $ | 2,550 | ||||
5.300%, 02/15/2040 | 7,659 | 8,916 | ||||||
4.250%, 12/15/2041 | 2,000 | 2,033 | ||||||
4.000%, 09/30/2042 | 14,915 | 14,655 | ||||||
3.900%, 06/15/2021 | 50 | 53 | ||||||
3.875%, 03/15/2046 | 4,100 | 3,964 | ||||||
3.750%, 06/01/2045 | 500 | 470 | ||||||
Duke Energy Florida | ||||||||
6.400%, 06/15/2038 | 3,035 | 3,956 | ||||||
Duke Energy Florida LLC | ||||||||
3.400%, 10/01/2046 | 1,315 | 1,164 | ||||||
Duke Energy Florida Project Finance LLC | ||||||||
3.112%, 09/01/2036 | 4,675 | 4,248 | ||||||
Duke Energy Indiana LLC | ||||||||
6.450%, 04/01/2039 | 4,275 | 5,607 | ||||||
6.350%, 08/15/2038 | 3,185 | 4,102 | ||||||
4.900%, 07/15/2043 | 930 | 1,033 | ||||||
Duke Energy Progress LLC | ||||||||
4.375%, 03/30/2044 | 2,270 | 2,341 | ||||||
4.200%, 08/15/2045 | 4,810 | 4,818 | ||||||
4.150%, 12/01/2044 | 1,250 | 1,241 | ||||||
4.100%, 05/15/2042 | 530 | 522 | ||||||
3.700%, 10/15/2046 | 650 | 603 | ||||||
Duquesne Light Holdings | ||||||||
6.250%, 08/15/2035 | 2,500 | 2,653 | ||||||
Electricite de France | ||||||||
6.000%, 01/22/2114 (A) | 9,903 | 9,690 | ||||||
4.950%, 10/13/2045 (A) | 3,625 | 3,644 | ||||||
4.750%, 10/13/2035 (A) | 1,625 | 1,637 | ||||||
Elm Road Generating Station Supercritical | ||||||||
5.848%, 01/19/2041 (A) | 1,000 | 1,084 | ||||||
Entergy Louisiana LLC | ||||||||
4.440%, 01/15/2026 | 1,510 | 1,594 | ||||||
3.250%, 04/01/2028 | 3,475 | 3,437 | ||||||
Entergy Mississippi | ||||||||
2.850%, 06/01/2028 | 4,370 | 4,167 | ||||||
Exelon | ||||||||
4.950%, 06/15/2035 | 1,685 | 1,769 | ||||||
Exelon Generation LLC | ||||||||
5.200%, 10/01/2019 | 100 | 107 | ||||||
Florida Power & Light | ||||||||
5.960%, 04/01/2039 | 2,570 | 3,271 | ||||||
5.690%, 03/01/2040 | 5,728 | 7,134 | ||||||
5.650%, 02/01/2037 | 1,000 | 1,214 | ||||||
4.050%, 06/01/2042 | 3,460 | 3,522 | ||||||
4.050%, 10/01/2044 | 3,215 | 3,260 | ||||||
3.800%, 12/15/2042 | 4,720 | 4,621 | ||||||
Georgia Power | ||||||||
5.650%, 03/01/2037 | 105 | 122 | ||||||
5.400%, 06/01/2040 | 11,470 | 12,887 | ||||||
4.300%, 03/15/2042 | 10,330 | 10,334 | ||||||
4.300%, 03/15/2043 | 2,945 | 2,982 | ||||||
| 158 | SEI Institutional Investments Trust / Semi-Annual Report / November 30, 2016 |
| Description | Face Amount ($ Thousands) | Market Value ($ Thousands) | ||||||
Gulf Power | ||||||||
4.550%, 10/01/2044 | $ | 1,500 | $ | 1,468 | ||||
Indianapolis Power & Light | ||||||||
4.700%, 09/01/2045 (A) | 3,870 | 4,065 | ||||||
4.650%, 06/01/2043 (A) | 4,250 | 4,319 | ||||||
International Transmission | ||||||||
4.625%, 08/15/2043 (A) | 1,975 | 2,069 | ||||||
Jersey Central Power & Light | ||||||||
6.150%, 06/01/2037 | 775 | 884 | ||||||
John Sevier Combined Cycle Generation | ||||||||
4.626%, 01/15/2042 | 6,816 | 7,149 | ||||||
Kansas Gas & Electric | ||||||||
4.300%, 07/15/2044 (A) | 3,275 | 3,358 | ||||||
Kentucky Utilities | ||||||||
5.125%, 11/01/2040 | 2,565 | 2,930 | ||||||
KeySpan Gas East | ||||||||
5.819%, 04/01/2041 (A) | 4,951 | 5,810 | ||||||
Louisville Gas & Electric | ||||||||
4.650%, 11/15/2043 | 3,390 | 3,703 | ||||||
MidAmerican Energy | ||||||||
4.800%, 09/15/2043 | 5,260 | 5,832 | ||||||
4.400%, 10/15/2044 | 7,655 | 8,053 | ||||||
Monongahela Power | ||||||||
5.400%, 12/15/2043 (A) | 2,930 | 3,398 | ||||||
Narragansett Electric | ||||||||
4.170%, 12/10/2042 (A) | 1,000 | 974 | ||||||
Nevada Power | ||||||||
6.650%, 04/01/2036 | 100 | 130 | ||||||
Niagara Mohawk Power | ||||||||
4.278%, 10/01/2034 (A) | 5,244 | 5,358 | ||||||
4.119%, 11/28/2042 (A) | 2,000 | 1,917 | ||||||
NiSource Finance | ||||||||
5.950%, 06/15/2041 | 220 | 256 | ||||||
5.800%, 02/01/2042 | 900 | 1,053 | ||||||
Northern States Power | ||||||||
6.250%, 06/01/2036 | 1,176 | 1,526 | ||||||
6.200%, 07/01/2037 | 3,640 | 4,745 | ||||||
4.850%, 08/15/2040 | 3,400 | 3,807 | ||||||
3.400%, 08/15/2042 | 464 | 425 | ||||||
Oglethorpe Power | ||||||||
5.375%, 11/01/2040 | 2,735 | 3,015 | ||||||
5.250%, 09/01/2050 | 1,205 | 1,274 | ||||||
4.250%, 04/01/2046 | 1,630 | 1,553 | ||||||
4.200%, 12/01/2042 | 3,740 | 3,581 | ||||||
Ohio Edison | ||||||||
8.250%, 10/15/2038 | 395 | 556 | ||||||
Oklahoma Gas & Electric | ||||||||
4.550%, 03/15/2044 | 1,395 | 1,480 | ||||||
Oncor Electric Delivery | ||||||||
7.500%, 09/01/2038 | 200 | 283 | ||||||
7.000%, 09/01/2022 | 85 | 104 | ||||||
6.800%, 09/01/2018 | 35 | 38 | ||||||
| Description | Face Amount ($ Thousands) | Market Value ($ Thousands) | ||||||
5.250%, 09/30/2040 | $ | 1,650 | $ | 1,901 | ||||
4.550%, 12/01/2041 | 4,700 | 5,003 | ||||||
Oncor Electric Delivery LLC | ||||||||
5.300%, 06/01/2042 | 1,450 | 1,700 | ||||||
One Gas | ||||||||
4.658%, 02/01/2044 | 1,420 | 1,487 | ||||||
Pacific Gas & Electric | ||||||||
6.250%, 03/01/2039 | 4,640 | 5,952 | ||||||
6.050%, 03/01/2034 | 7,504 | 9,335 | ||||||
4.600%, 06/15/2043 | 8,520 | 9,043 | ||||||
4.450%, 04/15/2042 | 5,495 | 5,714 | ||||||
4.000%, 12/01/2046 | 2,391 | 2,333 | ||||||
3.250%, 09/15/2021 | 18 | 18 | ||||||
PacifiCorp | ||||||||
6.250%, 10/15/2037 | 3,475 | 4,504 | ||||||
6.000%, 01/15/2039 | 5,065 | 6,440 | ||||||
4.100%, 02/01/2042 | 2,725 | 2,726 | ||||||
PECO Energy | ||||||||
4.800%, 10/15/2043 | 1,505 | 1,658 | ||||||
Pennsylvania Electric | ||||||||
6.150%, 10/01/2038 | 100 | 112 | ||||||
6.050%, 09/01/2017 | 50 | 51 | ||||||
Piedmont Natural Gas | ||||||||
4.650%, 08/01/2043 | 830 | 858 | ||||||
3.640%, 11/01/2046 | 1,300 | 1,149 | ||||||
Potomac Electric Power | ||||||||
4.950%, 11/15/2043 | 950 | 1,070 | ||||||
PPL Electric Utilities | ||||||||
5.200%, 07/15/2041 | 1,100 | 1,264 | ||||||
4.750%, 07/15/2043 | 3,600 | 3,970 | ||||||
Progress Energy | ||||||||
4.400%, 01/15/2021 | 25 | 27 | ||||||
PSEG Power LLC | ||||||||
5.125%, 04/15/2020 | 50 | 54 | ||||||
Public Service Electric & Gas MTN | ||||||||
4.150%, 11/01/2045 | 700 | 724 | ||||||
4.050%, 05/01/2045 | 1,800 | 1,822 | ||||||
4.000%, 06/01/2044 | 695 | 704 | ||||||
3.650%, 09/01/2042 | 1,905 | 1,812 | ||||||
Public Service of Colorado | ||||||||
6.250%, 09/01/2037 | 1,960 | 2,515 | ||||||
4.300%, 03/15/2044 | 1,780 | 1,859 | ||||||
3.950%, 03/15/2043 | 5,845 | 5,807 | ||||||
2.900%, 05/15/2025 | 4,730 | 4,688 | ||||||
Public Service of Oklahoma | ||||||||
4.400%, 02/01/2021 | 27 | 29 | ||||||
Puget Sound Energy | ||||||||
5.795%, 03/15/2040 | 130 | 159 | ||||||
San Diego Gas & Electric | ||||||||
6.000%, 06/01/2026 | 625 | 765 | ||||||
Sempra Energy | ||||||||
9.800%, 02/15/2019 | 50 | 58 | ||||||
| SEI Institutional Investments Trust / Semi-Annual Report / November 30, 2016 | 159 |
SCHEDULE OF INVESTMENTS (Unaudited)
Long Duration Credit Fund (Continued)
November 30, 2016
| Description | Face Amount ($ Thousands) | Market Value ($ Thousands) | ||||||
6.000%, 10/15/2039 | $ | 2,740 | $ | 3,243 | ||||
South Carolina Electric & Gas | ||||||||
5.450%, 02/01/2041 | 605 | 686 | ||||||
5.100%, 06/01/2065 | 5,915 | 6,145 | ||||||
Southern California Edison | ||||||||
6.000%, 01/15/2034 | 175 | 217 | ||||||
5.950%, 02/01/2038 | 510 | 648 | ||||||
5.500%, 03/15/2040 | 70 | 84 | ||||||
5.350%, 07/15/2035 | 2,240 | 2,605 | ||||||
4.650%, 10/01/2043 | 9,509 | 10,447 | ||||||
4.050%, 03/15/2042 | 7,405 | 7,396 | ||||||
Southern California Gas | ||||||||
3.750%, 09/15/2042 | 3,150 | 3,072 | ||||||
Southern Gas Capital | ||||||||
4.400%, 06/01/2043 | 665 | 655 | ||||||
3.950%, 10/01/2046 | 400 | 368 | ||||||
3.500%, 09/15/2021 | 68 | 70 | ||||||
Southwest Gas | ||||||||
3.800%, 09/29/2046 | 1,025 | 925 | ||||||
Southwestern Electric Power | ||||||||
6.200%, 03/15/2040 | 1,204 | 1,451 | ||||||
3.900%, 04/01/2045 | 780 | 719 | ||||||
Southwestern Public Service | ||||||||
8.750%, 12/01/2018 | 40 | 45 | ||||||
4.500%, 08/15/2041 | 10,725 | 11,195 | ||||||
Tampa Electric | ||||||||
4.350%, 05/15/2044 | 1,225 | 1,220 | ||||||
Union Electric | ||||||||
8.450%, 03/15/2039 | 2,780 | 4,305 | ||||||
Virginia Electric & Power | ||||||||
6.350%, 11/30/2037 | 630 | 808 | ||||||
4.650%, 08/15/2043 | 2,530 | 2,719 | ||||||
4.450%, 02/15/2044 | 4,500 | 4,695 | ||||||
4.200%, 05/15/2045 | 1,750 | 1,781 | ||||||
4.000%, 11/15/2046 | 1,720 | 1,708 | ||||||
Wisconsin Electric Power | ||||||||
4.250%, 06/01/2044 | 850 | 876 | ||||||
3.650%, 12/15/2042 | 3,930 | 3,659 | ||||||
2.950%, 09/15/2021 | 3 | 3 | ||||||
Wisconsin Power & Light | ||||||||
4.100%, 10/15/2044 | 325 | 328 | ||||||
Wisconsin Public Service | ||||||||
4.752%, 11/01/2044 | 3,615 | 4,001 | ||||||
|
| |||||||
| 472,025 | ||||||||
|
| |||||||
Total Corporate Obligations (Cost $2,708,377) ($ Thousands) | 2,691,639 | |||||||
|
| |||||||
| Description | Face Amount ($ Thousands) | Market Value ($ Thousands) | ||||||
MUNICIPAL BONDS — 7.5% | ||||||||
California — 3.4% | ||||||||
Bay Area, Toll Authority, Build America Project, RB | ||||||||
6.263%, 04/01/2049 | $ | 6,745 | $ | 9,167 | ||||
California State, Build America Project, GO | ||||||||
7.550%, 04/01/2039 | 10,155 | 15,038 | ||||||
7.500%, 04/01/2034 | 13,085 | 18,424 | ||||||
Los Angeles, Community College District, Ser D, GO | ||||||||
6.680%, 08/01/2036 | 500 | 660 | ||||||
Los Angeles, Department of Water & Power, Build America Project, RB | ||||||||
6.574%, 07/01/2045 | 4,530 | 6,220 | ||||||
Los Angeles, Department of Water & Power, RB | ||||||||
5.716%, 07/01/2039 | 1,510 | 1,827 | ||||||
Los Angeles, Department of Water & Power, Ser C, RB | ||||||||
5.516%, 07/01/2027 | 955 | 1,127 | ||||||
Los Angeles, Unified School District, Build America Project, Ser RY, GO | ||||||||
6.758%, 07/01/2034 | 7,000 | 9,507 | ||||||
San Diego County, Water Authority, Build America Project, RB | ||||||||
6.138%, 05/01/2049 | 1,750 | 2,275 | ||||||
Santa Clara Valley, Transportation Authority, Build America Project, RB | ||||||||
5.876%, 04/01/2032 | 3,455 | 4,206 | ||||||
State of California, Build America Project, GO | ||||||||
7.625%, 03/01/2040 | 1,370 | 2,012 | ||||||
7.300%, 10/01/2039 | 11,750 | 16,568 | ||||||
University of California, Build America Project, RB | ||||||||
5.770%, 05/15/2043 | 5,100 | 6,229 | ||||||
University of California, Ser AD, RB | ||||||||
4.858%, 05/15/2112 | 6,337 | 6,062 | ||||||
University of California, Ser AP, RB | ||||||||
3.931%, 05/15/2045 | 950 | 931 | ||||||
University of California, Ser AQ, RB | ||||||||
4.767%, 05/15/2115 | 4,529 | 4,286 | ||||||
University of California, Ser J, RB | ||||||||
4.131%, 05/15/2045 | 1,000 | 999 | ||||||
|
| |||||||
| 105,538 | ||||||||
|
| |||||||
District of Columbia — 0.0% | ||||||||
District of Columbia, Water & Sewer Authority, RB | ||||||||
4.814%, 10/01/2114 | 530 | 535 | ||||||
|
| |||||||
| 160 | SEI Institutional Investments Trust / Semi-Annual Report / November 30, 2016 |
| Description | Face Amount ($ Thousands) | Market Value ($ Thousands) | ||||||
Georgia — 0.2% | ||||||||
Municipal Electric Authority of Georgia, Build America Project, RB | ||||||||
7.055%, 04/01/2057 | $ | 2,235 | $ | 2,552 | ||||
6.637%, 04/01/2057 | 3,909 | 4,852 | ||||||
|
| |||||||
| 7,404 | ||||||||
|
| |||||||
Illinois — 0.2% | ||||||||
Illinois State, GO | ||||||||
5.100%, 06/01/2033 | 2,285 | 2,046 | ||||||
Metropolitan Water Reclamation District of Greater Chicago, Build America Project, GO | ||||||||
5.720%, 12/01/2038 | 3,205 | 3,862 | ||||||
|
| |||||||
| 5,908 | ||||||||
|
| |||||||
Kansas — 0.2% | ||||||||
Kansas State, Development Finance Authority, Ser H, RB | ||||||||
4.727%, 04/15/2037 | 6,300 | 6,542 | ||||||
|
| |||||||
Massachusetts — 0.3% | ||||||||
Commonwealth of Massachusetts, Build America Project, GO | ||||||||
4.910%, 05/01/2029 | 555 | 645 | ||||||
Commonwealth of Massachusetts, GO | ||||||||
5.456%, 12/01/2039 | 5,085 | 6,332 | ||||||
Commonwealth of Massachusetts, Ser D, GO | ||||||||
4.500%, 08/01/2031 | 330 | 369 | ||||||
Commonwealth of Massachusetts, Ser F, GO | ||||||||
3.277%, 06/01/2046 | 660 | 611 | ||||||
|
| |||||||
| 7,957 | ||||||||
|
| |||||||
Michigan — 0.0% | ||||||||
Michigan State University, Build America Project, RB Callable 02/15/2030 @ 100 | ||||||||
6.173%, 02/15/2050 | 850 | 1,013 | ||||||
|
| |||||||
Missouri — 0.0% | ||||||||
Health & Educational Facilities Authority of the State of Missouri, RB | ||||||||
3.086%, 09/15/2051 | 1,555 | 1,317 | ||||||
|
| |||||||
New Jersey — 0.4% | ||||||||
New Jersey Turnpike Authority, RB | ||||||||
7.414%, 01/01/2040 | 2,895 | 4,217 | ||||||
7.102%, 01/01/2041 | 5,985 | 8,377 | ||||||
|
| |||||||
| 12,594 | ||||||||
|
| |||||||
New York — 1.1% | ||||||||
City of New York, Build America Project, GO | ||||||||
5.985%, 12/01/2036 | 1,175 | 1,473 | ||||||
5.206%, 10/01/2031 | 750 | 863 | ||||||
| Description | Face Amount ($ Thousands) | Market Value ($ Thousands) | ||||||
New York City Transitional Finance Authority Future Tax Secured Revenue, RB | ||||||||
5.767%, 08/01/2036 | $ | 3,140 | $ | 3,869 | ||||
5.508%, 08/01/2037 | 1,890 | 2,283 | ||||||
New York City, Municipal Water Finance Authority, Build America Project, RB | ||||||||
6.011%, 06/15/2042 | 750 | 984 | ||||||
5.882%, 06/15/2044 | 500 | 650 | ||||||
5.724%, 06/15/2042 | 3,720 | 4,743 | ||||||
5.440%, 06/15/2043 | 5,500 | 6,765 | ||||||
New York City, Transitional Finance Authority, Build America Project, RB | ||||||||
5.572%, 11/01/2038 | 900 | 1,090 | ||||||
New York State, Urban Development, Build America Project, RB | ||||||||
5.770%, 03/15/2039 | 1,970 | 2,368 | ||||||
Port Authority of New York & New Jersey, RB | ||||||||
4.926%, 10/01/2051 | 245 | 272 | ||||||
4.458%, 10/01/2062 | 7,225 | 7,263 | ||||||
|
| |||||||
| 32,623 | ||||||||
|
| |||||||
North Carolina — 0.1% | ||||||||
University of North Carolina at Chapel Hill, Ser C, RB | ||||||||
3.327%, 12/01/2036 | 3,660 | 3,584 | ||||||
|
| |||||||
Ohio — 0.3% | ||||||||
American Municipal Power, RB | ||||||||
6.053%, 02/15/2043 | 2,200 | 2,629 | ||||||
Ohio State University, Ser A, RB | ||||||||
4.048%, 12/01/2056 | 4,150 | 4,102 | ||||||
Ohio Water Development Authority Water Pollution Control Loan Fund, RB | ||||||||
4.879%, 12/01/2034 | 1,795 | 2,027 | ||||||
|
| |||||||
| 8,758 | ||||||||
|
| |||||||
Pennsylvania — 0.1% | ||||||||
Commonwealth Financing Authority, Ser A, RB | ||||||||
4.144%, 06/01/2038 | 2,250 | 2,172 | ||||||
|
| |||||||
Texas — 1.0% | ||||||||
City Public Service Board of San Antonio Texas, RB | ||||||||
5.808%, 02/01/2041 | 3,800 | 4,766 | ||||||
Grand Parkway Transportation, Sub-Ser E, RB | ||||||||
5.184%, 10/01/2042 | 1,350 | 1,586 | ||||||
State of Texas, Build America Project, Ser A, GO | ||||||||
4.631%, 04/01/2033 | 1,500 | 1,712 | ||||||
Texas State, Build America Project, GO | ||||||||
5.517%, 04/01/2039 | 4,350 | 5,493 | ||||||
| SEI Institutional Investments Trust / Semi-Annual Report / November 30, 2016 | 161 |
SCHEDULE OF INVESTMENTS (Unaudited)
Long Duration Credit Fund (Concluded)
November 30, 2016
| Description | Face Amount ($ Thousands) | Market Value ($ Thousands) | ||||||
Texas Transportation Commission State Highway Fund, Ser B, RB | ||||||||
5.178%, 04/01/2030 | $ | 4,025 | $ | 4,762 | ||||
5.028%, 04/01/2026 | 6,600 | 7,577 | ||||||
University of Texas Permanent University Fund, Build America Project, RB | ||||||||
5.262%, 07/01/2039 | 4,540 | 5,529 | ||||||
University of Texas, Build America Project, Ser B, RB Callable 08/15/2019 @ 100 | ||||||||
6.276%, 08/15/2041 | 60 | 66 | ||||||
|
| |||||||
| 31,491 | ||||||||
|
| |||||||
Virginia — 0.0% | ||||||||
Virginia Commonwealth University, Health System Authority, Ser A, RB | ||||||||
4.956%, 01/01/2044 | 475 | 500 | ||||||
|
| |||||||
Washington — 0.2% | ||||||||
State of Washington, GO | ||||||||
5.140%, 08/01/2040 | 4,495 | 5,393 | ||||||
|
| |||||||
Total Municipal Bonds |
| 233,329 | ||||||
|
| |||||||
U.S. TREASURY OBLIGATIONS — 4.6% |
| |||||||
U.S. Treasury Bills | ||||||||
0.462%, 02/23/2017 (B) (E) | 5,170 | 5,164 | ||||||
0.335%, 01/12/2017 (B) (E) | 14,155 | 14,150 | ||||||
0.000%, 04/06/2017 (B) (E) | 8,020 | 8,006 | ||||||
U.S. Treasury Bonds | ||||||||
2.875%, 11/15/2046 | 8,020 | 7,795 | ||||||
2.500%, 02/15/2046 | 16,225 | 14,523 | ||||||
2.500%, 05/15/2046 | 31,840 | 28,494 | ||||||
2.250%, 08/15/2046 | 58,475 | 49,485 | ||||||
U.S. Treasury Inflation Indexed Bonds | ||||||||
1.375%, 02/15/2044 | 300 | 344 | ||||||
0.750%, 02/15/2045 | 1,820 | 1,783 | ||||||
U.S. Treasury Notes | ||||||||
2.000%, 11/15/2026 | 7,525 | 7,281 | ||||||
1.500%, 08/15/2026 | 7,255 | 6,700 | ||||||
|
| |||||||
Total U.S. Treasury Obligations (Cost $149,675) ($ Thousands) | 143,725 | |||||||
|
| |||||||
U.S. GOVERNMENT AGENCY OBLIGATIONS — 0.1% |
| |||||||
Tennessee Valley Authority | ||||||||
5.880%, 04/01/2036 | 1,200 | 1,600 | ||||||
4.250%, 09/15/2065 | 2,590 | 2,678 | ||||||
|
| |||||||
| Description | Face Amount ($ Thousands) | Market Value ($ Thousands) | ||||||
Total U.S. Government Agency Obligations |
| $ | 4,278 | |||||
|
| |||||||
SOVEREIGN DEBT — 0.1% | ||||||||
Qatar Government International Bond | ||||||||
4.625%, 06/02/2046 (A) | $ | 2,050 | 2,038 | |||||
|
| |||||||
Total Sovereign Debt |
| 2,038 | ||||||
|
| |||||||
ASSET-BACKED SECURITY — 0.0% |
| |||||||
Other Asset-Backed Securities — 0.0% |
| |||||||
321 Henderson Receivables LLC, Ser 2013-3A, Cl A | ||||||||
4.080%, 01/17/2073 (A) | 473 | 479 | ||||||
|
| |||||||
Total Asset-Backed Security |
| 479 | ||||||
|
| |||||||
Shares | ||||||||
CASH EQUIVALENT — 0.8% | ||||||||
SEI Daily Income Trust, Government Fund, Cl A | ||||||||
0.210%** | 25,596,072 | 25,596 | ||||||
|
| |||||||
Total Cash Equivalent |
| 25,596 | ||||||
|
| |||||||
Total Investments — 99.1% |
| $ | 3,101,084 | |||||
|
| |||||||
The open futures contracts held by the Fund at November 30, 2016, are as follows:
| Type of Contract | Number of (Short) | Expiration Date | Unrealized Appreciation (Depreciation) ($ Thousands) | |||||||||
U.S. 10-Year Treasury Note | 79 | Mar-2017 | $ | (55 | ) | |||||||
U.S. 2-Year Treasury Note | (123 | ) | Apr-2017 | (11 | ) | |||||||
U.S. 5-Year Treasury Note | 234 | Mar-2017 | (112 | ) | ||||||||
U.S. Long Treasury Bond | (896 | ) | Mar-2017 | 343 | ||||||||
U.S. Ultra Long Treasury Bond | 567 | Mar-2017 | (220 | ) | ||||||||
Ultra 10-Year U.S. Treasury Bond | (118 | ) | Mar-2017 | 64 | ||||||||
|
| |||||||||||
| $ | 9 | |||||||||||
|
| |||||||||||
For the period ended November 30, 2016, the total amount of all open futures contracts, as presented in the table above, are representative of the volume of activity for the derivative type during the year.
Percentages are based on Net Assets of $3,128,323 ($ Thousands).
| ** | Rate shown is the 7-day effective yield as of November 30, 2016. |
| 162 | SEI Institutional Investments Trust / Semi-Annual Report / November 30, 2016 |
| (A) | Security exempt from registration under Rule 144A of the Securities Act of 1933. These securities may be resold in transactions exempt from registration normally to qualified institutions. On November 30, 2016, the value of these securities amounted to $314,025 ($ Thousands), representing 10.0% of the net assets of the Fund. |
| (B) | The rate reported is effective yield at the time of purchase. |
| (C) | Variable Rate Security — The rate reported on the Schedule of Investments is the rate in effect as of November 30, 2016. |
| (D) | Step Bonds – The rate reflected on the Schedule of Investments is the effective yield on November 30, 2016. The coupon on a step bond changes on a specified date. |
| (E) | Security, or portion thereof, has been pledged as collateral on open futures contracts. |
Cl — Class
GO — General Obligation
LLC — Limited Liability Company
MTN — Medium Term Note
RB — Revenue Bond
Ser — Series
The following is a list of the level of inputs used as of November 30, 2016, in valuing the
Fund’s investments and other financial instruments carried at value ($ Thousands):
| Investments in Securities | Level 1 | Level 2 | Level 3 | Total | ||||||||||||
Corporate Obligations | $ | — | $ | 2,691,639 | $ | — | $ | 2,691,639 | ||||||||
Municipal Bonds | — | 233,329 | — | 233,329 | ||||||||||||
U.S. Treasury Obligations | — | 143,725 | — | 143,725 | ||||||||||||
U.S. Government Agency Obligations | — | 4,278 | — | 4,278 | ||||||||||||
Sovereign Debt | — | 2,038 | — | 2,038 | ||||||||||||
Asset-Backed Security | — | 479 | — | 479 | ||||||||||||
Cash Equivalent | 25,596 | — | — | 25,596 | ||||||||||||
|
|
|
|
|
|
|
| |||||||||
Total Investments in Securities | $ | 25,596 | $ | 3,075,488 | $ | — | $ | 3,101,084 | ||||||||
|
|
|
|
|
|
|
| |||||||||
| Other Financial Instruments | Level 1 | Level 2 | Level 3 | Total | ||||||||||||
Futures Contracts * | ||||||||||||||||
Unrealized Appreciation | $ | 407 | $ | — | $ | — | $ | 407 | ||||||||
Unrealized Depreciation | (398 | ) | — | — | (398 | ) | ||||||||||
|
|
|
|
|
|
|
| |||||||||
Total Other Financial Instruments | $ | 9 | $ | — | $ | — | $ | 9 | ||||||||
|
|
|
|
|
|
|
| |||||||||
| * | Futures contracts are valued at the unrealized appreciation (depreciation) on the instrument. |
For the period ended November 30, 2016, there were no transfers between Level 1 and Level 2 assets and liabilities.
For the period ended November 30, 2016, there were no transfers between Level 2 and Level 3 assets and liabilities.
For more information on valuation inputs, see Note 2 – Significant Accounting Policies in Notes to Financial Statements.
Amounts designated as “—” are $0 or have been rounded to $0.
The accompanying notes are an integral part of the financial statements.
| SEI Institutional Investments Trust / Semi-Annual Report / November 30, 2016 | 163 |
SCHEDULE OF INVESTMENTS (Unaudited)
Ultra Short Duration Bond Fund
November 30, 2016
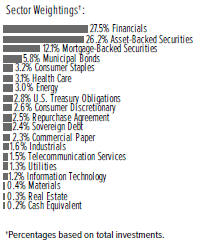
| Description | Face Amount ($ Thousands) | Market Value ($ Thousands) | ||||||
CORPORATE OBLIGATIONS — 46.8% |
| |||||||
Consumer Discretionary — 2.6% | ||||||||
AutoZone | ||||||||
1.625%, 04/21/2019 | $ | 160 | $ | 159 | ||||
BMW US Capital LLC | ||||||||
1.260%, 09/13/2019 (A) (B) | 2,035 | 2,033 | ||||||
Daimler Finance North America LLC | ||||||||
1.598%, 07/05/2019 (A) (B) | 1,810 | 1,820 | ||||||
Ford Motor Credit LLC | ||||||||
2.021%, 05/03/2019 | 1,300 | 1,285 | ||||||
1.750%, 06/15/2018 (A) | 1,940 | 1,947 | ||||||
1.724%, 12/06/2017 | 750 | 749 | ||||||
1.675%, 03/12/2019 (A) | 1,000 | 1,001 | ||||||
1.361%, 09/08/2017 (A) | 1,480 | 1,480 | ||||||
NBCUniversal Enterprise | ||||||||
1.565%, 04/15/2018 (A) (B) | 1,400 | 1,410 | ||||||
Thomson Reuters | ||||||||
1.650%, 09/29/2017 | 1,190 | 1,191 | ||||||
Time Warner Cable | ||||||||
5.850%, 05/01/2017 | 950 | 967 | ||||||
|
| |||||||
| 14,042 | ||||||||
|
| |||||||
Consumer Staples — 3.3% | ||||||||
Anheuser-Busch InBev Finance | ||||||||
2.146%, 02/01/2021 (A) | 800 | 821 | ||||||
1.900%, 02/01/2019 | 640 | 640 | ||||||
Baxalta | ||||||||
1.646%, 06/22/2018 (A) | 3,300 | 3,301 | ||||||
Catholic Health Initiatives | ||||||||
1.600%, 11/01/2017 | 2,650 | 2,651 | ||||||
CVS Health | ||||||||
1.900%, 07/20/2018 | 1,000 | 1,002 | ||||||
JM Smucker | ||||||||
1.750%, 03/15/2018 | 380 | 381 | ||||||
Kroger | ||||||||
2.000%, 01/15/2019 | 290 | 291 | ||||||
| Description | Face Amount ($ Thousands) | Market Value ($ Thousands) | ||||||
Kroger MTN | ||||||||
1.500%, 09/30/2019 | $ | 615 | $ | 605 | ||||
Molson Coors Brewing | ||||||||
1.450%, 07/15/2019 | 240 | 236 | ||||||
Mondelez International | ||||||||
1.406%, 02/01/2019 (A) | 1,500 | 1,500 | ||||||
Mondelez International Holdings Netherlands BV | ||||||||
1.500%, 10/28/2019 (A) (B) | 1,695 | 1,695 | ||||||
Reynolds American | ||||||||
2.300%, 06/12/2018 | 1,070 | 1,078 | ||||||
SABMiller Holdings | ||||||||
1.576%, 08/01/2018 (A) (B) | 750 | 751 | ||||||
Walgreens Boots Alliance | ||||||||
1.750%, 11/17/2017 | 1,700 | 1,705 | ||||||
1.750%, 05/30/2018 | 850 | 852 | ||||||
|
| |||||||
| 17,509 | ||||||||
|
| |||||||
Energy — 3.1% | ||||||||
Anadarko Petroleum | ||||||||
6.950%, 06/15/2019 | 470 | 519 | ||||||
BP Capital Markets (A) | ||||||||
1.392%, 05/10/2018 | 1,500 | 1,503 | ||||||
1.327%, 02/13/2018 | 1,000 | 1,001 | ||||||
ConocoPhillips | ||||||||
1.500%, 05/15/2018 | 790 | 786 | ||||||
Devon Energy | ||||||||
1.390%, 12/15/2016 (A) | 1,450 | 1,450 | ||||||
Enbridge | ||||||||
1.289%, 06/02/2017 (A) | 1,575 | 1,573 | ||||||
Energy Transfer Partners | ||||||||
2.500%, 06/15/2018 | 800 | 801 | ||||||
Kinder Morgan | ||||||||
2.000%, 12/01/2017 | 785 | 786 | ||||||
Noble Energy | ||||||||
8.250%, 03/01/2019 | 595 | 668 | ||||||
Schlumberger Holdings | ||||||||
1.900%, 12/21/2017 (B) | 1,250 | 1,254 | ||||||
Schlumberger Norge | ||||||||
1.250%, 08/01/2017 (B) | 205 | 205 | ||||||
Shell International Finance | ||||||||
1.375%, 05/10/2019 | 750 | 741 | ||||||
Shell International Finance BV | ||||||||
1.195%, 09/12/2019 (A) | 1,385 | 1,388 | ||||||
Statoil | ||||||||
1.087%, 11/09/2017 (A) | 1,350 | 1,351 | ||||||
Suncor Energy | ||||||||
6.100%, 06/01/2018 | 875 | 927 | ||||||
TransCanada PipeLines | ||||||||
1.664%, 01/12/2018 (A) | 1,600 | 1,607 | ||||||
|
| |||||||
| 16,560 | ||||||||
|
| |||||||
| 164 | SEI Institutional Investments Trust / Semi-Annual Report / November 30, 2016 |
| Description | Face Amount ($ Thousands) | Market Value ($ Thousands) | ||||||
Financials — 28.2% | ||||||||
AIG Global Funding MTN | ||||||||
1.650%, 12/15/2017 (B) | $ | 1,050 | $ | 1,054 | ||||
American Express Credit MTN | ||||||||
1.875%, 11/05/2018 | 1,100 | 1,103 | ||||||
1.166%, 09/22/2017 (A) | 925 | 926 | ||||||
1.105%, 06/05/2017 (A) | 1,720 | 1,721 | ||||||
American Honda Finance MTN (A) | ||||||||
1.741%, 02/22/2019 | 1,850 | 1,872 | ||||||
1.338%, 07/13/2018 | 1,500 | 1,505 | ||||||
Australia & New Zealand Banking Group | ||||||||
1.466%, 05/15/2018 (A) | 625 | 627 | ||||||
Banco Santander Chile | ||||||||
1.776%, 04/11/2017 (A) (B) | 1,200 | 1,197 | ||||||
Bank Nederlandse Gemeenten MTN | ||||||||
0.951%, 07/14/2017 (A) (B) | 3,750 | 3,750 | ||||||
Bank of America MTN | ||||||||
5.650%, 05/01/2018 | 305 | 320 | ||||||
2.000%, 01/11/2018 | 545 | 546 | ||||||
1.700%, 08/25/2017 | 1,100 | 1,102 | ||||||
1.540%, 08/25/2017 (A) | 1,790 | 1,792 | ||||||
Bank of America | ||||||||
5.300%, 03/15/2017 | 900 | 910 | ||||||
1.920%, 01/15/2019 (A) | 1,000 | 1,008 | ||||||
1.150%, 06/15/2017 (A) | 1,560 | 1,560 | ||||||
Bank of Montreal MTN | ||||||||
1.476%, 04/09/2018 (A) | 1,000 | 1,004 | ||||||
Bank of Montreal | ||||||||
1.950%, 01/30/2017 (B) | 1,780 | 1,782 | ||||||
1.400%, 04/10/2018 | 925 | 923 | ||||||
Bank of New York Mellon MTN (A) | ||||||||
1.325%, 09/11/2019 | 2,000 | 2,003 | ||||||
1.275%, 03/06/2018 | 700 | 701 | ||||||
Bank of Nova Scotia | ||||||||
2.125%, 09/11/2019 | 1,620 | 1,628 | ||||||
1.710%, 01/15/2019 (A) | 1,470 | 1,483 | ||||||
Bank of Tokyo-Mitsubishi UFJ | ||||||||
1.450%, 09/08/2017 (B) | 1,000 | 998 | ||||||
1.151%, 09/08/2017 (A) (B) | 1,025 | 1,023 | ||||||
Barclays Bank PLC MTN | ||||||||
6.050%, 12/04/2017 (B) | 1,500 | 1,555 | ||||||
BB&T MTN(A) | ||||||||
1.710%, 06/15/2018 | 890 | 895 | ||||||
1.546%, 02/01/2019 | 800 | 803 | ||||||
Berkshire Hathaway Finance | ||||||||
1.174%, 01/12/2018 (A) | 1,195 | 1,198 | ||||||
Canadian Imperial Bank of Commerce | ||||||||
1.355%, 09/06/2019 (A) | 1,225 | 1,226 | ||||||
Capital One(A) | ||||||||
2.056%, 08/17/2018 | 1,150 | 1,161 | ||||||
1.561%, 02/05/2018 | 1,100 | 1,102 | ||||||
| Description | Face Amount ($ Thousands) | Market Value ($ Thousands) | ||||||
Capital One Bank USA | ||||||||
1.300%, 06/05/2017 | $ | 2,500 | $ | 2,498 | ||||
Citigroup | ||||||||
1.700%, 04/27/2018 | 850 | 848 | ||||||
1.642%, 04/08/2019 (A) | 1,000 | 1,001 | ||||||
1.630%, 11/24/2017 (A) | 580 | 582 | ||||||
1.424%, 04/27/2018 (A) | 1,680 | 1,684 | ||||||
1.385%, 03/10/2017 (A) | 1,500 | 1,501 | ||||||
Citizens Bank MTN | ||||||||
1.600%, 12/04/2017 | 2,000 | 1,997 | ||||||
Cooperatieve Rabobank UA MTN | ||||||||
3.375%, 01/19/2017 | 1,250 | 1,254 | ||||||
Credit Agricole MTN | ||||||||
1.815%, 06/10/2020 (A) (B) | 500 | 502 | ||||||
Credit Suisse NY | ||||||||
1.700%, 04/27/2018 | 1,275 | 1,271 | ||||||
Credit Suisse NY MTN (A) | ||||||||
1.577%, 01/29/2018 | 1,100 | 1,103 | ||||||
1.427%, 05/26/2017 | 1,780 | 1,781 | ||||||
Daimler Finance North America LLC | ||||||||
1.650%, 05/18/2018 (B) | 800 | 798 | ||||||
1.500%, 07/05/2019 (B) | 670 | 659 | ||||||
Deutsche Bank | ||||||||
1.582%, 02/13/2018 (A) | 1,100 | 1,082 | ||||||
1.350%, 05/30/2017 | 1,250 | 1,245 | ||||||
DNB Boligkreditt | ||||||||
1.450%, 03/21/2018 (B) | 4,075 | 4,072 | ||||||
Fifth Third Bank | ||||||||
1.443%, 09/27/2019 (A) | 1,210 | 1,210 | ||||||
Fifth Third Bank MTN | ||||||||
1.821%, 08/20/2018 (A) | 1,250 | 1,259 | ||||||
General Electric MTN | ||||||||
1.556%, 04/02/2018 (A) | 500 | 504 | ||||||
General Motors Financial | ||||||||
2.400%, 04/10/2018 | 1,600 | 1,601 | ||||||
Goldman Sachs Group MTN (A) | ||||||||
2.006%, 11/15/2018 | 1,375 | 1,389 | ||||||
1.650%, 12/15/2017 | 1,730 | 1,736 | ||||||
Goldman Sachs Group | ||||||||
2.375%, 01/22/2018 | 2,300 | 2,315 | ||||||
2.087%, 04/30/2018 (A) | 215 | 217 | ||||||
2.042%, 04/23/2020 (A) | 875 | 886 | ||||||
HSBC Bank | ||||||||
1.546%, 05/15/2018 (A) (B) | 2,155 | 2,156 | ||||||
HSBC USA | ||||||||
1.300%, 06/23/2017 | 1,850 | 1,849 | ||||||
Huntington National Bank | ||||||||
2.200%, 11/06/2018 | 1,225 | 1,229 | ||||||
Hyundai Capital America MTN | ||||||||
2.000%, 03/19/2018 (B) | 560 | 560 | ||||||
2.000%, 07/01/2019 (B) | 500 | 496 | ||||||
| SEI Institutional Investments Trust / Semi-Annual Report / November 30, 2016 | 165 |
SCHEDULE OF INVESTMENTS (Unaudited)
Ultra Short Duration Bond Fund (Continued)
November 30, 2016
| Description | Face Amount ($ Thousands) | Market Value ($ Thousands) | ||||||
ING Bank | ||||||||
1.536%, 10/01/2019 (A) (B) | $ | 1,300 | $ | 1,304 | ||||
JPMorgan Chase(A) | ||||||||
1.837%, 01/23/2020 | 700 | 706 | ||||||
1.615%, 01/25/2018 | 2,205 | 2,220 | ||||||
1.520%, 01/28/2019 | 1,000 | 1,004 | ||||||
JPMorgan Chase MTN | ||||||||
1.352%, 03/01/2018 (A) | 1,100 | 1,100 | ||||||
KeyBank | ||||||||
2.350%, 03/08/2019 | 750 | 756 | ||||||
1.726%, 11/22/2021 (A) | 1,300 | 1,303 | ||||||
Manufacturers & Traders Trust | ||||||||
1.400%, 07/25/2017 | 1,150 | 1,151 | ||||||
1.182%, 07/25/2017 (A) | 950 | 951 | ||||||
Metropolitan Life Global Funding I | ||||||||
1.500%, 01/10/2018 (B) | 740 | 741 | ||||||
1.192%, 09/14/2018 (A) (B) | 600 | 600 | ||||||
Mizuho Bank | ||||||||
1.307%, 09/25/2017 (A) (B) | 3,240 | 3,238 | ||||||
Morgan Stanley MTN | ||||||||
5.950%, 12/28/2017 | 550 | 574 | ||||||
4.750%, 03/22/2017 | 1,043 | 1,054 | ||||||
2.162%, 04/25/2018 (A) | 1,000 | 1,013 | ||||||
Morgan Stanley | ||||||||
1.732%, 01/24/2019 (A) | 750 | 754 | ||||||
Nissan Motor Acceptance MTN | ||||||||
1.385%, 03/03/2017 (A) (B) | 615 | 616 | ||||||
PNC Bank | ||||||||
1.800%, 11/05/2018 | 2,565 | 2,569 | ||||||
Pricoa Global Funding I | ||||||||
1.350%, 08/18/2017 (B) | 1,200 | 1,201 | ||||||
Principal Life Global Funding II | ||||||||
1.500%, 04/18/2019 (B) | 500 | 494 | ||||||
Principal Life Global Funding II MTN | ||||||||
1.125%, 02/24/2017 (B) | 550 | 550 | ||||||
Protective Life Global Funding | ||||||||
1.722%, 04/15/2019 (B) | 1,065 | 1,060 | ||||||
Prudential Financial MTN | ||||||||
6.000%, 12/01/2017 | 2,120 | 2,210 | ||||||
1.686%, 08/15/2018 (A) | 1,649 | 1,646 | ||||||
Royal Bank of Canada MTN | ||||||||
1.625%, 04/15/2019 | 1,000 | 992 | ||||||
Santander Bank | ||||||||
1.804%, 01/12/2018 (A) | 1,250 | 1,250 | ||||||
Santander Holdings USA | ||||||||
2.380%, 11/24/2017 (A) | 1,500 | 1,510 | ||||||
Santander UK | ||||||||
1.264%, 09/29/2017 (A) | 1,500 | 1,498 | ||||||
Santander UK MTN | ||||||||
1.780%, 08/24/2018 (A) | 1,250 | 1,252 | ||||||
Societe Generale MTN | ||||||||
1.926%, 10/01/2018 (A) | 2,500 | 2,516 | ||||||
| Description | Face Amount ($ Thousands) | Market Value ($ Thousands) | ||||||
Standard Chartered MTN | ||||||||
1.520%, 04/17/2018 (A) (B) | $ | 2,000 | $ | 1,992 | ||||
Sumitomo Mitsui Banking MTN | ||||||||
1.822%, 01/18/2019 (A) | 1,550 | 1,557 | ||||||
Synchrony Financial | ||||||||
2.111%, 02/03/2020 (A) | 1,750 | 1,729 | ||||||
1.875%, 08/15/2017 | 760 | 761 | ||||||
Toronto-Dominion Bank | ||||||||
2.250%, 09/25/2019 (B) | 1,575 | 1,588 | ||||||
Toronto-Dominion Bank MTN (A) | ||||||||
1.722%, 01/22/2019 | 1,180 | 1,189 | ||||||
1.422%, 07/23/2018 | 1,500 | 1,504 | ||||||
0.999%, 05/02/2017 | 690 | 690 | ||||||
Toyota Motor Credit MTN | ||||||||
1.550%, 07/13/2018 | 1,500 | 1,501 | ||||||
UBS MTN(A) | ||||||||
1.557%, 03/26/2018 | 2,355 | 2,363 | ||||||
1.542%, 08/14/2019 | 1,750 | 1,751 | ||||||
US Bank MTN | ||||||||
1.467%, 01/29/2018 (A) | 700 | 702 | ||||||
Volkswagen Group of America Finance LLC | ||||||||
1.386%, 05/22/2018 (A) (B) | 750 | 746 | ||||||
1.351%, 11/20/2017 (A) (B) | 3,000 | 2,991 | ||||||
1.250%, 05/23/2017 (B) | 750 | 749 | ||||||
Voya Financial | ||||||||
2.900%, 02/15/2018 | 1,860 | 1,881 | ||||||
WEA Finance LLC | ||||||||
1.750%, 09/15/2017 (B) | 1,600 | 1,604 | ||||||
Wells Fargo MTN | ||||||||
1.622%, 01/22/2018 (A) | 1,200 | 1,207 | ||||||
1.567%, 01/30/2020 (A) | 1,250 | 1,250 | ||||||
1.512%, 04/23/2018 (A) | 1,290 | 1,295 | ||||||
1.400%, 09/08/2017 | 1,000 | 999 | ||||||
Westpac Banking | ||||||||
1.289%, 01/17/2019 (A) | 800 | 802 | ||||||
|
| |||||||
| 150,447 | ||||||||
|
| |||||||
Health Care — 3.2% | ||||||||
AbbVie | ||||||||
1.800%, 05/14/2018 | 1,200 | 1,199 | ||||||
Actavis Funding SCS | ||||||||
2.350%, 03/12/2018 | 1,730 | 1,741 | ||||||
1.925%, 03/12/2018 (A) | 2,025 | 2,042 | ||||||
1.300%, 06/15/2017 | 1,250 | 1,251 | ||||||
Aetna | ||||||||
1.700%, 06/07/2018 | 3,150 | 3,150 | ||||||
Amgen | ||||||||
1.296%, 05/22/2017 (A) | 2,280 | 2,283 | ||||||
Catholic Health Initiatives | ||||||||
2.600%, 08/01/2018 | 740 | 747 | ||||||
Celgene | ||||||||
2.125%, 08/15/2018 | 750 | 753 | ||||||
| 166 | SEI Institutional Investments Trust / Semi-Annual Report / November 30, 2016 |
| Description | Face Amount ($ Thousands) | Market Value ($ Thousands) | ||||||
Teva Pharmaceutical Finance Netherlands III BV | ||||||||
1.700%, 07/19/2019 | $ | 1,175 | $ | 1,153 | ||||
1.400%, 07/20/2018 | 1,400 | 1,387 | ||||||
Zimmer Holdings | ||||||||
1.450%, 04/01/2017 | 1,400 | 1,400 | ||||||
|
| |||||||
| 17,106 | ||||||||
|
| |||||||
Industrials — 1.6% | ||||||||
Air Lease | ||||||||
2.125%, 01/15/2018 | 385 | 386 | ||||||
2.125%, 01/15/2020 | 650 | 640 | ||||||
Caterpillar Financial Services MTN | ||||||||
1.517%, 02/23/2018 (A) | 1,435 | 1,444 | ||||||
Fortive | ||||||||
1.800%, 06/15/2019 (B) | 520 | 516 | ||||||
GATX | ||||||||
1.250%, 03/04/2017 | 525 | 525 | ||||||
General Electric Capital MTN | ||||||||
1.496%, 01/09/2020 (A) | 1,210 | 1,218 | ||||||
Honeywell International | ||||||||
1.170%, 10/30/2019 (A) | 1,250 | 1,250 | ||||||
Hutchison Whampoa International | ||||||||
1.625%, 10/31/2017 (B) | 1,400 | 1,398 | ||||||
TTX MTN | ||||||||
2.250%, 02/01/2019 (B) | 465 | 465 | ||||||
United Technologies | ||||||||
1.236%, 11/01/2019 (A) | 900 | 902 | ||||||
|
| |||||||
| 8,744 | ||||||||
|
| |||||||
Information Technology — 1.3% | ||||||||
Cisco Systems (A) | ||||||||
1.511%, 02/21/2018 | 550 | 553 | ||||||
1.194%, 09/20/2019 | 850 | 853 | ||||||
eBay | ||||||||
2.500%, 03/09/2018 | 800 | 806 | ||||||
Fidelity National Information Services | ||||||||
1.450%, 06/05/2017 | 470 | 470 | ||||||
Hewlett Packard Enterprise | ||||||||
2.598%, 10/05/2017 (A) (B) | 2,215 | 2,240 | ||||||
2.450%, 10/05/2017 (B) | 1,750 | 1,769 | ||||||
|
| |||||||
| 6,691 | ||||||||
|
| |||||||
Materials — 0.4% | ||||||||
Air Liquide Finance | ||||||||
1.375%, 09/27/2019 (B) | 900 | 886 | ||||||
Monsanto | ||||||||
1.150%, 06/30/2017 | 1,425 | 1,420 | ||||||
|
| |||||||
| 2,306 | ||||||||
|
| |||||||
Real Estate — 0.3% | �� | |||||||
Simon Property Group | ||||||||
1.500%, 02/01/2018 (B) | 1,345 | 1,344 | ||||||
| Description | Face Amount ($ Thousands) | Market Value ($ Thousands) | ||||||
Ventas Realty | ||||||||
1.250%, 04/17/2017 | $ | 285 | $ | 285 | ||||
|
| |||||||
| 1,629 | ||||||||
|
| |||||||
Telecommunication Services — 1.5% |
| |||||||
AT&T | ||||||||
5.500%, 02/01/2018 | 1,700 | 1,769 | ||||||
1.768%, 06/30/2020 (A) | 1,250 | 1,251 | ||||||
British Telecommunications | ||||||||
1.250%, 02/14/2017 | 655 | 655 | ||||||
Verizon Communications | ||||||||
2.606%, 09/14/2018 (A) | 935 | 957 | ||||||
1.375%, 08/15/2019 | 965 | 947 | ||||||
1.127%, 08/15/2019 (A) | 2,415 | 2,410 | ||||||
|
| |||||||
| 7,989 | ||||||||
|
| |||||||
Utilities — 1.3% | ||||||||
DTE Energy | ||||||||
1.500%, 10/01/2019 | 870 | 855 | ||||||
Duke Energy | ||||||||
1.034%, 04/03/2017 (A) | 2,000 | 2,002 | ||||||
Emera US Finance | ||||||||
2.150%, 06/15/2019 (B) | 340 | 341 | ||||||
Exelon | ||||||||
1.550%, 06/09/2017 | 1,200 | 1,200 | ||||||
NextEra Energy Capital Holdings | ||||||||
1.649%, 09/01/2018 | 185 | 185 | ||||||
Sempra Energy | ||||||||
1.625%, 10/07/2019 | 395 | 390 | ||||||
Southern | ||||||||
1.550%, 07/01/2018 | 650 | 648 | ||||||
1.300%, 08/15/2017 | 780 | 780 | ||||||
Xcel Energy | ||||||||
1.200%, 06/01/2017 | 670 | 669 | ||||||
|
| |||||||
| 7,070 | ||||||||
|
| |||||||
Total Corporate Obligations | 250,093 | |||||||
|
| |||||||
ASSET-BACKED SECURITIES — 26.8% |
| |||||||
Agency Mortgage-Backed Obligations — 0.4% |
| |||||||
FHLMC Multifamily Structured Pass Through Certificates, Ser K020, Cl A1 | ||||||||
1.573%, 01/25/2022 | 418 | 416 | ||||||
FNMA, Ser M5, Cl ASQ2 | ||||||||
2.034%, 03/25/2019 | 287 | 289 | ||||||
FREMF Mortgage Trust, Ser 2013-K502, Cl B | ||||||||
2.567%, 10/25/2017 (A)(B) | 1,340 | 1,343 | ||||||
|
| |||||||
| 2,048 | ||||||||
|
| |||||||
| SEI Institutional Investments Trust / Semi-Annual Report / November 30, 2016 | 167 |
SCHEDULE OF INVESTMENTS (Unaudited)
Ultra Short Duration Bond Fund (Continued)
November 30, 2016
| Description | Face Amount ($ Thousands) | Market Value ($ Thousands) | ||||||
Automotive — 12.6% | ||||||||
Ally Master Owner Trust, Ser 2014-4, Cl A1 | ||||||||
0.938%, 06/17/2019 (A) | $ | 945 | $ | 945 | ||||
Ally Master Owner Trust, Ser 2014-4, Cl A2 | ||||||||
1.430%, 06/17/2019 | 3,485 | 3,488 | ||||||
Ally Master Owner Trust, Ser 2014-5, Cl A2 | ||||||||
1.600%, 10/15/2019 | 2,245 | 2,252 | ||||||
AmeriCredit Automobile Receivables Trust, Ser 2013-3, Cl D | ||||||||
3.000%, 07/08/2019 | 875 | 886 | ||||||
AmeriCredit Automobile Receivables Trust, Ser 2013-4, Cl C | ||||||||
2.720%, 09/09/2019 | 1,850 | 1,864 | ||||||
AmeriCredit Automobile Receivables Trust, Ser 2014-2, Cl B | ||||||||
1.600%, 07/08/2019 | 2,250 | 2,253 | ||||||
AmeriCredit Automobile Receivables Trust, Ser 2014-4, Cl A3 | ||||||||
1.270%, 07/08/2019 | 668 | 667 | ||||||
AmeriCredit Automobile Receivables Trust, Ser 2015-1, Cl B | ||||||||
1.880%, 03/09/2020 | 1,290 | 1,295 | ||||||
AmeriCredit Automobile Receivables Trust, Ser 2016-1, Cl A2A | ||||||||
1.520%, 06/10/2019 | 321 | 321 | ||||||
AmeriCredit Automobile Receivables Trust, Ser 2016-1, Cl A2B | ||||||||
1.280%, 06/10/2019 (A) | 772 | 773 | ||||||
AmeriCredit Automobile Receivables Trust, Ser 2016-2, Cl A3 | ||||||||
1.600%, 11/09/2020 | 470 | 470 | ||||||
Americredit Automobile Receivables Trust, Ser 2016-4, Cl A2A | ||||||||
1.340%, 04/08/2020 | 645 | 644 | ||||||
ARI Fleet Lease Trust, Ser 2014-A, Cl A2 | ||||||||
0.810%, 11/15/2022 (B) | 43 | 43 | ||||||
ARI Fleet Lease Trust, Ser 2014-A, Cl A3 | ||||||||
1.550%, 11/15/2022 (B) | 750 | 750 | ||||||
Bank of The West Auto Trust, Ser 2015-1, Cl A2B | ||||||||
0.858%, 04/16/2018 (A) (B) | 195 | 195 | ||||||
California Republic Auto Receivables Trust, Ser 2013-1, Cl A2 | ||||||||
1.410%, 09/17/2018 (B) | 166 | 166 | ||||||
Capital Auto Receivables Asset Trust, Ser 2013- 3, Cl B | ||||||||
2.320%, 07/20/2018 | 1,225 | 1,227 | ||||||
Capital Auto Receivables Asset Trust, Ser 2015- 3, Cl A2 | ||||||||
1.720%, 01/22/2019 | 890 | 893 | ||||||
CarMax Auto Owner Trust, Ser 2014-1, Cl A4 |
| |||||||
1.320%, 07/15/2019 | 1,245 | 1,246 | ||||||
| Description | Face Amount ($ Thousands) | Market Value ($ Thousands) | ||||||
CarMax Auto Owner Trust, Ser 2015-3, Cl A2A | ||||||||
1.100%, 11/15/2018 | $ | 508 | $ | 508 | ||||
CarMax Auto Owner Trust, Ser 2015-4, Cl A3 | ||||||||
1.560%, 11/16/2020 | 1,250 | 1,254 | ||||||
CarMax Auto Owner Trust, Ser 2016-2, Cl A2A | ||||||||
1.240%, 06/17/2019 | 1,315 | 1,316 | ||||||
Chesapeake Funding, Ser 2014-1A, Cl A | ||||||||
0.946%, 03/07/2026 (A) (B) | 1,382 | 1,382 | ||||||
Chesapeake Funding, Ser 2015-1A, Cl B | ||||||||
1.448%, 02/07/2027 (A) (B) | 1,330 | 1,320 | ||||||
Chrysler Capital Auto Receivables Trust, Ser 2015-BA, Cl A2 | ||||||||
1.460%, 12/17/2018 (B) | 441 | 441 | ||||||
CPS Auto Receivables Trust, Ser 2013-D, Cl A | ||||||||
1.540%, 07/16/2018 (B) | 79 | 79 | ||||||
CPS Auto Receivables Trust, Ser 2014-A, Cl A | ||||||||
1.210%, 08/15/2018 (B) | 47 | 47 | ||||||
CPS Auto Receivables Trust, Ser 2015-A, Cl A | ||||||||
1.530%, 07/15/2019 (B) | 1,368 | 1,369 | ||||||
CPS Auto Trust, Ser 2012-C, Cl A | ||||||||
1.820%, 12/16/2019 (B) | 443 | 443 | ||||||
Credit Acceptance Auto Loan Trust, Ser 2014- 1A, Cl A | ||||||||
1.550%, 10/15/2021 (B) | 312 | 312 | ||||||
Credit Acceptance Auto Loan Trust, Ser 2014- 2A, Cl A | ||||||||
1.880%, 03/15/2022 (B) | 1,792 | 1,792 | ||||||
DT Auto Owner Trust, Ser 2015-3A, Cl A | ||||||||
1.660%, 03/15/2019 (B) | 605 | 605 | ||||||
DT Auto Owner Trust, Ser 2016-4A, Cl A | ||||||||
1.440%, 11/15/2019 (B) | 1,719 | 1,719 | ||||||
Enterprise Fleet Financing LLC, Ser 2014-1, Cl A2 | ||||||||
0.870%, 09/20/2019 (B) | 37 | 37 | ||||||
Enterprise Fleet Financing LLC, Ser 2014-1, Cl A3 | ||||||||
1.380%, 09/20/2019 (B) | 700 | 699 | ||||||
Enterprise Fleet Financing LLC, Ser 2014-2, Cl A2 | ||||||||
1.050%, 03/20/2020 (B) | 1,550 | 1,546 | ||||||
Enterprise Fleet Financing LLC, Ser 2016-2, Cl A2 | ||||||||
1.740%, 02/22/2022 (B) | 595 | 595 | ||||||
First Investors Auto Owner Trust, Ser 2014-3A, Cl A3 | ||||||||
1.670%, 11/16/2020 (B) | 907 | 906 | ||||||
First Investors Auto Owner Trust, Ser 2015-1A, Cl A2 | ||||||||
1.210%, 04/15/2019 (B) | 216 | 216 | ||||||
Flagship Credit Auto Trust, Ser 2013-2, Cl A | ||||||||
1.940%, 01/15/2019 (B) | 71 | 71 | ||||||
Ford Credit Auto Lease Trust, Ser 2014-B, Cl A4 | ||||||||
1.100%, 11/15/2017 | 8 | 8 | ||||||
| 168 | SEI Institutional Investments Trust / Semi-Annual Report / November 30, 2016 |
| Description | Face Amount ($ Thousands) | Market Value ($ Thousands) | ||||||
Ford Credit Auto Lease Trust, Ser 2015-B, Cl B | ||||||||
1.920%, 03/15/2019 | $ | 765 | $ | 765 | ||||
Ford Credit Floorplan Master Owner Trust, Ser 2012-2, Cl A | ||||||||
1.920%, 01/15/2019 | 4,414 | 4,418 | ||||||
Ford Credit Floorplan Master Owner Trust, Ser 2014-1, Cl A2 | ||||||||
0.935%, 02/15/2019 (A) | 850 | 850 | ||||||
Ford Credit Floorplan Master Owner Trust, Ser 2014-1, Cl B | ||||||||
1.400%, 02/15/2019 | 205 | 205 | ||||||
Ford Credit Floorplan Master Owner Trust, Ser 2015-4, Cl A2 | ||||||||
1.108%, 08/15/2020 (A) | 170 | 171 | ||||||
GLS Auto Receivables Trust, Ser 2016-1A, Cl A | ||||||||
2.730%, 10/15/2020 (B) | 514 | 512 | ||||||
GM Financial Automobile Leasing Trust, Ser 2015-1, Cl B | ||||||||
2.140%, 06/20/2019 | 2,395 | 2,402 | ||||||
GM Financial Automobile Leasing Trust, Ser 2016-2, Cl A3 | ||||||||
1.620%, 09/20/2019 | 580 | 580 | ||||||
GM Financial Automobile Leasing Trust, Ser 2016-3, Cl A3 | ||||||||
1.610%, 12/20/2019 | 1,300 | 1,302 | ||||||
GMF Floorplan Owner Revolving Trust, Ser 2015-1, Cl A2 | ||||||||
1.035%, 05/15/2020 (A) (B) | 1,600 | 1,601 | ||||||
Hertz Fleet Lease Funding, Ser 2013-3, Cl B | ||||||||
1.579%, 12/10/2027 (A) (B) | 1,825 | 1,826 | ||||||
Huntington Auto Trust, Ser 2016-1, Cl A2 | ||||||||
1.290%, 05/15/2019 | 765 | 765 | ||||||
Nissan Master Owner Trust Receivables, Ser 2016-A, Cl A2 | ||||||||
1.540%, 06/15/2021 | 855 | 850 | ||||||
Porsche Innovative Lease Owner Trust, Ser 2014-1, Cl A3 | ||||||||
1.030%, 11/20/2017 (B) | 238 | 238 | ||||||
Prestige Auto Receivables Trust, Ser 2014-1A, Cl B | ||||||||
1.910%, 04/15/2020 (B) | 2,400 | 2,406 | ||||||
Prestige Auto Receivables Trust, Ser 2015-1, Cl A3 | ||||||||
1.530%, 02/15/2021 (B) | 878 | 878 | ||||||
Prestige Auto Receivables Trust, Ser 2016-1A, Cl A2 | ||||||||
1.780%, 08/15/2019 (B) | 644 | 645 | ||||||
Santander Drive Auto Receivables Trust, Ser 2012-3, Cl D | ||||||||
3.640%, 05/15/2018 | 762 | 762 | ||||||
Santander Drive Auto Receivables Trust, Ser 2013-1, Cl C | ||||||||
1.760%, 01/15/2019 | 1,265 | 1,267 | ||||||
| Description | Face Amount ($ Thousands) | Market Value ($ Thousands) | ||||||
Santander Drive Auto Receivables Trust, Ser 2013-2, Cl D | ||||||||
2.570%, 03/15/2019 | $ | 1,000 | $ | 1,008 | ||||
Susquehanna Auto Receivables Trust, Ser 2014-1A, Cl A3 | ||||||||
1.000%, 02/15/2018 (B) | 121 | 121 | ||||||
Toyota Auto Receivables Owner Trust, Ser 2016-B, Cl A3 | ||||||||
1.300%, 04/15/2020 | 240 | 240 | ||||||
USAA Auto Owner Trust, Ser 2015-1, Cl A3 | ||||||||
1.200%, 06/17/2019 | 565 | 565 | ||||||
Volkswagen Credit Auto Master Trust, Ser 2014-1A, Cl A1 | ||||||||
0.876%, 07/22/2019 (A)(B) | 1,250 | 1,247 | ||||||
Volvo Financial Equipment LLC, Ser 2014-1A, Cl A3 | ||||||||
0.820%, 04/16/2018 (B) | 174 | 174 | ||||||
Westlake Automobile Receivables Trust, Ser 2014-2A, Cl C | ||||||||
2.240%, 04/15/2020 (B) | 550 | 551 | ||||||
Westlake Automobile Receivables Trust, Ser 2015-1A, Cl B | ||||||||
1.680%, 11/16/2020 (B) | 1,283 | 1,283 | ||||||
Westlake Automobile Receivables Trust, Ser 2015-2A, Cl A2A | ||||||||
1.280%, 07/16/2018 (B) | 124 | 124 | ||||||
Westlake Automobile Receivables Trust, Ser 2016-2A, Cl A2 | ||||||||
1.570%, 06/17/2019 (B) | 525 | 526 | ||||||
Westlake Automobile Receivables Trust, Ser 2016-2A, Cl B | ||||||||
2.300%, 11/15/2019 (B) | 720 | 721 | ||||||
Wheels SPV LLC, Ser 2014-1A, Cl A2 | ||||||||
0.840%, 03/20/2023 (B) | 271 | 271 | ||||||
World Omni Automobile Lease Securitization Trust, Ser 2014-A, Cl A4 | ||||||||
1.370%, 01/15/2020 | 850 | 851 | ||||||
World Omni Automobile Lease Securitization Trust, Ser 2015-A, Cl A2A | ||||||||
1.060%, 05/15/2018 | 373 | 373 | ||||||
|
| |||||||
| 67,541 | ||||||||
|
| |||||||
Credit Cards — 3.4% | ||||||||
BA Credit Card Trust, Ser 2016-A1, Cl A | ||||||||
0.925%, 10/15/2021 (A) | 815 | 818 | ||||||
Barclays Dryrock Issuance Trust, Ser 2014-1, Cl A | ||||||||
0.895%, 12/16/2019 (A) | 600 | 600 | ||||||
Cabela's Credit Card Master Note Trust, Ser 2013-2A, Cl A2 | ||||||||
1.188%, 08/16/2021 (A) (B) | 395 | 397 | ||||||
| SEI Institutional Investments Trust / Semi-Annual Report / November 30, 2016 | 169 |
SCHEDULE OF INVESTMENTS (Unaudited)
Ultra Short Duration Bond Fund (Continued)
November 30, 2016
| Description | Face Amount ($ Thousands) | Market Value ($ Thousands) | ||||||
Cabela's Credit Card Master Note Trust, Ser 2016-1, Cl A1 | ||||||||
1.780%, 06/15/2022 | $ | 640 | $ | 639 | ||||
Capital One Multi-Asset Execution Trust, Ser 2014-A2, Cl A2 | ||||||||
1.260%, 01/15/2020 | 1,537 | 1,538 | ||||||
Chase Issuance Trust, Ser 2012-A2, Cl A2 | ||||||||
0.808%, 05/15/2019 (A) | 200 | 200 | ||||||
Chase Issuance Trust, Ser 2014-A1, Cl A1 | ||||||||
1.150%, 01/15/2019 | 1,894 | 1,894 | ||||||
Citibank Credit Card Issuance Trust, Ser 2006- A8, Cl A8 | ||||||||
0.920%, 12/17/2018 (A) | 500 | 500 | ||||||
Citibank Credit Card Issuance Trust, Ser 2013- A2, Cl A2 | ||||||||
0.872%, 05/26/2020 (A) | 1,015 | 1,017 | ||||||
Citibank Credit Card Issuance Trust, Ser 2014- A2, Cl A2 | ||||||||
1.020%, 02/22/2019 | 2,134 | 2,134 | ||||||
Discover Card Execution Note Trust, Ser 2014- A3, Cl A3 | ||||||||
1.220%, 10/15/2019 | 2,270 | 2,272 | ||||||
Discover Card Execution Note Trust, Ser 2016- A2, Cl A2 | ||||||||
1.075%, 09/15/2021 (A) | 1,055 | 1,062 | ||||||
Synchrony Credit Card Master Note Trust, Ser 2014-1, Cl A | ||||||||
1.610%, 11/15/2020 | 2,250 | 2,256 | ||||||
Synchrony Credit Card Master Note Trust, Ser 2015-2, Cl A | ||||||||
1.600%, 04/15/2021 | 1,400 | 1,403 | ||||||
Trillium Credit Card Trust II, Ser 2016-1A, Cl A | ||||||||
1.254%, 05/26/2021 (A) (B) | 1,190 | 1,196 | ||||||
|
| |||||||
| 17,926 | ||||||||
|
| |||||||
Mortgage Related Securities — 0.6% | ||||||||
Accredited Mortgage Loan Trust, Ser 2004-4, Cl A1A | ||||||||
1.214%, 01/25/2035 (A) | 374 | 369 | ||||||
Aegis Asset-Backed Securities Trust Mortgage Pass-Through Certificates, Ser 2004-4, Cl A1 | ||||||||
1.254%, 10/25/2034 (A) | 1,162 | 1,150 | ||||||
Bear Stearns Asset-Backed Securities I Trust, Ser 2005-HE3, Cl M2 | ||||||||
1.554%, 03/25/2035 (A) | 855 | 848 | ||||||
Bear Stearns Asset-Backed Securities Trust, Ser 2004-2, Cl A1 | ||||||||
1.534%, 08/25/2034 (A) | 170 | 170 | ||||||
HSBC Home Equity Loan Trust, Ser 2007-3, Cl APT | ||||||||
1.687%, 11/20/2036 (A) | 344 | 343 | ||||||
| Description | Face Amount ($ Thousands) | Market Value ($ Thousands) | ||||||
Option One Mortgage Loan Trust Asset-Backed Certificates, Ser 2005-4, Cl A3 | ||||||||
0.748%, 11/25/2035 (A) | $ | 49 | $ | 49 | ||||
Option One Mortgage Loan Trust, Ser 2005-1, Cl A1A | ||||||||
1.034%, 02/25/2035 (A) | 248 | 246 | ||||||
|
| |||||||
| 3,175 | ||||||||
|
| |||||||
Non-Agency Mortgage-Backed Obligations — 1.1% |
| |||||||
Cosmopolitan Hotel Trust, Ser 2016-CSMO, Cl A | ||||||||
1.936%, 11/15/2033 (A) (B) | 1,610 | 1,613 | ||||||
FHLMC Structured Agency Credit Risk Debt Notes, Ser 2016-DNA1, Cl M1 | ||||||||
2.034%, 07/25/2028 (A) | 1,520 | 1,526 | ||||||
FHLMC Structured Agency Credit Risk Debt Notes, Ser 2016-HQA3, Cl M1 | ||||||||
1.334%, 03/25/2029 (A) | 1,689 | 1,691 | ||||||
Towd Point Mortgage Trust, Ser 2016-4, Cl A1 |
| |||||||
2.250%, 07/25/2056 (A) (B) | 976 | 976 | ||||||
|
| |||||||
| 5,806 | ||||||||
|
| |||||||
Other Asset-Backed Securities — 8.7% |
| |||||||
Ally Master Owner Trust, Ser 2012-5, Cl A | ||||||||
1.540%, 09/15/2019 | 1,400 | 1,403 | ||||||
Apidos CLO XII, Ser 2013-12A, Cl A | ||||||||
1.780%, 04/15/2025 (A) (B) | 1,100 | 1,092 | ||||||
Carlyle Global Market Strategies CLO, Ser 2013-2A, Cl A | ||||||||
1.829%, 04/18/2025 (A) (B) | 325 | 325 | ||||||
Carlyle Global Market Strategies CLO, Ser 2014-2AR, Cl A1R | ||||||||
1.996%, 07/20/2023 (A) (B) | 646 | 646 | ||||||
Cent CLO, Ser 2014-16AR, Cl A1AR | ||||||||
2.007%, 08/01/2024 (A) (B) | 2,157 | 2,157 | ||||||
Cent CLO, Ser 2014-20A, Cl A | ||||||||
2.195%, 01/25/2026 (A) (B) | 1,850 | 1,849 | ||||||
CIFC Funding, Ser 2013-1A, Cl A1 | ||||||||
1.829%, 04/16/2025 (A) (B) | 1,060 | 1,060 | ||||||
CIFC Funding, Ser 2016-3A, Cl A2R | ||||||||
2.630%, 01/29/2025 (A) (B) | 495 | 495 | ||||||
CNH Equipment Trust, Ser 2014-C, Cl A3 | ||||||||
1.050%, 11/15/2019 | 123 | 122 | ||||||
CNH Equipment Trust, Ser 2016-B, Cl A2A | ||||||||
1.310%, 10/15/2019 | 495 | 495 | ||||||
Credit-Based Asset Servicing and Securitization, Ser 2005-CB3, Cl M2 | ||||||||
1.418%, 05/25/2035 (A) | 1,574 | 1,560 | ||||||
Dryden XXXI Senior Loan Fund, Ser 2014-31A, Cl A | ||||||||
2.029%, 04/18/2026 (A) (B) | 1,315 | 1,315 | ||||||
Ford Credit Floorplan Master Owner Trust, Ser 2016-4, Cl A | ||||||||
1.065%, 07/15/2020 (A) | 730 | 732 | ||||||
| 170 | SEI Institutional Investments Trust / Semi-Annual Report / November 30, 2016 |
| Description | Face Amount ($ Thousands) | Market Value ($ Thousands) | ||||||
Gramercy Park CLO, Ser 2014-1AR, Cl A1R | ||||||||
1.979%, 07/17/2023 (A) (B) | $ | 912 | $ | 912 | ||||
GreatAmerica Leasing Receivables Funding LLC, Ser 2015-1, Cl A3 | ||||||||
1.540%, 07/20/2018 (B) | 2,440 | 2,443 | ||||||
GreatAmerica Leasing Receivables Funding LLC, Ser 2016-1, Cl A2 | ||||||||
1.570%, 05/21/2018 (B) | 1,134 | 1,135 | ||||||
GSAMP Trust, Ser 2006-HE1, Cl A2D | ||||||||
0.798%, 01/25/2036 (A) | 2,112 | 2,068 | ||||||
ING IM CLO, Ser 2014-1RA, Cl A1R | ||||||||
1.856%, 03/14/2022 (A) (B) | 347 | 347 | ||||||
John Deere Owner Trust, Ser 2014-B, Cl A4 | ||||||||
1.500%, 06/15/2021 | 1,015 | 1,017 | ||||||
Kubota Credit Owner Trust, Ser 2016-1A, Cl A2 | ||||||||
1.250%, 04/15/2019 (B) | 310 | 309 | ||||||
Limerock CLO II, Ser 2014-2A, Cl A | ||||||||
2.179%, 04/18/2026 (A) (B) | 1,250 | 1,250 | ||||||
Madison Park Funding, Ser 2007-4A, Cl A1B | ||||||||
0.947%, 03/22/2021 (A) (B) | 580 | 568 | ||||||
Magnetite CLO IX, Ser 2014-9A, Cl A1 | ||||||||
2.135%, 07/25/2026 (A) (B) | 1,265 | 1,266 | ||||||
MMAF Equipment Finance LLC, Ser 2013-AA, Cl A3 | ||||||||
1.030%, 12/11/2017 (B) | 52 | 52 | ||||||
Nationstar HECM Loan Trust, Ser 2015-2A, Cl A | ||||||||
2.883%, 11/25/2025 (B) | 137 | 137 | ||||||
Nationstar HECM Loan Trust, Ser 2016-1A, Cl A | ||||||||
2.981%, 02/25/2026 (B) | 190 | 190 | ||||||
Nationstar HECM Loan Trust, Ser 2016-2A, Cl A | ||||||||
2.239%, 06/25/2026 (B) | 336 | 337 | ||||||
Nationstar HECM Loan Trust, Ser 2016-3A, Cl A | ||||||||
2.013%, 08/25/2026 (B) | 141 | 140 | ||||||
Navient Student Loan Trust, Ser 2015-1, Cl A1 | ||||||||
0.788%, 09/26/2022 (A) | 809 | 805 | ||||||
Navient Student Loan Trust, Ser 2016-6A, Cl A1 | ||||||||
1.000%, 03/25/2066 (A) (B) | 865 | 865 | ||||||
New Residential Advance Receivables Trust Advance Receivables Backed Notes, | ||||||||
Ser 2016-T2, Cl AT2 | ||||||||
2.575%, 10/15/2049 (B) | 1,025 | 1,023 | ||||||
NRZ Advance Receivables Trust Advance Receivables Backed, Ser 2015-T2, Cl AT2 | ||||||||
3.302%, 08/17/2048 (B) | 755 | 754 | ||||||
NRZ Advance Receivables Trust Advance Receivables Backed, Ser 2015-T4, Cl AT4 | ||||||||
3.196%, 11/15/2047 (B) | 900 | 903 | ||||||
NYCTL Trust, Ser 2015-A, Cl A | ||||||||
1.340%, 11/10/2028 (B) | 423 | 421 | ||||||
NYCTL Trust, Ser 2016-A, Cl A | ||||||||
1.470%, 11/10/2029 (B) | 251 | 252 | ||||||
| Description | Face Amount ($ Thousands) | Market Value ($ Thousands) | ||||||
Octagon Investment Partners XVI, Ser 2013-1A, Cl A | ||||||||
1.799%, 07/17/2025 (A) (B) | $ | 1,000 | $ | 999 | ||||
OHA Credit Partners VIII, Ser 2013-8A, Cl A | ||||||||
2.000%, 04/20/2025 (A) (B) | 690 | 689 | ||||||
Race Point VI CLO, Ser 2014-6RA, Cl BR | ||||||||
3.080%, 05/24/2023 (A) (B) | 1,650 | 1,651 | ||||||
SLM Student Loan Trust, Ser 2003-14, Cl A5 | ||||||||
0.945%, 01/25/2023 (A) | 180 | 179 | ||||||
SLM Student Loan Trust, Ser 2004-1, Cl A3 | ||||||||
0.925%, 04/25/2023 (A) | 831 | 830 | ||||||
SLM Student Loan Trust, Ser 2004-3, Cl A5 | ||||||||
0.885%, 07/25/2023 (A) | 570 | 568 | ||||||
SLM Student Loan Trust, Ser 2005-3, Cl A5 | ||||||||
0.972%, 10/25/2024 (A) | 1,181 | 1,174 | ||||||
SLM Student Loan Trust, Ser 2005-4, Cl A3 | ||||||||
1.002%, 01/25/2027 (A) | 27 | 27 | ||||||
SLM Student Loan Trust, Ser 2005-6, Cl A5A | ||||||||
0.825%, 07/27/2026 (A) | 518 | 513 | ||||||
SLM Student Loan Trust, Ser 2006-1, Cl A4 | ||||||||
0.805%, 07/25/2019 (A) | 153 | 153 | ||||||
SLM Student Loan Trust, Ser 2006-4, Cl A5 | ||||||||
0.815%, 10/27/2025 (A) | 432 | 431 | ||||||
Springleaf Funding Trust, Ser 2014-AA, Cl A | ||||||||
2.410%, 12/15/2022 (B) | 424 | 424 | ||||||
SPS Servicer Advance Receivables Trust, Ser 2016-T1, Cl AT1 | ||||||||
2.530%, 11/16/2048 (B) | 1,020 | 1,020 | ||||||
Structured Asset Securities Mortgage Loan Trust, Ser 2006-GEL3, Cl A2 | ||||||||
0.764%, 07/25/2036 (A) (B) | 385 | 385 | ||||||
Structured Asset Securities Mortgage Loan Trust, Ser 2006-WF1, Cl A1 | ||||||||
0.684%, 02/25/2036 (A) | 128 | 128 | ||||||
Symphony CLO VIII, Ser 2014-8AR, Cl BR | ||||||||
2.224%, 01/09/2023 (A) (B) | 1,660 | 1,654 | ||||||
Utah State Board of Regents, Ser 2016-1, Cl A | ||||||||
1.281%, 09/25/2056 (A) | 775 | 769 | ||||||
Verizon Owner Trust, Ser 2016-1A, Cl A | ||||||||
1.420%, 01/20/2021 (B) | 1,250 | 1,245 | ||||||
Verizon Owner Trust, Ser 2016-2A, Cl A | ||||||||
1.680%, 05/20/2021 (B) | 630 | 629 | ||||||
Voya CLO, Ser 2014-1RA, Cl A2R | ||||||||
2.506%, 03/14/2022 (A) (B) | 1,400 | 1,403 | ||||||
Voya CLO, Ser 2014-3A, Cl A1 | ||||||||
2.058%, 07/25/2026 (A) (B) | 910 | 910 | ||||||
|
| |||||||
| 46,226 | ||||||||
|
| |||||||
| SEI Institutional Investments Trust / Semi-Annual Report / November 30, 2016 | 171 |
SCHEDULE OF INVESTMENTS (Unaudited)
Ultra Short Duration Bond Fund (Continued)
November 30, 2016
| Description | Face Amount ($ Thousands) | Market Value ($ Thousands) | ||||||
Other-Asset Backed Securities — 0.0% |
| |||||||
Morgan Stanley Capital 1 Trust, Ser 2012-STAR, Cl A1 | ||||||||
2.084%, 08/05/2034 | $ | 237 | $ | 234 | ||||
|
| |||||||
Total Asset-Backed Securities | 142,956 | |||||||
|
| |||||||
MORTGAGE-BACKED SECURITIES — 12.4% |
| |||||||
Agency Mortgage-Backed Obligations — 6.0% |
| |||||||
FHLMC | ||||||||
1.369%, 05/25/2019 | 152 | 152 | ||||||
1.000%, 09/29/2017 | 1,135 | 1,136 | ||||||
5.000%, 06/01/2026 | 1,681 | 1,760 | ||||||
FHLMC ARM | ||||||||
2.592%, 02/01/2022 (A) | 71 | 73 | ||||||
2.551%, 02/01/2030 (A) | 100 | 106 | ||||||
2.375%, 05/01/2036 (A) | 120 | 127 | ||||||
FHLMC CMO, Ser 2003-2641, Cl KW | ||||||||
4.500%, 07/15/2018 | 1,200 | 1,233 | ||||||
FHLMC CMO, Ser 2003-2643, Cl MJ | ||||||||
4.500%, 07/15/2018 | 802 | 817 | ||||||
FHLMC CMO, Ser 2003-2644, Cl EB | ||||||||
4.500%, 07/15/2018 | 857 | 880 | ||||||
FHLMC Multifamily Structured Pass Through Certificates, Ser K011, Cl A1 | ||||||||
2.917%, 08/25/2020 | 107 | 109 | ||||||
FNMA | ||||||||
4.500%, 05/01/2023 | 388 | 412 | ||||||
1.900%, 10/01/2019 | 575 | 578 | ||||||
6.000%, 01/01/2027 to 04/01/2040 | 339 | 386 | ||||||
5.000%, 05/01/2019 to 03/01/2025 | 3,103 | 3,188 | ||||||
FNMA ARM | ||||||||
2.965%, 01/01/2029 (A) | 15 | 15 | ||||||
2.732%, 09/01/2024 (A) | 107 | 110 | ||||||
2.633%, 09/01/2024 (A) | 39 | 40 | ||||||
2.512%, 05/01/2028 (A) | 23 | 25 | ||||||
2.470%, 11/01/2025 (A) | 8 | 9 | ||||||
2.460%, 11/01/2023 (A) | 19 | 20 | ||||||
1.882%, 11/01/2021 (A) | 15 | 15 | ||||||
FNMA CMO, Ser 1993-58, Cl H | ||||||||
5.500%, 04/25/2023 | 34 | 36 | ||||||
FNMA CMO, Ser 2001-33, Cl FA | ||||||||
1.034%, 07/25/2031 (A) | 24 | 24 | ||||||
FNMA CMO, Ser 2002-56, Cl MC | ||||||||
5.500%, 09/25/2017 | 7 | 7 | ||||||
FNMA CMO, Ser 2002-64, Cl FG | ||||||||
0.805%, 10/18/2032 (A) | 28 | 28 | ||||||
FNMA CMO, Ser 2002-77, Cl CB | ||||||||
5.000%, 12/25/2017 | 33 | 34 | ||||||
| Description | Face Amount ($ Thousands) | Market Value ($ Thousands) | ||||||
FNMA CMO, Ser 2008-18, Cl HD | ||||||||
4.000%, 12/25/2018 | $ | 62 | $ | 63 | ||||
FNMA CMO, Ser 2008-47, Cl FA | ||||||||
0.988%, 06/25/2023 (A) | 103 | 103 | ||||||
FNMA CMO, Ser 2011-24, Cl PC | ||||||||
4.000%, 10/25/2039 | 2,196 | 2,242 | ||||||
FNMA CMO, Ser 2011-M7, Cl A2 | ||||||||
2.578%, 09/25/2018 | 721 | 730 | ||||||
FNMA TBA | ||||||||
3.500%, 12/01/2040 | 3,850 | 4,010 | ||||||
3.000%, 12/25/2028 | 8,028 | 8,256 | ||||||
FNMA, Ser 2015-MA, Cl ASQ2 | ||||||||
1.626%, 02/25/2018 | 227 | 227 | ||||||
FNMA, Ser M9, Cl ASQ2 | ||||||||
1.513%, 12/25/2017 | 504 | 502 | ||||||
FREMF Mortgage Trust, Ser 2012-K705, Cl C | ||||||||
4.302%, 09/25/2044 (A) (B) | 770 | 783 | ||||||
FREMF Mortgage Trust, Ser 2013-K502, Cl C | ||||||||
3.035%, 03/25/2045 (A) (B) | 550 | 551 | ||||||
FREMF Mortgage Trust, Ser 2014-K503, Cl C | ||||||||
3.002%, 10/25/2047 (A) (B) | 350 | 338 | ||||||
GNMA ARM | ||||||||
2.125%, 09/20/2039 (A) | 142 | 146 | ||||||
GNMA CMO, Ser 2006-47, Cl AC | ||||||||
5.000%, 02/16/2033 | 100 | 102 | ||||||
GNMA CMO, Ser 2009-10, Cl JA | ||||||||
4.500%, 03/16/2034 | 117 | 120 | ||||||
GNMA CMO, Ser 2009-113, Cl MJ | ||||||||
4.000%, 03/16/2023 | 111 | 112 | ||||||
GNMA CMO, Ser 2011-62, Cl PA | ||||||||
3.000%, 01/20/2040 | 148 | 148 | ||||||
GS Mortgage Securities Trust, Ser 2010-C2, Cl A1 | ||||||||
3.849%, 12/10/2043 (B) | 90 | 94 | ||||||
Mortgage-Linked Amortizing Notes CMO, Ser 2012-1, Cl A10 | ||||||||
2.060%, 01/15/2022 | 208 | 207 | ||||||
NCUA Guaranteed Notes CMO, Ser 2010-R1, Cl 1A | ||||||||
0.977%, 10/07/2020 (A) | 1,129 | 1,130 | ||||||
NCUA Guaranteed Notes CMO, Ser 2010-R2, Cl 1A | ||||||||
0.898%, 11/06/2017 (A) | 61 | 61 | ||||||
NCUA Guaranteed Notes CMO, Ser 2011-R1, Cl 1A | ||||||||
0.976%, 01/08/2020 (A) | 594 | 595 | ||||||
NCUA Guaranteed Notes CMO, Ser 2011-R2, Cl 1A | ||||||||
0.927%, 02/06/2020 (A) | 120 | 120 | ||||||
| 172 | SEI Institutional Investments Trust / Semi-Annual Report / November 30, 2016 |
| Description | Face Amount ($ Thousands) | Market Value ($ Thousands) | ||||||
NCUA Guaranteed Notes CMO, Ser 2011-R4, Cl 1A | ||||||||
0.907%, 03/06/2020 (A) | $ | 42 | $ | 42 | ||||
|
| |||||||
| 32,002 | ||||||||
|
| |||||||
Non-Agency Mortgage-Backed Obligations — 6.4% |
| |||||||
BAMLL Commercial Mortgage Securities Trust, Ser 2014-ICTS, Cl A | ||||||||
1.335%, 06/15/2028 (A) (B) | 1,000 | 999 | ||||||
Banc of America Mortgage Securities, Ser 2005-F, Cl 2A2 | ||||||||
3.239%, 07/25/2035 (A) | 262 | 242 | ||||||
Banc of America Mortgage Securities, Ser 2005-J, Cl 2A1 | ||||||||
3.213%, 11/25/2035 (A) | 34 | 32 | ||||||
Bear Stearns Adjustable Rate Mortgage Trust, Ser 2005-12, Cl 11A1 | ||||||||
3.121%, 02/25/2036 (A) | 99 | 84 | ||||||
Bear Stearns Adjustable Rate Mortgage Trust, Ser 2005-3, Cl 2A1 | ||||||||
3.203%, 06/25/2035 (A) | 129 | 121 | ||||||
Bear Stearns Adjustable Rate Mortgage Trust, Ser 2005-6, Cl 3A1 | ||||||||
3.168%, 08/25/2035 (A) | 223 | 213 | ||||||
BLCP Hotel Trust, Ser 2014-CLRN, Cl A | ||||||||
1.488%, 08/15/2029 (A) (B) | 960 | 959 | ||||||
CD Mortgage Trust, Ser 2007-CD5, Cl A4 | ||||||||
5.886%, 11/15/2044 (A) | 1,235 | 1,258 | ||||||
CHL Mortgage Pass-Through Trust, Ser 2004- 29, Cl 1A1 | ||||||||
1.074%, 02/25/2035 (A) | 31 | 29 | ||||||
CHL Mortgage Pass-Through Trust, Ser 2005- HY10, Cl 3A1A | ||||||||
2.843%, 02/20/2036 (A) | 177 | 152 | ||||||
Citigroup Commercial Mortgage Trust, Ser 2007-C6, Cl A4 | ||||||||
5.711%, 12/10/2049 (A) | 1,650 | 1,667 | ||||||
Citigroup Commercial Mortgage Trust, Ser 2008-C7, Cl A4 | ||||||||
6.129%, 12/10/2049 (A) | 1,024 | 1,047 | ||||||
Citigroup Commercial Mortgage Trust, Ser 2012-GC8, Cl A1 | ||||||||
0.685%, 09/10/2045 | 44 | 44 | ||||||
Citigroup Deutsche Bank Commercial Mortgage, Ser 2007-CD4, Cl A4 | ||||||||
5.322%, 12/11/2049 | 96 | 96 | ||||||
Citigroup Mortgage Loan Trust, Ser 2004- HYB3, Cl 1A | ||||||||
3.093%, 09/25/2034 (A) | 54 | 53 | ||||||
Citigroup Mortgage Loan Trust, Ser 2006-AR2, Cl 1A1 | ||||||||
2.987%, 03/25/2036 (A) | 198 | 173 | ||||||
| Description | Face Amount ($ Thousands) | Market Value ($ Thousands) | ||||||
COMM Mortgage Trust, Ser 2012-CR4, Cl A1 | ||||||||
0.704%, 10/15/2045 | $ | 69 | $ | 69 | ||||
COMM Mortgage Trust, Ser 2013-CR10, Cl A1 | ||||||||
1.278%, 08/10/2046 | 276 | 276 | ||||||
COMM Mortgage Trust, Ser 2014-BBG, Cl A | ||||||||
1.335%, 03/15/2029 (A) (B) | 2,970 | 2,956 | ||||||
CSMC Trust, Ser 2014-TIKI, Cl A | ||||||||
1.431%, 09/15/2038 (A) (B) | 700 | 695 | ||||||
FHLMC Structured Agency Credit Risk Debt Notes, Ser 2013-DN1, Cl M1 | ||||||||
3.934%, 07/25/2023 (A) | 669 | 680 | ||||||
FHLMC Structured Agency Credit Risk Debt Notes, Ser 2014-DN1, Cl M1 | ||||||||
1.534%, 02/25/2024 (A) | 96 | 96 | ||||||
FHLMC Structured Agency Credit Risk Debt Notes, Ser 2015-DN1, Cl M2 | ||||||||
2.934%, 01/25/2025 (A) | 785 | 789 | ||||||
FHLMC Structured Agency Credit Risk Debt Notes, Ser 2015-HQA1, Cl M1 | ||||||||
1.784%, 03/25/2028 (A) | 83 | 83 | ||||||
FNMA Connecticut Avenue Securities, Ser 2014- C02, Cl 1M1 | ||||||||
1.484%, 05/25/2024 (A) | 372 | 372 | ||||||
FNMA Connecticut Avenue Securities, Ser 2014- C02, Cl 2M1 | ||||||||
1.484%, 05/25/2024 (A) | 180 | 180 | ||||||
FNMA Connecticut Avenue Securities, Ser 2014- C03, Cl 1M1 | ||||||||
1.784%, 07/25/2024 (A) | 675 | 676 | ||||||
FNMA Connecticut Avenue Securities, Ser 2015-C02, Cl 1M1 | ||||||||
1.684%, 05/25/2025 (A) | 44 | 44 | ||||||
GMAC Mortgage Loan Trust, Ser 2005-AR6, Cl 2A1 | ||||||||
3.453%, 11/19/2035 (A) | 239 | 220 | ||||||
GS Mortgage Securities Trust, Ser 2012-GCJ9, Cl A1 | ||||||||
0.662%, 11/10/2045 | 19 | 19 | ||||||
GS Mortgage Securities Trust, Ser 2013-GC13, Cl A1 | ||||||||
1.206%, 07/10/2046 | 109 | 109 | ||||||
GSR Mortgage Loan Trust, Ser 2005-AR4, Cl 2A1 | ||||||||
3.331%, 07/25/2035 (A) | 280 | 251 | ||||||
GSR Mortgage Loan Trust, Ser 2006-AR1, Cl 2A1 | ||||||||
2.972%, 01/25/2036 (A) | 287 | 266 | ||||||
GSR Mortgage Loan Trust, Ser 2007-AR2, Cl 1A1 | ||||||||
3.198%, 05/25/2047 (A) | 288 | 235 | ||||||
HILT Mortgage Trust, Ser 2014-ORL, Cl A | ||||||||
1.381%, 07/15/2029 (A) (B) | 1,600 | 1,592 | ||||||
Impac CMB Trust, Ser 2004-9, Cl 1A1 | ||||||||
1.294%, 01/25/2035 (A) | 79 | 72 | ||||||
| SEI Institutional Investments Trust / Semi-Annual Report / November 30, 2016 | 173 |
SCHEDULE OF INVESTMENTS (Unaudited)
Ultra Short Duration Bond Fund (Continued)
November 30, 2016
| Description | Face Amount ($ Thousands) | Market Value ($ Thousands) | ||||||
Impac CMB Trust, Ser 2005-2, Cl 1A1 | ||||||||
1.054%, 04/25/2035 (A) | $ | 85 | $ | 77 | ||||
Impac CMB Trust, Ser 2005-3, Cl A1 | ||||||||
1.014%, 08/25/2035 (A) | 79 | 70 | ||||||
Impac CMB Trust, Ser 2005-5, Cl A1 | ||||||||
1.174%, 08/25/2035 (A) | 65 | 57 | ||||||
Impac CMB Trust, Ser 2005-8, Cl 1A | ||||||||
1.054%, 02/25/2036 (A) | 201 | 172 | ||||||
JPMBB Commercial Mortgage Securities Trust, Ser 2013-C14, Cl A2 | ||||||||
3.019%, 08/15/2046 | 595 | 610 | ||||||
JPMBB Commercial Mortgage Securities Trust, Ser 2013-C15, Cl A2 | ||||||||
2.977%, 11/15/2045 | 1,246 | 1,274 | ||||||
JPMBB Commercial Mortgage Securities Trust, | ||||||||
Ser 2014-C19, Cl A1 | ||||||||
1.266%, 04/15/2047 | 841 | 838 | ||||||
JPMorgan Chase Commercial Mortgage Securities Trust, Ser 2013-C13, Cl A1 | ||||||||
1.303%, 01/15/2046 | 153 | 153 | ||||||
JPMorgan Chase Commercial Mortgage Securities Trust, Ser 2014-CBM, Cl A | ||||||||
1.438%, 10/15/2029 (A) (B) | 3,005 | 3,001 | ||||||
JPMorgan Chase Commercial Mortgage Securities Trust, Ser 2014-PHH, Cl A | ||||||||
1.642%, 08/15/2027 (A) (B) | 1,225 | 1,225 | ||||||
JPMorgan Mortgage Trust, Ser 2005-A6, Cl 7A1 | ||||||||
3.166%, 08/25/2035 (A) | 122 | 116 | ||||||
JPMorgan Mortgage Trust, Ser 2007-A3, Cl 1A1 | ||||||||
2.881%, 05/25/2037 (A) | 167 | 147 | ||||||
LB-UBS Commercial Mortgage Trust, Ser 2007- C6, Cl A4 | ||||||||
5.858%, 07/15/2040 (A) | 590 | 595 | ||||||
LB-UBS Commercial Mortgage Trust, Ser 2008- C1, Cl A2 | ||||||||
6.114%, 04/15/2041 (A) | 694 | 722 | ||||||
Merrill Lynch Mortgage Investors, Ser 2005- A3, Cl A1 | ||||||||
0.804%, 04/25/2035 (A) | 61 | 58 | ||||||
Merrill Lynch Mortgage-Backed Securities Trust, Ser 2007-3, Cl 2A1 | ||||||||
3.159%, 06/25/2037 (A) | 291 | 242 | ||||||
ML-CFC Commercial Mortgage Trust, Ser 2007-5, Cl A4 | ||||||||
5.378%, 08/12/2048 | 28 | 28 | ||||||
Morgan Stanley Bank of America Merrill Lynch Trust, Ser 2012-C5, Cl A2 | ||||||||
1.972%, 08/15/2045 | 449 | 450 | ||||||
Morgan Stanley Bank of America Merrill Lynch Trust, Ser 2013-C11, Cl A2 | ||||||||
3.085%, 08/15/2046 | 1,186 | 1,208 | ||||||
| Description | Face Amount ($ Thousands) | Market Value ($ Thousands) | ||||||
Morgan Stanley Capital I Trust, Ser 2008-T29, | ||||||||
Cl A4FL | ||||||||
2.623%, 01/11/2043 (A) | $ | 1,068 | $ | 1,080 | ||||
Morgan Stanley Capital I Trust, Ser 2012-C4, Cl A2 | ||||||||
2.111%, 03/15/2045 | 176 | 177 | ||||||
Morgan Stanley Re-REMIC Trust, Ser 2012-IO, Cl AXA | ||||||||
1.000%, 03/27/2051 (B) | 196 | 195 | ||||||
MortgageIT Trust, Ser 2005-5, Cl A1 | ||||||||
0.794%, 12/25/2035 (A) | 280 | 255 | ||||||
Paragon Mortgages, Ser 2006-12A, Cl A2C | ||||||||
1.126%, 11/15/2038 (A) (B) | 137 | 126 | ||||||
Paragon Mortgages, Ser 2007-15A, Cl A2C | ||||||||
1.070%, 12/15/2039 (A) (B) | 342 | 316 | ||||||
Residential Funding Mortgage Securities, Ser 2007-SA3, Cl 2A1 | ||||||||
4.317%, 07/27/2037 (A) | 224 | 193 | ||||||
Sequoia Mortgage Trust, Ser 2004-12, Cl A1 | ||||||||
1.066%, 01/20/2035 (A) | 32 | 29 | ||||||
Towd Point Mortgage Trust, Ser 2015-4, Cl A1B | ||||||||
2.750%, 04/25/2055 (A) (B) | 364 | 366 | ||||||
Towd Point Mortgage Trust, Ser 2015-5, Cl A1B | ||||||||
2.750%, 05/25/2055 (A) (B) | 371 | 373 | ||||||
Towd Point Mortgage Trust, Ser 2016-1, Cl A1B | ||||||||
2.750%, 02/25/2055 (A) (B) | 352 | 356 | ||||||
Towd Point Mortgage Trust, Ser 2016-3, Cl A1 | ||||||||
2.250%, 08/25/2055 (A) (B) | 661 | 657 | ||||||
UBS-Barclays Commercial Mortgage Trust, Ser 2012-C3, Cl A1 | ||||||||
0.726%, 08/10/2049 | 90 | 90 | ||||||
UBS-Barclays Commercial Mortgage Trust, Ser 2012-C4, Cl A1 | ||||||||
0.673%, 12/10/2045 | 33 | 33 | ||||||
UBS-Barclays Commercial Mortgage Trust, Ser 2013-C5, Cl A1 | ||||||||
0.779%, 03/10/2046 | 228 | 227 | ||||||
WaMu Mortgage Pass-Through Certificates, Ser 2006-AR2, Cl 1A1 | ||||||||
2.517%, 03/25/2036 (A) | 311 | 288 | ||||||
Wells Fargo Commercial Mortgage Trust, Ser 2012-LC5, Cl A1 | ||||||||
0.687%, 10/15/2045 | 65 | 65 | ||||||
Wells Fargo Mortgage-Backed Securities Trust, Ser 2004-BB, Cl A2 | ||||||||
2.882%, 01/25/2035 (A) | 115 | 115 | ||||||
Wells Fargo Mortgage-Backed Securities Trust, Ser 2006-AR10, Cl 2A1 | ||||||||
3.022%, 07/25/2036 (A) | 240 | 234 | ||||||
Wells Fargo Mortgage-Backed Securities Trust, Ser 2006-AR12, Cl 1A1 | ||||||||
3.231%, 09/25/2036 (A) | 133 | 124 | ||||||
| 174 | SEI Institutional Investments Trust / Semi-Annual Report / November 30, 2016 |
| Description | Face Amount ($ Thousands) | Market Value ($ Thousands) | ||||||
WFRBS Commercial Mortgage Trust, Ser 2012-C10, Cl A2 | ||||||||
1.765%, 12/15/2045 | $ | 925 | $ | 928 | ||||
WFRBS Commercial Mortgage Trust, Ser 2012-C10, Cl A1 | ||||||||
0.734%, 12/15/2045 | 121 | 120 | ||||||
WFRBS Commercial Mortgage Trust, Ser 2012-C9, Cl A1 | ||||||||
0.673%, 11/15/2045 | 89 | 89 | ||||||
|
| |||||||
| 34,328 | ||||||||
|
| |||||||
Total Mortgage-Backed Securities | 66,330 | |||||||
|
| |||||||
MUNICIPAL BONDS — 5.9% | ||||||||
Alabama — 0.2% | ||||||||
Birmingham, Water Works Board, Sub-Ser C, RB | ||||||||
1.030%, 01/01/2017 | 900 | 900 | ||||||
|
| |||||||
Arkansas — 0.3% | ||||||||
County of Garland Arkansas, RB | ||||||||
1.540%, 11/01/2018 | 1,520 | 1,514 | ||||||
|
| |||||||
California — 1.0% | ||||||||
Anaheim Housing & Public Improvements Authority, RB | ||||||||
1.000%, 10/01/2017 | 1,470 | 1,466 | ||||||
Municipal Improvement Corp of Los Angeles, Ser A, RB | ||||||||
1.924%, 11/01/2017 | 1,455 | 1,463 | ||||||
Riverside, Pension Obligation, Ser A, RB | ||||||||
0.980%, 06/01/2017 | 1,005 | 1,003 | ||||||
University of California, Ser Y-1, RB Callable 01/01/2017 @ 100 | ||||||||
1.117%, 07/01/2041(A) | 1,310 | 1,310 | ||||||
|
| |||||||
| 5,242 | ||||||||
|
| |||||||
Colorado — 0.4% | ||||||||
Colorado Housing & Finance Authority, Ser B, RB | ||||||||
1.850%, 05/15/2017 | 1,645 | 1,651 | ||||||
Denver, City and County, Taxable Refiancing Improvement, Ser B, RB | ||||||||
2.700%, 08/01/2017 | 395 | 399 | ||||||
1.543%, 08/01/2018 | 350 | 351 | ||||||
|
| |||||||
| 2,401 | ||||||||
|
| |||||||
Florida — 0.8% | ||||||||
Florida State, Board of Administration Finance, Ser A, RB | ||||||||
2.163%, 07/01/2019 | 1,200 | 1,212 | ||||||
| Description | Face Amount ($ Thousands) | Market Value ($ Thousands) | ||||||
Miami Beach Redevelopment Agency, GO | ||||||||
1.926%, 02/01/2017 | $ | 1,390 | $ | 1,390 | ||||
Orlando Utilities Commission, Ser 2-RMKT, RB Callable 01/03/2017 @ 100 | ||||||||
0.590%, 10/01/2033(A) | 1,925 | 1,925 | ||||||
|
| |||||||
| 4,527 | ||||||||
|
| |||||||
Illinois — 0.5% | ||||||||
Chicago Midway International Airport, Sub-Ser C-SUB, RB | ||||||||
1.796%, 01/01/2017 | 1,080 | 1,081 | ||||||
Saint Clair County High School District No. 201 Belleville, GO, BAM | ||||||||
3.500%, 04/01/2017 | 1,830 | 1,844 | ||||||
|
| |||||||
| 2,925 | ||||||||
|
| |||||||
Maine — 0.3% | ||||||||
Maine Municipal Bond Bank, RB | ||||||||
2.404%, 06/01/2017 | 1,550 | 1,557 | ||||||
|
| |||||||
Massachusetts — 0.3% | ||||||||
Town of Belmont Massachussetts, GO | ||||||||
1.250%, 05/05/2017 | 1,565 | 1,565 | ||||||
|
| |||||||
New Jersey — 0.7% | ||||||||
New Jersey State, Rutgers University, Ser K, RB | ||||||||
1.709%, 05/01/2017 | 955 | 957 | ||||||
New Jersey State, Transportation Trust Fund Authority, Ser B, RB | ||||||||
1.087%, 12/15/2016 | 2,800 | 2,800 | ||||||
|
| |||||||
| 3,757 | ||||||||
|
| |||||||
North Carolina — 0.4% | ||||||||
North Carolina State, Eastern Municipal Power Agency, RB | ||||||||
1.561%, 07/01/2017 | 2,090 | 2,091 | ||||||
|
| |||||||
Ohio — 0.4% | ||||||||
County of Lucas, Ohio, GO | ||||||||
1.125%, 07/12/2017 | 1,935 | 1,933 | ||||||
|
| |||||||
Pennsylvania — 0.1% | ||||||||
Pennsylvania Turnpike Commission, Sub-Ser B, RB | ||||||||
1.760%, 12/01/2019 | 770 | 760 | ||||||
|
| |||||||
| SEI Institutional Investments Trust / Semi-Annual Report / November 30, 2016 | 175 |
SCHEDULE OF INVESTMENTS (Unaudited)
Ultra Short Duration Bond Fund (Concluded)
November 30, 2016
| Description | Face Amount ($ Thousands) | Market Value ($ Thousands) | ||||||
Wyoming — 0.5% | ||||||||
Wyoming Community Development Authority, Ser 6-REMK, AMT, RB Callable 06/01/2017 @ 100 | ||||||||
0.630%, 12/01/2037(A) | $ | 2,500 | $ | 2,500 | ||||
|
| |||||||
Total Municipal Bonds | 31,672 | |||||||
|
| |||||||
U.S. TREASURY OBLIGATIONS — 2.9% |
| |||||||
U.S. Treasury Notes | ||||||||
1.375%, 06/30/2018 | 11,725 | 11,786 | ||||||
1.125%, 12/31/2019 | 3,700 | 3,665 | ||||||
|
| |||||||
Total U.S. Treasury Obligations |
| 15,451 | ||||||
|
| |||||||
SOVEREIGN DEBT — 2.5% | ||||||||
European Investment Bank | ||||||||
0.875%, 04/18/2017 | 2,600 | 2,598 | ||||||
Export-Import Bank of Korea | ||||||||
1.423%, 01/14/2017 (A) | 2,200 | 2,201 | ||||||
Hydro-Quebec | ||||||||
1.375%, 06/19/2017 | 675 | 676 | ||||||
Inter-American Development Bank MTN | ||||||||
0.646%, 12/12/2016 (A) | 1,250 | 1,250 | ||||||
International Bank for Reconstruction & Development | ||||||||
1.125%, 07/18/2017 | 849 | 849 | ||||||
Korea Development Bank | ||||||||
1.327%, 01/22/2017 (A) | 2,950 | 2,950 | ||||||
Province of Quebec Canada MTN | ||||||||
0.910%, 09/04/2018 (A) | 2,701 | 2,703 | ||||||
|
| |||||||
Total Sovereign Debt | 13,227 | |||||||
|
| |||||||
COMMERCIAL PAPER (C) (D) — 2.3% |
| |||||||
Credit Suisse NY | ||||||||
1.013%, 12/22/2016 | 1,250 | 1,250 | ||||||
Dominion Gas Holdings LLC | ||||||||
0.781%, 12/12/2016 | 2,500 | 2,499 | ||||||
Gas Light and Coke Company | ||||||||
0.650%, 12/01/2016 | 3,900 | 3,900 | ||||||
United Health Group | ||||||||
0.640%, 12/02/2016 | 4,700 | 4,700 | ||||||
|
| |||||||
Total Commercial Paper |
| 12,349 | ||||||
|
| |||||||
| Description | Shares | Market Value ($ Thousands) | ||||||
CASH EQUIVALENT — 0.2% |
| |||||||
SEI Daily Income Trust, Government Fund, Cl A | ||||||||
0.210%**† | 1,191,278 | $ | 1,191 | |||||
|
| |||||||
Total Cash Equivalent |
| 1,191 | ||||||
|
| |||||||
Face Amount | ||||||||
REPURCHASE AGREEMENT(F) — 2.5% | ||||||||
BNP Paribas | ||||||||
0.290%, dated 11/30/2016, to be repurchased on 09/01/2016, | $ | 13,400 | 13,400 | |||||
|
| |||||||
Total Repurchase Agreement | 13,400 | |||||||
|
| |||||||
Total Investments — 102.3% | $ | 546,669 | ||||||
|
| |||||||
The open futures contracts held by the Fund at November 30, 2016, is as follows:
| Type of Contract | Number of (Short) | Expiration Date | Unrealized Appreciation (Depreciation) ($ Thousands) | |||||||||
U.S. 10-Year Treasury Note | (41 | ) | Mar-2017 | $ | 15 | |||||||
U.S. 2-Year Treasury Note | 16 | Apr-2017 | 1 | |||||||||
U.S. 5-Year Treasury Note | 27 | Mar-2017 | — | |||||||||
U.S. Long Treasury Bond | (1 | ) | Mar-2017 | 1 | ||||||||
|
| |||||||||||
| $ | 17 | |||||||||||
|
| |||||||||||
For the period ended November 30, 2016, the total amount of all open futures contracts, as presented in the table above, are representative of the volume of activity for the derivative type during the period.
Percentages are based on Net Assets of $534,220 ($ Thousands).
| ** | Rate shown is the 7-day effective yield as of November 30, 2016. |
| † | Investment in Affiliated Security (see Note 6). |
| (A) | Variable Rate Security — The rate reported on the Schedule of Investments is the rate in effect as of November 30, 2016. |
| (B) | Security exempt from registration under Rule 144A of the Securities Act of 1933. These securities may be resold in transactions exempt from registration normally to qualified institutions. On November 30, 2016, the value of these securities amounted to $142,918 ($ Thousands), representing 26.8% of the net assets of the Fund. |
| (C) | Securities are held in connection with a letter of credit issued by a major bank. |
| (D) | The rate reported is the effective yield at the time of purchase. |
| (E) | Zero coupon security. The rate shown on the schedule of investments represents the security's effective yield at the time of purchase. |
(F) Tri-Party Repurchase Agreement.
AMT — Alternative Minimum Tax
ARM — Adjustable Rate Mortgage
BAM — Build America Mutual
Cl — Class
CLO — Collateralized Loan Obligation
CMO — Collateralized Mortgage Obligation
FHLMC — Federal Home Loan Mortgage Corporation
| 176 | SEI Institutional Investments Trust / Semi-Annual Report / November 30, 2016 |
FNMA — Federal National Mortgage Association
FREMF— Freddie Mac Multi-Family
GNMA — Government National Mortgage Association
GO — General Obligation
LLC — Limited Liability Company
MTN — Medium Term Note
NCUA — National Credit Union Association
PLC — Public Limited Company
RB — Revenue Bond
REMIC — Real Estate Mortgage Investment Conduit
Ser — Series
TBA — To Be Announced
The following is a list of the level of inputs used as of November 30, 2016, in valuing the Fund’s investments and other financial instruments carried at value ($ Thousands):
| Investments in Securities | Level 1 | Level 2 | Level 3 | Total | ||||||||||||
Corporate Obligations | $ | — | $ | 250,093 | $ | — | $ | 250,093 | ||||||||
Asset-Backed Securities | — | 142,956 | — | 142,956 | ||||||||||||
Mortgage-Backed Securities | — | 66,330 | — | 66,330 | ||||||||||||
Municipal Bonds | — | 31,672 | — | 31,672 | ||||||||||||
U.S. Treasury Obligations | — | 15,451 | — | 15,451 | ||||||||||||
Repurchase Agreement | — | 13,400 | — | 13,400 | ||||||||||||
Sovereign Debt | — | 13,227 | — | 13,227 | ||||||||||||
Commercial Paper | — | 12,349 | — | 12,349 | ||||||||||||
Cash Equivalent | 1,191 | — | — | 1,191 | ||||||||||||
|
|
|
|
|
|
|
| |||||||||
Total Investments in Securities | $ | 1,191 | $ | 545,478 | $ | — | $ | 546,669 | ||||||||
|
|
|
|
|
|
|
| |||||||||
| Other Financial Instruments | Level 1 | Level 2 | Level 3 | Total | ||||||||||||
Futures Contracts * Unrealized Appreciation | $ | 17 | $ | — | $ | — | $ | 17 | ||||||||
|
|
|
|
|
|
|
| |||||||||
Total Other Financial Instruments | $ | 17 | $ | — | $ | — | $ | 17 | ||||||||
|
|
|
|
|
|
|
| |||||||||
| * | Futures contracts are valued at the unrealized appreciation (depreciation) on the instrument. |
For the period ended November 30, 2016, there were no transfers between Level 1 and Level 2 assets and liabilities.
For the period ended November 30, 2016, there were no transfers between Level 2 and Level 3 assets and liabilities.
For more information on valuation inputs, see Note 2 – Significant Accounting Policies in Notes to Financial Statements.
Amounts designated as “—” are $0 or have been rounded to $0.
The accompanying notes are an integral part of the financial statements.
| SEI Institutional Investments Trust / Semi-Annual Report / November 30, 2016 | 177 |
SCHEDULE OF INVESTMENTS (Unaudited)
Emerging Markets Debt Fund
November 30, 2016
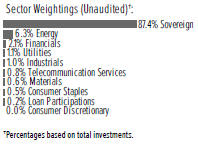
| Description | Face Amount (Thousands) | Market Value ($ Thousands) | ||||||||||
GLOBAL BONDS — 95.2% |
| |||||||||||
Angola — 0.1% | ||||||||||||
Republic of Angola | ||||||||||||
9.500%, 11/12/2025 | $ | 1,900 | $ | 1,763 | ||||||||
9.500%, 11/12/2025 (A) | 1,053 | 977 | ||||||||||
|
| |||||||||||
| 2,740 | ||||||||||||
|
| |||||||||||
Argentina — 4.6% | ||||||||||||
Arcor SAIC | ||||||||||||
6.000%, 07/06/2023 (A) | 234 | 239 | ||||||||||
Argentina Bonar Bonds (B) | ||||||||||||
27.158%, 03/01/2018 | ARS | 6,258 | 397 | |||||||||
26.204%, 03/11/2019 | 8,405 | 563 | ||||||||||
Argentine Bonad Bonds | ||||||||||||
2.400%, 03/18/2018 | $ | 5,903 | 5,821 | |||||||||
0.750%, 02/22/2017 | 356 | 354 | ||||||||||
Argentine Bonos del Tesoro | ||||||||||||
21.200%, 09/19/2018 | ARS | 14,977 | 987 | |||||||||
16.000%, 10/17/2023 | 42,967 | 2,675 | ||||||||||
15.500%, 10/17/2026 | 120,393 | 7,525 | ||||||||||
Cablevision | ||||||||||||
6.500%, 06/15/2021 (A) | $ | 290 | 294 | |||||||||
City of Buenos Aires Argentina | ||||||||||||
7.500%, 06/01/2027 (A) | 1,298 | 1,288 | ||||||||||
Petrobras Argentina | ||||||||||||
7.375%, 07/21/2023 (A) | 362 | 353 | ||||||||||
Provincia de Buenos Aires | ||||||||||||
9.950%, 06/09/2021 (A) | 1,670 | 1,841 | ||||||||||
Provincia de Cordoba | ||||||||||||
7.125%, 06/10/2021 (A) | 709 | 713 | ||||||||||
Republic of Argentina | ||||||||||||
12.079%, 12/15/2035 (B) | 1,548 | 152 | ||||||||||
8.280%, 12/31/2033 | 5,996 | 5,951 | ||||||||||
8.280%, 12/31/2033 | 12,156 | 12,429 | ||||||||||
7.820%, 12/31/2033 | EUR | 7,540 | 7,866 | |||||||||
7.820%, 12/31/2033 | 16,530 | 17,009 | ||||||||||
7.625%, 04/22/2046 | $ | 54 | 51 | |||||||||
7.500%, 04/22/2026 | 1,001 | 1,011 | ||||||||||
7.500%, 04/22/2026 | 2,156 | 2,178 | ||||||||||
7.500%, 04/22/2026 | 57 | 58 | ||||||||||
7.125%, 07/06/2036 | 1,473 | 1,356 | ||||||||||
6.875%, 04/22/2021 (A) | 323 | 337 | ||||||||||
6.875%, 04/22/2021 | 200 | 208 | ||||||||||
| Description | Face Amount (Thousands) | Market Value ($ Thousands) | ||||||||||
6.250%, 04/22/2019 | $ | 150 | $ | 157 | ||||||||
6.250%, 04/22/2019 | 150 | 157 | ||||||||||
5.000%, 01/15/2027 | EUR | 5,930 | 5,488 | |||||||||
4.191%, 12/15/2035 (B) | 26,151 | 2,702 | ||||||||||
3.875%, 01/15/2022 | 1,300 | 1,295 | ||||||||||
2.500%, 03/31/2019 (C) (D) | $ | 3,350 | 2,002 | |||||||||
2.260%, 12/31/2038 (D) | EUR | 1,278 | 760 | |||||||||
0.044%, 12/15/2035 (B) | $ | 14,639 | 1,464 | |||||||||
YPF | ||||||||||||
8.500%, 07/28/2025 (A) | 3,178 | 3,226 | ||||||||||
|
| |||||||||||
| 88,907 | ||||||||||||
|
| |||||||||||
Armenia — 0.2% | ||||||||||||
Republic of Armenia | ||||||||||||
7.150%, 03/26/2025 (A) | 3,222 | 3,295 | ||||||||||
|
| |||||||||||
Azerbaijan — 1.2% | ||||||||||||
Republic of Azerbaijan | ||||||||||||
4.750%, 03/18/2024 (A) | 5,112 | 5,059 | ||||||||||
Southern Gas Corridor | ||||||||||||
6.875%, 03/24/2026 | 4,516 | 4,787 | ||||||||||
State Oil of the Azerbaijan Republic | ||||||||||||
6.950%, 03/18/2030 | 1,460 | 1,472 | ||||||||||
6.950%, 03/18/2030 | 6,829 | 6,846 | ||||||||||
State Oil of the Azerbaijan Republic MTN | ||||||||||||
4.750%, 03/13/2023 | 600 | 566 | ||||||||||
4.750%, 03/13/2023 | 4,671 | 4,402 | ||||||||||
|
| |||||||||||
| 23,132 | ||||||||||||
|
| |||||||||||
Bahrain — 0.0% | ||||||||||||
Bahrain Government International Bond | ||||||||||||
7.000%, 10/12/2028 (A) | 815 | 823 | ||||||||||
|
| |||||||||||
Belize — 0.1% | ||||||||||||
Republic of Belize | ||||||||||||
5.000%, 02/20/2038 (D) | 3,437 | 1,289 | ||||||||||
|
| |||||||||||
Bermuda — 0.3% | ||||||||||||
Government of Bermuda | ||||||||||||
4.854%, 02/06/2024 | 2,950 | 3,093 | ||||||||||
3.717%, 01/25/2027 | 1,673 | 1,589 | ||||||||||
|
| |||||||||||
| 4,682 | ||||||||||||
|
| |||||||||||
Brazil — 8.8% | ||||||||||||
Banco Nacional de Desenvolvimento Economico e Social | ||||||||||||
6.500%, 06/10/2019 (A) | 720 | 768 | ||||||||||
6.500%, 06/10/2019 | 100 | 107 | ||||||||||
Braskem Finance | ||||||||||||
5.750%, 04/15/2021 | 2,472 | 2,577 | ||||||||||
Brazil Letras do Tesouro Nacional (E) | ||||||||||||
17.752%, 07/01/2019 | BRL | 16,870 | 3,759 | |||||||||
15.621%, 01/01/2019 (E) | 138,066 | 32,463 | ||||||||||
14.882%, 01/01/2020 | 32,000 | 6,735 | ||||||||||
| 178 | SEI Institutional Investments Trust / Semi-Annual Report / November 30, 2016 |
| Description | Face Amount (Thousands) | Market Value ($ Thousands) | ||||||||
12.154%, 01/01/2017 | BRL | 7,770 | $ | 2,270 | ||||||
11.776%, 07/01/2018 | 25,343 | 6,290 | ||||||||
9.465%, 01/01/2018 | 52,286 | 13,670 | ||||||||
2.147%, 01/01/2019 | 3,701 | 872 | ||||||||
Brazil Loan Trust 1 | ||||||||||
5.477%, 07/24/2023 (A) | $ | 289 | 282 | |||||||
Brazil Minas SPE via State of Minas Gerais | ||||||||||
5.333%, 02/15/2028 | 2,028 | 1,896 | ||||||||
5.333%, 02/15/2028 | 5,020 | 4,694 | ||||||||
Brazil Notas do Tesouro Nacional Serie B | ||||||||||
6.000%, 08/15/2022 | BRL | 5,000 | 4,398 | |||||||
6.000%, 05/15/2035 | 1,000 | 871 | ||||||||
Brazil Notas do Tesouro Nacional Serie F | ||||||||||
10.000%, 01/01/2021 | 25,497 | 7,144 | ||||||||
10.000%, 01/01/2023 | 52,018 | 14,225 | ||||||||
10.000%, 01/01/2025 | 74,910 | 20,197 | ||||||||
10.000%, 01/01/2027 | 24,900 | 6,623 | ||||||||
Brazil Notas do Tesouro Nacional | ||||||||||
10.000%, 01/01/2017 | 1,910 | 563 | ||||||||
BRF | ||||||||||
4.750%, 05/22/2024 | $ | 2,100 | 2,053 | |||||||
Cosan Luxembourg | ||||||||||
7.000%, 01/20/2027 (A) | 365 | 361 | ||||||||
ESAL GmbH | ||||||||||
6.250%, 02/05/2023 (A) | 308 | 294 | ||||||||
Federal Republic of Brazil | ||||||||||
8.250%, 01/20/2034 | 3,130 | 3,645 | ||||||||
7.125%, 01/20/2037 | 878 | 917 | ||||||||
6.000%, 04/07/2026 | 1,516 | 1,585 | ||||||||
5.625%, 01/07/2041 | 2,170 | 1,887 | ||||||||
5.625%, 02/21/2047 | 2,542 | 2,199 | ||||||||
5.000%, 01/27/2045 | 1,286 | 1,020 | ||||||||
4.875%, 01/22/2021 | 738 | 758 | ||||||||
4.250%, 01/07/2025 | 699 | 657 | ||||||||
2.625%, 01/05/2023 | 3,370 | 2,991 | ||||||||
GTL Trade Finance | ||||||||||
5.893%, 04/29/2024 (A) | 198 | 195 | ||||||||
JBS Investments GmbH | ||||||||||
7.750%, 10/28/2020 | 1,110 | 1,157 | ||||||||
Klabin Finance | ||||||||||
5.250%, 07/16/2024 | 735 | 698 | ||||||||
Marfrig Holdings Europe | ||||||||||
8.000%, 06/08/2023 (A) | 740 | 742 | ||||||||
8.000%, 06/08/2023 | 200 | 200 | ||||||||
Marfrig Overseas | ||||||||||
9.500%, 05/04/2020 (A) | 1,505 | 1,552 | ||||||||
Minerva Luxembourg | ||||||||||
6.500%, 09/20/2026 | 1,677 | 1,576 | ||||||||
6.500%, 09/20/2026 | 823 | 774 | ||||||||
6.500%, 09/20/2026 (A) | 375 | 352 | ||||||||
Petrobras Global Finance | ||||||||||
8.750%, 05/23/2026 | 5,059 | 5,428 | ||||||||
| Description | Face Amount (Thousands) | Market Value ($ Thousands) | ||||||||
8.375%, 05/23/2021 | $ | 2,235 | $ | 2,397 | ||||||
4.375%, 05/20/2023 | 1,018 | 898 | ||||||||
Petrobras International Finance | ||||||||||
5.375%, 01/27/2021 | 3,020 | 2,940 | ||||||||
Ultrapar International | ||||||||||
5.250%, 10/06/2026 | 410 | 404 | ||||||||
Vale Overseas | ||||||||||
6.250%, 08/10/2026 | 1,029 | 1,071 | ||||||||
|
| |||||||||
| 169,155 | ||||||||||
|
| |||||||||
Cameroon — 0.0% | ||||||||||
Republic of Cameroon | ||||||||||
9.500%, 11/19/2025 | 520 | 543 | ||||||||
|
| |||||||||
Chile — 0.7% | ||||||||||
Banco del Estado de Chile | ||||||||||
4.125%, 10/07/2020 (A) | 300 | 311 | ||||||||
4.125%, 10/07/2020 | 160 | 166 | ||||||||
Banco del Estado de Chile MTN | ||||||||||
3.875%, 02/08/2022 (A) | 250 | 257 | ||||||||
Bonos de la Tesoreria de la Republica en pesos | ||||||||||
6.000%, 01/01/2020 | CLP | 90,000 | 145 | |||||||
Empresa Electrica Angamos | ||||||||||
4.875%, 05/25/2029 (A) | $ | 1,732 | 1,631 | |||||||
Empresa Nacional del Petroleo | ||||||||||
4.375%, 10/30/2024 (A) | 716 | 711 | ||||||||
3.750%, 08/05/2026 (A) | 516 | 486 | ||||||||
Nacional del Cobre de Chile | ||||||||||
6.150%, 10/24/2036 (A) | 569 | 629 | ||||||||
5.625%, 09/21/2035 | 1,760 | 1,840 | ||||||||
4.875%, 11/04/2044 (A) | 1,120 | 1,065 | ||||||||
4.500%, 09/16/2025 (A) | 954 | 960 | ||||||||
3.875%, 11/03/2021 | 426 | 430 | ||||||||
Republic of Chile | ||||||||||
5.500%, 08/05/2020 | CLP | 413,000 | 641 | |||||||
3.125%, 01/21/2026 | $ | 2,982 | 2,960 | |||||||
VTR Finance | ||||||||||
6.875%, 01/15/2024 (A) | 123 | 125 | ||||||||
|
| |||||||||
| 12,357 | ||||||||||
|
| |||||||||
China — 0.3% | ||||||||||
CNOOC Finance 2015 | ||||||||||
3.500%, 05/05/2025 | 297 | 289 | ||||||||
Sinochem Overseas Capital | ||||||||||
4.500%, 11/12/2020 | 93 | 98 | ||||||||
Sinopec Capital 2013 | ||||||||||
3.125%, 04/24/2023 (A) | 515 | 503 | ||||||||
Sinopec Group Overseas Development 2012 | ||||||||||
3.900%, 05/17/2022 (A) | 1,195 | 1,239 | ||||||||
Sinopec Group Overseas Development 2013 | ||||||||||
4.375%, 10/17/2023 | 944 | 997 | ||||||||
Sinopec Group Overseas Development 2016 | ||||||||||
3.500%, 05/03/2026 (A) | 1,634 | 1,593 | ||||||||
| SEI Institutional Investments Trust / Semi-Annual Report / November 30, 2016 | 179 |
SCHEDULE OF INVESTMENTS (Unaudited)
Emerging Markets Debt Fund (Continued)
November 30, 2016
| Description | Face Amount (Thousands) | Market Value ($ Thousands) | ||||||||
2.750%, 05/03/2021 (A) | $ | 1,634 | $ | 1,624 | ||||||
|
| |||||||||
| 6,343 | ||||||||||
|
| |||||||||
Colombia — 6.7% | ||||||||||
Bogota Distrito Capital | ||||||||||
9.750%, 07/26/2028 (A) | COP | 10,018,000 | 3,319 | |||||||
9.750%, 07/26/2028 | 794,000 | 263 | ||||||||
Colombian TES | ||||||||||
11.000%, 07/24/2020 | 20,302,300 | 7,538 | ||||||||
10.000%, 07/24/2024 | 33,964,000 | 12,965 | ||||||||
7.750%, 09/18/2030 | 13,102,300 | 4,361 | ||||||||
7.500%, 08/26/2026 | 39,319,800 | 13,052 | ||||||||
7.000%, 09/11/2019 | 24,614,000 | 8,123 | ||||||||
7.000%, 05/04/2022 | 66,043,000 | 21,770 | ||||||||
Ecopetrol | ||||||||||
7.375%, 09/18/2043 | $ | 577 | 553 | |||||||
5.875%, 09/18/2023 | 219 | 226 | ||||||||
5.875%, 05/28/2045 | 1,264 | 1,035 | ||||||||
5.375%, 06/26/2026 | 2,283 | 2,197 | ||||||||
Emgesa ESP | ||||||||||
8.750%, 01/25/2021 | COP | 940,000 | 305 | |||||||
Empresas Publicas de Medellin ESP | ||||||||||
8.375%, 02/01/2021 | 4,738,000 | 1,519 | ||||||||
7.625%, 09/10/2024 (A) | 2,224,000 | 673 | ||||||||
7.625%, 09/10/2024 (A) | 1,827,000 | 553 | ||||||||
Financiera de Desarrollo Territorial Findeter | ||||||||||
7.875%, 08/12/2024 (A) | 1,408,000 | 426 | ||||||||
7.875%, 08/12/2024 | 1,095,000 | 332 | ||||||||
Pacific Exploration and Production (C) | ||||||||||
5.625%, 01/19/2025 (A) | $ | 2,820 | 578 | |||||||
5.375%, 01/26/2019 | 1,370 | 242 | ||||||||
Republic of Colombia | ||||||||||
9.850%, 06/28/2027 | COP | 994,000 | 379 | |||||||
9.850%, 06/28/2027 | 7,914,000 | 3,021 | ||||||||
8.125%, 05/21/2024 | $ | 416 | 514 | |||||||
7.750%, 04/14/2021 | COP | 3,729,000 | 1,269 | |||||||
7.375%, 01/27/2017 | $ | 2,935 | 2,958 | |||||||
7.375%, 09/18/2037 | 3,414 | 4,054 | ||||||||
6.125%, 01/18/2041 | 5,645 | 5,927 | ||||||||
6.000%, 04/28/2028 | COP | 29,591,900 | 8,570 | |||||||
5.000%, 11/21/2018 | 26,984,200 | 8,610 | ||||||||
4.500%, 01/28/2026 | $ | 709 | 723 | |||||||
4.375%, 07/12/2021 | 3,012 | 3,129 | ||||||||
4.375%, 03/21/2023 | COP | 7,800,000 | 2,202 | |||||||
4.000%, 02/26/2024 | $ | 4,281 | 4,260 | |||||||
2.625%, 03/15/2023 | 599 | 558 | ||||||||
Republic of Colombia MTN | ||||||||||
3.875%, 03/22/2026 | EUR | 1,446 | 1,669 | |||||||
|
| |||||||||
| 127,873 | ||||||||||
|
| |||||||||
Costa Rica — 1.2% | ||||||||||
Banco Nacional de Costa Rica | ||||||||||
6.250%, 11/01/2023 | $ | 431 | 427 | |||||||
| Description | Face Amount (Thousands) | Market Value ($ Thousands) | ||||||||
6.250%, 11/01/2023 (A) | $ | 290 | $ | 288 | ||||||
5.875%, 04/25/2021 (A) | 799 | 800 | ||||||||
Instituto Costarricense de Electricidad | ||||||||||
6.950%, 11/10/2021 | 400 | 414 | ||||||||
6.375%, 05/15/2043 | 290 | 232 | ||||||||
Republic of Costa Rica | ||||||||||
7.158%, 03/12/2045 | 3,609 | 3,354 | ||||||||
7.158%, 03/12/2045 | 6,775 | 6,296 | ||||||||
7.158%, 03/12/2045 (A) | 1,585 | 1,473 | ||||||||
7.000%, 04/04/2044 | 1,650 | 1,519 | ||||||||
7.000%, 04/04/2044 (A) | 3,031 | 2,790 | ||||||||
7.000%, 04/04/2044 | 3,407 | 3,136 | ||||||||
4.375%, 04/30/2025 (A) | 337 | 298 | ||||||||
4.375%, 04/30/2025 | 376 | 333 | ||||||||
4.250%, 01/26/2023 | 1,627 | 1,489 | ||||||||
|
| |||||||||
| 22,849 | ||||||||||
|
| |||||||||
Croatia — 1.2% | ||||||||||
Republic of Croatia | ||||||||||
6.625%, 07/14/2020 | 4,762 | 5,172 | ||||||||
6.375%, 03/24/2021 (A) | 6,145 | 6,686 | ||||||||
6.375%, 03/24/2021 | 2,540 | 2,763 | ||||||||
6.000%, 01/26/2024 (A) | 2,423 | 2,620 | ||||||||
5.875%, 07/09/2018 | EUR | 170 | 196 | |||||||
5.500%, 04/04/2023 | $ | 600 | 631 | |||||||
5.500%, 04/04/2023 (A) | 858 | 902 | ||||||||
3.000%, 03/11/2025 | EUR | 2,910 | 3,076 | |||||||
|
| |||||||||
| 22,046 | ||||||||||
|
| |||||||||
Dominican Republic — 1.3% | ||||||||||
Republic of Dominican Republic | ||||||||||
15.950%, 06/04/2021 | DOP | 4,500 | 116 | |||||||
11.500%, 05/10/2024 | 67,000 | 1,522 | ||||||||
11.000%, 01/05/2018 | 7,560 | 165 | ||||||||
11.000%, 07/30/2021 (A) | 67,030 | 1,458 | ||||||||
9.040%, 01/23/2018 | $ | 439 | 455 | |||||||
8.625%, 04/20/2027 | 2,098 | 2,349 | ||||||||
7.450%, 04/30/2044 (A) | 2,143 | 2,159 | ||||||||
7.450%, 04/30/2044 | 1,000 | 1,010 | ||||||||
7.450%, 04/30/2044 | 1,324 | 1,337 | ||||||||
6.875%, 01/29/2026 | 1,204 | 1,249 | ||||||||
6.850%, 01/27/2045 | 525 | 499 | ||||||||
6.850%, 01/27/2045 (A) | 5,005 | 4,755 | ||||||||
5.875%, 04/18/2024 | 380 | 380 | ||||||||
5.875%, 04/18/2024 (A) | 5,063 | 5,062 | ||||||||
5.500%, 01/27/2025 | 1,620 | 1,555 | ||||||||
|
| |||||||||
| 24,071 | ||||||||||
|
| |||||||||
Ecuador — 0.9% | ||||||||||
EP PetroEcuador via Noble Sovereign Funding I | ||||||||||
6.487%, 09/24/2019 (B) | 529 | 523 | ||||||||
Republic of Ecuador | ||||||||||
10.750%, 03/28/2022 (A) | 730 | 767 | ||||||||
10.500%, 03/24/2020 (A) | 4,641 | 4,850 | ||||||||
| 180 | SEI Institutional Investments Trust / Semi-Annual Report / November 30, 2016 |
| Description | Face Amount (Thousands) | Market Value ($ Thousands) | ||||||||
10.500%, 03/24/2020 | $ | 924 | $ | 966 | ||||||
7.950%, 06/20/2024 | 10,920 | 10,046 | ||||||||
|
| |||||||||
| 17,152 | ||||||||||
|
| |||||||||
Egypt — 0.1% | ||||||||||
Arab Republic of Egypt | ||||||||||
5.875%, 06/11/2025 (A) | 2,788 | 2,551 | ||||||||
|
| |||||||||
El Salvador — 0.5% | ||||||||||
Republic of El Salvador | ||||||||||
7.750%, 01/24/2023 | 2,887 | 2,858 | ||||||||
7.650%, 06/15/2035 | 2,427 | 2,093 | ||||||||
7.650%, 06/15/2035 | 496 | 428 | ||||||||
7.625%, 02/01/2041 | 1,560 | 1,326 | ||||||||
7.375%, 12/01/2019 | 884 | 899 | ||||||||
6.375%, 01/18/2027 (A) | 1,135 | 996 | ||||||||
6.375%, 01/18/2027 | 691 | 606 | ||||||||
5.875%, 01/30/2025 | 545 | 477 | ||||||||
5.875%, 01/30/2025 (A) | 828 | 724 | ||||||||
|
| |||||||||
| 10,407 | ||||||||||
|
| |||||||||
Ethiopia — 0.0% | ||||||||||
Federal Democratic Republic of Ethiopia | ||||||||||
6.625%, 12/11/2024 (A) | 690 | 613 | ||||||||
|
| |||||||||
Gabon — 0.4% | ||||||||||
Republic of Gabon | ||||||||||
8.200%, 12/12/2017 | 520 | 536 | ||||||||
6.950%, 06/16/2025 (A) | 1,225 | 1,074 | ||||||||
6.375%, 12/12/2024 (A) | 1,174 | 1,027 | ||||||||
6.375%, 12/12/2024 | 6,074 | 5,312 | ||||||||
|
| |||||||||
| 7,949 | ||||||||||
|
| |||||||||
Georgia — 0.1% | ||||||||||
Republic of Georgia | ||||||||||
6.875%, 04/12/2021 (A) | 888 | 958 | ||||||||
|
| |||||||||
Ghana — 0.9% | ||||||||||
Republic of Ghana | ||||||||||
24.750%, 07/19/2021 | 5,206 | 1,348 | ||||||||
24.500%, 04/22/2019 | 2,587 | 630 | ||||||||
24.000%, 09/09/2019 | 1,294 | 317 | ||||||||
10.750%, 10/14/2030 (A) | 1,369 | 1,537 | ||||||||
10.750%, 10/14/2030 | 9,875 | 11,087 | ||||||||
9.250%, 09/15/2022 (A) | 294 | 298 | ||||||||
7.875%, 08/07/2023 | 2,927 | 2,704 | ||||||||
|
| |||||||||
| 17,921 | ||||||||||
|
| |||||||||
Guatemala — 0.1% | ||||||||||
Comcel Trust | ||||||||||
6.875%, 02/06/2024 (A) | 1,370 | 1,366 | ||||||||
Comcel Trust via Comunicaciones Celulares | ||||||||||
6.875%, 02/06/2024 | 540 | 539 | ||||||||
|
| |||||||||
| 1,905 | ||||||||||
|
| |||||||||
| Description | Face Amount (Thousands) | Market Value ($ Thousands) | ||||||||
Hong Kong — 0.0% | ||||||||||
Studio City | ||||||||||
7.250%, 11/30/2021 (A) | $ | 595 | $ | 614 | ||||||
|
| |||||||||
Hungary — 3.2% | ||||||||||
Magyar Export-Import Bank Zrt | ||||||||||
4.000%, 01/30/2020 (A) | 1,144 | 1,172 | ||||||||
Republic of Hungary | ||||||||||
7.625%, 03/29/2041 | 13,820 | 19,417 | ||||||||
7.000%, 06/24/2022 | HUF | 225,660 | 949 | |||||||
6.750%, 10/22/2028 | 1,065,450 | 4,723 | ||||||||
6.375%, 03/29/2021 | $ | 2,721 | 3,057 | |||||||
6.250%, 01/29/2020 | 1,000 | 1,098 | ||||||||
6.000%, 11/24/2023 | HUF | 2,147,590 | 8,817 | |||||||
5.750%, 11/22/2023 | $ | 6,393 | 7,132 | |||||||
5.500%, 06/24/2025 | HUF | 2,582,130 | 10,225 | |||||||
5.375%, 02/21/2023 | $ | 3,237 | 3,521 | |||||||
5.375%, 03/25/2024 | 952 | 1,046 | ||||||||
3.000%, 06/26/2024 | HUF | 227,190 | 769 | |||||||
|
| |||||||||
| 61,926 | ||||||||||
|
| |||||||||
India — 0.2% | ||||||||||
Bharti Airtel International Netherlands | ||||||||||
5.125%, 03/11/2023 | $ | 2,275 | 2,373 | |||||||
Vedanta Resources | ||||||||||
6.000%, 01/31/2019 (A) | 675 | 677 | ||||||||
|
| |||||||||
| 3,050 | ||||||||||
|
| |||||||||
Indonesia — 9.2% | ||||||||||
Listrindo Capital BV | ||||||||||
4.950%, 09/14/2026 | 440 | 429 | ||||||||
Majapahit Holding | ||||||||||
7.875%, 06/29/2037 | 387 | 469 | ||||||||
7.875%, 06/29/2037 (A) | 215 | 261 | ||||||||
Pelabuhan Indonesia III | ||||||||||
4.875%, 10/01/2024 | 1,858 | 1,887 | ||||||||
Pertamina Persero | ||||||||||
6.500%, 05/27/2041 (A) | 820 | 849 | ||||||||
6.000%, 05/03/2042 (A) | 1,344 | 1,313 | ||||||||
5.250%, 05/23/2021 | 575 | 604 | ||||||||
4.875%, 05/03/2022 (A) | 550 | 569 | ||||||||
Pertamina Persero MTN | ||||||||||
6.450%, 05/30/2044 (A) | 1,285 | 1,326 | ||||||||
5.625%, 05/20/2043 | 4,088 | 3,853 | ||||||||
5.625%, 05/20/2043 | 900 | 848 | ||||||||
Perusahaan Listrik Negara MTN | ||||||||||
5.250%, 10/24/2042 | 1,080 | 985 | ||||||||
Republic of Indonesia | ||||||||||
12.800%, 06/15/2021 | IDR | 230,000 | 20 | |||||||
11.000%, 09/15/2025 | 2,000,000 | 172 | ||||||||
9.000%, 03/15/2029 | 253,606,000 | 19,695 | ||||||||
8.750%, 05/15/2031 | 149,729,000 | 11,523 | ||||||||
8.500%, 10/12/2035 | $ | 800 | 1,118 | |||||||
| SEI Institutional Investments Trust / Semi-Annual Report / November 30, 2016 | 181 |
SCHEDULE OF INVESTMENTS (Unaudited)
Emerging Markets Debt Fund (Continued)
November 30, 2016
| Description | Face Amount (Thousands) | Market Value ($ Thousands) | ||||||||
8.375%, 03/15/2024 | IDR | 387,046,000 | $ | 28,630 | ||||||
8.375%, 09/15/2026 | 133,583,000 | 10,055 | ||||||||
8.375%, 03/15/2034 | 151,217,000 | 11,102 | ||||||||
8.250%, 07/15/2021 | 16,550,000 | 1,235 | ||||||||
8.250%, 06/15/2032 | 5,900,000 | 429 | ||||||||
8.250%, 05/15/2036 | 73,090,000 | 5,403 | ||||||||
7.875%, 04/15/2019 | 13,000,000 | 955 | ||||||||
7.750%, 01/17/2038 | $ | 54 | 72 | |||||||
7.750%, 01/17/2038 | 2,461 | 3,261 | ||||||||
7.750%, 01/17/2038 | 1,575 | 2,087 | ||||||||
7.000%, 05/15/2022 | IDR | 163,800,000 | 11,488 | |||||||
7.000%, 05/15/2027 | 11,500,000 | 786 | ||||||||
6.625%, 05/15/2033 | 45,270,000 | 2,844 | ||||||||
6.625%, 02/17/2037 | $ | 2,182 | 2,613 | |||||||
6.125%, 05/15/2028 | IDR | 18,170,000 | �� | 1,130 | ||||||
5.625%, 05/15/2023 | 71,594,000 | 4,611 | ||||||||
4.875%, 05/05/2021 | $ | 2,640 | 2,805 | |||||||
4.875%, 05/05/2021 (A) | 200 | 213 | ||||||||
3.375%, 07/30/2025 | EUR | 7,070 | 7,685 | |||||||
Republic of Indonesia MTN | ||||||||||
11.625%, 03/04/2019 (A) | $ | 2,500 | 2,997 | |||||||
11.625%, 03/04/2019 | 258 | 309 | ||||||||
11.625%, 03/04/2019 | 1,006 | 1,206 | ||||||||
6.750%, 01/15/2044 (A) | 245 | 305 | ||||||||
5.875%, 01/15/2024 | 4,183 | 4,696 | ||||||||
5.875%, 01/15/2024 (A) | 1,500 | 1,684 | ||||||||
5.875%, 01/15/2024 | 5,475 | 6,147 | ||||||||
5.250%, 01/17/2042 | 867 | 898 | ||||||||
5.125%, 01/15/2045 (A) | 291 | 298 | ||||||||
4.750%, 01/08/2026 (A) | 6,497 | 6,839 | ||||||||
4.750%, 01/08/2026 | 2,372 | 2,497 | ||||||||
4.125%, 01/15/2025 | 2,405 | 2,427 | ||||||||
3.375%, 04/15/2023 (A) | 3,263 | 3,223 | ||||||||
|
| |||||||||
| 176,851 | ||||||||||
|
| |||||||||
Iraq — 0.4% | ||||||||||
Republic of Iraq | ||||||||||
5.800%, 01/15/2028 | 10,506 | 8,326 | ||||||||
|
| |||||||||
Ivory Coast — 0.8% | ||||||||||
Government of Ivory Coast | ||||||||||
11.660%, 12/31/2032 | 3,527 | 3,250 | ||||||||
11.660%, 12/31/2032 | 10,960 | 10,097 | ||||||||
6.375%, 03/03/2028 (A) | 644 | 624 | ||||||||
5.375%, 07/23/2024 (A) | 1,363 | 1,306 | ||||||||
|
| |||||||||
| 15,277 | ||||||||||
|
| |||||||||
Jamaica — 0.3% | ||||||||||
Digicel Group | ||||||||||
8.250%, 09/30/2020 | 1,750 | 1,466 | ||||||||
8.250%, 09/30/2020 (A) | 287 | 240 | ||||||||
7.125%, 04/01/2022 (A) | 1,317 | 978 | ||||||||
| Description | Face Amount (Thousands) | Market Value ($ Thousands) | ||||||||
Government of Jamaica | ||||||||||
8.000%, 03/15/2039 | $ | 1,582 | $ | 1,712 | ||||||
7.875%, 07/28/2045 | 680 | 719 | ||||||||
7.625%, 07/09/2025 | 1,154 | 1,287 | ||||||||
|
| |||||||||
| 6,402 | ||||||||||
|
| |||||||||
Jordan — 0.1% | ||||||||||
Jordan Government International Bond | ||||||||||
5.750%, 01/31/2027 | 889 | 837 | ||||||||
5.750%, 01/31/2027 (A) | 336 | 316 | ||||||||
|
| |||||||||
| 1,153 | ||||||||||
|
| |||||||||
Kazakhstan — 0.6% | ||||||||||
Development Bank of Kazakhstan | ||||||||||
4.125%, 12/10/2022 | 880 | 832 | ||||||||
KazAgro National Management Holding MTN | ||||||||||
4.625%, 05/24/2023 | 420 | 379 | ||||||||
Kazakhstan Temir Zholy Finance | ||||||||||
6.950%, 07/10/2042 | 500 | 467 | ||||||||
6.375%, 10/06/2020 (A) | 660 | 701 | ||||||||
KazMunaiGaz Finance Sub | ||||||||||
7.000%, 05/05/2020 | 1,391 | 1,500 | ||||||||
KazMunaiGaz Finance Sub MTN | ||||||||||
6.375%, 04/09/2021 | 2,856 | 3,030 | ||||||||
KazMunayGas National | ||||||||||
7.000%, 05/05/2020 (A) | 947 | 1,021 | ||||||||
Republic of Kazakhstan MTN | ||||||||||
6.500%, 07/21/2045 | 1,270 | 1,406 | ||||||||
5.125%, 07/21/2025 | 930 | 984 | ||||||||
Republic of Kazakhstan | ||||||||||
3.875%, 10/14/2024 (A) | 1,311 | 1,310 | ||||||||
Samruk-Energy MTN | ||||||||||
3.750%, 12/20/2017 | 700 | 702 | ||||||||
|
| |||||||||
| 12,332 | ||||||||||
|
| |||||||||
Kenya — 0.6% | ||||||||||
Kenya Infrastructure Bond | ||||||||||
12.500%, 05/12/2025 | KES | 76,000 | 730 | |||||||
11.000%, 09/15/2025 | 295,000 | 2,699 | ||||||||
11.000%, 10/12/2026 | 40,000 | 361 | ||||||||
11.000%, 03/15/2027 | 161,850 | 1,453 | ||||||||
Republic of Kenya | ||||||||||
6.875%, 06/24/2024 (A) | $ | 1,553 | 1,475 | |||||||
6.875%, 06/24/2024 | 4,364 | 4,146 | ||||||||
5.875%, 06/24/2019 (A) | 1,182 | 1,204 | ||||||||
|
| |||||||||
| 12,068 | ||||||||||
|
| |||||||||
Kuwait — 0.0% | ||||||||||
Equate Petrochemical BV MTN | ||||||||||
4.250%, 11/03/2026 (A) | 410 | 388 | ||||||||
|
| |||||||||
Lithuania — 0.4% | ||||||||||
Lithuania Government International Bond | ||||||||||
6.625%, 02/01/2022 | 6,950 | 8,100 | ||||||||
| 182 | SEI Institutional Investments Trust / Semi-Annual Report / November 30, 2016 |
| Description | Face Amount (Thousands) | Market Value ($ Thousands) | ||||||||
Republic of Lithuania | ||||||||||
7.375%, 02/11/2020 (A) | $ | 251 | $ | 287 | ||||||
|
| |||||||||
| 8,387 | ||||||||||
|
| |||||||||
Malaysia — 3.9% | ||||||||||
1MDB Global Investments | ||||||||||
4.400%, 03/09/2023 | 6,000 | 5,040 | ||||||||
Government of Malaysia | ||||||||||
5.248%, 09/15/2028 | MYR | 1,050 | 246 | |||||||
4.935%, 09/30/2043 | 4,500 | 987 | ||||||||
4.498%, 04/15/2030 | 1,540 | 334 | ||||||||
4.392%, 04/15/2026 | 12,223 | 2,647 | ||||||||
4.378%, 11/29/2019 | 1,800 | 407 | ||||||||
4.232%, 06/30/2031 | 9,500 | 2,002 | ||||||||
4.181%, 07/15/2024 | 17,412 | 3,824 | ||||||||
4.160%, 07/15/2021 | 9,850 | 2,202 | ||||||||
4.048%, 09/30/2021 | 5,020 | 1,112 | ||||||||
4.012%, 09/15/2017 | 600 | 135 | ||||||||
3.955%, 09/15/2025 | 45,616 | 9,816 | ||||||||
3.900%, 11/30/2026 | 2,240 | 479 | ||||||||
3.892%, 03/15/2027 | 2,325 | 482 | ||||||||
3.889%, 07/31/2020 | 10,760 | 2,371 | ||||||||
3.844%, 04/15/2033 | 1,960 | 391 | ||||||||
3.800%, 08/17/2023 | 34,705 | 7,559 | ||||||||
3.795%, 09/30/2022 | 11,000 | 2,400 | ||||||||
3.654%, 10/31/2019 | 22,840 | 5,035 | ||||||||
3.580%, 09/28/2018 | 10,125 | 2,255 | ||||||||
3.502%, 05/31/2027 | 1,050 | 214 | ||||||||
3.492%, 03/31/2020 | 7,580 | 1,654 | ||||||||
3.480%, 03/15/2023 | 19,004 | 3,994 | ||||||||
3.418%, 08/15/2022 | 10,253 | 2,186 | ||||||||
3.314%, 10/31/2017 | 6,420 | 1,435 | ||||||||
3.260%, 03/01/2018 | 25,790 | 5,731 | ||||||||
Malaysia Government Investment Issue | ||||||||||
4.070%, 09/30/2026 | 25,473 | 5,540 | ||||||||
Petronas Capital MTN | ||||||||||
4.500%, 03/18/2045 (A) | $ | 351 | 346 | |||||||
3.500%, 03/18/2025 (A) | 3,976 | 3,963 | ||||||||
|
| |||||||||
| 74,787 | ||||||||||
|
| |||||||||
Mexico — 8.5% | ||||||||||
Alfa | ||||||||||
6.875%, 03/25/2044 | 2,325 | 2,153 | ||||||||
America Movil | ||||||||||
7.125%, 12/09/2024 | MXN | 23,310 | 1,057 | |||||||
6.000%, 06/09/2019 | 14,350 | 677 | ||||||||
Banco Nacional de Comercio Exterior SNC (B) | ||||||||||
3.800%, 08/11/2026 (A) | $ | 3,115 | 2,904 | |||||||
3.800%, 08/11/2026 | 1,062 | 990 | ||||||||
Cemex | ||||||||||
7.750%, 04/16/2026 (A) | 3,317 | 3,557 | ||||||||
6.125%, 05/05/2025 (A) | 91 | 90 | ||||||||
5.700%, 01/11/2025 (A) | 245 | 238 | ||||||||
| Description | Face Amount (Thousands) | Market Value ($ Thousands) | ||||||||
Cemex Finance LLC | ||||||||||
6.000%, 04/01/2024 | $ | 1,470 | $ | 1,461 | ||||||
Comision Federal de Electricidad | ||||||||||
7.350%, 11/25/2025 | MXN | 52,305 | 2,247 | |||||||
5.750%, 02/14/2042 (A) | $ | 570 | 515 | |||||||
4.875%, 01/15/2024 (A) | 288 | 284 | ||||||||
4.750%, 02/23/2027 (A) | 1,363 | 1,268 | ||||||||
Fermaca Enterprises S de RL | ||||||||||
6.375%, 03/30/2038 (A) | 713 | 701 | ||||||||
Mexican Bonos | ||||||||||
10.000%, 12/05/2024 | MXN | 353,413 | 20,164 | |||||||
10.000%, 11/20/2036 | 43,491 | 2,635 | ||||||||
8.500%, 12/13/2018 | 25,513 | 1,292 | ||||||||
8.500%, 05/31/2029 | 136,907 | 7,235 | ||||||||
8.500%, 11/18/2038 | 94,561 | 5,026 | ||||||||
7.750%, 05/29/2031 | 161,342 | 7,993 | ||||||||
7.750%, 11/23/2034 | 60,968 | 3,014 | ||||||||
7.750%, 11/13/2042 | 19,590 | 967 | ||||||||
6.500%, 06/10/2021 | 367,223 | 17,616 | ||||||||
6.500%, 06/09/2022 | 126,919 | 6,043 | ||||||||
5.750%, 03/05/2026 | 52,083 | 2,280 | ||||||||
5.000%, 12/11/2019 | 150,340 | 7,008 | ||||||||
4.750%, 06/14/2018 | 73,500 | 3,506 | ||||||||
Mexican Bonos , Ser M20 | ||||||||||
8.000%, 12/07/2023 | 26 | 1 | ||||||||
Mexican Udibonos | ||||||||||
2.000%, 06/09/2022 | 1,752 | 447 | ||||||||
Mexico City Airport Trust | ||||||||||
4.250%, 10/31/2026 (A) | $ | 576 | 552 | |||||||
Petroleos Mexicanos MTN | ||||||||||
6.875%, 08/04/2026 | 6,502 | 6,653 | ||||||||
6.875%, 08/04/2026 (A) | 4,983 | 5,099 | ||||||||
6.750%, 09/21/2047 (A) | 1,432 | 1,256 | ||||||||
6.375%, 01/23/2045 (A) | 1,016 | 862 | ||||||||
5.625%, 01/23/2046 | 828 | 644 | ||||||||
4.625%, 09/21/2023 (A) | 1,599 | 1,501 | ||||||||
4.250%, 01/15/2025 | 4,725 | 4,181 | ||||||||
2.750%, 04/21/2027 | EUR | 1,500 | 1,340 | |||||||
Petroleos Mexicanos | ||||||||||
9.500%, 09/15/2027 | $ | 215 | 254 | |||||||
7.470%, 11/12/2026 | MXN | 140,104 | 5,575 | |||||||
7.190%, 09/12/2024 | 102,190 | 4,227 | ||||||||
6.625%, 06/15/2035 | $ | 7,893 | 7,243 | |||||||
6.625%, 06/15/2038 | 2,871 | 2,605 | ||||||||
6.500%, 06/02/2041 | 1,655 | 1,457 | ||||||||
6.375%, 02/04/2021 (A) | 441 | 462 | ||||||||
6.375%, 01/23/2045 | 2,384 | 2,024 | ||||||||
6.000%, 03/05/2020 | 452 | 471 | ||||||||
5.750%, 03/01/2018 | 670 | 694 | ||||||||
5.500%, 01/21/2021 | 17 | 17 | ||||||||
5.500%, 06/27/2044 | 2,041 | 1,579 | ||||||||
4.875%, 01/24/2022 | 370 | 360 | ||||||||
| SEI Institutional Investments Trust / Semi-Annual Report / November 30, 2016 | 183 |
SCHEDULE OF INVESTMENTS (Unaudited)
Emerging Markets Debt Fund (Continued)
November 30, 2016
| Description | Face Amount (Thousands) | Market Value ($ Thousands) | ||||||||
4.875%, 01/18/2024 | $ | 643 | $ | 602 | ||||||
Sixsigma Networks Mexico | ||||||||||
8.250%, 11/07/2021 (A) | 643 | 601 | ||||||||
Trust F/1401 | ||||||||||
6.950%, 01/30/2044 * | MXN | 2,190 | 1,971 | |||||||
United Mexican States | ||||||||||
5.750%, 10/12/2110 | $ | 478 | 429 | |||||||
4.600%, 01/23/2046 | 3,782 | 3,281 | ||||||||
4.350%, 01/15/2047 | 1,805 | 1,503 | ||||||||
4.000%, 10/02/2023 | 170 | 169 | ||||||||
3.600%, 01/30/2025 | 218 | 209 | ||||||||
United Mexican States MTN | ||||||||||
4.125%, 01/21/2026 | 1,743 | 1,721 | ||||||||
3.625%, 03/15/2022 | 1,114 | 1,111 | ||||||||
|
| |||||||||
| 164,022 | ||||||||||
|
| |||||||||
Mongolia — 0.3% | ||||||||||
Development Bank of Mongolia MTN | ||||||||||
5.750%, 03/21/2017 | 1,138 | 1,093 | ||||||||
Government of Mongolia MTN | ||||||||||
10.875%, 04/06/2021 (A) | 1,813 | 1,822 | ||||||||
5.125%, 12/05/2022 | 2,715 | 2,199 | ||||||||
Trade & Development Bank of Mongolia MTN | ||||||||||
9.375%, 05/19/2020 | 470 | 439 | ||||||||
9.375%, 05/19/2020 (A) | 453 | 423 | ||||||||
|
| |||||||||
| 5,976 | ||||||||||
|
| |||||||||
Montenegro — 0.0% | ||||||||||
Republic of Montenegro | ||||||||||
5.750%, 03/10/2021 (A) | EUR | 742 | 814 | |||||||
|
| |||||||||
Morocco — 0.0% | ||||||||||
OCP | ||||||||||
6.875%, 04/25/2044 (A) | $ | 605 | 596 | |||||||
|
| |||||||||
Namibia — 0.1% | ||||||||||
Namibia International Bonds | ||||||||||
5.250%, 10/29/2025 (A) | 1,412 | 1,386 | ||||||||
|
| |||||||||
Nigeria — 0.1% | ||||||||||
Republic of Nigeria | ||||||||||
6.750%, 01/28/2021 | 1,112 | 1,080 | ||||||||
|
| |||||||||
Oman — 0.1% | ||||||||||
Oman Government International Bond | ||||||||||
4.750%, 06/15/2026 (A) | 1,088 | 1,053 | ||||||||
3.625%, 06/15/2021 | 711 | 710 | ||||||||
|
| |||||||||
| 1,763 | ||||||||||
|
| |||||||||
Pakistan — 0.1% | ||||||||||
Republic of Pakistan | ||||||||||
8.250%, 04/15/2024 | 663 | 718 | ||||||||
| Description | Face Amount (Thousands) | Market Value ($ Thousands) | ||||||||
Third Pakistan International Sukuk | ||||||||||
5.500%, 10/13/2021 | $ | 882 | $ | 895 | ||||||
|
| |||||||||
| 1,613 | ||||||||||
|
| |||||||||
Panama — 1.0% | ||||||||||
Panama Notas del Tesoro | ||||||||||
4.875%, 02/05/2021 | 840 | 894 | ||||||||
Republic of Panama | ||||||||||
9.375%, 01/16/2023 | 595 | 760 | ||||||||
9.375%, 04/01/2029 | 6,288 | 8,921 | ||||||||
8.875%, 09/30/2027 | 1,963 | 2,704 | ||||||||
8.125%, 04/28/2034 | 2,249 | 2,947 | ||||||||
6.700%, 01/26/2036 | 220 | 270 | ||||||||
4.300%, 04/29/2053 | 140 | 127 | ||||||||
3.750%, 03/16/2025 | 3,084 | 3,080 | ||||||||
|
| |||||||||
| 19,703 | ||||||||||
|
| |||||||||
Paraguay — 0.2% | ||||||||||
Republic of Paraguay | ||||||||||
6.100%, 08/11/2044 (A) | 1,280 | 1,270 | ||||||||
5.000%, 04/15/2026 | 781 | 785 | ||||||||
4.625%, 01/25/2023 | 293 | 292 | ||||||||
Telefonica Celular del Paraguay | ||||||||||
6.750%, 12/13/2022 | 900 | 916 | ||||||||
6.750%, 12/13/2022 | 200 | 204 | ||||||||
|
| |||||||||
| 3,467 | ||||||||||
|
| |||||||||
Peru — 1.8% | ||||||||||
Abengoa Transmission Sur | ||||||||||
6.875%, 04/30/2043 (A) | 326 | 328 | ||||||||
Peru Enhanced Pass-Through Finance (E) | ||||||||||
4.978%, 06/02/2025 (A) | 1,000 | 797 | ||||||||
1.273%, 05/31/2018 | 108 | 105 | ||||||||
1.223%, 05/31/2018 (A) | 122 | 119 | ||||||||
Peru Government Bond | ||||||||||
6.900%, 08/12/2037 | PEN | 7,439 | 2,220 | |||||||
6.850%, 02/12/2042 | 2,763 | 800 | ||||||||
6.350%, 08/12/2028 | 2,235 | 648 | ||||||||
Peruvian Government International Bond | ||||||||||
6.350%, 08/12/2028 (A) | 3,774 | 1,095 | ||||||||
6.350%, 08/12/2028 | 2,539 | 736 | ||||||||
Republic of Peru | ||||||||||
8.750%, 11/21/2033 | $ | 246 | 362 | |||||||
8.200%, 08/12/2026 | PEN | 10,540 | 3,511 | |||||||
6.950%, 08/12/2031 | 8,996 | 2,716 | ||||||||
6.950%, 08/12/2031 | 10,193 | 3,077 | ||||||||
6.850%, 02/12/2042 | 1,011 | 293 | ||||||||
6.550%, 03/14/2037 | $ | 2,154 | 2,725 | |||||||
5.700%, 08/12/2024 (A) | PEN | 9,779 | 2,835 | |||||||
5.700%, 08/12/2024 | 4,658 | 1,350 | ||||||||
3.750%, 03/01/2030 | EUR | 8,818 | 10,512 | |||||||
| 184 | SEI Institutional Investments Trust / Semi-Annual Report / November 30, 2016 |
| Description | Face Amount (Thousands) | Market Value ($ Thousands) | ||||||||
Southern Copper | ||||||||||
3.875%, 04/23/2025 | $ | 873 | $ | 850 | ||||||
|
| |||||||||
| 35,079 | ||||||||||
|
| |||||||||
Philippines — 0.1% | ||||||||||
Republic of Philippines | ||||||||||
6.250%, 01/14/2036 | PHP | 10,000 | 218 | |||||||
3.900%, 11/26/2022 | 52,000 | 981 | ||||||||
|
| |||||||||
| 1,199 | ||||||||||
|
| |||||||||
Poland — 4.2% | ||||||||||
Republic of Poland | ||||||||||
5.750%, 09/23/2022 | PLN | 16,534 | 4,477 | |||||||
5.250%, 10/25/2020 | 27,025 | 7,073 | ||||||||
5.125%, 04/21/2021 | $ | 1,420 | 1,556 | |||||||
5.000%, 03/23/2022 | 2,108 | 2,305 | ||||||||
4.000%, 10/25/2023 | PLN | 40,125 | 9,949 | |||||||
4.000%, 01/22/2024 | $ | 609 | 628 | |||||||
3.250%, 07/25/2025 | PLN | 42,012 | 9,783 | |||||||
3.250%, 04/06/2026 | $ | 819 | 792 | |||||||
3.000%, 03/17/2023 | 332 | 327 | ||||||||
2.750%, 08/25/2023 | PLN | 20,857 | 6,107 | |||||||
2.750%, 04/25/2028 | 4,920 | 1,062 | ||||||||
2.500%, 07/25/2026 | 50,558 | 10,943 | ||||||||
1.750%, 07/25/2021 | 64,167 | 14,544 | ||||||||
1.707%, 10/25/2018 (E) | 21,950 | 5,047 | ||||||||
1.500%, 04/25/2020 | 26,774 | 6,184 | ||||||||
|
| |||||||||
| 80,777 | ||||||||||
|
| |||||||||
Qatar — 0.6% | ||||||||||
Ooredoo International Finance MTN | ||||||||||
7.875%, 06/10/2019 | $ | 873 | 985 | |||||||
State of Qatar | ||||||||||
9.750%, 06/15/2030 | 3,537 | 5,518 | ||||||||
6.400%, 01/20/2040 | 3,463 | 4,373 | ||||||||
|
| |||||||||
| 10,876 | ||||||||||
|
| |||||||||
Romania — 1.3% | ||||||||||
Government of Romania | ||||||||||
5.850%, 04/26/2023 | RON | 23,390 | 6,380 | |||||||
4.750%, 02/24/2025 | 22,285 | 5,743 | ||||||||
3.500%, 12/19/2022 | 4,965 | 1,199 | ||||||||
Government of Romania MTN | ||||||||||
6.750%, 02/07/2022 (A) | $ | 1,707 | 1,952 | |||||||
6.750%, 02/07/2022 | 504 | 576 | ||||||||
6.125%, 01/22/2044 (A) | 818 | 973 | ||||||||
6.125%, 01/22/2044 | 6,400 | 7,616 | ||||||||
4.875%, 01/22/2024 (A) | 284 | 302 | ||||||||
4.375%, 08/22/2023 | 540 | 557 | ||||||||
|
| |||||||||
| 25,298 | ||||||||||
|
| |||||||||
Russia — 4.6% | ||||||||||
Alfa Bank via Alfa Bond Issuance | ||||||||||
7.750%, 04/28/2021 | 1,300 | 1,457 | ||||||||
| Description | Face Amount (Thousands) | Market Value ($ Thousands) | ||||||||
Credit Bank of Moscow Via CBOM Finance | ||||||||||
5.875%, 11/07/2021 (A) | $ | 1,626 | $ | 1,622 | ||||||
Evraz Group | ||||||||||
8.250%, 01/28/2021 | 1,400 | 1,532 | ||||||||
Ritekro | ||||||||||
14.548%, 11/07/2022 (E) (F) | 538 | 269 | ||||||||
Russian Federal Bond - OFZ | ||||||||||
8.150%, 02/03/2027 | RUB | 54,120 | 810 | |||||||
7.600%, 04/14/2021 | 525,649 | 7,819 | ||||||||
7.600%, 07/20/2022 | 470,208 | 6,923 | ||||||||
7.500%, 03/15/2018 | 366,156 | 5,591 | ||||||||
7.500%, 02/27/2019 | 391,835 | 5,934 | ||||||||
7.400%, 06/14/2017 | 39,060 | 600 | ||||||||
7.050%, 01/19/2028 | 289,772 | 3,960 | ||||||||
7.000%, 01/25/2023 | 204,736 | 2,909 | ||||||||
7.000%, 08/16/2023 | 309,500 | 4,378 | ||||||||
6.800%, 12/11/2019 | 701,224 | 10,332 | ||||||||
6.700%, 05/15/2019 | 386,027 | 5,724 | ||||||||
6.500%, 11/24/2021 (D) | 24,270 | 346 | ||||||||
6.400%, 05/27/2020 | 30,690 | 443 | ||||||||
6.200%, 01/31/2018 | 205,553 | 3,093 | ||||||||
Russian Foreign Bond - Eurobond | ||||||||||
5.875%, 09/16/2043 | $ | 800 | 871 | |||||||
5.625%, 04/04/2042 | 800 | 847 | ||||||||
5.000%, 04/29/2020 (A) | 2,537 | 2,671 | ||||||||
4.875%, 09/16/2023 | 6,000 | 6,308 | ||||||||
3.250%, 04/04/2017 | 800 | 803 | ||||||||
Russian Railways via RZD Capital | ||||||||||
5.700%, 04/05/2022 | 2,400 | 2,508 | ||||||||
Vnesheconombank via VEB Finance | ||||||||||
6.902%, 07/09/2020 | 1,635 | 1,758 | ||||||||
6.800%, 11/22/2025 | 2,476 | 2,581 | ||||||||
6.800%, 11/22/2025 (A) | 600 | 626 | ||||||||
5.450%, 11/22/2017 (A) | 340 | 347 | ||||||||
5.450%, 11/22/2017 | 110 | 112 | ||||||||
Vnesheconombank Via VEB Finance | ||||||||||
6.902%, 07/09/2020 | 1,990 | 2,140 | ||||||||
6.800%, 11/22/2025 | 2,435 | 2,539 | ||||||||
|
| |||||||||
| 87,853 | ||||||||||
|
| |||||||||
Saudi Arabia — 0.6% | ||||||||||
Saudi Government International Bond MTN | ||||||||||
4.500%, 10/26/2046 | 1,565 | 1,508 | ||||||||
3.250%, 10/26/2026 | 9,606 | 9,079 | ||||||||
|
| |||||||||
| 10,587 | ||||||||||
|
| |||||||||
Senegal — 0.3% | ||||||||||
Republic of Senegal | ||||||||||
8.750%, 05/13/2021 | 1,390 | 1,541 | ||||||||
8.750%, 05/13/2021 (A) | 200 | 222 | ||||||||
6.250%, 07/30/2024 (A) | 330 | 328 | ||||||||
6.250%, 07/30/2024 | 3,870 | 3,842 | ||||||||
|
| |||||||||
| 5,933 | ||||||||||
|
| |||||||||
| SEI Institutional Investments Trust / Semi-Annual Report / November 30, 2016 | 185 |
SCHEDULE OF INVESTMENTS (Unaudited)
Emerging Markets Debt Fund (Continued)
November 30, 2016
| Description | Face Amount (Thousands) | Market Value ($ Thousands) | ||||||||
Serbia — 0.7% | ||||||||||
Republic of Serbia | ||||||||||
7.250%, 09/28/2021 (A) | $ | 300 | $ | 335 | ||||||
7.250%, 09/28/2021 | 7,026 | 7,839 | ||||||||
5.875%, 12/03/2018 (A) | 640 | 670 | ||||||||
4.875%, 02/25/2020 | 3,597 | 3,663 | ||||||||
|
| |||||||||
| 12,507 | ||||||||||
|
| |||||||||
Slovenia — 0.3% | ||||||||||
Republic of Slovenia | ||||||||||
5.850%, 05/10/2023 | 2,300 | 2,616 | ||||||||
5.250%, 02/18/2024 | 3,250 | 3,602 | ||||||||
|
| |||||||||
| 6,218 | ||||||||||
|
| |||||||||
South Africa — 6.1% | ||||||||||
Eskom Holdings SOC | ||||||||||
7.125%, 02/11/2025 (A) | 1,248 | 1,224 | ||||||||
7.125%, 02/11/2025 | 6,280 | 6,162 | ||||||||
Republic of South Africa | ||||||||||
10.500%, 12/21/2026 | ZAR | 315,035 | 24,606 | |||||||
8.875%, 02/28/2035 | 49,900 | 3,309 | ||||||||
8.750%, 01/31/2044 | 18,377 | 1,182 | ||||||||
8.750%, 02/28/2048 | 72,873 | 4,684 | ||||||||
8.500%, 06/23/2017 | $ | 2,100 | 2,160 | |||||||
8.500%, 01/31/2037 | ZAR | 231,414 | 14,700 | |||||||
8.250%, 03/31/2032 | 90,707 | 5,787 | ||||||||
8.000%, 12/21/2018 | 9,478 | 675 | ||||||||
8.000%, 01/31/2030 | 100,802 | 6,425 | ||||||||
7.750%, 02/28/2023 | 134,667 | 9,159 | ||||||||
7.250%, 01/15/2020 | 11,101 | 769 | ||||||||
7.000%, 02/28/2031 | 137,144 | 7,930 | ||||||||
6.750%, 03/31/2021 | 61,448 | 4,116 | ||||||||
6.500%, 02/28/2041 | 41,359 | 2,070 | ||||||||
6.250%, 03/31/2036 | 115,150 | 5,786 | ||||||||
5.875%, 09/16/2025 | $ | 7,482 | 8,017 | |||||||
4.875%, 04/14/2026 | 2,508 | 2,495 | ||||||||
4.300%, 10/12/2028 | 4,316 | 3,998 | ||||||||
Transnet SOC MTN | ||||||||||
9.500%, 05/13/2021 (A) | ZAR | 16,660 | 1,105 | |||||||
|
| |||||||||
| 116,359 | ||||||||||
|
| |||||||||
Sri Lanka — 0.7% | ||||||||||
Democratic Socialist Republic of Sri Lanka | ||||||||||
6.850%, 11/03/2025 (A) | $ | 1,248 | 1,253 | |||||||
6.850%, 11/03/2025 | 6,365 | 6,390 | ||||||||
6.250%, 07/27/2021 | 1,147 | 1,179 | ||||||||
5.875%, 07/25/2022 (A) | 2,114 | 2,111 | ||||||||
Sri Lanka Government International Bond | ||||||||||
6.825%, 07/18/2026 (A) | 1,612 | 1,616 | ||||||||
6.250%, 10/04/2020 | 719 | 746 | ||||||||
|
| |||||||||
| 13,295 | ||||||||||
|
| |||||||||
| Description | Face Amount (Thousands) | Market Value ($ Thousands) | ||||||||
Supranational — 0.2% | ||||||||||
European Investment Bank MTN | ||||||||||
8.500%, 09/17/2024 | ZAR | 11,350 | $ | 784 | ||||||
7.200%, 07/09/2019 | IDR | 9,100,000 | 648 | |||||||
Inter-American Development Bank MTN | ||||||||||
7.350%, 09/12/2018 | 24,590,000 | 1,766 | ||||||||
|
| |||||||||
| 3,198 | ||||||||||
|
| |||||||||
Suriname — 0.0% | ||||||||||
Republic of Suriname | ||||||||||
9.250%, 10/26/2026 (A) | $ | 713 | 709 | |||||||
|
| |||||||||
Thailand — 2.5% | ||||||||||
Government of Thailand | ||||||||||
5.670%, 03/13/2028 | THB | 3,000 | 107 | |||||||
4.875%, 06/22/2029 | 257,549 | 8,681 | ||||||||
3.875%, 06/13/2019 | 43,000 | 1,270 | ||||||||
3.850%, 12/12/2025 | 186,139 | 5,722 | ||||||||
3.650%, 12/17/2021 | 425,849 | 12,842 | ||||||||
3.625%, 06/16/2023 | 280,041 | 8,442 | ||||||||
3.580%, 12/17/2027 | 33,270 | 995 | ||||||||
3.400%, 06/17/2036 | 89,500 | 2,599 | ||||||||
2.550%, 06/26/2020 | 75,000 | 2,153 | ||||||||
2.125%, 12/17/2026 | 134,731 | 3,554 | ||||||||
1.875%, 06/17/2022 | 15,000 | 411 | ||||||||
1.200%, 07/14/2021 | 63,750 | 1,854 | ||||||||
|
| |||||||||
| 48,630 | ||||||||||
|
| |||||||||
Trinidad & Tobago — 0.0% | ||||||||||
Trinidad Generation UnLtd | ||||||||||
5.250%, 11/04/2027 (A) | $ | 706 | 694 | |||||||
|
| |||||||||
Tunisia — 0.2% | ||||||||||
Banque Centrale de Tunisie | ||||||||||
5.750%, 01/30/2025 (A) | 3,572 | 3,269 | ||||||||
|
| |||||||||
Turkey — 6.6% | ||||||||||
Export Credit Bank of Turkey MTN | ||||||||||
5.375%, 02/08/2021 (A) | 1,206 | 1,182 | ||||||||
Export Credit Bank of Turkey | ||||||||||
5.875%, 04/24/2019 (A) | 200 | 203 | ||||||||
5.375%, 10/24/2023 (A) | 1,487 | 1,398 | ||||||||
5.000%, 09/23/2021 (A) | 674 | 647 | ||||||||
KOC Holding | ||||||||||
5.250%, 03/15/2023 | 2,210 | 2,143 | ||||||||
Republic of Turkey | ||||||||||
10.700%, 02/17/2021 | TRY | 30,521 | 8,946 | |||||||
10.600%, 02/11/2026 | 74,381 | 21,303 | ||||||||
10.500%, 01/15/2020 | 5,244 | 1,542 | ||||||||
10.400%, 03/27/2019 | 8,790 | 2,574 | ||||||||
10.400%, 03/20/2024 | 2,700 | 775 | ||||||||
9.500%, 01/12/2022 | 13,804 | 3,849 | ||||||||
9.400%, 07/08/2020 | 31,440 | 8,876 | ||||||||
| 186 | SEI Institutional Investments Trust / Semi-Annual Report / November 30, 2016 |
| Description | Face Amount (Thousands) | Market Value ($ Thousands) | ||||||||
9.000%, 07/24/2024 | TRY | 24,182 | $ | 6,418 | ||||||
8.800%, 11/14/2018 | 11,483 | 3,268 | ||||||||
8.500%, 07/10/2019 | 4,290 | 1,204 | ||||||||
8.500%, 09/14/2022 | 16,527 | 4,372 | ||||||||
8.300%, 06/20/2018 | 2,346 | 665 | ||||||||
8.000%, 03/12/2025 | 4,211 | 1,044 | ||||||||
7.400%, 02/05/2020 | 61,179 | 16,451 | ||||||||
7.375%, 02/05/2025 | $ | 1,540 | 1,693 | |||||||
7.100%, 03/08/2023 | TRY | 8,160 | 1,994 | |||||||
7.000%, 03/11/2019 | $ | 779 | 829 | |||||||
7.000%, 06/05/2020 | 3,686 | 3,958 | ||||||||
6.875%, 03/17/2036 | 2,375 | 2,432 | ||||||||
6.750%, 04/03/2018 | 1,886 | 1,969 | ||||||||
6.750%, 05/30/2040 | 2,590 | 2,605 | ||||||||
6.625%, 02/17/2045 | 2,010 | 1,986 | ||||||||
6.250%, 09/26/2022 | 2,317 | 2,418 | ||||||||
6.000%, 01/14/2041 | 1,391 | 1,280 | ||||||||
5.750%, 03/22/2024 | 245 | 247 | ||||||||
5.625%, 03/30/2021 | 769 | 788 | ||||||||
5.125%, 03/25/2022 | 3,450 | 3,433 | ||||||||
4.875%, 04/16/2043 | 850 | 676 | ||||||||
4.250%, 04/14/2026 | 2,239 | 2,000 | ||||||||
3.000%, 08/02/2023 | TRY | 6,700 | 2,584 | |||||||
TC Ziraat Bankasi MTN | ||||||||||
4.750%, 04/29/2021 (A) | $ | 756 | 723 | |||||||
TC Ziraat Bankasi | ||||||||||
4.250%, 07/03/2019 (A) | 1,710 | 1,672 | ||||||||
Turk Telekomunikasyon | ||||||||||
4.875%, 06/19/2024 | 2,300 | 2,150 | ||||||||
Turkey Government Bond | ||||||||||
9.200%, 09/22/2021 | TRY | 14,372 | 3,957 | |||||||
Turkiye Garanti Bankasi | ||||||||||
5.250%, 09/13/2022 (A) | $ | 465 | 445 | |||||||
Turkiye Is Bankasi | ||||||||||
5.500%, 04/21/2022 (A) | 141 | 133 | ||||||||
|
| |||||||||
| 126,832 | ||||||||||
|
| |||||||||
Ukraine — 2.2% | ||||||||||
Government of Ukraine | ||||||||||
7.750%, 09/01/2019 (A) | 185 | 179 | ||||||||
7.750%, 09/01/2020 (A) | 9,114 | 8,668 | ||||||||
7.750%, 09/01/2021 (A) | 7,972 | 7,483 | ||||||||
7.750%, 09/01/2022 (A) | 4,074 | 3,783 | ||||||||
7.750%, 09/01/2023 (A) | 1,928 | 1,764 | ||||||||
7.750%, 09/01/2024 | 2,290 | 2,077 | ||||||||
7.750%, 09/01/2024 (A) | 4,332 | 3,928 | ||||||||
7.750%, 09/01/2025 (A) | 5,398 | 4,845 | ||||||||
7.750%, 09/01/2026 | 3,408 | 3,050 | ||||||||
7.750%, 09/01/2026 (A) | 901 | 806 | ||||||||
7.750%, 09/01/2027 | 940 | 833 | ||||||||
7.750%, 09/01/2027 (A) | 2,201 | 1,950 | ||||||||
3.269%, 05/31/2040 (A) (B) | 1,832 | 536 | ||||||||
| Description | Face Amount (Thousands) | Market Value ($ Thousands) | ||||||||
Ukreximbank Via Biz Finance | ||||||||||
9.625%, 04/27/2022 (A) | $ | 2,211 | $ | 2,067 | ||||||
|
| |||||||||
| 41,969 | ||||||||||
|
| |||||||||
United Arab Emirates — 0.3% | ||||||||||
DP World MTN | ||||||||||
6.850%, 07/02/2037 | 2,350 | 2,398 | ||||||||
MAF Global Securities | ||||||||||
7.125%, 10/29/2049 (B) | 3,300 | 3,441 | ||||||||
|
| |||||||||
| 5,839 | ||||||||||
|
| |||||||||
Uruguay — 0.8% | ||||||||||
Republic of Uruguay PIK | ||||||||||
7.875%, 01/15/2033 | 4,370 | 5,571 | ||||||||
Republic of Uruguay | ||||||||||
5.100%, 06/18/2050 | 6,211 | 5,559 | ||||||||
4.375%, 10/27/2027 | 4,135 | 4,125 | ||||||||
4.125%, 11/20/2045 | 367 | 303 | ||||||||
|
| |||||||||
| 15,558 | ||||||||||
|
| |||||||||
Venezuela — 1.1% | ||||||||||
Petroleos de Venezuela | ||||||||||
9.000%, 11/17/2021 | 7,525 | 3,659 | ||||||||
6.000%, 05/16/2024 | 1,777 | 664 | ||||||||
6.000%, 05/16/2024 | 5,384 | 2,013 | ||||||||
6.000%, 05/16/2024 | 7,900 | 2,934 | ||||||||
6.000%, 11/15/2026 | 2,442 | 898 | ||||||||
6.000%, 11/15/2026 | 3,759 | 1,382 | ||||||||
5.500%, 04/12/2037 | 1,076 | 377 | ||||||||
5.375%, 04/12/2027 | 3,600 | 1,293 | ||||||||
Republic of Venezuela | ||||||||||
13.625%, 08/15/2018 | 1,493 | 1,168 | ||||||||
13.625%, 08/15/2018 | 497 | 364 | ||||||||
9.375%, 01/13/2034 | 5,531 | 2,415 | ||||||||
7.650%, 04/21/2025 | 3,743 | 1,572 | ||||||||
7.650%, 04/21/2025 (C) | 279 | 117 | ||||||||
Venezuela Government International Bond | ||||||||||
7.750%, 10/13/2019 | 3,997 | 1,998 | ||||||||
|
| |||||||||
| 20,854 | ||||||||||
|
| |||||||||
Zambia — 0.2% | ||||||||||
Republic of Zambia | ||||||||||
8.970%, 07/30/2027 | 2,463 | 2,320 | ||||||||
8.500%, 04/14/2024 | 1,975 | 1,852 | ||||||||
|
| |||||||||
| 4,172 | ||||||||||
|
| |||||||||
Total Global Bonds |
| 1,829,247 | ||||||||
|
| |||||||||
| SEI Institutional Investments Trust / Semi-Annual Report / November 30, 2016 | 187 |
SCHEDULE OF INVESTMENTS (Unaudited)
Emerging Markets Debt Fund (Continued)
November 30, 2016
| Description | Face Amount (Thousands) | Market Value ($ Thousands) | ||||||||
LOAN PARTICIPATIONS — 0.2% |
| |||||||||
Singapore — 0.0% | ||||||||||
Morton Bay Senior | ||||||||||
6.220%, 01/02/2049 | 3,020 | $ | — | |||||||
|
| |||||||||
Venezuela — 0.2% | ||||||||||
Bolivarian Republic of Venezuela | ||||||||||
6.250%, 01/10/2018 | 3,700 | 3,773 | ||||||||
|
| |||||||||
Total Loan Participations |
| 3,773 | ||||||||
|
| |||||||||
Total Investments — 95.4% |
| $ | 1,833,020 | |||||||
|
| |||||||||
A list of the open futures contracts held by the Fund at November 30, 2016, is as follows:
| Type of Contract | Number of Contracts Long (Short) | Expiration Date | Unrealized Appreciation (Depreciation) ($ Thousands) | |||||||||
Euro-Bond | (140 | ) | Mar-2017 | $ | 143 | |||||||
Euro-Buxl 30 Year Bond | (25 | ) | Mar-2017 | 90 | ||||||||
JSE Bond Future R186 | 811 | Feb-2017 | (89 | ) | ||||||||
JSE Bond Future R2030 | 1,472 | Feb-2017 | (157 | ) | ||||||||
JSE Bond Future R2037 | 411 | Feb-2017 | (5 | ) | ||||||||
JSE Bond Future R207 | 816 | Feb-2017 | (33 | ) | ||||||||
JSE Bond Future R208 | 505 | Feb-2017 | (25 | ) | ||||||||
Korea 3-Year Bond | 197 | Dec-2016 | (234 | ) | ||||||||
U.S. 10-Year Treasury Note | 198 | Mar-2017 | (28 | ) | ||||||||
U.S. 5-Year Treasury Note | (36 | ) | Mar-2017 | 4 | ||||||||
U.S. Ultra Long Treasury Bond | (19 | ) | Mar-2017 | 2 | ||||||||
|
| |||||||||||
| $ | (332 | ) | ||||||||||
|
| |||||||||||
For the period ended November 30, 2016, the total amount of all open futures contracts, as presented in the table above, are representative of the volume of activity for the derivative type during the period.
A list of the open forward foreign currency contracts held by the Fund at November 30, 2016, is as follows:
| Settlement Date | Currency to Deliver (Thousands) | Currency To Receive (Thousands) | Unrealized Appreciation (Depreciation) ($ Thousands) | |||||||||||||||||
12/01/16-07/19/17 | USD | 31,901 | RUB | 2,165,460 | $ | 801 | ||||||||||||||
12/01/16-03/15/17 | USD | 11,137 | RUB | 720,386 | (109 | ) | ||||||||||||||
12/09/16-01/03/17 | USD | 20,355 | EUR | 19,258 | 110 | |||||||||||||||
12/01/16-12/21/16 | USD | 120,688 | EUR | 109,602 | (4,356 | ) | ||||||||||||||
12/01/16-01/11/17 | EUR | 147,388 | USD | 160,336 | 3,863 | |||||||||||||||
12/01/16-03/15/17 | EUR | 29,902 | USD | 31,589 | (150 | ) | ||||||||||||||
12/21/16-03/15/17 | RUB | 920,583 | USD | 14,173 | 124 | |||||||||||||||
12/01/16-12/01/16 | RUB | 818,431 | USD | 12,598 | (76 | ) | ||||||||||||||
01/30/17-01/30/17 | USD | 24,246 | BRL | 84,414 | 265 | |||||||||||||||
12/02/16-01/18/17 | USD | 15,654 | BRL | 51,708 | (478 | ) | ||||||||||||||
12/02/16-01/30/17 | BRL | 113,732 | USD | 35,055 | 1,597 | |||||||||||||||
12/02/16-03/02/17 | BRL | 88,058 | USD | 25,342 | (267 | ) | ||||||||||||||
12/08/16-02/17/17 | USD | 51,476 | MYR | 214,268 | (3,706 | ) | ||||||||||||||
02/21/17-02/21/17 | USD | 4,290 | COP | 13,764,604 | 154 | |||||||||||||||
| Settlement Date | Currency to Deliver (Thousands) | Currency To Receive (Thousands) | Unrealized Appreciation (Depreciation) ($ Thousands) | |||||||||||||||||
12/09/16-12/21/16 | USD | 23,551 | COP | 70,895,516 | $ | (434 | ) | |||||||||||||
12/21/16-01/27/17 | USD | 27,465 | PEN | 94,592 | 187 | |||||||||||||||
12/09/16 | USD | 2,592 | PEN | 8,772 | (22 | ) | ||||||||||||||
12/09/16-02/17/17 | MYR | 158,898 | USD | 36,966 | 1,523 | |||||||||||||||
12/09/16-12/21/16 | COP | 86,138,930 | USD | 29,031 | 916 | |||||||||||||||
12/09/16-02/21/17 | COP | 40,350,547 | USD | 12,735 | (329 | ) | ||||||||||||||
02/14/17 | USD | 3,739 | KRW | 4,414,412 | 21 | |||||||||||||||
12/12/16-02/15/17 | USD | 9,745 | KRW | 10,795,393 | (525 | ) | ||||||||||||||
12/12/16-03/15/17 | USD | 26,278 | ZAR | 379,221 | 578 | |||||||||||||||
12/12/16-12/21/16 | USD | 16,986 | ZAR | 232,240 | (482 | ) | ||||||||||||||
12/12/16-01/13/17 | ZAR | 206,142 | USD | 14,766 | 157 | |||||||||||||||
12/12/16-01/13/17 | ZAR | 389,377 | USD | 27,138 | (524 | ) | ||||||||||||||
12/12/16-02/15/17 | KRW | 56,288,410 | USD | 49,228 | 1,205 | |||||||||||||||
01/13/17-02/28/17 | USD | 12,657 | MXN | 263,651 | 108 | |||||||||||||||
12/14/16-02/17/17 | USD | 38,886 | MXN | 759,975 | (1,977 | ) | ||||||||||||||
12/15/16-01/12/17 | EUR | 24,999 | PLN | 108,288 | (723 | ) | ||||||||||||||
12/15/16-01/12/17 | PLN | 28,437 | EUR | 6,463 | 80 | |||||||||||||||
12/19/16-12/21/16 | USD | 31,888 | PHP | 1,537,785 | (1,039 | ) | ||||||||||||||
01/18/17 | USD | 225 | IDR | 3,077,397 | — | |||||||||||||||
12/19/16-01/27/17 | USD | 32,290 | IDR | 431,477,480 | (664 | ) | ||||||||||||||
12/19/16-12/21/16 | PHP | 829,090 | USD | 17,152 | 518 | |||||||||||||||
12/20/16-12/21/16 | USD | 14,275 | CLP | 9,692,522 | 107 | |||||||||||||||
12/21/16-12/21/16 | USD | 1,852 | CLP | 1,221,500 | (40 | ) | ||||||||||||||
12/20/16-02/21/17 | USD | 53,483 | THB | 1,876,933 | (875 | ) | ||||||||||||||
12/20/16-02/21/17 | THB | 757,941 | USD | 21,496 | 252 | |||||||||||||||
02/21/17 | THB | 11,836 | USD | 331 | — | |||||||||||||||
12/20/16-12/21/16 | CLP | 16,550,604 | USD | 25,113 | 554 | |||||||||||||||
12/21/16-12/30/16 | EUR | 14,144 | HUF | 4,348,306 | (275 | ) | ||||||||||||||
12/21/16-01/23/17 | EUR | 21,857 | RON | 98,745 | 86 | |||||||||||||||
12/21/16 | USD | 22,072 | ILS | 84,790 | 56 | |||||||||||||||
12/21/16-01/20/17 | USD | 26,541 | HUF | 7,523,332 | (1,025 | ) | ||||||||||||||
12/21/16-01/27/17 | USD | 26,969 | TRY | 89,482 | (1,108 | ) | ||||||||||||||
12/21/16-01/20/17 | USD | 28,953 | PLN | 115,318 | (1,446 | ) | ||||||||||||||
12/21/16-12/27/16 | USD | 35,577 | INR | 2,392,092 | (724 | ) | ||||||||||||||
12/21/16-02/15/17 | SGD | 47,518 | USD | 34,634 | 1,453 | |||||||||||||||
12/21/16-01/27/17 | PEN | 18,613 | USD | 5,466 | 40 | |||||||||||||||
12/21/16 | PEN | 42,040 | USD | 12,212 | (87 | ) | ||||||||||||||
12/21/16-12/21/16 | RON | 63,196 | USD | 15,940 | 1,027 | |||||||||||||||
12/21/16 | ILS | 84,690 | USD | 22,388 | 286 | |||||||||||||||
12/21/16-01/27/17 | TRY | 156,842 | USD | 49,966 | 4,567 | |||||||||||||||
12/21/16 | TWD | 244,000 | USD | 7,729 | 76 | |||||||||||||||
12/21/16-11/14/17 | CNY | 265,595 | USD | 38,949 | 898 | |||||||||||||||
12/21/16-02/17/17 | MXN | 1,051,125 | USD | 55,471 | 4,280 | |||||||||||||||
12/21/16-02/17/17 | MXN | 111,389 | USD | 5,330 | (73 | ) | ||||||||||||||
12/21/16-12/21/16 | HUF | 6,889,671 | USD | 25,021 | 1,659 | |||||||||||||||
12/22/16-01/27/17 | IDR | 171,002,650 | USD | 12,730 | 219 | |||||||||||||||
01/27/17-05/23/17 | IDR | 129,296,600 | USD | 9,121 | (153 | ) | ||||||||||||||
12/27/16-12/27/16 | INR | 577,539 | USD | 8,610 | 200 | |||||||||||||||
12/30/16 | HUF | 3,982,926 | EUR | 12,888 | 181 | |||||||||||||||
01/09/17 | USD | 4,190 | SGD | 5,800 | (140 | ) | ||||||||||||||
01/20/17-01/20/17 | USD | 7,430 | RON | 31,464 | 3 | |||||||||||||||
03/15/17 | PLN | 5,260 | USD | 1,250 | (4 | ) | ||||||||||||||
10/18/17 | USD | 1,105 | EGP | 14,750 | (315 | ) | ||||||||||||||
11/14/17 | USD | 1,247 | CNY | 8,803 | (4 | ) | ||||||||||||||
| 188 | SEI Institutional Investments Trust / Semi-Annual Report / November 30, 2016 |
| Settlement Date | Currency to Deliver (Thousands) | Currency To Receive (Thousands) | Unrealized Appreciation (Depreciation) ($ Thousands) | |||||||||||||||||
09/27/18 | EUR | 7,840 | CZK | 209,378 | $ | (6 | ) | |||||||||||||
09/27/18 | CZK | 25,278 | EUR | 948 | 2 | |||||||||||||||
|
| |||||||||||||||||||
| $ | 6,017 | |||||||||||||||||||
|
| |||||||||||||||||||
A list of the counterparties for the outstanding forward foreign currency contracts held by the Fund at November 30, 2016, is as follows:
| Counterparty | Currency to Deliver ($ Thousands) | Currency to Receive ($ Thousands) | Unrealized Appreciation (Depreciation) ($ Thousands) | |||||||||
Bank of America | $ | (20,210 | ) | $ | 21,603 | $ | 1,393 | |||||
Barclays PLC | (31,446 | ) | 31,499 | 53 | ||||||||
| Counterparty | Currency to Deliver ($ Thousands) | Currency to Receive ($ Thousands) | Unrealized Appreciation (Depreciation) ($ Thousands) | |||||||||
BT Brokerage | $ | (43,217 | ) | $ | 42,386 | $ | (831 | ) | ||||
Citigroup | (486,678 | ) | 491,954 | 5,275 | ||||||||
Goldman Sachs | (316,307 | ) | 317,365 | 1,059 | ||||||||
HSBC | (30,475 | ) | 30,476 | 1 | ||||||||
JPMorgan Chase Bank | (573,455 | ) | 575,020 | 1,565 | ||||||||
Standard Bank | (113,733 | ) | 111,253 | (2,480 | ) | |||||||
UBS | (2,938 | ) | 2,920 | (18 | ) | |||||||
|
| |||||||||||
| $ | 6,017 | |||||||||||
|
| |||||||||||
For the period ended November 30, 2016, the total amount of all open forward foreign currency contracts, as presented in the tables above, are representative of the volume of activity for this derivative type during the period.
A list of open OTC swap agreements held by the Fund at November 30, 2016, is as follows:
| Interest Rate Swaps | ||||||||||||||||
| Counterparty | Fund Pays | Fund Receives | Termination Date | Currency | Notional Amount (Thousands) | Net Unrealized Appreciation (Depreciation) ($ Thousands) | ||||||||||
| Citibank | 0.35% | 6-Month CZK - PRIBOR | 06/27/21 | CZK | 28,000 | $ | 11 | |||||||||
| Goldman Sachs | 28-Day MXN - TIIE | 6.38% | 09/16/26 | MXN | 35,000 | (152 | ) | |||||||||
| Goldman Sachs | 1.99% | 6-Month HUF - BUBOR | 07/25/26 | HUF | 630,000 | 90 | ||||||||||
| Goldman Sachs | 1-Day COP - COOIS | 7.23% | 05/04/26 | COP | 3,958,824 | (36 | ) | |||||||||
| Goldman Sachs | 28-Day MXN - TIIE | 6.17% | 03/05/26 | MXN | 63,199 | (305 | ) | |||||||||
| Goldman Sachs | 28-Day MXN - TIIE | 6.21% | 12/08/25 | MXN | 21,174 | (96 | ) | |||||||||
| Goldman Sachs | 28-Day MXN - TIIE | 6.36% | 05/21/25 | MXN | 29,801 | (111 | ) | |||||||||
| Goldman Sachs | 1-Year BRL - CDI | 10.89% | 01/03/23 | BRL | 6,139 | (127 | ) | |||||||||
| Goldman Sachs | 1-Day BRL - CETIP | 11.99% | 01/02/23 | BRL | 3,000 | 2 | ||||||||||
| Goldman Sachs | 28-Day MXN - TIIE | 5.90% | 09/12/22 | MXN | 99,662 | (331 | ) | |||||||||
| Goldman Sachs | 1.39% | 3-Month KRW - KWCDC | 11/04/21 | KRW | 20,000,000 | 157 | ||||||||||
| Goldman Sachs | 3-Month MYR - KLIBOR | 3.42% | 09/23/21 | MYR | 19,500 | (82 | ) | |||||||||
| Goldman Sachs | 0.33% | 6-Month CZK - PRIBOR | 09/01/21 | CZK | 50,000 | 23 | ||||||||||
| Goldman Sachs | 0.38% | 6-Month CZK - PRIBOR | 08/02/21 | CZK | 44,600 | 15 | ||||||||||
| Goldman Sachs | 0.28% | 6-Month CZK - PRIBOR | 07/08/21 | CZK | 47,000 | 25 | ||||||||||
| Goldman Sachs | 28-Day MXN - TIIE | 5.63% | 06/11/21 | MXN | 84,721 | 252 | ||||||||||
| Goldman Sachs | 0.45% | 6-Month CZK - PRIBOR | 05/24/21 | CZK | 37,000 | 3 | ||||||||||
| Goldman Sachs | 28-Day MXN - TIIE | 5.37% | 03/17/21 | MXN | 62,000 | (204 | ) | |||||||||
| Goldman Sachs | 1-Day BRL - CETIP | 12.73% | 01/04/21 | BRL | 13,491 | 167 | ||||||||||
| Goldman Sachs | 0.57% | 6-Month CZK - PRIBOR | 12/16/20 | CZK | 151,000 | (38 | ) | |||||||||
| Goldman Sachs | 0.42% | 6-Month CZK - PRIBOR | 10/23/20 | CZK | 55,000 | 7 | ||||||||||
| Goldman Sachs | 1-Day BRL - CETIP | 13.39% | 01/02/19 | BRL | 18,383 | 212 | ||||||||||
| Goldman Sachs | 1-Day BRL - CETIP | 13.42% | 01/02/19 | BRL | 25,101 | 293 | ||||||||||
| Goldman Sachs | 3-Month KRW - KWCDC | 1.32% | 11/04/18 | KRW | 53,500,000 | (63 | ) | |||||||||
| Goldman Sachs | 28-Day MXN - TIIE | 0.05% | 09/21/18 | MXN | 229,582 | 233 | ||||||||||
| Goldman Sachs | 1-Year BRL - CDI | 11.81% | 01/02/18 | BRL | 12,298 | (11 | ) | |||||||||
| Goldman Sachs | 1-Year BRL - CDI | 11.98% | 01/02/18 | BRL | 11,341 | (3 | ) | |||||||||
| Goldman Sachs | 1-Day BRL - CETIP | 12.86% | 01/02/18 | BRL | 47,206 | 124 | ||||||||||
| Goldman Sachs | 1-Day BRL - CETIP | 13.27% | 01/02/17 | BRL | 35,880 | (3 | ) | |||||||||
| JPMorgan Chase Bank | 2.52% | 6-Month HUF - BUBOR | 11/16/26 | HUF | 645,536 | 7 | ||||||||||
| JPMorgan Chase Bank | 0.94% | 6-Month CZK - PRIBOR | 11/14/26 | CZK | 58,000 | (12 | ) | |||||||||
| JPMorgan Chase Bank | 28-Day MXN - TIIE | 6.13% | 06/18/26 | MXN | 47,000 | (240 | ) | |||||||||
| JPMorgan Chase Bank | 3.45% | 6-Month HUF - BUBOR | 05/11/25 | HUF | 900,000 | (353 | ) | |||||||||
| JPMorgan Chase Bank | 4.29% | 6-Month HUF - BUBOR | 08/04/24 | HUF | 600,000 | (355 | ) | |||||||||
| JPMorgan Chase Bank | 0.36% | 6-Month CZK - PRIBOR | 09/29/21 | CZK | 50,000 | 20 | ||||||||||
| JPMorgan Chase Bank | 1.38% | 6-Month HUF - BUBOR | 06/17/21 | HUF | 875,267 | (21 | ) | |||||||||
| JPMorgan Chase Bank | 0.39% | 6-Month CZK - PRIBOR | 04/04/21 | CZK | 30,000 | 5 | ||||||||||
| JPMorgan Chase Bank | 0.30% | 6-Month CZK - PRIBOR | 02/26/21 | CZK | 83,000 | 29 | ||||||||||
| JPMorgan Chase Bank | 7.16% | 1-Day COP - Columbia IBR Overnight Interbank | 02/11/21 | COP | 15,000,000 | (183 | ) | |||||||||
| JPMorgan Chase Bank | 7.11% | 1-Day COP - Columbia IBR Overnight Interbank | 01/22/21 | COP | 13,433,034 | (155 | ) | |||||||||
| JPMorgan Chase Bank | 0.44% | 6-Month CZK - PRIBOR | 11/20/20 | CZK | 30,000 | 3 | ||||||||||
| JPMorgan Chase Bank | 0.50% | 6-Month CZK - PRIBOR | 05/05/20 | CZK | 180,000 | (28 | ) | |||||||||
| JPMorgan Chase Bank | 0.59% | 6-Month CZK - PRIBOR | 03/13/20 | CZK | 30,000 | (10 | ) | |||||||||
| JPMorgan Chase Bank | 0.54% | 6-Month CZK - PRIBOR | 02/16/20 | CZK | 320,000 | (76 | ) | |||||||||
| SEI Institutional Investments Trust / Semi-Annual Report / November 30, 2016 | 189 |
SCHEDULE OF INVESTMENTS (Unaudited)
Emerging Markets Debt Fund (Concluded)
November 30, 2016
| Interest Rate Swaps | ||||||||||||||||
| Counterparty | Fund Pays | Fund Receives | Termination Date | Currency | Notional Amount (Thousands) | Net Unrealized Appreciation (Depreciation) ($ Thousands) | ||||||||||
| JPMorgan Chase Bank | 0.85% | 6-Month HUF - BUBOR | 10/10/19 | HUF | 4,000,000 | $ | (4 | ) | ||||||||
| JPMorgan Chase Bank | 1-Day COP - COOIS | 6.96% | 11/17/17 | COP | 38,467,587 | 49 | ||||||||||
| JPMorgan Chase Bank | 1.77% | 3-Month HUF - BUBOR | 07/17/17 | HUF | 7,146,976 | (308 | ) | |||||||||
| JPMorgan Chase Bank | 3 Month USD LIBOR | 8.66% | 01/26/18 | TRY | 95,000 | (1,648 | ) | |||||||||
|
| |||||||||||||||
| $ | (3,228 | ) | ||||||||||||||
|
| |||||||||||||||
For the period ended November 30, 2016, the total amount of all open swap agreements, as presented in the tables above, are representative of the volume of activity for the derivative type during the period.
Percentages are based on Net Assets of $1,920,526 ($ Thousands).
| (A) | Security exempt from registration under Rule 144A of the Securities Act of 1933. These securities may be resold in transactions exempt from registration normally to qualified institutions. On November 30, 2016, the value of these securities amounted to $219,094 ($ Thousands), representing 11.4% of the net assets of the Fund. |
| (B) | Variable Rate Security — The rate reported on the Schedule of Investments is the rate in effect as of November 30, 2016. |
| (C) | Security is in default on interest payment. |
| (D) | Step Bonds — The rate reflected on the Schedule of Investments is the effective yield on November 30, 2016. The coupon on a step bond changes on a specified date. |
| (E) | Zero coupon security. The rate shown on the schedule of investments represents the security's effective yield at the time of purchase. |
| (F) | The rate reported is the effective yield at the time of purchase. |
| (G) | Securities considered illiquid. The total value of such securities as of November 30, 2016 was $269 ($ Thousands) and represented 0.0% of Net Assets. |
ARS — Argentine Peso
BRL — Brazilian Real
BUBOR — Budapest Interbank Offered Rate
CDI — Average One-Day Interbank Deposit Rate
CLP — Chilean Peso
CNY — Chinese Yuan
COP — Colombian Peso
CZK — Czech Koruna
DOP — Dominican Peso
EGP — Egyptian Pound
EUR — Euro
HUF — Hungarian Forint
IDR — Indonesian Rupiah
ILS — Israeli New Sheckels
INR — Indian Rupee
JIBAR — Johannesburg Interbank Offered Rate
KLIBOR — Kuala Lumpur Interbank Offered Rate
KES — Kenyan Shilling
KRW — Korean Won
LIBOR — London Interbank Offered Rate
LLC — Limited Liability Company
MTN — Medium Term Note
MXN — Mexican Peso
MYR — Malaysian Ringgit
OTC — Over the Counter
PEN — Peruvian Sol
PHP — Philippine Peso
PIK — Payment-in-Kind
PLC — Public Limited Company
PLN — Polish Zloty
PRIBOR — Prague Interbank Offered Rate
RON — Romanian Leu
RUB — Russian Ruble
SGD — Singapore Dollar
Ser — Series
THB — Thai Bhat
TRY — Turkish Lira
TWD — Taiwan Dollar
USD — United States Dollar
ZAR — South African Rand
The following is a list of the level of inputs used as of November 30, 2016, in valuing the Fund’s investments and other financial instruments carried at value ($ Thousands):
| Investments in Securities | Level 1 | Level 2 | Level 3† | Total | ||||||||||||
Global Bonds | $ | — | $ | 1,828,978 | $ | 269 | $ | 1,829,247 | ||||||||
Loan Participations | — | 3,773 | — | 3,773 | ||||||||||||
|
|
|
|
|
|
|
| |||||||||
Total Investments in Securities | $ | — | $ | 1,832,751 | $ | 269 | $ | 1,833,020 | ||||||||
|
|
|
|
|
|
|
| |||||||||
| Other Financial Instruments | Level 1 | Level 2 | Level 3† | Total | ||||||||||||
Futures Contracts* | ||||||||||||||||
Unrealized Appreciation | $ | 239 | $ | — | $ | — | $ | 239 | ||||||||
Unrealized Depreciation | (571 | ) | — | — | (571 | ) | ||||||||||
Forwards Contracts* | ||||||||||||||||
Unrealized Appreciation | — | 28,153 | — | 28,153 | ||||||||||||
Unrealized Depreciation | — | (22,136 | ) | — | (22,136 | ) | ||||||||||
OTC Swaps | ||||||||||||||||
Interest Rate Swaps* | ||||||||||||||||
Unrealized Appreciation | — | 1,727 | — | 1,727 | ||||||||||||
Unrealized Depreciation | — | (4,955 | ) | — | (4,955 | ) | ||||||||||
|
|
|
|
|
|
|
| |||||||||
Total Other Financial Instruments | $ | (332 | ) | $ | 2,789 | $ | — | $ | 2,457 | |||||||
|
|
|
|
|
|
|
| |||||||||
| † | A reconciliation of Level 3 instruments is presented when the Fund has a significant amount of Level 3 investments at the beginning and/or end of the period in relation to net assets. Management has concluded that Level 3 investments are not material in relation to net assets. |
| * | Futures contracts, forwards contracts and swaps are valued at the unrealized appreciation (depreciation) on the instrument. |
For the period ended November 30, 2016, there were no transfers between Level 1 and Level 2 assets and liabilities.
For the period ended November 30, 2016, there were no transfers between Level 2 and Level 3 assets and liabilities.
For more information on valuation inputs, see Note 2 — Significant Accounting Policies in Notes to Financial Statements.
Amounts designated as “—” are $0 or have been rounded to $0.
The accompanying notes are an integral part of the financial statements.
| 190 | SEI Institutional Investments Trust / Semi-Annual Report / November 30, 2016 |
SCHEDULE OF INVESTMENTS (Unaudited)
Real Return Fund
November 30, 2016
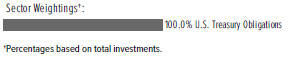
| Description | Face Amount ($ Thousands) | Market Value ($ Thousands) | ||||||
U.S. TREASURY OBLIGATIONS — 93.0% |
| |||||||
U.S. Treasury Inflation-Protected Securities |
| |||||||
2.125%, 01/15/2019 | $ | 5,288 | $ | 5,585 | ||||
1.875%, 07/15/2019 | 6,018 | 6,401 | ||||||
1.625%, 01/15/2018 | 5,306 | 5,440 | ||||||
1.375%, 07/15/2018 | 5,686 | 5,891 | ||||||
1.375%, 01/15/2020 | 7,311 | 7,679 | ||||||
1.250%, 07/15/2020 | 11,271 | 11,892 | ||||||
1.125%, 01/15/2021 | 12,790 | 13,402 | ||||||
0.625%, 07/15/2021 | 13,646 | 14,090 | ||||||
0.125%, 04/15/2018 | 18,764 | 18,892 | ||||||
0.125%, 04/15/2019 | 18,692 | 18,887 | ||||||
0.125%, 04/15/2020 | 18,501 | 18,668 | ||||||
0.125%, 04/15/2021 | 11,166 | 11,223 | ||||||
|
| |||||||
Total U.S. Treasury Obligations | 138,050 | |||||||
|
| |||||||
Total Investments — 93.0% | $ | 138,050 | ||||||
|
| |||||||
Percentages are based on Net Assets of $148,482 ($ Thousands).
As of November 30, 2016, all of the Fund's investments were considered level 2, in accordance with the authoritative guidance on fair value measurements and disclosure under U.S. GAAP.
For the period ended November 30, 2016, there were no transfers between Level 1 and Level 2 assets and liabilities.
For the period ended November 30, 2016, there were no transfers between Level 2 and Level 3 assets and liabilities.
For more information on valuation inputs, see Note 2 — Significant Accounting Policies in Notes to Financial Statements.
The accompanying notes are an integral part of the financial statements.
| SEI Institutional Investments Trust / Semi-Annual Report / November 30, 2016 | 191 |
SCHEDULE OF INVESTMENTS (Unaudited)
Limited Duration Bond Fund
November 30, 2016
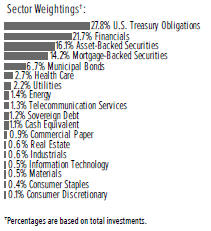
| Description | Face Amount ($ Thousands) | Market Value ($ Thousands) | ||||||
CORPORATE OBLIGATIONS — 31.3% |
| |||||||
Consumer Discretionary — 0.1% |
| |||||||
McDonald's MTN | ||||||||
2.100%, 12/07/2018 | $ | 1,000 | $ | 1,007 | ||||
|
| |||||||
Consumer Staples — 0.4% | ||||||||
Walgreens Boots Alliance | ||||||||
1.750%, 11/17/2017 | 5,084 | 5,101 | ||||||
|
| |||||||
Energy — 1.3% | ||||||||
Enbridge | ||||||||
1.289%, 06/02/2017 (A) | 3,250 | 3,247 | ||||||
Enterprise Products Operating LLC | ||||||||
6.650%, 04/15/2018 | 2,092 | 2,223 | ||||||
ONEOK Partners | ||||||||
2.000%, 10/01/2017 | 4,685 | 4,695 | ||||||
Regency Energy Partners | ||||||||
5.875%, 03/01/2022 | 250 | 276 | ||||||
Statoil | ||||||||
1.087%, 11/09/2017 (A) | 2,200 | 2,201 | ||||||
TransCanada PipeLines | ||||||||
1.875%, 01/12/2018 | 1,605 | 1,605 | ||||||
1.664%, 01/12/2018 (A) | 2,000 | 2,009 | ||||||
Williams Partners | ||||||||
3.600%, 03/15/2022 | 250 | 247 | ||||||
|
| |||||||
| 16,503 | ||||||||
|
| |||||||
Financials — 21.2% | ||||||||
AIG Global Funding MTN | ||||||||
1.650%, 12/15/2017 (B) | 3,445 | 3,457 | ||||||
American Express Bank | ||||||||
6.000%, 09/13/2017 | 2,450 | 2,535 | ||||||
American Express Credit MTN | ||||||||
1.875%, 11/05/2018 | 4,900 | 4,916 | ||||||
| Description | Face Amount ($ Thousands) | Market Value ($ Thousands) | ||||||
American Honda Finance MTN | ||||||||
1.741%, 02/22/2019 (A) | $ | 1,000 | $ | 1,012 | ||||
Bank Nederlandse Gemeenten MTN | ||||||||
0.951%, 07/14/2017 (A) (B) | 9,075 | 9,076 | ||||||
Bank of America | ||||||||
5.300%, 03/15/2017 | 850 | 860 | ||||||
1.650%, 03/26/2018 | 3,600 | 3,600 | ||||||
1.250%, 02/14/2017 | 650 | 650 | ||||||
1.150%, 06/15/2017 (A) | 6,650 | 6,649 | ||||||
Bank of America MTN | ||||||||
6.400%, 08/28/2017 | 500 | 517 | ||||||
1.700%, 08/25/2017 | 1,570 | 1,573 | ||||||
Bank of Montreal | ||||||||
1.750%, 06/15/2021 (B) | 5,900 | 5,732 | ||||||
Bank of Nova Scotia | ||||||||
2.125%, 09/11/2019 | 5,245 | 5,271 | ||||||
1.875%, 04/26/2021 | 3,325 | 3,240 | ||||||
Barclays | ||||||||
2.000%, 03/16/2018 | 2,250 | 2,243 | ||||||
BB&T MTN | ||||||||
1.710%, 06/15/2018 (A) | 1,140 | 1,146 | ||||||
Canadian Imperial Bank of Commerce | ||||||||
1.600%, 09/06/2019 | 5,300 | 5,243 | ||||||
Citigroup | ||||||||
2.606%, 05/15/2018 (A) | 1,750 | 1,781 | ||||||
1.850%, 11/24/2017 | 960 | 963 | ||||||
1.800%, 02/05/2018 | 8,110 | 8,107 | ||||||
1.576%, 04/27/2018 (A) | 2,315 | 2,321 | ||||||
Citizens Bank MTN | ||||||||
2.300%, 12/03/2018 | 6,290 | 6,332 | ||||||
Credit Suisse NY MTN | ||||||||
1.427%, 05/26/2017 (A) | 3,500 | 3,501 | ||||||
Daimler Finance North America LLC | ||||||||
1.500%, 07/05/2019 (B) | 4,550 | 4,473 | ||||||
Discover Bank | ||||||||
3.100%, 06/04/2020 | 1,000 | 1,011 | ||||||
Fifth Third Bank | ||||||||
1.450%, 02/28/2018 | 4,424 | 4,415 | ||||||
Ford Motor Credit LLC | ||||||||
5.000%, 05/15/2018 | 3,750 | 3,901 | ||||||
1.361%, 09/08/2017 (A) | 2,650 | 2,649 | ||||||
Goldman Sachs Group MTN | ||||||||
1.650%, 12/15/2017 (A) | 3,375 | 3,388 | ||||||
Goldman Sachs Group | ||||||||
2.900%, 07/19/2018 | 3,035 | 3,080 | ||||||
2.375%, 01/22/2018 | 4,600 | 4,629 | ||||||
Harley-Davidson Financial Services MTN | ||||||||
1.550%, 11/17/2017 (B) | 3,000 | 3,000 | ||||||
HSBC Bank USA NY | ||||||||
6.000%, 08/09/2017 | 5,000 | 5,148 | ||||||
HSBC USA | ||||||||
1.700%, 03/05/2018 | 5,300 | 5,290 | ||||||
| 192 | SEI Institutional Investments Trust / Semi-Annual Report / November 30, 2016 |
| Description | Face Amount ($ Thousands) | Market Value ($ Thousands) | ||||||
Huntington National Bank | ||||||||
2.200%, 11/06/2018 | $ | 3,850 | $ | 3,863 | ||||
Hyundai Capital America MTN | ||||||||
2.000%, 03/19/2018 (B) | 1,385 | 1,385 | ||||||
JPMorgan Chase MTN | ||||||||
1.700%, 03/01/2018 | 11,690 | 11,687 | ||||||
JPMorgan Chase | ||||||||
6.000%, 10/01/2017 | 2,150 | 2,228 | ||||||
1.782%, 01/25/2018 (A) | 3,280 | 3,302 | ||||||
KeyBank | ||||||||
1.650%, 02/01/2018 | 2,578 | 2,579 | ||||||
1.600%, 08/22/2019 | 3,685 | 3,639 | ||||||
KeyCorp MTN | ||||||||
5.100%, 03/24/2021 | 3,925 | 4,303 | ||||||
MassMutual Global Funding | ||||||||
2.000%, 04/05/2017 (B) | 1,350 | 1,354 | ||||||
Metropolitan Life Global Funding I | ||||||||
1.500%, 01/10/2018 (B) | 2,000 | 2,001 | ||||||
Morgan Stanley MTN | ||||||||
4.750%, 03/22/2017 | 6,980 | 7,054 | ||||||
2.162%, 04/25/2018 (A) | 2,150 | 2,178 | ||||||
New York Life Global Funding MTN | ||||||||
2.000%, 04/13/2021 (B) | 1,000 | 984 | ||||||
New York Life Global Funding | ||||||||
1.550%, 11/02/2018 (B) | 4,540 | 4,528 | ||||||
PNC Bank | ||||||||
1.800%, 11/05/2018 | 1,500 | 1,502 | ||||||
Pricoa Global Funding I | ||||||||
1.350%, 08/18/2017 (B) | 5,050 | 5,054 | ||||||
Protective Life Global Funding | ||||||||
1.555%, 09/13/2019 (B) | 5,810 | 5,730 | ||||||
Royal Bank of Canada | ||||||||
1.875%, 02/05/2020 | 13,355 | 13,285 | ||||||
Santander Bank | ||||||||
2.000%, 01/12/2018 | 6,718 | 6,699 | ||||||
Santander Holdings USA | ||||||||
2.380%, 11/24/2017 (A) | 2,025 | 2,039 | ||||||
Santander UK | ||||||||
1.375%, 03/13/2017 | 1,700 | 1,700 | ||||||
Sumitomo Mitsui Banking MTN | ||||||||
1.822%, 01/18/2019 (A) | 5,250 | 5,273 | ||||||
Synchrony Financial | ||||||||
1.875%, 08/15/2017 | 2,190 | 2,193 | ||||||
Toronto-Dominion Bank MTN | ||||||||
1.722%, 01/22/2019 (A) | 4,315 | 4,347 | ||||||
Toronto-Dominion Bank | ||||||||
2.250%, 09/25/2019 (B) | 5,300 | 5,344 | ||||||
Travelers MTN | ||||||||
5.750%, 12/15/2017 | 875 | 915 | ||||||
UBS MTN | ||||||||
1.557%, 03/26/2018 (A) | 5,060 | 5,078 | ||||||
| Description | Face Amount ($ Thousands) | Market Value ($ Thousands) | ||||||
US Bancorp MTN | ||||||||
1.650%, 05/15/2017 | $ | 1,270 | $ | 1,273 | ||||
Volkswagen Group of America Finance LLC | ||||||||
1.600%, 11/20/2017 (B) | 2,600 | 2,594 | ||||||
Volkswagen International Finance | ||||||||
2.375%, 03/22/2017 (B) | 2,400 | 2,407 | ||||||
Voya Financial | ||||||||
2.900%, 02/15/2018 | 3,988 | 4,034 | ||||||
Wells Fargo MTN | ||||||||
2.550%, 12/07/2020 | 5,765 | 5,776 | ||||||
1.400%, 09/08/2017 | 4,400 | 4,397 | ||||||
Wells Fargo Bank | ||||||||
1.530%, 05/24/2019 (A) | 2,250 | 2,256 | ||||||
Wells Fargo Bank MTN | ||||||||
1.622%, 01/22/2018 (A) | 3,550 | 3,570 | ||||||
|
| |||||||
| 258,260 | ||||||||
|
| |||||||
Health Care — 2.6% | ||||||||
Abbott Laboratories | ||||||||
2.350%, 11/22/2019 | 4,920 | 4,924 | ||||||
AbbVie | ||||||||
2.300%, 05/14/2021 | 735 | 721 | ||||||
1.800%, 05/14/2018 | 750 | 749 | ||||||
Actavis Funding SCS | ||||||||
2.350%, 03/12/2018 | 5,730 | 5,765 | ||||||
Aetna | ||||||||
1.700%, 06/07/2018 | 1,920 | 1,920 | ||||||
Anthem | ||||||||
2.300%, 07/15/2018 | 1,214 | 1,221 | ||||||
1.875%, 01/15/2018 | 2,570 | 2,573 | ||||||
Baxalta | ||||||||
2.000%, 06/22/2018 | 1,115 | 1,115 | ||||||
Becton Dickinson | ||||||||
1.800%, 12/15/2017 | 3,850 | 3,857 | ||||||
Dignity Health | ||||||||
2.637%, 11/01/2019 | 1,240 | 1,250 | ||||||
Forest Laboratories LLC | ||||||||
5.000%, 12/15/2021 (B) | 500 | 540 | ||||||
McLaren Health Care | ||||||||
1.964%, 05/15/2018 | 1,270 | 1,268 | ||||||
Mylan | ||||||||
2.500%, 06/07/2019 (B) | 1,950 | 1,941 | ||||||
Teva Pharmaceuticals | ||||||||
1.700%, 07/19/2019 | 3,740 | 3,670 | ||||||
|
| |||||||
| 31,514 | ||||||||
|
| |||||||
Industrials — 0.6% | ||||||||
America West Airlines Pass- | ||||||||
7.930%, 01/02/2019 | 706 | 754 | ||||||
MUFG Americas Holdings | ||||||||
1.625%, 02/09/2018 | 4,350 | 4,335 | ||||||
| SEI Institutional Investments Trust / Semi-Annual Report / November 30, 2016 | 193 |
SCHEDULE OF INVESTMENTS (Unaudited)
Limited Duration Bond Fund (Continued)
November 30, 2016
| Description | Face Amount ($ Thousands) | Market Value ($ Thousands) | ||||||
Penske Truck Leasing LP | ||||||||
3.750%, 05/11/2017 (B) | $ | 2,090 | $ | 2,110 | ||||
|
| |||||||
| 7,199 | ||||||||
|
| |||||||
Information Technology — 0.5% | ||||||||
Apple | ||||||||
1.740%, 02/22/2019 (A) | 1,500 | 1,522 | ||||||
Hewlett Packard Enterprise (A) | ||||||||
2.788%, 10/05/2018 (B) | 3,165 | 3,237 | ||||||
2.598%, 10/05/2017 (B) | 1,495 | 1,512 | ||||||
|
| |||||||
| 6,271 | ||||||||
|
| |||||||
Materials — 0.5% | ||||||||
Chevron Phillips Chemical LLC | ||||||||
1.700%, 05/01/2018 (B) | 4,535 | 4,523 | ||||||
Ecolab | ||||||||
1.450%, 12/08/2017 | 1,565 | 1,564 | ||||||
|
| |||||||
| 6,087 | ||||||||
|
| |||||||
Real Estate — 0.6% | ||||||||
Essex Portfolio | ||||||||
5.500%, 03/15/2017 | 1,000 | 1,011 | ||||||
HCP | ||||||||
3.750%, 02/01/2019 | 600 | 616 | ||||||
Realty Income | ||||||||
2.000%, 01/31/2018 | 1,000 | 1,003 | ||||||
Simon Property Group | ||||||||
1.500%, 02/01/2018 (B) | 3,765 | 3,763 | ||||||
Welltower | ||||||||
4.700%, 09/15/2017 | 1,230 | 1,259 | ||||||
|
| |||||||
| 7,652 | ||||||||
|
| |||||||
Telecommunication Services — 1.3% |
| |||||||
AT&T | ||||||||
5.500%, 02/01/2018 | 3,800 | 3,956 | ||||||
Verizon Communications | ||||||||
2.606%, 09/14/2018 (A) | 7,950 | 8,140 | ||||||
1.350%, 06/09/2017 | 1,800 | 1,803 | ||||||
1.234%, 06/09/2017 (A) | 1,700 | 1,702 | ||||||
|
| |||||||
| 15,601 | ||||||||
|
| |||||||
Utilities — 2.2% | ||||||||
Berkshire Hathaway Energy | ||||||||
5.750%, 04/01/2018 | 6,500 | 6,853 | ||||||
Emera US Finance | ||||||||
2.150%, 06/15/2019 (B) | 2,110 | 2,114 | ||||||
Entergy Texas | ||||||||
7.125%, 02/01/2019 | 750 | 829 | ||||||
Exelon | ||||||||
1.550%, 06/09/2017 | 3,530 | 3,531 | ||||||
NextEra Energy Capital Holdings | ||||||||
1.649%, 09/01/2018 | 3,600 | 3,593 | ||||||
| Description | Face Amount ($ Thousands) | Market Value ($ Thousands) | ||||||
Oncor Electric Delivery LLC | ||||||||
5.750%, 09/30/2020 | $ | 500 | $ | 560 | ||||
5.000%, 09/30/2017 | 2,660 | 2,737 | ||||||
Southern Power | ||||||||
1.500%, 06/01/2018 | 4,700 | 4,685 | ||||||
West Penn Power | ||||||||
5.950%, 12/15/2017 (B) | 470 | 488 | ||||||
Xcel Energy | ||||||||
1.200%, 06/01/2017 | 1,145 | 1,144 | ||||||
|
| |||||||
| 26,534 | ||||||||
|
| |||||||
Total Corporate Obligations | 381,729 | |||||||
|
| |||||||
U.S. TREASURY OBLIGATIONS — 27.1% |
| |||||||
U.S. Treasury Bills | ||||||||
0.322%, 12/08/2016 (C) | 75 | 75 | ||||||
U.S. Treasury Inflation-Protected Securities | ||||||||
0.125%, 04/15/2020 | 11,900 | 12,379 | ||||||
U.S. Treasury Notes | ||||||||
3.125%, 05/15/2019 | 15,765 | 16,471 | ||||||
2.750%, 02/15/2019 | 56,450 | 58,355 | ||||||
2.125%, 08/31/2020 | 21,570 | 21,943 | ||||||
2.125%, 01/31/2021 | 19,825 | 20,129 | ||||||
2.125%, 08/15/2021 | 16,855 | 17,052 | ||||||
1.750%, 11/30/2021 | 7,730 | 7,700 | ||||||
1.500%, 12/31/2018 | 50,440 | 50,806 | ||||||
1.375%, 06/30/2018 | 11,080 | 11,137 | ||||||
1.250%, 10/31/2021 | 12,740 | 12,375 | ||||||
1.125%, 12/31/2019 | 48,750 | 48,293 | ||||||
1.125%, 04/30/2020 | 1,000 | 986 | ||||||
1.125%, 09/30/2021 | 2,595 | 2,508 | ||||||
0.750%, 02/28/2018 | 21,710 | 21,650 | ||||||
0.750%, 10/31/2018 | 23,605 | 23,438 | ||||||
0.750%, 08/15/2019 | 6,420 | 6,321 | ||||||
|
| |||||||
Total U.S. Treasury Obligations | 331,618 | |||||||
|
| |||||||
ASSET-BACKED SECURITIES — 15.8% |
| |||||||
Automotive — 8.1% | ||||||||
Ally Master Owner Trust, Ser 2012-5, Cl A | ||||||||
1.540%, 09/15/2019 | 3,000 | 3,006 | ||||||
Ally Master Owner Trust, Ser 2015-3, Cl A | ||||||||
1.630%, 05/15/2020 | 2,000 | 2,002 | ||||||
AmeriCredit Automobile Receivables Trust, Ser 2013-2, Cl D | ||||||||
2.420%, 05/08/2019 | 3,070 | 3,089 | ||||||
| 194 | SEI Institutional Investments Trust / Semi-Annual Report / November 30, 2016 |
| Description | Face Amount ($ Thousands) | Market Value ($ Thousands) | ||||||
AmeriCredit Automobile Receivables Trust, Ser 2013-3, Cl D | ||||||||
3.000%, 07/08/2019 | $ | 2,700 | $ | 2,733 | ||||
AmeriCredit Automobile Receivables Trust, Ser 2014-2, Cl B | ||||||||
1.600%, 07/08/2019 | 2,525 | 2,528 | ||||||
Capital Auto Receivables Asset Trust, Ser 2013- 3, Cl B | ||||||||
2.320%, 07/20/2018 | 6,095 | 6,106 | ||||||
CarMax Auto Owner Trust, Ser 2013-4, Cl B | ||||||||
1.710%, 07/15/2019 | 600 | 602 | ||||||
Chesapeake Funding II LLC, Ser 2016-2A, Cl A2 | ||||||||
1.538%, 06/15/2028 (A)(B) | 1,980 | 1,991 | ||||||
Chesapeake Funding II LLC, Ser 2016-2A, Cl B | ||||||||
2.700%, 06/15/2028 (B) | 500 | 496 | ||||||
Chesapeake Funding, Ser 2014-1A, Cl A | ||||||||
0.946%, 03/07/2026 (A) (B) | 1,513 | 1,512 | ||||||
Chesapeake Funding, Ser 2015-1A, Cl B | ||||||||
1.483%, 02/07/2027 (A) (B) | 1,430 | 1,419 | ||||||
Chrysler Capital Auto Receivables Trust, Ser 2016-BA, Cl A4 | ||||||||
1.870%, 02/15/2022 (B) | 4,255 | 4,209 | ||||||
CPS Auto Receivables Trust, Ser 2012-B, Cl A | ||||||||
2.520%, 09/16/2019 (B) | 135 | 135 | ||||||
CPS Auto Receivables Trust, Ser 2013-B, Cl A | ||||||||
1.820%, 09/15/2020 (B) | 139 | 138 | ||||||
CPS Auto Receivables Trust, Ser 2013-D, Cl A | ||||||||
1.540%, 07/16/2018 (B) | 26 | 26 | ||||||
CPS Auto Receivables Trust, Ser 2014-A, Cl A | ||||||||
1.210%, 08/15/2018 (B) | 46 | 46 | ||||||
CPS Auto Receivables Trust, Ser 2014-B, Cl A | ||||||||
1.110%, 11/15/2018 (B) | 183 | 182 | ||||||
CPS Auto Receivables Trust, Ser 2014-C, Cl A | ||||||||
1.310%, 02/15/2019 (B) | 431 | 431 | ||||||
CPS Auto Receivables Trust, Ser 2016-C, Cl B | ||||||||
2.480%, 09/15/2020 (B) | 1,000 | 998 | ||||||
Credit Acceptance Auto Loan Trust, Ser 2015- 1A, Cl A | ||||||||
2.000%, 07/15/2022 (B) | 1,395 | 1,393 | ||||||
DT Auto Owner Trust, Ser 2015-2A, Cl B | ||||||||
1.880%, 05/15/2019 (B) | 120 | 120 | ||||||
DT Auto Owner Trust, Ser 2015-3A, Cl A | ||||||||
1.660%, 03/15/2019 (B) | 407 | 407 | ||||||
Enterprise Fleet Financing LLC, Ser 2014-2, Cl A2 | ||||||||
1.050%, 03/20/2020 (B) | 1,015 | 1,012 | ||||||
Enterprise Fleet Financing LLC, Ser 2016-2, Cl A2 | ||||||||
1.740%, 02/22/2022 (B) | 1,500 | 1,499 | ||||||
Ford Credit Auto Owner Trust, Ser 2014-1, Cl A | ||||||||
2.260%, 11/15/2025 (B) | 3,350 | 3,392 | ||||||
| Description | Face Amount ($ Thousands) | Market Value ($ Thousands) | ||||||
Ford Credit Floorplan Master Owner Trust, Ser 2012-2, Cl A | ||||||||
1.920%, 01/15/2019 | $ | 4,995 | $ | 4,999 | ||||
Ford Credit Floorplan Master Owner Trust, Ser 2014-4, Cl A1 | ||||||||
1.400%, 08/15/2019 | 1,350 | 1,352 | ||||||
Ford Credit Floorplan Master Owner Trust, Ser 2015-4, Cl A2 | ||||||||
1.135%, 08/15/2020 (A) | 5,250 | 5,268 | ||||||
GM Financial Automobile Leasing Trust, Ser 2015-1, Cl B | ||||||||
2.140%, 06/20/2019 | 2,845 | 2,854 | ||||||
GMF Floorplan Owner Revolving Trust, Ser 2015-1, Cl A1 | ||||||||
1.650%, 05/15/2020 (B) | 2,405 | 2,386 | ||||||
GMF Floorplan Owner Revolving Trust, Ser 2015-1, Cl B | ||||||||
1.970%, 05/15/2020 (B) | 1,320 | 1,318 | ||||||
Harley-Davidson Motorcycle Trust, Ser 2013-1, Cl A4 | ||||||||
0.870%, 07/15/2019 | 174 | 174 | ||||||
Hertz Fleet Lease Funding, Ser 2013-3, Cl B | ||||||||
1.579%, 12/10/2027 (A) (B) | 1,355 | 1,356 | ||||||
Honda Auto Receivables Owner Trust, Ser 2015-2, Cl A3 | ||||||||
1.040%, 02/21/2019 | 1,334 | 1,334 | ||||||
Honda Auto Receivables Owner Trust, Ser 2015-4, Cl A2 | ||||||||
0.820%, 07/23/2018 | 460 | 460 | ||||||
Mercedes Benz Auto Lease Trust, Ser 2015-B, Cl A3 | ||||||||
1.340%, 07/16/2018 | 7,045 | 7,056 | ||||||
Mercedes-Benz Auto Lease Trust, Ser 2016-B, Cl A4 | ||||||||
1.520%, 06/15/2022 | 2,310 | 2,297 | ||||||
NextGear Floorplan Master Owner Trust, Ser 2014-1A, Cl A | ||||||||
1.920%, 10/15/2019 (B) | 2,250 | 2,250 | ||||||
Nissan Auto Lease Trust, Ser 2016-A, Cl A3 | ||||||||
1.490%, 03/15/2019 | 3,795 | 3,799 | ||||||
Nissan Auto Receivables Owner Trust, Ser 2015-A, Cl A3 | ||||||||
1.050%, 10/15/2019 | 644 | 644 | ||||||
Nissan Auto Receivables Owner Trust, Ser 2015-B, Cl A2B | ||||||||
0.815%, 07/16/2018 (A) | 415 | 415 | ||||||
Nissan Auto Receivables Owner Trust, Ser 2016-B, Cl A2A | ||||||||
1.050%, 04/15/2019 | 705 | 705 | ||||||
Nissan Master Owner Trust Receivables, Ser 2016-A, Cl A2 | ||||||||
1.540%, 06/15/2021 | 3,000 | 2,982 | ||||||
| SEI Institutional Investments Trust / Semi-Annual Report / November 30, 2016 | 195 |
SCHEDULE OF INVESTMENTS (Unaudited)
Limited Duration Bond Fund (Continued)
November 30, 2016
| Description | Face Amount ($ Thousands) | Market Value ($ Thousands) | ||||||
Porsche Innovative Lease Owner Trust, Ser 2014-1, Cl A4 | ||||||||
1.260%, 09/21/2020 (B) | $ | 375 | $ | 375 | ||||
Prestige Auto Receivables Trust, Ser 2013-1A, Cl B | ||||||||
1.740%, 05/15/2019 (B) | 661 | 661 | ||||||
Prestige Auto Receivables Trust, Ser 2014-1A, Cl A3 | ||||||||
1.520%, 04/15/2020 (B) | 148 | 148 | ||||||
Prestige Auto Receivables Trust, Ser 2014-1A, Cl B | ||||||||
1.910%, 04/15/2020 (B) | 2,370 | 2,376 | ||||||
Prestige Auto Receivables Trust, Ser 2015-1, Cl A3 | ||||||||
1.530%, 02/15/2021 (B) | 2,758 | 2,760 | ||||||
Santander Drive Auto Receivables Trust, Ser 2012-AA, Cl C | ||||||||
1.780%, 11/15/2018 (B) | 395 | 395 | ||||||
Santander Drive Auto Receivables Trust, Ser 2013-1, Cl C | ||||||||
1.760%, 01/15/2019 | 760 | 761 | ||||||
Santander Drive Auto Receivables Trust, Ser 2013-2, Cl D | ||||||||
2.570%, 03/15/2019 | 2,985 | 3,009 | ||||||
Susquehanna Auto Receivables Trust, Ser 2014-1A, Cl A3 | ||||||||
1.000%, 02/15/2018 (B) | 55 | 55 | ||||||
Toyota Auto Receivables Owner Trust, Ser 2015-A, Cl A3 | ||||||||
1.120%, 02/15/2019 | 644 | 644 | ||||||
Toyota Auto Receivables Owner Trust, Ser 2016-B, Cl A2A | ||||||||
1.020%, 10/15/2018 | 720 | 720 | ||||||
Westlake Automobile Receivables Trust, Ser 2014-2A, Cl C | ||||||||
2.240%, 04/15/2020 (B) | 570 | 571 | ||||||
Westlake Automobile Receivables Trust, Ser 2015-1A, Cl B | ||||||||
1.680%, 11/16/2020 (B) | 1,734 | 1,734 | ||||||
Westlake Automobile Receivables Trust, Ser 2016-3A, Cl B | ||||||||
2.070%, 12/15/2021 (B) | 4,100 | 4,095 | ||||||
|
| |||||||
| 99,425 | ||||||||
|
| |||||||
Credit Cards — 2.2% | ||||||||
BA Credit Card Trust, Ser 2016-A1, Cl A | ||||||||
0.928%, 10/15/2021 (A) | 2,530 | 2,538 | ||||||
Capital One Multi-Asset Execution Trust, Ser 2016-A4, Cl A4 | ||||||||
1.330%, 06/15/2022 | 4,610 | 4,568 | ||||||
Chase Issuance Trust, Ser 2007-A12, Cl A12 | ||||||||
0.588%, 08/15/2019 (A) | 900 | 899 | ||||||
| Description | Face Amount ($ Thousands) | Market Value ($ Thousands) | ||||||
Chase Issuance Trust, Ser 2013-A1, Cl A1 | ||||||||
1.300%, 02/18/2020 | $ | 550 | $ | 550 | ||||
Chase Issuance Trust, Ser 2014, Cl A1 | ||||||||
1.150%, 01/15/2019 | 3,260 | 3,260 | ||||||
Citibank Credit Card Issuance Trust, Ser 2008- A2, Cl A2 | ||||||||
1.718%, 01/23/2020 (A) | 1,970 | 1,992 | ||||||
Discover Card Execution Note Trust, Ser 2014- A3, Cl A3 | ||||||||
1.220%, 10/15/2019 | 4,195 | 4,198 | ||||||
Discover Card Execution Note Trust, Ser 2014- A5, Cl A | ||||||||
1.390%, 04/15/2020 | 2,650 | 2,654 | ||||||
GE Capital Credit Card Master Note Trust, Ser 2012-7, Cl A | ||||||||
1.760%, 09/15/2022 | 2,000 | 1,991 | ||||||
Golden Credit Card Trust, Ser 2012-2A, Cl A1 | ||||||||
1.770%, 01/15/2019 (B) | 1,000 | 1,001 | ||||||
Synchrony Credit Card Master Note Trust, Ser 2012-6, Cl A | ||||||||
1.360%, 08/17/2020 | 1,656 | 1,658 | ||||||
Trillium Credit Card Trust II, Ser 2016-1A, Cl A | ||||||||
1.326%, 05/26/2021 (A)(B) | 1,000 | 1,005 | ||||||
|
| |||||||
| 26,314 | ||||||||
|
| |||||||
Mortgage Related Securities — 1.1% | ||||||||
Accredited Mortgage Loan Trust, Ser 2005-3, Cl M1 | ||||||||
0.980%, 09/25/2035 (A) | 1,044 | 1,032 | ||||||
ACE Securities Home Equity Loan Trust Series, Ser 2006-NC1, Cl A1 | ||||||||
0.812%, 12/25/2035 (A) | 1,619 | 1,607 | ||||||
Aegis Asset-Backed Securities Trust Mortgage Pass-Through Certificates, Ser 2004-2, Cl A1 | ||||||||
1.134%, 06/25/2034 (A) | 12 | 12 | ||||||
Aegis Asset-Backed Securities Trust Mortgage Pass-Through Certificates, Ser 2004-4, Cl A1 | ||||||||
1.254%, 10/25/2034 (A) | 862 | 853 | ||||||
Aegis Asset-Backed Securities Trust, Ser 2005- 5, Cl 2A | ||||||||
0.842%, 12/25/2035 (A) | 1,647 | 1,618 | ||||||
Asset-Backed Securities Home Equity Loan Trust, Ser 2004-HE6, Cl A2 | ||||||||
1.312%, 09/25/2034 (A) | 699 | 694 | ||||||
Bear Stearns Asset-Backed Securities Trust, Ser 2004-2, Cl A1 | ||||||||
1.534%, 08/25/2034 (A) | 116 | 116 | ||||||
Bear Stearns Asset-Backed Securities Trust, Ser 2004-SD3, Cl A3 | ||||||||
1.104%, 09/25/2034 (A) | 162 | 160 | ||||||
First NLC Trust, Ser 2005-2, Cl M1 | ||||||||
1.072%, 09/25/2035 (A) | 1,061 | 1,042 | ||||||
| 196 | SEI Institutional Investments Trust / Semi-Annual Report / November 30, 2016 |
| Description | Face Amount ($ Thousands) | Market Value ($ Thousands) | ||||||
Master Asset-Backed Securities Trust, Ser 2005-FRE1, Cl A5 | ||||||||
0.942%, 10/25/2035 (A) | $ | 52 | $ | 52 | ||||
Merrill Lynch Mortgage Investors Trust, Ser 2006-FF1, Cl M1 | ||||||||
0.754%, 08/25/2036 (A) | 3,400 | 3,381 | ||||||
Option One Mortgage Loan Trust, Ser 2005-3, Cl M1 | ||||||||
1.062%, 08/25/2035 (A) | 964 | 958 | ||||||
Option One Mortgage Loan Trust, Ser 2005-4, Cl M1 | ||||||||
1.032%, 11/25/2035 (A) | 1,750 | 1,718 | ||||||
|
| |||||||
| 13,243 | ||||||||
|
| |||||||
Other Asset-Backed Securities — 4.4% |
| |||||||
CenterPoint Energy Restoration Bond LLC, Ser 2009-1, Cl A2 | ||||||||
3.460%, 08/15/2019 | 792 | 804 | ||||||
CIT Equipment Collateral, | ||||||||
1.690%, 10/21/2019 (B) | 716 | 716 | ||||||
CNH Equipment Trust, Ser 2014-C, Cl A3 | ||||||||
1.050%, 11/15/2019 | 2,338 | 2,336 | ||||||
Countrywide Asset-Backed Certificates, Ser 2004-12, Cl MV3 | ||||||||
1.582%, 03/25/2035 (A) | 842 | 840 | ||||||
Countrywide Asset-Backed Certificates, Ser 2004-14, Cl M2 | ||||||||
1.402%, 06/25/2035 (A) | 1,062 | 1,055 | ||||||
Countrywide Asset-Backed Certificates, Ser 2005-6, Cl M3 | ||||||||
1.152%, 12/25/2035 (A) | 1,750 | 1,727 | ||||||
Credit-Based Asset Servicing and Securitization, Ser 2005-CB3, Cl M2 | ||||||||
1.464%, 05/25/2035 (A) | 3,269 | 3,238 | ||||||
CWABS Asset-Backed Certificates Trust, Ser 2004-13, Cl MV4 | ||||||||
1.809%, 04/25/2035 (A) | 1,360 | 1,335 | ||||||
CWABS Asset-Backed Certificates Trust, Ser 2005-14, Cl 3A3 | ||||||||
0.942%, 04/25/2036 (A) | 998 | 997 | ||||||
Encore Credit Receivables Trust, Ser 2005-2, Cl M2 | ||||||||
1.282%, 11/25/2035 (A) | 1,609 | 1,596 | ||||||
Encore Credit Receivables Trust, Ser 2005-3, Cl M2 | ||||||||
1.327%, 10/25/2035 (A) | 1,159 | 1,154 | ||||||
FBR Securitization Trust, Ser 2005-2, Cl M1 | ||||||||
1.254%, 09/25/2035 (A) | 541 | 536 | ||||||
GSAMP Trust, Ser 2006-HE1, Cl A2D | ||||||||
0.902%, 01/25/2036 (A) | 1,872 | 1,833 | ||||||
John Deere Owner Trust, Ser 2014-B, Cl A3 | ||||||||
1.070%, 11/15/2018 | 760 | 760 | ||||||
| Description | Face Amount ($ Thousands) | Market Value ($ Thousands) | ||||||
John Deere Owner Trust, Ser 2015-A, Cl A3 | ||||||||
1.320%, 06/17/2019 | $ | 2,755 | $ | 2,757 | ||||
Kubota Credit Owner Trust, Ser 2014-1A, Cl A3 | ||||||||
1.160%, 05/15/2018 (B) | 898 | 899 | ||||||
MMAF Equipment Finance LLC, | ||||||||
1.390%, 12/17/2018 (B) | 3,500 | 3,496 | ||||||
Navient Student Loan Trust, Ser 2016-2, Cl A1 | ||||||||
1.334%, 06/25/2065 (A) (B) | 479 | 481 | ||||||
Navient Student Loan Trust, Ser 2016-3A, Cl A2 | ||||||||
1.434%, 06/25/2065 (A) (B) | 830 | 830 | ||||||
Nelnet Student Loan Trust, Ser 2012-5A, Cl A | ||||||||
1.134%, 10/27/2036 (A) (B) | 684 | 665 | ||||||
Nelnet Student Loan Trust, Ser 2014-2A, Cl A1 | ||||||||
0.864%, 06/25/2021 (A) (B) | 554 | 553 | ||||||
Park Place Securities Asset-Backed Pass- Through Certificates, Ser 2004-WHQ2, Cl M2 | ||||||||
1.537%, 02/25/2035 (A) | 1,015 | 1,017 | ||||||
Park Place Securities Asset-Backed Pass- Through Certificates, Ser 2005-WHQ2, Cl M1 | ||||||||
1.222%, 05/25/2035 (A) | 623 | 623 | ||||||
RAMP Trust, Ser 2004-RS12, Cl MII3 | ||||||||
2.034%, 12/25/2034 (A) | 1,174 | 1,164 | ||||||
RAMP Trust, Ser 2006-RZ1, Cl M1 | ||||||||
0.992%, 03/25/2036 (A) | 1,500 | 1,464 | ||||||
Saxon Asset Securities Trust, Ser 2006-1, Cl A2C | ||||||||
0.854%, 03/25/2036 (A) | 3,357 | 3,311 | ||||||
Securitized Asset-Backed Receivables Trust, Ser 2006-OP1, Cl M1 | ||||||||
0.962%, 10/25/2035 (A) | 972 | 952 | ||||||
SLC Student Loan Trust, Ser 2006-1, Cl A5 | ||||||||
0.960%, 06/15/2018 (A) | 740 | 724 | ||||||
SLC Student Loan Trust, Ser 2006-2, Cl A5 | ||||||||
0.950%, 09/15/2026 (A) | 1,133 | 1,122 | ||||||
SLM Student Loan Trust, Ser 2003-12, Cl A5 | ||||||||
1.130%, 09/15/2022 (A) (B) | 585 | 584 | ||||||
SLM Student Loan Trust, Ser 2004-10, Cl A6A | ||||||||
1.432%, 04/27/2026 (A) (B) | 1,750 | 1,738 | ||||||
SLM Student Loan Trust, Ser 2004-10, Cl A6B | ||||||||
1.432%, 04/27/2026 (A) (B) | 1,500 | 1,496 | ||||||
SLM Student Loan Trust, Ser 2005-4, Cl A3 | ||||||||
1.002%, 01/25/2027 (A) | 893 | 882 | ||||||
SLM Student Loan Trust, Ser 2005-8, Cl A4 | ||||||||
1.632%, 01/25/2028 (A) | 1,694 | 1,694 | ||||||
SLM Student Loan Trust, Ser 2011-2, Cl A1 | ||||||||
1.184%, 11/25/2027 (A) | 1,025 | 1,027 | ||||||
SLM Student Loan Trust, Ser 2013-4, Cl A | ||||||||
1.084%, 06/25/2027 (A) | 610 | 590 | ||||||
SLM Student Loan Trust, Ser 2013-5, Cl A2 | ||||||||
0.984%, 10/26/2020 (A) | 172 | 171 | ||||||
| SEI Institutional Investments Trust / Semi-Annual Report / November 30, 2016 | 197 |
SCHEDULE OF INVESTMENTS (Unaudited)
Limited Duration Bond Fund (Continued)
November 30, 2016
| Description | Face Amount ($ Thousands) | Market Value ($ Thousands) | ||||||
SLM Student Loan Trust, Ser 2013-6, Cl A2 | ||||||||
1.084%, 02/25/2021 (A) | $ | 239 | $ | 239 | ||||
SLM Student Loan Trust, Ser 2014-1, Cl A2 | ||||||||
0.914%, 07/26/2021 (A) | 454 | 454 | ||||||
Structured Asset Investment Loan Trust, Ser 2004-10, Cl A7 | ||||||||
1.652%, 11/25/2034 (A) | 1,585 | 1,572 | ||||||
Structured Asset Investment Loan Trust, Ser 2004-11, Cl A4 | ||||||||
1.492%, 01/25/2035 (A) | 1,089 | 1,078 | ||||||
Structured Asset Investment Loan Trust, Ser 2005-3, Cl M2 | ||||||||
1.252%, 04/25/2035 (A) | 1,301 | 1,278 | ||||||
Structured Asset Securities, | ||||||||
1.194%, 02/25/2035 (A) | 1,770 | 1,736 | ||||||
|
| |||||||
| 53,524 | ||||||||
|
| |||||||
Total Asset-Backed Securities (Cost $192,567) ($ Thousands) | 192,506 | |||||||
|
| |||||||
MORTGAGE-BACKED SECURITIES — 13.9% |
| |||||||
Agency Mortgage-Backed Obligations — 6.9% |
| |||||||
FHLMC | ||||||||
5.000%, 06/01/2019 | 61 | 63 | ||||||
4.000%, 06/01/2025 | 658 | 698 | ||||||
FHLMC ARM | ||||||||
2.259%, 03/01/2037 (A) | 227 | 240 | ||||||
FHLMC CMO, Ser 2004-2761, Cl FT | ||||||||
0.888%, 12/15/2033 (A) | 1,311 | 1,316 | ||||||
FHLMC CMO, Ser 2005-2990, Cl LK | ||||||||
0.908%, 10/15/2034 (A) | 2,755 | 2,753 | ||||||
FHLMC CMO, Ser 2005-3066, Cl PF | ||||||||
0.838%, 04/15/2035 (A) | 3,098 | 3,095 | ||||||
FHLMC CMO, Ser 2006-3102, Cl FB | ||||||||
0.838%, 01/15/2036 (A) | 2,127 | 2,126 | ||||||
FHLMC CMO, Ser 2008-3419, Cl FA | ||||||||
1.108%, 08/15/2037 (A) | 2,362 | 2,370 | ||||||
FHLMC CMO, Ser 2010-3747, Cl PA | ||||||||
4.000%, 04/15/2038 | 361 | 374 | ||||||
FHLMC CMO, Ser 2010-3777, Cl WA | ||||||||
4.000%, 12/15/2040 | 4,000 | 4,219 | ||||||
FHLMC CMO, Ser 2011-3867, Cl FN | ||||||||
0.888%, 04/15/2040 (A) | 714 | 714 | ||||||
FHLMC CMO, Ser 2011-3940, Cl PF | ||||||||
0.888%, 05/15/2040 (A) | 3,307 | 3,305 | ||||||
FHLMC CMO, Ser 2011-3960, Cl JF | ||||||||
0.988%, 04/15/2041 (A) | 1,541 | 1,541 | ||||||
FHLMC CMO, Ser 2012-4048, Cl GF | ||||||||
0.888%, 10/15/2040 (A) | 948 | 938 | ||||||
| Description | Face Amount ($ Thousands) | Market Value ($ Thousands) | ||||||
FHLMC Multifamily Structured Pass-Through Certificates, Ser 2010-K008, Cl A1 | ||||||||
2.746%, 12/25/2019 | $ | 1,842 | $ | 1,863 | ||||
FHLMC Multifamily Structured Pass-Through Certificates, Ser KGRP, Cl A | ||||||||
0.972%, 04/25/2020 (A) | 618 | 618 | ||||||
FHLMC Multifamily Structured Pass-Through Certificates, Ser KIR1, Cl A1 | ||||||||
2.450%, 03/25/2026 | 2,001 | 2,022 | ||||||
FNMA | ||||||||
6.000%, 02/01/2023 | 2,549 | 2,765 | ||||||
5.000%, 05/01/2019 | 1,573 | 1,608 | ||||||
4.506%, 06/01/2019 | 4,550 | 4,659 | ||||||
4.380%, 04/01/2021 | 909 | 981 | ||||||
4.330%, 04/01/2021 | 761 | 821 | ||||||
3.800%, 04/01/2018 | 2,007 | 2,051 | ||||||
3.427%, 01/01/2018 | 1,426 | 1,439 | ||||||
3.270%, 10/01/2020 | 1,034 | 1,080 | ||||||
4.500%, 05/01/2024 to 07/01/2034 | 4,643 | 5,006 | ||||||
FNMA CMO, Ser 2004-94, Cl HF | ||||||||
0.739%, 10/25/2034 (A) | 1,174 | 1,178 | ||||||
FNMA CMO, Ser 2005-45, Cl PF | ||||||||
0.834%, 10/25/2034 (A) | 2,632 | 2,624 | ||||||
FNMA CMO, Ser 2005-83, Cl FP | ||||||||
0.914%, 10/25/2035 (A) | 2,108 | 2,100 | ||||||
FNMA CMO, Ser 2007-98, Cl FD | ||||||||
1.034%, 06/25/2037 (A) | 918 | 920 | ||||||
FNMA CMO, Ser 2008-18, Cl HD | ||||||||
4.000%, 12/25/2018 | 74 | 75 | ||||||
FNMA CMO, Ser 2011-124, Cl DF | ||||||||
1.034%, 08/25/2040 (A) | 3,240 | 3,250 | ||||||
FNMA CMO, Ser 2011-23, Cl AB | ||||||||
2.750%, 06/25/2020 | 89 | 90 | ||||||
FNMA CMO, Ser 2011-24, Cl PC | ||||||||
4.000%, 10/25/2039 | 2,736 | 2,793 | ||||||
FNMA CMO, Ser 2012-29, Cl NA | ||||||||
3.500%, 03/25/2042 | 464 | 473 | ||||||
FNMA, Ser 2010-M7, Cl A2 | ||||||||
3.655%, 11/25/2020 | 1,058 | 1,106 | ||||||
FNMA, Ser 2012-M9, Cl A2 | ||||||||
2.482%, 04/25/2022 | 1,200 | 1,211 | ||||||
FNMA, Ser 2013-M14, Cl FA | ||||||||
0.934%, 08/25/2018 (A) | 2,049 | 2,051 | ||||||
FNMA, Ser 2014-M2, Cl ASV2 | ||||||||
2.777%, 06/25/2021 (A) | 1,951 | 2,003 | ||||||
FNMA, Ser 2014-M6, Cl FA | ||||||||
0.804%, 12/25/2017 (A) | 602 | 602 | ||||||
FNMA, Ser M14, Cl APT | ||||||||
2.586%, 04/25/2023 (A) | 2,563 | 2,551 | ||||||
FNMA, Ser M9, Cl ASQ2 | ||||||||
1.513%, 12/25/2017 | 1,778 | 1,772 | ||||||
| 198 | SEI Institutional Investments Trust / Semi-Annual Report / November 30, 2016 |
| Description | Face Amount ($ Thousands) | Market Value ($ Thousands) | ||||||
GNMA ARM | ||||||||
3.000%, 02/20/2041 (A) | $ | 452 | $ | 468 | ||||
2.125%, 08/20/2041 to 04/20/2042 (A) | 981 | 1,009 | ||||||
2.000%, 01/20/2042 to 10/20/2042 (A) | 2,169 | 2,239 | ||||||
GNMA CMO, Ser 2010-162, Cl PQ | ||||||||
4.500%, 06/16/2039 | 116 | 120 | ||||||
GNMA CMO, Ser 2012-31, Cl QJ | ||||||||
3.000%, 12/20/2039 | 265 | 269 | ||||||
GNMA CMO, Ser 2012-77, Cl FM | ||||||||
1.212%, 11/16/2039 (A) | 2,298 | 2,321 | ||||||
GNMA, Ser 2011-142, Cl A | ||||||||
2.337%, 10/16/2040 | 1,721 | 1,725 | ||||||
GNMA, Ser 2012-109, Cl AB | ||||||||
1.388%, 09/16/2044 | 878 | 856 | ||||||
GNMA, Ser 2013-12, Cl AB | ||||||||
1.826%, 11/16/2052 | 1,429 | 1,384 | ||||||
GNMA, Ser 2013193, Cl AB | ||||||||
2.000%, 12/16/2049 | 295 | 295 | ||||||
GS Mortgage Securities Trust, Ser 2010-C2, Cl A1 | ||||||||
3.849%, 12/10/2043 (B) | 29 | 30 | ||||||
|
| |||||||
| 84,180 | ||||||||
|
| |||||||
Non-Agency Mortgage-Backed Obligations — 7.0% |
| |||||||
Agate Bay Mortgage Trust, Ser 2015-2, Cl A7 | ||||||||
3.500%, 03/25/2045 (A) (B) | 1,924 | 1,946 | ||||||
Agate Bay Mortgage Trust, Ser 2015-5, Cl A5 | ||||||||
3.500%, 07/25/2045 (A) (B) | 3,011 | 3,061 | ||||||
Aventura Mall Trust, Ser 2013-AVM, Cl A | ||||||||
3.743%, 12/05/2032 (A) (B) | 3,770 | 3,978 | ||||||
BAMLL Commercial Mortgage Securities Trust, Ser 2013-DSNY, Cl A | ||||||||
1.585%, 09/15/2026 (A) (B) | 1,790 | 1,790 | ||||||
BAMLL Commercial Mortgage Securities Trust, Ser 2014-ICTS, Cl A | ||||||||
1.335%, 06/15/2028 (A) (B) | 870 | 869 | ||||||
BAMLL-DB Trust, Ser OSI, Cl B | ||||||||
4.830%, 04/13/2017 (B) | 1,500 | 1,513 | ||||||
Banc of America Commercial Mortgage Trust, Ser 2007-2, Cl A4 | ||||||||
5.637%, 04/10/2049 (A) | 804 | 806 | ||||||
BLCP Hotel Trust, Ser 2014-CLRN, Cl A | ||||||||
1.488%, 08/15/2029 (A) (B) | 1,056 | 1,055 | ||||||
Citigroup Commercial Mortgage Trust, Ser 2012-GC8, Cl A2 | ||||||||
1.813%, 09/10/2045 | 935 | 936 | ||||||
Citigroup Commercial Mortgage Trust, Ser 2013-GC11, Cl A2 | ||||||||
1.987%, 04/10/2046 | 985 | 990 | ||||||
Citigroup Commercial Mortgage Trust, Ser 2013-GC15, Cl A2 | ||||||||
3.161%, 09/10/2018 | 1,750 | 1,796 | ||||||
| Description | Face Amount ($ Thousands) | Market Value ($ Thousands) | ||||||
Citigroup Commercial Mortgage Trust, Ser 2013-SMP, Cl A | ||||||||
2.110%, 01/12/2030 (B) | $ | 4,268 | $ | 4,278 | ||||
Citigroup Commercial Mortgage Trust, Ser 2016-C1, Cl A1 | ||||||||
1.506%, 03/10/2021 | 3,402 | 3,383 | ||||||
COMM Mortgage Trust, Ser 2014-BBG, Cl A | ||||||||
1.335%, 03/15/2029 (A) (B) | 4,223 | 4,203 | ||||||
COMM Mortgage Trust, Ser 2014-PAT, Cl A | ||||||||
1.327%, 08/13/2027 (A) (B) | 320 | 319 | ||||||
COMM Mortgage Trust, | ||||||||
2.963%, 08/10/2019 | 2,075 | 2,122 | ||||||
COMM Mortgage Trust, Ser 2015-LC23, Cl A1 | ||||||||
1.811%, 09/10/2020 | 251 | 252 | ||||||
Cosmopolitan Hotel Trust, Ser 2016-CSMO, Cl A | ||||||||
1.936%, 11/15/2033 (A) (B) | 4,960 | 4,969 | ||||||
Credit Suisse Commercial Mortgage Trust | ||||||||
5.361%, 02/15/2040 | 435 | 434 | ||||||
CSMC Trust, Ser 2014-WIN1, Cl 1A1 | ||||||||
3.000%, 08/25/2029 (A) (B) | 3,435 | 3,464 | ||||||
CSMC Trust, Ser 2014-WIN1, Cl 2A5 | ||||||||
3.000%, 09/25/2044 (A) (B) | 1,076 | 1,077 | ||||||
CSMLT Trust, Ser 2015-1, Cl A3 | ||||||||
3.500%, 05/25/2045 (B) | 2,244 | 2,255 | ||||||
FHLMC Structured Agency Credit Risk Debt Notes, Ser 2015-DNA1, Cl M1 | ||||||||
1.434%, 10/25/2027 (A) | 1,756 | 1,757 | ||||||
GS Mortgage Securities Trust, Ser 2010-C1, Cl A1 | ||||||||
3.679%, 08/10/2043 (B) | 201 | 207 | ||||||
Homestar Mortgage Acceptance, Ser 2004-3, Cl AV1 | ||||||||
0.984%, 07/25/2034 (A) | 668 | 660 | ||||||
JPMBB Commercial Mortgage Securities Trust, Ser 2013-C15, Cl A2 | ||||||||
2.977%, 11/15/2045 | 1,557 | 1,591 | ||||||
JPMBB Commercial Mortgage Securities Trust, Ser 2014-C19, Cl A1 | ||||||||
1.266%, 04/15/2047 | 153 | 153 | ||||||
JPMBB Commercial Mortgage Securities Trust, Ser 2014-C19, Cl A2 | ||||||||
3.046%, 04/15/2047 | 1,000 | 1,028 | ||||||
JPMBB Commercial Mortgage Securities Trust, Ser 2014-C22, Cl A1 | ||||||||
1.451%, 06/15/2019 | 754 | 750 | ||||||
JPMBB Commercial Mortgage Securities Trust, Ser 2015-C27, Cl A2 | ||||||||
2.734%, 01/15/2020 | 1,500 | 1,534 | ||||||
JPMBB Commercial Mortgage Securities Trust, Ser 2015-C29, Cl A1 | ||||||||
1.626%, 05/15/2048 | 1,061 | 1,060 | ||||||
| SEI Institutional Investments Trust / Semi-Annual Report / November 30, 2016 | 199 |
SCHEDULE OF INVESTMENTS (Unaudited)
Limited Duration Bond Fund (Continued)
November 30, 2016
| Description | Face Amount ($ Thousands) | Market Value ($ Thousands) | ||||||
JPMorgan Chase Commercial Mortgage Securities Trust, Ser 2010-C2, Cl A3 | ||||||||
4.070%, 11/15/2043 (B) | $ | 1,333 | $ | 1,397 | ||||
JPMorgan Chase Commercial Mortgage Securities Trust, Ser 2010-C2, Cl A2 | ||||||||
3.616%, 11/15/2043 (B) | 725 | 736 | ||||||
JPMorgan Chase Commercial Mortgage Securities Trust, Ser 2011-C3, Cl A3 | ||||||||
4.388%, 02/15/2046 (B) | 624 | 644 | ||||||
JPMorgan Chase Commercial Mortgage Securities Trust, Ser 2013-C13, Cl A2 | ||||||||
2.665%, 01/15/2046 | 1,050 | 1,068 | ||||||
JPMorgan Chase Commercial Mortgage Securities Trust, Ser 2014-CBM, Cl A | ||||||||
1.438%, 10/15/2029 (A) (B) | 1,785 | 1,783 | ||||||
JPMorgan Chase Commercial Mortgage Securities Trust, Ser 2014-FL5, Cl A | ||||||||
1.504%, 07/15/2031 (A) (B) | 373 | 373 | ||||||
JPMorgan Chase Commercial Mortgage Securities Trust, Ser 2014-PHH, Cl A | ||||||||
1.735%, 08/15/2027 (A) (B) | 4,110 | 4,110 | ||||||
JPMorgan Mortgage Trust, Ser 2014-5, Cl A1 | ||||||||
3.000%, 10/25/2029 (A) (B) | 2,408 | 2,436 | ||||||
JPMorgan Mortgage Trust, Ser 2015-3, Cl A5 | ||||||||
3.500%, 05/25/2045 (A) (B) | 3,467 | 3,494 | ||||||
JPMorgan Resecuritization Trust Series, Ser 2009-7, Cl 18A1 | ||||||||
3.095%, 11/27/2036 (A) (B) | 678 | 676 | ||||||
LB-UBS Commercial Mortgage Trust, Ser 2007- C2, Cl A3 | ||||||||
5.430%, 02/15/2040 | 734 | 737 | ||||||
Merrill Lynch Mortgage Investors Trust, Ser 2004-A, Cl A1 | ||||||||
0.994%, 04/25/2029 (A) | 1,151 | 1,101 | ||||||
Morgan Stanley Bank of America Merrill Lynch Trust, Ser 2012-C5, Cl A2 | ||||||||
1.972%, 08/15/2045 | 2,169 | 2,174 | ||||||
Morgan Stanley Bank of America Merrill Lynch Trust, Ser 2013-C7, Cl A2 | ||||||||
1.863%, 02/15/2046 | 1,178 | 1,182 | ||||||
Morgan Stanley Bank of America Merrill Lynch Trust, Ser 2015-C21, Cl A2 | ||||||||
2.933%, 01/15/2020 | 300 | 307 | ||||||
Morgan Stanley Bank of America Merrill Lynch Trust, Ser 2015-C27, Cl A1 | ||||||||
1.980%, 11/15/2020 | 307 | 307 | ||||||
Morgan Stanley Capital I Trust, Ser 2014-MP, Cl A | ||||||||
3.469%, 08/11/2021 (B) | 750 | 782 | ||||||
Wachovia Bank Commercial Mortgage Trust, Ser 2007-C32, Cl A3 | ||||||||
5.890%, 06/15/2049 (A) | 1,483 | 1,496 | ||||||
| Description | Face Amount ($ Thousands) | Market Value ($ Thousands) | ||||||
Waldorf Astoria Boca Raton Trust, Ser 2016- BOCA, Cl A | ||||||||
1.888%, 06/15/2018 (A) (B) | $ | 2,000 | $ | 2,000 | ||||
WFRBS Commercial Mortgage Trust, Ser 2013- C12, Cl A2 | ||||||||
2.072%, 03/15/2048 | 1,107 | 1,111 | ||||||
WFRBS Commercial Mortgage Trust, Ser 2014- C25, Cl A1 | ||||||||
1.518%, 11/15/2047 | 1,128 | 1,126 | ||||||
WinWater Mortgage Loan Trust, Ser 2015-A, Cl A5 | ||||||||
3.500%, 05/27/2045 (A) (B) | 1,877 | 1,884 | ||||||
|
| |||||||
| 85,160 | ||||||||
|
| |||||||
Total Mortgage-Backed Securities | 169,340 | |||||||
|
| |||||||
MUNICIPAL BONDS — 6.5% | ||||||||
California — 1.5% | ||||||||
California State, GO | ||||||||
6.200%, 03/01/2019 | 5,100 | 5,608 | ||||||
Los Angeles, Municipal Improvement, Ser A, RB | ||||||||
2.344%, 11/01/2018 | 995 | 1,013 | ||||||
San Francisco, City & County Airport Comm-San Francisco International Airport, Ser H, RB | ||||||||
3.396%, 05/01/2019 | 3,805 | 3,957 | ||||||
State of California Department of Water Resources Power Supply Revenue, Ser P, RB | ||||||||
1.713%, 05/01/2021 | 7,875 | 7,738 | ||||||
|
| |||||||
| 18,316 | ||||||||
|
| |||||||
Colorado — 0.6% | ||||||||
Colorado Housing & Finance Authority, Ser B, RB | ||||||||
1.850%, 05/15/2017 | 5,710 | 5,734 | ||||||
Denver, City & County, Ser B, RB | ||||||||
1.825%, 08/01/2019 | 2,000 | 2,002 | ||||||
|
| |||||||
| 7,736 | ||||||||
|
| |||||||
Connecticut — 0.1% | ||||||||
Connecticut State, Ser B, GO | ||||||||
2.500%, 08/01/2020 | 1,560 | 1,590 | ||||||
|
| |||||||
Florida — 0.2% | ||||||||
Greater Orlando, Aviation Authority, Ser D, RB | ||||||||
3.733%, 10/01/2020 | 1,820 | 1,929 | ||||||
Miami Beach, Redevelopment Agency, TA | ||||||||
2.407%, 02/01/2018 | 1,000 | 1,005 | ||||||
|
| |||||||
| 2,934 | ||||||||
|
| |||||||
| 200 | SEI Institutional Investments Trust / Semi-Annual Report / November 30, 2016 |
| Description | Face Amount ($ Thousands) | Market Value ($ Thousands) | ||||||
Georgia — 0.1% | ||||||||
Georgia State, Electric Authority, Ser D, RB | ||||||||
3.552%, 01/01/2017 | $ | 810 | $ | 811 | ||||
|
| |||||||
Illinois — 0.1% | ||||||||
Waukegan City, Ser B, GO | ||||||||
2.566%, 12/30/2019 | 1,045 | 1,048 | ||||||
|
| |||||||
Kentucky — 0.4% | ||||||||
Louisville Regional Airport Authority, Ser C, RB | ||||||||
1.906%, 07/01/2018 | 2,880 | 2,893 | ||||||
Louisville, Regional Airport Authority, Ser C, RB | ||||||||
1.313%, 07/01/2017 | 1,640 | 1,641 | ||||||
|
| |||||||
| 4,534 | ||||||||
|
| |||||||
Louisiana — 0.4% | ||||||||
Louisiana State, Ser C, GO | ||||||||
1.087%, 08/01/2017 | 4,455 | 4,452 | ||||||
|
| |||||||
Maryland — 0.1% | ||||||||
Maryland State, Community Development Administration Housing Revenue, Ser A, RB | ||||||||
1.517%, 03/01/2019 | 1,000 | 992 | ||||||
|
| |||||||
Michigan — 0.4% | ||||||||
Hartland, Consolidated Schools, Ser B, GO, Q-SBLF | ||||||||
1.830%, 05/01/2019 | 2,050 | 2,062 | ||||||
Haslett, Public Schools, Ser B, GO, Q-SBLF | ||||||||
1.384%, 05/01/2018 | 2,050 | 2,049 | ||||||
Michigan State, Ser A, GO | ||||||||
1.625%, 05/15/2017 | 1,000 | 1,004 | ||||||
|
| |||||||
| 5,115 | ||||||||
|
| |||||||
Minnesota — 0.3% | ||||||||
Saint Paul, Housing & Redevelopment Authority, RB | ||||||||
1.838%, 07/01/2018 | 4,235 | 4,247 | ||||||
|
| |||||||
New Jersey — 0.5% | ||||||||
New Jersey State, Economic Development Authority, Ser Q, RB | ||||||||
1.802%, 06/15/2017 | 4,915 | 4,923 | ||||||
New Jersey State, Transportation Trust Fund Authority, Ser B, RB | ||||||||
1.758%, 12/15/2018 | 1,000 | 984 | ||||||
|
| |||||||
| 5,907 | ||||||||
|
| |||||||
North Carolina — 0.6% | ||||||||
North Carolina Eastern Municipal Power Agency, RB | ||||||||
2.578%, 07/01/2019 | 2,670 | 2,708 | ||||||
| Description | Face Amount ($ Thousands) | Market Value ($ Thousands) | ||||||
North Carolina State, Eastern Municipal Power Agency, RB | ||||||||
2.003%, 07/01/2018 | $ | 4,075 | $ | 4,091 | ||||
|
| |||||||
| 6,799 | ||||||||
|
| |||||||
Ohio — 0.3% | ||||||||
Jobs, Beverage System, Ser B, RB | ||||||||
1.820%, 01/01/2018 | 2,195 | 2,208 | ||||||
Ohio State, Build America Bonds, RB | ||||||||
4.168%, 06/15/2018 | 1,275 | 1,329 | ||||||
|
| |||||||
| 3,537 | ||||||||
|
| |||||||
Oklahoma — 0.1% | ||||||||
University of Oklahoma, Ser D, RB | ||||||||
2.349%, 07/01/2020 | 1,815 | 1,825 | ||||||
|
| |||||||
Pennsylvania — 0.4% | ||||||||
Pennsylvania Turnpike Commission, Sub-Ser B, RB | ||||||||
2.024%, 12/01/2020 | 4,680 | 4,599 | ||||||
|
| |||||||
Washington — 0.4% | ||||||||
Public Utility District No 1 of Franklin County, Ser B, RB | ||||||||
1.980%, 09/01/2021 | 1,000 | 976 | ||||||
1.590%, 09/01/2019 | 1,200 | 1,186 | ||||||
WBRP 3.2, Ser B, RB | ||||||||
1.485%, 03/01/2018 | 2,725 | 2,726 | ||||||
|
| |||||||
| 4,888 | ||||||||
|
| |||||||
Total Municipal Bonds (Cost $79,645) ($ Thousands) | 79,330 | |||||||
|
| |||||||
SOVEREIGN DEBT — 1.2% | ||||||||
Export-Import Bank of Korea | ||||||||
1.631%, 01/14/2017 (A) | 3,915 | 3,917 | ||||||
Korea Development Bank | ||||||||
1.507%, 01/22/2017 (A) | 7,056 | 7,056 | ||||||
Province of Quebec Canada MTN | ||||||||
1.065%, 09/04/2018 (A) | 3,585 | 3,588 | ||||||
|
| |||||||
Total Sovereign Debt (Cost $14,549) ($ Thousands) | 14,561 | |||||||
|
| |||||||
COMMERCIAL PAPER (B)(C)(D) — 0.8% |
| |||||||
DTE Gas Company | ||||||||
0.570%, 12/06/2016 | 4,000 | 4,000 | ||||||
United Health Group | ||||||||
0.640%, 12/05/2016 | 6,500 | 6,499 | ||||||
|
| |||||||
| SEI Institutional Investments Trust / Semi-Annual Report / November 30, 2016 | 201 |
SCHEDULE OF INVESTMENTS (Unaudited)
Limited Duration Bond Fund (Concluded)
November 30, 2016
| Description | Face Amount ($ Thousands) | Market Value ($ Thousands) | ||||||||||
Total Commercial Paper (Cost $10,499) ($ Thousands) |
| $ | 10,499 | |||||||||
|
| |||||||||||
| Shares | ||||||||||||
CASH EQUIVALENT — 1.1% |
| |||||||||||
SEI Daily Income Trust, Government Fund, Cl A | ||||||||||||
0.210%**† | 13,188,480 | 13,188 | ||||||||||
|
| |||||||||||
Total Cash Equivalent (Cost $13,188) ($ Thousands) | 13,188 | |||||||||||
|
| |||||||||||
Total Investments — 97.7% (Cost $1,196,651) ($ Thousands) |
| $ | 1,192,771 | |||||||||
|
| |||||||||||
| Type of Contract | Number of Contracts Long | Expiration Date | Unrealized Appreciation ($ Thousands) | |||||||||
U.S. 2-Year Treasury Note | 80 | Apr-2017 | $ | 4 | ||||||||
|
| |||||||||||
| Percentages | are based on Net Assets of $1,220,753 ($ Thousands). |
| ** | Rate shown is the 7-day effective yield as of November 30, 2016. |
| † | Investment in Affiliated Security (see Note 6). |
| (A) | Variable Rate Security — The rate reported on the Schedule of Investments is the rate in effect as of November 30, 2016. |
| (B) | Security exempt from registration under Rule 144A of the Securities Act of 1933. These securities may be resold in transactions exempt from registration normally to qualified institutions. On November 30, 2016, the value of these securities amounted to $186,026 ($ Thousands), representing 15.2% of the net assets of the Fund. |
| (C) | The rate reported is the effective yield at the time of purchase. |
| (D) | Securities are held in connection with a letter of credit issued by a major bank. |
ARM — Adjustable Rate Mortgage
Cl — Class
CMO — Collateralized Mortgage Obligation
FHLMC — Federal Home Loan Mortgage Corporation
FNMA — Federal National Mortgage Association
GNMA — Government National Mortgage Association
GO — General Obligation
LLC — Limited Liability Company
LP — Limited Partnership
MTN — Medium Term Note
RB — Revenue Bond
Ser — Series
TA — Tax Allocation
The following is a list of the level of inputs used as of November 30, 2016, in valuing the Fund’s investments carried at value ($ Thousands):
| Investments in Securities | Level 1 | Level 2 | Level 3 | Total | ||||||||||||
Corporate Obligations | $ | — | $ | 381,729 | $ | — | $ | 381,729 | ||||||||
U.S. Treasury Obligations | — | 331,618 | — | 331,618 | ||||||||||||
Asset-Backed Securities | — | 192,506 | — | 192,506 | ||||||||||||
Mortgage-Backed Securities | — | 169,340 | — | 169,340 | ||||||||||||
Municipal Bonds | — | 79,330 | — | 79,330 | ||||||||||||
Sovereign Debt | — | 14,561 | — | 14,561 | ||||||||||||
Commercial Paper | — | 10,499 | — | 10,499 | ||||||||||||
Cash Equivalent | 13,188 | — | — | 13,188 | ||||||||||||
|
|
|
|
|
|
|
| |||||||||
Total Investments in Securities | $ | 13,188 | $ | 1,179,583 | $ | — | $ | 1,192,771 | ||||||||
|
|
|
|
|
|
|
| |||||||||
| Other Financial Instruments | Level 1 | Level 2 | Level 3 | Total | ||||||||||||
Futures Contracts* | ||||||||||||||||
Unrealized Appreciation | $ | 4 | $ | — | $ | — | $ | 4 | ||||||||
|
|
|
|
|
|
|
| |||||||||
Total Other Financial Instruments | $ | 4 | $ | — | $ | — | $ | 4 | ||||||||
|
|
|
|
|
|
|
| |||||||||
| * | Futures contracts are valued at the unrealized appreciation (depreciation) on the instrument. |
For the period ended November 30, 2016, there were no transfers between Level 1 and Level 2 assets and liabilities.
For the period ended November 30, 2016, there were no transfers between Level 2 and Level 3 assets and liabilities.
For more information on valuation inputs, see Note 2 — Significant Accounting Policies in Notes to Financial Statements.
Amounts designated as “—” are $0 or have been rounded to $0.
The accompanying notes are an integral part of the financial statements.
| 202 | SEI Institutional Investments Trust / Semi-Annual Report / November 30, 2016 |
SCHEDULE OF INVESTMENTS (Unaudited)
Intermediate Duration Credit Fund
November 30, 2016
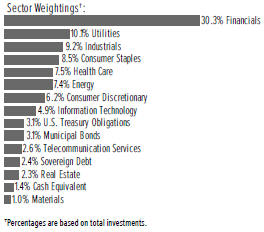
| Description | Face Amount ($ Thousands) | Market Value ($ Thousands) | ||||||
CORPORATE OBLIGATIONS — 89.4%‡‡ |
| |||||||
Consumer Discretionary — 6.2% | ||||||||
21st Century Fox America | ||||||||
8.150%, 10/17/2036 | $ | 40 | $ | 54 | ||||
6.900%, 08/15/2039 | 2,170 | 2,744 | ||||||
Air Canada, Pass-Through Trust, Ser 2015-1, Cl A | ||||||||
3.600%, 03/15/2027 (A) | 4,561 | 4,570 | ||||||
American Honda Finance MTN | ||||||||
1.200%, 07/12/2019 | 5,260 | 5,165 | ||||||
American Honda Finance | ||||||||
2.125%, 10/10/2018 | 2,690 | 2,716 | ||||||
BMW US Capital LLC | ||||||||
2.800%, 04/11/2026 (A) | 2,715 | 2,609 | ||||||
1.500%, 04/11/2019 (A) | 1,875 | 1,863 | ||||||
Charter Communications Operating LLC | ||||||||
4.464%, 07/23/2022 (A) | 1,185 | 1,231 | ||||||
Comcast | ||||||||
6.950%, 08/15/2037 | 4,290 | 5,802 | ||||||
5.650%, 06/15/2035 | 190 | 224 | ||||||
4.200%, 08/15/2034 | 3,700 | 3,776 | ||||||
3.375%, 02/15/2025 | 6,425 | 6,500 | ||||||
3.150%, 03/01/2026 | 2,435 | 2,419 | ||||||
1.625%, 01/15/2022 | 920 | 880 | ||||||
Comcast Cable Communications Holdings | ||||||||
9.455%, 11/15/2022 | 1,750 | 2,371 | ||||||
Darden Restaurants | ||||||||
6.800%, 10/15/2037 | 1,570 | 1,773 | ||||||
Discovery Communications LLC | ||||||||
6.350%, 06/01/2040 | 1,460 | 1,517 | ||||||
4.875%, 04/01/2043 | 910 | 813 | ||||||
Ford Holdings | ||||||||
9.300%, 03/01/2030 | 287 | 387 | ||||||
Ford Motor Credit LLC | ||||||||
2.551%, 10/05/2018 | 655 | 659 | ||||||
| Description | Face Amount ($ Thousands) | Market Value ($ Thousands) | ||||||
General Motors | ||||||||
4.875%, 10/02/2023 | $ | 1,150 | $ | 1,202 | ||||
General Motors Financial | ||||||||
5.250%, 03/01/2026 | 1,170 | 1,222 | ||||||
Home Depot | ||||||||
5.875%, 12/16/2036 | 1,489 | 1,867 | ||||||
4.400%, 04/01/2021 | 1,050 | 1,137 | ||||||
4.400%, 03/15/2045 | 840 | 886 | ||||||
3.500%, 09/15/2056 | 2,170 | 1,893 | ||||||
3.350%, 09/15/2025 | 785 | 803 | ||||||
2.000%, 04/01/2021 | 1,280 | 1,267 | ||||||
Lowe’s | ||||||||
4.375%, 09/15/2045 | 2,590 | 2,637 | ||||||
3.375%, 09/15/2025 | 1,590 | 1,627 | ||||||
Newell Brands | ||||||||
5.000%, 11/15/2023 | 1,475 | 1,573 | ||||||
NVR | ||||||||
3.950%, 09/15/2022 | 665 | 681 | ||||||
QVC | ||||||||
4.375%, 03/15/2023 | 1,345 | 1,313 | ||||||
Target | ||||||||
6.500%, 10/15/2037 | 1,750 | 2,318 | ||||||
3.625%, 04/15/2046 | 920 | 846 | ||||||
2.900%, 01/15/2022 | 1,405 | 1,429 | ||||||
2.500%, 04/15/2026 | 1,350 | 1,283 | ||||||
Time Warner | ||||||||
3.800%, 02/15/2027 | 1,280 | 1,274 | ||||||
Time Warner Entertainment | ||||||||
8.375%, 07/15/2033 | 797 | 1,025 | ||||||
Toyota Motor Credit MTN | ||||||||
2.800%, 07/13/2022 | 2,450 | 2,489 | ||||||
1.550%, 07/13/2018 | 2,980 | 2,982 | ||||||
1.450%, 01/12/2018 | 4,135 | 4,134 | ||||||
Viacom | ||||||||
5.625%, 09/15/2019 | 2,200 | 2,381 | ||||||
Volkswagen Group of America Finance LLC | ||||||||
1.250%, 05/23/2017 (A) | 2,175 | 2,170 | ||||||
|
| |||||||
| 88,512 | ||||||||
|
| |||||||
Consumer Staples — 8.3% | ||||||||
Altria Group | ||||||||
9.950%, 11/10/2038 | 1,708 | 2,897 | ||||||
4.750%, 05/05/2021 | 1,000 | 1,090 | ||||||
2.625%, 09/16/2026 | 1,525 | 1,448 | ||||||
Anheuser-Busch InBev Finance | ||||||||
4.700%, 02/01/2036 | 11,591 | 12,155 | ||||||
3.650%, 02/01/2026 | 8,030 | 8,093 | ||||||
3.300%, 02/01/2023 | 4,165 | 4,208 | ||||||
2.650%, 02/01/2021 | 3,675 | 3,688 | ||||||
Anheuser-Busch InBev Worldwide | ||||||||
2.500%, 07/15/2022 | 1,385 | 1,364 | ||||||
| SEI Institutional Investments Trust / Semi-Annual Report / November 30, 2016 | 203 |
SCHEDULE OF INVESTMENTS (Unaudited)
Intermediate Duration Credit Fund (Continued)
November 30, 2016
| Description | Face Amount ($ Thousands) | Market Value ($ Thousands) | ||||||
Anheuser-Busch LLC | ||||||||
5.000%, 03/01/2019 | $ | 1,000 | $ | 1,065 | ||||
BAT International Finance | ||||||||
2.750%, 06/15/2020 (A) | 4,240 | 4,269 | ||||||
1.850%, 06/15/2018 (A) | 2,740 | 2,740 | ||||||
Bayer US Finance LLC | ||||||||
1.500%, 10/06/2017 (A) | 2,955 | 2,951 | ||||||
Blue Cross & Blue Shield of Minnesota | ||||||||
3.790%, 05/01/2025 (A) | 2,086 | 2,021 | ||||||
Bowdoin College | ||||||||
4.693%, 07/01/2112 | 2,056 | 1,868 | ||||||
Coca-Cola | ||||||||
1.550%, 09/01/2021 | 3,005 | 2,919 | ||||||
Constellation Brands | ||||||||
6.000%, 05/01/2022 | 450 | 512 | ||||||
4.750%, 11/15/2024 | 1,925 | 2,055 | ||||||
CVS Health | ||||||||
5.125%, 07/20/2045 | 1,205 | 1,322 | ||||||
CVS Pass-Through Trust | ||||||||
8.353%, 07/10/2031 (A) | 2,379 | 3,134 | ||||||
7.507%, 01/10/2032 (A) | 1,677 | 2,053 | ||||||
Hershey | ||||||||
2.300%, 08/15/2026 | 4,470 | 4,155 | ||||||
Japan Tobacco | ||||||||
2.100%, 07/23/2018 (A) | 2,652 | 2,665 | ||||||
Land O’ Lakes | ||||||||
6.000%, 11/15/2022 (A) | 1,665 | 1,827 | ||||||
Massachusetts Institute of Technology | ||||||||
5.600%, 07/01/2111 | 3,080 | 3,775 | ||||||
Molson Coors Brewing | ||||||||
2.100%, 07/15/2021 | 1,985 | 1,934 | ||||||
Novartis Capital | ||||||||
3.000%, 11/20/2025 | 3,085 | 3,076 | ||||||
PepsiCo | ||||||||
3.125%, 11/01/2020 | 3,915 | 4,049 | ||||||
1.700%, 10/06/2021 | 1,850 | 1,802 | ||||||
1.500%, 02/22/2019 | 1,175 | 1,171 | ||||||
1.250%, 04/30/2018 | 2,700 | 2,697 | ||||||
Philip Morris International | ||||||||
4.500%, 03/20/2042 | 1,375 | 1,403 | ||||||
3.875%, 08/21/2042 | 335 | 312 | ||||||
Roche Holdings | ||||||||
2.875%, 09/29/2021 (A) | 3,950 | 4,023 | ||||||
Sanofi | ||||||||
1.250%, 04/10/2018 | 3,410 | 3,421 | ||||||
Shire Acquisitions Investments Ireland DAC | ||||||||
2.400%, 09/23/2021 | 845 | 817 | ||||||
1.900%, 09/23/2019 | 3,025 | 2,985 | ||||||
Toledo Hospital | ||||||||
4.982%, 11/15/2045 | 2,180 | 2,401 | ||||||
University of Southern California | ||||||||
5.250%, 10/01/2111 | 3,250 | 3,710 | ||||||
| Description | Face Amount ($ Thousands) | Market Value ($ Thousands) | ||||||
Walgreens Boots Alliance | ||||||||
1.750%, 05/30/2018 | $ | 3,160 | $ | 3,166 | ||||
Wal-Mart Stores | ||||||||
4.300%, 04/22/2044 | 80 | 84 | ||||||
2.550%, 04/11/2023 | 5,680 | 5,628 | ||||||
Wesleyan University | ||||||||
4.781%, 07/01/2116 | 2,040 | 1,946 | ||||||
|
| |||||||
| 118,899 | ||||||||
|
| |||||||
Energy — 7.3% | ||||||||
Anadarko Petroleum | ||||||||
6.450%, 09/15/2036 | 1,995 | 2,246 | ||||||
4.475%, 10/10/2036 (B) | 12,000 | 4,725 | ||||||
BP Capital Markets | ||||||||
3.723%, 11/28/2028 | 2,159 | 2,173 | ||||||
3.216%, 11/28/2023 | 1,460 | 1,459 | ||||||
1.375%, 11/06/2017 | 2,512 | 2,512 | ||||||
British Transco Finance | ||||||||
6.625%, 06/01/2018 | 1,765 | 1,891 | ||||||
Chevron | ||||||||
2.954%, 05/16/2026 | 2,095 | 2,049 | ||||||
1.344%, 11/09/2017 | 2,800 | 2,803 | ||||||
Columbia Pipeline Group | ||||||||
2.450%, 06/01/2018 | 2,925 | 2,941 | ||||||
Conoco Funding | ||||||||
6.950%, 04/15/2029 | 1,067 | 1,307 | ||||||
ConocoPhillips | ||||||||
6.500%, 02/01/2039 | 1,365 | 1,680 | ||||||
4.200%, 03/15/2021 | 3,220 | 3,417 | ||||||
2.400%, 12/15/2022 | 3,000 | 2,893 | ||||||
1.806%, 05/15/2022 (C) | 3,955 | 3,897 | ||||||
Devon Energy | ||||||||
5.850%, 12/15/2025 | 940 | 1,044 | ||||||
Devon Financing | ||||||||
7.875%, 09/30/2031 | 1,761 | 2,147 | ||||||
Energy Transfer Partners | ||||||||
5.150%, 03/15/2045 | 670 | 604 | ||||||
4.650%, 06/01/2021 | 2,982 | 3,127 | ||||||
4.050%, 03/15/2025 | 520 | 503 | ||||||
Enterprise Products Operating LLC | ||||||||
3.900%, 02/15/2024 | 4,250 | 4,341 | ||||||
EOG Resources | ||||||||
2.450%, 04/01/2020 | 1,780 | 1,778 | ||||||
Exxon Mobil | ||||||||
4.114%, 03/01/2046 | 3,293 | 3,306 | ||||||
3.043%, 03/01/2026 | 1,985 | 1,968 | ||||||
1.305%, 03/06/2018 | 4,700 | 4,697 | ||||||
Hess | ||||||||
4.300%, 04/01/2027 | 1,310 | 1,243 | ||||||
Kinder Morgan | ||||||||
5.550%, 06/01/2045 | 2,220 | 2,194 | ||||||
| 204 | SEI Institutional Investments Trust / Semi-Annual Report / November 30, 2016 |
| Description | Face Amount ($ Thousands) | Market Value ($ Thousands) | ||||||
MPLX | ||||||||
4.875%, 12/01/2024 | $ | 2,615 | $ | 2,635 | ||||
Nexen | ||||||||
7.400%, 05/01/2028 | 772 | 985 | ||||||
Occidental Petroleum | ||||||||
4.400%, 04/15/2046 | 1,910 | 1,895 | ||||||
Schlumberger Holdings | ||||||||
4.000%, 12/21/2025 (A) | 1,500 | 1,552 | ||||||
3.000%, 12/21/2020 (A) | 2,562 | 2,610 | ||||||
Shell International Finance | ||||||||
6.375%, 12/15/2038 | 1,170 | 1,480 | ||||||
4.125%, 05/11/2035 | 2,040 | 2,028 | ||||||
4.000%, 05/10/2046 | 3,115 | 2,891 | ||||||
3.625%, 08/21/2042 | 641 | 566 | ||||||
3.400%, 08/12/2023 | 5,525 | 5,633 | ||||||
2.875%, 05/10/2026 | 2,585 | 2,489 | ||||||
1.375%, 05/10/2019 | 4,170 | 4,120 | ||||||
Spectra Energy Partners | ||||||||
3.375%, 10/15/2026 | 1,380 | 1,310 | ||||||
Suncor Energy | ||||||||
5.950%, 12/01/2034 | 1,375 | 1,566 | ||||||
Sunoco Logistics Partners Operations | ||||||||
4.950%, 01/15/2043 | 2,124 | 1,885 | ||||||
TransCanada PipeLines | ||||||||
6.100%, 06/01/2040 | 1,435 | 1,721 | ||||||
Transcanada Trust | ||||||||
5.875%, 08/15/2076 (C) | 2,670 | 2,763 | ||||||
Valero Energy | ||||||||
10.500%, 03/15/2039 | 1,668 | 2,487 | ||||||
Williams Partners | ||||||||
3.600%, 03/15/2022 | 1,540 | 1,522 | ||||||
|
| |||||||
| 105,083 | ||||||||
|
| |||||||
Financials — 30.1% | ||||||||
AIA Group MTN | ||||||||
3.200%, 03/11/2025 (A) | 3,600 | 3,484 | ||||||
American Express Credit MTN | ||||||||
2.375%, 03/24/2017 | 2,370 | 2,379 | ||||||
American International Group | ||||||||
4.875%, 06/01/2022 | 1,300 | 1,416 | ||||||
Ameriprise Financial | ||||||||
4.000%, 10/15/2023 | 2,450 | 2,575 | ||||||
ANZ New Zealand International | ||||||||
1.750%, 03/29/2018 (A) | 4,000 | 3,996 | ||||||
Apollo Management Holdings | ||||||||
4.400%, 05/27/2026 (A) | 1,715 | 1,709 | ||||||
Bank of America MTN | ||||||||
5.000%, 01/21/2044 | 550 | 596 | ||||||
4.183%, 11/25/2027 | 2,935 | 2,929 | ||||||
3.500%, 04/19/2026 | 2,670 | 2,636 | ||||||
3.248%, 10/21/2027 | 2,610 | 2,487 | ||||||
2.503%, 10/21/2022 | 2,665 | 2,588 | ||||||
| Description | Face Amount ($ Thousands) | Market Value ($ Thousands) | ||||||
Bank of America | ||||||||
6.000%, 10/15/2036 | $ | 345 | $ | 413 | ||||
Bank of Montreal MTN | ||||||||
1.900%, 08/27/2021 | 1,865 | 1,810 | ||||||
1.500%, 07/18/2019 | 2,977 | 2,938 | ||||||
Bank of New York Mellon MTN | ||||||||
2.600%, 08/17/2020 | 3,745 | 3,778 | ||||||
2.300%, 09/11/2019 | 1,650 | 1,667 | ||||||
2.200%, 08/16/2023 | 2,025 | 1,929 | ||||||
2.150%, 02/24/2020 | 2,825 | 2,821 | ||||||
BB&T | ||||||||
4.900%, 06/30/2017 | 880 | 896 | ||||||
Berkshire Hathaway | ||||||||
3.125%, 03/15/2026 | 3,978 | 3,947 | ||||||
2.750%, 03/15/2023 | 3,585 | 3,573 | ||||||
1.031%, 08/06/2018 (C) | 1,190 | 1,191 | ||||||
Berkshire Hathaway Finance | ||||||||
1.700%, 03/15/2019 | 3,475 | 3,473 | ||||||
Blackstone Holdings Finance | ||||||||
5.000%, 06/15/2044 (A) | 3,115 | 3,097 | ||||||
4.450%, 07/15/2045 (A) | 3,845 | 3,530 | ||||||
BPCE MTN | ||||||||
2.750%, 12/02/2021 | 780 | 777 | ||||||
Branch Banking & Trust | ||||||||
3.800%, 10/30/2026 | 1,780 | 1,833 | ||||||
2.850%, 04/01/2021 | 4,065 | 4,128 | ||||||
Capital One | ||||||||
2.250%, 09/13/2021 | 2,050 | 1,997 | ||||||
Carlyle Holdings Finance LLC | ||||||||
3.875%, 02/01/2023 (A) | 1,182 | 1,191 | ||||||
Carlyle Holdings II Finance LLC | ||||||||
5.625%, 03/30/2043 (A) | 3,127 | 3,088 | ||||||
CDP Financial | ||||||||
5.600%, 11/25/2039 (A) | 700 | 866 | ||||||
4.400%, 11/25/2019 (A) | 2,290 | 2,454 | ||||||
Charles Schwab | ||||||||
4.450%, 07/22/2020 | 1,720 | 1,845 | ||||||
Chubb INA Holdings | ||||||||
4.350%, 11/03/2045 | 1,138 | 1,188 | ||||||
2.875%, 11/03/2022 | 3,685 | 3,718 | ||||||
2.300%, 11/03/2020 | 3,790 | 3,785 | ||||||
Citigroup | ||||||||
5.500%, 09/13/2025 | 655 | 716 | ||||||
4.750%, 05/18/2046 | 1,010 | 997 | ||||||
4.650%, 07/30/2045 | 1,680 | 1,734 | ||||||
4.450%, 09/29/2027 | 3,025 | 3,067 | ||||||
Cooperatieve Centrale Raiffeisen- Boerenleenbank BA | ||||||||
3.950%, 11/09/2022 | 3,638 | 3,723 | ||||||
Cooperatieve Rabobank UA | ||||||||
5.250%, 08/04/2045 | 1,925 | 2,096 | ||||||
| SEI Institutional Investments Trust / Semi-Annual Report / November 30, 2016 | 205 |
SCHEDULE OF INVESTMENTS (Unaudited)
Intermediate Duration Credit Fund (Continued)
November 30, 2016
| Description | Face Amount ($ Thousands) | Market Value ($ Thousands) | ||||||
Credit Suisse Group Funding Guernsey | ||||||||
4.550%, 04/17/2026 (A) | $ | 2,775 | $ | 2,825 | ||||
Credit Suisse NY MTN | ||||||||
1.750%, 01/29/2018 | 4,260 | 4,254 | ||||||
Credit Suisse NY | ||||||||
3.000%, 10/29/2021 | 2,810 | 2,819 | ||||||
Farmers Exchange Capital III | ||||||||
5.454%, 10/15/2054 (A) (C) | 1,750 | 1,654 | ||||||
Fifth Third Bank | ||||||||
2.875%, 10/01/2021 | 3,570 | 3,619 | ||||||
2.300%, 03/15/2019 | 3,950 | 3,977 | ||||||
Fifth Third Bank MTN | ||||||||
2.150%, 08/20/2018 | 4,000 | 4,025 | ||||||
General Electric MTN | ||||||||
6.875%, 01/10/2039 | 1,225 | 1,709 | ||||||
5.875%, 01/14/2038 | 550 | 689 | ||||||
5.625%, 09/15/2017 | 2,740 | 2,835 | ||||||
2.300%, 04/27/2017 | 2,335 | 2,346 | ||||||
Goldman Sachs Group MTN | ||||||||
7.500%, 02/15/2019 | 2,900 | 3,229 | ||||||
5.375%, 03/15/2020 | 2,140 | 2,325 | ||||||
4.800%, 07/08/2044 | 2,850 | 2,958 | ||||||
2.634%, 10/28/2027 (C) | 2,595 | 2,619 | ||||||
Goldman Sachs Group | ||||||||
6.345%, 02/15/2034 | 2,555 | 2,981 | ||||||
6.250%, 02/01/2041 | 3,150 | 3,873 | ||||||
6.150%, 04/01/2018 | 980 | 1,033 | ||||||
5.950%, 01/18/2018 | 1,465 | 1,531 | ||||||
5.150%, 05/22/2045 | 2,140 | 2,204 | ||||||
4.750%, 10/21/2045 | 1,740 | 1,818 | ||||||
3.500%, 01/23/2025 | 1,700 | 1,693 | ||||||
3.500%, 11/16/2026 | 6,048 | 5,943 | ||||||
2.625%, 04/25/2021 | 2,445 | 2,431 | ||||||
2.600%, 04/23/2020 | 2,160 | 2,163 | ||||||
HSBC Bank PLC | ||||||||
7.650%, 05/01/2025 | 2,515 | 3,053 | ||||||
HSBC Bank USA | ||||||||
5.875%, 11/01/2034 | 1,990 | 2,287 | ||||||
4.875%, 08/24/2020 | 2,745 | 2,918 | ||||||
HSBC Finance | ||||||||
6.676%, 01/15/2021 | 410 | 461 | ||||||
HSBC Holdings | ||||||||
4.375%, 11/23/2026 | 2,630 | 2,619 | ||||||
2.650%, 01/05/2022 | 2,425 | 2,364 | ||||||
Huntington National Bank | ||||||||
2.200%, 11/06/2018 | 2,225 | 2,232 | ||||||
1.700%, 02/26/2018 | 2,750 | 2,751 | ||||||
Hyundai Capital America MTN | ||||||||
2.000%, 07/01/2019 (A) | 600 | 595 | ||||||
Infinity Property & Casualty | ||||||||
5.000%, 09/19/2022 | 2,075 | 2,133 | ||||||
| Description | Face Amount ($ Thousands) | Market Value ($ Thousands) | ||||||
Intercontinental Exchange | ||||||||
2.750%, 12/01/2020 | $ | 4,350 | $ | 4,387 | ||||
JPMorgan Chase MTN | ||||||||
2.295%, 08/15/2021 | 6,955 | 6,829 | ||||||
JPMorgan Chase | ||||||||
6.400%, 05/15/2038 | 3,440 | 4,411 | ||||||
6.000%, 10/01/2017 | 6,610 | 6,848 | ||||||
6.000%, 01/15/2018 | 3,929 | 4,112 | ||||||
4.950%, 06/01/2045 | 2,200 | 2,333 | ||||||
4.625%, 05/10/2021 | 675 | 727 | ||||||
4.500%, 01/24/2022 | 4,741 | 5,113 | ||||||
3.875%, 09/10/2024 | 3,140 | 3,177 | ||||||
3.625%, 12/01/2027 | 1,480 | 1,441 | ||||||
3.250%, 09/23/2022 | 2,855 | 2,888 | ||||||
3.200%, 06/15/2026 | 2,710 | 2,640 | ||||||
2.700%, 05/18/2023 | 2,860 | 2,787 | ||||||
KeyBank | ||||||||
2.350%, 03/08/2019 | 2,970 | 2,995 | ||||||
1.700%, 06/01/2018 | 2,120 | 2,122 | ||||||
KFW MTN | ||||||||
1.500%, 04/20/2020 | 2,925 | 2,898 | ||||||
KFW | ||||||||
2.125%, 01/17/2023 | 2,810 | 2,782 | ||||||
1.000%, 09/07/2018 | 2,725 | 2,710 | ||||||
KKR Group Finance III | ||||||||
5.125%, 06/01/2044 (A) | 6,541 | 6,143 | ||||||
Macquarie Group MTN | ||||||||
4.875%, 08/10/2017 (A) | 2,890 | 2,952 | ||||||
MetLife | ||||||||
10.750%, 08/01/2039 | 880 | 1,373 | ||||||
4.050%, 03/01/2045 | 1,370 | 1,308 | ||||||
3.000%, 03/01/2025 | 2,500 | 2,483 | ||||||
Metropolitan Life Global Funding I | ||||||||
2.300%, 04/10/2019 (A) | 3,500 | 3,517 | ||||||
Mitsubishi UFJ Trust & Banking | ||||||||
1.600%, 10/16/2017 (A) | 3,500 | 3,497 | ||||||
Morgan Stanley | ||||||||
2.800%, 06/16/2020 | 1,205 | 1,215 | ||||||
2.650%, 01/27/2020 | 2,900 | 2,918 | ||||||
Morgan Stanley MTN | ||||||||
7.300%, 05/13/2019 | 1,905 | 2,128 | ||||||
6.375%, 07/24/2042 | 1,975 | 2,533 | ||||||
5.625%, 09/23/2019 | 970 | 1,054 | ||||||
4.350%, 09/08/2026 | 260 | 266 | ||||||
4.300%, 01/27/2045 | 1,150 | 1,139 | ||||||
4.000%, 07/23/2025 | 2,230 | 2,284 | ||||||
3.875%, 01/27/2026 | 2,402 | 2,434 | ||||||
2.625%, 11/17/2021 | 2,620 | 2,591 | ||||||
2.500%, 04/21/2021 | 5,950 | 5,885 | ||||||
2.450%, 02/01/2019 | 2,990 | 3,013 | ||||||
2.282%, 10/24/2023 (C) | 4,015 | 4,025 | ||||||
| 206 | SEI Institutional Investments Trust / Semi-Annual Report / November 30, 2016 |
| Description | Face Amount ($ Thousands) | Market Value ($ Thousands) | ||||||
MUFG Americas Holdings | ||||||||
3.000%, 02/10/2025 | $ | 3,590 | $ | 3,463 | ||||
National Rural Utilities Cooperative Finance MTN | ||||||||
0.950%, 04/24/2017 | 2,855 | 2,854 | ||||||
National Rural Utilities Cooperative Finance | ||||||||
4.750%, 04/30/2043 (C) | 2,056 | 2,077 | ||||||
4.023%, 11/01/2032 | 3,230 | 3,301 | ||||||
Nationwide Building Society | ||||||||
4.000%, 09/14/2026 (A) | 2,070 | 1,936 | ||||||
New York Life Global Funding MTN | ||||||||
2.000%, 04/13/2021 (A) | 5,000 | 4,920 | ||||||
New York Life Global Funding | ||||||||
1.950%, 02/11/2020 (A) | 3,500 | 3,469 | ||||||
Nordea Bank MTN | ||||||||
1.625%, 05/15/2018 (A) | 2,460 | 2,455 | ||||||
Pacific Life Insurance | ||||||||
9.250%, 06/15/2039 (A) | 1,215 | 1,772 | ||||||
PNC Bank | ||||||||
3.300%, 10/30/2024 | 1,840 | 1,853 | ||||||
2.250%, 07/02/2019 | 945 | 952 | ||||||
1.950%, 03/04/2019 | 2,030 | 2,035 | ||||||
PNC Bank MTN | ||||||||
2.150%, 04/29/2021 | 4,880 | 4,826 | ||||||
1.600%, 06/01/2018 | 3,810 | 3,805 | ||||||
Pricoa Global Funding I | ||||||||
2.200%, 06/03/2021 (A) | 2,925 | 2,876 | ||||||
Principal Life Global Funding II | ||||||||
2.375%, 11/21/2021 (A) | 3,000 | 2,971 | ||||||
Prudential Financial MTN | ||||||||
5.700%, 12/14/2036 | 1,660 | 1,915 | ||||||
Royal Bank of Canada MTN | ||||||||
2.500%, 01/19/2021 | 2,165 | 2,178 | ||||||
Royal Bank of Scotland Group | ||||||||
3.875%, 09/12/2023 | 2,500 | 2,363 | ||||||
S&P Global | ||||||||
3.300%, 08/14/2020 | 2,543 | 2,595 | ||||||
SunTrust Banks | ||||||||
2.900%, 03/03/2021 | 1,715 | 1,739 | ||||||
Teachers Insurance & Annuity Association of America | ||||||||
6.850%, 12/16/2039 (A) | 115 | 147 | ||||||
4.900%, 09/15/2044 (A) | 1,605 | 1,714 | ||||||
TIAA Asset Management Finance LLC | ||||||||
2.950%, 11/01/2019 (A) | 2,810 | 2,862 | ||||||
Toronto-Dominion Bank MTN | ||||||||
2.625%, 09/10/2018 | 3,500 | 3,557 | ||||||
Toronto-Dominion Bank | ||||||||
3.625%, 09/15/2031 (C) | 5,660 | 5,447 | ||||||
Travelers | ||||||||
3.750%, 05/15/2046 | 2,965 | 2,792 | ||||||
| Description | Face Amount ($ Thousands) | Market Value ($ Thousands) | ||||||
UBS MTN | ||||||||
1.800%, 03/26/2018 | $ | 3,500 | $ | 3,501 | ||||
1.375%, 08/14/2017 | 1,810 | 1,810 | ||||||
US Bancorp MTN | ||||||||
2.950%, 07/15/2022 | 2,110 | 2,128 | ||||||
US Bank | ||||||||
2.125%, 10/28/2019 | 2,305 | 2,320 | ||||||
USF&G Capital III | ||||||||
8.312%, 07/01/2046 (A) | 585 | 742 | ||||||
Validus Holdings | ||||||||
8.875%, 01/26/2040 | 1,370 | 1,789 | ||||||
Visa | ||||||||
2.800%, 12/14/2022 | 2,285 | 2,302 | ||||||
2.200%, 12/14/2020 | 2,110 | 2,112 | ||||||
WEA Finance LLC | ||||||||
3.750%, 09/17/2024 (A) | 3,382 | 3,426 | ||||||
Wells Fargo MTN | ||||||||
4.900%, 11/17/2045 | 1,180 | 1,220 | ||||||
4.400%, 06/14/2046 | 3,865 | 3,724 | ||||||
4.300%, 07/22/2027 | 1,870 | 1,933 | ||||||
2.150%, 01/30/2020 | 5,665 | 5,629 | ||||||
Wells Fargo | ||||||||
3.900%, 05/01/2045 | 410 | 385 | ||||||
3.000%, 04/22/2026 | 2,672 | 2,564 | ||||||
3.000%, 10/23/2026 | 3,500 | 3,349 | ||||||
2.500%, 03/04/2021 | 2,745 | 2,737 | ||||||
2.150%, 01/15/2019 | 8,776 | 8,821 | ||||||
Westpac Banking | ||||||||
4.625%, 06/01/2018 | 3,466 | 3,592 | ||||||
ZFS Finance USA Trust I | ||||||||
6.500%, 05/09/2037 (A) (C) | 1,945 | 1,963 | ||||||
|
| |||||||
| 432,906 | ||||||||
|
| |||||||
Health Care — 7.6% | ||||||||
Abbott Laboratories | ||||||||
3.750%, 11/30/2026 | 2,295 | 2,269 | ||||||
2.900%, 11/30/2021 | 2,555 | 2,544 | ||||||
AbbVie | ||||||||
2.500%, 05/14/2020 | 1,000 | 998 | ||||||
Aetna | ||||||||
4.375%, 06/15/2046 | 60 | 59 | ||||||
4.250%, 06/15/2036 | 835 | 829 | ||||||
3.200%, 06/15/2026 | 519 | 508 | ||||||
2.750%, 11/15/2022 | 2,945 | 2,913 | ||||||
2.400%, 06/15/2021 | 2,905 | 2,882 | ||||||
1.900%, 06/07/2019 | 2,595 | 2,583 | ||||||
AmerisourceBergen | ||||||||
1.150%, 05/15/2017 | 1,075 | 1,075 | ||||||
Amgen | ||||||||
4.400%, 05/01/2045 | 280 | 267 | ||||||
Anthem | ||||||||
3.300%, 01/15/2023 | 670 | 669 | ||||||
| SEI Institutional Investments Trust / Semi-Annual Report / November 30, 2016 | 207 |
SCHEDULE OF INVESTMENTS (Unaudited)
Intermediate Duration Credit Fund (Continued)
November 30, 2016
| Description | Face Amount ($ Thousands) | Market Value ($ Thousands) | ||||||
AstraZeneca | ||||||||
6.450%, 09/15/2037 | $ | 1,070 | $ | 1,380 | ||||
2.375%, 11/16/2020 | 2,170 | 2,162 | ||||||
Coventry Health Care | ||||||||
5.950%, 03/15/2017 | 6,155 | 6,237 | ||||||
5.450%, 06/15/2021 | 1,480 | 1,636 | ||||||
Dignity Health | ||||||||
2.637%, 11/01/2019 | 4,364 | 4,400 | ||||||
Express Scripts Holding | ||||||||
4.800%, 07/15/2046 | 280 | 268 | ||||||
Gilead Sciences | ||||||||
4.750%, 03/01/2046 | 2,065 | 2,122 | ||||||
4.150%, 03/01/2047 | 920 | 862 | ||||||
4.000%, 09/01/2036 | 2,620 | 2,504 | ||||||
3.250%, 09/01/2022 | 2,225 | 2,275 | ||||||
2.950%, 03/01/2027 | 2,285 | 2,169 | ||||||
2.550%, 09/01/2020 | 6,070 | 6,113 | ||||||
2.050%, 04/01/2019 | 4,100 | 4,115 | ||||||
Johnson & Johnson | ||||||||
5.550%, 08/15/2017 | 1,759 | 1,816 | ||||||
Medtronic | ||||||||
4.625%, 03/15/2045 | 1,164 | 1,235 | ||||||
4.375%, 03/15/2035 | 3,576 | 3,710 | ||||||
3.150%, 03/15/2022 | 2,285 | 2,347 | ||||||
2.500%, 03/15/2020 | 7,695 | 7,770 | ||||||
1.500%, 03/15/2018 | 2,900 | 2,901 | ||||||
Merck | ||||||||
2.750%, 02/10/2025 | 730 | 717 | ||||||
2.350%, 02/10/2022 | 2,715 | 2,702 | ||||||
1.850%, 02/10/2020 | 2,865 | 2,862 | ||||||
Mylan | ||||||||
5.250%, 06/15/2046 (A) | 1,375 | 1,270 | ||||||
3.950%, 06/15/2026 | 1,815 | 1,705 | ||||||
New York and Presbyterian Hospital | ||||||||
4.763%, 08/01/2116 | 2,350 | 2,216 | ||||||
Perrigo | ||||||||
5.300%, 11/15/2043 | 1,060 | 1,019 | ||||||
4.000%, 11/15/2023 | 1,380 | 1,376 | ||||||
Pfizer | ||||||||
3.000%, 12/15/2026 | 4,170 | 4,111 | ||||||
Pharmacia | ||||||||
6.600%, 12/01/2028 | 1,000 | 1,285 | ||||||
Stryker | ||||||||
2.000%, 03/08/2019 | 2,595 | 2,600 | ||||||
Teva Pharmaceutical Finance Netherlands III | ||||||||
2.800%, 07/21/2023 | 2,200 | 2,073 | ||||||
2.200%, 07/21/2021 | 2,280 | 2,190 | ||||||
UnitedHealth Group | ||||||||
4.700%, 02/15/2021 | 4,150 | 4,511 | ||||||
4.625%, 07/15/2035 | 695 | 749 | ||||||
| Description | Face Amount ($ Thousands) | Market Value ($ Thousands) | ||||||
1.400%, 12/15/2017 | $ | 4,205 | $ | 4,207 | ||||
|
| |||||||
| 109,211 | ||||||||
|
| |||||||
Industrials — 9.1% | ||||||||
3M MTN | ||||||||
3.125%, 09/19/2046 | 2,050 | 1,793 | ||||||
American Airlines, Pass-Through Trust, Ser 2013-2, Cl A | ||||||||
4.950%, 01/15/2023 | 4,155 | 4,451 | ||||||
American Airlines, Pass-Through Trust, Ser 2014-1, Cl A | ||||||||
4.375%, 10/01/2022 | 1,520 | 1,512 | ||||||
American Airlines, Pass-Through Trust, Ser 2016-2, Cl AA | ||||||||
3.200%, 06/15/2028 | 2,335 | 2,306 | ||||||
American Airlines, Pass-Through Trust, Ser 2016-2, Cl A | ||||||||
3.650%, 06/15/2028 | 1,700 | 1,697 | ||||||
BAE Systems | ||||||||
5.800%, 10/11/2041 (A) | 3,940 | 4,459 | ||||||
Boeing | ||||||||
2.500%, 03/01/2025 | 1,440 | 1,397 | ||||||
1.875%, 06/15/2023 | 3,885 | 3,713 | ||||||
Burlington Northern Santa Fe | ||||||||
6.150%, 05/01/2037 | 1,550 | 1,969 | ||||||
Burlington Northern Santa Fe LLC | ||||||||
5.650%, 05/01/2017 | 1,700 | 1,731 | ||||||
4.550%, 09/01/2044 | 2,955 | 3,109 | ||||||
Caterpillar | ||||||||
4.750%, 05/15/2064 | 640 | 673 | ||||||
3.803%, 08/15/2042 | 1,060 | 1,024 | ||||||
3.400%, 05/15/2024 | 3,050 | 3,149 | ||||||
Continental Airlines, Pass-Through Trust, Ser 2012-2, Cl A | ||||||||
4.000%, 10/29/2024 | 4,132 | 4,276 | ||||||
Delta Air Lines, Pass-Through Trust, | ||||||||
4.750%, 05/07/2020 | 3,568 | 3,783 | ||||||
Delta Air Lines, Pass-Through Trust, | ||||||||
3.875%, 07/30/2027 | 1,506 | 1,552 | ||||||
Fortive | ||||||||
2.350%, 06/15/2021 (A) | 1,405 | 1,381 | ||||||
GE Capital International Funding Unlimited | ||||||||
4.418%, 11/15/2035 | 6,621 | 6,892 | ||||||
2.342%, 11/15/2020 | 7,076 | 7,074 | ||||||
General Dynamics | ||||||||
1.875%, 08/15/2023 | 2,250 | 2,144 | ||||||
General Electric | ||||||||
5.250%, 12/06/2017 | 2,920 | 3,039 | ||||||
5.000%, 12/29/2049 (C) | 1,988 | 2,030 | ||||||
4.500%, 03/11/2044 | 3,245 | 3,418 | ||||||
| 208 | SEI Institutional Investments Trust / Semi-Annual Report / November 30, 2016 |
| Description | Face Amount ($ Thousands) | Market Value ($ Thousands) | ||||||
4.125%, 10/09/2042 | $ | 1,720 | $ | 1,720 | ||||
Harris | ||||||||
1.999%, 04/27/2018 | 885 | 887 | ||||||
Illinois Tool Works | ||||||||
2.650%, 11/15/2026 | 5,993 | 5,754 | ||||||
John Deere Capital MTN | ||||||||
2.800%, 03/04/2021 | 5,915 | 5,988 | ||||||
2.450%, 09/11/2020 | 2,431 | 2,434 | ||||||
John Deere Capital | ||||||||
2.550%, 01/08/2021 | 2,500 | 2,518 | ||||||
Norfolk Southern | ||||||||
6.000%, 05/23/2111 | 4,499 | 4,875 | ||||||
PACCAR Financial MTN | ||||||||
2.200%, 09/15/2019 | 4,000 | 4,031 | ||||||
1.650%, 08/11/2021 | 1,200 | 1,158 | ||||||
1.600%, 03/15/2017 | 164 | 164 | ||||||
1.200%, 08/12/2019 | 1,425 | 1,401 | ||||||
1.100%, 06/06/2017 | 3,680 | 3,679 | ||||||
Raytheon | ||||||||
7.200%, 08/15/2027 | 1,005 | 1,332 | ||||||
2.500%, 12/15/2022 | 4,305 | 4,294 | ||||||
Siemens Financieringsmaatschappij | ||||||||
4.400%, 05/27/2045 (A) | 2,000 | 2,089 | ||||||
2.900%, 05/27/2022 (A) | 2,105 | 2,131 | ||||||
1.700%, 09/15/2021 (A) | 2,945 | 2,836 | ||||||
Southwest Airlines | ||||||||
2.650%, 11/05/2020 | 1,545 | 1,549 | ||||||
Southwest Airlines, Pass-Through Trust, Ser 2007-1 | ||||||||
6.150%, 08/01/2022 | 747 | 830 | ||||||
Tyco International Finance | ||||||||
5.125%, 09/14/2045 | 650 | 695 | ||||||
Union Pacific | ||||||||
4.050%, 03/01/2046 | 3,070 | 3,054 | ||||||
Union Pacific Railroad 2006 Pass-Through Trust | ||||||||
5.866%, 07/02/2030 | 1,758 | 1,984 | ||||||
United Technologies | ||||||||
4.500%, 06/01/2042 | 2,315 | 2,451 | ||||||
3.750%, 11/01/2046 | 1,540 | 1,445 | ||||||
3.100%, 06/01/2022 | 2,650 | 2,720 | ||||||
|
| |||||||
| 130,591 | ||||||||
|
| |||||||
Information Technology — 4.9% | ||||||||
Alibaba Group Holding | ||||||||
1.625%, 11/28/2017 | 1,183 | 1,180 | ||||||
Apple | ||||||||
4.650%, 02/23/2046 | 2,145 | 2,270 | ||||||
4.500%, 02/23/2036 | 1,785 | 1,898 | ||||||
3.850%, 08/04/2046 | 1,820 | 1,703 | ||||||
3.250%, 02/23/2026 | 1,660 | 1,670 | ||||||
2.850%, 05/06/2021 | 2,082 | 2,128 | ||||||
| Description | Face Amount ($ Thousands) | Market Value ($ Thousands) | ||||||
2.450%, 08/04/2026 | $ | 1,055 | $ | 992 | ||||
1.550%, 02/07/2020 | 4,000 | 3,960 | ||||||
Applied Materials | ||||||||
2.625%, 10/01/2020 | 2,312 | 2,336 | ||||||
Cisco Systems | ||||||||
2.200%, 02/28/2021 | 3,090 | 3,074 | ||||||
2.200%, 09/20/2023 | 3,035 | 2,917 | ||||||
1.850%, 09/20/2021 | 3,000 | 2,922 | ||||||
Diamond 1 Finance | ||||||||
8.350%, 07/15/2046 (A) | 1,915 | 2,246 | ||||||
6.020%, 06/15/2026 (A) | 1,735 | 1,825 | ||||||
Hewlett Packard Enterprise | ||||||||
6.450%, 10/15/2035 (A) | 2,085 | 2,031 | ||||||
Intel | ||||||||
4.900%, 07/29/2045 | 2,660 | 2,962 | ||||||
Mastercard | ||||||||
2.950%, 11/21/2026 | 1,530 | 1,514 | ||||||
Microsoft | ||||||||
3.700%, 08/08/2046 | 2,456 | 2,286 | ||||||
3.500%, 02/12/2035 | 965 | 924 | ||||||
3.450%, 08/08/2036 | 790 | 746 | ||||||
2.700%, 02/12/2025 | 2,550 | 2,504 | ||||||
2.400%, 08/08/2026 | 6,535 | 6,205 | ||||||
2.000%, 08/08/2023 | 3,645 | 3,473 | ||||||
Oracle | ||||||||
6.125%, 07/08/2039 | 1,000 | 1,249 | ||||||
4.300%, 07/08/2034 | 2,495 | 2,567 | ||||||
4.000%, 07/15/2046 | 750 | 711 | ||||||
2.650%, 07/15/2026 | 1,375 | 1,305 | ||||||
2.400%, 09/15/2023 | 2,880 | 2,782 | ||||||
2.250%, 10/08/2019 | 4,630 | 4,685 | ||||||
1.900%, 09/15/2021 | 2,260 | 2,209 | ||||||
Seagate HDD Cayman | ||||||||
4.750%, 06/01/2023 | 970 | 942 | ||||||
|
| |||||||
| 70,216 | ||||||||
|
| |||||||
Materials — 1.0% | ||||||||
Albemarle | ||||||||
4.150%, 12/01/2024 | 1,830 | 1,883 | ||||||
3.000%, 12/01/2019 | 250 | 255 | ||||||
Barrick Gold | ||||||||
5.250%, 04/01/2042 | 1,290 | 1,297 | ||||||
Barrick North America Finance LLC | ||||||||
5.750%, 05/01/2043 | 1,760 | 1,873 | ||||||
BHP Billiton Finance USA | ||||||||
6.750%, 10/19/2075 (A) (C) | 680 | 750 | ||||||
Georgia-Pacific LLC | ||||||||
8.875%, 05/15/2031 | 1,506 | 2,254 | ||||||
LyondellBasell Industries | ||||||||
4.625%, 02/26/2055 | 1,905 | 1,718 | ||||||
Nacional del Cobre de Chile | ||||||||
4.500%, 09/16/2025 (A) | 920 | 925 | ||||||
| SEI Institutional Investments Trust / Semi-Annual Report / November 30, 2016 | 209 |
SCHEDULE OF INVESTMENTS (Unaudited)
Intermediate Duration Credit Fund (Continued)
November 30, 2016
| Description | Face Amount ($ Thousands) | Market Value ($ Thousands) | ||||||
Praxair | ||||||||
3.200%, 01/30/2026 | $ | 1,525 | $ | 1,540 | ||||
Yara International | ||||||||
3.800%, 06/06/2026 (A) | 2,230 | 2,208 | ||||||
|
| |||||||
| 14,703 | ||||||||
|
| |||||||
Real Estate — 2.2% | ||||||||
American Tower Trust I | ||||||||
3.070%, 03/15/2023 (A) | 4,330 | 4,275 | ||||||
Crown Castle Towers LLC | ||||||||
6.113%, 01/15/2020 (A) | 4,235 | 4,649 | ||||||
3.222%, 05/15/2022 (A) | 2,230 | 2,247 | ||||||
Federal Realty Investment Trust | ||||||||
3.625%, 08/01/2046 | 1,650 | 1,442 | ||||||
Kimco Realty | ||||||||
2.700%, 03/01/2024 | 1,850 | 1,771 | ||||||
Simon Property Group | ||||||||
6.750%, 02/01/2040 | 470 | 629 | ||||||
4.375%, 03/01/2021 | 2,300 | 2,465 | ||||||
4.250%, 11/30/2046 | 1,864 | 1,829 | ||||||
2.500%, 07/15/2021 | 2,215 | 2,215 | ||||||
2.200%, 02/01/2019 | 6,565 | 6,618 | ||||||
Ventas Realty | ||||||||
3.125%, 06/15/2023 | 1,320 | 1,295 | ||||||
WP Carey | ||||||||
4.600%, 04/01/2024 | 2,670 | 2,691 | ||||||
|
| |||||||
| 32,126 | ||||||||
|
| |||||||
Telecommunication Services — 2.6% | ||||||||
America Movil | ||||||||
6.125%, 03/30/2040 | 965 | 1,089 | ||||||
3.125%, 07/16/2022 | 6,135 | 6,015 | ||||||
AT&T | ||||||||
4.550%, 03/09/2049 (A) | 984 | 879 | ||||||
3.465%, 11/27/2022 (A) (B) | 8,000 | 6,370 | ||||||
SES | ||||||||
3.600%, 04/04/2023 (A) | 5,399 | 5,340 | ||||||
SES Global Americas Holdings | ||||||||
5.300%, 03/25/2044 (A) | 1,750 | 1,505 | ||||||
Sprint Spectrum LLC | ||||||||
3.360%, 09/20/2021 (A) | 6,201 | 6,216 | ||||||
Telefonos de Mexico | ||||||||
5.500%, 11/15/2019 | 2,715 | 2,956 | ||||||
Verizon Communications | ||||||||
5.150%, 09/15/2023 | 1,160 | 1,285 | ||||||
5.012%, 08/21/2054 | 1,342 | 1,328 | ||||||
4.862%, 08/21/2046 | 793 | 795 | ||||||
4.672%, 03/15/2055 | 950 | 886 | ||||||
4.522%, 09/15/2048 | 2,629 | 2,507 | ||||||
|
| |||||||
| 37,171 | ||||||||
|
| |||||||
| Description | Face Amount ($ Thousands) | Market Value ($ Thousands) | ||||||
Utilities — 10.1% | ||||||||
Ameren Illinois | ||||||||
6.125%, 11/15/2017 | $ | 1,450 | $ | 1,515 | ||||
2.700%, 09/01/2022 | 2,000 | 2,012 | ||||||
Berkshire Hathaway Energy | ||||||||
2.000%, 11/15/2018 | 4,470 | 4,496 | ||||||
CenterPoint Energy Houston Electric | ||||||||
4.500%, 04/01/2044 | 2,215 | 2,390 | ||||||
Commonwealth Edison | ||||||||
4.000%, 08/01/2020 | 35 | 37 | ||||||
Connecticut Light & Power | ||||||||
5.650%, 05/01/2018 | 2,775 | 2,940 | ||||||
Dominion Resources | ||||||||
5.250%, 08/01/2033 | 3,531 | 3,764 | ||||||
1.600%, 08/15/2019 | 1,875 | 1,851 | ||||||
Duke Energy Carolinas LLC | ||||||||
5.300%, 02/15/2040 | 1,700 | 1,979 | ||||||
3.900%, 06/15/2021 | 190 | 202 | ||||||
Duke Energy Florida LLC | ||||||||
3.100%, 08/15/2021 | 4,530 | 4,662 | ||||||
Duke Energy Indiana LLC | ||||||||
6.350%, 08/15/2038 | 270 | 348 | ||||||
4.900%, 07/15/2043 | 210 | 233 | ||||||
Duke Energy Progress LLC | ||||||||
4.200%, 08/15/2045 | 2,995 | 3,000 | ||||||
4.100%, 05/15/2042 | 744 | 733 | ||||||
3.000%, 09/15/2021 | 3,745 | 3,854 | ||||||
2.800%, 05/15/2022 | 4,400 | 4,463 | ||||||
Edison International | ||||||||
2.950%, 03/15/2023 | 1,655 | 1,648 | ||||||
Electricite de France | ||||||||
4.950%, 10/13/2045 (A) | 1,615 | 1,624 | ||||||
4.750%, 10/13/2035 (A) | 720 | 725 | ||||||
2.150%, 01/22/2019 (A) | 4,000 | 4,015 | ||||||
Emera US Finance | ||||||||
4.750%, 06/15/2046 (A) | 945 | 929 | ||||||
Entergy Mississippi | ||||||||
2.850%, 06/01/2028 | 2,745 | 2,617 | ||||||
Exelon | ||||||||
3.950%, 06/15/2025 | 1,846 | 1,894 | ||||||
Florida Power & Light | ||||||||
5.960%, 04/01/2039 | 120 | 153 | ||||||
5.690%, 03/01/2040 | 1,621 | 2,019 | ||||||
5.125%, 06/01/2041 | 187 | 217 | ||||||
4.125%, 02/01/2042 | 2,540 | 2,614 | ||||||
Georgia Power | ||||||||
4.300%, 03/15/2043 | 3,455 | 3,498 | ||||||
1.950%, 12/01/2018 | 6,179 | 6,215 | ||||||
Great Plains Energy | ||||||||
5.292%, 06/15/2022 (D) | 1,090 | 1,179 | ||||||
Indianapolis Power & Light | ||||||||
4.700%, 09/01/2045 (A) | 2,420 | 2,542 | ||||||
| 210 | SEI Institutional Investments Trust / Semi-Annual Report / November 30, 2016 |
| Description | Face Amount ($ Thousands) | Market Value ($ Thousands) | ||||||
Kansas City Power & Light | ||||||||
7.150%, 04/01/2019 | $ | 3,880 | $ | 4,322 | ||||
Kentucky Utilities | ||||||||
5.125%, 11/01/2040 | 250 | 286 | ||||||
MidAmerican Energy | ||||||||
2.400%, 03/15/2019 | 2,420 | 2,453 | ||||||
Monongahela Power | ||||||||
4.100%, 04/15/2024 (A) | 2,190 | 2,292 | ||||||
NextEra Energy Capital Holdings | ||||||||
1.586%, 06/01/2017 | 890 | 891 | ||||||
Niagara Mohawk Power | ||||||||
4.278%, 10/01/2034 (A) | 1,959 | 2,002 | ||||||
Northern States Power | ||||||||
7.125%, 07/01/2025 | 3,220 | 4,174 | ||||||
Oglethorpe Power | ||||||||
5.375%, 11/01/2040 | 1,420 | 1,565 | ||||||
4.250%, 04/01/2046 | 1,015 | 967 | ||||||
4.200%, 12/01/2042 | 150 | 144 | ||||||
Oncor Electric Delivery LLC | ||||||||
5.300%, 06/01/2042 | 2,505 | 2,936 | ||||||
3.750%, 04/01/2045 (A) | 2,510 | 2,391 | ||||||
Pacific Gas & Electric | ||||||||
5.800%, 03/01/2037 | 2,226 | 2,688 | ||||||
3.750%, 02/15/2024 | 1,985 | 2,074 | ||||||
PacifiCorp | ||||||||
6.000%, 01/15/2039 | 3,815 | 4,851 | ||||||
2.950%, 06/01/2023 | 3,930 | 3,967 | ||||||
PECO Energy | ||||||||
4.800%, 10/15/2043 | 2,925 | 3,222 | ||||||
1.700%, 09/15/2021 | 900 | 875 | ||||||
Public Service Electric & Gas MTN | ||||||||
1.800%, 06/01/2019 | 4,198 | 4,185 | ||||||
Public Service of Colorado | ||||||||
6.250%, 09/01/2037 | 190 | 244 | ||||||
Public Service of Oklahoma | ||||||||
6.625%, 11/15/2037 | 900 | 1,131 | ||||||
San Diego Gas & Electric | ||||||||
3.600%, 09/01/2023 | 1,224 | 1,285 | ||||||
3.000%, 08/15/2021 | 2,470 | 2,539 | ||||||
South Carolina Electric & Gas | ||||||||
6.050%, 01/15/2038 | 930 | 1,142 | ||||||
5.450%, 02/01/2041 | 2,980 | 3,378 | ||||||
Southern California Edison | ||||||||
3.875%, 06/01/2021 | 4,895 | 5,206 | ||||||
1.845%, 02/01/2022 | 4,294 | 4,225 | ||||||
Southern California Gas | ||||||||
3.750%, 09/15/2042 | 155 | 151 | ||||||
Union Electric | ||||||||
6.700%, 02/01/2019 | 5,035 | 5,538 | ||||||
Virginia Electric & Power | ||||||||
4.000%, 11/15/2046 | 1,175 | 1,167 | ||||||
2.950%, 11/15/2026 | 435 | 425 | ||||||
| Description | Face Amount ($ Thousands) | Market Value ($ Thousands) | ||||||
Xcel Energy | ||||||||
3.350%, 12/01/2026 | $ | 1,200 | $ | 1,199 | ||||
|
| |||||||
| 144,283 | ||||||||
|
| |||||||
Total Corporate Obligations | 1,283,701 | |||||||
|
| |||||||
U.S. TREASURY OBLIGATIONS — 3.1% |
| |||||||
U.S. Treasury Bonds | ||||||||
2.250%, 08/15/2046 (E) | 21,360 | 18,076 | ||||||
U.S. Treasury Notes | ||||||||
2.000%, 11/15/2026 | 5,967 | 5,773 | ||||||
1.750%, 11/30/2021 | 320 | 319 | ||||||
1.625%, 10/31/2023 | 3,650 | 3,523 | ||||||
1.250%, 10/31/2021 | 10,505 | 10,204 | ||||||
1.000%, 11/15/2019 | 5,775 | 5,709 | ||||||
0.750%, 10/31/2018 | 1,290 | 1,281 | ||||||
|
| |||||||
Total U.S. Treasury Obligations | 44,885 | |||||||
|
| |||||||
MUNICIPAL BONDS — 3.1% | ||||||||
California — 1.0% | ||||||||
Bay Area, Toll Authority, Build America Project, RB | ||||||||
6.263%, 04/01/2049 | 1,760 | 2,392 | ||||||
Bay Area, Toll Authority, Build America Project, Ser S1-SUB, RB | ||||||||
6.793%, 04/01/2030 | 1,222 | 1,516 | ||||||
California State, Build America Project, GO | ||||||||
7.550%, 04/01/2039 | 2,985 | 4,436 | ||||||
Los Angeles, Community College District, Build America Project, GO | ||||||||
6.750%, 08/01/2049 | 500 | 719 | ||||||
Los Angeles, Unified School District, Build America Project, Ser RY, GO | ||||||||
6.758%, 07/01/2034 | 2,070 | 2,812 | ||||||
Regents of the University of California Medical Center Pooled Revenue, Build America Project, Ser H, RB | ||||||||
6.548%, 05/15/2048 | 120 | 158 | ||||||
University of California, Build America Project, RB | ||||||||
5.770%, 05/15/2043 | 1,350 | 1,652 | ||||||
|
| |||||||
| 13,685 | ||||||||
|
| |||||||
Florida — 0.1% | ||||||||
Florida State, Board of Administration Finance, Ser A, RB | ||||||||
2.638%, 07/01/2021 | 1,905 | 1,920 | ||||||
|
| |||||||
| SEI Institutional Investments Trust / Semi-Annual Report / November 30, 2016 | 211 |
SCHEDULE OF INVESTMENTS (Unaudited)
Intermediate Duration Credit Fund (Concluded)
November 30, 2016
| Description | Face Amount ($ Thousands) | Market Value ($ Thousands) | ||||||
Georgia — 0.7% | ||||||||
Municipal Electric Authority of Georgia, Build America Project, RB | ||||||||
7.055%, 04/01/2057 | $ | 3,512 | $ | 4,010 | ||||
6.637%, 04/01/2057 | 4,414 | 5,493 | ||||||
|
| |||||||
| 9,503 | ||||||||
|
| |||||||
Illinois — 0.1% | ||||||||
Illinois State, GO | ||||||||
5.100%, 06/01/2033 | 1,700 | 1,526 | ||||||
|
| |||||||
Kansas — 0.3% | ||||||||
Kansas State, Development Finance Authority, Ser H, RB | ||||||||
4.727%, 04/15/2037 | 3,860 | 4,002 | ||||||
|
| |||||||
Kentucky — 0.1% | ||||||||
Kentucky State, Asset/Liability Commission, RB | ||||||||
3.165%, 04/01/2018 | 1,141 | 1,156 | ||||||
|
| |||||||
Massachusetts — 0.0% | ||||||||
Commonwealth of Massachusetts, Build America Project, GO | ||||||||
4.910%, 05/01/2029 | 100 | 116 | ||||||
Commonwealth of Massachusetts, Build America Project, RB | ||||||||
5.731%, 06/01/2040 | 80 | 103 | ||||||
|
| |||||||
| 219 | ||||||||
|
| |||||||
New Jersey — 0.5% | ||||||||
New Jersey State, Economic Development Authority, | ||||||||
3.041%, 02/15/2020 (B) | 4,500 | 4,066 | ||||||
New Jersey State, State Turnpike Authority, Build America Project, RB | ||||||||
7.102%, 01/01/2041 | 2,500 | 3,516 | ||||||
|
| |||||||
| 7,582 | ||||||||
|
| |||||||
New York — 0.1% | ||||||||
New York City, Build America Project, GO | ||||||||
6.271%, 12/01/2037 | 200 | 263 | ||||||
Port Authority of New York & | ||||||||
4.458%, 10/01/2062 | 620 | 629 | ||||||
Port Authority of New York & | ||||||||
4.960%, 08/01/2046 | 155 | 174 | ||||||
|
| |||||||
| 1,066 | ||||||||
|
| |||||||
North Carolina — 0.1% | ||||||||
University of North Carolina at Chapel Hill, Ser C, RB | ||||||||
3.327%, 12/01/2036 | 2,150 | 2,135 | ||||||
|
| |||||||
| Description | Face Amount ($ Thousands) | Market Value ($ Thousands) | ||||||
Texas — 0.1% | ||||||||
Grand Parkway Transportation, | ||||||||
5.184%, 10/01/2042 | $ | 530 | $ | 623 | ||||
North Texas, Tollway Authority, Build America Project, RB | ||||||||
6.718%, 01/01/2049 | 60 | 84 | ||||||
Texas State, Build America Project, GO | ||||||||
5.517%, 04/01/2039 | 540 | 688 | ||||||
|
| |||||||
| 1,395 | ||||||||
|
| |||||||
Total Municipal Bonds | 44,189 | |||||||
|
| |||||||
SOVEREIGN DEBT — 2.4% | ||||||||
Asian Development Bank MTN | ||||||||
1.500%, 01/22/2020 | 2,330 | 2,320 | ||||||
1.000%, 08/16/2019 | 2,290 | 2,254 | ||||||
European Investment Bank MTN | ||||||||
1.875%, 03/15/2019 | 5,590 | 5,635 | ||||||
1.375%, 06/15/2020 | 2,960 | 2,918 | ||||||
1.250%, 05/15/2019 | 6,030 | 5,977 | ||||||
Inter-American Development Bank MTN | ||||||||
1.750%, 10/15/2019 | 3,655 | 3,665 | ||||||
International Bank for Reconstruction & Development | ||||||||
1.375%, 04/10/2018 | 5,210 | 5,219 | ||||||
International Finance MTN | ||||||||
1.750%, 09/04/2018 | 3,860 | 3,890 | ||||||
Province of Quebec Canada MTN | ||||||||
6.350%, 01/30/2026 | 270 | 336 | ||||||
Qatar Government International Bond | ||||||||
4.625%, 06/02/2046 (A) | 1,995 | 1,983 | ||||||
Saudi Government International Bond MTN | ||||||||
4.500%, 10/26/2046 (A) | 550 | 530 | ||||||
|
| |||||||
Total Sovereign Debt | 34,727 | |||||||
|
| |||||||
Shares | ||||||||
CASH EQUIVALENT — 1.4% | ||||||||
SEI Daily Income Trust, Government Fund, Cl A | ||||||||
0.210%**† | 20,547,593 | 20,548 | ||||||
|
| |||||||
Total Cash Equivalent | 20,548 | |||||||
|
| |||||||
Total Investments — 99.4% | $ | 1,428,050 | ||||||
|
| |||||||
| 212 | SEI Institutional Investments Trust / Semi-Annual Report / November 30, 2016 |
A list of the open futures contracts held by the Fund at November 30, 2016, is as follows:
| Type of Contract | Number of Contracts Short | Expiration Date | Unrealized Appreciation ($ Thousands) | |||||||||
U.S. 10-Year Treasury Note | (225 | ) | Mar-2017 | $ | 101 | |||||||
U.S. Ultra Long Treasury Bond | (53 | ) | Mar-2017 | 40 | ||||||||
|
| |||||||||||
| $ | 141 | |||||||||||
|
| |||||||||||
For the period ended November 30, 2016, the total amount of all open futures contracts, as presented in the table above, are representative of the volume of activity for the derivative type during the year.
Percentages are based on Net Assets of $1,436,807 ($ Thousands).
| ** | Rate shown is the 7-day effective yield as of November 30, 2016. |
| † | Investment in Affiliated Security (see Note 6). |
| ‡‡ | Narrow industries are utilized for compliance purposes, whereas broad sectors are utilized for reporting. |
| (A) | Security exempt from registration under Rule 144A of the Securities Act of 1933. These securities may be resold in transactions exempt from registration normally to qualified institutions. On November 30, 2016, the value of these securities amounted to $192,804 ($ Thousands), representing 13.4% of the net assets of the Fund. |
| (B) | Zero coupon security. The rate shown on the schedule of investments represents the security’s effective yield at the time of purchase. |
| (C) | Variable Rate Security — The rate reported on the Schedule of Investments is the rate in effect as of November 30, 2016. |
| (D) | Step Bonds — The rate reflected on the Schedule of Investments is the effective yield on November 30, 2016. The coupon on a step bond changes on a specified date. |
| (E) | Security, or portion thereof, has been pledged as collateral on open futures contracts. |
AGM — Assured Guaranty Municipal
Cl — Class
DAC — Designated Activity Company
GO — General Obligation
LLC — Limited Liability Company
MTN — Medium Term Note
PLC — Public Limited Company
RB — Revenue Bond
S&P — Standard & Poor’s
Ser — Series
The following is a list of the level of inputs used as of November 30, 2016, in valuing the Fund’s investments and other financial instruments carried at value ($ Thousands):
| Investments in Securities | Level 1 | Level 2 | Level 3 | Total | ||||||||||||
Corporate Obligations | $ | — | $ | 1,283,701 | $ | — | $ | 1,283,701 | ||||||||
U.S. Treasury Obligations | — | 44,885 | — | 44,885 | ||||||||||||
Municipal Bonds | — | 44,189 | — | 44,189 | ||||||||||||
Sovereign Debt | — | 34,727 | — | 34,727 | ||||||||||||
Cash Equivalent | 20,548 | — | — | 20,548 | ||||||||||||
|
|
|
|
|
|
|
| |||||||||
Total Investments in Securities | $ | 20,548 | $ | 1,407,502 | $ | — | $ | 1,428,050 | ||||||||
|
|
|
|
|
|
|
| |||||||||
| Other Financial Instruments | Level 1 | Level 2 | Level 3 | Total | ||||||||||||
Futures Contracts* | ||||||||||||||||
Unrealized Appreciation | $ | 141 | $ | — | $ | — | $ | 141 | ||||||||
|
|
|
|
|
|
|
| |||||||||
Total Other Financial Instruments | $ | 141 | $ | — | $ | — | $ | 141 | ||||||||
|
|
|
|
|
|
|
| |||||||||
| * | Futures contracts are valued at the unrealized depreciation on the instrument. |
For the period ended November 30, 2016, there were no transfers between Level 1 and Level 2 assets and liabilities.
For the period ended November 30, 2016, there were no transfers between Level 2 and Level 3 assets and liabilities.
For more information on valuation inputs, see Note 2 — Significant Accounting Policies in Notes to Financial Statements.
Amounts designated as “—” are $0 or have been rounded to $0.
The accompanying notes are an integral part of the financial statements.
| SEI Institutional Investments Trust / Semi-Annual Report / November 30, 2016 | 213 |
CONSOLIDATED SUMMARY SCHEDULE OF INVESTMENTS (Unaudited)
Dynamic Asset Allocation Fund
November 30, 2016
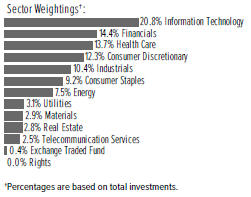
| Description | Percentage of Net Assets (%) | Shares | Market Value ($ Thousands) | |||||||||
COMMON STOCK — 94.9% |
| |||||||||||
Consumer Discretionary — 11.7% |
| |||||||||||
Amazon.com* | 1.5 | % | 43,300 | $ | 32,500 | |||||||
Comcast, Cl A | 0.8 | 264,300 | 18,371 | |||||||||
Home Depot | 0.8 | 135,932 | 17,590 | |||||||||
McDonald’s | 0.5 | 93,400 | 11,140 | |||||||||
Starbucks | 0.4 | 162,100 | 9,397 | |||||||||
Walt Disney | 0.7 | 162,562 | 16,113 | |||||||||
Other Securities | 7.0 | 153,256 | ||||||||||
|
| |||||||||||
| 258,367 | ||||||||||||
|
| |||||||||||
Consumer Staples — 8.8% |
| |||||||||||
Altria Group | 0.6 | 214,100 | 13,687 | |||||||||
Coca-Cola | 0.8 | 427,300 | 17,242 | |||||||||
PepsiCo | 0.7 | 158,262 | 15,842 | |||||||||
Philip Morris International | 0.7 | 170,600 | 15,061 | |||||||||
Procter & Gamble | 1.1 | 293,836 | 24,230 | |||||||||
Wal-Mart Stores | 0.5 | 165,955 | 11,688 | |||||||||
Other Securities | 4.4 | 96,013 | ||||||||||
|
| |||||||||||
| 193,763 | ||||||||||||
|
| |||||||||||
Energy — 7.2% | ||||||||||||
Chevron | 1.1 | 207,600 | 23,160 | |||||||||
Exxon Mobil | 1.8 | 458,000 | 39,983 | |||||||||
Schlumberger | 0.6 | 152,337 | 12,804 | |||||||||
Other Securities | 3.7 | 82,069 | ||||||||||
|
| |||||||||||
| 158,016 | ||||||||||||
|
| |||||||||||
Financials — 13.8% | ||||||||||||
Bank of America | 1.1 | 1,123,300 | 23,724 | |||||||||
Berkshire Hathaway, Cl B* | 1.5 | 209,700 | 33,015 | |||||||||
Citigroup | 0.8 | 319,600 | 18,022 | |||||||||
JPMorgan Chase | 1.5 | 398,800 | 31,972 | |||||||||
Wells Fargo | 1.2 | 500,000 | 26,460 | |||||||||
Other Securities | 7.7 | 170,047 | ||||||||||
|
| |||||||||||
| 303,240 | ||||||||||||
|
| |||||||||||
Health Care — 13.0% |
| |||||||||||
AbbVie | 0.5 | 178,200 | 10,835 | |||||||||
Amgen | 0.5 | 82,000 | 11,814 | |||||||||
Bristol-Myers Squibb | 0.5 | 182,800 | 10,317 | |||||||||
Celgene* | 0.5 | 85,700 | 10,156 | |||||||||
| Description | Percentage of Net Assets (%) | Shares | Market Value ($ Thousands) | |||||||||
Gilead Sciences | 0.5 | % | 144,456 | $ | 10,646 | |||||||
Johnson & Johnson | 1.5 | 302,100 | 33,624 | |||||||||
Medtronic | 0.5 | 151,355 | 11,050 | |||||||||
Merck | 0.8 | 304,200 | 18,614 | |||||||||
Pfizer | 1.0 | 667,596 | 21,457 | |||||||||
UnitedHealth Group | 0.7 | 104,700 | 16,576 | |||||||||
Other Securities | 6.0 | 132,144 | ||||||||||
|
| |||||||||||
| 287,233 | ||||||||||||
|
| |||||||||||
Industrials — 9.9% | ||||||||||||
3M | 0.5 | 66,900 | 11,489 | |||||||||
Boeing | 0.4 | 63,500 | 9,561 | |||||||||
General Electric | 1.4 | 989,392 | 30,434 | |||||||||
Honeywell International | 0.4 | 84,300 | 9,605 | |||||||||
Union Pacific | 0.4 | 91,000 | 9,221 | |||||||||
United Technologies | 0.4 | 85,100 | 9,167 | |||||||||
Other Securities | 6.4 | 139,680 | ||||||||||
|
| |||||||||||
| 219,157 | ||||||||||||
|
| |||||||||||
Information Technology — 19.8% |
| |||||||||||
Alphabet, Cl A* | 1.1 | 32,545 | 25,251 | |||||||||
Alphabet, Cl C* | 1.1 | 32,622 | 24,729 | |||||||||
Apple | 3.0 | 594,000 | 65,649 | |||||||||
Cisco Systems | 0.7 | 553,100 | 16,493 | |||||||||
Facebook, Cl A* | 1.4 | 256,500 | 30,375 | |||||||||
Intel | 0.8 | 520,500 | 18,061 | |||||||||
International Business Machines | 0.7 | 95,658 | 15,518 | |||||||||
MasterCard, Cl A | 0.5 | 105,000 | 10,731 | |||||||||
Microsoft | 2.3 | 858,800 | 51,751 | |||||||||
Oracle | 0.6 | 329,700 | 13,251 | |||||||||
QUALCOMM | 0.5 | 163,100 | 11,112 | |||||||||
Visa, Cl A | 0.7 | 207,500 | 16,044 | |||||||||
Other Securities | 6.4 | 136,713 | ||||||||||
|
| |||||||||||
| 435,678 | ||||||||||||
|
| |||||||||||
Materials — 2.8% |
| |||||||||||
Other Securities | 2.8 | 60,836 | ||||||||||
|
| |||||||||||
Real Estate — 2.6% |
| |||||||||||
Other Securities‡ | 2.6 | 58,351 | ||||||||||
|
| |||||||||||
Telecommunication Services — 2.4% |
| |||||||||||
AT&T | 1.2 | 677,416 | 26,169 | |||||||||
Verizon Communications | 1.0 | 448,700 | 22,390 | |||||||||
Other Securities | 0.2 | 3,648 | ||||||||||
|
| |||||||||||
| 52,207 | ||||||||||||
|
| |||||||||||
Utilities — 2.9% |
| |||||||||||
Other Securities | 2.9 | 64,742 | ||||||||||
|
| |||||||||||
Total Common Stock |
| 2,091,590 | ||||||||||
|
| |||||||||||
| 214 | SEI Institutional Investments Trust / Semi-Annual Report / November 30, 2016 |
| Description | Percentage of Net Assets (%) | Shares | Market Value ($ Thousands) | |||||||||
EXCHANGE TRADED FUND — 0.3% |
| |||||||||||
Other Securities | 0.3 | % | $ | 7,372 | ||||||||
|
| |||||||||||
Total Exchange Traded Fund |
| 7,372 | ||||||||||
|
| |||||||||||
RIGHTS — 0.0% |
| |||||||||||
Other Securities | 0.0 | 23 | ||||||||||
|
| |||||||||||
Total Rights |
| 23 | ||||||||||
|
| |||||||||||
Total Investments — 95.2% |
| $ | 2,098,985 | |||||||||
|
| |||||||||||
Contracts | ||||||||||||
PURCHASED OPTION (A) — 0.3% |
| |||||||||||
January 2017, EUR Put, USD Call, Expires 01/06/2017, Strike Price $1.07* | 0.3 | 369,539,932 | $ | 7,305 | ||||||||
|
| |||||||||||
Total Purchased Option |
| $ | 7,305 | |||||||||
|
| |||||||||||
A list of the open futures contracts held by the Fund at November 30, 2016, is as follows:
| Type of Contract | Number of Long | Expiration Date | Unrealized Appreciation (Depreciation) ($ Thousands) | |||||||||
S&P 500 Index E-MINI | (481 | ) | Dec-2016 | $ | (1,441 | ) | ||||||
Topix Index | 835 | Dec-2016 | 9,070 | |||||||||
|
| |||||||||||
| $ | 7,629 | |||||||||||
|
| |||||||||||
For the period ended November 30, 2016, the total amount of all open futures contracts, as presented in the table above, are representative of the volume of activity for the derivative type during the period.
A list of the open forward foreign currency contracts held by the Fund at November 30, 2016, is as follows:
| Settlement Date | Currency to Deliver (Thousands) | Currency To Receive (Thousands) | Unrealized Appreciation (Depreciation) ($ Thousands) | |||||||||||||||||
10/19/16-1/9/17 | EUR | 751,773 | USD | 223,643 | $ | 12,451 | ||||||||||||||
1/9/17 | EUR | 11,900 | USD | 12,640 | (11 | ) | ||||||||||||||
1/9/17 | USD | 7,769 | SAR | 29,424 | 74 | |||||||||||||||
1/9/17 | INR | 176,000 | USD | 2,614 | 55 | |||||||||||||||
1/9/17 | USD | 224,882 | INR | 15,199,069 | (3,912 | ) | ||||||||||||||
1/9/17 | SAR | 439,575 | USD | 114,298 | (2,872 | ) | ||||||||||||||
1/9/17 | KRW | 255,561,130 | USD | 228,432 | 10,686 | |||||||||||||||
1/10/17 | JPY | 280,500 | USD | 2,679 | 210 | |||||||||||||||
1/10/17 | JPY | 592,680 | USD | 5,198 | (18 | ) | ||||||||||||||
|
| |||||||||||||||||||
| $ | 16,663 | |||||||||||||||||||
|
| |||||||||||||||||||
A list of the counterparties for the open forward foreign currency contracts held by the Fund at November 30, 2016, is as follows:
| Counterparty | Currency to Deliver ($ Thousands) | Currency to Receive ($ Thousands) | Unrealized Appreciation (Depreciation) ($ Thousands) | |||||||||
Bank of America | $ | (357,288 | ) | $ | 351,109 | $ | (6,179 | ) | ||||
Goldman Sachs | (5,784 | ) | 6,108 | 324 | ||||||||
Jefferies LLC | (200,731 | ) | 211,274 | 10,543 | ||||||||
JPMorgan Chase Bank | (101,484 | ) | 107,418 | 5,934 | ||||||||
Morgan Stanley | (119,351 | ) | 125,249 | 5,898 | ||||||||
Standard Chartered | (17,015 | ) | 17,158 | 143 | ||||||||
|
| |||||||||||
| $ | 16,663 | |||||||||||
|
| |||||||||||
For the period ended November 30, 2016 the total amount of all open forward foreign currency contracts, as presented in the table above, are representative of the volume of activity for the derivative type during the period.
A list of the OTC swap agreements held by the Fund at November 30, 2016, is as follows:
| Interest Rate Swaps | ||||||||||||||
| Counterparty | Fund Pays | Fund Receives | Termination Date | Notional Amount ($ Thousands) | Net Unrealized Appreciation ($ Thousands) | |||||||||
| Bank of America | 1.74% | US CPI URBAN CONSUMERS NSA | 8/24/2026 | $ | 17,222 | $ | 876 | |||||||
| BNP Paribas | 1.76% | US CPI URBAN CONSUMERS NSA | 8/26/2026 | 38,102 | 1,862 | |||||||||
| BNP Paribas | 1.76% | US CPI URBAN CONSUMERS NSA | 8/25/2026 | 51,665 | 2,527 | |||||||||
|
| |||||||||||||
| $ | 5,265 | |||||||||||||
|
| |||||||||||||
For the period ended November 30, 2016, the total amount of all open swap contracts, as presented in the table above, are representative of the volume of activity for this derivative type during the period.
Percentages are based on Net Assets of $2,203,796 ($ Thousands).
| * | Non-income producing security. |
| ‡ | Real Estate Investment Trust. |
| (A) | For the period ended November 30, 2016, the total amount of open purchased options, as presented in the Schedule of Investments, are representative of the volume of activity for these derivative types during the period. |
Cl — Class
CPI — Consumer Price Index
EUR — Euro
INR — Indian Rupee
JPY — Japanese Yen
KRW — Korean Won
LLC — Limited Liability Company
NSA — Not seasonally adjusted
OTC — Over the Counter
S&P — Standard & Poor’s
SAR — Saudi Riyal
USD — United States Dollar
The Summary Schedule of Investments does not reflect the complete portfolio holdings. It includes the Fund’s 50 largest holdings and each investment of any issuer that exceeds 1% of the Fund’s net assets. “Other Securities” represent all issues not required to be disclosed under the rules adopted by the U.S. Securities and Exchange Commission (“SEC”). In certain instances, securities for which footnotes
| SEI Institutional Investments Trust / Semi-Annual Report / November 30, 2016 | 215 |
CONSOLIDATED SUMMARY SCHEDULE OF INVESTMENTS (Unaudited)
Dynamic Asset Allocation Fund (Concluded)
November 30, 2016
listed above may otherwise apply are included in the Other Securities caption. The complete schedule of portfolio holdings is available (i) without charge, upon request, by calling (800) 342-5734; and (ii) on the SEC’s website at http://www.sec.gov.
The following is a list of the level of inputs used as of November 30, 2016, in valuing the Fund’s investments and other financial instruments carried at value ($ Thousands):
| Investments in Securities | Level 1 | Level 2 | Level 3 | Total | ||||||||||||
Common Stock | $ | 2,091,590 | $ | — | $ | — | $ | 2,091,590 | ||||||||
Exchange Traded Fund | 7,372 | — | — | 7,372 | ||||||||||||
Rights | — | 23 | — | 23 | ||||||||||||
|
|
|
|
|
|
|
| |||||||||
Total Investments in Securities | $ | 2,098,962 | $ | 23 | $ | — | $ | 2,098,985 | ||||||||
|
|
|
|
|
|
|
| |||||||||
| Other Financial Instruments | Level 1 | Level 2 | Level 3 | Total | ||||||||||||
Purchased Option | $ | 7,305 | $ | — | $ | — | $ | 7,305 | ||||||||
Futures Contracts* | ||||||||||||||||
Unrealized Appreciation | 9,070 | — | — | 9,070 | ||||||||||||
Unrealized Depreciation | (1,441 | ) | — | — | (1,441 | ) | ||||||||||
Forwards Contracts* | ||||||||||||||||
Unrealized Appreciation | — | 23,476 | — | 23,476 | ||||||||||||
Unrealized Depreciation | — | (6,813 | ) | — | (6,813 | ) | ||||||||||
OTC Swaps | ||||||||||||||||
Interest Rate Swaps* | ||||||||||||||||
Unrealized Appreciation | — | 5,265 | — | 5,265 | ||||||||||||
|
|
|
|
|
|
|
| |||||||||
Total Other Financial Instruments | $ | 14,934 | $ | 21,928 | $ | — | $ | 36,862 | ||||||||
|
|
|
|
|
|
|
| |||||||||
| * | Futures contracts, forwards contracts and swaps are valued at the unrealized appreciation (depreciation) on the instrument. |
For the period ended November 30, 2016, there were no transfers between Level 1 and Level 2 assets and liabilities.
For the period ended November 30, 2016, there were no transfers between Level 2 and Level 3 assets and liabilities.
For more information on valuation inputs, see Note 2 — Significant Accounting Policies in Notes to Financial Statements.
Amounts designated as “—” are $0 or have been rounded to $0.
The accompanying notes are an integral part of the financial statements.
| 216 | SEI Institutional Investments Trust / Semi-Annual Report / November 30, 2016 |
CONSOLIDATED SCHEDULE OF INVESTMENTS (Unaudited)
Multi-Asset Real Return Fund
November 30, 2016
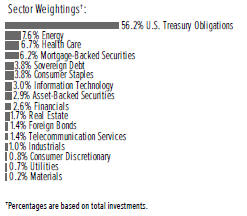
| Description | Face Amount | Market Value ($ Thousands) | ||||||||||
U.S. TREASURY OBLIGATIONS — 64.5% |
| |||||||||||
U.S. Treasury Bills (A) | ||||||||||||
0.456%, 12/01/2016 | $ | 78,000 | $ | 78,000 | ||||||||
0.456%, 04/20/2017 | 16,640 | 16,604 | ||||||||||
0.445%, 02/09/2017 | 28,700 | 28,676 | ||||||||||
U.S. Treasury Inflation-Protected Securities (B) | ||||||||||||
2.125%, 01/15/2019 | 26,827 | 28,329 | ||||||||||
1.375%, 01/15/2020 | 41,044 | 43,112 | ||||||||||
1.250%, 07/15/2020 | 41,283 | 43,559 | ||||||||||
0.625%, 07/15/2021 | 92,865 | 95,885 | ||||||||||
0.125%, 04/15/2018 | 7,740 | 7,793 | ||||||||||
0.125%, 04/15/2019 | 74,670 | 75,446 | ||||||||||
0.125%, 04/15/2020 | 55,902 | 56,406 | ||||||||||
|
| |||||||||||
Total U.S. Treasury Obligations |
| 473,810 | ||||||||||
|
| |||||||||||
| Shares | ||||||||||||
COMMON STOCK — 26.9% |
| |||||||||||
Consumer Staples — 4.2% | ||||||||||||
Altria Group (B) | 78,500 | 5,019 | ||||||||||
Campbell Soup | 3,700 | 210 | ||||||||||
Clorox | 3,900 | 451 | ||||||||||
Coca-Cola | 10,400 | 420 | ||||||||||
CVS Health | 2,300 | 177 | ||||||||||
Dean Foods | 212,400 | 4,218 | ||||||||||
Dr. Pepper Snapple Group (B) | 20,000 | 1,735 | ||||||||||
Energizer Holdings | 1,400 | 63 | ||||||||||
Fresh Del Monte Produce | 6,200 | 384 | ||||||||||
Ingredion | 2,200 | 258 | ||||||||||
Medifast | 8,400 | 328 | ||||||||||
Mondelez International, Cl A | 39,500 | 1,629 | ||||||||||
Nu Skin Enterprises, Cl A | 15,700 | 819 | ||||||||||
Omega Protein* | 14,800 | 354 | ||||||||||
PepsiCo | 16,000 | 1,602 | ||||||||||
Philip Morris International | 3,700 | 327 | ||||||||||
Post Holdings* | 8,500 | 649 | ||||||||||
Procter & Gamble | 30,500 | 2,515 | ||||||||||
| Description | Shares | Market Value ($ Thousands) | ||||||||||
Sanderson Farms | 7,500 | $ | 605 | |||||||||
Sysco | 43,100 | 2,295 | ||||||||||
Tyson Foods, Cl A (B) | 63,900 | 3,630 | ||||||||||
Universal | 14,500 | 798 | ||||||||||
Walgreens Boots Alliance | 1,200 | 102 | ||||||||||
Wal-Mart Stores | 35,300 | 2,486 | ||||||||||
|
| |||||||||||
| 31,074 | ||||||||||||
|
| |||||||||||
Energy — 7.9% | ||||||||||||
Antero Resources* | 42,500 | 1,041 | ||||||||||
Atwood Oceanics | 221,400 | 2,094 | ||||||||||
Chesapeake Energy* | 9,000 | 63 | ||||||||||
Chevron (B) | 34,470 | 3,846 | ||||||||||
Contango Oil & Gas* | 7,600 | 75 | ||||||||||
DHT Holdings | 312,700 | 1,110 | ||||||||||
Diamondback Energy* | 3,100 | 334 | ||||||||||
Energen | 6,300 | 391 | ||||||||||
Exxon Mobil (B) | 141,000 | 12,309 | ||||||||||
Gener8 Maritime* | 14,300 | 58 | ||||||||||
Hallador Energy | 39,200 | 360 | ||||||||||
McDermott International* | 145,900 | 1,004 | ||||||||||
Natural Gas Services Group* | 1,200 | 34 | ||||||||||
PDC Energy* | 500 | 37 | ||||||||||
PHI* | 6,900 | 104 | ||||||||||
Pioneer Natural Resources | 21,800 | 4,165 | ||||||||||
REX American Resources* | 10,100 | 987 | ||||||||||
Rowan, Cl A | 225,400 | 4,017 | ||||||||||
RSP Permian* | 20,000 | 893 | ||||||||||
Schlumberger (B) | 38,300 | 3,219 | ||||||||||
Southwestern Energy* | 241,900 | 2,746 | ||||||||||
Tesoro (B) | 49,800 | 4,051 | ||||||||||
Transocean (B) | 376,100 | 4,852 | ||||||||||
Valero Energy (B) | 77,600 | 4,777 | ||||||||||
Western Refining | 134,400 | 4,821 | ||||||||||
Westmoreland Coal* | 7,900 | 137 | ||||||||||
|
| |||||||||||
| 57,525 | ||||||||||||
|
| |||||||||||
Financials — 1.1% | ||||||||||||
Ambac Financial Group* | 33,400 | 818 | ||||||||||
Ares Commercial Real Estate‡ | 3,900 | 53 | ||||||||||
Berkshire Hills Bancorp | 4,100 | 139 | ||||||||||
Chimera Investment‡ | 119,600 | 2,028 | ||||||||||
Citigroup | 7,800 | 440 | ||||||||||
Citizens Financial Group | 8,900 | 298 | ||||||||||
Dynex Capital‡ | 5,600 | 39 | ||||||||||
Erie Indemnity, Cl A | 1,600 | 171 | ||||||||||
Heartland Financial USA | 4,500 | 193 | ||||||||||
MFA Financial‡ | 284,000 | 2,221 | ||||||||||
Morgan Stanley | 29,100 | 1,204 | ||||||||||
White Mountains Insurance Group | 555 | 465 | ||||||||||
|
| |||||||||||
| 8,069 | ||||||||||||
|
| |||||||||||
| SEI Institutional Investments Trust / Semi-Annual Report / November 30, 2016 | 217 |
CONSOLIDATED SCHEDULE OF INVESTMENTS (Unaudited)
Multi-Asset Real Return Fund (Continued)
November 30, 2016
| Description | Shares | Market Value ($ Thousands) | ||||||
Health Care — 6.9% | ||||||||
Aetna | 25,300 | $ | 3,310 | |||||
AMAG Pharmaceuticals* | 6,000 | 199 | ||||||
Amgen (B) | 27,100 | 3,904 | ||||||
Anthem | 21,600 | 3,079 | ||||||
Baxter International (B) | 90,800 | 4,029 | ||||||
Charles River Laboratories International* | 5,600 | 398 | ||||||
Cigna | 200 | 27 | ||||||
Exactech* | 800 | 20 | ||||||
Express Scripts Holding* | 6,500 | 493 | ||||||
Five Prime Therapeutics* | 7,500 | 431 | ||||||
Gilead Sciences (B) | 68,500 | 5,049 | ||||||
Healthways* | 12,600 | 292 | ||||||
Humana | 12,400 | 2,637 | ||||||
INC Research Holdings, Cl A* | 5,300 | 262 | ||||||
Johnson & Johnson (B) | 56,000 | 6,233 | ||||||
Magellan Health Services* | 15,100 | 1,099 | ||||||
Merck | 17,700 | 1,083 | ||||||
Mettler Toledo International* | 7,460 | 3,074 | ||||||
PDL BioPharma | 241,200 | 528 | ||||||
Pfizer | 59,900 | 1,925 | ||||||
Quintiles IMS Holdings* | 5,700 | 438 | ||||||
United Therapeutics* | 29,800 | 3,743 | ||||||
UnitedHealth Group | 15,400 | 2,438 | ||||||
Waters* | 11,700 | 1,575 | ||||||
WellCare Health Plans* | 31,300 | 4,289 | ||||||
|
| |||||||
| 50,555 | ||||||||
|
| |||||||
Industrials — 0.9% | ||||||||
Argan | 12,000 | 726 | ||||||
Greenbrier | 78,025 | 3,027 | ||||||
Hawaiian Holdings*,(B) | 26,900 | 1,381 | ||||||
Heritage-Crystal Clean* | 2,900 | 47 | ||||||
Insteel Industries | 4,700 | 186 | ||||||
Manpowergroup | 400 | 34 | ||||||
United Continental Holdings* | 16,500 | 1,138 | ||||||
Universal Forest Products | 700 | 70 | ||||||
|
| |||||||
| 6,609 | ||||||||
|
| |||||||
Information Technology — 2.9% | ||||||||
Accenture, Cl A | 19,900 | 2,377 | ||||||
EarthLink Holdings | 65,700 | 347 | ||||||
Electronic Arts* | 13,300 | 1,054 | ||||||
Hackett Group | 22,500 | 400 | ||||||
International Business Machines (B) | 31,300 | 5,077 | ||||||
Leidos Holdings | 55,600 | 2,847 | ||||||
Microsoft | 47,900 | 2,886 | ||||||
NeuStar, Cl A* | 84,600 | 2,052 | ||||||
Symantec (B) | 163,900 | 3,997 | ||||||
Xerox | 7,300 | 68 | ||||||
| Description | Shares | Market Value ($ Thousands) | ||||||||||
Zix* | 24,700 | $ | 110 | |||||||||
|
| |||||||||||
| 21,215 | ||||||||||||
|
| |||||||||||
Real Estate — 1.8% | ||||||||||||
Altisource Portfolio Solutions* | 72,100 | 1,942 | ||||||||||
AV Homes* | 1,600 | 25 | ||||||||||
CorEnergy Infrastructure Trust‡ | 5,200 | 170 | ||||||||||
CoreSite Realty‡ | 13,300 | 938 | ||||||||||
DuPont Fabros Technology‡ | 39,400 | 1,602 | ||||||||||
Equity Commonwealth*‡ | 54,800 | 1,594 | ||||||||||
Equity LifeStyle Properties‡ | 6,600 | 458 | ||||||||||
Equity Residential‡ | 17,600 | 1,056 | ||||||||||
Gaming and Leisure Properties‡ | 52,200 | 1,593 | ||||||||||
Hudson Pacific Properties‡ | 1,000 | 35 | ||||||||||
Macerich‡ | 14,300 | 971 | ||||||||||
Monmouth Real Estate Investment, Cl A‡ | 4,300 | 60 | ||||||||||
PS Business Parks‡ | 5,600 | 626 | ||||||||||
Public Storage‡ | 1,700 | 356 | ||||||||||
Retail Opportunity Investments‡ | 19,100 | 394 | ||||||||||
RMR Group | 3,100 | 129 | ||||||||||
Ryman Hospitality Properties‡ | 20,800 | 1,225 | ||||||||||
Simon Property Group‡ | 1,400 | 251 | ||||||||||
|
| |||||||||||
| 13,425 | ||||||||||||
|
| |||||||||||
Telecommunication Services — 0.7% |
| |||||||||||
AT&T | 16,200 | 626 | ||||||||||
FairPoint Communications* | 31,600 | 526 | ||||||||||
IDT, Cl B | 17,300 | 366 | ||||||||||
Telephone & Data Systems | 83,400 | 2,246 | ||||||||||
Verizon Communications | 19,000 | 948 | ||||||||||
|
| |||||||||||
| 4,712 | ||||||||||||
|
| |||||||||||
Utilities — 0.5% | ||||||||||||
Exelon | 26,100 | 848 | ||||||||||
FirstEnergy | 25,200 | 789 | ||||||||||
MDU Resources Group | 40,700 | 1,132 | ||||||||||
NiSource | 51,600 | 1,132 | ||||||||||
|
| |||||||||||
| 3,901 | ||||||||||||
|
| |||||||||||
Total Common Stock |
| 197,085 | ||||||||||
|
| |||||||||||
| Face Amount (Thousands) | ||||||||||||
MORTGAGE-BACKED SECURITIES — 7.1% |
| |||||||||||
Agency Mortgage-Backed Obligations — 0.7% |
| |||||||||||
FHLMC CMO, Ser 2007-3311, Cl IE, IO | ||||||||||||
5.872%, 05/15/2037 (C) | $ | 1,863 | 358 | |||||||||
FHLMC CMO, Ser 2016-4593, Cl SA, IO | ||||||||||||
5.462%, 06/15/2046 (C) | 2,181 | 492 | ||||||||||
| 218 | SEI Institutional Investments Trust / Semi-Annual Report / November 30, 2016 |
| Description | Face Amount (Thousands) | Market Value ($ Thousands) | ||||||||||
FHLMC Multifamily Structured Pass-Through | ||||||||||||
Certificates, Ser K025, Cl A1 | ||||||||||||
1.875%, 04/25/2022 | $ | 796 | $ | 795 | ||||||||
FNMA CMO, Ser 2011-15, Cl SA, IO | ||||||||||||
6.476%, 03/25/2041 (C) | 2,041 | 460 | ||||||||||
FNMA CMO, Ser 2015-33, Cl AI, IO | ||||||||||||
5.000%, 06/25/2045 | 2,632 | 512 | ||||||||||
FNMA CMO, Ser 2015-66, Cl AS, IO | ||||||||||||
5.666%, 09/25/2045 (C) | 2,493 | 447 | ||||||||||
FNMA CMO, Ser 2016-11, Cl SG, IO | ||||||||||||
5.566%, 03/25/2046 (C) | 2,691 | 478 | ||||||||||
FNMA CMO, Ser 2016-22, Cl ST, IO | ||||||||||||
5.516%, 04/25/2046 (C) | 2,659 | 461 | ||||||||||
FNMA CMO, Ser 2016-79, Cl JS, IO | ||||||||||||
5.466%, 11/25/2046 (C) | 1,977 | 424 | ||||||||||
GNMA CMO, Ser 2016-108, Cl SA, IO | ||||||||||||
5.538%, 08/20/2046 (C) | 2,507 | 501 | ||||||||||
GNMA CMO, Ser 2016-108, Cl SM, IO | ||||||||||||
5.538%, 08/20/2046 (C) | 2,125 | 540 | ||||||||||
|
| |||||||||||
| 5,468 | ||||||||||||
|
| |||||||||||
Non-Agency Mortgage-Backed Obligations — 6.4% |
| |||||||||||
Alternative Loan Trust, Ser 2005-20CB, Cl 3A6 | ||||||||||||
5.500%, 07/25/2035 | 107 | 98 | ||||||||||
Alternative Loan Trust, Ser 2005-57CB, Cl 4A3 | ||||||||||||
5.500%, 12/25/2035 | 257 | 219 | ||||||||||
Alternative Loan Trust, Ser 2006-23CB, Cl 1A7 | ||||||||||||
6.000%, 08/25/2036 | 167 | 153 | ||||||||||
Alternative Loan Trust, Ser 2006-24CB, Cl A16 | ||||||||||||
5.750%, 06/25/2036 | 440 | 377 | ||||||||||
Alternative Loan Trust, Ser 2006-28CB, Cl A14 | ||||||||||||
6.250%, 10/25/2036 | 309 | 254 | ||||||||||
Alternative Loan Trust, Ser 2006-9T1, Cl A1 | ||||||||||||
5.750%, 05/25/2036 | 182 | 141 | ||||||||||
Alternative Loan Trust, Ser 2006-J1, Cl 1A13 | ||||||||||||
5.500%, 02/25/2036 | 249 | 218 | ||||||||||
Banc of America Commercial Mortgage Trust, Ser 2007-5, Cl AM | ||||||||||||
5.772%, 02/10/2051 (C) | 78 | 79 | ||||||||||
Bear Stearns Commercial Mortgage Securities Trust, Ser 2006-PW13, Cl AJ | ||||||||||||
5.611%, 09/11/2041 (C) | 88 | 88 | ||||||||||
Bellemeade Re II, Ser 2016-1A, Cl M2B | ||||||||||||
7.034%, 04/25/2026 (C) (D) | 311 | 316 | ||||||||||
Bellemeade Re, Ser 2015-1A, Cl M1 | ||||||||||||
3.034%, 07/25/2025 (C) (D) | 55 | 55 | ||||||||||
BHMS Mortgage Trust, Ser 2014-ATLS, Cl AFX | ||||||||||||
3.600%, 07/05/2033 (D) | 905 | 919 | ||||||||||
CGBAM Commercial Mortgage Trust, Ser 2016-IMC, Cl C | ||||||||||||
4.488%, 11/15/2021 (C) (D) | 214 | 216 | ||||||||||
| Description | Face Amount (Thousands) | Market Value ($ Thousands) | ||||||||||
CGRBS Commercial Mortgage Trust, Ser 2013- VN05, Cl A | ||||||||||||
3.187%, 03/13/2035 (D) | $ | 285 | $ | 293 | ||||||||
Chase Mortgage Finance Trust, Ser 2007-S5, Cl 1A17 | ||||||||||||
6.000%, 07/25/2037 | 141 | 117 | ||||||||||
CHL Mortgage Pass-Through Trust, Ser 2006- 10, Cl 1A8 | ||||||||||||
6.000%, 05/25/2036 | 233 | 199 | ||||||||||
CHL Mortgage Pass-Through Trust, Ser 2006- 13, Cl 1A19 | ||||||||||||
6.250%, 09/25/2036 | 121 | 103 | ||||||||||
Citigroup Commercial Mortgage Trust, Ser 2012-GC8, Cl D | ||||||||||||
4.876%, 09/10/2045 (C) (D) | 541 | 496 | ||||||||||
Citigroup Commercial Mortgage Trust, Ser 2013-GC11, Cl D | ||||||||||||
4.456%, 04/10/2046 (C) (D) | 560 | 499 | ||||||||||
Citigroup Commercial Mortgage Trust, Ser 2015-GC27, Cl A5 | ||||||||||||
3.137%, 02/10/2048 | 779 | 780 | ||||||||||
Citigroup Commercial Mortgage Trust, Ser 2016-C1, Cl A4 | ||||||||||||
3.209%, 05/10/2049 | 750 | 749 | ||||||||||
COMM Mortgage Trust, Ser 2013-SFS, Cl A1 | ||||||||||||
1.873%, 04/12/2035 (D) | 1,122 | 1,107 | ||||||||||
Commercial Mortgage Loan Trust, Ser 2008- LS1, Cl A1A | ||||||||||||
6.093%, 12/10/2049 (C) | 1,146 | 1,178 | ||||||||||
Commercial Mortgage Trust, Ser 2007-GG9, Cl AM | ||||||||||||
5.475%, 03/10/2039 | 246 | 246 | ||||||||||
Countrywide Home Loan Mortgage Pass- Through Trust, Ser 2007-HYB2, Cl 3A1 | ||||||||||||
2.995%, 02/25/2047 (C) | 139 | 115 | ||||||||||
Credit Suisse Commercial Mortgage Trust, Ser 2007-C3, Cl AM | ||||||||||||
5.690%, 06/15/2039 (C) | 461 | 468 | ||||||||||
Credit Suisse Commercial Mortgage Trust, Ser 2016-MFF, Cl D | ||||||||||||
5.125%, 10/15/2018 | 215 | 215 | ||||||||||
CSAIL Commercial Mortgage Trust, Ser 2015- C3, Cl A4 | ||||||||||||
3.691%, 08/15/2048 | 641 | 668 | ||||||||||
CSMC Series, Ser 2010-6R, Cl 3A2 | ||||||||||||
5.875%, 01/26/2038 (D) | 453 | 373 | ||||||||||
CW Capital Cobalt, Ser 2007-C3, Cl A4 | ||||||||||||
5.758%, 05/15/2046 (C) | 135 | 136 | ||||||||||
Deutsche Alt-A Securities Mortgage Loan Trust, Ser 2006-AR4, Cl A2 | ||||||||||||
0.724%, 12/25/2036 (C) | 277 | 173 | ||||||||||
| SEI Institutional Investments Trust / Semi-Annual Report / November 30, 2016 | 219 |
CONSOLIDATED SCHEDULE OF INVESTMENTS (Unaudited)
Multi-Asset Real Return Fund (Continued)
November 30, 2016
| Description | Face Amount (Thousands) | Market Value ($ Thousands) | ||||||||||
FHLMC Structured Agency Credit Risk Debt Notes, Ser 2013-DN2, Cl M2 | ||||||||||||
4.784%, 11/25/2023 (C) | $ | 785 | $ | 828 | ||||||||
FHLMC Structured Agency Credit Risk Debt Notes, Ser 2014-DN3, Cl M3 | ||||||||||||
4.534%, 08/25/2024 (C) | 890 | 921 | ||||||||||
FHLMC Structured Agency Credit Risk Debt Notes, Ser 2014-DN4, Cl M3 | ||||||||||||
5.084%, 10/25/2024 (C) | 250 | 265 | ||||||||||
FHLMC Structured Agency Credit Risk Debt Notes, Ser 2014-HQ3, Cl M3 | ||||||||||||
5.334%, 10/25/2024 (C) | 650 | 695 | ||||||||||
FHLMC Structured Agency Credit Risk Debt Notes, Ser 2015-DNA1, Cl M3 | ||||||||||||
3.834%, 10/25/2027 (C) | 265 | 273 | ||||||||||
FHLMC Structured Agency Credit Risk Debt Notes, Ser 2015-DNA2, Cl M2 | ||||||||||||
3.134%, 12/25/2027 (C) | 1,067 | 1,080 | ||||||||||
FHLMC Structured Agency Credit Risk Debt Notes, Ser 2015-DNA3, Cl M3 | ||||||||||||
5.234%, 04/25/2028 (C) | 292 | 305 | ||||||||||
FHLMC Structured Agency Credit Risk Debt Notes, Ser 2015-HQ1, Cl M2 | ||||||||||||
2.734%, 03/25/2025 (C) | 397 | 399 | ||||||||||
FHLMC Structured Agency Credit Risk Debt Notes, Ser 2015-HQA1, Cl M2 | ||||||||||||
3.184%, 03/25/2028 (C) | 828 | 840 | ||||||||||
FHLMC Structured Agency Credit Risk Debt Notes, Ser 2015-HQA2, Cl M3 | ||||||||||||
5.334%, 05/25/2028 (C) | 280 | 294 | ||||||||||
FHLMC Structured Agency Credit Risk Debt Notes, Ser 2015-HQA2, Cl M2 | ||||||||||||
3.334%, 05/25/2028 (C) | 311 | 317 | ||||||||||
FHLMC Structured Agency Credit Risk Debt Notes, Ser 2016-DNA1, Cl M3 | ||||||||||||
5.975%, 07/25/2028 (C) | 350 | 381 | ||||||||||
FHLMC Structured Agency Credit Risk Debt Notes, Ser 2016-DNA2, Cl M3 | ||||||||||||
5.184%, 10/25/2028 (C) | 318 | 329 | ||||||||||
FHLMC Structured Agency Credit Risk Debt Notes, Ser 2016-DNA4, Cl M3 | ||||||||||||
4.392%, 03/25/2029 (C) | 296 | 291 | ||||||||||
FHLMC Structured Agency Credit Risk Debt Notes, Ser 2016-HQA1, Cl M3 | ||||||||||||
6.884%, 09/25/2028 (C) | 676 | 758 | ||||||||||
First Horizon Alternative Mortgage Securities Trust, Ser 2006-FA3, Cl A9 | ||||||||||||
6.000%, 07/25/2036 | 106 | 86 | ||||||||||
FNMA Connecticut Avenue Securities, Ser 2014- C03, Cl 1M1 | ||||||||||||
1.784%, 07/25/2024 (C) | 114 | 114 | ||||||||||
| Description | Face Amount (Thousands) | Market Value ($ Thousands) | ||||||||||
FNMA Connecticut Avenue Securities, Ser 2014- C04, Cl 2M2 | ||||||||||||
5.534%, 11/25/2024 (C) | $ | 205 | $ | 220 | ||||||||
FNMA Connecticut Avenue Securities, Ser 2014- C04, Cl 1M2 | ||||||||||||
5.434%, 11/25/2024 (C) | 533 | 577 | ||||||||||
FNMA Connecticut Avenue Securities, Ser 2015-C01, Cl 2M2 | ||||||||||||
5.084%, 02/25/2025 (C) | 539 | 559 | ||||||||||
FNMA Connecticut Avenue Securities, Ser 2015-C01, Cl 1M2 | ||||||||||||
4.834%, 02/25/2025 (C) | 415 | 431 | ||||||||||
FNMA Connecticut Avenue Securities, Ser 2015-C02, Cl 2M2 | ||||||||||||
4.534%, 05/25/2025 (C) | 465 | 480 | ||||||||||
FNMA Connecticut Avenue Securities, Ser 2015-C02, Cl 1M2 | ||||||||||||
4.534%, 05/25/2025 (C) | 674 | 697 | ||||||||||
FNMA Connecticut Avenue Securities, Ser 2015-C03, Cl 1M1 | ||||||||||||
2.034%, 07/25/2025 (C) | 131 | 131 | ||||||||||
FNMA Connecticut Avenue Securities, Ser 2015-C03, Cl 1M2 | ||||||||||||
5.534%, 07/25/2025 (C) | 737 | 782 | ||||||||||
FNMA Connecticut Avenue Securities, Ser 2015-C03, Cl 2M2 | ||||||||||||
5.534%, 07/25/2025 (C) | 718 | 765 | ||||||||||
FNMA Connecticut Avenue Securities, Ser 2015-C04, Cl 1M2 | ||||||||||||
5.894%, 04/25/2028 (C) | 218 | 236 | ||||||||||
FNMA Connecticut Avenue Securities, Ser 2015-C04, Cl 2M2 | ||||||||||||
6.084%, 04/25/2028 (C) | 750 | 811 | ||||||||||
FNMA Connecticut Avenue Securities, Ser 2016-C01, Cl 2M2 | ||||||||||||
7.484%, 08/25/2028 (C) | 495 | 558 | ||||||||||
FNMA Connecticut Avenue Securities, Ser 2016-C01, Cl 1M2 | ||||||||||||
7.284%, 08/25/2028 (C) | 658 | 739 | ||||||||||
FNMA Connecticut Avenue Securities, Ser 2016-C02, Cl 1M2 | ||||||||||||
6.534%, 09/25/2028 (C) | 565 | 618 | ||||||||||
FNMA Connecticut Avenue Securities, Ser 2016-C03, Cl 2M2 | ||||||||||||
6.434%, 10/25/2028 (C) | 459 | 496 | ||||||||||
FNMA Connecticut Avenue Securities, Ser 2016-C03, Cl 1M2 | ||||||||||||
5.834%, 10/25/2028 (C) | 92 | 98 | ||||||||||
FNMA Connecticut Avenue Securities, Ser 2016-C05, Cl 2M2 | ||||||||||||
5.042%, 01/25/2029 (C) | 244 | 247 | ||||||||||
| 220 | SEI Institutional Investments Trust / Semi-Annual Report / November 30, 2016 |
| Description | Face Amount (Thousands) | Market Value ($ Thousands) | ||||||||||
FNMA Connecticut Avenue Securities, Ser 2016-C06, Cl 1M2 | ||||||||||||
4.842%, 04/25/2029 (C) | $ | 476 | $ | 479 | ||||||||
GS Mortgage Securites Trust, Ser 2006-AR4, Cl A2 | ||||||||||||
2.059%, 04/10/2031 (C) | 176 | 171 | ||||||||||
GS Mortgage Securities Trust, Ser 2007-GG10, Cl A4 | ||||||||||||
5.794%, 08/10/2045 (C) | 552 | 557 | ||||||||||
GS Mortgage Securities Trust, Ser 2013-G1, Cl A2 | ||||||||||||
3.557%, 04/10/2031 (C) (D) | 1,485 | 1,491 | ||||||||||
GS Mortgage Securities Trust, Ser 2013-KING, Cl A | ||||||||||||
2.706%, 12/10/2027 (D) | 251 | 255 | ||||||||||
GS Mortgage Securities Trust, Ser 2014-GC18, Cl D | ||||||||||||
5.110%, 01/10/2047 (C) (D) | 631 | 513 | ||||||||||
GS Mortgage Securities Trust, Ser GC6, Cl D | ||||||||||||
5.843%, 01/10/2045 (C) (D) | 483 | 467 | ||||||||||
H/2 Asset Funding, Ser 2015-1A | ||||||||||||
2.102%, 06/24/2049 | 691 | 684 | ||||||||||
HomeBanc Mortgage Trust, Ser 2005-1, Cl A1 | ||||||||||||
1.034%, 03/25/2035 (C) | 114 | 96 | ||||||||||
JPMBB Commercial Mortgage Securities Trust, Ser 2015-C31, Cl A3 | ||||||||||||
3.801%, 08/15/2048 | 592 | 619 | ||||||||||
JPMBB Commercial Mortgage Securities Trust, Ser 2015-C32, Cl C | ||||||||||||
4.668%, 11/15/2048 (C) | 585 | 536 | ||||||||||
JPMorgan Chase Commercial Mortgage Securities Trust, Ser 2004-LN2, Cl A1A | ||||||||||||
4.838%, 07/15/2041 (C) (D) | 163 | 162 | ||||||||||
JPMorgan Chase Commercial Mortgage Securities Trust, Ser 2006-LDP9, Cl AM | ||||||||||||
5.372%, 05/15/2047 | 364 | 363 | ||||||||||
JPMorgan Chase Commercial Mortgage Securities Trust, Ser 2007-CB19, Cl AM | ||||||||||||
5.715%, 02/12/2049 (C) | 100 | 101 | ||||||||||
JPMorgan Chase Commercial Mortgage Securities Trust, Ser 2007-LD12, Cl AM | ||||||||||||
6.040%, 02/15/2051 (C) | 75 | 77 | ||||||||||
JPMorgan Chase Commercial Mortgage Securities Trust, Ser 2007-LDPX, Cl A1A | ||||||||||||
5.439%, 01/15/2049 | 646 | 649 | ||||||||||
JPMorgan Chase Commercial Mortgage Securities Trust, Ser 2014-INN, Cl A | ||||||||||||
1.458%, 06/15/2029 (C) (D) | 923 | 921 | ||||||||||
JPMorgan Chase Commercial Mortgage Securities Trust, Ser 2015-SGP, Cl A | ||||||||||||
2.235%, 07/15/2036 (C) (D) | 913 | 920 | ||||||||||
JPMorgan Mortgage Trust, Ser 2007-S3, Cl 1A8 | ||||||||||||
6.000%, 08/25/2037 | 204 | 180 | ||||||||||
| Description | Face Amount (Thousands) | Market Value ($ Thousands) | ||||||||||
LB-UBS Commercial Mortgage Trust, Ser 2006- C6, Cl AJ | ||||||||||||
5.452%, 09/15/2039 (C) | $ | 272 | $ | 253 | ||||||||
LB-UBS Commercial Mortgage Trust, Ser 2007- C1, Cl AM | ||||||||||||
5.455%, 02/15/2040 | 305 | 306 | ||||||||||
LSTAR Commercial Mortgage Trust, Ser 2014-2, Cl A2 | ||||||||||||
2.767%, 01/20/2041 (D) | 430 | 430 | ||||||||||
LSTAR Commercial Mortgage Trust, Ser 2015-3, Cl A2 | ||||||||||||
2.729%, 04/20/2048 (C) (D) | 728 | 730 | ||||||||||
LSTAR Commercial Mortgage Trust, Ser 4, Cl A2 | ||||||||||||
2.579%, 03/10/2049 (D) | 642 | 626 | ||||||||||
Merrill Lynch Mortgage Trust, Ser 2006-C2, Cl AJ | ||||||||||||
5.802%, 08/12/2043 (C) | 17 | 17 | ||||||||||
ML-CFC Commercial Mortgage Trust, Ser 2007- 9, Cl A4 | ||||||||||||
5.700%, 09/12/2049 | 255 | 261 | ||||||||||
Morgan Stanley Capital I Trust, Ser 2005-IQ9, Cl D | ||||||||||||
5.000%, 07/15/2056 | 369 | 373 | ||||||||||
Morgan Stanley Capital I Trust, Ser 2015-XLF2, Cl AFSA | ||||||||||||
2.405%, 08/15/2026 (C) (D) | 151 | 151 | ||||||||||
Morgan Stanley Capital I Trust, Ser 2015-XLF2, Cl SNMA | ||||||||||||
2.485%, 11/15/2026 (C) (D) | 151 | 152 | ||||||||||
RBSSP Resecuritization Trust, Ser 2009-7, Cl 10A3 | ||||||||||||
6.000%, 08/26/2037 (D) | 594 | 496 | ||||||||||
RBSSP Resecuritization Trust, Ser 2010-9, Cl 7A6 | ||||||||||||
6.238%, 05/26/2037 (C) (D) | 555 | 412 | ||||||||||
Resource Capital, Ser 2014-CRE2, Cl A | ||||||||||||
1.605%, 04/15/2032 (C) (D) | 206 | 204 | ||||||||||
SG Commercial Mortgage Securities Trust, Ser 2016-C5, Cl A4 | ||||||||||||
3.055%, 10/10/2048 | 443 | 433 | ||||||||||
Starwood Retail Property Trust, Ser 2014-STAR, Cl A | ||||||||||||
1.744%, 11/15/2027 (C)(D) | 1,220 | 1,208 | ||||||||||
UBS-Barclays Commercial Mortgage Trust, Ser 2012-C3, Cl A4 | ||||||||||||
3.091%, 08/10/2049 | 98 | 101 | ||||||||||
UBS-Barclays Commercial Mortgage Trust, Ser 2012-C4, Cl A5 | ||||||||||||
2.850%, 12/10/2045 | 194 | 197 | ||||||||||
UBS-Citigroup Commercial Mortgage Trust, Ser 2011-C1, Cl E | ||||||||||||
6.064%, 01/10/2045 (C) (D) | 239 | 255 | ||||||||||
| SEI Institutional Investments Trust / Semi-Annual Report / November 30, 2016 | 221 |
CONSOLIDATED SCHEDULE OF INVESTMENTS (Unaudited)
Multi-Asset Real Return Fund (Continued)
November 30, 2016
| Description | Face Amount (Thousands) | Market Value ($ Thousands) | ||||||||||
Wachovia Bank Commercial Mortgage Trust Series, Ser 2006-C26, Cl A1A | ||||||||||||
6.009%, 06/15/2045 (C) | $ | 38 | $ | 38 | ||||||||
Wells Fargo Commercial Mortgage Trust, Ser 2015-SG1, Cl C | ||||||||||||
4.471%, 12/15/2047 (C) | 527 | 503 | ||||||||||
Wells Fargo Commercial Mortgage Trust, Ser 2016-LC25, Cl C | ||||||||||||
4.437%, 12/15/2059 (C) | 370 | 346 | ||||||||||
Wells Fargo Commercial Mortgage Trust, Ser 2016-NXS6, Cl C | ||||||||||||
4.452%, 11/15/2049 | 620 | 594 | ||||||||||
Wells Fargo Credit Risk Transfer Securities Trust, Ser 2015-WF1, Cl 2M2 | ||||||||||||
6.034%, 11/25/2025 (C) (D) | 122 | 122 | ||||||||||
Wells Fargo Credit Risk Transfer Securities Trust, Ser 2015-WF1, Cl 1M2 | ||||||||||||
5.784%, 11/25/2025 (C) (D) | 432 | 433 | ||||||||||
Wells Fargo Mortgage-Backed Securities Trust, Ser 2007-8, Cl 2A5 | ||||||||||||
5.750%, 07/25/2037 | 136 | 134 | ||||||||||
WFRBS Commercial Mortgage Trust, Ser 2012-C9, Cl D | ||||||||||||
4.801%, 11/15/2045 (C) (D) | 354 | 337 | ||||||||||
WFRBS Commercial Mortgage Trust, Ser 2013- C14, Cl A5 | ||||||||||||
3.337%, 06/15/2046 | 280 | 289 | ||||||||||
WFRBS Commercial Mortgage Trust, Ser 2014-C20, Cl A2 | ||||||||||||
3.036%, 05/15/2047 | 549 | 563 | ||||||||||
|
| |||||||||||
| 46,874 | ||||||||||||
|
| |||||||||||
Total Mortgage-Backed Securities | 52,342 | |||||||||||
|
| |||||||||||
CORPORATE OBLIGATIONS — 6.4% |
| |||||||||||
Consumer Discretionary — 0.9% | ||||||||||||
Adient Global Holdings | ||||||||||||
4.875%, 08/15/2026 (D) | 372 | 357 | ||||||||||
CBS | ||||||||||||
5.750%, 04/15/2020 | 145 | 160 | ||||||||||
3.500%, 01/15/2025 | 625 | 618 | ||||||||||
CSC Holdings LLC | ||||||||||||
6.750%, 11/15/2021 | 125 | 131 | ||||||||||
Dana Holdings | ||||||||||||
6.000%, 09/15/2023 | 91 | 95 | ||||||||||
Discovery Communications LLC | ||||||||||||
3.450%, 03/15/2025 | 338 | 324 | ||||||||||
Ford Motor Credit LLC | ||||||||||||
5.875%, 08/02/2021 | 200 | 221 | ||||||||||
4.375%, 08/06/2023 | 260 | 267 | ||||||||||
| Description | Face Amount (Thousands) | Market Value ($ Thousands) | ||||||||||
2.597%, 11/04/2019 | $ | 346 | $ | 346 | ||||||||
General Motors | ||||||||||||
3.500%, 10/02/2018 | 365 | 371 | ||||||||||
Hanesbrands | ||||||||||||
4.625%, 05/15/2024 (D) | 227 | 226 | ||||||||||
International Game Technology | ||||||||||||
6.500%, 02/15/2025 (D) | 530 | 563 | ||||||||||
KB Home | ||||||||||||
4.750%, 05/15/2019 | 294 | 298 | ||||||||||
Kohl’s | ||||||||||||
5.550%, 07/17/2045 | 485 | 456 | ||||||||||
Newell Brands | ||||||||||||
3.850%, 04/01/2023 | 269 | 276 | ||||||||||
3.150%, 04/01/2021 | 915 | 931 | ||||||||||
Time Warner | ||||||||||||
4.700%, 01/15/2021 | 130 | 140 | ||||||||||
Time Warner Cable LLC | ||||||||||||
4.500%, 09/15/2042 | 245 | 216 | ||||||||||
4.125%, 02/15/2021 | 65 | 67 | ||||||||||
Viacom | ||||||||||||
4.375%, 03/15/2043 | 388 | 341 | ||||||||||
|
| |||||||||||
| 6,404 | ||||||||||||
|
| |||||||||||
Consumer Staples — 0.1% | ||||||||||||
Lamb Weston Holdings | ||||||||||||
4.875%, 11/01/2026 (D) | 94 | 93 | ||||||||||
4.625%, 11/01/2024 (D) | 94 | 94 | ||||||||||
Walgreens Boots Alliance | ||||||||||||
3.800%, 11/18/2024 | 588 | 598 | ||||||||||
|
| |||||||||||
| 785 | ||||||||||||
|
| |||||||||||
Energy — 0.9% | ||||||||||||
Cenovus Energy | ||||||||||||
3.000%, 08/15/2022 | 36 | 34 | ||||||||||
Diamond Offshore Drilling | ||||||||||||
4.875%, 11/01/2043 | 301 | 210 | ||||||||||
Energy Transfer Partners | ||||||||||||
5.200%, 02/01/2022 | 465 | 499 | ||||||||||
4.650%, 06/01/2021 | 85 | 89 | ||||||||||
EnLink Midstream Partners | ||||||||||||
5.050%, 04/01/2045 | 371 | 314 | ||||||||||
Enterprise Products Operating LLC | ||||||||||||
5.200%, 09/01/2020 | 110 | 120 | ||||||||||
3.700%, 02/15/2026 | 810 | 799 | ||||||||||
Hess | ||||||||||||
4.300%, 04/01/2027 | 653 | 620 | ||||||||||
Kinder Morgan Energy Partners | ||||||||||||
4.150%, 03/01/2022 | 48 | 49 | ||||||||||
Marathon Petroleum | ||||||||||||
5.125%, 03/01/2021 | 47 | �� | 51 | |||||||||
Noble Energy | ||||||||||||
8.250%, 03/01/2019 | 174 | 195 | ||||||||||
| 222 | SEI Institutional Investments Trust / Semi-Annual Report / November 30, 2016 |
| Description | Face Amount (Thousands) | Market Value ($ Thousands) | ||||||||||
4.150%, 12/15/2021 | $ | 340 | $ | 352 | ||||||||
3.900%, 11/15/2024 | 463 | 460 | ||||||||||
Plains All American Pipeline | ||||||||||||
3.600%, 11/01/2024 | 660 | 621 | ||||||||||
Regency Energy Partners | ||||||||||||
4.500%, 11/01/2023 | 72 | 73 | ||||||||||
Sabine Pass Liquefaction LLC | ||||||||||||
5.000%, 03/15/2027 (D) | 486 | 480 | ||||||||||
Schlumberger Holdings | ||||||||||||
3.000%, 12/21/2020 (D) | 880 | 897 | ||||||||||
SM Energy | ||||||||||||
6.500%, 01/01/2023 | 35 | 35 | ||||||||||
Ultrapar International | ||||||||||||
5.250%, 10/06/2026 (D) | 376 | 370 | ||||||||||
Valero Energy | ||||||||||||
6.125%, 02/01/2020 | 149 | 165 | ||||||||||
Williams Partners | ||||||||||||
3.900%, 01/15/2025 | 176 | 169 | ||||||||||
|
| |||||||||||
| 6,602 | ||||||||||||
|
| |||||||||||
Financials — 1.4% | ||||||||||||
American International Group | ||||||||||||
4.875%, 06/01/2022 | 410 | 447 | ||||||||||
Bank of America | ||||||||||||
6.500%, 12/31/2049 (C) | 233 | 243 | ||||||||||
Citigroup | ||||||||||||
3.875%, 03/26/2025 | 680 | 676 | ||||||||||
Cooperatieve Rabobank UA | ||||||||||||
4.375%, 08/04/2025 | 425 | 433 | ||||||||||
Credit Agricole | ||||||||||||
4.375%, 03/17/2025 (D) | 366 | 359 | ||||||||||
Credit Suisse Group Funding Guernsey | ||||||||||||
3.800%, 06/09/2023 | 810 | 795 | ||||||||||
Goldman Sachs Group MTN | ||||||||||||
2.537%, 11/29/2023 (C) | 660 | 672 | ||||||||||
Goldman Sachs Group | ||||||||||||
2.350%, 11/15/2027 | 621 | 604 | ||||||||||
Hartford Financial Services Group | ||||||||||||
5.500%, 03/30/2020 | 13 | 14 | ||||||||||
HSBC Finance | ||||||||||||
6.676%, 01/15/2021 | 60 | 67 | ||||||||||
JPMorgan Chase MTN | ||||||||||||
2.295%, 08/15/2021 | 375 | 368 | ||||||||||
JPMorgan Chase | ||||||||||||
6.400%, 05/15/2038 | 40 | 51 | ||||||||||
Lincoln National | ||||||||||||
4.200%, 03/15/2022 | 110 | 117 | ||||||||||
Lloyds Banking Group | ||||||||||||
4.650%, 03/24/2026 | 364 | 363 | ||||||||||
3.100%, 07/06/2021 | 730 | 737 | ||||||||||
MetLife | ||||||||||||
5.700%, 06/15/2035 | 65 | 76 | ||||||||||
| Description | Face Amount (Thousands) | Market Value ($ Thousands) | ||||||||||
Morgan Stanley MTN | ||||||||||||
5.500%, 07/28/2021 | $ | 168 | $ | 187 | ||||||||
4.750%, 03/22/2017 | 40 | 40 | ||||||||||
MTN Maurtitius Investments | ||||||||||||
5.373%, 02/13/2022 | 376 | 371 | ||||||||||
Murray Street Investment Trust I | ||||||||||||
4.647%, 03/09/2017 (E) | 18 | 18 | ||||||||||
Nationwide Building Society | ||||||||||||
4.000%, 09/14/2026 (D) | 935 | 874 | ||||||||||
Nationwide Financial Services | ||||||||||||
5.375%, 03/25/2021 (D) | 320 | 349 | ||||||||||
Navient MTN | ||||||||||||
7.250%, 01/25/2022 | 15 | 16 | ||||||||||
Navient | ||||||||||||
6.625%, 07/26/2021 | 560 | 585 | ||||||||||
PNC Bank | ||||||||||||
3.800%, 07/25/2023 | 460 | 477 | ||||||||||
Royal Bank of Scotland Group | ||||||||||||
8.625%, 12/31/2049 (C) | 560 | 551 | ||||||||||
Santander Issuances | ||||||||||||
5.179%, 11/19/2025 | 400 | 395 | ||||||||||
Societe Generale | ||||||||||||
4.250%, 08/19/2026 (D) | 375 | 358 | ||||||||||
|
| |||||||||||
| 10,243 | ||||||||||||
|
| |||||||||||
Health Care — 0.9% | ||||||||||||
AbbVie | ||||||||||||
3.600%, 05/14/2025 | 479 | 473 | ||||||||||
Actavis Funding SCS | ||||||||||||
3.850%, 06/15/2024 | 241 | 244 | ||||||||||
3.800%, 03/15/2025 | 846 | 852 | ||||||||||
Baxalta | ||||||||||||
3.600%, 06/23/2022 | 745 | 755 | ||||||||||
Celgene | ||||||||||||
3.875%, 08/15/2025 | 530 | 539 | ||||||||||
HCA | ||||||||||||
5.250%, 06/15/2026 | 70 | 70 | ||||||||||
4.500%, 02/15/2027 | 55 | 52 | ||||||||||
Laboratory Corp of America Holdings | ||||||||||||
3.600%, 02/01/2025 | 285 | 284 | ||||||||||
Medtronic | ||||||||||||
3.500%, 03/15/2025 | 920 | 944 | ||||||||||
Mylan | ||||||||||||
3.950%, 06/15/2026 | 226 | 212 | ||||||||||
Perrigo Finance Unlimited | ||||||||||||
3.900%, 12/15/2024 | 320 | 312 | ||||||||||
3.500%, 12/15/2021 | 217 | 220 | ||||||||||
Teva Pharmaceutical Finance Netherlands III | ||||||||||||
3.150%, 10/01/2026 | 461 | 425 | ||||||||||
2.800%, 07/21/2023 | 691 | 652 | ||||||||||
| SEI Institutional Investments Trust / Semi-Annual Report / November 30, 2016 | 223 |
CONSOLIDATED SCHEDULE OF INVESTMENTS (Unaudited)
Multi-Asset Real Return Fund (Continued)
November 30, 2016
| Description | Face Amount (Thousands) | Market Value ($ Thousands) | ||||||||||
Valeant Pharmaceuticals International | ||||||||||||
6.125%, 04/15/2025 (D) | $ | 415 | $ | 307 | ||||||||
|
| |||||||||||
| 6,341 | ||||||||||||
|
| |||||||||||
Industrials — 0.2% | ||||||||||||
AerCap Aviation Solutions | ||||||||||||
6.375%, 05/30/2017 | 355 | 363 | ||||||||||
Allison Transmission | ||||||||||||
5.000%, 10/01/2024 (D) | 216 | 218 | ||||||||||
Avis Budget Car Rental LLC | ||||||||||||
5.250%, 03/15/2025 (D) | 320 | 295 | ||||||||||
General Electric | ||||||||||||
5.000%, 12/29/2049 (C) | 200 | 204 | ||||||||||
International Lease Finance | ||||||||||||
5.875%, 04/01/2019 | 249 | 265 | ||||||||||
SPX FLOW | ||||||||||||
5.875%, 08/15/2026 (D) | 124 | 121 | ||||||||||
5.625%, 08/15/2024 (D) | 124 | 122 | ||||||||||
|
| |||||||||||
| 1,588 | ||||||||||||
|
| |||||||||||
Information Technology — 0.6% | ||||||||||||
Diamond 1 Finance | ||||||||||||
7.125%, 06/15/2024 (D) | 379 | 414 | ||||||||||
4.420%, 06/15/2021 (D) | 935 | 962 | ||||||||||
Fidelity National Information Services | ||||||||||||
5.000%, 10/15/2025 | 3 | 3 | ||||||||||
3.500%, 04/15/2023 | 126 | 128 | ||||||||||
Intel | ||||||||||||
4.800%, 10/01/2041 | 95 | 104 | ||||||||||
KLA-Tencor | ||||||||||||
4.650%, 11/01/2024 | 691 | 729 | ||||||||||
Lam Research | ||||||||||||
2.800%, 06/15/2021 | 437 | 434 | ||||||||||
Micron Technology | ||||||||||||
7.500%, 09/15/2023 (D) | 234 | 259 | ||||||||||
Seagate HDD Cayman | ||||||||||||
4.750%, 01/01/2025 | 343 | 320 | ||||||||||
Total System Services | ||||||||||||
2.375%, 06/01/2018 | 90 | 90 | ||||||||||
Western Digital | ||||||||||||
7.375%, 04/01/2023 (D) | 517 | 558 | ||||||||||
|
| |||||||||||
| 4,001 | ||||||||||||
|
| |||||||||||
Materials — 0.2% | ||||||||||||
Barrick Gold | ||||||||||||
4.100%, 05/01/2023 | 49 | 51 | ||||||||||
Dow Chemical | ||||||||||||
4.250%, 11/15/2020 | 41 | 43 | ||||||||||
International Paper | ||||||||||||
4.750%, 02/15/2022 | 305 | 330 | ||||||||||
| Description | Face Amount (Thousands) | Market Value ($ Thousands) | ||||||||||
LyondellBasell Industries | ||||||||||||
5.750%, 04/15/2024 | $ | 1,125 | $ | 1,278 | ||||||||
|
| |||||||||||
| 1,702 | ||||||||||||
|
| |||||||||||
Real Estate — 0.1% | ||||||||||||
Healthcare Realty Trust | ||||||||||||
5.750%, 01/15/2021 | 320 | 353 | ||||||||||
Host Hotels & Resorts | ||||||||||||
5.250%, 03/15/2022 | 70 | 76 | ||||||||||
3.750%, 10/15/2023 | 13 | 13 | ||||||||||
Welltower | ||||||||||||
4.000%, 06/01/2025 | 565 | 578 | ||||||||||
|
| |||||||||||
| 1,020 | ||||||||||||
|
| |||||||||||
Telecommunication Services — 0.9% | ||||||||||||
AT&T | ||||||||||||
4.750%, 05/15/2046 | 148 | 138 | ||||||||||
4.600%, 02/15/2021 | 60 | 64 | ||||||||||
3.800%, 03/15/2022 | 110 | 112 | ||||||||||
3.400%, 05/15/2025 | 280 | 269 | ||||||||||
3.000%, 02/15/2022 | 485 | 481 | ||||||||||
CenturyLink | ||||||||||||
7.500%, 04/01/2024 | 247 | 255 | ||||||||||
6.450%, 06/15/2021 | 270 | 279 | ||||||||||
Cox Communications | ||||||||||||
2.950%, 06/30/2023 (D) | 173 | 162 | ||||||||||
RELX Capital | ||||||||||||
8.625%, 01/15/2019 | 455 | 513 | ||||||||||
SBA Tower Trust | ||||||||||||
3.156%, 10/15/2020 (D) | 753 | 770 | ||||||||||
Sprint Capital | ||||||||||||
6.900%, 05/01/2019 | 1,070 | 1,116 | ||||||||||
Sprint Spectrum LLC | ||||||||||||
3.360%, 09/20/2021 (D) | 395 | 396 | ||||||||||
Verizon Communications | ||||||||||||
4.600%, 04/01/2021 | 850 | 913 | ||||||||||
3.850%, 11/01/2042 | 323 | 279 | ||||||||||
3.500%, 11/01/2024 | 611 | 615 | ||||||||||
Ziggo Secured Finance | ||||||||||||
5.500%, 01/15/2027 (D) | 565 | 542 | ||||||||||
|
| |||||||||||
| 6,904 | ||||||||||||
|
| |||||||||||
Utilities — 0.2% | ||||||||||||
Berkshire Hathaway Energy | ||||||||||||
6.125%, 04/01/2036 | 275 | 342 | ||||||||||
CMS Energy | ||||||||||||
5.050%, 03/15/2022 | 52 | 57 | ||||||||||
Constellation Energy Group | ||||||||||||
5.150%, 12/01/2020 | 26 | 28 | ||||||||||
Entergy | ||||||||||||
4.000%, 07/15/2022 | 648 | 680 | ||||||||||
| 224 | SEI Institutional Investments Trust / Semi-Annual Report / November 30, 2016 |
| Description | Face Amount (Thousands) | Market Value ($ Thousands) | ||||||||||
Exelon Generation LLC | ||||||||||||
4.250%, 06/15/2022 | $ | 360 | $ | 375 | ||||||||
Pacific Gas & Electric | ||||||||||||
4.500%, 12/15/2041 | 65 | 68 | ||||||||||
|
| |||||||||||
| 1,550 | ||||||||||||
|
| |||||||||||
Total Corporate Obligations | 47,140 | |||||||||||
|
| |||||||||||
SOVEREIGN DEBT — 4.4% | ||||||||||||
Brazil Notas do Tesouro Nacional | ||||||||||||
10.000%, 01/01/2017 | BRL | 4,890 | 1,440 | |||||||||
Brazil Notas do Tesouro Nacional Serie F | ||||||||||||
10.000%, 01/01/2027 | 6,340 | 1,686 | ||||||||||
Japan Treasury Discount Bill | ||||||||||||
0.000%, 02/27/2017 (A) | JPY | 3,240,000 | 28,453 | |||||||||
Qatar Government International Bond | ||||||||||||
2.375%, 06/02/2021 (D) | $ | 652 | 643 | |||||||||
United Mexican States MTN | ||||||||||||
5.950%, 03/19/2019 | 94 | 102 | ||||||||||
|
| |||||||||||
Total Sovereign Debt | 32,324 | |||||||||||
|
| |||||||||||
ASSET-BACKED SECURITIES — 3.4% |
| |||||||||||
Automotive — 1.8% | ||||||||||||
Ally Auto Receivables Trust, Ser 2015-2, Cl A3 | ||||||||||||
1.490%, 11/15/2019 | 364 | 365 | ||||||||||
ARI Fleet Lease Trust, Ser 2014-A, Cl A2 | ||||||||||||
0.810%, 11/15/2022 (D) | 36 | 36 | ||||||||||
Avis Budget Rental Car Funding AESOP LLC, Ser 2013-2A, Cl A | ||||||||||||
2.970%, 02/20/2020 (D) | 710 | 720 | ||||||||||
Avis Budget Rental Car Funding AESOP LLC, Ser 2016-1A, Cl A | ||||||||||||
2.990%, 06/20/2022 (D) | 438 | 440 | ||||||||||
Bank of The West Auto Trust, Ser 2015-1, Cl A3 | ||||||||||||
1.310%, 10/15/2019 (D) | 748 | 748 | ||||||||||
California Republic Auto Receivables Trust, Ser 2014-2, Cl A4 | ||||||||||||
1.570%, 12/16/2019 | 722 | 723 | ||||||||||
California Republic Auto Receivables Trust, Ser 2015-2, Cl A3 | ||||||||||||
1.310%, 08/15/2019 | 502 | 501 | ||||||||||
Capital Auto Receivables Asset Trust, Ser 2014- 1, Cl B | ||||||||||||
2.220%, 01/22/2019 | 160 | 160 | ||||||||||
CPS Auto Receivables Trust, Ser 2013-B, Cl A | ||||||||||||
1.820%, 09/15/2020 (D) | 177 | 176 | ||||||||||
| Description | Face Amount (Thousands) | Market Value ($ Thousands) | ||||||||||
CPS Auto Receivables Trust, Ser 2014-B, Cl A | ||||||||||||
1.110%, 11/15/2018 (D) | $ | 69 | $ | 69 | ||||||||
Drive Auto Receivables Trust, Ser 2016-BA, Cl A2 | ||||||||||||
1.380%, 08/15/2018 (D) | 502 | 502 | ||||||||||
Enterprise Fleet Financing LLC, Ser 2014-1, Cl A2 | ||||||||||||
0.870%, 09/20/2019 (D) | 28 | 28 | ||||||||||
Enterprise Fleet Financing LLC, Ser 2015-1, Cl A2 | ||||||||||||
1.300%, 09/20/2020 (D) | 408 | 408 | ||||||||||
Exeter Automobile Receivables Trust, Ser 2016- 1A, Cl D | ||||||||||||
8.200%, 02/15/2023 (D) | 280 | 295 | ||||||||||
Exeter Automobile Receivables Trust, Ser 2016- 3A, Cl A | ||||||||||||
1.840%, 11/16/2020 (D) | 382 | 382 | ||||||||||
First Investors Auto Owner Trust, Ser 2016-2A, Cl A1 | ||||||||||||
1.530%, 11/16/2020 (D) | 615 | 614 | ||||||||||
Flagship Credit Auto Trust, Ser 2016-2, Cl D | ||||||||||||
8.560%, 11/15/2023 (D) | 365 | 384 | ||||||||||
Flagship Credit Auto Trust, Ser 2016-4, Cl D | ||||||||||||
3.890%, 11/15/2022 (D) | 375 | 371 | ||||||||||
Ford Credit Auto Owner Trust, Ser 2012-D, Cl B | ||||||||||||
1.010%, 05/15/2018 | 88 | 88 | ||||||||||
Ford Credit Auto Owner Trust, Ser 2014-2, Cl A | ||||||||||||
2.310%, 04/15/2026 (D) | 640 | 648 | ||||||||||
Ford Credit Floorplan Master Owner Trust, Ser 2015-2, Cl A2 | ||||||||||||
1.105%, 01/15/2022 (C) | 741 | 744 | ||||||||||
Harley-Davidson Motorcycle Trust, Ser 2014-1, Cl A3 | ||||||||||||
1.100%, 09/15/2019 | 218 | 218 | ||||||||||
Harley-Davidson Motorcycle Trust, Ser 2015-2, Cl A3 | ||||||||||||
1.300%, 03/16/2020 | 748 | 748 | ||||||||||
Hertz Fleet Lease Funding, Ser 2013-3, Cl A | ||||||||||||
1.079%, 12/10/2027 (C) (D) | 172 | 172 | ||||||||||
Hertz Vehicle Financing II LP, Ser 2015-2A, Cl A | ||||||||||||
2.020%, 09/25/2019 (D) | 542 | 537 | ||||||||||
Hertz Vehicle Financing LLC, Ser 2013-1A, Cl B2 | ||||||||||||
2.480%, 08/25/2019 (D) | 395 | 388 | ||||||||||
Hertz Vehicle Financing LLC, Ser 2016-1A, Cl A | ||||||||||||
2.320%, 03/25/2020 (D) | 352 | 350 | ||||||||||
Hyundai Auto Lease Securitization Trust, Ser 2015-A, Cl A2 | ||||||||||||
1.000%, 10/16/2017 (D) | 6 | 6 | ||||||||||
Mercedes Benz Auto Lease Trust, Ser 2015-B, Cl A3 | ||||||||||||
1.340%, 07/16/2018 | 343 | 344 | ||||||||||
| SEI Institutional Investments Trust / Semi-Annual Report / November 30, 2016 | 225 |
CONSOLIDATED SCHEDULE OF INVESTMENTS (Unaudited)
Multi-Asset Real Return Fund (Continued)
November 30, 2016
| Description | Face Amount (Thousands) | Market Value ($ Thousands) | ||||||||
Porsche Innovative Lease Owner Trust, Ser 2015-1, Cl A4 | ||||||||||
1.430%, 05/21/2021 (D) | $ | 746 | $ | 746 | ||||||
Santander Drive Auto Receivables Trust, Ser 2013-2, Cl E | ||||||||||
2.980%, 04/15/2020 (D) | 750 | 758 | ||||||||
Santander Drive Auto Receivables Trust, Ser 2015-4, Cl A2A | ||||||||||
1.200%, 12/17/2018 | 40 | 40 | ||||||||
Santander Drive Auto Receivables Trust, Ser 2016-3, Cl A2A | ||||||||||
1.340%, 11/15/2019 | 402 | 402 | ||||||||
Westlake Automobile Receivables Trust, Ser 2015-3A, Cl A2A | ||||||||||
1.420%, 05/17/2021 (D) | 133 | 133 | ||||||||
|
| |||||||||
| 13,244 | ||||||||||
|
| |||||||||
Credit Cards — 0.3% | ||||||||||
Cabela’s Credit Card Master Note Trust, Ser 2014-1, Cl A | ||||||||||
0.885%, 03/16/2020 (C) | 500 | 500 | ||||||||
Synchrony Credit Card Master Note Trust, Ser 2012-2, Cl A | ||||||||||
2.220%, 01/15/2022 | 1,098 | 1,109 | ||||||||
Synchrony Credit Card Master Note Trust, Ser 2016-1, Cl A | ||||||||||
2.040%, 03/15/2022 | 247 | 249 | ||||||||
World Financial Network Credit Card Master Trust, Ser 2013-A, Cl A | ||||||||||
1.610%, 12/15/2021 | 161 | 161 | ||||||||
World Financial Network Credit Card Master Trust, Ser 2015-A, Cl A | ||||||||||
1.018%, 02/15/2022 (C) | 424 | 425 | ||||||||
|
| |||||||||
| 2,444 | ||||||||||
|
| |||||||||
Other Asset-Backed Securities — 1.3% |
| |||||||||
Ally Master Owner Trust, Ser 2014-1, Cl A2 | ||||||||||
1.290%, 01/15/2019 | 1,051 | 1,051 | ||||||||
Ally Master Owner Trust, Ser 2015-3, Cl A | ||||||||||
1.630%, 05/15/2020 | 788 | 789 | ||||||||
BMW Floorplan Master Owner Trust, Ser 2015- 1A, Cl A | ||||||||||
1.035%, 07/15/2020 (C) (D) | 1,062 | 1,064 | ||||||||
Citi Held For Asset Issuance, Ser 2016-PM1, Cl A | ||||||||||
4.650%, 04/15/2025 (D) | 293 | 297 | ||||||||
CNH Equipment Trust, Ser 2015-A, Cl A4 | ||||||||||
1.850%, 04/15/2021 | 520 | 523 | ||||||||
Dell Equipment Finance Trust, Ser 2015-1, Cl A3 | ||||||||||
1.300%, 03/23/2020 (D) | 258 | 258 | ||||||||
| Description | Face Amount (Thousands) | Market Value ($ Thousands) | ||||||||
Dell Equipment Finance Trust, Ser 2015-2, Cl A2A | ||||||||||
1.420%, 12/22/2017 (D) | $ | 184 | $ | 184 | ||||||
Ford Credit Floorplan Master Owner Trust, Ser 2014-1, Cl A1 | ||||||||||
1.200%, 02/15/2019 | 770 | 770 | ||||||||
GE Dealer Floorplan Master Note Trust, Ser 2014-1, Cl A | ||||||||||
0.906%, 07/20/2019 (C) | 481 | 481 | ||||||||
GE Dealer Floorplan Master Note Trust, Ser 2015-1, Cl A | ||||||||||
1.026%, 01/20/2020 (C) | 683 | 684 | ||||||||
Marlette Funding Trust, Ser 2016-1A, Cl A | ||||||||||
3.060%, 01/17/2023 (D) | 294 | 294 | ||||||||
SoFi Consumer Loan Program LLC, Ser 2016- 2A, Cl A | ||||||||||
3.090%, 10/27/2025 (D) | 481 | 481 | ||||||||
Sofi Consumer Loan Program LLC, Ser 2016-3, Cl A | ||||||||||
3.050%, 12/26/2025 (D) | 557 | 556 | ||||||||
Taco Bell Funding LLC, Ser 2016-1A, Cl A2I | ||||||||||
3.832%, 05/25/2046 (D) | 557 | 551 | ||||||||
Volkswagen Credit Auto Master Trust, Ser 2014-1A, Cl A1 | ||||||||||
0.876%, 07/22/2019 (C) (D) | 350 | 349 | ||||||||
Volvo Financial Equipment LLC, Ser 2015-1A, Cl A3 | ||||||||||
1.510%, 06/17/2019 (D) | 742 | 743 | ||||||||
|
| |||||||||
| 9,075 | ||||||||||
|
| |||||||||
Total Asset-Backed Securities | 24,763 | |||||||||
|
| |||||||||
FOREIGN BONDS — 1.7% | ||||||||||
ABN AMRO Bank | ||||||||||
4.750%, 07/28/2025 (D) | 200 | 202 | ||||||||
Barclays Bank PLC | ||||||||||
7.750%, 04/10/2023 (C) | 321 | 332 | ||||||||
6.860%, 09/29/2049 (C) (D) | 106 | 122 | ||||||||
6.625%, 03/30/2022 | EUR | 75 | 96 | |||||||
3.650%, 03/16/2025 | $ | 235 | 224 | |||||||
Basell Finance | ||||||||||
8.100%, 03/15/2027 (D) | 70 | 90 | ||||||||
BNP Paribas MTN | ||||||||||
2.250%, 01/11/2027 | EUR | 340 | 341 | |||||||
Cenovus Energy | ||||||||||
5.700%, 10/15/2019 | $ | 178 | 189 | |||||||
Credit Agricole | ||||||||||
8.125%, 12/31/2049 (C) (D) | 210 | 217 | ||||||||
Credit Suisse Group Funding Guernsey | ||||||||||
3.750%, 03/26/2025 | 375 | 360 | ||||||||
| 226 | SEI Institutional Investments Trust / Semi-Annual Report / November 30, 2016 |
| Description | Face Amount (Thousands) | Market Value ($ Thousands) | ||||||||||
Ecopetrol | ||||||||||||
5.875%, 05/28/2045 | $ | 252 | $ | 206 | ||||||||
Empresa de Transporte de Pasajeros Metro | ||||||||||||
4.750%, 02/04/2024 (D) | 296 | 311 | ||||||||||
Grupo Bimbo | ||||||||||||
3.875%, 06/27/2024 (D) | 553 | 548 | ||||||||||
International Game Technology | ||||||||||||
6.250%, 02/15/2022 (D) | 380 | 404 | ||||||||||
Intesa Sanpaolo MTN | ||||||||||||
5.017%, 06/26/2024 (D) | 583 | 519 | ||||||||||
Israel Electric | ||||||||||||
5.000%, 11/12/2024 (D) | 581 | 597 | ||||||||||
Korea National Oil | ||||||||||||
3.125%, 04/03/2017 (D) | 200 | 201 | ||||||||||
Lloyds Banking Group | ||||||||||||
7.500%, 12/01/2099 (C) | 371 | 378 | ||||||||||
MCE Finance | ||||||||||||
5.000%, 02/15/2021 (D) | 250 | 251 | ||||||||||
Minerva Luxembourg | ||||||||||||
6.500%, 09/20/2026 (D) | 233 | 219 | ||||||||||
Minsur | ||||||||||||
6.250%, 02/07/2024 (D) | 320 | 329 | ||||||||||
Mizuho Financial Group Cayman 3 | ||||||||||||
4.600%, 03/27/2024 (D) | 631 | 662 | ||||||||||
NOVA Chemicals | ||||||||||||
5.250%, 08/01/2023 (D) | 339 | 340 | ||||||||||
Numericable Group | ||||||||||||
5.375%, 05/15/2022 (D) | EUR | 223 | 246 | |||||||||
Odebrecht Finance | ||||||||||||
7.125%, 06/26/2042 (D) | $ | 571 | 308 | |||||||||
5.250%, 06/27/2029 (D) | 369 | 203 | ||||||||||
Petrobras International Finance | ||||||||||||
5.750%, 01/20/2020 | 702 | 704 | ||||||||||
Petroleos Mexicanos MTN | ||||||||||||
4.625%, 09/21/2023 (D) | 760 | 713 | ||||||||||
Rogers Communications | ||||||||||||
4.000%, 06/06/2022 | CAD | 20 | 16 | |||||||||
Royal Bank of Scotland MTN | ||||||||||||
9.500%, 03/16/2022 (C) | $ | 10 | 10 | |||||||||
Royal Bank of Scotland Group | ||||||||||||
7.640%, 09/29/2017 (C) | 300 | 276 | ||||||||||
7.500%, 12/29/2049 (C) | 350 | 316 | ||||||||||
Santander UK | ||||||||||||
5.000%, 11/07/2023 (D) | 555 | 560 | ||||||||||
Sociedad Quimica y Minera de Chile | ||||||||||||
3.625%, 04/03/2023 (D) | 280 | 272 | ||||||||||
Societe Generale | ||||||||||||
5.922%, 04/05/2017 (C) (D) | 100 | 99 | ||||||||||
Standard Chartered | ||||||||||||
6.409%, 01/30/2049 (C) (D) | 400 | 312 | ||||||||||
UBS Group Funding Jersey | ||||||||||||
4.125%, 09/24/2025 (D) | 486 | 490 | ||||||||||
| Description | Face Amount (Thousands) | Market Value ($ Thousands) | ||||||||||
Virgolino de Oliveira Finance | ||||||||||||
10.500%, 01/28/2018 (D) (F) | $ | 500 | $ | 35 | ||||||||
Wind Acquisition Finance | ||||||||||||
4.750%, 07/15/2020 (D) | 360 | 360 | ||||||||||
Yamana | ||||||||||||
4.950%, 07/15/2024 | 359 | 352 | ||||||||||
|
| |||||||||||
Total Foreign Bonds | 12,410 | |||||||||||
|
| |||||||||||
| Shares | ||||||||||||
FOREIGN COMMON STOCK — 0.5% |
| |||||||||||
Puerto Rico — 0.5% | ||||||||||||
Popular | 89,900 | 3,655 | ||||||||||
|
| |||||||||||
Total Foreign Common Stock | 3,655 | |||||||||||
|
| |||||||||||
Total Investments — 114.9% | $ | 843,529 | ||||||||||
|
| |||||||||||
COMMON STOCK SOLD SHORT— (13.4)% |
| |||||||||||
Consumer Discretionary — (6.9)% | ||||||||||||
1-800-Flowers.com, Cl A* | (22,700 | ) | (239 | ) | ||||||||
Amazon.com* | (170 | ) | (128 | ) | ||||||||
America’s Car-Mart* | (8,700 | ) | (396 | ) | ||||||||
Arctic Cat | (32,600 | ) | (497 | ) | ||||||||
Ascena Retail Group* | (389,400 | ) | (2,352 | ) | ||||||||
Ascent Capital Group, Cl A* | (10,900 | ) | (197 | ) | ||||||||
Beazer Homes USA* | (115,600 | ) | (1,558 | ) | ||||||||
Boot Barn Holdings* | (6,500 | ) | (103 | ) | ||||||||
BorgWarner | (72,400 | ) | (2,577 | ) | ||||||||
Bridgepoint Education* | (7,800 | ) | (79 | ) | ||||||||
Carmax* | (51,200 | ) | (2,959 | ) | ||||||||
Cherokee* | (5,100 | ) | (53 | ) | ||||||||
Chipotle Mexican Grill, Cl A* | (7,939 | ) | (3,146 | ) | ||||||||
ClubCorp Holdings | (26,000 | ) | (338 | ) | ||||||||
Crocs* | (142,000 | ) | (994 | ) | ||||||||
Del Frisco’s Restaurant Group* | (11,500 | ) | (198 | ) | ||||||||
Delphi Automotive | (3,200 | ) | (205 | ) | ||||||||
Destination XL Group* | (9,000 | ) | (37 | ) | ||||||||
Dollar Tree* | (9,700 | ) | (855 | ) | ||||||||
EW Scripps, Cl A* | (59,500 | ) | (1,019 | ) | ||||||||
Federal-Mogul Holdings, Cl A* | (6,600 | ) | (63 | ) | ||||||||
Fiesta Restaurant Group* | (42,200 | ) | (1,209 | ) | ||||||||
Fox Factory Holding* | (13,500 | ) | (339 | ) | ||||||||
Fred’s, Cl A | (43,200 | ) | (432 | ) | ||||||||
Gaia, Cl A* | (2,900 | ) | (25 | ) | ||||||||
Gentherm* | (25,900 | ) | (825 | ) | ||||||||
G-III Apparel Group* | (33,700 | ) | (915 | ) | ||||||||
Global Eagle Entertainment* | (35,700 | ) | (229 | ) | ||||||||
| SEI Institutional Investments Trust / Semi-Annual Report / November 30, 2016 | 227 |
CONSOLIDATED SCHEDULE OF INVESTMENTS (Unaudited)
Multi-Asset Real Return Fund (Continued)
November 30, 2016
| Description | Shares | Market Value ($ Thousands) | ||||||
Gray Television* | (35,200 | ) | $ | (356 | ) | |||
Groupon, Cl A* | (172,300 | ) | (684 | ) | ||||
H&R Block | (16,000 | ) | (355 | ) | ||||
Hanesbrands | (107,200 | ) | (2,490 | ) | ||||
Harley-Davidson | (72,100 | ) | (4,390 | ) | ||||
Horizon Global* | (2,400 | ) | (55 | ) | ||||
Houghton Mifflin Harcourt* | (88,900 | ) | (982 | ) | ||||
Kate Spade* | (79,100 | ) | (1,175 | ) | ||||
Kona Grill* | (15,900 | ) | (196 | ) | ||||
La Quinta Holdings* | (12,400 | ) | (151 | ) | ||||
Liberty Global, Cl A* | (29,600 | ) | (927 | ) | ||||
Liberty Global LiLAC* | (15,421 | ) | (333 | ) | ||||
Liberty Interactive, Cl A* | (29,400 | ) | (609 | ) | ||||
Madison Square Garden, Cl A* | — | — | ||||||
Monro Muffler | (3,500 | ) | (209 | ) | ||||
Motorcar Parts & Accessories* | (26,300 | ) | (643 | ) | ||||
Nautilus* | (37,200 | ) | (640 | ) | ||||
NetFlix* | (33,800 | ) | (3,955 | ) | ||||
New Home* | (10,200 | ) | (118 | ) | ||||
Newell Brands | — | — | ||||||
Norwegian Cruise Line Holdings* | (10,600 | ) | (422 | ) | ||||
Penn National Gaming* | (63,400 | ) | (842 | ) | ||||
Pinnacle Entertainment* | (35,900 | ) | (489 | ) | ||||
Ruby Tuesday* | (109,300 | ) | (330 | ) | ||||
Signet Jewelers | (12,500 | ) | (1,141 | ) | ||||
Skechers U.S.A., Cl A* | (31,600 | ) | (720 | ) | ||||
Sonic | (2,800 | ) | (73 | ) | ||||
Sotheby’s | (20,900 | ) | (816 | ) | ||||
Taylor Morrison Home, Cl A* | (24,900 | ) | (493 | ) | ||||
Time | (144,700 | ) | (2,344 | ) | ||||
TripAdvisor* | (35,800 | ) | (1,728 | ) | ||||
Tuesday Morning* | (52,900 | ) | (246 | ) | ||||
Vince Holding* | (18,200 | ) | (77 | ) | ||||
William Lyon Homes, Cl A* | (20,700 | ) | (410 | ) | ||||
Zagg* | (15,700 | ) | (104 | ) | ||||
|
| |||||||
| (50,470 | ) | |||||||
|
| |||||||
Financials — (0.6)% | ||||||||
eHealth* | (15,700 | ) | (159 | ) | ||||
First NBC Bank Holding* | (31,000 | ) | (219 | ) | ||||
Genworth Financial, Cl A* | (29,700 | ) | (127 | ) | ||||
Greenlight Capital Re, Cl A* | (17,500 | ) | (398 | ) | ||||
Home BancShares | (15,600 | ) | (404 | ) | ||||
OneMain Holdings, Cl A* | (26,500 | ) | (540 | ) | ||||
PHH* | (70,900 | ) | (1,030 | ) | ||||
Safeguard Scientifics* | (4,800 | ) | (56 | ) | ||||
TFS Financial | (40,900 | ) | (762 | ) | ||||
Yadkin Financial | (15,100 | ) | (495 | ) | ||||
|
| |||||||
| (4,190 | ) | |||||||
|
| |||||||
| Description | Shares | Market Value ($ Thousands) | ||||||
Industrials — (1.4)% | ||||||||
Acacia Research | (27,889 | ) | $ | (192 | ) | |||
Aerovironment* | (12,900 | ) | (365 | ) | ||||
Builders FirstSource* | (100,500 | ) | (1,112 | ) | ||||
CDI | (13,000 | ) | (94 | ) | ||||
Celadon Group | (8,600 | ) | (69 | ) | ||||
Chart Industries* | (21,900 | ) | (779 | ) | ||||
DXP Enterprises* | (37,700 | ) | (1,270 | ) | ||||
Engility Holdings* | (9,300 | ) | (337 | ) | ||||
Hertz Global Holdings* | (9,000 | ) | (227 | ) | ||||
Kirby* | (2,700 | ) | (171 | ) | ||||
KLX* | (10,500 | ) | (409 | ) | ||||
Kratos Defense & Security Solutions* | (8,500 | ) | (62 | ) | ||||
LB Foster, Cl A | (7,700 | ) | (94 | ) | ||||
LMI Aerospace* | (3,700 | ) | (34 | ) | ||||
MRC Global* | (53,400 | ) | (1,075 | ) | ||||
NN | (5,600 | ) | (95 | ) | ||||
Northwest Pipe* | (4,500 | ) | (79 | ) | ||||
NOW* | (36,600 | ) | (788 | ) | ||||
Sparton* | (3,400 | ) | (83 | ) | ||||
SPX* | (3,300 | ) | (81 | ) | ||||
SPX FLOW* | (17,200 | ) | (539 | ) | ||||
Team* | (1,400 | ) | (48 | ) | ||||
Triumph Group | (49,900 | ) | (1,387 | ) | ||||
Twin Disc | (2,400 | ) | (35 | ) | ||||
Wesco Aircraft Holdings* | (35,600 | ) | (525 | ) | ||||
YRC Worldwide* | (23,600 | ) | (299 | ) | ||||
|
| |||||||
| (10,249 | ) | |||||||
|
| |||||||
Information Technology — (2.7)% | ||||||||
Advanced Micro Devices* | (154,300 | ) | (1,375 | ) | ||||
Apple | (9,100 | ) | (1,006 | ) | ||||
Applied Micro Circuits* | (81,800 | ) | (716 | ) | ||||
Black Box | (8,100 | ) | (124 | ) | ||||
Brocade Communications Systems | (1 | ) | — | |||||
CalAmp* | (22,900 | ) | (333 | ) | ||||
Calix* | (25,300 | ) | (191 | ) | ||||
Cray* | (18,100 | ) | (349 | ) | ||||
CUI Global* | (8,200 | ) | (50 | ) | ||||
Cypress Semiconductor | (363,800 | ) | (4,093 | ) | ||||
Electro Scientific Industries* | (21,400 | ) | (111 | ) | ||||
FormFactor* | (12,900 | ) | (145 | ) | ||||
Harmonic* | (119,100 | ) | (554 | ) | ||||
Immersion* | (44,600 | ) | (459 | ) | ||||
Infinera* | (449,600 | ) | (3,822 | ) | ||||
Lattice Semiconductor* | (247,000 | ) | (1,731 | ) | ||||
MACOM Technology Solutions Holdings* | (9,900 | ) | (493 | ) | ||||
Microchip Technology | (1 | ) | — | |||||
PDF Solutions* | (2,800 | ) | (66 | ) | ||||
ShoreTel* | (24,700 | ) | (173 | ) | ||||
Sonus Networks* | (40,000 | ) | (241 | ) | ||||
Veeco Instruments* | (29,500 | ) | (786 | ) | ||||
| 228 | SEI Institutional Investments Trust / Semi-Annual Report / November 30, 2016 |
| Description | Shares | Market Value ($ Thousands) | ||||||
VeriFone Systems* | (119,400 | ) | $ | (2,017 | ) | |||
ViaSat* | (14,000 | ) | (998 | ) | ||||
Western Digital | — | — | ||||||
Zebra Technologies, Cl A* | (2,900 | ) | (229 | ) | ||||
|
| |||||||
| (20,062 | ) | |||||||
|
| |||||||
Materials — (1.8)% | ||||||||
A. Schulman | (9,700 | ) | (323 | ) | ||||
Balchem | (2,100 | ) | (168 | ) | ||||
Century Aluminum* | (343,600 | ) | (3,168 | ) | ||||
CF Industries Holdings | (135,800 | ) | (3,930 | ) | ||||
Freeport-McMoRan, Cl B | (240,400 | ) | (3,690 | ) | ||||
Olin | (25,900 | ) | (673 | ) | ||||
Real Industry* | (13,300 | ) | (78 | ) | ||||
TimkenSteel* | (80,600 | ) | (1,273 | ) | ||||
|
| |||||||
| (13,303 | ) | |||||||
|
| |||||||
Real Estate — 0.0% | ||||||||
Forestar Group* | (29,000 | ) | (388 | ) | ||||
Kennedy-Wilson Holdings | (4,300 | ) | (92 | ) | ||||
|
| |||||||
| (480 | ) | |||||||
|
| |||||||
Total Common Stock Sold Short | (98,754 | ) | ||||||
|
| |||||||
Total Investments Sold Short — (13.4)% | $ | (98,754 | ) | |||||
|
| |||||||
A list of the open futures contracts held by the Fund at November 30, 2016, is as follows:
| Type of Contract | Number of Contracts Long (Short) | Expiration Date | Unrealized Appreciation (Depreciation) ($ Thousands) | |||||||||
Coffee | 36 | Mar-2017 | $ | (99 | ) | |||||||
Copper | 109 | Mar-2017 | 456 | |||||||||
Corn | (114 | ) | Dec-2017 | 16 | ||||||||
Corn | 422 | Mar-2017 | (150 | ) | ||||||||
Cotton No. 2 | (41 | ) | Jul-2017 | — | ||||||||
Cotton No. 2 | 63 | Mar-2017 | 71 | |||||||||
Crude Oil | 303 | Jan-2017 | 29 | |||||||||
Gasoline | 19 | Mar-2017 | (11 | ) | ||||||||
Gold | 113 | Feb-2017 | (1,054 | ) | ||||||||
Heating Oil | 101 | Jan-2017 | (126 | ) | ||||||||
ICE Brent Crude | 45 | Dec-2017 | 42 | |||||||||
ICE Brent Crude | 260 | Feb-2017 | 890 | |||||||||
Lean Hogs | 20 | Feb-2017 | 12 | |||||||||
Live Cattle | 120 | Mar-2017 | 274 | |||||||||
LME Aluminum | 56 | Jan-2017 | 34 | |||||||||
LME Nickel | 109 | Jan-2017 | 294 | |||||||||
LME Zinc | 97 | Jan-2017 | 868 | |||||||||
MSCI EAFE Index E-MINI | (125 | ) | Dec-2016 | 418 | ||||||||
Natural Gas | 443 | Jan-2017 | (605 | ) | ||||||||
| Type of Contract | Number of Contracts Long (Short) | Expiration Date | Unrealized Appreciation (Depreciation) ($ Thousands) | |||||||||
Natural Gas | 112 | Feb-2017 | $ | 93 | ||||||||
Platinum | 31 | Jan-2017 | (121 | ) | ||||||||
RBOB Gasoline | 69 | Dec-2016 | 18 | |||||||||
S&P 500 Index E-MINI | (103 | ) | Dec-2016 | (249 | ) | |||||||
Silver | 44 | Mar-2017 | (392 | ) | ||||||||
Soybean | 101 | Jan-2017 | 174 | |||||||||
Soybean | 41 | May-2017 | (4 | ) | ||||||||
Soybean | (43 | ) | Nov-2017 | 2 | ||||||||
Soybean Meal | 177 | Jan-2017 | 245 | |||||||||
Soybean Oil | 124 | Jan-2017 | 110 | |||||||||
Sugar No. 11 | (148 | ) | Jul-2017 | (129 | ) | |||||||
Sugar No. 11 | 583 | May-2017 | (457 | ) | ||||||||
U.S. 10-Year Treasury Note | (114 | ) | Mar-2017 | 43 | ||||||||
U.S. 2-Year Treasury Note | (82 | ) | Apr-2017 | 18 | ||||||||
U.S. 5-Year Treasury Note | 62 | Mar-2017 | (20 | ) | ||||||||
U.S. Ultra Long Treasury Bond | 10 | Mar-2017 | (3 | ) | ||||||||
Wheat | 111 | Mar-2017 | (106 | ) | ||||||||
Wheat | 260 | Mar-2017 | (313 | ) | ||||||||
|
| |||||||||||
| $ | 268 | |||||||||||
|
| |||||||||||
For the period ended November 30, 2016, the total amount of all open futures contracts, as presented in the table above, are representative of the volume of activity for the derivative type during the period.
A list of the open forward foreign currency contracts held by the Fund at November 30, 2016, is as follows:
Settlement Date | Currency | Currency | Unrealized Appreciation (Depreciation) ($ Thousands) | |||||||||||||||||
12/2/16 | BRL | 6,661 | USD | 2,079 | $ | 110 | ||||||||||||||
1/4/17 | BRL | 11,796 | USD | 3,057 | (394 | ) | ||||||||||||||
12/8/16 | TWD | 41,452 | USD | 1,291 | (9 | ) | ||||||||||||||
12/9/16-1/23/17 | JPY | 3,244,004 | USD | 31,091 | 2,599 | |||||||||||||||
12/14/16 | SGD | 5,079 | USD | 3,730 | 183 | |||||||||||||||
12/15/16 | USD | 1,285 | IDR | 17,426,293 | (3 | ) | ||||||||||||||
12/15/16 | USD | 1,697 | INR | 114,914 | (22 | ) | ||||||||||||||
12/15/16 | INR | 113,889 | USD | 1,690 | 29 | |||||||||||||||
12/15/16 | KRW | 1,523,001 | USD | 1,288 | (13 | ) | ||||||||||||||
12/29/16 | USD | 1,110 | COP | 3,501,727 | 30 | |||||||||||||||
1/19/17 | AUD | 2,734 | USD | 2,067 | 50 | |||||||||||||||
1/20/17 | GBP | 106 | USD | 133 | — | |||||||||||||||
1/25/17 | EUR | 766 | USD | 836 | 21 | |||||||||||||||
2/3/17 | USD | 1,886 | CAD | 2,530 | (2 | ) | ||||||||||||||
2/3/17 | CAD | 9,752 | USD | 7,302 | 43 | |||||||||||||||
|
| |||||||||||||||||||
| $ | 2,622 | |||||||||||||||||||
|
| |||||||||||||||||||
| SEI Institutional Investments Trust / Semi-Annual Report / November 30, 2016 | 229 |
CONSOLIDATED SCHEDULE OF INVESTMENTS (Unaudited)
Multi-Asset Real Return Fund (Continued)
November 30, 2016
A list of the counterparties for the open forward foreign currency contracts held by the Fund at November 30, 2016, is as follows:
| Counterparty | Currency to Deliver ($ Thousands) | Currency to Receive ($ Thousands) | Unrealized Appreciation (Depreciation) ($ Thousands) | |||||||||
Barclays PLC | $ | (3,470 | ) | $ | 3,490 | $ | 20 | |||||
BNP Paribas | (2,700 | ) | 2,719 | 19 | ||||||||
Brown Brothers Harriman | (376 | ) | 385 | 9 | ||||||||
Citigroup | (19,568 | ) | 21,162 | 1,594 | ||||||||
Goldman Sachs | (2,504 | ) | 2,161 | (343 | ) | |||||||
| Counterparty | Currency to Deliver ($ Thousands) | Currency to Receive ($ Thousands) | Unrealized Appreciation (Depreciation) ($ Thousands) | |||||||||
HSBC | $ | (11,809 | ) | $ | 11,821 | $ | 12 | |||||
JPMorgan Chase Bank | (821 | ) | 835 | 14 | ||||||||
Morgan Stanley | (968 | ) | 1,034 | 66 | ||||||||
RBC | (1,110 | ) | 1,140 | 30 | ||||||||
Standard Chartered | (14,595 | ) | 15,796 | 1,201 | ||||||||
|
| |||||||||||
| $ | 2,622 | |||||||||||
|
| |||||||||||
For the period ended November 30, 2016 the total amount of all open forward foreign currency contracts, as presented in the table above, are representative of the volume of activity for the derivative type during the period.
A list of the open centrally cleared swap agreements held by the Fund at November 30, 2016, is as follows:
| Interest Rate Swaps | ||||||||||||||||||
| Counterparty | Fund Pays | Fund Receives | Termination Date | Notional Amount ($ Thousands) | Net Unrealized Appreciation (Depreciation) ($ Thousands) | |||||||||||||
| Citibank, N.A. | 3-Month NZD - BBR | 2.47% | 07/28/2026 | $ | 5,160 | $ | (213 | ) | ||||||||||
| Morgan Stanley | 2.63% | 3-Month USD - LIBOR | 11/10/2035 | 3,600 | (99 | ) | ||||||||||||
| Morgan Stanley | 3-Month USD - LIBOR | 3.31% | 05/06/2034 | 1,650 | 214 | |||||||||||||
| Morgan Stanley | 1.67% | 3-Month USD - LIBOR | 11/09/2026 | 1,230 | 59 | |||||||||||||
| Morgan Stanley | 6-Month NOK - NIBOR | 1.66% | 11/09/2026 | 17,865 | (54 | ) | ||||||||||||
| Morgan Stanley | 1.66% | 3-Month USD - LIBOR | 11/08/2026 | 1,230 | 60 | |||||||||||||
| Morgan Stanley | 6-Month NOK - NIBOR | 1.67% | 11/08/2026 | 17,865 | (53 | ) | ||||||||||||
| Morgan Stanley | 6-Month NOK - NIBOR | 1.67% | 11/07/2026 | 24,860 | (73 | ) | ||||||||||||
| Morgan Stanley | 1.68% | 3-Month USD - LIBOR | 11/07/2026 | 1,640 | 77 | |||||||||||||
| Morgan Stanley | 0.96% | 6-Month NOK - BBR | 08/01/2026 | 49,660 | 31 | |||||||||||||
| Morgan Stanley | 2.29% | 3-Month USD - LIBOR | 08/04/2025 | 1,833 | (33 | ) | ||||||||||||
| Morgan Stanley | 2.49% | 3-Month USD - LIBOR | 06/09/2025 | 1,240 | (46 | ) | ||||||||||||
| Morgan Stanley | 2.31% | 3-Month USD - LIBOR | 05/18/2025 | 2,880 | (41 | ) | ||||||||||||
| Morgan Stanley | 1.99% | 3-Month USD - LIBOR | 04/21/2025 | 2,040 | 20 | |||||||||||||
| Morgan Stanley | 3-Month USD - LIBOR | 2.69% | 09/24/2024 | 2,470 | 116 | |||||||||||||
| Morgan Stanley | 3-Month USD - LIBOR | 2.67% | 07/18/2024 | 1,710 | 87 | |||||||||||||
| Morgan Stanley | 2.67% | 3-Month USD - LIBOR | 07/10/2024 | 2,130 | (110 | ) | ||||||||||||
| Morgan Stanley | 2.63% | 3-Month USD - LIBOR | 07/02/2024 | 3,360 | (164 | ) | ||||||||||||
| Morgan Stanley | 3-Month USD - LIBOR | 2.63% | 05/29/2024 | 1,630 | 64 | |||||||||||||
| Morgan Stanley | 2.63% | 3-Month USD - LIBOR | 05/23/2024 | 4,050 | (161 | ) | ||||||||||||
| Morgan Stanley | 2.82% | 3-Month USD - LIBOR | 04/28/2024 | 2,770 | (151 | ) | ||||||||||||
| Morgan Stanley | 2.89% | 3-Month USD - LIBOR | 02/14/2024 | 1,780 | (117 | ) | ||||||||||||
| Morgan Stanley | 2.98% | 3-Month USD - LIBOR | 01/14/2024 | 1,990 | (146 | ) | ||||||||||||
| Morgan Stanley | 1.26% | 3-Month USD - LIBOR | 08/31/2021 | 7,710 | 165 | |||||||||||||
| Morgan Stanley | 2.24% | 3-Month USD - LIBOR | 06/25/2021 | 1,680 | (49 | ) | ||||||||||||
| Morgan Stanley | 1.69% | 3-Month USD - LIBOR | 08/06/2020 | 7,270 | (47 | ) | ||||||||||||
| Morgan Stanley | 1.57% | 3-Month USD - LIBOR | 04/01/2020 | 5,370 | (4 | ) | ||||||||||||
| Morgan Stanley | 6-Month NOK - BBR | 1.08% | 08/11/2018 | 55,170 | 23 | |||||||||||||
| Morgan Stanley | 1.01% | 6-Month NOK - BBR | 08/04/2018 | 12,870 | 7 | |||||||||||||
| Morgan Stanley | 0.95% | 6-Month NOK - NIBOR | 05/12/2018 | 220,160 | (13 | ) | ||||||||||||
| Morgan Stanley | 0.81% | 3-Month USD - LIBOR | 05/18/2017 | 15,030 | 11 | |||||||||||||
| UBS | 1.49% | 3-Month USD - LIBOR | 10/04/2026 | 7,010 | 460 | |||||||||||||
|
| |||||||||||||||||
| $ | (180 | ) | ||||||||||||||||
|
| |||||||||||||||||
| 230 | SEI Institutional Investments Trust / Semi-Annual Report / November 30, 2016 |
A list of the open OTC swap agreements held by the Fund at November 30, 2016 is as follows:
| Interest Rate Swaps | ||||||||||||||||
| Counterparty | Fund Pays | Fund Receives | Termination Date | Notional Amount ($ Thousands) | Net Unrealized Appreciation (Depreciation) ($ Thousands) | |||||||||||
| Barclays Bank PLC | 1.10% | 3 Month USD - LIBOR | 02/21/2017 | $ | 500 | $ | (2 | ) | ||||||||
| Credit Suisse | 3-Month USD - LIBOR | 2.09% | 03/12/2022 | 250 | 5 | |||||||||||
| Morgan Stanley | 2.80% | 3 Month USD - LIBOR | 03/06/2042 | 330 | (25 | ) | ||||||||||
| Morgan Stanley | 2.81% | 3 Month USD - LIBOR | 02/21/2042 | 450 | (35 | ) | ||||||||||
|
| |||||||||||||||
| $ | (57 | ) | ||||||||||||||
|
| |||||||||||||||
| Credit Default Swaps | ||||||||||||||||
| Counterparty | Reference Entity/Obligation | Buy/Sell Protection | (Pays)/Receives Rate | Termination Date | Notional Amount ($ Thousands) | Net Unrealized Appreciation (Depreciation) | ||||||||||
| Bank of America | Societe Generale | SELL | 3.00% | 12/20/2017 | $ | (200 | ) | $ | 4 | |||||||
| Citibank | Advanced Micro Devices | BUY | 5.00% | 03/20/2019 | 300 | (42 | ) | |||||||||
| Citibank | Sprint Communications | BUY | 5.00% | 06/20/2019 | 499 | (16 | ) | |||||||||
| Citibank | Sprint Communications | BUY | 5.00% | 06/20/2019 | 571 | (18 | ) | |||||||||
| Credit Suisse | CMBX-BBB-316311 | SELL | 3.00% | 05/11/2063 | (552 | ) | (3 | ) | ||||||||
| Credit Suisse | CMBX-BBB-331911 | SELL | 3.00% | 12/31/2049 | (778 | ) | — | |||||||||
| Credit Suisse | CMBX-BBB-331915 | SELL | 3.00% | 12/31/2049 | (162 | ) | — | |||||||||
| Credit Suisse | CMBX-BBB-363753 | SELL | 3.00% | 12/31/2049 | (900 | ) | (21 | ) | ||||||||
| Deutsche Bank | Anadarko Petroleum Corporation | SELL | 1.00% | 09/20/2017 | (170 | ) | 2 | |||||||||
| Deutsche Bank | CMBX-BBB-364870 | SELL | 3.00% | 12/31/2049 | (29 | ) | — | |||||||||
| Deutsche Bank | CMBX-BBB-395754 | SELL | 3.00% | 05/11/2049 | (528 | ) | 7 | |||||||||
| Goldman Sachs | CMBX-BBB-379352 | SELL | 3.00% | 05/11/2063 | (750 | ) | 8 | |||||||||
| Goldman Sachs | CMBX-BBB-394233 | SELL | 3.00% | 12/31/2049 | (565 | ) | 5 | |||||||||
|
| |||||||||||||||
| $ | (74 | ) | ||||||||||||||
|
| |||||||||||||||
For the period ended November 30, 2016, the total amount of all open swap agreements, as presented in the tables above, are representative of the volume of activity for this derivative type during the period.
Percentages are based on Net Assets of $734,198 ($ Thousands).
| * | Non-income producing security. |
| ‡ | Real Estate Investment Trust. |
| (A) | The rate reported is the effective yield at the time of purchase. |
| (B) | Security, or a portion thereof, has been pledged as collateral on reverse repurchase agreements, securities sold short and open centrally cleared interest rate swap agreements. |
| (C) | Variable Rate Security — The rate reported on the Schedule of Investments is the rate in effect as of November 30, 2016. |
| (D) | Security exempt from registration under Rule 144A of the Securities Act of 1933. These securities may be resold in transactions exempt from registration normally to qualified institutions. On November 30, 2016, the value of these securities amounted to $47,646 ($ Thousands), representing 6.5% of the net assets of the Fund. |
| (E) | Step Bonds — The rate reflected on the Schedule of Investments is the effective yield on November 30, 2016. The coupon on a step bond changes on a specified date. |
| (F) | Security is in default on interest payment. |
AUD — Australian Dollar
BBR — Australian Bank Bill Benchmark
BRL — Brazilian Real
CAD — Canadian Dollar
Cl — Class
CMO — Collateralized Mortgage Obligation
COP — Colombian Peso
EAFE — Europe, Australasia and Far East
EUR — Euro
FHLMC — Federal Home Loan Mortgage Corporation
FNMA — Federal National Mortgage Association
GBP — British Pound Sterling
GNMA — Government National Mortgage Association
ICE — Intercontinental Exchange
IDR — Indonesian Rupiah
INR — Indian Rupee
IO — Interest Only
JPY — Japanese Yen
KRW — Korean Won
LIBOR — London Interbank Offered Rate
LLC — Limited Liability Company
LME — London Metal Exchange
MSCI — Morgan Stanley Capital International
| SEI Institutional Investments Trust / Semi-Annual Report / November 30, 2016 | 231 |
CONSOLIDATED SCHEDULE OF INVESTMENTS (Unaudited)
Multi-Asset Real Return Fund (Concluded)
November 30, 2016
MTN — Medium Term Note
N.A. — National Association
NIBOR — Norwegian Interbank Offered Rate
NOK — Norwegian Krone
NZD — New Zealand Dollar
OTC — Over the Counter
PLC — Public Limited Company
S&P — Standard & Poor’s
Ser — Series
SGD — Singapore Dollar
TWD — Taiwanese Dollar
USD — United States Dollar
The following is a list of the level of inputs used as of November 30, 2016, in valuing the Fund’s investments and other financial instruments carried at value ($ Thousands):
| Investments in Securities | Level 1 | Level 2 | Level 3 | Total | ||||||||||||
U.S. Treasury Obligations | $ | — | $ | 473,810 | $ | — | $ | 473,810 | ||||||||
Common Stock | 197,085 | — | — | 197,085 | ||||||||||||
Mortgage-Backed Securities | — | 52,342 | — | 52,342 | ||||||||||||
Corporate Obligations | — | 47,140 | — | 47,140 | ||||||||||||
Sovereign Debt | — | 32,324 | — | 32,324 | ||||||||||||
Asset-Backed Securities | — | 24,763 | — | 24,763 | ||||||||||||
Foreign Bonds | — | 12,410 | — | 12,410 | ||||||||||||
Foreign Common Stock | 3,655 | — | — | 3,655 | ||||||||||||
|
|
|
|
|
|
|
| |||||||||
Total Investments in Securities | $ | 200,740 | $ | 642,789 | $ | — | $ | 843,529 | ||||||||
|
|
|
|
|
|
|
| |||||||||
| Securities Sold Short | Level 1 | Level 2 | Level 3 | Total | ||||||||||||
Common Stock | $ | (98,754 | ) | $ | — | $ | — | $ | (98,754 | ) | ||||||
|
|
|
|
|
|
|
| |||||||||
Total Securities Sold Short | $ | (98,754 | ) | $ | — | $ | — | $ | (98,754 | ) | ||||||
|
|
|
|
|
|
|
| |||||||||
| Other Financial Instruments | Level 1 | Level 2 | Level 3 | Total | ||||||||||||
Futures Contracts* | ||||||||||||||||
Unrealized Appreciation | $ | 4,107 | $ | — | $ | — | $ | 4,107 | ||||||||
Unrealized Depreciation | (3,839 | ) | — | — | (3,839 | ) | ||||||||||
Forwards Contracts* | ||||||||||||||||
Unrealized Appreciation | — | 3,065 | — | 3,065 | ||||||||||||
Unrealized Depreciation | — | (443 | ) | — | (443 | ) | ||||||||||
Centrally Cleared Swaps | ||||||||||||||||
Interest Rate Swaps* | ||||||||||||||||
Unrealized Appreciation | — | 1,394 | — | 1,394 | ||||||||||||
Unrealized Depreciation | — | (1,574 | ) | — | (1,574 | ) | ||||||||||
OTC Swaps | ||||||||||||||||
Interest Rate Swaps* | ||||||||||||||||
Unrealized Appreciation | — | 5 | — | 5 | ||||||||||||
Unrealized Depreciation | — | (62 | ) | — | (62 | ) | ||||||||||
Credit Default Swaps* | ||||||||||||||||
Unrealized Appreciation | — | 26 | — | 26 | ||||||||||||
Unrealized Depreciation | — | (100 | ) | — | (100 | ) | ||||||||||
Reverse Repurchase Agreements | — | (155,974 | ) | — | (155,974 | ) | ||||||||||
|
|
|
|
|
|
|
| |||||||||
Total Other Financial Instruments | $ | 268 | $ | (153,663 | ) | $ | — | $ | (153,395 | ) | ||||||
|
|
|
|
|
|
|
| |||||||||
| * | Futures contracts, forwards contracts and swaps are valued at the unrealized appreciation (depreciation) on the instrument. |
For the period ended November 30, 2016, there were no transfers between Level 1 and Level 2 assets and liabilities.
For the period ended November 30, 2016, there were no transfers between Level 2 and Level 3 assets and liabilities.
For more information on valuation inputs, see Note 2 — Significant Accounting Policies in Notes to Financial Statements.
Amounts designated as “—” are $0 or have been rounded to $0.
The accompanying notes are an integral part of the financial statements.
| 232 | SEI Institutional Investments Trust / Semi-Annual Report / November 30, 2016 |
(This page intentionally left blank)
STATEMENTS OF ASSETS AND LIABILITIES ($ Thousands) (Unaudited)
November 30, 2016
| Large Cap Fund | Large Cap Diversified Alpha Fund | |||||||
Assets: | ||||||||
Investments, at value† | $ | 1,908,950 | * | $ | 52,219 | |||
Affiliated investments, at value†† | 87,171 | 2,862 | ||||||
Cash and cash equivalents | — | — | ||||||
Cash pledged as collateral for futures contracts | 2,986 | 5 | ||||||
Receivable for fund shares sold | 4,661 | 143 | ||||||
Receivable for investment securities sold | 65,254 | 1,723 | ||||||
Dividends and Interest receivable | 4,341 | 121 | ||||||
Foreign tax reclaim receivable | 7 | 4 | ||||||
Prepaid expenses | 16 | 1 | ||||||
Total Assets | 2,073,386 | 57,078 | ||||||
Liabilities: | ||||||||
Payable for fund shares redeemed | 68,650 | 1 | ||||||
Payable upon return on securities loaned | 19,234 | — | ||||||
Payable for investment securities purchased | 5,391 | 1,873 | ||||||
Payable for variation margin | 174 | — | ||||||
Payable to custodian | 28 | — | ||||||
Investment advisory fees payable | 298 | 10 | ||||||
Trustees fees payable | 6 | — | ||||||
CCO fees payable | 2 | — | ||||||
Accrued expense payable | 53 | 4 | ||||||
Total Liabilities | 93,836 | 1,888 | ||||||
Net Assets | $ | 1,979,550 | $ | 55,190 | ||||
† Cost of investments | $ | 1,498,744 | $ | 45,260 | ||||
†† Cost of affiliated investments | 87,171 | 2,862 | ||||||
* Includes market value of securities on loan | 19,084 | — | ||||||
Net Assets: | ||||||||
Paid-in Capital — (unlimited authorization — no par value) | $ | 1,508,701 | $ | 48,972 | ||||
Undistributed net investment income | 5,731 | 460 | ||||||
Accumulated net realized gain (loss) on investments, futures contracts and foreign currency | 54,512 | (1,202 | ) | |||||
Net unrealized appreciation on investments | 410,206 | 6,959 | ||||||
Net unrealized appreciation on futures contracts | 400 | 1 | ||||||
Net unrealized depreciation on forward foreign currency contracts, foreign currencies and translation of other assets and liabilities denominated in foreign currencies | — | — | ||||||
Net Assets | $ | 1,979,550 | $ | 55,190 | ||||
Net Asset Value, Offering and Redemption Price Per Share — Class A | $19.72 | $9.69 | ||||||
| | ($1,979,549,778 ÷ 100,364,002 shares | ) | | ($55,190,375 ÷ 5,694,403 shares | ) | |||
Amounts designated as “—” are $0 or have been rounded to $0.
The accompanying notes are an integral part of the financial statements.
| 234 | SEI Institutional Investments Trust / Semi-Annual Report / November 30, 2016 |
| Large Cap Disciplined Equity Fund | Large Cap Index Fund | S&P 500 Index Fund | Extended Market Index Fund | Small Cap Fund | Small Cap II Fund | Small/Mid Cap Equity Fund | ||||||||||||||||||||
| $ | 3,427,350 | * | $ | 2,167,363 | * | $ | 3,569,488 | * | $ | 815,781 | * | $ | 512,366 | * | $ | 451,154 | * | $ | 1,664,599 | * | ||||||
| 186,274 | 47,191 | 91,976 | 80,580 | 47,698 | 67,840 | 185,399 | ||||||||||||||||||||
| 22 | 4 | – | 3 | – | – | – | ||||||||||||||||||||
| 2,200 | — | — | — | — | 566 | — | ||||||||||||||||||||
| 3,287 | 70,510 | 6,771 | 2,750 | 1,207 | 7,844 | 3,958 | ||||||||||||||||||||
| 58,037 | 7,821 | 24,014 | 22,655 | 7,538 | 18,334 | 36,975 | ||||||||||||||||||||
| 7,548 | 4,690 | 8,465 | 792 | 586 | 400 | 2,098 | ||||||||||||||||||||
| 56 | — | 23 | — | — | — | — | ||||||||||||||||||||
| 44 | — | 41 | 9 | 6 | 6 | 21 | ||||||||||||||||||||
| 3,684,818 | 2,297,579 | 3,700,778 | 922,570 | 569,401 | 546,144 | 1,893,050 | ||||||||||||||||||||
| 62,017 | 25,442 | 19,994 | 27,782 | 2,844 | 18,284 | 10,140 | ||||||||||||||||||||
| 20,865 | 18,470 | 17,633 | 57,203 | 26,280 | 43,486 | 119,959 | ||||||||||||||||||||
| 49,422 | 44,904 | — | — | 6,677 | 5,757 | 17,448 | ||||||||||||||||||||
| 40 | 101 | 215 | 93 | — | 68 | — | ||||||||||||||||||||
| — | — | 7 | — | 158 | 5 | 4 | ||||||||||||||||||||
| 497 | 18 | 30 | 27 | 182 | 158 | 598 | ||||||||||||||||||||
| 10 | 6 | 10 | 2 | 2 | 1 | 4 | ||||||||||||||||||||
| 4 | 2 | 3 | 1 | 1 | 1 | 2 | ||||||||||||||||||||
| 109 | 100 | 122 | 59 | 16 | 14 | 49 | ||||||||||||||||||||
| 132,964 | 89,043 | 38,014 | 85,167 | 36,160 | 67,774 | 148,204 | ||||||||||||||||||||
| $ | 3,551,854 | $ | 2,208,536 | $ | 3,662,764 | $ | 837,403 | $ | 533,241 | $ | 478,370 | $ | 1,744,846 | |||||||||||||
| $ | 2,873,948 | $ | 1,260,122 | $ | 3,222,347 | $ | 721,805 | $ | 435,578 | $ | 386,526 | $ | 1,365,333 | |||||||||||||
| 186,274 | 46,858 | 91,976 | 80,579 | 47,698 | 67,840 | 185,397 | ||||||||||||||||||||
| 20,511 | 18,216 | 17,503 | 56,542 | 21,824 | 42,854 | 116,897 | ||||||||||||||||||||
| $ | 2,898,524 | $ | 1,286,017 | $ | 3,334,162 | $ | 732,141 | $ | 450,086 | $ | 419,991 | $ | 1,394,509 | |||||||||||||
| 13,733 | 8,207 | 14,553 | 1,813 | 990 | 529 | 7,396 | ||||||||||||||||||||
| 85,842 | 5,525 | (35,108 | ) | 8,118 | 5,377 | (7,018 | ) | 43,673 | ||||||||||||||||||
| 553,402 | 907,574 | 347,141 | 93,977 | 76,788 | 64,628 | 299,268 | ||||||||||||||||||||
| 356 | 1,213 | 2,016 | 1,354 | — | 240 | — | ||||||||||||||||||||
| | (3 | ) | — | — | — | — | — | — | ||||||||||||||||||
| $3,551,854 | $2,208,536 | $3,662,764 | $837,403 | $533,241 | $478,370 | $1,744,846 | ||||||||||||||||||||
| $13.19 | $168.72 | $12.19 | $13.61 | $17.86 | $12.33 | $13.24 | ||||||||||||||||||||
| | ($3,551,853,763 ÷ 269,362,879 shares | ) | | ($2,208,535,610 ÷ 13,089,995 shares | ) | | ($3,662,764,401 ÷ 300,520,325 shares | ) | | ($837,403,087 ÷ 61,512,613 shares | ) | | ($533,241,451 ÷ 29,856,004 shares | ) | | ($478,369,948 ÷ 38,811,937 shares | ) | | ($1,744,845,645 ÷ 131,790,796 shares | ) | ||||||
| SEI Institutional Investments Trust / Semi-Annual Report / November 30, 2016 | 235 |
STATEMENTS OF ASSETS AND LIABILITIES ($ Thousands) (Unaudited)
November 30, 2016
| U.S. Managed Volatility Fund | Global Managed Volatility Fund | |||||||
Assets: | ||||||||
Investments, at value† | $ | 1,446,233 | $ | 1,013,667 | ||||
Affiliated investments, at value†† | 19,117 | 40,662 | ||||||
Cash and cash equivalents | 8 | 4,315 | ||||||
Cash pledged as collateral for forward foreign currency contracts, futures contracts and swap contracts | 1,430 | 1,567 | ||||||
Foreign currency, at value††† | 288 | 3,014 | ||||||
Receivable for fund shares sold | 63,743 | 58,955 | ||||||
Receivable for investment securities sold | 32,437 | — | ||||||
Dividends and Interest receivable | 3,630 | 2,638 | ||||||
Foreign tax reclaim receivable | 1 | 530 | ||||||
Unrealized gain on forward foreign currency contracts | — | 1,789 | ||||||
Unrealized gain on foreign spot currency contracts | — | — | ||||||
Swap contracts, at value†††† | — | — | ||||||
Options purchased, at value††††† | — | — | ||||||
Receivable for variation margin | — | 36 | ||||||
Prepaid expenses | 20 | 13 | ||||||
Total Assets | 1,566,907 | 1,127,186 | ||||||
Liabilities: | ||||||||
Payable for fund shares redeemed | 76,497 | 72,708 | ||||||
Payable for investment securities purchased | 6,500 | — | ||||||
Payable for variation margin | 78 | 49 | ||||||
Payable upon return on securities loaned | — | — | ||||||
Income distribution payable | — | — | ||||||
Swap contracts, at value†††† | — | — | ||||||
Options written, at value††††† | — | — | ||||||
Payable to custodian | — | — | ||||||
Unrealized loss on foreign currency spot contracts | — | — | ||||||
Unrealized loss on forward foreign currency contracts | — | 149 | ||||||
Investment advisory fees payable | 268 | 193 | ||||||
Trustees fees payable | 4 | 3 | ||||||
CCO fees payable | 1 | 1 | ||||||
Accrued expense payable | 54 | 23 | ||||||
Accrued foreign capital gains tax on appreciated securities | — | — | ||||||
Total Liabilities | 83,402 | 73,126 | ||||||
Net Assets | $ | 1,483,505 | $ | 1,054,060 | ||||
† Cost of investments | $ | 1,220,291 | $ | 964,528 | ||||
†† Cost of affiliated investments | 19,117 | 40,662 | ||||||
††† Cost of foreign currency | 291 | 3,064 | ||||||
†††† Cost (Premiums received) | — | — | ||||||
††††† Cost (Premiums received) | — | — | ||||||
* Includes market value of securities on loan | — | — | ||||||
Net Assets: | ||||||||
Paid-in Capital — (unlimited authorization — no par value) | $ | 1,173,587 | $ | 957,845 | ||||
Undistributed (distributions in excess of) net investment income | 5,178 | 13,778 | ||||||
Accumulated net realized gain (loss) on investments, options contracts, futures contracts, swap contracts and foreign currency | 78,333 | 31,627 | ||||||
Net unrealized appreciation (depreciation) on investments | 225,942 | 49,139 | ||||||
Net unrealized appreciation on option contracts | — | — | ||||||
Net unrealized appreciation (depreciation) on futures contracts | 466 | 188 | ||||||
Net unrealized appreciation (depreciation) on forward foreign currency contracts, foreign currencies and translation of other assets and liabilities denominated in foreign currencies | (1 | ) | 1,483 | |||||
Net unrealized appreciation (depreciation) on swap contracts | — | — | ||||||
Accumulated foreign capital gains tax on appreciated securities | — | — | ||||||
Net Assets | $ | 1,483,505 | $ | 1,054,060 | ||||
Net Asset Value, Offering and Redemption Price Per Share — Class A | $14.43 | $10.99 | ||||||
| | ($1,483,504,524 ÷ 102,810,413 shares | ) | | ($1,054,060,170 ÷ 95,915,801 shares | ) | |||
Amounts designated as “—” are $0 or have been rounded to $0.
The accompanying notes are an integral part of the financial statements.
| 236 | SEI Institutional Investments Trust / Semi-Annual Report / November 30, 2016 |
World Equity Ex-US Fund | Screened World Equity Ex-US Fund | Emerging Markets Equity Fund | Opportunistic Income Fund | Core Fixed Income Fund | High Yield Bond Fund | Long Duration Fund | ||||||||||||||||||||
| $ | 6,818,435 | * | $ | 82,560 | $ | 1,011,846 | $ | 2,126,711 | $ | 5,700,087 | $ | 2,757,594 | $ | 2,484,416 | ||||||||||||
| 375,336 | 2,349 | 3,966 | 91,541 | 227,806 | 79,955 | 9,355 | ||||||||||||||||||||
| 149,880 | 2,155 | 13,199 | — | 2,002 | — | 56 | ||||||||||||||||||||
| 4,662 | 147 | — | 62 | 11,289 | 1,719 | 886 | ||||||||||||||||||||
| 6,963 | 369 | 591 | — | 777 | — | — | ||||||||||||||||||||
| 92,532 | 11 | 47,860 | 39,185 | 46,898 | 22,526 | 3,726 | ||||||||||||||||||||
| 47,201 | 838 | 4,773 | 4,240 | 402,145 | 39,795 | 14,965 | ||||||||||||||||||||
| 10,794 | 107 | 536 | 6,682 | 26,146 | 43,690 | 25,049 | ||||||||||||||||||||
| 7,514 | 102 | 33 | 8 | 6 | 12 | 10 | ||||||||||||||||||||
| — | — | 1 | — | 8,203 | — | — | ||||||||||||||||||||
| 41 | 2 | — | — | — | — | — | ||||||||||||||||||||
| — | — | — | — | 13 | — | — | ||||||||||||||||||||
| — | — | — | — | 12 | — | — | ||||||||||||||||||||
| 362 | 9 | — | 69 | 3,568 | 20 | 972 | ||||||||||||||||||||
| 87 | 1 | 12 | 26 | 40 | 33 | 14 | ||||||||||||||||||||
| 7,513,807 | 88,650 | 1,082,817 | 2,268,524 | 6,428,992 | 2,945,344 | 2,539,449 | ||||||||||||||||||||
| 36,343 | 24 | 2,648 | 7,474 | 193,518 | 30,239 | 31,264 | ||||||||||||||||||||
| 38,768 | 940 | 42,936 | 59,343 | 749,817 | 68,697 | 24,678 | ||||||||||||||||||||
| 22 | 1 | — | 3 | 1,794 | — | 1,850 | ||||||||||||||||||||
| 301,754 | — | — | — | — | — | — | ||||||||||||||||||||
| — | — | — | — | 172 | 293 | 348 | ||||||||||||||||||||
| — | — | — | — | 467 | — | 310 | ||||||||||||||||||||
| — | — | — | — | 303 | — | — | ||||||||||||||||||||
| — | — | — | 3,283 | — | 1,203 | — | ||||||||||||||||||||
| 43 | 2 | — | — | — | — | — | ||||||||||||||||||||
| — | — | 2 | — | 373 | — | — | ||||||||||||||||||||
| 1,747 | 19 | 458 | 427 | 473 | 656 | 280 | ||||||||||||||||||||
| 20 | — | 3 | 6 | 16 | 8 | 8 | ||||||||||||||||||||
| 7 | — | 1 | 2 | 6 | 3 | 3 | ||||||||||||||||||||
| 301 | 10 | 147 | 70 | 156 | 81 | 92 | ||||||||||||||||||||
| 167 | — | 145 | — | — | — | — | ||||||||||||||||||||
| 379,172 | 996 | 46,340 | 70,608 | 947,095 | 101,180 | 58,833 | ||||||||||||||||||||
| $ | 7,134,635 | $ | 87,654 | $ | 1,036,477 | $ | 2,197,916 | $ | 5,481,897 | $ | 2,844,164 | $ | 2,480,616 | |||||||||||||
| $ | 6,549,843 | $ | 81,720 | $ | 1,024,218 | $ | 2,134,982 | $ | 5,737,454 | $ | 2,772,382 | $ | 2,424,173 | |||||||||||||
| 375,336 | 2,349 | 3,966 | 91,541 | 227,806 | 79,955 | 9,355 | ||||||||||||||||||||
| 7,021 | 378 | 605 | — | 777 | — | — | ||||||||||||||||||||
| — | — | — | — | (16 | ) | — | — | |||||||||||||||||||
| — | — | — | — | (488 | ) | — | — | |||||||||||||||||||
| 289,406 | — | — | — | — | — | — | ||||||||||||||||||||
| $ | 7,143,557 | $ | 96,780 | $ | 1,060,161 | $ | 2,253,326 | $ | 5,486,224 | $ | 2,974,766 | $ | 2,415,042 | |||||||||||||
| 132,216 | 1,517 | 14,946 | 18,035 | 2,364 | 14,526 | (1,641 | ) | |||||||||||||||||||
| | (410,542 | ) | (11,481 | ) | (26,097 | ) | (65,173 | ) | 21,050 | (130,466 | ) | 8,194 | ||||||||||||||
| 268,592 | 840 | (12,372 | ) | (8,271 | ) | (37,367 | ) | (14,788 | ) | 60,243 | ||||||||||||||||
| — | — | — | — | 197 | — | — | ||||||||||||||||||||
| 2,327 | 23 | — | (1 | ) | 499 | — | (54 | ) | ||||||||||||||||||
| | (1,348 | ) | (25 | ) | (16 | ) | — | 7,830 | — | — | ||||||||||||||||
| — | — | — | — | 1,100 | 126 | (1,168 | ) | |||||||||||||||||||
| (167 | ) | — | (145 | ) | — | — | — | — | ||||||||||||||||||
| $ | 7,134,635 | $ | 87,654 | $ | 1,036,477 | $ | 2,197,916 | $ | 5,481,897 | $ | 2,844,164 | $ | 2,480,616 | |||||||||||||
| $11.04 | $8.88 | $8.99 | $8.18 | $10.27 | $8.86 | $8.35 | ||||||||||||||||||||
| | ($7,134,634,625 ÷ 645,983,434 shares | ) | | ($87,654,036 ÷ 9,872,074 shares | ) | | ($1,036,476,656 ÷ 115,273,344 shares | ) | | ($2,197,916,103 ÷ 268,839,693 shares | ) | | ($5,481,897,332 ÷ 533,761,712 shares | ) | | ($2,844,163,502 ÷ 320,833,897 shares | ) | | ($2,480,615,703 ÷ 296,976,258 shares | ) | ||||||
| SEI Institutional Investments Trust / Semi-Annual Report / November 30, 2016 | 237 |
STATEMENTS OF ASSETS AND LIABILITIES/CONSOLIDATED STATEMENTS OF ASSETS AND LIABILITIES ($ Thousands) (Unaudited)
November 30, 2016
| Long Duration Credit Fund | Ultra Short Duration Bond Fund | |||||||
Assets: | ||||||||
Investments, at value† | $ | 3,075,488 | $ | 545,478 | ||||
Affiliated investments, at value†† | 25,596 | 1,191 | ||||||
Cash and cash equivalents | — | — | ||||||
Cash pledged as collateral for forward foreign currency contracts, futures contracts and swap contracts | — | 39 | ||||||
Foreign currency, at value††† | — | — | ||||||
Receivable for fund shares sold | — | 8,242 | ||||||
Dividends and Interest receivable | 34,083 | 1,433 | ||||||
Receivable for investment securities sold | 9,245 | 5 | ||||||
Receivable for variation margin | 1,512 | 26 | ||||||
Foreign tax reclaim receivable | 29 | — | ||||||
Unrealized gain on forward foreign currency contracts | — | — | ||||||
Unrealized gain on foreign spot currency contracts | — | — | ||||||
Swap contracts, at value†††† | — | — | ||||||
Options purchased, at value††††† | — | — | ||||||
Prepaid expenses | 41 | 7 | ||||||
Total Assets | 3,145,994 | 556,421 | ||||||
Liabilities: | ||||||||
Payable for investment securities purchased | 12,278 | 20,313 | ||||||
Payable for fund shares redeemed | 2,628 | 1,722 | ||||||
Payable for variation margin | 1,237 | 9 | ||||||
Payable to custodian | 1,075 | 78 | ||||||
Payable for securities sold short@ | — | — | ||||||
Income distribution payable | — | 12 | ||||||
Swap contracts, at value †††† | — | — | ||||||
Reverse repurchase agreements | — | — | ||||||
Unrealized loss on foreign currency spot contracts | — | — | ||||||
Unrealized loss on forward foreign currency contracts | — | — | ||||||
Investment advisory fees payable | 339 | 43 | ||||||
Trustees fees payable | 9 | 1 | ||||||
CCO fees payable | 3 | 1 | ||||||
Accrued expense payable | 102 | 22 | ||||||
Total Liabilities | 17,671 | 22,201 | ||||||
Net Assets | $ | 3,128,323 | $ | 534,220 | ||||
† Cost of investments | $ | 3,103,453 | $ | 545,248 | ||||
†† Cost of affiliated investments | 25,596 | 1,191 | ||||||
††† Cost of foreign currency | — | — | ||||||
†††† Cost (Premiums received) | — | — | ||||||
††††† Cost (Premiums received) | — | — | ||||||
@ Proceeds from securities sold short | — | — | ||||||
Net Assets: | ||||||||
Paid-in Capital — (unlimited authorization — no par value) | $ | 3,159,895 | $ | 537,838 | ||||
Undistributed (distributions in excess of) net investment income/(accumulated net investment loss) | (22 | ) | (1,744 | ) | ||||
Accumulated net realized gain (loss) on investments, options contracts, swaptions contracts, futures contracts, securities sold short, swap contracts and foreign currency | (3,594 | ) | (2,121 | ) | ||||
Net unrealized appreciation (depreciation) on investments and securities sold short | (27,965 | ) | 230 | |||||
Net unrealized appreciation on option contracts | — | — | ||||||
Net unrealized appreciation (depreciation) on futures contracts | 9 | 17 | ||||||
Net unrealized appreciation on forward foreign currency contracts, foreign currencies and translation of other assets and liabilities denominated in foreign currencies | — | — | ||||||
Net unrealized appreciation (depreciation) on swap contracts | — | — | ||||||
Net Assets | $ | 3,128,323 | $ | 534,220 | ||||
Net Asset Value, Offering and Redemption Price Per Share — Class A | $9.92 | $9.99 | ||||||
| | ($3,128,322,844 ÷ 315,239,774 shares | ) | | ($534,219,541 ÷ 53,483,292 shares | ) | |||
Amounts designated as “—” are $0 or have been rounded to $0.
The accompanying notes are an integral part of the financial statements.
| 238 | SEI Institutional Investments Trust / Semi-Annual Report / November 30, 2016 |
| Emerging Markets Debt Fund | Real Return Fund | Limited Duration Bond Fund | Intermediate Duration Credit Fund | Dynamic Asset Allocation Fund | Multi-Asset Real Return Fund | |||||||||||||||||
| $ | 1,833,020 | $ | 138,050 | $ | 1,179,583 | $ | 1,407,502 | $ | 2,098,985 | $ | 843,529 | |||||||||||
| — | — | 13,188 | 20,548 | — | — | |||||||||||||||||
| 32,641 | 946 | — | — | 17,623 | 126,473 | |||||||||||||||||
| 2,615 | — | — | — | 51,620 | 3,295 | |||||||||||||||||
| 1,828 | — | — | — | �� | — | 178 | ||||||||||||||||
| 28,127 | 9,201 | 83,533 | — | 9,737 | 8,588 | |||||||||||||||||
| 34,266 | 336 | 4,454 | 11,642 | 4,947 | 2,307 | |||||||||||||||||
| 15,992 | — | 648 | 20,080 | 10,044 | — | |||||||||||||||||
| 211 | — | — | 233 | 692 | 4,168 | |||||||||||||||||
| — | — | 4 | — | 26 | 20 | |||||||||||||||||
| 28,151 | — | — | — | 23,476 | 3,065 | |||||||||||||||||
| 310 | — | — | — | — | 10 | |||||||||||||||||
| 1,726 | — | — | — | 5,265 | 13 | |||||||||||||||||
| — | — | — | — | 7,305 | — | |||||||||||||||||
| 10 | 2 | 14 | 17 | 26 | 9 | |||||||||||||||||
| 1,978,897 | 148,535 | 1,281,424 | 1,460,022 | 2,229,746 | 991,655 | |||||||||||||||||
| 13,204 | — | 35,975 | 20,114 | — | 422 | |||||||||||||||||
| 15,818 | 41 | 24,539 | 90 | 18,976 | 360 | |||||||||||||||||
| 1,456 | — | 2 | — | 1 | 737 | |||||||||||||||||
| — | — | 4 | 2,806 | — | — | |||||||||||||||||
| — | — | — | — | — | 98,754 | |||||||||||||||||
| — | — | 25 | — | — | — | |||||||||||||||||
| 4,954 | — | — | — | — | 476 | |||||||||||||||||
| — | — | — | — | — | 155,974 | |||||||||||||||||
| 65 | — | — | — | — | — | |||||||||||||||||
| 22,134 | — | — | — | 6,813 | 443 | |||||||||||||||||
| 610 | 7 | 86 | 155 | 107 | 142 | |||||||||||||||||
| 6 | 1 | 3 | 4 | 6 | 2 | |||||||||||||||||
| 2 | — | 1 | 1 | 2 | 1 | |||||||||||||||||
| 122 | 4 | 36 | 45 | 45 | 146 | |||||||||||||||||
| 58,371 | 53 | 60,671 | 23,215 | 25,950 | 257,457 | |||||||||||||||||
| $ | 1,920,526 | $ | 148,482 | $ | 1,220,753 | $ | 1,436,807 | $ | 2,203,796 | $ | 734,198 | |||||||||||
| $ | 2,009,262 | $ | 137,343 | $ | 1,183,463 | $ | 1,429,399 | $ | 1,516,872 | $ | 823,853 | |||||||||||
| — | — | 13,188 | 20,548 | — | — | |||||||||||||||||
| 1,839 | — | — | — | — | 183 | |||||||||||||||||
| — | — | — | — | — | (332 | ) | ||||||||||||||||
| — | — | — | — | 2,100 | — | |||||||||||||||||
| — | — | — | — | — | 95,338 | |||||||||||||||||
| $ | 2,131,643 | $ | 152,505 | $ | 1,224,488 | $ | 1,470,999 | $ | 1,587,355 | $ | 802,387 | |||||||||||
| 45,143 | 613 | (258 | ) | (98 | ) | 14,761 | (3,832 | ) | ||||||||||||||
| | (81,668 | ) | (5,343 | ) | 399 | (12,338 | ) | (15,195 | ) | (83,195 | ) | |||||||||||
| (176,242 | ) | 707 | (3,880 | ) | (21,897 | ) | 582,113 | 16,260 | ||||||||||||||
| — | — | — | — | 5,205 | — | |||||||||||||||||
| (332 | ) | — | 4 | 141 | 7,629 | 268 | ||||||||||||||||
| | 5,210 |
| — | — | — | 16,663 | 2,621 | |||||||||||||||
| (3,228 | ) | — | — | — | 5,265 | (311 | ) | |||||||||||||||
| $ | 1,920,526 | $ | 148,482 | $ | 1,220,753 | $ | 1,436,807 | $ | 2,203,796 | $ | 734,198 | |||||||||||
| $9.44 | $9.65 | $9.96 | $9.80 | $16.98 | $8.30 | |||||||||||||||||
| | ($1,920,526,085 ÷ 203,516,348 shares | ) | | ($148,481,510 ÷ 15,386,911 shares | ) | | ($1,220,752,689 ÷ 122,564,036 shares | ) | | ($1,436,807,382 ÷ 146,560,776 shares | ) | | ($2,203,795,596 ÷ 129,751,815 shares | ) | | ($734,197,671 ÷ 88,454,636 shares | ) | |||||
| SEI Institutional Investments Trust / Semi-Annual Report / November 30, 2016 | 239 |
STATEMENTS OF OPERATIONS ($ Thousands) (Unaudited)
For the six month period ended November 30, 2016
Large Cap Fund | Large Cap Diversified Alpha Fund | Large Cap Disciplined Equity Fund | ||||||||||
Investment Income: | ||||||||||||
Dividends | $ | 18,078 | $ | 527 | $ | 38,835 | ||||||
Dividends from affiliated investments(1) | 1 | 3 | 148 | |||||||||
Interest income | 66 | — | 152 | |||||||||
Security lending income — net(1)(2) | 157 | — | 284 | |||||||||
Less: foreign taxes withheld | (30 | ) | (4 | ) | (58 | ) | ||||||
Total Investment Income | 18,272 | 526 | 39,361 | |||||||||
Expenses: | ||||||||||||
Investment advisory fees | 4,115 | 109 | 7,240 | |||||||||
Administration fees | 514 | 14 | 905 | |||||||||
Trustees’ fees | 16 | 1 | 28 | |||||||||
Chief compliance officer fees | 5 | — | 9 | |||||||||
Custodian/wire agent fees | 47 | 1 | 81 | |||||||||
Professional fees | 42 | 1 | 73 | |||||||||
Registration fees | 16 | 1 | 24 | |||||||||
Printing fees | 9 | — | 16 | |||||||||
Rating fees | — | — | — | |||||||||
Other expenses | 54 | 2 | 95 | |||||||||
Total Expenses | 4,818 | 129 | 8,471 | |||||||||
Less: | ||||||||||||
Waiver of investment advisory fees | (2,263 | ) | (49 | ) | (4,163 | ) | ||||||
Waiver of administration fees | (514 | ) | (14 | ) | (905 | ) | ||||||
Fees paid indirectly(1) | (1 | ) | — | (33 | ) | |||||||
Net Expenses | 2,040 | 66 | 3,370 | |||||||||
Net Investment Income | 16,232 | 460 | 35,991 | |||||||||
Net Realized Gain (Loss) on: | ||||||||||||
Investments | 55,020 | 1,525 | 120,230 | |||||||||
Futures contracts | 1,066 | 46 | 8,397 | |||||||||
Foreign currency transactions | — | — | — | |||||||||
Net Change in Unrealized Appreciation (Depreciation) on: | ||||||||||||
Investments | 29,062 | 955 | 40,340 | |||||||||
Futures contracts | 400 | (10 | ) | (3,484 | ) | |||||||
Foreign currency translation of other assets and liabilities denominated in foreign currencies | — | — | (1 | ) | ||||||||
Net Increase in Net Assets Resulting from Operations | $ | 101,780 | $ | 2,976 | $ | 201,473 | ||||||
| (1) | See Note 6 in the Notes to Financial Statements. |
| (2) | Income is from the investment of collateral in an affiliated security. |
Amounts designated as “—” are $0 or have been rounded to $0.
The accompanying notes are an integral part of the financial statements.
| 240 | SEI Institutional Investments Trust / Semi-Annual Report / November 30, 2016 |
| Large Cap Index Fund | S&P 500 Index Fund | Extended Market Index Fund | Small Cap Fund | Small Cap II Fund | Small/Mid Cap Equity Fund | |||||||||||||||||
| $ | 22,220 | $ | 38,583 | $ | 5,768 | $ | 3,769 | $ | 2,562 | $ | 11,632 | |||||||||||
| 48 | 72 | — | 20 | 20 | 65 | |||||||||||||||||
| 70 | 78 | 24 | — | — | — | |||||||||||||||||
| 190 | 97 | 609 | 200 | 198 | 640 | |||||||||||||||||
| (4 | ) | — | (10 | ) | (19 | ) | (18 | ) | (22 | ) | ||||||||||||
| 22,524 | 38,830 | 6,391 | 3,970 | 2,762 | 12,315 | |||||||||||||||||
| 1,805 | 528 | 465 | 1,677 | 1,508 | 5,463 | |||||||||||||||||
| 531 | 879 | 194 | 129 | 116 | 420 | |||||||||||||||||
| 16 | 27 | 6 | 4 | 4 | 13 | |||||||||||||||||
| 5 | 9 | 2 | 2 | 1 | 4 | |||||||||||||||||
| 46 | 75 | 16 | 11 | 10 | 37 | |||||||||||||||||
| 42 | 69 | 15 | 10 | 9 | 33 | |||||||||||||||||
| 18 | 27 | 4 | 3 | 3 | 13 | |||||||||||||||||
| 10 | 16 | 3 | 2 | 2 | 8 | |||||||||||||||||
| — | 474 | — | — | — | — | |||||||||||||||||
| 30 | 89 | 25 | 15 | 12 | 43 | |||||||||||||||||
| 2,503 | 2,193 | 730 | 1,853 | 1,665 | 6,034 | |||||||||||||||||
| (1,698 | ) | (352 | ) | (310 | ) | (568 | ) | (557 | ) | (1,849 | ) | |||||||||||
| (531 | ) | (879 | ) | (194 | ) | (129 | ) | (116 | ) | (420 | ) | |||||||||||
| — | — | — | (2 | ) | (2 | ) | (5 | ) | ||||||||||||||
| 274 | 962 | 226 | 1,154 | 990 | 3,760 | |||||||||||||||||
| 22,250 | 37,868 | 6,165 | 2,816 | 1,772 | 8,555 | |||||||||||||||||
| 1,417 | (1,391 | ) | 2,644 | 26,703 | 21,901 | 66,037 | ||||||||||||||||
| 3,360 | 5,398 | 2,255 | 242 | 817 | 1,163 | |||||||||||||||||
| — | — | — | — | — | (1 | ) | ||||||||||||||||
| 102,574 | 164,184 | 74,762 | 29,793 | 24,909 | 100,179 | |||||||||||||||||
| (588 | ) | (1,000 | ) | 288 | (161 | ) | (229 | ) | (376 | ) | ||||||||||||
| — | — | — | — | — | 1 | |||||||||||||||||
| $ | 129,013 | $ | 205,059 | $ | 86,114 | $ | 59,393 | $ | 49,170 | $ | 175,558 | |||||||||||
| SEI Institutional Investments Trust / Semi-Annual Report / November 30, 2016 | 241 |
STATEMENTS OF OPERATIONS ($ Thousands) (Unaudited)
For the six month period ended November 30, 2016
| U.S. Managed Volatility Fund | Global Managed Volatility Fund | World Equity Ex-US Fund | ||||||||||
Investment Income: | ||||||||||||
Dividends | $ | 20,708 | $ | 15,354 | $ | 79,601 | ||||||
Dividends from affiliated investments(1) | 27 | 46 | 151 | |||||||||
Interest income | 2 | 4 | 40 | |||||||||
Security lending income — net(1)(2) | — | — | 2,082 | |||||||||
Less: foreign taxes withheld | (138 | ) | (701 | ) | (7,838 | ) | ||||||
Total Investment Income | 20,599 | 14,703 | 74,036 | |||||||||
Expenses: | ||||||||||||
Investment advisory fees | 5,008 | 3,527 | 19,746 | |||||||||
Administration fees | 385 | 271 | 1,795 | |||||||||
Trustees’ fees | 12 | 8 | 55 | |||||||||
Chief compliance officer fees | 4 | 3 | 18 | |||||||||
Custodian/wire agent fees | 36 | 114 | 407 | |||||||||
Professional fees | 32 | 22 | 140 | |||||||||
Printing fees | 7 | 5 | 33 | |||||||||
Registration fees | 3 | 4 | 48 | |||||||||
Rating fees | — | — | — | |||||||||
Other expenses | 43 | 26 | 189 | |||||||||
Total Expenses | 5,530 | 3,980 | 22,431 | |||||||||
Less: | ||||||||||||
Waiver of investment advisory fees | (3,326 | ) | (2,333 | ) | (8,976 | ) | ||||||
Waiver of administration fees | (385 | ) | (271 | ) | (1,795 | ) | ||||||
Fees paid indirectly(1) | — | — | (53 | ) | ||||||||
Net Expenses | 1,819 | 1,376 | 11,607 | |||||||||
Net Investment Income | 18,780 | 13,327 | 62,429 | |||||||||
Net Realized Gain (Loss) on: | ||||||||||||
Investments | 50,982 | 13,203 | (65,853 | ) | ||||||||
Futures contracts | 905 | 2,751 | 17,716 | |||||||||
Foreign currency transactions | (106 | ) | 10,187 | (6,187 | ) | |||||||
Purchased and written options | — | — | — | |||||||||
Swap contracts | — | — | — | |||||||||
Net Change in Unrealized Appreciation (Depreciation) on: | ||||||||||||
Investments | 856 | (19,324 | ) | 159,729 | ||||||||
Futures contracts | 217 | (581 | ) | (5,478 | ) | |||||||
Purchased and written options | — | — | — | |||||||||
Swap contracts | — | — | — | |||||||||
Foreign capital gains tax | — | — | — | |||||||||
Foreign currency translation of other assets and liabilities denominated in foreign currencies | 48 | 1,004 | (1,124 | ) | ||||||||
Net Increase (Decrease) in Net Assets Resulting from Operations | $ | 71,682 | $ | 20,567 | $ | 161,232 | ||||||
| (1) | See Note 6 in the Notes to Financial Statements. |
| (2) | Income is from the investment of collateral in an affiliated security. |
Amounts designated as “—” are $0 or have been rounded to $0.
The accompanying notes are an integral part of the financial statements.
| 242 | SEI Institutional Investments Trust / Semi-Annual Report / November 30, 2016 |
| Screened World Equity Ex-US Fund | Emerging Markets Equity Fund | Opportunistic Income Fund | Core Fixed Income Fund | High Yield Bond Fund | Long Duration Fund | |||||||||||||||||
| $ | 929 | $ | 13,792 | $ | 55 | $ | — | $ | 695 | $ | — | |||||||||||
| 1 | 7 | 74 | 151 | 127 | 28 | |||||||||||||||||
| — | 16 | 31,337 | 71,796 | 95,933 | 55,865 | |||||||||||||||||
| — | — | — | — | — | — | |||||||||||||||||
| (101 | ) | (1,568 | ) | (1 | ) | (1 | ) | (38 | ) | (51 | ) | |||||||||||
| 829 | 12,247 | 31,465 | 71,946 | 96,717 | 55,842 | |||||||||||||||||
| 283 | 5,344 | 4,824 | 8,344 | 6,824 | 4,218 | |||||||||||||||||
| 22 | 254 | 536 | 1,391 | 700 | 703 | |||||||||||||||||
| 1 | 8 | 17 | 43 | 21 | 22 | |||||||||||||||||
| — | 3 | 5 | 14 | 7 | 7 | |||||||||||||||||
| 36 | 322 | 48 | 125 | 59 | 64 | |||||||||||||||||
| 2 | 20 | 43 | 112 | 55 | 58 | |||||||||||||||||
| — | 5 | 10 | 25 | 13 | 13 | |||||||||||||||||
| 1 | 5 | 9 | 40 | 22 | 5 | |||||||||||||||||
| — | — | — | — | — | — | |||||||||||||||||
| 2 | 24 | 57 | 142 | 70 | 74 | |||||||||||||||||
| 347 | 5,985 | 5,549 | 10,236 | 7,771 | 5,164 | |||||||||||||||||
| (170 | ) | (2,494 | ) | (2,251 | ) | (5,520 | ) | (2,904 | ) | (2,390 | ) | |||||||||||
| (22 | ) | (254 | ) | (536 | ) | (1,391 | ) | (700 | ) | (703 | ) | |||||||||||
| — | — | — | — | — | — | |||||||||||||||||
| 155 | 3,237 | 2,762 | 3,325 | 4,167 | 2,071 | |||||||||||||||||
| 674 | 9,010 | 28,703 | 68,621 | 92,550 | 53,771 | |||||||||||||||||
| 127 | 18,479 | 283 | 21,982 | (16,480 | ) | 27,347 | ||||||||||||||||
| 246 | — | 465 | 11,010 | — | (5,525 | ) | ||||||||||||||||
| (72 | ) | (191 | ) | — | 341 | — | — | |||||||||||||||
| — | — | — | (933 | ) | — | — | ||||||||||||||||
| — | — | — | (4,344 | ) | 598 | (104 | ) | |||||||||||||||
| 2,889 | 14,887 | 15,036 | (141,941 | ) | 118,621 | (120,925 | ) | |||||||||||||||
| (18 | ) | — | 11 | 884 | — | (561 | ) | |||||||||||||||
| — | — | — | 312 | — | — | |||||||||||||||||
| — | — | — | 8,759 | 126 | 719 | |||||||||||||||||
| — | (145 | ) | — | — | — | — | ||||||||||||||||
| (14 | ) | (26 | ) | — | 7,413 | — | — | |||||||||||||||
| $ | 3,832 | $ | 42,014 | $ | 44,498 | $ | (27,896 | ) | $ | 195,415 | $ | (45,278 | ) | |||||||||
| SEI Institutional Investments Trust / Semi-Annual Report / November 30, 2016 | 243 |
STATEMENTS OF OPERATIONS/CONSOLIDATED STATEMENTS OF OPERATIONS ($ Thousands) (Unaudited)
For the six month period ended November 30, 2016
| Long Duration Credit Fund | Ultra Short Duration Bond Fund | Emerging Markets Debt Fund | ||||||||||
Investment Income: | ||||||||||||
Dividends | $ | — | $ | (3 | ) | $ | — | |||||
Dividends from affiliated investments(1) | 39 | 3 | — | |||||||||
Interest income | 65,873 | 2,319 | 65,263 | |||||||||
Security lending income — net(1)(2) | — | — | — | |||||||||
Less: foreign taxes withheld | — | — | (1,063 | ) | ||||||||
Total Investment Income | 65,912 | 2,319 | 64,200 | |||||||||
Expenses: | ||||||||||||
Investment advisory fees | 5,039 | 386 | 8,661 | |||||||||
Administration fees | 840 | 129 | 509 | |||||||||
Trustees’ fees | 26 | 4 | 16 | |||||||||
Chief compliance officer fees | 9 | 1 | 5 | |||||||||
Custodian/wire agent fees | 74 | 15 | 270 | |||||||||
Professional fees | 68 | 11 | 41 | |||||||||
Registration fees | 21 | 4 | 11 | |||||||||
Printing fees | 15 | 2 | 9 | |||||||||
Interest expense on reverse repurchase agreements | — | — | — | |||||||||
Dividend expense on securities sold short | — | — | — | |||||||||
Rating fees | — | — | — | |||||||||
Other expenses | 90 | 15 | 53 | |||||||||
Total Expenses | 6,182 | 567 | 9,575 | |||||||||
Less: | ||||||||||||
Waiver of investment advisory fees | (2,856 | ) | (129 | ) | (4,789 | ) | ||||||
Waiver of administration fees | (840 | ) | (129 | ) | (509 | ) | ||||||
Net Expenses | 2,486 | 309 | 4,277 | |||||||||
Net Investment Income | 63,426 | 2,010 | 59,923 | |||||||||
Net Realized Gain (Loss) on: | ||||||||||||
Investments | 24,800 | 1,475 | 19,369 | |||||||||
Securities sold short | — | — | — | |||||||||
Futures contracts | 1,736 | — | (677 | ) | ||||||||
Foreign currency transactions | — | 48 | (44,011 | ) | ||||||||
Purchased and written options | — | — | — | |||||||||
Purchased and written swaptions | — | — | — | |||||||||
Swap contracts | — | — | (2,545 | ) | ||||||||
Net Change in Unrealized Appreciation (Depreciation) on: | ||||||||||||
Investments | (127,723 | ) | 578 | (27,172 | ) | |||||||
Securities sold short | — | — | — | |||||||||
Futures contracts | (187 | ) | 22 | (275 | ) | |||||||
Purchased and written options | — | — | — | |||||||||
Swap contracts | — | — | 167 | |||||||||
Foreign currency translation of other assets and liabilities denominated in foreign currencies | — | — | 10,749 | |||||||||
Net Increase (Decrease) in Net Assets Resulting from Operations | $ | (37,948 | ) | $ | 4,133 | $ | 15,528 | |||||
| (1) | See Note 6 in the Notes to Financial Statements. |
| (2) | Income is from the investment of collateral in an affiliated security. |
Amounts designated as “—” are $0 or have been rounded to $0.
The accompanying notes are an integral part of the financial statements.
| 244 | SEI Institutional Investments Trust / Semi-Annual Report / November 30, 2016 |
| Real Return Fund | Limited Duration Bond Fund | Intermediate Duration Credit Fund | Dynamic Asset Allocation Fund | Multi-Asset Real Return Fund | ||||||||||||||
| $ | — | $ | — | $ | 6 | $ | 23,179 | $ | 2,185 | |||||||||
| — | 16 | 29 | — | — | ||||||||||||||
| 1,903 | 8,612 | 20,267 | 634 | 7,946 | ||||||||||||||
| — | — | — | — | — | ||||||||||||||
| — | — | — | (15 | ) | (1 | ) | ||||||||||||
| 1,903 | 8,628 | 20,302 | 23,798 | 10,130 | ||||||||||||||
| 156 | 1,466 | 1,836 | 6,422 | 2,017 | ||||||||||||||
| 35 | 293 | 367 | 535 | 183 | ||||||||||||||
| 1 | 9 | 11 | 16 | 5 | ||||||||||||||
| — | 3 | 4 | 5 | 2 | ||||||||||||||
| 1 | 26 | 31 | 16 | 12 | ||||||||||||||
| 3 | 23 | 29 | 42 | 15 | ||||||||||||||
| 1 | 10 | 9 | 14 | 5 | ||||||||||||||
| 1 | 5 | 7 | 9 | 3 | ||||||||||||||
| — | — | — | — | 546 | ||||||||||||||
| — | — | — | — | 148 | ||||||||||||||
| — | — | — | — | — | ||||||||||||||
| 5 | 28 | 39 | 54 | 19 | ||||||||||||||
| 203 | 1,863 | 2,333 | 7,113 | 2,955 | ||||||||||||||
| (114 | ) | (938 | ) | (881 | ) | (5,780 | ) | (1,137 | ) | |||||||||
| (35 | ) | (293 | ) | (367 | ) | (535 | ) | (183 | ) | |||||||||
| 54 | 632 | 1,085 | 798 | 1,635 | ||||||||||||||
| 1,849 | 7,996 | 19,217 | 23,000 | 8,495 | ||||||||||||||
| 183 | 720 | 6,886 | 2,214 | 6,916 | ||||||||||||||
| — | — | — | — | (11,203 | ) | |||||||||||||
| — | (85 | ) | 1,150 | 4,006 | 5,903 | |||||||||||||
| — | — | — | 1,062 | (2,021 | ) | |||||||||||||
| — | — | — | (1,568 | ) | (156 | ) | ||||||||||||
| — | — | — | — | (43 | ) | |||||||||||||
| — | — | — | 10,053 | (182 | ) | |||||||||||||
| (844 | ) | (5,325 | ) | (31,623 | ) | 95,888 | 1,349 | |||||||||||
| — | — | — | — | (4,690 | ) | |||||||||||||
| — | 4 | 217 | 4,713 | (6,110 | ) | |||||||||||||
| — | — | — | 6,494 | 69 | ||||||||||||||
| — | — | — | (1,119 | ) | 1,400 | |||||||||||||
| | — |
| — | — | 6,506 | 2,772 | ||||||||||||
| $ | 1,188 | $ | 3,310 | $ | (4,153 | ) | $ | 151,249 | $ | 2,499 | ||||||||
| SEI Institutional Investments Trust / Semi-Annual Report / November 30, 2016 | 245 |
STATEMENTS OF CHANGES IN NET ASSETS ($ Thousands)
For the six month period ended November 30, 2016 (Unaudited) and the year ended May 31, 2016
| Large Cap Fund | Large Cap Diversified Alpha Fund | Large Cap Disciplined Equity Fund | ||||||||||||||||||||||
| 06/01/16 to 11/30/16 | 06/01/15 to 05/31/16 | 06/01/16 to 11/30/16 | 06/01/15 to 05/31/16 | 06/01/16 to 11/30/16 | 06/01/15 to 05/31/16 | |||||||||||||||||||
Operations: | ||||||||||||||||||||||||
Net investment income | $ | 16,232 | $ | 34,016 | $ | 460 | $ | 1,026 | $ | 35,991 | $ | 67,990 | ||||||||||||
Net realized gain (loss) from investments and futures contracts | 56,086 | 111,742 | 1,571 | 424 | 128,627 | 113,204 | ||||||||||||||||||
Net realized gain on foreign currency transactions | — | — | — | — | — | 9 | ||||||||||||||||||
Net change in unrealized appreciation (depreciation) on investments and futures contracts | 29,462 | (204,357 | ) | 945 | (4,385 | ) | 36,856 | (156,765 | ) | |||||||||||||||
Net change in unrealized appreciation (depreciation) on foreign currency transactions | — | — | — | — | (1 | ) | 9 | |||||||||||||||||
Net Increase (Decrease) in Net Assets Resulting from Operations | 101,780 | (58,599 | ) | 2,976 | (2,935 | ) | 201,473 | 24,447 | ||||||||||||||||
Dividends and Distributions to Shareholders: | ||||||||||||||||||||||||
Net investment income: | ||||||||||||||||||||||||
Class A | (14,609 | ) | (34,137 | ) | — | (1,026 | ) | (27,494 | ) | (73,173 | ) | |||||||||||||
Net realized gains: | ||||||||||||||||||||||||
Class A | — | (293,971 | ) | — | (20,185 | ) | — | (435,090 | ) | |||||||||||||||
Return of capital: | ||||||||||||||||||||||||
Class A | — | — | — | (365 | ) | — | — | |||||||||||||||||
Total Dividends and Distributions | (14,609 | ) | (328,108 | ) | — | (21,576 | ) | (27,494 | ) | (508,263 | ) | |||||||||||||
Capital Share Transactions:(1) | ||||||||||||||||||||||||
Class A: | ||||||||||||||||||||||||
Proceeds from shares issued | 85,774 | 363,483 | 3,749 | 18,548 | 192,787 | 358,811 | ||||||||||||||||||
Reinvestment of dividends & distributions | 14,215 | 319,314 | — | 14,464 | 27,102 | 500,632 | ||||||||||||||||||
Cost of shares redeemed | (294,132 | ) | (575,772 | ) | (5,870 | ) | (17,773 | ) | (434,240 | ) | (982,046 | ) | ||||||||||||
Net Increase (Decrease) from Class A Transactions | (194,143 | ) | 107,025 | (2,121 | ) | 15,239 | (214,351 | ) | (122,603 | ) | ||||||||||||||
Net Increase (Decrease) in Net Assets | (106,972 | ) | (279,682 | ) | 855 | (9,272 | ) | (40,372 | ) | (606,419 | ) | |||||||||||||
Net Assets | ||||||||||||||||||||||||
Beginning of Period | 2,086,522 | 2,366,204 | 54,335 | 63,607 | 3,592,226 | 4,198,645 | ||||||||||||||||||
End of Period | $ | 1,979,550 | $ | 2,086,522 | $ | 55,190 | $ | 54,335 | $ | 3,551,854 | $ | 3,592,226 | ||||||||||||
Undistributed Net Investment Income Included in Net Assets at Period End | $ | 5,731 | $ | 4,108 | $ | 460 | $ | — | $ | 13,733 | $ | 5,236 | ||||||||||||
| (1) | See Note 7 in the Notes to Financial Statements for additional information. |
Amounts designated as “—” are $0 or have been rounded to $0.
The accompanying notes are an integral part of the financial statements.
| 246 | SEI Institutional Investments Trust / Semi-Annual Report / November 30, 2016 |
| Large Cap Index Fund | S&P 500 Index Fund | Extended Market Index Fund | Small Cap Fund | |||||||||||||||||||||||||||
| 06/01/16 to 11/30/16 | 06/01/15 to 05/31/16 | 06/01/16 to 11/30/16 | 06/01/15 to 05/31/16 | 06/01/16 to 11/30/16 | 06/01/15 to 05/31/16 | 06/01/16 to 11/30/16 | 06/01/15 to 05/31/16 | |||||||||||||||||||||||
| $ | 22,250 | $ | 38,037 | $ | 37,868 | $ | 65,144 | $ | 6,165 | $ | 10,094 | $ | 2,816 | $ | 5,449 | |||||||||||||||
| 4,777 | 42,019 | 4,007 | (27,207 | ) | 4,899 | 11,697 | 26,945 | 16,261 | ||||||||||||||||||||||
| — | — | — | — | — | — | — | — | |||||||||||||||||||||||
|
101,986 |
| (64,518 | ) | 163,184 | 13,638 | 75,050 | (62,920 | ) | 29,632 | (55,859 | ) | ||||||||||||||||||
|
— |
| — | — | — | — | — | — | — | |||||||||||||||||||||
| 129,013 | 15,538 | 205,059 | 51,575 | 86,114 | (41,129 | ) | 59,393 | (34,149 | ) | |||||||||||||||||||||
| (19,016 | ) | (38,254 | ) | (31,768 | ) | (66,365 | ) | (5,045 | ) | (9,861 | ) | (1,963 | ) | (5,988 | ) | |||||||||||||||
| — | (70,310 | ) | — | (8,700 | ) | — | (22,374 | ) | — | (56,411 | ) | |||||||||||||||||||
| — | — | — | — | — | — | — | — | |||||||||||||||||||||||
| (19,016 | ) | (108,564 | ) | (31,768 | ) | (75,065 | ) | (5,045 | ) | (32,235 | ) | (1,963 | ) | (62,399 | ) | |||||||||||||||
| 194,361 | 561,572 | 285,610 | 751,497 | 110,735 | 183,326 | 19,215 | 46,690 | |||||||||||||||||||||||
| 18,946 | 108,163 | 31,165 | 74,445 | 5,025 | 32,115 | 1,833 | 54,340 | |||||||||||||||||||||||
| (176,438 | ) | (487,293 | ) | (211,862 | ) | (612,736 | ) | (73,684 | ) | (165,182 | ) | (47,459 | ) | (185,884 | ) | |||||||||||||||
| 36,869 | 182,442 | 104,913 | 213,206 | 42,076 | 50,259 | (26,411 | ) | (84,854 | ) | |||||||||||||||||||||
| 146,866 | 89,416 | 278,204 | 189,716 | 123,145 | (23,105 | ) | 31,019 | (181,402 | ) | |||||||||||||||||||||
| 2,061,670 | 1,972,254 | 3,384,560 | 3,194,844 | 714,258 | 737,363 | 502,222 | 683,624 | |||||||||||||||||||||||
| $ | 2,208,536 | $ | 2,061,670 | $ | 3,662,764 | $ | 3,384,560 | $ | 837,403 | $ | 714,258 | $ | 533,241 | $ | 502,222 | |||||||||||||||
| $ | 8,207 |
| $ | 4,973 | $ | 14,553 | $ | 8,453 | $ | 1,813 | $ | 693 | $ | 990 | $ | 137 | ||||||||||||||
| SEI Institutional Investments Trust / Semi-Annual Report / November 30, 2016 | 247 |
STATEMENTS OF CHANGES IN NET ASSETS ($ Thousands)
For the six month period ended November 30, 2016 (Unaudited) and the year ended May 31, 2016
| Small Cap II Fund | Small/Mid Cap Equity Fund | |||||||||||||||
| 06/01/16 to 11/30/16 | 06/01/15 to 05/31/16 | 06/01/16 to 11/30/16 | 06/01/15 to 05/31/16 | |||||||||||||
Operations: | ||||||||||||||||
Net investment income | $ | 1,772 | $ | 2,765 | $ | 8,555 | $ | 15,317 | ||||||||
Net realized gain (loss) from investments and futures contracts | 22,718 | (14,207 | ) | 67,200 | 46,336 | |||||||||||
Net realized gain (loss) on foreign currency transactions | — | — | (1 | ) | — | |||||||||||
Net change in unrealized appreciation (depreciation) on investments and futures contracts | 24,680 | (7,454 | ) | 99,803 | (160,914 | ) | ||||||||||
Net change in unrealized appreciation (depreciation) on foreign currency transactions | — | — | 1 | — | ||||||||||||
Net change in unrealized appreciation (depreciation) on foreign cap gains tax | — | — | — | — | ||||||||||||
Net Increase (Decrease) in Net Assets Resulting from Operations | 49,170 | (18,896 | ) | 175,558 | (99,261 | ) | ||||||||||
Dividends and Distributions to Shareholders: | ||||||||||||||||
Net investment income: | ||||||||||||||||
Class A | (1,579 | ) | (2,674 | ) | (5,803 | ) | (16,765 | ) | ||||||||
Net realized gains: | ||||||||||||||||
Class A | — | (29,158 | ) | — | (226,544 | ) | ||||||||||
Total Dividends and Distributions | (1,579 | ) | (31,832 | ) | (5,803 | ) | (243,309 | ) | ||||||||
Capital Share Transactions:(2) | ||||||||||||||||
Class A: | ||||||||||||||||
Proceeds from shares issued | 26,265 | 229,943 | 89,971 | 174,795 | ||||||||||||
Reinvestment of dividends & distributions | 1,541 | 30,961 | 5,732 | 240,258 | ||||||||||||
Cost of shares redeemed | (52,769 | ) | (128,292 | ) | (163,396 | ) | (289,308 | ) | ||||||||
Net Increase (Decrease) from Class A Transactions | (24,963 | ) | 132,612 | (67,693 | ) | 125,745 | ||||||||||
Net Increase (Decrease) in Net Assets | 22,628 | 81,884 | 102,062 | (216,825 | ) | |||||||||||
Net Assets | ||||||||||||||||
Beginning of Period | 455,742 | 373,858 | 1,642,784 | 1,859,609 | ||||||||||||
End of Period | $ | 478,370 | $ | 455,742 | $ | 1,744,846 | $ | 1,642,784 | ||||||||
Undistributed Net Investment Income Included in Net Assets at Period End | $ | 529 | $ | 336 | $ | 7,396 | $ | 4,644 | ||||||||
| (1) | Commenced operations on January 29, 2016. |
| (2) | See Note 7 in Notes to Financial Statements for additional information |
Amounts designated as “—” are $0 or have been rounded to $0.
The accompanying notes are an integral part of the financial statements.
| 248 | SEI Institutional Investments Trust / Semi-Annual Report / November 30, 2016 |
| U.S. Managed Volatility Fund | Global Managed Volatility Fund(1) | World Equity Ex-US Fund | Screened World Equity Ex-US Fund | Emerging Markets Equity Fund | ||||||||||||||||||||||||||||||||||
| 06/01/16 to 11/30/16 | 06/01/15 to 05/31/16 | 06/01/16 to 11/30/16 | 01/29/16 to 05/31/16 | 06/01/16 to 11/30/16 | 06/01/15 to 05/31/16 | 06/01/16 to 11/30/16 | 06/01/15 to 05/31/16 | 06/01/16 to 11/30/16 | 06/01/15 to 05/31/16 | |||||||||||||||||||||||||||||
| $ | 18,780 | $ | 38,461 | $ | 13,327 | $ | 11,524 | $ | 62,429 | $ | 143,430 | $ | 674 | $ | 1,573 | $ | 9,010 | $ | 12,232 | |||||||||||||||||||
| 51,887 | 55,381 | 15,954 | 5,772 | (48,137 | ) | (343,294 | ) | 373 | (2,399 | ) | 18,479 | (41,168 | ) | |||||||||||||||||||||||||
| (106 | ) | (73 | ) | 10,187 | (11,359 | ) | (6,187 | ) | (6,606 | ) | (72 | ) | (46 | ) | (191 | ) | (355 | ) | ||||||||||||||||||||
| 1,073 | (20,508 | ) | (19,905 | ) | 69,232 | 154,251 | (750,648 | ) | 2,871 | (6,428 | ) | 14,887 | (34,235 | )�� | ||||||||||||||||||||||||
| 48 | (35 | ) | 1,004 | 479 | (1,124 | ) | 541 | (14 | ) | 10 | (26 | ) | 30 | |||||||||||||||||||||||||
| — | — | — | — | — | 413 | — | — | (145 | ) | — | ||||||||||||||||||||||||||||
| 71,682 | 73,226 | 20,567 | 75,648 | 161,232 | (956,164 | ) | 3,832 | (7,290 | ) | 42,014 | (63,496 | ) | ||||||||||||||||||||||||||
| (17,157 | ) | (38,954 | ) | — | — | — | (138,717 | ) | — | (1,667 | ) | — | (11,121 | ) | ||||||||||||||||||||||||
| — | (96,312 | ) | — | — | — | (30,172 | ) | — | — | — | (1,805 | ) | ||||||||||||||||||||||||||
| (17,157 | ) | (135,266 | ) | — | — | — | (168,889 | ) | — | (1,667 | ) | — | (12,926 | ) | ||||||||||||||||||||||||
| 114,603 | 601,031 | 137,438 | 1,229,214 | 571,853 | 1,408,936 | 4,923 | 13,462 | 130,072 | 495,732 | |||||||||||||||||||||||||||||
| 16,943 | 132,818 | — | — | — | 165,514 | — | 1,098 | — | 12,653 | |||||||||||||||||||||||||||||
| (227,134 | ) | (561,879 | ) | (164,959 | ) | (243,848 | ) | (522,387 | ) | (1,170,304 | ) | (3,937 | ) | (6,646 | ) | (71,008 | ) | (88,527 | ) | |||||||||||||||||||
| (95,588 | ) | 171,970 | (27,521 | ) | 985,366 | 49,466 | 404,146 | 986 | 7,914 | 59,064 | 419,858 | |||||||||||||||||||||||||||
| (41,063 | ) | 109,930 | (6,954 | ) | 1,061,014 | 210,698 | (720,907 | ) | 4,818 | (1,043 | ) | 101,078 | 343,436 | |||||||||||||||||||||||||
| 1,524,568 | 1,414,638 | 1,061,014 | — | 6,923,937 | 7,644,844 | 82,836 | 83,879 | 935,399 | 591,963 | |||||||||||||||||||||||||||||
| $ | 1,483,505 | $ | 1,524,568 | $ | 1,054,060 | $ | 1,061,014 | $ | 7,134,635 | $ | 6,923,937 | $ | 87,654 | $ | 82,836 | $ | 1,036,477 | $ | 935,399 | |||||||||||||||||||
| $ | 5,178 | $ | 3,555 | $ | 13,778 | $ | 451 | $ | 132,216 | $ | 69,787 | $ | 1,517 | $ | 843 | $ | 14,946 | $ | 5,936 | |||||||||||||||||||
| SEI Institutional Investments Trust / Semi-Annual Report / November 30, 2016 | 249 |
STATEMENTS OF CHANGES IN NET ASSETS ($ Thousands)
For the six month period ended November 30, 2016 (Unaudited) and the year ended May 31, 2016
| Opportunistic Income Fund | Core Fixed Income Fund | High Yield Bond Fund | ||||||||||||||||||||||
| 06/01/16 to 11/30/16 | 06/01/15 to 05/31/16 | 06/01/16 to 11/30/16 | 06/01/15 to 05/31/16 | 06/01/16 to 11/30/16 | 06/01/15 to 05/31/16 | |||||||||||||||||||
Operations: | ||||||||||||||||||||||||
Net investment income | $ | 28,703 | $ | 57,812 | $ | 68,621 | $ | 142,203 | $ | 92,550 | $ | 162,425 | ||||||||||||
Net realized gain (loss) from investments, futures contracts, options and swap contracts | 748 | (9,791 | ) | 27,715 | 45,716 | (15,882 | ) | (68,824 | ) | |||||||||||||||
Net realized gain (loss) on foreign currency transactions | — | — | 341 | 493 | — | — | ||||||||||||||||||
Net change in unrealized appreciation (depreciation) on investments, futures contracts, options and swap contracts | 15,047 | (28,104 | ) | (131,986 | ) | (34,287 | ) | 118,747 | (132,712 | ) | ||||||||||||||
Net change in unrealized appreciation (depreciation) on foreign currency transactions | — | — | 7,413 | (1,345 | ) | — | — | |||||||||||||||||
Net Increase (Decrease) in Net Assets Resulting from Operations | 44,498 | 19,917 | (27,896 | ) | 152,780 | 195,415 | (39,111 | ) | ||||||||||||||||
Dividends and Distributions to Shareholders: | ||||||||||||||||||||||||
Net investment income: | ||||||||||||||||||||||||
Class A | (28,157 | ) | (56,898 | ) | (70,969 | ) | (146,140 | ) | (91,872 | ) | (161,193 | ) | ||||||||||||
Net realized gains: | ||||||||||||||||||||||||
Class A | — | — | — | (100,701 | ) | — | (20,343 | ) | ||||||||||||||||
Total Dividends and Distributions | (28,157 | ) | (56,898 | ) | (70,969 | ) | (246,841 | ) | (91,872 | ) | (181,536 | ) | ||||||||||||
Capital Share Transactions:(1) | ||||||||||||||||||||||||
Class A: | ||||||||||||||||||||||||
Proceeds from shares issued | 153,572 | 337,500 | 942,905 | 1,048,275 | (2) | 262,037 | 634,290 | |||||||||||||||||
Reinvestment of dividends & distributions | 27,528 | 54,859 | 69,834 | 242,742 | 89,994 | 177,399 | ||||||||||||||||||
Cost of shares redeemed | (129,194 | ) | (393,187 | ) | (696,836 | ) | (1,532,904 | ) | (251,329 | ) | (467,893 | ) | ||||||||||||
Net Increase (Decrease) from Class A Transactions | 51,906 | (828 | ) | 315,903 | (241,887 | ) | 100,702 | 343,796 | ||||||||||||||||
Net Increase (Decrease) in Net Assets | 68,247 | (37,809 | ) | 217,038 | (335,948 | ) | 204,245 | 123,149 | ||||||||||||||||
Net Assets | ||||||||||||||||||||||||
Beginning of Period | 2,129,669 | 2,167,478 | 5,264,859 | 5,600,807 | 2,639,919 | 2,516,770 | ||||||||||||||||||
End of Period | $ | 2,197,916 | $ | 2,129,669 | $ | 5,481,897 | $ | 5,264,859 | $ | 2,844,164 | $ | 2,639,919 | ||||||||||||
Undistributed (Distributions in Excess of) Net Investment Income Included in Net Assets at Period End | $ | 18,035 | $ | 17,489 | $ | 2,364 | $ | 4,712 | $ | 14,526 | $ | 13,848 | ||||||||||||
| (1) | See Note 7 in Notes to Financial Statements for additional information. |
| (2) | Includes subscriptions as a result of an in-kind transfer of securities (see Note 11). |
| (3) | Includes redemptions as a result of an in-kind transfer of securities (see Note 11). |
Amounts designated as “—” are $0 or have been rounded to $0.
The accompanying notes are an integral part of the financial statements.
| 250 | SEI Institutional Investments Trust / Semi-Annual Report / November 30, 2016 |
| Long Duration Fund | Long Duration Credit Fund | Ultra Short Duration Bond Fund | Emerging Markets Debt Fund | |||||||||||||||||||||||||||
| 06/01/16 to 11/30/16 | 06/01/15 to 05/31/16 | 06/01/16 to 11/30/16 | 06/01/15 to 05/31/16 | 06/01/16 to 11/30/16 | 06/01/15 to 05/31/16 | 06/01/16 to 11/30/16 | 06/01/15 to 05/31/16 | |||||||||||||||||||||||
| $ | 53,771 | $ | 124,845 | $ | 63,426 | $ | 133,441 | $ | 2,010 | $ | 7,007 | $ | 59,923 | $ | 112,763 | |||||||||||||||
| 21,718 | 47,900 | 26,536 | (22,676 | ) | 1,475 | (122 | ) | 16,147 | (21,426 | ) | ||||||||||||||||||||
| — | — | — | — | 48 | — | (44,011 | ) | (92,417 | ) | |||||||||||||||||||||
|
(120,767 |
) | (12,574 | ) | (127,910 | ) | 106,606 | 600 | (639 | ) | (27,280 | ) | (11,722 | ) | ||||||||||||||||
| — | — | — | — | — | — | 10,749 | (12,341 | ) | ||||||||||||||||||||||
| (45,278 | ) | 160,171 | (37,948 | ) | 217,371 | 4,133 | 6,246 | 15,528 | (25,143 | ) | ||||||||||||||||||||
| (53,759 | ) | (124,564 | ) | (63,434 | ) | (133,496 | ) | (3,719 | ) | (8,407 | ) | (4,733 | ) | (16,885 | ) | |||||||||||||||
| — | (126,907 | ) | — | (67,810 | ) | — | — | — | — | |||||||||||||||||||||
| (53,759 | ) | (251,471 | ) | (63,434 | ) | (201,306 | ) | (3,719 | ) | (8,407 | ) | (4,733 | ) | (16,885 | ) | |||||||||||||||
| 97,793 | 448,715 | 8,218 | 349,678 | (2) | 97,274 | 260,010 | 131,478 | 457,705 | ||||||||||||||||||||||
| 51,592 | 241,069 | 63,434 | 200,665 | 3,620 | 8,283 | 4,615 | 16,472 | |||||||||||||||||||||||
| (344,969 | ) | (1,167,092 | )(3) | (175,753 | ) | (697,830 | ) | (102,717 | ) | (376,375 | ) | (162,113 | ) | (333,174 | ) | |||||||||||||||
| (195,584 | ) | (477,308 | ) | (104,101 | ) | (147,487 | ) | (1,823 | ) | (108,082 | ) | (26,020 | ) | 141,003 | ||||||||||||||||
| (294,621 | ) | (568,608 | ) | (205,483 | ) | (131,422 | ) | (1,409 | ) | (110,243 | ) | (15,225 | ) | 98,975 | ||||||||||||||||
| 2,775,237 | 3,343,845 | 3,333,806 | 3,465,228 | 535,629 | 645,872 | 1,935,751 | 1,836,776 | |||||||||||||||||||||||
| $ | 2,480,616 | $ | 2,775,237 | $ | 3,128,323 | $ | 3,333,806 | $ | 534,220 | $ | 535,629 | $ | 1,920,526 | $ | 1,935,751 | |||||||||||||||
| $ | (1,641 | ) | $ | (1,653 | ) | $ | (22 | ) | $ | (14 | ) | $ | (1,744 | ) | $ | (35 | ) | $ | 45,143 | $ | (10,047 | ) | ||||||||
| SEI Institutional Investments Trust / Semi-Annual Report / November 30, 2016 | 251 |
STATEMENTS OF CHANGES IN NET ASSESTS/CONSOLIDATED STATEMENTS OF CHANGES IN NET ASSETS ($ Thousands)
For the six month period ended November 30, 2016 (Unaudited) and the year ended May 31, 2016
| Real Return Fund | Limited Duration Bond Fund | |||||||||||||||
| 06/01/16 to 11/30/16 | 06/01/15 to 05/31/16 | 06/01/16 to 11/30/16 | 06/01/15 to 05/31/16 | |||||||||||||
Operations: | ||||||||||||||||
Net investment income | $ | 1,849 | $ | 1,589 | $ | 7,996 | $ | 11,452 | ||||||||
Net realized gain (loss) from investments, securities sold short, futures contracts, options, swaptions and swap contracts | 183 | (2,891 | ) | 635 | 776 | |||||||||||
Net realized gain (loss) on foreign currency transactions | — | — | — | — | ||||||||||||
Net change in unrealized appreciation (depreciation) on investments, securities sold short, futures contracts, options and swap contracts | (844 | ) | 1,467 | (5,321 | ) | 615 | ||||||||||
Net change in unrealized appreciation (depreciation) on foreign currency transactions | — | — | — | — | ||||||||||||
Net Increase (Decrease) in Net Assets Resulting from Operations | 1,188 | 165 | 3,310 | 12,843 | ||||||||||||
Dividends and Distributions to Shareholders: | ||||||||||||||||
Net investment income: | ||||||||||||||||
Class A | (980 | ) | — | (8,272 | ) | (11,927 | ) | |||||||||
Net realized gains: | ||||||||||||||||
Class A | — | — | — | (553 | ) | |||||||||||
Total Dividends and Distributions | (980 | ) | — | (8,272 | ) | (12,480 | ) | |||||||||
Capital Share Transactions:(1) | ||||||||||||||||
Class A: | ||||||||||||||||
Proceeds from shares issued | 15,911 | 86,798 | 199,484 | 681,315 | ||||||||||||
Reinvestment of dividends & distributions | 962 | — | 8,122 | 12,220 | ||||||||||||
Cost of shares redeemed | (18,571 | ) | (164,326 | ) | (138,149 | ) | (208,219 | ) | ||||||||
Net Increase (Decrease) from Class A Transactions | (1,698 | ) | (77,528 | ) | 69,457 | 485,316 | ||||||||||
Net Increase (Decrease) in Net Assets | (1,490 | ) | (77,363 | ) | 64,495 | 485,679 | ||||||||||
Net Assets | ||||||||||||||||
Beginning of Period | 149,972 | 227,335 | 1,156,258 | 670,579 | ||||||||||||
End of Period | $ | 148,482 | $ | 149,972 | $ | 1,220,753 | $ | 1,156,258 | ||||||||
Undistributed (Distributions in Excess of) Net Investment Income Included in Net Assets at Period End | $ | 613 | $ | (256 | ) | $ | (258 | ) | $ | 18 | ||||||
| (1) | See Note 7 in Notes to Financial Statements for additional information. |
Amounts designated as “—” are $0 or have been rounded to $0.
The accompanying notes are an integral part of the financial statements.
| 252 | SEI Institutional Investments Trust / Semi-Annual Report / November 30, 2016 |
| Intermediate Duration Credit Fund | Dynamic Asset Allocation Fund | Multi-Asset Real Return Fund | ||||||||||||||||||||
| 06/01/16 to 11/30/16 | 06/01/15 to 05/31/16 | 06/01/16 to 11/30/16 | 06/01/15 to 05/31/16 | 06/01/16 to 11/30/16 | 06/01/15 to 05/31/16 | |||||||||||||||||
| $ | 19,217 | $ | 40,662 | $ | 23,000 | $ | 40,296 | $ | 8,495 | $ | 8,309 | |||||||||||
|
8,036 |
| (18,130 | ) | 14,705 | (26,668 | ) | 1,235 | (29,826 | ) | ||||||||||||
| — | — | 1,062 | (32,506 | ) | (2,021 | ) | 731 | |||||||||||||||
|
(31,406 |
) | 32,905 | 105,976 | (5,312 | ) | (7,982 | ) | (543 | ) | ||||||||||||
| — | — | 6,506 | 17,963 | 2,772 | (401 | ) | ||||||||||||||||
| (4,153 | ) | 55,437 | 151,249 | (6,227 | ) | 2,499 | (21,730 | ) | ||||||||||||||
| (19,455 | ) | (40,672 | ) | — | (107,550 | ) | — | (7,020 | ) | |||||||||||||
| — | — | — | (17,904 | ) | — | — | ||||||||||||||||
| (19,455 | ) | (40,672 | ) | — | (125,454 | ) | — | (7,020 | ) | |||||||||||||
| 45,272 | 320,630 | 149,002 | 443,753 | 47,686 | 192,897 | |||||||||||||||||
| 16,104 | 40,417 | — | 122,245 | — | 6,609 | |||||||||||||||||
| (41,395 | ) | (535,495 | ) | (175,609 | ) | (348,739 | ) | (49,016 | ) | (168,539 | ) | |||||||||||
| 19,981 | (174,448 | ) | (26,607 | ) | 217,259 | (1,330 | ) | 30,967 | ||||||||||||||
| (3,627 | ) | (159,683 | ) | 124,642 | 85,578 | 1,169 | 2,217 | |||||||||||||||
| 1,440,434 | 1,600,117 | 2,079,154 | 1,993,576 | 733,029 | 730,812 | |||||||||||||||||
| $ | 1,436,807 | $ | 1,440,434 | $ | 2,203,796 | $ | 2,079,154 | $ | 734,198 | $ | 733,029 | |||||||||||
$ |
(98 |
) | $ | 140 | $ | 14,761 | $ | (8,239 | ) | $ | (3,832 | ) | $ | (12,327 | ) | |||||||
| SEI Institutional Investments Trust / Semi-Annual Report / November 30, 2016 | 253 |
CONSOLIDATED STATEMENT OF CASH FLOWS ($ Thousands) (Unaudited)
For the six month period ended November 30, 2016
| Multi-Asset Real Return Fund | ||||
Cash Flows from Operating Activities: | ||||
Net Increase in Net Assets from Operations | $ | 2,499 | ||
Adjustments to Reconcile Net Increase in Net Assets Resulting from Operations to Net Cash Provided by Operating Activities: | ||||
Purchase of investment securities | (410,518 | ) | ||
Proceeds from disposition of investment securities | 438,348 | |||
Purchased options/purchases to cover written options and securities sold short | 56,874 | |||
Proceeds from sale of options/expired options and securities sold short | (78,184 | ) | ||
Amortization (accretion of market discount) | (3,534 | ) | ||
Net Realized (Gain) Loss on: | ||||
Investments | (6,916 | ) | ||
Options | 43 | |||
Securities sold short | 11,203 | |||
Net Change in Unrealized (Appreciation) Depreciation on: | ||||
Investments | (1,349 | ) | ||
Options | (69 | ) | ||
Securities sold short | 4,690 | |||
Changes in Assets: | ||||
Cash pledged as collateral for forward foreign currency contracts, futures contracts and swap contracts | 456 | |||
Foreign currency, at value | (178 | ) | ||
Dividends and interest receivable | (329 | ) | ||
Receivable for investment securities sold | 21,143 | |||
Receivable for variation margin | (2,860 | ) | ||
Foreign tax reclaim receivable | (5 | ) | ||
Unrealized gain on forward foreign currency contracts | (2,888 | ) | ||
Unrealized gain on foreign spot currency contracts | (10 | ) | ||
Swap contracts, at value | 136 | |||
Prepaid expenses | (5 | ) | ||
Changes in Liabilities: | ||||
Payable for investment securities purchased | (23,810 | ) | ||
Payable for variation margin | (412 | ) | ||
Swap contracts, at value | 366 | |||
Unrealized loss on forward foreign currency contracts | 113 | |||
Investment advisory fees payable | (8 | ) | ||
CCO fees payable | (1 | ) | ||
Interest payable | (2 | ) | ||
Accrued expenses payable | (11 | ) | ||
Net Cash Provided by Operating Activities | 2,283 | |||
Cash Flows from Financing Activities | ||||
Reverse repurchase agreements | (2,529 | ) | ||
Proceeds from shares issued | 41,447 | |||
Cost of shares redeemed | (57,547 | ) | ||
Net Cash Used in Financing Activities | (18,629 | ) | ||
Net Change in Cash | (13,847 | ) | ||
Cash at Beginning of Period | $ | 140,320 | ||
Cash at End of Period | $ | 126,473 | ||
The accompanying notes are an integral part of the financial statements.
| 254 | SEI Institutional Investments Trust / Semi-Annual Report / November 30, 2016 |
For the six month period ended November 30, 2016 (Unaudited) and the years or periods ended May 31,
For a share outstanding throughout each period
| Net Asset Value, Beginning of Period | Net Investment Income (Loss)(1) | Net Realized and Unrealized Gains (Losses) on | Total from Operations | Dividends Investment | Distributions from Net Realized Capital Gains | Total Distributions | Net Asset End of Period | Total Return† | Net Assets End of Period | Ratio of Net | Ratio of Expenses to Average Net Assets (Excluding Fees Paid Indirectly Including | Ratio of Expenses to Average Net Assets (Excluding Fees Paid Indirectly and | Ratio of Net Investment Income (Loss) to Average | Portfolio Turnover | ||||||||||||||||||||||||||||||||||||||||||||||
Large Cap Fund |
| |||||||||||||||||||||||||||||||||||||||||||||||||||||||||||
Class A |
| |||||||||||||||||||||||||||||||||||||||||||||||||||||||||||
2016@ | $ | 18.90 | $ | 0.15 | $ | 0.81 | $ | 0.96 | $ | (0.14 | ) | $ | — | $ | (0.14 | ) | $ | 19.72 | 5.09 | % | $ | 1,979,550 | 0.20 | % | 0.20 | % | 0.47 | % | 1.57 | % | 30 | % | ||||||||||||||||||||||||||||
2016 | 22.89 | 0.33 | (0.96 | ) | (0.63 | ) | (0.32 | ) | (3.04 | ) | (3.36 | ) | 18.90 | (2.41 | ) | 2,086,522 | 0.20 | (2) | 0.20 | (2) | 0.47 | (2) | 1.60 | 73 | ||||||||||||||||||||||||||||||||||||
2015 | 22.72 | 0.30 | 2.27 | 2.57 | (0.31 | ) | (2.09 | ) | (2.40 | ) | 22.89 | 11.95 | 2,366,204 | 0.19 | 0.19 | 0.47 | 1.30 | 60 | ||||||||||||||||||||||||||||||||||||||||||
2014 | 20.94 | 0.30 | 3.96 | 4.26 | (0.30 | ) | (2.18 | ) | (2.48 | ) | 22.72 | 21.32 | 2,305,214 | 0.18 | 0.18 | 0.46 | 1.38 | 59 | ||||||||||||||||||||||||||||||||||||||||||
2013 | 17.07 | 0.34 | 4.38 | 4.72 | (0.33 | ) | (0.52 | ) | (0.85 | ) | 20.94 | 28.44 | 1,897,837 | 0.19 | (3) | 0.19 | (3) | 0.46 | (3) | 1.79 | 47 | |||||||||||||||||||||||||||||||||||||||
2012 | 18.40 | 0.25 | (0.61 | ) | (0.36 | ) | (0.24 | ) | (0.73 | ) | (0.97 | ) | 17.07 | (1.69 | ) | 1,774,178 | 0.26 | (4) | 0.26 | (4) | 0.47 | (4) | 1.47 | 83 | ||||||||||||||||||||||||||||||||||||
Large Cap Diversified Alpha Fund |
| |||||||||||||||||||||||||||||||||||||||||||||||||||||||||||
Class A |
| |||||||||||||||||||||||||||||||||||||||||||||||||||||||||||
2016@ | $ | 9.18 | $ | 0.08 | $ | 0.43 | $ | 0.51 | $ | — | $ | — | $ | — | $ | 9.69 | 5.56 | % | $ | 55,190 | 0.24 | % | 0.24 | % | 0.47 | % | 1.69 | % | 32 | % | ||||||||||||||||||||||||||||||
2016 | 15.28 | 0.20 | (0.94 | ) | (0.74 | ) | (0.25 | )** | (5.11 | ) | (5.36 | ) | 9.18 | (3.89 | ) | 54,335 | 0.24 | (2) | 0.24 | (2) | 0.47 | (2) | 1.77 | 142 | ||||||||||||||||||||||||||||||||||||
2015 | 14.05 | 0.22 | 1.50 | 1.72 | (0.23 | ) | (0.26 | ) | (0.49 | ) | 15.28 | 12.43 | 63,607 | 0.24 | 0.24 | 0.47 | 1.49 | 110 | ||||||||||||||||||||||||||||||||||||||||||
2014 | 11.59 | 0.16 | 2.42 | 2.58 | (0.12 | ) | — | (0.12 | ) | 14.05 | 22.36 | 138,725 | 0.24 | 0.24 | 0.46 | 1.24 | 121 | |||||||||||||||||||||||||||||||||||||||||||
2013 | 9.41 | 0.16 | 2.22 | 2.38 | (0.20 | ) | — | (0.20 | ) | 11.59 | 25.66 | 309,577 | 0.24 | 0.24 | 0.46 | 1.55 | 82 | |||||||||||||||||||||||||||||||||||||||||||
2012 | 9.53 | 0.13 | (0.16 | ) | (0.03 | ) | (0.09 | ) | — | (0.09 | ) | 9.41 | (0.24 | ) | 320,907 | 0.31 | 0.31 | 0.47 | 1.40 | 101 | ||||||||||||||||||||||||||||||||||||||||
Large Cap Disciplined Equity Fund |
| |||||||||||||||||||||||||||||||||||||||||||||||||||||||||||
Class A |
| |||||||||||||||||||||||||||||||||||||||||||||||||||||||||||
2016@ | $ | 12.57 | $ | 0.13 | $ | 0.59 | $ | 0.72 | $ | (0.10 | ) | $ | — | $ | (0.10 | ) | $ | 13.19 | 5.74 | % | $ | 3,551,854 | 0.19 | % | 0.19 | % | 0.47 | % | 1.98 | % | 48 | % | ||||||||||||||||||||||||||||
2016 | 14.38 | 0.24 | (0.14 | ) | 0.10 | (0.25 | ) | (1.66 | ) | (1.91 | ) | 12.57 | 1.34 | 3,592,226 | 0.19 | (2) | 0.19 | (2) | 0.47 | (2) | 1.82 | 102 | ||||||||||||||||||||||||||||||||||||||
2015 | 14.79 | 0.24 | 1.45 | 1.69 | (0.23 | ) | (1.87 | ) | (2.10 | ) | 14.38 | 12.23 | 4,198,645 | 0.18 | (5) | 0.18 | (5) | 0.47 | (5) | 1.61 | 113 | |||||||||||||||||||||||||||||||||||||||
2014 | 13.24 | 0.23 | 2.39 | 2.62 | (0.20 | ) | (0.87 | ) | (1.07 | ) | 14.79 | 20.49 | 4,622,216 | 0.18 | (6) | 0.18 | (6) | 0.46 | (6) | 1.65 | 110 | |||||||||||||||||||||||||||||||||||||||
2013 | 10.58 | 0.21 | 2.73 | 2.94 | (0.28 | ) | — | (0.28 | ) | 13.24 | 28.24 | 5,500,315 | 0.17 | (7) | 0.17 | (7) | 0.46 | (7) | 1.80 | 109 | ||||||||||||||||||||||||||||||||||||||||
2012 | 10.87 | 0.16 | (0.29 | ) | (0.13 | ) | (0.16 | ) | — | (0.16 | ) | 10.58 | (1.14 | ) | 5,436,390 | 0.18 | (5) | 0.18 | (5) | 0.47 | (5) | 1.54 | 93 | |||||||||||||||||||||||||||||||||||||
Large Cap Index Fund |
| |||||||||||||||||||||||||||||||||||||||||||||||||||||||||||
Class A |
| |||||||||||||||||||||||||||||||||||||||||||||||||||||||||||
2016@ | $ | 160.22 | $ | 1.72 | $ | 8.25 | $ | 9.97 | $ | (1.47 | ) | $ | — | $ | (1.47 | ) | $ | 168.72 | 6.26 | % | $ | 2,208,536 | 0.03 | % | 0.03 | % | 0.24 | % | 2.09 | % | 5 | % | ||||||||||||||||||||||||||||
2016 | 169.36 | 3.26 | (2.45 | ) | 0.81 | (3.32 | ) | (6.63 | ) | (9.95 | ) | 160.22 | 0.76 | 2,061,670 | 0.03 | (2) | 0.03 | (2) | 0.25 | (2) | 2.06 | 18 | ||||||||||||||||||||||||||||||||||||||
2015 | 164.21 | 3.14 | 15.63 | 18.77 | (3.23 | ) | (10.39 | ) | (13.62 | ) | 169.36 | 11.89 | 1,972,254 | 0.03 | 0.03 | 0.24 | 1.87 | 12 | ||||||||||||||||||||||||||||||||||||||||||
2014 | 140.87 | 2.91 | 25.93 | 28.84 | (3.02 | ) | (2.48 | ) | (5.50 | ) | 164.21 | 20.88 | 1,905,609 | 0.02 | 0.02 | 0.23 | 1.92 | 10 | ||||||||||||||||||||||||||||||||||||||||||
2013 | 113.85 | 2.77 | 28.02 | 30.79 | (2.61 | ) | (1.16 | ) | (3.77 | ) | 140.87 | 27.55 | 2,214,088 | 0.03 | 0.03 | 0.23 | 2.18 | 14 | ||||||||||||||||||||||||||||||||||||||||||
2012 | 117.49 | 2.26 | (3.78 | ) | (1.52 | ) | (2.12 | ) | — | (2.12 | ) | 113.85 | (1.24 | ) | 1,255,669 | 0.06 | 0.06 | 0.24 | 2.01 | 12 | ||||||||||||||||||||||||||||||||||||||||
S&P 500 Index Fund |
| |||||||||||||||||||||||||||||||||||||||||||||||||||||||||||
Class A |
| |||||||||||||||||||||||||||||||||||||||||||||||||||||||||||
2016@ | $ | 11.60 | $ | 0.13 | $ | 0.57 | $ | 0.70 | $ | (0.11 | ) | $ | — | $ | (0.11 | ) | $ | 12.19 | 6.04 | % | $ | 3,662,764 | 0.05 | % | 0.05 | % | 0.12 | % | 2.15 | % | 3 | % | ||||||||||||||||||||||||||||
2016 | 11.69 | 0.24 | (0.06 | ) | 0.18 | (0.24 | ) | (0.03 | ) | (0.27 | ) | 11.60 | 1.66 | 3,384,560 | 0.05 | (2) | 0.05 | (2) | 0.12 | (2) | 2.11 | 13 | ||||||||||||||||||||||||||||||||||||||
2015 | 10.68 | 0.23 | 1.01 | 1.24 | (0.21 | ) | (0.02 | ) | (0.23 | ) | 11.69 | 11.71 | 3,194,844 | 0.04 | 0.04 | 0.11 | 2.03 | 15 | ||||||||||||||||||||||||||||||||||||||||||
2014(8) | 10.00 | 0.09 | 0.63 | 0.72 | (0.04 | ) | — | (0.04 | ) | 10.68 | 7.27 | 836,591 | 0.04 | 0.04 | 0.11 | 2.02 | 3 | |||||||||||||||||||||||||||||||||||||||||||
| ** | Includes a return of capital of less than $0.01 per share. |
| † | Returns and portfolio turnover rates are for the period indicated and have not been annualized. Returns do not reflect the deduction of taxes the shareholder would pay on fund distributions or redemption of fund shares. |
| (1) | Per share net investment income and net realized and unrealized gains (losses) calculated using average shares. |
| (2) | The expense ratio includes proxy expenses outside the cap. |
| (3) | The expense ratio includes interest expense. Had this expense been excluded, the ratios would have been 0.19%, 0.19% and 0.46%, respectively. |
| (4) | The expense ratio includes interest expense. Had this expense been excluded, the ratios would have been 0.26%, 0.26% and 0.47%, respectively. |
| (5) | The expense ratio includes interest expense. Had this expense been excluded, the ratios would have been 0.18%, 0.18% and 0.47%, respectively. |
| (6) | The expense ratio includes interest expense. Had this expense been excluded, the ratios would have been 0.18%, 0.18% and 0.46%, respectively. |
| (7) | The expense ratio includes interest expense. Had this expense been excluded, the ratios would have been 0.17%, 0.17% and 0.46%, respectively. |
| (8) | Commenced operations on December 18, 2013. All ratios for the period have been annualized. |
| @ | For the six-month period ended November 30, 2016. All ratios for the period have been annualized. |
Amounts designated as “—” are $0 or have been rounded to $0.
The accompanying notes are an integral part of the financial statements.
| SEI Institutional Investments Trust / Semi-Annual Report / November 30, 2016 | 255 |
FINANCIAL HIGHLIGHTS
For the six month period ended November 30, 2016 (Unaudited) and the years or periods ended May 31,
For a share outstanding throughout each period
| Net Asset Value, Beginning of Period | Net Investment Income (Loss)(1) | Net Realized and Unrealized Gains (Losses) on | Total from Operations | Dividends Investment | Distributions from Net Realized Capital Gains | Total Distributions | Net Asset End of Period | Total Return† | Net Assets End of Period | Ratio of Net | Ratio of Expenses to Average Net Assets (Excluding Fees Paid Indirectly Including | Ratio of Expenses to Average Net Assets (Excluding Fees Paid Indirectly and | Ratio of Net Investment Income (Loss) to Average | Portfolio Turnover | ||||||||||||||||||||||||||||||||||||||||||||||
Extended Market Index Fund |
| |||||||||||||||||||||||||||||||||||||||||||||||||||||||||||
Class A |
| |||||||||||||||||||||||||||||||||||||||||||||||||||||||||||
2016@ | $ | 12.30 | $ | 0.10 | $ | 1.29 | $ | 1.39 | $ | (0.08 | ) | $ | — | $ | (0.08 | ) | $ | 13.61 | 11.38 | % | $ | 837,403 | 0.06 | % | 0.06 | % | 0.19 | % | 1.59 | % | 11 | % | ||||||||||||||||||||||||||||
2016 | 13.69 | 0.18 | (0.98 | ) | (0.80 | ) | (0.18 | ) | (0.41 | ) | (0.59 | ) | 12.30 | (5.66 | ) | 714,258 | 0.07 | (2) | 0.07 | (2) | 0.20 | (2) | 1.49 | 27 | ||||||||||||||||||||||||||||||||||||
2015 | 12.74 | 0.17 | 1.27 | 1.44 | (0.19 | ) | (0.30 | ) | (0.49 | ) | 13.69 | 11.61 | 737,363 | 0.06 | 0.06 | 0.19 | 1.30 | 19 | ||||||||||||||||||||||||||||||||||||||||||
2014 | 10.77 | 0.17 | 2.03 | 2.20 | (0.14 | ) | (0.09 | ) | (0.23 | ) | 12.74 | 20.59 | 513,283 | 0.06 | 0.06 | 0.18 | 1.36 | 17 | ||||||||||||||||||||||||||||||||||||||||||
2013(3) | 10.00 | 0.03 | 0.75 | 0.78 | (0.01 | ) | — | (0.01 | ) | 10.77 | 7.84 | 174,107 | 0.11 | 0.11 | 0.22 | 1.30 | 4 | |||||||||||||||||||||||||||||||||||||||||||
Small Cap Fund |
| |||||||||||||||||||||||||||||||||||||||||||||||||||||||||||
Class A |
| |||||||||||||||||||||||||||||||||||||||||||||||||||||||||||
2016@ | $ | 15.99 | $ | 0.09 | $ | 1.84 | $ | 1.93 | $ | (0.06 | ) | $ | — | $ | (0.06 | ) | $ | 17.86 | 12.13 | % | $ | 533,241 | 0.45 | % | 0.45 | % | 0.72 | % | 1.09 | % | 56 | % | ||||||||||||||||||||||||||||
2016 | 19.06 | 0.17 | (1.18 | ) | (1.01 | ) | (0.19 | ) | (1.87 | ) | (2.06 | ) | 15.99 | (4.99 | ) | 502,222 | 0.46 | (2),(4) | 0.46 | (2),(4) | 0.72 | (2),(4) | 0.99 | 115 | ||||||||||||||||||||||||||||||||||||
2015 | 17.95 | 0.11 | 1.62 | 1.73 | (0.13 | ) | (0.49 | ) | (0.62 | ) | 19.06 | 9.86 | 683,624 | 0.48 | (5) | 0.48 | (5) | 0.72 | (5) | 0.61 | 113 | |||||||||||||||||||||||||||||||||||||||
2014 | 15.42 | 0.12 | 2.56 | 2.68 | (0.15 | ) | — | (0.15 | ) | 17.95 | 17.39 | 692,554 | 0.47 | 0.47 | 0.72 | 0.67 | 63 | |||||||||||||||||||||||||||||||||||||||||||
2013 | 12.04 | 0.13 | 3.42 | 3.55 | (0.17 | ) | — | (0.17 | ) | 15.42 | 29.71 | 778,976 | 0.47 | 0.47 | 0.71 | 1.01 | 85 | |||||||||||||||||||||||||||||||||||||||||||
2012 | 13.49 | 0.11 | (1.47 | ) | (1.36 | ) | (0.09 | ) | — | (0.09 | ) | 12.04 | (10.11 | ) | 753,232 | 0.54 | 0.54 | 0.72 | 0.88 | 85 | ||||||||||||||||||||||||||||||||||||||||
Small Cap II Fund |
| |||||||||||||||||||||||||||||||||||||||||||||||||||||||||||
Class A |
| |||||||||||||||||||||||||||||||||||||||||||||||||||||||||||
2016@ | $ | 11.14 | $ | 0.04 | $ | 1.19 | $ | 1.23 | $ | (0.04 | ) | $ | — | $ | (0.04 | ) | $ | 12.33 | 11.06 | % | $ | 478,370 | 0.43 | % | 0.43 | % | 0.72 | % | 0.76 | % | 59 | % | ||||||||||||||||||||||||||||
2016 | 12.95 | 0.08 | (0.89 | ) | (0.81 | ) | (0.08 | ) | (0.92 | ) | (1.00 | ) | 11.14 | (6.07 | ) | 455,742 | 0.45 | (2) | 0.45 | (2) | 0.72 | (2) | 0.70 | 134 | ||||||||||||||||||||||||||||||||||||
2015 | 12.50 | 0.06 | 1.42 | 1.48 | (0.07 | ) | (0.96 | ) | (1.03 | ) | 12.95 | 12.58 | 373,858 | 0.46 | 0.46 | 0.72 | 0.49 | 107 | ||||||||||||||||||||||||||||||||||||||||||
2014 | 12.23 | 0.06 | 2.01 | 2.07 | (0.07 | ) | (1.73 | ) | (1.80 | ) | 12.50 | 17.35 | 252,435 | 0.46 | (6) | 0.46 | (6) | 0.71 | (6) | 0.50 | 108 | |||||||||||||||||||||||||||||||||||||||
2013 | 9.62 | 0.09 | 2.64 | 2.73 | (0.09 | ) | (0.03 | ) | (0.12 | ) | 12.23 | 28.54 | 221,697 | 0.48 | 0.48 | 0.72 | 0.88 | 113 | ||||||||||||||||||||||||||||||||||||||||||
2012(8) | 10.00 | 0.02 | (0.40 | ) | (0.38 | ) | — | — | — | 9.62 | (3.80 | ) | 62,066 | 0.59 | 0.59 | 0.78 | 1.07 | 9 | ||||||||||||||||||||||||||||||||||||||||||
Small/Mid Cap Equity Fund |
| |||||||||||||||||||||||||||||||||||||||||||||||||||||||||||
Class A |
| |||||||||||||||||||||||||||||||||||||||||||||||||||||||||||
2016@ | $ | 11.98 | $ | 0.06 | $ | 1.24 | $ | 1.30 | $ | (0.04 | ) | $ | — | $ | (0.04 | ) | $ | 13.24 | 10.90 | % | $ | 1,744,846 | 0.45 | % | 0.45 | % | 0.72 | % | 1.02 | % | 43 | % | ||||||||||||||||||||||||||||
2016 | 14.89 | 0.12 | (0.99 | ) | (0.87 | ) | (0.13 | ) | (1.91 | ) | (2.04 | ) | 11.98 | (5.33 | ) | 1,642,784 | 0.46 | (2) | 0.46 | (2) | 0.72 | (2) | 0.93 | 104 | ||||||||||||||||||||||||||||||||||||
2015 | 15.58 | 0.10 | 1.47 | 1.57 | (0.10 | ) | (2.16 | ) | (2.26 | ) | 14.89 | 11.16 | 1,859,609 | 0.47 | 0.47 | 0.72 | 0.66 | 95 | ||||||||||||||||||||||||||||||||||||||||||
2014 | 15.69 | 0.09 | 2.87 | 2.96 | (0.11 | ) | (2.96 | ) | (3.07 | ) | 15.58 | 20.09 | 1,829,276 | 0.46 | 0.46 | 0.71 | 0.55 | 54 | ||||||||||||||||||||||||||||||||||||||||||
2013 | 12.34 | 0.14 | 3.45 | 3.59 | (0.15 | ) | (0.09 | ) | (0.24 | ) | 15.69 | 29.49 | 2,153,745 | 0.46 | 0.46 | 0.71 | 1.02 | 92 | ||||||||||||||||||||||||||||||||||||||||||
2012 | 13.62 | 0.09 | (1.28 | ) | (1.19 | ) | (0.09 | ) | — | (0.09 | ) | 12.34 | (8.71 | ) | 1,981,358 | 0.49 | 0.49 | 0.72 | 0.77 | 84 | ||||||||||||||||||||||||||||||||||||||||
U.S. Managed Volatility Fund |
| |||||||||||||||||||||||||||||||||||||||||||||||||||||||||||
Class A |
| |||||||||||||||||||||||||||||||||||||||||||||||||||||||||||
2016@ | $ | 13.92 | $ | 0.17 | $ | 0.50 | $ | 0.67 | $ | (0.16 | ) | $ | — | $ | (0.16 | ) | $ | 14.43 | 4.17 | % | $ | 1,483,505 | 0.24 | % | 0.24 | % | 0.72 | % | 2.43 | % | 20 | % | ||||||||||||||||||||||||||||
2016 | 14.64 | 0.34 | 0.13 | 0.47 | (0.35 | ) | (0.84 | ) | (1.19 | ) | 13.92 | 3.71 | 1,524,568 | 0.24 | (2) | 0.24 | (2) | 0.72 | (2) | 2.47 | 62 | |||||||||||||||||||||||||||||||||||||||
2015 | 14.74 | 0.34 | 1.52 | 1.86 | (0.34 | ) | (1.62 | ) | (1.96 | ) | 14.64 | 13.33 | 1,414,638 | 0.24 | 0.24 | 0.72 | 2.27 | 58 | ||||||||||||||||||||||||||||||||||||||||||
2014 | 13.54 | 0.31 | 2.42 | 2.73 | (0.31 | ) | (1.22 | ) | (1.53 | ) | 14.74 | 21.39 | 1,236,524 | 0.23 | 0.23 | 0.71 | 2.19 | 72 | ||||||||||||||||||||||||||||||||||||||||||
2013 | 11.39 | 0.32 | 2.37 | 2.69 | (0.31 | ) | (0.23 | ) | (0.54 | ) | 13.54 | 24.19 | 1,145,980 | 0.24 | 0.24 | 0.71 | 2.55 | 41 | ||||||||||||||||||||||||||||||||||||||||||
2012 | 12.15 | 0.25 | 0.01 | 0.26 | (0.21 | ) | (0.81 | ) | (1.02 | ) | 11.39 | 2.62 | 722,082 | 0.35 | 0.35 | 0.73 | 2.25 | 44 | ||||||||||||||||||||||||||||||||||||||||||
| † | Returns and portfolio turnover rates are for the period indicated and have not been annualized. Returns do not reflect the deduction of taxes the shareholder would pay on fund distributions or redemption of fund shares. |
| (1) | Per share net investment income and net realized and unrealized gains (losses) calculated using average shares. |
| (2) | The expense ratio includes proxy expenses outside the cap. |
| (3) | Commenced operations on February 28, 2013. All ratios for the period have been annualized. |
| (4) | The expense ratio includes interest expense. Had this expense been excluded, the ratios would have been 0.46%, 0.46% and 0.72%, respectively. |
| (5) | The expense ratio includes interest expense. Had this expense been excluded, the ratios would have been 0.48%, 0.48% and 0.72%, respectively. |
| (6) | The expense ratio includes interest expense. Had this expense been excluded, the ratios would have been 0.46%, 0.46% and 0.71%, respectively. |
| (7) | Commenced operations on April 10, 2012. All ratios for the period have been annualized. |
| @ | For the six-month period ended November 30, 2016. All ratios for the period have been annualized. |
Amounts designated as “—” are $0 or have been rounded to $0.
The accompanying notes are an integral part of the financial statements.
| 256 | SEI Institutional Investments Trust / Semi-Annual Report / November 30, 2016 |
FINANCIAL HIGHLIGHTS
For the six month period ended November 30, 2016 (Unaudited) and the years or periods ended May 31,
For a share outstanding throughout each period
| Net Asset Value, Beginning of Period | Net Investment Income (Loss)(1) | Net Realized and Unrealized Gains (Losses) on | Total from Operations | Dividends Investment | Distributions from Net Realized Capital Gains | Total Distributions | Net Asset End of Period | Total Return† | Net Assets End of Period | Ratio of Net | Ratio of Expenses to Average Net Assets (Excluding Fees Paid Indirectly Including | Ratio of Expenses to Average Net Assets (Excluding Fees Paid Indirectly and | Ratio of Net Investment Income (Loss) to Average | Portfolio Turnover | ||||||||||||||||||||||||||||||||||||||||||||||
Global Managed Volatility Fund |
| |||||||||||||||||||||||||||||||||||||||||||||||||||||||||||
Class A |
| |||||||||||||||||||||||||||||||||||||||||||||||||||||||||||
2016@ | $ | 10.78 | $ | 0.14 | $ | 0.07 | $ | 0.21 | $ | — | $ | — | $ | — | $ | 10.99 | 1.95 | % | $ | 1,054,060 | 0.27 | % | 0.27 | % | 0.77 | % | 2.59 | % | 21 | % | ||||||||||||||||||||||||||||||
2016(2) | 10.00 | 0.12 | 0.66 | 0.78 | — | — | — | 10.78 | 7.80 | 1,061,014 | 0.26 | (3) | 0.26 | (3) | 0.73 | (3) | 3.34 | 42 | ||||||||||||||||||||||||||||||||||||||||||
World Equity Ex-US Fund |
| |||||||||||||||||||||||||||||||||||||||||||||||||||||||||||
Class A |
| |||||||||||||||||||||||||||||||||||||||||||||||||||||||||||
2016@ | $ | 10.80 | $ | 0.10 | $ | 0.14 | $ | 0.24 | $ | — | $ | — | $ | — | $ | 11.04 | 2.22 | % | $ | 7,134,635 | 0.32 | % | 0.32 | % | 0.62 | % | 1.73 | % | 29 | % | ||||||||||||||||||||||||||||||
2016 | 12.68 | 0.23 | (1.83 | ) | (1.60 | ) | (0.23 | ) | (0.05 | ) | (0.28 | ) | 10.80 | (12.60 | ) | 6,923,937 | 0.33 | (3) | 0.33 | (3) | 0.63 | (3) | 2.11 | 50 | ||||||||||||||||||||||||||||||||||||
2015 | 12.86 | 0.25 | (0.03 | )(4) | 0.22 | (0.25 | ) | (0.15 | ) | (0.40 | ) | 12.68 | 1.93 | 7,644,844 | 0.34 | 0.34 | 0.62 | 2.00 | 45 | |||||||||||||||||||||||||||||||||||||||||
2014 | 11.51 | 0.24 | 1.40 | 1.64 | (0.29 | ) | — | (0.29 | ) | 12.86 | 14.31 | 6,723,128 | 0.34 | 0.34 | 0.62 | 2.01 | 46 | |||||||||||||||||||||||||||||||||||||||||||
2013 | 9.24 | 0.25 | 2.24 | 2.49 | (0.22 | ) | — | (0.22 | ) | 11.51 | 27.11 | 6,192,852 | 0.35 | 0.35 | 0.62 | 2.30 | 52 | |||||||||||||||||||||||||||||||||||||||||||
2012 | 11.71 | 0.23 | (2.50 | ) | (2.27 | ) | (0.20 | ) | — | (0.20 | ) | 9.24 | (19.36 | ) | 4,623,934 | 0.45 | 0.45 | 0.63 | 2.28 | 56 | ||||||||||||||||||||||||||||||||||||||||
Screened World Equity Ex-US Fund |
| |||||||||||||||||||||||||||||||||||||||||||||||||||||||||||
Class A |
| |||||||||||||||||||||||||||||||||||||||||||||||||||||||||||
2016@ | $ | 8.50 | $ | 0.07 | $ | 0.31 | $ | 0.38 | $ | — | $ | — | $ | — | $ | 8.88 | 4.47 | % | $ | 87,654 | 0.36 | % | 0.36 | % | 0.79 | % | 1.54 | % | 27 | % | ||||||||||||||||||||||||||||||
2016 | 9.52 | 0.17 | (1.01 | ) | (0.84 | ) | (0.18 | ) | — | (0.18 | ) | 8.50 | (8.78 | ) | 82,836 | 0.35 | (3) | 0.35 | (3) | 0.79 | (3) | 2.01 | 41 | |||||||||||||||||||||||||||||||||||||
2015 | 9.69 | 0.18 | (0.19 | ) | (0.01 | ) | (0.16 | ) | — | (0.16 | ) | 9.52 | (0.04 | ) | 83,879 | 0.36 | 0.36 | 0.78 | 1.96 | 63 | ||||||||||||||||||||||||||||||||||||||||
2014 | 8.66 | 0.16 | 1.04 | 1.20 | (0.17 | ) | — | (0.17 | ) | 9.69 | 13.87 | 77,117 | 0.44 | 0.44 | 0.85 | 1.75 | 45 | |||||||||||||||||||||||||||||||||||||||||||
2013 | 7.02 | 0.15 | 1.64 | 1.79 | (0.15 | ) | — | (0.15 | ) | 8.66 | 25.69 | 62,521 | 0.50 | 0.50 | 0.89 | 1.81 | 76 | |||||||||||||||||||||||||||||||||||||||||||
2012 | 9.01 | 0.13 | (1.97 | ) | (1.84 | ) | (0.15 | ) | — | (0.15 | ) | 7.02 | (20.39 | ) | 48,756 | 0.74 | 0.74 | 0.93 | 1.63 | 76 | ||||||||||||||||||||||||||||||||||||||||
Emerging Markets Equity Fund |
| |||||||||||||||||||||||||||||||||||||||||||||||||||||||||||
Class A |
| |||||||||||||||||||||||||||||||||||||||||||||||||||||||||||
2016@ | $ | 8.61 | $ | 0.08 | $ | 0.30 | $ | 0.38 | $ | — | $ | — | $ | — | $ | 8.99 | 4.41 | % | $ | 1,036,477 | 0.63 | % | 0.63 | % | 1.17 | % | 1.77 | % | 41 | % | ||||||||||||||||||||||||||||||
2016 | 10.01 | 0.14 | (1.40 | ) | (1.26 | ) | (0.12 | ) | (0.02 | ) | (0.14 | ) | 8.61 | (12.53 | ) | 935,399 | 0.70 | (3) | 0.70 | (3) | 1.24 | (3) | 1.67 | 105 | ||||||||||||||||||||||||||||||||||||
2015(5) | 10.00 | 0.10 | (0.07 | )(6) | 0.03 | (0.02 | ) | — | (0.02 | ) | 10.01 | 0.33 | 591,963 | 0.65 | 0.65 | 1.16 | 1.57 | 103 | ||||||||||||||||||||||||||||||||||||||||||
Opportunistic Income Fund |
| |||||||||||||||||||||||||||||||||||||||||||||||||||||||||||
Class A |
| |||||||||||||||||||||||||||||||||||||||||||||||||||||||||||
2016@ | $ | 8.11 | $ | 0.11 | $ | 0.07 | $ | 0.18 | $ | (0.11 | ) | $ | — | $ | (0.11 | ) | $ | 8.18 | 2.21 | % | $ | 2,197,916 | 0.26 | % | 0.26 | % | 0.52 | % | 2.67 | % | 21 | % | ||||||||||||||||||||||||||||
2016 | 8.25 | 0.22 | (0.15 | ) | 0.07 | (0.21 | ) | — | (0.21 | ) | 8.11 | 0.93 | 2,129,669 | 0.26 | (3) | 0.26 | (3) | 0.52 | (3) | 2.67 | 35 | |||||||||||||||||||||||||||||||||||||||
2015 | 8.31 | 0.22 | (0.06 | ) | 0.16 | (0.22 | ) | — | (0.22 | ) | 8.25 | 1.91 | 2,167,478 | 0.26 | 0.26 | 0.52 | 2.64 | 42 | ||||||||||||||||||||||||||||||||||||||||||
2014 | 8.26 | 0.19 | 0.02 | 0.21 | (0.16 | ) | — | (0.16 | ) | 8.31 | 2.59 | 1,875,851 | 0.24 | (7) | 0.24 | (7) | 0.52 | (7) | 2.34 | 121 | ||||||||||||||||||||||||||||||||||||||||
2013 | 7.97 | 0.12 | 0.34 | 0.46 | (0.17 | ) | — | (0.17 | ) | 8.26 | 5.78 | 996,522 | 0.21 | 0.26 | 0.52 | 1.41 | 26 | |||||||||||||||||||||||||||||||||||||||||||
2012 | 7.95 | 0.15 | 0.04 | 0.19 | (0.17 | ) | — | (0.17 | ) | 7.97 | 2.49 | 218,959 | 0.41 | 0.41 | 0.53 | 1.94 | 58 | |||||||||||||||||||||||||||||||||||||||||||
| † | Returns and portfolio turnover rates are for the period indicated and have not been annualized. Returns do not reflect the deduction of taxes the shareholder would pay on fund distributions or redemption of fund shares. |
| (1) | Per share net investment income and net realized and unrealized gains (losses) calculated using average shares. |
| (2) | Commenced operations on January 29, 2016. All ratios for the period have been annualized. |
| (3) | The expense ratio includes proxy expenses outside the cap. |
| (4) | The amount shown for the year ended May 31, 2013, for a share outstanding throughout the period does not accord with the aggregate net gains on investments for that period because of the sales and repurchase of Fund shares in relation to fluctuating market value of the investments of the Fund. |
| (5) | Commenced operations on October 31, 2014. All ratios for the period have been annualized. |
| (6) | The amount shown for the year ended May 31, 2015, for a share outstanding throughout the period does not accord with the aggregate net gains on investments for that period because of the sales and repurchase of Fund shares in relation to fluctuating market value of the investments of the Fund. |
| (7) | The expense ratio includes interest expense. Had this expense been excluded, the ratios would have been 0.24%, 0.24% and 0.52%, respectively. |
| @ | For the six-month period ended November 30, 2016. All ratios for the period have been annualized. |
Amounts designated as “—” are $0 or have been rounded to $0.
The accompanying notes are an integral part of the financial statements.
| SEI Institutional Investments Trust / Semi-Annual Report / November 30, 2016 | 257 |
FINANCIAL HIGHLIGHTS
For the six month period ended November 30, 2016 (Unaudited) and the years or periods ended May 31,
For a share outstanding throughout each period
| Net Asset Value, Beginning of Period | Net Investment Income (Loss)(1) | Net Realized and Unrealized Gains (Losses) on | Total from Operations | Dividends Investment | Distributions from Net Realized Capital Gains | Total Distributions | Net Asset End of Period | Total Return† | Net Assets End of Period | Ratio of Net | Ratio of Expenses to Average Net Assets (Excluding Fees Paid Indirectly Including | Ratio of Expenses to Average Net Assets (Excluding Fees Paid Indirectly and | Ratio of Net Investment Income (Loss) to Average | Portfolio Turnover | ||||||||||||||||||||||||||||||||||||||||||||||
Core Fixed Income Fund |
| |||||||||||||||||||||||||||||||||||||||||||||||||||||||||||
Class A |
| |||||||||||||||||||||||||||||||||||||||||||||||||||||||||||
2016@ | $ | 10.44 | $ | 0.13 | $ | (0.17 | ) | $ | (0.04 | ) | $ | (0.13 | ) | $ | — | $ | (0.13 | ) | $ | 10.27 | (0.36 | )% | $ | 5,481,897 | 0.12 | % | 0.12 | % | 0.37 | % | 2.46 | % | 160 | % | ||||||||||||||||||||||||||
2016 | 10.62 | 0.28 | 0.02 | 0.30 | (0.28 | ) | (0.20 | ) | (0.48 | ) | 10.44 | 2.97 | 5,264,859 | 0.13 | (2) | 0.13 | (2) | 0.37 | (2) | 2.66 | 364 | |||||||||||||||||||||||||||||||||||||||
2015 | 10.54 | 0.27 | 0.12 | 0.39 | (0.28 | ) | (0.03 | ) | (0.31 | ) | 10.62 | 3.79 | 5,600,807 | 0.13 | 0.13 | 0.37 | 2.59 | 316 | ||||||||||||||||||||||||||||||||||||||||||
2014 | 10.54 | 0.29 | 0.05 | 0.34 | (0.30 | ) | (0.04 | ) | (0.34 | ) | 10.54 | 3.36 | 5,910,306 | 0.12 | 0.12 | 0.36 | 2.78 | 329 | ||||||||||||||||||||||||||||||||||||||||||
2013 | 10.63 | 0.27 | 0.06 | 0.33 | (0.29 | ) | (0.13 | ) | (0.42 | ) | 10.54 | 3.12 | 6,484,218 | 0.13 | 0.13 | 0.36 | 2.53 | 315 | ||||||||||||||||||||||||||||||||||||||||||
2012 | 10.39 | 0.34 | 0.47 | 0.81 | (0.36 | ) | (0.21 | ) | (0.57 | ) | 10.63 | 7.98 | 7,081,317 | 0.14 | 0.14 | 0.37 | 3.21 | 386 | ||||||||||||||||||||||||||||||||||||||||||
High Yield Bond Fund |
| |||||||||||||||||||||||||||||||||||||||||||||||||||||||||||
Class A |
| |||||||||||||||||||||||||||||||||||||||||||||||||||||||||||
2016@ | $ | 8.53 | $ | 0.29 | $ | 0.33 | $ | 0.62 | $ | (0.29 | ) | $ | — | $ | (0.29 | ) | $ | 8.86 | 7.32 | % | $ | 2,844,164 | 0.30 | % | 0.30 | % | 0.55 | % | 6.59 | % | 30 | % | ||||||||||||||||||||||||||||
2016 | 9.41 | 0.58 | (0.81 | ) | (0.23 | ) | (0.58 | ) | (0.07 | ) | (0.65 | ) | 8.53 | (2.17 | ) | 2,639,919 | 0.30 | (2) | 0.30 | (2) | 0.56 | (2) | 6.81 | 50 | ||||||||||||||||||||||||||||||||||||
2015 | 9.96 | 0.58 | (0.34 | ) | 0.24 | (0.58 | ) | (0.21 | ) | (0.79 | ) | 9.41 | 2.63 | 2,516,770 | 0.30 | 0.30 | 0.56 | 6.09 | 55 | |||||||||||||||||||||||||||||||||||||||||
2014 | 10.01 | 0.63 | 0.10 | 0.73 | (0.62 | ) | (0.16 | ) | (0.78 | ) | 9.96 | 7.75 | 2,175,102 | 0.30 | 0.30 | 0.56 | 6.41 | 65 | ||||||||||||||||||||||||||||||||||||||||||
2013 | 9.30 | 0.71 | 0.69 | 1.40 | (0.69 | ) | — | (0.69 | ) | 10.01 | 15.46 | 2,162,551 | 0.30 | (3) | 0.30 | (3) | 0.56 | (3) | 7.23 | 72 | ||||||||||||||||||||||||||||||||||||||||
2012 | 9.58 | 0.74 | (0.29 | ) | 0.45 | (0.72 | ) | (0.01 | ) | (0.73 | ) | 9.30 | 5.09 | 1,914,780 | 0.35 | (4) | 0.35 | (4) | 0.56 | (4) | 7.97 | 50 | ||||||||||||||||||||||||||||||||||||||
Long Duration Fund |
| |||||||||||||||||||||||||||||||||||||||||||||||||||||||||||
Class A |
| |||||||||||||||||||||||||||||||||||||||||||||||||||||||||||
2016@ | $ | 8.68 | $ | 0.17 | $ | (0.33 | ) | $ | (0.16 | ) | $ | (0.17 | ) | $ | — | $ | (0.17 | ) | $ | 8.35 | (1.95 | )% | $ | 2,480,616 | 0.15 | % | 0.15 | % | 0.37 | % | 3.81 | % | 32 | % | ||||||||||||||||||||||||||
2016 | 8.92 | 0.36 | 0.14 | 0.50 | (0.36 | ) | (0.38 | ) | (0.74 | ) | 8.68 | 6.19 | 2,775,237 | 0.15 | (2) | 0.15 | (2) | 0.37 | (2) | 4.23 | 72 | |||||||||||||||||||||||||||||||||||||||
2015 | 8.88 | 0.36 | 0.14 | 0.50 | (0.36 | ) | (0.10 | ) | (0.46 | ) | 8.92 | 5.68 | 3,343,845 | 0.15 | 0.15 | 0.37 | 4.00 | 73 | ||||||||||||||||||||||||||||||||||||||||||
2014 | 8.75 | 0.36 | 0.17 | 0.53 | (0.36 | ) | (0.04 | ) | (0.40 | ) | 8.88 | 6.41 | 4,021,437 | 0.15 | 0.15 | 0.37 | 4.28 | 105 | ||||||||||||||||||||||||||||||||||||||||||
2013 | 9.65 | 0.36 | (0.25 | ) | 0.11 | (0.36 | ) | (0.65 | ) | (1.01 | ) | 8.75 | 0.78 | 3,322,291 | 0.16 | 0.16 | 0.37 | 3.80 | 96 | |||||||||||||||||||||||||||||||||||||||||
2012 | 8.83 | 0.41 | 1.42 | 1.83 | (0.42 | ) | (0.59 | ) | (1.01 | ) | 9.65 | 21.70 | 5,497,375 | 0.20 | 0.20 | 0.37 | 4.45 | 121 | ||||||||||||||||||||||||||||||||||||||||||
Long Duration Credit Fund |
| |||||||||||||||||||||||||||||||||||||||||||||||||||||||||||
Class A |
| |||||||||||||||||||||||||||||||||||||||||||||||||||||||||||
2016@ | $ | 10.26 | $ | 0.20 | $ | (0.34 | ) | $ | (0.14 | ) | $ | (0.20 | ) | $ | — | $ | (0.20 | ) | $ | 9.92 | (1.47 | )% | $ | 3,128,323 | 0.15 | % | 0.15 | % | 0.37 | % | 3.77 | % | 30 | % | ||||||||||||||||||||||||||
2016 | 10.18 | 0.41 | 0.30 | 0.71 | (0.41 | ) | (0.22 | ) | (0.63 | ) | 10.26 | 7.37 | 3,333,806 | 0.15 | (2) | 0.15 | (2) | 0.37 | (2) | 4.15 | 74 | |||||||||||||||||||||||||||||||||||||||
2015 | 10.20 | 0.43 | (0.02 | ) | 0.41 | (0.43 | ) | — | (0.43 | ) | 10.18 | 4.02 | 3,465,228 | 0.15 | 0.15 | 0.37 | 4.16 | 151 | ||||||||||||||||||||||||||||||||||||||||||
2014 | 9.93 | 0.44 | 0.32 | 0.76 | (0.44 | ) | (0.05 | ) | (0.49 | ) | 10.20 | 8.10 | 2,820,257 | 0.15 | 0.15 | 0.36 | 4.56 | 115 | ||||||||||||||||||||||||||||||||||||||||||
2013(5) | 10.00 | 0.39 | — | 0.39 | (0.39 | ) | (0.07 | ) | (0.46 | ) | 9.93 | 3.75 | 2,082,952 | 0.15 | 0.15 | 0.36 | 4.08 | 100 | ||||||||||||||||||||||||||||||||||||||||||
Ultra Short Duration Bond Fund |
| |||||||||||||||||||||||||||||||||||||||||||||||||||||||||||
Class A |
| |||||||||||||||||||||||||||||||||||||||||||||||||||||||||||
2016@ | $ | 9.98 | $ | 0.04 | $ | 0.04 | $ | 0.08 | $ | (0.07 | ) | $ | — | $ | (0.07 | ) | $ | 9.99 | 0.83 | % | $ | 534,220 | 0.12 | % | 0.12 | % | 0.22 | % | 0.78 | % | 101 | % | ||||||||||||||||||||||||||||
2016 | 10.01 | 0.11 | (0.01 | ) | 0.10 | (0.13 | ) | — | (0.13 | ) | 9.98 | 1.01 | 535,629 | 0.12 | (2) | 0.12 | (2) | 0.22 | (2) | 1.08 | 103 | |||||||||||||||||||||||||||||||||||||||
2015 | 10.05 | 0.09 | (0.02 | ) | 0.07 | (0.11 | ) | — | (0.11 | ) | 10.01 | 0.72 | 645,872 | 0.12 | 0.12 | 0.22 | 0.95 | 112 | ||||||||||||||||||||||||||||||||||||||||||
2014 | 10.04 | 0.09 | 0.02 | 0.11 | (0.10 | ) | — | (0.10 | ) | 10.05 | 1.13 | 718,199 | 0.11 | 0.11 | 0.21 | 0.87 | 118 | |||||||||||||||||||||||||||||||||||||||||||
2013 | 9.95 | 0.10 | 0.11 | 0.21 | (0.12 | ) | — | (0.12 | ) | 10.04 | 2.14 | 522,593 | 0.12 | 0.12 | 0.21 | 1.02 | 178 | |||||||||||||||||||||||||||||||||||||||||||
2012 | 9.99 | 0.11 | (0.02 | ) | 0.09 | (0.13 | ) | — | (0.13 | ) | 9.95 | 0.86 | 298,223 | 0.16 | 0.16 | 0.21 | 1.14 | 222 | ||||||||||||||||||||||||||||||||||||||||||
Emerging Markets Debt Fund |
| |||||||||||||||||||||||||||||||||||||||||||||||||||||||||||
Class A |
| |||||||||||||||||||||||||||||||||||||||||||||||||||||||||||
2016@ | $ | 9.39 | $ | 0.29 | $ | (0.22 | ) | $ | 0.07 | $ | (0.02 | ) | $ | — | $ | (0.02 | ) | $ | 9.44 | 0.76 | % | $ | 1,920,526 | 0.42 | % | 0.42 | % | 0.94 | % | 5.86 | % | 42 | % | |||||||||||||||||||||||||||
2016 | 9.65 | 0.56 | (0.73 | ) | (0.17 | ) | (0.09 | ) | — | (0.09 | ) | 9.39 | (1.77 | ) | 1,935,751 | 0.43 | (2) | 0.43 | (2) | 0.95 | (2) | 6.19 | 77 | |||||||||||||||||||||||||||||||||||||
2015 | 10.68 | 0.57 | (1.22 | ) | (0.65 | ) | (0.38 | ) | — | (0.38 | ) | 9.65 | (6.17 | ) | 1,836,776 | 0.40 | 0.40 | 0.93 | 5.69 | 78 | ||||||||||||||||||||||||||||||||||||||||
2014 | 11.11 | 0.60 | (0.58 | ) | 0.02 | (0.33 | ) | (0.12 | ) | (0.45 | ) | 10.68 | 0.44 | 1,596,100 | 0.45 | 0.45 | 0.95 | 5.86 | 100 | |||||||||||||||||||||||||||||||||||||||||
2013 | 11.22 | 0.56 | 0.65 | 1.21 | (0.84 | ) | (0.48 | ) | (1.32 | ) | 11.11 | 10.64 | 1,411,893 | 0.48 | 0.48 | 0.94 | 4.79 | 119 | ||||||||||||||||||||||||||||||||||||||||||
2012 | 11.60 | 0.73 | (0.22 | ) | 0.51 | (0.77 | ) | (0.12 | ) | (0.89 | ) | 11.22 | 4.67 | 1,114,918 | 0.55 | 0.55 | 0.93 | 6.43 | 55 | |||||||||||||||||||||||||||||||||||||||||
| † | Returns and portfolio turnover rates are for the period indicated and have not been annualized. Returns do not reflect the deduction of taxes the shareholder would pay on fund distributions or redemption of fund shares. |
| (1) | Per share net investment income and net realized and unrealized gains (losses) calculated using average shares. |
| (2) | The expense ratio includes proxy expenses outside the cap. |
| (3) | The expense ratio includes interest expense. Had this expense been excluded, the ratios would have been 0.30%, 0.30% and 0.56%, respectively. |
| (4) | The expense ratio includes interest expense. Had this expense been excluded, the ratios would have been 0.35%, 0.35% and 0.56%, respectively. |
| (5) | Commenced operations on June 29, 2012. All ratios for the period have been annualized. |
| @ | For the six-month period ended November 30, 2016. All ratios for the period have been annualized. |
Amounts designated as “—” are $0 or have been rounded to $0.
The accompanying notes are an integral part of the financial statements.
| 258 | SEI Institutionals Investments Trust / Semi-Annual Report / November 30, 2016 |
FINANCIAL HIGHLIGHTS/CONSOLIDATED FINANCIAL HIGHLIGHTS
For the period ended November 30, 2016 (unaudited) and the years or periods ended May 31,
For a share outstanding throughout each period
| Net Asset Value, Beginning of Period | Net Investment Income (Loss)(1) | Net Realized and Unrealized Gains (Losses) on | Total from Operations | Dividends Investment | Distributions from Net Realized Capital Gains | Total Distributions | Net Asset End of Period | Total Return† | Net Assets End of Period | Ratio of Net | Ratio of Expenses to Average Net Assets (Excluding Fees Paid Indirectly Including | Ratio of Expenses to Average Net Assets (Excluding Fees Paid Indirectly and | Ratio of Net Investment Income (Loss) to Average | Portfolio Turnover | ||||||||||||||||||||||||||||||||||||||||||||||
Real Return Fund |
| |||||||||||||||||||||||||||||||||||||||||||||||||||||||||||
Class A |
| |||||||||||||||||||||||||||||||||||||||||||||||||||||||||||
2016@ | $ | 9.64 | $ | 0.13 | $ | (0.05 | ) | $ | 0.08 | $ | (0.07 | ) | $ | — | $ | (0.07 | ) | $ | 9.65 | 0.81 | % | $ | 148,482 | 0.08 | % | 0.08 | % | 0.29 | % | 2.60 | % | 14 | % | |||||||||||||||||||||||||||
2016 | 9.59 | 0.08 | (0.03 | ) | 0.05 | — | — | — | 9.64 | 0.52 | 149,972 | 0.08 | (2) | 0.08 | (2) | 0.29 | (2) | 0.87 | 80 | |||||||||||||||||||||||||||||||||||||||||
2015 | 9.82 | (0.07 | ) | (0.09 | ) | (0.16 | ) | (0.07 | ) | — | (0.07 | ) | 9.59 | (1.60 | ) | 227,335 | 0.08 | 0.08 | 0.29 | (0.77 | ) | 41 | ||||||||||||||||||||||||||||||||||||||
2014 | 9.86 | 0.05 | 0.04 | 0.09 | (0.04 | ) | (0.09 | ) | (0.13 | ) | 9.82 | 0.96 | 207,578 | 0.08 | 0.08 | 0.29 | 0.52 | 49 | ||||||||||||||||||||||||||||||||||||||||||
2013 | 10.29 | 0.09 | (0.10 | ) | (0.01 | ) | (0.18 | ) | (0.24 | ) | (0.42 | ) | 9.86 | (0.15 | ) | 251,852 | 0.11 | 0.11 | 0.28 | 0.87 | 97 | |||||||||||||||||||||||||||||||||||||||
2012 | 10.67 | 0.29 | (0.07 | ) | 0.22 | (0.35 | ) | (0.25 | ) | (0.60 | ) | 10.29 | 2.15 | 281,861 | 0.20 | 0.20 | 0.28 | 2.75 | 96 | |||||||||||||||||||||||||||||||||||||||||
Limited Duration Bond Fund |
| |||||||||||||||||||||||||||||||||||||||||||||||||||||||||||
Class A |
| |||||||||||||||||||||||||||||||||||||||||||||||||||||||||||
2016@ | $ | 10.00 | $ | 0.07 | $ | (0.04 | ) | $ | 0.03 | $ | (0.07 | ) | $ | — | $ | (0.07 | ) | $ | 9.96 | 0.30 | % | $ | 1,220,753 | 0.11 | % | 0.11 | % | 0.32 | % | 1.36 | % | 38 | % | |||||||||||||||||||||||||||
2016 | 10.01 | 0.12 | 0.01 | 0.13 | (0.13 | ) | (0.01 | ) | (0.14 | ) | 10.00 | 1.26 | 1,156,258 | 0.12 | 0.12 | 0.32 | 1.25 | 134 | ||||||||||||||||||||||||||||||||||||||||||
2015(3) | 10.00 | 0.09 | 0.01 | 0.10 | (0.09 | ) | — | (0.09 | ) | 10.01 | 0.98 | 670,579 | 0.15 | 0.15 | 0.34 | 1.03 | 62 | |||||||||||||||||||||||||||||||||||||||||||
Intermediate Duration Credit Fund |
| |||||||||||||||||||||||||||||||||||||||||||||||||||||||||||
Class A |
| |||||||||||||||||||||||||||||||||||||||||||||||||||||||||||
2016@ | $ | 9.96 | $ | 0.13 | $ | (0.16 | ) | $ | (0.03 | ) | $ | (0.13 | ) | $ | — | $ | (0.13 | ) | $ | 9.80 | (0.30 | )% | $ | 1,436,807 | 0.15 | % | 0.15 | % | 0.32 | % | 2.61 | % | 70 | % | ||||||||||||||||||||||||||
2016 | 9.82 | 0.26 | 0.14 | 0.40 | (0.26 | ) | — | (0.26 | ) | 9.96 | 4.16 | 1,440,434 | 0.15 | 0.15 | 0.32 | 2.66 | 181 | |||||||||||||||||||||||||||||||||||||||||||
2015(4) | 10.00 | 0.03 | (0.18 | ) | (0.15 | ) | (0.03 | )** | — | (0.03 | ) | 9.82 | (1.46 | ) | 1,600,117 | 0.20 | 0.20 | 0.35 | 2.03 | 122 | ||||||||||||||||||||||||||||||||||||||||
Dynamic Asset Allocation Fund |
| |||||||||||||||||||||||||||||||||||||||||||||||||||||||||||
Class A |
| |||||||||||||||||||||||||||||||||||||||||||||||||||||||||||
2016@ | $ | 15.83 | $ | 0.17 | $ | 0.98 | $ | 1.15 | $ | — | $ | — | $ | — | $ | 16.98 | 7.26 | % | $ | 2,203,796 | 0.07 | % | 0.07 | % | 0.66 | % | 2.14 | % | 4 | % | ||||||||||||||||||||||||||||||
2016 | 16.97 | 0.33 | (0.41 | ) | (0.08 | ) | (0.91 | ) | (0.15 | ) | (1.06 | ) | 15.83 | (0.32 | ) | 2,079,154 | 0.08 | 0.08 | 0.67 | 2.08 | 12 | |||||||||||||||||||||||||||||||||||||||
2015 | 14.53 | 0.31 | 2.88 | 3.19 | (0.75 | ) | — | (0.75 | ) | 16.97 | 22.32 | 1,993,576 | 0.07 | 0.07 | 0.66 | 1.92 | 9 | |||||||||||||||||||||||||||||||||||||||||||
2014 | 12.81 | 0.27 | 1.69 | 1.96 | (0.02 | ) | (0.22 | ) | (0.24 | ) | 14.53 | 15.49 | 1,557,322 | 0.07 | 0.07 | 0.66 | 1.99 | 11 | ||||||||||||||||||||||||||||||||||||||||||
2013 | 11.14 | 0.30 | 2.20 | 2.50 | (0.35 | ) | (0.48 | ) | (0.83 | ) | 12.81 | 23.75 | 1,135,631 | 0.10 | 0.10 | 0.66 | 2.50 | 35 | ||||||||||||||||||||||||||||||||||||||||||
2012 | 11.26 | (0.01 | ) | 0.39 | 0.38 | — | (0.50 | ) | (0.50 | ) | 11.14 | 3.73 | 552,649 | 0.50 | 0.50 | 0.67 | (0.10 | ) | 140 | |||||||||||||||||||||||||||||||||||||||||
Multi-Asset Real Return Fund |
| |||||||||||||||||||||||||||||||||||||||||||||||||||||||||||
Class A |
| |||||||||||||||||||||||||||||||||||||||||||||||||||||||||||
2016@ | $ | 8.28 | $ | 0.10 | $ | (0.08 | ) | $ | 0.02 | $ | — | $ | — | $ | — | $ | 8.30 | 0.24 | % | $ | 734,198 | 0.44 | %(5) | 0.44 | %(5) | 0.80 | %(5) | 2.31 | % | 33 | % | |||||||||||||||||||||||||||||
2016 | 8.64 | 0.10 | (0.38 | ) | (0.28 | ) | (0.08 | ) | — | (0.08 | ) | 8.28 | (3.19 | ) | 733,029 | 0.54 | (6) | 0.54 | (6) | 0.90 | (6) | 1.17 | 91 | |||||||||||||||||||||||||||||||||||||
2015 | 9.30 | 0.03 | (0.51 | ) | (0.48 | ) | (0.18 | )*** | — | (0.18 | ) | 8.64 | (5.16 | ) | 730,812 | 0.43 | (7) | 0.43 | (7) | 0.80 | (7) | 0.29 | 99 | |||||||||||||||||||||||||||||||||||||
2014 | 9.19 | 0.12 | (0.01 | ) | 0.11 | — | — | — | 9.30 | 1.20 | 716,022 | 0.32 | (8) | 0.32 | (8) | 0.64 | (8) | 1.30 | 122 | |||||||||||||||||||||||||||||||||||||||||
2013 | 9.25 | 0.11 | (0.10 | )(9) | 0.01 | (0.07 | )** | — | (0.07 | ) | 9.19 | 0.07 | 303,899 | 0.32 | (10) | 0.32 | (10) | 0.66 | (10) | 1.11 | 49 | |||||||||||||||||||||||||||||||||||||||
2012(11) | 10.00 | 0.10 | (0.84 | ) | (0.74 | ) | (0.01 | ) | — | (0.01 | ) | 9.25 | (7.37 | ) | 140,063 | 0.41 | (12) | 0.41 | (12) | 0.66 | (12) | 1.23 | 58 | |||||||||||||||||||||||||||||||||||||
| ** | Includes a return of capital of less than $0.01 per share. |
| *** | Includes a return of capital of less than $0.02 per share. |
| † | Returns and portfolio turnover rates are for the period indicated and have not been annualized. Returns do not reflect the deduction of taxes the shareholder would pay on fund distributions or redemption of fund shares. |
| (1) | Per share net investment income and net realized and unrealized gains (losses) calculated using average shares. |
| (2) | The expense ratio includes proxy expenses outside the cap. |
| (3) | Commenced operations on July 31, 2014. All ratios for the period have been annualized. |
| (4) | Commenced operations on March 31, 2015. All ratios for the period have been annualized. |
| (5) | The expense ratio includes interest expense on reverse repurchase agreements and dividend expense on securities sold short. Had this expense been excluded, the ratios would have been 0.26%, 0.26% and 0.62%, respectively. |
| (6) | The expense ratio includes interest expense on reverse repurchase agreements and dividend expense on securities sold short. Had this expense been excluded, the ratios would have been 0.31%, 0.31% and 0.67%, respectively. |
| (7) | The expense ratio includes interest expense on reverse repurchase agreements and dividend expense on securities sold short. Had this expense been excluded, the ratios would have been 0.30%, 0.30% and 0.67%, respectively. |
| (8) | The expense ratio includes interest expense on reverse repurchase agreements and dividend expense on securities sold short. Had this expense been excluded, the ratios would have been 0.30%, 0.30% and 0.62%, respectively. |
| (9) | The amount shown for the year ended May 31, 2013, for a share outstanding throughout the period does not accord with the aggregate net gains on investments for that period because of the sales and repurchase of Fund shares in relation to fluctuating market value of the investments of the Fund. |
| (10) | The expense ratio includes interest expense on reverse repurchase agreements. Had this expense been excluded, the ratios would have been 0.29%, 0.29% and 0.63%, respectively. |
| (11) | Commenced operations on July 29, 2011. All ratios for the period have been annualized. |
| (12) | The expense ratio includes interest expense on reverse repurchase agreements. Had this expense been excluded, the ratios would have been 0.39%, 0.39% and 0.64%, respectively |
| @ | For the six-month period ended November 30, 2016. All ratios for the period have been annualized. |
Amounts designated as “—” are $0 or have been rounded to $0.
The accompanying notes are an integral part of the financial statements.
| SEI Institutional Investments Trust / Semi-Annual Report / November 30, 2016 | 259 |
NOTES TO FINANCIAL STATEMENTS/CONSOLIDATED NOTES TO FINANCIAL STATEMENTS (Unaudited)
November 30, 2016
1. ORGANIZATION
SEI Institutional Investments Trust (the “Trust”) was organized as a Massachusetts business trust under a Declaration of Trust dated March 1, 1995. The Trust commenced operations on June 14, 1996.
The Trust is registered under the Investment Company Act of 1940, as amended, as an open-end investment company with 28 registered funds: Large Cap, Large Cap Diversified Alpha, Large Cap Disciplined Equity, Large Cap Index, S&P 500 Index, Extended Market Index, Small Cap, Small Cap II, Small/Mid Cap Equity, U.S. Managed Volatility, Global Managed Volatility, World Equity Ex-US, Screened World Equity Ex-US, Emerging Markets Equity, Opportunistic Income, Core Fixed Income, High Yield Bond, Long Duration, Long Duration Credit, Ultra Short Duration Bond, Emerging Markets Debt, Real Return, Limited Duration Bond, Intermediate Duration Credit, Dynamic Asset Allocation, Multi-Asset Real Return, Strategic U.S. Large Cap Equity and Global Equity Funds (each a “Fund,” collectively, the “Funds”) each of which are diversified Funds with the exception of the Emerging Markets Debt and Multi-Asset Real Return Funds. The Trust is registered to offer Class A shares of all Funds. The assets of each Fund are segregated, and a shareholder’s interest is limited to the Fund in which shares are held. The Trust’s prospectus provides a description of each Fund’s investment goals, principal strategies and risks.
The DAA Commodity Strategy Subsidiary, Ltd. and the MARR Commodity Strategy Subsidiary, Ltd. are wholly-owned subsidiaries of the Dynamic Asset Allocation and Multi-Asset Real Return Funds (the “Subsidiaries”) respectively. The Subsidiaries are organized under the laws of the Cayman Islands as an exempt limited company. Information regarding the Dynamic Asset Allocation and Multi-Asset Real Return Funds and their respective subsidiary has been consolidated on the Consolidated Summary Schedule of Investments, Consolidated Schedule of Investments, Consolidated Statements of Assets and Liabilities, Consolidated Statements of Operations, Consolidated Statements of Changes in Net Assets, Consolidated Statement of Cash Flows and Consolidated Financial Highlights.
As of November 30, 2016, the Strategic U.S. Large Cap Equity and Global Equity Funds have not yet commenced operations.
2. SIGNIFICANT ACCOUNTING POLICIES
The following is a summary of the significant accounting policies followed by the Funds. The Funds are investment companies in conformity with accounting principles generally accepted in the United States of America (“U.S. GAAP”). Therefore, the Funds follow the
accounting and reporting guidelines for investment companies.
Use of Estimates — The preparation of financial statements, in conformity with U.S. GAAP requires management to make estimates and assumptions that affect the reported amount of assets and liabilities and disclosure of contingent assets and liabilities as of the date of the financial statements and the reported amounts of increases and decreases in net assets from operations during the reporting period. Actual results could differ from those estimates.
Security Valuation — Securities listed on a securities exchange, market or automated quotation system for which quotations are readily available (other than securities traded on National Association of Securities Dealers Automated Quotations (NASDAQ) or as otherwise noted below) at the last quoted sale price on an exchange or market (foreign or domestic) on which the securities are traded, or, if there is no such reported sale, at the most recent quoted bid price. The Funds value securities traded on NASDAQ at the NASDAQ Official Closing Price. If available, debt securities, swaps (which are not centrally cleared), bank loans or collateralized debt obligations (including collateralized loan obligations), such as those held by the Funds, are priced based upon valuations provided by independent, third-party pricing agents. Such values generally reflect the last reported sales price if the security is actively traded. The third-party pricing agents may also value debt securities at an evaluated bid price by employing methodologies that utilize actual market transactions, broker-supplied valuations or other methodologies designed to identify the market value for such securities. Redeemable securities issued by open-end investment companies are valued at the investment company’s applicable net asset value, with the exception of ETFs, which are priced as equity securities. The prices of foreign securities are reported in local currency and converted to U.S. dollars using currency exchange rates. If a security’s price cannot be obtained, as noted above, the Funds will value the securities using a bid price from at least one independent broker. If such prices are not readily available or cannot be valued using the methodologies described above, the Funds will value the security using the Funds’ Fair Value Pricing Policies and Procedures (“Fair Value Procedures”), as described below.
On the first day a new debt security purchase is recorded, if a price is not available from a third-party pricing agent or an independent broker, the security may be valued at its purchase price. Each day thereafter, the debt security will be valued according to the Funds’ Fair Value Procedures until a price from an independent source can be secured. Securities held by a Fund with
| 260 | SEI Institutional Investments Trust / Semi-Annual Report / November 30, 2016 |
remaining maturities of 60 days or less may be valued by the amortized cost method, which involves valuing a security at its cost on the date of purchase and thereafter (absent unusual circumstances) assuming a constant amortization to maturity of any discount or premium, regardless of the impact of fluctuations in general market rates of interest on the value of the instrument. While this method provides certainty in valuation, it may result in periods during which value, as determined by this method, is higher or lower than the price a Fund would receive if it sold the instrument. Further, the value of securities in the Fund can be expected to vary inversely with changes in prevailing interest rates. Should existing credit, liquidity or interest rate conditions in the relevant markets and issuer-specific circumstances suggest that amortized cost does not approximate fair value, then the amortized cost method may not be used.
Options and warrants are valued at the last quoted sales price. If there is no such reported sale on the valuation date, long positions are valued at the most recent bid price, and short positions are valued at the most recent ask price.
Futures and swaps cleared through a central clearing house (“centrally cleared swaps”) are valued at the settlement price established each day by the board of exchange on which they are traded. The daily settlement prices for financial futures and centrally cleared swaps are provided by an independent source. On days when there is excessive volume, market volatility or the future or centrally cleared swap does not end trading by the time a Fund calculates its NAV, the settlement price may not be available at the time at which the Fund calculates its NAV. On such days, the best available price (which is typically the last sales price) may be used to value a Fund’s futures or centrally cleared swaps position.
Foreign currency forward contracts are valued at the current day’s interpolated foreign exchange rate, as calculated using the current day’s spot rate, and the thirty, sixty, ninety and one-hundred eighty day forward rates provided by an independent source.
Prices for most securities held by a Fund are provided daily by third-party independent pricing agents. SEI Investments Management Corporation (“SIMC”) or a Sub-Adviser (“Sub-Adviser”), as applicable, reasonably believes that prices provided by independent pricing agents are reliable. However, there can be no assurance that such pricing service’s prices will be reliable. SIMC or a Sub-Adviser, as applicable, will continuously monitor the reliability of prices obtained from any pricing service and shall promptly notify the Funds’ administrator if it believes that a particular pricing service is no longer a reliable source of prices. The Funds’ administrator,
in turn, will notify the Fair Value Pricing Committee (the “Committee”) if it receives such notification from SIMC or a Sub-Adviser, as applicable, or if the Funds’ administrator reasonably believes that a particular pricing service is no longer a reliable source for prices.
The Funds’ Fair Value Procedures provide that any change in a primary pricing agent or a pricing methodology requires prior approval by the Board of Trustees (“Board”) or its designated sub-committee. However, when the change would not materially affect valuation of a Fund’s net assets or involve a material departure in pricing methodology from that of the Fund’s existing pricing agent or pricing methodology, approval may be obtained at the next regularly scheduled meeting of the Board.
Securities for which market prices are not readily available, for which market prices are determined to be unreliable, or which cannot be valued using the methodologies described above are valued in accordance with the Fair Value Procedures established by the Board. The Funds’ Fair Value Procedures are implemented through the Committee designated by the Board. The Committee is currently composed of two members of the Board, as well as representatives from SIMC and its affiliates. Some of the more common reasons that may necessitate that a security be valued using Fair Value Procedures include: (i) the security’s trading has been halted or suspended, (ii) the security has been delisted from a national exchange, (iii) the security’s primary trading market is temporarily closed at a time when under normal conditions it would be open, or (iv) the security’s primary pricing source is not able or willing to provide a price. When a security is valued in accordance with the Fair Value Procedures, the Committee will determine the value after taking into consideration relevant information reasonably available to the Committee. Examples of factors the Committee may consider include: (i) the facts giving rise to the need to fair value, (ii) the last trade price, (iii) the performance of the market or the issuer’s industry, (iv) the liquidity of the security, (v) the size of the holding in a Fund, or (vi) any other appropriate information.
The determination of a security’s fair value price often involves the consideration of a number of subjective factors, and is therefore subject to the unavoidable risk that the value assigned to a security may be higher or lower than the security’s value would be if a reliable market quotation for the security was readily available.
For securities that principally trade on a foreign market or exchange, a significant gap in time can exist between the time of a particular security’s last trade and the time at which a Fund calculates its Net Asset Value (“NAV”). The closing prices of such securities may no longer
| SEI Institutional Investments Trust / Semi-Annual Report / November 30, 2016 | 261 |
NOTES TO FINANCIAL STATEMENTS/CONSOLIDATED NOTES TO FINANCIAL STATEMENTS (Unaudited) (Continued)
November 30, 2016
reflect their market value at the time a Fund calculates NAV if an event that could materially affect the value of those securities (a “Significant Event”), including substantial fluctuations in domestic or foreign markets or occurrences not tied directly to the securities markets, such as natural disasters, armed conflicts or significant governmental actions, has occurred between the time of the security’s last close and the time that the Fund calculates NAV. A Fund may invest in securities that are primarily listed on foreign exchanges that trade on weekends or other days when the Fund does not price its shares. As a result, the NAV of the Fund’s shares may change on days when shareholders will not be able to purchase or redeem Fund shares.
A Significant Event may relate to a single issuer or to an entire market sector. If SIMC or a Sub-Adviser becomes aware of a Significant Event that has occurred with respect to a security or group of securities after the closing of the exchange or market on which the security or securities principally trade, but before the time at which the Funds calculate NAV, it may request that a Committee meeting be called. In addition, the Funds use several processes, with respect to certain securities to monitor the pricing data supplied by various sources, including price comparisons and price movements. Any identified discrepancies are researched and subject to the procedures described above.
The World Equity Ex-US, Screened World Equity Ex-US, Emerging Markets Equity and Multi-Asset Real Return Funds that hold international securities also use a third-party fair valuation vendor. The vendor provides a fair value for foreign securities held by the Funds based on certain factors and methodologies (involving, generally, tracking valuation correlations between the U.S. market and each non-U.S. security). Values from the fair value vendor are applied in the event that there is a movement in the U.S. market that exceeds a specific threshold that has been established by the Committee. The Committee has also established a “confidence interval” which is used to determine the level of historical correlation between the value of a specific foreign security and movements in the U.S. market before a particular security will be fair valued when the threshold is exceeded. In the event that the threshold established by the Committee is exceeded on a specific day, these Funds will value the non-U.S. securities in their portfolios that exceed the applicable “confidence interval” based upon the adjusted prices provided by the fair valuation vendor.
In accordance with U.S. GAAP, fair value is defined as the price that a Fund would receive upon selling an investment in an orderly transaction to an independent buyer in the principal or most advantageous market
of the investment. A three tier hierarchy has been established to maximize the use of observable and minimize the use of unobservable inputs and to establish classification of fair value measurements for disclosure purposes. Inputs refer broadly to the assumptions that market participants would use in pricing an asset. Inputs may be observable or unobservable. Observable inputs are inputs that reflect the assumptions market participants would use in pricing the asset or liability based on market data obtained from sources independent of the reporting entity. Unobservable inputs are inputs that reflect the reporting entity’s own assumptions about the assumptions market participants would use in pricing the asset or liability based on the best information available in the circumstances.
The three-tier hierarchy of inputs is summarized in the three broad Levels listed below:
Level 1 — quoted prices in active markets for identical investments
Level 2 — other significant observable inputs (including quoted prices for similar investments, interest rates, prepayment speeds, credit risks, etc.)
Level 3 — significant unobservable inputs (including the Fund’s own assumptions in determining the fair value of investments) Investments are classified within the level of the lowest significant input considered in determining fair value. Investments classified within Level 3 whose fair value measurement considers several inputs may include Level 1 or Level 2 inputs as components of the overall fair value measurement.
Debt securities are valued in accordance with the evaluated bid price supplied by the pricing service and generally categorized as Level 2 in the hierarchy. Other securities that are categorized as Level 2 in the hierarchy include, but are not limited to, preferred stocks, bank loans, warrants, swaps and forward contracts. The Fund may use a systematic fair valuation model provided by an independent pricing service to value foreign equity securities in order to adjust for stale pricing, which may occur between the close of certain foreign exchanges and the New York Stock Exchange. These are generally categorized as Level 2 in the hierarchy.
When independent prices are unavailable or unreliable, debt securities and swaps may be valued utilizing pricing matrices which consider similar factors that would be used by independent pricing services. These are generally categorized as Level 2 in the hierarchy but may be Level 3 depending on the circumstances. For certain collateralized debt obligations, corporate obligations, mortgage backed securities, auction rate
| 262 | SEI Institutional Investments Trust / Semi-Annual Report / November 30, 2016 |
preferred securities and loan participations where observable inputs are limited, assumptions about market activity and risk are used and are categorized as Level 3 in the hierarchy.
The valuation techniques used by the Funds to measure fair value during the period ended November 30, 2016 maximized the use of observable inputs and minimized the use of unobservable inputs. For details of the investment classification, reference the Summary Schedules of Investments/Schedules of Investments.
For the period ended November 30, 2016, there have been no significant changes to the Trust’s fair valuation methodologies.
Security Transactions and Investment Income — Security transactions are recorded on the trade date. Costs used in determining net realized capital gains and losses on the sale of securities are on the basis of specific identification. Dividend income and expense is recognized on the ex-dividend date, and interest income and expense is recognized using the accrual basis of accounting. Income from payment-in-kind securities is recorded daily based on the effective interest method of accrual.
Distributions received on securities that represent a return of capital or capital gain are recorded as a reduction of cost of investments and/ or as a realized gain. The Trust estimates the components of distributions received that may be considered nontaxable distributions or capital gain distributions.
Amortization and accretion is calculated using the scientific interest method, which approximates the effective interest method over the holding period of the security. Amortization of premiums and discounts is included in interest income.
For Treasury Inflation-Protected Securities, the principal amount is adjusted daily to keep pace with inflation. Interest is accrued based on the adjusted principal amount. The adjustments to principal due to inflation are reflected as increases or decreases to interest in the accompanying Statements of Operations. Such adjustments may have a significant impact on a Fund’s distributions.
Cash and Cash Equivalents — Idle cash and currency balances may be swept into various overnight sweep accounts and are classified as cash equivalents on the Statement of Assets and Liabilities. These amounts, at times, may exceed United States federally insured limits. Amounts swept are available on the next business day.
Repurchase Agreements — Securities pledged as collateral for repurchase agreements are held by each Fund’s custodian bank until the repurchase date
of the repurchase agreement. The Funds may also invest in tri-party repurchase agreements. Securities held as collateral for tri-party repurchase agreements are maintained by the broker’s custodian bank in a segregated account until the repurchase date of the repurchase agreement. Provisions of the repurchase agreements and the Trust’s policies require that the market value of the collateral, including accrued interest thereon, is sufficient in the event of default by the counterparty. If the counterparty defaults and the value of the collateral declines, or if the counterparty enters into an insolvency proceeding, realization of the collateral by the Funds may be delayed or limited.
Reverse Repurchase Agreements — To the extent consistent with its Investment Objective and Strategies, a Fund may enter into reverse repurchase agreements. A reverse repurchase agreement involves the sale of portfolio assets together with an agreement to repurchase the same assets later at a fixed price. Assets are then segregated to cover the requirements to repurchase the assets. The segregated assets may consist of cash, U.S. Government securities, or other liquid securities at least equal in value to the obligations under the reverse repurchase agreements. In the event the buyer of securities under a reverse repurchase agreement files for bankruptcy or becomes insolvent, a Fund’s use of the proceeds under the reverse repurchase agreement may be restricted pending a determination by the other party, or its trustee or receiver, whether to enforce the obligation to repurchase the securities.
Reverse repurchase agreements outstanding as of November 30, 2016 were as follows:
| Multi-Asset Real Return Fund | ||||||||||
Principal Amount ($ Thousands) | Counterparty | Rate % | Value ($ Thousands) | |||||||
| $8,018 | Chase Securities | 0.48% | $ | 8,018 | ||||||
| 25,393 | Chase Securities | 0.59 | 25,393 | |||||||
| 6,270 | HSBC | 0.47 | 6,270 | |||||||
| 11,520 | HSBC | 0.47 | 11,520 | |||||||
| 18,266 | HSBC | 0.78 | 18,266 | |||||||
| 21,422 | HSBC | 0.80 | 21,422 | |||||||
| 19,352 | Merrill Lynch | 0.51 | 19,352 | |||||||
| 11,694 | Merrill Lynch | 0.85 | 11,694 | |||||||
| 34,039 | Merrill Lynch | 0.85 | 34,039 | |||||||
|
| |||||||||
| $ | 155,974 | |||||||||
|
| |||||||||
Expenses — Expenses that are directly related to a Fund are charged directly to that Fund. Other operating expenses of the Funds are prorated to the Funds on the basis of relative net assets.
Commodity-Linked Investments — To the extent consistent with its Investment Objective and Strategies,
| SEI Institutional Investments Trust / Semi-Annual Report / November 30, 2016 | 263 |
NOTES TO FINANCIAL STATEMENTS/CONSOLIDATED NOTES TO FINANCIAL STATEMENTS (Unaudited) (Continued)
November 30, 2016
the Dynamic Asset Allocation and Multi-Asset Real Return Funds may invest in commodity investments to provide exposure to the investment returns of the commodities markets. Commodity investments include notes with interest payments that are tied to an underlying commodity or commodity index, ETFs or other exchange-traded products that are tied to the performance of a commodity or commodity index or other types of commodities or commodity indices. The Dynamic Asset Allocation and Multi-Asset Real Return Funds may also invest in equity securities of issuers in commodity-related industries.
The Dynamic Asset Allocation and Multi-Asset Real Return Funds may also seek to gain exposure to the commodity markets, in whole or in part, through investments in a wholly owned Subsidiary. The Subsidiary, unlike the Fund, may invest to a significant extent directly in commodities and in equity-linked securities and commodity-linked derivative instruments, including options, futures contracts, swaps, options on futures contracts and commodity-linked structured notes. The Subsidiary may also invest in other instruments in which the Fund is permitted to invest, either as investments or to serve as margin or collateral for its derivative positions. A Fund may invest up to 25% of its total assets in its Subsidiary.
In order for a Fund to qualify as a regulated investment company under Subchapter M of the Code, the Fund must derive at least 90% of its gross income each taxable year from qualifying income. The status of certain commodity-linked derivative instruments as qualifying income has been addressed in Revenue Ruling 2006-1 and Revenue Ruling 2006-31 which provide that income from certain commodity-linked derivative instruments in which the Fund invests will not be considered qualifying income. To the extent the Dynamic Asset Allocation and Multi-Asset Real Return Funds invest in such instruments directly, each Fund will seek to restrict its income from commodity-linked derivative instruments that do not generate qualifying income, such as commodity-linked swaps, to a maximum of 10% of its gross income (when combined with its other investments that produce non-qualifying income).
Foreign Currency Translation — The books and records of the Funds investing in international securities are maintained in U.S. dollars on the following basis:
(I) market value of investment securities, assets and liabilities at the current rate of exchange; and
(II) purchases and sales of investment securities, income and expenses at the relevant rates of exchange prevailing on the respective dates of such transactions.
The Funds do not isolate that portion of gains and losses on investments in equity securities that is due to changes in the foreign exchange rates from that which is due to changes in market prices of equity securities.
The Funds report certain foreign-currency-related transactions as components of realized gains for financial reporting purposes, whereas such components are treated as ordinary income for Federal income tax purposes.
Forward Foreign Currency Contracts — To the extent consistent with its Investment Objective and Strategies, a Fund may enter into forward foreign currency contracts as hedges against either specific transactions, fund positions or anticipated fund positions. A Fund may also engage in currency transactions to enhance that Fund’s returns. All commitments are marked-to-market daily at the applicable foreign exchange rate, and any resulting unrealized gains or losses are recorded currently. A Fund realizes gains and losses at the time forward contracts are extinguished. Unrealized gains or losses on outstanding positions in forward foreign currency contracts held at the close of the period are recognized as ordinary income or loss for Federal income tax purposes.
A Fund could be exposed to risk if the counterparties to the contracts are unable to meet the terms of the contract and from unanticipated movements in the value of a foreign currency relative to the U.S. dollar.
Finally, the risk exists that losses could exceed amounts disclosed on the Statements of Assets and Liabilities or Consolidated Statements of Assets and Liabilities. Refer to each Fund’s Schedule of Investments, Summary Schedule of Investments, Consolidated Schedule of Investments or Consolidated Summary Schedule of Investments for details regarding open forward foreign currency contracts as of November 30, 2016, if applicable.
Futures Contracts — To the extent consistent with its Investment Objective and Strategies, a Fund may use futures contracts for tactical hedging purposes as well as to enhance the Fund’s returns. In addition, fixed income funds will utilize futures contracts to help manage duration and yield curve exposure. These Funds’ investments in futures contracts are designed to enable the Funds to more closely approximate the performance of their benchmark indices. Initial margin deposits of cash or securities are made upon entering into futures contracts. The contracts are marked-to-market daily and the resulting changes in value are accounted for as unrealized gains and losses. Variation margin payments are paid or received, depending upon whether unrealized gains or losses are incurred. When
| 264 | SEI Institutional Investments Trust / Semi-Annual Report / November 30, 2016 |
contracts are closed, the Funds record a realized gain or loss equal to the difference between the proceeds from (or cost of) the closing transaction and the amount invested in the contract.
Risks of entering into futures contracts include the possibility that there will be an imperfect price correlation between the futures and the underlying securities. Second, it is possible that a lack of liquidity for futures contracts could exist in the secondary market, resulting in an inability to close a position prior to its maturity date. Third, futures contracts involve the risk that a Fund could lose more than the original margin deposit required to initiate a futures transaction.
Finally, the risk exists that losses could exceed amounts disclosed on the Statements of Assets and Liabilities or Consolidated Statements of Assets and Liabilities. Refer to each Fund’s Schedule of Investments, Summary Schedule of Investments, Consolidated Summary Schedule of Investments or Consolidated Schedule of Investments for details regarding open futures contracts as of November 30, 2016, if applicable.
Options/Swaptions Writing/Purchasing — To the extent consistent with its Investment Objective and Strategies, a Fund may invest in financial options/swaptions contracts for the purpose of hedging its existing portfolio securities, or securities that a Fund intends to purchase, against fluctuations in fair market value caused by changes in prevailing market interest rates. A Fund may also invest in financial option/swaption contracts to enhance its returns. When the Fund writes or purchases an option/swaption, an amount equal to the premium received or paid by the Fund is recorded as a liability or an asset and is subsequently adjusted to the current market value of the option/swaption written or purchased. Premiums received or paid from writing or purchasing options/swaptions which expire unexercised are treated by the Fund on the expiration date as realized gains or losses. The difference between the premium and the amount paid or received on effecting a closing purchase or sale transaction, including brokerage commissions, is also treated as a realized gain or loss. If an option/swaption is exercised, the premium paid or received is added to the cost of the purchase or proceeds from the sale in determining whether the Fund has realized a gain or a loss. The Core Fixed Income and Dynamic Asset Allocation Funds had options/swaption contracts as of November 30, 2016, as disclosed in the Funds’ Schedule of Investments or Consolidated Summary Schedule of Investments.
The risk in writing a call option/swaption is a Fund may give up the opportunity for profit if the market price of the security increases. The risk in writing a put option/swaption is a Fund may incur a loss if the market
price of the security decreases and the option/swaption is exercised. The risk in purchasing an option/swaption is a Fund may pay a premium whether or not the option/swaption is exercised. The Funds also have the additional risk of being unable to enter into a closing transaction at an acceptable price if a liquid secondary market does not exist. Option/swaption contracts also involve the risk that they may not work as intended due to unanticipated developments in market conditions or other causes.
Finally, the risk exists that losses on written options could exceed amounts disclosed on the Statements of Assets and Liabilities. Refer to each Fund’s Schedule of Investments or Consolidated Summary Schedule of Investments for details regarding open option/swaption contracts as of November 30, 2016, if applicable.
Securities Sold Short — To the extent consistent with its Investment Objective and Strategies, a Fund may engage in short sales. Short sales are transactions under which a Fund sells a security it does not own. To complete such a transaction, a Fund must borrow the security to make delivery to the buyer. A Fund then is obligated to replace the security borrowed by purchasing the security at the market price at the time of the replacement. The price at such time may be more or less than the price at which the security was sold by a Fund. Until the security is replaced, a Fund is required to pay the lender amounts equal to any dividends or interest that accrue during the period of the loan. Dividends and interest are shown as an expense for financial reporting purposes. To borrow the security, a Fund also may be required to pay a premium, which would decrease proceeds of the security sold. The proceeds of the short sale are retained by the broker, to the extent necessary to meet margin requirements, until the short position is closed out. A gain, limited to the price at which a Fund sold the security short, or a loss, unlimited in size, will be recognized upon the close of a short sale.
Until a Fund closes its short position or replaces the borrowed security, the Fund will: (i) earmark on the books of the Fund or place in a segregated account cash or liquid securities at such a level that the amount earmarked or deposited in the segregated account plus the amount deposited with the broker as collateral will equal the current value of the security sold short; or (ii) otherwise “cover” the Fund’s short position as required by the 1940 Act. Refer to each Fund’s Schedule of Investments, Summary Schedule of Investments, Consolidated Summary Schedule of Investments or Consolidated Schedule of Investments for details regarding securities sold short as of November 30, 2016,
| SEI Institutional Investments Trust / Semi-Annual Report / November 30, 2016 | 265 |
NOTES TO FINANCIAL STATEMENTS/CONSOLIDATED NOTES TO FINANCIAL STATEMENTS (Unaudited) (Continued)
November 30, 2016
if applicable. As of November 30, 2016, the Multi-Asset Real Return Fund held short positions.
Swap Agreements — To the extent consistent with its Investment Objective and Strategies, a Fund may invest in swap contracts as an efficient means to synthetically obtain exposure to securities or baskets of securities and to manage a Fund’s interest rate duration and yield curve exposure. Swap contracts may also be used to mitigate a Fund’s overall level of risk and/or a Fund’s risk to particular types of securities, currencies or market segments. Interest rate swaps may further be used to manage a Fund’s yield spread sensitivity. A Fund may buy credit default swaps in an attempt to manage credit risk where a Fund has credit exposure to an issuer, and a Fund may sell credit default swaps to more efficiently gain credit exposure to a security or basket of securities. A swap agreement is a two-party contract under which an agreement is made to exchange returns from predetermined investments or instruments, including a particular interest rate, foreign currency, or “basket” of securities representing a particular index. Swap agreements are privately negotiated in the over-the-counter market (“OTC swaps”) or may be executed in a multilateral or other trade facility platform, such as a registered commodities exchange (“Centrally Cleared swaps”). Interest rate swaps involve the exchange by a Fund with another party of their respective commitments to pay or receive interest (e.g., an exchange of floating rate payments for fixed rate payments) with respect to a notional amount of principal. Credit-default swaps involve periodic payments by a Fund or counterparty based on a specified rate multiplied by a notional amount assigned to an underlying debt instrument or group of debt instruments in exchange for the assumption of credit risk on the same instruments. In the event of a credit event, usually in the form of a credit rating downgrade, the party receiving periodic payments (i.e. floating rate payer) must pay the other party (i.e. fixed rate payer) an amount equal to the recovery rate used to settle the contracts. The recovery rate is a function of how many credit default swap investors wish to deliver the security or receive the security. The recovery rate is determined through an auction process. Total return swaps allow an investor to benefit from the cash flow without ever actually owning the underlying security. The receiver must pay any decline in value to the payer at the end of the total return swap. However, the investor does not need to make a payment if there is no decline in price. Payments can be made on various indices, bonds (i.e. mortgage backed securities, bank debt and corporate), loans or commodities. The value of a total return swap is equal to the change in value of the underlying asset versus the accrued income payment based on LIBOR or some other form of indices
on the notional amount. Interest rate swaps involve the exchange by a Fund with another party of their respective commitments to pay or receive interest (e.g., an exchange of floating rate payments for fixed rate payments) with respect to a notional amount of principal to manage a Fund’s exposure to interest rates. Payments received or made are recorded as realized gains or loss. A Fund could be exposed to credit or market risk due to unfavorable changes in the fluctuation of interest rates or if the counterparty defaults on its obligation to perform. Risk of loss may exceed amounts recognized on the Statements of Assets and Liabilities or Consolidated Statements of Assets and Liabilities. Interest rate swap contracts outstanding at period end, if any, are listed after a Fund’s portfolio. In connection with swap agreements securities may be set aside as collateral by a Fund’s custodian.
Swaps are marked-to-market daily based upon quotations from market makers and the resulting changes in market values, if any, are recorded as an unrealized gain or loss on the Statements of Operations or Consolidated Statements of Operations. Net payments of interest are recorded as realized gains or losses. Daily changes in valuation of Centrally Cleared swaps, if any, are recorded as a receivable or payable for the change in value as appropriate (“variation margin”) on the Statements of Assets and Liabilities or Consolidated Statements of Assets and Liabilities.
Entering into swap agreements involves, to varying degrees, elements of credit and market risk in excess of the amounts recognized on the Statements of Assets and Liabilities or Consolidated Statements of Assets and Liabilities. Such risks involve the possibility that there will be no liquid market for these agreements, that the counterparty to the agreement may default on its obligation to perform and that there may be unfavorable changes in the fluctuation of interest rates. Risks also arise from potential losses from adverse market movements.
This risk is mitigated by having a master netting arrangement between a Fund and the counterparty and by having the counterparty post collateral to cover a Fund’s exposure to the counterparty. See Note 3 for further details. Refer to each Fund’s Schedule of Investments, Summary Schedule of Investments, Consolidated Summary Schedule of Investments or Consolidated Schedule of Investments for details regarding open swap agreements as of November 30, 2016, if applicable.
Forward Treasury Commitments — To the extent consistent with its Investment Objective and Strategies, a Fund may invest in commitments to purchase U.S. Treasury securities on an extended settlement basis.
| 266 | SEI Institutional Investments Trust / Semi-Annual Report / November 30, 2016 |
Such transactions involve the commitment to purchase a security with payment and delivery taking place in the future, sometimes a month or more after the transaction date. The Funds account for such transactions as purchases and sales and record an unrealized gain or loss each day equal to the difference between the cost of the purchase commitment and the current market value. Realized gains or losses are recorded upon closure or settlement of such commitments. No interest is earned prior to settlement of the transaction. These instruments are subject to market fluctuation due to changes in interest rates and the market value at the time of settlement could be higher or lower than the purchase price. A Fund may incur losses due to changes in the value of the underlying treasury securities from interest rate fluctuations or as a result of counterparty nonperformance.
Delayed Delivery Transactions — To the extent consistent with its Investment Objective and Strategies, a Fund may purchase or sell securities on a when-issued or delayed delivery basis. These transactions involve a commitment by the Fund to purchase or sell securities for a predetermined price or yield, with payment and delivery taking place beyond the customary settlement period. When purchasing a security on a delayed delivery basis, the Fund assumes the rights and risks of ownership of the security, including the risk of price and yield fluctuations, and takes such fluctuations into account when determining its net asset value. The Funds may dispose of or renegotiate a delayed delivery transaction after it is entered into, and may sell when-issued securities before they are delivered, which may result in a capital gain or loss. When the Fund has sold a security on a delayed delivery basis, the Fund does not participate in future gains and losses with respect to the security.
Participation Notes (P-Notes) — To the extent consistent with its Investment Objective and Strategies, a Fund may acquire P-Notes issued by participating banks or broker-dealers. P-Notes are participation interest notes that are designed to offer a return linked to a particular underlying equity, debt, currency or market. The P-Notes in which the Fund may invest will typically have a maturity of one year. When purchasing a P-Note, the posting of margin is not required because the full cost of the P-Note (plus commission) is paid at the time of purchase. When the P-Note matures, the issuer will pay to, or receive from, the purchaser the difference between the minimal value of the underlying instrument at the time of purchase and that instrument’s value at maturity. Investments in P-Notes involve the same risks associated with a direct investment in the underlying
foreign companies of foreign securities markets that they seek to replicate.
In addition, there can be no assurance that the trading price of P-Notes will equal the underlying value of the foreign companies or foreign securities markets that they seek to replicate. The holder of a participation note that is linked to a particular underlying security is entitled to receive any dividends paid in connection with an underlying security or instrument. However, the holder of a participation note does not receive voting rights as it would if it directly owned the underlying security or instrument. P-Notes are generally traded over-the- counter. P-Notes constitute general unsecured contractual obligations of the banks or broker-dealers that issue them and the counterparty. There is also counterparty risk associated with these investments because the Fund is relying on the creditworthiness of such counterparty and has no rights under a participation note against the issuer of the underlying security. In addition, the Fund will incur transaction costs as a result of investments in P-Notes.
Loan Participations and Brady Bonds — To the extent consistent with its Investment Objective and Strategies, a Fund may invest in U.S. dollar-denominated fixed- and floating-rate loans (“Loans”) arranged through private negotiations between a foreign sovereign entity and one or more financial institutions (“Lenders”). The Fund invests in such Loans in the form of participations in Loans (“Participations”) or assignments of all or a portion of Loans from third parties. Participations typically result in this Fund having a contractual relationship only with the Lenders, not with the sovereign borrowers. This Fund has the right to receive payments of principal, interest and any fees to which it is entitled from the Lender selling the Participation and only upon receipt by the Lender of the payments from the borrower. In connection with purchasing Participations, the Fund generally has no right to enforce compliance by the borrower with the terms of the loan agreement relating to the Loan, nor any rights of set-off against the borrower, and the Fund will not benefit directly from any collateral supporting the Loan in which it has purchased the Participation. As a result, the Fund assumes the credit risk of both the borrower and the Lender that is selling the Participation.
Certain debt obligations, customarily referred to as “Brady Bonds,” are created through the exchange of existing commercial bank loans to foreign entities for new obligations in connection with debt restructuring under a plan introduced by former U.S. Secretary of the Treasury Nicholas F. Brady. Brady Bonds have only been issued since 1989, and, accordingly, do not have a long payment history. They are issued by governments that may have previously defaulted on the loans being
| SEI Institutional Investments Trust / Semi-Annual Report / November 30, 2016 | 267 |
NOTES TO FINANCIAL STATEMENTS/CONSOLIDATED NOTES TO FINANCIAL STATEMENTS (Unaudited) (Continued)
November 30, 2016
restructured by the Brady Bonds, so they are subject to the risk of default by the issuer. They may be fully or partially collateralized or uncollateralized and issued in various currencies.
Collateralized Debt Obligations — To the extent consistent with its Investment Objective and Strategies, a Fund may invest in collateralized debt obligations (“CDOs”), which include collateralized loan obligations (“CLOs”) and other similarly structured securities. CLOs are a type of asset-backed securities. A CLO is a trust typically collateralized by a pool of loans, which ,ay include, among others, domestic and foreign senior secured loans, senior unsecured loans, and subordinate corporate loans, including loans that may be rated below investment grade or equivalent unrated loans. CDOs may charge management fees and administrative expenses.
Dividends and Distributions to Shareholders — Dividends from net investment income are declared and paid to shareholders quarterly for the Large Cap, Large Cap Diversified Alpha, Large Cap Disciplined Equity, Large Cap Index, S&P 500 Index, Extended Market Index, Small Cap, Small Cap II, Small/Mid Cap Equity, U.S. Managed Volatility, Opportunistic Income, Emerging Markets Debt and Real Return Funds; declared daily and paid monthly for the Core Fixed Income, High Yield Bond, Long Duration, Long Duration Credit, Ultra Short Duration Bond and Intermediate Duration Credit
Funds; declared and paid at least annually for the Global Managed Volatility, World Equity Ex-US, Screened World Equity Ex-US, Emerging Markets Equity, Limited Duration Bond, Dynamic Asset Allocation and Multi-Asset Real Return Funds. Dividends and distributions are recorded on the ex-dividend date. Any net realized capital gains will be distributed at least annually by the Funds.
Illiquid Securities — A security is considered illiquid if it cannot be sold or disposed of in the ordinary course of business within seven days or less for its approximate carrying value on the books of a Fund. Valuations of illiquid securities may differ significantly from the values that would have been used had an active market value for these securities existed.
Restricted Securities — As of November 30, 2016, the following Fund owned private placement investments that were purchased through private offerings or acquired through initial public offerings and cannot be sold without prior registration under the Securities Act of 1933 or pursuant to an exemption therefrom. In addition, this Fund has generally agreed to further restrictions on the disposition of certain holdings as set forth in various agreements entered into in connection with the purchase of these private placement investments. The acquisition dates of these investments, the enforceable right to acquire these private placement investments, along with the cost and values at November 30, 2016, were as follows:
| Face Amount ($ Thousands) | Acquisition Date | Right to Acquire Date | Cost ($ Thousands) | Market Value ($ Thousands) | % of Net Assets | |||||||||||||||||||
| High Yield Bond Fund | ||||||||||||||||||||||||
Aventine (Escrow Security) | $ | 2,600 | 11/30/10 | 11/30/10 | $ | — | $ | — | 0.00 | % | ||||||||||||||
|
|
|
|
|
| |||||||||||||||||||
Investments in Real Estate Investment Trusts (“REITs”) — With respect to the Funds, with the exception of the World Equity Ex-US, Screened World Equity Ex-US and Real Return Funds, dividend income is recorded based on the income included in distributions received from the REIT investments using published REIT reclassifications including some management estimates when actual amounts are not available. Distributions received in excess of this estimated amount are recorded as a reduction of the cost of investments or reclassified to capital gains. The actual amounts of income, return of capital, and capital gains are only determined by each REIT after its fiscal year-end, and may differ from the estimated amounts.
Investment in Subsidiary — The Dynamic Asset Allocation and Multi-Asset Real Return Funds may invest in their own Subsidiary. By investing in its Subsidiary, each Fund is indirectly exposed to the risks associated with the Subsidiary’s investments. The commodity-related instruments held by a Subsidiary are generally similar to those that are permitted to be held by the
applicable Fund and are subject to the same risks that apply to similar investments if held directly by the Fund. A Subsidiary, however, is not registered under the 1940 Act and will not be subject to all of the investor protections of the 1940 Act. Thus, the Dynamic Asset Allocation and Multi-Asset Real Return Funds, as investors in their own Subsidiary, will not have all of the protections offered to investors in registered investment companies.
However, each Fund wholly owns and controls its respective Subsidiary, and the Funds and the Subsidiaries are all managed by SIMC, making it unlikely that the Subsidiary will take action contrary to the interests of the applicable Fund or its shareholders. While a Subsidiary has its own Board of Directors (“Board”) that is responsible for overseeing the operations of such Subsidiary, the respective Fund’s Board has oversight responsibility for the investment activities of the Fund, including its investment in the respective Subsidiary, and the Fund’s role as the sole shareholder of such Subsidiary. It is not currently
| 268 | SEI Institutional Investments Trust / Semi-Annual Report / November 30, 2016 |
expected that shares of the Subsidiary will be sold or offered to investors other than the respective Fund.
Changes in the laws of the United States and/or the Cayman Islands or governmental interpretation of such laws, under which the Fund and the Subsidiary, respectively, are organized, could result in the inability of the Fund and/or its respective Subsidiary to operate as intended and could negatively affect the Fund and its shareholders. For example, Cayman Islands law does not currently impose any income, corporate or capital gains tax, estate duty, inheritance tax, gift tax or withholding tax on the Subsidiaries. If Cayman Islands law changes such that the Subsidiaries must pay Cayman Islands governmental authority taxes, Fund shareholders would likely suffer decreased investment return.
3. CREDIT DERIVATIVES
A Fund may use credit default swaps to reduce risk where a Fund has exposure to the issuer, or to take an active long or short position with respect to the likelihood of an event of default. The reference obligation of the swap can be a single issuer, a “basket” of issuers, or an index. The underlying referenced assets are corporate debt, sovereign debt and asset backed securities.
The buyer of a credit default swap is generally obligated to pay the seller a periodic stream of payments over the term of the contract in return for a contingent payment upon the occurrence of a credit event with respect to an underlying reference obligation. Generally, a credit event for corporate or sovereign reference obligations means bankruptcy, failure to pay, obligation acceleration, repudiation/moratorium or restructuring. For credit default swaps on asset-backed securities, a credit event may be triggered by events such as failure to pay principal, maturity extension, rating downgrade or write-down.
If a Fund is a seller of protection, and a credit event occurs, as defined under the terms of that particular swap agreement, a Fund will generally either (i) pay to the buyer an amount equal to the notional amount
of the swap and take delivery of the referenced obligation, other deliverable obligations, or underlying securities comprising a referenced index or (ii) pay a net settlement amount in the form of cash or securities equal to the notional amount of the swap less the recovery value of the referenced obligation or underlying securities comprising a referenced index.
If a Fund is a buyer of protection and a credit event occurs, as defined under the terms of that particular swap agreement, a Fund will either (i) receive from the seller of protection an amount equal to the notional amount of the swap and deliver the referenced obligation, other deliverable obligations or underlying securities comprising the referenced index or (ii) receive a net settlement amount in the form of cash or securities equal to the notional amount of the swap less the recovery value of the referenced obligation or underlying securities comprising the referenced index. Recovery values are assumed by market makers considering either industry standard recovery rates or entity specific factors and considerations until a credit event occurs. If a credit event has occurred, the recovery value is determined by a facilitated auction whereby a minimum number of allowable broker bids, together with a specified valuation method, are used to calculate the settlement value.
As of November 30, 2016, the Multi-Asset Real Return Fund is the buyer (“receiving protection”) on a total notional amount of $1.4 million. Additionally, the Core Fixed Income, High Yield Bond and Multi-Asset Real Return Funds are the sellers (“providing protection”) on a total notional amount of $1.9 million, $14.1 million and $4.6 million, respectively. The notional amounts of the swaps are not recorded in the financial statements; however the notional amounts approximate the maximum potential amount of future payments that the Fund could be required to make if the Fund was the seller of protection and a credit event were to occur. Those credit default swaps (“CDS”) for which the Fund is providing protection at balance sheet date are summarized as follows:
| Core Fixed Income Fund Written Credit Derivative Contracts | Single Name CDS | CDS Index | ||||||||||||||||||
| Reference Asset | Corp US$ | Sovereign US$ | ABS US$ | Corp US$ | Total | |||||||||||||||
Fair value of written credit derivatives | $ | 13,147 | $ | — | $ | — | $ | — | $ | 13,147 | ||||||||||
Maximum potential amount of future payments | 1,920,000 | — | — | — | 1,920,000 | |||||||||||||||
Recourse provisions with the third parties any amounts paid under the credit derivative (including any purchased credit protection) | — | — | — | — | — | |||||||||||||||
Collateral held by the Partnership or other third parties which the Partnership can obtain upon occurrence of triggering event | — | — | — | — | — | |||||||||||||||
| 1 | Potential recoveries would include purchased credit derivatives to the extent they offset written credit derivatives which have an identical underlying, or a netting arrangement or credit support annex with the counterparty. There may be other potential recoveries from recourse provisions where agreements cover multiple derivative arrangements but those amounts have not been included. |
| SEI Institutional Investments Trust / Semi-Annual Report / November 30, 2016 | 269 |
NOTES TO FINANCIAL STATEMENTS/CONSOLIDATED NOTES TO FINANCIAL STATEMENTS (Unaudited) (Continued)
November 30, 2016
| Maximum Potential Amount of Future Payments by Contract Term | ||||||||||||||||||||||||
| 0-6 Months | 6-12 Months | 1-5 Years | 5-10 Years | >10 Years | Total | |||||||||||||||||||
Current credit spread* on underlying (in basis points)(1) | ||||||||||||||||||||||||
0-100 | $ | — | $ | — | $ | 1,920,000 | $ | — | $ | — | $ | 1,920,000 | ||||||||||||
> 101 | — | — | — | — | — | — | ||||||||||||||||||
Total | $ | — | $ | — | $ | 1,920,000 | $ | — | $ | — | $ | 1,920,000 | ||||||||||||
| * | The credit spread on the underlying asset is generally indicative of the current status of the underlying risk of the Fund having to perform. The spread also reflects the cost of buying/selling protection and may include upfront payments required to be made to enter into a contract. Higher credit spreads with a shorter contract term is indicative of a higher likelihood of performance by the Fund. |
High Yield Bond Fund Written Credit Derivative Contracts | Single Name CDS | CDS Index | ||||||||||||||||||
| Reference Asset | Corp US$ | Sovereign US$ | ABS US$ | Corp US$ | Total | |||||||||||||||
Fair value of written credit derivatives | $ | — | $ | — | $ | 377,379 | $ | 354,228 | $ | 731,607 | ||||||||||
Maximum potential amount of future payments | — | — | 6,700,000 | 7,400,000 | 14,100,000 | |||||||||||||||
Recourse provisions with the third parties any amounts paid under the credit derivative (including any purchased credit protection) | — | — | — | — | — | |||||||||||||||
Collateral held by the Partnership or other third parties which the Partnership can obtain upon occurrence of triggering event | — | — | — | — | — | |||||||||||||||
| 1 | Potential recoveries would include purchased credit derivatives to the extent they offset written credit derivatives which have an identical underlying, or a netting arrangement or credit support annex with the counterparty. There may be other potential recoveries from recourse provisions where agreements cover multiple derivative arrangements but those amounts have not been included. |
| Maximum Potential Amount of Future Payments by Contract Term | ||||||||||||||||||||||||
| 0-6 Months | 6-12 Months | 1-5 Years | 5-10 Years | >10 Years | Total | |||||||||||||||||||
Current credit spread* on underlying (in basis points)(1) | ||||||||||||||||||||||||
0-100 | $ | — | $ | — | $ | — | $ | — | $ | — | $ | — | ||||||||||||
301-400 | — | — | 6,700,000 | 7,400,000 | — | 14,100,000 | ||||||||||||||||||
Total | $ | — | $ | — | $ | 6,700,000 | $ | 7,400,000 | $ | — | $ | 14,100,000 | ||||||||||||
| * | The credit spread on the underlying asset is generally indicative of the current status of the underlying risk of the Fund having to perform. The spread also reflects the cost of buying/selling protection and may include upfront payments required to be made to enter into a contract. Higher credit spreads with a shorter contract term is indicative of a higher likelihood of performance by the Fund. |
Multi-Asset Real Return Fund Written Credit Derivative Contracts | Single Name CDS | CDS Index | ||||||||||||||||||
| Reference Asset | Corp US$ | Sovereign US$ | ABS US$ | Corp US$ | Total | |||||||||||||||
Fair value of written credit derivatives | $ | 8,387 | $ | — | $ | (316,496 | ) | $ | — | $ | (308,109 | ) | ||||||||
Maximum potential amount of future payments | 382,161 | — | 4,264,000 | — | 4,646,161 | |||||||||||||||
Recourse provisions with the third parties any amounts paid under the credit derivative (including any purchased credit protection) | — | — | — | — | — | |||||||||||||||
Collateral held by the Partnership or other third parties which the Partnership can obtain upon occurrence of triggering event | — | — | — | — | — | |||||||||||||||
| 1 | Potential recoveries would include purchased credit derivatives to the extent they offset written credit derivatives which have an identical underlying, or a netting arrangement or credit support annex with the counterparty. There may be other potential recoveries from recourse provisions where agreements cover multiple derivative arrangements but those amounts have not been included. |
| Maximum Potential Amount of Future Payments by Contract Term | ||||||||||||||||||||||||
| 0-6 Months | 6-12 Months | 1-5 Years | 5-10 Years | >10 Years | Total | |||||||||||||||||||
Current credit spread* on underlying (in basis points)(1) | ||||||||||||||||||||||||
0-100 | $ | 170,000 | $ | — | $ | 212,161 | $ | — | $ | — | $ | 382,161 | ||||||||||||
301-400 | — | — | — | — | 4,264,000 | 4,264,000 | ||||||||||||||||||
Total | $ | 170,000 | $ | — | $ | 212,161 | $ | — | $ | 4,264,000 | $ | 4,646,161 | ||||||||||||
| * | The credit spread on the underlying asset is generally indicative of the current status of the underlying risk of the Fund having to perform. The spread also reflects the cost of buying/selling protection and may include upfront payments required to be made to enter into a contract. Higher credit spreads with a shorter contract term is indicative of a higher likelihood of performance by the Fund. |
The credit spread disclosed above for each reference obligation where the Fund is the seller of protection is a representation of the current payment/performance risk of the swap.
| 270 | SEI Institutional Investments Trust / Semi-Annual Report / November 30, 2016 |
4. DERIVATIVE TRANSACTIONS
The following tables include only Funds that had exposure to more than one type of risk on derivatives held throughout the period. For Funds that held derivatives throughout the period with only one type of risk exposure, additional information can be found on
the Schedule of Investments, Consolidated Summary Schedule of Investments or Consolidated Schedule of Investments and the Statements of Operations or Consolidated Statements of Operations.
The fair value of derivative instruments as of November 30, 2016 was as follows ($ Thousands):
| Asset Derivatives | Liability Derivatives | |||||||||||
| Statements of Assets and Liabilities Location | Fair Value | Statements of Assets and Liabilities Location | Fair Value | |||||||||
| Global Managed Volatility Fund | ||||||||||||
Equity contracts | Net Assets — Unrealized appreciation on swaps contracts | $ | 229 | * | Net Assets — Unrealized depreciation on futures contracts | $ | 41 | * | ||||
Foreign exchange contracts | Unrealized gain on forward foreign currency contracts | 1,789 | Unrealized loss on forward foreign currency contracts | 149 | ||||||||
|
|
|
| |||||||||
Total derivatives not accounted for as hedging instruments | $ | 2,018 | $ | 190 | ||||||||
|
|
|
| |||||||||
| Core Fixed Income Fund | ||||||||||||
Interest rate contracts | Net Assets — Unrealized appreciation on futures contracts | $ | 2,006 | * | Net Assets — Unrealized depreciation on futures contracts | $ | 1,507 | * | ||||
Net Assets — Unrealized appreciation on swap contracts | 3,294 | † | Net Assets — Unrealized depreciation on swap contracts | 2,194 | † | |||||||
Options purchased, at value | 12 | Options Written, at value | 303 | |||||||||
Credit Contracts | Net Assets — Unrealized appreciation on swap contracts | — | Net Assets — Unrealized depreciation on swap contracts | 3 | † | |||||||
Foreign exchange contracts | Unrealized gain on forward foreign currency contracts | 8,203 | Unrealized loss on forward foreign currency contracts | 373 | ||||||||
|
|
|
| |||||||||
Total derivatives not accounted for as hedging instruments | $ | 13,515 | $ | 4,380 | ||||||||
|
|
|
| |||||||||
| Long Duration Fund | ||||||||||||
Interest rate contracts | Net Assets — Unrealized appreciation on futures contracts | $ | 317 | * | Net Assets — Unrealized depreciation on futures contracts | $ | 371 | * | ||||
Net Assets — Unrealized appreciation on swap contracts | — | Net Assets — Unrealized depreciation on swap contracts | 1,688 | † | ||||||||
|
|
|
| |||||||||
Total derivatives not accounted for as hedging instruments | $ | 317 | $ | 1,539 | ||||||||
|
|
|
| |||||||||
| Emerging Markets Debt Fund | ||||||||||||
Interest rate contracts | Net Assets — Unrealized appreciation on futures contracts | $ | 239 | * | Net Assets — Unrealized depreciation on futures contracts | $ | 571 | * | ||||
Net Assets — Unrealized appreciation on swap contracts | 1,727 | † | Net Assets — Unrealized depreciation on swap contracts | 4,955 | † | |||||||
Foreign exchange contracts | Unrealized gain on forward foreign currency contracts | 28,153 | Unrealized loss on forward foreign currency contracts | 22,136 | ||||||||
|
|
|
| |||||||||
Total derivatives not accounted for as hedging instruments | $ | 30,119 | $ | 27,662 | ||||||||
|
|
|
| |||||||||
| Dynamic Asset Allocation Fund | ||||||||||||
Interest rate contracts | Net Assets — Unrealized appreciation on swaps contracts | $ | 5,265 | † | Net Assets — Unrealized depreciation on Swaps contracts | $ | — | |||||
Equity Contracts | Net Assets — Unrealized appreciation on futures contracts | 9,070 | * | Net Assets — Unrealized depreciation on futures contracts | 1,441 | * | ||||||
Foreign exchange contracts | Options purchased, at value | 7,305 | Options written, at value | — | ||||||||
| SEI Institutional Investments Trust / Semi-Annual Report / November 30, 2016 | 271 |
NOTES TO FINANCIAL STATEMENTS/CONSOLIDATED NOTES TO FINANCIAL STATEMENTS (Unaudited) (Continued)
November 30, 2016
| Asset Derivatives | Liability Derivatives | |||||||||||
Unrealized gain on forward foreign currency contracts | 23,476 | Unrealized loss on forward foreign currency contracts | 6,813 | |||||||||
|
|
|
| |||||||||
Total derivatives not accounted for as hedging instruments | $ | 45,116 | $ | 8,254 | ||||||||
|
|
|
| |||||||||
| Multi-Asset Real Return Fund | ||||||||||||
Interest rate contracts | Net Assets — Unrealized appreciation on futures contracts | $ | 61 | * | Net Assets — Unrealized depreciation on futures contracts | $ | 23 | * | ||||
Net Assets — Unrealized appreciation on swap contracts | 1,399 | † | Net Assets — Unrealized depreciation on swap contracts | 1,636 | † | |||||||
Equity Contracts | Net Assets — Unrealized appreciation on futures contracts | 418 | * | Net Assets — Unrealized depreciation on futures contracts | 249 | * | ||||||
Credit Contracts | Net Assets — Unrealized appreciation on swap contracts | 26 | † | Net Assets — Unrealized depreciation on swap contracts | 100 | † | ||||||
Commodity Contracts | Net Assets — Unrealized appreciation on futures contracts | 3,628 | * | Net Assets — Unrealized depreciation on futures contracts | 3,567 | * | ||||||
Foreign exchange contracts | Unrealized gain on forward foreign currency contracts | 3,065 | Unrealized loss on forward foreign currency contracts | 443 | ||||||||
|
|
|
| |||||||||
Total derivatives not accounted for as hedging instruments | $ | 8,597 | $ | 6,018 | ||||||||
|
|
|
| |||||||||
| * | Includes cumulative appreciation/depreciation of futures contracts as reported in the Schedules of Investments, Consolidated Summary Schedule of Investments or Consolidated Schedule of Investments. Only current day’s variation margin is reported within the Statements of Assets and Liabilities or Consolidated Statements of Assets and Liabilities. |
| † | Includes cumulative appreciation/depreciation of swap contracts as reported in the Schedules of Investments, Consolidated Summary Schedule of Investments or Consolidated Schedule of Investments. Market Value is reported within the Statements of Assets and Liabilities or Consolidated Statements of Assets and Liabilities for swap contracts that have paid premiums. |
The effect of derivative instruments on the Statements of Operations or Consolidated Statements of Operations for the period ended November 30, 2016.
Amount of realized gain or (loss) on derivatives recognized in income ($ Thousands):
Derivatives Not Accounted for as Hedging Instruments | Swaptions | Options | Futures | Forward Currency Contracts | Swaps | Total | ||||||||||||||||||
World Equity Ex-US Fund | ||||||||||||||||||||||||
Equity contracts | $ | — | $ | — | $ | 2,751 | $ | — | $ | — | $ | 2,751 | ||||||||||||
Foreign exchange contracts | — | — | — | 10,054 | — | 10,054 | ||||||||||||||||||
Total | $ | — | $ | — | $ | 2,751 | $ | 10,054 | $ | — | $ | 12,805 | ||||||||||||
Core Fixed Income Fund | ||||||||||||||||||||||||
Interest rate contracts | $ | — | $ | (933 | ) | $ | 11,095 | $ | — | $ | (4,438 | ) | $ | 5,724 | ||||||||||
Foreign exchange contracts | — | — | (85 | ) | (3,718 | ) | — | (3,803 | ) | |||||||||||||||
Credit contracts | — | — | — | — | 94 | 94 | ||||||||||||||||||
Total | $ | — | $ | (933 | ) | $ | 11,010 | $ | (3,718 | ) | $ | (4,344 | ) | $ | 2,015 | |||||||||
Emerging Markets Debt Fund | ||||||||||||||||||||||||
Interest rate contracts | $ | — | $ | — | $ | (677 | ) | $ | — | $ | (900 | ) | $ | (1,577 | ) | |||||||||
Foreign exchange contracts | — | — | — | (21,018 | ) | — | (21,018 | ) | ||||||||||||||||
Credit contracts | — | — | — | — | (1,645 | ) | (1,645 | ) | ||||||||||||||||
Total | $ | — | $ | — | $ | (677 | ) | $ | (21.018 | ) | $ | (2,545 | ) | $ | (24,240 | ) | ||||||||
Dynamic Asset Allocation Fund | ||||||||||||||||||||||||
Interest Rates | $ | — | $ | — | $ | (1,532 | ) | $ | — | $ | 10,053 | $ | 8,521 | |||||||||||
Foreign exchange contracts | — | — | — | 1,867 | — | 1,867 | ||||||||||||||||||
Equity contracts | — | (1,568 | ) | 5,538 | — | — | 3,970 | |||||||||||||||||
Total | $ | — | $ | (1,568 | ) | $ | 4,006 | $ | 1,867 | $ | 10,053 | $ | 14,358 | |||||||||||
| 272 | SEI Institutional Investments Trust / Semi-Annual Report / November 30, 2016 |
Derivatives Not Accounted for as Hedging Instruments | Swaptions | Options | Futures | Forward Currency Contracts | Swaps | Total | ||||||||||||||||||
Multi-Asset Real Return Fund | ||||||||||||||||||||||||
Interest Rates | $ | (43 | ) | $ | — | $ | 19 | $ | — | $ | (193 | ) | $ | (217 | ) | |||||||||
Foreign exchange contracts | — | — | — | (273 | ) | — | (273 | ) | ||||||||||||||||
Credit contracts | — | — | — | — | 11 | 11 | ||||||||||||||||||
Equity contracts | — | — | (1,642 | ) | — | — | (1,642 | ) | ||||||||||||||||
Commodity contracts | — | (156 | ) | 7,526 | — | — | 7,370 | |||||||||||||||||
Total | $ | (43 | ) | $ | (156 | ) | $ | 5,903 | $ | (273 | ) | $ | (182 | ) | $ | 5,249 | ||||||||
Change in unrealized appreciation or (depreciation) on derivatives recognized in income ($ Thousands):
| Derivatives Not Accounted for as Hedging Instruments | Options | Futures | Forward Currency Contracts | Swaps | Total | |||||||||||||||
Core Fixed Income Fund | ||||||||||||||||||||
Interest rate contracts | $ | 312 | $ | 884 | $ | — | $ | 8,866 | $ | 10,062 | ||||||||||
Foreign exchange contracts | — | — | 7,439 | — | 7,439 | |||||||||||||||
Credit contracts | — | — | — | (107 | ) | (107 | ) | |||||||||||||
Total | $ | 312 | $ | 884 | $ | 7,439 | $ | 8,759 | $ | 17,394 | ||||||||||
Emerging Markets Debt Fund | ||||||||||||||||||||
Interest rate contracts | $ | — | $ | (275 | ) | $ | — | $ | 95 | $ | (180 | ) | ||||||||
Foreign exchange contracts | — | — | 11,320 | — | 11,320 | |||||||||||||||
Credit contracts | — | — | — | 72 | 72 | |||||||||||||||
Total | $ | — | $ | (275 | ) | $ | 11,320 | $ | 167 | $ | 11,212 | |||||||||
Dynamic Asset Allocation Fund | ||||||||||||||||||||
Interest Rates | $ | — | $ | 160 | $ | — | $ | (1,119 | ) | $ | (959 | ) | ||||||||
Foreign exchange contracts | 5,205 | — | 7,805 | — | 13,010 | |||||||||||||||
Equity contracts | 1,289 | 4,553 | — | — | 5,842 | |||||||||||||||
Total | $ | 6,494 | $ | 4,713 | $ | 7,805 | $ | (1,119 | ) | $ | 17,893 | |||||||||
Multi-Asset Real Return Fund | ||||||||||||||||||||
Interest Rates | $ | — | $ | 7 | $ | — | $ | 1,610 | $ | 1,617 | ||||||||||
Foreign exchange contracts | — | — | 2,775 | — | 2,775 | |||||||||||||||
Credit contracts | — | — | — | (210 | ) | (210 | ) | |||||||||||||
Equity contracts | — | 974 | — | — | 974 | |||||||||||||||
Commodity contracts | 69 | (7,091 | ) | — | — | (7,022 | ) | |||||||||||||
Total | $ | 69 | $ | (6,110 | ) | $ | 2,775 | $ | 1,400 | $ | (1,866 | ) | ||||||||
A Fund is subject to various netting arrangements with select counterparties (“Master Agreements”). Master Agreements govern the terms of certain transactions, and reduce the counterparty risk associated with relevant transactions by specifying credit protection mechanisms and providing standardization that improves legal certainty. Since different types of transactions have different mechanics and are sometimes traded out of different legal entities of a particular counterparty organization, each type of transaction may be covered by a different Master Agreement, resulting in the need for multiple agreements with a single counterparty. As the Master Agreements are specific to unique operations of different asset types, they allow a Fund to close out and net its total exposure to a specific counterparty entity in the event of a default with respect to all the transactions governed under a single agreement with a specific counterparty entity.
Master Agreements can also help limit counterparty risk by specifying collateral posting arrangements at pre-arranged exposure levels. Under the Master Agreements, collateral is routinely transferred if the total net exposure to certain transactions (net of existing collateral already in place) governed under the relevant Master Agreement with a counterparty in a given account exceeds a specified threshold, which typically ranges from zero to $250,000 depending on the counterparty and the type of Master Agreement. United States Treasury Securities and U.S. dollar cash are generally the preferred forms of collateral. Securities and cash pledged as collateral are reflected as assets on the Statements of Assets and Liabilities/Consolidated Statements of Assets and Liabilities as either a component of investments at value (securities) or deposits due from counterparties (cash). Cash collateral received is not typically held in a segregated account and as such is reflected as a liability on the Statements
| SEI Institutional Investments Trust / Semi-Annual Report / November 30, 2016 | 273 |
NOTES TO FINANCIAL STATEMENTS/CONSOLIDATED NOTES TO FINANCIAL STATEMENTS (Unaudited) (Continued)
November 30, 2016
of Assets and Liabilities/Consolidated Statements of Assets and Liabilities as deposits due to counterparties. The market value of any securities received as collateral is not reflected as a component of net asset value. A Fund’s overall exposure to counterparty risk can change substantially within a short period, as it is affected by each transaction subject to the relevant Master Agreement.
Customer Account Agreements and related addendums govern exchange traded derivatives transactions such as futures, options on futures, and centrally cleared
swaps. Exchange traded derivative transactions require posting of initial margin as determined by each relevant clearing agency which is segregated at a broker account registered with the Commodities Futures Trading Commission (CFTC), or the applicable regulator. In the US, counterparty risk is significantly reduced as creditors of the futures broker do not have claim to Fund assets in the segregated account. Additionally, portability of exposure in the event of default further reduces risk to the Funds. Variation margin, or changes in market value, are exchanged daily, but may not be netted between futures and cleared OTC derivatives.
The following is a summary of the market value and variation margin of exchange-traded or centrally cleared financial derivative instruments of the Funds as of November 30, 2016 ($ Thousands):
| Financial Derivative Assets | Financial Derivative Liabilities | |||||||||||||||||||||||||||||||||||
| Market Value | Variation Margin Asset | Market Value | Variation Margin Liability | |||||||||||||||||||||||||||||||||
| Fund | Purchased Options | Futures | Swap Agreements | Total | Written Options | Futures | Swap Agreements | Total | ||||||||||||||||||||||||||||
Large Cap Fund | $ | — | $ | — | $ | — | $ | — | $ | — | $ | 174 | $ | — | $ | 174 | ||||||||||||||||||||
Large Cap Disciplined Equity Fund | — | — | — | — | — | 40 | — | 40 | ||||||||||||||||||||||||||||
Large Cap Index Fund | — | — | — | — | — | 101 | — | 101 | ||||||||||||||||||||||||||||
S&P 500 Index Fund | — | — | — | — | — | 215 | — | 215 | ||||||||||||||||||||||||||||
Extended Market Index Fund | — | — | — | — | — | 93 | — | 93 | ||||||||||||||||||||||||||||
Small Cap II Fund | — | — | — | — | — | 68 | — | 68 | ||||||||||||||||||||||||||||
U.S. Managed Volatility Fund | — | — | — | — | — | 78 | — | 78 | ||||||||||||||||||||||||||||
Global Managed Volatility Fund | — | 36 | — | 36 | — | 49 | — | 49 | ||||||||||||||||||||||||||||
World Equity Ex-US Fund | — | 362 | — | 362 | — | 22 | — | 22 | ||||||||||||||||||||||||||||
Screened World Equity Ex-US Fund | — | 9 | — | 9 | — | 1 | — | 1 | ||||||||||||||||||||||||||||
Opportunistic Income Fund | — | 69 | — | 69 | — | 3 | — | 3 | ||||||||||||||||||||||||||||
Core Fixed Income Fund | 12 | 2,844 | 724 | 3,580 | 303 | 1,749 | 45 | 2,097 | ||||||||||||||||||||||||||||
High Yield Bond Fund | — | — | 20 | 20 | — | — | — | — | ||||||||||||||||||||||||||||
Long Duration Fund | — | 915 | 57 | 972 | — | 1,850 | — | 1,850 | ||||||||||||||||||||||||||||
Long Duration Credit Fund | — | 1,512 | — | 1,512 | — | 1,237 | — | 1,237 | ||||||||||||||||||||||||||||
Ultra Short Duration Bond Fund | — | 26 | — | 26 | — | 9 | — | 9 | ||||||||||||||||||||||||||||
Emerging Markets Debt Fund | — | 211 | — | 211 | — | 1,411 | 45 | 1,456 | ||||||||||||||||||||||||||||
Limited Duration Bond Fund | — | — | — | — | — | 2 | — | 2 | ||||||||||||||||||||||||||||
Intermediate Duration Credit Fund | — | 233 | — | 233 | — | — | — | — | ||||||||||||||||||||||||||||
Dynamic Asset Allocation Fund | 7,305 | 692 | — | 7,997 | — | 1 | — | 1 | ||||||||||||||||||||||||||||
Multi-Asset Real Return Fund | — | 3,911 | 257 | 4,168 | — | 652 | 85 | 737 | ||||||||||||||||||||||||||||
Securities with an aggregate fair market value of $447 ($ Thousands) have been pledged and $97,147 ($ Thousands) has been pledged as collateral for exchange-traded and centrally cleared derivative instruments as of November 30, 2016.
International Swaps and Derivatives Association, Inc. Master Agreements and Credit Support Annexes (“ISDA Master Agreements”) govern OTC financial derivative transactions entered into by a Fund and select counterparties. ISDA Master Agreements maintain provisions for general obligations, representations, agreements, collateral and events of default or termination. Events of termination include conditions that may entitle counterparties to elect to terminate early and
cause settlement of all outstanding transactions under the applicable ISDA Master Agreement. Any election to terminate early could be material to the financial statements. In limited circumstances, the ISDA Master Agreement may contain additional provisions that add additional counterparty protection beyond coverage of existing daily exposure if the counterparty has a decline in credit quality below a predefined level. These amounts, if any, may be segregated with a third party custodian.
| 274 | SEI Institutional Investments Trust / Semi-Annual Report / November 30, 2016 |
The following is a summary by derivative type of the market value of OTC financial derivative instruments and collateral (received) pledged as of November 30, 2016 ($ Thousands):
| Financial Derivative Assets | Financial Derivative Liabilities | |||||||||||||||||||||||||||||||||||||||||||||||||||||||
| Global Managed Volatility | Forward Foreign Currency Contracts | Purchased Options and Swaptions | Swap Agreements | Total Over the Counter | Forward Foreign Currency Contracts | Written Options and Swaptions | Swap Agreements | Reverse Repurchase Agreements | Total the | Net Market Value of OTC Derivatives | Collateral (Received) Pledged | Net Exposures(1) | ||||||||||||||||||||||||||||||||||||||||||||
Brown Brothers Harriman | $ | 1,789 | $ | — | $ | — | $ | 1,789 | $ | 149 | $ | — | $ | — | $ | — | $ | 149 | $ | 1,640 | $ | — | $ | 1,640 | ||||||||||||||||||||||||||||||||
Total Over the Counter | $ | 1,789 | $ | — | $ | — | $ | 1,789 | $ | 149 | $ | — | $ | — | $ | — | $ | 149 | ||||||||||||||||||||||||||||||||||||||
| Financial Derivative Assets | Financial Derivative Liabilities | |||||||||||||||||||||||||||||||||||||||||||||||||||||||
| Core Fixed Income Fund | Forward Foreign Currency Contracts | Purchased Options and Swaptions | Swap Agreements | Total Over the Counter | Forward Foreign Currency Contracts | Written Options and Swaptions | Swap Agreements | Reverse Repurchase Agreements | Total Over the Counter | Net Market Value of OTC Derivatives | Collateral (Received) Pledged | Net Exposures(1) | ||||||||||||||||||||||||||||||||||||||||||||
Bank of America | $ | — | $ | — | $ | — | $ | — | $ | 41 | $ | — | $ | — | $ | — | $ | 41 | $ | (41 | ) | $ | — | $ | (41 | ) | ||||||||||||||||||||||||||||||
Barclays PLC | 150 | — | — | 150 | — | — | — | — | — | 150 | — | 150 | ||||||||||||||||||||||||||||||||||||||||||||
Citigroup | 2,528 | — | — | 2,528 | 332 | — | 467 | — | 799 | 1,729 | — | 1,729 | ||||||||||||||||||||||||||||||||||||||||||||
Goldman Sachs | — | — | 13 | 13 | — | — | — | — | — | 13 | — | 13 | ||||||||||||||||||||||||||||||||||||||||||||
JPMorgan Chase Bank | 3,241 | — | — | 3,241 | — | — | — | — | — | 3,241 | — | 3,241 | ||||||||||||||||||||||||||||||||||||||||||||
UBS | 53 | — | — | 53 | — | — | — | — | — | 53 | — | 53 | ||||||||||||||||||||||||||||||||||||||||||||
US Bank | 2,231 | — | — | 2,231 | — | — | — | — | — | 2,231 | — | 2,231 | ||||||||||||||||||||||||||||||||||||||||||||
Total Over the Counter | $ | 8,203 | $ | — | $ | 13 | $ | 8,216 | $ | 373 | $ | — | $ | 467 | $ | — | $ | 839 | ||||||||||||||||||||||||||||||||||||||
| Financial Derivative Assets | Financial Derivative Liabilities | |||||||||||||||||||||||||||||||||||||||||||||||||||||||
| Long Duration Fund | Forward Foreign Currency Contracts | Purchased Options and Swaptions | Swap Agreements | Total Over the Counter | Forward Foreign Currency Contracts | Written Options and Swaptions | Swap Agreements | Reverse Repurchase Agreements | Total Over the Counter | Net Market Value of OTC Derivatives | Collateral (Received) Pledged | Net Exposures(1) | ||||||||||||||||||||||||||||||||||||||||||||
Citigroup | $ | — | $ | — | $ | — | $ | — | $ | — | $ | — | $ | 310 | $ | — | $ | 310 | $ | 310 | $ | — | $ | 310 | ||||||||||||||||||||||||||||||||
Total Over the Counter | $ | — | $ | — | $ | — | $ | — | $ | — | $ | — | $ | 310 | $ | — | $ | 310 | ||||||||||||||||||||||||||||||||||||||
| Financial Derivative Assets | Financial Derivative Liabilities | |||||||||||||||||||||||||||||||||||||||||||||||||||||||
| Emerging Markets Debt Fund | Forward Contracts | Purchased Options and Swaptions | Swap Agreements | Total Over the Counter | Forward Foreign Currency Contracts | Written Options and Swaptions | Swap Agreements | Reverse Repurchase Agreements | Total Over the Counter | Net Market Value of OTC Derivatives | Collateral (Received) Pledged | Net Exposures(1) | ||||||||||||||||||||||||||||||||||||||||||||
Bank of America | $ | 1,596 | $ | — | $ | — | $ | 1,596 | $ | 203 | $ | — | $ | — | $ | — | $ | 203 | $ | 1,393 | $ | — | $ | 1,393 | ||||||||||||||||||||||||||||||||
Barclays PLC | 383 | — | — | 383 | 330 | — | — | — | 330 | 53 | — | 53 | ||||||||||||||||||||||||||||||||||||||||||||
BT Brokerage | 238 | — | — | 238 | 1,069 | — | — | — | 1,069 | (831 | ) | — | (831 | ) | ||||||||||||||||||||||||||||||||||||||||||
Citigroup | 12,134 | — | 11 | 12,145 | 6,859 | — | — | — | 6,859 | 5,286 | — | 5,286 | ||||||||||||||||||||||||||||||||||||||||||||
Goldman Sachs | 4,394 | — | 1,603 | 5,997 | 3,335 | — | 1,562 | — | 4,897 | 1,100 | 1,310 | 2,410 | ||||||||||||||||||||||||||||||||||||||||||||
HSBC | 655 | — | — | 655 | 654 | — | — | — | 654 | 1 | 2,500 | 2,501 | ||||||||||||||||||||||||||||||||||||||||||||
JPMorgan Chase Bank | 7,877 | — | 113 | 7,990 | 6,312 | — | 3,393 | — | 9,705 | (1,715 | ) | — | (1,715 | ) | ||||||||||||||||||||||||||||||||||||||||||
Standard Bank | 865 | — | — | 865 | 3,345 | — | — | — | 3,345 | (2,480 | ) | — | (2,480 | ) | ||||||||||||||||||||||||||||||||||||||||||
UBS | 9 | — | — | 9 | 27 | — | — | — | 27 | (18 | ) | — | (18 | ) | ||||||||||||||||||||||||||||||||||||||||||
Total Over the Counter | $ | 28,151 | $ | — | $ | 1,727 | $ | 29,878 | $ | 22,134 | $ | — | $ | 4,955 | $ | — | $ | 27,089 | ||||||||||||||||||||||||||||||||||||||
| Financial Derivative Assets | Financial Derivative Liabilities | |||||||||||||||||||||||||||||||||||||||||||||||||||||||
| Dynamic Asset Allocation Fund | Forward Foreign Currency Contracts | Purchased Options and Swaptions | Swap Agreements | Total Over the Counter | Forward Foreign Currency Contracts | Written Options and Swaptions | Swap Agreements | Reverse Repurchase Agreements | Total Over the Counter | Net Market Value of OTC Derivatives | Collateral (Received) Pledged | Net Exposures(1) | ||||||||||||||||||||||||||||||||||||||||||||
Bank of America | $ | 605 | $ | — | $ | 876 | $ | 1,481 | $ | 6,784 | $ | — | $ | — | $ | — | $ | 6,784 | $ | (5,303 | ) | $ | — | $ | (5,303 | ) | ||||||||||||||||||||||||||||||
BNP Paribas | — | — | 4,389 | 4,389 | — | — | — | — | — | 4,389 | — | 4,389 | ||||||||||||||||||||||||||||||||||||||||||||
Goldman Sachs | 324 | — | — | 324 | — | — | — | — | — | 324 | — | 324 | ||||||||||||||||||||||||||||||||||||||||||||
Jefferies LLC | 10,543 | — | — | 10,543 | — | — | — | — | — | 10,543 | — | 10,543 | ||||||||||||||||||||||||||||||||||||||||||||
| SEI Institutional Investments Trust / Semi-Annual Report / November 30, 2016 | 275 |
NOTES TO FINANCIAL STATEMENTS/CONSOLIDATED NOTES TO FINANCIAL STATEMENTS (Unaudited) (Continued)
November 30, 2016
| Financial Derivative Assets | Financial Derivative Liabilities | |||||||||||||||||||||||||||||||||||||||||||||||||||||||
| Dynamic Asset Allocation Fund | Forward Foreign Currency Contracts | Purchased Options and Swaptions | Swap Agreements | Total Over the Counter | Forward Foreign Currency Contracts | Written Options and Swaptions | Swap Agreements | Reverse Repurchase Agreements | Total Over the Counter | Net Market Value of OTC Derivatives | Collateral (Received) Pledged | Net Exposures(1) | ||||||||||||||||||||||||||||||||||||||||||||
JPMorgan Chase Bank | 5,934 | — | — | 5,934 | — | — | — | — | — | 5,934 | — | 5,934 | ||||||||||||||||||||||||||||||||||||||||||||
Morgan Stanley | 5,927 | — | — | 5,927 | 29 | — | — | — | 29 | 5,898 | — | 5,898 | ||||||||||||||||||||||||||||||||||||||||||||
Standard Chartered | 143 | — | — | 143 | — | — | — | — | — | 143 | — | 143 | ||||||||||||||||||||||||||||||||||||||||||||
Total Over the Counter | $ | 23,476 | $ | — | $ | 5,265 | $ | 28,741 | $ | 6,813 | $ | — | $ | — | $ | — | $ | 6,813 | ||||||||||||||||||||||||||||||||||||||
| Financial Derivative Assets | Financial Derivative Liabilities | |||||||||||||||||||||||||||||||||||||||||||||||||||||||
| Multi-Asset Real Return Fund | Forward Contracts | Purchased Options and Swaptions | Swap Agreements | Total Over the Counter | Forward Foreign Currency Contracts | Written Options and Swaptions | Swap Agreements | Reverse Repurchase Agreements | Total Over the Counter | Net Market Value of OTC Derivatives | Collateral (Received) Pledged | Net Exposures(1) | ||||||||||||||||||||||||||||||||||||||||||||
Bank of America | $ | — | $ | — | $ | 7 | $ | 7 | $ | — | $ | — | $ | — | $ | — | $ | — | $ | 7 | $ | — | $ | 7 | ||||||||||||||||||||||||||||||||
Barclays PLC | 41 | — | — | 41 | 21 | — | 2 | — | 23 | 18 | — | 18 | ||||||||||||||||||||||||||||||||||||||||||||
BNP Paribas | 21 | — | — | 21 | 2 | — | — | — | 2 | 19 | — | 19 | ||||||||||||||||||||||||||||||||||||||||||||
Brown Brothers Harriman | 9 | — | — | 9 | — | — | — | — | — | 9 | — | 9 | ||||||||||||||||||||||||||||||||||||||||||||
Citibank | 1,594 | — | — | 1,594 | — | — | 98 | — | 98 | 1,496 | — | 1,496 | ||||||||||||||||||||||||||||||||||||||||||||
Chase Securities | — | — | — | — | — | — | — | 33,411 | 33,411 | (33,411 | ) | 33,307 | (104 | ) | ||||||||||||||||||||||||||||||||||||||||||
Credit Suisse | — | — | 5 | 5 | — | — | 178 | — | 178 | (173 | ) | — | (173 | ) | ||||||||||||||||||||||||||||||||||||||||||
Deutsche Bank | — | — | 1 | 1 | — | — | 41 | — | 41 | (40 | ) | — | (40 | ) | ||||||||||||||||||||||||||||||||||||||||||
Goldman Sachs | 43 | — | — | 43 | 386 | — | 97 | — | 483 | (440 | ) | — | (440 | ) | ||||||||||||||||||||||||||||||||||||||||||
HSBC | 43 | — | — | 43 | 31 | — | — | 57,478 | 57,509 | (57,466 | ) | 57,188 | (278 | ) | ||||||||||||||||||||||||||||||||||||||||||
JPMorgan Chase Bank | 14 | — | — | 14 | — | — | — | — | — | 14 | — | 14 | ||||||||||||||||||||||||||||||||||||||||||||
Merrill Lynch | — | — | — | — | — | — | — | 65,085 | 65,085 | (65,085 | ) | 65,167 | 82 | |||||||||||||||||||||||||||||||||||||||||||
Morgan Stanley | 66 | — | — | 66 | — | — | 60 | — | 60 | 6 | — | 6 | ||||||||||||||||||||||||||||||||||||||||||||
RBC | 30 | — | — | 30 | — | — | — | — | — | 30 | — | 30 | ||||||||||||||||||||||||||||||||||||||||||||
Standard Chartered | 1,204 | — | — | 1,204 | 3 | — | — | — | 3 | 1,201 | — | 1,201 | ||||||||||||||||||||||||||||||||||||||||||||
Total Over the Counter | $ | 3,065 | $ | — | $ | 13 | $ | 3,078 | $ | 443 | $ | — | $ | 476 | $ | 155,974 | $ | 156,893 | ||||||||||||||||||||||||||||||||||||||
| (1) | Net Exposures represents the net receivable/(payable) that would be due from/to the counterparty in the event of default. Exposure from OTC financial derivative instruments can only be netted across transactions governed under the same master agreement with the same legal entity. |
| (2) | Excess collateral pledged is not shown for financial reporting purposes. |
Securities with an aggregate fair market value of $155,215 ($ Thousands) have been pledged as collateral for financial derivative instruments as governed by International Swaps and Derivatives Association, Inc. master agreements as of November 30, 2016.
Written options transactions entered into during the period ended November 30, 2016, are summarized as follows:
| Core Fixed Income Fund | ||||||||
| Number of Contracts | Premium ($ Thousands) | |||||||
| Balance at the beginning of period | 321 | $ | 100 | |||||
| Written | 6,910 | 2,693 | ||||||
| Expired | (2,524 | ) | (959 | ) | ||||
| Closing buys | (3,270 | ) | (1,331 | ) | ||||
| Balance at the end of period | 1,437 | $ | 503 | |||||
As of November 30, 2016, the Funds had cash and/or securities at least equal to the value of written options.
5. BASIS FOR CONSOLIDATION FOR THE DYNAMIC ASSET ALLOCATION AND MULTI-ASSET REAL RETURN FUNDS
The Consolidated Summary Schedule of Investments, Consolidated Schedule of Investments, Consolidated Statements of Assets and Liabilities, Consolidated Statements of Operations, Consolidated Statements of Changes in Net Assets, Consolidated Statement of Cash Flows, and the Consolidated Financial Highlights of the Dynamic Asset Allocation and Multi-Asset Real Return Funds include the accounts of their respective Subsidiaries. All intercompany accounts and transactions have been eliminated in consolidation for the Funds. The Subsidiaries have a fiscal year end of May 31 for financial statement consolidation purposes and a nonconforming tax year end of April 30.
The Subsidiaries are classified as controlled foreign corporations under the Internal Revenue Code of 1986 (“IRC”). The Subsidiaries taxable income is included in the calculation of the Funds’ taxable income. Net losses of the Subsidiaries are not deductible by the Funds
| 276 | SEI Institutional Investments Trust / Semi-Annual Report / November 30, 2016 |
either in the current period or carried forward to future periods.
The Dynamic Asset Allocation and Multi-Asset Real Return Funds may invest up to 25% of their total assets in their respective Subsidiary.
A summary of the Funds’ investments in the Subsidiaries are as follows:
Inception Date of Subsidiary | Subsidiary Net Assets at November 30, 2016 ($ Thousands) | % of Total Net Assets at November 30, 2016 | ||||||||||
Dynamic Asset Allocation Commodity Strategy Subsidiary, Ltd. | January 28, 2014 | $ | 7,423 | 0.3 | % | |||||||
Multi-Asset Real Return Commodity Strategy Subsidiary, Ltd. | June 27, 2013 | $ | 148,918 | 20.3 | % | |||||||
6. INVESTMENT ADVISORY, ADMINISTRATION AND DISTRIBUTION AGREEMENTS, INVESTMENT SUBADVISORY AGREEMENTS AND OTHER TRANSACTIONS WITH AFFILIATES
Investment Advisory, Administration and Distribution Agreements — SEI Investments Global Funds Services (the “Administrator”) serves as administrator to the Funds. The Administrator provides certain administrative and shareholder servicing for an annual fee of 0.05% of the average daily net assets of each Fund. For the period ended November 30, 2016, the Administrator has voluntarily agreed to waive all of its fee. The Funds’ Administrator may discontinue all or part of these voluntary waiver at any time.
SIMC serves as investment adviser (the “Adviser”) to each Fund. In connection with serving as Adviser, SIMC is entitled to a fee that is calculated daily and paid monthly, based on the average daily net assets of each Fund. SIMC plans to voluntarily waive a portion of its fees in order to keep investment advisory fees at a specified level. The Funds’ Adviser may discontinue all or part of these voluntary waivers at any time. Accordingly, the advisory fee and voluntary expense limitations for each Fund are as follows:
| Advisory Fees | Investment Advisory Fees After Fee Waivers | |||||||
Large Cap Fund | 0.40 | % | 0.18 | % | ||||
Large Cap Diversified Alpha Fund | 0.40 | 0.22 | ||||||
Large Cap Disciplined Equity Fund | 0.40 | 0.17 | ||||||
Large Cap Index Fund | 0.17 | 0.01 | ||||||
S&P 500 Index Fund | 0.03 | 0.01 | ||||||
Extended Market Index Fund | 0.12 | 0.04 | ||||||
| Advisory Fees | Investment Advisory Fees After Fee Waivers | |||||||
Small Cap Fund | 0.65 | % | 0.45 | % | ||||
Small Cap II Fund | 0.65 | 0.43 | ||||||
Small/Mid Cap Equity Fund | 0.65 | 0.44 | ||||||
U.S. Managed Volatility Fund | 0.65 | 0.22 | ||||||
Global Managed Volatility Fund | 0.65 | 0.22 | ||||||
World Equity Ex-US Fund | 0.55 | 0.31 | ||||||
Screened World Equity Ex-US Fund | 0.65 | 0.26 | ||||||
Emerging Markets Equity Fund | 1.05 | 0.56 | ||||||
Opportunistic Income Fund | 0.45 | 0.24 | ||||||
Core Fixed Income Fund | 0.30 | 0.11 | ||||||
High Yield Bond Fund | 0.4875 | 0.28 | ||||||
Long Duration Fund | 0.30 | 0.13 | ||||||
Long Duration Credit Fund | 0.30 | 0.13 | ||||||
Ultra Short Duration Bond Fund | 0.15 | 0.10 | ||||||
Emerging Markets Debt Fund | 0.85 | 0.38 | ||||||
Real Return Fund | 0.22 | 0.06 | ||||||
Limited Duration Bond Fund | 0.25 | 0.09 | ||||||
Intermediate Duration Credit Fund | 0.25 | 0.13 | ||||||
Dynamic Asset Allocation Fund | 0.60 | 0.06 | ||||||
Multi-Asset Real Return Fund | 0.55 | 0.24 | ||||||
As of November 30, 2016, SIMC has entered into investment sub-advisory agreements with the following parties and pays the sub-advisers out of the fee that it receives from the Funds:
| Investment Sub-Adviser |
Large Cap Fund |
| AJO, LP |
| AQR Capital Management, LLC |
| Brown Advisory LLC |
| Jackson Square Partners, LLC |
| LSV Asset Management |
| Waddell & Reed Investment Management Company |
Large Cap Diversified Alpha Fund |
| AQR Capital Management, LLC |
| Brandywine Global Investment Management, LLC |
| Coho Partners, Ltd. |
| Jackson Square Partners, LLC |
| Parametric Portfolio Associates LLC |
Large Cap Disciplined Equity Fund |
| Analytic Investors, LLC |
| INTECH Investment Management, LLC |
| Lazard Asset Management LLC |
| OppenheimerFunds, Inc. |
| Quantitative Management Associates, LLC |
Large Cap Index Fund |
| SSGA Funds Management, Inc. |
S&P 500 Index Fund |
| SSGA Funds Management, Inc. |
Extended Market Index Fund |
| SSGA Funds Management, Inc. |
Small Cap Fund |
| AQR Capital Management, LLC |
| SEI Institutional Investments Trust / Semi-Annual Report / November 30, 2016 | 277 |
NOTES TO FINANCIAL STATEMENTS/CONSOLIDATED NOTES TO FINANCIAL STATEMENTS (Unaudited) (Continued)
November 30, 2016
| Axiom International Investors, LLC |
| Boston Partners Global Investors Inc. |
| EAM Investors, LLC |
| Falcon Point Capital, LLC |
| LSV Asset Management |
| William Blair & Company, L.L.C. |
Small Cap II Fund |
| AQR Capital Management, LLC |
| Arrowpoint Asset Management LLC |
| EAM Investors, LLC |
| Falcon Point Capital, LLC |
| LMCG Investments, LLC |
| Mesirow Financial Investment Management, Inc. |
| Snow Capital Management, L.P. |
Small/Mid Cap Equity Fund |
| AllianceBernstein L.P. |
| AQR Capital Management, LLC |
| Arrowpoint Asset Management, LLC |
| Axiom International Investors, LLC |
| Boston Partners Global Investors Inc. |
| Castle Ark Management, LLC |
| Falcon Point Capital, LLC |
| Integrity Asset Management |
| LMCG Investments, LLC |
| LSV Asset Management |
| Victory Capital Management Inc. |
U.S. Managed Volatility Fund |
| AJO, L.P. |
| Analytic Investors, LLC |
| LSV Asset Management |
Global Managed Volatility Fund |
| Acadian Asset Management LLC |
| Analytic Investors, LLC |
| LSV Asset Management |
World Equity Ex-US Fund |
| Acadian Asset Management LLC |
| Bailie Gifford Overseas Ltd |
| BlackRock International, Ltd. |
| EARNEST Partners LLC |
| J O Hambro Capital Management Limited |
| McKinley Capital Management, LLC |
| NFJ Investment Group LLC |
Screened World Equity Ex-US Fund |
| Acadian Asset Management LLC |
| Baillie Gifford Overseas, Ltd. |
| EARNEST Partners LLC |
| McKinley Capital Management, LLC |
Emerging Markets Equity Fund |
| AllianceBernstein L.P. |
| Causeway Capital Management LLC |
| J O Hambro Capital Management Limited |
| KBI Global Investors (North America) Ltd. |
| RWC Asset Advisor (US) LLC |
| WCM Investment Management |
Opportunistic Income Fund |
| Ares Management, LLC |
| Declaration Management & Research, LLC |
| Schroder Investment Management North America Inc. |
| Wellington Management Company, LLP |
Core Fixed Income Fund |
| Jennison Associates LLC |
| Metropolitan West Asset Management, LLC |
| Wells Capital Management, Incorporated |
| Western Asset Management Company |
| Western Asset Management Company Limited |
High Yield Bond Fund |
| Ares Management, LLC |
| Benefit Street Partners, LLC |
| Brigade Capital Management, LP |
| J.P. Morgan Investment Management, Inc. |
Long Duration Fund |
| Income Research & Management |
| Jennison Associates LLC |
| Legal & General Investment Management America, Inc. |
| Metropolitan West Asset Management LLC |
Long Duration Credit Fund |
| Income Research & Management |
| Jennison Associates LLC |
| Legal & General Investment Management America, Inc. |
| Logan Circle Partners, L.P. |
| Metropolitan West Asset Management LLC |
Ultra Short Duration Bond Fund |
| Logan Circle Partners, L.P. |
| Wellington Management Company, LLP |
Emerging Markets Debt Fund |
| Investec Asset Management Ltd. |
| Neuberger Berman Investment Advisers, LLC |
| Stone Harbor Investment Partners, L.P. |
Limited Duration Bond Fund |
| Logan Circle Partners, L.P. |
| Metropolitan West Asset Management LLC |
Intermediate Duration Credit Fund |
| Income Research & Management |
| Legal & General Investment Management America Inc. |
| Logan Circle Partners, L.P. |
Dynamic Asset Allocation Fund |
| SSgA Funds Management, Inc. |
Multi-Asset Real Return Fund |
| AllianceBernstein L.P. |
| QS Investors, LLC |
SEI Investments Distribution Co. (the “Distributor”), a wholly owned subsidiary of SEI Investments Company (“SEI”), serves as each Fund’s Distributor pursuant to a Distribution Agreement with the Trust.
Other — The Distribution Agreement between the Distributor and the Trust provides that the Distributor may receive compensation on fund transactions
| 278 | SEI Institutional Investments Trust / Semi-Annual Report / November 30, 2016 |
effected for the Trust in accordance with Securities and Exchange Commission (“SEC”) rules. Accordingly, it is expected that fund transactions may result in brokerage commissions being paid to the Distributor. The SEC rules require that such commissions not exceed usual and customary commissions.
Such commissions for the period ended November 30, 2016, were as follows ($ Thousands):
| Large Cap Fund | $ | 3 | ||
| Large Cap Disciplined Equity Fund | 4 | |||
| Small Cap Fund | 15 | |||
| Small Cap II Fund | 21 | |||
| Small/Mid Cap Equity Fund | 1 | |||
| World Equity Ex-US Fund | 31 |
Payments to Affiliates — Certain officers and/or trustees of the Trust are also officers and/or Directors of the Distributor, the Adviser and/or the Administrator. The Trust pays each unaffiliated Trustee an annual fee for attendance at quarterly and interim meetings. Compensation of officers and affiliated Trustees of the Trust is paid by the Distributor or Administrator.
A portion of the services provided by the Chief Compliance Officer (“CCO”) and his staff, whom are employees of the Administrator, are paid for by the Trust as incurred. The services include regulatory oversight of the Trust’s Adviser, sub-advisers and service providers as required by SEC regulations.
LSV Asset Management (partially-owned subsidiary of SIMC) serves as a sub-adviser to the Large Cap, Small Cap, Small/Mid Cap Equity, U.S. Managed Volatility, Global Managed Volatility and Intermediate Duration Credit Funds. For this service, LSV Asset Management is entitled to receive a fee from SIMC. Such fees for the period ended November 30, 2016, were as follows ($ Thousands):
| Large Cap Fund | $ | 284 | ||
| Small Cap Fund | 210 | |||
| Small/Mid Cap Equity Fund | 534 | |||
| Global Managed Volatility Fund | 685 | |||
| U.S. Managed Volatility Fund | 1,085 |
Fees Paid Indirectly — The Funds may direct certain fund trades to the Distributor who pays a portion of each Fund’s expenses. Accordingly, the expenses reduced, which were used to pay third party expenses, can be found on the Statements of Operations or Consolidated Statement of Operations and the effect on each Fund’s expense ratio, as a percentage of each Fund’s average daily net assets for the period ended November 30, 2016, can be found on the Financial Highlights or Consolidated Financial Highlights.
Investment in Affiliated Security —The Funds may invest in the SEI Daily Income Trust (“SDIT”) Government
Fund, an affiliated money market fund to manage excess cash or to serve as margin or collateral for derivative positions. Additionally, the Funds may invest the cash collateral from the securities lending program in the SEI Liquidity Fund, L.P.
The following is a summary of the transactions with affiliates for the period ended November 30, 2016 ($ Thousands):
| SEI Liquidity Fund, L.P. | Purchases at Cost | Proceeds from Sales | Value 11/30/2016 | Dividend Income | ||||||||||||
Large Cap Fund | $ | 37,502 | $ | (58,800 | ) | $ | 19,234 | $ | 157 | |||||||
Large Cap Disciplined Equity Fund | 48,414 | (52,032 | ) | 20,865 | 284 | |||||||||||
Large Cap Index Fund | 23,864 | (26,284 | ) | 18,470 | 190 | |||||||||||
S&P 500 Index Fund | 37,800 | (46,699 | ) | 17,633 | 97 | |||||||||||
Extended Market Index Fund | 47,092 | (32,487 | ) | 57,203 | 609 | |||||||||||
Small Cap Fund | 18,565 | (14,512 | ) | 26,280 | 200 | |||||||||||
Small Cap II Fund | 35,753 | (26,104 | ) | 43,486 | 198 | |||||||||||
Small/Mid Cap Equity Fund | 47,536 | (80,560 | ) | 119,961 | 640 | |||||||||||
World Equity Ex-US Fund | 254,026 | (303,231 | ) | 313,007 | 2,082 | |||||||||||
| SEI Daily Income Trust, Prime Obligation Fund | Purchases at Cost | Proceeds from Sales | Value 11/30/2016 | Dividend Income | ||||||||||||
Large Cap Fund | $ | 4,208 | $ | (66,335 | ) | $ | — | $ | 1 | |||||||
Large Cap Diversified Alpha Fund | 185 | (3,753 | ) | — | — | |||||||||||
Large Cap Disciplined Equity Fund | 6,199 | (158,111 | ) | — | 1 | |||||||||||
Large Cap Index Fund | 37,540 | (77,113 | ) | — | — | |||||||||||
S&P 500 Index Fund | 37,945 | (98,843 | ) | — | 1 | |||||||||||
Extended Market Index Fund | 3,844 | (18,423 | ) | — | — | |||||||||||
Small Cap Fund | 4,813 | (31,706 | ) | — | — | |||||||||||
Small Cap II Fund | 4,092 | (25,161 | ) | — | — | |||||||||||
Small/Mid Cap Equity Fund | 4,052 | (82,877 | ) | — | — | |||||||||||
U.S. Managed Volatility Fund | 6,912 | (10,506 | ) | — | — | |||||||||||
Global Managed Volatility Fund | 9,725 | (64,223 | ) | — | 7 | |||||||||||
World Equity Ex-US Fund | 129,125 | (326,340 | ) | — | 23 | |||||||||||
Screened World Equity Ex- US Fund | 62 | (2,146 | ) | — | — | |||||||||||
Emerging Markets Equity Fund | 11,321 | (14,215 | ) | — | 1 | |||||||||||
Opportunistic Income Fund | 59,855 | (127,428 | ) | — | 13 | |||||||||||
Core Fixed Income Fund | 291,198 | (360,370 | ) | — | 22 | |||||||||||
High Yield Bond Fund | 54,672 | (175,341 | ) | — | 18 | |||||||||||
Long Duration Fund | 56,059 | (93,419 | ) | — | 7 | |||||||||||
Long Duration Credit Fund | 79,279 | (121,140 | ) | — | 33 | |||||||||||
Ultra Short Duration Bond Fund | 21,176 | (23,144 | ) | — | — | |||||||||||
Limited Duration Bond Fund | 96,532 | (103,043 | ) | — | 4 | |||||||||||
Intermediate Duration Credit Fund | 38,845 | (82,259 | ) | — | 6 | |||||||||||
| SEI Common Stock | Purchases at Cost | Proceeds from Sales | Value 11/30/2016 | Dividend Income | ||||||||||||
Large Cap Index Fund | $ | 60 | $ | — | $ | 615 | $ | 3 | ||||||||
Extended Market Index Fund | 221 | (225 | ) | 1,138 | 7 | |||||||||||
| SEI Institutional Investments Trust / Semi-Annual Report / November 30, 2016 | 279 |
NOTES TO FINANCIAL STATEMENTS/CONSOLIDATED NOTES TO FINANCIAL STATEMENTS (Unaudited) (Continued)
November 30, 2016
SEI Daily Income Trust, Government Fund | Purchases at Cost | Proceeds from Sales | Value 11/30/2016 | Dividend Income | ||||||||||||
Large Cap Fund | $ | 394,766 | $ | (326,829 | ) | $ | 67,937 | $ | 65 | |||||||
Large Cap Diversified Alpha Fund | 13,044 | (10,182 | ) | 2,862 | 3 | |||||||||||
Large Cap Disciplined Equity Fund | 616,047 | (450,638 | ) | 165,409 | 147 | |||||||||||
Large Cap Index Fund | 232,405 | (204,299 | ) | 28,106 | 45 | |||||||||||
S&P 500 Index Fund | 326,246 | (251,903 | ) | 74,343 | 71 | |||||||||||
Extended Market Index Fund | 115,268 | (91,891 | ) | 23,377 | 22 | |||||||||||
Small Cap Fund | 134,226 | (112,808 | ) | 21,418 | 20 | |||||||||||
Small Cap II Fund | 114,633 | (90,279 | ) | 24,354 | 20 | |||||||||||
Small/Mid Cap Equity Fund | 372,429 | (306,991 | ) | 65,438 | 65 | |||||||||||
U.S. Managed Volatility Fund | 145,348 | (126,231 | ) | 19,117 | 27 | |||||||||||
Global Managed Volatility Fund | 120,446 | (79,784 | ) | 40,662 | 39 | |||||||||||
World Equity Ex-US Fund | 542,853 | (469,271 | ) | 73,582 | 128 | |||||||||||
Screened World Equity Ex- US Fund | 6,380 | (4,031 | ) | 2,349 | 1 | |||||||||||
Emerging Markets Equity Fund | 73,344 | (69,378 | ) | 3,966 | 6 | |||||||||||
Opportunistic Income Fund | 452,293 | (360,752 | ) | 91,541 | 61 | |||||||||||
Core Fixed Income Fund | 1,799,805 | (1,571,999 | ) | 227,806 | 129 | |||||||||||
High Yield Bond Fund | 660,639 | (580,684 | ) | 79,955 | 109 | |||||||||||
Long Duration Fund | 354,680 | (345,325 | ) | 9,355 | 21 | |||||||||||
Long Duration Credit Fund | 374,467 | (348,871 | ) | 25,596 | 6 | |||||||||||
Ultra Short Duration Bond Fund | 100,005 | (98,814 | ) | 1,191 | 3 | |||||||||||
Limited Duration Bond Fund | 299,683 | (286,495 | ) | 13,188 | 12 | |||||||||||
Intermediate Duration Credit Fund | 272,570 | (252,022 | ) | 20,548 | 23 | |||||||||||
Interfund Lending — The SEC has granted an exemption that permits the Trust to participate in an interfund lending program (“The Program”) with existing or future investment companies registered under the 1940 Act that are advised by SIMC (the “SEI Funds”). The Program allows the SEI Funds to lend money to and borrow money from each other for temporary or emergency purposes. Participation in The Program is voluntary for both borrowing and lending funds. Interfund loans may be made only when the rate of interest to be charged is more favorable to the lending fund than an investment in overnight repurchase agreements (“Repo Rate”), and more favorable to the borrowing fund than the rate of interest that would be charged by a bank for short-term borrowings (“Bank Loan Rate”). The Bank Loan Rate will be determined using a formula annually reviewed by the SEI Funds’ Board of Trustees. The interest rate imposed on inter fund loans is the average of the Repo Rate and the Bank Loan Rate.
During and at the period ended November 30, 2016, the Trust did not borrow funds from SEI Institutional Managed Trust, Multi-Asset Accumulation Fund.
At November 30, 2016, the Trust had no outstanding borrowings.
7. CAPITAL SHARE TRANSACTIONS
Capital share transactions for the Funds were as follows (Thousands):
| Large Cap Fund | Large Cap Diversified Alpha Fund | Large Cap Disciplined Equity Fund | Large Cap Index Fund | |||||||||||||||||||||||||||||
6/1/2016 to 11/30/2016 (Unaudited) | 6/1/2015 to 5/31/2016 | 6/1/2016 to 11/30/2016 (Unaudited) | 6/1/2015 to 5/31/2016 | 6/1/2016 to 11/30/2016 (Unaudited) | 6/1/2015 to 5/31/2016 | 6/1/2016 to 11/30/2016 (Unaudited) | 6/1/2015 to 5/31/2016 | |||||||||||||||||||||||||
Class A: | ||||||||||||||||||||||||||||||||
Shares Issued | 4,522 | 18,834 | 399 | 1,634 | 14,959 | 27,859 | 1,176 | 3,582 | ||||||||||||||||||||||||
Shares Issued in Lieu of Dividends and Distributions | 750 | 17,001 | — | 1,579 | 2,119 | 40,864 | 117 | 695 | ||||||||||||||||||||||||
Shares Redeemed | (15,284 | ) | (28,840 | ) | (623 | ) | (1,459 | ) | (33,603 | ) | (74,856 | ) | (1,070 | ) | (3,055 | ) | ||||||||||||||||
Total Increase (Decrease) in Net Assets Derived from | (10,012 | ) | 6,995 | (224 | ) | 1,754 | (16,525 | ) | (6,133 | ) | 223 | 1,222 | ||||||||||||||||||||
S&P 500 Index Fund | Extended Market Index Fund | Small Cap Fund | Small Cap II Fund | |||||||||||||||||||||||||||||
6/1/2016 to 11/30/2016 (Unaudited) | 6/1/2015 to 5/31/2016 | 6/1/2016 to 11/30/2016 (Unaudited) | 6/1/2015 to 5/31/2016 | 6/1/2016 to 11/30/2016 (Unaudited) | 6/1/2015 to 5/31/2016 | 6/1/2016 to 11/30/2016 (Unaudited) | 6/1/2015 to 5/31/2016 | |||||||||||||||||||||||||
Class A: | ||||||||||||||||||||||||||||||||
Shares Issued | 24,024 | 66,483 | 8,652 | 15,048 | 1,154 | 2,905 | 2,264 | 20,766 | ||||||||||||||||||||||||
Shares Issued in Lieu of Dividends and Distributions | 2,645 | 6,627 | 396 | 2,678 | 110 | 3,466 | 135 | 2,823 | ||||||||||||||||||||||||
Shares Redeemed | (17,816 | ) | (54,692 | ) | (5,621 | ) | (13,492 | ) | (2,814 | ) | (10,827 | ) | (4,492 | ) | (11,555 | ) | ||||||||||||||||
Total Increase (Decrease) in Net Assets Derived from | 8,853 | 18,418 | 3,427 | 4,234 | (1,550 | ) | (4,456 | ) | (2,093 | ) | 12,034 | |||||||||||||||||||||
| 280 | SEI Institutional Investments Trust / Semi-Annual Report / November 30, 2016 |
Small/Mid Cap Equity Fund | U.S. Managed Volatility Fund | Global Managed Volatility Fund(1) | World Equity Ex-US Fund | |||||||||||||||||||||||||||||
6/1/2016 to 11/30/2016 (Unaudited) | 6/1/2015 to 5/31/2016 | 6/1/2016 to 11/30/2016 (Unaudited) | 6/1/2015 to 5/31/2016 | 6/1/2016 to 11/30/2016 (Unaudited) | 1/29/2016 to 5/31/2016 | 6/1/2016 to 11/30/2016 (Unaudited) | 6/1/2015 to 5/31/2016 | |||||||||||||||||||||||||
Class A: | ||||||||||||||||||||||||||||||||
Shares Issued | 7,271 | 13,939 | 7,958 | 43,538 | 12,478 | 121,441 | 52,111 | 129,197 | ||||||||||||||||||||||||
Shares Issued in Lieu of Dividends and Distributions | 464 | 20,663 | 1,193 | 9,956 | — | — | — | 15,224 | ||||||||||||||||||||||||
Shares Redeemed | (13,098 | ) | (22,342 | ) | (15,856 | ) | (40,619 | ) | (14,968 | ) | (23,034 | ) | (46,955 | ) | (106,454 | ) | ||||||||||||||||
Total Increase (Decrease) in Net Assets Derived from | (5,363 | ) | 12,260 | (6,705 | ) | 12,875 | (2,490 | ) | 98,407 | 5,156 | 37,967 | |||||||||||||||||||||
Screened World Equity Ex-US Fund | Emerging Markets Equity Fund | Opportunistic Income Fund | ||||||||||||||||||||||||||||||
6/1/2016 to 11/30/2016 (Unaudited) | 6/1/2015 to 5/31/2016 | 6/1/2016 to 11/30/2016 (Unaudited) | 6/1/2015 to 5/31/2016 | 6/1/2016 to 11/30/2016 (Unaudited) | 6/1/2015 to 5/31/2016 | |||||||||||||||||||||||||||
Class A: | ||||||||||||||||||||||||||||||||
Shares Issued | 567 | 1,581 | 14,350 | 58,292 | 18,830 | 41,392 | ||||||||||||||||||||||||||
Shares Issued in Lieu of Dividends and Distributions | — | 129 | — | 1,545 | 3,395 | 6,774 | ||||||||||||||||||||||||||
Shares Redeemed | (445 | ) | (775 | ) | (7,692 | ) | (10,369 | ) | (15,851 | ) | (48,311 | ) | ||||||||||||||||||||
Total Increase (Decrease) in Net Assets Derived from | 122 | 935 | 6,658 | 49,468 | 6,374 | (145 | ) | |||||||||||||||||||||||||
Core Fixed Income Fund | High Yield Bond Fund | Long Duration Fund | Long Duration Credit Fund | |||||||||||||||||||||||||||||
6/1/2016 to 11/30/2016 (Unaudited) | 6/1/2015 to 5/31/2016 | 6/1/2016 to 11/30/2016 (Unaudited) | 6/1/2015 to 5/31/2016 | 6/1/2016 to 11/30/2016 (Unaudited) | 6/1/2015 to 5/31/2016 | 6/1/2016 to 11/30/2016 (Unaudited) | 6/1/2015 to 5/31/2016 | |||||||||||||||||||||||||
Class A: | ||||||||||||||||||||||||||||||||
Shares Issued | 89,351 | 100,693 | (2) | 29,673 | 75,177 | 10,893 | 53,155 | 783 | 34,900 | (2) | ||||||||||||||||||||||
Shares Issued in Lieu of Dividends and Distributions | 6,621 | 23,419 | 10,185 | 20,813 | 5,747 | 28,777 | 5,999 | 20,357 | ||||||||||||||||||||||||
Shares Redeemed | (66,703 | ) | (147,078 | ) | (28,440 | ) | (54,082 | ) | (39,329 | ) | (137,160 | )(3) | (16,559 | ) | (70,602 | ) | ||||||||||||||||
Total Increase (Decrease) in Net Assets Derived from | 29,269 | (22,966 | ) | 11,418 | 41,908 | (22,689 | ) | (55,228 | ) | (9,777 | ) | (15,345 | ) | |||||||||||||||||||
Ultra Short Duration Bond Fund | Emerging Markets Debt Fund | Real Return Fund | Limited Duration Bond Fund | |||||||||||||||||||||||||||||
6/1/2016 to 11/30/2016 (Unaudited) | 6/1/2015 to 5/31/2016 | 6/1/2016 to 11/30/2016 (Unaudited) | 6/1/2015 to 5/31/2016 | 6/1/2016 to 11/30/2016 (Unaudited) | 6/1/2015 to 5/31/2016 | 6/1/2016 to 11/30/2016 (Unaudited) | 6/1/2015 to 5/31/2016 | |||||||||||||||||||||||||
Class A: | ||||||||||||||||||||||||||||||||
Shares Issued | 9,730 | 26,044 | 13,375 | 50,673 | 1,644 | 9,101 | 19,957 | 68,270 | ||||||||||||||||||||||||
Shares Issued in Lieu of Dividends and Distributions | 362 | 830 | 455 | 1,782 | 99 | — | 811 | 1,225 | ||||||||||||||||||||||||
Shares Redeemed | (10,275 | ) | (37,724 | ) | (16,378 | ) | (36,683 | ) | (1,911 | ) | (17,250 | ) | (13,802 | ) | (20,891 | ) | ||||||||||||||||
Total Increase (Decrease) in Net Assets Derived from | (183 | ) | (10,850 | ) | (2,548 | ) | 15,772 | (168 | ) | (8,149 | ) | 6,966 | 48,604 | |||||||||||||||||||
Intermediate Duration Credit Fund | Dynamic Asset Allocation Fund | Multi-Asset Real Return Fund | ||||||||||||||||||||||||||||||
6/1/2016 to 11/30/2016 (Unaudited) | 6/1/2015 to 5/31/2016 | 6/1/2016 to 11/30/2016 (Unaudited) | 6/1/2015 to 5/31/2016 | 6/1/2016 to 11/30/2016 (Unaudited) | 6/1/2015 to 5/31/2016 | |||||||||||||||||||||||||||
Class A: | ||||||||||||||||||||||||||||||||
Shares Issued | 4,435 | 32,843 | 9,183 | 28,244 | 5,723 | 23,380 | ||||||||||||||||||||||||||
Shares Issued in Lieu of Dividends and Distributions | 1,581 | 4,152 | — | 7,787 | — | 818 | ||||||||||||||||||||||||||
Shares Redeemed | (4,081 | ) | (55,237 | ) | (10,762 | ) | (22,164 | ) | (5,844 | ) | (20,202 | ) | ||||||||||||||||||||
Total Increase (Decrease) in Net Assets Derived from | 1,935 | (18,242 | ) | (1,579 | ) | 13,867 | (121 | ) | 3,996 | |||||||||||||||||||||||
| (1) | Fund commenced operations on January 29, 2016. |
| (2) | Includes subscriptions as a result of an in-kind transfer of securities (see Note 11). |
| (3) | Includes redemptions as a result of an in-kind transfer of securities (see Note 11). |
| SEI Institutional Investments Trust / Semi-Annual Report / November 30, 2016 | 281 |
NOTES TO FINANCIAL STATEMENTS/CONSOLIDATED NOTES TO FINANCIAL STATEMENTS (Unaudited) (Continued)
November 30, 2016
8. INVESTMENT TRANSACTIONS
The cost of security purchases and proceeds from the sale and maturities of securities other than temporary cash investments, during the period ended November 30, 2016, were as follows:
U.S. Gov’t ($ Thousands) | Other ($ Thousands) | Total ($ Thousands) | ||||||||||
Large Cap Fund | ||||||||||||
Purchases | $ | — | $ | 592,526 | $ | 592,526 | ||||||
Sales | — | 787,736 | 787,736 | |||||||||
Large Cap Diversified Alpha Fund |
| |||||||||||
Purchases | — | 16,232 | 16,232 | |||||||||
Sales | — | 17,373 | 17,373 | |||||||||
Large Cap Disciplined Equity Fund |
| |||||||||||
Purchases | — | 1,665,807 | 1,665,807 | |||||||||
Sales | — | 1,842,724 | 1,842,724 | |||||||||
Large Cap Index Fund | ||||||||||||
Purchases | — | 167,137 | 167,137 | |||||||||
Sales | — | 113,496 | 113,496 | |||||||||
S&P 500 Index Fund | ||||||||||||
Purchases | — | 190,405 | 190,405 | |||||||||
Sales | — | 99,260 | 99,260 | |||||||||
Extended Market Index Fund | ||||||||||||
Purchases | — | 123,453 | 123,453 | |||||||||
Sales | — | 82,203 | 82,203 | |||||||||
Small Cap Fund | ||||||||||||
Purchases | — | 273,749 | 273,749 | |||||||||
Sales | — | 286,838 | 286,838 | |||||||||
Small Cap II Fund | ||||||||||||
Purchases | — | 259,560 | 259,560 | |||||||||
Sales | — | 284,609 | 284,609 | |||||||||
Small/Mid Cap Equity Fund | ||||||||||||
Purchases | — | 687,151 | 687,151 | |||||||||
Sales | — | 755,399 | 755,399 | |||||||||
U.S. Managed Volatility Fund | ||||||||||||
Purchases | — | 303,615 | 303,615 | |||||||||
Sales | — | 410,386 | 410,386 | |||||||||
Global Managed Volatility Fund | ||||||||||||
Purchases | — | 243,692 | 243,692 | |||||||||
Sales | — | 215,734 | 215,734 | |||||||||
World Equity Ex-US Fund | ||||||||||||
Purchases | — | 2,213,150 | 2,213,150 | |||||||||
Sales | — | 1,984,330 | 1,984,330 | |||||||||
Screened World Equity Ex-US Fund | ||||||||||||
Purchases | — | 24,466 | 24,466 | |||||||||
Sales | — | 22,205 | 22,205 | |||||||||
Emerging Markets Equity Fund | ||||||||||||
Purchases | — | 486,757 | 486,757 | |||||||||
Sales | — | 404,688 | 404,688 | |||||||||
Opportunistic Income Fund | ||||||||||||
Purchases | 50,334 | 191,441 | 241,775 | |||||||||
Sales | 47,689 | 270,568 | 318,257 | |||||||||
Core Fixed Income Fund | ||||||||||||
Purchases | 7,855,575 | 992,201 | 8,847,776 | |||||||||
Sales | 7,445,593 | 996,847 | 8,442,776 | |||||||||
High Yield Bond Fund | ||||||||||||
Purchases | — | 858,740 | 858,740 | |||||||||
Sales | — | 715,235 | 715,235 | |||||||||
U.S. Gov’t ($ Thousands) | Other ($ Thousands) | Total ($ Thousands) | ||||||||||
Long Duration Fund | ||||||||||||
Purchases | 633,903 | 222,819 | 856,722 | |||||||||
Sales | 588,293 | 411,066 | 999,359 | |||||||||
Long Duration Credit Fund | ||||||||||||
Purchases | 470,450 | 508,163 | 978,613 | |||||||||
Sales | 499,620 | 564,404 | 1,064,024 | |||||||||
Ultra Short Duration Bond Fund | ||||||||||||
Purchases | 97,967 | 63,016 | 160,983 | |||||||||
Sales | 104,356 | 77,667 | 182,023 | |||||||||
Emerging Markets Debt Fund | ||||||||||||
Purchases | 146,012 | 639,860 | 785,872 | |||||||||
Sales | 93,126 | 685,420 | 778,546 | |||||||||
Real Return Fund | ||||||||||||
Purchases | 20,106 | — | 20,106 | |||||||||
Sales | 32,127 | — | 32,127 | |||||||||
Limited Duration Bond Fund | ||||||||||||
Purchases | 290,400 | 194,976 | 485,376 | |||||||||
Sales | 261,758 | 114,749 | 376,507 | |||||||||
Intermediate Duration Credit Fund | ||||||||||||
Purchases | 553,384 | 467,948 | 1,021,332 | |||||||||
Sales | 563,096 | 424,401 | 987,497 | |||||||||
Dynamic Asset Allocation Fund | ||||||||||||
Purchases | — | 86,282 | 86,282 | |||||||||
Sales | — | 88,140 | 88,140 | |||||||||
Multi-Asset Real Return Fund | ||||||||||||
Purchases | 122,153 | 55,179 | 177,332 | |||||||||
Sales | 145,915 | 68,687 | 214,602 | |||||||||
9. FEDERAL TAX INFORMATION
It is each Fund’s intention to qualify for or continue to qualify as a regulated investment company under Subchapter M of the Internal Revenue Code and distribute all of its taxable income (including net capital gains). Accordingly, no provision for Federal income taxes is required.
The Dynamic Asset Allocation and Multi-Asset Real Return Funds have each requested private letter rulings from the Internal Revenue Service (“IRS”) concluding that the income generated from their investment in their respective Subsidiaries, each of which invests in commodity-linked derivatives, will be “qualifying income” for regulated investment company (“RIC”) qualification purposes, regardless of whether actual distributions are made to the Funds by the respective Subsidiary.
In July 2011, the IRS suspended the issuance of private letter rulings regarding the investment by RICs into controlled foreign corporations which principally invest in commodities, such as the Subsidiaries, indicating that it was reconsidering its policies surrounding the issuance of these rulings. The IRS subsequently stated that it intends to issue public guidance regarding the use of controlled foreign corporations by RICs to indirectly invest in commodities. It is unclear whether this guidance will continue to permit or somehow restrict the distributions from controlled foreign corporations
| 282 | SEI Institutional Investments Trust / Semi-Annual Report / November 30, 2016 |
to be treated as “qualifying income” for purposes of the RIC qualification rules. As a result, there can be no assurance that the IRS will grant the private letter ruling requested by the Funds. While the private letter ruling request is pending with the IRS, the Dynamic Asset Allocation and Multi-Asset Real Return Funds have secured an opinion of counsel based on customary representations that actual distributions made to the Funds should be treated as “qualifying income.” If the IRS does issue public guidance that results in an adverse determination relating to the treatment of income and gain to the Funds from controlled foreign corporations such as the Subsidiaries, the Funds would likely need to significantly change their investment strategies, which could adversely affect such Funds.
Dividends from net investment income and distributions from net realized capital gains are determined in accordance with U.S. Federal income tax regulations, which may differ from those amounts determined under U.S. GAAP. These book/tax differences are either temporary or permanent in nature. To the extent these differences are permanent, they are charged or credited to paid-in capital, undistributed net investment income or accumulated net realized gain, as appropriate, in the period that the differences arise.
The tax character of dividends and distributions paid during the last two years or periods ended May 31, 2016 were as follows:
| Ordinary Income ($ Thousands) | Long-term Capital Gain ($ Thousands) | Return of Capital ($ Thousands) | Total ($ Thousands) | |||||||||||||||||
Large Cap Fund | ||||||||||||||||||||
| 2016 | $ | 35,569 | $ | 292,539 | $ | — | $ | 328,108 | ||||||||||||
| 2015 | 59,060 | 186,918 | — | 245,978 | ||||||||||||||||
Large Cap Diversified Alpha Fund | ||||||||||||||||||||
| 2016 | 2,805 | 18,406 | 365 | 21,576 | ||||||||||||||||
| 2015 | 1,987 | 2,247 | — | 4,234 | ||||||||||||||||
Large Cap Disciplined Equity Fund | ||||||||||||||||||||
| 2016 | 159,971 | 348,292 | — | 508,263 | ||||||||||||||||
| 2015 | 123,271 | 508,968 | — | 632,239 | ||||||||||||||||
Large Cap Index Fund | ||||||||||||||||||||
| 2016 | 40,817 | 67,747 | — | 108,564 | ||||||||||||||||
| 2015 | 43,351 | 106,205 | — | 149,556 | ||||||||||||||||
S&P 500 Index Fund | ||||||||||||||||||||
| 2016 | 70,828 | 4,237 | — | 75,065 | ||||||||||||||||
| 2015 | 32,451 | 1,115 | — | 33,566 | ||||||||||||||||
Extended Market Index Fund | ||||||||||||||||||||
| 2016 | 13,527 | 18,708 | — | 32,235 | ||||||||||||||||
| 2015 | 17,020 | 4,377 | — | 21,397 | ||||||||||||||||
Small Cap Fund | ||||||||||||||||||||
| 2016 | 8,250 | 54,149 | — | 62,399 | ||||||||||||||||
| 2015 | 4,749 | 17,304 | — | 22,053 | ||||||||||||||||
Small Cap II Fund | ||||||||||||||||||||
| 2016 | 5,957 | 25,875 | — | 31,832 | ||||||||||||||||
| 2015 | 5,493 | 18,511 | — | 24,004 | ||||||||||||||||
| SEI Institutional Investments Trust / Semi-Annual Report / November 30, 2016 | 283 |
NOTES TO FINANCIAL STATEMENTS/CONSOLIDATED NOTES TO FINANCIAL STATEMENTS (Unaudited) (Continued)
November 30, 2016
| Ordinary Income ($ Thousands) | Long-term Capital Gain ($ Thousands) | Return of Capital ($ Thousands) | Total ($ Thousands) | |||||||||||||||||
Small/Mid Cap Equity Fund | ||||||||||||||||||||
| 2016 | $ | 32,327 | $ | 210,982 | $ | — | $ | 243,309 | ||||||||||||
| 2015 | 56,049 | 206,547 | — | 262,596 | ||||||||||||||||
U.S. Managed Volatility Fund | ||||||||||||||||||||
| 2016 | 47,909 | 87,357 | — | 135,266 | ||||||||||||||||
| 2015 | 64,197 | 102,025 | — | 166,222 | ||||||||||||||||
Global Managed Volatility Fund | ||||||||||||||||||||
| 2016 | — | — | — | — | ||||||||||||||||
World Equity Ex-US Fund | ||||||||||||||||||||
| 2016 | 138,753 | 30,136 | — | 168,889 | ||||||||||||||||
| 2015 | 135,664 | 82,563 | — | 218,227 | ||||||||||||||||
Screened World Equity Ex-US Fund | ||||||||||||||||||||
| 2016 | 1,667 | — | — | 1,667 | ||||||||||||||||
| 2015 | 1,372 | — | — | 1,372 | ||||||||||||||||
Emerging Markets Equity Fund | ||||||||||||||||||||
| 2016 | 12,926 | — | — | 12,926 | ||||||||||||||||
| 2015 | 668 | — | — | 668 | ||||||||||||||||
Opportunistic Income Fund | ||||||||||||||||||||
| 2016 | 56,898 | — | — | 56,898 | ||||||||||||||||
| 2015 | 51,651 | — | — | 51,651 | ||||||||||||||||
Core Fixed Income Fund | ||||||||||||||||||||
| 2016 | 209,971 | 36,870 | — | 246,841 | ||||||||||||||||
| 2015 | 181,213 | — | — | 181,213 | ||||||||||||||||
High Yield Bond Fund | ||||||||||||||||||||
| 2016 | 181,482 | 54 | — | 181,536 | ||||||||||||||||
| 2015 | 148,070 | 39,852 | — | 187,922 | ||||||||||||||||
Long Duration Fund | ||||||||||||||||||||
| 2016 | 198,920 | 52,551 | — | 251,471 | ||||||||||||||||
| 2015 | 190,776 | 8,164 | — | 198,940 | ||||||||||||||||
Long Duration Credit Fund | ||||||||||||||||||||
| 2016 | 172,839 | 28,467 | — | 201,306 | ||||||||||||||||
| 2015 | 131,283 | — | — | 131,283 | ||||||||||||||||
Ultra Short Duration Bond Fund | ||||||||||||||||||||
| 2016 | 8,407 | — | — | 8,407 | ||||||||||||||||
| 2015 | 8,484 | — | — | 8,484 | ||||||||||||||||
Emerging Markets Debt Fund | ||||||||||||||||||||
| 2016 | 16,885 | — | — | 16,885 | ||||||||||||||||
| 2015 | 62,267 | — | — | 62,267 | ||||||||||||||||
Real Return Fund | ||||||||||||||||||||
| 2016 | — | — | — | — | ||||||||||||||||
| 2015 | 1,584 | — | — | 1,584 | ||||||||||||||||
Limited Duration Bond Fund | ||||||||||||||||||||
| 2016 | 12,469 | 11 | — | 12,480 | ||||||||||||||||
| 2015 | 2,937 | — | — | 2,937 | ||||||||||||||||
Intermediate Duration Credit Fund | ||||||||||||||||||||
| 2016 | 40,672 | — | — | 40,672 | ||||||||||||||||
| 2015 | 4,969 | — | 129 | 5,098 | ||||||||||||||||
Dynamic Asset Allocation Fund | ||||||||||||||||||||
| 2016 | 124,343 | 1,111 | — | 125,454 | ||||||||||||||||
| 2015 | 84,817 | — | — | 84,817 | ||||||||||||||||
Multi-Asset Real Return Fund | ||||||||||||||||||||
| 2016 | 7,020 | — | — | 7,020 | ||||||||||||||||
| 2015 | 12,380 | — | 2,378 | 14,758 | ||||||||||||||||
| 284 | SEI Institutional Investments Trust / Semi-Annual Report / November 30, 2016 |
As of May 31, 2016, the components of distributable earnings (accumulated losses) were as follows:
Undistributed Ordinary ($ Thousands) | Undistributed Capital Gain | Capital Loss Carryforwards ($ Thousands) | Post-October Losses ($ Thousands) | Late Year ($ Thousands) | Unrealized ($ Thousands) | Other Temporary Differences ($ Thousands) | Total Distributable Earnings (Accumulated Losses) ($ Thousands) | |||||||||||||||||||||||||
Large Cap Fund | $ | 4,109 | $ | 44,075 | $ | — | $ | — | $ | — | $ | 335,494 | $ | — | $ | 383,678 | ||||||||||||||||
Large Cap Diversified Alpha Fund | — | — | — | (1,033 | ) | — | 4,285 | (10 | ) | 3,242 | ||||||||||||||||||||||
Large Cap Disciplined Equity Fund | 5,323 | 26,555 | — | — | — | 451,316 | (3,843 | ) | 479,351 | |||||||||||||||||||||||
Large Cap Index Fund | 6,181 | 22,236 | — | — | — | 785,906 | (1,801 | ) | 812,522 | |||||||||||||||||||||||
S&P 500 Index Fund | 8,455 | — | (6,150 | ) | — | — | 156,023 | (3,017 | ) | 155,311 | ||||||||||||||||||||||
Extended Market Index Fund | 2,154 | 12,119 | — | — | — | 10,986 | (1,066 | ) | 24,193 | |||||||||||||||||||||||
Small Cap Fund | 422 | — | — | (7,949 | ) | — | 33,413 | (161 | ) | 25,725 | ||||||||||||||||||||||
Small Cap II Fund | 336 | — | — | (14,693 | ) | — | 25,613 | (468 | ) | 10,788 | ||||||||||||||||||||||
Small/Mid Cap Equity Fund | 5,857 | 22,060 | — | — | — | 153,043 | (378 | ) | 180,582 | |||||||||||||||||||||||
U.S. Managed Volatility Fund | 3,558 | 31,627 | — | — | — | 220,459 | (251 | ) | 255,393 | |||||||||||||||||||||||
Global Managed Volatility Fund | 9,693 | 1,193 | — | — | — | 65,964 | (1,202 | ) | 75,648 | |||||||||||||||||||||||
World Equity Ex-US Fund | 71,194 | — | (150,020 | ) | (189,602 | ) | — | 101,493 | (3,219 | ) | (170,154 | ) | ||||||||||||||||||||
Screened World Equity Ex-US Fund | 894 | — | (9,959 | ) | (1,588 | ) | — | (2,287 | ) | (18 | ) | (12,958 | ) | |||||||||||||||||||
Emerging Markets Equity Fund | 8,218 | — | (10,824 | ) | (27,354 | ) | — | (35,733 | ) | (5 | ) | (65,698 | ) | |||||||||||||||||||
Opportunistic Income Fund | 18,335 | — | (57,789 | ) | (8,121 | ) | — | (23,445 | ) | (731 | ) | (71,751 | ) | |||||||||||||||||||
Core Fixed Income Fund | 37,524 | — | — | — | — | 91,179 | (34,165 | ) | 94,538 | |||||||||||||||||||||||
High Yield Bond Fund | 31,342 | — | (71,296 | ) | — | — | (178,826 | ) | (15,365 | ) | (234,145 | ) | ||||||||||||||||||||
Long Duration Fund | 39,247 | 1,055 | — | — | — | 168,686 | (44,377 | ) | 164,611 | |||||||||||||||||||||||
Long Duration Credit Fund | 10,718 | — | (25,325 | ) | — | — | 95,798 | (11,381 | ) | 69,810 | ||||||||||||||||||||||
Ultra Short Duration Bond Fund | 674 | — | (3,390 | ) | — | — | (568 | ) | (748 | ) | (4,032 | ) | ||||||||||||||||||||
Emerging Markets Debt Fund | 2,695 | — | (45,790 | ) | — | — | (165,224 | ) | (13,593 | ) | (221,912 | ) | ||||||||||||||||||||
Real Return Fund | — | — | (4,248 | ) | — | (12 | ) | 470 | (441 | ) | (4,231 | ) | ||||||||||||||||||||
Limited Duration Bond Fund | 45 | — | — | (113 | ) | — | 1,322 | (27 | ) | 1,227 | ||||||||||||||||||||||
Intermediate Duration Credit Fund | 140 | — | (18,802 | ) | — | — | 8,041 | 37 | (10,584 | ) | ||||||||||||||||||||||
Dynamic Asset Allocation Fund | 2,654 | — | (8,196 | ) | (3,640 | ) | — | 486,888 | (12,514 | ) | 465,192 | |||||||||||||||||||||
Multi-Asset Real Return Fund | 874 | — | (18,037 | ) | — | — | (52,668 | ) | (857 | ) | (70,688 | ) | ||||||||||||||||||||
Post-October losses represent losses realized on investment transactions from November 1, 2015 through May 31, 2016 that, in accordance with Federal income tax regulations, the Funds may elect to defer and treat as having arisen in the following fiscal year.
For Federal income tax purposes, capital losses incurred in taxable years beginning before December 22, 2010 may be carried forward for a maximum period of eight years and applied against future net capital gains as follows:
| Expires 2017 ($ Thousands) | Expires 2018 ($ Thousands) | Expires 2019 ($ Thousands) | Total Capital Loss | |||||||||||||
Screened World Equity Ex-US Fund | $ | — | $ | 9,159 | $ | — | $ | 9,159 | ||||||||
Opportunistic Fund | 7,753 | 23,512 | 19,071 | 50,336 | ||||||||||||
Funds are permitted to carry forward capital losses incurred in taxable years beginning after December 22, 2010 for an unlimited period. However, any losses incurred during those future taxable years will be required to be utilized prior to the losses incurred in pre-enactment taxable years. As a result of this ordering rule, pre-enactment capital loss carryforwards may be more likely to expire unused. Additionally, post-enactment capital losses that are carried forward will retain their character as either short-term or long-term capital losses rather than being considered all short-term as under previous law. Losses carried forward under these new provisions are as follows:
| SEI Institutional Investments Trust / Semi-Annual Report / November 30, 2016 | 285 |
NOTES TO FINANCIAL STATEMENTS/CONSOLIDATED NOTES TO FINANCIAL STATEMENTS (Unaudited) (Continued)
November 30, 2016
| Short-Term Loss ($ Thousands) | Long-Term ($Thousands) | Total* ($ Thousands) | ||||||||||
S&P 500 Index Fund | $ | 6,150 | $ | — | $ | 6,150 | ||||||
World Equity Ex-US Fund | 125,183 | 24,837 | 150,020 | |||||||||
Screened World Equity Ex-US Fund | 800 | — | 800 | |||||||||
Emerging Markets Equity Fund | 10,824 | — | 10,824 | |||||||||
Opportunistic Income Fund | 2,582 | 4,871 | 7,453 | |||||||||
High Yield Bond Fund | 26,760 | 44,536 | 71,296 | |||||||||
Long Duration Credit Fund | 17,031 | 8,294 | 25,325 | |||||||||
Ultra Short Duration Bond Fund | 942 | 2,448 | 3,390 | |||||||||
Emerging Markets Debt Fund | 28,032 | 17,758 | 45,790 | |||||||||
Real Return | 724 | 3,524 | 4,248 | |||||||||
Intermediate Duration Credit Fund | 10,416 | 8,386 | 18,802 | |||||||||
Dynamic Asset Allocation Fund | 8,196 | — | 8,196 | |||||||||
Multi-Asset Real Return Fund | 16,470 | 1,567 | 18,037 | |||||||||
| * | This table should be used in conjunction with the capital loss carryforwards table. |
For Federal income tax purposes, the cost of securities owned at November 30, 2016, and the net realized gains or losses on securities sold for the period were not materially different from amounts reported for financial reporting purposes. These differences are primarily due to investments in partnerships, passive foreign investment companies, defaulted bond and wash sales which cannot be used for Federal income tax purposes in the current year and have been deferred for use in future years. The aggregate gross unrealized appreciation and depreciation on total investments held by the Funds at November 30, 2016, was as follows:
| Federal Tax Cost ($ Thousands) | Appreciated Securities ($ Thousands) | Depreciated Securities ($ Thousands) | Net (Depreciation) | |||||||||||||
Large Cap Fund | $ | 1,585,914 | $ | 445,284 | $ | (35,078 | ) | $ | 410,206 | |||||||
Large Cap Diversified Alpha Fund | 48,122 | 7,882 | (923 | ) | 6,959 | |||||||||||
Large Cap Disciplined Equity Fund | 3,060,223 | 584,739 | (31,337 | ) | 553,402 | |||||||||||
Large Cap Index Fund | 1,306,981 | 931,986 | (24,412 | ) | 907,574 | |||||||||||
S&P 500 Index Fund | 3,314,324 | 459,521 | (112,380 | ) | 347,141 | |||||||||||
Extended Market Index | ||||||||||||||||
Fund | 802,384 | 159,179 | (65,202 | ) | 93,977 | |||||||||||
Small Cap Fund | 483,276 | 93,687 | (16,899 | ) | 76,788 | |||||||||||
Small Cap II Fund | 454,366 | 76,609 | (11,981 | ) | 64,628 | |||||||||||
Small/Mid Cap Equity Fund | 1,550,730 | 348,195 | (48,927 | ) | 299,268 | |||||||||||
U.S. Managed Volatility Fund | 1,239,408 | 251,360 | (25,418 | ) | 225,942 | |||||||||||
Global Managed Volatility Fund | 1,005,190 | 85,838 | (36,699 | ) | 49,139 | |||||||||||
World Equity Ex-US Fund | 6,925,179 | 737,908 | (469,316 | ) | 268,592 | |||||||||||
Screened World Equity Ex-US Fund | 84,069 | 8,094 | (7,254 | ) | 840 | |||||||||||
Emerging Markets Equity Fund | 1,028,184 | 73,602 | (85,974 | ) | (12,372 | ) | ||||||||||
Opportunistic Income Fund | 2,226,523 | 18,695 | (26,966 | ) | (8,271 | ) | ||||||||||
Core Fixed Income Fund | 5,965,260 | 74,912 | (112,271 | ) | (37,359 | ) | ||||||||||
| Federal Tax Cost ($ Thousands) | Appreciated Securities ($ Thousands) | Depreciated Securities ($ Thousands) | Net Unrealized (Depreciation) | |||||||||||||
High Yield Bond Fund | $ | 2,852,337 | $ | 104,076 | $ | (118,864 | ) | $ | (14,788 | ) | ||||||
Long Duration Fund | 2,433,528 | 113,705 | (53,462 | ) | 60,243 | |||||||||||
Long Duration Credit Fund | 3,129,049 | 56,420 | (84,385 | ) | (27,965 | ) | ||||||||||
Ultra Short Duration Bond Fund | 546,517 | 1,389 | (1,159 | ) | 230 | |||||||||||
Emerging Markets Debt Fund | 2,009,262 | 22,865 | (199,107 | ) | (176,242 | ) | ||||||||||
Real Return Fund | 137,343 | 1,019 | (312 | ) | 707 | |||||||||||
Limited Duration Bond Fund | 1,196,651 | 1,312 | (5,192 | ) | (3,880 | ) | ||||||||||
Intermediate Duration Credit Fund | 1,449,947 | 6,674 | (28,571 | ) | (21,897 | ) | ||||||||||
Dynamic Asset Allocation Fund | 1,516,872 | 615,906 | (33,793 | ) | 582,113 | |||||||||||
Multi-Asset Real Return Fund | 823,853 | 28,664 | (8,988 | ) | 19,676 | |||||||||||
Management has analyzed the Funds’ tax positions taken on Federal income tax returns for all open tax years and has concluded that as of November 30, 2016, no provision for income tax would be required in the Funds’ financial statements. The Funds’ Federal and state income and Federal excise tax returns for tax years for which the applicable statutes of limitations have not expired are subject to examination by the Internal Revenue Service and state departments of revenue.
10. CONCENTRATION/RISKS
In the normal course of business, the Trust enters into contracts that provide general indemnifications by the Trust to the counterparty to the contract. The Trust’s maximum exposure under these arrangements is dependent on future claims that may be made against the Trust and, therefore, cannot be estimated; however, Management believes that, based on experience, the risk of loss from such claims is considered remote.
The market values of the Core Fixed Income, High Yield Bond, Long Duration, Long Duration Credit, Ultra Short Duration Bond, Limited Duration Bond, Intermediate Duration Credit and Multi-Asset Real Return Funds’ investments will change in response to interest rate changes and other factors. During periods of falling interest rates, the values of fixed income securities generally rise. Conversely, during periods of rising interest rates, the values of such securities generally decline. Changes by recognized rating agencies in the ratings of any fixed income security and in the ability of an issuer to make payments of interest and principal may also affect the value of these investments.
The World Equity Ex-US, Screened World Equity Ex-US, Emerging Markets Equity and Emerging Markets Debt Funds concentrate their investments in securities of
| 286 | SEI Institutional Investments Trust / Semi-Annual Report / November 30, 2016 |
foreign issuers in various countries. These investments may involve certain considerations and risks not typically associated with investments in the United States, as a result of, among other factors, the possibility of future political and economic developments and the level of governmental supervision and regulation of securities markets in the respective countries.
The following descriptions provide additional information about some of the risks of investing in the Funds:
Asset-Backed Securities Risk — Payment of principal and interest on asset-backed securities is dependent largely on the cash flows generated by the assets backing the securities, and asset-backed securities may not have the benefit of any security interest in the related assets.
Bank Loans Risk — With respect to bank loans, the Fund will assume the credit risk of both the borrower and the lender that is selling the participation. The Fund may also have difficulty disposing of bank loans because, in certain cases, the market for such instruments is not highly liquid.
Credit Risk — The risk that the issuer of a security or the counterparty to a contract will default or otherwise become unable to honor a financial obligation.
Currency Risk — To the extent a Fund takes positions in currencies, it will be subject to the risk that currency exchange rates may fluctuate in response to, among other things, changes in interest rates, intervention (or failure to intervene) by U.S. or foreign governments, central banks or supranational entities, or by the imposition of currency controls or other political developments in the United States or abroad.
Fixed Income Market Risk — The prices of a Fund’s fixed income securities respond to economic developments, particularly interest rate changes, as well as to perceptions about the creditworthiness of individual issuers, including governments and their agencies. Generally, the Fund’s fixed income securities will decrease in value if interest rates rise and vice versa. In the case of foreign securities, price fluctuations will reflect international economic and political events, as well as changes in currency valuations relative to the U.S. dollar.
Foreign Investment/Emerging Markets Risk — The risk that non-U.S. securities may be subject to additional risks due to, among other things, political, social and economic developments abroad, currency movements, and different legal, regulatory and tax environments. These additional risks may be heightened with respect to emerging market countries since political turmoil and
rapid changes in economic conditions are more likely to occur in these countries.
Interest Rate Risk — The risk that a rise in interest rates will cause a fall in the value of fixed income securities, including U.S. Government Securities, in which the Fund invests. Although U.S. Government securities are considered to be among the safest investments, they are not guaranteed against price movements due to changing interest rates. A low interest rate environment may present greater interest rate risk, because there may be a greater likelihood of rates increasing and rates may increase more rapidly.
Leverage Risk — Certain Fund transactions, such as derivatives or reverse repurchase agreements, may give rise to a form of leverage. The use of leverage can amplify the effects of market volatility on the Funds’ share price and make the Funds’ returns more volatile. This is because leverage tends to exaggerate the effect of any increase or decrease in the value of the Funds’ portfolio securities. The use of leverage may also cause the Funds to liquidate portfolio positions when it would not be advantageous to do so in order to satisfy its obligations.
Mortgage-Backed Securities Risk — Mortgage-backed securities are affected by, among other things, interest rate changes and the possibility of prepayment of the underlying mortgage loans. Mortgage-backed securities are also subject to the risk that underlying borrowers will be unable to meet their obligations.
Please refer to each Fund’s current prospectus for additional disclosure regarding the risks associated with investing in the Funds. The foregoing is not intended to be a complete discussion of the risks associated with the investment strategies of the Funds.
11. IN-KIND TRANSFERS OF SECURITIES
During the year ended May 31, 2016, the Core Fixed Income, Long Duration and Long Duration Credit Funds issued/(redeemed) shares of beneficial interest in exchange for securities. These securities were transferred at their current value on the date of such transactions.
| Shares Issued (Redeemed) ($ Thousands) | Value ($ Thousands) | Gain ($ Thousands) | ||||||||||
Core Fixed Income | ||||||||||||
12/31/2015 | $ | 6,509 | $ | 66,396 | $ | — | ||||||
Long Duration Fund | ||||||||||||
05/31/2016 | $ | (3,777 | ) | $ | (33,688 | ) | $ | 2,784 | ||||
Long Duration Credit Fund | ||||||||||||
05/31/2016 | $ | 3,309 | $ | 33,688 | $ | — | ||||||
| SEI Institutional Investments Trust / Semi-Annual Report / November 30, 2016 | 287 |
NOTES TO FINANCIAL STATEMENTS/CONSOLIDATED NOTES TO FINANCIAL STATEMENTS (Unaudited) (Concluded)
November 30, 2016
12. SECURITIES LENDING
To the extent consistent with its Investment Objective and Strategies, a Fund may lend portfolio securities to brokers, dealers and other financial organizations that meet capital and other credit requirements or other criteria established by the Trust’s Board of Trustees. These loans may not exceed 33 1/3% of the total asset value of the Fund including the loan collateral). No Fund will lend portfolio securities to its Adviser, sub-adviser or their affiliates unless it has applied for and received specific authority to do so from the SEC. Loans of portfolio securities will be fully collateralized by cash. Collateral will be maintained in an amount equal to at least 100% of the current market value of the loaned securities by marking-to-market daily, although the borrower will be required to deliver collateral between 102% and 105% of the market value of borrowed securities for domestic and foreign securities, respectively. However, due to market fluctuations during the day, the value of securities loaned on a particular day may, during the course of the day, exceed the value of collateral. On each business day, the amount of collateral is adjusted based on the prior day’s market fluctuations and the current day’s lending activity.
Income from lending activity is determined by the amount of interest earned on collateral, less any amounts payable to the borrowers of the securities and the lending agent. Lending securities involves certain risks, including the risk that the Fund may be delayed or prevented from recovering the collateral if the borrower fails to return the securities.
Cash collateral received in connection with securities lending is invested in short-term investments by the lending agent. These investments may include the SEI Liquidity Fund, L.P., and the Fund bears all of the gains and losses on such investment. There is no guarantee that these investments will not lose value.
The following is a summary of securities lending agreements held by certain Funds which would be subject to offset as of November 30, 2016 ($ Thousands):
| Fund | Securities Loaned at Value | Cash Collateral Received(1) | Net Amount | |||||||||
Large Cap Fund | $ | 19,084 | $ | 19,084 | $ | — | ||||||
Large Cap Disciplined Equity Fund | 20,511 | 20,511 | — | |||||||||
Large Cap Index Fund | 18,216 | 18,216 | — | |||||||||
S&P 500 Index Fund | 17,503 | 17,503 | — | |||||||||
Extended Market Index Fund | 56,542 | 56,542 | — | |||||||||
Small Cap Fund | 21,824 | 21,824 | — | |||||||||
Small Cap II Fund | 42,854 | 42,854 | — | |||||||||
Small/Mid Cap Equity Fund | 116,897 | 116,897 | — | |||||||||
World Equity Ex-US Fund | 289,406 | 289,406 | — | |||||||||
| (1) | Excess collateral received in connection with the above securities lending transactions is not shown for financial reporting purposes. See each Fund’s Summary Schedule of Investments or Schedule of Investments for the total collateral received. |
13. CONCENTRATION OF SHAREHOLDERS
SEI Private Trust Company (“SPTC”) and SIMC are subsidiaries of SEI Investments Company. As of November 30, 2016, SPTC held of record the following:
| Fund | % Held | |||
| Large Cap Fund | 56.34 | % | ||
| Large Cap Fund Diversified Alpha Fund | 98.97 | % | ||
| Large Cap Disciplined Equity Fund | 70.78 | % | ||
| Large Cap Index Fund | 55.69 | % | ||
| S&P 500 Index Fund | 56.63 | % | ||
| Extended Market Index Fund | 67.94 | % | ||
| Small Cap Fund | 41.33 | % | ||
| Small Cap II Fund | 53.26 | % | ||
| Small/Mid Cap Equity Fund | 61.30 | % | ||
| U.S. Managed Volatility Fund | 56.74 | % | ||
| Global Managed Volatility Fund | 46.33 | % | ||
| World Equity Ex-US Fund | 56.66 | % | ||
| Screened World Equity Ex-US Fund | 100.00 | % | ||
| Emerging Markets Equity Fund | 70.11 | % | ||
| Opportunistic Income Fund | 72.97 | % | ||
| Core Fixed Income Fund | 56.96 | % | ||
| High Yield Bond Fund | 55.05 | % | ||
| Long Duration Fund | 68.52 | % | ||
| Long Duration Credit Fund | 36.30 | % | ||
| Ultra Short Duration Bond Fund | 75.72 | % | ||
| Emerging Markets Debt Fund | 61.92 | % | ||
| Real Return Fund | 66.24 | % | ||
| Limited Duration Bond Fund | 72.68 | % | ||
| Intermediate Duration Credit Fund | 49.30 | % | ||
| Dynamic Asset Allocation Fund | 68.34 | % | ||
| Multi-Asset Real Return Fund | 70.48 | % | ||
SPTC is not a direct service provider to the Funds. However, SPTC performs a key role in the comprehensive investment solution that SEI provides to investors. SPTC holds the vast majority of shares in the Funds as custodian for shareholders that are clients of the advisors and financial planners. SPTC maintains accounts at SEI Institutional Transfer Agency (“SITA”), and operates in an omnibus fund account environment.
14. REGULATORY MATTERS
In October 2016, the Securities and Exchange Commission (the “SEC”) released its Final Rule on Investment Company Reporting Modernization (the “Rule”). The Rule which introduces two new regulatory reporting forms for investment companies – Form N-PORT and Form N-CEN – also contains amendments to Regulation S-X which impact financial statement presentation, particularly the presentation of derivative investments. Although still evaluating the impact of the Rule, management believes that many of the Regulation
| 288 | SEI Institutional Investments Trust / Semi-Annual Report / November 30, 2016 |
S-X amendments are consistent with the Funds’ current financial statement presentation and expects that the Funds will be able to comply with the Rule’s Regulation S-X amendments by the August 1, 2017 compliance date.
15. SUBSEQUENT EVENTS
Management has evaluated the need for disclosures and/or adjustments resulting from subsequent events through the date the financial statements were issued. Based on this evaluation, no disclosure and/or adjustments were required to the financial statements as of November 30, 2016.
| SEI Institutional Investments Trust / Semi-Annual Report / November 30, 2016 | 289 |
DISCLOSURE OF FUND EXPENSES (Unaudited)
November 30, 2016
All mutual funds have operating expenses. As a shareholder of a fund, your investment is affected by these ongoing costs, which include (among others) costs for portfolio management, administrative services, and shareholder reports like this one. It is important for you to understand the impact of these costs on your investment returns.
Operating expenses such as these are deducted from the fund’s gross income and directly reduce your final investment return. These expenses are expressed as a percentage of the fund’s average net assets; this percentage is known as the fund’s expense ratio.
The following examples use the expense ratio and are intended to help you understand the ongoing costs (in dollars) of investing in your fund and to compare these costs with those of other mutual funds. The examples are based on an investment of $1,000 made at the beginning of the period shown and held for the entire period (June 1, 2016 through November 30, 2016).
The table on this page illustrates your fund’s costs in two ways:
• Actual fund return. This section helps you to estimate the actual expenses after fee waivers that your Fund incurred over the period. The “Expenses Paid During Period” column shows the actual dollar expense cost incurred by a $1,000 investment in the Fund, and the “Ending Account Value” number is derived from deducting that expense cost from the Fund’s gross investment return.
You can use this information, together with the actual amount you invested in the Fund, to estimate the expenses you paid over that period. Simply divide your actual account value by $1,000 to arrive at a ratio (for example, an $8,600 account value divided by $1,000 = 8.6), then multiply that ratio by the number shown for your Fund under “Expenses Paid During Period.”
• Hypothetical 5% return. This section helps you compare your Fund’s costs with those of other mutual funds. It assumes that the fund had an annual 5% return before expenses during the year, but that the expense ratio (Column 3) for the period is unchanged. This example is useful in making comparisons because the Securities and Exchange Commission requires all mutual funds to make this 5% calculation. You can assess your Fund’s comparative cost by comparing the hypothetical result for your Fund in the “Expense Paid During Period” column with those that appear in the same charts in the shareholder reports for other funds.
NOTE: Because the return is set at 5% for comparison purposes — NOT your Fund’s actual return — the account values shown may not apply to your specific investment.
Beginning Value 6/1/16 | Ending Account Value 11/30/16 | Annualized Ratios | Expenses Paid During Period* | |||||||||||||
Large Cap Fund |
| |||||||||||||||
Actual Fund Return |
| |||||||||||||||
Class A Shares | $ | 1,000.00 | $ | 1,050.90 | 0.20 | % | $ | 1.03 | ||||||||
Hypothetical 5% Return |
| |||||||||||||||
Class A Shares | $ | 1,000.00 | $ | 1,024.07 | 0.20 | % | $ | 1.01 | ||||||||
Large Cap Diversified Alpha Fund |
| |||||||||||||||
Actual Fund Return |
| |||||||||||||||
Class A Shares | $ | 1,000.00 | $ | 1,055.60 | 0.24 | % | $ | 1.24 | ||||||||
Hypothetical 5% Return |
| |||||||||||||||
Class A Shares | $ | 1,000.00 | $ | 1,023.87 | 0.24 | % | $ | 1.22 | ||||||||
Large Cap Disciplined Equity Fund |
| |||||||||||||||
Actual Fund Return |
| |||||||||||||||
Class A Shares | $ | 1,000.00 | $ | 1,057.40 | 0.19 | % | $ | 0.98 | ||||||||
Hypothetical 5% Return |
| |||||||||||||||
Class A Shares | $ | 1,000.00 | $ | 1,024.12 | 0.19 | % | $ | 0.96 | ||||||||
Beginning Value 6/1/16 | Ending Account Value 11/30/16 | Annualized Ratios | Expenses Paid During | |||||||||||||
Large Cap Index Fund |
| |||||||||||||||
Actual Fund Return |
| |||||||||||||||
Class A Shares | $ | 1,000.00 | $ | 1,062.60 | 0.03 | % | $ | 0.16 | ||||||||
Hypothetical 5% Return |
| |||||||||||||||
Class A Shares | $ | 1,000.00 | $ | 1,024.92 | 0.03 | % | $ | 0.15 | ||||||||
S&P 500 Index Fund |
| |||||||||||||||
Actual Fund Return |
| |||||||||||||||
Class A Shares | $ | 1,000.00 | $ | 1,060.40 | 0.05 | % | $ | 0.26 | ||||||||
Hypothetical 5% Return |
| |||||||||||||||
Class A Shares | $ | 1,000.00 | $ | 1,024.82 | 0.05 | % | $ | 0.25 | ||||||||
Extended Market Index Fund |
| |||||||||||||||
Actual Fund Return |
| |||||||||||||||
Class A Shares | $ | 1,000.00 | $ | 1,113.80 | 0.06 | % | $ | 0.32 | ||||||||
Hypothetical 5% Return |
| |||||||||||||||
Class A Shares | $ | 1,000.00 | $ | 1,024.77 | 0.06 | % | $ | 0.30 | ||||||||
| 290 | SEI Institutional Investments Trust / Semi-Annual Report / November 30, 2016 |
| Beginning Account Value 6/1/16 | Ending Account Value 11/30/16 | Annualized Expense Ratios | Expenses Paid During Period* | |||||||||||||
Small Cap Fund |
| |||||||||||||||
Actual Fund Return |
| |||||||||||||||
Class A Shares | $ | 1,000.00 | $ | 1,121.30 | 0.45 | % | $ | 2.39 | ||||||||
Hypothetical 5% Return |
| |||||||||||||||
Class A Shares | $ | 1,000.00 | $ | 1,022.81 | 0.45 | % | $ | 2.28 | ||||||||
Small Cap II Fund |
| |||||||||||||||
Actual Fund Return |
| |||||||||||||||
Class A Shares | $ | 1,000.00 | $ | 1,109.70 | 0.43 | % | $ | 2.27 | ||||||||
Hypothetical 5% Return |
| |||||||||||||||
Class A Shares | $ | 1,000.00 | $ | 1,022.91 | 0.43 | % | $ | 2.18 | ||||||||
Small/Mid Cap Equity Fund |
| |||||||||||||||
Actual Fund Return |
| |||||||||||||||
Class A Shares | $ | 1,000.00 | $ | 1,109.00 | 0.45 | % | $ | 2.38 | ||||||||
Hypothetical 5% Return |
| |||||||||||||||
Class A Shares | $ | 1,000.00 | $ | 1,022.81 | 0.45 | % | $ | 2.28 | ||||||||
U.S. Managed Volatility Fund |
| |||||||||||||||
Actual Fund Return |
| |||||||||||||||
Class A Shares | $ | 1,000.00 | $ | 1,048.40 | 0.24 | % | $ | 1.23 | ||||||||
Hypothetical 5% Return |
| |||||||||||||||
Class A Shares | $ | 1,000.00 | $ | 1,023.87 | 0.24 | % | $ | 1.22 | ||||||||
Global Managed Volatility Fund |
| |||||||||||||||
Actual Fund Return |
| |||||||||||||||
Class A Shares | $ | 1,000.00 | $ | 1,019.50 | 0.27 | % | $ | 1.37 | ||||||||
Hypothetical 5% Return |
| |||||||||||||||
Class A Shares | $ | 1,000.00 | $ | 1,023.71 | 0.27 | % | $ | 1.37 | ||||||||
World Equity Ex-US Fund |
| |||||||||||||||
Actual Fund Return |
| |||||||||||||||
Class A Shares | $ | 1,000.00 | $ | 1,022.20 | 0.32 | % | $ | 1.62 | ||||||||
Hypothetical 5% Return |
| |||||||||||||||
Class A Shares | $ | 1,000.00 | $ | 1,023.46 | 0.32 | % | $ | 1.62 | ||||||||
Screened World Equity Ex-US Fund |
| |||||||||||||||
Actual Fund Return |
| |||||||||||||||
Class A Shares | $ | 1,000.00 | $ | 1,044.70 | 0.36 | % | $ | 1.85 | ||||||||
Hypothetical 5% Return |
| |||||||||||||||
Class A Shares | $ | 1,000.00 | $ | 1,023.26 | 0.36 | % | $ | 1.83 | ||||||||
Emerging Markets Equity Fund |
| |||||||||||||||
Actual Fund Return |
| |||||||||||||||
Class A Shares | $ | 1,000.00 | $ | 1,044.10 | 0.63 | % | $ | 3.23 | ||||||||
Hypothetical 5% Return |
| |||||||||||||||
Class A Shares | $ | 1,000.00 | $ | 1,021.91 | 0.63 | % | $ | 3.19 | ||||||||
Opportunistic Income Fund |
| |||||||||||||||
Actual Fund Return |
| |||||||||||||||
Class A Shares | $ | 1,000.00 | $ | 1,022.10 | 0.26 | % | $ | 1.32 | ||||||||
Hypothetical 5% Return |
| |||||||||||||||
Class A Shares | $ | 1,000.00 | $ | 1,023.76 | 0.26 | % | $ | 1.32 | ||||||||
Core Fixed Income Fund |
| |||||||||||||||
Actual Fund Return |
| |||||||||||||||
Class A Shares | $ | 1,000.00 | $ | 996.40 | 0.12 | % | $ | 0.60 | ||||||||
Hypothetical 5% Return |
| |||||||||||||||
Class A Shares | $ | 1,000.00 | $ | 1,024.47 | 0.12 | % | $ | 0.61 | ||||||||
| Beginning Account Value 6/1/16 | Ending Account Value 11/30/16 | Annualized Expense Ratios | Expenses Paid During Period* | |||||||||||||
High Yield Bond Fund |
| |||||||||||||||
Actual Fund Return |
| |||||||||||||||
Class A Shares | $ | 1,000.00 | $ | 1,073.20 | 0.30 | % | $ | 1.56 | ||||||||
Hypothetical 5% Return |
| |||||||||||||||
Class A Shares | $ | 1,000.00 | $ | 1,023.56 | 0.30 | % | $ | 1.52 | ||||||||
Long Duration Fund |
| |||||||||||||||
Actual Fund Return |
| |||||||||||||||
Class A Shares | $ | 1,000.00 | $ | 980.50 | 0.15 | % | $ | 0.74 | ||||||||
Hypothetical 5% Return |
| |||||||||||||||
Class A Shares | $ | 1,000.00 | $ | 1,024.32 | 0.15 | % | $ | 0.76 | ||||||||
Long Duration Credit Fund |
| |||||||||||||||
Actual Fund Return |
| |||||||||||||||
Class A Shares | $ | 1,000.00 | $ | 985.30 | 0.15 | % | $ | 0.75 | ||||||||
Hypothetical 5% Return |
| |||||||||||||||
Class A Shares | $ | 1,000.00 | $ | 1,024.32 | 0.15 | % | $ | 0.76 | ||||||||
Ultra Short Duration Bond Fund |
| |||||||||||||||
Actual Fund Return |
| |||||||||||||||
Class A Shares | $ | 1,000.00 | $ | 1,008.30 | 0.12 | % | $ | 0.60 | ||||||||
Hypothetical 5% Return |
| |||||||||||||||
Class A Shares | $ | 1,000.00 | $ | 1,024.47 | 0.12 | % | $ | 0.61 | ||||||||
Emerging Markets Debt Fund |
| |||||||||||||||
Actual Fund Return |
| |||||||||||||||
Class A Shares | $ | 1,000.00 | $ | 1,007.60 | 0.42 | % | $ | 2.11 | ||||||||
Hypothetical 5% Return |
| |||||||||||||||
Class A Shares | $ | 1,000.00 | $ | 1,022.96 | 0.42 | % | $ | 2.13 | ||||||||
Real Return Fund |
| |||||||||||||||
Actual Fund Return |
| |||||||||||||||
Class A Shares | $ | 1,000.00 | $ | 1,008.10 | 0.08 | % | $ | 0.40 | ||||||||
Hypothetical 5% Return |
| |||||||||||||||
Class A Shares | $ | 1,000.00 | $ | 1,024.67 | 0.08 | % | $ | 0.41 | ||||||||
Limited Duration Bond Fund |
| |||||||||||||||
Actual Fund Return |
| |||||||||||||||
Class A Shares | $ | 1,000.00 | $ | 1,003.00 | 0.11 | % | $ | 0.55 | ||||||||
Hypothetical 5% Return |
| |||||||||||||||
Class A Shares | $ | 1,000.00 | $ | 1,024.52 | 0.11 | % | $ | 0.56 | ||||||||
Intermediate Duration Credit Fund |
| |||||||||||||||
Actual Fund Return |
| |||||||||||||||
Class A Shares | $ | 1,000.00 | $ | 997.00 | 0.15 | % | $ | 0.75 | ||||||||
Hypothetical 5% Return |
| |||||||||||||||
Class A Shares | $ | 1,000.00 | $ | 1,024.32 | 0.15 | % | $ | 0.76 | ||||||||
Dynamic Asset Allocation Fund |
| |||||||||||||||
Actual Fund Return |
| |||||||||||||||
Class A Shares | $ | 1,000.00 | $ | 1,073.30 | 0.07 | % | $ | 0.36 | ||||||||
Hypothetical 5% Return |
| |||||||||||||||
Class A Shares | $ | 1,000.00 | $ | 1,024.72 | 0.07 | % | $ | 0.36 | ||||||||
Multi-Asset Real Return Fund |
| |||||||||||||||
Actual Fund Return |
| |||||||||||||||
Class A Shares | $ | 1,000.00 | $ | 1,002.40 | 0.44 | % | $ | 2.21 | ||||||||
Hypothetical 5% Return |
| |||||||||||||||
Class A Shares | $ | 1,000.00 | $ | 1,022.86 | 0.44 | % | $ | 2.23 | ||||||||
| * | Expenses are equal to the Fund’s annualized expense ratio multiplied by the average account value over the period, multiplied by 183/365 (to reflect the one-half year period shown). |
| SEI Institutional Investments Trust / Semi-Annual Report / November 30, 2016 | 291 |
(This page intentionally left blank)
SEI Institutional Investments Trust Semi-Annual Report November 30, 2016
Robert A. Nesher, Chairman
Trustees
William M. Doran
George J. Sullivan, Jr.
Nina Lesavoy
James M. Williams
Mitchell A. Johnson
Hubert L. Harris, Jr.
Susan C. Cote
Officers
Robert A. Nesher
President and Chief Executive Officer
James J. Hoffmayer
Controller and Chief Financial Officer
Russell Emery
Chief Compliance Officer
Timothy D. Barto
Vice President, Secretary
Aaron Buser
Vice President, Assistant Secretary
David F. McCann
Vice President, Assistant Secretary
Stephen G. MacRae
Vice President
Bridget E. Sudall
Anti-Money Laundering Compliance Officer
Privacy Officer
Investment Adviser
SEI Investments Management Corporation
Administrator
SEI Investments Global Funds Services
Distributor
SEI Investments Distribution Co.
Legal Counsel
Morgan, Lewis & Bockius LLP
Independent Registered Public Accounting Firm
KPMG LLP
This report and the financial statements contained herein are submitted for the general information of the shareholders of the Trust and must be preceded or accompanied by a current prospectus. Shares of the Funds are not deposits or obligations of, or guaranteed or endorsed by, any bank. The shares are not federally insured by the Federal Deposit Insurance Corporation (FDIC), the Federal Reserve Board, or any other government agency. Investment in the shares involves risk, including the possible loss of principal.
For more information call
1 800 DIAL SEI
(1 800 342 5734)

1 Freedom Valley Drive, P.O. Box 1100, Oaks, PA 19456
SEI-F-120 (11/16)
| Item 2. | Code of Ethics. |
Not applicable for semi-annual report.
| Item 3. | Audit Committee Financial Expert. |
Not applicable for semi-annual report.
| Item 4. | Principal Accountant Fees and Services. |
Not applicable for semi-annual report.
| Item 5. | Audit Committee of Listed Registrants. |
Not applicable for semi-annual report.
| Item 6. | Schedule of Investments. |
(a) The Schedules of Investments in securities of unaffiliated issuers as of the close of the reporting period for the Large Cap Fund, Large Cap Diversified Alpha Fund, Large Cap Disciplined Equity Fund, Large Cap Index Fund, S&P 500 Index Fund, Extended Market Index Fund, Small Cap Fund, Small Cap II Fund, Small/Mid Cap Equity Fund, U.S. Managed Volatility Fund, Global Managed Volatility Fund, World Equity Ex-US Fund, Screened World Equity Ex-US Fund and Emerging Markets Equity Fund and the Consolidated Schedule of Investments in securities of unaffiliated issuers as of the close of the reporting period for the Dynamic Asset Allocation Fund are listed below. The Schedule of Investments in securities of unaffiliated issuers as of the close of the reporting period for the Opportunistic Income Fund, Core Fixed Income Fund, High Yield Bond Fund, Long Duration Fund, Long Duration Credit Fund, Ultra Short Duration Bond Fund, Emerging Markets Debt Fund, Real Return Fund, Limited Duration Bond Fund and Intermediate Duration Credit Fund and the Consolidated Schedule of Investments in securities of unaffiliated issuers as of the close of the reporting period for the Multi-Asset Real Return Fund are included as part of the report to shareholders filed under Item 1 of this form.
SCHEDULE OF INVESTMENTS (Unaudited)
Large Cap Fund
November 30, 2016
| Description | Shares | Market Value ($ Thousands) | ||||||
COMMON STOCK†† — 96.5% | ||||||||
Consumer Discretionary — 10.1% | ||||||||
Abercrombie & Fitch, Cl A | 22,900 | $ | 329 | |||||
Amazon.com* | 22,408 | 16,819 | ||||||
AMC Networks, Cl A* | 4,142 | 229 | ||||||
American Eagle Outfitters (A) | 99,000 | 1,639 | ||||||
Bed Bath & Beyond | 12,874 | 577 | ||||||
Best Buy | 110,994 | 5,072 | ||||||
Big Lots (A) | 37,746 | 1,910 | ||||||
Brunswick | 2,772 | 139 | ||||||
Carnival, Cl A | 5,549 | 285 | ||||||
CBS, Cl B | 139,500 | 8,470 | ||||||
Comcast, Cl A | 117,241 | 8,149 | ||||||
Cooper Tire & Rubber | 55,591 | 2,129 | ||||||
Dana Holdings | 6,853 | 116 | ||||||
Darden Restaurants | 6,056 | 444 | ||||||
Dick’s Sporting Goods | 2,717 | 161 | ||||||
Dillard’s, Cl A | 15,300 | 1,094 | ||||||
Dollar General | 65,207 | 5,042 | ||||||
DR Horton | 39,034 | 1,082 | ||||||
Foot Locker | 22,600 | 1,620 | ||||||
Ford Motor | 234,300 | 2,802 | ||||||
GameStop, Cl A | 28,800 | 711 | ||||||
Gannett | 19,350 | 185 | ||||||
General Motors | 249,702 | 8,622 | ||||||
Goodyear Tire & Rubber | 173,784 | 5,333 | ||||||
Harley-Davidson | 35,800 | 2,180 | ||||||
Home Depot | 35,684 | 4,618 | ||||||
Hyatt Hotels, Cl A* | 4,434 | 228 | ||||||
International Game Technology | 48,375 | 1,247 | ||||||
Interpublic Group | 23,837 | 574 | ||||||
John Wiley & Sons, Cl A | 2,990 | 164 | ||||||
KB Home (A) | 103,400 | 1,638 | ||||||
Kohl’s | 50,200 | 2,702 | ||||||
L Brands | 129,106 | 9,066 | ||||||
Las Vegas Sands | 13,579 | 851 | ||||||
Lear | 66,051 | 8,554 | ||||||
Liberty Global* | 181,674 | 5,532 | ||||||
Liberty Global, Cl A* | 47,240 | 1,480 | ||||||
Liberty Interactive QVC Group, Cl A* | 639,985 | 13,254 | ||||||
Lowe’s | 5,544 | 391 | ||||||
Macy’s | 37,500 | 1,583 | ||||||
Magna International, Cl A | 120,920 | 4,891 | ||||||
Michael Kors Holdings* | 98,974 | 4,601 | ||||||
Newell Brands | 137,130 | 6,447 | ||||||
Staples | 10,143 | 98 | ||||||
Starbucks | 244,120 | 14,152 | ||||||
Target | 34,300 | 2,649 | ||||||
TEGNA | 55,900 | 1,254 | ||||||
Time Warner | 9,446 | 867 | ||||||
Toll Brothers* | 11,072 | 328 | ||||||
TripAdvisor* | 334,988 | 16,173 | ||||||
Tupperware Brands | 1,490 | 83 | ||||||
| Description | Shares | Market Value ($ Thousands) | ||||||
Twenty-First Century Fox, Cl A | 217,720 | $ | 6,120 | |||||
Under Armour, Cl A* (A) | 86,487 | 2,664 | ||||||
Under Armour, Cl C* | 169,276 | 4,364 | ||||||
Urban Outfitters* | 15,644 | 494 | ||||||
Viacom, Cl B | 48,900 | 1,833 | ||||||
Visteon* | 4,032 | 317 | ||||||
Whirlpool | 16,362 | 2,658 | ||||||
Wyndham Worldwide | 28,200 | 2,030 | ||||||
|
| |||||||
| 199,044 | ||||||||
|
| |||||||
Consumer Staples — 6.6% | ||||||||
Altria Group | 23,425 | 1,497 | ||||||
Archer-Daniels-Midland | 96,087 | 4,154 | ||||||
Bunge | 48,129 | 3,286 | ||||||
Coca-Cola | 11,939 | 482 | ||||||
Costco Wholesale | 100,830 | 15,136 | ||||||
Dean Foods | 209,068 | 4,152 | ||||||
Dr. Pepper Snapple Group | 44,049 | 3,821 | ||||||
Estee Lauder, Cl A | 134,721 | 10,468 | ||||||
Ingredion | 32,212 | 3,781 | ||||||
Kellogg | 54,330 | 3,912 | ||||||
Kraft Heinz | 101,720 | 8,305 | ||||||
Kroger | 59,300 | 1,915 | ||||||
Mead Johnson Nutrition, Cl A | 120,969 | 8,721 | ||||||
Molson Coors Brewing, Cl B | 83,952 | 8,230 | ||||||
Nu Skin Enterprises, Cl A | 32,561 | 1,699 | ||||||
PepsiCo | 62,017 | 6,208 | ||||||
Philip Morris International | 127,588 | 11,263 | ||||||
Pilgrim’s Pride* (A) | 76,113 | 1,340 | ||||||
Procter & Gamble | 57,924 | 4,776 | ||||||
Reynolds American | 12,138 | 657 | ||||||
Rite Aid* | 15,556 | 124 | ||||||
Sanderson Farms (A) | 28,047 | 2,262 | ||||||
SUPERVALU* | 120,100 | 557 | ||||||
Sysco | 76,616 | 4,080 | ||||||
Tyson Foods, Cl A | 123,265 | 7,003 | ||||||
Walgreens Boots Alliance | 66,722 | 5,653 | ||||||
Wal-Mart Stores | 102,980 | 7,253 | ||||||
|
| |||||||
| 130,735 | ||||||||
|
| |||||||
Energy — 7.0% | ||||||||
Anadarko Petroleum | 30,415 | 2,103 | ||||||
Baker Hughes | 5,207 | 335 | ||||||
Cabot Oil & Gas | 226,800 | 5,017 | ||||||
Canadian Natural Resources | 115,505 | 3,901 | ||||||
Chevron | 128,977 | 14,389 | ||||||
Cimarex Energy | 70,463 | 9,715 | ||||||
ConocoPhillips | 44,582 | 2,163 | ||||||
CONSOL Energy* | 12,448 | 256 | ||||||
Diamond Offshore Drilling* (A) | 19,850 | 358 | ||||||
Dril-Quip* | 21,889 | 1,238 | ||||||
Ensco, Cl A | 412,671 | 3,986 | ||||||
| 1 | SEI Institutional Investments Trust / Semi-Annual Report / November 30, 2016 |
SCHEDULE OF INVESTMENTS (Unaudited)
Large Cap Fund (Continued)
November 30, 2016
| Description | Shares | Market Value ($ Thousands) | ||||||
EOG Resources | 73,651 | $ | 7,551 | |||||
Exxon Mobil | 224,103 | 19,564 | ||||||
Halliburton | 207,489 | 11,016 | ||||||
Helmerich & Payne (A) | 73,264 | 5,542 | ||||||
Kinder Morgan | 16,926 | 376 | ||||||
Marathon Petroleum | 95,998 | 4,514 | ||||||
Nabors Industries | 321,302 | 5,173 | ||||||
National Oilwell Varco | 48,900 | 1,827 | ||||||
Oceaneering International | 149,418 | 3,982 | ||||||
Patterson-UTI Energy | 147,237 | 3,927 | ||||||
Phillips 66 | 25,100 | 2,085 | ||||||
Pioneer Natural Resources | 2,322 | 444 | ||||||
Rowan, Cl A* | 220,738 | 3,933 | ||||||
Schlumberger | 2,875 | 242 | ||||||
Southwestern Energy* | 125,655 | 1,426 | ||||||
Spectra Energy | 8,365 | 342 | ||||||
Tesoro | 115,672 | 9,410 | ||||||
Tsakos Energy Navigation (A) | 126,600 | 556 | ||||||
Valero Energy | 202,059 | 12,439 | ||||||
World Fuel Services | 2,532 | 113 | ||||||
|
| |||||||
| 137,923 | ||||||||
|
| |||||||
Financials — 15.9% | ||||||||
Aflac | 42,412 | 3,027 | ||||||
Allied World Assurance Holdings | 14,021 | 656 | ||||||
Allstate | 133,654 | 9,345 | ||||||
Ally Financial | 173,481 | 3,369 | ||||||
American Financial Group | 14,454 | 1,189 | ||||||
American International Group | 286,415 | 18,139 | ||||||
American National Insurance | 1,042 | 126 | ||||||
Ameriprise Financial | 34,164 | 3,902 | ||||||
Annaly Capital Management‡ | 253,400 | 2,590 | ||||||
Aspen Insurance Holdings | 7,835 | 399 | ||||||
Assurant | 19,500 | 1,684 | ||||||
Assured Guaranty | 110,455 | 3,950 | ||||||
Axis Capital Holdings | 31,190 | 1,903 | ||||||
Bank of America | 1,213,408 | 25,627 | ||||||
Bank of New York Mellon | 7,832 | 371 | ||||||
BB&T | 44,100 | 1,995 | ||||||
Berkshire Hathaway, Cl B* | 20,438 | 3,218 | ||||||
Capital One Financial | 42,809 | 3,598 | ||||||
Charles Schwab | 144,642 | 5,592 | ||||||
CIT Group | 26,600 | 1,087 | ||||||
Citigroup | 406,368 | 22,915 | ||||||
Citizens Financial Group | 171,556 | 5,749 | ||||||
CME Group, Cl A | 66,410 | 7,498 | ||||||
CNA Financial | 37,100 | 1,420 | ||||||
Discover Financial Services | 64,900 | 4,398 | ||||||
Donnelley Financial Solutions* | 8,863 | 169 | ||||||
Everest Re Group | 24,266 | 5,109 | ||||||
Fifth Third Bancorp | 103,100 | 2,683 | ||||||
Franklin Resources | 8,569 | 336 | ||||||
| Description | Shares | Market Value ($ Thousands) | ||||||
Genworth Financial, Cl A* | 287,166 | $ | 1,229 | |||||
Goldman Sachs Group | 9,300 | 2,039 | ||||||
Hartford Financial Services Group | 54,300 | 2,559 | ||||||
Huntington Bancshares | 173,300 | 2,159 | ||||||
Intercontinental Exchange | 203,445 | 11,271 | ||||||
Invesco | 6,191 | 194 | ||||||
JPMorgan Chase | 511,423 | 41,001 | ||||||
KeyCorp | 100,000 | 1,731 | ||||||
Legg Mason | 27,700 | 884 | ||||||
Lincoln National | 91,286 | 5,851 | ||||||
MetLife | 163,409 | 8,989 | ||||||
MGIC Investment* | 206,400 | 1,872 | ||||||
Morgan Stanley | 218,543 | 9,039 | ||||||
Navient | 69,800 | 1,203 | ||||||
Old Republic International | 16,640 | 297 | ||||||
PNC Financial Services Group | 68,968 | 7,624 | ||||||
Popular | 45,506 | 1,850 | ||||||
Progressive | 12,766 | 425 | ||||||
Prudential Financial | 79,538 | 8,001 | ||||||
Radian Group | 62,800 | 914 | ||||||
Regions Financial | 403,308 | 5,461 | ||||||
Reinsurance Group of America, Cl A | 17,206 | 2,100 | ||||||
S&P Global | 2,961 | 352 | ||||||
Starwood Property Trust‡ | 64,800 | 1,456 | ||||||
State Street | 21,213 | 1,672 | ||||||
SunTrust Banks | 223,032 | 11,586 | ||||||
Synchrony Financial | 5,630 | 195 | ||||||
Travelers | 89,206 | 10,111 | ||||||
Unum Group | 137,374 | 5,807 | ||||||
US Bancorp | 10,555 | 524 | ||||||
Validus Holdings | 39,491 | 2,146 | ||||||
Voya Financial | 195,576 | 7,602 | ||||||
Wells Fargo | 277,680 | 14,695 | ||||||
Zions Bancorporation | 1,856 | 74 | ||||||
|
| |||||||
| 314,957 | ||||||||
|
| |||||||
Health Care — 12.5% | ||||||||
AbbVie | 53,900 | 3,277 | ||||||
Aetna | 18,134 | 2,373 | ||||||
Agilent Technologies | 3,749 | 165 | ||||||
Alexion Pharmaceuticals* | 139,228 | 17,068 | ||||||
Allergan | 75,752 | 14,719 | ||||||
Amgen | 57,056 | 8,220 | ||||||
Anthem | 26,153 | 3,728 | ||||||
Baxter International | 51,086 | 2,267 | ||||||
Biogen* | 42,368 | 12,459 | ||||||
Bristol-Myers Squibb | 59,280 | 3,346 | ||||||
Bruker | 44,883 | 1,018 | ||||||
Cardinal Health | 31,900 | 2,265 | ||||||
Celgene* | 149,897 | 17,764 | ||||||
Cigna | 19,120 | 2,576 | ||||||
Danaher | 157,841 | 12,338 | ||||||
| 2 | SEI Institutional Investments Trust / Semi-Annual Report / November 30, 2016 |
SCHEDULE OF INVESTMENTS (Unaudited)
Large Cap Fund (Continued)
November 30, 2016
| Description | Shares | Market Value ($ Thousands) | ||||||
DaVita HealthCare Partners* | 118,206 | $ | 7,488 | |||||
DENTSPLY SIRONA | 115,994 | 6,748 | ||||||
DexCom* | 122,378 | 7,990 | ||||||
Express Scripts Holding* | 20,100 | 1,525 | ||||||
Gilead Sciences | 110,892 | 8,173 | ||||||
HCA Holdings* | 97,330 | 6,900 | ||||||
Humana | 2,643 | 562 | ||||||
Intuitive Surgical* | 17,511 | 11,272 | ||||||
Johnson & Johnson | 234,096 | 26,055 | ||||||
Mallinckrodt* | 7,168 | 378 | ||||||
McKesson | 6,082 | 875 | ||||||
Medtronic | 78,306 | 5,717 | ||||||
Merck | 161,465 | 9,880 | ||||||
Pfizer | 580,362 | 18,653 | ||||||
Quest Diagnostics | 24,200 | 2,117 | ||||||
Quintiles IMS Holdings* | 120,681 | 9,272 | ||||||
Shire ADR | 61,108 | 10,669 | ||||||
St. Jude Medical | 5,596 | 443 | ||||||
United Therapeutics* | 52,779 | 6,630 | ||||||
UnitedHealth Group | 3,842 | 608 | ||||||
WellCare Health Plans* | 15,514 | 2,126 | ||||||
|
| |||||||
| 247,664 | ||||||||
|
| |||||||
Industrials — 9.2% | ||||||||
3M | 2,384 | 409 | ||||||
AGCO | 34,800 | 1,942 | ||||||
American Airlines Group | 42,100 | 1,955 | ||||||
AO Smith | 15,594 | 758 | ||||||
Boeing | 42,530 | 6,403 | ||||||
Canadian Pacific Railway | 30,194 | 4,627 | ||||||
Carlisle | 2,561 | 287 | ||||||
Caterpillar | 44,860 | 4,287 | ||||||
Chicago Bridge & Iron | 63,151 | 2,116 | ||||||
CSX | 56,558 | 2,025 | ||||||
Cummins | 31,261 | 4,432 | ||||||
Delta Air Lines | 124,695 | 6,008 | ||||||
FedEx | 34,230 | 6,561 | ||||||
Fluor | 25,100 | 1,343 | ||||||
Fortive | 177,055 | 9,736 | ||||||
General Electric | 59,075 | 1,817 | ||||||
Hawaiian Holdings* | 72,225 | 3,709 | ||||||
Hertz Global Holdings* | 14,785 | 372 | ||||||
Honeywell International | 1,034 | 118 | ||||||
Huntington Ingalls Industries | 45,465 | 8,127 | ||||||
Ingersoll-Rand | 16,262 | 1,212 | ||||||
JB Hunt Transport Services | 41,970 | 4,003 | ||||||
Johnson Controls International | 178,335 | 8,021 | ||||||
Kansas City Southern | 61,990 | 5,499 | ||||||
L-3 Communications Holdings, Cl 3 | 4,237 | 668 | ||||||
Lockheed Martin | 20,520 | 5,443 | ||||||
LSC Communications | 34,141 | 705 | ||||||
Manpowergroup | 18,513 | 1,581 | ||||||
| Description | Shares | Market Value ($ Thousands) | ||||||
Masco | 11,077 | $ | 351 | |||||
Moog, Cl A* | 18,200 | 1,271 | ||||||
Nielsen Holdings | 147,258 | 6,347 | ||||||
Norfolk Southern | 20,797 | 2,214 | ||||||
Northrop Grumman | 22,832 | 5,700 | ||||||
Oshkosh Truck | 4,410 | 309 | ||||||
Owens Corning | 115,043 | 5,911 | ||||||
Parker Hannifin | 2,785 | 387 | ||||||
Pitney Bowes | 92,847 | 1,332 | ||||||
Quanta Services* | 139,304 | 4,697 | ||||||
Raytheon | 11,512 | 1,721 | ||||||
Republic Services | 17,490 | 971 | ||||||
Roper Technologies | 46,364 | 8,397 | ||||||
RR Donnelley & Sons | 32,762 | 570 | ||||||
Ryder System | 24,100 | 1,887 | ||||||
Southwest Airlines | 63,642 | 2,966 | ||||||
Spirit AeroSystems Holdings, Cl A | 122,172 | 7,117 | ||||||
Spirit Airlines* | 20,441 | 1,137 | ||||||
Timken | 67,015 | 2,617 | ||||||
Trinity Industries | 55,800 | 1,551 | ||||||
Union Pacific | 100,875 | 10,222 | ||||||
United Continental Holdings* | 153,960 | 10,616 | ||||||
United Technologies | 2,918 | 314 | ||||||
Vectrus* | 900 | 21 | ||||||
Wabtec | 101,485 | 8,593 | ||||||
Waste Management | 18,568 | 1,291 | ||||||
|
| |||||||
| 182,674 | ||||||||
|
| |||||||
Information Technology — 25.4% | ||||||||
Adobe Systems* | 176,248 | 18,120 | ||||||
Akamai Technologies* | 143,266 | 9,556 | ||||||
Alibaba Group Holding ADR* | 49,490 | 4,653 | ||||||
Alphabet, Cl A* | 35,275 | 27,369 | ||||||
Alphabet, Cl C* | 27,839 | 21,103 | ||||||
Amdocs | 32,172 | 1,897 | ||||||
Amphenol, Cl A | 179,870 | 12,278 | ||||||
Analog Devices | 99,280 | 7,371 | ||||||
Ansys* | 66,805 | 6,282 | ||||||
Apple | 74,574 | 8,242 | ||||||
Applied Materials | 419,554 | 13,510 | ||||||
Arrow Electronics* | 26,836 | 1,832 | ||||||
Aspen Technology* | 22,352 | 1,181 | ||||||
Avnet | 63,870 | 2,931 | ||||||
Brocade Communications Systems | 167,043 | 2,061 | ||||||
CA | 124,599 | 3,982 | ||||||
Cisco Systems | 347,170 | 10,353 | ||||||
Citrix Systems* | 44,134 | 3,828 | ||||||
Cognizant Technology Solutions, Cl A* | 161,495 | 8,895 | ||||||
Convergys | 60,800 | 1,573 | ||||||
CoreLogic* | 4,579 | 173 | ||||||
Corning | 168,600 | 4,051 | ||||||
Dell Technologies, Cl V* | 16,496 | 883 | ||||||
| 3 | SEI Institutional Investments Trust / Semi-Annual Report / November 30, 2016 |
SCHEDULE OF INVESTMENTS (Unaudited)
Large Cap Fund (Continued)
November 30, 2016
| Description | Shares | Market Value ($ Thousands) | ||||||
DST Systems | 4,407 | $ | 455 | |||||
eBay* | 651,944 | 18,131 | ||||||
Electronic Arts* | 149,230 | 11,825 | ||||||
Facebook, Cl A* | 289,249 | 34,253 | ||||||
FleetCor Technologies* | 55,587 | 8,301 | ||||||
Flex* | 118,300 | 1,685 | ||||||
Genpact* | 315,967 | 7,561 | ||||||
Hewlett Packard Enterprise | 145,946 | 3,473 | ||||||
HP | 329,288 | 5,071 | ||||||
IAC* | 2,670 | 180 | ||||||
Ingram Micro, Cl A* | 32,704 | 1,224 | ||||||
Intel | 483,826 | 16,789 | ||||||
International Business Machines | 30,754 | 4,989 | ||||||
Intuit | 97,053 | 11,033 | ||||||
Jabil Circuit | 18,278 | 387 | ||||||
Juniper Networks | 86,400 | 2,379 | ||||||
Kla-Tencor | 4,682 | 374 | ||||||
Lam Research | 20,000 | 2,120 | ||||||
LinkedIn, Cl A* | 1,887 | 368 | ||||||
Marvell Technology Group | 24,123 | 346 | ||||||
MasterCard, Cl A | 202,168 | 20,662 | ||||||
Maxim Integrated Products | 17,217 | 676 | ||||||
Micron Technology* | 41,453 | 810 | ||||||
Microsoft | 607,971 | 36,636 | ||||||
NCR* | 56,200 | 2,178 | ||||||
Nuance Communications* | 9,481 | 154 | ||||||
NXP Semiconductor* | 111,819 | 11,087 | ||||||
Oracle | 29,228 | 1,175 | ||||||
PayPal Holdings* | 659,264 | 25,896 | ||||||
QUALCOMM | 309,660 | 21,097 | ||||||
salesforce.com* | 142,060 | 10,228 | ||||||
Seagate Technology (A) | 55,700 | 2,234 | ||||||
Symantec | 347,912 | 8,486 | ||||||
Take-Two Interactive Software* | 28,443 | 1,400 | ||||||
Tech Data* | 18,100 | 1,536 | ||||||
Teradata* | 33,298 | 894 | ||||||
Teradyne | 79,167 | 1,930 | ||||||
Texas Instruments | 13,871 | 1,025 | ||||||
VeriSign* | 57,575 | 4,540 | ||||||
Versum Materials* | 33,135 | 810 | ||||||
Visa, Cl A | 479,850 | 37,102 | ||||||
Vishay Intertechnology | 112,000 | 1,697 | ||||||
VMware, Cl A* (A) | 2,781 | 226 | ||||||
Western Digital | 22,400 | 1,426 | ||||||
Western Union | 81,100 | 1,705 | ||||||
Xerox | 433,022 | 4,049 | ||||||
Xilinx | 3,240 | 175 | ||||||
Zynga, Cl A* | 174,293 | 498 | ||||||
|
| |||||||
| 503,400 | ||||||||
|
| |||||||
Materials — 2.7% | ||||||||
AdvanSix* | 18,181 | 340 | ||||||
| Description | Shares | Market Value ($ Thousands) | ||||||
Cabot | 35,568 | $ | 1,811 | |||||
Celanese, Cl A | 49,835 | 3,953 | ||||||
Crown Holdings* | 24,486 | 1,332 | ||||||
Domtar | 63,676 | 2,500 | ||||||
E.I. du Pont de Nemours | 9,891 | 728 | ||||||
Eastman Chemical | 33,324 | 2,503 | ||||||
Ecolab | 94,609 | 11,044 | ||||||
Graphic Packaging Holding | 5,362 | 67 | ||||||
Huntsman | 174,552 | 3,400 | ||||||
International Paper | 37,354 | 1,820 | ||||||
LyondellBasell Industries, Cl A | 110,403 | 9,972 | ||||||
Monsanto | 5,873 | 603 | ||||||
Mosaic | 49,600 | 1,409 | ||||||
Newmont Mining | 43,147 | 1,400 | ||||||
Owens-Illinois* | 56,900 | 1,045 | ||||||
Packaging Corp of America | 29,600 | 2,509 | ||||||
Reliance Steel & Aluminum | 56,315 | 4,567 | ||||||
Steel Dynamics | 33,288 | 1,181 | ||||||
Trinseo | 25,903 | 1,517 | ||||||
|
| |||||||
| 53,701 | ||||||||
|
| |||||||
Real Estate — 2.6% | ||||||||
American Tower, Cl A‡ | 42,110 | 4,306 | ||||||
Apartment Investment & Management, Cl A‡ | 26,888 | 1,132 | ||||||
Brandywine Realty Trust‡ | 56,000 | 860 | ||||||
Brixmor Property Group‡ | 2,819 | 69 | ||||||
CBL & Associates Properties‡ | 158,884 | 1,884 | ||||||
CBRE Group, Cl A* | 7,400 | 215 | ||||||
Columbia Property Trust‡ | 7,519 | 158 | ||||||
Crown Castle International‡ | 157,567 | 13,150 | ||||||
CyrusOne‡ | 2,460 | 105 | ||||||
DuPont Fabros Technology‡ | 45,421 | 1,847 | ||||||
Equinix‡ | 20,052 | 6,793 | ||||||
Equity Residential‡ | 4,353 | 261 | ||||||
Hospitality Properties Trust‡ | 131,679 | 3,818 | ||||||
Host Hotels & Resorts‡ | 143,533 | 2,561 | ||||||
Hudson Pacific Properties‡ | 46,382 | 1,617 | ||||||
Lexington Realty Trust‡ | 223,000 | 2,304 | ||||||
Mack-Cali Realty‡ | 51,543 | 1,394 | ||||||
Omega Healthcare Investors‡ | 70,289 | 2,071 | ||||||
Outfront Media‡ | 45,433 | 1,145 | ||||||
Piedmont Office Realty Trust, Cl A‡ | 46,680 | 917 | ||||||
Post Properties‡ | 662 | 43 | ||||||
Senior Housing Properties Trust‡ | 48,649 | 879 | ||||||
Simon Property Group‡ | 5,437 | 977 | ||||||
Taubman Centers‡ | 12,628 | 918 | ||||||
VEREIT‡ | 152,600 | 1,265 | ||||||
|
| |||||||
| 50,689 | ||||||||
|
| |||||||
Telecommunication Services — 1.9% |
| |||||||
AT&T | 335,262 | 12,951 | ||||||
CenturyLink | 7,868 | 185 | ||||||
| 4 | SEI Institutional Investments Trust / Semi-Annual Report / November 30, 2016 |
SCHEDULE OF INVESTMENTS (Unaudited)
Large Cap Fund (Concluded)
November 30, 2016
| Description | Shares | Market Value ($ Thousands) | ||||||
Level 3 Communications* | 3,232 | $ | 178 | |||||
SBA Communications, Cl A* | 88,896 | 8,797 | ||||||
Verizon Communications | 295,546 | 14,748 | ||||||
|
| |||||||
| 36,859 | ||||||||
|
| |||||||
Utilities — 2.6% |
| |||||||
AES | 460,844 | 5,277 | ||||||
Ameren | 37,387 | 1,836 | ||||||
American Electric Power | 97,871 | 5,779 | ||||||
CenterPoint Energy | 30,748 | 734 | ||||||
Consolidated Edison | 27,942 | 1,949 | ||||||
DTE Energy | 2,010 | 187 | ||||||
Edison International | 79,569 | 5,472 | ||||||
Entergy | 130,176 | 8,947 | ||||||
Exelon | 124,809 | 4,057 | ||||||
FirstEnergy | 98,851 | 3,093 | ||||||
Hawaiian Electric Industries | 31,707 | 977 | ||||||
NRG Energy | 47,886 | 543 | ||||||
PG&E | 21,926 | 1,289 | ||||||
Pinnacle West Capital | 7,799 | 577 | ||||||
Public Service Enterprise Group | 233,136 | 9,631 | ||||||
SCANA | 13,553 | 956 | ||||||
|
| |||||||
| 51,304 | ||||||||
|
| |||||||
Total Common Stock | 1,908,950 | |||||||
|
| |||||||
AFFILIATED PARTNERSHIP — 0.9% |
| |||||||
SEI Liquidity Fund, L.P. | ||||||||
0. 470%**† (B) | 19,233,399 | 19,234 | ||||||
|
| |||||||
Total Affiliated Partnership | 19,234 | |||||||
|
| |||||||
CASH EQUIVALENT — 3.4% |
| |||||||
SEI Daily Income Trust, | ||||||||
0.210%**† | 67,937,184 | 67,937 | ||||||
|
| |||||||
Total Cash Equivalent | 67,937 | |||||||
|
| |||||||
Total Investments — 100.8% |
| $ | 1,996,121 | |||||
|
| |||||||
A list of the open futures contracts held by the Fund at November 30, 2016, is as follows:
| Type of Contract | Number of Contracts Long | Expiration Date | Unrealized Appreciation ($ Thousands) | |||||||||
S&P 500 Index E-MINI | 77 | Dec-2016 | $ | 323 | ||||||||
S&P Mid Cap 400 Index E-MINI | 6 | Dec-2016 | 77 | |||||||||
|
| |||||||||||
| $ | 400 | |||||||||||
|
| |||||||||||
For the period ended November 30, 2016, the total amount of all open futures contracts, as presented in the table above, are representative of the volume of activity for the derivative type during the period.
Percentages are based on Net Assets of $1,979,550 ($ Thousands).
| * | Non-income producing security. |
| ** | Rate shown is the 7-day effective yield as of November 30, 2016. |
| † | Investment in Affiliated Security (see Note 6). |
| ‡ | Real Estate Investment Trust. |
| †† | Narrow Industries are utilized for compliance purposes, whereas broad sectors are utilized for reporting purposes. |
| (A) | This security or a partial position of this security is on loan at November 30, 2016 (see Note 12). The total market value of securities on loan at November 30, 2016 was $19,084 ($ Thousands). |
| (B) | This security was purchased with cash collateral held from securities on loan (see Note 12). The total market value of such securities as of November 30, 2016 was $19,234 ($ Thousands). |
ADR — American Depositary Receipt
Cl — Class
L.P. — Limited Partnership
S&P — Standard & Poor’s
The following is a list of the level of inputs used as of November 30, 2016, in valuing the Fund’s investments carried at value ($ Thousands):
| Investments in Securities | Level 1 | Level 2 | Level 3 | Total | ||||||||||||
Common Stock | $ | 1,908,950 | $ | — | $ | — | $ | 1,908,950 | ||||||||
Affiliated Partnership | — | 19,234 | — | 19,234 | ||||||||||||
Cash Equivalent | 67,937 | — | — | 67,937 | ||||||||||||
|
|
|
|
|
|
|
| |||||||||
Total Investments in Securities | $ | 1,976,887 | $ | 19,234 | $ | — | $ | 1,996,121 | ||||||||
|
|
|
|
|
|
|
| |||||||||
| Other Financial Instruments | Level 1 | Level 2 | Level 3 | Total | ||||||||||||
Futures Contracts* | ||||||||||||||||
Unrealized Appreciation | $ | 400 | $ | — | $ | — | $ | 400 | ||||||||
|
|
|
|
|
|
|
| |||||||||
| * | Futures contracts are valued at the unrealized appreciation on the instrument. |
For the period ended November 30, 2016, there were no transfers between Level 1 and Level 2 assets and liabilities.
For the period ended November 30, 2016, there were no transfers between Level 2 and Level 3 assets and liabilities.
For more information on valuation inputs, see Note 2 — Significant Accounting Policies in Notes to Financial Statements.
Amounts designated as “—” are $0 or have been rounded to $0.
The accompanying notes are an integral part of the financial statements.
| 5 | SEI Institutional Investments Trust / Semi-Annual Report / November 30, 2016 |
SCHEDULE OF INVESTMENTS (Unaudited)
Large Cap Diversified Alpha Fund
November 30, 2016
| Description | Shares | Market Value ($ Thousands) | ||||||
COMMON STOCK — 94.6% | ||||||||
Consumer Discretionary — 12.1% | ||||||||
Amazon.com* | 76 | $ | 57 | |||||
Bed Bath & Beyond | 793 | 36 | ||||||
Best Buy | 2,682 | 123 | ||||||
Carnival, Cl A | 1,369 | 70 | ||||||
Comcast, Cl A | 418 | 29 | ||||||
Darden Restaurants | 502 | 37 | ||||||
Delphi Automotive | 832 | 53 | ||||||
Dillard’s, Cl A | 1,934 | 138 | ||||||
Dollar General | 7,573 | 586 | ||||||
DR Horton | 2,822 | 78 | ||||||
Ford Motor | 11,954 | 143 | ||||||
General Motors | 9,892 | 342 | ||||||
Goodyear Tire & Rubber | 8,616 | 264 | ||||||
Home Depot | 428 | 55 | ||||||
Hyatt Hotels, Cl A* | 1,746 | 90 | ||||||
International Game Technology | 1,981 | 51 | ||||||
Interpublic Group | 2,922 | 70 | ||||||
John Wiley & Sons, Cl A | 1,583 | 87 | ||||||
Kohl’s | 2,702 | 145 | ||||||
L Brands | 7,528 | 529 | ||||||
Liberty Global* | 10,657 | 324 | ||||||
Liberty Global, Cl A* | 4,426 | 139 | ||||||
Liberty Interactive QVC Group, Cl A* | 23,640 | 490 | ||||||
Lowe’s | 4,156 | 293 | ||||||
Macy’s | 5,935 | 250 | ||||||
Magna International, Cl A | 4,731 | 191 | ||||||
Michael Kors Holdings* | 3,567 | 166 | ||||||
Norwegian Cruise Line Holdings* | 1,092 | 43 | ||||||
Omnicom Group | 5,995 | 521 | ||||||
PVH | 734 | 78 | ||||||
Ross Stores | 1,283 | 87 | ||||||
Scripps Networks Interactive, Cl A | 1,038 | 72 | ||||||
Signet Jewelers | 1,003 | 92 | ||||||
Staples | 8,842 | 85 | ||||||
TJX | 727 | 57 | ||||||
Toll Brothers* | 3,108 | 92 | ||||||
Toyota Motor ADR | 2,013 | 239 | ||||||
TripAdvisor* | 7,274 | 351 | ||||||
Tupperware Brands | 1,651 | 92 | ||||||
Whirlpool | 175 | 28 | ||||||
|
| |||||||
| 6,673 | ||||||||
|
| |||||||
Consumer Staples — 7.2% | ||||||||
Altria Group | 1,108 | 71 | ||||||
Bunge | 853 | 58 | ||||||
Campbell Soup | 4,784 | 272 | ||||||
CVS Health | 6,093 | 469 | ||||||
Dr. Pepper Snapple Group | 2,530 | 219 | ||||||
Hershey | 277 | 27 | ||||||
Ingredion | 220 | 26 | ||||||
JM Smucker | 2,992 | 377 | ||||||
| Description | Shares | Market Value ($ Thousands) | ||||||
Kroger | 13,247 | $ | 428 | |||||
Molson Coors Brewing, Cl B | 1,265 | 124 | ||||||
PepsiCo | 3,064 | 307 | ||||||
Philip Morris International | 3,426 | 302 | ||||||
Procter & Gamble | 6,022 | 497 | ||||||
Reynolds American | 6,293 | 340 | ||||||
Sysco | 2,787 | 148 | ||||||
Walgreens Boots Alliance | 1,319 | 112 | ||||||
Wal-Mart Stores | 2,855 | 201 | ||||||
|
| |||||||
| 3,978 | ||||||||
|
| |||||||
Energy — 5.8% | ||||||||
Anadarko Petroleum | 2,519 | 174 | ||||||
Apache | 2,068 | 136 | ||||||
Baker Hughes | 1,777 | 114 | ||||||
BP PLC ADR | 14,637 | 513 | ||||||
Canadian Natural Resources | 8,380 | 283 | ||||||
Chevron | 1,297 | 145 | ||||||
ConocoPhillips | 2,605 | 126 | ||||||
Devon Energy | 3,408 | 165 | ||||||
Exxon Mobil | 2,244 | 196 | ||||||
Helmerich & Payne | 634 | 48 | ||||||
Marathon Petroleum | 854 | 40 | ||||||
Nabors Industries | 2,160 | 35 | ||||||
Occidental Petroleum | 7,105 | 507 | ||||||
Oceaneering International | 2,192 | 58 | ||||||
Royal Dutch Shell ADR, Cl A | 6,348 | 324 | ||||||
Schlumberger | 498 | 42 | ||||||
Spectra Energy | 1,740 | 71 | ||||||
Tesoro | 1,350 | 110 | ||||||
Valero Energy | 1,520 | 94 | ||||||
|
| |||||||
| 3,181 | ||||||||
|
| |||||||
Financials — 13.8% | ||||||||
Aflac | 4,892 | 349 | ||||||
Allstate | 4,340 | 304 | ||||||
American Financial Group | 932 | 77 | ||||||
Ameriprise Financial | 283 | 32 | ||||||
Aspen Insurance Holdings | 3,302 | 168 | ||||||
Bank of America | 41,104 | 868 | ||||||
Berkshire Hathaway, Cl B* | 1,044 | 164 | ||||||
Blackstone Group (A) | 7,776 | 200 | ||||||
Charles Schwab | 1,417 | 55 | ||||||
Citigroup | 13,498 | 761 | ||||||
Cullen/Frost Bankers | 3,029 | 249 | ||||||
Discover Financial Services | 448 | 30 | ||||||
Intercontinental Exchange | 10,000 | 554 | ||||||
Invesco | 3,979 | 125 | ||||||
JPMorgan Chase | 8,513 | 683 | ||||||
KKR (A) | 23,028 | 352 | ||||||
Marsh & McLennan | 4,575 | 317 | ||||||
MetLife | 2,529 | 139 | ||||||
| 1 | SEI Institutional Investments Trust / Semi-Annual Report / November 30, 2016 |
SCHEDULE OF INVESTMENTS (Unaudited)
Large Cap Diversified Alpha Fund (Continued)
November 30, 2016
| Description | Shares | Market Value ($ Thousands) | ||||||
Morgan Stanley | 5,394 | $ | 223 | |||||
PNC Financial Services Group | 1,038 | 115 | ||||||
Popular | 3,464 | 141 | ||||||
Principal Financial Group | 2,995 | 173 | ||||||
Prudential Financial | 1,155 | 116 | ||||||
Regions Financial | 3,874 | 53 | ||||||
S&P Global | 1,024 | 122 | ||||||
Santander Consumer USA Holdings* | 8,535 | 118 | ||||||
State Street | 8,708 | 686 | ||||||
Synchrony Financial | 2,119 | 73 | ||||||
Two Harbors Investment‡ | 7,230 | 63 | ||||||
Validus Holdings | 560 | 30 | ||||||
Wells Fargo | 5,287 | 280 | ||||||
|
| |||||||
| 7,620 | ||||||||
|
| |||||||
Health Care — 14.3% | ||||||||
Abbott Laboratories | 4,260 | 162 | ||||||
AbbVie | 3,643 | 221 | ||||||
Allergan | 2,937 | 571 | ||||||
AmerisourceBergen | 3,816 | 298 | ||||||
Amgen | 2,201 | 317 | ||||||
Baxter International | 7,783 | 345 | ||||||
Becton Dickinson | 2,974 | 503 | ||||||
Biogen* | 2,663 | 783 | ||||||
Celgene* | 7,062 | 837 | ||||||
Cigna | 1,466 | 197 | ||||||
DENTSPLY SIRONA | 5,426 | 316 | ||||||
Gilead Sciences | 7,372 | 543 | ||||||
HCA Holdings* | 1,269 | 90 | ||||||
Horizon Pharma* | 4,292 | 85 | ||||||
Jazz Pharmaceuticals* | 193 | 20 | ||||||
Johnson & Johnson | 6,447 | 718 | ||||||
Mallinckrodt* | 656 | 35 | ||||||
Merck | 6,690 | 409 | ||||||
Mylan* | 2,586 | 95 | ||||||
Pfizer | 3,867 | 124 | ||||||
Quintiles IMS Holdings* | 7,011 | 539 | ||||||
United Therapeutics* | 207 | 26 | ||||||
UnitedHealth Group | 3,747 | 593 | ||||||
WellCare Health Plans* | 606 | 83 | ||||||
|
| |||||||
| 7,910 | ||||||||
|
| |||||||
Industrials — 10.3% | ||||||||
3M | 3,295 | 566 | ||||||
AECOM Technology* | 3,000 | 109 | ||||||
AerCap Holdings* | 3,710 | 159 | ||||||
American Airlines Group | 3,369 | 156 | ||||||
B/E Aerospace | 576 | 35 | ||||||
Caterpillar | 751 | 72 | ||||||
Chicago Bridge & Iron | 2,275 | 76 | ||||||
CSX | 948 | 34 | ||||||
Cummins | 1,581 | 224 | ||||||
| Description | Shares | Market Value ($ Thousands) | ||||||
Delta Air Lines | 10,638 | $ | 513 | |||||
Eaton | 4,053 | 270 | ||||||
FedEx | 289 | 55 | ||||||
General Electric | 800 | 25 | ||||||
Huntington Ingalls Industries | 354 | 63 | ||||||
Illinois Tool Works | 3,506 | 439 | ||||||
Ingersoll-Rand | 1,854 | 138 | ||||||
Manpowergroup | 1,953 | 167 | ||||||
Nielsen Holdings | 9,900 | 427 | ||||||
Norfolk Southern | 602 | 64 | ||||||
Northrop Grumman | 1,127 | 281 | ||||||
Owens Corning | 3,928 | 202 | ||||||
Raytheon | 798 | 119 | ||||||
Southwest Airlines | 3,223 | 150 | ||||||
Spirit AeroSystems Holdings, Cl A | 4,538 | 264 | ||||||
Stanley Black & Decker | 911 | 108 | ||||||
Terex | 3,275 | 100 | ||||||
United Continental Holdings* | 798 | 55 | ||||||
United Parcel Service, Cl B | 237 | 28 | ||||||
Waste Management | 1,327 | 92 | ||||||
WW Grainger | 2,898 | 668 | ||||||
|
| |||||||
| 5,659 | ||||||||
|
| |||||||
Information Technology — 23.5% | ||||||||
Alphabet, Cl A* | 1,239 | 961 | ||||||
Alphabet, Cl C* | 400 | 303 | ||||||
Amdocs | 4,119 | 243 | ||||||
Apple | 2,975 | 329 | ||||||
Applied Materials | 11,556 | 372 | ||||||
Arrow Electronics* | 1,836 | 125 | ||||||
Automatic Data Processing | 3,657 | 351 | ||||||
CA | 4,409 | 141 | ||||||
Cisco Systems | 13,621 | 406 | ||||||
Citrix Systems* | 706 | 61 | ||||||
Cognizant Technology Solutions, Cl A* | 3,078 | 170 | ||||||
eBay* | 25,315 | 704 | ||||||
Electronic Arts* | 6,304 | 500 | ||||||
Facebook, Cl A* | 5,273 | 624 | ||||||
Genpact* | 3,703 | 89 | ||||||
Hewlett Packard Enterprise | 5,090 | 121 | ||||||
HP | 14,415 | 222 | ||||||
Ingram Micro, Cl A* | 4,732 | 177 | ||||||
Intel | 12,321 | 428 | ||||||
International Business Machines | 1,640 | 266 | ||||||
Intuit | 3,004 | 342 | ||||||
Jabil Circuit | 2,881 | 61 | ||||||
Juniper Networks | 2,043 | 56 | ||||||
Kla-Tencor | 353 | 28 | ||||||
Lam Research | 705 | 75 | ||||||
MasterCard, Cl A | 5,431 | 555 | ||||||
Microchip Technology | 4,461 | 295 | ||||||
Micron Technology* | 14,992 | 293 | ||||||
| 2 | SEI Institutional Investments Trust / Semi-Annual Report / November 30, 2016 |
SCHEDULE OF INVESTMENTS (Unaudited)
Large Cap Diversified Alpha Fund (Continued)
November 30, 2016
| Description | Shares | Market Value ($ Thousands) | ||||||
Microsoft | 18,212 | $ | 1,097 | |||||
Motorola Solutions | 2,338 | 188 | ||||||
Oracle | 2,001 | 80 | ||||||
PayPal Holdings* | 18,728 | 736 | ||||||
Qualcomm | 13,251 | 903 | ||||||
Symantec | 21,191 | 517 | ||||||
Teradata* | 5,001 | 134 | ||||||
Texas Instruments | 1,858 | 137 | ||||||
Visa, Cl A | 9,773 | 756 | ||||||
Xerox | 16,387 | 153 | ||||||
|
| |||||||
| 12,999 | ||||||||
|
| |||||||
Materials — 2.3% | ||||||||
Cabot | 3,555 | 181 | ||||||
Crown Holdings* | 1,178 | 64 | ||||||
Dow Chemical | 3,244 | 181 | ||||||
Eastman Chemical | 3,157 | 237 | ||||||
Huntsman | 3,356 | 65 | ||||||
International Paper | 1,051 | 51 | ||||||
Louisiana-Pacific* | 7,551 | 146 | ||||||
LyondellBasell Industries, Cl A | 1,421 | 128 | ||||||
Newmont Mining | 972 | 32 | ||||||
Reliance Steel & Aluminum | 2,293 | 186 | ||||||
|
| |||||||
| 1,271 | ||||||||
|
| |||||||
Real Estate — 2.4% | ||||||||
CBRE Group, Cl A* | 6,850 | 199 | ||||||
Columbia Property Trust‡ | 1,127 | 24 | ||||||
Crown Castle International‡ | 8,780 | 733 | ||||||
Equinix‡ | 921 | 312 | ||||||
Host Hotels & Resorts‡ | 2,378 | 42 | ||||||
|
| |||||||
| 1,310 | ||||||||
|
| |||||||
Telecommunication Services — 0.6% | ||||||||
China Mobile ADR | 2,681 | 147 | ||||||
Verizon Communications | 4,091 | 204 | ||||||
|
| |||||||
| 351 | ||||||||
|
| |||||||
Utilities — 2.3% | ||||||||
Ameren | 668 | 33 | ||||||
Calpine* | 3,099 | 35 | ||||||
Consolidated Edison | 4,591 | 320 | ||||||
DTE Energy | 1,179 | 110 | ||||||
Entergy | 1,356 | 93 | ||||||
Exelon | 2,760 | 90 | ||||||
PG&E | 3,355 | 197 | ||||||
Pinnacle West Capital | 3,808 | 281 | ||||||
Public Service Enterprise Group | 1,893 | 79 | ||||||
| Description | Shares | Market Value ($ Thousands) | ||||||
WEC Energy Group | 511 | $ | 29 | |||||
|
| |||||||
| 1,267 | ||||||||
|
| |||||||
Total Common Stock | 52,219 | |||||||
|
| |||||||
CASH EQUIVALENT — 5.2% | ||||||||
SEI Daily Income Trust, | ||||||||
0.210%**† | 2,861,536 | 2,862 | ||||||
|
| |||||||
Total Cash Equivalent | 2,862 | |||||||
|
| |||||||
Total Investments — 99.8% | $ | 55,081 | ||||||
|
| |||||||
A list of the open futures contracts held by the Fund at November 30, 2016, is as follows:
| Type of Contract | Number of Contracts Long | Expiration Date | Unrealized Appreciation ($ Thousands) | |||||||||
S&P 500 Index E-MINI | 1 | Dec-2016 | $ | 1 | ||||||||
|
| |||||||||||
For the period ended November 30, 2016, the total amount of all open futures contracts, as presented in the table above, are representative of the volume of activity for the derivative type during the period.
Percentages are based on Net Assets of $55,190 ($ Thousands).
| * | Non-income producing security. |
| ** | Rate shown is the 7-day effective yield as of November 30, 2016. |
| † | Investment in Affiliated Security (see Note 6). |
| ‡ | Real Estate Investment Trust. |
| (A) | Security is a Master Limited Partnership. At November 30, 2016, such securities amounted to $552 ($ Thousands), or 1.00% of Net Assets (See Note 2). |
ADR — American Depositary Receipt
Cl — Class
PLC — Public Limited Company
S&P — Standard & Poor’s
The following is a list of the level of inputs used as of November 30, 2016, in valuing the Fund’s investments carried at value ($ Thousands):
| Investments in Securities | Level 1 | Level 2 | Level 3 | Total | ||||||||||||
Common Stock | $ | 52,219 | $ | — | $ | — | $ | 52,219 | ||||||||
Cash Equivalent | 2,862 | — | — | 2,862 | ||||||||||||
|
|
|
|
|
|
|
| |||||||||
Total Investments in Securities | $ | 55,081 | $ | — | $ | — | $ | 55,081 | ||||||||
|
|
|
|
|
|
|
| |||||||||
| Other Financial Instruments | Level 1 | Level 2 | Level 3 | Total | ||||||||||||
Futures Contracts* | ||||||||||||||||
Unrealized Appreciation | $ | 1 | $ | — | $ | — | $ | 1 | ||||||||
|
|
|
|
|
|
|
| |||||||||
| * | Futures contracts are valued at the unrealized appreciation on the instrument. |
For the period ended November 30, 2016, there were no transfers between Level 1 and Level 2 assets and liabilities.
| 3 | SEI Institutional Investments Trust / Semi-Annual Report / November 30, 2016 |
SCHEDULE OF INVESTMENTS (Unaudited)
Large Cap Diversified Alpha Fund (Concluded)
November 30, 2016
For the period ended November 30, 2016, there were no transfers between Level 2 and Level 3 assets and liabilities.
For more information on valuation inputs, see Note 2 — Significant Accounting Policies in Notes to Financial Statements.
Amounts designated as “—” are $0 or have been rounded to $0.
The accompanying notes are an integral part of the financial statements.
| 4 | SEI Institutional Investments Trust / Semi-Annual Report / November 30, 2016 |
SCHEDULE OF INVESTMENTS (Unaudited)
Large Cap Disciplined Equity Fund
November 30, 2016
| Description | Shares | Market Value ($ Thousands) | ||||||
COMMON STOCK — 96.5% |
| |||||||
Consumer Discretionary — 10.5% |
| |||||||
Adient* | 19,363 | $ | 1,037 | |||||
Advance Auto Parts | 37,141 | 6,304 | ||||||
Amazon.com* | 33,118 | 24,857 | ||||||
AutoNation* | 200 | 9 | ||||||
AutoZone* | 26,512 | 20,764 | ||||||
Bed Bath & Beyond | 23,700 | 1,062 | ||||||
Best Buy | 67,900 | 3,103 | ||||||
Bloomin’ Brands | 80,050 | 1,489 | ||||||
BorgWarner | 700 | 25 | ||||||
Burlington Stores* | 10,900 | 958 | ||||||
Carmax* (A) | 53,240 | 3,077 | ||||||
Carnival, Cl A | 1,600 | 82 | ||||||
CBS, Cl B | 31,400 | 1,907 | ||||||
Charter Communications, Cl A* | 6,900 | 1,900 | ||||||
Chico’s FAS | 125,000 | 1,914 | ||||||
Chipotle Mexican Grill, Cl A* | 100 | 40 | ||||||
Cinemark Holdings | 13,200 | 526 | ||||||
Coach | 74,400 | 2,707 | ||||||
Comcast, Cl A | 848,420 | 58,974 | ||||||
Cooper-Standard Holdings* | 19,700 | 1,878 | ||||||
Darden Restaurants | 1,600 | 117 | ||||||
Deckers Outdoor* | 43,330 | 2,577 | ||||||
Delphi Automotive | 184,415 | 11,803 | ||||||
Discovery Communications, Cl A* | 600 | 16 | ||||||
Discovery Communications, Cl C* | 34,332 | 908 | ||||||
Dollar General | 23,800 | 1,840 | ||||||
Dollar Tree* | 4,400 | 388 | ||||||
DR Horton | 262,200 | 7,268 | ||||||
Expedia | 400 | 50 | ||||||
Express* | 136,800 | 1,828 | ||||||
Extended Stay America | 50,600 | 787 | ||||||
Foot Locker | 25,470 | 1,825 | ||||||
Ford Motor | 56,100 | 671 | ||||||
Fox Factory Holding* | 65,825 | 1,652 | ||||||
Francesca’s Holdings* | 51,200 | 818 | ||||||
GameStop, Cl A | 24,600 | 607 | ||||||
Gap | 900 | 22 | ||||||
Garmin (A) | 4,700 | 245 | ||||||
General Motors | 30,616 | 1,057 | ||||||
Genuine Parts | 21,324 | 2,052 | ||||||
Goodyear Tire & Rubber | 10,700 | 328 | ||||||
H&R Block | 800 | 18 | ||||||
Hanesbrands | 1,300 | 30 | ||||||
Harley-Davidson | 800 | 49 | ||||||
Harman International Industries | 300 | 33 | ||||||
Hasbro | 14,400 | 1,230 | ||||||
Home Depot | 250,411 | 32,403 | ||||||
HSN | 25,700 | 979 | ||||||
Interpublic Group | 318,830 | 7,674 | ||||||
J.C. Penney* (A) | 299,310 | 2,834 | ||||||
Kohl’s | 800 | 43 | ||||||
| Description | Shares | Market Value ($ Thousands) | ||||||
L Brands | 6,900 | $ | 485 | |||||
Leggett & Platt | 28,600 | 1,375 | ||||||
Lennar, Cl A | 8,400 | 357 | ||||||
Liberty Interactive, Cl A* | 185,657 | 3,845 | ||||||
Liberty Tripadvisor Holdings, Cl A* | 53,800 | 864 | ||||||
LKQ* | 1,200 | 39 | ||||||
Lowe’s | 139,725 | 9,858 | ||||||
Macy’s | 182,000 | 7,680 | ||||||
Madison Square Garden, Cl A* | 51,653 | 8,969 | ||||||
Marriott International, Cl A | 1,160 | 91 | ||||||
Mattel | 72,500 | 2,289 | ||||||
McDonald’s | 268,346 | 32,006 | ||||||
Michael Kors Holdings* | 76,616 | 3,562 | ||||||
Modine Manufacturing* | 130,923 | 1,538 | ||||||
Mohawk Industries* | 2,400 | 474 | ||||||
Murphy USA* | 745 | 51 | ||||||
NetFlix* | 4,100 | 480 | ||||||
Newell Brands | 24,300 | 1,142 | ||||||
News, Cl A | 2,100 | 24 | ||||||
NIKE, Cl B | 13,200 | 661 | ||||||
Nordstrom (A) | 500 | 28 | ||||||
Omnicom Group | 59,082 | 5,137 | ||||||
O’Reilly Automotive* | 1,300 | 357 | ||||||
Priceline Group* | 900 | 1,353 | ||||||
PulteGroup | 1,200 | 23 | ||||||
PVH | 14,300 | 1,515 | ||||||
Ralph Lauren, Cl A | 200 | 21 | ||||||
Ross Stores | 192,060 | 12,981 | ||||||
Royal Caribbean Cruises | 2,100 | 170 | ||||||
Sally Beauty Holdings* | 45,820 | 1,200 | ||||||
Scholastic | 41,785 | 1,842 | ||||||
Scripps Networks Interactive, Cl A | 9,400 | 651 | ||||||
Signet Jewelers | 200 | 18 | ||||||
Smith & Wesson Holding* (A) | 55,400 | 1,293 | ||||||
Staples | 2,300 | 22 | ||||||
Starbucks | 60,600 | 3,513 | ||||||
Steven Madden* | 45,440 | 1,684 | ||||||
Target | 200,418 | 15,480 | ||||||
TEGNA | 95,500 | 2,142 | ||||||
Tenneco* | 12,600 | 743 | ||||||
Tiffany | 500 | 41 | ||||||
Time Warner | 23,705 | 2,177 | ||||||
TJX | 3,000 | 235 | ||||||
Tractor Supply | 4,600 | 345 | ||||||
TRI Pointe Homes* | 41,400 | 481 | ||||||
TripAdvisor* | 500 | 24 | ||||||
Twenty-First Century Fox, Cl A | 20,300 | 571 | ||||||
Twenty-First Century Fox, Cl B | 1,700 | 48 | ||||||
Ulta Salon Cosmetics & Fragrance* | 300 | 78 | ||||||
Under Armour, Cl A* (A) | 600 | 19 | ||||||
Under Armour, Cl C* | 580 | 15 | ||||||
Urban Outfitters* | 300 | 9 | ||||||
| 1 | SEI Institutional Investments Trust / Semi-Annual Report / November 30, 2016 |
SCHEDULE OF INVESTMENTS (Unaudited)
Large Cap Disciplined Equity Fund (continued)
November 30, 2016
| Description | Shares | Market Value ($ Thousands) | ||||||
VF | 1,200 | $ | 65 | |||||
Viacom, Cl B | 9,500 | 356 | ||||||
Vista Outdoor* | 28,925 | 1,161 | ||||||
Walt Disney | 86,150 | 8,539 | ||||||
Whirlpool | 39,620 | 6,436 | ||||||
Williams-Sonoma | 113,256 | 6,204 | ||||||
Wyndham Worldwide | 400 | 29 | ||||||
Wynn Resorts (A) | 14,100 | 1,438 | ||||||
Yum! Brands | 42,900 | 2,719 | ||||||
|
| |||||||
| 371,718 | ||||||||
|
| |||||||
Consumer Staples — 9.9% | ||||||||
Altria Group | 523,627 | 33,476 | ||||||
Archer-Daniels-Midland | 106,124 | 4,588 | ||||||
Avon Products* | 112,000 | 601 | ||||||
Brown-Forman, Cl B | 7,200 | 327 | ||||||
Campbell Soup | 37,200 | 2,116 | ||||||
Church & Dwight | 900 | 39 | ||||||
Clorox | 600 | 69 | ||||||
Coca-Cola | 529,422 | 21,362 | ||||||
Colgate-Palmolive | 183,515 | 11,971 | ||||||
ConAgra Foods | 57,400 | 2,106 | ||||||
Constellation Brands, Cl A | 27,700 | 4,187 | ||||||
Costco Wholesale | 1,400 | 210 | ||||||
Coty, Cl A | 3,900 | 73 | ||||||
CVS Health | 79,608 | 6,121 | ||||||
Dr. Pepper Snapple Group | 94,600 | 8,206 | ||||||
Estee Lauder, Cl A | 2,000 | 155 | ||||||
General Mills | 47,300 | 2,883 | ||||||
Hershey | 500 | 48 | ||||||
Hormel Foods | 13,800 | 473 | ||||||
JM Smucker | 900 | 113 | ||||||
Kellogg | 71,075 | 5,117 | ||||||
Kimberly-Clark | 72,801 | 8,417 | ||||||
Kraft Heinz | 225,962 | 18,450 | ||||||
Kroger | 55,100 | 1,780 | ||||||
Lamb Weston Holdings* | 9,467 | 317 | ||||||
McCormick | 2,800 | 255 | ||||||
Mead Johnson Nutrition, Cl A | 900 | 65 | ||||||
Molson Coors Brewing, Cl B | 175,795 | 17,233 | ||||||
Mondelez International, Cl A | 550,450 | 22,701 | ||||||
Monster Beverage* | 6,000 | 269 | ||||||
Nu Skin Enterprises, Cl A | 85,309 | 4,451 | ||||||
PepsiCo | �� | 527,918 | 52,845 | |||||
Philip Morris International | 373,067 | 32,934 | ||||||
Procter & Gamble | 385,411 | 31,781 | ||||||
Reynolds American | 60,226 | 3,258 | ||||||
Sanderson Farms (A) | 16,600 | 1,339 | ||||||
Sprouts Farmers Market* | 63,035 | 1,261 | ||||||
Sysco | 22,900 | 1,219 | ||||||
Tyson Foods, Cl A | 181,200 | 10,294 | ||||||
Walgreens Boots Alliance | 185,545 | 15,721 | ||||||
| Description | Shares | Market Value ($ Thousands) | ||||||
Wal-Mart Stores | 298,412 | $ | 21,017 | |||||
Whole Foods Market | 1,300 | 40 | ||||||
|
| |||||||
| 349,888 | ||||||||
|
| |||||||
Energy — 6.2% | ||||||||
Anadarko Petroleum | 77,400 | 5,352 | ||||||
Antero Resources* | 69,340 | 1,698 | ||||||
Apache | 36,600 | 2,414 | ||||||
Baker Hughes | 2,400 | 154 | ||||||
Cabot Oil & Gas | 47,300 | 1,046 | ||||||
Chesapeake Energy* (A) | 15,500 | 109 | ||||||
Chevron | 251,824 | 28,094 | ||||||
Cimarex Energy | 12,300 | 1,696 | ||||||
Concho Resources* | 7,400 | 1,058 | ||||||
ConocoPhillips | 385,704 | 18,714 | ||||||
Devon Energy | 2,900 | 140 | ||||||
Energen* | 18,800 | 1,167 | ||||||
EOG Resources | 48,110 | 4,932 | ||||||
EQT | 600 | 42 | ||||||
Extraction Oil & Gas* | 53,595 | 1,261 | ||||||
Exxon Mobil | 343,863 | 30,019 | ||||||
FMC Technologies* | 900 | 31 | ||||||
Halliburton | 55,300 | 2,936 | ||||||
Helmerich & Payne (A) | 26,600 | 2,012 | ||||||
Hess | 1,200 | 67 | ||||||
HollyFrontier | 189,055 | 5,439 | ||||||
Kinder Morgan | 166,100 | 3,687 | ||||||
Magellan Midstream Partners (B) | 130,744 | 9,054 | ||||||
Marathon Oil | 900 | 16 | ||||||
Marathon Petroleum | 148,601 | 6,987 | ||||||
Matador Resources* (A) | 51,120 | 1,362 | ||||||
McDermott International* | 40,500 | 279 | ||||||
Murphy Oil | 1,900 | 65 | ||||||
National Oilwell Varco | 1,600 | 60 | ||||||
Newfield Exploration* | 209,800 | 9,487 | ||||||
Newpark Resources* | 45,300 | 333 | ||||||
Noble Energy | 277,165 | 10,577 | ||||||
Occidental Petroleum | 16,900 | 1,206 | ||||||
Oceaneering International | 50,475 | 1,345 | ||||||
ONEOK | 39,100 | 2,148 | ||||||
Phillips 66 | 87,300 | 7,253 | ||||||
Pioneer Natural Resources | 34,008 | 6,497 | ||||||
Range Resources | 37,800 | 1,330 | ||||||
Rice Energy* | 124,500 | 3,032 | ||||||
Schlumberger | 233,553 | 19,630 | ||||||
Southwestern Energy* | 47,300 | 537 | ||||||
Spectra Energy | 52,382 | 2,145 | ||||||
Suncor Energy | 400,373 | 12,756 | ||||||
Tesoro | 95,700 | 7,785 | ||||||
Transocean* (A) | 1,700 | 22 | ||||||
Valero Energy | 49,500 | 3,047 | ||||||
| 2 | SEI Institutional Investments Trust / Semi-Annual Report / November 30, 2016 |
SCHEDULE OF INVESTMENTS (Unaudited)
Large Cap Disciplined Equity Fund (Continued)
November 30, 2016
| Description | Shares | Market Value ($ Thousands) | ||||||
Williams | 23,700 | $ | 728 | |||||
|
| |||||||
| 219,749 | ||||||||
|
| |||||||
Financials — 12.9% | ||||||||
Affiliated Managers Group* | 200 | 30 | ||||||
Aflac | 72,200 | 5,154 | ||||||
Allstate | 91,400 | 6,391 | ||||||
American Express | 163,771 | 11,798 | ||||||
American International Group | 14,900 | 944 | ||||||
Ameriprise Financial | 636 | 73 | ||||||
Aon | 73,145 | 8,346 | ||||||
Arch Capital Group* | 23,340 | 1,931 | ||||||
Argo Group International Holdings | 33,085 | 2,099 | ||||||
Arthur J Gallagher | 12,700 | 639 | ||||||
Assurant | 14,400 | 1,243 | ||||||
Assured Guaranty | 154,439 | 5,523 | ||||||
Bank of America | 2,504,500 | 52,895 | ||||||
Bank of New York Mellon | 290,230 | 13,763 | ||||||
BB&T | 2,900 | 131 | ||||||
Berkshire Hathaway, Cl B* | 265,214 | 41,755 | ||||||
BlackRock, Cl A | 1,400 | 519 | ||||||
Capital One Financial | 2,100 | 177 | ||||||
Charles Schwab | 234,825 | 9,078 | ||||||
Chimera Investment‡ | 175,095 | 2,970 | ||||||
Chubb | 7,141 | 914 | ||||||
Cincinnati Financial | 36,100 | 2,770 | ||||||
Citigroup | 768,332 | 43,326 | ||||||
Citizens Financial Group | 1,800 | 60 | ||||||
CME Group, Cl A | 187,619 | 21,184 | ||||||
Comerica | 37,310 | 2,379 | ||||||
Discover Financial Services | 187,058 | 12,677 | ||||||
Donnelley Financial Solutions* | 33,413 | 637 | ||||||
E*TRADE Financial* | 900 | 31 | ||||||
East West Bancorp | 35,758 | 1,712 | ||||||
Fifth Third Bancorp | 2,500 | 65 | ||||||
Franklin Resources | 1,200 | 47 | ||||||
Goldman Sachs Group | 51,100 | 11,206 | ||||||
Hartford Financial Services Group | 5,000 | 236 | ||||||
Home BancShares | 73,500 | 1,901 | ||||||
Huntington Bancshares | 690,543 | 8,604 | ||||||
Intercontinental Exchange | 175,345 | 9,714 | ||||||
Invesco | 93,959 | 2,942 | ||||||
Invesco Mortgage Capital‡ | 45,500 | 678 | ||||||
JPMorgan Chase | 348,455 | 27,936 | ||||||
KeyCorp | 725,400 | 12,557 | ||||||
Legg Mason | 300 | 10 | ||||||
Leucadia National | 1,200 | 26 | ||||||
Lincoln National | 5,700 | 365 | ||||||
Loews | 1,100 | 49 | ||||||
M&T Bank | 742 | 107 | ||||||
Marsh & McLennan | 95,191 | 6,598 | ||||||
MetLife | 218,200 | 12,003 | ||||||
| Description | Shares | Market Value ($ Thousands) | ||||||
Moody’s | 600 | $ | 60 | |||||
Morgan Stanley | 5,000 | 207 | ||||||
Morningstar | 19,635 | 1,432 | ||||||
Nasdaq | 30,100 | 1,929 | ||||||
Navient | 117,734 | 2,029 | ||||||
Northern Trust | 1,800 | 148 | ||||||
Old Republic International | 427,950 | 7,647 | ||||||
PacWest Bancorp | 29,300 | 1,502 | ||||||
Paramount Group‡ | 29,200 | 459 | ||||||
People’s United Financial | 31,300 | 586 | ||||||
PNC Financial Services Group | 40,800 | 4,510 | ||||||
Popular | 2,612 | 106 | ||||||
Principal Financial Group | 1,200 | 69 | ||||||
Progressive | 315,230 | 10,497 | ||||||
Prudential Financial | 1,400 | 141 | ||||||
Raymond James Financial | 21,500 | 1,547 | ||||||
Regions Financial | 4,500 | 61 | ||||||
Reinsurance Group of America, Cl A | 15,670 | 1,913 | ||||||
S&P Global | 65,739 | 7,822 | ||||||
Signature Bank NY* | 11,775 | 1,765 | ||||||
SLM* | 321,862 | 3,241 | ||||||
State Street | 9,800 | 772 | ||||||
SunTrust Banks | 206,740 | 10,740 | ||||||
Synchrony Financial | 285,365 | 9,862 | ||||||
T. Rowe Price Group | 1,100 | 81 | ||||||
Torchmark | 400 | 28 | ||||||
Travelers | 4,600 | 521 | ||||||
Unum Group | 800 | 34 | ||||||
US Bancorp | 464,639 | 23,055 | ||||||
Validus Holdings | 25,125 | 1,365 | ||||||
VEREIT‡ | 199,900 | 1,657 | ||||||
Webster Financial | 35,770 | 1,775 | ||||||
Wells Fargo | 224,055 | 11,857 | ||||||
Willis Towers Watson | 500 | 62 | ||||||
XL Group | 50,200 | 1,814 | ||||||
Zions Bancorporation | 700 | 28 | ||||||
|
| |||||||
| 457,515 | ||||||||
|
| |||||||
Health Care — 13.8% | ||||||||
Abbott Laboratories | 45,700 | 1,740 | ||||||
AbbVie | 188,181 | 11,441 | ||||||
Aetna | 3,595 | 470 | ||||||
Agilent Technologies | 144,780 | 6,367 | ||||||
Alexion Pharmaceuticals* | 500 | 61 | ||||||
Allergan | 75,131 | 14,598 | ||||||
AmerisourceBergen | 600 | 47 | ||||||
Amgen | 161,669 | 23,292 | ||||||
Anthem | 19,900 | 2,836 | ||||||
Baxter International | 270,298 | 11,993 | ||||||
Becton Dickinson | 37,000 | 6,257 | ||||||
Biogen* | 22,300 | 6,558 | ||||||
Boston Scientific* | 668,105 | 13,669 | ||||||
| 3 | SEI Institutional Investments Trust / Semi-Annual Report / November 30, 2016 |
SCHEDULE OF INVESTMENTS (Unaudited)
Large Cap Disciplined Equity Fund (Continued)
November 30, 2016
| Description | Shares | Market Value ($ Thousands) | ||||||
Bristol-Myers Squibb | 118,570 | $ | 6,692 | |||||
C.R. Bard | 21,400 | 4,506 | ||||||
Cardinal Health | 6,600 | 469 | ||||||
Catalent* | 34,380 | 823 | ||||||
Celgene* | 212,520 | 25,186 | ||||||
Cellectis ADR* | 44,115 | 744 | ||||||
Centene* | 3,100 | 179 | ||||||
Cerner* | 112,800 | 5,615 | ||||||
Cigna | 9,145 | 1,232 | ||||||
Cooper | 10,200 | 1,678 | ||||||
Danaher | 64,800 | 5,065 | ||||||
DaVita HealthCare Partners* | 700 | 44 | ||||||
DENTSPLY SIRONA | 22,283 | 1,296 | ||||||
Edwards Lifesciences* | 40,300 | 3,339 | ||||||
Eli Lilly | 84,050 | 5,641 | ||||||
Endo International* | 700 | 11 | ||||||
Express Scripts Holding* | 327,428 | 24,845 | ||||||
Gilead Sciences | 177,864 | 13,109 | ||||||
HCA Holdings* | 1,000 | 71 | ||||||
Henry Schein* | 10,500 | 1,564 | ||||||
Hologic* | 186,000 | 7,120 | ||||||
Humana | 57,326 | 12,190 | ||||||
Illumina* | 700 | 93 | ||||||
INC Research Holdings, Cl A* | 23,755 | 1,176 | ||||||
Intuitive Surgical* | 2,200 | 1,416 | ||||||
Jazz Pharmaceuticals* | 15,100 | 1,565 | ||||||
Johnson & Johnson | 588,969 | 65,552 | ||||||
Laboratory Corp of America Holdings* | 300 | 38 | ||||||
Mallinckrodt* | 107,000 | 5,639 | ||||||
McKesson | 10,900 | 1,568 | ||||||
Medtronic | 80,676 | 5,890 | ||||||
Merck | 521,651 | 31,920 | ||||||
Mettler Toledo International* | 3,300 | 1,360 | ||||||
Mylan* | 158,597 | 5,806 | ||||||
Patterson | 300 | 12 | ||||||
PerkinElmer | 3,900 | 198 | ||||||
Perrigo | 500 | 43 | ||||||
Pfizer | 1,602,205 | 51,495 | ||||||
Quest Diagnostics | 18,700 | 1,636 | ||||||
Quintiles IMS Holdings* | 50,470 | 3,878 | ||||||
Regeneron Pharmaceuticals* | 200 | 76 | ||||||
St. Jude Medical | 8,813 | 698 | ||||||
STERIS | 25,785 | 1,692 | ||||||
Stryker | 94,510 | 10,742 | ||||||
Thermo Fisher Scientific | 77,135 | 10,807 | ||||||
United Therapeutics* | 12,630 | 1,587 | ||||||
UnitedHealth Group | 263,864 | 41,775 | ||||||
Universal Health Services, Cl B | 2,100 | 258 | ||||||
Valeant Pharmaceuticals International* (A) | 148,020 | 2,337 | ||||||
Varian Medical Systems* | 400 | 36 | ||||||
Vertex Pharmaceuticals* | 800 | 65 | ||||||
VWR* | 64,095 | 1,743 | ||||||
| Description | Shares | Market Value ($ Thousands) | ||||||
Waters* | 6,200 | $ | 834 | |||||
Zimmer Biomet Holdings | 20,300 | 2,068 | ||||||
Zoetis, Cl A | 320,230 | 16,133 | ||||||
|
| |||||||
| 490,884 | ||||||||
|
| |||||||
Industrials — 11.2% | ||||||||
3M | 128,562 | 22,079 | ||||||
Acuity Brands | 3,700 | 930 | ||||||
Alaska Air Group | 24,620 | 2,025 | ||||||
Allegion | 5,633 | 377 | ||||||
Altra Industrial Motion | 34,325 | 1,201 | ||||||
American Airlines Group | 2,200 | 102 | ||||||
Ametek | 700 | 33 | ||||||
Arconic | 1,500 | 29 | ||||||
Argan | 10,800 | 653 | ||||||
Boeing | 79,000 | 11,894 | ||||||
BWX Technologies | 48,400 | 1,895 | ||||||
C.H. Robinson Worldwide | 2,300 | 172 | ||||||
Canadian National Railway | 110,750 | 7,401 | ||||||
Canadian Pacific Railway | 53,180 | 8,150 | ||||||
Caterpillar | 101,845 | 9,732 | ||||||
Cintas | 12,300 | 1,410 | ||||||
Continental Building Products* | 85,470 | 1,915 | ||||||
Copart* | 107,990 | 5,909 | ||||||
CSX | 3,300 | 118 | ||||||
Cummins | 8,100 | 1,148 | ||||||
Deere | 135,390 | 13,566 | ||||||
Delta Air Lines | 4,100 | 198 | ||||||
Deluxe | 17,175 | 1,163 | ||||||
Dover | 3,600 | 261 | ||||||
Dun & Bradstreet | 8,000 | 974 | ||||||
Eaton | 21,500 | 1,430 | ||||||
Echo Global Logistics* | 34,904 | 876 | ||||||
Emerson Electric | 13,000 | 734 | ||||||
Equifax | 33,900 | 3,880 | ||||||
Expeditors International of Washington | 600 | 32 | ||||||
Fastenal | 2,100 | 100 | ||||||
FedEx | 46,000 | 8,817 | ||||||
Flowserve | 10,200 | 484 | ||||||
Fluor | 16,800 | 899 | ||||||
Fortive | 1,100 | 60 | ||||||
Fortune Brands Home & Security | 17,300 | 954 | ||||||
Generac Holdings* | 33,240 | 1,362 | ||||||
General Dynamics | 20,300 | 3,560 | ||||||
General Electric | 1,369,934 | 42,139 | ||||||
Honeywell International | 239,797 | 27,322 | ||||||
Huntington Ingalls Industries | 29,900 | 5,345 | ||||||
Illinois Tool Works | 46,454 | 5,815 | ||||||
Ingersoll-Rand | 95,800 | 7,141 | ||||||
Insperity | �� | 5,700 | 413 | |||||
Jacobs Engineering Group* | 27,600 | 1,711 | ||||||
JB Hunt Transport Services | 4,000 | 381 | ||||||
| 4 | SEI Institutional Investments Trust / Semi-Annual Report / November 30, 2016 |
SCHEDULE OF INVESTMENTS (Unaudited)
Large Cap Disciplined Equity Fund (Continued)
November 30, 2016
| Description | Shares | Market Value ($ Thousands) | ||||||
Johnson Controls International | 326,740 | $ | 14,697 | |||||
Kansas City Southern | 10,000 | 887 | ||||||
Kirby* | 27,090 | 1,719 | ||||||
L-3 Communications Holdings, Cl 3 | 7,700 | 1,215 | ||||||
Lockheed Martin | 56,146 | 14,893 | ||||||
LSC Communications | 28,999 | 599 | ||||||
Masco | 292,202 | 9,248 | ||||||
Nielsen Holdings | 186,959 | 8,058 | ||||||
Norfolk Southern | 1,200 | 128 | ||||||
Northrop Grumman | 50,400 | 12,582 | ||||||
Owens Corning | 25,490 | 1,310 | ||||||
Paccar | 1,200 | 75 | ||||||
Parker Hannifin | 8,300 | 1,153 | ||||||
Pentair | 19,200 | 1,103 | ||||||
PGT* | 121,215 | 1,345 | ||||||
Pitney Bowes | 140,864 | 2,021 | ||||||
Quanta Services* | 36,500 | 1,231 | ||||||
Raytheon | 105,090 | 15,715 | ||||||
Regal-Beloit | 35,240 | 2,569 | ||||||
Republic Services | 124,024 | 6,882 | ||||||
Robert Half International | 89,204 | 4,003 | ||||||
Rockwell Automation | 53,625 | 7,170 | ||||||
Rockwell Collins | 500 | 46 | ||||||
Roper Technologies | 1,100 | 199 | ||||||
Ryder System | 200 | 16 | ||||||
Snap-on | 3,000 | 502 | ||||||
Southwest Airlines | 149,600 | 6,973 | ||||||
Stanley Black & Decker | 64,200 | 7,616 | ||||||
Steelcase, Cl A | 21,400 | 333 | ||||||
Stericycle* | 300 | 22 | ||||||
Tennant | 12,425 | 933 | ||||||
Textron | 2,200 | 101 | ||||||
TransDigm Group* | 5,300 | 1,333 | ||||||
TriMas* | 80,585 | 1,729 | ||||||
Union Pacific | 102,515 | 10,388 | ||||||
United Continental Holdings* | 1,700 | 117 | ||||||
United Parcel Service, Cl B | 97,835 | 11,341 | ||||||
United Rentals* | 15,900 | 1,608 | ||||||
United Technologies | 205,801 | 22,169 | ||||||
Universal Forest Products | 9,000 | 894 | ||||||
Verisk Analytics, Cl A* | 1,200 | 100 | ||||||
Waste Connections | 63,429 | 4,848 | ||||||
Waste Management | 115,366 | 8,020 | ||||||
Woodward Governor | 16,695 | 1,131 | ||||||
WW Grainger (A) | 200 | 46 | ||||||
Xylem | 46,700 | 2,409 | ||||||
|
| |||||||
| 398,267 | ||||||||
|
| |||||||
Information Technology — 21.2% |
| |||||||
Accenture, Cl A | 168,595 | 20,135 | ||||||
Activision Blizzard | 75,000 | 2,746 | ||||||
Adobe Systems* | 95,200 | 9,788 | ||||||
| Description | Shares | Market Value ($ Thousands) | ||||||
Akamai Technologies* | 600 | $ | 40 | |||||
Alliance Data Systems | 200 | 46 | ||||||
Alphabet, Cl A* | 63,409 | 49,198 | ||||||
Alphabet, Cl C* | 74,725 | 56,645 | ||||||
Amdocs | 310,381 | 18,303 | ||||||
Amphenol, Cl A | 18,300 | 1,249 | ||||||
Analog Devices | 1,100 | 82 | ||||||
Apple | 985,841 | 108,955 | ||||||
Applied Materials | 746,684 | 24,043 | ||||||
Autodesk* | 900 | 65 | ||||||
Automatic Data Processing | 7,100 | 682 | ||||||
Bottomline Technologies de* | 50,315 | 1,261 | ||||||
Broadcom | 24,243 | 4,133 | ||||||
Broadridge Financial Solutions | 72,810 | 4,714 | ||||||
BroadSoft* | 23,330 | 968 | ||||||
Brocade Communications Systems | 125,023 | 1,543 | ||||||
Brooks Automation | 65,630 | 1,070 | ||||||
CA | 69,920 | 2,235 | ||||||
Cardtronics* | 19,900 | 984 | ||||||
Ciena* | 72,505 | 1,555 | ||||||
Cisco Systems | 1,630,247 | 48,614 | ||||||
Citrix Systems* | 70,800 | 6,141 | ||||||
Cognizant Technology Solutions, Cl A* | 143,400 | 7,899 | ||||||
Corning | 48,700 | 1,170 | ||||||
CSRA | 600 | 19 | ||||||
Cypress Semiconductor | 115,920 | 1,304 | ||||||
DST Systems | 5,100 | 526 | ||||||
eBay* | 882,535 | 24,543 | ||||||
Electronic Arts* | 36,000 | 2,853 | ||||||
F5 Networks* | 27,000 | 3,800 | ||||||
Facebook, Cl A* | 424,755 | 50,300 | ||||||
Fidelity National Information Services | 72,470 | 5,594 | ||||||
First Solar* | 15,000 | 455 | ||||||
Fiserv* | 26,500 | 2,772 | ||||||
FLIR Systems | 46,180 | 1,658 | ||||||
Global Payments | 500 | 34 | ||||||
Harris | 6,200 | 642 | ||||||
Hewlett Packard Enterprise | 513,716 | 12,226 | ||||||
HP | 352,000 | 5,421 | ||||||
Intel | 872,549 | 30,277 | ||||||
International Business Machines | 42,141 | 6,836 | ||||||
Intuit | 74,800 | 8,503 | ||||||
j2 Global | 22,525 | 1,656 | ||||||
Juniper Networks | 1,500 | 41 | ||||||
Kla-Tencor | 800 | 64 | ||||||
Lam Research | 16,600 | 1,760 | ||||||
Leidos Holdings | 46,025 | 2,357 | ||||||
Linear Technology | 7,350 | 460 | ||||||
Littelfuse | 6,130 | 894 | ||||||
MACOM Technology Solutions Holdings* (A) | 25,080 | 1,250 | ||||||
MasterCard, Cl A | 63,700 | 6,510 | ||||||
Microchip Technology | 28,100 | 1,860 | ||||||
| 5 | SEI Institutional Investments Trust / Semi-Annual Report / November 30, 2016 |
SCHEDULE OF INVESTMENTS (Unaudited)
Large Cap Disciplined Equity Fund (Continued)
November 30, 2016
| Description | Shares | Market Value ($ Thousands) | ||||||
Micron Technology* | 3,600 | $ | 70 | |||||
Microsemi* | 32,420 | 1,775 | ||||||
Microsoft | 996,974 | 60,078 | ||||||
Motorola Solutions | 98,805 | 7,929 | ||||||
NCR* | 49,270 | 1,909 | ||||||
NetApp | 1,100 | 40 | ||||||
NETGEAR* | 5,200 | 279 | ||||||
Nvidia | 92,600 | 8,538 | ||||||
Oracle | 662,100 | 26,610 | ||||||
Paychex | 20,800 | 1,226 | ||||||
PayPal Holdings* | 238,346 | 9,362 | ||||||
Qorvo* | 2,000 | 107 | ||||||
QUALCOMM | 244,600 | 16,665 | ||||||
Red Hat* | 19,885 | 1,573 | ||||||
salesforce.com inc* | 4,600 | 331 | ||||||
Seagate Technology | 22,800 | 914 | ||||||
Skyworks Solutions | 75,385 | 5,793 | ||||||
Symantec | 71,976 | 1,756 | ||||||
SYNNEX | 3,200 | 374 | ||||||
TE Connectivity | 1,700 | 115 | ||||||
Teradata* | 400 | 11 | ||||||
Texas Instruments | 232,986 | 17,225 | ||||||
Total System Services | 43,400 | 2,136 | ||||||
Vantiv, Cl A* | 153,265 | 8,649 | ||||||
VeriSign* (A) | 500 | 39 | ||||||
Versum Materials* | 50,405 | 1,233 | ||||||
Visa, Cl A | 164,761 | 12,739 | ||||||
Western Digital | 122,783 | 7,816 | ||||||
Western Union | 3,300 | 69 | ||||||
Xerox | 523,578 | 4,895 | ||||||
Xilinx | 2,000 | 108 | ||||||
Yahoo!* | 30,800 | 1,263 | ||||||
Yelp, Cl A* | 75,609 | 2,813 | ||||||
|
| |||||||
| 753,319 | ||||||||
|
| |||||||
Materials — 2.6% | ||||||||
AdvanSix* | 97,107 | 1,816 | ||||||
Air Products & Chemicals | 700 | 101 | ||||||
Albemarle | 28,300 | 2,484 | ||||||
Avery Dennison | 24,900 | 1,794 | ||||||
Ball | 5,200 | 390 | ||||||
Calgon Carbon | 47,965 | 849 | ||||||
CF Industries Holdings | 800 | 23 | ||||||
Crown Holdings* | 153,115 | 8,328 | ||||||
Dow Chemical | 4,000 | 223 | ||||||
E.I. du Pont de Nemours | 108,576 | 7,992 | ||||||
Eastman Chemical | 1,400 | 105 | ||||||
Ecolab | 900 | 105 | ||||||
FMC | 9,400 | 528 | ||||||
Freeport-McMoRan, Cl B* | 385,100 | 5,911 | ||||||
Graphic Packaging Holding | 130,350 | 1,639 | ||||||
Greif, Cl A | 13,700 | 704 | ||||||
| Description | Shares | Market Value ($ Thousands) | ||||||
Ingevity* | 34,440 | $ | 1,804 | |||||
Innospec | 22,425 | 1,473 | ||||||
International Flavors & Fragrances | 13,000 | 1,574 | ||||||
International Paper | 30,500 | 1,486 | ||||||
LyondellBasell Industries, Cl A | 106,200 | 9,592 | ||||||
Martin Marietta Materials | 5,400 | 1,185 | ||||||
Monsanto | 14,006 | 1,439 | ||||||
Mosaic | 1,200 | 34 | ||||||
Newmont Mining | 394,989 | 12,813 | ||||||
Nucor | 44,800 | 2,786 | ||||||
Owens-Illinois* | 107,900 | 1,982 | ||||||
Packaging Corp of America | 7,500 | 636 | ||||||
PPG Industries | 67,994 | 6,523 | ||||||
Praxair | 1,000 | 120 | ||||||
Sealed Air | 800 | 36 | ||||||
Sherwin-Williams | 600 | 161 | ||||||
Steel Dynamics | 70,000 | 2,484 | ||||||
Trinseo | 37,100 | 2,172 | ||||||
Valvoline (A) | 80,325 | 1,686 | ||||||
Vulcan Materials | 62,979 | 7,913 | ||||||
Westlake Chemical | 19,500 | 1,154 | ||||||
WestRock | 13,100 | 671 | ||||||
|
| |||||||
| 92,716 | ||||||||
|
| |||||||
Real Estate — 2.3% | ||||||||
American Campus Communities‡ | 123,555 | 5,821 | ||||||
American Tower, Cl A‡ | 4,000 | 409 | ||||||
Apartment Investment & Management, Cl A‡ | 18,300 | 770 | ||||||
Apple Hospitality‡ (A) | 47,700 | 880 | ||||||
AvalonBay Communities‡ | 3,000 | 493 | ||||||
Boston Properties‡ | 600 | 74 | ||||||
CBRE Group, Cl A* | 1,000 | 29 | ||||||
CoreCivic‡ | 38,882 | 883 | ||||||
Crown Castle International‡ | 3,500 | 292 | ||||||
DCT Industrial Trust‡ | 42,765 | 1,965 | ||||||
DDR‡ | 200,285 | 3,048 | ||||||
Digital Realty Trust‡ (A) | 44,300 | 4,090 | ||||||
Equinix‡ | 14,410 | 4,882 | ||||||
Equity Residential‡ | 35,506 | 2,131 | ||||||
Essex Property Trust‡ | 700 | 151 | ||||||
Extra Space Storage‡ | 19,750 | 1,386 | ||||||
Federal Realty Investment Trust‡ | 6,300 | 885 | ||||||
Forest City Realty Trust, Cl A‡ | 80,600 | 1,490 | ||||||
Franklin Street Properties‡ | 30,800 | 387 | ||||||
General Growth Properties‡ | 259,833 | 6,584 | ||||||
GEO Group‡ | 23,800 | 792 | ||||||
HCP‡ | 34,900 | 1,031 | ||||||
Host Hotels & Resorts‡ | 3,200 | 57 | ||||||
Iron Mountain‡ | 152,742 | 5,041 | ||||||
Jones Lang LaSalle | 21,220 | 2,149 | ||||||
Kilroy Realty‡ | 26,770 | 1,937 | ||||||
Kimco Realty‡ | 56,200 | 1,435 | ||||||
| 6 | SEI Institutional Investments Trust / Semi-Annual Report / November 30, 2016 |
SCHEDULE OF INVESTMENTS (Unaudited)
Large Cap Disciplined Equity Fund (Continued)
November 30, 2016
| Description | Shares | Market Value ($ Thousands) | ||||||
Lamar Advertising, Cl A‡ | 40,984 | $ | 2,717 | |||||
Lexington Realty Trust‡ | 6,500 | 67 | ||||||
Macerich‡ | 34,991 | 2,376 | ||||||
Mid-America Apartment Communities‡ | 64,780 | 5,936 | ||||||
Prologis‡ | 52,700 | 2,682 | ||||||
Public Storage‡ | 2,700 | 565 | ||||||
Quality Care Properties*‡ | 7,800 | 117 | ||||||
Realty Income‡ | 49,700 | 2,755 | ||||||
Ryman Hospitality Properties‡ | 20,300 | 1,196 | ||||||
Simon Property Group‡ | 33,282 | 5,979 | ||||||
SL Green Realty‡ | 300 | 32 | ||||||
Tanger Factory Outlet Centers‡ | 48,040 | 1,656 | ||||||
UDR‡ | 54,940 | 1,870 | ||||||
Ventas‡ | 46,000 | 2,779 | ||||||
Vornado Realty Trust‡ | 1,300 | 127 | ||||||
Welltower‡ | 6,500 | 408 | ||||||
Weyerhaeuser‡ | 2,900 | 89 | ||||||
WP Carey‡ | 23,300 | 1,354 | ||||||
|
| |||||||
| 81,797 | ||||||||
|
| |||||||
Telecommunication Services — 2.7% |
| |||||||
AT&T | 1,128,925 | 43,610 | ||||||
CenturyLink | 9,000 | 212 | ||||||
Frontier Communications (A) | 119,800 | 437 | ||||||
Level 3 Communications* | 9,246 | 509 | ||||||
Verizon Communications | 1,028,433 | 51,319 | ||||||
|
| |||||||
| 96,087 | ||||||||
|
| |||||||
Utilities — 3.2% |
| |||||||
AES | 730,592 | 8,365 | ||||||
Alliant Energy | 39,400 | 1,415 | ||||||
Ameren | 30,800 | 1,513 | ||||||
American Electric Power | 205,725 | 12,148 | ||||||
American Water Works | 48,800 | 3,537 | ||||||
AmeriGas Partners (B) | 2,830 | 127 | ||||||
Avangrid | 22,610 | 818 | ||||||
CenterPoint Energy | 57,500 | 1,372 | ||||||
CMS Energy | 74,645 | 3,002 | ||||||
Consolidated Edison | 5,200 | 363 | ||||||
Dominion Resources | 2,400 | 176 | ||||||
DTE Energy | 47,900 | 4,459 | ||||||
Duke Energy | 86,800 | 6,403 | ||||||
Edison International | 32,900 | 2,262 | ||||||
Entergy | 27,600 | 1,897 | ||||||
Eversource Energy | 7,300 | 377 | ||||||
Exelon | 76,600 | 2,490 | ||||||
FirstEnergy | 120,000 | 3,755 | ||||||
MDU Resources Group | 51,900 | 1,444 | ||||||
NextEra Energy | 12,600 | 1,439 | ||||||
NiSource | 91,700 | 2,012 | ||||||
NRG Energy | 72,100 | 818 | ||||||
PG&E | 317,291 | 18,657 | ||||||
| Description | Shares | Market Value ($ Thousands) | ||||||
Pinnacle West Capital | 75,967 | $ | 5,616 | |||||
PNM Resources | 52,960 | 1,674 | ||||||
PPL | 290,100 | 9,707 | ||||||
Public Service Enterprise Group | 80,300 | 3,317 | ||||||
SCANA | 40,700 | 2,871 | ||||||
Sempra Energy | 13,800 | 1,377 | ||||||
Southern | 21,000 | 983 | ||||||
UGI | 51,500 | 2,307 | ||||||
WEC Energy Group | 36,153 | 2,025 | ||||||
Xcel Energy | 163,890 | 6,393 | ||||||
|
| |||||||
| 115,119 | ||||||||
|
| |||||||
Total Common Stock |
| 3,427,059 | ||||||
|
| |||||||
| Number of Rights | ||||||||
RIGHTS — 0.0% | ||||||||
United States — 0.0% | ||||||||
Safeway - PDC*‡‡ | 85,749 | 4 | ||||||
Safeway CVR - Casa Ley*‡‡ | 85,749 | 87 | ||||||
|
| |||||||
Total Rights |
| 91 | ||||||
|
| |||||||
| Face Amount (Thousands) | ||||||||
U.S. TREASURY OBLIGATION — 0.0% |
| |||||||
U.S. Treasury Bill | ||||||||
0.335%, 12/15/2016 (C) (E) | $ | 200 | 200 | |||||
|
| |||||||
Total U.S. Treasury Obligation |
| 200 | ||||||
|
| |||||||
| Shares | ||||||||
AFFILIATED PARTNERSHIP — 0.6% |
| |||||||
SEI Liquidity Fund, L.P. | ||||||||
0.470%**† (D) | 20,864,164 | 20,865 | ||||||
|
| |||||||
Total Affiliated Partnership |
| 20,865 | ||||||
|
| |||||||
| 7 | SEI Institutional Investments Trust / Semi-Annual Report / November 30, 2016 |
SCHEDULE OF INVESTMENTS (Unaudited)
Large Cap Disciplined Equity Fund (Concluded)
November 30, 2016
| Description | Shares | Market Value ($ Thousands) | ||||||
CASH EQUIVALENT — 4.6% |
| |||||||
SEI Daily Income Trust, | ||||||||
0.210%**† | 165,409,465 | $ | 165,409 | |||||
|
| |||||||
Total Cash Equivalent |
| 165,409 | ||||||
|
| |||||||
Total Investments — 101.7% |
| $ | 3,613,624 | |||||
|
| |||||||
A list of the open futures contracts held by the Fund at November 30, 2016, is as follows:
| Type of Contract | Number of Contracts Long | Expiration Date | Unrealized Appreciation ($ Thousands) | |||||||||
S&P 500 Index E-MINI | 160 | Dec-2016 | $ | 356 | ||||||||
|
| |||||||||||
For the period ended November 30, 2016, the total amount of all open futures contracts, as presented in the table above, are representative of the volume of activity for the derivative type during the period.
Percentages are based on Net Assets of $3,551,854 ($ Thousands).
| * | Non-income producing security. |
| ** | Rate shown is the 7-day effective yield as of November 30, 2016. |
| † | Investment in Affiliated Security (see Note 6). |
| ‡ | Real Estate Investment Trust. |
| ‡‡ | Expiration date unavailable. |
| (A) | This security or a partial position of this security is on loan at November 30, 2016 (see Note 12). The total market value of securities on loan at November 30, 2016 was $20,511 ($ Thousands). |
| (B) | Security is a Master Limited Partnership. At November 30, 2016, such securities amounted to $9,181 ($ Thousands), or 0.26% of Net Assets (See Note 2). |
| (C) | Security, or portion thereof, has been pledged as collateral on open futures contracts. |
| (D) | This security was purchased with cash collateral held from securities on loan (see Note 12). The total market value of such securities as of November 30, 2016 was $20,865 ($ Thousands). |
| (E) | The rate reported is the effective yield at the time of purchase. |
ADR — American Depositary Receipt
Cl — Class
L.P. — Limited Partnership
S&P — Standard & Poor’s
The following is a list of the level of inputs used as of November 30, 2016, in valuing the Fund’s investments carried at value ($ Thousands):
| Investments in Securities | Level 1 | Level 2 | Level 3 | Total | ||||||||||||
Common Stock | $ | 3,427,059 | $ | — | $ | — | $ | 3,427,059 | ||||||||
Rights | — | 91 | — | 91 | ||||||||||||
U.S. Treasury Obligation | — | 200 | — | 200 | ||||||||||||
Affiliated Partnership | — | 20,865 | — | 20,865 | ||||||||||||
Cash Equivalent | 165,409 | — | — | 165,409 | ||||||||||||
|
|
|
|
|
|
|
| |||||||||
Total Investments in Securities | $ | 3,592,468 | $ | 21,156 | $ | — | $ | 3,613,624 | ||||||||
|
|
|
|
|
|
|
| |||||||||
| Other Financial Instruments | Level 1 | Level 2 | Level 3 | Total | ||||||||||||
Futures Contracts* | ||||||||||||||||
Unrealized Appreciation | $ | 356 | $ | — | $ | — | $ | 356 | ||||||||
|
|
|
|
|
|
|
| |||||||||
| * | Futures contracts are valued at the unrealized appreciation on the instrument. |
For the period ended November 30, 2016, there were no transfers between Level 1 and Level 2 assets and liabilities.
For the period ended November 30, 2016, there were no transfers between Level 2 and Level 3 assets and liabilities.
For more information on valuation inputs, see Note 2 — Significant Accounting Policies in Notes to Financial Statements.
Amounts designated as “—” are $0 or have been rounded to $0.
The accompanying notes are an integral part of the financial statements.
| 8 | SEI Institutional Investments Trust / Semi-Annual Report / November 30, 2016 |
SCHEDULE OF INVESTMENTS (Unaudited)
Large Cap Index Fund
November 30, 2016
| Description | Shares | Market Value ($ Thousands) | ||||||
COMMON STOCK — 98.0% |
| |||||||
Consumer Discretionary — 12.4% |
| |||||||
Adient* | 9,127 | $ | 489 | |||||
Advance Auto Parts | 7,008 | 1,189 | ||||||
Amazon.com* | 39,889 | 29,940 | ||||||
AMC Networks, Cl A* | 5,485 | 303 | ||||||
Aramark | 23,800 | 819 | ||||||
AutoNation* | 6,732 | 301 | ||||||
AutoZone* | 2,907 | 2,277 | ||||||
Bed Bath & Beyond | 14,915 | 668 | ||||||
Best Buy | 27,647 | 1,263 | ||||||
BorgWarner | 22,064 | 786 | ||||||
Brinker International | 5,283 | 281 | ||||||
Brunswick | 9,400 | 471 | ||||||
Burlington Stores* | 6,900 | 607 | ||||||
Cabela’s* | 4,800 | 299 | ||||||
Cable One | 457 | 270 | ||||||
CalAtlantic Group | 7,300 | 244 | ||||||
Carmax* (A) | 19,660 | 1,136 | ||||||
Carnival, Cl A | 41,100 | 2,113 | ||||||
Carter’s | 5,100 | 466 | ||||||
CBS, Cl B | 40,099 | 2,435 | ||||||
Charter Communications, Cl A* | 20,797 | 5,726 | ||||||
Chipotle Mexican Grill, Cl A* | 2,819 | 1,117 | ||||||
Choice Hotels International | 3,584 | 184 | ||||||
Cinemark Holdings | 11,000 | 438 | ||||||
Clear Channel Outdoor Holdings, Cl A* | 700 | 4 | ||||||
Coach | 27,567 | 1,003 | ||||||
Comcast, Cl A | 247,625 | 17,212 | ||||||
CST Brands | 7,148 | 343 | ||||||
Darden Restaurants | 11,922 | 874 | ||||||
Delphi Automotive | 27,100 | 1,734 | ||||||
Dick’s Sporting Goods | 8,758 | 517 | ||||||
Dillard’s, Cl A | 1,900 | 136 | ||||||
Discovery Communications, Cl A* | 14,500 | 393 | ||||||
Discovery Communications, Cl C* | 23,100 | 611 | ||||||
DISH Network, Cl A* | 21,762 | 1,250 | ||||||
Dollar General | 28,200 | 2,180 | ||||||
Dollar Tree* | 22,434 | 1,978 | ||||||
Domino’s Pizza | 5,000 | 840 | ||||||
DR Horton | 33,768 | 936 | ||||||
Dunkin’ Brands Group | 9,000 | 489 | ||||||
Expedia | 12,022 | 1,491 | ||||||
Extended Stay America | 5,900 | 92 | ||||||
Foot Locker | 13,469 | 965 | ||||||
Ford Motor | 405,484 | 4,850 | ||||||
GameStop, Cl A (A) | 10,100 | 249 | ||||||
Gap | 21,721 | 542 | ||||||
Garmin (A) | 11,200 | 584 | ||||||
General Motors | 146,200 | 5,048 | ||||||
Gentex | 29,264 | 541 | ||||||
Genuine Parts | 14,511 | 1,396 | ||||||
Goodyear Tire & Rubber | 26,852 | 824 | ||||||
| Description | Shares | Market Value ($ Thousands) | ||||||
Graham Holdings, Cl B | 457 | $ | 224 | |||||
Groupon, Cl A* | 36,000 | 143 | ||||||
H&R Block | 23,325 | 517 | ||||||
Hanesbrands | 37,172 | 864 | ||||||
Harley-Davidson | 18,103 | 1,102 | ||||||
Harman International Industries | 7,168 | 784 | ||||||
Hasbro | 11,267 | 962 | ||||||
Hilton Worldwide Holdings | 51,700 | 1,296 | ||||||
Home Depot | 127,915 | 16,552 | ||||||
Hyatt Hotels, Cl A* | 2,200 | 113 | ||||||
International Game Technology | 8,400 | 217 | ||||||
Interpublic Group | 40,675 | 979 | ||||||
J.C. Penney* (A) | 29,251 | 277 | ||||||
John Wiley & Sons, Cl A | 4,042 | 222 | ||||||
Kate Spade* | 11,900 | 177 | ||||||
Kohl’s | 18,119 | 975 | ||||||
L Brands | 24,157 | 1,696 | ||||||
Las Vegas Sands | 36,593 | 2,293 | ||||||
Lear | 7,500 | 971 | ||||||
Leggett & Platt | 13,012 | 625 | ||||||
Lennar, Cl A | 18,030 | 767 | ||||||
Lennar, Cl B | 1,200 | 41 | ||||||
Liberty Broadband, Cl A* | 2,780 | 193 | ||||||
Liberty Broadband, Cl C* | 10,108 | 721 | ||||||
Liberty Expedia Holdings, Cl A* | 5,433 | 239 | ||||||
Liberty Interactive QVC Group, Cl A* | 44,430 | 920 | ||||||
Liberty SiriusXM Group, Cl A* | 8,320 | 302 | ||||||
Liberty SiriusXM Group, Cl C* | 18,640 | 667 | ||||||
Liberty Ventures, Ser A* | 8,149 | 318 | ||||||
Lions Gate Entertainment* (A) | 9,800 | 229 | ||||||
Live Nation* | 13,600 | 376 | ||||||
LKQ* | 30,500 | 1,001 | ||||||
Lowe’s | 92,810 | 6,548 | ||||||
lululemon athletica* | 10,000 | 570 | ||||||
Macy’s | 30,330 | 1,280 | ||||||
Madison Square Garden, Cl A* | 1,786 | 310 | ||||||
Marriott International, Cl A | 32,394 | 2,552 | ||||||
Mattel | 34,142 | 1,078 | ||||||
McDonald’s | 90,680 | 10,815 | ||||||
MGM Resorts International* | 46,639 | 1,339 | ||||||
Michael Kors Holdings* | 16,200 | 753 | ||||||
Michaels* | 9,500 | 232 | ||||||
Mohawk Industries* | 6,066 | 1,198 | ||||||
Murphy USA* | 3,588 | 245 | ||||||
NetFlix* | 42,500 | 4,973 | ||||||
Newell Brands | 46,693 | 2,195 | ||||||
News | 10,800 | 129 | ||||||
News, Cl A | 37,846 | 438 | ||||||
NIKE, Cl B | 135,268 | 6,773 | ||||||
Nordstrom (A) | 12,712 | 711 | ||||||
Norwegian Cruise Line Holdings* | 15,600 | 621 | ||||||
NVR* | 354 | 565 | ||||||
| 1 | SEI Institutional Investments Trust / Semi-Annual Report / November 30, 2016 |
SCHEDULE OF INVESTMENTS (Unaudited)
Large Cap Index Fund (Continued)
November 30, 2016
| Description | Shares | Market Value ($ Thousands) | ||||||
Omnicom Group | 23,444 | $ | 2,038 | |||||
O’Reilly Automotive* | 9,440 | 2,591 | ||||||
Panera Bread, Cl A* | 2,262 | 480 | ||||||
Penske Auto Group | 4,000 | 200 | ||||||
Polaris Industries (A) | 5,900 | 513 | ||||||
Pool | 4,000 | 402 | ||||||
Priceline Group* | 5,132 | 7,717 | ||||||
PulteGroup | 34,945 | 659 | ||||||
PVH | 7,900 | 837 | ||||||
Ralph Lauren, Cl A | 5,780 | 605 | ||||||
Regal Entertainment Group, Cl A (A) | 7,388 | 169 | ||||||
Ross Stores | 39,076 | 2,641 | ||||||
Royal Caribbean Cruises | 16,900 | 1,368 | ||||||
Sally Beauty Holdings* | 14,200 | 372 | ||||||
Scripps Networks Interactive, Cl A | 8,253 | 572 | ||||||
Service International | 19,394 | 523 | ||||||
ServiceMaster Global Holdings* | 13,300 | 508 | ||||||
Signet Jewelers (A) | 7,800 | 712 | ||||||
Sirius XM Holdings (A) | 174,400 | 797 | ||||||
Six Flags Entertainment | 7,500 | 432 | ||||||
Skechers U.S.A., Cl A* | 13,400 | 305 | ||||||
Staples | 64,464 | 623 | ||||||
Starbucks | 147,512 | 8,551 | ||||||
Starz* | 8,820 | 299 | ||||||
Target | 61,585 | 4,757 | ||||||
TEGNA | 22,559 | 506 | ||||||
Tempur Sealy International* (A) | 5,600 | 355 | ||||||
Tesla Motors* (A) | 12,437 | 2,356 | ||||||
Thor Industries | 4,900 | 493 | ||||||
Tiffany | 10,925 | 901 | ||||||
Time Warner | 81,479 | 7,481 | ||||||
TJX | 68,808 | 5,390 | ||||||
Toll Brothers* | 15,751 | 467 | ||||||
Tractor Supply | 13,400 | 1,006 | ||||||
Tribune Media, Cl A | 7,200 | 259 | ||||||
TripAdvisor* | 11,367 | 549 | ||||||
Tupperware Brands | 4,800 | 266 | ||||||
Twenty-First Century Fox, Cl A | 108,085 | 3,038 | ||||||
Twenty-First Century Fox, Cl B | 49,500 | 1,389 | ||||||
Ulta Salon Cosmetics & Fragrance* | 5,752 | 1,493 | ||||||
Under Armour, Cl A* (A) | 18,400 | 567 | ||||||
Under Armour, Cl C* | 18,821 | 485 | ||||||
Urban Outfitters* | 8,820 | 279 | ||||||
Vail Resorts | 4,500 | 713 | ||||||
VF | 33,968 | 1,852 | ||||||
Viacom, Cl A | 1,200 | 50 | ||||||
Viacom, Cl B | 34,869 | 1,307 | ||||||
Vista Outdoor* | 5,672 | 228 | ||||||
Visteon* | 3,300 | 260 | ||||||
Walt Disney | 166,772 | 16,530 | ||||||
Wendy’s | 20,075 | 252 | ||||||
Whirlpool | 7,516 | 1,221 | ||||||
| Description | Shares | Market Value ($ Thousands) | ||||||
Williams-Sonoma | 9,062 | $ | 496 | |||||
Wyndham Worldwide | 10,868 | 782 | ||||||
Wynn Resorts (A) | 7,896 | 805 | ||||||
Yum China Holdings* | 38,448 | 1,081 | ||||||
Yum! Brands | 37,148 | 2,355 | ||||||
|
| |||||||
| 274,875 | ||||||||
|
| |||||||
Consumer Staples — 8.5% | ||||||||
Altria Group | 201,440 | 12,878 | ||||||
Archer-Daniels-Midland | 57,179 | 2,472 | ||||||
Blue Buffalo Pet Products* | 5,600 | 131 | ||||||
Brown-Forman, Cl A | 5,000 | 236 | ||||||
Brown-Forman, Cl B | 19,954 | 905 | ||||||
Bunge | 13,700 | 935 | ||||||
Campbell Soup | 18,878 | 1,074 | ||||||
Casey’s General Stores | 3,800 | 458 | ||||||
Church & Dwight | 25,814 | 1,130 | ||||||
Clorox | 12,803 | 1,480 | ||||||
Coca-Cola | 400,540 | 16,162 | ||||||
Colgate-Palmolive | 88,750 | 5,789 | ||||||
ConAgra Foods | 43,386 | 1,592 | ||||||
Constellation Brands, Cl A | 16,431 | 2,483 | ||||||
Costco Wholesale | 44,481 | 6,677 | ||||||
Coty, Cl A | 45,423 | 850 | ||||||
CVS Health | 109,252 | 8,400 | ||||||
Dr. Pepper Snapple Group | 18,400 | 1,596 | ||||||
Edgewell Personal Care* | 6,041 | 478 | ||||||
Energizer Holdings | 6,341 | 285 | ||||||
Estee Lauder, Cl A | 21,508 | 1,671 | ||||||
Flowers Foods (A) | 16,525 | 256 | ||||||
General Mills | 62,392 | 3,802 | ||||||
Hain Celestial Group* | 10,300 | 404 | ||||||
Herbalife* (A) | 7,500 | 368 | ||||||
Hershey | 14,198 | 1,372 | ||||||
Hormel Foods | 26,556 | 909 | ||||||
Ingredion | 7,200 | 845 | ||||||
JM Smucker | 11,511 | 1,450 | ||||||
Kellogg | 24,803 | 1,786 | ||||||
Kimberly-Clark | 37,618 | 4,349 | ||||||
Kraft Heinz | 62,102 | 5,071 | ||||||
Kroger | 94,546 | 3,054 | ||||||
Lamb Weston Holdings* | 14,462 | 484 | ||||||
McCormick | 11,393 | 1,039 | ||||||
Mead Johnson Nutrition, Cl A | 18,486 | 1,333 | ||||||
Molson Coors Brewing, Cl B | 17,162 | 1,682 | ||||||
Mondelez International, Cl A | 152,606 | 6,293 | ||||||
Monster Beverage* | 42,087 | 1,883 | ||||||
Nu Skin Enterprises, Cl A | 5,500 | 287 | ||||||
PepsiCo | 148,552 | 14,870 | ||||||
Philip Morris International | 159,468 | 14,078 | ||||||
Pilgrim’s Pride* | 5,700 | 100 | ||||||
Pinnacle Foods | 11,800 | 585 | ||||||
| 2 | SEI Institutional Investments Trust / Semi-Annual Report / November 30, 2016 |
SCHEDULE OF INVESTMENTS (Unaudited)
Large Cap Index Fund (Continued)
November 30, 2016
| Description | Shares | Market Value ($ Thousands) | ||||||
Post Holdings* | 6,300 | $ | 481 | |||||
Procter & Gamble | 262,754 | 21,667 | ||||||
Reynolds American | 86,250 | 4,666 | ||||||
Rite Aid* | 104,400 | 831 | ||||||
Spectrum Brands Holdings | 2,500 | 300 | ||||||
Sprouts Farmers Market* | 13,500 | 270 | ||||||
Sysco | 52,148 | 2,777 | ||||||
TreeHouse Foods* | 5,400 | 374 | ||||||
Tyson Foods, Cl A | 28,965 | 1,646 | ||||||
US Foods Holding* | 4,600 | 105 | ||||||
Walgreens Boots Alliance | 87,725 | 7,433 | ||||||
Wal-Mart Stores | 155,979 | 10,986 | ||||||
WhiteWave Foods* | 17,422 | 960 | ||||||
Whole Foods Market | 31,704 | 964 | ||||||
|
| |||||||
| 187,442 | ||||||||
|
| |||||||
Energy — 7.1% | ||||||||
Anadarko Petroleum | 55,740 | 3,854 | ||||||
Antero Resources* | 18,400 | 451 | ||||||
Apache | 37,859 | 2,497 | ||||||
Baker Hughes | 43,940 | 2,827 | ||||||
Cabot Oil & Gas | 46,100 | 1,020 | ||||||
Cheniere Energy* | 19,700 | 805 | ||||||
Chesapeake Energy* (A) | 61,266 | 429 | ||||||
Chevron | 193,002 | 21,531 | ||||||
Cimarex Energy | 9,300 | 1,282 | ||||||
Concho Resources* | 14,200 | 2,031 | ||||||
ConocoPhillips | 128,976 | 6,258 | ||||||
CONSOL Energy* | 23,244 | 478 | ||||||
Continental Resources* | 9,000 | 522 | ||||||
Devon Energy | 51,913 | 2,509 | ||||||
Diamond Offshore Drilling* (A) | 6,209 | 112 | ||||||
Diamondback Energy* | 7,800 | 841 | ||||||
Dril-Quip* | 3,700 | 209 | ||||||
Energen* | 9,437 | 586 | ||||||
Ensco, Cl A | 30,400 | 294 | ||||||
EOG Resources | 57,290 | 5,873 | ||||||
EQT | 17,266 | 1,210 | ||||||
Exxon Mobil | 427,138 | 37,289 | ||||||
FMC Technologies* | 22,920 | 785 | ||||||
Frank’s International (A) | 4,000 | 50 | ||||||
Gulfport Energy* | 12,100 | 311 | ||||||
Halliburton | 89,736 | 4,764 | ||||||
Helmerich & Payne (A) | 9,750 | 738 | ||||||
Hess | 28,212 | 1,579 | ||||||
HollyFrontier | 16,726 | 481 | ||||||
Kinder Morgan | 201,422 | 4,472 | ||||||
Kosmos Energy* | 17,200 | 91 | ||||||
Laredo Petroleum* | 14,600 | 233 | ||||||
Marathon Oil | 85,676 | 1,547 | ||||||
Marathon Petroleum | 52,176 | 2,453 | ||||||
Murphy Oil | 15,454 | 524 | ||||||
| Description | Shares | Market Value ($ Thousands) | ||||||
Nabors Industries | 26,800 | $ | 432 | |||||
National Oilwell Varco | 37,380 | 1,397 | ||||||
Newfield Exploration* | 20,099 | 909 | ||||||
Noble* | 21,700 | 135 | ||||||
Noble Energy | 42,124 | 1,607 | ||||||
Occidental Petroleum | 79,454 | 5,670 | ||||||
Oceaneering International | 9,700 | 259 | ||||||
ONEOK | 20,558 | 1,129 | ||||||
Parsley Energy, Cl A* | 16,500 | 630 | ||||||
Patterson-UTI Energy | 13,232 | 353 | ||||||
PBF Energy, Cl A (A) | 9,900 | 238 | ||||||
Phillips 66 | 47,288 | 3,929 | ||||||
Pioneer Natural Resources | 16,144 | 3,084 | ||||||
QEP Resources* | 24,346 | 479 | ||||||
Range Resources | 20,614 | 725 | ||||||
Rice Energy* | 19,900 | 485 | ||||||
Rowan, Cl A* | 10,886 | 194 | ||||||
RPC (A) | 5,550 | 111 | ||||||
Schlumberger | 143,455 | 12,057 | ||||||
SM Energy | 8,800 | 351 | ||||||
Southwestern Energy* | 48,976 | 556 | ||||||
Spectra Energy | 69,509 | 2,846 | ||||||
Superior Energy Services* | 14,700 | 253 | ||||||
Targa Resources | 15,300 | 815 | ||||||
Tesoro | 11,746 | 956 | ||||||
Transocean* (A) | 33,900 | 437 | ||||||
Valero Energy | 46,736 | 2,877 | ||||||
Weatherford International* | 88,900 | 454 | ||||||
Whiting Petroleum* | 21,348 | 261 | ||||||
Williams | 68,396 | 2,100 | ||||||
World Fuel Services | 7,000 | 311 | ||||||
WPX Energy* | 34,048 | 529 | ||||||
|
| |||||||
| 157,505 | ||||||||
|
| |||||||
Financials — 14.5% | ||||||||
Affiliated Managers Group* | 5,420 | 803 | ||||||
Aflac | 39,956 | 2,852 | ||||||
AGNC Investment‡ | 34,059 | 636 | ||||||
Alleghany* | 1,499 | 851 | ||||||
Allied World Assurance Holdings | 8,900 | 417 | ||||||
Allstate | 37,225 | 2,603 | ||||||
Ally Financial | 45,400 | 882 | ||||||
American Express | 83,134 | 5,989 | ||||||
American Financial Group | 7,014 | 577 | ||||||
American International Group | 114,923 | 7,278 | ||||||
American National Insurance | 822 | 99 | ||||||
Ameriprise Financial | 15,780 | 1,802 | ||||||
AmTrust Financial Services | 9,200 | 234 | ||||||
Annaly Capital Management‡ | 100,011 | 1,022 | ||||||
Aon | 26,144 | 2,983 | ||||||
Arch Capital Group* | 11,300 | 935 | ||||||
Arthur J Gallagher | 17,304 | 871 | ||||||
| 3 | SEI Institutional Investments Trust / Semi-Annual Report / November 30, 2016 |
SCHEDULE OF INVESTMENTS (Unaudited)
Large Cap Index Fund (Continued)
November 30, 2016
| Description | Shares | Market Value ($ Thousands) | ||||||
Artisan Partners Asset Management, Cl A | 4,200 | $ | 125 | |||||
Aspen Insurance Holdings | 5,700 | 290 | ||||||
Associated Banc | 14,684 | 336 | ||||||
Assurant | 6,293 | 543 | ||||||
Assured Guaranty | 13,200 | 472 | ||||||
Axis Capital Holdings | 8,800 | 537 | ||||||
Bank of America | 1,055,063 | 22,283 | ||||||
Bank of Hawaii | 4,082 | 340 | ||||||
Bank of New York Mellon | 109,209 | 5,179 | ||||||
BankUnited | 9,600 | 340 | ||||||
BB&T | 85,406 | 3,865 | ||||||
Berkshire Hathaway, Cl B* | 193,800 | 30,512 | ||||||
BlackRock, Cl A | 13,085 | 4,852 | ||||||
BOK Financial (A) | 2,475 | 199 | ||||||
Brown & Brown | 11,124 | 482 | ||||||
Capital One Financial | 53,425 | 4,490 | ||||||
CBOE Holdings | 7,900 | 544 | ||||||
Charles Schwab | 121,685 | 4,704 | ||||||
Chimera Investment‡ | 18,880 | 320 | ||||||
Chubb | 47,991 | 6,143 | ||||||
Cincinnati Financial | 14,786 | 1,135 | ||||||
CIT Group | 20,200 | 825 | ||||||
Citigroup | 301,804 | 17,019 | ||||||
Citizens Financial Group | 52,400 | 1,756 | ||||||
CME Group, Cl A | 35,470 | 4,005 | ||||||
CNA Financial | 3,100 | 119 | ||||||
Comerica | 17,553 | 1,119 | ||||||
Commerce Bancshares | 8,205 | 450 | ||||||
Credit Acceptance* (A) | 800 | 153 | ||||||
Cullen/Frost Bankers | 5,468 | 450 | ||||||
Discover Financial Services | 40,789 | 2,764 | ||||||
Donnelley Financial Solutions* | 2,397 | 46 | ||||||
E*TRADE Financial* | 28,300 | 977 | ||||||
East West Bancorp | 14,400 | 689 | ||||||
Eaton Vance | 11,010 | 445 | ||||||
Endurance Specialty Holdings | 6,500 | 599 | ||||||
Erie Indemnity, Cl A | 2,419 | 259 | ||||||
Everest Re Group | 4,100 | 863 | ||||||
FactSet Research Systems | 3,900 | 625 | ||||||
Federated Investors, Cl B | 9,658 | 266 | ||||||
Fifth Third Bancorp | 75,782 | 1,972 | ||||||
First American Financial | 10,500 | 396 | ||||||
First Hawaiian | 2,400 | 72 | ||||||
First Horizon National | 21,756 | 415 | ||||||
First Republic Bank | 14,400 | 1,179 | ||||||
FNF Group | 26,552 | 848 | ||||||
Franklin Resources | 35,749 | 1,404 | ||||||
Goldman Sachs Group | 39,875 | 8,744 | ||||||
Hanover Insurance Group | 4,393 | 380 | ||||||
Hartford Financial Services Group | 38,810 | 1,829 | ||||||
Huntington Bancshares | 106,234 | 1,324 | ||||||
Interactive Brokers Group, Cl A | 5,600 | 206 | ||||||
| Description | Shares | Market Value ($ Thousands) | ||||||
Intercontinental Exchange | 62,000 | $ | 3,435 | |||||
Invesco | 40,600 | 1,271 | ||||||
JPMorgan Chase | 373,234 | 29,922 | ||||||
KeyCorp | 107,551 | 1,862 | ||||||
Lazard, Cl A | 15,600 | 606 | ||||||
Legg Mason | 10,781 | 344 | ||||||
Leucadia National | 33,806 | 744 | ||||||
Lincoln National | 24,188 | 1,550 | ||||||
Loews | 27,836 | 1,243 | ||||||
LPL Financial Holdings | 7,900 | 325 | ||||||
M&T Bank | 14,857 | 2,139 | ||||||
Markel* | 1,350 | 1,213 | ||||||
MarketAxess Holdings | 3,600 | 597 | ||||||
Marsh & McLennan | 54,765 | 3,796 | ||||||
Mercury General | 2,396 | 140 | ||||||
MetLife | 96,909 | 5,331 | ||||||
MFA Financial‡ | 33,700 | 264 | ||||||
Moody’s | 16,927 | 1,701 | ||||||
Morgan Stanley | 148,378 | 6,137 | ||||||
Morningstar | 1,800 | 131 | ||||||
MSCI, Cl A | 9,000 | 709 | ||||||
Nasdaq | 11,400 | 731 | ||||||
Navient | 32,814 | 565 | ||||||
New York Community Bancorp | 46,772 | 747 | ||||||
Northern Trust | 20,505 | 1,684 | ||||||
NorthStar Asset Management Group | 17,300 | 255 | ||||||
Old Republic International | 23,390 | 418 | ||||||
OneMain Holdings, Cl A* | 4,700 | 96 | ||||||
PacWest Bancorp | 12,000 | 615 | ||||||
People’s United Financial | 31,534 | 590 | ||||||
PNC Financial Services Group | 51,922 | 5,739 | ||||||
Popular | 10,453 | 425 | ||||||
Principal Financial Group | 26,408 | 1,523 | ||||||
ProAssurance | 5,500 | 308 | ||||||
Progressive | 58,480 | 1,947 | ||||||
Prudential Financial | 46,163 | 4,644 | ||||||
Raymond James Financial | 12,621 | 908 | ||||||
Regions Financial | 125,487 | 1,699 | ||||||
Reinsurance Group of America, Cl A | 6,299 | 769 | ||||||
RenaissanceRe Holdings | 4,200 | 548 | ||||||
S&P Global | 26,256 | 3,124 | ||||||
Santander Consumer USA Holdings* | 11,600 | 160 | ||||||
SEI† | 13,042 | 615 | ||||||
Signature Bank NY* | 5,300 | 795 | ||||||
SLM* | 43,914 | 442 | ||||||
Starwood Property Trust‡ | 23,500 | 528 | ||||||
State Street | 39,179 | 3,087 | ||||||
SunTrust Banks | 50,546 | 2,626 | ||||||
SVB Financial Group* | 5,200 | 822 | ||||||
Synchrony Financial | 83,418 | 2,883 | ||||||
Synovus Financial | 12,096 | 468 | ||||||
T. Rowe Price Group | 24,030 | 1,780 | ||||||
| 4 | SEI Institutional Investments Trust / Semi-Annual Report / November 30, 2016 |
SCHEDULE OF INVESTMENTS (Unaudited)
Large Cap Index Fund (Continued)
November 30, 2016
| Description | Shares | Market Value ($ Thousands) | ||||||
TCF Financial | 15,001 | $ | 260 | |||||
TD Ameritrade Holding | 25,445 | 1,044 | ||||||
TFS Financial | 6,200 | 116 | ||||||
Thomson Reuters | 30,000 | 1,296 | ||||||
Torchmark | 11,687 | 819 | ||||||
Travelers | 29,075 | 3,296 | ||||||
Two Harbors Investment‡ | 31,800 | 276 | ||||||
Unum Group | 23,805 | 1,006 | ||||||
US Bancorp | 167,997 | 8,336 | ||||||
Validus Holdings | 7,926 | 431 | ||||||
Voya Financial | 20,500 | 797 | ||||||
Wells Fargo | 468,766 | 24,807 | ||||||
Western Alliance Bancorp* | 9,200 | 430 | ||||||
White Mountains Insurance Group | 447 | 374 | ||||||
WR Berkley | 9,714 | 600 | ||||||
XL Group | 27,400 | 990 | ||||||
Zions Bancorporation | 20,402 | 812 | ||||||
|
| |||||||
| 321,414 | ||||||||
|
| |||||||
Health Care — 13.0% | ||||||||
Abbott Laboratories | 150,276 | 5,721 | ||||||
AbbVie | 166,961 | 10,151 | ||||||
ABIOMED* | 3,900 | 438 | ||||||
Acadia Healthcare* | 7,100 | 270 | ||||||
ACADIA Pharmaceuticals* (A) | 8,900 | 240 | ||||||
Aetna | 35,535 | 4,649 | ||||||
Agilent Technologies | 32,164 | 1,415 | ||||||
Agios Pharmaceuticals* | 5,200 | 303 | ||||||
Akorn* | 8,700 | 185 | ||||||
Alere* | 8,900 | 354 | ||||||
Alexion Pharmaceuticals* | 21,600 | 2,648 | ||||||
Align Technology* | 7,200 | 670 | ||||||
Alkermes* | 15,000 | 852 | ||||||
Allergan | 40,316 | 7,833 | ||||||
Allscripts Healthcare Solutions* | 16,500 | 181 | ||||||
Alnylam Pharmaceuticals* | 7,600 | 333 | ||||||
AmerisourceBergen | 17,624 | 1,375 | ||||||
Amgen | 77,458 | 11,159 | ||||||
Amsurg, Cl A* | 5,300 | 361 | ||||||
Anthem | 27,631 | 3,938 | ||||||
athenahealth* (A) | 3,900 | 369 | ||||||
Baxter International | 49,515 | 2,197 | ||||||
Becton Dickinson | 20,978 | 3,547 | ||||||
Biogen* | 22,700 | 6,675 | ||||||
BioMarin Pharmaceutical* | 17,200 | 1,473 | ||||||
Bio-Rad Laboratories, Cl A* | 2,200 | 382 | ||||||
Bio-Techne | 3,441 | 363 | ||||||
Boston Scientific* | 134,939 | 2,761 | ||||||
Bristol-Myers Squibb | 172,459 | 9,734 | ||||||
Brookdale Senior Living, Cl A* | 19,000 | 221 | ||||||
Bruker | 9,400 | 213 | ||||||
C.R. Bard | 7,385 | 1,555 | ||||||
| Description | Shares | Market Value ($ Thousands) | ||||||
Cardinal Health | 32,429 | $ | 2,303 | |||||
Celgene* | 79,360 | 9,405 | ||||||
Centene* | 16,728 | 964 | ||||||
Cerner* | 29,196 | 1,453 | ||||||
Charles River Laboratories International* | 4,443 | 316 | ||||||
Cigna | 25,455 | 3,430 | ||||||
Cooper | 4,704 | 774 | ||||||
Danaher | 63,102 | 4,933 | ||||||
DaVita HealthCare Partners* | 16,585 | 1,051 | ||||||
DENTSPLY SIRONA | 22,766 | 1,325 | ||||||
DexCom* | 8,300 | 542 | ||||||
Edwards Lifesciences* | 21,228 | 1,759 | ||||||
Eli Lilly | 99,461 | 6,676 | ||||||
Endo International* | 20,397 | 327 | ||||||
Envision Healthcare Holdings* | 19,100 | 434 | ||||||
Express Scripts Holding* | 65,936 | 5,003 | ||||||
Gilead Sciences | 136,734 | 10,077 | ||||||
HCA Holdings* | 30,500 | 2,162 | ||||||
Henry Schein* | 8,084 | 1,204 | ||||||
Hill-Rom Holdings | 6,524 | 348 | ||||||
Hologic* | 28,200 | 1,080 | ||||||
Humana | 14,775 | 3,142 | ||||||
Idexx Laboratories* | 9,004 | 1,059 | ||||||
Illumina* | 14,505 | 1,931 | ||||||
Incyte* | 16,300 | 1,667 | ||||||
Inovalon Holdings, Cl A* (A) | 6,100 | 94 | ||||||
Intercept Pharmaceuticals* (A) | 1,700 | 172 | ||||||
Intrexon* (A) | 6,000 | 175 | ||||||
Intuitive Surgical* | 3,757 | 2,419 | ||||||
Ionis Pharmaceuticals* | 12,400 | 543 | ||||||
Johnson & Johnson | 281,609 | 31,343 | ||||||
Juno Therapeutics* (A) | 6,200 | 124 | ||||||
Laboratory Corp of America Holdings* | 10,090 | 1,270 | ||||||
LifePoint Hospitals* | 3,976 | 218 | ||||||
Mallinckrodt* | 10,712 | 565 | ||||||
McKesson | 22,366 | 3,216 | ||||||
MEDNAX* | 9,300 | 609 | ||||||
Medtronic | 144,726 | 10,566 | ||||||
Merck | 284,743 | 17,423 | ||||||
Mettler Toledo International* | 2,636 | 1,086 | ||||||
Mylan* | 45,619 | 1,670 | ||||||
Neurocrine Biosciences* | 8,400 | 390 | ||||||
OPKO Health* (A) | 32,400 | 337 | ||||||
Patheon* | 3,200 | 88 | ||||||
Patterson | 8,683 | 336 | ||||||
PerkinElmer | 11,034 | 560 | ||||||
Perrigo | 13,800 | 1,191 | ||||||
Pfizer | 617,122 | 19,834 | ||||||
Premier, Cl A* | 5,000 | 151 | ||||||
QIAGEN* | 23,200 | 634 | ||||||
Quest Diagnostics | 14,044 | 1,228 | ||||||
Quintiles IMS Holdings* | 14,213 | 1,092 | ||||||
| 5 | SEI Institutional Investments Trust / Semi-Annual Report / November 30, 2016 |
SCHEDULE OF INVESTMENTS (Unaudited)
Large Cap Index Fund (Continued)
November 30, 2016
| Description | Shares | Market Value ($ Thousands) | ||||||
Regeneron Pharmaceuticals* | 7,700 | $ | 2,920 | |||||
ResMed | 13,782 | 847 | ||||||
Seattle Genetics* | 9,900 | 642 | ||||||
St. Jude Medical | 27,746 | 2,197 | ||||||
Stryker | 35,304 | 4,013 | ||||||
Teleflex | 4,340 | 642 | ||||||
Tenet Healthcare* | 8,698 | 132 | ||||||
Thermo Fisher Scientific | 40,825 | 5,720 | ||||||
United Therapeutics* | 4,300 | 540 | ||||||
UnitedHealth Group | 96,420 | 15,265 | ||||||
Universal Health Services, Cl B | 8,476 | 1,043 | ||||||
Varian Medical Systems* | 9,630 | 865 | ||||||
VCA Antech* | 7,639 | 478 | ||||||
Veeva Systems, Cl A* | 10,000 | 465 | ||||||
Vertex Pharmaceuticals* | 24,400 | 1,991 | ||||||
VWR* | 7,700 | 209 | ||||||
Waters* | 7,646 | 1,029 | ||||||
WellCare Health Plans* | 4,400 | 603 | ||||||
West Pharmaceutical Services | 7,100 | 576 | ||||||
Zimmer Biomet Holdings | 18,325 | 1,867 | ||||||
Zoetis, Cl A | 45,244 | 2,279 | ||||||
|
| |||||||
| 287,588 | ||||||||
|
| |||||||
Industrials — 10.5% | ||||||||
3M | 60,733 | 10,430 | ||||||
Acuity Brands | 4,300 | 1,081 | ||||||
AECOM Technology* | 15,216 | 553 | ||||||
AGCO | 6,800 | 379 | ||||||
Air Lease, Cl A | 9,900 | 355 | ||||||
Alaska Air Group | 11,700 | 963 | ||||||
Allegion | 9,766 | 653 | ||||||
Allison Transmission Holdings, Cl A | 13,700 | 454 | ||||||
AMERCO* | 600 | 205 | ||||||
American Airlines Group | 53,100 | 2,466 | ||||||
Ametek | 22,728 | 1,076 | ||||||
AO Smith | 14,800 | 720 | ||||||
Arconic | 44,367 | 855 | ||||||
Armstrong World Industries* | 4,100 | 171 | ||||||
Avis Budget Group* | 8,300 | 318 | ||||||
B/E Aerospace | 10,266 | 616 | ||||||
Boeing | 61,591 | 9,273 | ||||||
BWX Technologies | 9,850 | 386 | ||||||
C.H. Robinson Worldwide | 14,086 | 1,054 | ||||||
Carlisle | 6,366 | 714 | ||||||
Caterpillar | 58,088 | 5,551 | ||||||
Chicago Bridge & Iron | 10,695 | 358 | ||||||
Cintas | 8,857 | 1,015 | ||||||
Clean Harbors* | 5,000 | 264 | ||||||
Colfax* | 10,100 | 380 | ||||||
Copa Holdings, Cl A (A) | 3,000 | 267 | ||||||
Copart* | 9,618 | 526 | ||||||
Covanta Holding | 12,600 | 184 | ||||||
| Description | Shares | Market Value ($ Thousands) | ||||||
Crane | 4,700 | $ | 345 | |||||
CSX | 94,896 | 3,398 | ||||||
Cummins | 15,812 | 2,242 | ||||||
Deere | 31,319 | 3,138 | ||||||
Delta Air Lines | 80,900 | 3,898 | ||||||
Donaldson | 13,144 | 533 | ||||||
Dover | 15,557 | 1,130 | ||||||
Dun & Bradstreet | 3,756 | 457 | ||||||
Eaton | 45,516 | 3,027 | ||||||
Emerson Electric | 67,410 | 3,805 | ||||||
Equifax | 11,956 | 1,368 | ||||||
Expeditors International of Washington | 18,148 | 957 | ||||||
Fastenal | 28,824 | 1,366 | ||||||
FedEx | 26,044 | 4,992 | ||||||
Flowserve | 13,000 | 617 | ||||||
Fluor | 13,908 | 744 | ||||||
Fortive | 30,001 | 1,650 | ||||||
Fortune Brands Home & Security | 15,320 | 845 | ||||||
General Dynamics | 25,472 | 4,467 | ||||||
General Electric | 943,406 | 29,019 | ||||||
Genesee & Wyoming, Cl A* | 5,700 | 436 | ||||||
Graco | 5,424 | 441 | ||||||
HD Supply Holdings* | 19,800 | 777 | ||||||
Heico | 1,900 | 149 | ||||||
HEICO, Cl A | 3,800 | 255 | ||||||
Herc Holdings* | 1,980 | 79 | ||||||
Hertz Global Holdings* | 7,440 | 187 | ||||||
Hexcel | 8,800 | 455 | ||||||
Honeywell International | 78,690 | 8,966 | ||||||
Hubbell, Cl B | 5,392 | 605 | ||||||
Huntington Ingalls Industries | 4,537 | 811 | ||||||
IDEX | 7,693 | 720 | ||||||
Illinois Tool Works | 30,880 | 3,866 | ||||||
Ingersoll-Rand | 25,500 | 1,901 | ||||||
ITT | 9,251 | 374 | ||||||
Jacobs Engineering Group* | 11,784 | 731 | ||||||
JB Hunt Transport Services | 8,752 | 835 | ||||||
JetBlue Airways* | 32,200 | 647 | ||||||
Johnson Controls International | 95,966 | 4,317 | ||||||
Kansas City Southern | 10,600 | 940 | ||||||
KAR Auction Services | 13,900 | 586 | ||||||
KBR | 13,180 | 220 | ||||||
Kirby* | 5,200 | 330 | ||||||
L-3 Communications Holdings, Cl 3 | 7,777 | 1,227 | ||||||
Landstar System | 4,165 | 339 | ||||||
Lennox International | 3,900 | 580 | ||||||
Lincoln Electric Holdings | 5,900 | 463 | ||||||
Lockheed Martin | 26,373 | 6,995 | ||||||
LSC Communications | 2,397 | 50 | ||||||
Macquarie Infrastructure | 7,500 | 615 | ||||||
Manitowoc Foodservice* | 13,500 | 240 | ||||||
Manpowergroup | 7,184 | 614 | ||||||
| 6 | SEI Institutional Investments Trust / Semi-Annual Report / November 30, 2016 |
SCHEDULE OF INVESTMENTS (Unaudited)
Large Cap Index Fund (Continued)
November 30, 2016
| Description | Shares | Market Value ($ Thousands) | ||||||
Masco | 32,779 | $ | 1,037 | |||||
Middleby* | 5,700 | 781 | ||||||
MSC Industrial Direct, Cl A | 4,820 | 431 | ||||||
Nielsen Holdings | 36,300 | 1,565 | ||||||
Nordson | 5,800 | 619 | ||||||
Norfolk Southern | 29,333 | 3,123 | ||||||
Northrop Grumman | 17,378 | 4,338 | ||||||
Old Dominion Freight Line* | 6,800 | 594 | ||||||
Orbital ATK | 5,936 | 507 | ||||||
Oshkosh Truck | 7,559 | 529 | ||||||
Owens Corning | 11,700 | 601 | ||||||
Paccar | 33,970 | 2,111 | ||||||
Parker Hannifin | 13,204 | 1,834 | ||||||
Pentair | 16,373 | 941 | ||||||
Pitney Bowes | 18,085 | 260 | ||||||
Quanta Services* | 14,100 | 475 | ||||||
Raytheon | 31,068 | 4,646 | ||||||
Regal-Beloit | 4,000 | 292 | ||||||
Republic Services | 23,642 | 1,312 | ||||||
Robert Half International | 12,976 | 582 | ||||||
Rockwell Automation | 13,004 | 1,739 | ||||||
Rockwell Collins | 12,979 | 1,203 | ||||||
Rollins | 8,850 | 284 | ||||||
Roper Technologies | 9,900 | 1,793 | ||||||
RR Donnelley & Sons | 6,392 | 111 | ||||||
Ryder System | 5,606 | 439 | ||||||
Snap-on | 5,691 | 952 | ||||||
Southwest Airlines | 63,520 | 2,961 | ||||||
Spirit AeroSystems Holdings, Cl A | 13,400 | 781 | ||||||
Spirit Airlines* | 7,500 | 417 | ||||||
Stanley Black & Decker | 15,093 | 1,791 | ||||||
Stericycle* | 8,326 | 608 | ||||||
Terex | 10,048 | 307 | ||||||
Textron | 26,622 | 1,225 | ||||||
Timken | 6,769 | 264 | ||||||
Toro | 11,040 | 584 | ||||||
TransDigm Group* | 4,993 | 1,255 | ||||||
TransUnion* | 5,000 | 149 | ||||||
Trinity Industries | 14,400 | 400 | ||||||
Union Pacific | 87,232 | 8,839 | ||||||
United Continental Holdings* | 33,900 | 2,337 | ||||||
United Parcel Service, Cl B | 71,541 | 8,293 | ||||||
United Rentals* | 8,700 | 880 | ||||||
United Technologies | 80,290 | 8,649 | ||||||
USG* | 8,800 | 252 | ||||||
Valmont Industries | 2,100 | 313 | ||||||
Verisk Analytics, Cl A* | 15,400 | 1,279 | ||||||
WABCO Holdings* | 5,324 | 525 | ||||||
Wabtec | 8,600 | 728 | ||||||
Waste Management | 44,094 | 3,065 | ||||||
Watsco | 2,700 | 402 | ||||||
WESCO International* | 4,100 | 278 | ||||||
| Description | Shares | Market Value ($ Thousands) | ||||||
WW Grainger | 5,487 | $ | 1,265 | |||||
Xylem | 17,602 | 908 | ||||||
|
| |||||||
| 230,870 | ||||||||
|
| |||||||
Information Technology — 20.0% | ||||||||
Accenture, Cl A | 64,600 | 7,715 | ||||||
Activision Blizzard | 55,656 | 2,038 | ||||||
Adobe Systems* | 50,802 | 5,223 | ||||||
Akamai Technologies* | 17,318 | 1,155 | ||||||
Alliance Data Systems | 5,712 | 1,307 | ||||||
Alphabet, Cl A* | 30,129 | 23,376 | ||||||
Alphabet, Cl C* | 30,399 | 23,044 | ||||||
Amdocs | 14,900 | 879 | ||||||
Amphenol, Cl A | 29,784 | 2,033 | ||||||
Analog Devices | 30,912 | 2,295 | ||||||
Ansys* | 8,800 | 827 | ||||||
Apple | 560,825 | 61,982 | ||||||
Applied Materials | 114,555 | 3,689 | ||||||
Arista Networks* | 3,900 | 370 | ||||||
ARRIS International* | 18,800 | 539 | ||||||
Arrow Electronics* | 8,789 | 600 | ||||||
Atlassian, Cl A* | 2,700 | 73 | ||||||
Autodesk* | 20,937 | 1,520 | ||||||
Automatic Data Processing | 47,592 | 4,570 | ||||||
Avnet | 12,410 | 569 | ||||||
Black Knight Financial Services, Cl A* | 2,500 | 93 | ||||||
Booz Allen Hamilton Holding | 11,300 | 427 | ||||||
Broadcom | 39,132 | 6,672 | ||||||
Broadridge Financial Solutions | 11,573 | 749 | ||||||
Brocade Communications Systems | 38,900 | 480 | ||||||
CA | 28,538 | 912 | ||||||
Cadence Design Systems* | 29,863 | 785 | ||||||
CDK Global | 15,497 | 894 | ||||||
CDW | 16,000 | 820 | ||||||
Cisco Systems | 517,727 | 15,439 | ||||||
Citrix Systems* | 15,387 | 1,335 | ||||||
Cognex | 7,800 | 466 | ||||||
Cognizant Technology Solutions, Cl A* | 61,076 | 3,364 | ||||||
CommerceHub* | 3,624 | 54 | ||||||
CommScope Holding* | 13,000 | 468 | ||||||
Computer Sciences | 13,864 | 841 | ||||||
CoreLogic* | 9,184 | 347 | ||||||
Corning | 106,958 | 2,570 | ||||||
CoStar Group* | 3,100 | 592 | ||||||
Cree* | 10,722 | 271 | ||||||
CSRA | 16,564 | 530 | ||||||
Cypress Semiconductor | 29,700 | 334 | ||||||
Dell Technologies, Cl V* | 21,912 | 1,174 | ||||||
Dolby Laboratories, Cl A | 5,343 | 247 | ||||||
DST Systems | 3,295 | 340 | ||||||
eBay* | 106,211 | 2,954 | ||||||
EchoStar, Cl A* | 4,932 | 252 | ||||||
| 7 | SEI Institutional Investments Trust / Semi-Annual Report / November 30, 2016 |
SCHEDULE OF INVESTMENTS (Unaudited)
Large Cap Index Fund (Continued)
November 30, 2016
| Description | Shares | Market Value ($ Thousands) | ||||||
Electronic Arts* | 28,865 | $ | 2,287 | |||||
Euronet Worldwide* | 4,900 | 351 | ||||||
F5 Networks* | 6,638 | 934 | ||||||
Facebook, Cl A* | 230,100 | 27,248 | ||||||
Fidelity National Information Services | 32,290 | 2,492 | ||||||
FireEye* (A) | 15,800 | 203 | ||||||
First Data, Cl A* | 30,800 | 449 | ||||||
First Solar* (A) | 8,000 | 243 | ||||||
Fiserv* | 22,338 | 2,337 | ||||||
Fitbit, Cl A* | 13,100 | 110 | ||||||
FleetCor Technologies* | 9,100 | 1,359 | ||||||
FLIR Systems | 13,700 | 492 | ||||||
Fortinet* | 14,800 | 445 | ||||||
Gartner* | 8,100 | 833 | ||||||
Genpact* | 15,700 | 376 | ||||||
Global Payments | 15,168 | 1,040 | ||||||
GoDaddy, Cl A* | 4,500 | 159 | ||||||
Guidewire Software* | 7,100 | 396 | ||||||
Harris | 12,354 | 1,279 | ||||||
Hewlett Packard Enterprise | 180,770 | 4,302 | ||||||
HP | 173,770 | 2,676 | ||||||
IAC* | 6,632 | 447 | ||||||
Ingram Micro, Cl A* | 14,723 | 551 | ||||||
Intel | 485,758 | 16,856 | ||||||
International Business Machines | 90,498 | 14,681 | ||||||
Intuit | 24,252 | 2,757 | ||||||
IPG Photonics* | 3,600 | 345 | ||||||
Jabil Circuit | 17,874 | 378 | ||||||
Jack Henry & Associates | 7,900 | 683 | ||||||
Juniper Networks | 37,325 | 1,028 | ||||||
Keysight Technologies* | 17,232 | 635 | ||||||
Kla-Tencor | 15,809 | 1,262 | ||||||
Lam Research | 15,752 | 1,670 | ||||||
Leidos Holdings | 13,173 | 674 | ||||||
Linear Technology | 23,557 | 1,473 | ||||||
LinkedIn, Cl A* | 11,800 | 2,304 | ||||||
Manhattan Associates* | 7,000 | 367 | ||||||
Marvell Technology Group | 41,100 | 589 | ||||||
MasterCard, Cl A | 99,500 | 10,169 | ||||||
Match Group* (A) | 3,400 | 61 | ||||||
Maxim Integrated Products | 27,900 | 1,096 | ||||||
Microchip Technology | 21,215 | 1,404 | ||||||
Micron Technology* | 102,716 | 2,006 | ||||||
Microsoft | 775,400 | 46,726 | ||||||
Motorola Solutions | 17,514 | 1,406 | ||||||
National Instruments | 10,704 | 315 | ||||||
NCR* | 12,089 | 468 | ||||||
NetApp | 29,055 | 1,062 | ||||||
Nuance Communications* | 21,700 | 352 | ||||||
Nvidia | 53,056 | 4,892 | ||||||
ON Semiconductor* | 39,300 | 463 | ||||||
Oracle | 304,720 | 12,247 | ||||||
| Description | Shares | Market Value ($ Thousands) | ||||||
Palo Alto Networks* | 8,800 | $ | 1,182 | |||||
Pandora Media* (A) | 23,100 | 268 | ||||||
Paychex | 32,007 | 1,887 | ||||||
PayPal Holdings* | 118,211 | 4,643 | ||||||
PTC* | 11,200 | 546 | ||||||
Qorvo* | 12,600 | 673 | ||||||
QUALCOMM | 151,659 | 10,333 | ||||||
Red Hat* | 18,327 | 1,450 | ||||||
Sabre | 20,400 | 527 | ||||||
salesforce.com inc* | 66,752 | 4,806 | ||||||
ServiceNow* | 15,900 | 1,322 | ||||||
Skyworks Solutions | 19,200 | 1,476 | ||||||
Splunk* | 12,900 | 743 | ||||||
Square, Cl A* (A) | 5,900 | 76 | ||||||
SS&C Technologies Holdings | 16,900 | 507 | ||||||
SunPower, Cl A* (A) | 4,100 | 28 | ||||||
Symantec | 61,948 | 1,511 | ||||||
Synopsys* | 15,282 | 924 | ||||||
Tableau Software, Cl A* | 5,700 | 256 | ||||||
Teradata* | 13,289 | 357 | ||||||
Teradyne | 20,763 | 506 | ||||||
Texas Instruments | 104,008 | 7,689 | ||||||
Total System Services | 16,691 | 822 | ||||||
Trimble* | 25,828 | 728 | ||||||
Twilio, Cl A* (A) | 1,100 | 37 | ||||||
Twitter* (A) | 62,760 | 1,160 | ||||||
Tyler Technologies* | 3,200 | 476 | ||||||
Ultimate Software Group* | 2,800 | 574 | ||||||
Vantiv, Cl A* | 15,400 | 869 | ||||||
VeriFone Systems* | 10,200 | 172 | ||||||
VeriSign* (A) | 9,685 | 764 | ||||||
Versum Materials* | 9,747 | 238 | ||||||
Visa, Cl A | 196,000 | 15,155 | ||||||
VMware, Cl A* (A) | 8,300 | 673 | ||||||
Western Digital | 27,996 | 1,782 | ||||||
Western Union | 49,828 | 1,048 | ||||||
WEX* | 4,000 | 442 | ||||||
Workday, Cl A* | 11,600 | 978 | ||||||
Xerox | 101,196 | 946 | ||||||
Xilinx | 25,157 | 1,358 | ||||||
Yahoo!* | 91,081 | 3,736 | ||||||
Yelp, Cl A* | 6,900 | 257 | ||||||
Zebra Technologies, Cl A* | 4,825 | 381 | ||||||
Zillow Group, Cl A* (A) | 5,543 | 195 | ||||||
Zillow Group, Cl C* (A) | 10,286 | 369 | ||||||
Zynga, Cl A* | 77,500 | 222 | ||||||
|
| |||||||
| 441,684 | ||||||||
|
| |||||||
Materials — 3.2% | ||||||||
AdvanSix* | 3,035 | 57 | ||||||
Air Products & Chemicals | 19,494 | 2,816 | ||||||
Albemarle | 11,073 | 972 | ||||||
| 8 | SEI Institutional Investments Trust / Semi-Annual Report / November 30, 2016 |
SCHEDULE OF INVESTMENTS (Unaudited)
Large Cap Index Fund (Continued)
November 30, 2016
| Description | Shares | Market Value ($ Thousands) | ||||||
Alcoa | 14,789 | $ | 428 | |||||
AptarGroup | 6,000 | 439 | ||||||
Ashland Global Holdings | 6,376 | 719 | ||||||
Avery Dennison | 9,010 | 649 | ||||||
Axalta Coating Systems* | 16,200 | 428 | ||||||
Ball | 16,850 | 1,265 | ||||||
Bemis | 9,174 | 459 | ||||||
Berry Plastics Group* | 11,900 | 592 | ||||||
Cabot | 6,173 | 314 | ||||||
Celanese, Cl A | 14,683 | 1,165 | ||||||
CF Industries Holdings | 23,230 | 672 | ||||||
Compass Minerals International (A) | 3,100 | 240 | ||||||
Crown Holdings* | 13,251 | 721 | ||||||
Domtar | 6,100 | 240 | ||||||
Dow Chemical | 116,570 | 6,495 | ||||||
E.I. du Pont de Nemours | 89,392 | 6,580 | ||||||
Eagle Materials | 4,500 | 437 | ||||||
Eastman Chemical | 14,828 | 1,114 | ||||||
Ecolab | 25,908 | 3,024 | ||||||
FMC | 13,320 | 748 | ||||||
Freeport-McMoRan, Cl B* | 134,124 | 2,059 | ||||||
Graphic Packaging Holding | 33,000 | 415 | ||||||
Huntsman | 18,929 | 369 | ||||||
International Flavors & Fragrances | 7,891 | 955 | ||||||
International Paper | 40,755 | 1,986 | ||||||
LyondellBasell Industries, Cl A | 34,500 | 3,116 | ||||||
Martin Marietta Materials | 6,263 | 1,374 | ||||||
Monsanto | 45,550 | 4,679 | ||||||
Mosaic | 34,978 | 993 | ||||||
NewMarket | 700 | 293 | ||||||
Newmont Mining | 52,733 | 1,711 | ||||||
Nucor | 31,490 | 1,958 | ||||||
Owens-Illinois* | 16,591 | 305 | ||||||
Packaging Corp of America | 9,299 | 788 | ||||||
Platform Specialty Products* (A) | 16,800 | 157 | ||||||
PPG Industries | 26,646 | 2,556 | ||||||
Praxair | 30,025 | 3,612 | ||||||
Reliance Steel & Aluminum | 7,100 | 576 | ||||||
Royal Gold | 6,700 | 467 | ||||||
RPM International | 13,269 | 702 | ||||||
Scotts Miracle-Gro, Cl A | 4,606 | 420 | ||||||
Sealed Air | 19,868 | 906 | ||||||
Sherwin-Williams | 8,037 | 2,159 | ||||||
Silgan Holdings | 4,304 | 213 | ||||||
Sonoco Products | 10,146 | 549 | ||||||
Southern Copper (A) | 8,268 | 272 | ||||||
Steel Dynamics | 23,700 | 841 | ||||||
Tahoe Resources | 29,300 | 281 | ||||||
United States Steel | 15,883 | 514 | ||||||
Valspar | 7,964 | 813 | ||||||
Vulcan Materials | 13,157 | 1,653 | ||||||
Westlake Chemical | 3,800 | 225 | ||||||
| Description | Shares | Market Value ($ Thousands) | ||||||
WestRock | 24,745 | $ | 1,267 | |||||
WR Grace | 7,200 | 470 | ||||||
|
| |||||||
| 70,228 | ||||||||
|
| |||||||
Real Estate — 3.5% | ||||||||
Alexandria Real Estate Equities‡ | 7,700 | 844 | ||||||
American Campus Communities‡ | 13,000 | 612 | ||||||
American Homes 4 Rent, Cl A‡ | 16,500 | 348 | ||||||
American Tower, Cl A‡ | 44,022 | 4,502 | ||||||
Apartment Investment & Management, Cl A‡ | 15,199 | 640 | ||||||
Apple Hospitality‡ | 16,700 | 308 | ||||||
AvalonBay Communities‡ | 13,641 | 2,244 | ||||||
Boston Properties‡ | 15,284 | 1,893 | ||||||
Brandywine Realty Trust‡ | 15,500 | 238 | ||||||
Brixmor Property Group‡ | 19,200 | 468 | ||||||
Camden Property Trust‡ | 8,547 | 673 | ||||||
Care Capital Properties‡ | 8,823 | 212 | ||||||
CBRE Group, Cl A* | 29,617 | 860 | ||||||
Columbia Property Trust‡ | 11,800 | 249 | ||||||
Communications Sales & Leasing‡ | 12,529 | 312 | ||||||
CoreCivic‡ | 10,240 | 233 | ||||||
Corporate Office Properties Trust‡ | 9,800 | 280 | ||||||
Crown Castle International‡ | 33,396 | 2,787 | ||||||
CubeSmart‡ | 17,400 | 429 | ||||||
CyrusOne‡ | 6,900 | 295 | ||||||
DCT Industrial Trust‡ | 8,800 | 404 | ||||||
DDR‡ | 30,800 | 469 | ||||||
Digital Realty Trust‡ | 14,600 | 1,348 | ||||||
Douglas Emmett‡ | 14,300 | 525 | ||||||
Duke Realty‡ | 34,209 | 870 | ||||||
Empire State Realty Trust, Cl A‡ | 12,600 | 254 | ||||||
EPR Properties‡ | 6,200 | 431 | ||||||
Equinix‡ | 6,942 | 2,352 | ||||||
Equity Commonwealth*‡ | 11,525 | 335 | ||||||
Equity LifeStyle Properties‡ | 7,700 | 535 | ||||||
Equity One‡ | 9,000 | 269 | ||||||
Equity Residential‡ | 35,877 | 2,153 | ||||||
Essex Property Trust‡ | 6,554 | 1,415 | ||||||
Extra Space Storage‡ | 12,100 | 849 | ||||||
Federal Realty Investment Trust‡ | 6,996 | 982 | ||||||
Forest City Realty Trust, Cl A‡ | 22,742 | 421 | ||||||
Gaming and Leisure Properties‡ | 18,491 | 564 | ||||||
General Growth Properties‡ | 57,053 | 1,446 | ||||||
HCP‡ | 46,774 | 1,381 | ||||||
Healthcare Trust of America, Cl A‡ | 13,700 | 387 | ||||||
Highwoods Properties‡ | 9,400 | 452 | ||||||
Hospitality Properties Trust‡ | 16,366 | 475 | ||||||
Host Hotels & Resorts‡ | 72,540 | 1,294 | ||||||
Howard Hughes* | 3,673 | 418 | ||||||
Iron Mountain‡ | 25,703 | 848 | ||||||
Jones Lang LaSalle | 4,600 | 466 | ||||||
Kilroy Realty‡ | 9,100 | 658 | ||||||
| 9 | SEI Institutional Investments Trust / Semi-Annual Report / November 30, 2016 |
SCHEDULE OF INVESTMENTS (Unaudited)
Large Cap Index Fund (Continued)
November 30, 2016
| Description | Shares | Market Value ($ Thousands) | ||||||
Kimco Realty‡ | 39,944 | $ | 1,020 | |||||
Lamar Advertising, Cl A‡ | 8,240 | 546 | ||||||
Liberty Property Trust‡ | 14,606 | 575 | ||||||
Life Storage‡ | 4,500 | 366 | ||||||
Macerich‡ | 14,211 | 965 | ||||||
Mid-America Apartment Communities‡ | 7,500 | 687 | ||||||
National Retail Properties‡ | 14,000 | 598 | ||||||
NorthStar Realty Finance‡ | 18,650 | 282 | ||||||
Omega Healthcare Investors‡ | 18,400 | 542 | ||||||
Outfront Media‡ | 12,680 | 320 | ||||||
Paramount Group‡ | 18,400 | 289 | ||||||
Piedmont Office Realty Trust, Cl A‡ | 14,600 | 287 | ||||||
Post Properties‡ | 5,000 | 325 | ||||||
Prologis‡ | 51,918 | 2,643 | ||||||
Public Storage‡ | 14,668 | 3,070 | ||||||
Quality Care Properties*‡ | 9,354 | 140 | ||||||
Rayonier‡ | 11,704 | 310 | ||||||
Realogy Holdings | 14,800 | 357 | ||||||
Realty Income‡ | 25,600 | 1,419 | ||||||
Regency Centers‡ | 10,408 | 696 | ||||||
Retail Properties of America, Cl A‡ | 24,300 | 371 | ||||||
Senior Housing Properties Trust‡ | 23,600 | 426 | ||||||
Simon Property Group‡ | 31,981 | 5,745 | ||||||
SL Green Realty‡ | 9,868 | 1,040 | ||||||
Spirit Realty Capital‡ | 47,100 | 508 | ||||||
STORE Capital‡ | 14,800 | 366 | ||||||
Sun Communities‡ | 6,100 | 440 | ||||||
Tanger Factory Outlet Centers‡ | 9,600 | 331 | ||||||
Taubman Centers‡ | 5,800 | 421 | ||||||
UDR‡ | 26,493 | 902 | ||||||
Ventas‡ | 33,592 | 2,030 | ||||||
VEREIT‡ | 98,000 | 812 | ||||||
Vornado Realty Trust‡ | 17,036 | 1,665 | ||||||
Weingarten Realty Investors‡ | 11,267 | 400 | ||||||
Welltower‡ | 35,483 | 2,228 | ||||||
Weyerhaeuser‡ | 73,646 | 2,271 | ||||||
WP Carey‡ | 10,400 | 604 | ||||||
|
| |||||||
| 76,425 | ||||||||
|
| |||||||
Telecommunication Services — 2.4% | ||||||||
AT&T | 632,051 | 24,416 | ||||||
CenturyLink | 53,254 | 1,252 | ||||||
Frontier Communications (A) | 116,395 | 425 | ||||||
Level 3 Communications* | 29,286 | 1,613 | ||||||
SBA Communications, Cl A* | 12,300 | 1,217 | ||||||
Sprint* (A) | 77,115 | �� | 605 | |||||
Telephone & Data Systems | 9,880 | 266 | ||||||
T-Mobile US* | 28,800 | 1,561 | ||||||
US Cellular* | 831 | 31 | ||||||
Verizon Communications | 418,876 | 20,902 | ||||||
| Description | Shares | Market Value ($ Thousands) | ||||||
Zayo Group Holdings* | 16,400 | $ | 566 | |||||
|
| |||||||
| 52,854 | ||||||||
|
| |||||||
Utilities — 2.9% | ||||||||
AES | 66,924 | 766 | ||||||
Alliant Energy | 22,752 | 817 | ||||||
Ameren | 23,890 | 1,173 | ||||||
American Electric Power | 48,950 | 2,890 | ||||||
American Water Works | 17,600 | 1,275 | ||||||
Aqua America | 18,046 | 537 | ||||||
Atmos Energy | 10,091 | 718 | ||||||
Avangrid | 5,594 | 202 | ||||||
Calpine* | 36,900 | 411 | ||||||
CenterPoint Energy | 43,115 | 1,029 | ||||||
CMS Energy | 27,942 | 1,124 | ||||||
Consolidated Edison | 30,416 | 2,122 | ||||||
Dominion Resources | 64,212 | 4,706 | ||||||
DTE Energy | 18,064 | 1,682 | ||||||
Duke Energy | 70,716 | 5,217 | ||||||
Edison International | 31,379 | 2,158 | ||||||
Entergy | 17,898 | 1,230 | ||||||
Eversource Energy | 31,808 | 1,642 | ||||||
Exelon | 88,276 | 2,870 | ||||||
FirstEnergy | 43,027 | 1,346 | ||||||
Great Plains Energy | 25,871 | 683 | ||||||
Hawaiian Electric Industries | 11,046 | 340 | ||||||
MDU Resources Group | 19,821 | 551 | ||||||
National Fuel Gas | 7,089 | 400 | ||||||
NextEra Energy | 47,173 | 5,389 | ||||||
NiSource | 32,121 | 705 | ||||||
NRG Energy | 30,200 | 342 | ||||||
OGE Energy | 19,936 | 631 | ||||||
PG&E | 49,418 | 2,906 | ||||||
Pinnacle West Capital | 10,892 | 805 | ||||||
PPL | 67,426 | 2,256 | ||||||
Public Service Enterprise Group | 50,452 | 2,084 | ||||||
SCANA | 13,010 | 918 | ||||||
Sempra Energy | 24,823 | 2,477 | ||||||
Southern | 98,203 | 4,598 | ||||||
UGI | 17,225 | 772 | ||||||
Vectren | 8,491 | 417 | ||||||
WEC Energy Group | 31,657 | 1,773 | ||||||
Westar Energy, Cl A | 13,900 | 792 | ||||||
Xcel Energy | 50,681 | 1,977 | ||||||
|
| |||||||
| 64,731 | ||||||||
|
| |||||||
Total Common Stock |
| 2,165,616 | ||||||
|
| |||||||
| 10 | SEI Institutional Investments Trust / Semi-Annual Report / November 30, 2016 |
SCHEDULE OF INVESTMENTS (Unaudited)
Large Cap Index Fund (Concluded)
November 30, 2016
| Description | Face Amount (Thousands) | Market Value ($ Thousands) | ||||||
U.S. TREASURY OBLIGATION — 0.1% |
| |||||||
U.S. Treasury Bills | ||||||||
0.421%, 03/02/2017 (B) (D) | $ | 2,365 | $ | 2,362 | ||||
|
| |||||||
Total U.S. Treasury Obligation |
| 2,362 | ||||||
|
| |||||||
| Shares | ||||||||
AFFILIATED PARTNERSHIP — 0.8% |
| |||||||
SEI Liquidity Fund, L.P. | ||||||||
0.470% **† (C) | 18,469,274 | 18,470 | ||||||
|
| |||||||
Total Affiliated Partnership |
| 18,470 | ||||||
|
| |||||||
CASH EQUIVALENT — 1.3% |
| |||||||
SEI Daily Income Trust, Government Fund, Cl A | ||||||||
0.210%**† | 28,105,926 | 28,106 | ||||||
|
| |||||||
Total Cash Equivalent |
| 28,106 | ||||||
|
| |||||||
Total Investments — 100.2% |
| $ | 2,214,554 | |||||
|
| |||||||
A list of the open futures contracts held by the Fund at November 30, 2016, is as follows:
| Type of Contract | Number of Contracts Long | Expiration Date | Unrealized Appreciation ($ Thousands) | |||||||||
S&P 500 Index E-MINI | 358 | Dec-2016 | $ | 969 | ||||||||
S&P Mid Cap 400 Index E-MINI | 29 | Dec-2016 | 244 | |||||||||
|
| |||||||||||
| $ | 1,213 | |||||||||||
|
| |||||||||||
For the period ended November 30, 2016, the total amount of all open futures contracts, as presented in the table above, are representative of the volume of activity for the derivative type during the period.
Percentages are based on Net Assets of $2,208,536 ($ Thousands).
| * | Non-income producing security. |
| ** | Rate shown is the 7-day effective yield as of November 30, 2016. |
| † | Investment in Affiliated Security (see Note 6). |
| ‡ | Real Estate Investment Trust. |
| (A) | This security or a partial position of this security is on loan at November 30, 2016 (see Note 12). The total market value of securities on loan at November 30, 2016 was $18,216 ($ Thousands). |
| (B) | Security, or portion thereof, has been pledged as collateral on open futures contracts. |
| (C) | This security was purchased with cash collateral held from securities on loan (see Note 12). The total market value of such securities as of November 30, 2016 was $18,470 ($ Thousands). |
| (D) | The rate reported is the effective yield at time of purchase. |
Cl — Class
L.P. — Limited Partnership
MSCI — Morgan Stanley Capital International
S&P — Standard & Poor’s
The following is a list of the level of inputs used as of November 30, 2016, in valuing the Fund’s investments carried at value ($ Thousands):
| Investments in Securities | Level 1 | Level 2 | Level 3 | Total | ||||||||||||
Common Stock | $ | 2,165,616 | $ | — | $ | — | $ | 2,165,616 | ||||||||
U.S. Treasury Obligation | — | 2,362 | — | 2,362 | ||||||||||||
Affiliated Partnership | — | 18,470 | — | 18,470 | ||||||||||||
Cash Equivalent | 28,106 | — | — | 28,106 | ||||||||||||
|
|
|
|
|
|
|
| |||||||||
Total Investments in Securities | $ | 2,193,722 | $ | 20,832 | $ | — | $ | 2,214,554 | ||||||||
|
|
|
|
|
|
|
| |||||||||
| Other Financial Instruments | Level 1 | Level 2 | Level 3 | Total | ||||||||||||
Futures Contracts* | ||||||||||||||||
Unrealized Appreciation | $ | 1,213 | $ | — | $ | — | $ | 1,213 | ||||||||
|
|
|
|
|
|
|
| |||||||||
| * | Futures contracts are valued at the unrealized appreciation on the instrument. |
For the period ended November 30, 2016, there were no transfers between Level 1 and Level 2 assets and liabilities.
For the period ended November 30, 2016, there were no transfers between Level 2 and Level 3 assets and liabilities.
For more information on valuation inputs, see Note 2 — Significant Accounting Policies in Notes to Financial Statements.
Amounts designated as “—” are $0 or have been rounded to $0.
The accompanying notes are an integral part of the financial statements.
| 11 | SEI Institutional Investments Trust / Semi-Annual Report / November 30, 2016 |
SCHEDULE OF INVESTMENTS (Unaudited)
S&P 500 Index Fund
November 30, 2016
| Description | Shares | Market Value ($ Thousands) | ||||||
COMMON STOCK — 97.4% | ||||||||
Consumer Discretionary — 12.0% | ||||||||
Advance Auto Parts | 13,900 | $ | 2,359 | |||||
Amazon.com* | 73,860 | 55,437 | ||||||
AutoNation* | 12,600 | 563 | ||||||
AutoZone* | 5,445 | 4,264 | ||||||
Bed Bath & Beyond | 29,300 | 1,313 | ||||||
Best Buy | 51,487 | 2,353 | ||||||
BorgWarner | 38,500 | 1,371 | ||||||
Carmax* (A) | 35,700 | 2,063 | ||||||
Carnival, Cl A | 81,000 | 4,164 | ||||||
CBS, Cl B | 76,182 | 4,626 | ||||||
Charter Communications, Cl A* | 40,700 | 11,205 | ||||||
Chipotle Mexican Grill, Cl A* (A) | 5,520 | 2,188 | ||||||
Coach | 52,791 | 1,921 | ||||||
Comcast, Cl A | 450,974 | 31,347 | ||||||
Darden Restaurants | 23,895 | 1,752 | ||||||
Delphi Automotive | 51,300 | 3,283 | ||||||
Discovery Communications, Cl A* | 27,900 | 756 | ||||||
Discovery Communications, Cl C* | 42,600 | 1,126 | ||||||
Dollar General | 49,000 | 3,789 | ||||||
Dollar Tree* | 44,569 | 3,929 | ||||||
DR Horton | 63,991 | 1,774 | ||||||
Expedia | 22,695 | 2,815 | ||||||
Foot Locker | 25,200 | 1,806 | ||||||
Ford Motor | 731,743 | 8,752 | ||||||
Gap | 40,600 | 1,014 | ||||||
Garmin (A) | 21,795 | 1,137 | ||||||
General Motors | 266,587 | 9,205 | ||||||
Genuine Parts | 28,100 | 2,704 | ||||||
Goodyear Tire & Rubber | 48,900 | 1,501 | ||||||
H&R Block | 40,691 | 902 | ||||||
Hanesbrands | 71,500 | 1,661 | ||||||
Harley-Davidson | 33,700 | 2,052 | ||||||
Harman International Industries | 13,095 | 1,432 | ||||||
Hasbro | 21,395 | 1,827 | ||||||
Home Depot | 231,987 | 30,019 | ||||||
Interpublic Group | 75,900 | 1,827 | ||||||
Kohl’s | 33,991 | 1,830 | ||||||
L Brands | 45,400 | 3,188 | ||||||
Leggett & Platt | 24,995 | 1,201 | ||||||
Lennar, Cl A | 35,591 | 1,514 | ||||||
LKQ* | 58,100 | 1,907 | ||||||
Lowe’s | 164,087 | 11,576 | ||||||
Macy’s | 58,400 | 2,464 | ||||||
Marriott International, Cl A | 59,936 | 4,722 | ||||||
Mattel | 64,487 | 2,036 | ||||||
McDonald’s | 160,187 | 19,106 | ||||||
Michael Kors Holdings* | 32,000 | 1,488 | ||||||
Mohawk Industries* | 11,900 | 2,350 | ||||||
NetFlix* | 80,379 | 9,404 | ||||||
Newell Brands | 90,690 | 4,263 | ||||||
News | 23,200 | 277 | ||||||
| Description | Shares | Market Value ($ Thousands) | ||||||
News, Cl A | 71,083 | $ | 822 | |||||
NIKE, Cl B | 252,982 | 12,667 | ||||||
Nordstrom (A) | 22,195 | 1,241 | ||||||
Omnicom Group | 44,700 | 3,886 | ||||||
O’Reilly Automotive* | 17,900 | 4,914 | ||||||
Priceline Group* | 9,284 | 13,960 | ||||||
PulteGroup | 58,483 | 1,103 | ||||||
PVH | 15,000 | 1,589 | ||||||
Ralph Lauren, Cl A | 10,695 | 1,119 | ||||||
Ross Stores | 74,300 | 5,022 | ||||||
Royal Caribbean Cruises | 31,800 | 2,575 | ||||||
Scripps Networks Interactive, Cl A | 18,200 | 1,261 | ||||||
Signet Jewelers (A) | 14,000 | 1,278 | ||||||
Staples | 124,778 | 1,207 | ||||||
Starbucks | 275,182 | 15,952 | ||||||
Target | 107,791 | 8,326 | ||||||
TEGNA | 40,600 | 911 | ||||||
Tiffany | 20,495 | 1,690 | ||||||
Time Warner | 145,987 | 13,405 | ||||||
TJX | 123,191 | 9,651 | ||||||
Tractor Supply | 25,300 | 1,899 | ||||||
TripAdvisor* | 21,695 | 1,047 | ||||||
Twenty-First Century Fox, Cl A | 200,474 | 5,635 | ||||||
Twenty-First Century Fox, Cl B | 92,100 | 2,584 | ||||||
Ulta Salon Cosmetics & Fragrance* | 11,100 | 2,880 | ||||||
Under Armour, Cl A* (A) | 34,795 | 1,072 | ||||||
Under Armour, Cl C* | 35,432 | 913 | ||||||
Urban Outfitters* | 16,100 | 509 | ||||||
VF | 62,691 | 3,417 | ||||||
Viacom, Cl B | 65,500 | 2,455 | ||||||
Walt Disney | 277,583 | 27,514 | ||||||
Whirlpool | 14,100 | 2,290 | ||||||
Wyndham Worldwide | 20,600 | 1,483 | ||||||
Wynn Resorts (A) | 14,900 | 1,520 | ||||||
Yum! Brands | 65,800 | 4,171 | ||||||
|
| |||||||
| 439,531 | ||||||||
|
| |||||||
Consumer Staples — 9.0% | ||||||||
Altria Group | 366,783 | 23,448 | ||||||
Archer-Daniels-Midland | 108,891 | 4,707 | ||||||
Brown-Forman, Cl B | 34,792 | 1,578 | ||||||
Campbell Soup | 36,791 | 2,093 | ||||||
Church & Dwight | 48,600 | 2,128 | ||||||
Clorox | 24,500 | 2,831 | ||||||
Coca-Cola | 729,257 | 29,426 | ||||||
Colgate-Palmolive | 167,191 | 10,906 | ||||||
ConAgra Foods | 78,787 | 2,891 | ||||||
Constellation Brands, Cl A | 33,300 | 5,033 | ||||||
Costco Wholesale | 82,200 | 12,339 | ||||||
Coty, Cl A | 87,883 | 1,644 | ||||||
CVS Health | 200,083 | 15,384 | ||||||
Dr. Pepper Snapple Group | 35,100 | 3,045 | ||||||
| 1 | SEI Institutional Investments Trust / Semi-Annual Report / November 30, 2016 |
SCHEDULE OF INVESTMENTS (Unaudited)
S&P 500 Index Fund (Continued)
November 30, 2016
| Description | Shares | Market Value ($ Thousands) | ||||||
Estee Lauder, Cl A | 41,800 | $ | 3,248 | |||||
General Mills | 111,896 | 6,819 | ||||||
Hershey | 26,200 | 2,532 | ||||||
Hormel Foods | 51,192 | 1,753 | ||||||
JM Smucker | 21,795 | 2,745 | ||||||
Kellogg | 47,700 | 3,434 | ||||||
Kimberly-Clark | 67,396 | 7,792 | ||||||
Kraft Heinz | 111,691 | 9,120 | ||||||
Kroger | 178,282 | 5,758 | ||||||
McCormick | 21,795 | 1,988 | ||||||
Mead Johnson Nutrition, Cl A | 34,500 | 2,487 | ||||||
Molson Coors Brewing, Cl B | 34,795 | 3,411 | ||||||
Mondelez International, Cl A | 291,878 | 12,037 | ||||||
Monster Beverage* | 75,831 | 3,393 | ||||||
PepsiCo | 270,178 | 27,045 | ||||||
Philip Morris International | 291,178 | 25,705 | ||||||
Procter & Gamble | 501,067 | 41,318 | ||||||
Reynolds American | 155,212 | 8,397 | ||||||
Sysco | 95,700 | 5,096 | ||||||
Tyson Foods, Cl A | 56,187 | 3,192 | ||||||
Walgreens Boots Alliance | 160,387 | 13,590 | ||||||
Wal-Mart Stores | 284,483 | 20,036 | ||||||
Whole Foods Market | 59,391 | 1,805 | ||||||
|
| |||||||
| 330,154 | ||||||||
|
| |||||||
Energy — 7.3% | ||||||||
Anadarko Petroleum | 102,595 | 7,094 | ||||||
Apache | 71,300 | 4,702 | ||||||
Baker Hughes | 80,800 | 5,198 | ||||||
Cabot Oil & Gas | 88,087 | 1,949 | ||||||
Chesapeake Energy* | 141,878 | 993 | ||||||
Chevron | 354,178 | 39,512 | ||||||
Cimarex Energy | 17,896 | 2,468 | ||||||
Concho Resources* | 26,700 | 3,819 | ||||||
ConocoPhillips | 232,283 | 11,270 | ||||||
Devon Energy | 98,500 | 4,761 | ||||||
EOG Resources | 103,291 | 10,589 | ||||||
EQT | 32,695 | 2,291 | ||||||
Exxon Mobil | 778,700 | 67,981 | ||||||
FMC Technologies* | 43,100 | 1,477 | ||||||
Halliburton | 161,391 | 8,568 | ||||||
Helmerich & Payne (A) | 20,495 | 1,550 | ||||||
Hess | 50,700 | 2,837 | ||||||
Kinder Morgan | 359,883 | �� | 7,989 | |||||
Marathon Oil | 159,700 | 2,884 | ||||||
Marathon Petroleum | 98,992 | 4,655 | ||||||
Murphy Oil | 29,991 | 1,017 | ||||||
National Oilwell Varco | 71,200 | 2,660 | ||||||
Newfield Exploration* | 37,600 | 1,700 | ||||||
Noble Energy | 80,900 | 3,087 | ||||||
Occidental Petroleum | 143,295 | 10,226 | ||||||
ONEOK | 39,791 | 2,186 | ||||||
| Description | Shares | Market Value ($ Thousands) | ||||||
Phillips 66 | 83,296 | $ | 6,920 | |||||
Pioneer Natural Resources | 31,896 | 6,093 | ||||||
Range Resources | 35,600 | 1,252 | ||||||
Schlumberger | 261,066 | 21,943 | ||||||
Southwestern Energy* | 93,700 | 1,064 | ||||||
Spectra Energy | 131,300 | 5,377 | ||||||
Tesoro | 22,500 | 1,830 | ||||||
Transocean* (A) | 63,800 | 823 | ||||||
Valero Energy | 86,700 | 5,337 | ||||||
Williams | 128,496 | 3,945 | ||||||
|
| |||||||
| 268,047 | ||||||||
|
| |||||||
Financials — 14.3% | ||||||||
Affiliated Managers Group* | 10,200 | 1,511 | ||||||
Aflac | 76,691 | 5,474 | ||||||
Allstate | 69,600 | 4,866 | ||||||
American Express | 145,587 | 10,488 | ||||||
American International Group | 190,778 | 12,082 | ||||||
Ameriprise Financial | 30,500 | 3,483 | ||||||
Aon | 49,800 | 5,682 | ||||||
Arthur J Gallagher | 33,500 | 1,687 | ||||||
Assurant | 10,495 | 906 | ||||||
Bank of America | 1,915,983 | 40,466 | ||||||
Bank of New York Mellon | 200,187 | 9,493 | ||||||
BB&T | 152,691 | 6,909 | ||||||
Berkshire Hathaway, Cl B* | 356,528 | 56,132 | ||||||
BlackRock, Cl A | 22,896 | 8,490 | ||||||
Capital One Financial | 95,196 | 8,000 | ||||||
Charles Schwab | 226,491 | 8,756 | ||||||
Chubb | 87,247 | 11,168 | ||||||
Cincinnati Financial | 28,296 | 2,172 | ||||||
Citigroup | 545,457 | 30,758 | ||||||
Citizens Financial Group | 98,200 | 3,291 | ||||||
CME Group, Cl A | 63,695 | 7,192 | ||||||
Comerica | 32,891 | 2,097 | ||||||
Discover Financial Services | 75,600 | 5,123 | ||||||
E*TRADE Financial* | 51,791 | 1,787 | ||||||
Fifth Third Bancorp | 144,900 | 3,770 | ||||||
Franklin Resources | 65,695 | 2,579 | ||||||
Goldman Sachs Group | 70,791 | 15,524 | ||||||
Hartford Financial Services Group | 72,500 | 3,416 | ||||||
Huntington Bancshares | 205,361 | 2,559 | ||||||
Intercontinental Exchange | 111,900 | 6,199 | ||||||
Invesco | 77,600 | 2,430 | ||||||
JPMorgan Chase | 678,257 | 54,376 | ||||||
KeyCorp | 204,000 | 3,531 | ||||||
Legg Mason | 16,795 | 536 | ||||||
Leucadia National | 61,387 | 1,352 | ||||||
Lincoln National | 44,000 | 2,820 | ||||||
Loews | 52,187 | 2,330 | ||||||
M&T Bank | 29,623 | 4,264 | ||||||
Marsh & McLennan | 97,391 | 6,750 | ||||||
| 2 | SEI Institutional Investments Trust / Semi-Annual Report / November 30, 2016 |
SCHEDULE OF INVESTMENTS (Unaudited)
S&P 500 Index Fund (Continued)
November 30, 2016
| Description | Shares | Market Value ($ Thousands) | ||||||
MetLife | 206,087 | $ | 11,337 | |||||
Moody’s | 31,600 | 3,176 | ||||||
Morgan Stanley | 276,100 | 11,420 | ||||||
Nasdaq | 21,600 | 1,384 | ||||||
Navient | 58,100 | 1,001 | ||||||
Northern Trust | 40,296 | 3,310 | ||||||
People’s United Financial | 57,600 | 1,078 | ||||||
PNC Financial Services Group | 92,191 | 10,191 | ||||||
Principal Financial Group | 50,591 | 2,919 | ||||||
Progressive | 109,983 | 3,662 | ||||||
Prudential Financial | 82,200 | 8,269 | ||||||
Regions Financial | 234,700 | 3,178 | ||||||
S&P Global | 49,500 | 5,890 | ||||||
State Street | 68,700 | 5,414 | ||||||
SunTrust Banks | 94,300 | 4,899 | ||||||
Synchrony Financial | 148,421 | 5,129 | ||||||
T. Rowe Price Group | 47,000 | 3,481 | ||||||
Torchmark | 21,246 | 1,489 | ||||||
Travelers | 53,996 | 6,121 | ||||||
Unum Group | 43,691 | 1,847 | ||||||
US Bancorp | 301,883 | 14,979 | ||||||
Wells Fargo | 852,648 | 45,122 | ||||||
Willis Towers Watson | 24,545 | 3,053 | ||||||
XL Group | 52,100 | 1,882 | ||||||
Zions Bancorporation | 38,100 | 1,516 | ||||||
|
| |||||||
| 522,196 | ||||||||
|
| |||||||
Health Care — 13.4% | ||||||||
Abbott Laboratories | 275,683 | 10,495 | ||||||
AbbVie | 305,678 | 18,585 | ||||||
Aetna | 65,995 | 8,635 | ||||||
Agilent Technologies | 61,291 | 2,696 | ||||||
Alexion Pharmaceuticals* | 42,200 | 5,173 | ||||||
Allergan | 70,399 | 13,679 | ||||||
AmerisourceBergen | 31,296 | 2,441 | ||||||
Amgen | 140,491 | 20,241 | ||||||
Anthem | 49,296 | 7,026 | ||||||
Baxter International | 91,629 | 4,066 | ||||||
Becton Dickinson | 40,038 | 6,770 | ||||||
Biogen* | 41,100 | 12,086 | ||||||
Boston Scientific* | 254,900 | 5,215 | ||||||
Bristol-Myers Squibb | 313,583 | 17,699 | ||||||
C.R. Bard | 13,900 | 2,927 | ||||||
Cardinal Health | 60,196 | 4,275 | ||||||
Celgene* | 145,487 | 17,242 | ||||||
Centene* | 32,200 | 1,856 | ||||||
Cerner* | 56,800 | 2,827 | ||||||
Cigna | 48,200 | 6,494 | ||||||
Cooper | 9,200 | 1,513 | ||||||
Danaher | 114,000 | 8,911 | ||||||
DaVita HealthCare Partners* | 31,195 | 1,976 | ||||||
DENTSPLY SIRONA | 44,091 | 2,565 | ||||||
| Description | Shares | Market Value ($ Thousands) | ||||||
Edwards Lifesciences* | 40,000 | $ | 3,314 | |||||
Eli Lilly | 182,191 | 12,229 | ||||||
Endo International* | 38,000 | 608 | ||||||
Express Scripts Holding* | 118,191 | 8,968 | ||||||
Gilead Sciences | 247,678 | 18,254 | ||||||
HCA Holdings* | 55,795 | 3,955 | ||||||
Henry Schein* | 15,400 | 2,294 | ||||||
Hologic* | 52,500 | 2,010 | ||||||
Humana | 27,996 | 5,953 | ||||||
Illumina* | 27,600 | 3,675 | ||||||
Intuitive Surgical* | 7,200 | 4,635 | ||||||
Johnson & Johnson | 513,770 | 57,183 | ||||||
Laboratory Corp of America Holdings* | 19,400 | 2,441 | ||||||
Mallinckrodt* | 20,496 | 1,080 | ||||||
McKesson | 42,400 | 6,098 | ||||||
Medtronic | 259,361 | 18,936 | ||||||
Merck | 519,170 | 31,768 | ||||||
Mettler Toledo International* | 5,000 | 2,060 | ||||||
Mylan* | 86,596 | 3,170 | ||||||
Patterson | 15,500 | 600 | ||||||
PerkinElmer | 20,200 | 1,025 | ||||||
Perrigo | 26,696 | 2,305 | ||||||
Pfizer | 1,138,835 | 36,602 | ||||||
Quest Diagnostics | 26,100 | 2,283 | ||||||
Regeneron Pharmaceuticals* | 14,100 | 5,347 | ||||||
St. Jude Medical | 53,600 | 4,245 | ||||||
Stryker | 58,196 | 6,615 | ||||||
Thermo Fisher Scientific | 73,991 | 10,367 | ||||||
UnitedHealth Group | 178,787 | 28,306 | ||||||
Universal Health Services, Cl B | 17,100 | 2,104 | ||||||
Varian Medical Systems* | 17,495 | 1,572 | ||||||
Vertex Pharmaceuticals* | 46,600 | 3,803 | ||||||
Waters* | 15,200 | 2,045 | ||||||
Zimmer Biomet Holdings | 37,595 | 3,829 | ||||||
Zoetis, Cl A | 92,700 | 4,670 | ||||||
|
| |||||||
| 489,742 | ||||||||
|
| |||||||
Industrials — 10.2% | ||||||||
3M | 113,391 | 19,474 | ||||||
Acuity Brands | 8,300 | 2,087 | ||||||
Alaska Air Group | 23,300 | 1,917 | ||||||
Allegion | 18,296 | 1,224 | ||||||
American Airlines Group | 99,691 | 4,630 | ||||||
Ametek | 44,000 | 2,083 | ||||||
Arconic | 82,666 | 1,594 | ||||||
Boeing | 108,891 | 16,395 | ||||||
C.H. Robinson Worldwide | 26,995 | 2,021 | ||||||
Caterpillar | 109,591 | 10,473 | ||||||
Cintas | 15,995 | 1,833 | ||||||
CSX | 177,778 | 6,366 | ||||||
Cummins | 28,996 | 4,111 | ||||||
Deere | 54,196 | 5,430 | ||||||
| 3 | SEI Institutional Investments Trust / Semi-Annual Report / November 30, 2016 |
SCHEDULE OF INVESTMENTS (Unaudited)
S&P 500 Index Fund (Continued)
November 30, 2016
| Description | Shares | Market Value ($ Thousands) | ||||||
Delta Air Lines | 140,387 | $ | 6,764 | |||||
Dover | 29,400 | 2,135 | ||||||
Dun & Bradstreet | 6,695 | 815 | ||||||
Eaton | 85,195 | 5,666 | ||||||
Emerson Electric | 120,991 | 6,829 | ||||||
Equifax | 22,595 | 2,586 | ||||||
Expeditors International of Washington | 34,291 | 1,809 | ||||||
Fastenal | 54,491 | 2,583 | ||||||
FedEx | 45,800 | 8,779 | ||||||
Flowserve | 25,000 | 1,186 | ||||||
Fluor | 26,400 | 1,413 | ||||||
Fortive | 56,850 | 3,126 | ||||||
Fortune Brands Home & Security | 29,200 | 1,610 | ||||||
General Dynamics | 53,796 | 9,433 | ||||||
General Electric | 1,682,688 | 51,759 | ||||||
Honeywell International | 142,787 | 16,269 | ||||||
Illinois Tool Works | 59,895 | 7,498 | ||||||
Ingersoll-Rand | 48,796 | 3,637 | ||||||
Jacobs Engineering Group* | 22,596 | 1,401 | ||||||
JB Hunt Transport Services | 16,400 | 1,564 | ||||||
Johnson Controls International | 176,946 | 7,959 | ||||||
Kansas City Southern | 20,400 | 1,810 | ||||||
L-3 Communications Holdings, Cl 3 | 14,600 | 2,303 | ||||||
Lockheed Martin | 47,356 | 12,561 | ||||||
Masco | 62,500 | 1,978 | ||||||
Nielsen Holdings | 63,500 | 2,737 | ||||||
Norfolk Southern | 55,196 | 5,876 | ||||||
Northrop Grumman | 33,496 | 8,362 | ||||||
Paccar | 66,200 | 4,114 | ||||||
Parker Hannifin | 25,300 | 3,515 | ||||||
Pentair | 31,000 | 1,781 | ||||||
Pitney Bowes | 35,000 | 502 | ||||||
Quanta Services* | 28,700 | 968 | ||||||
Raytheon | 55,295 | 8,269 | ||||||
Republic Services | 44,100 | 2,447 | ||||||
Robert Half International | 24,295 | 1,090 | ||||||
Rockwell Automation | 24,496 | 3,275 | ||||||
Rockwell Collins | 24,600 | 2,281 | ||||||
Roper Technologies | 19,000 | 3,441 | ||||||
Ryder System | 9,995 | 783 | ||||||
Snap-on | 11,000 | 1,839 | ||||||
Southwest Airlines | 116,187 | 5,415 | ||||||
Stanley Black & Decker | 28,295 | 3,357 | ||||||
Stericycle* | 16,096 | 1,175 | ||||||
Textron | 50,991 | 2,347 | ||||||
TransDigm Group* | 9,500 | 2,389 | ||||||
Union Pacific | 156,287 | 15,837 | ||||||
United Continental Holdings* | 54,900 | 3,785 | ||||||
United Parcel Service, Cl B | 129,687 | 15,033 | ||||||
United Rentals* | 16,000 | 1,618 | ||||||
United Technologies | 146,091 | 15,737 | ||||||
Verisk Analytics, Cl A* | 29,600 | 2,459 | ||||||
| Description | Shares | Market Value ($ Thousands) | ||||||
Waste Management | 76,200 | $ | 5,297 | |||||
WW Grainger (A) | 10,400 | 2,398 | ||||||
Xylem | 33,900 | 1,749 | ||||||
|
| |||||||
| 372,987 | ||||||||
|
| |||||||
Information Technology — 20.3% | ||||||||
Accenture, Cl A | 116,796 | 13,949 | ||||||
Activision Blizzard | 127,700 | 4,675 | ||||||
Adobe Systems* | 93,495 | 9,612 | ||||||
Akamai Technologies* | 33,096 | 2,207 | ||||||
Alliance Data Systems | 11,100 | 2,539 | ||||||
Alphabet, Cl A* | 55,341 | 42,938 | ||||||
Alphabet, Cl C* | 55,463 | 42,043 | ||||||
Amphenol, Cl A | 58,091 | 3,965 | ||||||
Analog Devices | 57,900 | 4,298 | ||||||
Apple | 1,011,946 | 111,840 | ||||||
Applied Materials | 203,100 | 6,540 | ||||||
Autodesk* | 36,900 | 2,679 | ||||||
Automatic Data Processing | 85,491 | 8,209 | ||||||
Broadcom | 74,159 | 12,643 | ||||||
CA | 59,287 | 1,895 | ||||||
Cisco Systems | 944,243 | 28,157 | ||||||
Citrix Systems* | 29,500 | 2,559 | ||||||
Cognizant Technology Solutions, Cl A* | 113,695 | 6,262 | ||||||
Corning | 178,470 | 4,289 | ||||||
CSRA | 27,795 | 890 | ||||||
eBay* | 196,683 | 5,470 | ||||||
Electronic Arts* | 56,800 | 4,501 | ||||||
F5 Networks* | 12,600 | 1,773 | ||||||
Facebook, Cl A* | 436,178 | 51,652 | ||||||
Fidelity National Information Services | 61,500 | 4,747 | ||||||
First Solar* (A) | 14,300 | 434 | ||||||
Fiserv* | 41,500 | 4,342 | ||||||
FLIR Systems | 25,500 | 916 | ||||||
Global Payments | 29,082 | 1,994 | ||||||
Harris | 23,500 | 2,434 | ||||||
Hewlett Packard Enterprise | 311,474 | 7,413 | ||||||
HP | 320,374 | 4,934 | ||||||
Intel | 888,152 | 30,819 | ||||||
International Business Machines | 163,251 | 26,483 | ||||||
Intuit | 45,900 | 5,218 | ||||||
Juniper Networks | 72,400 | 1,994 | ||||||
Kla-Tencor | 29,500 | 2,355 | ||||||
Lam Research | 30,195 | 3,201 | ||||||
Linear Technology | 45,196 | 2,826 | ||||||
MasterCard, Cl A | 179,947 | 18,391 | ||||||
Microchip Technology | 40,596 | 2,687 | ||||||
Micron Technology* | 195,400 | 3,816 | ||||||
Microsoft | 1,463,404 | 88,185 | ||||||
Motorola Solutions | 31,388 | 2,519 | ||||||
NetApp | 52,991 | 1,937 | ||||||
Nvidia | 100,283 | 9,246 | ||||||
| 4 | SEI Institutional Investments Trust / Semi-Annual Report / November 30, 2016 |
SCHEDULE OF INVESTMENTS (Unaudited)
S&P 500 Index Fund (Continued)
November 30, 2016
| Description | Shares | Market Value ($ Thousands) | ||||||
Oracle | 564,965 | $ | 22,706 | |||||
Paychex | 60,687 | 3,577 | ||||||
PayPal Holdings* | 210,483 | 8,268 | ||||||
Qorvo* | 23,700 | 1,266 | ||||||
QUALCOMM | 276,578 | 18,843 | ||||||
Red Hat* | 34,200 | 2,706 | ||||||
salesforce.com* | 120,791 | 8,697 | ||||||
Seagate Technology (A) | 56,500 | 2,266 | ||||||
Skyworks Solutions | 34,996 | 2,689 | ||||||
Symantec | 116,000 | 2,829 | ||||||
TE Connectivity | 66,891 | 4,524 | ||||||
Teradata* | 24,700 | 663 | ||||||
Texas Instruments | 188,183 | 13,912 | ||||||
Total System Services | 30,791 | 1,516 | ||||||
VeriSign* | 17,600 | 1,388 | ||||||
Visa, Cl A | 354,170 | 27,384 | ||||||
Western Digital | 53,531 | 3,408 | ||||||
Western Union | 91,678 | 1,928 | ||||||
Xerox | 161,300 | 1,508 | ||||||
Xilinx | 47,900 | 2,586 | ||||||
Yahoo!* | 164,591 | 6,752 | ||||||
|
| |||||||
| 741,892 | ||||||||
|
| |||||||
Materials — 2.8% | ||||||||
Air Products & Chemicals | 40,600 | 5,865 | ||||||
Albemarle | 21,300 | 1,870 | ||||||
Avery Dennison | 17,000 | 1,225 | ||||||
Ball | 32,996 | 2,477 | ||||||
CF Industries Holdings | 44,700 | 1,294 | ||||||
Dow Chemical | 211,383 | 11,778 | ||||||
Eastman Chemical | 27,996 | 2,103 | ||||||
Ecolab | 49,196 | 5,743 | ||||||
EI du Pont de Nemours | 163,987 | 12,071 | ||||||
FMC | 25,400 | 1,425 | ||||||
Freeport-McMoRan, Cl B* | 231,100 | 3,547 | ||||||
International Flavors & Fragrances | 15,100 | 1,828 | ||||||
International Paper | 77,696 | 3,785 | ||||||
LyondellBasell Industries, Cl A | 63,896 | 5,771 | ||||||
Martin Marietta Materials | 12,000 | 2,633 | ||||||
Monsanto | 82,091 | 8,432 | ||||||
Mosaic | 66,391 | 1,885 | ||||||
Newmont Mining | 99,783 | 3,237 | ||||||
Nucor | 59,987 | 3,731 | ||||||
Owens-Illinois* | 30,100 | 553 | ||||||
PPG Industries | 50,100 | 4,806 | ||||||
Praxair | 53,500 | 6,436 | ||||||
Sealed Air | 37,300 | 1,701 | ||||||
Sherwin-Williams | 15,100 | 4,057 | ||||||
Vulcan Materials | 25,100 | 3,154 | ||||||
WestRock | 47,582 | 2,436 | ||||||
|
| |||||||
| 103,843 | ||||||||
|
| |||||||
| Description | Shares | Market Value ($ Thousands) | ||||||
Real Estate — 2.7% | ||||||||
American Tower, Cl A‡ | 79,800 | $ | 8,161 | |||||
Apartment Investment & Management, Cl A‡ | 29,700 | 1,250 | ||||||
AvalonBay Communities‡ | 25,700 | 4,227 | ||||||
Boston Properties‡ | 28,900 | 3,580 | ||||||
CBRE Group, Cl A* | 56,491 | 1,641 | ||||||
Crown Castle International‡ | 63,996 | 5,341 | ||||||
Digital Realty Trust‡ | 27,800 | 2,567 | ||||||
Equinix‡ | 13,357 | 4,525 | ||||||
Equity Residential‡ | 68,396 | 4,104 | ||||||
Essex Property Trust‡ | 12,300 | 2,656 | ||||||
Extra Space Storage‡ | 23,800 | 1,670 | ||||||
Federal Realty Investment Trust‡ | 13,400 | 1,882 | ||||||
General Growth Properties‡ | 110,000 | 2,787 | ||||||
HCP‡ | 88,000 | 2,599 | ||||||
Host Hotels & Resorts‡ | 140,474 | 2,506 | ||||||
Iron Mountain‡ | 46,301 | 1,528 | ||||||
Kimco Realty‡ | 79,487 | 2,030 | ||||||
Macerich‡ | 22,396 | 1,520 | ||||||
Prologis‡ | 98,700 | 5,024 | ||||||
Public Storage‡ | 27,995 | 5,859 | ||||||
Realty Income‡ | 48,900 | 2,711 | ||||||
Simon Property Group‡ | 58,896 | 10,581 | ||||||
SL Green Realty‡ | 19,000 | 2,002 | ||||||
UDR‡ | 50,600 | 1,722 | ||||||
Ventas‡ | 66,100 | 3,994 | ||||||
Vornado Realty Trust‡ | 32,496 | 3,177 | ||||||
Welltower‡ | 67,300 | 4,225 | ||||||
Weyerhaeuser‡ | 140,745 | 4,339 | ||||||
|
| |||||||
| 98,208 | ||||||||
|
| |||||||
Telecommunication Services — 2.4% | ||||||||
AT&T | 1,155,143 | 44,623 | ||||||
CenturyLink (A) | 103,287 | 2,429 | ||||||
Frontier Communications (A) | 215,165 | 786 | ||||||
Level 3 Communications* | 54,900 | 3,023 | ||||||
Verizon Communications | 765,352 | 38,191 | ||||||
|
| |||||||
| 89,052 | ||||||||
|
| |||||||
Utilities — 3.0% | ||||||||
AES | 124,900 | 1,430 | ||||||
Alliant Energy | 43,100 | 1,548 | ||||||
Ameren | 45,891 | 2,254 | ||||||
American Electric Power | 92,100 | 5,439 | ||||||
American Water Works | 33,500 | 2,428 | ||||||
CenterPoint Energy | 81,583 | 1,947 | ||||||
CMS Energy | 52,591 | 2,115 | ||||||
Consolidated Edison | 57,000 | 3,977 | ||||||
Dominion Resources | 117,300 | 8,597 | ||||||
DTE Energy | 33,800 | 3,146 | ||||||
Duke Energy | 129,191 | 9,530 | ||||||
Edison International | 61,296 | 4,215 | ||||||
| 5 | SEI Institutional Investments Trust / Semi-Annual Report / November 30, 2016 |
SCHEDULE OF INVESTMENTS (Unaudited)
S&P 500 Index Fund (Concluded)
November 30, 2016
| Description | Shares | Market Value ($ Thousands) | ||||||
Entergy | 33,700 | $ | 2,316 | |||||
Eversource Energy | 60,000 | 3,097 | ||||||
Exelon | 172,891 | 5,621 | ||||||
FirstEnergy | 80,087 | 2,506 | ||||||
NextEra Energy | 87,600 | 10,007 | ||||||
NiSource | 61,087 | 1,340 | ||||||
NRG Energy | 58,487 | 663 | ||||||
PG&E | 93,600 | 5,504 | ||||||
Pinnacle West Capital | 21,100 | 1,560 | ||||||
PPL | 127,500 | 4,266 | ||||||
Public Service Enterprise Group | 95,200 | 3,933 | ||||||
SCANA | 27,096 | 1,911 | ||||||
Sempra Energy | 46,995 | 4,690 | ||||||
Southern | 183,500 | 8,591 | ||||||
WEC Energy Group | 59,631 | 3,340 | ||||||
Xcel Energy | 95,583 | 3,729 | ||||||
|
| |||||||
| 109,700 | ||||||||
|
| |||||||
Total Common Stock |
| 3,565,352 | ||||||
|
| |||||||
| Face Amount (Thousands) | ||||||||
U.S. TREASURY OBLIGATIONS — 0.1% |
| |||||||
U.S. Treasury Bills | ||||||||
0.410%, 03/02/2017 (B) (C) | $ | 1,338 | 1,336 | |||||
0.331%, 12/08/2016 (B) (C) | 2,800 | 2,800 | ||||||
|
| |||||||
Total U.S. Treasury Obligations |
| 4,136 | ||||||
|
| |||||||
| Shares | ||||||||
AFFILIATED PARTNERSHIP — 0.4% |
| |||||||
SEI Liquidity Fund, L.P. | ||||||||
0.470%**† (D) | 17,631,607 | 17,633 | ||||||
|
| |||||||
Total Affiliated Partnership |
| 17,633 | ||||||
|
| |||||||
CASH EQUIVALENT — 2.0% |
| |||||||
SEI Daily Income Trust, Government Fund, Cl A | ||||||||
0.210%**† | 74,343,418 | 74,343 | ||||||
|
| |||||||
Total Cash Equivalent |
| 74,343 | ||||||
|
| |||||||
Total Investments — 99.9% |
| $ | 3,661,464 | |||||
|
| |||||||
A list of the open futures contracts held by the Fund at November 30, 2016, is as follows:
| Type of Contract | Number of Contracts Long | Expiration Date | Unrealized Appreciation ($ Thousands) | |||||||||
S&P 500 Index E-MINI | 861 | Dec-2016 | $ | 2,016 | ||||||||
|
| |||||||||||
For the period ended November 30, 2016, the total amount of all open futures contracts, as presented in the table above, are representative of the volume of activity for the derivative type during the period.
Percentages are based on Net Assets of $3,662,764 ($ Thousands).
| * | Non-income producing security. |
| ** | Rate shown is the 7-day effective yield as of November 30, 2016. |
| † | Investment in Affiliated Security (see Note 6). |
| ‡ | Real Estate Investment Trust. |
| (A) | This security or a partial position of this security is on loan at November 30, 2016 (see Note 12). The total market value of securities on loan at November 30, 2016 was $17,503 ($ Thousands). |
| (B) | Security, or portion thereof, has been pledged as collateral on open futures contracts. |
| (C) | The rate reported is the effective yield at the time of purchase. |
| (D) | This security was purchased with cash collateral held from securities on loan (see Note 12). The total market value of such securities as of November 30, 2016 was $17,633 ($ Thousands). |
Cl — Class
L.P. — Limited Partnership
S&P — Standard & Poor’s
The following is a list of the level of inputs used as of November 30, 2016, in valuing the Fund’s investments carried at value ($ Thousands):
| Investments in Securities | Level 1 | Level 2 | Level 3 | Total | ||||||||||||
Common Stock | $ | 3,565,352 | $ | — | $ | — | $ | 3,565,352 | ||||||||
U.S. Treasury Obligations | — | 4,136 | — | 4,136 | ||||||||||||
Affiliated Partnership | — | 17,633 | — | 17,633 | ||||||||||||
Cash Equivalent | 74,343 | — | — | 74,343 | ||||||||||||
|
|
|
|
|
|
|
| |||||||||
Total Investments in Securities | $ | 3,639,695 | $ | 21,769 | $ | — | $ | 3,661,464 | ||||||||
|
|
|
|
|
|
|
| |||||||||
| Other Financial Instruments | Level 1 | Level 2 | Level 3 | Total | ||||||||||||
Futures Contracts* | ||||||||||||||||
Unrealized Appreciation | $ | 2,016 | $ | — | $ | — | $ | 2,016 | ||||||||
|
|
|
|
|
|
|
| |||||||||
| * | Futures contracts are valued at the unrealized appreciation on the instrument. |
For the period ended November 30, 2016, there were no transfers between Level 1 and Level 2 assets and liabilities.
For the period ended November 30, 2016, there were no transfers between Level 2 and Level 3 assets and liabilities.
For more information on valuation inputs, see Note 2 — Significant Accounting Policies in Notes to Financial Statements.
Amounts designated as “—” are $0 or have been rounded to $0.
The accompanying notes are an integral part of the financial statements.
| 6 | SEI Institutional Investments Trust / Semi-Annual Report / November 30, 2016 |
SCHEDULE OF INVESTMENTS (Unaudited)
Extended Market Index Fund
November 30, 2016
| Description | Shares | Market Value ($ Thousands) | ||||||
COMMON STOCK — 97.3% | ||||||||
Consumer Discretionary — 13.6% | ||||||||
1-800-Flowers.com, Cl A* | 7,300 | $ | 77 | |||||
Aaron’s | 12,216 | 356 | ||||||
Abercrombie & Fitch, Cl A | 12,300 | 177 | ||||||
Adient* | 17,800 | 953 | ||||||
AMC Entertainment Holdings, Cl A | 4,100 | 139 | ||||||
AMC Networks, Cl A* | 11,660 | 644 | ||||||
American Axle & Manufacturing Holdings* | 13,498 | 211 | ||||||
American Eagle Outfitters (A) | 32,922 | 545 | ||||||
American Public Education* | 2,727 | 63 | ||||||
America’s Car-Mart* | 850 | 39 | ||||||
Apollo Education Group, Cl A* | 16,100 | 152 | ||||||
Aramark | 46,200 | 1,590 | ||||||
Arctic Cat | 1,535 | 23 | ||||||
Asbury Automotive Group* | 4,098 | 241 | ||||||
Ascena Retail Group* | 33,727 | 204 | ||||||
Ascent Capital Group, Cl A* | 1,754 | 32 | ||||||
Barnes & Noble | 12,727 | 160 | ||||||
Barnes & Noble Education* | 5,894 | 67 | ||||||
Bassett Furniture Industries | 2,700 | 78 | ||||||
Beazer Homes USA* | 7,161 | 97 | ||||||
Belmond, Cl A* | 17,030 | 221 | ||||||
Big 5 Sporting Goods | 4,423 | 86 | ||||||
Big Lots | 9,446 | 478 | ||||||
Biglari Holdings* | 182 | 85 | ||||||
BJ’s Restaurants* | 4,642 | 172 | ||||||
Bloomin’ Brands | 22,950 | 427 | ||||||
Blue Nile | 1,431 | 58 | ||||||
Bob Evans Farms | 3,287 | 147 | ||||||
Bojangles’* | 2,000 | 36 | ||||||
Boot Barn Holdings* (A) | 3,000 | 47 | ||||||
Boyd Gaming* | 15,245 | 287 | ||||||
Bridgepoint Education* | 2,679 | 27 | ||||||
Bright Horizons Family Solutions* | 8,735 | 601 | ||||||
Brinker International (A) | 11,882 | 631 | ||||||
Brunswick | 17,483 | 876 | ||||||
Buckle (A) | 4,851 | 123 | ||||||
Buffalo Wild Wings* | 3,427 | 578 | ||||||
Build-A-Bear Workshop, Cl A* | 2,700 | 39 | ||||||
Burlington Stores* | 13,300 | 1,169 | ||||||
Cabela’s* | 10,639 | 662 | ||||||
Cable One | 900 | 532 | ||||||
Caesars Acquisition, Cl A* | 11,600 | 139 | ||||||
Caesars Entertainment* (A) | 7,783 | 58 | ||||||
CalAtlantic Group | 15,175 | 507 | ||||||
Caleres | 8,576 | 281 | ||||||
Callaway Golf | 17,606 | 214 | ||||||
Capella Education | 2,138 | 187 | ||||||
Career Education* | 10,054 | 100 | ||||||
Carmike Cinemas* (A) | 5,042 | 170 | ||||||
Carriage Services, Cl A | 2,006 | 54 | ||||||
Carrols Restaurant Group* | 7,900 | 107 | ||||||
| Description | Shares | Market Value ($ Thousands) | ||||||
Carter’s | 9,370 | $ | 855 | |||||
Cato, Cl A | 6,296 | 186 | ||||||
Cavco Industries* | 1,831 | 173 | ||||||
Central European Media Enterprises, Cl A* | 7,006 | 19 | ||||||
Century Communities* | 4,200 | 87 | ||||||
Cheesecake Factory | 8,723 | 516 | ||||||
Chegg* | 15,300 | 124 | ||||||
Chico’s FAS | 26,951 | 413 | ||||||
Children’s Place | 3,633 | 377 | ||||||
Choice Hotels International | 6,377 | 328 | ||||||
Churchill Downs | 2,534 | 388 | ||||||
Chuy’s Holdings* | 2,335 | 73 | ||||||
Cinemark Holdings | 20,540 | 818 | ||||||
Citi Trends | 3,097 | 54 | ||||||
Clear Channel Outdoor Holdings, Cl A | 6,796 | 37 | ||||||
ClubCorp Holdings | 14,200 | 185 | ||||||
Collectors Universe | 1,500 | 30 | ||||||
Columbia Sportswear | 5,144 | 293 | ||||||
Conn’s* (A) | 3,909 | 44 | ||||||
Container Store Group* | 1,600 | 9 | ||||||
Cooper Tire & Rubber | 10,632 | 407 | ||||||
Cooper-Standard Holdings* | 3,400 | 324 | ||||||
Core-Mark Holdings | 9,436 | 345 | ||||||
Cracker Barrel Old Country Store (A) | 3,644 | 593 | ||||||
Crocs* | 11,003 | 77 | ||||||
CSS Industries | 2,292 | 62 | ||||||
CST Brands | 14,500 | 696 | ||||||
Culp | 2,861 | 97 | ||||||
Daily Journal* | 100 | 24 | ||||||
Dana Holdings | 29,898 | 505 | ||||||
Dave & Buster’s Entertainment* | 8,500 | 398 | ||||||
Deckers Outdoor* | 6,404 | 381 | ||||||
Del Frisco’s Restaurant Group* | 2,800 | 48 | ||||||
Del Taco Restaurants* | 4,500 | 65 | ||||||
Delta Apparel* | 1,400 | 29 | ||||||
Denny’s* | 14,463 | 175 | ||||||
Destination XL Group* | 4,342 | 18 | ||||||
DeVry Education Group (A) | 12,681 | 379 | ||||||
Dick’s Sporting Goods | 16,335 | 965 | ||||||
Dillard’s, Cl A | 3,862 | 276 | ||||||
DineEquity | 3,272 | 273 | ||||||
DISH Network, Cl A* | 42,219 | 2,425 | ||||||
Domino’s Pizza | 9,558 | 1,606 | ||||||
Dorman Products* | 5,340 | 386 | ||||||
Drew Industries | 4,549 | 478 | ||||||
DSW, Cl A | 11,992 | 285 | ||||||
Duluth Holdings, Cl B* (A) | 2,900 | 97 | ||||||
Dunkin’ Brands Group | 17,130 | 930 | ||||||
Eastman Kodak* | 2,100 | 32 | ||||||
El Pollo Loco Holdings* (A) | 3,900 | 49 | ||||||
Eldorado Resorts* (A) | 7,500 | 103 | ||||||
Entercom Communications, Cl A | 4,782 | 73 | ||||||
| 1 | SEI Institutional Investments Trust / Semi-Annual Report / November 30, 2016 |
SCHEDULE OF INVESTMENTS (Unaudited)
Extended Market Index Fund (Continued)
November 30, 2016
| Description | Shares | Market Value ($ Thousands) | ||||||
Entravision Communications, Cl A | 14,200 | $ | 94 | |||||
Eros International* (A) | 5,900 | 83 | ||||||
Ethan Allen Interiors | 5,276 | 182 | ||||||
Etsy* | 20,200 | 250 | ||||||
EW Scripps, Cl A* | 10,496 | 180 | ||||||
Express* | 14,962 | 200 | ||||||
Extended Stay America | 15,600 | 243 | ||||||
Federal-Mogul Holdings, Cl A* | 3,316 | 32 | ||||||
Fiesta Restaurant Group* | 6,805 | 195 | ||||||
Finish Line, Cl A | 9,311 | 209 | ||||||
Five Below* | 10,605 | 417 | ||||||
Flexsteel Industries | 1,700 | 93 | ||||||
Fossil Group* | 8,500 | 284 | ||||||
Fox Factory Holding* | 5,000 | 125 | ||||||
Francesca’s Holdings* | 8,224 | 131 | ||||||
Fred’s, Cl A | 6,579 | 66 | ||||||
FTD* | 2,392 | 55 | ||||||
GameStop, Cl A (A) | 22,100 | 546 | ||||||
Gannett | 20,200 | 193 | ||||||
Genesco* | 4,069 | 257 | ||||||
Gentex | 55,990 | 1,035 | ||||||
Gentherm* | 6,548 | 209 | ||||||
G-III Apparel Group* | 8,106 | 220 | ||||||
Global Eagle Entertainment* | 10,300 | 66 | ||||||
GNC Holdings, Cl A | 13,278 | 192 | ||||||
GoPro, Cl A* (A) | 21,400 | 214 | ||||||
Graham Holdings, Cl B | 800 | 392 | ||||||
Grand Canyon Education* | 8,215 | 469 | ||||||
Gray Television* | 12,300 | 124 | ||||||
Green Brick Partners* (A) | 6,200 | 57 | ||||||
Group 1 Automotive | 3,735 | 271 | ||||||
Groupon, Cl A* | 82,841 | 329 | ||||||
Guess? | 11,317 | 173 | ||||||
Habit Restaurants, Cl A* (A) | 1,600 | 27 | ||||||
Haverty Furniture | 4,363 | 94 | ||||||
Helen of Troy* | 5,448 | 464 | ||||||
Hibbett Sports* | 4,012 | 161 | ||||||
Hilton Worldwide Holdings | 100,800 | 2,527 | ||||||
Hooker Furniture | 2,700 | 74 | ||||||
Horizon Global* | 2,470 | 57 | ||||||
Houghton Mifflin Harcourt* | 24,200 | 267 | ||||||
Hovnanian Enterprises, Cl A* (A) | 10,715 | 21 | ||||||
HSN | 6,411 | 244 | ||||||
Hyatt Hotels, Cl A* | 4,327 | 222 | ||||||
Iconix Brand Group* (A) | 8,051 | 72 | ||||||
ILG | 24,898 | 450 | ||||||
IMAX* (A) | 11,800 | 377 | ||||||
Installed Building Products* | 5,100 | 212 | ||||||
International Game Technology | 18,500 | 477 | ||||||
International Speedway, Cl A | 5,498 | 202 | ||||||
Intrawest Resorts Holdings* | 3,200 | 56 | ||||||
iRobot* | 5,702 | 325 | ||||||
| Description | Shares | Market Value ($ Thousands) | ||||||
Isle of Capri Casinos* | 4,779 | $ | 107 | |||||
J Alexander’s Holdings* | 2,756 | 26 | ||||||
J.C. Penney* (A) | 55,795 | 528 | ||||||
Jack in the Box | 6,221 | 647 | ||||||
JAKKS Pacific* | 427 | 3 | ||||||
Jamba* | 1,407 | 14 | ||||||
John Wiley & Sons, Cl A | 9,072 | 498 | ||||||
Johnson Outdoors, Cl A | 700 | 29 | ||||||
K12* | 8,088 | 119 | ||||||
Kate Spade* | 23,798 | 353 | ||||||
KB Home | 17,485 | 277 | ||||||
Kimball International, Cl B | 7,025 | 105 | ||||||
Kirkland’s* | 2,028 | 30 | ||||||
La Quinta Holdings* | 14,500 | 176 | ||||||
Lands’ End* (A) | 4,362 | 77 | ||||||
Las Vegas Sands | 70,404 | 4,412 | ||||||
La-Z-Boy | 8,926 | 239 | ||||||
Lear | 14,071 | 1,822 | ||||||
LGI Homes* (A) | 2,900 | 95 | ||||||
Libbey | 2,785 | 53 | ||||||
Liberty Braves Group, Cl A* | 1,803 | 36 | ||||||
Liberty Braves Group, Cl C* | 6,565 | 130 | ||||||
Liberty Broadband, Cl A* | 5,683 | 395 | ||||||
Liberty Broadband, Cl C* | 20,268 | 1,445 | ||||||
Liberty Expedia Holdings, Cl A* | 11,032 | 485 | ||||||
Liberty Interactive, Cl A* | 84,844 | 1,757 | ||||||
Liberty Media Group LLC, Cl A* | 4,508 | 141 | ||||||
Liberty Media Group LLC, Cl C* | 9,042 | 282 | ||||||
Liberty SiriusXM Group, Cl A* | 18,035 | 655 | ||||||
Liberty SiriusXM Group, Cl C* | 34,670 | 1,240 | ||||||
Liberty Tripadvisor Holdings, Cl A* | 13,392 | 215 | ||||||
Liberty Ventures, Ser A* | 16,547 | 646 | ||||||
LifeLock* | 15,063 | 359 | ||||||
Lifetime Brands | 300 | 5 | ||||||
Lions Gate Entertainment (A) | 18,309 | 428 | ||||||
Lithia Motors, Cl A | 4,789 | 440 | ||||||
Live Nation* | 25,803 | 714 | ||||||
Loral Space & Communications* | 1,900 | 75 | ||||||
lululemon athletica* | 18,300 | 1,043 | ||||||
Lumber Liquidators Holdings* (A) | 4,126 | 73 | ||||||
M/I Homes* | 6,094 | 142 | ||||||
Madison Square Garden, Cl A* | 3,879 | 674 | ||||||
Malibu Boats, Cl A* | 4,600 | 84 | ||||||
Marcus | 2,761 | 83 | ||||||
MarineMax* | 3,996 | 75 | ||||||
Marriott Vacations Worldwide | 4,374 | 340 | ||||||
MDC Holdings | 7,689 | 207 | ||||||
MDC Partners, Cl A | 8,576 | 53 | ||||||
Media General* | 20,200 | 371 | ||||||
Meredith | 7,344 | 408 | ||||||
Meritage Homes* | 7,211 | 260 | ||||||
Metaldyne Performance Group | 3,400 | 69 | ||||||
| 2 | SEI Institutional Investments Trust / Semi-Annual Report / November 30, 2016 |
SCHEDULE OF INVESTMENTS (Unaudited)
Extended Market Index Fund (Continued)
November 30, 2016
| Description | Shares | Market Value ($ Thousands) | ||||||
MGM Resorts International* | 91,274 | $ | 2,620 | |||||
Michaels* | 20,300 | 495 | ||||||
Modine Manufacturing* | 7,374 | 87 | ||||||
Monarch Casino & Resort* | 1,100 | 27 | ||||||
Monro Muffler | 5,728 | 343 | ||||||
Motorcar Parts & Accessories* | 3,700 | 91 | ||||||
Movado Group | 2,720 | 77 | ||||||
MSG Networks* | 11,940 | 244 | ||||||
Murphy USA* | 8,000 | 546 | ||||||
Nathan’s Famous* | 900 | 56 | ||||||
National CineMedia | 15,007 | 230 | ||||||
Nautilus* | 6,200 | 107 | ||||||
New Media Investment | 8,900 | 137 | ||||||
New York Times, Cl A | 22,982 | 299 | ||||||
Nexstar Broadcasting Group, Cl A | 5,722 | 341 | ||||||
Noodles, Cl A* | 700 | 3 | ||||||
Norwegian Cruise Line Holdings* | 30,069 | 1,197 | ||||||
Nutrisystem | 6,359 | 234 | ||||||
NVR* | 670 | 1,069 | ||||||
Office Depot | 98,947 | 482 | ||||||
Ollie’s Bargain Outlet Holdings* | 3,000 | 90 | ||||||
Overstock.com* | 700 | 12 | ||||||
Oxford Industries | 2,854 | 207 | ||||||
Panera Bread, Cl A* | 4,320 | 916 | ||||||
Papa John’s International | 5,042 | 446 | ||||||
Party City Holdco* | 3,900 | 63 | ||||||
Penn National Gaming* | 16,554 | 220 | ||||||
Penske Auto Group | 7,388 | 369 | ||||||
Perry Ellis International* | 2,439 | 62 | ||||||
PetMed Express (A) | 3,796 | 83 | ||||||
Pier 1 Imports | 18,189 | 102 | ||||||
Pinnacle Entertainment* | 10,760 | 147 | ||||||
Planet Fitness, Cl A | 4,600 | 93 | ||||||
Polaris Industries (A) | 11,907 | 1,034 | ||||||
Pool | 7,870 | 792 | ||||||
Popeyes Louisiana Kitchen* | 4,739 | 284 | ||||||
Potbelly* | 5,900 | 81 | ||||||
Reading International, Cl A* | 3,800 | 60 | ||||||
Red Robin Gourmet Burgers* | 2,967 | 153 | ||||||
Red Rock Resorts, Cl A | 5,400 | 124 | ||||||
Regal Entertainment Group, Cl A (A) | 16,205 | 371 | ||||||
Regis* | 6,527 | 88 | ||||||
Rent-A-Center, Cl A | 9,840 | 114 | ||||||
Restoration Hardware Holdings* (A) | 7,211 | 260 | ||||||
Ruby Tuesday* | 9,879 | 30 | ||||||
Ruth’s Hospitality Group | 7,672 | 130 | ||||||
Saga Communications, Cl A | 593 | 28 | ||||||
Sally Beauty Holdings* | 26,991 | 707 | ||||||
Scholastic | 5,667 | 250 | ||||||
Scientific Games, Cl A* (A) | 8,962 | 132 | ||||||
Sears Holdings* (A) | 2,026 | 26 | ||||||
SeaWorld Entertainment (A) | 16,000 | 270 | ||||||
| Description | Shares | Market Value ($ Thousands) | ||||||
Select Comfort* | 9,009 | $ | 204 | |||||
Sequential Brands Group* (A) | 10,040 | 51 | ||||||
Service International | 35,089 | 947 | ||||||
ServiceMaster Global Holdings* | 25,400 | 971 | ||||||
Shake Shack, Cl A* | 2,800 | 103 | ||||||
Shoe Carnival | 2,076 | 54 | ||||||
Shutterfly* | 6,425 | 326 | ||||||
Sinclair Broadcast Group, Cl A | 12,711 | 414 | ||||||
Sirius XM Holdings (A) | 339,079 | 1,550 | ||||||
Six Flags Entertainment | 13,958 | 805 | ||||||
Skechers U.S.A., Cl A* | 24,646 | 561 | ||||||
Smith & Wesson Holding* (A) | 12,383 | 289 | ||||||
Sonic | 9,133 | 238 | ||||||
Sonic Automotive, Cl A | 5,064 | 107 | ||||||
Sotheby’s (A) | 9,561 | 373 | ||||||
Spartan Motors | 6,500 | 58 | ||||||
Speedway Motorsports | 1,635 | 33 | ||||||
Sportsman’s Warehouse Holdings* | 5,400 | 49 | ||||||
Stage Stores | 3,854 | 17 | ||||||
Standard Motor Products | 3,966 | 198 | ||||||
Starz* | 16,539 | 560 | ||||||
Stein Mart | 4,791 | 24 | ||||||
Steven Madden* | 13,301 | 493 | ||||||
Stoneridge* | 3,730 | 59 | ||||||
Strattec Security | 400 | 16 | ||||||
Strayer Education* | 1,817 | 133 | ||||||
Sturm Ruger (A) | 3,542 | 182 | ||||||
Superior Industries International | 5,323 | 134 | ||||||
Superior Uniform Group | 2,000 | 38 | ||||||
Tailored Brands | 10,068 | 189 | ||||||
Taylor Morrison Home, Cl A* | 5,700 | 113 | ||||||
Tempur Sealy International* (A) | 9,723 | 615 | ||||||
Tenneco* | 11,263 | 664 | ||||||
Tesla Motors* (A) | 24,058 | 4,557 | ||||||
Texas Roadhouse, Cl A | 13,266 | 622 | ||||||
Thor Industries | 8,990 | 904 | ||||||
Tile Shop Holdings* | 7,600 | 152 | ||||||
Tilly’s, Cl A* | 843 | 8 | ||||||
Time | 19,600 | 318 | ||||||
Toll Brothers* | 30,639 | 909 | ||||||
TopBuild* | 8,000 | 290 | ||||||
Tower International | 4,800 | 126 | ||||||
TRI Pointe Homes* | 27,473 | 319 | ||||||
Tribune Media, Cl A | 15,600 | 560 | ||||||
tronc | 4,100 | 53 | ||||||
Tuesday Morning* | 6,886 | 32 | ||||||
Tupperware Brands | 9,624 | 534 | ||||||
Unifi* | 2,480 | 77 | ||||||
Universal Electronics* | 2,487 | 167 | ||||||
Vail Resorts | 7,312 | 1,158 | ||||||
Vera Bradley* | 2,470 | 36 | ||||||
Vince Holding* | 1,977 | 8 | ||||||
| 3 | SEI Institutional Investments Trust / Semi-Annual Report / November 30, 2016 |
SCHEDULE OF INVESTMENTS (Unaudited)
Extended Market Index Fund (Continued)
November 30, 2016
| Description | Shares | Market Value ($ Thousands) | ||||||
Vista Outdoor* | 12,288 | $ | 493 | |||||
Visteon | 6,765 | 532 | ||||||
Vitamin Shoppe* | 5,384 | 134 | ||||||
Wayfair, Cl A* (A) | 5,600 | 204 | ||||||
WCI Communities* | 4,900 | 114 | ||||||
Weight Watchers International* | 5,774 | 61 | ||||||
Wendy’s | 42,675 | 536 | ||||||
West Marine* | 537 | 5 | ||||||
Weyco Group | 263 | 8 | ||||||
William Lyon Homes, Cl A* (A) | 5,900 | 117 | ||||||
Williams-Sonoma | 16,537 | 906 | ||||||
Wingstop | 2,500 | 77 | ||||||
Winmark | 395 | 45 | ||||||
Winnebago Industries | 5,835 | 189 | ||||||
Wolverine World Wide | 19,596 | 441 | ||||||
World Wrestling Entertainment, Cl A (A) | 7,434 | 140 | ||||||
Yum China Holdings* | 69,600 | 1,957 | ||||||
Zagg* | 7,200 | 48 | ||||||
Zoe’s Kitchen* (A) | 3,000 | 74 | ||||||
Zumiez* | 3,903 | 97 | ||||||
|
| |||||||
| 113,417 | ||||||||
|
| |||||||
Consumer Staples — 3.3% | ||||||||
AdvancePierre Foods Holdings | 5,000 | 135 | ||||||
Alico | 143 | 4 | ||||||
Alliance One International* | 466 | 7 | ||||||
Amplify Snack Brands* (A) | 4,900 | 47 | ||||||
Andersons | 5,399 | 213 | ||||||
Avon Products | 83,800 | 450 | ||||||
B&G Foods, Cl A | 12,611 | 540 | ||||||
Blue Buffalo Pet Products* | 13,500 | 316 | ||||||
Boston Beer, Cl A* (A) | 1,783 | 309 | ||||||
Bunge | 26,543 | 1,812 | ||||||
Calavo Growers | 3,226 | 174 | ||||||
Cal-Maine Foods (A) | 7,128 | 290 | ||||||
Casey’s General Stores | 7,759 | 935 | ||||||
Central Garden & Pet* | 2,600 | 75 | ||||||
Central Garden and Pet, Cl A* | 7,929 | 217 | ||||||
Chefs’ Warehouse* | 3,921 | 51 | ||||||
Coca-Cola Bottling | 889 | 144 | ||||||
Craft Brew Alliance* | 1,600 | 24 | ||||||
Darling International* | 33,257 | 449 | ||||||
Dean Foods | 20,350 | 404 | ||||||
Edgewell Personal Care* | 11,045 | 874 | ||||||
Energizer Holdings | 13,145 | 590 | ||||||
Farmer Brothers* | 900 | 31 | ||||||
Flowers Foods (A) | 33,208 | 515 | ||||||
Fresh Del Monte Produce | 6,581 | 408 | ||||||
Freshpet* (A) | 3,400 | 31 | ||||||
Hain Celestial Group* | 20,260 | 794 | ||||||
Herbalife* (A) | 14,672 | 719 | ||||||
HRG Group* | 26,178 | 407 | ||||||
| Description | Shares | Market Value ($ Thousands) | ||||||
Ingles Markets, Cl A | 2,245 | $ | 103 | |||||
Ingredion | 13,665 | 1,604 | ||||||
Inter Parfums | 3,806 | 131 | ||||||
Inventure Foods* | 900 | 8 | ||||||
J&J Snack Foods | 3,064 | 372 | ||||||
John B Sanfilippo & Son | 1,519 | 97 | ||||||
Lamb Weston Holdings | 27,700 | 927 | ||||||
Lancaster Colony | 3,629 | 492 | ||||||
Landec* | 4,693 | 67 | ||||||
Lifevantage* | 2,700 | 22 | ||||||
Limoneira (A) | 1,295 | 23 | ||||||
Medifast | 1,564 | 61 | ||||||
MGP Ingredients | 2,300 | 109 | ||||||
National Beverage (A) | 2,352 | 119 | ||||||
Natural Grocers by Vitamin Cottage* | 1,085 | 12 | ||||||
Natural Health Trends (A) | 2,100 | 53 | ||||||
Nature’s Sunshine Products | 437 | 7 | ||||||
Nu Skin Enterprises, Cl A | 11,605 | 606 | ||||||
Nutraceutical International | 2,062 | 67 | ||||||
Oil-Dri Corp of America | 210 | 8 | ||||||
Omega Protein* | 3,866 | 93 | ||||||
Orchids Paper Products | 800 | 20 | ||||||
Performance Food Group* | 6,700 | 141 | ||||||
Pilgrim’s Pride | 11,607 | 204 | ||||||
Pinnacle Foods | 22,800 | 1,130 | ||||||
Post Holdings* | 12,669 | 967 | ||||||
PriceSmart | 3,923 | 358 | ||||||
Primo Water* | 4,100 | 53 | ||||||
Revlon, Cl A* | 2,920 | 81 | ||||||
Rite Aid* | 201,827 | 1,607 | ||||||
Sanderson Farms (A) | 4,041 | 326 | ||||||
Seaboard* | 57 | 233 | ||||||
Seneca Foods, Cl A* | 462 | 17 | ||||||
Smart & Final Stores* | 3,500 | 47 | ||||||
Snyder’s-Lance | 16,153 | 602 | ||||||
SpartanNash | 7,336 | 266 | ||||||
Spectrum Brands Holdings (A) | 4,739 | 568 | ||||||
Sprouts Farmers Market* | 29,700 | 594 | ||||||
SUPERVALU* | 52,216 | 242 | ||||||
Tootsie Roll Industries (A) | 3,118 | 118 | ||||||
TreeHouse Foods* | 11,409 | 791 | ||||||
United Natural Foods* | 9,698 | 455 | ||||||
Universal | 4,145 | 228 | ||||||
US Foods Holding* | 9,100 | 208 | ||||||
USANA Health Sciences* | 1,632 | 100 | ||||||
Vector Group (A) | 18,394 | 393 | ||||||
Village Super Market, Cl A | 1,962 | 68 | ||||||
WD-40 (A) | 2,686 | 290 | ||||||
Weis Markets | 1,704 | 95 | ||||||
WhiteWave Foods* | 33,252 | 1,832 | ||||||
|
| |||||||
| 27,980 | ||||||||
|
| |||||||
| 4 | SEI Institutional Investments Trust / Semi-Annual Report / November 30, 2016 |
SCHEDULE OF INVESTMENTS (Unaudited)
Extended Market Index Fund (Continued)
November 30, 2016
| Description | Shares | Market Value ($ Thousands) | ||||||
Energy — 4.2% | ||||||||
Abraxas Petroleum* | 16,494 | $ | 35 | |||||
Adams Resources & Energy | 300 | 12 | ||||||
Alon USA Energy | 3,296 | 31 | ||||||
Antero Resources* | 35,600 | 872 | ||||||
Archrock | 14,083 | 189 | ||||||
Ardmore Shipping | 2,100 | 14 | ||||||
Atwood Oceanics (A) | 9,540 | 90 | ||||||
Bill Barrett* | 6,264 | 49 | ||||||
Bristow Group | 5,303 | 83 | ||||||
California Resources* (A) | 5,600 | 97 | ||||||
Callon Petroleum* | 29,385 | 518 | ||||||
CARBO Ceramics | 2,350 | 19 | ||||||
Carrizo Oil & Gas* | 11,209 | 475 | ||||||
Cheniere Energy* | 37,965 | 1,551 | ||||||
Clayton Williams Energy* (A) | 916 | 103 | ||||||
Clean Energy Fuels* | 20,388 | 74 | ||||||
Cobalt International Energy* | 61,015 | 82 | ||||||
CONSOL Energy | 42,300 | 871 | ||||||
Contango Oil & Gas* | 2,535 | 25 | ||||||
Continental Resources* | 17,196 | 998 | ||||||
CVR Energy | 1,897 | 32 | ||||||
Dawson Geophysical* | 6,900 | 54 | ||||||
Delek US Holdings | 12,509 | 252 | ||||||
Denbury Resources* | 73,000 | 276 | ||||||
DHT Holdings (A) | 14,000 | 50 | ||||||
Diamond Offshore Drilling (A) | 12,200 | 220 | ||||||
Diamondback Energy* | 14,775 | 1,593 | ||||||
Dorian LPG* (A) | 6,000 | 42 | ||||||
Dril-Quip* | 7,387 | 418 | ||||||
Eclipse Resources* | 3,800 | 11 | ||||||
Energen | 18,189 | 1,129 | ||||||
Ensco, Cl A | 57,300 | 554 | ||||||
EP Energy, Cl A* | 3,800 | 20 | ||||||
Era Group* | 2,093 | 25 | ||||||
Evolution Petroleum | 9,927 | 84 | ||||||
EXCO Resources* | 19,913 | 21 | ||||||
Exterran* | 4,841 | 97 | ||||||
Fairmount Santrol Holdings* (A) | 14,100 | 136 | ||||||
Forum Energy Technologies* | 12,705 | 276 | ||||||
Frank’s International (A) | 5,300 | 67 | ||||||
Frontline (A) | 9,120 | 64 | ||||||
GasLog (A) | 8,650 | 136 | ||||||
Gener8 Maritime* | 7,800 | 32 | ||||||
Geospace Technologies* | 1,598 | 34 | ||||||
Golar LNG (A) | 17,702 | 432 | ||||||
Green Plains Renewable Energy | 7,690 | 208 | ||||||
Gulfport Energy* | 24,081 | 619 | ||||||
Helix Energy Solutions Group* | 19,569 | 204 | ||||||
HollyFrontier | 32,254 | 928 | ||||||
Hornbeck Offshore Services* (A) | 4,612 | 24 | ||||||
Independence Contract Drilling* | 10,200 | 58 | ||||||
| Description | Shares | Market Value ($ Thousands) | ||||||
Jones Energy, Cl A* (A) | 15,900 | $ | 73 | |||||
Kosmos Energy* | 33,075 | 175 | ||||||
Laredo Petroleum* | 29,589 | 473 | ||||||
Matador Resources* (A) | 15,400 | 410 | ||||||
Matrix Service* | 4,781 | 100 | ||||||
McDermott International* | 48,370 | 333 | ||||||
Nabors Industries | 54,300 | 874 | ||||||
Natural Gas Services Group* | 3,844 | 109 | ||||||
Navios Maritime Acquisition | 9,600 | 15 | ||||||
Newpark Resources* | 18,020 | 132 | ||||||
Noble | 44,100 | 274 | ||||||
Nordic American Tankers (A) | 16,977 | 146 | ||||||
Northern Oil And Gas* | 7,039 | 16 | ||||||
Oasis Petroleum* | 49,697 | 744 | ||||||
Oceaneering International | 18,946 | 505 | ||||||
Oil States International* | 9,399 | 337 | ||||||
Overseas Shipholding Group, Cl A | 8,900 | 69 | ||||||
Pacific Ethanol* | 2,400 | 21 | ||||||
Panhandle Oil and Gas, Cl A | 1,682 | 41 | ||||||
Par Petroleum* (A) | 4,286 | 63 | ||||||
Parker Drilling* | 16,551 | 36 | ||||||
Parsley Energy, Cl A* | 30,500 | 1,164 | ||||||
Patterson-UTI Energy | 30,622 | 817 | ||||||
PBF Energy, Cl A (A) | 21,177 | 508 | ||||||
PDC Energy* | 11,093 | 826 | ||||||
PHI* | 1,443 | 22 | ||||||
Pioneer Energy Services* | 9,836 | 49 | ||||||
QEP Resources | 47,300 | 930 | ||||||
Range Resources | 6,862 | 241 | ||||||
Renewable Energy Group* | 10,800 | 105 | ||||||
REX American Resources* | 800 | 78 | ||||||
Rice Energy* | 28,500 | 694 | ||||||
RigNet* | 1,441 | 25 | ||||||
Ring Energy* | 10,100 | 129 | ||||||
Rowan, Cl A | 25,800 | 460 | ||||||
RPC (A) | 10,999 | 221 | ||||||
RSP Permian* | 18,000 | 804 | ||||||
Sanchez Energy* (A) | 12,530 | 105 | ||||||
Scorpio Tankers | 31,743 | 134 | ||||||
SEACOR Holdings* (A) | 3,374 | 209 | ||||||
Seadrill* (A) | 66,300 | 185 | ||||||
SemGroup, Cl A | 14,344 | 517 | ||||||
Ship Finance International (A) | 11,476 | 165 | ||||||
SM Energy | 16,513 | 658 | ||||||
Superior Energy Services | 29,060 | 501 | ||||||
Synergy Resources* (A) | 38,062 | 361 | ||||||
Targa Resources | 29,659 | 1,581 | ||||||
Teekay (A) | 7,454 | 59 | ||||||
Teekay Tankers, Cl A | 18,023 | 42 | ||||||
Tesco | 11,269 | 87 | ||||||
TETRA Technologies* | 16,405 | 89 | ||||||
Tidewater | 6,246 | 14 | ||||||
| 5 | SEI Institutional Investments Trust / Semi-Annual Report / November 30, 2016 |
SCHEDULE OF INVESTMENTS (Unaudited)
Extended Market Index Fund (Continued)
November 30, 2016
| Description | Shares | Market Value ($ Thousands) | ||||||
Unit* | 8,395 | $ | 204 | |||||
US Silica Holdings | 12,126 | 614 | ||||||
W&T Offshore* | 3,238 | 5 | ||||||
Weatherford International* | 176,600 | 902 | ||||||
Western Refining | 15,699 | 563 | ||||||
Westmoreland Coal* | 2,400 | 42 | ||||||
Whiting Petroleum* | 39,660 | 485 | ||||||
World Fuel Services | 13,841 | 615 | ||||||
WPX Energy* | 66,000 | 1,026 | ||||||
|
| |||||||
| 35,466 | ||||||||
|
| |||||||
Financials — 17.4% | ||||||||
1st Source | 3,958 | 156 | ||||||
Access National (A) | 1,600 | 44 | ||||||
ACNB | 900 | 28 | ||||||
AGNC Investment‡ | 62,621 | 1,168 | ||||||
Alleghany* | 2,967 | 1,685 | ||||||
Allegiance Bancshares* | 3,400 | 104 | ||||||
Allied World Assurance Holdings | 17,512 | 820 | ||||||
Ally Financial | 84,600 | 1,643 | ||||||
Altisource Residential, Cl B‡ | 11,300 | 133 | ||||||
Ambac Financial Group* | 8,400 | 206 | ||||||
American Equity Investment Life Holding | 17,778 | 369 | ||||||
American Financial Group | 13,553 | 1,114 | ||||||
American National Bankshares | 1,206 | 38 | ||||||
American National Insurance | 1,331 | 160 | ||||||
Ameris Bancorp | 7,852 | 352 | ||||||
AMERISAFE | 3,933 | 250 | ||||||
Ames National | 697 | 21 | ||||||
AmTrust Financial Services | 17,918 | 456 | ||||||
Annaly Capital Management‡ | 195,015 | 1,993 | ||||||
Anworth Mortgage Asset‡ | 20,368 | 106 | ||||||
Apollo Commercial Real Estate Finance‡ | 16,619 | 285 | ||||||
Arch Capital Group* | 21,936 | 1,815 | ||||||
Ares Commercial Real Estate‡ | 4,800 | 65 | ||||||
Argo Group International Holdings | 5,427 | 344 | ||||||
Arlington Asset Investment, Cl A | 3,412 | 55 | ||||||
ARMOUR Residential‡ (A) | 7,624 | 170 | ||||||
Arrow Financial | 2,123 | 80 | ||||||
Artisan Partners Asset Management, Cl A | 8,900 | 265 | ||||||
Aspen Insurance Holdings | 11,795 | 601 | ||||||
Associated Banc | 27,286 | 623 | ||||||
Associated Capital Group | 822 | 28 | ||||||
Assured Guaranty | 25,887 | 926 | ||||||
Astoria Financial | 16,365 | 268 | ||||||
Atlantic Capital Bancshares* | 4,300 | 69 | ||||||
Atlas Financial Holdings* | 2,600 | 44 | ||||||
Axis Capital Holdings | 17,168 | 1,047 | ||||||
Baldwin & Lyons, Cl B | 1,481 | 39 | ||||||
Banc of California (A) | 8,100 | 122 | ||||||
BancFirst | 1,825 | 150 | ||||||
Banco Latinoamericano de Comercio Exterior | 5,312 | 151 | ||||||
| Description | Shares | Market Value ($ Thousands) | ||||||
Bancorp* | 16,404 | $ | 114 | |||||
Bancorpsouth | 16,982 | 485 | ||||||
Bank Mutual | 9,599 | 86 | ||||||
Bank of Hawaii (A) | 8,224 | 686 | ||||||
Bank of Marin Bancorp | 907 | 58 | ||||||
Bank of the Ozarks | 17,670 | 857 | ||||||
BankFinancial | 6,097 | 86 | ||||||
BankUnited | 19,196 | 680 | ||||||
Banner | 6,251 | 326 | ||||||
Bar Harbor Bankshares | 1,900 | 84 | ||||||
BBX Capital, Cl A* | 521 | 11 | ||||||
Bear State Financial | 3,600 | 36 | ||||||
Beneficial Bancorp | 12,788 | 222 | ||||||
Berkshire Hills Bancorp | 6,050 | 205 | ||||||
BGC Partners, Cl A | 47,736 | 466 | ||||||
Blue Hills Bancorp | 4,700 | 82 | ||||||
BNC Bancorp | 7,600 | 230 | ||||||
BofI Holding* (A) | 11,936 | 282 | ||||||
BOK Financial (A) | 4,993 | 401 | ||||||
Boston Private Financial Holdings | 17,215 | 258 | ||||||
Bridge Bancorp | 3,412 | 115 | ||||||
Brookline Bancorp | 14,374 | 214 | ||||||
Brown & Brown | 21,776 | 944 | ||||||
Bryn Mawr Bank | 4,322 | 159 | ||||||
BSB Bancorp* | 1,200 | 32 | ||||||
Calamos Asset Management, Cl A | 4,282 | 29 | ||||||
Camden National | 3,058 | 119 | ||||||
Capital Bank Financial, Cl A | 5,319 | 190 | ||||||
Capital City Bank Group | 800 | 15 | ||||||
Capitol Federal Financial | 26,187 | 417 | ||||||
Capstead Mortgage‡ | 18,718 | 194 | ||||||
Cardinal Financial | 7,741 | 248 | ||||||
Carolina Financial | 2,000 | 53 | ||||||
Cascade Bancorp* | 5,915 | 43 | ||||||
Cathay General Bancorp | 14,115 | 495 | ||||||
CBOE Holdings | 16,038 | 1,105 | ||||||
CenterState Banks | 9,585 | 215 | ||||||
Central Pacific Financial | 6,910 | 204 | ||||||
Charter Financial | 2,200 | 31 | ||||||
Chemical Financial | 12,549 | 651 | ||||||
Chimera Investment‡ | 36,165 | 613 | ||||||
CIT Group | 39,137 | 1,599 | ||||||
Citizens, Cl A* (A) | 7,833 | 72 | ||||||
Citizens & Northern | 1,840 | 44 | ||||||
City Holding | 3,385 | 208 | ||||||
Clifton Bancorp | 3,100 | 51 | ||||||
CNA Financial | 5,975 | 229 | ||||||
CNB Financial | 2,048 | 48 | ||||||
CNO Financial Group | 34,625 | 620 | ||||||
CoBiz Financial | 5,671 | 86 | ||||||
Codorus Valley Bancorp | 1,680 | 40 | ||||||
Cohen & Steers | 3,936 | 140 | ||||||
| 6 | SEI Institutional Investments Trust / Semi-Annual Report / November 30, 2016 |
SCHEDULE OF INVESTMENTS (Unaudited)
Extended Market Index Fund (Continued)
November 30, 2016
| Description | Shares | Market Value ($ Thousands) | ||||||
Colony Financial‡ (A) | 21,700 | $ | 445 | |||||
Columbia Banking System | 11,809 | 470 | ||||||
Commerce Bancshares | 16,944 | 929 | ||||||
Community Bank System | 8,002 | 454 | ||||||
Community Trust Bancorp | 3,393 | 143 | ||||||
ConnectOne Bancorp | 6,383 | 150 | ||||||
Consolidated-Tomoka Land | 500 | 27 | ||||||
Cowen Group, Cl A* (A) | 14,521 | 53 | ||||||
Crawford, Cl B | 3,520 | 46 | ||||||
Credit Acceptance* (A) | 1,712 | 328 | ||||||
CU Bancorp* | 3,900 | 109 | ||||||
Cullen/Frost Bankers | 9,905 | 815 | ||||||
Customers Bancorp* | 4,070 | 124 | ||||||
CVB Financial | 18,579 | 386 | ||||||
CYS Investments‡ | 29,962 | 241 | ||||||
Diamond Hill Investment Group | 554 | 116 | ||||||
Dime Community Bancshares | 5,583 | 104 | ||||||
Donnelley Financial Solutions* | 4,958 | 95 | ||||||
Dynex Capital‡ | 6,593 | 46 | ||||||
Eagle Bancorp* | 5,706 | 335 | ||||||
East West Bancorp | 28,366 | 1,358 | ||||||
EastGroup Properties‡ | 6,885 | 470 | ||||||
Eaton Vance | 20,425 | 826 | ||||||
eHealth* | 1,874 | 19 | ||||||
EMC Insurance Group | 1,050 | 29 | ||||||
Employers Holdings | 7,574 | 268 | ||||||
Encore Capital Group* (A) | 5,075 | 139 | ||||||
Endurance Specialty Holdings | 12,651 | 1,166 | ||||||
Enova International* | 3,366 | 39 | ||||||
Enstar Group* | 2,251 | 443 | ||||||
Enterprise Bancorp | 1,148 | 36 | ||||||
Enterprise Financial Services | 4,849 | 186 | ||||||
Erie Indemnity, Cl A | 5,287 | 567 | ||||||
Essent Group* | 16,300 | 497 | ||||||
EverBank Financial | 19,024 | 367 | ||||||
Evercore Partners, Cl A | 7,376 | 497 | ||||||
Everest Re Group | 8,144 | 1,715 | ||||||
Ezcorp, Cl A* | 7,457 | 87 | ||||||
FactSet Research Systems | 7,886 | 1,263 | ||||||
Farmers Capital Bank | 1,300 | 47 | ||||||
Farmers National Banc | 4,900 | 58 | ||||||
FBL Financial Group, Cl A | 1,682 | 129 | ||||||
FCB Financial Holdings, Cl A* | 5,600 | 248 | ||||||
Federal Agricultural Mortgage, Cl C | 1,988 | 107 | ||||||
Federated Investors, Cl B | 17,970 | 494 | ||||||
Federated National Holding | 1,300 | 23 | ||||||
Fidelity & Guaranty Life (A) | 2,700 | 64 | ||||||
Fidelity Southern | 3,513 | 78 | ||||||
Financial Engines | 9,864 | 344 | ||||||
Financial Institutions | 1,767 | 54 | ||||||
First American Financial | 19,772 | 746 | ||||||
First Bancorp | 7,697 | 207 | ||||||
| Description | Shares | Market Value ($ Thousands) | ||||||
First BanCorp* | 18,716 | $ | 111 | |||||
First Busey | 7,436 | 204 | ||||||
First Business Financial Services | 1,000 | 22 | ||||||
First Citizens BancShares, Cl A | 1,491 | 531 | ||||||
First Commonwealth Financial | 15,201 | 192 | ||||||
First Community Bancshares | 4,442 | 125 | ||||||
First Connecticut Bancorp | 4,848 | 105 | ||||||
First Defiance Financial | 2,292 | 106 | ||||||
First Financial | 1,612 | 74 | ||||||
First Financial Bancorp | 11,549 | 310 | ||||||
First Financial Bankshares (A) | 12,556 | 541 | ||||||
First Foundation* | 4,000 | 112 | ||||||
First Hawaiian | 5,600 | 168 | ||||||
First Horizon National | 42,800 | 817 | ||||||
First Interstate Bancsystem, Cl A | 4,412 | 167 | ||||||
First Merchants | 8,633 | 296 | ||||||
First Mid-Illinois Bancshares | 2,100 | 64 | ||||||
First Midwest Bancorp | 14,942 | 363 | ||||||
First NBC Bank Holding* | 2,500 | 18 | ||||||
First Northwest Bancorp* | 3,500 | 52 | ||||||
First of Long Island | 4,995 | 128 | ||||||
First Republic Bank | 28,043 | 2,297 | ||||||
FirstCash | 10,320 | 474 | ||||||
Flagstar Bancorp* | 4,600 | 130 | ||||||
Flushing Financial | 4,470 | 117 | ||||||
FNB (Pennsylvania) | 38,101 | 582 | ||||||
FNF Group | 50,058 | 1,599 | ||||||
FNFV Group* | 15,962 | 204 | ||||||
Franklin Financial Network* | 2,800 | 106 | ||||||
FRP Holdings* | 838 | 32 | ||||||
Fulton Financial | 33,712 | 598 | ||||||
Gain Capital Holdings | 5,300 | 34 | ||||||
GAMCO Investors, Cl A | 822 | 25 | ||||||
Genworth Financial, Cl A* | 98,400 | 421 | ||||||
German American Bancorp | 3,444 | 163 | ||||||
Glacier Bancorp | 14,880 | 510 | ||||||
Gladstone Commercial‡ | 3,119 | 57 | ||||||
Global Indemnity* | 1,002 | 37 | ||||||
Great Ajax | 2,900 | 38 | ||||||
Great Southern Bancorp | 2,499 | 124 | ||||||
Great Western Bancorp | 11,700 | 468 | ||||||
Green Bancorp* | 4,100 | 51 | ||||||
Green Dot, Cl A* | 8,955 | 216 | ||||||
Greenhill | 5,871 | 163 | ||||||
Greenlight Capital Re, Cl A* | 6,409 | 146 | ||||||
Guaranty Bancorp | 4,005 | 85 | ||||||
Hancock Holding | 15,214 | 632 | ||||||
Hanmi Financial | 5,678 | 174 | ||||||
Hannon Armstrong Sustainable Infrastructure Capital‡ | 7,100 | 141 | ||||||
Hanover Insurance Group | 8,117 | 703 | ||||||
HarborOne Bancorp* | 4,300 | 81 | ||||||
| 7 | SEI Institutional Investments Trust / Semi-Annual Report / November 30, 2016 |
SCHEDULE OF INVESTMENTS (Unaudited)
Extended Market Index Fund (Continued)
November 30, 2016
| Description | Shares | Market Value ($ Thousands) | ||||||
HCI Group | 915 | $ | 30 | |||||
Heartland Financial USA | 4,975 | 213 | ||||||
Heritage Commerce | 3,100 | 38 | ||||||
Heritage Financial | 4,271 | 97 | ||||||
Heritage Insurance Holdings | 3,800 | 55 | ||||||
Heritage Oaks Bancorp | 1,400 | 14 | ||||||
HFF, Cl A | 7,995 | 232 | ||||||
Hilltop Holdings | 13,838 | 389 | ||||||
Hingham Institution for Savings | 300 | 50 | ||||||
Home Bancorp | 1,200 | 40 | ||||||
Home BancShares | 21,892 | 566 | ||||||
HomeStreet* | 4,372 | 127 | ||||||
HomeTrust Bancshares* | 4,102 | 97 | ||||||
Hope Bancorp | 25,295 | 503 | ||||||
Horace Mann Educators | 7,614 | 306 | ||||||
Horizon Bancorp | 3,750 | 85 | ||||||
Houlihan Lokey | 3,400 | 97 | ||||||
IBERIABANK | 7,584 | 628 | ||||||
Impac Mortgage Holdings* (A) | 4,500 | 69 | ||||||
Independent Bank | 7,602 | 370 | ||||||
Independent Bank Group | 2,100 | 126 | ||||||
Infinity Property & Casualty | 2,414 | 208 | ||||||
Interactive Brokers Group, Cl A | 13,827 | 508 | ||||||
International Bancshares | 11,250 | 438 | ||||||
International FCStone* | 3,268 | 134 | ||||||
Invesco Mortgage Capital‡ | 22,471 | 335 | ||||||
Investment Technology Group | 6,017 | 112 | ||||||
Investors Bancorp | 59,043 | 799 | ||||||
Investors Real Estate Trust‡ (A) | 24,031 | 151 | ||||||
iStar Financial *‡ | 16,418 | 201 | ||||||
James River Group Holdings | 2,700 | 105 | ||||||
Janus Capital Group | 29,412 | 397 | ||||||
KCG Holdings, Cl A* | 9,853 | 139 | ||||||
Kearny Financial | 19,637 | 297 | ||||||
Kemper | 8,936 | 366 | ||||||
Kinsale Capital Group | 2,100 | 60 | ||||||
Kite Realty Group Trust‡ | 15,255 | 367 | ||||||
Ladder Capital, Cl A | 9,219 | 132 | ||||||
Ladenburg Thalmann Financial Services* | 12,600 | 30 | ||||||
Lakeland Bancorp | 8,293 | 146 | ||||||
Lakeland Financial | 4,957 | 209 | ||||||
Lazard, Cl A | 25,231 | 980 | ||||||
LCNB | 2,500 | 52 | ||||||
LegacyTexas Financial Group | 8,610 | 338 | ||||||
LendingClub* | 61,500 | 348 | ||||||
LendingTree* (A) | 1,500 | 157 | ||||||
Live Oak Bancshares (A) | 6,000 | 104 | ||||||
LPL Financial Holdings | 17,362 | 715 | ||||||
Macatawa Bank | 5,200 | 49 | ||||||
Maiden Holdings | 11,023 | 170 | ||||||
MainSource Financial Group | 4,890 | 149 | ||||||
Marcus & Millichap* | 1,700 | 47 | ||||||
| Description | Shares | Market Value ($ Thousands) | ||||||
Markel* | 2,713 | $ | 2,437 | |||||
MarketAxess Holdings | 6,952 | 1,152 | ||||||
Marlin Business Services | 322 | 7 | ||||||
MB Financial | 15,126 | 654 | ||||||
MBIA* | 22,582 | 235 | ||||||
MBT Financial | 1,400 | 13 | ||||||
Mercantile Bank | 2,257 | 74 | ||||||
Merchants Bancshares | 807 | 40 | ||||||
Mercury General | 5,578 | 326 | ||||||
Meridian Bancorp | 11,227 | 199 | ||||||
Meta Financial Group | 2,100 | 191 | ||||||
MFA Financial‡ | 70,297 | 550 | ||||||
MGIC Investment* | 66,018 | 599 | ||||||
MidWestOne Financial Group | 769 | 26 | ||||||
Moelis, Cl A | 4,000 | 117 | ||||||
Morningstar | 4,120 | 300 | ||||||
Mortgage Investment Trust‡ | 7,588 | 133 | ||||||
MSCI, Cl A | 17,269 | 1,361 | ||||||
MTGE Investment‡ | 7,965 | 133 | ||||||
MutualFirst Financial | 700 | 21 | ||||||
National Bank Holdings, Cl A | 4,600 | 125 | ||||||
National Bankshares (A) | 1,036 | 37 | ||||||
National Commerce* | 1,700 | 56 | ||||||
National General Holdings | 10,300 | 233 | ||||||
National Western Life Group, Cl A | 341 | 89 | ||||||
Nationstar Mortgage Holdings* (A) | 6,046 | 103 | ||||||
Navigators Group | 2,083 | 220 | ||||||
NBT Bancorp | 9,108 | 352 | ||||||
Nelnet, Cl A | 4,531 | 229 | ||||||
New Residential Investments‡ | 46,950 | 725 | ||||||
New Senior Investment Group‡ | 16,600 | 168 | ||||||
New York Community Bancorp | 93,339 | 1,492 | ||||||
New York Mortgage Trust‡ (A) | 28,238 | 189 | ||||||
New York REIT‡ | 31,800 | 307 | ||||||
NewStar Financial* | 3,393 | 29 | ||||||
Nicolet Bankshares* | 2,000 | 88 | ||||||
NMI Holdings, Cl A* | 14,500 | 125 | ||||||
Northfield Bancorp | 6,705 | 124 | ||||||
Northrim BanCorp | 1,300 | 37 | ||||||
NorthStar Asset Management Group | 37,458 | 553 | ||||||
NorthStar Realty Europe‡ | 10,009 | 107 | ||||||
Northwest Bancshares | 18,499 | 336 | ||||||
OceanFirst Financial | 5,588 | 133 | ||||||
Ocwen Financial* (A) | 20,161 | 104 | ||||||
OFG Bancorp | 12,325 | 166 | ||||||
Old Line Bancshares | 400 | 9 | ||||||
Old National Bancorp | 26,794 | 457 | ||||||
Old Republic International | 44,944 | 803 | ||||||
Old Second Bancorp | 9,000 | 83 | ||||||
OM Asset Management | 9,900 | 146 | ||||||
On Deck Capital* (A) | 11,400 | 52 | ||||||
One Liberty Properties‡ | 2,524 | 62 | ||||||
| 8 | SEI Institutional Investments Trust / Semi-Annual Report / November 30, 2016 |
SCHEDULE OF INVESTMENTS (Unaudited)
Extended Market Index Fund (Continued)
November 30, 2016
| Description | Shares | Market Value ($ Thousands) | ||||||
OneBeacon Insurance Group, Cl A | 4,135 | $ | 63 | |||||
OneMain Holdings, Cl A* | 10,500 | 214 | ||||||
Oppenheimer Holdings, Cl A | 2,164 | 38 | ||||||
Opus Bank | 3,100 | 78 | ||||||
Orchid Island Capital, Cl A‡ (A) | 6,800 | 73 | ||||||
Oritani Financial | 7,124 | 126 | ||||||
Orrstown Financial Services | 100 | 2 | ||||||
Owens Realty Mortgage‡ | 2,000 | 36 | ||||||
Pacific Continental | 2,665 | 53 | ||||||
Pacific Premier Bancorp* | 5,100 | 163 | ||||||
PacWest Bancorp | 23,442 | 1,201 | ||||||
Park National | 2,405 | 268 | ||||||
Park Sterling | 13,570 | 132 | ||||||
Peapack Gladstone Financial | 2,654 | 71 | ||||||
Penns Woods Bancorp | 652 | 31 | ||||||
Pennsylvania Real Estate Investment Trust‡ | 13,699 | 263 | ||||||
PennyMac Financial Services, Cl A* | 1,100 | 19 | ||||||
PennyMac Mortgage Investment Trust‡ | 14,063 | 229 | ||||||
Peoples Bancorp | 4,910 | 143 | ||||||
Peoples Financial Services | 900 | 40 | ||||||
People’s Utah Bancorp | 2,500 | 58 | ||||||
PHH* | 9,932 | 144 | ||||||
PICO Holdings* | 2,621 | 37 | ||||||
Pinnacle Financial Partners | 8,125 | 524 | ||||||
Piper Jaffray* | 3,577 | 261 | ||||||
PJT Partners | 3,200 | 94 | ||||||
Popular | 18,956 | 771 | ||||||
PRA Group* | 10,358 | 372 | ||||||
Preferred Apartment Communities, Cl A‡ | 6,000 | 82 | ||||||
Preferred Bank | 1,937 | 87 | ||||||
Primerica | 9,429 | 667 | ||||||
PrivateBancorp, Cl A | 14,319 | 670 | ||||||
ProAssurance | 10,325 | 579 | ||||||
Prosperity Bancshares | 13,269 | 877 | ||||||
Provident Financial Services | 11,979 | 323 | ||||||
QCR Holdings | 3,400 | 130 | ||||||
Radian Group | 41,848 | 609 | ||||||
Ramco-Gershenson Properties‡ | 16,337 | 277 | ||||||
Raymond James Financial | 24,081 | 1,732 | ||||||
Redwood Trust‡ | 16,405 | 250 | ||||||
Regional Management* | 2,800 | 69 | ||||||
Reinsurance Group of America, Cl A | 12,416 | 1,515 | ||||||
RenaissanceRe Holdings | 7,906 | 1,032 | ||||||
Renasant | 7,360 | 305 | ||||||
Republic Bancorp, Cl A | 1,298 | 48 | ||||||
Resource Capital‡ (A) | 7,276 | 61 | ||||||
RLI | 7,382 | 443 | ||||||
S&T Bancorp | 7,532 | 267 | ||||||
Safeguard Scientifics*† | 3,396 | 40 | ||||||
Safety Insurance Group | 2,931 | 206 | ||||||
Sandy Spring Bancorp | 4,647 | 169 | ||||||
Santander Consumer USA Holdings*† | 24,200 | 333 | ||||||
| Description | Shares | Market Value ($ Thousands) | ||||||
Seacoast Banking Corporation of Florida* | 8,098 | $ | 166 | |||||
SEI† | 24,119 | 1,138 | ||||||
Selective Insurance Group | 11,484 | 472 | ||||||
ServisFirst Bancshares | 4,700 | 346 | ||||||
Shore Bancshares | 3,000 | 42 | ||||||
Sierra Bancorp | 2,978 | 68 | ||||||
Signature Bank NY* | 10,370 | 1,555 | ||||||
Simmons First National, Cl A | 5,418 | 328 | ||||||
SLM*† | 81,900 | 825 | ||||||
South State | 4,786 | 407 | ||||||
Southern First Bancshares* | 400 | 12 | ||||||
Southside Bancshares | 6,011 | 231 | ||||||
Southwest Bancorp | 3,479 | 76 | ||||||
St. Joe* | 8,800 | 183 | ||||||
STAG Industrial‡ | 15,356 | 363 | ||||||
Starwood Property Trust‡ | 43,480 | 977 | ||||||
State Auto Financial | 1,890 | 49 | ||||||
State Bank Financial | 6,384 | 158 | ||||||
State National | 5,800 | 78 | ||||||
Sterling Bancorp | 23,434 | 533 | ||||||
Stewart Information Services | 4,241 | 201 | ||||||
Stifel Financial* | 12,882 | 642 | ||||||
Stock Yards Bancorp | 4,702 | 194 | ||||||
Stonegate Bank | 2,800 | 109 | ||||||
Suffolk Bancorp | 2,000 | 83 | ||||||
Summit Financial Group (A) | 1,700 | 42 | ||||||
Sun Bancorp | 2,132 | 49 | ||||||
SVB Financial Group* | 9,882 | 1,562 | ||||||
Synovus Financial | 24,792 | 960 | ||||||
TCF Financial | 28,239 | 490 | ||||||
TD Ameritrade Holding | 47,573 | 1,951 | ||||||
Tejon Ranch* | 1,647 | 43 | ||||||
Terreno Realty‡ | 7,963 | 217 | ||||||
Territorial Bancorp | 773 | 24 | ||||||
Texas Capital Bancshares* | 8,923 | 649 | ||||||
TFS Financial | 12,343 | 230 | ||||||
Third Point Reinsurance* | 11,800 | 140 | ||||||
Thomson Reuters | 57,785 | 2,497 | ||||||
Tiptree Financial | 9,700 | 63 | ||||||
Tompkins Financial | 2,905 | 251 | ||||||
Towne Bank | 11,580 | 373 | ||||||
TriCo Bancshares | 4,809 | 150 | ||||||
TriState Capital Holdings* | 6,600 | 135 | ||||||
Triumph Bancorp* | 4,500 | 97 | ||||||
Trupanion* (A) | 3,600 | 60 | ||||||
TrustCo Bank NY | 22,326 | 182 | ||||||
Trustmark | 13,139 | 443 | ||||||
Two Harbors Investment‡ | 67,540 | 586 | ||||||
UMB Financial | 8,145 | 619 | ||||||
UMH Properties‡ | 5,400 | 71 | ||||||
Umpqua Holdings | 40,531 | 720 | ||||||
Union Bankshares | 8,742 | 295 | ||||||
| 9 | SEI Institutional Investments Trust / Semi-Annual Report / November 30, 2016 |
SCHEDULE OF INVESTMENTS (Unaudited)
Extended Market Index Fund (Continued)
November 30, 2016
| Description | Shares | Market Value ($ Thousands) | ||||||
United Bankshares (A) | 13,183 | $ | 608 | |||||
United Community Banks | 13,574 | 369 | ||||||
United Community Financial | 6,700 | 55 | ||||||
United Financial Bancorp | 11,373 | 192 | ||||||
United Fire Group | 4,071 | 185 | ||||||
United Insurance Holdings | 1,900 | 26 | ||||||
Universal Health Realty Income Trust‡ | 2,016 | 120 | ||||||
Universal Insurance Holdings (A) | 5,200 | 125 | ||||||
Univest Corp of Pennsylvania | 4,715 | 135 | ||||||
Validus Holdings | 15,026 | 817 | ||||||
Valley National Bancorp | 46,670 | 529 | ||||||
Veritex Holdings* | 3,700 | 73 | ||||||
Virtu Financial, Cl A | 6,100 | 84 | ||||||
Virtus Investment Partners | 800 | 93 | ||||||
Voya Financial | 38,900 | 1,512 | ||||||
Waddell & Reed Financial, Cl A | 16,402 | 320 | ||||||
Walker & Dunlop* | 6,023 | 177 | ||||||
Walter Investment Management* (A) | 4,636 | 26 | ||||||
Washington Federal | 18,236 | 592 | ||||||
Washington Trust Bancorp | 3,770 | 192 | ||||||
WashingtonFirst Bankshares | 1,600 | 44 | ||||||
Waterstone Financial | 4,000 | 72 | ||||||
Webster Financial | 16,951 | 841 | ||||||
WesBanco | 8,388 | 334 | ||||||
West Bancorporation | 1,985 | 44 | ||||||
Westamerica Bancorporation (A) | 4,755 | 295 | ||||||
Western Alliance Bancorp* | 17,961 | 839 | ||||||
Western Asset Mortgage Capital‡ | 6,644 | 71 | ||||||
Western New England Bancorp | 5,000 | 42 | ||||||
Westwood Holdings Group | 1,828 | 109 | ||||||
White Mountains Insurance Group | 955 | 799 | ||||||
Wintrust Financial | 9,349 | 616 | ||||||
WisdomTree Investments (A) | 19,675 | 218 | ||||||
WMIH* | 36,200 | 62 | ||||||
World Acceptance* (A) | 976 | 55 | ||||||
WR Berkley | 18,924 | 1,169 | ||||||
WSFS Financial | 5,829 | 249 | ||||||
Xenith Bankshares* | 7,300 | 18 | ||||||
Yadkin Financial | 9,300 | 305 | ||||||
|
| |||||||
| 145,276 | ||||||||
|
| |||||||
Health Care — 10.3% | ||||||||
AAC Holdings* | 1,600 | 13 | ||||||
Abaxis | 4,493 | 232 | ||||||
ABIOMED* | 7,412 | 832 | ||||||
Acadia Healthcare* (A) | 14,187 | 539 | ||||||
ACADIA Pharmaceuticals* (A) | 18,500 | 499 | ||||||
Accelerate Diagnostics* (A) | 4,900 | 122 | ||||||
Acceleron Pharma* | 4,900 | 165 | ||||||
Accuray* | 14,863 | 75 | ||||||
Aceto | 4,717 | 96 | ||||||
Achillion Pharmaceuticals* | 23,198 | 96 | ||||||
| Description | Shares | Market Value ($ Thousands) | ||||||
Aclaris Therapeutics* | 1,900 | $ | 57 | |||||
Acorda Therapeutics* | 7,142 | 149 | ||||||
Adamas Pharmaceuticals* (A) | 3,000 | 45 | ||||||
Addus HomeCare* | 2,200 | 76 | ||||||
Adeptus Health, Cl A* | 2,200 | 18 | ||||||
Aduro Biotech* (A) | 7,800 | 89 | ||||||
Advaxis* (A) | 4,700 | 39 | ||||||
Adverum Biotechnologies* | 1,300 | 4 | ||||||
Aerie Pharmaceuticals* | 4,500 | 167 | ||||||
Agenus* | 16,000 | 66 | ||||||
Agios Pharmaceuticals* (A) | 6,400 | 373 | ||||||
Aimmune Therapeutics* | 6,400 | 145 | ||||||
Air Methods* | 7,077 | 231 | ||||||
Akebia Therapeutics* | 4,100 | 35 | ||||||
Akorn* | 18,427 | 391 | ||||||
Albany Molecular Research* (A) | 3,800 | 64 | ||||||
Alder Biopharmaceuticals* (A) | 8,400 | 198 | ||||||
Alere* | 16,721 | 664 | ||||||
Align Technology* | 13,713 | 1,276 | ||||||
Alkermes* | 28,653 | 1,628 | ||||||
Allscripts Healthcare Solutions* | 40,553 | 445 | ||||||
Almost Family* | 1,009 | 41 | ||||||
Alnylam Pharmaceuticals* | 14,289 | 627 | ||||||
AMAG Pharmaceuticals* | 6,003 | 199 | ||||||
Amedisys* | 5,671 | 224 | ||||||
American Renal Associates Holdings* | 1,700 | 42 | ||||||
Amicus Therapeutics* | 29,200 | 175 | ||||||
AMN Healthcare Services* | 8,709 | 290 | ||||||
Amphastar Pharmaceuticals* | 7,300 | 148 | ||||||
Amsurg, Cl A* | 10,766 | 733 | ||||||
Analogic | 2,420 | 223 | ||||||
AngioDynamics* | 7,370 | 120 | ||||||
ANI Pharmaceuticals* (A) | 2,100 | 124 | ||||||
Anika Therapeutics* | 3,070 | 143 | ||||||
Anthera Pharmaceuticals* (A) | 9,700 | 15 | ||||||
Applied Genetic Technologies* | 2,500 | 23 | ||||||
Aptevo Therapeutics* | 2,492 | 5 | ||||||
Aratana Therapeutics* | 6,400 | 46 | ||||||
Ardelyx* | 4,600 | 68 | ||||||
Arena Pharmaceuticals* | 39,753 | 58 | ||||||
ARIAD Pharmaceuticals* | 34,224 | 461 | ||||||
Array BioPharma* | 31,360 | 254 | ||||||
Arrowhead Pharmaceuticals* (A) | 11,600 | 17 | ||||||
Atara Biotherapeutics* | 3,400 | 67 | ||||||
athenahealth* (A) | 8,192 | 775 | ||||||
Athersys* (A) | 15,300 | 25 | ||||||
AtriCure* | 6,020 | 108 | ||||||
Atrion | 230 | 113 | ||||||
Avexis* (A) | 1,600 | 95 | ||||||
AxoGen* | 6,100 | 51 | ||||||
Axovant Sciences* (A) | 7,100 | 96 | ||||||
Bellicum Pharmaceuticals* (A) | 6,500 | 117 | ||||||
| 10 | SEI Institutional Investments Trust / Semi-Annual Report / November 30, 2016 |
SCHEDULE OF INVESTMENTS (Unaudited)
Extended Market Index Fund (Continued)
November 30, 2016
| Description | Shares | Market Value ($ Thousands) | ||||||
BioCryst Pharmaceuticals* | 13,600 | $ | 76 | |||||
BioMarin Pharmaceutical* | 32,946 | 2,821 | ||||||
Bio-Rad Laboratories, Cl A* | 4,353 | 755 | ||||||
BioScrip* (A) | 21,711 | 25 | ||||||
BioSpecifics Technologies* | 1,400 | 69 | ||||||
Bio-Techne | 6,825 | 719 | ||||||
BioTelemetry* | 5,500 | 107 | ||||||
BioTime* (A) | 19,600 | 62 | ||||||
Bluebird Bio* (A) | 6,800 | 410 | ||||||
Blueprint Medicines* | 4,500 | 132 | ||||||
Brookdale Senior Living, Cl A* | 36,909 | 429 | ||||||
Bruker | 20,632 | 468 | ||||||
Cambrex* | 6,360 | 319 | ||||||
Cantel Medical | 6,477 | 528 | ||||||
Capital Senior Living* | 5,312 | 83 | ||||||
Cara Therapeutics* (A) | 4,500 | 40 | ||||||
Cardiovascular Systems* | 6,125 | 148 | ||||||
Castlight Health, Cl B* | 2,800 | 13 | ||||||
Catalent* | 19,400 | 464 | ||||||
Celldex Therapeutics* (A) | 15,756 | 60 | ||||||
Cellular Biomedicine Group* | 2,500 | 34 | ||||||
Cempra* (A) | 8,500 | 55 | ||||||
Cerus* (A) | 15,197 | 79 | ||||||
Charles River Laboratories International* | 9,906 | 704 | ||||||
Chemed | 3,245 | 483 | ||||||
ChemoCentryx* | 2,000 | 16 | ||||||
Chimerix* | 7,900 | 39 | ||||||
Civitas Solutions* | 3,000 | 50 | ||||||
Clearside Biomedical* | 3,600 | 53 | ||||||
Clovis Oncology* | 6,666 | 228 | ||||||
Codexis* | 15,000 | 71 | ||||||
Coherus Biosciences* | 4,900 | 132 | ||||||
Collegium Pharmaceutical* (A) | 2,700 | 45 | ||||||
Community Health Systems* | 21,729 | 118 | ||||||
Computer Programs & Systems (A) | 1,702 | 41 | ||||||
Concert Pharmaceuticals* | 3,900 | 35 | ||||||
ConforMIS* (A) | 9,200 | 83 | ||||||
CONMED | 5,108 | 223 | ||||||
Corcept Therapeutics* | 13,100 | 110 | ||||||
CorVel* | 1,434 | 46 | ||||||
Cotiviti Holdings* (A) | 4,000 | 119 | ||||||
Cross Country Healthcare* | 5,079 | 73 | ||||||
CryoLife | 5,045 | 99 | ||||||
Curis* | 28,500 | 82 | ||||||
Cutera* | 4,700 | 77 | ||||||
Cynosure, Cl A* | 4,339 | 197 | ||||||
Cytokinetics* (A) | 8,500 | 102 | ||||||
CytomX Therapeutics* | 4,000 | 45 | ||||||
CytRx* | 6,500 | 3 | ||||||
Depomed* | 11,355 | 217 | ||||||
Dermira* | 4,600 | 147 | ||||||
DexCom* | 16,124 | 1,053 | ||||||
| Description | Shares | Market Value ($ Thousands) | ||||||
Diplomat Pharmacy* (A) | 7,900 | $ | 112 | |||||
Durect* | 31,600 | 41 | ||||||
Dynavax Technologies* (A) | 5,889 | 25 | ||||||
Eagle Pharmaceuticals* (A) | 2,200 | 174 | ||||||
Edge Therapeutics* | 4,300 | 52 | ||||||
Editas Medicine* | 2,000 | 29 | ||||||
Egalet* (A) | 4,500 | 30 | ||||||
Emergent Biosolutions* | 6,884 | 184 | ||||||
Enanta Pharmaceuticals* | 3,300 | 104 | ||||||
Endocyte* | 4,870 | 13 | ||||||
Endologix* | 15,995 | 118 | ||||||
Ensign Group | 10,436 | 226 | ||||||
Entellus Medical* | 2,300 | 42 | ||||||
Envision Healthcare Holdings* | 37,000 | 841 | ||||||
Enzo Biochem* | 10,000 | 68 | ||||||
Epizyme* | 9,700 | 108 | ||||||
Esperion Therapeutics* (A) | 2,500 | 26 | ||||||
Evolent Health, Cl A* | 2,200 | 41 | ||||||
Exact Sciences* (A) | 20,654 | 305 | ||||||
Exactech* | 1,239 | 31 | ||||||
Exelixis* | 42,700 | 722 | ||||||
FibroGen* | 9,800 | 217 | ||||||
Five Prime Therapeutics* | 5,300 | 305 | ||||||
Flexion Therapeutics* | 3,700 | 61 | ||||||
Fluidigm* | 4,553 | 29 | ||||||
Foundation Medicine* (A) | 2,952 | 61 | ||||||
Galena Biopharma* | 2,710 | 8 | ||||||
Genesis Healthcare, Cl A* | 2,900 | 10 | ||||||
GenMark Diagnostics* | 5,900 | 69 | ||||||
Genomic Health* | 2,897 | 88 | ||||||
Geron* (A) | 23,970 | 49 | ||||||
Glaukos* | 2,500 | 78 | ||||||
Global Blood Therapeutics* (A) | 3,201 | 61 | ||||||
Globus Medical, Cl A* | 14,300 | 309 | ||||||
Haemonetics* | 9,847 | 390 | ||||||
Halozyme Therapeutics* (A) | 21,658 | 256 | ||||||
Halyard Health* | 10,500 | 390 | ||||||
HealthEquity* | 8,900 | 396 | ||||||
HealthSouth | 17,041 | 710 | ||||||
HealthStream* | 5,964 | 149 | ||||||
Healthways* | 6,021 | 140 | ||||||
Heron Therapeutics* (A) | 5,000 | 77 | ||||||
Heska* | 1,900 | 126 | ||||||
Hill-Rom Holdings | 12,701 | 677 | ||||||
HMS Holdings* | 17,331 | 318 | ||||||
Horizon Pharma* | 29,300 | 580 | ||||||
ICU Medical* | 3,227 | 485 | ||||||
Idera Pharmaceuticals* | 7,600 | 13 | ||||||
Idexx Laboratories* | 17,002 | 2,000 | ||||||
Ignyta* | 5,200 | 33 | ||||||
Immune Design* | 3,200 | 24 | ||||||
ImmunoGen* (A) | 15,452 | 28 | ||||||
| 11 | SEI Institutional Investments Trust / Semi-Annual Report / November 30, 2016 |
SCHEDULE OF INVESTMENTS (Unaudited)
Extended Market Index Fund (Continued)
November 30, 2016
| Description | Shares | Market Value ($ Thousands) | ||||||
Immunomedics* (A) | 26,657 | $ | 86 | |||||
Impax Laboratories* | 13,488 | 195 | ||||||
INC Research Holdings, Cl A* | 7,800 | 386 | ||||||
Incyte* | 31,371 | 3,209 | ||||||
Infinity Pharmaceuticals* | 6,394 | 7 | ||||||
Innoviva* (A) | 17,709 | 183 | ||||||
Inogen* | 3,000 | 193 | ||||||
Inotek Pharmaceuticals* | 3,500 | 22 | ||||||
Inovalon Holdings, Cl A* (A) | 10,600 | 163 | ||||||
Inovio Pharmaceuticals* (A) | 16,000 | 113 | ||||||
Insmed* | 11,100 | 152 | ||||||
Insulet* | 11,221 | 378 | ||||||
Insys Therapeutics* (A) | 3,800 | 45 | ||||||
Integer Holdings* | 5,730 | 162 | ||||||
Integra LifeSciences Holdings* | 6,452 | 521 | ||||||
Intercept Pharmaceuticals* (A) | 3,276 | 331 | ||||||
Intersect ENT* | 4,900 | 51 | ||||||
Intra-Cellular Therapies, Cl A* | 7,100 | 99 | ||||||
Intrexon* (A) | 11,400 | 333 | ||||||
Invacare | 6,889 | 79 | ||||||
Invitae* | 4,500 | 31 | ||||||
InVivo Therapeutics Holdings* (A) | 4,100 | 20 | ||||||
Ionis Pharmaceuticals* | 23,894 | 1,046 | ||||||
Ironwood Pharmaceuticals, Cl A* | 25,154 | 393 | ||||||
Juno Therapeutics* (A) | 11,600 | 233 | ||||||
K2M Group Holdings* | 4,900 | 92 | ||||||
Karyopharm Therapeutics* | 5,000 | 46 | ||||||
Keryx Biopharmaceuticals* (A) | 17,594 | 102 | ||||||
Kindred Healthcare | 14,973 | 100 | ||||||
Kite Pharma* (A) | 7,700 | 392 | ||||||
La Jolla Pharmaceutical* | 3,000 | 54 | ||||||
Landauer | 2,073 | 103 | ||||||
Lannett* (A) | 5,200 | 119 | ||||||
LeMaitre Vascular | 4,100 | 93 | ||||||
Lexicon Pharmaceuticals* (A) | 9,305 | 142 | ||||||
LHC Group* | 2,284 | 96 | ||||||
LifePoint Hospitals* | 7,596 | 417 | ||||||
Ligand Pharmaceuticals* (A) | 3,728 | 389 | ||||||
Lion Biotechnologies* | 7,000 | 47 | ||||||
Loxo Oncology* | 2,300 | 63 | ||||||
Luminex* | 8,555 | 174 | ||||||
MacroGenics* | 5,400 | 140 | ||||||
Magellan Health Services* | 4,540 | 331 | ||||||
MannKind* (A) | 34,843 | 16 | ||||||
Masimo* | 7,693 | 476 | ||||||
Medicines* | 14,557 | 511 | ||||||
MediciNova* (A) | 5,900 | 42 | ||||||
Medidata Solutions* | 10,594 | 585 | ||||||
MEDNAX* | 18,056 | 1,182 | ||||||
Medpace Holdings* | 2,400 | 86 | ||||||
Meridian Bioscience | 7,741 | 134 | ||||||
Merit Medical Systems* | 7,375 | 174 | ||||||
| Description | Shares | Market Value ($ Thousands) | ||||||
Merrimack Pharmaceuticals* (A) | 23,500 | $ | 129 | |||||
MiMedx Group* (A) | 24,700 | 234 | ||||||
Minerva Neurosciences* (A) | 3,700 | 48 | ||||||
Mirati Therapeutics* | 2,400 | 13 | ||||||
Molina Healthcare* | 8,436 | 446 | ||||||
Momenta Pharmaceuticals* | 11,154 | 158 | ||||||
MyoKardia* | 2,200 | 35 | ||||||
Myriad Genetics* | 12,426 | 207 | ||||||
NanoString Technologies* | 3,500 | 77 | ||||||
NantKwest* (A) | 4,700 | 31 | ||||||
Natera* | 7,200 | 86 | ||||||
National Healthcare | 2,094 | 144 | ||||||
National Research, Cl A | 312 | 5 | ||||||
Natus Medical* | 5,958 | 237 | ||||||
Nektar Therapeutics, Cl A* | 31,495 | 387 | ||||||
Neogen* | 7,380 | 467 | ||||||
NeoGenomics* | 13,300 | 119 | ||||||
Neurocrine Biosciences* | 17,100 | 794 | ||||||
Nevro* (A) | 4,800 | 365 | ||||||
NewLink Genetics* | 3,916 | 43 | ||||||
Nobilis Health* (A) | 15,000 | 35 | ||||||
Novavax* (A) | 49,853 | 60 | ||||||
Novocure* (A) | 9,000 | 70 | ||||||
NuVasive* | 10,478 | 680 | ||||||
NxStage Medical* | 13,347 | 330 | ||||||
Ocular Therapeutix* | 1,700 | 16 | ||||||
Omeros* (A) | 5,200 | 64 | ||||||
Omnicell* | 6,412 | 230 | ||||||
OncoMed Pharmaceuticals* | 5,600 | 48 | ||||||
Ophthotech* | 5,400 | 166 | ||||||
OPKO Health* (A) | 61,984 | 644 | ||||||
OraSure Technologies* | 14,539 | 123 | ||||||
Organovo Holdings* (A) | 16,500 | 50 | ||||||
Orthofix International* | 3,940 | 148 | ||||||
Osiris Therapeutics* (A) | 4,100 | 24 | ||||||
Otonomy* | 4,600 | 78 | ||||||
OvaScience* | 2,500 | 8 | ||||||
Owens & Minor | 12,639 | 429 | ||||||
Oxford Immunotec Global* | 5,400 | 80 | ||||||
Pacific Biosciences of California* (A) | 15,900 | 121 | ||||||
Pacira Pharmaceuticals* | 6,345 | 202 | ||||||
Paratek Pharmaceuticals* | 3,300 | 44 | ||||||
PAREXEL International* | 10,246 | 605 | ||||||
Patheon* | 7,100 | 194 | ||||||
PDL BioPharma | 31,600 | 69 | ||||||
Penumbra* | 4,800 | 297 | ||||||
Pfenex* | 4,300 | 40 | ||||||
PharmAthene* | 9,700 | 30 | ||||||
PharMerica* | 6,850 | 165 | ||||||
Phibro Animal Health, Cl A | 3,700 | 102 | ||||||
Portola Pharmaceuticals, Cl A* | 10,000 | 180 | ||||||
PRA Health Sciences* | 5,200 | 279 | ||||||
| 12 | SEI Institutional Investments Trust / Semi-Annual Report / November 30, 2016 |
SCHEDULE OF INVESTMENTS (Unaudited)
Extended Market Index Fund (Continued)
November 30, 2016
| Description | Shares | Market Value ($ Thousands) | ||||||
Premier, Cl A* | 8,800 | $ | 265 | |||||
Prestige Brands Holdings* | 10,079 | 479 | ||||||
Progenics Pharmaceuticals* | 11,596 | 104 | ||||||
Protagonist Therapeutics* | 2,600 | 65 | ||||||
Prothena* (A) | 6,200 | 366 | ||||||
Providence Service* | 2,458 | 90 | ||||||
PTC Therapeutics* | 5,200 | 58 | ||||||
Puma Biotechnology* | 4,900 | 211 | ||||||
QIAGEN* | 44,948 | 1,228 | ||||||
Quality Systems | 11,815 | 155 | ||||||
Quidel* | 5,012 | 115 | ||||||
Quintiles IMS Holdings* | 26,997 | 2,074 | ||||||
Quorum Health* | 8,332 | 48 | ||||||
Radius Health* (A) | 5,800 | 309 | ||||||
RadNet* | 3,900 | 24 | ||||||
Reata Pharmaceuticals, Cl A* (A) | 1,600 | 42 | ||||||
REGENXBIO* | 4,100 | 91 | ||||||
Regulus Therapeutics* | 3,400 | 8 | ||||||
Repligen* | 6,722 | 216 | ||||||
ResMed | 26,599 | 1,635 | ||||||
Retrophin* | 7,400 | 151 | ||||||
Revance Therapeutics* (A) | 2,600 | 44 | ||||||
Rigel Pharmaceuticals* | 17,759 | 46 | ||||||
Rockwell Medical* (A) | 10,000 | 65 | ||||||
RTI Surgical* | 6,918 | 20 | ||||||
Sage Therapeutics* | 6,300 | 316 | ||||||
Sangamo BioSciences* | 11,070 | 35 | ||||||
Sarepta Therapeutics* (A) | 10,900 | 373 | ||||||
SciClone Pharmaceuticals* | 11,601 | 115 | ||||||
Seattle Genetics* | 19,000 | 1,231 | ||||||
Select Medical Holdings* | 24,265 | 295 | ||||||
Seres Therapeutics* (A) | 3,300 | 33 | ||||||
Sorrento Therapeutics* (A) | 4,400 | 23 | ||||||
Spark Therapeutics* | 3,800 | 209 | ||||||
Spectranetics* | 8,424 | 184 | ||||||
Spectrum Pharmaceuticals* | 16,579 | 65 | ||||||
STAAR Surgical* | 5,378 | 58 | ||||||
Stemline Therapeutics* | 900 | 12 | ||||||
Sucampo Pharmaceuticals, Cl A* | 5,500 | 89 | ||||||
Supernus Pharmaceuticals* | 10,200 | 220 | ||||||
Surgery Partners* | 3,500 | 52 | ||||||
Surgical Care Affiliates* | 4,800 | 202 | ||||||
Surmodics* | 2,444 | 59 | ||||||
Synergy Pharmaceuticals* | 41,915 | 220 | ||||||
Tandem Diabetes Care* | 1,500 | 4 | ||||||
Team Health Holdings* | 14,508 | 617 | ||||||
Teladoc* (A) | 4,000 | 73 | ||||||
Teleflex | 8,602 | 1,272 | ||||||
Teligent* | 6,200 | 45 | ||||||
Tenet Healthcare* | 14,900 | 227 | ||||||
TESARO* (A) | 5,600 | 760 | ||||||
Tetraphase Pharmaceuticals* | 5,400 | 23 | ||||||
| Description | Shares | Market Value ($ Thousands) | ||||||
TG Therapeutics* (A) | 7,600 | $ | 44 | |||||
TherapeuticsMD* (A) | 30,100 | 179 | ||||||
Theravance Biopharma* (A) | 6,345 | 177 | ||||||
TransEnterix* (A) | 13,500 | 21 | ||||||
Trevena* | 10,400 | 57 | ||||||
Triple-S Management, Cl B* | 5,566 | 124 | ||||||
Trovagene* (A) | 9,900 | 29 | ||||||
Ultragenyx Pharmaceutical* | 7,100 | 556 | ||||||
United Therapeutics* | 8,264 | 1,038 | ||||||
Universal American* | 7,316 | 73 | ||||||
US Physical Therapy | 1,926 | 123 | ||||||
Utah Medical Products | 1,200 | 82 | ||||||
Vanda Pharmaceuticals* | 9,100 | 150 | ||||||
Vascular Solutions* | 2,718 | 150 | ||||||
VCA Antech* | 14,583 | 913 | ||||||
Veeva Systems, Cl A* | 18,600 | 865 | ||||||
Versartis* | 5,400 | 67 | ||||||
Vital Therapies* | 4,300 | 22 | ||||||
Vocera Communications* | 6,142 | 112 | ||||||
Voyager Therapeutics* | 2,400 | 30 | ||||||
VWR* | 14,500 | 394 | ||||||
WaVe Life Sciences* | 2,100 | 75 | ||||||
WellCare Health Plans* | 8,766 | 1,201 | ||||||
West Pharmaceutical Services | 13,530 | 1,098 | ||||||
Wright Medical Group* | 20,678 | 476 | ||||||
XBiotech* (A) | 4,800 | 67 | ||||||
Xencor* | 7,400 | 189 | ||||||
Zafgen* | 3,500 | 12 | ||||||
Zeltiq Aesthetics* | 6,800 | 299 | ||||||
ZIOPHARM Oncology* (A) | 30,346 | 197 | ||||||
Zogenix* | 5,700 | 72 | ||||||
|
| |||||||
| 86,114 | ||||||||
|
| |||||||
Industrials — 12.9% | ||||||||
AAON | 9,350 | 308 | ||||||
AAR | 5,729 | 211 | ||||||
ABM Industries | 12,055 | 530 | ||||||
Acacia Research | 8,749 | 60 | ||||||
ACCO Brands* | 23,129 | 288 | ||||||
Actuant, Cl A | 11,042 | 287 | ||||||
Advanced Drainage Systems | 6,500 | 132 | ||||||
Advisory Board* | 8,484 | 300 | ||||||
AECOM Technology* | 30,248 | 1,100 | ||||||
Aegion, Cl A* | 7,603 | 184 | ||||||
Aerojet Rocketdyne Holdings* | 12,579 | 256 | ||||||
Aerovironment* | 3,825 | 108 | ||||||
AGCO | 12,823 | 716 | ||||||
Air Lease, Cl A | 19,431 | 697 | ||||||
Air Transport Services Group* | 10,936 | 177 | ||||||
Aircastle | 8,557 | 184 | ||||||
Alamo Group | 2,135 | 156 | ||||||
Albany International, Cl A | 5,898 | 275 | ||||||
| 13 | SEI Institutional Investments Trust / Semi-Annual Report / November 30, 2016 |
SCHEDULE OF INVESTMENTS (Unaudited)
Extended Market Index Fund (Continued)
November 30, 2016
| Description | Shares | Market Value ($ Thousands) | ||||||
Allegiant Travel, Cl A | 2,450 | $ | 400 | |||||
Allison Transmission Holdings, Cl A | 28,176 | 935 | ||||||
Altra Industrial Motion | 5,589 | 196 | ||||||
AMERCO | 1,300 | 444 | ||||||
Ameresco, Cl A* | 779 | 5 | ||||||
American Railcar Industries (A) | 1,277 | 57 | ||||||
American Woodmark* | 2,484 | 190 | ||||||
AO Smith | 28,716 | 1,396 | ||||||
Apogee Enterprises | 5,411 | 258 | ||||||
Applied Industrial Technologies | 7,261 | 435 | ||||||
ARC Document Solutions* | 4,300 | 19 | ||||||
ArcBest | 3,490 | 106 | ||||||
Argan | 2,979 | 180 | ||||||
Armstrong Flooring* | 3,038 | 57 | ||||||
Armstrong World Industries* | 8,677 | 362 | ||||||
Astec Industries | 4,063 | 269 | ||||||
Astronics* | 3,274 | 121 | ||||||
Astronics, Cl B* | 1,656 | 62 | ||||||
Atkore International Group* | 3,600 | 77 | ||||||
Atlas Air Worldwide Holdings* | 4,769 | 236 | ||||||
Avis Budget Group* | 15,260 | 584 | ||||||
AZZ | 4,696 | 306 | ||||||
B/E Aerospace | 19,230 | 1,155 | ||||||
Babcock & Wilcox Enterprises* | 8,162 | 130 | ||||||
Barnes Group | 9,852 | 455 | ||||||
Barrett Business Services | 834 | 49 | ||||||
Beacon Roofing Supply* | 12,070 | 560 | ||||||
BMC Stock Holdings* | 10,900 | 205 | ||||||
Brady, Cl A | 9,427 | 346 | ||||||
Briggs & Stratton | 10,449 | 217 | ||||||
Brink’s | 9,606 | 388 | ||||||
Builders FirstSource* | 14,970 | 166 | ||||||
BWX Technologies | 18,624 | 729 | ||||||
Caesarstone* | 4,600 | 125 | ||||||
CAI International* | 1,272 | 11 | ||||||
Carlisle | 12,277 | 1,377 | ||||||
Casella Waste Systems, Cl A* | 11,391 | 144 | ||||||
CBIZ* | 11,445 | 142 | ||||||
CEB | 6,461 | 381 | ||||||
Ceco Environmental | 5,647 | 80 | ||||||
Celadon Group | 3,375 | 27 | ||||||
Chart Industries* | 6,872 | 244 | ||||||
Chicago Bridge & Iron | 20,392 | 683 | ||||||
CIRCOR International | 3,715 | 235 | ||||||
CLARCOR | 9,523 | 671 | ||||||
Clean Harbors* | 10,376 | 548 | ||||||
Colfax* | 18,889 | 710 | ||||||
Columbus McKinnon | 2,465 | 65 | ||||||
Comfort Systems USA | 6,991 | 225 | ||||||
Continental Building Products* | 6,600 | 148 | ||||||
Copa Holdings, Cl A (A) | 6,628 | 589 | ||||||
Copart* | 18,350 | 1,004 | ||||||
| Description | Shares | Market Value ($ Thousands) | ||||||
Costamare (A) | 5,100 | $ | 29 | |||||
Covanta Holding | 21,258 | 310 | ||||||
Covenant Transportation Group, Cl A* | 3,300 | 68 | ||||||
CRA International | 2,105 | 69 | ||||||
Crane | 8,929 | 656 | ||||||
CSW Industrials* | 2,600 | 95 | ||||||
Cubic | 4,689 | 217 | ||||||
Curtiss-Wright | 8,178 | 822 | ||||||
Deluxe | 9,454 | 640 | ||||||
DigitalGlobe* | 11,232 | 361 | ||||||
DMC Global | 3,900 | 64 | ||||||
Donaldson | 23,746 | 963 | ||||||
Douglas Dynamics | 4,222 | 135 | ||||||
Ducommun* | 1,000 | 29 | ||||||
DXP Enterprises* | 1,662 | 56 | ||||||
Dycom Industries* | 5,907 | 433 | ||||||
Echo Global Logistics* | 4,586 | 115 | ||||||
EMCOR Group | 11,987 | 832 | ||||||
Encore Wire | 4,403 | 187 | ||||||
Energous* (A) | 3,000 | 48 | ||||||
Energy Recovery* | 10,200 | 111 | ||||||
EnerNOC* | 4,160 | 25 | ||||||
EnerSys | 8,683 | 691 | ||||||
Engility Holdings* | 3,410 | 124 | ||||||
Ennis | 3,488 | 56 | ||||||
EnPro Industries | 4,668 | 284 | ||||||
ESCO Technologies | 5,477 | 306 | ||||||
Essendant | 7,137 | 138 | ||||||
Esterline Technologies* | 5,790 | 509 | ||||||
ExOne* (A) | 1,900 | 19 | ||||||
Exponent | 4,786 | 290 | ||||||
Federal Signal | 14,947 | 236 | ||||||
Forward Air | 6,318 | 306 | ||||||
Franklin Covey* | 404 | 8 | ||||||
Franklin Electric | 8,781 | 343 | ||||||
FreightCar America | 1,733 | 25 | ||||||
FTI Consulting* | 8,168 | 349 | ||||||
FuelCell Energy* | 2,863 | 6 | ||||||
G&K Services, Cl A | 4,039 | 387 | ||||||
GATX (A) | 7,552 | 413 | ||||||
Generac Holdings* | 14,045 | 576 | ||||||
General Cable | 8,737 | 164 | ||||||
Genesee & Wyoming, Cl A* | 11,274 | 861 | ||||||
Gibraltar Industries* | 6,160 | 277 | ||||||
Global Brass & Copper Holdings | 5,100 | 146 | ||||||
GMS* | 1,400 | 35 | ||||||
Gorman-Rupp | 4,077 | 122 | ||||||
GP Strategies* | 2,500 | 66 | ||||||
Graco | 11,035 | 896 | ||||||
Graham | 796 | 18 | ||||||
Granite Construction | 7,811 | 461 | ||||||
Great Lakes Dredge & Dock* | 9,180 | 39 | ||||||
| 14 | SEI Institutional Investments Trust / Semi-Annual Report / November 30, 2016 |
SCHEDULE OF INVESTMENTS (Unaudited)
Extended Market Index Fund (Continued)
November 30, 2016
| Description | Shares | Market Value ($ Thousands) | ||||||
Greenbrier (A) | 5,123 | $ | 199 | |||||
Griffon | 4,237 | 101 | ||||||
H&E Equipment Services | 5,625 | 104 | ||||||
Harsco | 15,128 | 212 | ||||||
Hawaiian Holdings* | 9,880 | 507 | ||||||
HC2 Holdings* | 11,000 | 52 | ||||||
HD Supply Holdings* | 38,200 | 1,499 | ||||||
Healthcare Services Group | 13,439 | 523 | ||||||
Heartland Express | 9,772 | 210 | ||||||
Heico | 3,981 | 313 | ||||||
HEICO, Cl A | 7,700 | 517 | ||||||
Heidrick & Struggles International | 2,952 | 63 | ||||||
Herc Holdings* | 4,367 | 174 | ||||||
Heritage-Crystal Clean* | 1,200 | 20 | ||||||
Herman Miller | 11,043 | 359 | ||||||
Hertz Global Holdings* | 14,502 | 365 | ||||||
Hexcel | 17,298 | 895 | ||||||
Hillenbrand | 12,085 | 423 | ||||||
HNI | 8,849 | 467 | ||||||
Hub Group, Cl A* | 7,762 | 333 | ||||||
Hubbell, Cl B | 10,389 | 1,166 | ||||||
Huntington Ingalls Industries | 9,159 | 1,637 | ||||||
Hurco | 1,235 | 40 | ||||||
Huron Consulting Group* | 4,011 | 212 | ||||||
Hyster-Yale Materials Handling | 2,002 | 129 | ||||||
ICF International* | 4,368 | 242 | ||||||
IDEX | 14,941 | 1,399 | ||||||
InnerWorkings* | 7,387 | 68 | ||||||
Insperity | 3,012 | 218 | ||||||
Insteel Industries | 2,941 | 116 | ||||||
Interface, Cl A | 13,845 | 241 | ||||||
ITT | 16,563 | 669 | ||||||
JetBlue Airways* | 63,581 | 1,277 | ||||||
John Bean Technologies | 5,731 | 517 | ||||||
Joy Global | 19,200 | 538 | ||||||
Kadant | 1,725 | 108 | ||||||
Kaman | 5,573 | 272 | ||||||
KAR Auction Services | 25,929 | 1,093 | ||||||
KBR | 31,145 | 520 | ||||||
Kelly Services, Cl A | 6,795 | 137 | ||||||
Kennametal | 16,014 | 552 | ||||||
KEYW Holding* | 8,468 | 106 | ||||||
Kforce | 4,537 | 100 | ||||||
Kirby* | 11,226 | 712 | ||||||
KLX* | 9,765 | 381 | ||||||
Knight Transportation (A) | 14,537 | 509 | ||||||
Knoll | 11,263 | 299 | ||||||
Korn/Ferry International | 10,658 | 270 | ||||||
Kratos Defense & Security Solutions* | 5,216 | 38 | ||||||
Landstar System | 8,944 | 728 | ||||||
Layne Christensen* | 4,900 | 52 | ||||||
Lennox International | 7,829 | 1,164 | ||||||
| Description | Shares | Market Value ($ Thousands) | ||||||
Lincoln Electric Holdings | 12,133 | $ | 953 | |||||
Lindsay Manufacturing (A) | 2,327 | 196 | ||||||
LSC Communications | 4,958 | 102 | ||||||
LSI Industries | 2,000 | 20 | ||||||
Lydall* | 3,632 | 217 | ||||||
Macquarie Infrastructure | 14,700 | 1,205 | ||||||
Manitowoc | 23,950 | 143 | ||||||
Manitowoc Foodservice* | 23,950 | 425 | ||||||
Manpowergroup | 14,056 | 1,201 | ||||||
Marten Transport | 3,095 | 75 | ||||||
Masonite International* | 6,200 | 402 | ||||||
MasTec* | 12,762 | 484 | ||||||
Matson | 8,552 | 322 | ||||||
Matthews International, Cl A | 6,513 | 474 | ||||||
McGrath RentCorp | 5,748 | 212 | ||||||
Mercury Systems* | 8,423 | 250 | ||||||
Meritor* | 18,495 | 233 | ||||||
Middleby* | 11,125 | 1,524 | ||||||
Milacron Holdings* | 4,400 | 74 | ||||||
Miller Industries | 2,311 | 59 | ||||||
Mistras Group* | 2,697 | 64 | ||||||
Mobile Mini | 8,283 | 254 | ||||||
Moog, Cl A* | 5,924 | 414 | ||||||
MRC Global* | 17,212 | 346 | ||||||
MSA Safety | 5,944 | 369 | ||||||
MSC Industrial Direct, Cl A | 8,803 | 786 | ||||||
Mueller Industries | 11,208 | 426 | ||||||
Mueller Water Products, Cl A | 31,812 | 421 | ||||||
Multi-Color | 2,557 | 184 | ||||||
MYR Group* | 4,179 | 157 | ||||||
NACCO Industries, Cl A | 1,005 | 95 | ||||||
National Presto Industries | 1,091 | 104 | ||||||
Navigant Consulting* | 10,241 | 253 | ||||||
Navistar International* (A) | 10,291 | 317 | ||||||
NCI Building Systems* | 3,548 | 59 | ||||||
NN | 5,587 | 95 | ||||||
Nordson | 11,212 | 1,197 | ||||||
NOW* | 21,600 | 465 | ||||||
NV5 Global* | 1,400 | 51 | ||||||
Old Dominion Freight Line* | 12,690 | 1,108 | ||||||
On Assignment* | 10,069 | 416 | ||||||
Orbital ATK | 10,892 | 929 | ||||||
Orion Marine Group* | 1,874 | 19 | ||||||
Oshkosh Truck | 14,017 | 981 | ||||||
Owens Corning | 21,660 | 1,113 | ||||||
PAM Transportation Services* | 900 | 22 | ||||||
Park-Ohio Holdings | 1,118 | 47 | ||||||
Patrick Industries* | 2,850 | 203 | ||||||
Paylocity Holding* | 3,700 | 123 | ||||||
PGT* | 10,000 | 111 | ||||||
Plug Power* (A) | 19,400 | 26 | ||||||
Ply Gem Holdings* | 5,900 | 90 | ||||||
| 15 | SEI Institutional Investments Trust / Semi-Annual Report / November 30, 2016 |
SCHEDULE OF INVESTMENTS (Unaudited)
Extended Market Index Fund (Continued)
November 30, 2016
| Description | Shares | Market Value ($ Thousands) | ||||||
Powell Industries | 1,364 | $ | 59 | |||||
Power Solutions International* | 800 | 10 | ||||||
Preformed Line Products | 90 | 5 | ||||||
Primoris Services | 7,847 | 180 | ||||||
Proto Labs* | 5,099 | 266 | ||||||
Quad, Cl A | 6,862 | 193 | ||||||
Quanex Building Products | 5,765 | 112 | ||||||
Raven Industries | 6,155 | 154 | ||||||
RBC Bearings* | 4,295 | 364 | ||||||
Regal-Beloit | 8,625 | 629 | ||||||
Resources Connection | 3,581 | 58 | ||||||
Rexnord* | 15,426 | 339 | ||||||
Roadrunner Transportation Systems* | 3,272 | 33 | ||||||
Rollins | 20,462 | 657 | ||||||
RPX* | 12,610 | 132 | ||||||
RR Donnelley & Sons | 13,219 | 230 | ||||||
Rush Enterprises, Cl A* | 5,399 | 163 | ||||||
Rush Enterprises, Cl B* | 1,800 | 50 | ||||||
Saia* | 5,692 | 238 | ||||||
Scorpio Bulkers* (A) | 5,716 | 30 | ||||||
Simpson Manufacturing | 8,343 | 393 | ||||||
SiteOne Landscape Supply* | 3,100 | 104 | ||||||
SkyWest | 9,922 | 366 | ||||||
SP Plus* | 2,498 | 69 | ||||||
Sparton* | 1,100 | 27 | ||||||
Spirit AeroSystems Holdings, Cl A | 26,075 | 1,519 | ||||||
Spirit Airlines* | 13,147 | 731 | ||||||
SPX* | 7,194 | 176 | ||||||
SPX FLOW* | 7,194 | 225 | ||||||
Standex International | 2,429 | 214 | ||||||
Steelcase, Cl A | 17,557 | 273 | ||||||
Sun Hydraulics | 4,677 | 186 | ||||||
Sunrun* (A) | 11,300 | 58 | ||||||
Supreme Industries, Cl A | 2,600 | 37 | ||||||
Swift Transporation, Cl A* (A) | 16,609 | 415 | ||||||
TASER International* | 9,069 | 247 | ||||||
Team* | 5,757 | 197 | ||||||
Teledyne Technologies* | 6,637 | 829 | ||||||
Tennant | 3,938 | 296 | ||||||
Terex | 20,770 | 634 | ||||||
Tetra Tech | 10,742 | 460 | ||||||
Textainer Group Holdings | 2,253 | 22 | ||||||
Thermon Group Holdings* | 6,882 | 132 | ||||||
Timken | 15,209 | 594 | ||||||
Titan International | 10,772 | 125 | ||||||
Titan Machinery* | 3,312 | 46 | ||||||
Toro | 20,100 | 1,064 | ||||||
TransUnion* | 11,900 | 355 | ||||||
TRC* | 5,200 | 50 | ||||||
Trex* | 5,740 | 378 | ||||||
TriMas* | 9,876 | 212 | ||||||
TriNet Group* | 8,900 | 225 | ||||||
| Description | Shares | Market Value ($ Thousands) | ||||||
Trinity Industries | 27,642 | $ | 768 | |||||
Triton International | 5,884 | 114 | ||||||
Triumph Group | 9,696 | 270 | ||||||
TrueBlue* | 8,328 | 174 | ||||||
Tutor Perini* | 6,751 | 176 | ||||||
UniFirst | 2,840 | 401 | ||||||
Univar* | 8,300 | 207 | ||||||
Universal Forest Products | 3,655 | 363 | ||||||
Universal Logistics Holdings | 700 | 10 | ||||||
US Ecology | 4,640 | 216 | ||||||
USA Truck* | 1,700 | 15 | ||||||
USG* | 17,582 | 504 | ||||||
Valmont Industries | 4,414 | 657 | ||||||
Vectrus* | 1,379 | 32 | ||||||
Veritiv* | 2,000 | 94 | ||||||
Viad | 4,271 | 187 | ||||||
Vicor* | 2,500 | 36 | ||||||
Virgin America* (A) | 3,500 | 198 | ||||||
VSE | 1,000 | 39 | ||||||
Wabash National | 11,741 | 162 | ||||||
WABCO Holdings* | 10,410 | 1,025 | ||||||
Wabtec | 16,306 | 1,381 | ||||||
WageWorks* | 7,071 | 522 | ||||||
Watsco | 5,459 | 813 | ||||||
Watts Water Technologies, Cl A | 5,056 | 345 | ||||||
Werner Enterprises | 8,390 | 227 | ||||||
Wesco Aircraft Holdings* | 12,046 | 178 | ||||||
WESCO International* | 8,866 | 602 | ||||||
West | 8,100 | 193 | ||||||
Woodward Governor | 10,242 | 694 | ||||||
XPO Logistics* | 18,790 | 837 | ||||||
YRC Worldwide* | 4,500 | 57 | ||||||
|
| |||||||
| 107,609 | ||||||||
|
| |||||||
Information Technology — 17.2% | ||||||||
2U* | 6,500 | 215 | ||||||
3D Systems* (A) | 19,547 | 271 | ||||||
8x8* | 16,714 | 228 | ||||||
A10 Networks* | 9,800 | 80 | ||||||
Acacia Communications* (A) | 1,300 | 90 | ||||||
ACI Worldwide* | 23,312 | 434 | ||||||
Actua* | 5,188 | 70 | ||||||
Acxiom* | 17,074 | 453 | ||||||
ADTRAN | 9,897 | 201 | ||||||
Advanced Energy Industries* | 7,719 | 426 | ||||||
Advanced Micro Devices* | 147,800 | 1,317 | ||||||
Aerohive Networks* | 4,800 | 26 | ||||||
Agilysys* | 900 | 9 | ||||||
Alarm.com Holdings* | 2,700 | 80 | ||||||
Alpha & Omega Semiconductor* | 1,800 | 39 | ||||||
Ambarella* (A) | 5,900 | 363 | ||||||
Amber Road* | 1,900 | 22 | ||||||
| 16 | SEI Institutional Investments Trust / Semi-Annual Report / November 30, 2016 |
SCHEDULE OF INVESTMENTS (Unaudited)
Extended Market Index Fund (Continued)
November 30, 2016
| Description | Shares | Market Value ($ Thousands) | ||||||
Amdocs | 28,268 | $ | 1,667 | |||||
American Software, Cl A | 2,872 | 32 | ||||||
Amkor Technology* | 20,913 | 247 | ||||||
Angie’s List* | 10,248 | 88 | ||||||
Anixter International* | 5,941 | 464 | ||||||
Ansys* | 16,717 | 1,572 | ||||||
Appfolio, Cl A* | 2,400 | 53 | ||||||
Applied Micro Circuits* | 18,598 | 163 | ||||||
Applied Optoelectronics* (A) | 3,800 | 94 | ||||||
Arista Networks* | 7,600 | 721 | ||||||
ARRIS International* | 37,270 | 1,069 | ||||||
Arrow Electronics* | 17,925 | 1,224 | ||||||
Aspen Technology* | 16,367 | 865 | ||||||
Atlassian, Cl A* | 5,600 | 152 | ||||||
Autobytel* | 3,000 | 42 | ||||||
Avid Technology* | 5,000 | 21 | ||||||
Avnet | 25,299 | 1,161 | ||||||
AVX | 11,978 | 182 | ||||||
Axcelis Technologies* | 7,550 | 103 | ||||||
Badger Meter | 5,724 | 207 | ||||||
Bankrate* | 13,049 | 134 | ||||||
Barracuda Networks* | 4,800 | 106 | ||||||
Bazaarvoice* | 18,400 | 98 | ||||||
Bel Fuse, Cl B | 888 | 26 | ||||||
Belden | 8,023 | 593 | ||||||
Benchmark Electronics* | 9,930 | 282 | ||||||
Benefitfocus* | 2,300 | 63 | ||||||
Black Box | 2,509 | 39 | ||||||
Black Knight Financial Services, Cl A* | 4,300 | 159 | ||||||
Blackbaud | 10,055 | 631 | ||||||
Blackhawk Network Holdings, Cl A* | 10,600 | 382 | ||||||
Blucora* | 6,429 | 91 | ||||||
Booz Allen Hamilton Holding | 22,665 | 857 | ||||||
Bottomline Technologies de* | 7,571 | 190 | ||||||
Box, Cl A* | 12,100 | 184 | ||||||
Brightcove* | 6,800 | 56 | ||||||
Broadridge Financial Solutions | 22,397 | 1,450 | ||||||
BroadSoft* | 5,594 | 232 | ||||||
Brocade Communications Systems | 76,759 | 947 | ||||||
Brooks Automation | 14,503 | 236 | ||||||
Cabot Microelectronics | 4,424 | 264 | ||||||
CACI International, Cl A* | 4,732 | 612 | ||||||
Cadence Design Systems* | 58,747 | 1,544 | ||||||
CalAmp* | 8,156 | 119 | ||||||
Calix* | 4,945 | 37 | ||||||
Callidus Software* | 11,856 | 186 | ||||||
Carbonite* | 4,600 | 85 | ||||||
Cardtronics* | 9,785 | 484 | ||||||
Care.com* | 3,200 | 27 | ||||||
Cass Information Systems | 2,390 | 167 | ||||||
Cavium* | 12,752 | 727 | ||||||
CDK Global | 29,700 | 1,714 | ||||||
| Description | Shares | Market Value ($ Thousands) | ||||||
CDW | 32,000 | $ | 1,640 | |||||
CEVA* | 3,838 | 122 | ||||||
ChannelAdvisor* | 2,400 | 35 | ||||||
Ciena* | 27,386 | 587 | ||||||
Cimpress* (A) | 5,499 | 478 | ||||||
Cirrus Logic* | 12,095 | 665 | ||||||
Clearfield* (A) | 1,400 | 27 | ||||||
Cognex | 15,158 | 905 | ||||||
Coherent* | 4,353 | 568 | ||||||
Cohu | 5,077 | 63 | ||||||
CommerceHub* | 7,282 | 108 | ||||||
CommScope Holding* | 25,500 | 917 | ||||||
CommVault Systems* | 7,184 | 388 | ||||||
Computer Sciences | 26,400 | 1,601 | ||||||
comScore* | 9,833 | 286 | ||||||
Comtech Telecommunications | 4,332 | 50 | ||||||
Control4* | 5,800 | 66 | ||||||
Convergys | 17,587 | 455 | ||||||
CoreLogic* | 17,183 | 648 | ||||||
Cornerstone OnDemand* | 9,599 | 345 | ||||||
CoStar Group* | 6,063 | 1,159 | ||||||
Cray* | 7,570 | 146 | ||||||
Cree* (A) | 19,523 | 494 | ||||||
CSG Systems International | 5,617 | 250 | ||||||
CTS | 7,945 | 176 | ||||||
Cypress Semiconductor | 60,035 | 675 | ||||||
Daktronics | 4,580 | 47 | ||||||
Datalink* | 3,697 | 41 | ||||||
Dell Technologies, Cl V* | 41,700 | 2,233 | ||||||
DHI Group* | 6,690 | 41 | ||||||
Diebold | 13,333 | 304 | ||||||
Digi International* | 3,601 | 48 | ||||||
Digimarc* (A) | 2,076 | 64 | ||||||
Diodes* | 7,842 | 191 | ||||||
Dolby Laboratories, Cl A | 11,004 | 508 | ||||||
DSP Group* | 4,262 | 50 | ||||||
DST Systems | 6,350 | 655 | ||||||
DTS | 3,044 | 129 | ||||||
EarthLink Holdings | 20,333 | 107 | ||||||
Ebix (A) | 5,325 | 317 | ||||||
EchoStar, Cl A* | 8,603 | 439 | ||||||
Electro Scientific Industries* | 5,500 | 29 | ||||||
Electronics For Imaging* | 9,328 | 406 | ||||||
Ellie Mae* | 6,263 | 517 | ||||||
EMCORE | 11,200 | 72 | ||||||
Endurance International Group Holdings* | 9,100 | 72 | ||||||
Entegris* | 28,508 | 512 | ||||||
Envestnet* | 7,952 | 287 | ||||||
EPAM Systems* | 9,300 | 613 | ||||||
ePlus* | 1,144 | 127 | ||||||
Euronet Worldwide* | 9,688 | 695 | ||||||
EVERTEC | 13,600 | 248 | ||||||
| 17 | SEI Institutional Investments Trust / Semi-Annual Report / November 30, 2016 |
SCHEDULE OF INVESTMENTS (Unaudited)
Extended Market Index Fund (Continued)
November 30, 2016
| Description | Shares | Market Value ($ Thousands) | ||||||
Everyday Health* | 6,300 | $ | 66 | |||||
Exa* | 2,700 | 40 | ||||||
Exar* | 4,992 | 50 | ||||||
ExlService Holdings* | 6,623 | 315 | ||||||
Extreme Networks* | 19,687 | 83 | ||||||
Fabrinet* | 7,315 | 313 | ||||||
Fair Isaac | 6,091 | 692 | ||||||
FARO Technologies* | 4,108 | 150 | ||||||
Finisar* | 20,654 | 686 | ||||||
FireEye* (A) | 28,100 | 361 | ||||||
First Data, Cl A* | 62,200 | 906 | ||||||
Fitbit, Cl A* (A) | 23,700 | 198 | ||||||
Five9* | 7,300 | 116 | ||||||
FleetCor Technologies* | 17,673 | 2,639 | ||||||
FormFactor* | 12,919 | 145 | ||||||
Forrester Research | 1,564 | 64 | ||||||
Fortinet* | 30,199 | 909 | ||||||
Gartner* | 15,237 | 1,567 | ||||||
Genpact* | 29,250 | 700 | ||||||
Gigamon* | 6,600 | 352 | ||||||
Globant* (A) | 4,600 | 158 | ||||||
Glu Mobile* (A) | 16,800 | 38 | ||||||
GoDaddy, Cl A* | 8,800 | 311 | ||||||
Gogo* (A) | 9,200 | 86 | ||||||
GrubHub* (A) | 16,000 | 592 | ||||||
GTT Communications* | 5,300 | 135 | ||||||
Guidance Software* | 594 | 4 | ||||||
Guidewire Software* | 13,469 | 750 | ||||||
Hackett Group | 3,300 | 59 | ||||||
Harmonic* | 14,394 | 67 | ||||||
Hortonworks* (A) | 7,200 | 65 | ||||||
HubSpot* | 5,600 | 314 | ||||||
IAC | 13,121 | 884 | ||||||
II-VI* | 11,043 | 334 | ||||||
Immersion* | 3,567 | 37 | ||||||
Imperva* | 5,283 | 202 | ||||||
Impinj* (A) | 1,700 | 46 | ||||||
Infinera* | 28,784 | 245 | ||||||
Ingram Micro, Cl A | 27,246 | 1,020 | ||||||
Inphi* | 8,862 | 400 | ||||||
Insight Enterprises* | 7,198 | 252 | ||||||
Instructure* | 2,100 | 41 | ||||||
Integrated Device Technology* | 24,545 | 574 | ||||||
Interactive Intelligence Group* | 3,968 | 240 | ||||||
InterDigital | 6,930 | 549 | ||||||
Intersil, Cl A | 26,772 | 593 | ||||||
Intralinks Holdings* | 6,626 | 74 | ||||||
InvenSense, Cl A* | 12,577 | 96 | ||||||
IPG Photonics* | 6,520 | 625 | ||||||
Itron* | 7,111 | 457 | ||||||
Ixia* | 12,258 | 169 | ||||||
IXYS | 4,880 | 57 | ||||||
| Description | Shares | Market Value ($ Thousands) | ||||||
j2 Global | 9,157 | $ | 673 | |||||
Jabil Circuit | 39,200 | 829 | ||||||
Jack Henry & Associates | 15,519 | 1,341 | ||||||
Jive Software* | 7,834 | 30 | ||||||
Keysight Technologies* | 33,900 | 1,249 | ||||||
Kimball Electronics* | 7,093 | 124 | ||||||
Knowles* (A) | 15,800 | 253 | ||||||
Kopin* | 8,823 | 23 | ||||||
KVH Industries* | 1,997 | 22 | ||||||
Lattice Semiconductor* | 22,462 | 157 | ||||||
Leidos Holdings | 26,050 | 1,334 | ||||||
Limelight Networks* | 15,000 | 32 | ||||||
LinkedIn, Cl A* | 22,806 | 4,453 | ||||||
Lionbridge Technologies* | 7,618 | 38 | ||||||
Liquidity Services* | 2,222 | 20 | ||||||
Littelfuse | 4,203 | 613 | ||||||
LivePerson* | 8,091 | 65 | ||||||
LogMeIn | 4,913 | 495 | ||||||
Lumentum Holdings* | 9,340 | 375 | ||||||
MA-COM Tech* | 4,900 | 244 | ||||||
Manhattan Associates* | 13,280 | 696 | ||||||
ManTech International, Cl A | 4,922 | 212 | ||||||
Marchex, Cl B | 2,900 | 8 | ||||||
Marvell Technology Group | 79,502 | 1,140 | ||||||
Match Group* (A) | 7,200 | 129 | ||||||
Maxim Integrated Products | 54,204 | 2,129 | ||||||
MAXIMUS | 12,416 | 686 | ||||||
MaxLinear, Cl A* | 10,244 | 209 | ||||||
Maxwell Technologies* (A) | 6,300 | 32 | ||||||
MeetMe* (A) | 10,200 | 49 | ||||||
Mentor Graphics | 21,540 | 787 | ||||||
Mesa Laboratories | 600 | 74 | ||||||
Methode Electronics | 6,984 | 258 | ||||||
Microsemi* | 22,362 | 1,224 | ||||||
MicroStrategy, Cl A* | 2,053 | 398 | ||||||
MINDBODY, Cl A* (A) | 3,600 | 78 | ||||||
Mitek Systems* | 5,800 | 32 | ||||||
MKS Instruments | 10,323 | 594 | ||||||
MobileIron* | 11,500 | 48 | ||||||
Model N* | 7,000 | 63 | ||||||
MoneyGram International* | 2,905 | 32 | ||||||
Monolithic Power Systems | 7,551 | 619 | ||||||
Monotype Imaging Holdings | 6,860 | 134 | ||||||
MTS Systems | 3,089 | 166 | ||||||
Nanometrics* | 3,644 | 87 | ||||||
National Instruments | 22,067 | 650 | ||||||
NCR* | 23,083 | 894 | ||||||
NeoPhotonics* | 7,500 | 97 | ||||||
NETGEAR* | 6,592 | 354 | ||||||
NetScout Systems* | 18,058 | 563 | ||||||
NeuStar, Cl A* | 10,232 | 248 | ||||||
New Relic* | 3,900 | 124 | ||||||
| 18 | SEI Institutional Investments Trust / Semi-Annual Report / November 30, 2016 |
SCHEDULE OF INVESTMENTS (Unaudited)
Extended Market Index Fund (Continued)
November 30, 2016
| Description | Shares | Market Value ($ Thousands) | ||||||
NIC | 13,222 | $ | 332 | |||||
Nimble Storage* | 13,400 | 102 | ||||||
Novanta* | 5,462 | 111 | ||||||
Nuance Communications* | 44,781 | 726 | ||||||
NVE | 694 | 46 | ||||||
Oclaro* | 23,500 | 210 | ||||||
ON Semiconductor* | 81,500 | 960 | ||||||
OSI Systems* | 3,768 | 285 | ||||||
Palo Alto Networks* | 16,733 | 2,248 | ||||||
Pandora Media* (A) | 47,471 | 552 | ||||||
Park City Group* | 3,600 | 53 | ||||||
Park Electrochemical | 5,082 | 92 | ||||||
Paycom Software* | 8,700 | 390 | ||||||
PC Connection | 2,231 | 60 | ||||||
PDF Solutions* | 4,653 | 110 | ||||||
Pegasystems | 7,736 | 279 | ||||||
Perficient* | 6,700 | 121 | ||||||
PFSweb* | 4,500 | 36 | ||||||
Photronics* | 13,129 | 131 | ||||||
Planet Payment* | 8,400 | 34 | ||||||
Plantronics | 6,269 | 325 | ||||||
Plexus* | 7,528 | 385 | ||||||
Power Integrations | 5,289 | 356 | ||||||
Progress Software (A) | 9,058 | 268 | ||||||
Proofpoint* | 8,000 | 616 | ||||||
PROS Holdings* | 5,899 | 141 | ||||||
PTC* | 21,390 | 1,042 | ||||||
Pure Storage, Cl A* (A) | 14,200 | 198 | ||||||
Q2 Holdings* | 5,000 | 148 | ||||||
QAD, Cl A | 2,900 | 84 | ||||||
Qualys* | 5,100 | 169 | ||||||
QuinStreet* | 1,186 | 4 | ||||||
Quotient Technology* | 12,000 | 154 | ||||||
Radisys* | 7,200 | 30 | ||||||
Rambus* | 21,110 | 278 | ||||||
Rapid7* | 5,000 | 58 | ||||||
RealNetworks* | 844 | 4 | ||||||
RealPage* | 10,046 | 287 | ||||||
Reis | 500 | 11 | ||||||
RetailMeNot* | 8,100 | 75 | ||||||
RingCentral, Cl A* | 11,400 | 246 | ||||||
Rogers* | 3,593 | 267 | ||||||
Rosetta Stone* | 5,200 | 42 | ||||||
Rubicon Project* | 7,000 | 53 | ||||||
Rudolph Technologies* | 5,507 | 108 | ||||||
Sabre | 38,900 | 1,006 | ||||||
Sanmina* | 14,266 | 469 | ||||||
Sapiens International | 5,300 | 78 | ||||||
ScanSource* | 5,696 | 216 | ||||||
Science Applications International | 7,742 | 639 | ||||||
Semtech* | 12,175 | 342 | ||||||
ServiceNow* | 30,369 | 2,525 | ||||||
| Description | Shares | Market Value ($ Thousands) | ||||||
ServiceSource International* | 9,746 | $ | 58 | |||||
ShoreTel* | 13,670 | 96 | ||||||
Shutterstock* (A) | 4,397 | 207 | ||||||
Sigma Designs* | 5,500 | 41 | ||||||
Silicom | 1,100 | 43 | ||||||
Silicon Laboratories* | 7,982 | 530 | ||||||
Silver Spring Networks* | 8,400 | 117 | ||||||
Sonus Networks* | 5,720 | 34 | ||||||
Splunk* | 24,884 | 1,434 | ||||||
SPS Commerce* | 3,029 | 210 | ||||||
Square, Cl A* (A) | 10,900 | 141 | ||||||
SS&C Technologies Holdings | 33,218 | 997 | ||||||
Stamps.com* (A) | 3,355 | 356 | ||||||
Stratasys* (A) | 9,769 | 176 | ||||||
SunPower, Cl A* (A) | 10,636 | 72 | ||||||
Super Micro Computer* | 6,951 | 190 | ||||||
Sykes Enterprises* | 8,011 | 226 | ||||||
Synaptics* | 6,887 | 376 | ||||||
Synchronoss Technologies* | 7,697 | 373 | ||||||
SYNNEX | 5,370 | 628 | ||||||
Synopsys* | 28,852 | 1,745 | ||||||
Syntel | 6,254 | 121 | ||||||
Systemax | 1,400 | 12 | ||||||
Tableau Software, Cl A* | 11,800 | 530 | ||||||
Take-Two Interactive Software* | 16,039 | 790 | ||||||
Tangoe* | 4,655 | 37 | ||||||
Tech Data* | 6,965 | 591 | ||||||
TechTarget* | 4,700 | 40 | ||||||
Telenav* | 3,400 | 20 | ||||||
TeleTech Holdings | 3,427 | 99 | ||||||
Teradyne | 38,000 | 926 | ||||||
Tessera Technologies | 9,930 | 393 | ||||||
TiVo* | 22,058 | 447 | ||||||
Travelport Worldwide | 21,000 | 294 | ||||||
Trimble* | 49,420 | 1,393 | ||||||
TrueCar* (A) | 14,800 | 183 | ||||||
TTM Technologies* | 15,287 | 207 | ||||||
TubeMogul* (A) | 5,200 | 73 | ||||||
Twilio, Cl A* (A) | 2,600 | 88 | ||||||
Twitter* (A) | 121,700 | 2,250 | ||||||
Tyler Technologies* | 6,487 | 966 | ||||||
Ubiquiti Networks* (A) | 5,700 | 319 | ||||||
Ultimate Software Group* | 5,135 | 1,052 | ||||||
Ultra Clean Holdings* | 4,452 | 45 | ||||||
Ultratech* | 5,268 | 121 | ||||||
Unisys* (A) | 7,183 | 107 | ||||||
Universal Display* | 7,708 | 421 | ||||||
USA Technologies* (A) | 7,200 | 31 | ||||||
Vantiv, Cl A* | 29,608 | 1,671 | ||||||
Varonis Systems* | 1,500 | 44 | ||||||
Vasco Data Security International* | 4,254 | 62 | ||||||
Veeco Instruments* | 7,001 | 187 | ||||||
| 19 | SEI Institutional Investments Trust / Semi-Annual Report / November 30, 2016 |
SCHEDULE OF INVESTMENTS (Unaudited)
Extended Market Index Fund (Continued)
November 30, 2016
| Description | Shares | Market Value ($ Thousands) | ||||||
VeriFone Systems* | 24,329 | $ | 411 | |||||
Verint Systems* | 13,450 | 505 | ||||||
Versum Materials* | 19,000 | 465 | ||||||
ViaSat* | 9,356 | 667 | ||||||
Viavi Solutions* | 48,200 | 378 | ||||||
VirnetX Holding* (A) | 4,742 | 15 | ||||||
Virtusa* | 4,649 | 103 | ||||||
Vishay Intertechnology | 25,217 | 382 | ||||||
Vishay Precision Group* | 3,164 | 58 | ||||||
VMware, Cl A* (A) | 16,017 | 1,300 | ||||||
Web.com Group* | 7,239 | 115 | ||||||
WebMD Health, Cl A* | 8,227 | 439 | ||||||
WEX* | 7,676 | 848 | ||||||
Workday, Cl A* | 22,289 | 1,879 | ||||||
Workiva, Cl A* (A) | 6,700 | 100 | ||||||
Xactly* | 7,000 | 99 | ||||||
Xcerra* | 7,941 | 50 | ||||||
XO Group* | 4,415 | 82 | ||||||
Yelp, Cl A* | 13,098 | 487 | ||||||
Zebra Technologies, Cl A* | 10,364 | 819 | ||||||
Zendesk* | 16,300 | 347 | ||||||
Zillow Group, Cl A* (A) | 10,191 | 358 | ||||||
Zillow Group, Cl C* (A) | 18,882 | 678 | ||||||
Zix* | 6,113 | 27 | ||||||
Zynga, Cl A* | 134,874 | 386 | ||||||
|
| |||||||
| 143,859 | ||||||||
|
| |||||||
Materials — 5.5% | ||||||||
A. Schulman | 4,729 | 157 | ||||||
AdvanSix* | 5,900 | 110 | ||||||
AEP Industries | 980 | 116 | ||||||
AK Steel Holding* (A) | 50,900 | 465 | ||||||
Alcoa | 28,400 | 823 | ||||||
Allegheny Technologies (A) | 21,500 | 377 | ||||||
American Vanguard | 3,999 | 73 | ||||||
AptarGroup | 12,266 | 898 | ||||||
Ashland Global Holdings | 12,208 | 1,376 | ||||||
Axalta Coating Systems* | 32,600 | 861 | ||||||
Balchem | 6,188 | 494 | ||||||
Bemis | 17,600 | 881 | ||||||
Berry Plastics Group* | 22,838 | 1,137 | ||||||
Boise Cascade* | 7,270 | 166 | ||||||
Cabot | 11,932 | 608 | ||||||
Calgon Carbon | 8,218 | 145 | ||||||
Carpenter Technology | 8,701 | 311 | ||||||
Celanese, Cl A | 28,292 | 2,244 | ||||||
Century Aluminum* | 6,659 | �� | 61 | |||||
Chase | 1,300 | 105 | ||||||
Chemours | 35,900 | 887 | ||||||
Chemtura* | 11,929 | 393 | ||||||
Clearwater Paper* | 2,951 | 184 | ||||||
Cliffs Natural Resources* (A) | 41,500 | 366 | ||||||
| Description | Shares | Market Value ($ Thousands) | ||||||
Coeur Mining* | 29,861 | $ | 288 | |||||
Commercial Metals | 22,941 | 505 | ||||||
Compass Minerals International (A) | 7,240 | 561 | ||||||
Crown Holdings* | 26,435 | 1,438 | ||||||
Deltic Timber | 2,396 | 167 | ||||||
Domtar | 12,350 | 485 | ||||||
Eagle Materials | 9,083 | 883 | ||||||
Ferro* | 19,505 | 289 | ||||||
Ferroglobe* | 11,102 | 1 | ||||||
Ferroglobe PLC | 11,102 | 127 | ||||||
Flotek Industries* (A) | 10,196 | 137 | ||||||
FutureFuel | 3,876 | 53 | ||||||
GCP Applied Technologies* | 14,624 | 409 | ||||||
Glatfelter | 7,871 | 181 | ||||||
Gold Resource (A) | 12,400 | 53 | ||||||
Graphic Packaging Holding | 63,317 | 796 | ||||||
Greif, Cl A | 4,519 | 232 | ||||||
Greif, Cl B | 1,700 | 114 | ||||||
H.B. Fuller | 9,733 | 457 | ||||||
Handy & Harman* | 800 | 18 | ||||||
Hawkins | 1,773 | 86 | ||||||
Haynes International | 2,823 | 123 | ||||||
Headwaters* | 14,120 | 335 | ||||||
Hecla Mining | 72,156 | 439 | ||||||
Huntsman | 38,624 | 752 | ||||||
Ingevity* | 7,900 | 414 | ||||||
Innophos Holdings | 4,189 | 228 | ||||||
Innospec | 4,513 | 297 | ||||||
Kaiser Aluminum | 3,154 | 260 | ||||||
KapStone Paper and Packaging | 17,642 | 360 | ||||||
KMG Chemicals | 2,509 | 85 | ||||||
Koppers Holdings* | 4,773 | 183 | ||||||
Kraton Performance Polymers* | 4,880 | 150 | ||||||
Kronos Worldwide (A) | 3,484 | 43 | ||||||
Louisiana-Pacific* | 25,842 | 500 | ||||||
LSB Industries* (A) | 2,939 | 23 | ||||||
Materion | 3,474 | 133 | ||||||
Minerals Technologies | 7,024 | 569 | ||||||
Multi Packaging Solutions International* | 4,800 | 67 | ||||||
Myers Industries | 3,418 | 48 | ||||||
Neenah Paper | 3,093 | 263 | ||||||
NewMarket | 1,397 | 585 | ||||||
Olin | 30,516 | 793 | ||||||
Olympic Steel | 1,927 | 47 | ||||||
OMNOVA Solutions* | 7,567 | 73 | ||||||
Packaging Corp of America | 17,749 | 1,504 | ||||||
Platform Specialty Products* (A) | 40,500 | 379 | ||||||
PolyOne | 16,832 | 555 | ||||||
Quaker Chemical | 2,734 | 348 | ||||||
Rayonier Advanced Materials (A) | 9,817 | 136 | ||||||
Real Industry* | 7,000 | 41 | ||||||
Reliance Steel & Aluminum | 13,738 | 1,114 | ||||||
| 20 | SEI Institutional Investments Trust / Semi-Annual Report / November 30, 2016 |
SCHEDULE OF INVESTMENTS (Unaudited)
Extended Market Index Fund (Continued)
November 30, 2016
| Description | Shares | Market Value ($ Thousands) | ||||||
Royal Gold | 12,902 | $ | 899 | |||||
RPM International | 25,588 | 1,354 | ||||||
Ryerson Holding* | 1,400 | 20 | ||||||
Schnitzer Steel Industries, Cl A | 6,156 | 172 | ||||||
Schweitzer-Mauduit International | 6,138 | 258 | ||||||
Scotts Miracle-Gro, Cl A | 8,759 | 799 | ||||||
Sensient Technologies | 8,635 | 674 | ||||||
Silgan Holdings | 8,130 | 403 | ||||||
Sonoco Products | 19,621 | 1,062 | ||||||
Southern Copper (A) | 18,129 | 595 | ||||||
Steel Dynamics | 46,237 | 1,640 | ||||||
Stepan | 3,825 | 310 | ||||||
Stillwater Mining* | 24,580 | 369 | ||||||
Summit Materials, Cl A* | 14,058 | 334 | ||||||
SunCoke Energy | 14,846 | 170 | ||||||
Tahoe Resources | 59,788 | 573 | ||||||
TerraVia Holdings* (A) | 7,830 | 11 | ||||||
TimkenSteel* | 7,904 | 125 | ||||||
Trecora Resources* | 2,517 | 30 | ||||||
Tredegar | 5,341 | 119 | ||||||
Trinseo | 5,400 | 316 | ||||||
Tronox, Cl A | 10,100 | 115 | ||||||
UFP Technologies* | 1,800 | 45 | ||||||
United States Steel | 29,700 | 961 | ||||||
US Concrete* (A) | 3,000 | 171 | ||||||
Valspar | 14,926 | 1,524 | ||||||
Westlake Chemical | 7,810 | 462 | ||||||
Worthington Industries | 9,102 | 512 | ||||||
WR Grace | 13,924 | 909 | ||||||
|
| |||||||
| 46,297 | ||||||||
|
| |||||||
Real Estate — 8.6% | ||||||||
Acadia Realty Trust‡ | 15,339 | 507 | ||||||
Agree Realty‡ | 4,747 | 213 | ||||||
Alexander & Baldwin | 8,877 | 391 | ||||||
Alexander’s‡ | 488 | 209 | ||||||
Alexandria Real Estate Equities‡ | 14,661 | 1,607 | ||||||
Altisource Portfolio Solutions* (A) | 1,700 | 46 | ||||||
American Assets Trust‡ | 7,991 | 320 | ||||||
American Campus Communities‡ | 25,662 | 1,209 | ||||||
American Homes 4 Rent, Cl A‡ | 33,200 | 699 | ||||||
Apple Hospitality‡ (A) | 33,000 | 608 | ||||||
Armada Hoffler Properties‡ | 7,500 | 105 | ||||||
Ashford Hospitality Prime‡ | 4,381 | 56 | ||||||
Ashford Hospitality Trust‡ | 14,971 | 105 | ||||||
AV Homes* | 3,707 | 59 | ||||||
Bluerock Residential Growth, Cl A‡ (A) | 5,800 | 73 | ||||||
Brandywine Realty Trust‡ | 34,639 | 532 | ||||||
Brixmor Property Group‡ | 35,700 | 869 | ||||||
Camden Property Trust‡ | 16,138 | 1,270 | ||||||
Care Capital Properties‡ | 15,800 | 380 | ||||||
CareTrust‡ | 10,653 | 151 | ||||||
| Description | Shares | Market Value ($ Thousands) | ||||||
CatchMark Timber Trust, Cl A‡ | 7,800 | $ | 85 | |||||
CBL & Associates Properties‡ | 33,182 | 394 | ||||||
Cedar Realty Trust‡ | 18,338 | 118 | ||||||
Chatham Lodging Trust‡ | 7,735 | 148 | ||||||
Chesapeake Lodging Trust‡ | 12,367 | 293 | ||||||
City Office | 4,700 | 59 | ||||||
Colony Starwood Homes‡ | 12,076 | 369 | ||||||
Columbia Property Trust‡ | 24,100 | 508 | ||||||
Communications Sales & Leasing‡ | 24,360 | 607 | ||||||
Community Healthcare Trust | 3,900 | 85 | ||||||
CoreCivic‡ | 21,702 | 493 | ||||||
CorEnergy Infrastructure Trust‡ | 2,140 | 70 | ||||||
CoreSite Realty‡ | 7,173 | 506 | ||||||
Corporate Office Properties Trust‡ | 18,330 | 525 | ||||||
Cousins Properties‡ | 64,473 | 510 | ||||||
CubeSmart‡ | 35,122 | 866 | ||||||
CyrusOne‡ | 15,029 | 641 | ||||||
DCT Industrial Trust‡ | 17,871 | 821 | ||||||
DDR‡ | 57,414 | 874 | ||||||
DiamondRock Hospitality‡ | 38,907 | 412 | ||||||
Douglas Emmett‡ | 27,685 | 1,016 | ||||||
Duke Realty‡ | 65,995 | 1,678 | ||||||
DuPont Fabros Technology‡ | 14,821 | 603 | ||||||
Easterly Government Properties‡ | 6,100 | 118 | ||||||
Education Realty Trust‡ | 14,057 | 571 | ||||||
Empire State Realty Trust, Cl A‡ | 23,000 | 464 | ||||||
EPR Properties‡ | 11,751 | 817 | ||||||
Equity Commonwealth*‡ | 23,644 | 688 | ||||||
Equity LifeStyle Properties‡ | 14,332 | 995 | ||||||
Equity One‡ | 18,385 | 549 | ||||||
FelCor Lodging Trust‡ | 25,463 | 185 | ||||||
First Industrial Realty Trust‡ | 23,053 | 610 | ||||||
First Potomac Realty Trust‡ | 14,422 | 142 | ||||||
Forest City Realty Trust, Cl A‡ | 45,145 | 835 | ||||||
Forestar Group* | 4,832 | 65 | ||||||
Four Corners Property Trust‡ | 12,719 | 244 | ||||||
Franklin Street Properties‡ | 24,196 | 304 | ||||||
Gaming and Leisure Properties‡ | 36,815 | 1,123 | ||||||
GEO Group‡ | 15,190 | 505 | ||||||
Getty Realty‡ | 6,289 | 151 | ||||||
Global Net Lease (A) | 32,200 | 245 | ||||||
Government Properties Income Trust‡ | 12,966 | 244 | ||||||
Gramercy Property Trust‡ | 77,473 | 677 | ||||||
Healthcare Realty Trust‡ | 22,555 | 663 | ||||||
Healthcare Trust of America, Cl A‡ | 28,350 | 802 | ||||||
Hersha Hospitality Trust, Cl A‡ | 9,019 | 182 | ||||||
Highwoods Properties‡ | 17,868 | 859 | ||||||
Hospitality Properties Trust‡ | 29,941 | 868 | ||||||
Howard Hughes* | 7,017 | 799 | ||||||
Hudson Pacific Properties‡ | 19,770 | 689 | ||||||
Independence Realty Trust‡ | 9,700 | 83 | ||||||
InfraREIT‡ | 8,200 | 141 | ||||||
| 21 | SEI Institutional Investments Trust / Semi-Annual Report / November 30, 2016 |
SCHEDULE OF INVESTMENTS (Unaudited)
Extended Market Index Fund (Continued)
November 30, 2016
| Description | Shares | Market Value ($ Thousands) | ||||||
Jones Lang LaSalle | 8,359 | $ | 847 | |||||
Kennedy-Wilson Holdings | 18,229 | 389 | ||||||
Kilroy Realty‡ | 17,143 | 1,240 | ||||||
Lamar Advertising, Cl A‡ | 15,397 | 1,021 | ||||||
LaSalle Hotel Properties‡ | 21,442 | 602 | ||||||
Lexington Realty Trust‡ | 43,190 | 446 | ||||||
Liberty Property Trust‡ | 27,475 | 1,082 | ||||||
Life Storage‡ | 9,093 | 739 | ||||||
LTC Properties‡ | 7,317 | 333 | ||||||
Mack-Cali Realty‡ | 17,467 | 472 | ||||||
Medical Properties Trust‡ | 61,362 | 731 | ||||||
Mid-America Apartment Communities‡ | 15,553 | 1,425 | ||||||
Monmouth Real Estate Investment, Cl A‡ | 13,346 | 187 | ||||||
Monogram Residential Trust‡ | 32,700 | 344 | ||||||
National Health Investors‡ | 7,264 | 514 | ||||||
National Retail Properties‡ | 28,043 | 1,197 | ||||||
National Storage Affiliates Trust‡ | 9,000 | 185 | ||||||
NexPoint Residential Trust‡ | 5,600 | 110 | ||||||
NorthStar Realty Finance‡ | 35,029 | 530 | ||||||
Omega Healthcare Investors‡ | 36,247 | 1,068 | ||||||
Outfront Media‡ | 26,409 | 666 | ||||||
Paramount Group‡ | 34,400 | 541 | ||||||
Parkway* | 8,059 | 158 | ||||||
Pebblebrook Hotel Trust‡ | 13,903 | 400 | ||||||
Physicians Realty Trust‡ | 26,200 | 475 | ||||||
Piedmont Office Realty Trust, Cl A‡ | 30,866 | 606 | ||||||
Post Properties‡ | 10,511 | 683 | ||||||
Potlatch‡ | 8,120 | 333 | ||||||
PS Business Parks‡ | 3,928 | 439 | ||||||
QTS Realty Trust, Cl A‡ | 9,400 | 440 | ||||||
Quality Care Properties*‡ | 18,100 | 271 | ||||||
RAIT Financial Trust‡ | 13,021 | 40 | ||||||
Rayonier‡ | 23,853 | 632 | ||||||
RE, Cl A | 3,200 | 157 | ||||||
Realogy Holdings | 28,802 | 696 | ||||||
Regency Centers‡ | 19,567 | 1,308 | ||||||
Retail Opportunity Investments‡ | 23,359 | 482 | ||||||
Retail Properties of America, Cl A‡ | 47,203 | 720 | ||||||
Rexford Industrial Realty‡ | 13,700 | 303 | ||||||
RLJ Lodging Trust‡ | 23,137 | 527 | ||||||
RMR Group | 1,170 | 49 | ||||||
Ryman Hospitality Properties‡ | 8,360 | 492 | ||||||
Sabra Health Care‡ | 11,662 | 258 | ||||||
Saul Centers‡ | 1,444 | 92 | ||||||
Select Income‡ | 11,421 | 279 | ||||||
Senior Housing Properties Trust‡ | 46,507 | 840 | ||||||
Seritage Growth Properties‡ (A) | 4,700 | 224 | ||||||
Silver Bay Realty Trust‡ | 8,946 | 156 | ||||||
Spirit Realty Capital‡ | 94,366 | 1,018 | ||||||
STORE Capital‡ | 29,900 | 739 | ||||||
Stratus Properties* | 1,900 | 56 | ||||||
Summit Hotel Properties‡ | 17,029 | 242 | ||||||
| Description | Shares | Market Value ($ Thousands) | ||||||
Sun Communities‡ | 11,621 | $ | 839 | |||||
Sunstone Hotel Investors‡ | 39,338 | 572 | ||||||
Tanger Factory Outlet Centers‡ | 19,849 | 684 | ||||||
Taubman Centers‡ | 10,887 | 791 | ||||||
Tier REIT | 9,500 | 153 | ||||||
Trinity Place Holdings* | 5,200 | 52 | ||||||
Urban Edge Properties‡ | 19,400 | 526 | ||||||
Urstadt Biddle Properties, Cl A‡ | 6,156 | 139 | ||||||
VEREIT‡ | 184,400 | 1,529 | ||||||
Washington Prime Group | 37,502 | 376 | ||||||
Washington Real Estate Investment Trust‡ | 15,913 | 494 | ||||||
Weingarten Realty Investors‡ | 23,068 | 819 | ||||||
Whitestone, Cl B‡ | 7,077 | 95 | ||||||
WP Carey‡ | 20,400 | 1,186 | ||||||
Xenia Hotels & Resorts‡ | 23,100 | 404 | ||||||
|
| |||||||
| 72,151 | ||||||||
|
| |||||||
Telecommunication Services — 1.3% | ||||||||
ATN International | 2,267 | 164 | ||||||
Boingo Wireless* | 10,700 | 131 | ||||||
Cincinnati Bell* | 9,337 | 192 | ||||||
Cogent Communications Holdings | 8,304 | 311 | ||||||
Consolidated Communications Holdings | 10,276 | 294 | ||||||
FairPoint Communications* | 4,570 | 76 | ||||||
General Communication, Cl A* | 8,003 | 135 | ||||||
Globalstar* (A) | 73,600 | 58 | ||||||
Hawaiian Telcom Holdco* | 905 | 21 | ||||||
IDT, Cl B | 3,103 | 66 | ||||||
Inteliquent | 7,353 | 167 | ||||||
Intelsat* | 5,200 | 21 | ||||||
Iridium Communications* (A) | 15,446 | 136 | ||||||
Lumos Networks* | 2,271 | 33 | ||||||
NII Holdings* | 17,300 | 29 | ||||||
ORBCOMM* | 12,086 | 102 | ||||||
pdvWireless* (A) | 2,000 | 47 | ||||||
SBA Communications, Cl A* | 23,919 | 2,367 | ||||||
Shenandoah Telecommunications | 9,304 | 261 | ||||||
Spok Holdings | 4,132 | 75 | ||||||
Sprint* (A) | 142,890 | 1,120 | ||||||
Straight Path Communications* (A) | 2,700 | 65 | ||||||
Telephone & Data Systems | 20,555 | 554 | ||||||
T-Mobile US* | 55,105 | 2,987 | ||||||
US Cellular* | 2,952 | 111 | ||||||
Vonage Holdings* | 39,520 | 260 | ||||||
Windstream Holdings (A) | 19,983 | 148 | ||||||
Zayo Group Holdings* | 30,700 | 1,059 | ||||||
|
| |||||||
| 10,990 | ||||||||
|
| |||||||
Utilities — 3.0% | ||||||||
ALLETE | 8,970 | 555 | ||||||
American States Water | 6,574 | 279 | ||||||
Aqua America | 35,037 | 1,042 | ||||||
| 22 | SEI Institutional Investments Trust / Semi-Annual Report / November 30, 2016 |
SCHEDULE OF INVESTMENTS (Unaudited)
Extended Market Index Fund (Continued)
November 30, 2016
| Description | Shares | Market Value ($ Thousands) | ||||||
Artesian Resources, Cl A | 2,184 | $ | 69 | |||||
Atlantic Power | 12,421 | 33 | ||||||
Atlantica Yield (A) | 12,500 | 227 | ||||||
Atmos Energy | 19,182 | 1,364 | ||||||
Avangrid | 10,950 | 396 | ||||||
Avista | 13,552 | 548 | ||||||
Black Hills | 10,902 | 640 | ||||||
California Water Service Group | 9,641 | 333 | ||||||
Calpine* | 66,272 | 739 | ||||||
Chesapeake Utilities | 2,915 | 189 | ||||||
Connecticut Water Service | 1,906 | 104 | ||||||
Consolidated Water | 3,000 | 33 | ||||||
Delta Natural Gas | 1,400 | 36 | ||||||
Dynegy, Cl A* | 21,400 | 185 | ||||||
El Paso Electric | 8,036 | 362 | ||||||
Empire District Electric | 8,156 | 278 | ||||||
Great Plains Energy | 40,523 | 1,069 | ||||||
Hawaiian Electric Industries | 19,658 | 605 | ||||||
IDACORP | 10,024 | 763 | ||||||
MDU Resources Group | 36,432 | 1,014 | ||||||
MGE Energy | 6,814 | 403 | ||||||
Middlesex Water | 2,701 | 110 | ||||||
National Fuel Gas | 14,688 | 828 | ||||||
New Jersey Resources | 17,194 | 592 | ||||||
Northwest Natural Gas | 4,976 | 285 | ||||||
NorthWestern | 10,346 | 580 | ||||||
NRG Yield, Cl A | 7,000 | 102 | ||||||
NRG Yield, Cl C | 12,100 | 186 | ||||||
OGE Energy | 39,176 | 1,240 | ||||||
ONE Gas | 10,100 | 606 | ||||||
Ormat Technologies | 8,534 | 408 | ||||||
Otter Tail | 7,746 | 297 | ||||||
Pattern Energy Group, Cl A | 13,100 | 257 | ||||||
PNM Resources | 15,017 | 475 | ||||||
Portland General Electric | 17,700 | 736 | ||||||
SJW | 3,664 | 197 | ||||||
South Jersey Industries | 15,496 | 511 | ||||||
Southwest Gas | 9,941 | 737 | ||||||
Spire | 8,903 | 575 | ||||||
Talen Energy* | 17,400 | 243 | ||||||
TerraForm Global, Cl A (A) | 21,900 | 83 | ||||||
TerraForm Power, Cl A* (A) | 19,600 | 248 | ||||||
UGI | 32,696 | 1,465 | ||||||
Unitil | 3,058 | 130 | ||||||
Vectren | 16,543 | 812 | ||||||
Vivint Solar* (A) | 4,900 | 14 | ||||||
Westar Energy, Cl A | 26,970 | 1,536 | ||||||
WGL Holdings | 9,261 | 672 | ||||||
| Description | Shares | Market Value ($ Thousands) | ||||||
York Water | 3,752 | $ | 137 | |||||
|
| |||||||
| 25,328 | ||||||||
|
| |||||||
Total Common Stock |
| 814,487 | ||||||
|
| |||||||
| Number of Rights | ||||||||
RIGHTS — 0.0% | ||||||||
Central European Media Enterprises‡‡ | 112 | — | ||||||
|
| |||||||
Tobira Therapeutics‡‡ | 2,300 | — | ||||||
|
| |||||||
Trius Contingent Value‡‡ | 2,885 | — | ||||||
|
| |||||||
overstock.com‡‡ | 70 | — | ||||||
|
| |||||||
Durata Therapeutics‡‡ | 800 | — | ||||||
|
| |||||||
Chelsea Therapeutics International‡‡ | 4,000 | — | ||||||
|
| |||||||
Leap Wireless‡‡ | 7,532 | — | ||||||
|
| |||||||
Dyax, Expires 12/31/2019 | 22,882 | — | ||||||
|
| |||||||
Total Rights | — | |||||||
|
| |||||||
| Face Amount (Thousands) | ||||||||
U.S. TREASURY OBLIGATIONS — 0.1% |
| |||||||
U.S. Treasury Bills | ||||||||
0.420%, 03/02/2017 (B) | $ | 620 | 619 | |||||
0.326%, 12/08/2016 (B) | 675 | 675 | ||||||
|
| |||||||
Total U.S. Treasury Obligations |
| 1,294 | ||||||
|
| |||||||
| Shares | ||||||||
AFFILIATED PARTNERSHIP — 6.8% |
| |||||||
SEI Liquidity Fund, L.P. | ||||||||
0.470%**† (C) | 57,202,268 | 57,203 | ||||||
|
| |||||||
Total Affiliated Partnership |
| 57,203 | ||||||
|
| |||||||
| 23 | SEI Institutional Investments Trust / Semi-Annual Report / November 30, 2016 |
SCHEDULE OF INVESTMENTS (Unaudited)
Extended Market Index Fund (Concluded)
November 30, 2016
| Description | Shares | Market Value ($ Thousands) | ||||||
CASH EQUIVALENT — 2.8% |
| |||||||
SEI Daily Income Trust, Government Fund, Cl A | ||||||||
0.210%**† | 23,376,930 | $ | 23,377 | |||||
|
| |||||||
Total Cash Equivalent |
| 23,377 | ||||||
|
| |||||||
Total Investments — 107.0% |
| $ | 896,361 | |||||
|
| |||||||
A list of the open futures contracts held by the Fund at November 30, 2016, is as follows:
| Type of Contract | Number of Contracts Long | Expiration Date | Unrealized Appreciation ($ Thousands) | |||||||||
Russell 2000 Index E-MINI | 66 | Dec-2016 | $ | 740 | ||||||||
S&P Mid Cap 400 Index E-MINI | 72 | Dec-2016 | 614 | |||||||||
|
| |||||||||||
| $ | 1,354 | |||||||||||
|
| |||||||||||
For the period ended November 30, 2016, the total amount of all open futures contracts, as presented in the table above, are representative of the volume of activity for the derivative type during the year.
Percentages are based on Net Assets of $837,403 ($ Thousands).
| * | Non-income producing security. |
| ** | Rate shown is the 7-day effective yield as of November 30, 2016. |
| † | Investment in Affiliated Security (see Note 5). |
| ‡ | Real Estate Investment Trust. |
| ‡‡ | Expiration date unavailable. |
| (A) | This security or a partial position of this security is on loan at November 30, 2016 (see Note 12). The total market value of securities on loan at November 30, 2016 was $56,542 ($ Thousands). |
| (B) | The rate reported is the effective yield at the time of purchase. |
| (C) | This security was purchased with cash collateral held from securities on loan (see Note 12). The total market value of such securities as of November 30, 2016 was $57,203 ($ Thousands). |
AID — Agency for International Development
Cl — Class
LLC — Limited Liability Company
MSCI — Morgan Stanley Capital International
MYR — Malaysian Ringgit
PLC — Public Limited Company
REIT — Real Estate Investment Trust
S&P — Standard & Poor’s
Ser — Series
SPX — Standard & Poor’s 500 Index
The following is a list of the level of inputs used as of November 30, 2016, in valuing the Fund’s investments and other financial instruments carried a value ($ Thousands):
| Investments in Securities | Level 1 | Level 2 | Level 3 | Total | ||||||||||||
Common Stock | $ | 814,487 | $ | — | $ | — | $ | 814,487 | ||||||||
Rights | — | — | — | — | ||||||||||||
U.S. Treasury Obligations | — | 1,294 | — | 1,294 | ||||||||||||
Affiliated Partnership | — | 57,203 | — | 57,203 | ||||||||||||
Cash Equivalent | 23,377 | — | — | 23,377 | ||||||||||||
|
|
|
|
|
|
|
| |||||||||
Total Investments in Securities | $ | 837,864 | $ | 58,497 | $ | — | $ | 896,361 | ||||||||
|
|
|
|
|
|
|
| |||||||||
| Other Financial Instruments | Level 1 | Level 2 | Level 3 | Total | ||||||||||||
Futures Contracts* | ||||||||||||||||
Unrealized Appreciation | $ | 1,354 | $ | — | $ | — | $ | 1,354 | ||||||||
|
|
|
|
|
|
|
| |||||||||
Total Other Financial Instruments | $ | 1,354 | $ | — | $ | — | $ | 1,354 | ||||||||
|
|
|
|
|
|
|
| |||||||||
| * | Futures contracts are value at the unrealized appreciation on the instrument. |
For the period ended November 30, 2016, there were no transfers between Level 1 and Level 2 assets and liabilities.
For the period ended November 30, 2016, there were no transfers between Level 2 and Level 3 assets and liabilities.
For more information on valuation inputs, see Note 2 — Significant Accounting Policies in Notes to Financial Statements.
Amounts designated as “—” are $0 or have been rounded to $0.
The accompanying notes are an integral part of the financial statements.
| 24 | SEI Institutional Investments Trust / Semi-Annual Report / November 30, 2016 |
SCHEDULE OF INVESTMENTS (Unaudited)
Small Cap Fund
November 30, 2016
| Description | Shares | Market Value ($ Thousands) | ||||||
COMMON STOCK — 95.8% | ||||||||
Consumer Discretionary — 10.2% | ||||||||
1-800-Flowers.com, Cl A* | 2,417 | $ | 26 | |||||
2U* (A) | 6,473 | 214 | ||||||
Aaron’s | 17,600 | 513 | ||||||
Abercrombie & Fitch, Cl A | 1,559 | 22 | ||||||
American Axle & Manufacturing Holdings* | 23,227 | 364 | ||||||
American Eagle Outfitters (A) | 15,115 | 250 | ||||||
American Public Education* | 26,961 | 623 | ||||||
America’s Car-Mart* | 5,889 | 268 | ||||||
Bassett Furniture Industries | 6,389 | 186 | ||||||
Beazer Homes USA* | 30,856 | 416 | ||||||
Big 5 Sporting Goods | 24,277 | 470 | ||||||
Big Lots (A) | 11,099 | 562 | ||||||
Biglari Holdings* | 91 | 43 | ||||||
BJ’s Restaurants* | 961 | 36 | ||||||
Bloomin’ Brands | 23,191 | 431 | ||||||
Bojangles’* | 15,798 | 283 | ||||||
Bright Horizons Family Solutions* | 19,832 | 1,365 | ||||||
Brinker International (A) | 13,900 | 738 | ||||||
Buffalo Wild Wings* | 43 | 7 | ||||||
Cabela’s* | 1,281 | 80 | ||||||
CalAtlantic Group | 7,400 | 247 | ||||||
Callaway Golf | 49,349 | 600 | ||||||
Capella Education | 7,490 | 654 | ||||||
Career Education* | 1,867 | 19 | ||||||
Carriage Services, Cl A | 37,740 | 1,024 | ||||||
Carrols Restaurant Group* | 593 | 8 | ||||||
Cavco Industries* | 4,295 | 406 | ||||||
Century Communities* | 48,700 | 1,011 | ||||||
Children’s Place | 6,636 | 689 | ||||||
Churchill Downs | 3,295 | 504 | ||||||
Citi Trends | 1,963 | 34 | ||||||
Cooper Tire & Rubber | 12,609 | 483 | ||||||
Cooper-Standard Holdings* | 11,018 | 1,050 | ||||||
Core-Mark Holding | 61,049 | 2,229 | ||||||
Crocs* | 43,700 | 306 | ||||||
CSS Industries | 10,800 | 294 | ||||||
CST Brands | 2,587 | 124 | ||||||
Dana Holdings | 72,513 | 1,225 | ||||||
Dave & Buster’s Entertainment* | 19,085 | 894 | ||||||
Deckers Outdoor* | 5,000 | 297 | ||||||
Del Frisco’s Restaurant Group* | 4,795 | 82 | ||||||
Del Taco Restaurants* | 64,190 | 932 | ||||||
Destination XL Group* | 24,600 | 101 | ||||||
Dick’s Sporting Goods | 3,934 | 232 | ||||||
DineEquity | 222 | 19 | ||||||
Drew Industries | 2,925 | 307 | ||||||
Duluth Holdings, Cl B* (A) | 7,774 | 261 | ||||||
Eastman Kodak* | 1,370 | 21 | ||||||
Eldorado Resorts* | 4,264 | 59 | ||||||
Entravision Communications, Cl A | 8,785 | 58 | ||||||
Ethan Allen Interiors | 26,084 | 900 | ||||||
| Description | Shares | Market Value ($ Thousands) | ||||||
Express* | 24,296 | $ | 325 | |||||
Fiesta Restaurant Group* | 111,671 | 3,199 | ||||||
Finish Line, Cl A | 20,700 | 465 | ||||||
Flexsteel Industries | 155 | 9 | ||||||
Francesca’s Holdings* | 1,370 | 22 | ||||||
Gannett | 28,028 | 267 | ||||||
Genesco* | 6,965 | 440 | ||||||
Grand Canyon Education* | 5,683 | 324 | ||||||
Group 1 Automotive | 5,300 | 385 | ||||||
Harman International Industries | 1,117 | 122 | ||||||
Haverty Furniture | 22,800 | 492 | ||||||
Helen of Troy* | 5,821 | 495 | ||||||
Horizon Global* | 14,633 | 337 | ||||||
Hovnanian Enterprises, Cl A* | 3,266 | 6 | ||||||
ILG | 25,700 | 464 | ||||||
IMAX* (A) | 12,475 | 399 | ||||||
International Game Technology | 9,415 | 243 | ||||||
Intrawest Resorts Holdings* | 798 | 14 | ||||||
iRobot* | 5,322 | 303 | ||||||
Isle of Capri Casinos* | 454 | 10 | ||||||
J Alexander’s Holdings* | 243 | 2 | ||||||
Jack in the Box | 28,296 | 2,943 | ||||||
John Wiley & Sons, Cl A | 5,840 | 320 | ||||||
K12* | 16,025 | 235 | ||||||
Kirkland’s* | 1,898 | 28 | ||||||
La Quinta Holdings* | 3,001 | 36 | ||||||
La-Z-Boy | 8,594 | 230 | ||||||
Lear | 1,415 | 183 | ||||||
Libbey | 125,475 | 2,400 | ||||||
Loral Space & Communications* | 325 | 13 | ||||||
Lumber Liquidators Holdings* (A) | 56,400 | 995 | ||||||
Marcus | 260 | 8 | ||||||
MarineMax* | 14,750 | 277 | ||||||
Marriott Vacations Worldwide | 3,691 | 287 | ||||||
MDC Partners, Cl A | 356,408 | 2,210 | ||||||
Media General* | 1,155 | 21 | ||||||
Meredith | 9,540 | 530 | ||||||
Meritage Homes* | 8,100 | 292 | ||||||
Modine Manufacturing* | 25,309 | 297 | ||||||
Monro Muffler Brake | 24,979 | 1,494 | ||||||
Movado Group | 2,022 | 57 | ||||||
Murphy USA* | 9,801 | 668 | ||||||
NACCO Industries, Cl A | 3,452 | 328 | ||||||
Nautilus* | 7,740 | 133 | ||||||
New Media Investment | 28,879 | 444 | ||||||
New York Times, Cl A | 10,125 | 132 | ||||||
Nexstar Broadcasting Group, Cl A | 5,122 | 306 | ||||||
Nutrisystem | 8,124 | 299 | ||||||
Office Depot | 20,989 | 102 | ||||||
Papa John’s International | 3,578 | 316 | ||||||
Perry Ellis International* | 2,294 | 59 | ||||||
Planet Fitness, Cl A (A) | 42,300 | 857 | ||||||
| 1 | SEI Institutional Investments Trust / Semi-Annual Report / November 30, 2016 |
SCHEDULE OF INVESTMENTS (Unaudited)
Small Cap Fund (Continued)
November 30, 2016
| Description | Shares | Market Value ($ Thousands) | ||||||
Rent-A-Center, Cl A | 15,700 | $ | 181 | |||||
Ruby Tuesday* | 4,980 | 15 | ||||||
Ruth’s Hospitality Group | 5,051 | 86 | ||||||
Sequential Brands Group* (A) | 87,500 | 448 | ||||||
Shoe Carnival | 29,900 | 781 | ||||||
Sinclair Broadcast Group, Cl A | 938 | 31 | ||||||
Smith & Wesson Holding* (A) | 12,537 | 292 | ||||||
Sonic Automotive, Cl A | 16,000 | 338 | ||||||
Spartan Motors | 40,459 | 362 | ||||||
Stage Stores (A) | 15,900 | 69 | ||||||
Stoneridge* | 17,715 | 281 | ||||||
Strayer Education* | 604 | 44 | ||||||
Superior Industries International | 707 | 18 | ||||||
Tenneco* | 143 | 8 | ||||||
Thor Industries | 3,242 | 326 | ||||||
Tower International | 27,051 | 709 | ||||||
Universal Electronics* | 6,785 | 457 | ||||||
Vail Resorts | 3,211 | 509 | ||||||
Visteon | 3,597 | 283 | ||||||
William Lyon Homes, Cl A* | 75,265 | 1,490 | ||||||
Wingstop | 10,004 | 307 | ||||||
Wolverine World Wide | 21,880 | 493 | ||||||
ZAGG* | 40,487 | 267 | ||||||
|
| |||||||
| 54,585 | ||||||||
|
| |||||||
Consumer Staples — 3.4% | ||||||||
Boston Beer, Cl A* (A) | 335 | 58 | ||||||
Central Garden & Pet* | 29,467 | 851 | ||||||
Central Garden and Pet, Cl A* | 4,699 | 129 | ||||||
Darling Ingredients* | 48,414 | 654 | ||||||
Dean Foods | 1,001 | 20 | ||||||
Edgewell Personal Care* | 2,240 | 177 | ||||||
Energizer Holdings | 1,896 | 85 | ||||||
Fresh Del Monte Produce | 20,011 | 1,241 | ||||||
Freshpet* (A) | 32,200 | 298 | ||||||
Hostess Brands* | 23,812 | 308 | ||||||
HRG Group* | 756 | 12 | ||||||
Ingles Markets, Cl A | 7,500 | 344 | ||||||
Ingredion | 998 | 117 | ||||||
Inventure Foods* | 114,299 | 1,033 | ||||||
J&J Snack Foods | 5,518 | 670 | ||||||
John B Sanfilippo & Son | 7,788 | 496 | ||||||
Lancaster Colony | 515 | 70 | ||||||
Landec* | 46,900 | 671 | ||||||
Medifast | 1,337 | 52 | ||||||
National Beverage (A) | 1,559 | 79 | ||||||
Nu Skin Enterprises, Cl A | 6,077 | 317 | ||||||
Omega Protein* | 30,419 | 729 | ||||||
Pilgrim’s Pride | 6,626 | 117 | ||||||
Primo Water* | 51,320 | 660 | ||||||
Sanderson Farms (A) | 12,731 | 1,027 | ||||||
Seaboard* | 27 | 110 | ||||||
| Description | Shares | Market Value ($ Thousands) | ||||||
Seneca Foods, Cl A* | 2,800 | $ | 105 | |||||
Snyder’s-Lance | 62,973 | 2,346 | ||||||
SpartanNash | 54,680 | 1,980 | ||||||
Spectrum Brands Holdings | 9,565 | 1,147 | ||||||
SUPERVALU* | 55,290 | 257 | ||||||
United Natural Foods* | 995 | 47 | ||||||
Universal | 11,772 | 648 | ||||||
Vector Group (A) | 1,063 | 23 | ||||||
Village Super Market, Cl A | 8,500 | 293 | ||||||
WD-40 (A) | 5,119 | 552 | ||||||
Weis Markets | 7,854 | 437 | ||||||
|
| |||||||
| 18,160 | ||||||||
|
| |||||||
Energy — 4.0% | ||||||||
Alberta Oilsands* | 536,100 | 48 | ||||||
Approach Resources* (A) | 67,100 | �� | 235 | |||||
Archrock | 36,679 | 493 | ||||||
Ardmore Shipping (A) | 122,900 | 836 | ||||||
Atwood Oceanics | 1,243 | 12 | ||||||
Bill Barrett* (A) | 66,647 | 521 | ||||||
California Resources* | 2,522 | 44 | ||||||
Carrizo Oil & Gas* | 34,282 | 1,451 | ||||||
Contango Oil & Gas* | 25,939 | 257 | ||||||
Dawson Geophysical* | 10,919 | 86 | ||||||
Denbury Resources* | 7,196 | 27 | ||||||
DHT Holdings (A) | 122,725 | 436 | ||||||
Diamondback Energy* | 1,952 | 211 | ||||||
Eclipse Resources* | 188,908 | 557 | ||||||
Energen | 3,791 | 235 | ||||||
Exterran* | 19,278 | 387 | ||||||
FMC Technologies* | 6,267 | 215 | ||||||
Gener8 Maritime* | 11,627 | 47 | ||||||
Gulfport Energy* | 56,980 | 1,464 | ||||||
Helix Energy Solutions Group* | 37,260 | 389 | ||||||
International Seaways* | 6,525 | 99 | ||||||
Jones Energy, Cl A* (A) | 9,417 | 43 | ||||||
Matrix Service* | 35,258 | 735 | ||||||
Murphy Oil | 3,515 | 119 | ||||||
Nabors Industries | 895 | 14 | ||||||
Newfield Exploration* | 1,364 | 62 | ||||||
Newpark Resources* | 57,900 | 426 | ||||||
Oasis Petroleum* | 22,908 | 343 | ||||||
Oceaneering International | 576 | 15 | ||||||
Overseas Shipholding Group, Cl A | 19,576 | 151 | ||||||
Pacific Ethanol* | 49,600 | 427 | ||||||
Parsley Energy, Cl A* | 12,147 | 463 | ||||||
PBF Energy, Cl A (A) | 13,200 | 317 | ||||||
PDC Energy* | 18,788 | 1,399 | ||||||
PHI* | 10,900 | 165 | ||||||
QEP Resources | 6,835 | 134 | ||||||
Range Resources | — | — | ||||||
Renewable Energy Group* | 33,400 | 326 | ||||||
| 2 | SEI Institutional Investments Trust / Semi-Annual Report / November 30, 2016 |
SCHEDULE OF INVESTMENTS (Unaudited)
Small Cap Fund (Continued)
November 30, 2016
| Description | Shares | Market Value ($ Thousands) | ||||||
Resolute Energy* (A) | 8,614 | $ | 289 | |||||
REX American Resources* | 1,389 | 136 | ||||||
Rice Energy* | 26,738 | 651 | ||||||
Ring Energy* | 22,899 | 293 | ||||||
RSP Permian* | 26,725 | 1,193 | ||||||
Scorpio Tankers | 228,400 | 966 | ||||||
SM Energy | 7,878 | 314 | ||||||
Smart Sand* | 31,740 | 434 | ||||||
StealthGas* | 106,900 | 381 | ||||||
Synergy Resources* | 43,800 | 416 | ||||||
TETRA Technologies* | 241,290 | 1,310 | ||||||
US Silica Holdings | 10,901 | 552 | ||||||
VAALCO Energy* | 30,600 | 24 | ||||||
W&T Offshore* | 10,431 | 18 | ||||||
Western Refining | 2,430 | 87 | ||||||
Westmoreland Coal* | 31,211 | 541 | ||||||
Whiting Petroleum* | 27,595 | 337 | ||||||
World Fuel Services | 3,362 | 149 | ||||||
|
| |||||||
| 21,280 | ||||||||
|
| |||||||
Financials — 18.8% | ||||||||
1st Source | 9,024 | 355 | ||||||
AGNC Investment‡ | 12,432 | 232 | ||||||
Allied World Assurance Holdings | 2,347 | 110 | ||||||
Ambac Financial Group* | 2,214 | 54 | ||||||
American Equity Investment Life Holding | 1,900 | 39 | ||||||
American Financial Group | 3,171 | 261 | ||||||
American National Insurance | 266 | 32 | ||||||
AMERISAFE | 1,915 | 122 | ||||||
AmTrust Financial Services | 8,800 | 224 | ||||||
Apollo Commercial Real Estate Finance‡ | 28,900 | 496 | ||||||
Arch Capital Group* | 1,047 | 87 | ||||||
Ares Capital (A) | 1,950 | 31 | ||||||
Argo Group International Holdings | 8,762 | 556 | ||||||
Ashford* | 187 | 8 | ||||||
Aspen Insurance Holdings | 29,648 | 1,511 | ||||||
Associated Banc | 14,000 | 320 | ||||||
Assurant | 877 | 76 | ||||||
Assured Guaranty | 17,670 | 632 | ||||||
Axis Capital Holdings | 8,739 | 533 | ||||||
Banc of California (A) | 26,800 | 405 | ||||||
BancFirst | 2,594 | 213 | ||||||
Banco Latinoamericano de Comercio Exterior | 20,399 | 581 | ||||||
Bancorpsouth | 13,307 | 380 | ||||||
Bank of Hawaii | 3,722 | 310 | ||||||
Bank of the Ozarks | 15,695 | 762 | ||||||
Banner | 11,500 | 600 | ||||||
Beneficial Bancorp | 18,256 | 318 | ||||||
Berkshire Hills Bancorp | 33,305 | 1,131 | ||||||
BlackRock Capital Investment | 33,900 | 251 | ||||||
Blackstone Mortgage Trust, Cl A‡ | 9,500 | 286 | ||||||
BNC Bancorp | 9,684 | 292 | ||||||
| Description | Shares | Market Value ($ Thousands) | ||||||
Boston Private Financial Holdings | 36,349 | $ | 545 | |||||
Brookline Bancorp | 7,971 | 119 | ||||||
Bryn Mawr Bank | 643 | 24 | ||||||
Camden National | 9,060 | 353 | ||||||
Capstead Mortgage‡ | 21,600 | 223 | ||||||
Cascade Bancorp* | 5,312 | 39 | ||||||
Cathay General Bancorp | 609 | 21 | ||||||
CenterState Banks | 7,426 | 167 | ||||||
Central Pacific Financial | 69,200 | 2,045 | ||||||
Chemical Financial | 6,691 | 347 | ||||||
Chimera Investment‡ | 5,781 | 98 | ||||||
City Holding | 1,888 | 116 | ||||||
CNO Financial Group | 95,259 | 1,705 | ||||||
CoBiz Financial | 40,928 | 619 | ||||||
Colony Financial‡ | 4,777 | 98 | ||||||
Commerce Bancshares | 13,989 | 767 | ||||||
Community Trust Bancorp | 11,095 | 469 | ||||||
Cullen/Frost Bankers | 1,399 | 115 | ||||||
Customers Bancorp* | 62,500 | 1,906 | ||||||
CVB Financial | 21,620 | 449 | ||||||
CYS Investments‡ | 38,000 | 306 | ||||||
Dime Community Bancshares | 27,340 | 511 | ||||||
Dynex Capital‡ | 39,900 | 276 | ||||||
Eagle Bancorp* | 21,265 | 1,249 | ||||||
East West Bancorp | 3,451 | 165 | ||||||
Employers Holdings | 6,731 | 238 | ||||||
Endurance Specialty Holdings | 13,271 | 1,224 | ||||||
Enstar Group* | 205 | 40 | ||||||
Enterprise Financial Services | 10,309 | 396 | ||||||
Essent Group* | 1,370 | 42 | ||||||
EverBank Financial | 1,879 | 36 | ||||||
Evercore Partners, Cl A | 18,418 | 1,241 | ||||||
Everest Re Group | 4,886 | 1,029 | ||||||
FBL Financial Group, Cl A | 575 | 44 | ||||||
FBR | 45,900 | 530 | ||||||
Federal Agricultural Mortgage, Cl C | 22,159 | 1,197 | ||||||
Federated National Holding | 5,947 | 103 | ||||||
Fidelity Southern | 43,091 | 961 | ||||||
First American Financial | 14,090 | 532 | ||||||
First BanCorp* | 39,181 | 232 | ||||||
First Busey | 16,021 | 439 | ||||||
First Business Financial Services | 9,400 | 206 | ||||||
First Citizens BancShares, Cl A | 1,009 | 360 | ||||||
First Commonwealth Financial | 23,400 | 295 | ||||||
First Defiance Financial | 8,497 | 393 | ||||||
First Financial | 3,181 | 146 | ||||||
First Financial Bancorp | 4,606 | 123 | ||||||
First Foundation* | 38,700 | 1,084 | ||||||
First Interstate Bancsystem, Cl A | 26,760 | 1,010 | ||||||
First Merchants | 12,724 | 437 | ||||||
First NBC Bank Holding* (A) | 8,283 | 58 | ||||||
FirstCash | 874 | 40 | ||||||
| 3 | SEI Institutional Investments Trust / Semi-Annual Report / November 30, 2016 |
SCHEDULE OF INVESTMENTS (Unaudited)
Small Cap Fund (Continued)
November 30, 2016
| Description | Shares | Market Value ($ Thousands) | ||||||
Flagstar Bancorp* | 28,059 | $ | 791 | |||||
Flushing Financial | 38,628 | 1,011 | ||||||
FNB (Pennsylvania) | 18,900 | 289 | ||||||
FNFV Group* | 30,900 | 396 | ||||||
Franklin Financial Network* | 12,110 | 457 | ||||||
Fulton Financial | 128,257 | 2,277 | ||||||
GAMCO Investors, Cl A | 1,213 | 37 | ||||||
Genworth Financial, Cl A* | 22,978 | 98 | ||||||
Glacier Bancorp | 22,490 | 771 | ||||||
Great Southern Bancorp | 1,045 | 52 | ||||||
Great Western Bancorp | 1,651 | 66 | ||||||
Hancock Holding | 42,374 | 1,761 | ||||||
Hanmi Financial | 36,537 | 1,122 | ||||||
Hanover Insurance Group | 19,153 | 1,658 | ||||||
Heartland Financial USA | 10,183 | 436 | ||||||
Hercules Capital | 20,100 | 275 | ||||||
Heritage Financial | 17,593 | 398 | ||||||
Heritage Insurance Holdings | 22,918 | 331 | ||||||
Home BancShares | 23,855 | 617 | ||||||
HomeStreet* | 13,903 | 404 | ||||||
HomeTrust Bancshares* | 216 | 5 | ||||||
Hope Bancorp | 25,300 | 503 | ||||||
Huntington Bancshares | 25,884 | 323 | ||||||
IBERIABANK | 15,128 | 1,253 | ||||||
Independent Bank | 24,351 | 542 | ||||||
Independent Bank Group | 5,068 | 305 | ||||||
Infinity Property & Casualty | 2,206 | 190 | ||||||
International Bancshares | 17,500 | 681 | ||||||
International FCStone* | 1,601 | 66 | ||||||
Invesco Mortgage Capital‡ | 2,069 | 31 | ||||||
Investors Bancorp | 75,611 | 1,024 | ||||||
Janus Capital Group | 6,553 | 88 | ||||||
Kearny Financial | 42,500 | 644 | ||||||
Kemper | 48,600 | 1,990 | ||||||
KeyCorp | — | — | ||||||
Lakeland Bancorp | 34,954 | 613 | ||||||
Lakeland Financial | 2,721 | 115 | ||||||
Legg Mason | 14,600 | 466 | ||||||
LendingClub* | 6,012 | 34 | ||||||
Maiden Holdings | 95,800 | 1,475 | ||||||
MainSource Financial Group | 23,500 | 718 | ||||||
Mercantile Bank | 13,900 | 456 | ||||||
Meridian Bancorp | 78,700 | 1,397 | ||||||
Meta Financial Group | 3,240 | 295 | ||||||
MFA Financial‡ | 11,125 | 87 | ||||||
MGIC Investment* | 73,903 | 670 | ||||||
Mortgage Investment Trust‡ | 14,400 | 253 | ||||||
National Bank Holdings, Cl A | 86,365 | 2,349 | ||||||
National General Holdings | 22,195 | 501 | ||||||
Navigators Group | 672 | 71 | ||||||
NBT Bancorp | 6,501 | 251 | ||||||
Nelnet, Cl A | 15,700 | 792 | ||||||
| Description | Shares | Market Value ($ Thousands) | ||||||
New Residential Investments‡ | 10,250 | $ | 158 | |||||
New York Mortgage Trust‡ (A) | 57,400 | 383 | ||||||
Northfield Bancorp | 72,200 | 1,338 | ||||||
OceanFirst Financial | 10,300 | 244 | ||||||
OFG Bancorp | 27,625 | 373 | ||||||
Old National Bancorp | 76,100 | 1,298 | ||||||
Old Republic International | 11,867 | 212 | ||||||
OneBeacon Insurance Group, Cl A | 8,362 | 128 | ||||||
Opus Bank | 2,663 | 67 | ||||||
Oritani Financial | 2,078 | 37 | ||||||
Pacific Premier Bancorp* | 872 | 28 | ||||||
PacWest Bancorp | 14,109 | 723 | ||||||
Park National | 2,667 | 298 | ||||||
PennyMac Mortgage Investment Trust‡ | 14,000 | 228 | ||||||
Piper Jaffray* | 7,600 | 554 | ||||||
Popular | 80,967 | 3,291 | ||||||
PRA Group* | 564 | 20 | ||||||
Preferred Bank | 12,546 | 566 | ||||||
Primerica | 4,189 | 296 | ||||||
PrivateBancorp, Cl A | 4,356 | 204 | ||||||
Prosperity Bancshares | 10,675 | 706 | ||||||
Radian Group | 61,956 | 902 | ||||||
Raymond James Financial | 2,608 | 188 | ||||||
Regional Management* | 11,340 | 280 | ||||||
Reinsurance Group of America, Cl A | 1,199 | 146 | ||||||
RenaissanceRe Holdings | 103 | 13 | ||||||
Renasant | 16,435 | 681 | ||||||
Republic Bancorp, Cl A | 10,200 | 378 | ||||||
Safeguard Scientifics* | 21,297 | 250 | ||||||
Sandy Spring Bancorp | 3,179 | 116 | ||||||
Selective Insurance Group | 24,740 | 1,017 | ||||||
Starwood Property Trust‡ | 7,115 | 160 | ||||||
State Bank Financial | 61,400 | 1,516 | ||||||
Sterling Bancorp | 18,045 | 411 | ||||||
Stewart Information Services | 80 | 4 | ||||||
Stock Yards Bancorp | 1,949 | 80 | ||||||
Stonegate Bank | 1,006 | 39 | ||||||
Synovus Financial | 6,030 | 233 | ||||||
TCF Financial | 64,546 | 1,120 | ||||||
Texas Capital Bancshares* | 1,595 | 116 | ||||||
Tompkins Financial | 1,118 | 97 | ||||||
Towne Bank | 3,392 | 109 | ||||||
TriCo Bancshares | 16,530 | 517 | ||||||
TrustCo Bank | 6,295 | 51 | ||||||
Trustmark | 533 | 18 | ||||||
Two Harbors Investment‡ | 105,052 | 911 | ||||||
UMB Financial | 1,589 | 121 | ||||||
Umpqua Holdings | 35,025 | 622 | ||||||
Union Bankshares | 15,251 | 516 | ||||||
United Community Banks | 84,390 | 2,294 | ||||||
United Financial Bancorp | 28,000 | 473 | ||||||
United Fire Group | 8,559 | 389 | ||||||
| 4 | SEI Institutional Investments Trust / Semi-Annual Report / November 30, 2016 |
SCHEDULE OF INVESTMENTS (Unaudited)
Small Cap Fund (Continued)
November 30, 2016
| Description | Shares | Market Value ($ Thousands) | ||||||
Universal Insurance Holdings (A) | 19,400 | $ | 466 | |||||
Univest Corp of Pennsylvania | 16,208 | 463 | ||||||
Validus Holdings | 21,868 | 1,188 | ||||||
Waddell & Reed Financial, Cl A | 5,363 | 105 | ||||||
Washington Federal | 16,563 | 537 | ||||||
Washington Trust Bancorp | 492 | 25 | ||||||
WesBanco | 7,700 | 307 | ||||||
Western Alliance Bancorp* | 17,475 | 816 | ||||||
White Mountains Insurance Group | 27 | 23 | ||||||
Wintrust Financial | 24,482 | 1,612 | ||||||
World Acceptance* (A) | 3,288 | 185 | ||||||
WSFS Financial | 16,975 | 724 | ||||||
Yadkin Financial | 19,835 | 650 | ||||||
Zions Bancorporation | 6,272 | 250 | ||||||
|
| |||||||
| 100,082 | ||||||||
|
| |||||||
Health Care — 9.8% | ||||||||
Abaxis | 106 | 5 | ||||||
Accuray* (A) | 326,100 | 1,647 | ||||||
Aclaris Therapeutics* | 11,392 | 341 | ||||||
Aerie Pharmaceuticals* | 8,243 | 306 | ||||||
Aimmune Therapeutics* | 13,284 | 302 | ||||||
Air Methods* | 7,900 | 258 | ||||||
Alere* | 2,684 | 107 | ||||||
Allscripts Healthcare Solutions* | 6,821 | 75 | ||||||
AMAG Pharmaceuticals* | 120,151 | 3,989 | ||||||
AMN Healthcare Services* | 104,859 | 3,492 | ||||||
Amphastar Pharmaceuticals* | 13,360 | 271 | ||||||
Analogic | 5,264 | 485 | ||||||
AngioDynamics* | 392 | 6 | ||||||
Anika Therapeutics* | 3,571 | 167 | ||||||
Applied Genetic Technologies* | 4,261 | 39 | ||||||
Ardelyx* | 8,455 | 125 | ||||||
AtriCure* | 20,270 | 365 | ||||||
Avexis* (A) | 4,872 | 288 | ||||||
BioDelivery Sciences International* | 165,692 | 282 | ||||||
Bio-Rad Laboratories, Cl A* | 2,133 | 370 | ||||||
BioSpecifics Technologies* | 1,145 | 56 | ||||||
BioTelemetry* | 16,405 | 319 | ||||||
Bovie Medical* (A) | 39,170 | 166 | ||||||
Cantel Medical | 3,870 | 316 | ||||||
Capital Senior Living* | 108,393 | 1,689 | ||||||
Cara Therapeutics* (A) | 24,259 | 218 | ||||||
Cardiovascular Systems* | 13,136 | 318 | ||||||
CoLucid Pharmaceuticals* (A) | 9,059 | 320 | ||||||
Community Health Systems* | 5,416 | 29 | ||||||
CONMED | 13,045 | 568 | ||||||
Corcept Therapeutics* | 31,190 | 262 | ||||||
Cynosure, Cl A* | 59,757 | 2,710 | ||||||
Dermira* | 8,183 | 262 | ||||||
Eagle Pharmaceuticals* (A) | 3,752 | 296 | ||||||
Emergent Biosolutions* | 9,146 | 245 | ||||||
| Description | Shares | Market Value ($ Thousands) | ||||||
Enanta Pharmaceuticals* | 1,471 | $ | 46 | |||||
Exactech* | 17,594 | 442 | ||||||
Exelixis* | 20,850 | 353 | ||||||
Five Prime Therapeutics* | 521 | 30 | ||||||
Flamel Technologies ADR* | 112,202 | 1,192 | ||||||
Glaukos* | 6,160 | 192 | ||||||
Globus Medical, Cl A* | 1,309 | 28 | ||||||
Halozyme Therapeutics* | 1,243 | 15 | ||||||
HealthSouth | 17,327 | 722 | ||||||
Heska* | 4,644 | 307 | ||||||
HMS Holdings* | 4,327 | 79 | ||||||
ICU Medical* | 1,959 | 294 | ||||||
INC Research Holdings, Cl A* | 13,445 | 666 | ||||||
Inogen* | 9,550 | 615 | ||||||
Integer Holdings* | 16,126 | 456 | ||||||
Integra LifeSciences Holdings* | 25,627 | 2,071 | ||||||
Intercept Pharmaceuticals* | 6,183 | 625 | ||||||
Invuity* | 21,530 | 146 | ||||||
iRadimed* | 1,744 | 19 | ||||||
Kindred Healthcare | 24,200 | 161 | ||||||
Lannett* (A) | 8,100 | 185 | ||||||
LeMaitre Vascular | 28,707 | 651 | ||||||
Ligand Pharmaceuticals* (A) | 25,740 | 2,687 | ||||||
Magellan Health Services* | 8,966 | 653 | ||||||
Masimo* | 7,346 | 454 | ||||||
Medidata Solutions* | 12,690 | 701 | ||||||
Merit Medical Systems* | 1,466 | 35 | ||||||
Molina Healthcare* | 41,623 | 2,200 | ||||||
Myriad Genetics* | 4,430 | 74 | ||||||
Natus Medical* | 1,372 | 55 | ||||||
NeoGenomics* | 56,835 | 508 | ||||||
Nevro* (A) | 3,433 | 261 | ||||||
Omnicell* | 17,460 | 626 | ||||||
OraSure Technologies* | 56,088 | 473 | ||||||
Orthofix International* | 1,840 | 69 | ||||||
PAREXEL International* | 427 | 25 | ||||||
PDL BioPharma | 44,143 | 97 | ||||||
Penumbra* | 4,895 | 303 | ||||||
Phibro Animal Health, Cl A | 1,772 | 49 | ||||||
Portola Pharmaceuticals, Cl A* | 595 | 11 | ||||||
PRA Health Sciences* | 17,870 | 960 | ||||||
Prestige Brands Holdings* | 73,323 | 3,488 | ||||||
Prothena* (A) | 339 | 20 | ||||||
Quality Systems | 1,241 | 16 | ||||||
Quorum Health* | 1,836 | 10 | ||||||
Radius Health* (A) | 7,000 | 373 | ||||||
REGENXBIO* | 13,153 | 293 | ||||||
Retrophin* | 1,198 | 24 | ||||||
Sarepta Therapeutics* | 784 | 27 | ||||||
SciClone Pharmaceuticals* | 7,895 | 79 | ||||||
Select Medical Holdings* | 16,100 | 196 | ||||||
Sucampo Pharmaceuticals, Cl A* | 25,100 | 408 | ||||||
| 5 | SEI Institutional Investments Trust / Semi-Annual Report / November 30, 2016 |
SCHEDULE OF INVESTMENTS (Unaudited)
Small Cap Fund (Continued)
November 30, 2016
| Description | Shares | Market Value ($ Thousands) | ||||||
Supernus Pharmaceuticals* | 70,477 | $ | 1,519 | |||||
SurModics* | 3,692 | 88 | ||||||
Synergy Pharmaceuticals* | 53,667 | 282 | ||||||
Tabula Rasa HealthCare* | 17,000 | 236 | ||||||
Team Health Holdings* | 1,161 | 49 | ||||||
Teleflex | 306 | 45 | ||||||
TESARO* (A) | 3,425 | 465 | ||||||
TransEnterix* (A) | 13,862 | 21 | ||||||
Trinity Biotech ADR (A) | 132,800 | 888 | ||||||
Triple-S Management, Cl B* | 22,159 | 494 | ||||||
Vanda Pharmaceuticals* | 10,640 | 175 | ||||||
Vascular Solutions* | 6,435 | 355 | ||||||
Veeva Systems, Cl A* | 5,808 | 270 | ||||||
Veracyte* | 38,200 | 291 | ||||||
Vocera Communications* | 76,125 | 1,385 | ||||||
VWR* | 2,376 | 65 | ||||||
WellCare Health Plans* | 2,493 | 342 | ||||||
Xencor* | 1,910 | 49 | ||||||
Zeltiq Aesthetics* (A) | 5,582 | 246 | ||||||
|
| |||||||
| 52,429 | ||||||||
|
| |||||||
Industrials — 16.8% | ||||||||
AAR | 27,703 | 1,022 | ||||||
ABM Industries | 30,835 | 1,357 | ||||||
ACCO Brands* | 77,263 | 962 | ||||||
Aegion, Cl A* | 9,300 | 225 | ||||||
AGCO | 1,513 | 84 | ||||||
Air Transport Services Group* | 82,760 | 1,341 | ||||||
Aircastle | 26,200 | 563 | ||||||
Alamo Group | 2,199 | 161 | ||||||
Alaska Air Group | 4,867 | 400 | ||||||
Albany International, Cl A | 8,220 | 384 | ||||||
Allegiant Travel, Cl A | 162 | 26 | ||||||
American Railcar Industries (A) | 5,600 | 251 | ||||||
American Woodmark* | 4,114 | 315 | ||||||
Apogee Enterprises | 72,999 | 3,482 | ||||||
Applied Industrial Technologies | 2,993 | 179 | ||||||
ARC Document Solutions* | 164,900 | 735 | ||||||
ArcBest | 12,134 | 370 | ||||||
Argan | 4,799 | 290 | ||||||
Astec Industries | 15,851 | 1,051 | ||||||
Atlas Air Worldwide Holdings* | 7,700 | 380 | ||||||
Babcock & Wilcox Enterprises* | 58,200 | 928 | ||||||
Barnes Group | 328 | 15 | ||||||
Brady, Cl A | 28,877 | 1,061 | ||||||
Briggs & Stratton | 28,539 | 591 | ||||||
BWX Technologies | 48,458 | 1,898 | ||||||
Carlisle | 1,520 | 171 | ||||||
Celadon Group (A) | 76,400 | 615 | ||||||
Chicago Bridge & Iron | 3,577 | 120 | ||||||
CIRCOR International | 8,955 | 568 | ||||||
CLARCOR | 157 | 11 | ||||||
| Description | Shares | Market Value ($ Thousands) | ||||||
Comfort Systems USA | 6,441 | $ | 207 | |||||
Continental Building Products* | 292 | 7 | ||||||
Covanta Holding | 61,100 | 892 | ||||||
CRA International | 4,864 | 160 | ||||||
Crane | 3,276 | 241 | ||||||
Curtiss-Wright | 10,650 | 1,071 | ||||||
Deluxe | 49,428 | 3,346 | ||||||
DigitalGlobe* | 9,194 | 296 | ||||||
Ducommun* | 11,916 | 341 | ||||||
Dycom Industries* | 4,420 | 324 | ||||||
EMCOR Group | 20,511 | 1,423 | ||||||
Engility Holdings* | 12,846 | 466 | ||||||
Ennis | 64,888 | 1,048 | ||||||
Essendant | 6,900 | 134 | ||||||
Esterline Technologies* | 1,166 | 103 | ||||||
Exponent | 14,275 | 866 | ||||||
Federal Signal | 2,496 | 39 | ||||||
FreightCar America | 79,111 | 1,161 | ||||||
FTI Consulting* | 12,425 | 531 | ||||||
FuelCell Energy* | 1,799 | 4 | ||||||
G&K Services, Cl A | 357 | 34 | ||||||
Generac Holdings* | 11,600 | 475 | ||||||
Gibraltar Industries* | 20,300 | 914 | ||||||
Global Brass & Copper Holdings | 40,250 | 1,153 | ||||||
Great Lakes Dredge & Dock* | 358,100 | 1,522 | ||||||
Greenbrier | 1,311 | 51 | ||||||
Griffon | 14,850 | 355 | ||||||
Harsco | 2,606 | 37 | ||||||
Hawaiian Holdings* | 16,071 | 825 | ||||||
Healthcare Services Group | 16,315 | 635 | ||||||
Heidrick & Struggles International | 2,000 | 42 | ||||||
Herman Miller | 14,435 | 469 | ||||||
Hillenbrand | 6,500 | 228 | ||||||
Hudson Technologies* | 37,738 | 287 | ||||||
Huntington Ingalls Industries | 2,892 | 517 | ||||||
Huron Consulting Group* | 39,483 | 2,083 | ||||||
Hyster-Yale Materials Handling | 5,400 | 349 | ||||||
ICF International* | 35,267 | 1,952 | ||||||
InnerWorkings* | 102,700 | 950 | ||||||
Insperity | 2,253 | 163 | ||||||
Insteel Industries | 20,395 | 807 | ||||||
Interface, Cl A | 33,217 | 578 | ||||||
ITT | 1,224 | 49 | ||||||
Jacobs Engineering Group* | 2,262 | 140 | ||||||
JetBlue Airways* | 23,779 | 478 | ||||||
John Bean Technologies | 20,715 | 1,869 | ||||||
Joy Global | 5,199 | 146 | ||||||
Kadant | 18,493 | 1,158 | ||||||
KBR | 70,700 | 1,181 | ||||||
Kelly Services, Cl A | 22,950 | 462 | ||||||
Kennametal | 1,489 | 51 | ||||||
KEYW Holding* (A) | 62,222 | 780 | ||||||
| 6 | SEI Institutional Investments Trust / Semi-Annual Report / November 30, 2016 |
SCHEDULE OF INVESTMENTS (Unaudited)
Small Cap Fund (Continued)
November 30, 2016
| Description | Shares | Market Value ($ Thousands) | ||||||
Kforce | 4,054 | $ | 90 | |||||
Kirby* | 1,714 | 109 | ||||||
Knoll | 3,011 | 80 | ||||||
Korn/Ferry International | 10,300 | 261 | ||||||
Kratos Defense & Security Solutions* | 42,985 | 315 | ||||||
LB Foster, Cl A | 6,900 | 85 | ||||||
Lincoln Electric Holdings | 331 | 26 | ||||||
LSC Communications | 11,063 | 228 | ||||||
Lydall* | 13,655 | 815 | ||||||
Macquarie Infrastructure | 1,955 | 160 | ||||||
Manpowergroup | 1,795 | 153 | ||||||
MasTec* | 64,063 | 2,431 | ||||||
Matson | 12,543 | 472 | ||||||
Matthews International, Cl A | 10,200 | 742 | ||||||
McGrath RentCorp | 8,806 | 325 | ||||||
Meritor* | 42,330 | 534 | ||||||
Mistras Group* | 2,879 | 68 | ||||||
Moog, Cl A* | 3,258 | 228 | ||||||
MRC Global* | 23,201 | 467 | ||||||
Mueller Industries | 7,487 | 284 | ||||||
Mueller Water Products, Cl A | 28,380 | 375 | ||||||
MYR Group* | 8,681 | 325 | ||||||
National Presto Industries | 1,792 | 171 | ||||||
Navigant Consulting* | 12,658 | 313 | ||||||
NCI Building Systems* | 13,610 | 227 | ||||||
NN | 11,300 | 192 | ||||||
Nordson | 2,887 | 308 | ||||||
Northwest Pipe* | 29,419 | 515 | ||||||
NV5 Global* | 11,305 | 413 | ||||||
On Assignment* | 68,036 | 2,809 | ||||||
Orbital ATK | 414 | 35 | ||||||
Orion Marine Group* | 57,700 | 575 | ||||||
Oshkosh Truck | 5,885 | 412 | ||||||
Owens Corning | 7,488 | 385 | ||||||
Park-Ohio Holdings | 9,744 | 411 | ||||||
Patrick Industries* | 3,602 | 257 | ||||||
Ply Gem Holdings* | 9,925 | 151 | ||||||
Quad, Cl A | 6,727 | 189 | ||||||
Quanta Services* | 8,882 | 300 | ||||||
Rand Logistics* | 35,872 | 33 | ||||||
Regal-Beloit | 455 | 33 | ||||||
Rexnord* | 3,381 | 74 | ||||||
Roadrunner Transportation Systems* | 23,953 | 240 | ||||||
RPX* | 7,563 | 79 | ||||||
Rush Enterprises, Cl A* | 639 | 19 | ||||||
Saia* | 18,400 | 768 | ||||||
Simpson Manufacturing | 8,965 | 423 | ||||||
SkyWest | 27,113 | 999 | ||||||
Snap-on | 206 | 34 | ||||||
Sparton* | 5,028 | 123 | ||||||
Spirit AeroSystems Holdings, Cl A | 6,201 | 361 | ||||||
Spirit Airlines* | 13,200 | 734 | ||||||
| Description | Shares | Market Value ($ Thousands) | ||||||
SPX FLOW* | 1,090 | $ | 34 | |||||
Standex International | 7,326 | 645 | ||||||
Steelcase, Cl A | 41,958 | 652 | ||||||
Sterling Construction* | 54,100 | 449 | ||||||
Supreme Industries, Cl A | 11,997 | 170 | ||||||
Swift Transportation, Cl A* (A) | 50,792 | 1,268 | ||||||
Team* | 26,159 | 897 | ||||||
Terex | 3,266 | 100 | ||||||
Tetra Tech | 22,019 | 944 | ||||||
Timken | 2,535 | 99 | ||||||
Titan International | 28,603 | 331 | ||||||
Titan Machinery* (A) | 56,100 | 785 | ||||||
Toro | 10,305 | 545 | ||||||
Triton International | 8,200 | 158 | ||||||
Triumph Group | 9,000 | 250 | ||||||
TrueBlue* | 2,874 | 60 | ||||||
Tutor Perini* | 75,423 | 1,969 | ||||||
UniFirst | 2,060 | 291 | ||||||
United Rentals* | 296 | 30 | ||||||
Universal Forest Products | 2,999 | 298 | ||||||
Valmont Industries | 3,805 | 567 | ||||||
Vectrus* | 13,939 | 322 | ||||||
Viad | 8,741 | 384 | ||||||
Wabash National | 40,106 | 553 | ||||||
WageWorks* | 36,443 | 2,691 | ||||||
Wesco Aircraft Holdings* | 32,800 | 484 | ||||||
WESCO International* | 10,144 | 689 | ||||||
West | 426 | 10 | ||||||
XPO Logistics* (A) | 20,243 | 901 | ||||||
Xylem | 3,121 | 161 | ||||||
|
| |||||||
| 89,849 | ||||||||
|
| |||||||
Information Technology — 17.1% | ||||||||
A10 Networks* | 1,761 | 14 | ||||||
Actua* | 21,200 | 287 | ||||||
Acxiom* | 140,478 | 3,727 | ||||||
ADTRAN | 19,655 | 400 | ||||||
Advanced Energy Industries* | 6,559 | 362 | ||||||
Advanced Micro Devices* | 8,930 | 80 | ||||||
Aerohive Networks* | 140,800 | 776 | ||||||
Alarm.com Holdings* | 18,951 | 561 | ||||||
Alpha & Omega Semiconductor* | 11,935 | 260 | ||||||
Amkor Technology* | 76,859 | 908 | ||||||
Applied Micro Circuits* | 73,300 | 641 | ||||||
Arrow Electronics* | 4,313 | 294 | ||||||
Aspen Technology* | 593 | 31 | ||||||
Avid Technology* | 2,899 | 12 | ||||||
Avnet | 6,990 | 321 | ||||||
AVX | 1,022 | 16 | ||||||
Bankrate* | 7,222 | 74 | ||||||
Barracuda Networks* | 3,860 | 85 | ||||||
Bazaarvoice* | 104,700 | 555 | ||||||
| 7 | SEI Institutional Investments Trust / Semi-Annual Report / November 30, 2016 |
SCHEDULE OF INVESTMENTS (Unaudited)
Small Cap Fund (Continued)
November 30, 2016
| Description | Shares | Market Value ($ Thousands) | ||||||
Bel Fuse, Cl B | 10,088 | $ | 296 | |||||
Belden | 9,195 | 680 | ||||||
Benchmark Electronics* | 44,448 | 1,260 | ||||||
Black Box | 33,633 | 516 | ||||||
Blackbaud | 4,775 | 300 | ||||||
Booz Allen Hamilton Holding | 59,382 | 2,245 | ||||||
Brightcove* | 9,629 | 80 | ||||||
Brocade Communications Systems | 11,776 | 145 | ||||||
Cabot Microelectronics | 121 | 7 | ||||||
CACI International, Cl A* | 737 | 95 | ||||||
CalAmp* | 191,206 | 2,780 | ||||||
Callidus Software* | 158,473 | 2,488 | ||||||
Cardtronics* | 6,468 | 320 | ||||||
Cavium* | 59,758 | 3,408 | ||||||
CEVA* | 8,263 | 263 | ||||||
CIBER* | 341,500 | 283 | ||||||
Cimpress* | 297 | 26 | ||||||
Cirrus Logic* | 5,694 | 313 | ||||||
Cognex | 5,045 | 301 | ||||||
Coherent* | 10,025 | 1,308 | ||||||
Cohu | 2,419 | 30 | ||||||
CommScope Holding* | 16,545 | 595 | ||||||
CommVault Systems* | 6,649 | 359 | ||||||
Convergys | 8,396 | 217 | ||||||
Cornerstone OnDemand* | 48,766 | 1,751 | ||||||
Cray* | 3,171 | 61 | ||||||
CSG Systems International | 23,779 | 1,058 | ||||||
CSRA | 31,900 | 1,021 | ||||||
DHI Group* | 45,837 | 280 | ||||||
Digi International* | 25,200 | 338 | ||||||
DST Systems | 10,420 | 1,075 | ||||||
Ebix (A) | 5,656 | 337 | ||||||
EchoStar, Cl A* | 6,257 | 319 | ||||||
EMCORE | 6,231 | 40 | ||||||
Entegris* | 2,410 | 43 | ||||||
ePlus* | 2,400 | 267 | ||||||
Euronet Worldwide* | 15,313 | 1,098 | ||||||
Everi Holdings* | 3,023 | 7 | ||||||
EVERTEC | 8,632 | 158 | ||||||
Exar* | 177,367 | 1,772 | ||||||
Extreme Networks* | 7,055 | 30 | ||||||
Fabrinet* | 146 | 6 | ||||||
Fair Isaac | 88 | 10 | ||||||
FARO Technologies* | 4,111 | 150 | ||||||
Finisar* | 13,099 | 435 | ||||||
FireEye* | 190,199 | 2,442 | ||||||
First Solar* | 2,787 | 85 | ||||||
Five9* | 84,425 | 1,336 | ||||||
Gigamon* | 5,322 | 284 | ||||||
GigPeak* | 18,489 | 50 | ||||||
Globant* (A) | 2,815 | 96 | ||||||
GoDaddy, Cl A* (A) | 7,817 | 276 | ||||||
| Description | Shares | Market Value ($ Thousands) | ||||||
Guidewire Software* | 4,970 | $ | 277 | |||||
Hackett Group | 27,724 | 492 | ||||||
IAC | 4,395 | 296 | ||||||
II-VI* | 34,440 | 1,040 | ||||||
Imperva* | 8,900 | 340 | ||||||
Ingram Micro, Cl A | 3,817 | 143 | ||||||
Inphi* | 21,445 | 969 | ||||||
Insight Enterprises* | 27,549 | 965 | ||||||
Instructure* | 9,380 | 183 | ||||||
Integrated Device Technology* | 16,580 | 388 | ||||||
InterDigital | 4,228 | 335 | ||||||
Intersil, Cl A | 25,456 | 564 | ||||||
Intralinks Holdings* | 40,323 | 452 | ||||||
Ixia* | 10,456 | 144 | ||||||
IXYS | 13,275 | 155 | ||||||
j2 Global | 9,155 | 673 | ||||||
Jabil Circuit | 3,009 | 64 | ||||||
Kulicke & Soffa Industries* | 33,200 | 512 | ||||||
Littelfuse | 12,939 | 1,886 | ||||||
LivePerson* | 1,542 | 12 | ||||||
LogMeIn | 17,231 | 1,738 | ||||||
Lumentum Holdings* | 64,380 | 2,582 | ||||||
M* | 6,499 | 324 | ||||||
Manhattan Associates* | 4,755 | 249 | ||||||
ManTech International, Cl A | 7,777 | 335 | ||||||
Marvell Technology Group | 8,703 | 125 | ||||||
MAXIMUS | 32,110 | 1,775 | ||||||
MaxLinear, Cl A* | 4,233 | 86 | ||||||
Medallion Financial (A) | 23,200 | 76 | ||||||
MeetMe* (A) | 11,247 | 54 | ||||||
Mentor Graphics | 47,203 | 1,725 | ||||||
Mercury Systems* | 51,810 | 1,539 | ||||||
Microsemi* | 20,504 | 1,123 | ||||||
MicroStrategy, Cl A* | 287 | 56 | ||||||
MINDBODY, Cl A* (A) | 17,166 | 371 | ||||||
Mitek Systems* (A) | 4,919 | 28 | ||||||
MKS Instruments | 5,099 | 293 | ||||||
MoneyGram International* | 48,500 | 530 | ||||||
Monolithic Power Systems | 16,259 | 1,334 | ||||||
Monotype Imaging Holdings | 1,126 | 22 | ||||||
Nanometrics* | 22,650 | 542 | ||||||
NeoPhotonics* | 8,236 | 106 | ||||||
NETGEAR* | 21,684 | 1,164 | ||||||
NeuStar, Cl A* | 12,669 | 307 | ||||||
NIC | 1,007 | 25 | ||||||
Oclaro* | 33,634 | 301 | ||||||
PDF Solutions* | 119,050 | 2,804 | ||||||
Pegasystems | 899 | 32 | ||||||
Perficient* | 102,566 | 1,846 | ||||||
Photronics* | 78,635 | 786 | ||||||
Plantronics | 7,000 | 363 | ||||||
Progress Software | 4,176 | 123 | ||||||
| 8 | SEI Institutional Investments Trust / Semi-Annual Report / November 30, 2016 |
SCHEDULE OF INVESTMENTS (Unaudited)
Small Cap Fund (Continued)
November 30, 2016
| Description | Shares | Market Value ($ Thousands) | ||||||
Proofpoint* | 27,831 | $ | 2,143 | |||||
PTC* | 5,360 | 261 | ||||||
Q2 Holdings* | 14,530 | 429 | ||||||
QAD, Cl A | 20,800 | 603 | ||||||
QuinStreet* | 556 | 2 | ||||||
RealPage* | 11,801 | 338 | ||||||
RetailMeNot* | 15,399 | 142 | ||||||
Rogers* | 1,194 | 89 | ||||||
Rubicon Project* | 47,748 | 361 | ||||||
Rudolph Technologies* | 18,029 | 353 | ||||||
Sanmina* | 44,850 | 1,473 | ||||||
ScanSource* | 18,550 | 702 | ||||||
Semtech* | 1,101 | 31 | ||||||
Silicon Laboratories* | 114 | 8 | ||||||
Sonus Networks* | 38,930 | 235 | ||||||
SuperCom* (A) | 73,900 | 236 | ||||||
Sykes Enterprises* | 33,233 | 937 | ||||||
Synaptics* | 3,658 | 200 | ||||||
Synchronoss Technologies* | 7,002 | 339 | ||||||
SYNNEX | 4,477 | 523 | ||||||
Synopsys* | 6,425 | 389 | ||||||
Syntel | 183 | 4 | ||||||
Tech Data* | 16,183 | 1,373 | ||||||
TeleTech Holdings | 108 | 3 | ||||||
Teradyne | 11,429 | 279 | ||||||
Tessera Technologies | 8,385 | 332 | ||||||
TiVo* | 3,333 | 68 | ||||||
Travelport Worldwide | 2,828 | 40 | ||||||
TrueCar* | 24,669 | 305 | ||||||
TTM Technologies* | 17,164 | 233 | ||||||
Tyler Technologies* | 6,139 | 914 | ||||||
Ultratech* | 24,543 | 563 | ||||||
Unisys* | 930 | 14 | ||||||
Verint Systems* | 2,093 | 79 | ||||||
Viavi Solutions* | 52,161 | 409 | ||||||
Vishay Intertechnology | 39,000 | 591 | ||||||
Vishay Precision Group* | 26,500 | 484 | ||||||
Xcerra* | 89,600 | 568 | ||||||
XO Group* | 2,549 | 47 | ||||||
Zix* | 4,004 | 18 | ||||||
|
| |||||||
| 91,316 | ||||||||
|
| |||||||
Materials — 5.3% | ||||||||
A. Schulman | 7,300 | 243 | ||||||
AdvanSix* | 26,200 | 490 | ||||||
AEP Industries | 76 | 9 | ||||||
AK Steel Holding* | 4,579 | 42 | ||||||
Allegheny Technologies (A) | 27,200 | 477 | ||||||
Avery Dennison | 4,589 | 331 | ||||||
Bemis | 4,800 | 240 | ||||||
Berry Plastics Group* | 73,014 | 3,634 | ||||||
Boise Cascade* | 14,400 | 328 | ||||||
| Description | Shares | Market Value ($ Thousands) | ||||||
Cabot | 15,583 | $ | 794 | |||||
Carpenter Technology | 18,115 | 648 | ||||||
Chemours | 33,848 | 837 | ||||||
Chemtura* | 21,022 | 693 | ||||||
Clearwater Paper* | 10,800 | 672 | ||||||
Cliffs Natural Resources* (A) | 49,986 | 440 | ||||||
Coeur Mining* | 28,172 | 272 | ||||||
Commercial Metals | 20,771 | 457 | ||||||
Domtar | 13,200 | 518 | ||||||
Ferro* | 3,942 | 58 | ||||||
Ferroglobe* | 55,400 | 6 | ||||||
Ferroglobe PLC | 55,400 | 632 | ||||||
Flotek Industries* (A) | 3,100 | 42 | ||||||
FutureFuel | 15,713 | 216 | ||||||
Glatfelter | 15,000 | 345 | ||||||
Greif, Cl A | 474 | 24 | ||||||
Hecla Mining | 8,395 | 51 | ||||||
Huntsman | 14,750 | 287 | ||||||
Ingevity* | 15,260 | 799 | ||||||
Innophos Holdings | 4,431 | 242 | ||||||
Innospec | 11,137 | 732 | ||||||
Kaiser Aluminum | 9,151 | 754 | ||||||
KapStone Paper and Packaging | 14,873 | 304 | ||||||
Koppers Holdings* | 1,630 | 62 | ||||||
Kraton Performance Polymers* | 16,583 | 511 | ||||||
Materion | 3,458 | 133 | ||||||
Minerals Technologies | 8,202 | 664 | ||||||
Neenah Paper | 3,682 | 313 | ||||||
Olympic Steel | 15,468 | 378 | ||||||
OMNOVA Solutions* | 9,337 | 90 | ||||||
PolyOne | 13,547 | 447 | ||||||
Rayonier Advanced Materials (A) | 12,474 | 173 | ||||||
Real Industry* | 78,800 | 461 | ||||||
Reliance Steel & Aluminum | 5,437 | 441 | ||||||
Royal Gold | 1,189 | 83 | ||||||
Ryerson Holding* | 34,038 | 487 | ||||||
Schweitzer-Mauduit International | 30,100 | 1,265 | ||||||
Scotts Miracle-Gro, Cl A | 4,193 | 383 | ||||||
Sensient Technologies | 21,226 | 1,657 | ||||||
Silgan Holdings | 8,469 | 419 | ||||||
Sonoco Products | 2,633 | 142 | ||||||
Steel Dynamics | 11,565 | 410 | ||||||
Stepan | 12,133 | 985 | ||||||
Summit Materials, Cl A* | 25,547 | 607 | ||||||
SunCoke Energy | 12,958 | 148 | ||||||
Tahoe Resources | 10,833 | 104 | ||||||
Tredegar | 708 | 16 | ||||||
Trinseo | 17,085 | 1,000 | ||||||
US Concrete* | 15,409 | 876 | ||||||
Worthington Industries | 2,910 | 164 | ||||||
|
| |||||||
| 28,036 | ||||||||
|
| |||||||
| 9 | SEI Institutional Investments Trust / Semi-Annual Report / November 30, 2016 |
SCHEDULE OF INVESTMENTS (Unaudited)
Small Cap Fund (Continued)
November 30, 2016
| Description | Shares | Market Value ($ Thousands) | ||||||
Real Estate — 6.1% | ||||||||
Acadia Realty Trust‡ | 19,785 | $ | 654 | |||||
Agree Realty‡ | 6,547 | 294 | ||||||
Alexander & Baldwin | 576 | 25 | ||||||
Alexander’s‡ | 214 | 92 | ||||||
Alexandria Real Estate Equities‡ | 1,064 | 117 | ||||||
American Assets Trust‡ | 13,810 | 553 | ||||||
American Campus Communities‡ | 17,776 | 837 | ||||||
Apartment Investment & Management, Cl A‡ | 5,798 | 244 | ||||||
Apple Hospitality‡ | 2,059 | 38 | ||||||
Armada Hoffler Properties‡ | 18,000 | 253 | ||||||
Ashford Hospitality Prime‡ | 4,219 | 54 | ||||||
Ashford Hospitality Trust‡ | 51,500 | 362 | ||||||
Brandywine Realty Trust‡ | 13,500 | 207 | ||||||
Brixmor Property Group‡ | 11,931 | 291 | ||||||
Camden Property Trust‡ | 4,406 | 347 | ||||||
Care Capital Properties‡ | 12,470 | 300 | ||||||
CareTrust‡ | 52,278 | 740 | ||||||
CatchMark Timber Trust, Cl A‡ | 27,200 | 298 | ||||||
CBL & Associates Properties‡ | 25,200 | 299 | ||||||
Cedar Realty Trust‡ | 151,100 | 975 | ||||||
Chatham Lodging Trust‡ | 9,200 | 176 | ||||||
Colony Starwood Homes‡ | 55,400 | 1,692 | ||||||
Columbia Property Trust‡ | 5,395 | 114 | ||||||
Communications Sales & Leasing‡ | 3,945 | 98 | ||||||
Community Healthcare Trust | 591 | 13 | ||||||
CoreCivic‡ | 3,528 | 80 | ||||||
CoreSite Realty‡ | 3,960 | 279 | ||||||
Corporate Office Properties Trust‡ | 3,477 | 100 | ||||||
Cousins Properties‡ | 59,800 | 473 | ||||||
DCT Industrial Trust‡ | 1,363 | 63 | ||||||
DDR‡ | 1,635 | 25 | ||||||
Douglas Emmett‡ | 2,308 | 85 | ||||||
Duke Realty‡ | 9,148 | 233 | ||||||
DuPont Fabros Technology‡ | 1,564 | 64 | ||||||
Education Realty Trust‡ | 15,496 | 629 | ||||||
EPR Properties‡ | 9,613 | 668 | ||||||
Equity Commonwealth*‡ | 69,251 | 2,014 | ||||||
Equity One‡ | 17,126 | 511 | ||||||
FelCor Lodging Trust‡ | 35,200 | 256 | ||||||
First Industrial Realty Trust‡ | 11,716 | 310 | ||||||
First Potomac Realty Trust‡ | 3,072 | 30 | ||||||
Forest City Realty Trust, Cl A‡ | 5,651 | 104 | ||||||
Four Corners Property Trust‡ | 374 | 7 | ||||||
Franklin Street Properties‡ | 67,280 | 845 | ||||||
GEO Group‡ | 16,889 | 562 | ||||||
Getty Realty‡ | 22,239 | 534 | ||||||
Government Properties Income Trust‡ (A) | 10,600 | 199 | ||||||
Gramercy Property Trust‡ | 152,614 | 1,334 | ||||||
Healthcare Realty Trust‡ | 2,777 | 82 | ||||||
Healthcare Trust of America, Cl A‡ | 11,193 | 317 | ||||||
Hersha Hospitality Trust, Cl A‡ | 12,700 | 256 | ||||||
| Description | Shares | Market Value ($ Thousands) | ||||||
Highwoods Properties‡ | 13,542 | $ | 651 | |||||
Hospitality Properties Trust‡ | 29,600 | 858 | ||||||
Kennedy-Wilson Holdings | 67,800 | 1,448 | ||||||
Lexington Realty Trust‡ | 12,781 | 132 | ||||||
Liberty Property Trust‡ | 7,143 | 281 | ||||||
Life Storage‡ | 1,937 | 157 | ||||||
LTC Properties‡ | 606 | 28 | ||||||
Mack-Cali Realty‡ | 11,600 | 314 | ||||||
MedEquities Realty Trust | 55,200 | 601 | ||||||
Mid-America Apartment Communities‡ | 1,507 | 138 | ||||||
Monmouth Real Estate Investment, Cl A‡ | 4,107 | 58 | ||||||
National Health Investors‡ | 829 | 59 | ||||||
National Retail Properties‡ | 8,909 | 380 | ||||||
National Storage Affiliates Trust‡ | 21,853 | 450 | ||||||
NexPoint Residential Trust‡ | 1,280 | 25 | ||||||
Outfront Media‡ | 8,625 | 217 | ||||||
Parkway* | 7,475 | 146 | ||||||
Pebblebrook Hotel Trust‡ | 13,319 | 383 | ||||||
Piedmont Office Realty Trust, Cl A‡ | 31,591 | 620 | ||||||
Post Properties‡ | 1,836 | 119 | ||||||
PS Business Parks‡ | 934 | 104 | ||||||
RAIT Financial Trust‡ | 6,566 | 20 | ||||||
Rayonier‡ | 2,828 | 75 | ||||||
Regency Centers‡ | 5,207 | 348 | ||||||
Retail Opportunity Investments‡ | — | — | ||||||
Retail Properties of America, Cl A‡ | 18,349 | 280 | ||||||
RLJ Lodging Trust‡ | 2,697 | 61 | ||||||
Ryman Hospitality Properties‡ | 835 | 49 | ||||||
Sabra Health Care‡ | 19,800 | 438 | ||||||
Saul Centers‡ | 5,431 | 345 | ||||||
Select Income‡ | 50,669 | 1,238 | ||||||
Senior Housing Properties Trust‡ | 8,222 | 148 | ||||||
Seritage Growth Properties‡ (A) | 12,400 | 591 | ||||||
Spirit Realty Capital‡ | 5,009 | 54 | ||||||
STORE Capital‡ | 1,720 | 43 | ||||||
Summit Hotel Properties‡ | 64,301 | 914 | ||||||
Sun Communities‡ | 860 | 62 | ||||||
Sunstone Hotel Investors‡ | 14,400 | 209 | ||||||
Tanger Factory Outlet Centers‡ | 14,615 | 504 | ||||||
Urban Edge Properties‡ | 654 | 18 | ||||||
Urstadt Biddle Properties, Cl A‡ | 866 | 20 | ||||||
Washington Real Estate Investment Trust‡ | 413 | 13 | ||||||
Weingarten Realty Investors‡ | 5,971 | 212 | ||||||
Whitestone, Cl B‡ | 26,813 | 360 | ||||||
|
| |||||||
| 32,304 | ||||||||
|
| |||||||
Telecommunication Services — 0.8% | ||||||||
8x8* | 59,378 | 810 | ||||||
ATN International | 1,473 | 107 | ||||||
Cincinnati Bell* | 10,461 | 215 | ||||||
Globalstar* | 10,361 | 8 | ||||||
IDT, Cl B | 16,855 | 357 | ||||||
| 10 | SEI Institutional Investments Trust / Semi-Annual Report / November 30, 2016 |
SCHEDULE OF INVESTMENTS (Unaudited)
Small Cap Fund (Continued)
November 30, 2016
| Description | Shares | Market Value ($ Thousands) | ||||||
Inteliquent | 30,522 | $ | 691 | |||||
Intelsat* (A) | 48,488 | 200 | ||||||
Iridium Communications* (A) | 74,300 | 654 | ||||||
magicJack VocalTec* (A) | 22,200 | 158 | ||||||
NII Holdings* | 1,324 | 2 | ||||||
Ooma* | 23,600 | 219 | ||||||
Spok Holdings | 14,332 | 261 | ||||||
Telephone & Data Systems | 446 | 12 | ||||||
Vonage Holdings* | 55,042 | 363 | ||||||
|
| |||||||
| 4,057 | ||||||||
|
| |||||||
Utilities — 3.5% | ||||||||
ALLETE | 23,524 | 1,454 | ||||||
American States Water | 1,133 | 48 | ||||||
Aqua America | 4,529 | 135 | ||||||
Avista | 22,365 | 905 | ||||||
Black Hills | 3,300 | 194 | ||||||
Cadiz* (A) | 36,400 | 379 | ||||||
Chesapeake Utilities | 15,415 | 999 | ||||||
Connecticut Water Service | 1,061 | 58 | ||||||
El Paso Electric | 1,242 | 56 | ||||||
Fortis | 1 | — | ||||||
Great Plains Energy | 16,409 | 433 | ||||||
Hawaiian Electric Industries | 18,310 | 564 | ||||||
IDACORP | 9,969 | 759 | ||||||
MDU Resources Group | 4,884 | 136 | ||||||
MGE Energy | 327 | 19 | ||||||
Middlesex Water | 2,660 | 108 | ||||||
Northwest Natural Gas | 4,443 | 255 | ||||||
NorthWestern | 19,309 | 1,083 | ||||||
ONE Gas | 11,646 | 699 | ||||||
Ormat Technologies | 275 | 13 | ||||||
Otter Tail | 1,918 | 74 | ||||||
Pinnacle West Capital | 12,013 | 888 | ||||||
PNM Resources | 38,645 | 1,221 | ||||||
Portland General Electric | 50,323 | 2,093 | ||||||
SJW | 7,397 | 397 | ||||||
South Jersey Industries | 16,700 | 551 | ||||||
Southwest Gas | 33,480 | 2,482 | ||||||
Spark Energy, Cl A (A) | 12,566 | 320 | ||||||
Spire | 8,850 | 571 | ||||||
Talen Energy* | 1,691 | 24 | ||||||
UGI | 20,223 | 906 | ||||||
Unitil | 3,517 | 149 | ||||||
Vectren | 10,578 | 519 | ||||||
Westar Energy, Cl A | 4,682 | 267 | ||||||
|
| |||||||
| 18,759 | ||||||||
|
| |||||||
Total Common Stock |
| 510,857 | ||||||
|
| |||||||
| Description | Shares | Market Value ($ Thousands) | ||||||
EXCHANGE TRADED FUND — 0.3% |
| |||||||
Exchange Traded Fund — 0.3% |
| |||||||
iShares Russell 2000 Value Fund (A) | 13,100 | $ | 1,505 | |||||
|
| |||||||
Total Exchange Traded Fund |
| 1,505 | ||||||
|
| |||||||
| Face Amount (Thousands) | ||||||||
CONVERTIBLE BOND — 0.0% |
| |||||||
Eddie Bauer Holdings | ||||||||
5.250%, 04/01/2014 (B) (C) | $ | 2,856 | 4 | |||||
|
| |||||||
Total Convertible Bond |
| 4 | ||||||
|
| |||||||
| Number of Rights | ||||||||
RIGHTS — 0.0% | ||||||||
Kinder Morgan Escrow*‡‡ | 69,896 | — | ||||||
|
| |||||||
Dyax, Expires 12/31/2019* | 1,964 | — | ||||||
|
| |||||||
Allos Therapeutics*‡‡ | 81,300 | — | ||||||
|
| |||||||
Total Rights |
| — | ||||||
|
| |||||||
| Shares | ||||||||
AFFILIATED PARTNERSHIP — 4.9% |
| |||||||
SEI Liquidity Fund, L.P. | ||||||||
0.470%**† (D) | 26,279,711 | 26,280 | ||||||
|
| |||||||
Total Affiliated Partnership |
| 26,280 | ||||||
|
| |||||||
CASH EQUIVALENT — 4.0% |
| |||||||
SEI Daily Income Trust, Government Fund, Cl A | ||||||||
0.210%**† | 21,418,038 | 21,418 | ||||||
|
| |||||||
Total Cash Equivalent |
| 21,418 | ||||||
|
| |||||||
Total Investments — 105.0% |
| $ | 560,064 | |||||
|
| |||||||
Percentages are based on Net Assets of $533,241 ($ Thousands).
| * | Non-income producing security. |
| ** | Rate shown is the 7-day effective yield as of November 30, 2016. |
| † | Investment in Affiliated Security (see Note 6). |
| ‡ | Real Estate Investment Trust. |
| 11 | SEI Institutional Investments Trust / Semi-Annual Report / November 30, 2016 |
SCHEDULE OF INVESTMENTS (Unaudited)
Small Cap Fund (Concluded)
November 30, 2016
| ‡‡ | Expiration date unavailable. |
| (A) | This security or a partial position of this security is on loan at November 30, 2016 (see Note 12). The total market value of securities on loan at November 30, 2016 was $21,824 ($ Thousands). |
| (B) | Security fair valued using methods determined in good faith by the Valuation Committee of the Board of Trustees. The total market value of such securities as of November 30, 2016 was $4 ($ Thousands) and represented 0.0% of Net Assets. |
| (C) | Security is in default on interest payment. |
| (D) | This security was purchased with cash collateral held from securities on loan (see Note 12). The total market value of such securities as of November 30, 2016 was $26,280 ($ Thousands). |
ADR — American Depositary Receipt
Cl — Class
L.P. — Limited Partnership
PLC — Public Limited Company
The following is a list of the level of inputs used as of November 30, 2016, in valuing the Fund’s investments and other financial instruments carried at value ($ Thousands):
| Investments in Securities | Level 1 | Level 2 | Level 3 | Total | ||||||||||||
Common Stock | $ | 510,857 | $ | — | $ | — | $ | 510,857 | ||||||||
Exchange Traded Fund | 1,505 | — | — | 1,505 | ||||||||||||
Convertible Bond | — | — | 4 | 4 | ||||||||||||
Rights | — | — | — | — | ||||||||||||
Affiliated Partnership | — | 26,280 | — | 26,280 | ||||||||||||
Cash Equivalent | 21,418 | — | — | 21,418 | ||||||||||||
|
|
|
|
|
|
|
| |||||||||
Total Investments in Securities | $ | 533,780 | $ | 26,280 | $ | 4 | $ | 560,064 | ||||||||
|
|
|
|
|
|
|
| |||||||||
| (1) | A reconciliation of Level 3 investments is presented when the Fund has a significant amount of Level 3 investments at the beginning and/or end of the period in relation to the net assets. |
For the period ended November 30, 2016, there were no transfers between Level 1 and Level 2 assets and liabilities.
For the period ended November 30, 2016, there were no transfers between Level 2 and Level 3 assets and liabilities.
For more information on valuation inputs, see Note 2 — Significant Accounting Policies in Notes to Financial Statements.
Amounts designated as “—” are $0 or have been rounded to $0.
The accompanying notes are an integral part of the financial statements.
| 12 | SEI Institutional Investments Trust / Semi-Annual Report / November 30, 2016 |
SCHEDULE OF INVESTMENTS (Unaudited)
Small Cap II Fund
November 30, 2016
| Description | Shares | Market Value ($ Thousands) | ||||||
COMMON STOCK — 94.3% | ||||||||
Consumer Discretionary — 10.3% | ||||||||
1-800-Flowers.com, Cl A* | 3,311 | $ | 35 | |||||
2U* (A) | 34,757 | 1,149 | ||||||
Abercrombie & Fitch, Cl A | 766 | 11 | ||||||
American Axle & Manufacturing Holdings* | 6,858 | 107 | ||||||
American Public Education* | 13,811 | 319 | ||||||
America’s Car-Mart* | 5,582 | 254 | ||||||
Arctic Cat (A) | 27,233 | 415 | ||||||
Bassett Furniture Industries | 6,735 | 196 | ||||||
Beazer Homes USA* | 10,556 | 142 | ||||||
Big 5 Sporting Goods | 11,267 | 218 | ||||||
Big Lots (A) | 54,145 | 2,740 | ||||||
BJ’s Restaurants* | 2,144 | 80 | ||||||
Bloomin’ Brands | 55,999 | 1,042 | ||||||
Bojangles’* | 14,975 | 268 | ||||||
Boot Barn Holdings* (A) | 34,070 | 538 | ||||||
Bright Horizons Family Solutions* | 13,900 | 957 | ||||||
Buffalo Wild Wings* | 1,717 | 289 | ||||||
Cabela’s* | 904 | 56 | ||||||
Callaway Golf | 46,988 | 571 | ||||||
Camping World Holdings, Cl A | 3,407 | 95 | ||||||
Capella Education | 2,454 | 214 | ||||||
Career Education* | 2,873 | 29 | ||||||
Carrols Restaurant Group* | 4,598 | 63 | ||||||
Cheesecake Factory | 388 | 23 | ||||||
Citi Trends | 5,740 | 100 | ||||||
Cooper Tire & Rubber | 5,255 | 201 | ||||||
Cooper-Standard Holdings* | 4,006 | 382 | ||||||
Core-Mark Holdings | 43,652 | 1,594 | ||||||
Cracker Barrel Old Country Store | 111 | 18 | ||||||
CST Brands | 1,579 | 76 | ||||||
Culp | 1,286 | 43 | ||||||
Dana Holdings | 674 | 11 | ||||||
Del Frisco’s Restaurant Group* | 35,660 | 613 | ||||||
Del Taco Restaurants* | 24,824 | 360 | ||||||
Dick’s Sporting Goods | 3,728 | 220 | ||||||
DineEquity | 257 | 21 | ||||||
Dorman Products* | 3,213 | 232 | ||||||
Drew Industries | 2,772 | 291 | ||||||
DSW, Cl A | 15,151 | 360 | ||||||
Duluth Holdings, Cl B* (A) | 7,368 | 247 | ||||||
Dunkin’ Brands Group | 13,676 | 742 | ||||||
Eastman Kodak* | 835 | 13 | ||||||
Eldorado Resorts* | 2,086 | 29 | ||||||
Entravision Communications, Cl A | 10,205 | 67 | ||||||
Ethan Allen Interiors | 4,316 | 149 | ||||||
Express* | 15,192 | 203 | ||||||
Fenix Parts* (A) | 49,691 | 170 | ||||||
Fiesta Restaurant Group* | 89,583 | 2,567 | ||||||
Five Below* (A) | 17,905 | 705 | ||||||
Flexsteel Industries | 173 | 9 | ||||||
Fossil Group* | 1,058 | 35 | ||||||
| Description | Shares | Market Value ($ Thousands) | ||||||
Francesca’s Holdings* | 2,597 | $ | 41 | |||||
Gannett | 26,400 | 252 | ||||||
Grand Canyon Education* | 25,082 | 1,432 | ||||||
Harman International Industries | 788 | 86 | ||||||
Haverty Furniture | 1,855 | 40 | ||||||
Helen of Troy* | 1,683 | 143 | ||||||
Hibbett Sports* (A) | 26,204 | 1,055 | ||||||
Horizon Global* | 25,550 | 588 | ||||||
Installed Building Products* | 21,050 | 874 | ||||||
International Game Technology | 5,292 | 136 | ||||||
Intrawest Resorts Holdings* | 701 | 12 | ||||||
iRobot* | 5,044 | 288 | ||||||
Isle of Capri Casinos* | 1,642 | 37 | ||||||
J Alexander’s Holdings* | 1,766 | 17 | ||||||
Jack in the Box | 22,830 | 2,375 | ||||||
John Wiley & Sons, Cl A | 2,732 | 150 | ||||||
K12* | 13,560 | 199 | ||||||
Kirkland’s* | 3,388 | 50 | ||||||
La Quinta Holdings* | 1,583 | 19 | ||||||
La-Z-Boy | 6,428 | 172 | ||||||
Lear | 837 | 108 | ||||||
Libbey | 13,569 | 260 | ||||||
Loral Space & Communications* | 950 | 37 | ||||||
Malibu Boats, Cl A* | 36,917 | 672 | ||||||
Marriott Vacations Worldwide | 13,820 | 1,073 | ||||||
MDC Partners, Cl A | 146,096 | 906 | ||||||
Media General* | 3,306 | 61 | ||||||
Modine Manufacturing* | 2,259 | 27 | ||||||
Monro Muffler | 25,551 | 1,528 | ||||||
Movado Group | 2,523 | 71 | ||||||
Murphy USA* | 10,894 | 743 | ||||||
NACCO Industries, Cl A | 2,812 | 267 | ||||||
National CineMedia | 82,656 | 1,268 | ||||||
New Media Investment | 7,262 | 112 | ||||||
New York Times, Cl A | 11,662 | 152 | ||||||
Nexstar Broadcasting Group, Cl A (A) | 24,345 | 1,452 | ||||||
Nutrisystem | 7,699 | 283 | ||||||
Office Depot | 27,092 | 132 | ||||||
Oxford Industries | 4,280 | 311 | ||||||
Papa John’s International | 3,391 | 300 | ||||||
Perry Ellis International* | 3,423 | 87 | ||||||
Pier 1 Imports | 2,301 | 13 | ||||||
Planet Fitness, Cl A (A) | 13,861 | 281 | ||||||
Pool | 9,802 | 986 | ||||||
Ruby Tuesday* | 4,822 | 15 | ||||||
Ruth’s Hospitality Group | 9,112 | 155 | ||||||
Sally Beauty Holdings* | 65,288 | 1,710 | ||||||
Shoe Carnival | 1,271 | 33 | ||||||
Sinclair Broadcast Group, Cl A | 772 | 25 | ||||||
Skechers U.S.A., Cl A* | 27,500 | 626 | ||||||
Smith & Wesson Holding* (A) | 1,784 | 42 | ||||||
SodaStream International* (A) | 19,140 | 697 | ||||||
| 1 | SEI Institutional Investments Trust / Semi-Annual Report / November 30, 2016 |
SCHEDULE OF INVESTMENTS (Unaudited)
Small Cap II Fund (Continued)
November 30, 2016
| Description | Shares | Market Value ($ Thousands) | ||||||
Spartan Motors | 38,644 | $ | 346 | |||||
Staples | 2,737 | 26 | ||||||
Steven Madden* | 7,442 | 276 | ||||||
Stoneridge* | 5,991 | 95 | ||||||
Strayer Education* | 293 | 21 | ||||||
Superior Industries International | 588 | 15 | ||||||
Tailored Brands | 13,608 | 255 | ||||||
Tenneco* | 939 | 55 | ||||||
Texas Roadhouse, Cl A | 17,110 | 802 | ||||||
Thor Industries | 3,073 | 309 | ||||||
Tilly’s, Cl A* | 2,397 | 24 | ||||||
Tower International | 4,222 | 111 | ||||||
Vista Outdoor* | 5,539 | 222 | ||||||
Visteon | 15,369 | 1,209 | ||||||
William Lyon Homes, Cl A* (A) | 60,338 | 1,195 | ||||||
Wingstop | 9,482 | 291 | ||||||
Winmark | 4,040 | 464 | ||||||
Wolverine World Wide | 87,066 | 1,962 | ||||||
Zagg* | 14,877 | 98 | ||||||
|
| |||||||
| 49,444 | ||||||||
|
| |||||||
Consumer Staples — 3.4% | ||||||||
Andersons | 36,509 | 1,437 | ||||||
B&G Foods, Cl A | 28,507 | 1,220 | ||||||
Boston Beer, Cl A* (A) | 505 | 87 | ||||||
Central Garden & Pet* | 11,313 | 327 | ||||||
Central Garden and Pet, Cl A* | 40,417 | 1,106 | ||||||
Darling International* | 45,501 | 615 | ||||||
Dean Foods | 3,157 | 63 | ||||||
Edgewell Personal Care* | 965 | 76 | ||||||
Energizer Holdings | 1,455 | 65 | ||||||
Fresh Del Monte Produce | 19,238 | 1,193 | ||||||
Hain Celestial Group* | 15,081 | 591 | ||||||
Hostess Brands* | 22,570 | 292 | ||||||
HRG Group* | 1,337 | 21 | ||||||
Ingredion | 398 | 47 | ||||||
Inventure Foods* | 91,630 | 828 | ||||||
John B Sanfilippo & Son | 7,096 | 452 | ||||||
Lancaster Colony | 903 | 122 | ||||||
Medifast | 4,899 | 191 | ||||||
National Beverage (A) | 1,391 | 70 | ||||||
Nu Skin Enterprises, Cl A | 3,362 | 175 | ||||||
Omega Protein* | 63,573 | 1,523 | ||||||
Performance Food Group* | 35,235 | 744 | ||||||
Pilgrim’s Pride | 4,605 | 81 | ||||||
Sanderson Farms (A) | 1,092 | 88 | ||||||
Seaboard* | 22 | 90 | ||||||
Snyder’s-Lance | 86,258 | 3,214 | ||||||
SpartanNash | 15,702 | 569 | ||||||
SUPERVALU* | 11,095 | 52 | ||||||
TreeHouse Foods* | 10,370 | 719 | ||||||
United Natural Foods* | 1,457 | 68 | ||||||
| Description | Shares | Market Value ($ Thousands) | ||||||
Vector Group (A) | 2,441 | $ | 52 | |||||
Weis Markets | 1,844 | 103 | ||||||
|
| |||||||
| 16,281 | ||||||||
|
| |||||||
Energy — 4.7% | ||||||||
Archrock | 4,422 | 59 | ||||||
Atwood Oceanics | 2,408 | 23 | ||||||
Bill Barrett* | 11,864 | 93 | ||||||
California Resources* (A) | 3,309 | 58 | ||||||
Callon Petroleum* | 85,949 | 1,516 | ||||||
Carrizo Oil & Gas* | 53,599 | 2,269 | ||||||
Contango Oil & Gas* | 23,093 | 228 | ||||||
Denbury Resources* | 7,935 | 30 | ||||||
DHT Holdings (A) | 15,398 | 55 | ||||||
Diamondback Energy* | 1,499 | 162 | ||||||
Eclipse Resources* | 2,112 | 6 | ||||||
Energen | 2,648 | 164 | ||||||
Evolution Petroleum | 147,297 | 1,245 | ||||||
Exterran* | 1,573 | 32 | ||||||
FMC Technologies* | 4,689 | 161 | ||||||
Forum Energy Technologies* | 27,915 | 607 | ||||||
Gener8 Maritime* | 15,790 | 64 | ||||||
Gulfport Energy* | 2,441 | 63 | ||||||
International Seaways* | 4,687 | 71 | ||||||
Jones Energy, Cl A* (A) | 14,465 | 67 | ||||||
Matrix Service* | 6,342 | 132 | ||||||
Murphy Oil | 2,444 | 83 | ||||||
Newfield Exploration* | 944 | 43 | ||||||
Oasis Petroleum* | 21,646 | 324 | ||||||
Oceaneering International | 733 | 19 | ||||||
Oil States International* | 22,625 | 811 | ||||||
Overseas Shipholding Group, Cl A | 14,063 | 109 | ||||||
Parsley Energy, Cl A* | 9,552 | 364 | ||||||
Patterson-UTI Energy | 41,685 | 1,112 | ||||||
PBF Energy, Cl A (A) | 121,929 | 2,925 | ||||||
PDC Energy* | 9,526 | 709 | ||||||
QEP Resources | 3,691 | 73 | ||||||
Range Resources | – | — | ||||||
Resolute Energy* (A) | 8,164 | 274 | ||||||
REX American Resources* | 1,246 | 122 | ||||||
Rice Energy* | 4,446 | 108 | ||||||
RigNet* | 32,210 | 556 | ||||||
Ring Energy* | 21,705 | 278 | ||||||
RSP Permian* | 9,104 | 406 | ||||||
SM Energy | 7,152 | 285 | ||||||
Southwestern Energy* | 216,705 | 2,460 | ||||||
Synergy Resources* (A) | 43,412 | 412 | ||||||
Tidewater (A) | 354,185 | 811 | ||||||
US Silica Holdings | 4,555 | 230 | ||||||
W&T Offshore* (A) | 18,228 | 31 | ||||||
Western Refining | 1,506 | 54 | ||||||
Whiting Petroleum* | 187,156 | 2,287 | ||||||
| 2 | SEI Institutional Investments Trust / Semi-Annual Report / November 30, 2016 |
SCHEDULE OF INVESTMENTS (Unaudited)
Small Cap II Fund (Continued)
November 30, 2016
| Description | Shares | Market Value ($ Thousands) | ||||||
World Fuel Services | 8,779 | $ | 390 | |||||
|
| |||||||
| 22,381 | ||||||||
|
| |||||||
Financials — 15.1% | ||||||||
1st Source | 1,000 | 39 | ||||||
AGNC Investment‡ | 7,081 | 132 | ||||||
Alleghany* | 32 | 18 | ||||||
Allied World Assurance Holdings | 1,688 | 79 | ||||||
Ambac Financial Group* | 2,455 | 60 | ||||||
American Equity Investment Life Holding | 123,280 | 2,556 | ||||||
American Financial Group | 2,888 | 237 | ||||||
American National Insurance | 196 | 24 | ||||||
Ameris Bancorp | 20,940 | 939 | ||||||
AMERISAFE | 406 | 26 | ||||||
Arch Capital Group* | 2,162 | 179 | ||||||
Argo Group International Holdings | 28,686 | 1,820 | ||||||
Aspen Insurance Holdings | 5,994 | 305 | ||||||
Assurant | 234 | 20 | ||||||
Assured Guaranty | 10,192 | 364 | ||||||
Avista Healthcare Public Acquisition* | 61,242 | 612 | ||||||
Axis Capital Holdings | 6,615 | 404 | ||||||
BancFirst | 1,334 | 109 | ||||||
Banco Latinoamericano de Comercio Exterior | 1,542 | 44 | ||||||
Bancorp* | 165,896 | 1,148 | ||||||
Bancorpsouth | 12,926 | 369 | ||||||
Bank of Hawaii | 2,360 | 197 | ||||||
BankUnited | 17,898 | 634 | ||||||
Bats Global Markets (A) | 20,172 | 641 | ||||||
Beneficial Bancorp | 13,791 | 240 | ||||||
Berkshire Hills Bancorp | 1,486 | 50 | ||||||
Blackstone Mortgage Trust, Cl A‡ | 24,526 | 738 | ||||||
BNC Bancorp | 9,179 | 277 | ||||||
Boston Private Financial Holdings | 2,696 | 40 | ||||||
Brookline Bancorp | 5,462 | 81 | ||||||
Bryn Mawr Bank | 454 | 17 | ||||||
Camden National | 1,412 | 55 | ||||||
Capital Bank Financial, Cl A | 4,069 | 146 | ||||||
Capitol Federal Financial | 103,195 | 1,642 | ||||||
Cardinal Financial | 434 | 14 | ||||||
Cathay General Bancorp | 545 | 19 | ||||||
CenterState Banks | 5,340 | 120 | ||||||
Central Pacific Financial | 5,008 | 148 | ||||||
Chemical Financial | 32,350 | 1,678 | ||||||
Chimera Investment‡ | 4,437 | 75 | ||||||
City Holding | 1,096 | 67 | ||||||
CNO Financial Group | 8,632 | 155 | ||||||
Colony Financial‡ | 5,648 | 116 | ||||||
Commerce Bancshares | 9,490 | 520 | ||||||
Community Bank System | 324 | 18 | ||||||
Community Trust Bancorp | 787 | 33 | ||||||
Cullen/Frost Bankers | 696 | 57 | ||||||
Dime Community Bancshares | 3,506 | 66 | ||||||
| Description | Shares | Market Value ($ Thousands) | ||||||
Eagle Bancorp* | 6,646 | $ | 390 | |||||
East West Bancorp | 2,937 | 141 | ||||||
Easterly Acquisition* | 29,432 | 39 | ||||||
Employers Holdings | 12,010 | 425 | ||||||
Endurance Specialty Holdings | 1,321 | 122 | ||||||
Enstar Group* | 290 | 57 | ||||||
Enterprise Financial Services | 7,355 | 282 | ||||||
Essent Group* | 1,941 | 59 | ||||||
EverBank Financial | 2,572 | 50 | ||||||
Evercore Partners, Cl A | 4,370 | 295 | ||||||
Everest Re Group | 2,896 | 610 | ||||||
FBL Financial Group, Cl A | 615 | 47 | ||||||
Federal Agricultural Mortgage, Cl C | 6,881 | 372 | ||||||
Federated Investors, Cl B | 5,746 | 158 | ||||||
Federated National Holding | 6,974 | 121 | ||||||
Fidelity Southern | 2,180 | 49 | ||||||
Financial Engines (A) | 25,876 | 902 | ||||||
First BanCorp* | 40,832 | 242 | ||||||
First Busey | 2,489 | 68 | ||||||
First Citizens BancShares, Cl A | 800 | 285 | ||||||
First Commonwealth Financial | 186,116 | 2,349 | ||||||
First Defiance Financial | 5,690 | 263 | ||||||
First Financial | 1,646 | 75 | ||||||
First Financial Bancorp | 457 | 12 | ||||||
First Horizon National | 28,571 | 545 | ||||||
First Interstate Bancsystem, Cl A | 21,265 | 803 | ||||||
First Merchants | 3,047 | 105 | ||||||
First NBC Bank Holding* (A) | 11,612 | 82 | ||||||
FirstCash | 1,163 | 53 | ||||||
Flagstar Bancorp* | 5,748 | 162 | ||||||
Flushing Financial | 7,306 | 191 | ||||||
FNB (Pennsylvania) | 273,715 | 4,182 | ||||||
Fulton Financial | 17,740 | 315 | ||||||
Genworth Financial, Cl A* | 21,664 | 93 | ||||||
Great Southern Bancorp | 730 | 36 | ||||||
Great Western Bancorp | 27,471 | 1,099 | ||||||
Green Dot, Cl A* | 88,645 | 2,137 | ||||||
Hancock Holding | 18,247 | 758 | ||||||
Hanmi Financial | 3,999 | 123 | ||||||
Hanover Insurance Group | 7,692 | 666 | ||||||
Heartland Financial USA | 9,277 | 398 | ||||||
Hercules Capital | 35,238 | 481 | ||||||
Heritage Financial | 3,706 | 84 | ||||||
Heritage Insurance Holdings | 6,805 | 98 | ||||||
HomeStreet* | 13,110 | 381 | ||||||
HomeTrust Bancshares* | 1,251 | 30 | ||||||
Horace Mann Educators | 17,011 | 683 | ||||||
Huntington Bancshares | 20,548 | 256 | ||||||
IBERIABANK | 21,966 | 1,820 | ||||||
Independent Bank | 5,388 | 140 | ||||||
Independent Bank Group | 4,804 | 289 | ||||||
Infinity Property & Casualty | 6,640 | 573 | ||||||
| 3 | SEI Institutional Investments Trust / Semi-Annual Report / November 30, 2016 |
SCHEDULE OF INVESTMENTS (Unaudited)
Small Cap II Fund (Continued)
November 30, 2016
| Description | Shares | Market Value ($ Thousands) | ||||||
International FCStone* | 4,043 | $ | 166 | |||||
Invesco Mortgage Capital‡ | 2,832 | 42 | ||||||
Investors Bancorp | 27,967 | 379 | ||||||
Janus Capital Group | 6,197 | 84 | ||||||
Lakeland Financial | 1,516 | 64 | ||||||
Legg Mason | 12,645 | 403 | ||||||
LendingClub* | 8,006 | 45 | ||||||
MB Financial | 11,223 | 486 | ||||||
Meta Financial Group | 3,071 | 279 | ||||||
MFA Financial‡ | 8,540 | 67 | ||||||
MGIC Investment* | 77,211 | 700 | ||||||
National Western Life Group, Cl A | 18 | 5 | ||||||
Navigators Group | 788 | 83 | ||||||
NBT Bancorp | 8,528 | 330 | ||||||
Nelnet, Cl A | 644 | 32 | ||||||
New Residential Investments‡ | 11,882 | 184 | ||||||
OFG Bancorp (A) | 242,362 | 3,272 | ||||||
Old National Bancorp | 66,335 | 1,131 | ||||||
Old Republic International | 1,904 | 34 | ||||||
OneBeacon Insurance Group, Cl A | 9,312 | 143 | ||||||
Opus Bank | 4,625 | 117 | ||||||
Pace Holdings* | 59,317 | 606 | ||||||
Pacific Premier Bancorp* | 955 | 31 | ||||||
PacWest Bancorp | 9,461 | 485 | ||||||
Park National | 2,528 | 282 | ||||||
PennantPark Investment (A) | 69,840 | 520 | ||||||
People’s United Financial | 6,116 | 115 | ||||||
Popular | 8,963 | 364 | ||||||
PRA Group* | 1,288 | 46 | ||||||
Preferred Bank | 10,983 | 495 | ||||||
Primerica | 3,971 | 281 | ||||||
PrivateBancorp, Cl A | 3,704 | 173 | ||||||
ProAssurance | 20,205 | 1,133 | ||||||
Prosperity Bancshares | 12,930 | 855 | ||||||
Radian Group | 13,647 | 199 | ||||||
Raymond James Financial | 1,402 | 101 | ||||||
Reinsurance Group of America, Cl A | 942 | 115 | ||||||
RenaissanceRe Holdings | 276 | 36 | ||||||
Sandy Spring Bancorp | 1,620 | 59 | ||||||
ServisFirst Bancshares | 7,737 | 570 | ||||||
SLM* | 61,893 | 623 | ||||||
Starwood Property Trust‡ | 3,784 | 85 | ||||||
Sterling Bancorp | 36,606 | 833 | ||||||
Stock Yards Bancorp | 1,283 | 53 | ||||||
Stonegate Bank | 486 | 19 | ||||||
Synovus Financial | 3,686 | 143 | ||||||
TCF Financial | 28,195 | 489 | ||||||
Texas Capital Bancshares* | 3,193 | 232 | ||||||
Tompkins Financial | 779 | 67 | ||||||
Towne Bank | 3,201 | 103 | ||||||
TriCo Bancshares | 1,340 | 42 | ||||||
TrustCo Bank | 1,643 | 13 | ||||||
| Description | Shares | Market Value ($ Thousands) | ||||||
Trustmark | 625 | $ | 21 | |||||
Two Harbors Investment‡ | 8,484 | 74 | ||||||
UMB Financial | 841 | 64 | ||||||
Union Bankshares | 4,596 | 155 | ||||||
United Fire Group | 8,330 | 378 | ||||||
Univest Corp of Pennsylvania | 32,525 | 929 | ||||||
Validus Holdings | 13,928 | 757 | ||||||
Voya Financial | 46,800 | 1,819 | ||||||
Waddell & Reed Financial, Cl A | 6,857 | 134 | ||||||
Walker & Dunlop* | 185 | 5 | ||||||
Washington Federal | 1,258 | 41 | ||||||
Washington Trust Bancorp | 539 | 27 | ||||||
Waterstone Financial | 1,416 | 25 | ||||||
Webster Financial | 22,128 | 1,098 | ||||||
Westamerica Bancorporation | 429 | 27 | ||||||
Western Alliance Bancorp* | 33,215 | 1,552 | ||||||
White Mountains Insurance Group | 82 | 69 | ||||||
Wintrust Financial | 40,547 | 2,670 | ||||||
WisdomTree Investments (A) | 58,953 | 652 | ||||||
Zions Bancorporation | 77,468 | 3,082 | ||||||
|
| |||||||
| 72,117 | ||||||||
|
| |||||||
Health Care — 12.5% | ||||||||
Accelerate Diagnostics* (A) | 17,264 | 431 | ||||||
Aclaris Therapeutics* | 10,798 | 323 | ||||||
Acorda Therapeutics* | 1,097 | 23 | ||||||
Aerie Pharmaceuticals* | 7,813 | 290 | ||||||
Aimmune Therapeutics* | 12,592 | 286 | ||||||
Akorn* | 40,400 | 857 | ||||||
Alere* | 1,529 | 61 | ||||||
Allscripts Healthcare Solutions* | 3,885 | 43 | ||||||
AMAG Pharmaceuticals* (A) | 96,321 | 3,198 | ||||||
AMN Healthcare Services* | 66,558 | 2,216 | ||||||
Amphastar Pharmaceuticals* | 12,662 | 257 | ||||||
Amsurg, Cl A* | 9,414 | 641 | ||||||
Analogic | 14,499 | 1,336 | ||||||
AngioDynamics* | 1,018 | 17 | ||||||
Anika Therapeutics* | 2,006 | 94 | ||||||
Applied Genetic Technologies* | 4,521 | 42 | ||||||
Atara Biotherapeutics* | 15,965 | 317 | ||||||
athenahealth* | 5,044 | 477 | ||||||
Avexis* (A) | 4,618 | 273 | ||||||
BioDelivery Sciences International* (A) | 132,623 | 225 | ||||||
Bio-Rad Laboratories, Cl A* | 2,022 | 351 | ||||||
BioSpecifics Technologies* | 2,026 | 100 | ||||||
BioTelemetry* | 17,776 | 346 | ||||||
Bluebird Bio* (A) | 7,313 | 441 | ||||||
Cantel Medical | 3,668 | 299 | ||||||
Capital Senior Living* | 86,895 | 1,354 | ||||||
Cara Therapeutics* (A) | 22,994 | 207 | ||||||
Cardiovascular Systems* | 12,450 | 301 | ||||||
Castlight Health, Cl B* (A) | 84,110 | 391 | ||||||
| 4 | SEI Institutional Investments Trust / Semi-Annual Report / November 30, 2016 |
SCHEDULE OF INVESTMENTS (Unaudited)
Small Cap II Fund (Continued)
November 30, 2016
| Description | Shares | Market Value ($ Thousands) | ||||||
Catalent* | 19,120 | $ | 458 | |||||
Charles River Laboratories International* | 5,361 | 381 | ||||||
Chimerix* | 72,036 | 352 | ||||||
CoLucid Pharmaceuticals* (A) | 8,586 | 304 | ||||||
Community Health Systems* (A) | 8,600 | 47 | ||||||
Corcept Therapeutics* | 29,564 | 248 | ||||||
Cynosure, Cl A* | 47,927 | 2,173 | ||||||
DBV Technologies ADR* | 9,470 | 346 | ||||||
Dermira* | 7,756 | 248 | ||||||
Diplomat Pharmacy* | 16,387 | 232 | ||||||
Eagle Pharmaceuticals* (A) | 3,557 | 281 | ||||||
Emergent Biosolutions* | 19,237 | 515 | ||||||
Enanta Pharmaceuticals* | 1,349 | 42 | ||||||
Endologix* (A) | 69,305 | 509 | ||||||
Ensign Group | 38,465 | 832 | ||||||
Entellus Medical* (A) | 17,816 | 328 | ||||||
Exact Sciences* (A) | 32,534 | 481 | ||||||
Exactech* | 1,112 | 28 | ||||||
Exelixis* | 19,459 | 329 | ||||||
Five Prime Therapeutics* | 990 | 57 | ||||||
Flamel Technologies ADR* | 89,949 | 955 | ||||||
Glaukos* | 5,640 | 176 | ||||||
Globus Medical, Cl A* | 4,943 | 107 | ||||||
Halozyme Therapeutics* (A) | 2,512 | 30 | ||||||
HealthSouth | 17,346 | 723 | ||||||
HealthStream* | 15,996 | 401 | ||||||
Heska* | 4,401 | 291 | ||||||
HMS Holdings* | 5,224 | 96 | ||||||
ICU Medical* | 1,857 | 279 | ||||||
INC Research Holdings, Cl A* | 26,379 | 1,306 | ||||||
Insulet* | 11,978 | 403 | ||||||
Integer Holdings* | 814 | 23 | ||||||
Integra LifeSciences Holdings* | 47,979 | 3,877 | ||||||
Intercept Pharmaceuticals* (A) | 4,961 | 502 | ||||||
iRadimed* (A) | 2,408 | 27 | ||||||
Kindred Healthcare | 95,820 | 637 | ||||||
Lannett* (A) | 149,632 | 3,427 | ||||||
LeMaitre Vascular | 2,152 | 49 | ||||||
Ligand Pharmaceuticals* (A) | 27,625 | 2,884 | ||||||
Magellan Health Services* | 1,739 | 127 | ||||||
Marinus Pharmaceuticals* (A) | 74,106 | 78 | ||||||
Masimo* | 7,838 | 485 | ||||||
Medidata Solutions* | 12,746 | 704 | ||||||
Medpace Holdings* | 4,424 | 158 | ||||||
Merit Medical Systems* | 15,997 | 377 | ||||||
MiMedx Group* (A) | 85,580 | 811 | ||||||
Mirati Therapeutics* | 1,698 | 9 | ||||||
Molina Healthcare* | 33,898 | 1,792 | ||||||
Myriad Genetics* | 5,144 | 86 | ||||||
National Research, Cl A | 9,506 | 152 | ||||||
Natus Medical* | 1,474 | 59 | ||||||
Neurocrine Biosciences* | 6,872 | 319 | ||||||
| Description | Shares | Market Value ($ Thousands) | ||||||
Neuroderm* (A) | 20,038 | $ | 327 | |||||
Nevro* (A) | 6,858 | 521 | ||||||
Novadaq Technologies* (A) | 45,330 | 360 | ||||||
Omnicell* | 24,565 | 881 | ||||||
OraSure Technologies* | 64,825 | 546 | ||||||
Orthofix International* | 2,137 | 80 | ||||||
OvaScience* | 13,000 | 44 | ||||||
Owens & Minor | 1,721 | 58 | ||||||
Pacific Biosciences of California* (A) | 41,201 | 314 | ||||||
Patterson | 11,685 | 453 | ||||||
PDL BioPharma | 72,552 | 159 | ||||||
Penumbra* | 4,834 | 299 | ||||||
PerkinElmer | 4,248 | 215 | ||||||
Phibro Animal Health, Cl A | 2,628 | 72 | ||||||
Portola Pharmaceuticals, Cl A* | 1,242 | 22 | ||||||
Prestige Brands Holdings* | 74,403 | 3,539 | ||||||
Prothena* (A) | 850 | 50 | ||||||
Quality Systems | 1,291 | 17 | ||||||
Quidel* | 14,052 | 322 | ||||||
Radius Health* (A) | 6,634 | 353 | ||||||
REGENXBIO* | 12,467 | 277 | ||||||
Repligen* | 11,064 | 356 | ||||||
Revance Therapeutics* (A) | 23,056 | 386 | ||||||
Sarepta Therapeutics* | 1,036 | 35 | ||||||
SciClone Pharmaceuticals* | 14,905 | 148 | ||||||
Spectranetics* | 28,212 | 616 | ||||||
Supernus Pharmaceuticals* | 50,775 | 1,094 | ||||||
SurModics* | 4,474 | 107 | ||||||
Syndax Pharmaceuticals* | 23,639 | 229 | ||||||
Synergy Pharmaceuticals* (A) | 50,864 | 268 | ||||||
Team Health Holdings* | 1,604 | 68 | ||||||
Teleflex | 520 | 77 | ||||||
TESARO* (A) | 3,446 | 468 | ||||||
TransEnterix* (A) | 28,958 | 44 | ||||||
Triple-S Management, Cl B* | 18,212 | 406 | ||||||
Trupanion* (A) | 21,045 | 350 | ||||||
Vascular Solutions* | 6,099 | 336 | ||||||
Veeva Systems, Cl A* | 5,505 | 256 | ||||||
Versartis* | 26,547 | 330 | ||||||
VWR* | 440 | 12 | ||||||
WellCare Health Plans* | 1,481 | 203 | ||||||
Xencor* | 15,941 | 407 | ||||||
Zeltiq Aesthetics* (A) | 5,290 | 233 | ||||||
|
| |||||||
| 60,076 | ||||||||
|
| |||||||
Industrials — 18.2% | ||||||||
AAR | 13,716 | 506 | ||||||
ABM Industries | 245 | 11 | ||||||
Acacia Research | 118,159 | 815 | ||||||
ACCO Brands* | 156,794 | 1,952 | ||||||
Actuant, Cl A | 11,653 | 302 | ||||||
Advisory Board* | 8,416 | 298 | ||||||
| 5 | SEI Institutional Investments Trust / Semi-Annual Report / November 30, 2016 |
SCHEDULE OF INVESTMENTS (Unaudited)
Small Cap II Fund (Continued)
November 30, 2016
| Description | Shares | Market Value ($ Thousands) | ||||||
Aegion, Cl A* | 729 | $ | 18 | |||||
AGCO | 1,096 | 61 | ||||||
Alamo Group | 1,422 | 104 | ||||||
Alaska Air Group | 528 | 43 | ||||||
Allegiant Travel, Cl A | 366 | 60 | ||||||
Allison Transmission Holdings, Cl A | 725 | 24 | ||||||
Altra Industrial Motion | 7,280 | 255 | ||||||
American Woodmark* | 1,258 | 96 | ||||||
Apogee Enterprises | 55,126 | 2,630 | ||||||
Applied Industrial Technologies | 1,878 | 112 | ||||||
ArcBest | 1,660 | 51 | ||||||
Argan | 4,549 | 275 | ||||||
Astec Industries | 5,327 | 353 | ||||||
Atlas Air Worldwide Holdings* | 58,750 | 2,902 | ||||||
Barnes Group | 25,549 | 1,180 | ||||||
Brady, Cl A | 13,636 | 501 | ||||||
Briggs & Stratton | 9,864 | 204 | ||||||
BWX Technologies | 38,847 | 1,521 | ||||||
CAI International* | 1,586 | 14 | ||||||
Carlisle | 804 | 90 | ||||||
CEB | 23,916 | 1,410 | ||||||
Chicago Bridge & Iron | 18,658 | 625 | ||||||
CIRCOR International | 17,200 | 1,090 | ||||||
Clean Harbors* | 32,211 | 1,702 | ||||||
Comfort Systems USA | 9,772 | 315 | ||||||
Continental Building Products* | 1,492 | 33 | ||||||
CRA International | 3,589 | 118 | ||||||
Crane | 24,434 | 1,796 | ||||||
Curtiss-Wright | 13,475 | 1,355 | ||||||
Deluxe | 23,594 | 1,597 | ||||||
DigitalGlobe* | 8,714 | 280 | ||||||
Ducommun* | 2,588 | 74 | ||||||
EMCOR Group | 35,047 | 2,431 | ||||||
EnerSys | 492 | 39 | ||||||
Engility Holdings* | 1,635 | 59 | ||||||
Ennis | 38,072 | 615 | ||||||
EnPro Industries | 7,264 | 442 | ||||||
ESCO Technologies | 166 | 9 | ||||||
Esterline Technologies* | 1,777 | 156 | ||||||
Federal Signal | 723 | 11 | ||||||
Forward Air | 21,280 | 1,030 | ||||||
Franklin Electric | 24,405 | 953 | ||||||
FreightCar America | 2,038 | 30 | ||||||
G&K Services, Cl A | 122 | 12 | ||||||
Generac Holdings* | 10,092 | 414 | ||||||
General Cable | 1,268 | 24 | ||||||
Gibraltar Industries* | 18,791 | 846 | ||||||
Global Brass & Copper Holdings | 18,929 | 542 | ||||||
Greenbrier | 439 | 17 | ||||||
Griffon | 14,076 | 336 | ||||||
Harsco | 4,483 | 63 | ||||||
Hawaiian Holdings* | 1,326 | 68 | ||||||
| Description | Shares | Market Value ($ Thousands) | ||||||
Heartland Express | 50,867 | $ | 1,094 | |||||
HEICO, Cl A | 13,351 | 897 | ||||||
Heidrick & Struggles International | 4,689 | 99 | ||||||
Heritage-Crystal Clean* | 111,353 | 1,815 | ||||||
Herman Miller | 2,097 | 68 | ||||||
Hexcel | 8,462 | 438 | ||||||
Hudson Technologies* | 35,766 | 272 | ||||||
Huntington Ingalls Industries | 1,774 | 317 | ||||||
Huron Consulting Group* | 41,575 | 2,193 | ||||||
Hyster-Yale Materials Handling | 133 | 9 | ||||||
ICF International* | 5,846 | 324 | ||||||
InnerWorkings* | 114,745 | 1,061 | ||||||
Insperity | 2,619 | 190 | ||||||
Insteel Industries | 7,802 | 309 | ||||||
Interface, Cl A | 2,781 | 48 | ||||||
ITT | 40,424 | 1,632 | ||||||
Jacobs Engineering Group* | 1,180 | 73 | ||||||
JetBlue Airways* | 9,082 | 182 | ||||||
John Bean Technologies | 17,645 | 1,592 | ||||||
Joy Global | 4,614 | 129 | ||||||
Kadant | 2,201 | 138 | ||||||
Kelly Services, Cl A | 3,121 | 63 | ||||||
Kennametal | 51,756 | 1,785 | ||||||
KEYW Holding* (A) | 23,715 | 297 | ||||||
Kforce | 6,825 | 151 | ||||||
Kirby* | 16,319 | 1,035 | ||||||
Knoll | 2,276 | 60 | ||||||
Korn/Ferry International | 17,364 | 441 | ||||||
Kratos Defense & Security Solutions* | 40,744 | 298 | ||||||
LB Foster, Cl A | 78,240 | 958 | ||||||
Lincoln Electric Holdings | 240 | 19 | ||||||
LSC Communications | 5,067 | 105 | ||||||
Lydall* | 4,472 | 267 | ||||||
Macquarie Infrastructure | 1,501 | 123 | ||||||
Manpowergroup | 1,878 | 160 | ||||||
MasTec* | 53,246 | 2,021 | ||||||
Matson | 1,159 | 44 | ||||||
Matthews International, Cl A | 4,493 | 327 | ||||||
McGrath RentCorp | 7,905 | 292 | ||||||
Meritor* | 13,088 | 165 | ||||||
Mistras Group* | 2,450 | 58 | ||||||
Moog, Cl A* | 2,740 | 191 | ||||||
MRC Global* | 16,824 | 339 | ||||||
MSA Safety | 14,870 | 924 | ||||||
Mueller Industries | 6,228 | 237 | ||||||
Mueller Water Products, Cl A | 26,897 | 356 | ||||||
Multi-Color | 2,922 | 210 | ||||||
MYR Group* | 6,222 | 233 | ||||||
National Presto Industries | 1,314 | 125 | ||||||
Navigant Consulting* | 11,997 | 296 | ||||||
NCI Building Systems* | 19,103 | 319 | ||||||
Nordson | 2,736 | 292 | ||||||
| 6 | SEI Institutional Investments Trust / Semi-Annual Report / November 30, 2016 |
SCHEDULE OF INVESTMENTS (Unaudited)
Small Cap II Fund (Continued)
November 30, 2016
| Description | Shares | Market Value ($ Thousands) | ||||||
Northwest Pipe* | 4,399 | $ | 77 | |||||
On Assignment* | 65,742 | 2,715 | ||||||
Orbital ATK | 1,128 | 96 | ||||||
Oshkosh Truck | 21,427 | 1,500 | ||||||
Owens Corning | 3,831 | 197 | ||||||
Park-Ohio Holdings | 6,262 | 264 | ||||||
Patrick Industries* | 3,414 | 244 | ||||||
Ply Gem Holdings* | 13,202 | 201 | ||||||
Proto Labs* (A) | 12,773 | 666 | ||||||
Quad, Cl A | 5,579 | 157 | ||||||
Quanta Services* | 9,512 | 321 | ||||||
Regal-Beloit | 7,205 | 525 | ||||||
Rexnord* | 2,903 | 64 | ||||||
Ritchie Bros Auctioneers | 8,214 | 314 | ||||||
Roadrunner Transportation Systems* | 17,134 | 172 | ||||||
RPX* | 16,353 | 171 | ||||||
Rush Enterprises, Cl A* | 286 | 9 | ||||||
Saia* | 7,590 | 317 | ||||||
SkyWest | 9,102 | 335 | ||||||
Snap-on | 120 | 20 | ||||||
SP Plus* | 43,560 | 1,209 | ||||||
Sparton* | 3,453 | 84 | ||||||
Spirit AeroSystems Holdings, Cl A | 3,062 | 178 | ||||||
SPX FLOW* | 2,101 | 66 | ||||||
Standex International | 6,077 | 535 | ||||||
Steelcase, Cl A | 11,445 | 178 | ||||||
Supreme Industries, Cl A | 10,112 | 143 | ||||||
Swift Transporation, Cl A* (A) | 42,572 | 1,063 | ||||||
TASER International* (A) | 15,229 | 415 | ||||||
Team* | 33,712 | 1,156 | ||||||
Teledyne Technologies* | 2,117 | 264 | ||||||
Tennant | 13,732 | 1,031 | ||||||
Terex | 21,164 | 646 | ||||||
Tetra Tech | 20,618 | 884 | ||||||
Timken | 1,158 | 45 | ||||||
Titan International | 27,109 | 313 | ||||||
TriMas* | 18,415 | 395 | ||||||
TriNet Group* | 69,791 | 1,761 | ||||||
Triumph Group | 93,221 | 2,592 | ||||||
TrueBlue* | 22,852 | 479 | ||||||
Tutor Perini* | 3,047 | 80 | ||||||
UniFirst | 2,698 | 381 | ||||||
United Rentals* | 266 | 27 | ||||||
Universal Forest Products | 2,673 | 266 | ||||||
Vectrus* | 11,019 | 255 | ||||||
Viad | 6,206 | 272 | ||||||
Wabash National | 5,204 | 72 | ||||||
WageWorks* | 29,885 | 2,207 | ||||||
Watts Water Technologies, Cl A | 2,910 | 199 | ||||||
Wesco Aircraft Holdings* | 104,720 | 1,545 | ||||||
WESCO International* | 6,835 | 464 | ||||||
XPO Logistics* (A) | 30,553 | 1,361 | ||||||
| Description | Shares | Market Value ($ Thousands) | ||||||
Xylem | 1,138 | $ | 59 | |||||
|
| |||||||
| 86,931 | ||||||||
|
| |||||||
Information Technology — 18.9% | ||||||||
A10 Networks* | 2,623 | 21 | ||||||
Actua* | 43,734 | 593 | ||||||
Acxiom* | 88,330 | 2,343 | ||||||
Advanced Energy Industries* | 7,331 | 405 | ||||||
Advanced Micro Devices* | 13,852 | 123 | ||||||
Alarm.com Holdings* | 7,356 | 218 | ||||||
Alpha & Omega Semiconductor* | 8,213 | 179 | ||||||
Amkor Technology* | 23,472 | 277 | ||||||
Anixter International* | 10,055 | 786 | ||||||
Arrow Electronics* | 2,984 | 204 | ||||||
Aspen Technology* | 23,300 | 1,231 | ||||||
Avid Technology* | 3,686 | 16 | ||||||
Avnet | 4,261 | 196 | ||||||
Axcelis Technologies* | 1,914 | 26 | ||||||
Bankrate* | 11,868 | 122 | ||||||
Barracuda Networks* | 20,328 | 448 | ||||||
Benchmark Electronics* | 15,069 | 427 | ||||||
Black Box | 86,121 | 1,322 | ||||||
Blackhawk Network Holdings, Cl A* | 43,975 | 1,583 | ||||||
Blackline* | 3,518 | 95 | ||||||
Booz Allen Hamilton Holding | 7,809 | 295 | ||||||
Bottomline Technologies de* | 33,130 | 830 | ||||||
Brightcove* | 8,529 | 71 | ||||||
BroadSoft* | 5,852 | 243 | ||||||
Brocade Communications Systems | 8,309 | 103 | ||||||
CACI International, Cl A* | 4,366 | 565 | ||||||
CalAmp* | 153,284 | 2,229 | ||||||
Callidus Software* | 166,645 | 2,616 | ||||||
Carbonite* | 69,360 | 1,283 | ||||||
Cardtronics* | 6,471 | 320 | ||||||
Cavium* | 46,452 | 2,649 | ||||||
CEVA* | 7,831 | 249 | ||||||
ChannelAdvisor* | 66,461 | 957 | ||||||
Cimpress* (A) | 6,417 | 558 | ||||||
Cirrus Logic* | 5,963 | 328 | ||||||
Cognex | 4,782 | 286 | ||||||
Coherent* | 5,180 | 676 | ||||||
Cohu | 2,931 | 36 | ||||||
CommVault Systems* | 27,142 | 1,466 | ||||||
comScore* | 13,660 | 397 | ||||||
Convergys | 4,687 | 121 | ||||||
Cornerstone OnDemand* | 39,094 | 1,404 | ||||||
Cray* | 1,978 | 38 | ||||||
CSG Systems International | 2,097 | 93 | ||||||
CSRA | 24,502 | 784 | ||||||
CTS | 23,408 | 517 | ||||||
Cypress Semiconductor | 142,271 | 1,601 | ||||||
Descartes* | 21,104 | 467 | ||||||
| 7 | SEI Institutional Investments Trust / Semi-Annual Report / November 30, 2016 |
SCHEDULE OF INVESTMENTS (Unaudited)
Small Cap II Fund (Continued)
November 30, 2016
| Description | Shares | Market Value ($ Thousands) | ||||||
DHI Group* | 8,608 | $ | 52 | |||||
Diebold | 18,522 | 422 | ||||||
DTS | 23,487 | 997 | ||||||
Ebix (A) | 5,361 | 320 | ||||||
EchoStar, Cl A* | 5,931 | 302 | ||||||
Electronics For Imaging* | 22,710 | 988 | ||||||
EMCORE | 12,679 | 81 | ||||||
Entegris* | 585 | 10 | ||||||
Envestnet* | 15,564 | 562 | ||||||
Euronet Worldwide* | 3,631 | 260 | ||||||
Everbridge* | 17,595 | 280 | ||||||
Everi Holdings* | 9,988 | 22 | ||||||
EVERTEC | 10,640 | 194 | ||||||
Everyday Health* | 642 | 7 | ||||||
Exa* | 63,760 | 946 | ||||||
Exar* | 3,344 | 33 | ||||||
ExlService Holdings* | 16,175 | 769 | ||||||
Extreme Networks* | 2,072 | 9 | ||||||
Fair Isaac | 50 | 6 | ||||||
FARO Technologies* | 3,067 | 112 | ||||||
Finisar* | 14,576 | 484 | ||||||
FireEye* (A) | 152,611 | 1,960 | ||||||
First Solar* | 1,483 | 45 | ||||||
Five9* | 70,043 | 1,109 | ||||||
Forrester Research | 10,426 | 426 | ||||||
Gigamon* | 5,528 | 295 | ||||||
GigPeak* | 26,302 | 71 | ||||||
GoDaddy, Cl A* (A) | 7,410 | 262 | ||||||
Hackett Group | 4,631 | 82 | ||||||
IAC | 4,165 | 281 | ||||||
II-VI* | 37,949 | 1,146 | ||||||
Ingram Micro, Cl A | 2,772 | 104 | ||||||
Inphi* | 28,327 | 1,280 | ||||||
Insight Enterprises* | 7,872 | 276 | ||||||
Integrated Device Technology* | 8,650 | 202 | ||||||
InterDigital | 3,700 | 293 | ||||||
Intersil, Cl A | 6,075 | 135 | ||||||
Ixia* | 112,080 | 1,541 | ||||||
IXYS | 11,121 | 130 | ||||||
j2 Global | 341 | 25 | ||||||
Jabil Circuit | 1,625 | 34 | ||||||
Keysight Technologies* | 66,315 | 2,442 | ||||||
Littelfuse | 9,970 | 1,454 | ||||||
LivePerson* | 77,150 | 617 | ||||||
LogMeIn | 2,040 | 206 | ||||||
Lumentum Holdings* | 46,019 | 1,845 | ||||||
MACOM Technology Solutions Holdings* | 16,592 | 827 | ||||||
ManTech International, Cl A | 9,146 | 393 | ||||||
Marvell Technology Group | 11,455 | 164 | ||||||
MAXIMUS | 25,742 | 1,423 | ||||||
MaxLinear, Cl A* | 3,950 | 81 | ||||||
MeetMe* | 9,443 | 46 | ||||||
| Description | Shares | Market Value ($ Thousands) | ||||||
Mentor Graphics | 10,482 | $ | 383 | |||||
Mesa Laboratories (A) | 2,687 | 333 | ||||||
Microsemi* | 6,676 | 366 | ||||||
MicroStrategy, Cl A* | 375 | 73 | ||||||
MINDBODY, Cl A* (A) | 16,270 | 351 | ||||||
Mitek Systems* (A) | 8,064 | 45 | ||||||
MKS Instruments | 28,568 | 1,644 | ||||||
Monolithic Power Systems | 13,027 | 1,069 | ||||||
Monotype Imaging Holdings | 3,726 | 73 | ||||||
Nanometrics* | 20,441 | 489 | ||||||
NeoPhotonics* | 7,945 | 103 | ||||||
NETGEAR* | 11,698 | 628 | ||||||
NeuStar, Cl A* | 2,563 | 62 | ||||||
New Relic* | 10,725 | 340 | ||||||
NIC | 1,658 | 42 | ||||||
Oclaro* | 31,876 | 285 | ||||||
Open Text | 28,136 | 1,788 | ||||||
Orbotech* | 20,910 | 662 | ||||||
OSI Systems* | 9,894 | 749 | ||||||
PDF Solutions* | 95,439 | 2,248 | ||||||
Perficient* | 82,318 | 1,482 | ||||||
Photronics* | 29,563 | 296 | ||||||
Progress Software | 6,395 | 189 | ||||||
Proofpoint* | 22,842 | 1,759 | ||||||
PTC* | 15,864 | 773 | ||||||
QAD, Cl A | 16,214 | 470 | ||||||
QuinStreet* | 2,482 | 8 | ||||||
RealPage* | 31,000 | 887 | ||||||
RetailMeNot* | 25,227 | 232 | ||||||
Rogers* | 1,294 | 96 | ||||||
Rubicon Project* | 35,282 | 266 | ||||||
Rudolph Technologies* | 15,857 | 311 | ||||||
Sanmina* | 49,261 | 1,618 | ||||||
ScanSource* | 2,742 | 104 | ||||||
Semtech* | 14,939 | 420 | ||||||
Shutterstock* (A) | 7,150 | 336 | ||||||
Silicon Laboratories* | 867 | 58 | ||||||
Sonus Networks* | 35,811 | 216 | ||||||
SPS Commerce* | 4,499 | 312 | ||||||
Stratasys* (A) | 22,452 | 405 | ||||||
Sykes Enterprises* | 18,118 | 511 | ||||||
Synaptics* | 5,213 | 285 | ||||||
Synchronoss Technologies* | 6,636 | 322 | ||||||
SYNNEX | 2,899 | 339 | ||||||
Synopsys* | 4,519 | 273 | ||||||
Tech Data* | 20,614 | 1,749 | ||||||
Telenav* | 464 | 3 | ||||||
TeleTech Holdings | 1,810 | 52 | ||||||
Teradyne | 6,603 | 161 | ||||||
Tessera Technologies | 7,810 | 309 | ||||||
TiVo* | 5,640 | 114 | ||||||
Travelport Worldwide | 6,226 | 87 | ||||||
| 8 | SEI Institutional Investments Trust / Semi-Annual Report / November 30, 2016 |
SCHEDULE OF INVESTMENTS (Unaudited)
Small Cap II Fund (Continued)
November 30, 2016
| Description | Shares | Market Value ($ Thousands) | ||||||
TrueCar* (A) | 23,383 | $ | 289 | |||||
TTM Technologies* | 16,268 | 221 | ||||||
Unisys* (A) | 2,907 | 43 | ||||||
VeriFone Systems* | 149,560 | 2,526 | ||||||
Verint Systems* | 2,417 | 91 | ||||||
Viavi Solutions* | 6,114 | 48 | ||||||
Virtusa* | 12,619 | 280 | ||||||
XO Group* | 5,211 | 96 | ||||||
Zebra Technologies, Cl A* | 36,235 | 2,864 | ||||||
Zedge, Cl B* | 1 | — | ||||||
Zix* | 8,334 | 37 | ||||||
|
| |||||||
| 90,519 | ||||||||
|
| |||||||
Materials — 5.7% | ||||||||
A. Schulman | 68,428 | 2,279 | ||||||
AEP Industries | 107 | 13 | ||||||
AK Steel Holding* | 6,107 | 56 | ||||||
Allegheny Technologies (A) | 19,235 | 337 | ||||||
Avery Dennison | 2,658 | 192 | ||||||
Balchem | 3,904 | 312 | ||||||
Bemis | 2,290 | 115 | ||||||
Berry Plastics Group* | 55,829 | 2,779 | ||||||
Cabot | 4,557 | 232 | ||||||
Chemours | 34,367 | 850 | ||||||
Chemtura* | 1,411 | 46 | ||||||
Cliffs Natural Resources* (A) | 47,002 | 414 | ||||||
Coeur Mining* | 25,771 | 249 | ||||||
Commercial Metals | 35,138 | 773 | ||||||
Eagle Materials | 11,800 | 1,147 | ||||||
Ferro* | 3,814 | 56 | ||||||
Ferroglobe* | 2,398 | — | ||||||
Ferroglobe PLC | 2,398 | 27 | ||||||
FMC | 20,385 | 1,144 | ||||||
FutureFuel | 13,645 | 187 | ||||||
Greif, Cl A | 572 | 29 | ||||||
Headwaters* | 33,830 | 802 | ||||||
Hecla Mining | 9,420 | 57 | ||||||
Huntsman | 9,756 | 190 | ||||||
Ingevity* | 23,476 | 1,229 | ||||||
Innophos Holdings | 7,439 | 406 | ||||||
Innospec | 11,416 | 750 | ||||||
Kaiser Aluminum | 2,432 | 200 | ||||||
KapStone Paper and Packaging | 14,096 | 288 | ||||||
Koppers Holdings* | 3,385 | 130 | ||||||
Kraton Performance Polymers* | 582 | 18 | ||||||
LSB Industries* (A) | 195,963 | 1,509 | ||||||
Materion | 3,429 | 131 | ||||||
Minerals Technologies | 11,525 | 934 | ||||||
Neenah Paper | 3,490 | 296 | ||||||
Olin | 17,945 | 467 | ||||||
Olympic Steel | 12,490 | 305 | ||||||
OMNOVA Solutions* | 8,971 | 86 | ||||||
| Description | Shares | Market Value ($ Thousands) | ||||||
Owens-Illinois* | 49,920 | $ | 917 | |||||
PolyOne | 447 | 15 | ||||||
Rayonier Advanced Materials (A) | 15,643 | 217 | ||||||
Reliance Steel & Aluminum | 3,284 | 266 | ||||||
Royal Gold | 726 | 51 | ||||||
Ryerson Holding* | 37,369 | 534 | ||||||
Scotts Miracle-Gro, Cl A | 3,974 | 363 | ||||||
Sensient Technologies | 12,850 | 1,003 | ||||||
Silgan Holdings | 6,599 | 327 | ||||||
Sonoco Products | 1,380 | 75 | ||||||
Steel Dynamics | 7,405 | 263 | ||||||
Stepan | 909 | 74 | ||||||
Summit Materials, Cl A* | 11,277 | 268 | ||||||
SunCoke Energy | 14,866 | 170 | ||||||
Tahoe Resources | 6,170 | 59 | ||||||
Trinseo | 8,626 | 505 | ||||||
United States Steel | 63,570 | 2,056 | ||||||
US Concrete* (A) | 12,364 | 703 | ||||||
Worthington Industries | 4,200 | 236 | ||||||
|
| |||||||
| 27,137 | ||||||||
|
| |||||||
Real Estate — 2.8% | ||||||||
Agree Realty‡ | 4,630 | 208 | ||||||
Alexander & Baldwin | 1,330 | 59 | ||||||
Alexander’s‡ | 54 | 23 | ||||||
Alexandria Real Estate Equities‡ | 1,109 | 121 | ||||||
American Campus Communities‡ | 3,855 | 182 | ||||||
Apartment Investment & Management, Cl A‡ | 4,164 | 175 | ||||||
Apple Hospitality‡ | — | — | ||||||
Armada Hoffler Properties‡ | 13,882 | 195 | ||||||
Ashford Hospitality Prime‡ | 1,395 | 18 | ||||||
Brandywine Realty Trust‡ | 68,139 | 1,046 | ||||||
Brixmor Property Group‡ | 3,561 | 87 | ||||||
Camden Property Trust‡ | 4,272 | 336 | ||||||
CareTrust‡ | 1,975 | 28 | ||||||
Colony Starwood Homes‡ | 39,110 | 1,195 | ||||||
Columbia Property Trust‡ | 3,917 | 82 | ||||||
Communications Sales & Leasing‡ | 3,028 | 75 | ||||||
Community Healthcare Trust | 836 | 18 | ||||||
CoreCivic‡ | 2,417 | 55 | ||||||
Corporate Office Properties Trust‡ | 19,839 | 568 | ||||||
DCT Industrial Trust‡ | 538 | 25 | ||||||
DDR‡ | — | — | ||||||
DiamondRock Hospitality‡ | 98,840 | 1,047 | ||||||
Douglas Emmett‡ | 1,922 | 70 | ||||||
Duke Realty‡ | 4,256 | 108 | ||||||
DuPont Fabros Technology‡ | 2,832 | 115 | ||||||
Education Realty Trust‡ | 10,365 | 421 | ||||||
EPR Properties‡ | 2,022 | 141 | ||||||
Equity Commonwealth*‡ | 7,138 | 208 | ||||||
Equity One‡ | 14,712 | 439 | ||||||
First Industrial Realty Trust‡ | 9,558 | 253 | ||||||
| 9 | SEI Institutional Investments Trust / Semi-Annual Report / November 30, 2016 |
SCHEDULE OF INVESTMENTS (Unaudited)
Small Cap II Fund (Continued)
November 30, 2016
| Description | Shares | Market Value ($ Thousands) | ||||||
First Potomac Realty Trust‡ | 2,191 | $ | 21 | |||||
FirstService | 4,865 | 211 | ||||||
Forest City Realty Trust, Cl A‡ | 4,103 | 76 | ||||||
Franklin Street Properties‡ | 12,148 | 153 | ||||||
Gaming and Leisure Properties‡ | — | — | ||||||
GEO Group‡ | 1,834 | 61 | ||||||
Getty Realty‡ | 700 | 17 | ||||||
Gramercy Property Trust‡ | 2,683 | 23 | ||||||
Healthcare Realty Trust‡ | 2,863 | 84 | ||||||
Healthcare Trust of America, Cl A‡ | 2,147 | 61 | ||||||
Highwoods Properties‡ | 1,739 | 84 | ||||||
Jernigan Capital (A) | 16,518 | 328 | ||||||
Jones Lang LaSalle | — | — | ||||||
Kilroy Realty‡ | — | — | ||||||
Lexington Realty Trust‡ | 36,092 | 373 | ||||||
Liberty Property Trust‡ | 4,572 | 180 | ||||||
Life Storage‡ | 861 | 70 | ||||||
LTC Properties‡ | 374 | 17 | ||||||
Mid-America Apartment Communities‡ | 1,431 | 131 | ||||||
Monmouth Real Estate Investment, Cl A‡ | 1,540 | 22 | ||||||
National Health Investors‡ | 1,335 | 94 | ||||||
National Retail Properties‡ | 4,689 | 200 | ||||||
National Storage Affiliates Trust‡ | 24,236 | 499 | ||||||
NexPoint Residential Trust‡ | 624 | 12 | ||||||
Omega Healthcare Investors‡ | — | — | ||||||
Outfront Media‡ | 6,932 | 175 | ||||||
Parkway* | — | — | ||||||
Physicians Realty Trust‡ | 8,240 | 149 | ||||||
Piedmont Office Realty Trust, Cl A‡ | 6,342 | 124 | ||||||
Post Properties‡ | 1,121 | 73 | ||||||
PS Business Parks‡ | 1,367 | 153 | ||||||
QTS Realty Trust, Cl A‡ | 22,305 | 1,044 | ||||||
Rayonier‡ | 1,374 | 36 | ||||||
Regency Centers‡ | 3,173 | 212 | ||||||
Retail Opportunity Investments‡ | — | — | ||||||
Retail Properties of America, Cl A‡ | 8,641 | 132 | ||||||
RLJ Lodging Trust‡ | 4,338 | 99 | ||||||
Ryman Hospitality Properties‡ | 605 | 36 | ||||||
Saul Centers‡ | 5,825 | 370 | ||||||
Select Income‡ | 8,050 | 197 | ||||||
Senior Housing Properties Trust‡ | 5,304 | 96 | ||||||
Spirit Realty Capital‡ | 2,837 | 31 | ||||||
STORE Capital‡ | — | — | ||||||
Summit Hotel Properties‡ | 8,268 | 117 | ||||||
Sun Communities‡ | 790 | 57 | ||||||
Taubman Centers‡ | — | — | ||||||
Urban Edge Properties‡ | 2,346 | 63 | ||||||
Urstadt Biddle Properties, Cl A‡ | 603 | 14 | ||||||
Washington Real Estate Investment Trust‡ | — | — | ||||||
Weingarten Realty Investors‡ | 5,466 | 194 | ||||||
|
| |||||||
| 13,387 | ||||||||
|
| |||||||
| Description | Shares | Market Value ($ Thousands) | ||||||
Telecommunication Services — 0.3% | ||||||||
8x8* | 6,540 | $ | 89 | |||||
ATN International | 1,449 | 105 | ||||||
Cincinnati Bell* | 8,729 | 180 | ||||||
Cogent Communications Holdings | 6,431 | 241 | ||||||
FairPoint Communications* | 643 | 11 | ||||||
Globalstar* | 7,812 | 6 | ||||||
IDT, Cl B | 12,417 | 263 | ||||||
Intelsat* (A) | 59,742 | 246 | ||||||
NII Holdings* | 14,561 | 25 | ||||||
Spok Holdings | 1,005 | 18 | ||||||
Vonage Holdings* | 60,275 | 397 | ||||||
|
| |||||||
| 1,581 | ||||||||
|
| |||||||
Utilities — 2.4% | ||||||||
ALLETE | 6,648 | 411 | ||||||
American States Water | 1,465 | 62 | ||||||
Aqua America | 2,032 | 60 | ||||||
Atmos Energy | 1,454 | 103 | ||||||
Avista | 11,437 | 463 | ||||||
California Water Service Group | 487 | 17 | ||||||
Connecticut Water Service | 288 | 16 | ||||||
Fortis | 1 | — | ||||||
Great Plains Energy | 26,796 | 707 | ||||||
Hawaiian Electric Industries | 8,474 | 261 | ||||||
IDACORP | 20,454 | 1,558 | ||||||
MDU Resources Group | 1,506 | 42 | ||||||
MGE Energy | 1,361 | 81 | ||||||
Middlesex Water | 2,356 | 96 | ||||||
Northwest Natural Gas | 3,727 | 213 | ||||||
NorthWestern | 6,449 | 362 | ||||||
ONE Gas | 8,796 | 528 | ||||||
Otter Tail | 2,615 | 100 | ||||||
Pinnacle West Capital | 9,531 | 705 | ||||||
PNM Resources | 32,810 | 1,037 | ||||||
Portland General Electric | 23,031 | 958 | ||||||
SJW | 5,209 | 280 | ||||||
Southwest Gas | 12,890 | 955 | ||||||
Spark Energy, Cl A (A) | 3,061 | 78 | ||||||
Spire | 16,645 | 1,074 | ||||||
Talen Energy* | 668 | 9 | ||||||
UGI | 13,957 | 625 | ||||||
Unitil | 1,887 | 80 | ||||||
Vectren | 5,238 | 257 | ||||||
Westar Energy, Cl A | 2,838 | 162 | ||||||
|
| |||||||
| 11,300 | ||||||||
|
| |||||||
Total Common Stock | 451,154 | |||||||
|
| |||||||
| 10 | SEI Institutional Investments Trust / Semi-Annual Report / November 30, 2016 |
SCHEDULE OF INVESTMENTS (Unaudited)
Small Cap II Fund (Concluded)
November 30, 2016
| Description | Number of Rights | Market Value ($ Thousands) | ||||||
RIGHTS — 0.0% | ||||||||
overstock.com*‡‡ | 134 | $ | — | |||||
Dyax*‡‡ | 3,929 | — | ||||||
|
| |||||||
Total Rights | — | |||||||
|
| |||||||
| Shares | ||||||||
AFFILIATED PARTNERSHIP — 9.1% |
| |||||||
SEI Liquidity Fund, L.P. | ||||||||
0.470%**† (B) | 43,485,830 | 43,486 | ||||||
|
| |||||||
Total Affiliated Partnership | 43,486 | |||||||
|
| |||||||
CASH EQUIVALENT — 5.1% | ||||||||
SEI Daily Income Trust, Government Fund, Cl A | ||||||||
0.210%**† | 24,353,812 | 24,354 | ||||||
|
| |||||||
Total Cash Equivalent | 24,354 | |||||||
|
| |||||||
Total Investments — 108.5% | $ | 518,994 | ||||||
|
| |||||||
A list of the open futures contracts held by the Fund at November 30, 2016, is as follows:
| Type of Contract | Number of Contracts Long (Short) | Expiration Date | Unrealized Appreciation ($ Thousands) | |||||||||
Russell 2000 Index E-MINI | 17 | Dec-2016 | $ | 240 | ||||||||
|
| |||||||||||
For the period ended November 30, 2016, the total amount of all open futures contracts, as presented in the table above, are representative of the volume of activity for the derivative type during the period.
Percentages are based on Net Assets of $478,370 ($ Thousands).
| * | Non-income producing security. |
| ** | Rate shown is the 7-day effective yield as of November 30, 2016. |
| † | Investment in Affiliated Security (see Note 6). |
| ‡ | Real Estate Investment Trust. |
| ‡‡ | Expiration date unavailable. |
| (A) | This security or a partial position of this security is on loan at November 30, 2016 (see Note 12). The total market value of securities on loan at November 30, 2016 was $42,854 ($ Thousands). |
| (B) | This security was purchased with cash collateral held from securities on loan (see Note 12). The total market value of such securities as of November 30, 2016 was $43,486 ($ Thousands). |
ADR — American Depositary Receipt
Cl — Class
L.P. — Limited Partnership
PLC — Public Limited Company
The following is a list of the level of inputs used as of November 30, 2016, in valuing the Fund’s investments and other financial instruments carried at value ($ Thousands):
| Investments in Securities | Level 1 | Level 2 | Level 3 | Total | ||||||||||||
Common Stock | $ | 451,154 | $ | — | $ | — | $ | 451,154 | ||||||||
Rights | — | — | — | — | ||||||||||||
Affiliated Partnership | — | 43,486 | — | 43,486 | ||||||||||||
Cash Equivalent | 24,354 | — | — | 24,354 | ||||||||||||
|
|
|
|
|
|
|
| |||||||||
Total Investments in Securities | $ | 475,508 | $ | 43,486 | $ | — | $ | 518,994 | ||||||||
|
|
|
|
|
|
|
| |||||||||
| Other Financial Instruments | Level 1 | Level 2 | Level 3 | Total | ||||||||||||
Futures Contracts* | ||||||||||||||||
Unrealized Appreciation | $ | 240 | $ | — | $ | — | $ | 240 | ||||||||
|
|
|
|
|
|
|
| |||||||||
Total Other Financial Instruments | $ | 240 | $ | — | $ | — | $ | 240 | ||||||||
|
|
|
|
|
|
|
| |||||||||
| * | Futures contracts are valued at the unrealized appreciation on the instrument. |
For the period ended November 30, 2016, there were no transfers between Level 1 and Level 2 assets and liabilities.
For the period ended November 30, 2016, there were no transfers between Level 2 and Level 3 assets and liabilities.
For more information on valuation inputs, see Note 2 — Significant Accounting Policies in Notes to Financial Statements.
Amounts designated as “—” are $0 or have been rounded to $0.
The accompanying notes are an integral part of the financial statements.
| 11 | SEI Institutional Investments Trust / Semi-Annual Report / November 30, 2016 |
SCHEDULE OF INVESTMENTS (Unaudited)
Small/Mid Cap Equity Fund
November 30, 2016
| Description | Shares | Market Value ($ Thousands) | ||||||
COMMON STOCK — 95.2% | ||||||||
Consumer Discretionary — 11.5% | ||||||||
American Eagle Outfitters (A) | 94,055 | $ | 1,558 | |||||
American Public Education* | 25,007 | 578 | ||||||
Aramark | 91,668 | 3,154 | ||||||
Arctic Cat | 11,674 | 178 | ||||||
Bassett Furniture Industries | 8,709 | 253 | ||||||
Big 5 Sporting Goods | 14,908 | 288 | ||||||
Big Lots (A) | 37,900 | 1,918 | ||||||
Biglari Holdings* | 240 | 113 | ||||||
BorgWarner | 26,154 | 931 | ||||||
Bright Horizons Family Solutions* | 81,709 | 5,623 | ||||||
Brinker International (A) | 15,900 | 844 | ||||||
Brunswick | 31,901 | 1,599 | ||||||
Buffalo Wild Wings* | 10,208 | 1,721 | ||||||
Burlington Stores* | 12,625 | 1,110 | ||||||
Cabela’s* | 3,070 | 191 | ||||||
CalAtlantic Group | 36,474 | 1,218 | ||||||
Caleres | 42,722 | 1,399 | ||||||
Callaway Golf | 93,814 | 1,140 | ||||||
Camping World Holdings, Cl A | 15,010 | 419 | ||||||
Capella Education | 4,473 | 390 | ||||||
Career Education* | 3,975 | 40 | ||||||
Carriage Services, Cl A | 88,890 | 2,412 | ||||||
Carrols Restaurant Group* | 2,829 | 38 | ||||||
Carter’s | 57,880 | 5,284 | ||||||
Century Communities* | 124,229 | 2,578 | ||||||
Children’s Place | 13,200 | 1,371 | ||||||
Cinemark Holdings | 26,315 | 1,048 | ||||||
Citi Trends | 1,086 | 19 | ||||||
Coach | 21,575 | 785 | ||||||
Cooper Tire & Rubber | 35,954 | 1,377 | ||||||
Cooper-Standard Holdings* | 21,415 | 2,041 | ||||||
Core-Mark Holding | 101,413 | 3,703 | ||||||
Crocs* | 111,549 | 781 | ||||||
CST Brands | 5,232 | 251 | ||||||
Dave & Buster’s Entertainment* | 42,056 | 1,970 | ||||||
Del Frisco’s Restaurant Group* | 15,497 | 267 | ||||||
Del Taco Restaurants* | 97,000 | 1,408 | ||||||
Destination XL Group* | 62,635 | 257 | ||||||
Dick’s Sporting Goods | 71,838 | 4,243 | ||||||
Dillard’s, Cl A | 20,600 | 1,473 | ||||||
DineEquity | 2,209 | 185 | ||||||
Dollar General | 12,438 | 962 | ||||||
Dorman Products* | 5,808 | 420 | ||||||
DR Horton | 44,969 | 1,246 | ||||||
DSW, Cl A | 177,068 | 4,207 | ||||||
Duluth Holdings, Cl B* (A) | 10,265 | 344 | ||||||
Dunkin’ Brands Group | 74,030 | 4,019 | ||||||
Eastman Kodak* | 4,969 | 75 | ||||||
Eldorado Resorts* | 8,992 | 124 | ||||||
Ethan Allen Interiors | 50,197 | 1,732 | ||||||
Etsy* | 40,690 | 505 | ||||||
| Description | Shares | Market Value ($ Thousands) | ||||||
Express* | 72,027 | $ | 962 | |||||
Fiesta Restaurant Group* | 157,385 | 4,509 | ||||||
Finish Line, Cl A | 42,210 | 947 | ||||||
Five Below* (A) | 91,277 | 3,593 | ||||||
GameStop, Cl A | 37,900 | 936 | ||||||
Gannett | 65,316 | 623 | ||||||
Goodyear Tire & Rubber | 128,743 | 3,951 | ||||||
Grand Canyon Education* | 87,370 | 4,989 | ||||||
Group 1 Automotive | 14,300 | 1,038 | ||||||
Harley-Davidson | 54,637 | 3,327 | ||||||
Harman International Industries | 2,676 | 293 | ||||||
Haverty Furniture | 53,168 | 1,148 | ||||||
Helen of Troy* | 16,130 | 1,373 | ||||||
Hibbett Sports* (A) | 125,755 | 5,062 | ||||||
Horizon Global* | 21,115 | 486 | ||||||
IMAX* (A) | 68,775 | 2,197 | ||||||
International Game Technology | 24,237 | 625 | ||||||
J Alexander’s Holdings* | 4,932 | 47 | ||||||
Jack in the Box | 49,969 | 5,198 | ||||||
John Wiley & Sons, Cl A | 9,759 | 535 | ||||||
K12* | 20,142 | 296 | ||||||
KB Home (A) | 71,300 | 1,129 | ||||||
Kohl’s | 17,350 | 934 | ||||||
La-Z-Boy | 6,636 | 177 | ||||||
Lear | 28,487 | 3,689 | ||||||
Libbey | 253,153 | 4,843 | ||||||
Lions Gate Entertainment (A) | 26,725 | 625 | ||||||
Lithia Motors, Cl A | 20,210 | 1,857 | ||||||
Live Nation* | 70,299 | 1,946 | ||||||
LKQ* | 65,842 | 2,162 | ||||||
Lumber Liquidators Holdings* (A) | 143,800 | 2,538 | ||||||
MarineMax* | 52,140 | 980 | ||||||
Mattel | 16,680 | 527 | ||||||
MDC Partners, Cl A | 701,245 | 4,348 | ||||||
Modine Manufacturing* | 3,337 | 39 | ||||||
Monro Muffler | 59,238 | 3,542 | ||||||
Movado Group | 3,969 | 112 | ||||||
Murphy USA* | 35,810 | 2,442 | ||||||
National CineMedia | 379,157 | 5,816 | ||||||
Nautilus* | 27,370 | 471 | ||||||
New Media Investment | 21,846 | 336 | ||||||
New York Times, Cl A | 14,847 | 193 | ||||||
Ollie’s Bargain Outlet Holdings* | 19,795 | 595 | ||||||
Oxford Industries | 7,738 | 562 | ||||||
Planet Fitness, Cl A (A) | 127,736 | 2,589 | ||||||
Polaris Industries (A) | 38,481 | 3,342 | ||||||
Pool | 6,034 | 607 | ||||||
PulteGroup | 27,445 | 518 | ||||||
Ralph Lauren, Cl A | 6,181 | 647 | ||||||
Rent-A-Center, Cl A | 56,700 | 655 | ||||||
Restaurant Brands International | 25,600 | 1,217 | ||||||
Sally Beauty Holdings* | 271,430 | 7,109 | ||||||
| 1 | SEI Institutional Investments Trust / Semi-Annual Report / November 30, 2016 |
SCHEDULE OF INVESTMENTS (Unaudited)
Small/Mid Cap Equity Fund (Continued)
November 30, 2016
| Description | Shares | Market Value ($ Thousands) | ||||||
Sequential Brands Group* (A) | 223,200 | $ | 1,143 | |||||
ServiceMaster Global Holdings* | 196,574 | 7,513 | ||||||
Shoe Carnival | 44,649 | 1,166 | ||||||
Sonic Automotive, Cl A | 81,600 | 1,726 | ||||||
Spartan Motors | 3,636 | 33 | ||||||
Stage Stores (A) | 77,000 | 335 | ||||||
Staples | 4,492 | 43 | ||||||
Starz* | 15,700 | 532 | ||||||
Steven Madden* | 13,450 | 498 | ||||||
Superior Industries International | 2,119 | 53 | ||||||
Tailored Brands | 24,595 | 461 | ||||||
TEGNA | 125,999 | 2,826 | ||||||
Tempur Sealy International* (A) | 6,510 | 412 | ||||||
Texas Roadhouse, Cl A | 11,770 | 552 | ||||||
Tile Shop Holdings* | 29,510 | 592 | ||||||
Tilly’s, Cl A* | 324 | 3 | ||||||
Tower International | 1,215 | 32 | ||||||
Universal Electronics* | 23,985 | 1,615 | ||||||
Vail Resorts | 10,960 | 1,736 | ||||||
Vista Outdoor* | 10,013 | 402 | ||||||
Whirlpool | 6,200 | 1,007 | ||||||
William Lyon Homes, Cl A* | 106,063 | 2,100 | ||||||
Wolverine World Wide | 195,697 | 4,409 | ||||||
Wyndham Worldwide | 49,202 | 3,542 | ||||||
|
| |||||||
| 201,203 | ||||||||
|
| |||||||
Consumer Staples — 2.6% | ||||||||
AdvancePierre Foods Holdings | 10,686 | 289 | ||||||
B&G Foods, Cl A | 64,835 | 2,775 | ||||||
Casey’s General Stores | 12,492 | 1,505 | ||||||
Central Garden & Pet* (A) | 61,970 | 1,790 | ||||||
Central Garden and Pet, Cl A* | 4,390 | 120 | ||||||
Chefs’ Warehouse* | 23,892 | 309 | ||||||
Darling Ingredients* | 99,157 | 1,340 | ||||||
Edgewell Personal Care* | 2,907 | 230 | ||||||
elf Beauty* (A) | 9,835 | 310 | ||||||
Energizer Holdings | 4,796 | 215 | ||||||
Fresh Del Monte Produce | 21,396 | 1,327 | ||||||
Freshpet* (A) | 119,233 | 1,103 | ||||||
Hain Celestial Group* | 52,906 | 2,073 | ||||||
Ingles Markets, Cl A | 27,718 | 1,272 | ||||||
Ingredion | 8,848 | 1,039 | ||||||
Inter Parfums | 1,608 | 55 | ||||||
Inventure Foods* | 161,069 | 1,456 | ||||||
John B Sanfilippo & Son | 9,762 | 622 | ||||||
Landec* | 119,600 | 1,710 | ||||||
Nu Skin Enterprises, Cl A | 12,213 | 637 | ||||||
Omega Protein* | 129,098 | 3,092 | ||||||
Pilgrim’s Pride (A) | 56,656 | 998 | ||||||
Primo Water* | 181,440 | 2,333 | ||||||
Sanderson Farms | 793 | 64 | ||||||
Seaboard* | 19 | 78 | ||||||
| Description | Shares | Market Value ($ Thousands) | ||||||
Snyder’s-Lance | 102,040 | $ | 3,802 | |||||
SpartanNash | 51,299 | 1,858 | ||||||
Spectrum Brands Holdings (A) | 36,695 | 4,399 | ||||||
SUPERVALU* | 147,019 | 682 | ||||||
TreeHouse Foods* | 50,482 | 3,499 | ||||||
WD-40 (A) | 18,089 | 1,952 | ||||||
Weis Markets | 28,731 | 1,600 | ||||||
|
| |||||||
| 44,534 | ||||||||
|
| |||||||
Energy — 4.4% | ||||||||
Alberta Oilsands* | 1,600,500 | 143 | ||||||
Anadarko Petroleum | 16,553 | 1,145 | ||||||
Approach Resources* (A) | 171,107 | 601 | ||||||
Archrock | 3,711 | 50 | ||||||
Ardmore Shipping (A) | 172,298 | 1,172 | ||||||
Atwood Oceanics (A) | 15,300 | 145 | ||||||
Bill Barrett* (A) | 147,282 | 1,152 | ||||||
Callon Petroleum* | 32,456 | 572 | ||||||
Carrizo Oil & Gas* | 93,521 | 3,960 | ||||||
Contango Oil & Gas* | 32,386 | 320 | ||||||
DHT Holdings | 292,100 | 1,037 | ||||||
Diamond Offshore Drilling (A) | 46,300 | 836 | ||||||
Diamondback Energy* | 4,939 | 533 | ||||||
Dril-Quip* | 27,438 | 1,552 | ||||||
Eclipse Resources* (A) | 461,200 | 1,360 | ||||||
Energen | 9,389 | 583 | ||||||
EQT | 15,842 | 1,110 | ||||||
FMC Technologies* | 17,186 | 589 | ||||||
Forum Energy Technologies* | 12,690 | 276 | ||||||
Gulfport Energy* | 145,244 | 3,731 | ||||||
HollyFrontier | 53,200 | 1,531 | ||||||
International Seaways* | 8,629 | 131 | ||||||
Matador Resources* (A) | 14,686 | 391 | ||||||
Matrix Service* | 157,783 | 3,290 | ||||||
Murphy Oil | 8,671 | 294 | ||||||
Nabors Industries | 246,965 | 3,976 | ||||||
Newfield Exploration* | 29,636 | 1,340 | ||||||
Newpark Resources* | 173,400 | 1,274 | ||||||
Noble | 50,500 | 314 | ||||||
Oasis Petroleum* | 189,107 | 2,831 | ||||||
Oceaneering International | 697 | 19 | ||||||
Oil States International* | 12,397 | 444 | ||||||
Overseas Shipholding Group, Cl A | 25,889 | 200 | ||||||
Pacific Ethanol* | 126,300 | 1,086 | ||||||
Parsley Energy, Cl A* | 86,686 | 3,307 | ||||||
PBF Energy, Cl A (A) | 23,100 | 554 | ||||||
PDC Energy* | 45,471 | 3,385 | ||||||
Pioneer Natural Resources | 5,380 | 1,028 | ||||||
QEP Resources | 15,544 | 306 | ||||||
REX American Resources* | 2,834 | 277 | ||||||
Rice Energy* | 71,606 | 1,744 | ||||||
RigNet* | 172,820 | 2,981 | ||||||
| 2 | SEI Institutional Investments Trust / Semi-Annual Report / November 30, 2016 |
SCHEDULE OF INVESTMENTS (Unaudited)
Small/Mid Cap Equity Fund (Continued)
November 30, 2016
| Description | Shares | Market Value ($ Thousands) | ||||||
Rowan, Cl A | 31,900 | $ | 568 | |||||
RSP Permian* | 49,504 | 2,210 | ||||||
Scorpio Tankers | 582,300 | 2,463 | ||||||
SM Energy | 1,145 | 46 | ||||||
Smart Sand* | 81,050 | 1,108 | ||||||
Spectra Energy | 15,327 | 628 | ||||||
StealthGas* | 272,300 | 969 | ||||||
Superior Energy Services | 111,237 | 1,918 | ||||||
Synergy Resources* (A) | 374,479 | 3,554 | ||||||
Tesoro | 29,400 | 2,392 | ||||||
TETRA Technologies* | 502,400 | 2,728 | ||||||
Tsakos Energy Navigation (A) | 157,700 | 692 | ||||||
US Silica Holdings | 38,905 | 1,969 | ||||||
Western Refining | 5,824 | 209 | ||||||
Westmoreland Coal* | 78,200 | 1,354 | ||||||
Whiting Petroleum* | 150,450 | 1,838 | ||||||
World Fuel Services | 19,988 | 889 | ||||||
WPX Energy* | 32,150 | 500 | ||||||
|
| |||||||
| 77,605 | ||||||||
|
| |||||||
Financials — 17.8% | ||||||||
1st Source | 5,447 | 214 | ||||||
AGNC Investment‡ | 25,952 | 484 | ||||||
Alleghany* | 276 | 157 | ||||||
Allied World Assurance Holdings | 5,433 | 254 | ||||||
Allstate | 16,324 | 1,141 | ||||||
Ally Financial | 137,381 | 2,668 | ||||||
American Equity Investment Life Holding | 4,800 | 100 | ||||||
American Financial Group | 81,749 | 6,722 | ||||||
American National Insurance | 892 | 107 | ||||||
Ameriprise Financial | 10,407 | 1,189 | ||||||
AMERISAFE | 2,166 | 138 | ||||||
Arch Capital Group* | 50,915 | 4,212 | ||||||
Ares Capital (A) | 53,000 | 850 | ||||||
Argo Group International Holdings | 6,411 | 407 | ||||||
Arthur J Gallagher | 29,366 | 1,479 | ||||||
Ashford* | 470 | 21 | ||||||
Aspen Insurance Holdings | 67,080 | 3,418 | ||||||
Associated Banc | 72,700 | 1,661 | ||||||
Assurant | 37,723 | 3,257 | ||||||
Assured Guaranty | 66,371 | 2,373 | ||||||
Axis Capital Holdings | 18,813 | 1,148 | ||||||
BancFirst | 4,850 | 397 | ||||||
Banco Latinoamericano de Comercio Exterior | 65,100 | 1,854 | ||||||
Bancorpsouth | 17,510 | 500 | ||||||
Bank of Hawaii | 8,730 | 728 | ||||||
Bank of the Ozarks | 39,388 | 1,911 | ||||||
BankUnited | 103,065 | 3,652 | ||||||
Bats Global Markets (A) | 82,680 | 2,629 | ||||||
Beneficial Bancorp | 45,980 | 800 | ||||||
Berkshire Hills Bancorp | 5,045 | 171 | ||||||
Blackstone Mortgage Trust, Cl A‡ | 80,589 | 2,424 | ||||||
| Description | Shares | Market Value ($ Thousands) | ||||||
Brookline Bancorp | 24,855 | $ | 370 | |||||
Bryn Mawr Bank | 1,540 | 57 | ||||||
Camden National | 3,234 | 126 | ||||||
CBOE Holdings | 17,450 | 1,202 | ||||||
CenterState Banks | 17,693 | 397 | ||||||
Central Pacific Financial | 185,945 | 5,495 | ||||||
Chemical Financial | 2,501 | 130 | ||||||
Chimera Investment‡ | 93,624 | 1,588 | ||||||
City Holding | 2,773 | 170 | ||||||
CNA Financial | 28,100 | 1,075 | ||||||
CNO Financial Group | 238,632 | 4,272 | ||||||
Colony Financial‡ | 8,690 | 178 | ||||||
Comerica | 36,143 | 2,304 | ||||||
Commerce Bancshares | 32,717 | 1,793 | ||||||
Community Bank System | 1,294 | 73 | ||||||
Community Trust Bancorp | 21,220 | 897 | ||||||
Cullen/Frost Bankers | 3,149 | 259 | ||||||
Customers Bancorp* | 159,500 | 4,865 | ||||||
CYS Investments‡ | 125,100 | 1,006 | ||||||
Dime Community Bancshares | 64,174 | 1,200 | ||||||
Donnelley Financial Solutions* | 5,407 | 103 | ||||||
E*TRADE Financial* | 132,850 | 4,585 | ||||||
Eagle Bancorp* | 87,237 | 5,125 | ||||||
East West Bancorp | 9,552 | 457 | ||||||
Employers Holdings | 18,721 | 662 | ||||||
Endurance Specialty Holdings | 40,309 | 3,716 | ||||||
Enterprise Financial Services | 23,427 | 900 | ||||||
Evercore Partners, Cl A | 48,795 | 3,289 | ||||||
Everest Re Group | 25,677 | 5,406 | ||||||
FBL Financial Group, Cl A | 895 | 69 | ||||||
FBR | 120,500 | 1,392 | ||||||
Federal Agricultural Mortgage, Cl C | 13,895 | 750 | ||||||
Federated Investors, Cl B | 10,385 | 285 | ||||||
Federated National Holding | 5,803 | 101 | ||||||
Fidelity Southern | 7,859 | 175 | ||||||
Financial Engines (A) | 112,851 | 3,933 | ||||||
First BanCorp* | 4,688 | 28 | ||||||
First Busey | 9,010 | 247 | ||||||
First Citizens BancShares, Cl A | 1,888 | 673 | ||||||
First Defiance Financial | 18,915 | 876 | ||||||
First Financial | 7,278 | 333 | ||||||
First Financial Bancorp | 1,828 | 49 | ||||||
First Foundation* | 98,700 | 2,766 | ||||||
First Hawaiian | 30,273 | 908 | ||||||
First Horizon National | 51,638 | 985 | ||||||
First Interstate Bancsystem, Cl A | 23,068 | 871 | ||||||
First Merchants | 5,483 | 188 | ||||||
First Republic Bank | 11,672 | 956 | ||||||
Flagstar Bancorp* | 15,940 | 449 | ||||||
Flushing Financial | 84,473 | 2,212 | ||||||
FNFV Group* | 78,700 | 1,007 | ||||||
Franklin Financial Network* | 42,810 | 1,616 | ||||||
| 3 | SEI Institutional Investments Trust / Semi-Annual Report / November 30, 2016 |
SCHEDULE OF INVESTMENTS (Unaudited)
Small/Mid Cap Equity Fund (Continued)
November 30, 2016
| Description | Shares | Market Value ($ Thousands) | ||||||
Fulton Financial | 297,983 | $ | 5,289 | |||||
Genworth Financial, Cl A* | 35,741 | 153 | ||||||
Great Southern Bancorp | 2,055 | 102 | ||||||
Great Western Bancorp | 3,463 | 139 | ||||||
Hancock Holding | 128,955 | 5,358 | ||||||
Hanmi Financial | 53,507 | 1,643 | ||||||
Hanover Insurance Group | 62,177 | 5,384 | ||||||
Hartford Financial Services Group | 24,183 | 1,140 | ||||||
Heartland Financial USA | 8,375 | 359 | ||||||
Hercules Capital | 63,688 | 870 | ||||||
Heritage Financial | 11,343 | 257 | ||||||
HomeStreet* | 4,974 | 144 | ||||||
HomeTrust Bancshares* | 3,325 | 79 | ||||||
Horace Mann Educators | 30,746 | 1,234 | ||||||
Houlihan Lokey | 12,158 | 346 | ||||||
Huntington Bancshares | 594,663 | 7,410 | ||||||
IBERIABANK | 13,118 | 1,087 | ||||||
Independent Bank | 15,674 | 494 | ||||||
Infinity Property & Casualty | 9,624 | 830 | ||||||
International Bancshares | 55,700 | 2,168 | ||||||
International FCStone* | 1,517 | 62 | ||||||
Investment Technology Group | 52,800 | 984 | ||||||
Investors Bancorp | 165,522 | 2,241 | ||||||
Janus Capital Group | 10,121 | 137 | ||||||
Kearny Financial | 108,337 | 1,641 | ||||||
Kemper | 123,900 | 5,074 | ||||||
KeyCorp | 198,300 | 3,433 | ||||||
Lakeland Financial | 4,074 | 172 | ||||||
Lincoln National | 37,500 | 2,404 | ||||||
LPL Financial Holdings | 192,581 | 7,932 | ||||||
M&T Bank | 8,140 | 1,172 | ||||||
Maiden Holdings | 247,432 | 3,810 | ||||||
MB Financial | 20,284 | 878 | ||||||
Meridian Bancorp | 200,700 | 3,562 | ||||||
Meta Financial Group | 472 | 43 | ||||||
MFA Financial‡ | 219,546 | 1,717 | ||||||
MGIC Investment* | 188,059 | 1,706 | ||||||
Mortgage Investment Trust‡ | 82,400 | 1,449 | ||||||
National Bank Holdings, Cl A | 180,200 | 4,901 | ||||||
National General Holdings | 78,470 | 1,773 | ||||||
Navient | 53,300 | 918 | ||||||
NBT Bancorp | 14,079 | 544 | ||||||
Nelnet, Cl A | 39,700 | 2,003 | ||||||
New Residential Investments‡ | 18,942 | 293 | ||||||
Northfield Bancorp | 184,100 | 3,411 | ||||||
OceanFirst Financial | 2,367 | 56 | ||||||
OFG Bancorp | 82,195 | 1,110 | ||||||
Old Republic International | 30,657 | 548 | ||||||
Oritani Financial | 9,964 | 176 | ||||||
PacWest Bancorp | 87,529 | 4,486 | ||||||
People’s United Financial | 1,717 | 32 | ||||||
Popular | 170,139 | 6,916 | ||||||
| Description | Shares | Market Value ($ Thousands) | ||||||
Preferred Bank | 16,083 | $ | 725 | |||||
Primerica | 30,888 | 2,184 | ||||||
PrivateBancorp, Cl A | 12,216 | 571 | ||||||
Prospect Capital (A) | 212,000 | 1,707 | ||||||
Prosperity Bancshares | 14,240 | 942 | ||||||
Radian Group | 5,056 | 74 | ||||||
Raymond James Financial | 41,044 | 2,953 | ||||||
Regions Financial | 322,100 | 4,361 | ||||||
Reinsurance Group of America, Cl A | 22,948 | 2,801 | ||||||
RenaissanceRe Holdings | 822 | 107 | ||||||
Republic Bancorp, Cl A | 31,200 | 1,155 | ||||||
Sandy Spring Bancorp | 6,454 | 235 | ||||||
ServisFirst Bancshares | 13,987 | 1,030 | ||||||
Signature Bank NY* | 9,553 | 1,432 | ||||||
SLM* | 111,864 | 1,126 | ||||||
Starwood Property Trust‡ | 79,803 | 1,793 | ||||||
State Bank Financial | 156,600 | 3,866 | ||||||
Sterling Bancorp | 87,440 | 1,989 | ||||||
Stifel Financial* | 41,718 | 2,080 | ||||||
Stock Yards Bancorp | 3,654 | 151 | ||||||
Stonegate Bank | 2,730 | 106 | ||||||
SVB Financial Group* | 11,301 | 1,786 | ||||||
Synovus Financial | 163,185 | 6,317 | ||||||
TCF Financial | 276,854 | 4,803 | ||||||
TFS Financial | 75,077 | 1,399 | ||||||
Tompkins Financial | 1,994 | 172 | ||||||
Towne Bank | 15,667 | 505 | ||||||
TriCo Bancshares | 6,119 | 191 | ||||||
TrustCo Bank NY | 15,102 | 123 | ||||||
Trustmark | 3,154 | 106 | ||||||
Two Harbors Investment‡ | 267,702 | 2,321 | ||||||
UMB Financial | 3,596 | 273 | ||||||
Union Bankshares | 7,176 | 243 | ||||||
United Community Banks | 261,040 | 7,095 | ||||||
United Fire Group | 11,446 | 520 | ||||||
Universal Insurance Holdings (A) | 57,800 | 1,387 | ||||||
Univest Corp of Pennsylvania | 34,048 | 972 | ||||||
Unum Group | 119,066 | 5,033 | ||||||
Validus Holdings | 73,010 | 3,967 | ||||||
Voya Financial | 28,542 | 1,109 | ||||||
Washington Federal | 72,376 | 2,349 | ||||||
Washington Trust Bancorp | 1,072 | 55 | ||||||
Waterstone Financial | 1,891 | 34 | ||||||
WesBanco | 30,800 | 1,228 | ||||||
Westamerica Bancorporation (A) | 33,451 | 2,075 | ||||||
Western Alliance Bancorp* | 98,689 | 4,611 | ||||||
White Mountains Insurance Group | 305 | 255 | ||||||
Wintrust Financial | 35,268 | 2,322 | ||||||
WisdomTree Investments (A) | 269,885 | 2,985 | ||||||
World Acceptance* (A) | 13,400 | 754 | ||||||
| 4 | SEI Institutional Investments Trust / Semi-Annual Report / November 30, 2016 |
SCHEDULE OF INVESTMENTS (Unaudited)
Small/Mid Cap Equity Fund (Continued)
November 30, 2016
| Description | Shares | Market Value ($ Thousands) | ||||||
Zions Bancorporation | 120,327 | $ | 4,788 | |||||
|
| |||||||
| 310,871 | ||||||||
|
| |||||||
Health Care — 10.1% | ||||||||
ABIOMED* | 20,589 | 2,311 | ||||||
Acadia Healthcare* | 7,902 | 300 | ||||||
Accuray* | 831,500 | 4,199 | ||||||
Adamas Pharmaceuticals* (A) | 12,939 | 194 | ||||||
Aerie Pharmaceuticals* | 7,000 | 260 | ||||||
Aimmune Therapeutics* | 12,435 | 282 | ||||||
Akorn* | 16,028 | 340 | ||||||
Alder Biopharmaceuticals* (A) | 9,039 | 213 | ||||||
Alere* | 5,602 | 223 | ||||||
Align Technology* | 32,131 | 2,990 | ||||||
Alkermes* | 19,540 | 1,110 | ||||||
Allscripts Healthcare Solutions* | 14,239 | 156 | ||||||
Alnylam Pharmaceuticals* | 36,460 | 1,600 | ||||||
AMAG Pharmaceuticals* | 184,715 | 6,133 | ||||||
AmerisourceBergen | 6,226 | 486 | ||||||
Amicus Therapeutics* | 29,312 | 175 | ||||||
AMN Healthcare Services* | 181,577 | 6,047 | ||||||
Amsurg, Cl A* | 41,457 | 2,824 | ||||||
AngioDynamics* | 1,658 | 27 | ||||||
Anika Therapeutics* | 5,013 | 234 | ||||||
Ardelyx* | 29,880 | 442 | ||||||
ARIAD Pharmaceuticals* (A) | 23,730 | 320 | ||||||
Atara Biotherapeutics* (A) | 74,658 | 1,482 | ||||||
athenahealth* (A) | 21,469 | 2,031 | ||||||
AtriCure* (A) | 71,650 | 1,289 | ||||||
Audentes Therapeutics* | 9,537 | 157 | ||||||
BioDelivery Sciences International* | 144,860 | 246 | ||||||
Bluebird Bio* (A) | 30,587 | 1,846 | ||||||
Bovie Medical* (A) | 138,440 | 588 | ||||||
Capital Senior Living* | 152,745 | 2,380 | ||||||
Catalent* | 79,785 | 1,909 | ||||||
Charles River Laboratories International* | 32,628 | 2,320 | ||||||
Community Health Systems* | 34,400 | 187 | ||||||
Cooper | 29,077 | 4,783 | ||||||
Cynosure, Cl A* | 83,894 | 3,805 | ||||||
DBV Technologies ADR* | 45,332 | 1,656 | ||||||
DENTSPLY SIRONA | 14,803 | 861 | ||||||
DexCom* | 36,335 | 2,372 | ||||||
Diplomat Pharmacy* (A) | 72,132 | 1,021 | ||||||
Eagle Pharmaceuticals* (A) | 9,500 | 750 | ||||||
Endologix* (A) | 297,946 | 2,190 | ||||||
Exact Sciences* (A) | 139,542 | 2,061 | ||||||
Exactech* | 5,299 | 133 | ||||||
Exelixis* | 98,700 | 1,670 | ||||||
Flamel Technologies ADR* | 158,114 | 1,679 | ||||||
Glaukos* | 14,173 | 442 | ||||||
GW Pharmaceuticals ADR* | 1,414 | 158 | ||||||
HealthSouth (A) | 51,283 | 2,137 | ||||||
| Description | Shares | Market Value ($ Thousands) | ||||||
Hill-Rom Holdings | 27,458 | $ | 1,465 | |||||
Horizon Pharma* | 22,585 | 447 | ||||||
ICON* | 22,678 | 1,715 | ||||||
Idexx Laboratories* | 8,585 | 1,010 | ||||||
Impax Laboratories* | 47,909 | 692 | ||||||
INC Research Holdings, Cl A* | 142,832 | 7,070 | ||||||
Inogen* | 33,750 | 2,175 | ||||||
Insulet* | 43,755 | 1,472 | ||||||
Integra LifeSciences Holdings* | 53,258 | 4,303 | ||||||
Intercept Pharmaceuticals* | 8,715 | 881 | ||||||
Invuity* | 76,120 | 518 | ||||||
iRhythm Technologies* | 1,443 | 44 | ||||||
Juno Therapeutics* (A) | 46,731 | 937 | ||||||
Kindred Healthcare | 75,400 | 501 | ||||||
Lannett* (A) | 19,092 | 437 | ||||||
LeMaitre Vascular | 96,120 | 2,179 | ||||||
Ligand Pharmaceuticals* (A) | 49,346 | 5,152 | ||||||
Magellan Health Services* | 4,010 | 292 | ||||||
Mallinckrodt* | 26,700 | 1,407 | ||||||
Medicines* | 7,290 | 256 | ||||||
Medidata Solutions* | 84,442 | 4,664 | ||||||
MEDNAX* | 40,779 | 2,670 | ||||||
Molina Healthcare* | 75,512 | 3,992 | ||||||
NeoGenomics* | 200,925 | 1,796 | ||||||
Neurocrine Biosciences* | 39,759 | 1,847 | ||||||
Nevro* (A) | 23,922 | 1,819 | ||||||
Novadaq Technologies* (A) | 197,656 | 1,571 | ||||||
NuVasive* | 23,115 | 1,500 | ||||||
Omnicell* | 61,710 | 2,212 | ||||||
Otonomy* | 10,675 | 181 | ||||||
Owens & Minor | 28,900 | 980 | ||||||
Patterson | 110,272 | 4,272 | ||||||
PDL BioPharma | 11,850 | 26 | ||||||
Penumbra* | 9,546 | 591 | ||||||
PerkinElmer | 7,680 | 390 | ||||||
PRA Health Sciences* | 89,185 | 4,791 | ||||||
Premier, Cl A* | 10,235 | 308 | ||||||
Prestige Brands Holdings* | 121,896 | 5,799 | ||||||
Prothena* (A) | 5,600 | 331 | ||||||
Quest Diagnostics | 11,545 | 1,010 | ||||||
Quidel* | 60,670 | 1,391 | ||||||
Radius Health* (A) | 5,400 | 287 | ||||||
Revance Therapeutics* (A) | 98,896 | 1,657 | ||||||
Sage Therapeutics* | 6,273 | 314 | ||||||
SciClone Pharmaceuticals* | 11,900 | 118 | ||||||
Seattle Genetics* | 10,500 | 681 | ||||||
Select Medical Holdings* | 93,800 | 1,140 | ||||||
Spectranetics* (A) | 109,571 | 2,394 | ||||||
STERIS | 51,103 | 3,353 | ||||||
Sucampo Pharmaceuticals, Cl A* | 73,200 | 1,190 | ||||||
Supernus Pharmaceuticals* | 114,493 | 2,467 | ||||||
Tabula Rasa HealthCare* | 42,452 | 589 | ||||||
| 5 | SEI Institutional Investments Trust / Semi-Annual Report / November 30, 2016 |
SCHEDULE OF INVESTMENTS (Unaudited)
Small/Mid Cap Equity Fund (Continued)
November 30, 2016
| Description | Shares | Market Value ($ Thousands) | ||||||
Teleflex | 2,741 | $ | 405 | |||||
TESARO* | 7,929 | 1,076 | ||||||
Trinity Biotech ADR (A) | 338,510 | 2,265 | ||||||
Triple-S Management, Cl B* | 38,611 | 860 | ||||||
Ultragenyx Pharmaceutical* | 4,442 | 348 | ||||||
United Therapeutics* | 9,100 | 1,143 | ||||||
Vanda Pharmaceuticals* | 37,610 | 619 | ||||||
Veracyte* (A) | 135,050 | 1,030 | ||||||
Vocera Communications* | 242,470 | 4,413 | ||||||
VWR* | 6,295 | 171 | ||||||
WellCare Health Plans* | 5,226 | 716 | ||||||
West Pharmaceutical Services | 6,340 | 515 | ||||||
Wright Medical Group* (A) | 39,385 | 907 | ||||||
Zeltiq Aesthetics* (A) | 36,351 | 1,600 | ||||||
|
| |||||||
| 176,371 | ||||||||
|
| |||||||
Industrials — 18.5% | ||||||||
AAR | 54,677 | 2,017 | ||||||
ABM Industries | 110,310 | 4,854 | ||||||
Actuant, Cl A | 21,071 | 547 | ||||||
Advanced Disposal Services* | 10,351 | 208 | ||||||
Advisory Board* | 35,706 | 1,264 | ||||||
AerCap Holdings* | 27,216 | 1,166 | ||||||
Aerojet Rocketdyne Holdings* | 77,216 | 1,569 | ||||||
AGCO | 23,552 | 1,314 | ||||||
Air Transport Services Group* | 219,400 | 3,554 | ||||||
Aircastle | 67,002 | 1,439 | ||||||
Alamo Group | 6,820 | 498 | ||||||
Alaska Air Group | 4,098 | 337 | ||||||
Albany International, Cl A | 29,060 | 1,357 | ||||||
Allegion | 22,424 | 1,500 | ||||||
Allison Transmission Holdings, Cl A | 29,283 | 971 | ||||||
Altra Industrial Motion | 12,645 | 443 | ||||||
American Woodmark* | 10,850 | 832 | ||||||
AO Smith | 23,806 | 1,158 | ||||||
Apogee Enterprises | 111,876 | 5,336 | ||||||
Applied Industrial Technologies | 11,173 | 669 | ||||||
ARC Document Solutions* | 420,495 | 1,875 | ||||||
Astec Industries | 47,253 | 3,133 | ||||||
Babcock & Wilcox Enterprises* | 148,400 | 2,365 | ||||||
Barnes Group | 828 | 38 | ||||||
Beacon Roofing Supply* | 12,215 | 567 | ||||||
Brady, Cl A | 16,816 | 618 | ||||||
Briggs & Stratton | 85,290 | 1,767 | ||||||
BWX Technologies | 139,009 | 5,444 | ||||||
Carlisle | 8,726 | 979 | ||||||
CEB | 99,795 | 5,883 | ||||||
Celadon Group (A) | 194,700 | 1,567 | ||||||
Chicago Bridge & Iron | 8,851 | 297 | ||||||
Clean Harbors* | 148,387 | 7,842 | ||||||
Copart* | 15,985 | 875 | ||||||
Costamare (A) | 86,039 | 496 | ||||||
| Description | Shares | Market Value ($ Thousands) | ||||||
Covanta Holding | 155,900 | $ | 2,276 | |||||
CRA International | 5,973 | 196 | ||||||
Crane | 34,264 | 2,518 | ||||||
Deluxe | 121,405 | 8,219 | ||||||
Dover | 10,016 | 727 | ||||||
Ducommun* | 4,064 | 116 | ||||||
Dycom Industries* | 25,292 | 1,852 | ||||||
EMCOR Group | 57,310 | 3,976 | ||||||
Engility Holdings* | 29,700 | 1,077 | ||||||
Ennis | 71,123 | 1,149 | ||||||
EnPro Industries | 13,128 | 798 | ||||||
Esterline Technologies* | 813 | 71 | ||||||
Exponent | 50,470 | 3,061 | ||||||
Federal Signal | 5,318 | 84 | ||||||
Fluor | 35,019 | 1,874 | ||||||
Fortune Brands Home & Security | 18,075 | 997 | ||||||
Forward Air | 100,985 | 4,886 | ||||||
FreightCar America | 201,245 | 2,954 | ||||||
Generac Holdings* | 47,943 | 1,965 | ||||||
General Cable | 96,925 | 1,817 | ||||||
Genesee & Wyoming, Cl A* | 51,251 | 3,916 | ||||||
Gibraltar Industries* | 18,170 | 818 | ||||||
Global Brass & Copper Holdings | 35,467 | 1,016 | ||||||
Great Lakes Dredge & Dock* | 913,051 | 3,880 | ||||||
Greenbrier | 557 | 22 | ||||||
H&E Equipment Services | 25,653 | 472 | ||||||
Harsco | 92,984 | 1,302 | ||||||
Healthcare Services Group (A) | 57,655 | 2,246 | ||||||
Heartland Express (A) | 213,126 | 4,584 | ||||||
HEICO, Cl A | 77,096 | 5,181 | ||||||
Hexcel | 27,819 | 1,439 | ||||||
Huntington Ingalls Industries | 31,363 | 5,606 | ||||||
Huron Consulting Group* | 73,578 | 3,881 | ||||||
Hyster-Yale Materials Handling | 677 | 44 | ||||||
ICF International* | 75,081 | 4,156 | ||||||
IDEX | 16,397 | 1,535 | ||||||
InnerWorkings* | 261,800 | 2,422 | ||||||
Insteel Industries | 54,570 | 2,159 | ||||||
ITT | 45,357 | 1,831 | ||||||
Jacobs Engineering Group* | 4,925 | 305 | ||||||
JetBlue Airways* | 227,460 | 4,570 | ||||||
John Bean Technologies | 61,324 | 5,531 | ||||||
Joy Global | 7,609 | 213 | ||||||
Kadant | 30,866 | 1,932 | ||||||
KAR Auction Services | 47,595 | 2,007 | ||||||
KBR | 250,145 | 4,180 | ||||||
Kelly Services, Cl A | 12,766 | 257 | ||||||
Kennametal | 88,484 | 3,052 | ||||||
KEYW Holding* (A) | 94,700 | 1,187 | ||||||
Kirby* | 66,480 | 4,218 | ||||||
Korn/Ferry International | 57,590 | 1,462 | ||||||
Lincoln Electric Holdings | 26,495 | 2,080 | ||||||
| 6 | SEI Institutional Investments Trust / Semi-Annual Report / November 30, 2016 |
SCHEDULE OF INVESTMENTS (Unaudited)
Small/Mid Cap Equity Fund (Continued)
November 30, 2016
| Description | Shares | Market Value ($ Thousands) | ||||||
LSC Communications | 31,552 | $ | 651 | |||||
Macquarie Infrastructure | 4,945 | 405 | ||||||
Manitowoc Foodservice* | 84,867 | 1,506 | ||||||
Manpowergroup | 44,392 | 3,791 | ||||||
MasTec* | 111,585 | 4,235 | ||||||
Matthews International, Cl A | 34,223 | 2,490 | ||||||
McGrath RentCorp | 4,071 | 150 | ||||||
Mercury Systems* | 172,025 | 5,111 | ||||||
Meritor* | 232,790 | 2,938 | ||||||
Middleby* | 16,540 | 2,266 | ||||||
Moog, Cl A* | 19,578 | 1,367 | ||||||
MRC Global* | 35,150 | 708 | ||||||
MSC Industrial Direct, Cl A | 37,124 | 3,317 | ||||||
Mueller Industries | 12,103 | 460 | ||||||
Multi-Color | 5,282 | 380 | ||||||
MYR Group* | 19,448 | 728 | ||||||
NACCO Industries, Cl A | 4,367 | 415 | ||||||
National Presto Industries | 4,328 | 412 | ||||||
NN | 29,881 | 506 | ||||||
Nordson | 5,389 | 575 | ||||||
Northwest Pipe* | 13,437 | 235 | ||||||
NV5 Global* | 39,945 | 1,460 | ||||||
Old Dominion Freight Line* | 33,735 | 2,945 | ||||||
On Assignment* | 95,875 | 3,959 | ||||||
Orbital ATK | 2,778 | 237 | ||||||
Orion Marine Group* | 147,200 | 1,468 | ||||||
Oshkosh Truck | 53,073 | 3,715 | ||||||
Owens Corning | 40,312 | 2,071 | ||||||
Parker Hannifin | 5,218 | 725 | ||||||
Park-Ohio Holdings | 1,937 | 82 | ||||||
Paylocity Holding* | 15,697 | 520 | ||||||
Pitney Bowes | 103,400 | 1,484 | ||||||
Powell Industries | 735 | 32 | ||||||
Proto Labs* (A) | 52,954 | 2,759 | ||||||
Quad, Cl A | 13,612 | 383 | ||||||
Quanta Services* | 45,377 | 1,530 | ||||||
Rand Logistics* | 90,887 | 84 | ||||||
RBC Bearings* | 7,120 | 603 | ||||||
Regal-Beloit | 42,358 | 3,088 | ||||||
Ritchie Bros Auctioneers | 34,344 | 1,313 | ||||||
Roadrunner Transportation Systems* | 128,221 | 1,286 | ||||||
RR Donnelley & Sons | 14,418 | 251 | ||||||
Ryder System | 21,600 | 1,691 | ||||||
Saia* | 31,546 | 1,317 | ||||||
Sensata Technologies Holding* | 147,869 | 5,526 | ||||||
SiteOne Landscape Supply* | 8,024 | 269 | ||||||
SkyWest | 2,004 | 74 | ||||||
Snap-on | 774 | 129 | ||||||
Sparton* | 8,675 | 211 | ||||||
Spirit AeroSystems Holdings, Cl A | 66,326 | 3,863 | ||||||
Spirit Airlines* | 49,545 | 2,755 | ||||||
Standex International | 10,724 | 945 | ||||||
| Description | Shares | Market Value ($ Thousands) | ||||||
Stericycle* | 13,028 | $ | 951 | |||||
Sterling Construction* | 138,050 | 1,144 | ||||||
Supreme Industries, Cl A | 17,317 | 246 | ||||||
Swift Transporation, Cl A* (A) | 150,102 | 3,748 | ||||||
Team* | 59,862 | 2,053 | ||||||
Teledyne Technologies* | 3,826 | 478 | ||||||
Tennant | 71,157 | 5,344 | ||||||
Terex | 8,200 | 250 | ||||||
Tetra Tech | 56,983 | 2,442 | ||||||
Timken | 24,618 | 961 | ||||||
Titan Machinery* (A) | 143,200 | 2,003 | ||||||
TriMas* | 33,244 | 713 | ||||||
TriNet Group* | 254,837 | 6,429 | ||||||
Trinity Industries | 72,400 | 2,012 | ||||||
Triton International | 24,400 | 471 | ||||||
Triumph Group | 41,723 | 1,160 | ||||||
Tutor Perini* | 178,000 | 4,646 | ||||||
UniFirst | 4,582 | 648 | ||||||
United Rentals* | 8,466 | 856 | ||||||
Univar* | 62,986 | 1,568 | ||||||
Universal Forest Products | 3,356 | 333 | ||||||
USG* | 48,207 | 1,381 | ||||||
Vectrus* | 29,642 | 685 | ||||||
Viad | 2,833 | 124 | ||||||
Wabash National | 60,593 | 836 | ||||||
Wabtec | 47,388 | 4,012 | ||||||
WageWorks* | 45,216 | 3,339 | ||||||
Waste Connections | 21,040 | 1,608 | ||||||
Watts Water Technologies, Cl A | 5,260 | 359 | ||||||
WESCO International* | 17,663 | 1,199 | ||||||
Woodward Governor | 30,948 | 2,096 | ||||||
XPO Logistics* (A) | 81,233 | 3,617 | ||||||
Xylem | 42,993 | 2,218 | ||||||
|
| |||||||
| 322,247 | ||||||||
|
| |||||||
Information Technology — 16.7% | ||||||||
2U* (A) | 138,834 | 4,590 | ||||||
8x8* | 187,775 | 2,563 | ||||||
Actua* | 52,524 | 712 | ||||||
Acxiom* | 155,268 | 4,119 | ||||||
Advanced Energy Industries* | 23,819 | 1,315 | ||||||
Aerohive Networks* | 350,115 | 1,929 | ||||||
Alarm.com Holdings* | 39,540 | 1,171 | ||||||
Alpha & Omega Semiconductor* | 21,773 | 474 | ||||||
Amkor Technology* | 25,968 | 307 | ||||||
Applied Micro Circuits* | 186,900 | 1,635 | ||||||
Arista Networks* | 5,720 | 542 | ||||||
ARRIS International* | 40,135 | 1,151 | ||||||
Arrow Electronics* | 37,314 | 2,547 | ||||||
Aspen Technology* | 15,065 | 796 | ||||||
Avnet | 97,091 | 4,456 | ||||||
AVX | 4,911 | 75 | ||||||
| 7 | SEI Institutional Investments Trust / Semi-Annual Report / November 30, 2016 |
SCHEDULE OF INVESTMENTS (Unaudited)
Small/Mid Cap Equity Fund (Continued)
November 30, 2016
| Description | Shares | Market Value ($ Thousands) | ||||||
Barracuda Networks* | 61,770 | $ | 1,361 | |||||
Bazaarvoice* | 266,693 | 1,413 | ||||||
Belden | 33,840 | 2,501 | ||||||
Benchmark Electronics* | 90,327 | 2,561 | ||||||
Black Box | 49,541 | 760 | ||||||
Blackbaud | 24,730 | 1,553 | ||||||
Blackhawk Network Holdings, Cl A* | 56,971 | 2,051 | ||||||
Booz Allen Hamilton Holding | 116,340 | 4,399 | ||||||
BroadSoft* | 10,577 | 439 | ||||||
Brocade Communications Systems | 194,818 | 2,404 | ||||||
Cabot Microelectronics | 596 | 36 | ||||||
CACI International, Cl A* | 18,354 | 2,375 | ||||||
Cadence Design Systems* | 336,945 | 8,855 | ||||||
CalAmp* | 269,445 | 3,918 | ||||||
Callidus Software* | 223,318 | 3,506 | ||||||
Cavium* | 81,654 | 4,657 | ||||||
CDW | 78,635 | 4,029 | ||||||
ChannelAdvisor* | 202,464 | 2,915 | ||||||
Ciber* | 870,757 | 723 | ||||||
Ciena* | 81,376 | 1,746 | ||||||
Cimpress* (A) | 28,013 | 2,436 | ||||||
Cirrus Logic* | 6,350 | 349 | ||||||
Cognex | 19,335 | 1,154 | ||||||
Coherent* | 29,812 | 3,890 | ||||||
Cohu | 7,623 | 95 | ||||||
CommScope Holding* | 84,849 | 3,053 | ||||||
CommVault Systems* | 20,930 | 1,130 | ||||||
Convergys | 91,108 | 2,357 | ||||||
Cornerstone OnDemand* | 68,720 | 2,468 | ||||||
CoStar Group* | 12,545 | 2,397 | ||||||
CSG Systems International | 27,880 | 1,241 | ||||||
CSRA | 104,787 | 3,354 | ||||||
Cypress Semiconductor | 230,958 | 2,598 | ||||||
Descartes Systems Group* | 111,812 | 2,477 | ||||||
Diebold | 62,655 | 1,429 | ||||||
Digi International* | 64,354 | 862 | ||||||
Dolby Laboratories, Cl A | 22,780 | 1,051 | ||||||
DST Systems | 36,840 | 3,802 | ||||||
Ellie Mae* | 6,442 | 532 | ||||||
EPAM Systems* | 6,010 | 396 | ||||||
ePlus* | 7,300 | 812 | ||||||
Euronet Worldwide* | 72,037 | 5,166 | ||||||
Exar* | 450,152 | 4,497 | ||||||
F5 Networks* | 7,735 | 1,089 | ||||||
FARO Technologies* | 4,978 | 181 | ||||||
Fidelity National Information Services | 14,803 | 1,143 | ||||||
Finisar* | 1,186 | 39 | ||||||
FireEye* | 268,059 | 3,442 | ||||||
First Data, Cl A* | 83,920 | 1,223 | ||||||
First Solar* | 3,983 | 121 | ||||||
Five9* | 96,876 | 1,534 | ||||||
Flex* | 322,427 | 4,591 | ||||||
| Description | Shares | Market Value ($ Thousands) | ||||||
Fortinet* | 13,370 | $ | 402 | |||||
Gartner* | 38,155 | 3,923 | ||||||
Globant* (A) | 9,940 | 341 | ||||||
Guidewire Software* | 29,916 | 1,667 | ||||||
Hackett Group | 85,100 | 1,511 | ||||||
HubSpot* | 9,170 | 514 | ||||||
IAC | 9,231 | 622 | ||||||
Imperva* | 22,600 | 862 | ||||||
Ingram Micro, Cl A | 9,663 | 362 | ||||||
Insight Enterprises* | 63,318 | 2,217 | ||||||
Instructure* | 33,160 | 648 | ||||||
Integrated Device Technology* | 37,680 | 882 | ||||||
Intersil, Cl A | 9,383 | 208 | ||||||
InterXion Holding* | 35,050 | 1,197 | ||||||
Ixia* | 97,578 | 1,342 | ||||||
IXYS | 17,360 | 203 | ||||||
Jabil Circuit | 4,405 | 93 | ||||||
Kulicke & Soffa Industries* | 74,242 | 1,146 | ||||||
Littelfuse | 45,807 | 6,678 | ||||||
LogMeIn | 74,437 | 7,507 | ||||||
Lumentum Holdings* | 120,443 | 4,830 | ||||||
MACOM Technology Solutions Holdings* | 18,858 | 940 | ||||||
Manhattan Associates* | 16,810 | 881 | ||||||
ManTech International, Cl A | 5,540 | 238 | ||||||
Marvell Technology Group | 297,736 | 4,270 | ||||||
MAXIMUS | 104,251 | 5,764 | ||||||
Mentor Graphics | 90,099 | 3,293 | ||||||
Microchip Technology | 14,188 | 939 | ||||||
Microsemi* | 101,760 | 5,571 | ||||||
MKS Instruments | 7,701 | 443 | ||||||
Monolithic Power Systems | 51,188 | 4,199 | ||||||
Nanometrics* | 13,054 | 312 | ||||||
NCR* | 69,300 | 2,685 | ||||||
NeoPhotonics* | 14,184 | 183 | ||||||
NETGEAR* | 43,147 | 2,317 | ||||||
New Relic* (A) | 57,224 | 1,815 | ||||||
Nutanix, Cl A* (A) | 3,619 | 116 | ||||||
Oclaro* | 31,622 | 283 | ||||||
ON Semiconductor* | 208,059 | 2,451 | ||||||
Pandora Media* (A) | 25,138 | 292 | ||||||
PDF Solutions* | 167,764 | 3,951 | ||||||
Perficient* | 144,565 | 2,602 | ||||||
Photronics* | 54,170 | 542 | ||||||
Plexus* | 31,722 | 1,621 | ||||||
Progress Software | 3,886 | 115 | ||||||
Proofpoint* | 42,102 | 3,242 | ||||||
PTC* | 41,150 | 2,004 | ||||||
Q2 Holdings* | 72,373 | 2,135 | ||||||
QAD, Cl A | 53,100 | 1,540 | ||||||
Qorvo* | 18,052 | 964 | ||||||
QuinStreet* | 5,522 | 18 | ||||||
RealPage* | 115,679 | 3,308 | ||||||
| 8 | SEI Institutional Investments Trust / Semi-Annual Report / November 30, 2016 |
SCHEDULE OF INVESTMENTS (Unaudited)
Small/Mid Cap Equity Fund (Continued)
November 30, 2016
| Description | Shares | Market Value ($ Thousands) | ||||||
RetailMeNot* | 5,624 | $ | 52 | |||||
RingCentral, Cl A* | 32,677 | 704 | ||||||
Rogers* | 470 | 35 | ||||||
Rubicon Project* | 76,043 | 574 | ||||||
Rudolph Technologies* | 65,697 | 1,288 | ||||||
Sanmina* | 98,991 | 3,252 | ||||||
ScanSource* | 9,128 | 345 | ||||||
Seagate Technology (A) | 44,900 | 1,800 | ||||||
Semtech* | 27,005 | 759 | ||||||
Shopify, Cl A* | 33,010 | 1,376 | ||||||
Shutterstock* (A) | 30,945 | 1,456 | ||||||
Silicon Laboratories* | 11,438 | 759 | ||||||
Sonus Networks* | 45,418 | 274 | ||||||
SPS Commerce* | 18,386 | 1,274 | ||||||
SS&C Technologies Holdings (A) | 162,766 | 4,885 | ||||||
Stratasys* (A) | 92,940 | 1,678 | ||||||
SuperCom* | 188,485 | 603 | ||||||
Sykes Enterprises* | 32,059 | 903 | ||||||
SYNNEX | 4,700 | 549 | ||||||
Synopsys* | 29,474 | 1,783 | ||||||
Take-Two Interactive Software* | 40,799 | 2,009 | ||||||
Tech Data* | 47,168 | 4,003 | ||||||
Teradata* | 52,200 | 1,402 | ||||||
Teradyne | 181,267 | 4,419 | ||||||
Tessera Technologies | 808 | 32 | ||||||
Trimble* | 127,081 | 3,582 | ||||||
Tyler Technologies* | 21,705 | 3,232 | ||||||
Ultimate Software Group* | 2,588 | 530 | ||||||
Ultratech* | 61,200 | 1,403 | ||||||
Viavi Solutions* | 130,500 | 1,024 | ||||||
Virtusa* | 22,812 | 507 | ||||||
Western Digital | 10,300 | 656 | ||||||
WEX* | 9,300 | 1,028 | ||||||
Xcerra* | 228,434 | 1,448 | ||||||
Xilinx | 24,970 | 1,348 | ||||||
Yelp, Cl A* | 21,965 | 817 | ||||||
Zebra Technologies, Cl A* | 13,105 | 1,036 | ||||||
|
| |||||||
| 290,507 | ||||||||
|
| |||||||
Materials — 4.3% | ||||||||
AdvanSix* | 66,900 | 1,251 | ||||||
AK Steel Holding* (A) | 144,042 | 1,315 | ||||||
Albemarle | 11,278 | 990 | ||||||
Allegheny Technologies (A) | 215,730 | 3,784 | ||||||
Avery Dennison | 12,662 | 912 | ||||||
Ball | 15,220 | 1,142 | ||||||
Bemis | 26,710 | 1,337 | ||||||
Berry Plastics Group* | 158,195 | 7,873 | ||||||
Cabot | 65,027 | 3,312 | ||||||
Carpenter Technology | 19,821 | 709 | ||||||
Celanese, Cl A | 14,495 | 1,150 | ||||||
Century Aluminum* | 105,825 | 976 | ||||||
| Description | Shares | Market Value ($ Thousands) | ||||||
Chemours | 18,239 | $ | 451 | |||||
Clearwater Paper* | 11,700 | 728 | ||||||
Cliffs Natural Resources* | 50,325 | 443 | ||||||
Coeur Mining* | 45,267 | 437 | ||||||
Commercial Metals | 14,431 | 318 | ||||||
Crown Holdings* | 23,754 | 1,292 | ||||||
Domtar | 36,200 | 1,422 | ||||||
Eastman Chemical | 14,600 | 1,097 | ||||||
Ferroglobe* | 141,200 | 16 | ||||||
Ferroglobe PLC | 141,200 | 1,611 | ||||||
Flotek Industries* (A) | 7,675 | 103 | ||||||
FMC | 33,707 | 1,892 | ||||||
FutureFuel | 25,106 | 345 | ||||||
Glatfelter | 39,200 | 900 | ||||||
Headwaters* | 72,200 | 1,711 | ||||||
Hecla Mining | 6,484 | 39 | ||||||
Huntsman | 178,650 | 3,480 | ||||||
Ingevity* | 62,025 | 3,248 | ||||||
Innophos Holdings | 15,790 | 861 | ||||||
Innospec | 5,133 | 337 | ||||||
Kaiser Aluminum | 7,223 | 595 | ||||||
Kraton Performance Polymers* | 56,975 | 1,757 | ||||||
Materion | 5,196 | 199 | ||||||
Olin | 66,195 | 1,721 | ||||||
Olympic Steel | 19,388 | 474 | ||||||
OMNOVA Solutions* | 10,140 | 97 | ||||||
PolyOne | 22,397 | 738 | ||||||
Rayonier Advanced Materials | 12,371 | 172 | ||||||
Real Industry* | 200,900 | 1,175 | ||||||
Reliance Steel & Aluminum | 13,235 | 1,073 | ||||||
Royal Gold | 3,160 | 220 | ||||||
Ryerson Holding* | 37,424 | 535 | ||||||
Schweitzer-Mauduit International | 65,294 | 2,745 | ||||||
Scotts Miracle-Gro, Cl A | 7,163 | 654 | ||||||
Sensient Technologies | 47,785 | 3,732 | ||||||
Silgan Holdings | 11,926 | 590 | ||||||
Sonoco Products | 7,686 | 416 | ||||||
Steel Dynamics | 74,731 | 2,651 | ||||||
Stepan | 2,076 | 168 | ||||||
Summit Materials, Cl A* | 76,087 | 1,809 | ||||||
SunCoke Energy | 17,405 | 199 | ||||||
Tahoe Resources | 22,615 | 217 | ||||||
Tredegar | 386 | 9 | ||||||
Trinseo | 26,142 | 1,531 | ||||||
Tronox, Cl A (A) | 119,071 | 1,350 | ||||||
United States Steel | 76,671 | 2,480 | ||||||
US Concrete* | 21,716 | 1,235 | ||||||
Westlake Chemical | 17,849 | 1,056 | ||||||
WestRock | 3,861 | 198 | ||||||
|
| |||||||
| 75,278 | ||||||||
|
| |||||||
| 9 | SEI Institutional Investments Trust / Semi-Annual Report / November 30, 2016 |
SCHEDULE OF INVESTMENTS (Unaudited)
Small/Mid Cap Equity Fund (Continued)
November 30, 2016
| Description | Shares | Market Value ($ Thousands) | ||||||
Real Estate — 5.6% | ||||||||
Agree Realty‡ | 10,365 | $ | 465 | |||||
Alexander’s‡ | 67 | 29 | ||||||
Alexandria Real Estate Equities‡ | 14,120 | 1,547 | ||||||
American Campus Communities‡ | 68,642 | 3,234 | ||||||
Apartment Investment & Management, Cl A‡ | 18,068 | 761 | ||||||
Apple Hospitality‡ | 6,869 | 127 | ||||||
Armada Hoffler Properties‡ | 19,201 | 270 | ||||||
Ashford Hospitality Prime‡ | 3,000 | 38 | ||||||
Ashford Hospitality Trust‡ | 83,700 | 588 | ||||||
Brandywine Realty Trust‡ | 121,300 | 1,862 | ||||||
Brixmor Property Group‡ | 70,980 | 1,728 | ||||||
Camden Property Trust‡ | 13,704 | 1,079 | ||||||
CareTrust‡ | 103,100 | 1,459 | ||||||
CatchMark Timber Trust, Cl A‡ | 69,358 | 759 | ||||||
CBL & Associates Properties‡ | 70,700 | 838 | ||||||
Cedar Realty Trust‡ | 385,300 | 2,485 | ||||||
Chatham Lodging Trust‡ | 37,400 | 717 | ||||||
Colony Starwood Homes‡ | 141,200 | 4,314 | ||||||
Columbia Property Trust‡ | 13,272 | 280 | ||||||
Communications Sales & Leasing‡ | 9,980 | 249 | ||||||
CoreCivic‡ | 8,154 | 185 | ||||||
CoreSite Realty‡ | 14,000 | 987 | ||||||
Corporate Office Properties Trust‡ | 38,354 | 1,098 | ||||||
Cousins Properties‡ | 135,000 | 1,068 | ||||||
CyrusOne‡ | 20,506 | 875 | ||||||
DCT Industrial Trust‡ | 3,531 | 162 | ||||||
DDR‡ | 150,502 | 2,291 | ||||||
DiamondRock Hospitality‡ | 96,069 | 1,017 | ||||||
Douglas Emmett‡ | 6,805 | 250 | ||||||
Duke Realty‡ | 116,368 | 2,959 | ||||||
Education Realty Trust‡ | 20,910 | 849 | ||||||
EPR Properties‡ | 5,425 | 377 | ||||||
Equinix‡ | 2,104 | 713 | ||||||
Equity Commonwealth*‡ | 152,065 | 4,422 | ||||||
Equity One‡ | 27,381 | 818 | ||||||
FelCor Lodging Trust‡ | 89,900 | 653 | ||||||
First Industrial Realty Trust‡ | 17,455 | 462 | ||||||
Forest City Realty Trust, Cl A‡ | 103,724 | 1,918 | ||||||
Franklin Street Properties‡ | 74,400 | 934 | ||||||
Geo Group‡ | 38,466 | 1,279 | ||||||
Getty Realty‡ | 49,874 | 1,198 | ||||||
Gramercy Property Trust‡ | 386,200 | 3,375 | ||||||
Healthcare Realty Trust‡ | 4,564 | 134 | ||||||
Healthcare Trust of America, Cl A‡ | 20,828 | 589 | ||||||
Highwoods Properties‡ | 6,285 | 302 | ||||||
Hospitality Properties Trust‡ | 99,100 | 2,873 | ||||||
Host Hotels & Resorts‡ | 47,730 | 852 | ||||||
Iron Mountain‡ | 30,295 | 1,000 | ||||||
Jones Lang LaSalle | — | — | ||||||
Kennedy-Wilson Holdings | 172,900 | 3,691 | ||||||
Lexington Realty Trust‡ | 348,641 | 3,601 | ||||||
| Description | Shares | Market Value ($ Thousands) | ||||||
Liberty Property Trust‡ | 15,878 | $ | 626 | |||||
Life Storage‡ | 5,360 | 435 | ||||||
LTC Properties‡ | 783 | 36 | ||||||
Mack-Cali Realty‡ | 139,387 | 3,770 | ||||||
MedEquities Realty Trust | 140,600 | 1,531 | ||||||
Medical Properties Trust‡ | 72,666 | 866 | ||||||
Mid-America Apartment Communities‡ | 27,935 | 2,560 | ||||||
Monmouth Real Estate Investment, Cl A‡ | 5,246 | 74 | ||||||
National Health Investors‡ | 15,800 | 1,118 | ||||||
National Retail Properties‡ | 20,240 | 864 | ||||||
National Storage Affiliates Trust‡ | 171,816 | 3,536 | ||||||
NexPoint Residential Trust‡ | 1,362 | 27 | ||||||
Omega Healthcare Investors‡ | 43,400 | 1,279 | ||||||
Outfront Media‡ | 23,947 | 604 | ||||||
Parkway* | 16,875 | 331 | ||||||
Piedmont Office Realty Trust, Cl A‡ | 110,394 | 2,168 | ||||||
Post Properties‡ | 3,714 | 241 | ||||||
RAIT Financial Trust‡ | 22,999 | 71 | ||||||
Rayonier‡ | 3,859 | 102 | ||||||
Regency Centers‡ | 14,065 | 940 | ||||||
Retail Opportunity Investments‡ | — | — | ||||||
Retail Properties of America, Cl A‡ | 21,137 | 323 | ||||||
Ryman Hospitality Properties‡ | 16,593 | 977 | ||||||
Sabra Health Care‡ | 44,600 | 987 | ||||||
Saul Centers‡ | 4,795 | 304 | ||||||
Select Income‡ | 105,126 | 2,569 | ||||||
Senior Housing Properties Trust‡ | 162,942 | 2,943 | ||||||
Seritage Growth Properties‡ (A) | 31,850 | 1,517 | ||||||
Spirit Realty Capital‡ | 22,825 | 246 | ||||||
STORE Capital‡ | 8,396 | 208 | ||||||
Sun Communities‡ | 5,490 | 396 | ||||||
Sunstone Hotel Investors‡ | 104,562 | 1,520 | ||||||
Washington Real Estate Investment Trust‡ | 4,559 | 142 | ||||||
Weingarten Realty Investors‡ | 16,037 | 569 | ||||||
WP Carey‡ | 1,000 | 58 | ||||||
|
| |||||||
| 97,699 | ||||||||
|
| |||||||
Telecommunication Services — 0.5% | ||||||||
ATN International | 4,429 | 320 | ||||||
Cincinnati Bell* | 13,059 | 269 | ||||||
Cogent Communications Holdings | 11,624 | 435 | ||||||
FairPoint Communications* | 2,247 | 37 | ||||||
IDT, Cl B | 23,769 | 503 | ||||||
Inteliquent | 76,000 | 1,721 | ||||||
Intelsat* | 37,858 | 156 | ||||||
Iridium Communications* (A) | 160,800 | 1,415 | ||||||
Ooma* | 62,341 | 580 | ||||||
Spok Holdings | 3,804 | 69 | ||||||
Telephone & Data Systems | 1,434 | 39 | ||||||
Vonage Holdings* | 189,685 | 1,250 | ||||||
| 10 | SEI Institutional Investments Trust / Semi-Annual Report / November 30, 2016 |
SCHEDULE OF INVESTMENTS (Unaudited)
Small/Mid Cap Equity Fund (Continued)
November 30, 2016
| Description | Shares | Market Value ($ Thousands) | ||||||
Zayo Group Holdings* | 42,030 | $ | 1,450 | |||||
|
| |||||||
| 8,244 | ||||||||
|
| |||||||
Utilities — 3.2% | ||||||||
ALLETE | 73,008 | 4,513 | ||||||
Alliant Energy | 46,406 | 1,667 | ||||||
Ameren | 28,700 | 1,410 | ||||||
American States Water | 3,051 | 129 | ||||||
Aqua America | 12,964 | 385 | ||||||
Atmos Energy | 17,502 | 1,245 | ||||||
Avista | 46,303 | 1,874 | ||||||
Cadiz* (A) | 92,873 | 966 | ||||||
Calpine* | 120,050 | 1,339 | ||||||
Chesapeake Utilities | 22,987 | 1,490 | ||||||
Connecticut Water Service | 2,258 | 123 | ||||||
DTE Energy | 13,115 | 1,221 | ||||||
Edison International | 14,711 | 1,012 | ||||||
El Paso Electric | 1,493 | 67 | ||||||
Fortis | — | — | ||||||
Great Plains Energy | 144,564 | 3,815 | ||||||
Hawaiian Electric Industries | 38,536 | 1,187 | ||||||
IDACORP | 14,104 | 1,074 | ||||||
MDU Resources Group | 9,752 | 271 | ||||||
MGE Energy | 6,158 | 365 | ||||||
Middlesex Water | 9,150 | 373 | ||||||
Northwest Natural Gas | 9,946 | 570 | ||||||
NorthWestern | 50,811 | 2,850 | ||||||
OGE Energy | 102,100 | 3,231 | ||||||
ONE Gas | 25,633 | 1,538 | ||||||
Ormat Technologies | 1,047 | 50 | ||||||
Pinnacle West Capital | 67,902 | 5,020 | ||||||
PNM Resources | 84,624 | 2,674 | ||||||
Portland General Electric | 123,307 | 5,130 | ||||||
PPL | 25,025 | 837 | ||||||
SCANA | 11,200 | 790 | ||||||
SJW | 11,683 | 627 | ||||||
South Jersey Industries | 42,550 | 1,404 | ||||||
Southwest Gas | 20,590 | 1,526 | ||||||
Talen Energy* | 4,552 | 64 | ||||||
UGI | 80,361 | 3,600 | ||||||
Unitil | 5,604 | 238 | ||||||
Vectren | 19,067 | 936 | ||||||
Westar Energy, Cl A | 10,409 | 593 | ||||||
|
| |||||||
| 56,204 | ||||||||
|
| |||||||
Total Common Stock | 1,660,763 | |||||||
|
| |||||||
| Description | Shares | Market Value ($ Thousands) | ||||||
EXCHANGE TRADED FUND — 0.2% |
| |||||||
Exchange Traded Fund — 0.2% |
| |||||||
iShares Russell 2000 Value Fund (A) | 33,400 | $ | 3,836 | |||||
|
| |||||||
Total Exchange Traded Fund | 3,836 | |||||||
|
| |||||||
| Number of Rights | ||||||||
RIGHTS — 0.0% | ||||||||
Dyax, Expires 12/31/2019* | 59,546 | — | ||||||
|
| |||||||
Total Rights | — | |||||||
|
| |||||||
| Shares | ||||||||
AFFILIATED PARTNERSHIP — 6.9% |
| |||||||
SEI Liquidity Fund, L.P. | ||||||||
0.470%**† (B) | 119,958,088 | 119,961 | ||||||
|
| |||||||
Total Affiliated Partnership | 119,961 | |||||||
|
| |||||||
CASH EQUIVALENT — 3.7% | ||||||||
SEI Daily Income Trust, Government Fund, Cl A | ||||||||
0.210%**† | 65,438,489 | 65,438 | ||||||
|
| |||||||
Total Cash Equivalent | 65,438 | |||||||
|
| |||||||
Total Investments — 106.0% |
| $ | 1,849,998 | |||||
|
| |||||||
Percentages are based on Net Assets of $1,744,846 ($ Thousands).
| * | Non-income producing security. |
| ** | Rate shown is the 7-day effective yield as of November 30, 2016. |
| † | Investment in Affiliated Security (see Note 6). |
| ‡ | Real Estate Investment Trust. |
| (A) | This security or a partial position of this security is on loan at November 30, 2016 (see Note 12). The total market value of securities on loan at November 30, 2016 was $116,897 ($ Thousands). |
| (B) | This security was purchased with cash collateral held from securities on loan (see Note 12). The total market value of such securities as of November 30, 2016 was $119,961 ($ Thousands). |
ADR — American Depositary Receipt
Cl — Class
L.P. — Limited Partnership
PLC — Public Limited Company
| 11 | SEI Institutional Investments Trust / Semi-Annual Report / November 30, 2016 |
SCHEDULE OF INVESTMENTS (Unaudited)
Small/Mid Cap Equity Fund (Concluded)
November 30, 2016
The following is a list of the level of inputs used as of November 30, 2016, in valuing the Fund’s investments and other financial instruments carried a value ($ Thousands):
| Investments in Securities | Level 1 | Level 2 | Level 3 | Total | ||||||||||||
Common Stock | $ | 1,660,763 | $ | — | $ | — | $ | 1,660,763 | ||||||||
Exchange Traded Fund | 3,836 | — | — | 3,836 | ||||||||||||
Rights | — | — | — | — | ||||||||||||
Affiliated Partnership | — | 119,961 | — | 119,961 | ||||||||||||
Cash Equivalent | 65,438 | — | — | 65,438 | ||||||||||||
|
|
|
|
|
|
|
| |||||||||
Total Investments in Securities | $ | 1,730,037 | $ | 119,961 | $ | — | $ | 1,849,998 | ||||||||
|
|
|
|
|
|
|
| |||||||||
For the period ended November 30, 2016, there were no transfers between Level 1 and Level 2 assets and liabilities.
For the period ended November 30, 2016, there were no transfers between Level 2 and Level 3 assets and liabilities.
For more information on valuation inputs, see Note 2 — Significant Accounting Policies in Notes to Financial Statements.
Amounts designated as “—” are $0 or have been rounded to $0.
The accompanying notes are an integral part of the financial statements.
| 12 | SEI Institutional Investments Trust / Semi-Annual Report / November 30, 2016 |
SCHEDULE OF INVESTMENTS (Unaudited)
U.S. Managed Volatility Fund
November 30, 2016
| Description | Shares | Market Value ($ Thousands) | ||||||
COMMON STOCK — 97.5% | ||||||||
Consumer Discretionary — 9.6% | ||||||||
American Eagle Outfitters | 121,651 | $ | 2,015 | |||||
Aramark | 140,202 | 4,824 | ||||||
Bed Bath & Beyond | 156,645 | 7,019 | ||||||
Best Buy | 20,211 | 924 | ||||||
Big Lots | 70,552 | 3,571 | ||||||
BJ’s Restaurants* | 7,547 | 280 | ||||||
Brinker International | 155,906 | 8,280 | ||||||
Canadian Tire, Cl A | 77,700 | 8,085 | ||||||
Cheesecake Factory | 66,529 | 3,936 | ||||||
Children’s Place | 20,600 | 2,139 | ||||||
Cogeco Communications | 13,400 | 643 | ||||||
Comcast, Cl A | 104,000 | 7,229 | ||||||
Cooper Tire & Rubber | 16,090 | 616 | ||||||
Cooper-Standard Holdings* | 5,209 | 497 | ||||||
Cracker Barrel Old Country Store | 2,634 | 429 | ||||||
Darden Restaurants | 35,300 | 2,587 | ||||||
Del Frisco’s Restaurant Group* | 3,767 | 65 | ||||||
Dillard’s, Cl A | 22,360 | 1,599 | ||||||
Dollar General | 31,491 | 2,435 | ||||||
Eldorado Resorts* | 23,445 | 322 | ||||||
Escalade | 4,575 | 63 | ||||||
Foot Locker | 82,744 | 5,930 | ||||||
GameStop, Cl A | 28,187 | 696 | ||||||
Gannett | 10,340 | 99 | ||||||
General Motors | 6,418 | 222 | ||||||
Genuine Parts | 9,335 | 898 | ||||||
Golden Entertainment | 2,096 | 26 | ||||||
H&R Block | 12,072 | 267 | ||||||
Hemisphere Media Group, Cl A* | 11,448 | 136 | ||||||
HSN | 41,600 | 1,585 | ||||||
International Speedway, Cl A | 7,007 | 258 | ||||||
John Wiley & Sons, Cl A | 5,143 | 282 | ||||||
Kohl’s | 113,822 | 6,127 | ||||||
Lear | 11,198 | 1,450 | ||||||
Lindblad Expeditions Holdings* | 6,864 | 66 | ||||||
Macy’s | 42,600 | 1,798 | ||||||
Mattel | 98,162 | 3,099 | ||||||
McDonald’s | 71,466 | 8,524 | ||||||
Michael Kors Holdings* | 99,573 | 4,629 | ||||||
MSG Networks* | 26,238 | 537 | ||||||
Murphy USA* | 88,400 | 6,028 | ||||||
National CineMedia | 2,931 | 45 | ||||||
NVR* | 1,851 | 2,952 | ||||||
Panera Bread, Cl A* | 7,321 | 1,553 | ||||||
PetMed Express | 21,310 | 465 | ||||||
Regal Entertainment Group, Cl A | 19,324 | 443 | ||||||
Ross Stores | 6,142 | 415 | ||||||
Sally Beauty Holdings* | 137,600 | 3,604 | ||||||
Scripps Networks Interactive, Cl A | 70,000 | 4,848 | ||||||
Staples | 110,259 | 1,066 | ||||||
Target | 275,941 | 21,314 | ||||||
| Description | Shares | Market Value ($ Thousands) | ||||||
Texas Roadhouse, Cl A | 2,218 | $ | 104 | |||||
Under Armour, Cl C* | 14,731 | 380 | ||||||
Viacom, Cl B | 94,600 | 3,546 | ||||||
Wayfair, Cl A* | 806 | 29 | ||||||
Yum! Brands | 30,323 | 1,922 | ||||||
|
| |||||||
| 142,901 | ||||||||
|
| |||||||
Consumer Staples — 14.7% | ||||||||
Altria Group | 360,004 | 23,015 | ||||||
Amplify Snack Brands* | 5,092 | 48 | ||||||
Bunge | 132,400 | 9,040 | ||||||
Calavo Growers | 3,819 | 206 | ||||||
Cal-Maine Foods | 1,238 | 50 | ||||||
Church & Dwight | 21,204 | 929 | ||||||
Clorox | 38,150 | 4,409 | ||||||
Coca-Cola | 107,926 | 4,355 | ||||||
Colgate-Palmolive | 99,809 | 6,511 | ||||||
Costco Wholesale | 43,021 | 6,458 | ||||||
CVS Health | 59,500 | 4,575 | ||||||
Dean Foods | 171,874 | 3,413 | ||||||
Dr. Pepper Snapple Group | 253,888 | 22,022 | ||||||
Flowers Foods | 143,273 | 2,224 | ||||||
Fresh Del Monte Produce | 124,035 | 7,691 | ||||||
General Mills | 97,739 | 5,956 | ||||||
Hershey | 48,853 | 4,721 | ||||||
Hormel Foods | 56,653 | 1,940 | ||||||
Ingredion | 25,900 | 3,040 | ||||||
J&J Snack Foods | 3,801 | 462 | ||||||
Kellogg | 34,549 | 2,488 | ||||||
Kimberly-Clark | 54,500 | 6,301 | ||||||
Kroger | 265,337 | 8,570 | ||||||
Lancaster Colony | 9,899 | 1,341 | ||||||
McCormick | 55,206 | 5,035 | ||||||
Metro, Cl A | 88,500 | 2,693 | ||||||
Nu Skin Enterprises, Cl A | 5,624 | 294 | ||||||
PepsiCo | 94,565 | 9,466 | ||||||
Philip Morris International | 102,076 | 9,011 | ||||||
Pinnacle Foods | 42,353 | 2,099 | ||||||
Sanderson Farms | 49,400 | 3,984 | ||||||
Snyder’s-Lance | 7,995 | 298 | �� | |||||
Sysco | 171,356 | 9,125 | ||||||
Tyson Foods, Cl A | 190,686 | 10,833 | ||||||
Universal | 53,536 | 2,947 | ||||||
Vector Group | 29,239 | 624 | ||||||
Wal-Mart Stores | 397,859 | 28,021 | ||||||
Weis Markets | 82,701 | 4,606 | ||||||
|
| |||||||
| 218,801 | ||||||||
|
| |||||||
Energy — 1.0% | ||||||||
Adams Resources & Energy | 443 | 17 | ||||||
Exxon Mobil | 131,600 | 11,489 | ||||||
Frank’s International | 95,543 | 1,203 | ||||||
| 1 | SEI Institutional Investments Trust / Semi-Annual Report / November 30, 2016 |
SCHEDULE OF INVESTMENTS (Unaudited)
U.S. Managed Volatility Fund (Continued)
November 30, 2016
| Description | Shares | Market Value ($ Thousands) | ||||||
Valero Energy | 42,700 | $ | 2,629 | |||||
|
| |||||||
| 15,338 | ||||||||
|
| |||||||
Financials — 16.5% | ||||||||
Access National | 2,563 | 70 | ||||||
AGNC Investment‡ | 79,200 | 1,478 | ||||||
Alleghany* | 705 | 400 | ||||||
Allied World Assurance Holdings | 43,593 | 2,041 | ||||||
Allstate | 168,703 | 11,796 | ||||||
American Financial Group | 125,284 | 10,302 | ||||||
American Homes 4 Rent, Cl A‡ | 9,065 | 191 | ||||||
American National Insurance | 8,758 | 1,055 | ||||||
AMERISAFE | 2,204 | 140 | ||||||
Annaly Capital Management‡ | 667,000 | 6,817 | ||||||
Anworth Mortgage Asset‡ | 50,060 | 260 | ||||||
Apollo Commercial Real Estate Finance‡ | 309,803 | 5,316 | ||||||
Arch Capital Group* | 50,806 | 4,203 | ||||||
Ares Commercial Real Estate‡ | 2,962 | 40 | ||||||
Argo Group International Holdings | 4,488 | 285 | ||||||
Aspen Insurance Holdings | 94,640 | 4,822 | ||||||
Assured Guaranty | 61,526 | 2,200 | ||||||
Atlas Financial Holdings* | 16,638 | 281 | ||||||
Axis Capital Holdings | 183,105 | 11,171 | ||||||
Bank of America | 182,956 | 3,864 | ||||||
Bank of Marin Bancorp | 763 | 48 | ||||||
BankUnited | 35,742 | 1,266 | ||||||
Berkshire Hathaway, Cl B* | 95,700 | 15,067 | ||||||
BNC Bancorp | 7,558 | 228 | ||||||
BOK Financial | 6,775 | 544 | ||||||
Canadian Imperial Bank of Commerce | 65,200 | 5,139 | ||||||
Capitol Federal Financial | 53,096 | 845 | ||||||
Capstead Mortgage‡ | 72,004 | 745 | ||||||
Carolina Financial | 7,119 | 189 | ||||||
CBOE Holdings | 63,528 | 4,377 | ||||||
Charter Financial | 2,061 | 29 | ||||||
Chemical Financial | 2,900 | 150 | ||||||
Citigroup | 7,143 | 403 | ||||||
Citizens Financial Group | 19,288 | 646 | ||||||
Community Trust Bancorp | 2,375 | 100 | ||||||
CU Bancorp* | 3,267 | 91 | ||||||
Cullen/Frost Bankers | 12,504 | 1,029 | ||||||
Employers Holdings | 5,322 | 188 | ||||||
Endurance Specialty Holdings | 21,777 | 2,008 | ||||||
Erie Indemnity, Cl A | 6,540 | 701 | ||||||
Essent Group* | 4,569 | 139 | ||||||
Everest Re Group | 94,442 | 19,885 | ||||||
Farmers Capital Bank | 3,534 | 127 | ||||||
Farmers National Banc | 2,368 | 28 | ||||||
First Business Financial Services | 5,209 | 114 | ||||||
First Foundation* | 7,001 | 196 | ||||||
First Mid-Illinois Bancshares | 3,636 | 111 | ||||||
Genworth MI Canada | 22,800 | 554 | ||||||
| Description | Shares | Market Value ($ Thousands) | ||||||
Great Ajax | 8,930 | $ | 116 | |||||
Green Dot, Cl A* | 13,926 | 336 | ||||||
Guaranty Bancorp | 2,615 | 56 | ||||||
Hanover Insurance Group | 65,282 | 5,653 | ||||||
Heritage Insurance Holdings | 5,640 | 81 | ||||||
Horizon Bancorp | 7,091 | 162 | ||||||
Houlihan Lokey | 4,610 | 131 | ||||||
James River Group Holdings | 6,113 | 238 | ||||||
JPMorgan Chase | 18,198 | 1,459 | ||||||
MBT Financial | 6,041 | 58 | ||||||
MFA Financial‡ | 1,049,704 | 8,209 | ||||||
MidWestOne Financial Group | 2,246 | 75 | ||||||
MTGE Investment‡ | 28,418 | 475 | ||||||
National Bank of Canada | 119,200 | 4,461 | ||||||
National Commerce* | 1,236 | 40 | ||||||
National General Holdings | 3,318 | 75 | ||||||
Northwest Bancshares | 14,483 | 263 | ||||||
Old Line Bancshares | 5,303 | 116 | ||||||
Old Republic International | 11,670 | 209 | ||||||
Old Second Bancorp | 15,296 | 141 | ||||||
Oritani Financial | 3,769 | 67 | ||||||
Pacific Premier Bancorp* | 19,184 | 615 | ||||||
PennyMac Mortgage Investment Trust‡ | 251,400 | 4,093 | ||||||
Peoples Financial Services | 3,680 | 162 | ||||||
People’s Utah Bancorp | 3,035 | 70 | ||||||
PNC Financial Services Group | 125,700 | 13,895 | ||||||
Popular | 27,780 | 1,129 | ||||||
Preferred Bank | 2,713 | 122 | ||||||
ProAssurance | 5,469 | 307 | ||||||
Reinsurance Group of America, Cl A | 30,693 | 3,746 | ||||||
RenaissanceRe Holdings | 89,597 | 11,698 | ||||||
RLI | 5,277 | 317 | ||||||
Starwood Property Trust‡ | 313,000 | 7,033 | ||||||
Stonegate Bank | 12,115 | 472 | ||||||
Territorial Bancorp | 996 | 31 | ||||||
Thomson Reuters | 6,551 | 283 | ||||||
Toronto-Dominion Bank | 140,900 | 6,661 | ||||||
Travelers | 175,938 | 19,943 | ||||||
Triumph Bancorp* | 1,315 | 28 | ||||||
Two Harbors Investment‡ | 527,028 | 4,569 | ||||||
US Bancorp | 53,013 | 2,631 | ||||||
Validus Holdings | 263,700 | 14,329 | ||||||
Virtu Financial, Cl A | 33,339 | 462 | ||||||
Voya Financial | 11,289 | 439 | ||||||
Washington Federal | 12,601 | 409 | ||||||
WashingtonFirst Bankshares | 855 | 23 | ||||||
Waterstone Financial | 11,928 | 214 | ||||||
Wells Fargo | 118,000 | 6,245 | ||||||
White Mountains Insurance Group | 285 | 239 | ||||||
|
| |||||||
| 244,265 | ||||||||
|
| |||||||
| 2 | SEI Institutional Investments Trust / Semi-Annual Report / November 30, 2016 |
SCHEDULE OF INVESTMENTS (Unaudited)
U.S. Managed Volatility Fund (Continued)
November 30, 2016
| Description | Shares | Market Value ($ Thousands) | ||||||
Health Care — 14.3% | ||||||||
AbbVie | 62,974 | $ | 3,829 | |||||
Allscripts Healthcare Solutions* | 76,971 | 845 | ||||||
Amgen | 41,726 | 6,011 | ||||||
Anthem | 56,700 | 8,081 | ||||||
AxoGen* | 30,812 | 257 | ||||||
Baxter International | 158,848 | 7,048 | ||||||
Biogen* | 3,863 | 1,136 | ||||||
Bristol-Myers Squibb | 101,411 | 5,724 | ||||||
C.R. Bard | 10,567 | 2,225 | ||||||
Cardinal Health | 153,790 | 10,921 | ||||||
Chemed | 3,333 | 497 | ||||||
Danaher | 3,104 | 243 | ||||||
DaVita HealthCare Partners* | 33,537 | 2,125 | ||||||
Eli Lilly | 42,761 | 2,870 | ||||||
Enzo Biochem* | 10,392 | 71 | ||||||
Express Scripts Holding* | 109,898 | 8,339 | ||||||
Gilead Sciences | 44,715 | 3,296 | ||||||
Haemonetics* | 613 | 24 | ||||||
HCA Holdings* | 15,786 | 1,119 | ||||||
Healthways* | 2,290 | 53 | ||||||
Henry Schein* | 5,993 | 893 | ||||||
Heska* | 6,518 | 431 | ||||||
Hill-Rom Holdings | 27,837 | 1,485 | ||||||
Humana | 12,600 | 2,679 | ||||||
ICON* | 34,673 | 2,623 | ||||||
ICU Medical* | 3,236 | 486 | ||||||
Johnson & Johnson | 312,884 | 34,824 | ||||||
Laboratory Corp of America Holdings* | 31,764 | 3,998 | ||||||
LeMaitre Vascular | 12,303 | 279 | ||||||
Luminex* | 1,074 | 22 | ||||||
Mallinckrodt* | 3,385 | 178 | ||||||
McKesson | 37,865 | 5,445 | ||||||
Merck | 494,377 | 30,251 | ||||||
Meridian Bioscience | 23,234 | 402 | ||||||
Myriad Genetics* | 23,842 | 398 | ||||||
NeoGenomics* | 25,743 | 230 | ||||||
Owens & Minor | 91,690 | 3,109 | ||||||
Pfizer | 825,299 | 26,525 | ||||||
Quality Systems | 25,341 | 332 | ||||||
Quest Diagnostics | 112,832 | 9,868 | ||||||
Quintiles IMS Holdings* | 13,742 | 1,056 | ||||||
Teleflex | 35,570 | 5,262 | ||||||
United Therapeutics* | 27,283 | 3,427 | ||||||
UnitedHealth Group | 47,100 | 7,457 | ||||||
Utah Medical Products | 4,830 | 329 | ||||||
Varian Medical Systems* | 36,116 | 3,244 | ||||||
Vocera Communications* | 3,077 | 56 | ||||||
Waters* | 12,053 | 1,622 | ||||||
|
| |||||||
| 211,625 | ||||||||
|
| |||||||
| Description | Shares | Market Value ($ Thousands) | ||||||
Industrials — 8.8% | ||||||||
Alaska Air Group | 7,865 | $ | 647 | |||||
Babcock & Wilcox Enterprises* | 28,612 | 456 | ||||||
Blue Bird* | 4,608 | 75 | ||||||
Boeing | 36,100 | 5,435 | ||||||
BWX Technologies | 87,107 | 3,411 | ||||||
CBIZ* | 334,000 | 4,142 | ||||||
Copa Holdings, Cl A | 5,129 | 456 | ||||||
Deere | 102,600 | 10,281 | ||||||
EMCOR Group | 17,975 | 1,247 | ||||||
FedEx | 19,738 | 3,783 | ||||||
Global Brass & Copper Holdings | 10,502 | 301 | ||||||
Huntington Ingalls Industries | 20,480 | 3,661 | ||||||
Kaman | 77,292 | 3,766 | ||||||
Landstar System | 53,587 | 4,365 | ||||||
Lockheed Martin | 31,962 | 8,478 | ||||||
Macquarie Infrastructure | 7,277 | 596 | ||||||
Masonite International* | 7,725 | 501 | ||||||
MSC Industrial Direct, Cl A | 1,000 | 89 | ||||||
Northrop Grumman | 61,187 | 15,275 | ||||||
Owens Corning | 12,990 | 667 | ||||||
Quanta Services* | 105,195 | 3,547 | ||||||
Raytheon | 59,559 | 8,906 | ||||||
Republic Services | 189,955 | 10,541 | ||||||
Southwest Airlines | 13,449 | 627 | ||||||
Spirit AeroSystems Holdings, Cl A | 38,827 | 2,262 | ||||||
Spirit Airlines* | 6,094 | 339 | ||||||
United Continental Holdings* | 47,591 | 3,281 | ||||||
United Parcel Service, Cl B | 76,878 | 8,912 | ||||||
United Technologies | 92,000 | 9,910 | ||||||
Waste Management | 215,180 | 14,959 | ||||||
West | 2,700 | 64 | ||||||
|
| |||||||
| 130,980 | ||||||||
|
| |||||||
Information Technology — 12.8% | ||||||||
Accenture, Cl A | 34,939 | 4,173 | ||||||
Alphabet, Cl A* | 2,292 | 1,778 | ||||||
Amdocs | 353,913 | 20,870 | ||||||
Amkor Technology* | 24,388 | 288 | ||||||
Apple | 84,600 | 9,350 | ||||||
Applied Materials | 58,375 | 1,880 | ||||||
Aspen Technology* | 70,532 | 3,726 | ||||||
Atlassian, Cl A* | 27,887 | 757 | ||||||
AVX | 471,700 | 7,165 | ||||||
Booz Allen Hamilton Holding | 138,275 | 5,228 | ||||||
Broadridge Financial Solutions | 7,358 | 476 | ||||||
CA | 160,885 | 5,142 | ||||||
CDW | 35,338 | 1,811 | ||||||
Cisco Systems | 495,700 | 14,782 | ||||||
Citrix Systems* | 25,968 | 2,252 | ||||||
CommVault Systems* | 966 | 52 | ||||||
Convergys | 210,560 | 5,447 | ||||||
| 3 | SEI Institutional Investments Trust / Semi-Annual Report / November 30, 2016 |
SCHEDULE OF INVESTMENTS (Unaudited)
U.S. Managed Volatility Fund (Continued)
November 30, 2016
| Description | Shares | Market Value ($ Thousands) | ||||||
CSG Systems International | 111,424 | $ | 4,958 | |||||
CSRA | 55,777 | 1,785 | ||||||
DST Systems | 696 | 72 | ||||||
eBay* | 128,323 | 3,569 | ||||||
First Data, Cl A* | 11,057 | 161 | ||||||
Forrester Research | 14,929 | 611 | ||||||
Genpact* | 23,684 | 567 | ||||||
Harris | 37,300 | 3,863 | ||||||
HP | 59,312 | 913 | ||||||
IAC | 40,110 | 2,702 | ||||||
Ingram Micro, Cl A | 49,435 | 1,851 | ||||||
Intel | 301,252 | 10,453 | ||||||
International Business Machines | 85,681 | 13,899 | ||||||
Intuit | 30,561 | 3,474 | ||||||
Lumentum Holdings* | 9,411 | 377 | ||||||
Microsoft | 27,742 | 1,672 | ||||||
MINDBODY, Cl A* | 11,436 | 247 | ||||||
Motorola Solutions | 113,300 | 9,092 | ||||||
NCR* | 31,644 | 1,226 | ||||||
NetApp | 16,707 | 611 | ||||||
NIC | 8,470 | 213 | ||||||
Oracle | 160,763 | 6,461 | ||||||
Planet Payment* | 32,019 | 129 | ||||||
QUALCOMM | 129,600 | 8,830 | ||||||
RealPage* | 8,729 | 250 | ||||||
Reis | 1,058 | 23 | ||||||
Sapiens International | 11,982 | 178 | ||||||
Square, Cl A* | 112,890 | 1,461 | ||||||
Symantec | 216,438 | 5,279 | ||||||
Synopsys* | 53,901 | 3,260 | ||||||
Take-Two Interactive Software* | 47,843 | 2,355 | ||||||
Teradyne | 97,936 | 2,388 | ||||||
VeriSign* | 42,851 | 3,379 | ||||||
Western Union | 374,000 | 7,865 | ||||||
|
| |||||||
| 189,351 | ||||||||
|
| |||||||
Materials — 2.0% | ||||||||
Avery Dennison | 58,200 | 4,194 | ||||||
Bemis | 108,274 | 5,421 | ||||||
Cabot | 4,379 | 223 | ||||||
Compass Minerals International | 19,256 | 1,493 | ||||||
International Paper | 92,200 | 4,492 | ||||||
Kaiser Aluminum | 45,000 | 3,708 | ||||||
LyondellBasell Industries, Cl A | 9,338 | 844 | ||||||
Sonoco Products | 158,200 | 8,563 | ||||||
|
| |||||||
| 28,938 | ||||||||
|
| |||||||
Real Estate — 2.7% | ||||||||
Apple Hospitality‡ | 59,012 | 1,088 | ||||||
CBL & Associates Properties‡ | 108,908 | 1,292 | ||||||
City Office | 6,754 | 85 | ||||||
CorEnergy Infrastructure Trust‡ | 4,335 | 142 | ||||||
| Description | Shares | Market Value ($ Thousands) | ||||||
Easterly Government Properties‡ | 29,977 | $ | 582 | |||||
Hospitality Properties Trust‡ | 12,029 | 349 | ||||||
Mid-America Apartment Communities‡ | 45,700 | 4,187 | ||||||
Monmouth Real Estate Investment, Cl A‡ | 22,827 | 321 | ||||||
Monogram Residential Trust‡ | 13,042 | 137 | ||||||
National Health Investors‡ | 68,200 | 4,826 | ||||||
Piedmont Office Realty Trust, Cl A‡ | 283,661 | 5,571 | ||||||
PS Business Parks‡ | 3,573 | 399 | ||||||
Retail Properties of America, Cl A‡ | 313,500 | 4,784 | ||||||
Ryman Hospitality Properties‡ | 32,809 | 1,932 | ||||||
Select Income‡ | 197,068 | 4,816 | ||||||
Silver Bay Realty Trust‡ | 14,669 | 256 | ||||||
Sun Communities‡ | 3,033 | 219 | ||||||
Tanger Factory Outlet Centers‡ | 134,500 | 4,636 | ||||||
Taubman Centers‡ | 3,356 | 244 | ||||||
Welltower‡ | 71,800 | 4,508 | ||||||
|
| |||||||
| 40,374 | ||||||||
|
| |||||||
Telecommunication Services — 5.7% |
| |||||||
AT&T | 799,995 | 30,904 | ||||||
BCE | 125,300 | 5,395 | ||||||
Hawaiian Telcom Holdco* | 8,211 | 187 | ||||||
NTT DOCOMO ADR | 135,700 | 3,098 | ||||||
Rogers Communications, Cl B | 63,600 | 2,455 | ||||||
SK Telecom ADR | 207,600 | 4,401 | ||||||
TELUS Toronto Stock Exchange | 176,800 | 5,517 | ||||||
Verizon Communications | 660,536 | 32,961 | ||||||
|
| |||||||
| 84,918 | ||||||||
|
| |||||||
Utilities — 9.4% | ||||||||
AES | 131,510 | 1,506 | ||||||
ALLETE | 6,266 | 387 | ||||||
Ameren | 156,900 | 7,707 | ||||||
American Electric Power | 221,567 | 13,084 | ||||||
Avista | 30,394 | 1,230 | ||||||
California Water Service Group | 6,356 | 220 | ||||||
CenterPoint Energy | 18,025 | 430 | ||||||
CMS Energy | 76,518 | 3,078 | ||||||
Consolidated Edison | 113,700 | 7,933 | ||||||
DTE Energy | 37,600 | 3,500 | ||||||
Edison International | 166,298 | 11,436 | ||||||
El Paso Electric | 7,664 | 345 | ||||||
Entergy | 187,506 | 12,887 | ||||||
Exelon | 391,190 | 12,718 | ||||||
FirstEnergy | 286,777 | 8,973 | ||||||
Hawaiian Electric Industries | 13,991 | 431 | ||||||
IDACORP | 11,296 | 860 | ||||||
MGE Energy | 4,857 | 288 | ||||||
Northwest Natural Gas | 10,385 | 595 | ||||||
NorthWestern | 10,700 | 600 | ||||||
PG&E | 54,571 | 3,209 | ||||||
Pinnacle West Capital | 122,118 | 9,028 | ||||||
| 4 | SEI Institutional Investments Trust / Semi-Annual Report / November 30, 2016 |
SCHEDULE OF INVESTMENTS (Unaudited)
U.S. Managed Volatility Fund (Concluded)
November 30, 2016
| Description | Shares | Market Value ($ Thousands) | ||||||
PNM Resources | 20,870 | $ | 659 | |||||
Portland General Electric | 134,005 | 5,575 | ||||||
Public Service Enterprise Group | 376,170 | 15,540 | ||||||
SCANA | 62,900 | 4,436 | ||||||
Southern | 123,206 | 5,768 | ||||||
Southwest Gas | 31,471 | 2,333 | ||||||
UGI | 10,192 | 457 | ||||||
Unitil | 14,975 | 636 | ||||||
Vectren | 12,971 | 637 | ||||||
Xcel Energy | 57,840 | 2,256 | ||||||
|
| |||||||
| 138,742 | ||||||||
|
| |||||||
Total Common Stock |
| 1,446,233 | ||||||
|
| |||||||
CASH EQUIVALENT — 1.3% |
| |||||||
SEI Daily Income Trust, Government Fund, Cl A | ||||||||
0.210%**† | 19,117,467 | 19,117 | ||||||
|
| |||||||
Total Cash Equivalent | 19,117 | |||||||
|
| |||||||
Total Investments — 98.8% | $ | 1,465,350 | ||||||
|
| |||||||
A list of the open futures contracts held by the Fund at November 30, 2016, is as follows:
| Type of Contract | Number of Contracts Long | Expiration Date | Unrealized Appreciation ($ Thousands) | |||||||||
S&P 500 Index E-MINI | 198 | Dec-2016 | $ | 466 | ||||||||
|
| |||||||||||
For the period ended November 30, 2016, the total amount of all open futures contracts, as presented in the table above, are representative of the volume of activity for the derivative type during the year.
Percentages are based on Net Assets of $1,483,505 ($ Thousands).
| * | Non-income producing security. |
| ** | Rate shown is the 7-day effective yield as of November 30, 2016. |
| † | Investment in Affiliated Security (see Note 6). |
| ‡ | Real Estate Investment Trust. |
ADR — American Depositary Receipt
Cl — Class
S&P — Standard & Poor’s
As of November 30, 2016, all of the Fund’s investments were considered level 1, in accordance with the authoritative guidance on fair value measurements and disclosure under U.S. GAAP.
The following is a list of the level of inputs used as of November 30, 2016, in valuing other financial instruments carried at value ($ Thousands):
| Other Financial Instruments | Level 1 | Level 2 | Level 3 | Total | ||||||||||||
Futures Contracts* | ||||||||||||||||
Unrealized Appreciation | $ | 466 | $ | — | $ | — | $ | 466 | ||||||||
|
|
|
|
|
|
|
| |||||||||
Total Other Financial Instruments | $ | 466 | $ | — | $ | — | $ | 466 | ||||||||
|
|
|
|
|
|
|
| |||||||||
| * | Futures contracts are valued at the unrealized appreciation on the instrument. |
For the period ended November 30, 2016, there were no transfers between Level 1 and Level 2 assets and liabilities.
For the period ended November 30, 2016, there were no transfers between Level 2 and Level 3 assets and liabilities.
For more information on valuation inputs, see Note 2 — Significant Accounting Policies in Notes to Financial Statements.
Amounts designated as “—” are $0 or have been rounded to $0.
The accompanying notes are an integral part of the financial statements.
| 5 | SEI Institutional Investments Trust / Semi-Annual Report / November 30, 2016 |
SCHEDULE OF INVESTMENTS (Unaudited)
Global Managed Volatility Fund
November 30, 2016
| Description | Shares | Market Value ($ Thousands) | ||||||
COMMON STOCK — 96.0% | ||||||||
Australia — 2.4% | ||||||||
AGL Energy | 281,269 | $ | 4,360 | |||||
Amcor | 114,309 | 1,215 | ||||||
Aristocrat Leisure | 8,567 | 95 | ||||||
ASX | 26,959 | 969 | ||||||
Aurizon Holdings | 295,187 | 1,086 | ||||||
AusNet Services | 767,026 | 842 | ||||||
Coca-Cola Amatil | 365,054 | 2,587 | ||||||
Cochlear | 7,917 | 694 | ||||||
Crown | 28,800 | 250 | ||||||
CSL | 16,930 | 1,226 | ||||||
Flight Centre Travel Group | 20,234 | 499 | ||||||
GPT Group†† | 1,769 | 6 | ||||||
Harvey Norman Holdings | 33,673 | 118 | ||||||
LendLease Group | 103,030 | 1,036 | ||||||
Orica | 50,040 | 628 | ||||||
Sonic Healthcare | 62,729 | 1,010 | ||||||
South32 | 388,041 | 777 | ||||||
Stockland†† | 291,190 | 932 | ||||||
Telstra | 576,817 | 2,152 | ||||||
Treasury Wine Estates | 15,751 | 126 | ||||||
Wesfarmers | 157,867 | 4,873 | ||||||
|
| |||||||
| 25,481 | ||||||||
|
| |||||||
Austria — 0.5% | ||||||||
Atrium European Real Estate | 50,072 | 206 | ||||||
BUWOG* | 26,740 | 622 | ||||||
Flughafen Wien | 5,554 | 131 | ||||||
Oesterreichische Post | 64,223 | 2,082 | ||||||
OMV | 10,211 | 330 | ||||||
Telekom Austria, Cl A* | 74,555 | 414 | ||||||
Voestalpine | 36,256 | 1,375 | ||||||
|
| |||||||
| 5,160 | ||||||||
|
| |||||||
Belgium — 0.4% | ||||||||
bpost | 109,000 | 2,451 | ||||||
Colruyt | 1,887 | 96 | ||||||
Elia System Operator | 4,533 | 224 | ||||||
Proximus | 44,323 | 1,254 | ||||||
|
| |||||||
| 4,025 | ||||||||
|
| |||||||
Canada — 7.5% | ||||||||
Agellan Commercial Real Estate Investment Trust†† | 12,200 | 95 | ||||||
Atco, Cl I | 49,161 | 1,565 | ||||||
Bank of Montreal | 102,193 | 6,729 | ||||||
Barrick Gold | 98,900 | 1,482 | ||||||
BCE | 189,836 | 8,177 | ||||||
Canadian Imperial Bank of Commerce | 13,919 | 1,097 | ||||||
Canadian Tire, Cl A | 71,772 | 7,469 | ||||||
Capital Power | 35,400 | 614 | ||||||
CCL Industries, Cl B | 8,581 | 1,492 | ||||||
Cineplex | 1,380 | 52 | ||||||
Constellation Software | 2,975 | 1,386 | ||||||
| Description | Shares | Market Value ($ Thousands) | ||||||
Dollarama | 36,031 | $ | 2,677 | |||||
Emera | 64,754 | 2,172 | ||||||
Empire, Cl A | 138,101 | 1,873 | ||||||
First Capital Realty | 68,160 | 1,032 | ||||||
George Weston | 29,790 | 2,475 | ||||||
H&R†† | 45,709 | 741 | ||||||
Inovalis Real Estate Investment Trust†† | 3,600 | 25 | ||||||
Intact Financial | 49,561 | 3,446 | ||||||
Jean Coutu Group, Cl A | 15,107 | 233 | ||||||
Killam Apartment†† | 102,223 | 915 | ||||||
Kinross Gold* | 145,400 | 480 | ||||||
Loblaw | 17,300 | 898 | ||||||
Manitoba Telecom Services | 23,984 | 665 | ||||||
Maple Leaf Foods | 13,000 | 283 | ||||||
Metro, Cl A | 58,365 | 1,776 | ||||||
Morguard†† | 5,427 | 57 | ||||||
National Bank of Canada | 87,710 | 3,282 | ||||||
New Flyer Industries | 45,500 | 1,432 | ||||||
Open Text | 18,637 | 1,186 | ||||||
Pure Industrial Real Estate Trust†† | 178,100 | 705 | ||||||
RioCan†† | 56,415 | 1,124 | ||||||
Rogers Communications, Cl B | 137,863 | 5,321 | ||||||
Rogers Sugar | 23,300 | 114 | ||||||
Royal Bank of Canada | 70,014 | 4,534 | ||||||
Saputo | 41,035 | 1,386 | ||||||
Shaw Communications, Cl B | 71,360 | 1,395 | ||||||
Smart Real Estate Investment Trust†† | 12,146 | 281 | ||||||
TELUS | 92,800 | 2,896 | ||||||
Toronto-Dominion Bank | 107,194 | 5,068 | ||||||
True North Commercial Real Estate Investment Trust†† | 23,600 | 110 | ||||||
Valener | 27,217 | 422 | ||||||
Yamana Gold | 66,300 | 198 | ||||||
|
| |||||||
| 79,360 | ||||||||
|
| |||||||
Denmark — 0.5% | ||||||||
Coloplast, Cl B | 6,145 | 391 | ||||||
Columbus | 42,938 | 65 | ||||||
Matas | 9,164 | 128 | ||||||
Novo Nordisk, Cl B | 103,315 | 3,506 | ||||||
TDC* | 46,974 | 239 | ||||||
William Demant Holding* | 30,910 | 524 | ||||||
|
| |||||||
| 4,853 | ||||||||
|
| |||||||
Finland — 0.0% | ||||||||
Orion, Cl B | 3,564 | 152 | ||||||
|
| |||||||
France — 1.7% | ||||||||
Atos | 68,900 | 7,128 | ||||||
Boiron | 744 | 64 | ||||||
Cie des Alpes | 4,246 | 80 | ||||||
Dassault Systemes | 4,229 | 323 | ||||||
Eutelsat Communications | 16,478 | 297 | ||||||
Iliad | 806 | 153 | ||||||
| 1 | SEI Institutional Investments Trust / Semi-Annual Report / November 30, 2016 |
SCHEDULE OF INVESTMENTS (Unaudited)
Global Managed Volatility Fund (Continued)
November 30, 2016
| Description | Shares | Market Value ($ Thousands) | ||||||
Rallye | 5,675 | $ | 99 | |||||
Sanofi-Aventis | 62,000 | 5,006 | ||||||
SES Global, Cl A | 18,198 | 394 | ||||||
TOTAL | 100,300 | 4,783 | ||||||
Vilmorin & Cie | 541 | 32 | ||||||
|
| |||||||
| 18,359 | ||||||||
|
| |||||||
Germany — 1.1% | ||||||||
Celesio | 92,259 | 2,481 | ||||||
Fielmann | 7 | — | ||||||
Homag Group | 1,506 | 68 | ||||||
Hornbach Holding & KGaA | 825 | 56 | ||||||
KWS Saat | 705 | 208 | ||||||
Merck KGaA | 8,169 | 819 | ||||||
Muenchener Rueckversicherungs | 17,500 | 3,190 | ||||||
Rhoen Klinikum | 36,938 | 977 | ||||||
Stada Arzneimittel | 17,752 | 868 | ||||||
Suedzucker | 28,658 | 643 | ||||||
Talanx | 60,400 | 1,920 | ||||||
Zalando*, (A) | 6,597 | 246 | ||||||
|
| |||||||
| 11,476 | ||||||||
|
| |||||||
Hong Kong — 2.8% | ||||||||
ASM Pacific Technology | 26,000 | 260 | ||||||
BOC Hong Kong Holdings | 89,000 | 334 | ||||||
Cathay Pacific Airways | 185,283 | 251 | ||||||
Cheung Kong Infrastructure Holdings | 162,710 | 1,359 | ||||||
CLP Holdings | 1,154,301 | 11,288 | ||||||
First Pacific | 325,619 | 229 | ||||||
Fountain SET Holdings | 386,000 | 50 | ||||||
Hang Seng Bank | 36,911 | 700 | ||||||
HK Electric Investments & HK Electric Investments (A) | 494,324 | 436 | ||||||
HKT Trust & HKT | 688,203 | 898 | ||||||
Hopewell Holdings | 23,000 | 84 | ||||||
Hysan Development | 62,684 | 276 | ||||||
Kerry Properties | 36,311 | 104 | ||||||
Link†† | 452,669 | 3,116 | ||||||
MTR | 151,369 | 757 | ||||||
NWS Holdings | 92,553 | 160 | ||||||
PCCW | 4,938,480 | 2,871 | ||||||
Power Assets Holdings | 25,587 | 244 | ||||||
Shangri-La Asia | 57,215 | 62 | ||||||
SmarTone Telecommunications Holdings | 815,500 | 1,123 | ||||||
Sunlight†† | 113,943 | 68 | ||||||
Swire Pacific, Cl A | 106,440 | 1,060 | ||||||
WH Group (A) | 1,706,086 | 1,419 | ||||||
Wheelock | 67,621 | 402 | ||||||
Yue Yuen Industrial Holdings | 609,744 | 2,197 | ||||||
|
| |||||||
| 29,748 | ||||||||
|
| |||||||
Ireland — 0.0% | ||||||||
Hibernia†† | 127,195 | 157 | ||||||
Irish Residential Properties†† | 50,199 | 62 | ||||||
| Description | Shares | Market Value ($ Thousands) | ||||||
Total Produce | 101,736 | $ | 188 | |||||
|
| |||||||
| 407 | ||||||||
|
| |||||||
Israel — 2.1% | ||||||||
Amot Investments | 215,013 | 946 | ||||||
Bank Hapoalim | 1,171,644 | 7,047 | ||||||
Bank Leumi Le-Israel* | 1,223,266 | 4,977 | ||||||
Israel Discount Bank, Cl A* | 308,718 | 630 | ||||||
Mizrahi Tefahot Bank | 280,700 | 3,932 | ||||||
Orbotech* | 54,364 | 1,722 | ||||||
Shufersal | 79,058 | 296 | ||||||
Teva Pharmaceutical Industries | 57,503 | 2,130 | ||||||
|
| |||||||
| 21,680 | ||||||||
|
| |||||||
Italy — 0.3% | ||||||||
Ascopiave | 80,433 | 217 | ||||||
CSP International Fashion Group | 233 | — | ||||||
DiaSorin | 2,596 | 140 | ||||||
Hera | 635,746 | 1,319 | ||||||
Parmalat | 20,771 | 55 | ||||||
Terna Rete Elettrica Nazionale | 309,398 | 1,343 | ||||||
|
| |||||||
| 3,074 | ||||||||
|
| |||||||
Japan — 9.0% | ||||||||
Alfresa Holdings | 3,700 | 59 | ||||||
Alpen | 2,900 | 56 | ||||||
Aozora Bank | 973,309 | 3,357 | ||||||
Asahi Glass | 10,000 | 65 | ||||||
Ashikaga Holdings | 570,100 | 2,081 | ||||||
Astellas Pharma | 352,000 | 4,879 | ||||||
Atsugi | 173,000 | 184 | ||||||
Azuma Shipping | 16,600 | 70 | ||||||
Can Do | 4,416 | 69 | ||||||
Canon | 51,000 | 1,460 | ||||||
Coca-Cola West | 23,178 | 659 | ||||||
COMSYS Holdings | 88,100 | 1,512 | ||||||
Daiichi Sankyo | 69,095 | 1,444 | ||||||
Daiki Aluminium Industry | 16,000 | 70 | ||||||
Daito Trust Construction | 3,600 | 562 | ||||||
Dydo Drinco | 13,596 | 674 | ||||||
Ehime Bank | 6,200 | 74 | ||||||
Eisai | 28,700 | 1,665 | ||||||
Feed One | 48,200 | 64 | ||||||
Fuji Oil Holdings | 107,100 | 2,028 | ||||||
Geo Holdings | 78,800 | 856 | ||||||
GungHo Online Entertainment* | 169,000 | 377 | ||||||
Hogy Medical | 55,800 | 3,291 | ||||||
Hoya | 24,210 | 956 | ||||||
Itochu | 79,000 | 1,083 | ||||||
Itochu-Shokuhin | 753 | 28 | ||||||
Japan Airlines* | 60,500 | 1,797 | ||||||
Japan Tobacco | 30,100 | 1,042 | ||||||
J-Oil Mills | 2,500 | 82 | ||||||
Kaneka | 7,000 | 56 | ||||||
| 2 | SEI Institutional Investments Trust / Semi-Annual Report / November 30, 2016 |
SCHEDULE OF INVESTMENTS (Unaudited)
Global Managed Volatility Fund (Continued)
November 30, 2016
| Description | Shares | Market Value ($ Thousands) | ||||||
Kato Sangyo | 7,900 | $ | 175 | |||||
KDDI | 130,835 | 3,444 | ||||||
Key Coffee | 1,500 | 27 | ||||||
KFC Holdings Japan | 9,173 | 153 | ||||||
Kisoji | 2,800 | 56 | ||||||
Kohnan Shoji | 128,954 | 2,448 | ||||||
Kourakuen Holdings | 4,200 | 58 | ||||||
Kuraray | 9,200 | 131 | ||||||
Kurimoto | 7,400 | 154 | ||||||
Kurita Water Industries | 2,400 | 50 | ||||||
Kyowa Exeo | 191,900 | 2,725 | ||||||
Kyowa Hakko Kirin | 3,200 | 46 | ||||||
Lawson | 18,369 | 1,277 | ||||||
Lion | 57,693 | 942 | ||||||
Mars Engineering | 4,700 | 85 | ||||||
Marubeni | 44,200 | 243 | ||||||
Marudai Food | 15,836 | 66 | ||||||
Maruichi Steel Tube | 3,400 | 110 | ||||||
Matsuya Foods | 5,330 | 163 | ||||||
Maxvalu Tokai | 383 | 6 | ||||||
McDonald’s Holdings Japan | 17,900 | 494 | ||||||
Medipal Holdings | 8,200 | 118 | ||||||
Ministop | 17,767 | 297 | ||||||
Mitsubishi | 6,700 | 145 | ||||||
Mitsubishi Gas Chemical | 25,600 | 390 | ||||||
Mitsubishi Tanabe Pharma | 284,300 | 5,367 | ||||||
Mitsui | 55,400 | 749 | ||||||
Mory Industries | 2,000 | 34 | ||||||
MOS Food Services | 9,046 | 270 | ||||||
Mr Max | 28,312 | 101 | ||||||
Nagatanien Holdings | 16,000 | 188 | ||||||
Nakayama Steel Works* | 8,800 | 55 | ||||||
Natori | 9,100 | 139 | ||||||
NEC | 75,000 | 196 | ||||||
Nihon Shokuhin Kako | 386 | 1 | ||||||
Nippon Beet Sugar Manufacturing | 3,000 | 59 | ||||||
Nippon Denko* | 18,900 | 38 | ||||||
Nippon Express | 57,890 | 300 | ||||||
Nippon Flour Mills | 117,142 | 1,589 | ||||||
Nippon Telegraph & Telephone | 235,200 | 9,547 | ||||||
Nisshin Oillio Group | 57,249 | 245 | ||||||
NTT DoCoMo | 247,250 | 5,694 | ||||||
Okinawa Electric Power | 2,300 | 47 | ||||||
Oracle Japan* | 18,574 | 929 | ||||||
Osaka Gas | 744,222 | 2,825 | ||||||
Otsuka | 2,500 | 122 | ||||||
OUG Holdings | 35,000 | 80 | ||||||
PIA | 1,100 | 26 | ||||||
Plenus | 97,800 | 1,916 | ||||||
Pola Orbis Holdings | 800 | 62 | ||||||
Renaissance | 7,300 | 92 | ||||||
Rhythm Watch | 16,000 | 26 | ||||||
| Description | Shares | Market Value ($ Thousands) | ||||||
Ricoh | 23,800 | $ | 192 | |||||
Rock Field | 5,920 | 75 | ||||||
Sagami Chain | 3,300 | 37 | ||||||
Sankyo | 40,577 | 1,287 | ||||||
Seed | 2,000 | 35 | ||||||
Sega Sammy Holdings | 25,000 | 375 | ||||||
Sekisui Chemical | 108,900 | 1,655 | ||||||
Senko | 233,000 | 1,652 | ||||||
Senshu Ikeda Holdings | 460,000 | 1,994 | ||||||
Shibusawa Warehouse | 10,000 | 30 | ||||||
Shimachu | 73,600 | 1,906 | ||||||
Shoei Foods | 6,700 | 102 | ||||||
SKY Perfect JSAT Holdings | 378,000 | 1,811 | ||||||
Start Today | 1,200 | 18 | ||||||
Starzen | 6,400 | 266 | ||||||
Studio Alice | 6,508 | 131 | ||||||
Sumitomo | 16,100 | 193 | ||||||
Sumitomo Bakelite | 294,000 | 1,592 | ||||||
Sumitomo Dainippon Pharma | 38,400 | 630 | ||||||
Sumitomo Osaka Cement | 547,000 | 1,939 | ||||||
Suzuken | 6,500 | 195 | ||||||
Takeda Pharmaceutical | 10,600 | 436 | ||||||
Toho | 4,300 | 94 | ||||||
Toho Gas | 27,466 | 218 | ||||||
Tokai | 1,777 | 57 | ||||||
Tokyo Gas | 83,000 | 363 | ||||||
Trend Micro* | 37,617 | 1,357 | ||||||
Vital KSK Holdings | 26,700 | 226 | ||||||
West Japan Railway | 5,900 | 360 | ||||||
WIN-Partners | 1,300 | 21 | ||||||
Wood One | 10,000 | 24 | ||||||
Yamada Denki | 56,500 | 303 | ||||||
Yamazaki Baking | 25,200 | 502 | ||||||
Yellow Hat | 7,000 | 144 | ||||||
Yokohama Reito | 15,100 | 138 | ||||||
|
| |||||||
| 95,458 | ||||||||
|
| |||||||
Luxembourg — 0.0% | ||||||||
RTL Group | 6,254 | 425 | ||||||
|
| |||||||
Netherlands — 0.3% | ||||||||
Accell Group | 1,000 | 21 | ||||||
Gemalto | 2,305 | 118 | ||||||
NN Group | 80,700 | 2,596 | ||||||
|
| |||||||
| 2,735 | ||||||||
|
| |||||||
New Zealand — 1.9% | ||||||||
Air New Zealand | 153,989 | 236 | ||||||
Argosy Property | 265,836 | 198 | ||||||
Auckland International Airport | 273,528 | 1,193 | ||||||
Contact Energy | 697,090 | 2,322 | ||||||
Fisher & Paykel Healthcare | 180,877 | 1,049 | ||||||
Fletcher Building | 690,413 | 5,031 | ||||||
Freightways | 78,838 | 374 | ||||||
| 3 | SEI Institutional Investments Trust / Semi-Annual Report / November 30, 2016 |
SCHEDULE OF INVESTMENTS (Unaudited)
Global Managed Volatility Fund (Continued)
November 30, 2016
| Description | Shares | Market Value ($ Thousands) | ||||||
Genesis Energy | 402,170 | $ | 579 | |||||
Goodman Property Trust†† | 151,219 | 131 | ||||||
Infratil | 19,844 | 39 | ||||||
Kiwi Property Group†† | 893,544 | 925 | ||||||
Mainfreight | 37,524 | 536 | ||||||
Mercury NZ | 158,888 | 339 | ||||||
Meridian Energy | 85,515 | 156 | ||||||
Metlifecare | 64,101 | 256 | ||||||
Port of Tauranga | 35,830 | 95 | ||||||
Property for Industry | 85,086 | 94 | ||||||
Restaurant Brands New Zealand | 53,081 | 193 | ||||||
Ryman Healthcare | 100,573 | 624 | ||||||
SKY Network Television | 143,438 | 487 | ||||||
SKYCITY Entertainment Group | 218,858 | 613 | ||||||
Spark New Zealand | 1,533,589 | 3,951 | ||||||
Steel & Tube Holdings | 41,738 | 70 | ||||||
Stride Property Group | 36,083 | 47 | ||||||
Summerset Group Holdings | 105,287 | 363 | ||||||
Tilt Renewables | 19,379 | 26 | ||||||
Trustpower | 19,379 | 60 | ||||||
Vector | 26,486 | 59 | ||||||
|
| |||||||
| 20,046 | ||||||||
|
| |||||||
Norway — 1.2% | ||||||||
AF Gruppen | 3,785 | 69 | ||||||
Atea* | 21,284 | 195 | ||||||
Austevoll Seafood | 35,732 | 336 | ||||||
DnB | 5,149 | 76 | ||||||
Leroy Seafood Group | 3,348 | 186 | ||||||
Marine Harvest | 93,648 | 1,684 | ||||||
Norsk Hydro | 630,237 | 2,972 | ||||||
Norway Royal Salmon | 5,533 | 129 | ||||||
Orkla | 380,682 | 3,394 | ||||||
SpareBank 1 Nord Norge | 46,740 | 283 | ||||||
SpareBank 1 SR-Bank | 30,205 | 199 | ||||||
Stolt-Nielsen | 14,894 | 177 | ||||||
Telenor | 184,960 | 2,733 | ||||||
|
| |||||||
| 12,433 | ||||||||
|
| |||||||
Portugal — 0.2% | ||||||||
REN - Redes Energeticas Nacionais | 684,205 | 1,872 | ||||||
Sonaecom SGPS | 10,320 | 29 | ||||||
|
| |||||||
| 1,901 | ||||||||
|
| |||||||
Singapore — 1.9% | ||||||||
Ascendas†† | 735,686 | 1,207 | ||||||
CapitaLand Commercial Trust†† | 901,527 | 963 | ||||||
CapitaLand Mall Trust†† | 2,015,075 | 2,743 | ||||||
ComfortDelGro | 360,291 | 634 | ||||||
DBS Group Holdings | 274,800 | 3,367 | ||||||
Hutchison Port Holdings Trust, Cl U | 500,403 | 210 | ||||||
Mapletree Industrial Trust†† | 1,594,100 | 1,825 | ||||||
OUE | 294,100 | 361 | ||||||
Singapore Airlines | 262,351 | 1,832 | ||||||
| Description | Shares | Market Value ($ Thousands) | ||||||
Singapore Press Holdings | 191,592 | $ | 502 | |||||
Singapore Technologies Engineering | 14,700 | 35 | ||||||
SPH†† | 329,900 | 221 | ||||||
StarHub | 336,136 | 676 | ||||||
Suntec†† | 86,222 | 102 | ||||||
United Overseas Bank | 101,400 | 1,445 | ||||||
UOL Group | 265,200 | 1,092 | ||||||
Venture | 298,500 | 2,023 | ||||||
Wilmar International | 320,152 | 787 | ||||||
|
| |||||||
| 20,025 | ||||||||
|
| |||||||
Spain — 0.4% | ||||||||
Ebro Foods | 84,222 | 1,708 | ||||||
Enagas | 1,828 | 45 | ||||||
Iberdrola | 212,334 | 1,279 | ||||||
Red Electrica | 82,357 | 1,468 | ||||||
|
| |||||||
| 4,500 | ||||||||
|
| |||||||
Sweden — 0.6% | ||||||||
Axfood | 40,806 | 594 | ||||||
Bonava, Cl B* | 13,309 | 174 | ||||||
ICA Gruppen | 13,431 | 398 | ||||||
Swedish Match | 105,713 | 3,295 | ||||||
Tele2, Cl B | 46,644 | 356 | ||||||
Telefonaktiebolaget LM Ericsson, Cl B | 287,300 | 1,478 | ||||||
|
| |||||||
| 6,295 | ||||||||
|
| |||||||
Switzerland — 3.1% | ||||||||
ABB | 13,784 | 280 | ||||||
Actelion | 24,235 | 4,663 | ||||||
Allreal Holding | 7,328 | 1,065 | ||||||
APG SGA | 152 | 63 | ||||||
Barry Callebaut | 239 | 283 | ||||||
Bell | 90 | 37 | ||||||
BKW | 2,587 | 117 | ||||||
Cembra Money Bank | 31,500 | 2,324 | ||||||
Chocoladefabriken Lindt & Spruengli | 5 | 290 | ||||||
Coca-Cola HBC | 20,834 | 443 | ||||||
EMS-Chemie Holding | 439 | 225 | ||||||
Galenica | 48 | 51 | ||||||
HOCHDORF Holding | 424 | 131 | ||||||
Intershop Holding | 594 | 290 | ||||||
Kuehne + Nagel International | 1,482 | 193 | ||||||
Mobilezone Holding | 76 | 1 | ||||||
Mobimo Holding | 1,009 | 242 | ||||||
Nestle | 102,031 | 6,851 | ||||||
Novartis | 20,166 | 1,391 | ||||||
Orior | 3,152 | 239 | ||||||
Pargesa Holding | 2,613 | 166 | ||||||
Roche Holding | 2,893 | 644 | ||||||
Romande Energie Holding | 20 | 24 | ||||||
Schindler Holding | 4,023 | 713 | ||||||
SGS | 376 | 754 | ||||||
Sika | 53 | 257 | ||||||
| 4 | SEI Institutional Investments Trust / Semi-Annual Report / November 30, 2016 |
SCHEDULE OF INVESTMENTS (Unaudited)
Global Managed Volatility Fund (Continued)
November 30, 2016
| Description | Shares | Market Value ($ Thousands) | ||||||
Sonova Holding | 6,773 | $ | 817 | |||||
St. Galler Kantonalbank | 414 | 158 | ||||||
Swiss Life Holding | 9,900 | 2,717 | ||||||
Swiss Prime Site | 17,910 | 1,463 | ||||||
Swiss Re | 39,200 | 3,602 | ||||||
Swisscom | 2,762 | 1,178 | ||||||
Valora Holding | 1,880 | 530 | ||||||
Ypsomed Holding | 4,478 | 834 | ||||||
|
| |||||||
| 33,036 | ||||||||
|
| |||||||
United Kingdom — 4.1% | ||||||||
AstraZeneca | 20,500 | 1,063 | ||||||
BAE Systems | 579,700 | 4,349 | ||||||
BCA Marketplace | 206,684 | 480 | ||||||
Berendsen PLC | 9,417 | 104 | ||||||
British American Tobacco | 44,203 | 2,426 | ||||||
Character Group | 7,583 | 41 | ||||||
Compass Group | 1 | — | ||||||
Cranswick | 9,792 | 274 | ||||||
Dechra Pharmaceuticals | 11,762 | 187 | ||||||
Diageo | 53,267 | 1,334 | ||||||
Direct Line Insurance Group | 386,600 | 1,677 | ||||||
easyJet | 95,600 | 1,183 | ||||||
EMIS Group | 15,419 | 179 | ||||||
GCP Student Living†† | 14,000 | 26 | ||||||
GlaxoSmithKline | 288,672 | 5,394 | ||||||
Hill & Smith Holdings | 21,912 | 336 | ||||||
Imperial Brands | 159,831 | 6,856 | ||||||
J D Wetherspoon | 131,200 | 1,344 | ||||||
J Sainsbury | 99,275 | 287 | ||||||
JD Sports Fashion | 4,180 | 17 | ||||||
John Menzies | 25,549 | 168 | ||||||
KCOM Group | 113,713 | 146 | ||||||
Lookers | 451,200 | 593 | ||||||
Melrose Industries | 49,717 | 114 | ||||||
Merlin Entertainments (A) | 1 | — | ||||||
National Grid | 354,193 | 4,041 | ||||||
QinetiQ | 146,951 | 446 | ||||||
Reckitt Benckiser Group | 28,585 | 2,415 | ||||||
Royal Mail | 508,900 | 2,980 | ||||||
Sage Group | 140,741 | 1,156 | ||||||
SSE | 156,587 | 2,886 | ||||||
Tate & Lyle | 4,453 | 38 | ||||||
Tritax Big Box†† | 322,869 | 531 | ||||||
|
| |||||||
| 43,071 | ||||||||
|
| |||||||
United States — 54.0% | ||||||||
Consumer Discretionary – 4.3% | ||||||||
Bob Evans Farms | 36,400 | 1,625 | ||||||
Brinker International | 37,600 | 1,997 | ||||||
Children’s Place Retail Stores | 25,600 | 2,659 | ||||||
Comcast, Cl A | 54,915 | 3,817 | ||||||
Cooper-Standard Holdings* | 26,300 | 2,507 | ||||||
| Description | Shares | Market Value ($ Thousands) | ||||||
Darden Restaurants | 25,052 | $ | 1,836 | |||||
Dick’s Sporting Goods | 6,628 | 392 | ||||||
Dollar General | 24,111 | 1,864 | ||||||
Foot Locker | 33,600 | 2,408 | ||||||
GameStop, Cl A | 60,535 | 1,495 | ||||||
Gap | 25,905 | 647 | ||||||
Golden Entertainment* | 6,193 | 77 | ||||||
Kohl’s | 47,300 | 2,546 | ||||||
Liberty Media Group, Cl A* | 5,541 | 173 | ||||||
McDonald’s | 54,069 | 6,449 | ||||||
RCI Hospitality Holdings | 4,989 | 61 | ||||||
Target | 137,233 | 10,600 | ||||||
Viacom, Cl B | 37,600 | 1,409 | ||||||
Walt Disney | 29,917 | 2,965 | ||||||
|
| |||||||
| 45,527 | ||||||||
|
| |||||||
Consumer Staples — 11.2% | ||||||||
AdvancePierre Foods Holdings | 4,854 | 131 | ||||||
Alliance One International* | 11,741 | 174 | ||||||
Altria Group | 131,961 | 8,436 | ||||||
Bunge | 62,441 | 4,263 | ||||||
Church & Dwight | 68,582 | 3,003 | ||||||
Clorox | 56,702 | 6,552 | ||||||
Coca-Cola | 74,979 | 3,025 | ||||||
Colgate-Palmolive | 37,954 | 2,476 | ||||||
Costco Wholesale | 32,300 | 4,849 | ||||||
CVS Health | 21,700 | 1,669 | ||||||
Dr. Pepper Snapple Group | 15,333 | 1,330 | ||||||
Estee Lauder, Cl A | 27,146 | 2,109 | ||||||
Fresh Del Monte Produce | 76,284 | 4,730 | ||||||
General Mills | 89,935 | 5,481 | ||||||
Hershey | 10,275 | 993 | ||||||
Hormel Foods | 5,548 | 190 | ||||||
Ingredion | 30,865 | 3,623 | ||||||
J&J Snack Foods | 1,930 | 234 | ||||||
JM Smucker | 5,898 | 743 | ||||||
Kellogg | 35,589 | 2,562 | ||||||
Kimberly-Clark | 53,717 | �� | 6,210 | |||||
Kroger | 80,000 | 2,584 | ||||||
Lancaster Colony | 4,532 | 614 | ||||||
Landec* | 7,117 | 102 | ||||||
McCormick | 7,008 | 639 | ||||||
Medifast | 3,405 | 133 | ||||||
Nutraceutical International | 8,450 | 273 | ||||||
Oil-Dri Corp of America | 662 | 26 | ||||||
PepsiCo | 44,067 | 4,411 | ||||||
Philip Morris International | 27,030 | 2,386 | ||||||
Procter & Gamble | 67,576 | 5,572 | ||||||
Spectrum Brands Holdings | 21,496 | 2,577 | ||||||
Sysco | 157,184 | 8,370 | ||||||
Tyson Foods, Cl A | 75,875 | 4,310 | ||||||
Universal | 59,317 | 3,265 | ||||||
Vector Group | 45,245 | 966 | ||||||
| 5 | SEI Institutional Investments Trust / Semi-Annual Report / November 30, 2016 |
SCHEDULE OF INVESTMENTS (Unaudited)
Global Managed Volatility Fund (Continued)
November 30, 2016
| Description | Shares | Market Value ($ Thousands) | ||||||
Wal-Mart Stores | 264,009 | $ | 18,594 | |||||
Weis Markets | 36,800 | 2,050 | ||||||
|
| |||||||
| 119,655 | ||||||||
|
| |||||||
Energy — 0.4% | ||||||||
Exxon Mobil | 47,100 | 4,112 | ||||||
|
| |||||||
Financials — 7.7% | ||||||||
AGNC Investment†† | 147,879 | 2,759 | ||||||
Allstate | 52,300 | 3,657 | ||||||
American Financial Group | 31,700 | 2,607 | ||||||
Annaly Capital Management†† | 524,157 | 5,357 | ||||||
Apollo Commercial Real Estate Finance†† | 122,800 | 2,107 | ||||||
Ares Commercial Real Estate†† | 54,489 | 737 | ||||||
Assurant | 26,000 | 2,245 | ||||||
Baldwin & Lyons, Cl B | 4,478 | 119 | ||||||
BankFinancial | 4,723 | 67 | ||||||
BB&T | 60,200 | 2,724 | ||||||
Beneficial Bancorp | 44,157 | 768 | ||||||
Berkshire Hathaway, Cl B* | 65,000 | 10,234 | ||||||
Blackstone Mortgage Trust, Cl A†† | 108,500 | 3,264 | ||||||
Capitol Federal Financial | 143,538 | 2,284 | ||||||
Charter Financial | 26,998 | 386 | ||||||
Chimera Investment†† | 67,426 | 1,144 | ||||||
Clifton Bancorp | 33,189 | 542 | ||||||
CME Group, Cl A | 1,744 | 197 | ||||||
Endurance Specialty Holdings | 48,000 | 4,426 | ||||||
Everest Re Group | 34,100 | 7,180 | ||||||
Farmers Capital Bank | 1,063 | 38 | ||||||
First Bancorp | 4,595 | 115 | ||||||
First Financial | 5,350 | 245 | ||||||
First Financial Northwest | 4,013 | 68 | ||||||
HomeTrust Bancshares* | 3,264 | 77 | ||||||
Kearny Financial | 48,298 | 732 | ||||||
Meridian Bancorp | 5,261 | 93 | ||||||
Northfield Bancorp | 24,655 | 457 | ||||||
Northwest Bancshares | 195,293 | 3,548 | ||||||
Peapack Gladstone Financial | 4,306 | 115 | ||||||
People’s Utah Bancorp | 3,412 | 79 | ||||||
PNC Financial Services Group | 24,500 | 2,708 | ||||||
Provident Financial Holdings | 9,202 | 181 | ||||||
Reinsurance Group of America, Cl A | 35,400 | 4,321 | ||||||
Starwood Property Trust†† | 113,100 | 2,541 | ||||||
Territorial Bancorp | 1,397 | 44 | ||||||
Travelers | 77,500 | 8,785 | ||||||
TrustCo Bank | 10,137 | 83 | ||||||
Voya Financial | 77,231 | 3,002 | ||||||
Waterstone Financial | 56,174 | 1,006 | ||||||
|
| |||||||
| 81,042 | ||||||||
|
| |||||||
Health Care — 11.6% | ||||||||
AbbVie | 73,471 | 4,467 | ||||||
AmerisourceBergen | 26,586 | 2,073 | ||||||
Amgen | 22,192 | 3,197 | ||||||
| Description | Shares | Market Value ($ Thousands) | ||||||
Anthem | 17,900 | $ | 2,551 | |||||
Baxter International | 12,901 | 572 | ||||||
Bio-Rad Laboratories, Cl A* | 7,033 | 1,220 | ||||||
Bristol-Myers Squibb | 36,759 | 2,075 | ||||||
C.R. Bard | 12,439 | 2,619 | ||||||
Cardinal Health | 71,337 | 5,066 | ||||||
Chemed | 16,338 | 2,434 | ||||||
Cigna | 17,400 | 2,344 | ||||||
DaVita HealthCare Partners* | 43,807 | 2,775 | ||||||
Exactech* | 3,031 | 76 | ||||||
Express Scripts Holding* | 38,732 | 2,939 | ||||||
Gilead Sciences | 43,745 | 3,224 | ||||||
HCA Holdings* | 38,300 | 2,715 | ||||||
Henry Schein* | 15,388 | 2,292 | ||||||
Hill-Rom Holdings | 3,153 | 168 | ||||||
Intuitive Surgical* | 3,172 | 2,042 | ||||||
Johnson & Johnson | 171,087 | 19,042 | ||||||
LifePoint Hospitals* | 28,269 | 1,553 | ||||||
Masimo* | 7,875 | 487 | ||||||
Merck | 285,824 | 17,490 | ||||||
Mettler Toledo International* | 6,280 | 2,587 | ||||||
National Healthcare | 14,752 | 1,012 | ||||||
Owens & Minor | 135,169 | 4,584 | ||||||
Pfizer | 406,211 | 13,056 | ||||||
Quest Diagnostics | 96,868 | 8,472 | ||||||
Stryker | 3,697 | 420 | ||||||
Teleflex | 19,160 | 2,834 | ||||||
United Therapeutics* | 15,933 | 2,001 | ||||||
Varian Medical Systems* | 18,721 | 1,682 | ||||||
|
| |||||||
| 120,069 | ||||||||
|
| |||||||
Industrials — 3.9% | ||||||||
Boeing | 20,900 | 3,147 | ||||||
CBIZ* | 166,900 | 2,070 | ||||||
Deere | 46,200 | 4,629 | ||||||
Expeditors International of Washington | 39,752 | 2,097 | ||||||
General Electric | 42,141 | 1,296 | ||||||
Kaman | 52,700 | 2,568 | ||||||
Lockheed Martin | 1,276 | 338 | ||||||
NACCO Industries, Cl A | 1,083 | 103 | ||||||
Republic Services, Cl A | 162,390 | 9,011 | ||||||
United Parcel Service, Cl B | 25,509 | 2,957 | ||||||
United Technologies | 38,600 | 4,158 | ||||||
Waste Management | 130,690 | 9,086 | ||||||
Willis Lease Finance* | 2,235 | 60 | ||||||
|
| |||||||
| 41,520 | ||||||||
|
| |||||||
Information Technology — 4.8% | ||||||||
Amdocs | 171,085 | 10,089 | ||||||
Apple | 21,800 | 2,409 | ||||||
Benchmark Electronics* | 60,800 | 1,724 | ||||||
CACI International, Cl A* | 3,107 | 402 | ||||||
Cisco Systems | 191,600 | 5,714 | ||||||
| 6 | SEI Institutional Investments Trust / Semi-Annual Report / November 30, 2016 |
SCHEDULE OF INVESTMENTS (Unaudited)
Global Managed Volatility Fund (Continued)
November 30, 2016
| Description | Shares | Market Value ($ Thousands) | ||||||
CSG Systems International | 32,448 | $ | 1,444 | |||||
Dell Technologies, Cl V* | 7,668 | 411 | ||||||
Intel | 150,500 | 5,222 | ||||||
International Business Machines | 36,200 | 5,872 | ||||||
ManTech International, Cl A | 11,268 | 485 | ||||||
MasterCard, Cl A | 18,520 | 1,893 | ||||||
Motorola Solutions | 54,900 | 4,406 | ||||||
NETGEAR* | 4,217 | 226 | ||||||
Qualcomm | 60,400 | 4,115 | ||||||
Sykes Enterprises* | 61,981 | 1,747 | ||||||
Symantec | 98,985 | 2,414 | ||||||
Synopsys* | 23,823 | 1,441 | ||||||
VMware, Cl A* | 14,485 | 1,175 | ||||||
|
| |||||||
| 51,189 | ||||||||
|
| |||||||
Materials — 1.4% | ||||||||
Bemis | 44,700 | 2,238 | ||||||
Kaiser Aluminum | 59,374 | 4,892 | ||||||
Newmont Mining | 58,165 | 1,887 | ||||||
Reliance Steel & Aluminum | 37,928 | 3,076 | ||||||
Sonoco Products | 37,900 | 2,052 | ||||||
|
| |||||||
| 14,145 | ||||||||
|
| |||||||
Real Estate — 1.0% | ||||||||
National Health Investors†† | 50,100 | 3,545 | ||||||
Select Income†† | 66,800 | 1,633 | ||||||
Senior Housing Properties Trust†† | 268,100 | 4,842 | ||||||
|
| |||||||
| 10,020 | ||||||||
|
| |||||||
Telecommunication Services — 2.6% |
| |||||||
AT&T | 319,799 | 12,354 | ||||||
CenturyLink | 117,100 | 2,754 | ||||||
Hawaiian Telcom Holdco* | 2,876 | 66 | ||||||
NII Holdings* | 176,266 | 300 | ||||||
Telephone & Data Systems | 9,026 | 243 | ||||||
US Cellular* | 1,518 | 57 | ||||||
Verizon Communications | 230,900 | 11,522 | ||||||
|
| |||||||
| 27,296 | ||||||||
|
| |||||||
Utilities — 5.1% | ||||||||
Ameren | 46,200 | 2,269 | ||||||
American Electric Power | 85,300 | 5,037 | ||||||
Consolidated Edison | 100,471 | 7,010 | ||||||
Duke Energy | 10,854 | 801 | ||||||
Edison International | 95,600 | 6,574 | ||||||
Entergy | 82,900 | 5,698 | ||||||
Exelon | 33,537 | 1,090 | ||||||
FirstEnergy | 199,500 | 6,242 | ||||||
Otter Tail | 2,164 | 83 | ||||||
Pinnacle West Capital | 43,900 | 3,246 | ||||||
PPL | 12,535 | 419 | ||||||
Public Service Enterprise Group | 152,900 | 6,316 | ||||||
Southern | 80,041 | 3,748 | ||||||
Unitil | 79,198 | 3,364 | ||||||
| Description | Shares | Market Value ($ Thousands) | ||||||
Xcel Energy | 59,279 | $ | 2,312 | |||||
|
| |||||||
| 54,209 | ||||||||
|
| |||||||
| 568,784 | ||||||||
|
| |||||||
Total Common Stock | 1,012,484 | |||||||
|
| |||||||
PREFERRED STOCK — 0.1% | ||||||||
Germany — 0.1% | ||||||||
Henkel | 7,401 | 858 | ||||||
|
| |||||||
Sweden — 0.0% | ||||||||
Akelius Residential Property | 9,764 | 324 | ||||||
|
| |||||||
Total Preferred Stock | 1,182 | |||||||
|
| |||||||
| Number of Rights | ||||||||
RIGHTS — 0.0% | ||||||||
Canada — 0.0% | ||||||||
Yamana Gold, Expires 12/15/2016* | 4 | 1 | ||||||
|
| |||||||
Total Rights | 1 | |||||||
|
| |||||||
| Shares | ||||||||
CASH EQUIVALENT — 3.9% | ||||||||
SEI Daily Income Trust, Government Fund, |
| |||||||
Cl A | ||||||||
0.210%**† | 40,662 | 40,662 | ||||||
|
| |||||||
Total Cash Equivalent | 40,662 | |||||||
|
| |||||||
Total Investments — 100.0% | $ | 1,054,329 | ||||||
|
| |||||||
| 7 | SEI Institutional Investments Trust / Semi-Annual Report / November 30, 2016 |
SCHEDULE OF INVESTMENTS (Unaudited)
Global Managed Volatility Fund (Continued)
November 30, 2016
A list of the open futures contracts held by the Fund at November 30, 2016, is as follows:
| Type of Contract | Number of Contracts Long | Expiration Date | Unrealized Appreciation (Depreciation) ($ Thousands) | |||||||||
DJ Euro Stoxx 50 Index | 76 | Dec-2016 | $ | 8 | ||||||||
FTSE 100 Index | 17 | Dec-2016 | (41 | ) | ||||||||
Hang Seng Index | 3 | Dec-2016 | 2 | |||||||||
S&P 500 Index E-MINI | 102 | Dec-2016 | 90 | |||||||||
SPI 200 Index | 10 | Dec-2016 | 2 | |||||||||
Topix Index | 18 | Dec-2016 | 127 | |||||||||
|
| |||||||||||
| $ | 188 | |||||||||||
|
| |||||||||||
For the period ended November 30, 2016, the total amount of all open futures contracts, as presented in the table above, are representative of the volume of activity for the derivative type during the period.
A list of the open forward foreign currency contracts held by the Fund at November 30, 2016, is as follows:
Settlement Date | Currency to Deliver (Thousands) | Currency To Receive (Thousands) | Unrealized Appreciation (Depreciation) ($ Thousands) | |||||||||||||||||
12/16/16 | USD | 30 | DKK | 213 | $ | — | ||||||||||||||
12/16/16 | USD | 7 | DKK | 52 | — | |||||||||||||||
12/16/16 | USD | 31 | SEK | 283 | — | |||||||||||||||
12/16/16 | USD | 24 | SEK | 225 | — | |||||||||||||||
12/16/16 | USD | 68 | HKD | 530 | — | |||||||||||||||
12/16/16 | USD | 81 | SGD | 116 | — | |||||||||||||||
12/16/16 | USD | 82 | NOK | 704 | 1 | |||||||||||||||
12/16/16 | USD | 160 | CHF | 162 | (1 | ) | ||||||||||||||
12/16/16 | USD | 57 | AUD | 78 | — | |||||||||||||||
12/16/16 | USD | 127 | AUD | 170 | (1 | ) | ||||||||||||||
12/16/16 | USD | 149 | NZD | 211 | 1 | |||||||||||||||
12/16/16 | USD | 80 | NZD | 112 | (1 | ) | ||||||||||||||
12/16/16 | USD | 320 | JPY | 35,784 | (5 | ) | ||||||||||||||
12/16/16 | USD | 497 | EUR | 469 | — | |||||||||||||||
12/16/16 | USD | 124 | EUR | 116 | — | |||||||||||||||
12/16/16 | USD | 466 | GBP | 373 | — | |||||||||||||||
12/16/16 | USD | 189 | GBP | 151 | — | |||||||||||||||
12/16/16 | USD | 690 | CAD | 926 | (1 | ) | ||||||||||||||
12/16/16 | SGD | 15,240 | USD | 10,702 | 61 | |||||||||||||||
12/16/16 | SGD | 122 | USD | 85 | — | |||||||||||||||
12/16/16 | NZD | 15,866 | USD | 11,213 | (25 | ) | ||||||||||||||
12/16/16 | CHF | 16,937 | USD | 16,790 | 138 | |||||||||||||||
12/16/16 | DKK | 17,313 | USD | 2,473 | 1 | |||||||||||||||
12/16/16 | DKK | 328 | USD | 47 | — | |||||||||||||||
12/16/16 | AUD | 33 | USD | 25 | — | |||||||||||||||
12/16/16 | AUD | 18,726 | USD | 13,792 | (37 | ) | ||||||||||||||
12/16/16 | GBP | 19,671 | USD | 24,543 | (46 | ) | ||||||||||||||
12/16/16 | SEK | 35,725 | USD | 3,873 | (2 | ) | ||||||||||||||
12/16/16 | EUR | 37,943 | USD | 40,328 | 41 | |||||||||||||||
12/16/16 | EUR | 723 | USD | 764 | (3 | ) | ||||||||||||||
12/16/16 | CAD | 53,679 | USD | 40,062 | 129 | |||||||||||||||
12/16/16 | CAD | 637 | USD | 472 | (2 | ) | ||||||||||||||
12/16/16 | NOK | 55,182 | USD | 6,459 | (25 | ) | ||||||||||||||
Settlement Date | Currency to Deliver (Thousands) | Currency To Receive (Thousands) | Unrealized Appreciation (Depreciation) ($ Thousands) | |||||||||||||||||
12/16/16 | HKD | 124,862 | USD | 16,100 | $ | — | ||||||||||||||
12/16/16 | HKD | 331 | USD | 43 | — | |||||||||||||||
12/16/16 | JPY | 6,226,598 | USD | 56,127 | 1,417 | |||||||||||||||
|
| |||||||||||||||||||
| $ | 1,640 | |||||||||||||||||||
|
| |||||||||||||||||||
A list of the counterparties for the outstanding forward foreign currency contracts held by the Fund at November 30, 2016, is as follows:
| Counterparty | Currency to ($ Thousands) | Currency to ($ Thousands) | Unrealized Appreciation ($ Thousands) | |||||||||
Brown Brothers Harriman | $ | (245,432 | ) | $ | 247,072 | $ | 1,640 | |||||
|
| |||||||||||
| $ | 1,640 | |||||||||||
|
| |||||||||||
For the period ended November 30, 2016, the total amount of all open forward foreign currency contracts, as presented in the table above, are representative of the volume of activity for the derivative type during the period.
Percentages are based on a Net Assets of $1,054,060 ($ Thousands).
| * | Non-income producing security. |
| ** | Rate shown is the 7-day effective yield as of November 30, 2016. |
| † | The Fund may purchase securities of certain companies with which it is affiliated to the extent these companies are represented in its benchmark index. |
| †† | Real Estate Investment Trust. |
| (A) | Security sold within terms of a private placement memorandum, exempt from registration under Section 144A of the Securities Act of 1933, as amended, and may be sold only to dealers in that program or other “accredited investors.” The total value of such securities as of November 30, 2016, was $2,101 ($ Thousands), and represented 0.2% of the net assets of the Fund. |
| AUD | — Australian Dollar |
CAD — Canadian Dollar
CHF — Swiss Franc
Cl — Class
DJ — Dow Jones
DKK — Danish Krone
EUR — Euro
FTSE — Financial Times and Stock Exchange
GBP — British Pound Sterling
HKD — Hong Kong Dollar
JPY — Japanese Yen
NOK — Norwegian Krone
NZD — New Zealand Dollar
PLC — Public Limited Company
S&P — Standard & Poor’s
SGD — Singapore Dollar
SEK — Swedish Krona
SPI — Share Price Index
USD — United States Dollar
The following is a list of the level of inputs used as of November 30, 2016, in valuing the Fund’s investments and other financial instruments carried at value ($ Thousands):
| Investments in Securities | Level 1 | Level 2 | Level 3 | Total | ||||||||||||
Common Stock | $ | 1,008,718 | $ | 3,766 | $ | — | $ | 1,012,484 | ||||||||
Preferred Stock | 1,182 | — | — | 1,182 | ||||||||||||
Right | 1 | — | — | 1 | ||||||||||||
Cash Equivalent | 40,662 | — | — | 40,662 | ||||||||||||
|
|
|
|
|
|
|
| |||||||||
Total Investments in Securities | $ | 1,050,563 | $ | 3,766 | $ | — | $ | 1,054,329 | ||||||||
|
|
|
|
|
|
|
| |||||||||
| 8 | SEI Institutional Investments Trust / Semi-Annual Report / November 30, 2016 |
SCHEDULE OF INVESTMENTS (Unaudited)
Global Managed Volatility Fund (Concluded)
November 30, 2016
| Other Financial Instruments | Level 1 | Level 2 | Level 3 | Total | ||||||||||||
Futures Contracts* | ||||||||||||||||
Unrealized Appreciation | $ | 229 | $ | — | $ | — | $ | 229 | ||||||||
Unrealized Depreciation | (41 | ) | — | — | (41 | ) | ||||||||||
Forwards Contracts* | ||||||||||||||||
Unrealized Appreciation | — | 1,789 | — | 1,789 | ||||||||||||
Unrealized Depreciation | — | (149 | ) | — | (149 | ) | ||||||||||
|
|
|
|
|
|
|
| |||||||||
Total Other Financial Instruments | $ | 188 | $ | 1,640 | $ | — | $ | 1,828 | ||||||||
|
|
|
|
|
|
|
| |||||||||
| * | Futures contracts and forwards contracts are valued at the unrealized appreciation (depreciation) on the instrument. |
For the period ended November 30, 2016, there were transfers between Level 1 and Level 2 assets and liabilities. The primary reason for changes in the classifications between Levels 1 and 2 occurs when foreign equity securities are fair valued using other observable market-based inputs in place of the closing exchange price due to events occurring after the close of the exchange or market on which the investment is principally traded.
For the period ended November 30, 2016, there were no transfers between Level 2 and Level 3 assets and liabilities.
For more information on valuation inputs, see Note 2 — Significant Accounting Policies in Notes to Financial Statements.
Amounts designated as “—” are $0 or have been rounded to $0.
The accompanying notes are an integral part of the financial statements.
| 9 | SEI Institutional Investments Trust / Semi-Annual Report / November 30, 2016 |
SCHEDULE OF INVESTMENTS (Unaudited)
World Equity Ex-US Fund
November 30, 2016
| Description | Shares | Market Value ($ Thousands) | ||||||
COMMON STOCK — 94.6% |
| |||||||
Argentina — 0.7% |
| |||||||
MercadoLibre | 157,000 | $ | 24,778 | |||||
Ternium ADR | 136,165 | 3,334 | ||||||
YPF ADR | 1,179,032 | 20,032 | ||||||
|
| |||||||
| 48,144 | ||||||||
|
| |||||||
Australia — 4.9% | ||||||||
a2 Milk* (A) | 14,832,639 | 26,083 | ||||||
Alumina | 19,038,111 | 23,280 | ||||||
Aristocrat Leisure | 615,035 | 6,816 | ||||||
Asaleo Care | 347,310 | 395 | ||||||
ASX | 590,295 | 21,223 | ||||||
Australia & New Zealand Banking Group ADR | 1,029,500 | 21,692 | ||||||
BGP Holdings* | 239,898 | — | ||||||
BHP Billiton | 1,127,066 | 20,327 | ||||||
BHP Billiton ADR (A) | 322,680 | 12,113 | ||||||
BlueScope Steel | 1,406,411 | 9,373 | ||||||
Boral* | 344,728 | 1,223 | ||||||
Brambles | 1,551,250 | 13,502 | ||||||
Caltex Australia | 336,826 | 7,478 | ||||||
Coca-Cola Amatil | 1,755,177 | 12,436 | ||||||
Cochlear | 184,329 | 16,166 | ||||||
CSR | 963,037 | 2,896 | ||||||
Downer | 506,364 | 2,121 | ||||||
Fortescue Metals Group | 2,191,709 | 9,506 | ||||||
Goodman Group | 961,070 | 4,743 | ||||||
Macquarie Group | 342,700 | 21,244 | ||||||
Mineral Resources | 334,041 | 3,102 | ||||||
Newcrest Mining | 1,231,868 | 17,785 | ||||||
Orora | 1,421,011 | 2,908 | ||||||
OZ Minerals | 4,092,914 | 23,799 | ||||||
Qantas Airways | 5,342,037 | 13,025 | ||||||
Regis Resources | 590,228 | 1,243 | ||||||
Resolute Mining | 702,351 | 641 | ||||||
SEEK | 418,621 | 4,581 | ||||||
Sonic Healthcare | 746,500 | 12,024 | ||||||
South32 (A) | 18,884,918 | 38,165 | ||||||
Whitehaven Coal* | 506,058 | 1,028 | ||||||
|
| |||||||
| 350,918 | ||||||||
|
| |||||||
Austria — 1.0% | ||||||||
Conwert Immobilien Invest* | 914,814 | 15,692 | ||||||
Erste Group Bank* | 617,316 | 17,183 | ||||||
Lenzing | 6,759 | 864 | ||||||
Schoeller-Bleckmann Oilfield Equipment (A) | 219,090 | 15,581 | ||||||
Voestalpine | 491,305 | 18,635 | ||||||
|
| |||||||
| 67,955 | ||||||||
|
| |||||||
Belgium — 0.4% | ||||||||
AGFA-Gevaert* | 120,446 | 552 | ||||||
Bekaert | 15,656 | 654 | ||||||
KBC Groep | 436,345 | 26,189 | ||||||
|
| |||||||
| 27,395 | ||||||||
|
| |||||||
| Description | Shares | Market Value ($ Thousands) | ||||||
Brazil — 2.3% | ||||||||
Banco Bradesco ADR* | 1,619,586 | $ | 14,009 | |||||
Banco do Brasil* | 592,225 | 4,990 | ||||||
BB Seguridade Participacoes ADR | 2,332,400 | 19,476 | ||||||
CETIP - Mercados Organizados | 1,701,813 | 22,319 | ||||||
Cia Energetica de Minas Gerais ADR (A) | 440,454 | 991 | ||||||
Cia Vale do Rio Doce* | 656,756 | 5,448 | ||||||
Cosan, Cl A | 522,789 | 3,759 | ||||||
Cosan Industria e Comercio (Brazil) | 122,500 | 1,430 | ||||||
EDP - Energias do Brasil | 408,200 | 1,711 | ||||||
Embraer ADR* | 585,200 | 11,464 | ||||||
Gerdau ADR (A) | 5,209,760 | 21,047 | ||||||
Hypermarcas | 2,554,908 | 19,616 | ||||||
JBS | 2,280,200 | 6,579 | ||||||
Kroton Educacional | 4,650,493 | 19,867 | ||||||
Light | 305,700 | 1,354 | ||||||
MRV Engenharia e Participacoes | 223,800 | 765 | ||||||
Ultrapar Participacoes | 285,600 | 5,834 | ||||||
|
| |||||||
| 160,659 | ||||||||
|
| |||||||
Canada — 5.5% | ||||||||
Aecon Group | 55,300 | 643 | ||||||
Agnico Eagle Mines | 404,613 | 16,611 | ||||||
ARC Resources | 1,173,891 | 20,534 | ||||||
Argonaut Gold* | 321,000 | 590 | ||||||
Bank of Montreal | 522,300 | 34,389 | ||||||
Canadian Imperial Bank of Commerce | 298,500 | 23,527 | ||||||
Canadian Pacific Railway | 75,100 | 11,509 | ||||||
Cascades | 63,768 | 554 | ||||||
Celestica* | 156,700 | 1,900 | ||||||
CGI Group, Cl A* | 237,400 | 11,234 | ||||||
Cogeco Communications | 9,000 | 432 | ||||||
Constellation Software | 43,490 | 20,262 | ||||||
Dollarama | 93,100 | 6,918 | ||||||
Fairfax Financial Holdings | 44,606 | 21,176 | ||||||
Franco-Nevada | 306,431 | 17,783 | ||||||
Genworth MI Canada | 132,735 | 3,225 | ||||||
George Weston | 32,600 | 2,709 | ||||||
Industrial Alliance Insurance & Financial Services | 71,700 | 3,037 | ||||||
Interfor* | 64,100 | 711 | ||||||
Linamar | 175,400 | 6,749 | ||||||
Lundin Mining* | 117,400 | 575 | ||||||
Magna International, Cl A (A) | 1,200,552 | 48,503 | ||||||
Manulife Financial | 699,900 | 12,206 | ||||||
Maple Leaf Foods | 216,573 | 4,713 | ||||||
Quebecor, Cl B | 378,210 | 10,241 | ||||||
Restaurant Brands International | 246,700 | 11,737 | ||||||
Ritchie Bros Auctioneers | 286,821 | 10,965 | ||||||
Rogers Communications, Cl B (A) | 399,287 | 15,412 | ||||||
Royal Bank of Canada | 369,300 | 23,917 | ||||||
Russel Metals | 98,700 | 1,897 | ||||||
Silvercorp Metals | 131,700 | 334 | ||||||
| 1 | SEI Institutional Investments Trust / Semi-Annual Report / November 30, 2016 |
SCHEDULE OF INVESTMENTS (Unaudited)
World Equity Ex-US Fund (Continued)
November 30, 2016
| Description | Shares | Market Value ($ Thousands) | ||||||
Teck Cominco, Cl B | 418,600 | $ | 10,588 | |||||
Toronto-Dominion Bank | 760,400 | 36,029 | ||||||
West Fraser Timber | 43,600 | 1,553 | ||||||
Westshore Terminals Investment | 12,800 | 264 | ||||||
Yamana Gold | 141,005 | 421 | ||||||
|
| |||||||
| 393,848 | ||||||||
|
| |||||||
Chile — 0.0% | ||||||||
Enersis Americas ADR | 230,029 | 1,838 | ||||||
Enersis Chile ADR | 230,029 | 1,083 | ||||||
|
| |||||||
| 2,921 | ||||||||
|
| |||||||
China — 1.8% | ||||||||
Alibaba Group Holding ADR* (A) | 319,061 | 29,998 | ||||||
Baidu ADR* | 102,657 | 17,139 | ||||||
BYD (A) | 1,913,000 | 11,517 | ||||||
China Coal Energy* | 1,919,000 | 967 | ||||||
China Life Insurance | 10,045,000 | 29,203 | ||||||
China Petroleum & Chemical | 994,000 | 695 | ||||||
China Shenhua Energy | 1,900,000 | 3,934 | ||||||
China Telecom | 10,156,000 | 4,910 | ||||||
Ctrip.com International ADR* | 292,720 | 13,240 | ||||||
NetEase ADR | 61,103 | 13,693 | ||||||
|
| |||||||
| 125,296 | ||||||||
|
| |||||||
Colombia — 0.3% | ||||||||
Bancolombia ADR, Cl R (A) | 685,811 | 22,975 | ||||||
|
| |||||||
Czech Republic — 0.1% | ||||||||
Komercni Banka | 299,394 | 9,907 | ||||||
|
| |||||||
Denmark — 1.5% | ||||||||
DSV | 362,272 | 16,317 | ||||||
Genmab* | 35,245 | 6,111 | ||||||
H Lundbeck* | 131,630 | 5,022 | ||||||
Nets* (B) | 759,742 | 12,999 | ||||||
Novo Nordisk, Cl B | 439,226 | 14,905 | ||||||
Novozymes, Cl B | 293,176 | 9,940 | ||||||
Pandora | 141,816 | 16,894 | ||||||
Vestas Wind Systems | 364,363 | 24,064 | ||||||
|
| |||||||
| 106,252 | ||||||||
|
| |||||||
Finland — 1.1% | ||||||||
Elisa, Cl A | 204,040 | 6,411 | ||||||
Kone, Cl B (A) | 336,038 | 14,815 | ||||||
Neste Oil | 467,312 | 19,209 | ||||||
Nokian Renkaat | 100,360 | 3,628 | ||||||
Orion, Cl B | 176,467 | 7,510 | ||||||
Outokumpu* | 55,645 | 430 | ||||||
Sampo, Cl A | 266,435 | 11,789 | ||||||
Sanoma | 45,013 | 365 | ||||||
Stora Enso, Cl R | 552,425 | 5,336 | ||||||
Tieto | 6,046 | 154 | ||||||
UPM-Kymmene | 489,116 | 11,207 | ||||||
| Description | Shares | Market Value ($ Thousands) | ||||||
Valmet | 35,316 | $ | 540 | |||||
|
| |||||||
| 81,394 | ||||||||
|
| |||||||
France — 5.3% |
| |||||||
Atos | 231,258 | 23,926 | ||||||
AXA | 985,810 | 23,247 | ||||||
BNP Paribas | 136,960 | 7,959 | ||||||
Bureau Veritas | 251,926 | 4,746 | ||||||
Capgemini | 257,300 | 20,334 | ||||||
Cie de Saint-Gobain | 238,409 | 10,350 | ||||||
Compagnie Generale des Etablissements Michelin, Cl B | 203,200 | 21,771 | ||||||
Criteo ADR* (A) | 455,501 | 18,799 | ||||||
Danone | 334,707 | 21,076 | ||||||
Edenred | 361,511 | 7,630 | ||||||
Essilor International | 105,429 | 11,195 | ||||||
Ipsen | 9,097 | 617 | ||||||
Kering | 24,640 | 5,358 | ||||||
Legrand | 273,161 | 15,285 | ||||||
L’Oreal | 121,946 | 20,834 | ||||||
Nexans* | 31,998 | 1,672 | ||||||
Nexity* | 37,186 | 1,720 | ||||||
Peugeot* | 905,830 | 13,376 | ||||||
Safran | 238,716 | 16,402 | ||||||
Sanofi-Aventis | 252,428 | 20,381 | ||||||
Societe Generale | 365,792 | 15,748 | ||||||
Sodexo | 174,736 | 19,129 | ||||||
Technicolor | 42,537 | 210 | ||||||
Technip | 120,170 | 8,332 | ||||||
Teleperformance | 91,408 | 8,934 | ||||||
Thales | 156,075 | 15,254 | ||||||
TOTAL | 726,184 | 34,631 | ||||||
Vinci | 127,180 | 8,261 | ||||||
|
| |||||||
| 377,177 | ||||||||
|
| |||||||
Germany — 5.5% |
| |||||||
adidas | 77,865 | 11,481 | ||||||
AURELIUS Equity Opportunities & KGaA | 13,555 | 782 | ||||||
BASF | 71,072 | 6,106 | ||||||
Bayer | 99,600 | 9,360 | ||||||
Brenntag | 205,613 | 10,833 | ||||||
CANCOM | 11,161 | 504 | ||||||
Continental | 138,317 | 24,562 | ||||||
Deutsche Boerse | 624,803 | 48,457 | ||||||
Deutsche Euroshop | 70,564 | 2,751 | ||||||
Deutsche Lufthansa | 1,353,798 | 17,557 | ||||||
Deutsche Wohnen | 689,858 | 21,266 | ||||||
Deutz | 84,126 | 460 | ||||||
Fresenius | 76,050 | 5,466 | ||||||
Gerresheimer | 106,943 | 7,811 | ||||||
Hannover Rueck | 54,052 | 5,742 | ||||||
Heidelberger Druckmaschinen* | 208,464 | 528 | ||||||
Henkel | 205,426 | 20,935 | ||||||
| 2 | SEI Institutional Investments Trust / Semi-Annual Report / November 30, 2016 |
SCHEDULE OF INVESTMENTS (Unaudited)
World Equity Ex-US Fund (Continued)
November 30, 2016
| Description | Shares | Market Value ($ Thousands) | ||||||
Hochtief | 106,320 | $ | 15,136 | |||||
Infineon Technologies | 1,214,716 | 20,334 | ||||||
K+S | 546,799 | 11,105 | ||||||
Kloeckner* | 64,494 | 682 | ||||||
KUKA | 23,380 | 2,187 | ||||||
Merck KGaA | 281,046 | 28,186 | ||||||
MTU Aero Engines | 81,925 | 8,618 | ||||||
OSRAM Licht | 34,094 | 1,737 | ||||||
Rhoen Klinikum | 42,665 | 1,128 | ||||||
SAP | 469,356 | 39,274 | ||||||
Siemens | 431,267 | 48,768 | ||||||
Software | 109,539 | 3,867 | ||||||
Stada Arzneimittel | 153,460 | 7,503 | ||||||
Suedzucker | 153,651 | 3,449 | ||||||
TUI | 353,815 | 4,654 | ||||||
|
| |||||||
| 391,229 | ||||||||
|
| |||||||
Hong Kong — 4.7% | ||||||||
AIA Group | 6,479,400 | 39,511 | ||||||
Anhui Conch Cement | 4,614,000 | 13,354 | ||||||
ASM Pacific Technology | 36,500 | 365 | ||||||
Bank of China | 60,934,000 | 27,731 | ||||||
Beijing Enterprises Holdings | 1,885,400 | 8,702 | ||||||
BOC Hong Kong Holdings | 6,513,500 | 24,436 | ||||||
Bright Smart Securities & Commodities Group | 4,554,000 | 1,967 | ||||||
Chaoda Modern Agriculture* | 52,790 | 1 | ||||||
China Construction Bank | 31,944,900 | 23,804 | ||||||
China High Speed Transmission Equipment Group | 778,000 | 1,041 | ||||||
China Mobile | 2,882,100 | 31,453 | ||||||
CK Hutchison Holdings | 1,531,000 | 18,652 | ||||||
ENN Energy Holdings | 2,363,000 | 10,876 | ||||||
Geely Automobile Holdings | 445,000 | 460 | ||||||
Guangzhou Automobile Group | 4,350,000 | 5,698 | ||||||
Haitong International Securities Group | 464,000 | 319 | ||||||
Hang Seng Bank | 770,900 | 14,610 | ||||||
Hong Kong Exchanges and Clearing | 1,641,671 | 43,176 | ||||||
Kingboard Chemical Holdings | 155,000 | 435 | ||||||
Kingboard Laminates Holdings | 1,157,000 | 1,025 | ||||||
Melco Crown Entertainment ADR | 261,447 | 5,140 | ||||||
Orient Overseas International | 2,962,000 | 11,819 | ||||||
Shanghai Fosun Pharmaceutical Group | 2,033,500 | 6,397 | ||||||
Tencent Holdings | 1,261,172 | 31,494 | ||||||
WH Group (B) | 13,175,500 | 10,956 | ||||||
Wharf Holdings | 82,000 | 608 | ||||||
Zhongsheng Group Holdings | 564,000 | 523 | ||||||
|
| |||||||
| 334,553 | ||||||||
|
| |||||||
Hungary — 0.2% | ||||||||
MOL Hungarian Oil & Gas | 78,660 | 4,916 | ||||||
OTP Bank | 296,540 | 7,992 | ||||||
|
| |||||||
| 12,908 | ||||||||
|
| |||||||
| Description | Shares | Market Value ($ Thousands) | ||||||
India — 1.2% | ||||||||
Axis Bank GDR | 386,315 | $ | 13,405 | |||||
Bharat Petroleum | 1,388,352 | 13,061 | ||||||
Gujarat Narmada Valley Fertilizers & Chemicals | 84,849 | 269 | ||||||
HDFC Bank ADR | 350,466 | 22,612 | ||||||
Hindustan Petroleum | 449,164 | 3,092 | ||||||
ICICI Bank ADR | 2,828,535 | 22,176 | ||||||
Indian Oil | 1,000,700 | 4,484 | ||||||
Oil & Natural Gas | 555,921 | 2,346 | ||||||
Petronet LNG | 67,129 | 381 | ||||||
Tata Motors | 447,757 | 3,005 | ||||||
|
| |||||||
| 84,831 | ||||||||
|
| |||||||
Indonesia — 0.8% | ||||||||
Bank Mandiri Persero | 15,497,900 | 12,007 | ||||||
Bank Rakyat Indonesia Persero | 18,430,200 | 14,823 | ||||||
Indofood Sukses Makmur | 19,643,500 | 10,980 | ||||||
Telekomunikasi Indonesia Persero | 30,317,000 | 8,456 | ||||||
Telekomunikasi Indonesia Persero ADR (A) | 214,730 | 6,034 | ||||||
Waskita Karya Persero | 22,890,800 | 4,307 | ||||||
|
| |||||||
| 56,607 | ||||||||
|
| |||||||
Ireland — 1.2% | ||||||||
Amarin ADR* | 322,813 | 1,046 | ||||||
CRH | 341,223 | 11,400 | ||||||
James Hardie Industries, CDI | 1,138,626 | 17,515 | ||||||
Ryanair Holdings ADR* | 354,564 | 28,309 | ||||||
Shire ADR | 61,900 | 10,808 | ||||||
Smurfit Kappa Group | 850,092 | 19,388 | ||||||
|
| |||||||
| 88,466 | ||||||||
|
| |||||||
Israel — 1.2% | ||||||||
Bank Hapoalim | 1,477,846 | 8,889 | ||||||
Bank Leumi Le-Israel* | 1,700,355 | 6,919 | ||||||
Check Point Software Technologies* | 242,396 | 19,956 | ||||||
Israel Discount Bank, Cl A* | 343,286 | 700 | ||||||
SodaStream International* (A) | 83,655 | 3,047 | ||||||
Teva Pharmaceutical Industries ADR | 1,165,470 | 43,938 | ||||||
Tower Semiconductor* | 29,392 | 528 | ||||||
|
| |||||||
| 83,977 | ||||||||
|
| |||||||
Italy — 1.2% | ||||||||
Banca Intesa | 6,205,731 | 13,798 | ||||||
Brembo | 80,460 | 4,618 | ||||||
Buzzi Unicem (A) | 174,315 | 3,708 | ||||||
Enel | 5,062,643 | 20,483 | ||||||
Exor | 257,432 | 10,817 | ||||||
Prysmian | 892,613 | 21,371 | ||||||
Recordati | 188,369 | 5,133 | ||||||
Saras (A) | 2,187,265 | 3,882 | ||||||
|
| |||||||
| 83,810 | ||||||||
|
| |||||||
Japan — 12.2% | ||||||||
Alfresa Holdings | 186,100 | 2,977 | ||||||
Asahi Glass | 244,000 | 1,591 | ||||||
| 3 | SEI Institutional Investments Trust / Semi-Annual Report / November 30, 2016 |
SCHEDULE OF INVESTMENTS (Unaudited)
World Equity Ex-US Fund (Continued)
November 30, 2016
| Description | Shares | Market Value ($ Thousands) | ||||||
Astellas Pharma | 702,000 | $ | 9,731 | |||||
Bandai Namco Holdings | 21,700 | 622 | ||||||
Bridgestone | 638,900 | 24,486 | ||||||
Calsonic Kansei | 612,000 | 9,421 | ||||||
Canon Marketing Japan | 28,800 | 455 | ||||||
Coca-Cola West | 272,100 | 7,737 | ||||||
Daiichi Sankyo | 434,515 | 9,083 | ||||||
Daikyo | 2,082,000 | 4,422 | ||||||
Daito Trust Construction | 162,900 | 25,412 | ||||||
Daiwa House Industry | 648,600 | 18,511 | ||||||
Daiwa Securities Group | 1,555,926 | 9,387 | ||||||
Denso | 1,155,400 | 50,497 | ||||||
FANUC | 68,900 | 11,673 | ||||||
Fujitsu | 2,354,000 | 13,941 | ||||||
Fujitsu General | 290,000 | 5,732 | ||||||
Furukawa Electric | 89,300 | 2,770 | ||||||
Goldcrest | 13,900 | 265 | ||||||
Haseko | 483,400 | 5,023 | ||||||
Hazama Ando | 610,800 | 4,304 | ||||||
Hitachi | 2,927,000 | 15,652 | ||||||
Isuzu Motors | 1,932,800 | 22,883 | ||||||
Itochu | 388,100 | 5,320 | ||||||
Japan Airlines* | 408,900 | 12,147 | ||||||
Japan Exchange Group | 1,751,700 | 26,042 | ||||||
Kao | 418,309 | 19,336 | ||||||
KDDI | 1,515,585 | 39,890 | ||||||
Koito Manufacturing | 149,900 | 7,841 | ||||||
Komatsu | 193,100 | 4,463 | ||||||
Konami | 166,800 | 5,665 | ||||||
Kura | 19,300 | 830 | ||||||
Maeda Road Construction | 137,000 | 2,366 | ||||||
Medipal Holdings | 584,900 | 8,403 | ||||||
Megmilk Snow Brand | 75,700 | 2,126 | ||||||
Misawa Homes | 38,200 | 338 | ||||||
Mitsubishi Electric | 877,000 | 12,134 | ||||||
Mitsubishi Gas Chemical | 247,000 | 3,759 | ||||||
Mitsubishi Shokuhin | 5,700 | 165 | ||||||
Mitsubishi UFJ Financial Group | 1,430,700 | 8,410 | ||||||
Mitsui Sumitomo Insurance Group Holdings | 694,600 | 21,634 | ||||||
Mitsui Trust Holdings | 492,200 | 17,926 | ||||||
Mixi | 130,100 | 4,550 | ||||||
Nidec | 162,200 | 14,577 | ||||||
Nippo | 101,000 | 1,940 | ||||||
Nippon Telegraph & Telephone | 471,400 | 19,134 | ||||||
Nissan Motor | 661,800 | 6,136 | ||||||
Nissan Tokyo Sales Holdings | 105,000 | 267 | ||||||
NTT Data | 51,700 | 2,582 | ||||||
NTT DoCoMo | 898,562 | 20,693 | ||||||
Olympus | 810,400 | 28,591 | ||||||
Omron | 775,600 | 28,725 | ||||||
Pioneer* | 892,000 | 1,847 | ||||||
Rakuten* | 1,525,700 | 15,104 | ||||||
| Description | Shares | Market Value ($ Thousands) | ||||||
Recruit Holdings | 849,062 | $ | 32,526 | |||||
Secom | 321,700 | 23,487 | ||||||
Shimano | 107,700 | 17,760 | ||||||
Shimizu | 794,000 | 7,345 | ||||||
SMC | 65,900 | 18,808 | ||||||
Square Enix Holdings | 414,300 | 10,482 | ||||||
Suzuken | 133,290 | 4,001 | ||||||
T&D Holdings | 1,813,700 | 22,746 | ||||||
Taisei | 713,000 | 5,181 | ||||||
Teijin | 52,000 | 967 | ||||||
THK | 1,092,600 | 23,598 | ||||||
TIS | 245,300 | 5,177 | ||||||
Toho Holdings | 134,200 | 2,610 | ||||||
Tokyo Electric Power Holdings* | 1,755,300 | 6,547 | ||||||
Toshiba* | 2,996,204 | 11,181 | ||||||
Tosoh | 165,000 | 1,112 | ||||||
Toyota Tsusho | 628,800 | 15,777 | ||||||
Trend Micro* | 762,000 | 27,485 | ||||||
Ube Industries | 2,233,000 | 4,664 | ||||||
West Japan Railway | 347,400 | 21,211 | ||||||
Yamazaki Baking | 130,600 | 2,601 | ||||||
Zenkoku Hosho | 109,000 | 3,707 | ||||||
Zensho Holdings | 42,200 | 724 | ||||||
|
| |||||||
| 869,213 | ||||||||
|
| |||||||
Malaysia — 0.5% |
| |||||||
Public Bank | 2,502,200 | 10,970 | ||||||
Tenaga Nasional | 7,359,400 | 23,136 | ||||||
|
| |||||||
| 34,106 | ||||||||
|
| |||||||
Mexico — 0.5% |
| |||||||
Cemex ADR* | 424,107 | 3,312 | ||||||
Grupo Financiero Banorte, Ser O | 3,037,200 | 14,638 | ||||||
Industrias Penoles | 888,764 | 19,188 | ||||||
Mexichem | 360,551 | 861 | ||||||
|
| |||||||
| 37,999 | ||||||||
|
| |||||||
Netherlands — 3.2% |
| |||||||
ASML Holding | 138,948 | 14,389 | ||||||
BE Semiconductor Industries | 12,598 | 418 | ||||||
Euronext (B) | 468,421 | 18,286 | ||||||
Heineken | 393,420 | 29,515 | ||||||
Heineken Holding | 327,752 | 23,048 | ||||||
ING Groep | 2,066,231 | 28,166 | ||||||
Koninklijke Ahold Delhaize | 1,664,512 | 32,860 | ||||||
Koninklijke DSM (A) | 320,219 | 19,437 | ||||||
Koninklijke Philips | 959,251 | 27,617 | ||||||
Koninklijke Vopak | 205,700 | 9,623 | ||||||
NN Group (A) | 149,160 | 4,799 | ||||||
PostNL* | 1,157,209 | 5,708 | ||||||
Randstad Holding | 17,610 | 895 | ||||||
Unilever (A) | 411,172 | 16,520 | ||||||
|
| |||||||
| 231,281 | ||||||||
|
| |||||||
| 4 | SEI Institutional Investments Trust / Semi-Annual Report / November 30, 2016 |
SCHEDULE OF INVESTMENTS (Unaudited)
World Equity Ex-US Fund (Continued)
November 30, 2016
| Description | Shares | Market Value ($ Thousands) | ||||||
Norway — 1.6% | ||||||||
Aker, Cl A | 3,479 | $ | 129 | |||||
DnB | 1,999,351 | 29,451 | ||||||
Grieg Seafood | 91,117 | 870 | ||||||
Marine Harvest | 263,440 | 4,738 | ||||||
Norsk Hydro | 3,474,230 | 16,381 | ||||||
Norway Royal Salmon | 12,280 | 287 | ||||||
Salmar | 14,479 | 454 | ||||||
Statoil | 1,335,729 | 22,892 | ||||||
Statoil ADR (A) | 1,078,357 | 18,763 | ||||||
Telenor | 1,345,235 | 19,879 | ||||||
|
| |||||||
| 113,844 | ||||||||
|
| |||||||
Panama — 0.2% | ||||||||
Copa Holdings, Cl A (A) | 146,197 | 12,993 | ||||||
|
| |||||||
Peru — 0.3% | ||||||||
Credicorp | 157,474 | 24,675 | ||||||
|
| |||||||
Poland — 0.1% | ||||||||
Polski Koncern Naftowy ORLEN | 399,509 | 7,286 | ||||||
|
| |||||||
Portugal — 0.4% | ||||||||
Galp Energia, Cl B | 1,509,032 | 20,434 | ||||||
Jeronimo Martins | 362,970 | 5,741 | ||||||
|
| |||||||
| 26,175 | ||||||||
|
| |||||||
Russia — 1.2% | ||||||||
Lukoil PJSC ADR (A) | 707,293 | 34,802 | ||||||
Magnit PJSC GDR | 353,907 | 14,256 | ||||||
Rosneft PJSC GDR | 1,765,456 | 9,286 | ||||||
Sberbank of Russia PJSC ADR | 1,473,340 | 14,836 | ||||||
Yandex, Cl A* | 546,304 | 10,385 | ||||||
|
| |||||||
| 83,565 | ||||||||
|
| |||||||
Singapore — 1.0% | ||||||||
DBS Group Holdings | 2,364,900 | 28,975 | ||||||
Singapore Airlines | 131,800 | 920 | ||||||
United Overseas Bank | 1,294,205 | 18,441 | ||||||
United Overseas Bank ADR | 727,900 | 20,658 | ||||||
|
| |||||||
| 68,994 | ||||||||
|
| |||||||
South Africa — 1.3% | ||||||||
Anglo American Platinum* | 42,193 | 869 | ||||||
Barloworld | 104,228 | 795 | ||||||
Clicks Group | 102,539 | 882 | ||||||
FirstRand | 1,613,310 | 5,809 | ||||||
Gold Fields ADR (A) | 557,758 | 1,712 | ||||||
Harmony Gold Mining ADR (A) | 327,367 | 746 | ||||||
Investec | 527,152 | 3,411 | ||||||
Kumba Iron Ore* (A) | 242,541 | 2,871 | ||||||
Liberty Holdings | 86,627 | 684 | ||||||
MMI Holdings | 849,922 | 1,332 | ||||||
Naspers, Cl N | 256,094 | 37,518 | ||||||
Sappi | 113,773 | 676 | ||||||
Sasol | 150,479 | 4,070 | ||||||
| Description | Shares | Market Value ($ Thousands) | ||||||
Sasol ADR | 764,900 | $ | 20,392 | |||||
Sibanye Gold | 1,624,390 | 3,378 | ||||||
Standard Bank Group | 534,575 | 5,755 | ||||||
Telkom | 513,911 | 2,550 | ||||||
|
| |||||||
| 93,450 | ||||||||
|
| |||||||
South Korea — 3.5% | ||||||||
Hanwha Chemical | 29,529 | 587 | ||||||
Hyundai Mobis | 83,897 | 17,869 | ||||||
Kia Motors | 89,310 | 2,857 | ||||||
Korea Electric Power | 142,583 | 5,671 | ||||||
Korea Electric Power ADR | 1,269,911 | 25,132 | ||||||
Korea Petrochemical Industries | 11,460 | 2,196 | ||||||
KT ADR | 341,091 | 4,731 | ||||||
LG Electronics | 110,709 | 4,252 | ||||||
LG.Philips LCD | 598,418 | 14,333 | ||||||
Lotte Chemical | 8,198 | 2,254 | ||||||
NAVER | 50,587 | 34,531 | ||||||
POSCO | 15,526 | 3,314 | ||||||
Samsung Biologics* | 16,382 | 2,158 | ||||||
Samsung Electronics | 74,406 | 111,127 | ||||||
SK Hynix | 252,664 | 9,272 | ||||||
SK Innovation | 40,316 | 5,259 | ||||||
S-Oil | 25,045 | 1,800 | ||||||
|
| |||||||
| 247,343 | ||||||||
|
| |||||||
Spain — 1.8% | ||||||||
Abertis Infraestructuras | 949,165 | 12,692 | ||||||
ACS Actividades Construcciones y Servicios | 487,260 | 14,362 | ||||||
Amadeus IT Group, Cl A | 794,270 | 36,028 | ||||||
Banco Bilbao Vizcaya Argentaria | 4,605,928 | 28,466 | ||||||
Bankinter | 1,745,318 | 13,130 | ||||||
Industria de Diseno Textil | 658,495 | 22,545 | ||||||
Mediaset Espana Comunicacion | 256,233 | 2,632 | ||||||
|
| |||||||
| 129,855 | ||||||||
|
| |||||||
Sweden — 1.9% | ||||||||
Atlas Copco, Cl A | 162,310 | 4,905 | ||||||
Atlas Copco, Cl B | 974,558 | 26,169 | ||||||
BillerudKorsnas | 100,797 | 1,673 | ||||||
Boliden | 68,282 | 1,762 | ||||||
Electrolux, Cl B | 676,784 | 15,813 | ||||||
Getinge, Cl B | 994,271 | 15,186 | ||||||
Lindab International | 33,394 | 275 | ||||||
Mycronic | 52,291 | 542 | ||||||
Nordea Bank | 2,096,500 | 22,005 | ||||||
Oriflame Holding* | 110,370 | 2,807 | ||||||
Svenska Cellulosa ADR | 388,100 | 10,302 | ||||||
Svenska Cellulosa, Cl B | 36,972 | 985 | ||||||
Svenska Handelsbanken, Cl A | 1,951,344 | 27,055 | ||||||
Volvo, Cl B | 729,112 | 7,787 | ||||||
|
| |||||||
| 137,266 | ||||||||
|
| |||||||
| 5 | SEI Institutional Investments Trust / Semi-Annual Report / November 30, 2016 |
SCHEDULE OF INVESTMENTS (Unaudited)
World Equity Ex-US Fund (Continued)
November 30, 2016
| Description | Shares | Market Value ($ Thousands) | ||||||
Switzerland — 4.4% | ||||||||
Actelion | 201,241 | $ | 38,721 | |||||
Cie Financiere Richemont (A) | 694,205 | 45,285 | ||||||
Coca-Cola HBC | 31,748 | 674 | ||||||
Credit Suisse Group ADR (A) | 1,124,722 | 15,004 | ||||||
Forbo Holding | 2,111 | 2,717 | ||||||
Galenica | 9,507 | 10,033 | ||||||
Georg Fischer | 6,575 | 5,615 | ||||||
Givaudan | 11,688 | 20,791 | ||||||
Holcim | 214,379 | 11,333 | ||||||
Julius Baer Group | 38,484 | 1,697 | ||||||
Logitech International | 86,455 | 2,126 | ||||||
Lonza Group | 150,085 | 26,756 | ||||||
Nestle | 462,378 | 31,048 | ||||||
Novartis ADR (A) | 346,289 | 23,811 | ||||||
Roche Holding | 120,757 | 26,874 | ||||||
SGS | 3,383 | 6,785 | ||||||
STMicroelectronics | 117,935 | 1,204 | ||||||
Swiss Life Holding | 78,150 | 21,451 | ||||||
Swiss Re | 46,815 | 4,302 | ||||||
Wolseley | 312,838 | 18,156 | ||||||
|
| |||||||
| 314,383 | ||||||||
|
| |||||||
Taiwan — 3.4% | ||||||||
Advanced Semiconductor Engineering | 14,061,000 | 15,110 | ||||||
AU Optronics | 12,408,000 | 4,457 | ||||||
Bizlink Holding | 1,231,000 | 5,928 | ||||||
Chunghwa Telecom | 6,112,399 | 20,616 | ||||||
Fubon Financial Holding | 7,689,949 | 11,931 | ||||||
Hon Hai Precision Industry | 18,029,779 | 46,385 | ||||||
Hon Hai Precision Industry GDR | 1,923,085 | 9,635 | ||||||
Innolux, Cl A | 15,521,544 | 5,357 | ||||||
Lite-On Technology | 879,475 | 1,388 | ||||||
Pegatron | 4,156,000 | 9,897 | ||||||
Taiwan PCB Techvest | 451,000 | 439 | ||||||
Taiwan Semiconductor Manufacturing | 5,565,000 | 31,952 | ||||||
Taiwan Semiconductor Manufacturing ADR | 2,615,744 | 77,661 | ||||||
United Microelectronics | 3,643,000 | 1,286 | ||||||
United Microelectronics ADR (A) | 1,211,600 | 2,205 | ||||||
|
| |||||||
| 244,247 | ||||||||
|
| |||||||
Thailand — 0.5% | ||||||||
Banpu | 3,866,300 | 2,026 | ||||||
Charoen Pokphand Foods | 4,336,400 | 3,494 | ||||||
Fabrinet* | 486,061 | 20,803 | ||||||
IRPC | 10,193,800 | 1,383 | ||||||
Sansiri | 8,769,900 | 401 | ||||||
Siam Cement NVDR | 517,000 | 6,897 | ||||||
Thai Oil | 1,090,000 | 2,261 | ||||||
Thanachart Capital | 1,205,600 | 1,487 | ||||||
|
| |||||||
| 38,752 | ||||||||
|
| |||||||
Turkey — 0.7% | ||||||||
Akbank | 6,558,505 | 14,441 | ||||||
| Description | Shares | Market Value ($ Thousands) | ||||||
Arcelik | 89,601 | $ | 524 | |||||
KOC Holding ADR | 498,950 | 9,006 | ||||||
Petkim Petrokimya Holding | 526,430 | 560 | ||||||
Turkiye Garanti Bankasi | 1,168,892 | 2,485 | ||||||
Turkiye Halk Bankasi | 2,820,359 | 7,230 | ||||||
Turkiye Is Bankasi, Cl C | 4,938,720 | 6,943 | ||||||
Turkiye Vakiflar Bankasi Tao, Cl D | 5,790,190 | 7,042 | ||||||
Yapi ve Kredi Bankasi* | 1,497,366 | 1,363 | ||||||
|
| |||||||
| 49,594 | ||||||||
|
| |||||||
United Arab Emirates — 0.3% | ||||||||
Aldar Properties PJSC | 807,235 | 545 | ||||||
Dubai Islamic Bank | 13,945,717 | 19,896 | ||||||
|
| |||||||
| 20,441 | ||||||||
|
| |||||||
United Kingdom — 11.3% | ||||||||
3i Group | 259,987 | 2,238 | ||||||
Abcam | 230,445 | 2,385 | ||||||
Anglo American* | 52,350 | 775 | ||||||
ASOS* | 139,251 | 8,781 | ||||||
Associated British Foods | 364,512 | 11,613 | ||||||
AstraZeneca | 526,524 | 27,297 | ||||||
BAE Systems ADR (A) | 769,500 | 23,154 | ||||||
Barclays | 13,978,612 | 37,716 | ||||||
Berendsen PLC | 39,996 | 442 | ||||||
BP PLC ADR | 384,265 | 13,453 | ||||||
British American Tobacco | 385,340 | 21,152 | ||||||
BT Group, Cl A | 8,152,909 | 36,375 | ||||||
Burberry Group | 475,112 | 8,483 | ||||||
Capita | 1,263,543 | 8,280 | ||||||
Carnival | 207,900 | 10,504 | ||||||
Compass Group | 388,347 | 6,652 | ||||||
CRH | 582,365 | 19,354 | ||||||
Debenhams | 1,592,681 | 1,102 | ||||||
Diageo | 1,011,281 | 25,333 | ||||||
Dialog Semiconductor* | 130,056 | 5,161 | ||||||
Direct Line Insurance Group | 4,161,390 | 18,052 | ||||||
Domino’s Pizza Group | 506,480 | 2,215 | ||||||
Experian | 923,108 | 17,415 | ||||||
Ferrexpo* | 729,366 | 1,201 | ||||||
GlaxoSmithKline | 257,380 | 4,809 | ||||||
Glencore* | 1,698,919 | 5,929 | ||||||
Greggs | 26,619 | 300 | ||||||
Halma | 410,031 | 4,831 | ||||||
Hargreaves Lansdown | 689,508 | 10,140 | ||||||
Hiscox | 25,585 | 335 | ||||||
Howden Joinery Group | 1,685,032 | 7,579 | ||||||
HSBC Holdings | 3,539,948 | 28,094 | ||||||
IG Group Holdings | 43,942 | 461 | ||||||
Imperial Brands | 650,428 | 27,898 | ||||||
Inchcape | 174,091 | 1,324 | ||||||
Indivior | 1,013,652 | 4,086 | ||||||
Investec | 447,508 | 2,907 | ||||||
| 6 | SEI Institutional Investments Trust / Semi-Annual Report / November 30, 2016 |
SCHEDULE OF INVESTMENTS (Unaudited)
World Equity Ex-US Fund (Continued)
November 30, 2016
| Description | Shares | Market Value ($ Thousands) | ||||||
ITV | 13,023,641 | $ | 27,337 | |||||
JD Sports Fashion | 235,510 | 980 | ||||||
John Wood Group | 384,032 | 3,949 | ||||||
Just Eat* | 1,323,869 | 9,684 | ||||||
Kingfisher | 7,159,864 | 31,587 | ||||||
Ladbrokes Coral Group | 495,333 | 768 | ||||||
Lloyds Banking Group | 25,702,461 | 18,584 | ||||||
London Stock Exchange Group | 591,857 | 20,321 | ||||||
Mondi | 377,677 | 7,706 | ||||||
National Grid | 93,857 | 1,071 | ||||||
Prudential | 928,199 | 17,958 | ||||||
QinetiQ | 967,075 | 2,936 | ||||||
Reckitt Benckiser Group | 68,441 | 5,783 | ||||||
Rentokil Initial | 498,152 | 1,334 | ||||||
Rightmove | 11,157 | 511 | ||||||
Rio Tinto | 1,102,506 | 41,187 | ||||||
Rio Tinto ADR (A) | 465,723 | 17,656 | ||||||
Rolls-Royce Holdings | 803,346 | 6,790 | ||||||
Royal Dutch Shell, Cl A (A) | 2,575,497 | 65,516 | ||||||
Royal Dutch Shell, Cl A (GBP) (A) | 120,089 | 3,040 | ||||||
Royal Dutch Shell ADR, Cl A | 435,300 | 22,244 | ||||||
Sage Group | 41,932 | 344 | ||||||
Schroders | 62,782 | 2,169 | ||||||
Shire | 785,083 | 45,709 | ||||||
SSE | 147,624 | 2,720 | ||||||
St. James’s Place | 925,337 | 10,868 | ||||||
Tate & Lyle | 196,882 | 1,668 | ||||||
Tullow Oil* (A) | 1,588,442 | 5,910 | ||||||
WPP | 1,161,876 | 24,809 | ||||||
|
| |||||||
| 808,965 | ||||||||
|
| |||||||
United States — 3.4% |
| |||||||
Alexion Pharmaceuticals* | 116,733 | 14,310 | ||||||
Carnival, Cl A | 573,380 | 29,477 | ||||||
Coca-Cola European Partners | 278,400 | 9,037 | ||||||
Core Laboratories (A) | 264,870 | 29,602 | ||||||
Estee Lauder, Cl A | 175,897 | 13,667 | ||||||
Everest Re Group | 119,766 | 25,217 | ||||||
ICON* | 757,455 | 57,294 | ||||||
International Game Technology | 578,837 | 14,922 | ||||||
MasterCard, Cl A | 131,962 | 13,487 | ||||||
Open Text | 199,600 | 12,687 | ||||||
PriceSmart | 115,660 | 10,560 | ||||||
TripAdvisor* | 282,085 | 13,619 | ||||||
|
| |||||||
| 243,879 | ||||||||
|
| |||||||
Total Common Stock | 6,749,528 | |||||||
|
| |||||||
| Description | Shares | Market Value ($ Thousands) | ||||||
EXCHANGE TRADED FUNDS — 0.6% |
| |||||||
United States — 0.6% |
| |||||||
iShares MSCI EAFE ETF | 490,052 | $ | 27,830 | |||||
iShares MSCI Emerging Markets Index Fund | 347,110 | 12,323 | ||||||
|
| |||||||
Total Exchange Traded Funds | 40,153 | |||||||
|
| |||||||
PREFERRED STOCK — 0.4% |
| |||||||
Brazil — 0.4% |
| |||||||
Banco Bradesco* | 861,208 | 7,575 | ||||||
Centrais Eletricas Brasileiras, Cl B* | 63,700 | 533 | ||||||
Cia Energetica de Minas Gerais | 476,854 | 1,114 | ||||||
Gerdau | 436,400 | 1,748 | ||||||
Itau Unibanco Holding | 364,045 | 3,812 | ||||||
Itau Unibanco Holding ADR | 939,723 | 9,717 | ||||||
Metalurgica Gerdau* | 878,200 | 1,516 | ||||||
Telefonica Brasil | 199,400 | 2,662 | ||||||
|
| |||||||
Total Preferred Stock | 28,677 | |||||||
|
| |||||||
| Number of Rights | ||||||||
RIGHTS — 0.0% | ||||||||
Australia — 0.0% | ||||||||
Boral, Expires 12/13/2016* | 344,727 | 60 | ||||||
|
| |||||||
Canada — 0.0% | ||||||||
Yamana Gold, Expires 12/15/2016 | 70,438 | 17 | ||||||
|
| |||||||
Total Rights | 77 | |||||||
|
| |||||||
| Shares | ||||||||
AFFILIATED PARTNERSHIP — 4.2% |
| |||||||
SEI Liquidity Fund, L.P. | ||||||||
0.470%**† (C) | 301,753,669 | 301,754 | ||||||
|
| |||||||
Total Affiliated Partnership | 301,754 | |||||||
|
| |||||||
| 7 | SEI Institutional Investments Trust / Semi-Annual Report / November 30, 2016 |
SCHEDULE OF INVESTMENTS (Unaudited)
World Equity Ex-US Fund (Continued)
November 30, 2016
| Description | Shares | Market Value ($ Thousands) | ||||||
CASH EQUIVALENT — 1.0% |
| |||||||
SEI Daily Income Trust, Government Fund, Cl A | ||||||||
0.210%**† | 73,582,079 | $ | 73,582 | |||||
|
| |||||||
Total Cash Equivalent | 73,582 | |||||||
|
| |||||||
Total Investments — 100.8% | $ | 7,193,771 | ||||||
|
| |||||||
A list of the open futures contracts held by the Fund at November 30, 2016, is as follows:
| Type of Contract | Number of Contracts Long | Expiration Date | Unrealized Appreciation (Depreciation) ($ Thousands) | |||||||||
DJ Euro Stoxx 50 Index | 1,366 | Dec-2016 | $ | 313 | ||||||||
FTSE 100 Index | 303 | Dec-2016 | (25 | ) | ||||||||
Hang Seng Index | 43 | Dec-2016 | 16 | |||||||||
S&P TSX 60 Index | 100 | Dec-2016 | 241 | |||||||||
SPI 200 Index | 114 | Dec-2016 | 172 | |||||||||
Topix Index | 262 | Dec-2016 | 1,610 | |||||||||
|
| |||||||||||
| $ | 2,327 | |||||||||||
|
| |||||||||||
For the period ended November 30, 2016, the total amount of all open futures contracts, as presented in the table above, are representative of the volume of activity for the derivative type during the period.
Percentages are based on Net Assets of $7,134,635 ($ Thousands).
| * | Non-income producing security. |
| ** | Rate shown is the 7-day effective yield as of November 30, 2016. |
| † | Investment in Affiliated Security (see Note 6). |
| (A) | This security or a partial position of this security is on loan at November 30, 2016 (see Note 12). The total market value of securities on loan at November 30, 2016 was $289,406 ($ Thousands). |
| (B) | Security exempt from registration under Rule 144A of the Securities Act of 1933. These securities may be resold in transactions exempt from registration normally to qualified institutions. On November 30, 2016, the value of these securities amounted to $42,241 ($ Thousands), representing 0.6% of the net assets of the Fund. |
| (C) | This security was purchased with cash collateral held from securities on loan (see Note 12). The total market value of such securities as of November 30, 2016 was $301,754 ($ Thousands). |
ADR — American Depositary Receipt
Cl — Class
DJ — Dow Jones
EAFE — Europe, Australasia and Far East
ETF — Exchange Traded Fund
FTSE — Financial Times and Stock Exchange
GBP — Great British Pound
GDR — Global Depositary Receipt
L.P. — Limited Partnership
MSCI — Morgan Stanley Capital International
NVDR — Non-Voting Depositary Receipt
PLC — Public Limited Company
Ser — Series
S&P — Standard & Poor’s
SPI — Share Price Index
TSX — Toronto Stock Exchange
The following is a list of the level of inputs used as of November 30, 2016, in valuing the Fund’s investments and other financial instruments carried at value ($ Thousands):
| Investments in Securities | Level 1 | Level 2 | Level 3 | Total | ||||||||||||
Common Stock | $ | 6,748,874 | $ | 654 | $ | — | $ | 6,749,528 | ||||||||
Exchange Traded Funds | 40,153 | — | — | 40,153 | ||||||||||||
Preferred Stock | 28,677 | — | — | 28,677 | ||||||||||||
Rights | 77 | — | — | 77 | ||||||||||||
Affiliated Partnership | — | 301,754 | — | 301,754 | ||||||||||||
Cash Equivalent | 73,582 | — | — | 73,582 | ||||||||||||
|
|
|
|
|
|
|
| |||||||||
Total Investments in Securities | $ | 6,891,363 | $ | 302,408 | $ | — | $ | 7,193,771 | ||||||||
|
|
|
|
|
|
|
| |||||||||
| 8 | SEI Institutional Investments Trust / Semi-Annual Report / November 30, 2016 |
SCHEDULE OF INVESTMENTS (Unaudited)
World Equity Ex-US Fund (Concluded)
November 30, 2016
| Other Financial Instruments | Level 1 | Level 2 | Level 3 | Total | ||||||||||||
Futures Contracts* | ||||||||||||||||
Unrealized Appreciation | $ | 2,352 | $ | — | $ | — | $ | 2,352 | ||||||||
Unrealized Depreciation | (25 | ) | — | — | (25 | ) | ||||||||||
|
|
|
|
|
|
|
| |||||||||
Total Other Financial Instruments | $ | 2,327 | $ | — | $ | — | $ | 2,327 | ||||||||
|
|
|
|
|
|
|
| |||||||||
| * | Futures contracts are valued at the unrealized appreciation (depreciation) on the instrument. |
For the period ended November 30, 2016, there were transfers between Level 1 and Level 2 assets and liabilities. The primary reason for changes in the classifications between Levels 1 and 2 occurs when foreign equity securities are fair valued using other observable market-based inputs in place of the closing exchange price due to events occurring after the close of the exchange or market on which the investment is principally traded.
For the period ended November 30, 2016, there were no transfers between Level 2 and Level 3 assets and liabilities.
For more information on valuation inputs, see Note 2 — Significant Accounting Policies in Notes to Financial Statements.
Amounts designated as “—” are $0 or have been rounded to $0.
The accompanying notes are an integral part of the financial statements.
| 9 | SEI Institutional Investments Trust / Semi-Annual Report / November 30, 2016 |
SCHEDULE OF INVESTMENTS (Unaudited)
Screened World Equity Ex-US Fund
November 30, 2016
| Description | Shares | Market Value ($ Thousands) | ||||||
COMMON STOCK — 92.5% | ||||||||
Argentina — 0.6% | ||||||||
MercadoLibre | 2,936 | $ | 463 | |||||
Ternium ADR | 1,099 | 27 | ||||||
|
| |||||||
| 490 | ||||||||
|
| |||||||
Australia — 3.3% | ||||||||
BGP Holdings* | 4,500 | — | ||||||
BHP Billiton ADR | 6,689 | 251 | ||||||
BlueScope Steel | 20,580 | 137 | ||||||
Brambles | 30,059 | 262 | ||||||
Cochlear | 5,158 | 452 | ||||||
Codan | 6,749 | 9 | ||||||
Commonwealth Bank of Australia | 9,650 | 561 | ||||||
Fortescue Metals Group | 45,692 | 198 | ||||||
Goodman Group‡ | 23,830 | 117 | ||||||
MACA | 36,820 | 42 | ||||||
Pro Medicus | 1,464 | 6 | ||||||
Rio Tinto | 5,991 | 256 | ||||||
SEEK | 7,478 | 82 | ||||||
Service Stream | 8,799 | 6 | ||||||
South32 | 106,635 | 213 | ||||||
Telstra | 73,069 | 273 | ||||||
Watpac* | 3,246 | 2 | ||||||
|
| |||||||
| 2,867 | ||||||||
|
| |||||||
Austria — 2.3% | ||||||||
Agrana Beteiligungs | 164 | 19 | ||||||
Conwert Immobilien Invest* | 18,963 | 325 | ||||||
Erste Group Bank* | 12,796 | 356 | ||||||
Kapsch TrafficCom | 3,230 | 138 | ||||||
Lenzing | 439 | 56 | ||||||
OMV | 8,837 | 286 | ||||||
Porr Ag | 2,082 | 78 | ||||||
Schoeller-Bleckmann Oilfield Equipment | 4,542 | 323 | ||||||
Strabag | 1,092 | 37 | ||||||
Voestalpine | 10,184 | 386 | ||||||
Wienerberger | 1,053 | 19 | ||||||
|
| |||||||
| 2,023 | ||||||||
|
| |||||||
Belgium — 0.2% | ||||||||
KBC Groep | 2,030 | 122 | ||||||
Sioen Industries | 210 | 7 | ||||||
|
| |||||||
| 129 | ||||||||
|
| |||||||
Brazil — 0.7% | ||||||||
Banco Bradesco ADR* | 32,107 | 278 | ||||||
Banco do Brasil* | 19,130 | 161 | ||||||
Cia de Locacao das Americas | 1,100 | 2 | ||||||
Cia Vale do Rio Doce* | 16,289 | 135 | ||||||
|
| |||||||
| 576 | ||||||||
|
| |||||||
Canada — 6.4% | ||||||||
Bank of Montreal | 10,900 | 718 | ||||||
Calian Group | 1,000 | 18 | ||||||
Chorus Aviation | 2,740 | 13 | ||||||
| Description | Shares | Market Value ($ Thousands) | ||||||
Cogeco | 3,782 | $ | 154 | |||||
Constellation Software | 703 | 327 | ||||||
Dollarama | 2,300 | 171 | ||||||
Dorel Industries, Cl B | 8,600 | 235 | ||||||
Fairfax Financial Holdings | 840 | 399 | ||||||
Genworth MI Canada | 3,320 | 81 | ||||||
Granite Oil | 535 | 2 | ||||||
Great Canadian Gaming* | 500 | 9 | ||||||
High Arctic Energy Services | 32,200 | 115 | ||||||
High Liner Foods | 8,383 | 125 | ||||||
Just Energy Group | 13,500 | 74 | ||||||
Lucara Diamond | 37,000 | 90 | ||||||
Magna International, Cl A | 9,360 | 378 | ||||||
Medical Facilities | 2,754 | 34 | ||||||
North American Energy Partners | 908 | 3 | ||||||
Restaurant Brands International | 4,862 | 231 | ||||||
Ritchie Bros Auctioneers | 5,645 | 216 | ||||||
Rogers Communications, Cl B | 9,550 | 369 | ||||||
Royal Bank of Canada | 8,200 | 531 | ||||||
Savanna Energy Services* | 29,300 | 35 | ||||||
Strad Energy Services* | 14,708 | 17 | ||||||
Stuart Olson | 14,600 | 61 | ||||||
Supremex | 13,600 | 52 | ||||||
Teck Cominco, Cl B | 10,900 | 276 | ||||||
Toronto-Dominion Bank | 11,200 | 529 | ||||||
Transat AT, Cl B* | 27,862 | 118 | ||||||
WestJet Airlines | 235 | 4 | ||||||
Westshore Terminals Investment | 3,700 | 76 | ||||||
Yellow Pages* | 10,033 | 134 | ||||||
|
| |||||||
| 5,595 | ||||||||
|
| |||||||
China — 2.3% | ||||||||
Alibaba Group Holding ADR* | 4,611 | 433 | ||||||
Baidu ADR* | 1,959 | 327 | ||||||
BYD | 39,500 | 238 | ||||||
China Finance Online ADR* | 6,486 | 27 | ||||||
China Life Insurance | 207,000 | 602 | ||||||
China Telecom | 8,000 | 4 | ||||||
Ctrip.com International ADR* | 5,560 | 251 | ||||||
NetEase ADR | 690 | 155 | ||||||
|
| |||||||
| 2,037 | ||||||||
|
| |||||||
Colombia — 0.3% | ||||||||
Bancolombia ADR, Cl R | 8,414 | 282 | ||||||
|
| |||||||
Czech Republic — 0.2% | ||||||||
Komercni Banka | 5,935 | 196 | ||||||
Unipetrol | 623 | 5 | ||||||
|
| |||||||
| 201 | ||||||||
|
| |||||||
Denmark — 1.3% | ||||||||
Columbus | 42,579 | 65 | ||||||
DSV | 6,302 | 284 | ||||||
Genmab* | 872 | 151 | ||||||
| 1 | SEI Institutional Investments Trust / Semi-Annual Report / November 30, 2016 |
SCHEDULE OF INVESTMENTS (Unaudited)
Screened World Equity Ex-US Fund (Continued)
November 30, 2016
| Description | Shares | Market Value ($ Thousands) | ||||||
Novo Nordisk, Cl B | 8,800 | $ | 299 | |||||
Novozymes, Cl B | 5,541 | 188 | ||||||
Pandora | 1,060 | 126 | ||||||
|
| |||||||
| 1,113 | ||||||||
|
| |||||||
Finland — 1.6% | ||||||||
Atria, Cl A | 10,693 | 125 | ||||||
Elisa, Cl A | 5,060 | 159 | ||||||
Kone, Cl B | 6,009 | 265 | ||||||
Lemminkainen | 365 | 7 | ||||||
Neste Oil | 7,029 | 289 | ||||||
Nokian Renkaat | 2,490 | 90 | ||||||
Orion, Cl B | 138 | 6 | ||||||
Sampo, Cl A | 5,004 | 221 | ||||||
UPM-Kymmene | 10,860 | 249 | ||||||
|
| |||||||
| 1,411 | ||||||||
|
| |||||||
France — 5.4% | ||||||||
Altamir | 3,132 | 39 | ||||||
Bigben Interactive* | 18,575 | 130 | ||||||
BNP Paribas | 3,400 | 198 | ||||||
Burelle | 77 | 72 | ||||||
Caisse Regionale de Credit Agricole Mutuel | ||||||||
Brie Picardie | 144 | 3 | ||||||
Cegedim* | 1,182 | 28 | ||||||
Credit Agricole Loire Haute-Loire | 140 | 10 | ||||||
Credit Agricole Toulouse | 315 | 30 | ||||||
Damartex | 230 | 8 | ||||||
Derichebourg | 17,193 | 54 | ||||||
Edenred | 6,813 | 144 | ||||||
Essilor International | 1,940 | 206 | ||||||
Esso Francaise* | 450 | 17 | ||||||
Flamel Technologies ADR* | 3,527 | 37 | ||||||
Fleury Michon | 329 | 20 | ||||||
Groupe Open | 2,777 | 65 | ||||||
Groupe Partouche* | 823 | 37 | ||||||
HighCo | 2,158 | 13 | ||||||
Ipsen | 2,948 | 200 | ||||||
Kering | 615 | 134 | ||||||
LafargeHolcim | 267 | 14 | ||||||
Lectra | 8,926 | 147 | ||||||
Legrand | 5,178 | 290 | ||||||
Linedata | 536 | 24 | ||||||
Mersen | 6,497 | 128 | ||||||
PCAS | 5,884 | 68 | ||||||
Peugeot* | 10,439 | 154 | ||||||
Plastivaloire | 1,513 | 184 | ||||||
PSB Industries | 59 | 3 | ||||||
Safran | 4,948 | 340 | ||||||
Savencia | 79 | 6 | ||||||
Societe Generale | 7,583 | 326 | ||||||
Sodexo | 3,634 | 398 | ||||||
Synergie | 1,933 | 67 | ||||||
| Description | Shares | Market Value ($ Thousands) | ||||||
Thales | 2,460 | $ | 240 | |||||
TOTAL | 7,790 | 371 | ||||||
UBISOFT Entertainment* | 9,201 | 320 | ||||||
Vetoquinol | 324 | 15 | ||||||
Vinci | 3,150 | 205 | ||||||
Voyageurs du Monde | 115 | 8 | ||||||
|
| |||||||
| 4,753 | ||||||||
|
| |||||||
Germany — 3.7% | ||||||||
adidas | 1,050 | 155 | ||||||
AUDI | 37 | 24 | ||||||
BASF | 1,546 | 133 | ||||||
Brenntag | 3,779 | 199 | ||||||
CENTROTEC Sustainable | 383 | 6 | ||||||
Constantin Medien* | 17,806 | 34 | ||||||
Continental | 2,802 | 498 | ||||||
CropEnergies | 4,408 | 22 | ||||||
Deutsche Boerse | 4,877 | 378 | ||||||
Deutsche Lufthansa | 5,740 | 74 | ||||||
Eckert & Ziegler | 2,760 | 69 | ||||||
Fresenius | 1,890 | 136 | ||||||
FRoSTA | 447 | 29 | ||||||
H&R GmbH & KGaA* | 1,379 | 23 | ||||||
Highlight Communications | 3,690 | 20 | ||||||
Koenig & Bauer* | 769 | 34 | ||||||
KUKA | 580 | 54 | ||||||
Leifheit | 72 | 4 | ||||||
Mensch und Maschine Software | 1,246 | 16 | ||||||
Merck KGaA | 2,180 | 219 | ||||||
MPH Mittelstaendische Pharma Holding | 6,149 | 21 | ||||||
MTU Aero Engines | 1,590 | 167 | ||||||
Muehlbauer Holding | 818 | 37 | ||||||
Paul Hartmann | 49 | 20 | ||||||
SAP | 4,181 | 350 | ||||||
Schloss Wachenheim | 625 | 10 | ||||||
Siemens | 2,281 | 258 | ||||||
VERBIO Vereinigte BioEnergie | 29,159 | 216 | ||||||
|
| |||||||
| 3,206 | ||||||||
|
| |||||||
Hong Kong — 3.7% | ||||||||
1010 Printing Group | 158,180 | 27 | ||||||
AIA Group | 35,800 | 218 | ||||||
Anhui Conch Cement | 95,500 | 276 | ||||||
Bank of China | 54,000 | 25 | ||||||
China Construction Bank | 556,000 | 414 | ||||||
China Mobile | 33,500 | 366 | ||||||
Dynam Japan Holdings | 22,400 | 32 | ||||||
EcoGreen International Group | 488,400 | 109 | ||||||
FSE Engineering Holdings | 38,000 | 13 | ||||||
Guangzhou Automobile Group | 108,000 | 141 | ||||||
Hang Seng Bank | 14,700 | 279 | ||||||
Hong Kong Exchanges and Clearing | 15,300 | 402 | ||||||
Industrial & Commercial Bank of China | 133,000 | 81 | ||||||
| 2 | SEI Institutional Investments Trust / Semi-Annual Report / November 30, 2016 |
SCHEDULE OF INVESTMENTS (Unaudited)
Screened World Equity Ex-US Fund (Continued)
November 30, 2016
| Description | Shares | Market Value ($ Thousands) | ||||||
Luen Thai Holdings | 39,000 | $ | 16 | |||||
Melco Crown Entertainment ADR | 6,477 | 127 | ||||||
Niraku GC Holdings | 208,000 | 19 | ||||||
Orient Overseas International | 61,500 | 245 | ||||||
Oriental Press Group | 50,000 | 6 | ||||||
Shanghai Fosun Pharmaceutical Group | 41,300 | 130 | ||||||
Sun Hung Kai Properties | 2,000 | 26 | ||||||
Tencent Holdings | 12,400 | 310 | ||||||
TPV Technology | 30,000 | 6 | ||||||
|
| |||||||
| 3,268 | ||||||||
|
| |||||||
Hungary — 0.2% | ||||||||
OTP Bank | 7,340 | 198 | ||||||
|
| |||||||
India — 1.3% | ||||||||
HDFC Bank ADR | 7,406 | 478 | ||||||
ICICI Bank ADR | 58,826 | 461 | ||||||
Tata Motors ADR | 7,060 | 233 | ||||||
|
| |||||||
| 1,172 | ||||||||
|
| |||||||
Indonesia — 1.0% | ||||||||
Bank Rakyat Indonesia Persero | 98,100 | 79 | ||||||
Gajah Tunggal* | 942,800 | 70 | ||||||
Hexindo Adiperkasa | 54,900 | 14 | ||||||
Indo Tambangraya Megah | 111,600 | 132 | ||||||
Indofood Sukses Makmur | 398,900 | 223 | ||||||
Japfa Comfeed Indonesia | 954,900 | 118 | ||||||
Samudera Indonesia | 4,200 | 2 | ||||||
Telekomunikasi Indonesia Persero | 610,900 | 170 | ||||||
Waskita Karya Persero | 570,800 | 107 | ||||||
|
| |||||||
| 915 | ||||||||
|
| |||||||
Ireland — 1.0% | ||||||||
James Hardie Industries, CDI | 21,563 | 332 | ||||||
Ryanair Holdings ADR* | 6,690 | 534 | ||||||
|
| |||||||
| 866 | ||||||||
|
| |||||||
Israel — 1.0% | ||||||||
Ceragon Networks* | 5,179 | 12 | ||||||
Dor Alon Energy in Israel 1988 | 1,076 | 14 | ||||||
Electra Consumer Products 1970 | 13,461 | 194 | ||||||
Knafaim Holdings | 3,989 | 31 | ||||||
Meitav DS Investments | 6,724 | 24 | ||||||
Scope Metals Group | 2,563 | 51 | ||||||
Tadiran Holdings | 9,468 | 232 | ||||||
Teva Pharmaceutical Industries ADR | 8,766 | 330 | ||||||
|
| |||||||
| 888 | ||||||||
|
| |||||||
Italy — 1.3% | ||||||||
Brembo | 2,000 | 115 | ||||||
Buzzi Unicem | 4,315 | 92 | ||||||
Danieli & C Officine Meccaniche | 145 | 2 | ||||||
DeA Capital* | 10,144 | 11 | ||||||
Enel | 84,448 | 342 | ||||||
Fiat Chrysler Automobiles* | 15,600 | 121 | ||||||
| Description | Shares | Market Value ($ Thousands) | ||||||
Prysmian | 18,503 | $ | 443 | |||||
Servizi Italia | 332 | 1 | ||||||
|
| |||||||
| 1,127 | ||||||||
|
| |||||||
Japan — 10.7% | ||||||||
Aichi Bank | 200 | 11 | ||||||
Arata | 1,800 | 38 | ||||||
AT-Group | 4,000 | 88 | ||||||
Axyz | 200 | 3 | ||||||
Central Japan Railway | 300 | 49 | ||||||
CK-San-Etsu | 2,000 | 23 | ||||||
Computer Engineering & Consulting | 300 | 5 | ||||||
Daihatsu Diesel Manufacturing | 3,600 | 22 | ||||||
Daito Trust Construction | 300 | 47 | ||||||
Daiwa House Industry | 5,200 | 148 | ||||||
Denso | 23,600 | 1,031 | ||||||
FANUC | 1,400 | 237 | ||||||
Fujitsu | 45,000 | 267 | ||||||
Haseko | 12,000 | 125 | ||||||
Hitachi | 61,000 | 326 | ||||||
Hokuriku Gas | 700 | 17 | ||||||
Itochu | 9,600 | 132 | ||||||
Japan Exchange Group | 33,300 | 495 | ||||||
Japan Post Holdings | 8,400 | 104 | ||||||
Kamei | 3,900 | 36 | ||||||
Kawasumi Laboratories | 900 | 5 | ||||||
Keihanshin Building | 4,100 | 21 | ||||||
Keiyo Gas | 1,000 | 4 | ||||||
Kita-Nippon Bank | 1,200 | 32 | ||||||
Koike Sanso Kogyo | 2,000 | 5 | ||||||
Koito Manufacturing | 3,700 | 194 | ||||||
Komatsu | 4,800 | 111 | ||||||
Maruhachi Holdings | 1,500 | 11 | ||||||
Marukyo | 3,000 | 28 | ||||||
Maruzen | 3,000 | 29 | ||||||
Megmilk Snow Brand | 1,700 | 48 | ||||||
Mie Bank | 2,000 | 39 | ||||||
Mitsubishi Electric | 12,000 | 166 | ||||||
Mitsubishi Gas Chemical | 6,000 | 91 | ||||||
Mitsubishi UFJ Financial Group | 35,500 | 209 | ||||||
Mitsui Sumitomo Insurance Group Holdings | 14,500 | 452 | ||||||
Mitsui Trust Holdings | 8,900 | 324 | ||||||
Mixi | 2,400 | 84 | ||||||
Nafco | 1,100 | 16 | ||||||
Nidec | 3,100 | 279 | ||||||
Nihon Dengi | 1,300 | 22 | ||||||
Nihon Eslead | 1,400 | �� | 16 | |||||
Nippon Telegraph & Telephone | 8,370 | 340 | ||||||
Nissan Motor | 16,400 | 152 | ||||||
NTT DoCoMo | 14,800 | 341 | ||||||
Otsuka Holdings | 100 | 4 | ||||||
Panasonic | 23,600 | 241 | ||||||
PAPYLESS | 600 | 22 | ||||||
| 3 | SEI Institutional Investments Trust / Semi-Annual Report / November 30, 2016 |
SCHEDULE OF INVESTMENTS (Unaudited)
Screened World Equity Ex-US Fund (Continued)
November 30, 2016
| Description | Shares | Market Value ($ Thousands) | ||||||
Rakuten* | 29,100 | $ | 288 | |||||
Sankyo Frontier | 3,000 | 29 | ||||||
Sato Shoji | 2,400 | 17 | ||||||
Secom | 6,700 | 489 | ||||||
Shimano | 2,000 | 330 | ||||||
Shimizu | 20,000 | 185 | ||||||
SMC | 1,300 | 371 | ||||||
Square Enix Holdings | 7,900 | 200 | ||||||
Sumitomo | 9,500 | 114 | ||||||
Taisei | 18,000 | 131 | ||||||
Techno Ryowa | 1,700 | 11 | ||||||
Terasaki Electric | 2,400 | 17 | ||||||
T-Gaia | 300 | 4 | ||||||
Tomen Devices | 700 | 13 | ||||||
Tomoku | 3,000 | 8 | ||||||
Toshiba* | 31,000 | 116 | ||||||
Toyota Motor | 8,100 | 473 | ||||||
Yamae Hisano | 1,600 | 14 | ||||||
Zenkoku Hosho | 1,400 | 48 | ||||||
|
| |||||||
| 9,348 | ||||||||
|
| |||||||
Malaysia — 0.3% | ||||||||
Allianz Malaysia | 17,200 | 37 | ||||||
Dutch Lady Milk Industries | 800 | 10 | ||||||
Gas Malaysia | 22,100 | 13 | ||||||
Malaysian Pacific Industries | 10,700 | 17 | ||||||
Padini Holdings | 108,200 | 64 | ||||||
Petron Malaysia Refining & Marketing | 37,500 | 35 | ||||||
Public Bank | 8,600 | 38 | ||||||
Tenaga Nasional | 25,000 | 79 | ||||||
|
| |||||||
| 293 | ||||||||
|
| |||||||
Mexico — 0.4% | ||||||||
Bio Pappel* | 18,819 | 23 | ||||||
Cia Minera Autlan* | 18,990 | 9 | ||||||
Grupo Financiero Banorte, Ser O | 62,800 | 303 | ||||||
Rassini, Ser CP, Cl CP | 8,586 | 32 | ||||||
|
| |||||||
| 367 | ||||||||
|
| |||||||
Netherlands — 1.6% | ||||||||
AMG Advanced Metallurgical Group | 6,284 | 101 | ||||||
BE Semiconductor Industries | 1,150 | 38 | ||||||
DOCdata | 492 | — | ||||||
Heineken Holding | 4,800 | 338 | ||||||
Kendrion | 985 | 28 | ||||||
Nederland Apparatenfabriek | 241 | 8 | ||||||
NN Group | 3,700 | 119 | ||||||
SNS Reaal* | 1,762 | — | ||||||
Unilever | 19,595 | 787 | ||||||
|
| |||||||
| 1,419 | ||||||||
|
| |||||||
New Zealand — 0.1% | ||||||||
New Zealand Oil & Gas | 48,333 | 22 | ||||||
| Description | Shares | Market Value ($ Thousands) | ||||||
Scales | 10,857 | $ | 26 | |||||
|
| |||||||
| 48 | ||||||||
|
| |||||||
Norway — 1.8% | ||||||||
Aker, Cl A | 2,025 | 75 | ||||||
Bonheur | 1,888 | 12 | ||||||
DnB | 41,581 | 613 | ||||||
Marine Harvest | 6,530 | 117 | ||||||
Norsk Hydro | 72,018 | 340 | ||||||
Selvaag Bolig | 4,994 | 24 | ||||||
Statoil ADR | 22,427 | 390 | ||||||
|
| |||||||
| 1,571 | ||||||||
|
| |||||||
Panama — 0.3% | ||||||||
Copa Holdings, Cl A | 2,818 | 250 | ||||||
|
| |||||||
Peru — 0.4% | ||||||||
Credicorp | 2,003 | 314 | ||||||
Empresa Siderurgica del Peru SAA* | 50,198 | 5 | ||||||
|
| |||||||
| 319 | ||||||||
|
| |||||||
Philippines — 0.1% | ||||||||
Cebu Air | 2,290 | 5 | ||||||
Top Frontier Investment Holdings* | 9,930 | 48 | ||||||
|
| |||||||
| 53 | ||||||||
|
| |||||||
Poland — 0.2% | ||||||||
Polski Koncern Naftowy ORLEN | 7,954 | 145 | ||||||
Stalprodukt | 348 | 41 | ||||||
|
| |||||||
| 186 | ||||||||
|
| |||||||
Portugal — 0.2% | ||||||||
Jeronimo Martins | 9,000 | 142 | ||||||
|
| |||||||
Qatar — 0.2% | ||||||||
Ooredoo QSC | 7,839 | 200 | ||||||
|
| |||||||
Russia — 1.8% | ||||||||
Lukoil PJSC ADR | 3,820 | 188 | ||||||
Magnit PJSC GDR | 6,716 | 270 | ||||||
Rosneft PJSC GDR | 111,334 | 586 | ||||||
Sberbank of Russia PJSC ADR | 28,665 | 289 | ||||||
Yandex, Cl A* | 10,557 | 201 | ||||||
|
| |||||||
| 1,534 | ||||||||
|
| |||||||
Singapore — 1.3% | ||||||||
Auric Pacific Group* | 16,500 | 16 | ||||||
Boustead Singapore | 107,700 | 61 | ||||||
CSE Global | 56,000 | 17 | ||||||
DBS Group Holdings | 37,400 | 458 | ||||||
Dutech Holdings | 25,900 | 8 | ||||||
Frencken Group | 11,600 | 2 | ||||||
Golden Agri-Resources | 8,000 | 2 | ||||||
Hong Leong Finance | 10,400 | 16 | ||||||
NatSteel | 8,500 | 10 | ||||||
New Toyo International Holdings | 23,200 | 5 | ||||||
QAF | 6,792 | 6 | ||||||
| 4 | SEI Institutional Investments Trust / Semi-Annual Report / November 30, 2016 |
SCHEDULE OF INVESTMENTS (Unaudited)
Screened World Equity Ex-US Fund (Continued)
November 30, 2016
| Description | Shares | Market Value ($ Thousands) | ||||||
United Industrial | 110,000 | $ | 208 | |||||
United Overseas Bank | 25,348 | 361 | ||||||
|
| |||||||
| 1,170 | ||||||||
|
| |||||||
South Africa — 1.6% | ||||||||
Alexander Forbes Group Holdings | 92,870 | 42 | ||||||
FirstRand | 25,808 | 93 | ||||||
Gold Fields ADR | 23,015 | 71 | ||||||
Kumba Iron Ore* | 6,005 | 71 | ||||||
Merafe Resources | 130,761 | 12 | ||||||
Naspers, Cl N | 4,831 | 708 | ||||||
Sibanye Gold | 40,260 | 84 | ||||||
Standard Bank Group | 28,228 | 304 | ||||||
Telkom | 9,767 | 48 | ||||||
|
| |||||||
| 1,433 | ||||||||
|
| |||||||
South Korea — 3.8% | ||||||||
Hyundai Mobis | 1,739 | 370 | ||||||
Korea Electric Power | 4,514 | 180 | ||||||
Korea Petrochemical Industries | 280 | 54 | ||||||
LG.Philips LCD | 510 | 12 | ||||||
NAVER | 387 | 264 | ||||||
Samsung Electronics | 1,459 | 2,179 | ||||||
SK Hynix | 6,309 | 231 | ||||||
|
| |||||||
| 3,290 | ||||||||
|
| |||||||
Spain — 1.9% | ||||||||
Abertis Infraestructuras | 19,628 | 262 | ||||||
Amadeus IT Group, Cl A | 15,768 | 715 | ||||||
Bankinter | 33,057 | 249 | ||||||
Iberpapel Gestion | 431 | 10 | ||||||
Industria de Diseno Textil | 12,785 | 438 | ||||||
|
| |||||||
| 1,674 | ||||||||
|
| |||||||
Sweden — 2.7% | ||||||||
Atlas Copco, Cl A | 12,854 | 388 | ||||||
Atlas Copco, Cl B | 18,313 | 492 | ||||||
Biotage | 68,876 | 348 | ||||||
Catella | 14,310 | 36 | ||||||
Getinge, Cl B | 19,739 | 301 | ||||||
KappAhl | 18,021 | 86 | ||||||
NCC, Cl A | 546 | 13 | ||||||
Proact IT Group | 1,997 | 29 | ||||||
Probi | 442 | 22 | ||||||
Svenska Handelsbanken, Cl A | 37,335 | 518 | ||||||
Volvo, Cl B | 14,666 | 157 | ||||||
|
| |||||||
| 2,390 | ||||||||
|
| |||||||
Switzerland — 3.9% | ||||||||
Actelion | 720 | 139 | ||||||
Bachem Holding, Cl B | 280 | 23 | ||||||
Cie Financiere Richemont | 3,719 | 243 | ||||||
Cie Financiere Tradition | 468 | 37 | ||||||
Credit Suisse Group ADR | 23,314 | 311 | ||||||
Goldbach Group | 1,151 | 34 | ||||||
| Description | Shares | Market Value ($ Thousands) | ||||||
Holcim | 3,758 | $ | 199 | |||||
Metall Zug | 12 | 38 | ||||||
Nestle | 10,287 | 691 | ||||||
Novartis ADR | 7,202 | 495 | ||||||
Roche Holding | 2,511 | 559 | ||||||
SGS | 118 | 237 | ||||||
Swiss Life Holding | 144 | 39 | ||||||
Wolseley | 5,867 | 340 | ||||||
|
| |||||||
| 3,385 | ||||||||
|
| |||||||
Taiwan — 4.4% | ||||||||
Advanced Semiconductor Engineering | 291,000 | 313 | ||||||
Bizlink Holding | 30,000 | 144 | ||||||
Hon Hai Precision Industry | 289,411 | 745 | ||||||
Hon Hai Precision Industry GDR | 65,921 | 330 | ||||||
Pegatron | 3,633 | 9 | ||||||
Taiwan Semiconductor Manufacturing | 134,000 | 769 | ||||||
Taiwan Semiconductor Manufacturing ADR | 52,810 | 1,568 | ||||||
|
| |||||||
| 3,878 | ||||||||
|
| |||||||
Thailand — 0.9% | ||||||||
Charoen Pokphand Foods | 107,500 | 87 | ||||||
Esso Thailand* | 72,100 | 27 | ||||||
PTT | 30,800 | 301 | ||||||
Siam Cement | 14,300 | 191 | ||||||
Siam Cement NVDR, NVDR | 12,850 | 171 | ||||||
Tata Steel Thailand* | 586,000 | 13 | ||||||
Thai Stanley Electric | 2,900 | 14 | ||||||
|
| |||||||
| 804 | ||||||||
|
| |||||||
Turkey — 1.0% | ||||||||
Akbank | 234,170 | 516 | ||||||
Turkiye Garanti Bankasi | 114,973 | 244 | ||||||
Turkiye Is Bankasi, Cl C | 108,417 | 152 | ||||||
|
| |||||||
| 912 | ||||||||
|
| |||||||
United Kingdom — 11.6% | ||||||||
3i Group | 874 | 8 | ||||||
ASOS* | 2,764 | 174 | ||||||
Associated British Foods | 8,751 | 279 | ||||||
AstraZeneca | 7,647 | 396 | ||||||
Barclays | 298,822 | 806 | ||||||
BHP Billiton | 194 | 3 | ||||||
BP | 22,985 | 132 | ||||||
BP PLC ADR | 7,884 | 276 | ||||||
British American Tobacco | 12,063 | 662 | ||||||
Burberry Group | 8,863 | 158 | ||||||
Capita | 23,953 | 157 | ||||||
Character Group | 4,317 | 23 | ||||||
CML Microsystems | 475 | 2 | ||||||
Coats Group* | 23,012 | 11 | ||||||
Compass Group | 5,169 | 89 | ||||||
Computacenter | 6,818 | 62 | ||||||
CRH | 11,098 | 369 | ||||||
| 5 | SEI Institutional Investments Trust / Semi-Annual Report / November 30, 2016 |
SCHEDULE OF INVESTMENTS (Unaudited)
Screened World Equity Ex-US Fund (Continued)
November 30, 2016
| Description | Shares | Market Value ($ Thousands) | ||||||
Diageo | 21,032 | $ | 527 | |||||
Domino’s Pizza Group | 12,540 | 55 | ||||||
Eco Animal Health Group | 1,679 | 11 | ||||||
Evraz* | 14,693 | 44 | ||||||
Experian | 17,602 | 332 | ||||||
Games Workshop Group | 1,198 | 9 | ||||||
GlaxoSmithKline | 6,380 | 119 | ||||||
Glencore* | 123,897 | 432 | ||||||
Halma | 10,200 | 120 | ||||||
Hargreaves Lansdown | 13,025 | 192 | ||||||
Hargreaves Services | 316 | 1 | ||||||
Howden Joinery Group | 32,127 | 145 | ||||||
HSBC Holdings | 115,664 | 918 | ||||||
Imperial Brands | 4,430 | 190 | ||||||
Indivior | 17,994 | 73 | ||||||
ITV | 165,634 | 348 | ||||||
JD Sports Fashion | 18,645 | 78 | ||||||
Just Eat* | 25,291 | 185 | ||||||
Morgan Sindall | 1,725 | 16 | ||||||
NWF Group* | 13,634 | 30 | ||||||
Premier Oil* | 35,437 | 26 | ||||||
Prudential | 17,710 | 343 | ||||||
Reckitt Benckiser Group | 1,590 | 134 | ||||||
Rio Tinto | 10,792 | 403 | ||||||
Rio Tinto ADR | 9,654 | 366 | ||||||
Rolls-Royce Holdings | 12,794 | 108 | ||||||
Shire | 16,871 | 982 | ||||||
Sky | 271 | 3 | ||||||
St. James’s Place | 16,271 | 191 | ||||||
Taptica international | 3,889 | 7 | ||||||
Tullow Oil* | 33,157 | 123 | ||||||
Vodafone Group ADR | 289 | 7 | ||||||
WPP | 1,599 | 34 | ||||||
|
| |||||||
| 10,159 | ||||||||
|
| |||||||
United States — 3.5% | ||||||||
Carnival, Cl A | 11,882 | 611 | ||||||
Core Laboratories | 5,481 | 612 | ||||||
Everest Re Group | 2,478 | 522 | ||||||
ICON* | 15,322 | 1,159 | ||||||
PriceSmart | 2,183 | 199 | ||||||
|
| |||||||
| 3,103 | ||||||||
|
| |||||||
Total Common Stock | 81,045 | |||||||
|
| |||||||
EXCHANGE TRADED FUNDS — 0.9% |
| |||||||
United States — 0.9% | ||||||||
iShares MSCI EAFE ETF | 10,134 | 575 | ||||||
| Description | Shares | Market Value ($ Thousands) | ||||||
iShares MSCI Emerging Markets Index Fund | 7,198 | $ | 256 | |||||
|
| |||||||
Total Exchange Traded Funds | 831 | |||||||
|
| |||||||
PREFERRED STOCK — 0.8% | ||||||||
Brazil — 0.7% | ||||||||
Banco Bradesco* | 21,392 | 188 | ||||||
Centrais Eletricas Santa Catarina | 8,800 | 38 | ||||||
Itau Unibanco Holding | 8,999 | 94 | ||||||
Itau Unibanco Holding ADR | 18,977 | 196 | ||||||
Metalurgica Gerdau* | 30,400 | 53 | ||||||
Vale, Cl A* | 5,200 | 39 | ||||||
|
| |||||||
| 608 | ||||||||
|
| |||||||
Germany — 0.1% | ||||||||
Einhell Germany | 165 | 7 | ||||||
KSB | 168 | 63 | ||||||
Westag & Getalit | 305 | 6 | ||||||
|
| |||||||
| 76 | ||||||||
|
| |||||||
Total Preferred Stock | 684 | |||||||
|
| |||||||
| Number of Rights | ||||||||
RIGHTS — 0.0% | ||||||||
Italy — 0.0% | ||||||||
UnipolSai, Cl A‡‡ | 63,532 | — | ||||||
|
| |||||||
Total Rights | — | |||||||
|
| |||||||
| Shares | ||||||||
CASH EQUIVALENT — 2.7% | ||||||||
SEI Daily Income Trust, Government Fund, Cl A | ||||||||
0.210%**† | 2,348,522 | 2,349 | ||||||
|
| |||||||
Total Cash Equivalent | 2,349 | |||||||
|
| |||||||
Total Investments — 96.9% | $ | 84,909 | ||||||
|
| |||||||
A list of the open futures contracts held by the Fund at November 30, 2016, is as follows:
| Type of Contract | Number of Contracts Long (Short) | Expiration Date | Unrealized Appreciation (Depreciation) ($ Thousands) | |||||||||
DJ Euro Stoxx 50 Index | 25 | Dec-2016 | $ | 6 | ||||||||
FTSE 100 Index | 6 | Dec-2016 | (1 | ) | ||||||||
Hang Seng Index | 1 | Dec-2016 | 1 | |||||||||
S&P TSX 60 Index | 2 | Dec-2016 | — | |||||||||
SPI 200 Index | 3 | Dec-2016 | 3 | |||||||||
Topix Index | 4 | Dec-2016 | 14 | |||||||||
|
| |||||||||||
| $ | 23 | |||||||||||
|
| |||||||||||
For the period ended November 30, 2016, the total amount of all open futures contracts, as presented in the table above, are representative of the volume of activity for the derivative type during the period.
| 6 | SEI Institutional Investments Trust / Semi-Annual Report / November 30, 2016 |
SCHEDULE OF INVESTMENTS (Unaudited)
Screened World Equity Ex-US Fund (Concluded)
November 30, 2016
Percentages are based on Net Assets of $87,654 ($ Thousands).
| * | Non-income producing security. |
| ** | Rate shown is the 7-day effective yield as of November 30, 2016. |
| † | Investment in Affiliated Security (see Note 6). |
| ‡ | Real Estate Investment Trust. |
| ‡‡ | Expiration date unavailable. |
ADR — American Depositary Receipt
CDI — Average One-Day Interbank Offered Rate
Cl — Class
DJ — Dow Jones
EAFE — Europe, Australasia and Far East
ETF — Exchange Traded Fund
FTSE — Financial Times and Stock Exchange
GDR — Global Depositary Receipt
MSCI — Morgan Stanley Capital International
NVDR — Non-Voting Depositary Receipt
PLC — Public Limited Company
Ser — Series
S&P — Standard & Poor’s
SPI — Share Price Index
TSX — Toronto Stock Exchange
The following is a list of the level of inputs used as of November 30, 2016, in valuing the Fund’s investments and other financial instruments carried at value ($ Thousands):
| Investments in Securities | Level 1 | Level 2 | Level 3 | Total | ||||||||||||
Common Stock | $ | 81,001 | $ | 44 | $ | — | $ | 81,045 | ||||||||
Exchange Traded Funds | 831 | — | — | 831 | ||||||||||||
Preferred Stock | 684 | — | — | 684 | ||||||||||||
Rights | — | — | — | — | ||||||||||||
Cash Equivalent | 2,349 | — | — | 2,349 | ||||||||||||
|
|
|
|
|
|
|
| |||||||||
Total Investments in Securities | $ | 84,865 | $ | 44 | $ | — | $ | 84,909 | ||||||||
|
|
|
|
|
|
|
| |||||||||
| Other Financial Instruments | Level 1 | Level 2 | Level 3 | Total | ||||||||||||
Futures Contracts * | ||||||||||||||||
Unrealized Appreciation | $ | 24 | $ | — | $ | — | $ | 24 | ||||||||
Unrealized Depreciation | (1 | ) | — | — | (1 | ) | ||||||||||
|
|
|
|
|
|
|
| |||||||||
Total Other Financial Instruments | $ | 23 | $ | — | $ | — | $ | 23 | ||||||||
|
|
|
|
|
|
|
| |||||||||
| * | Futures contracts are valued at the unrealized appreciation (depreciation) on the instrument. |
For the period ended November 30, 2016, there were transfers between Level 1 and Level 2 assets and liabilities. The primary reason for changes in the classifications between Levels 1 and 2 occurs when foreign equity securities are fair valued using other observable market-based inputs in place of the closing exchange price due to events occurring after the close of the exchange or market on which the investment is principally traded.
For the period ended November 30, 2016, there were no transfers between Level 2 and Level 3 assets and liabilities.
For more information on valuation inputs, see Note 2 — Significant Accounting Policies in Notes to Financial Statements.
Amounts designated as “—” are $0 or have been rounded to $0.
The accompanying notes are an integral part of the financial statements.
| 7 | SEI Institutional Investments Trust / Semi-Annual Report / November 30, 2016 |
SCHEDULE OF INVESTMENTS (Unaudited)
Emerging Markets Equity Fund
November 30, 2016
| Description | Shares | Market Value ($ Thousands) | ||||||
COMMON STOCK — 81.5% |
| |||||||
Argentina — 2.3% |
| |||||||
Banco Macro ADR | 25,470 | $ | 1,762 | |||||
Grupo Clarin GDR, Cl B | 60,800 | 1,453 | ||||||
Grupo Financiero Galicia ADR | 205,192 | 5,579 | ||||||
MercadoLibre | 53,210 | 8,398 | ||||||
Pampa Energia ADR* | 64,366 | 2,248 | ||||||
Telecom Argentina ADR | 59,300 | 1,067 | ||||||
Transportadora de Gas del Sur ADR | 96,200 | 745 | ||||||
YPF ADR | 134,470 | 2,285 | ||||||
|
| |||||||
| 23,537 | ||||||||
|
| |||||||
Bangladesh — 0.4% | ||||||||
BRAC Bank | 2,006,670 | 1,653 | ||||||
Envoy Textiles | 794,426 | 372 | ||||||
GrameenPhone | 413,070 | 1,474 | ||||||
Square Pharmaceuticals | 349,998 | 1,080 | ||||||
|
| |||||||
| 4,579 | ||||||||
|
| |||||||
Botswana — 0.0% | ||||||||
Sechaba Breweries Holdings | 116,590 | 317 | ||||||
|
| |||||||
Brazil — 3.3% | ||||||||
Ambev | 167,100 | 847 | ||||||
Ambev ADR | 1,118,013 | 5,579 | ||||||
Banco do Brasil* | 574,000 | 4,836 | ||||||
BM&F Bovespa* | 101,600 | 499 | ||||||
Cosan, Cl A | 169,451 | 1,218 | ||||||
Cosan Industria e Comercio (Brazil) | 103,900 | 1,213 | ||||||
EcoRodovias Infraestrutura e Logistica | 670,700 | 1,566 | ||||||
Iochpe Maxion | 71,670 | 280 | ||||||
JBS | 604,200 | 1,743 | ||||||
Lojas Renner | 259,729 | 1,726 | ||||||
Petroleo Brasileiro ADR, Cl A* | 362,840 | 3,403 | ||||||
Porto Seguro | 156,500 | 1,324 | ||||||
Raia Drogasil* | 214,865 | 4,097 | ||||||
Smiles | 63,300 | 896 | ||||||
TOTVS | 38,200 | 243 | ||||||
Ultrapar Participacoes | 45,300 | 925 | ||||||
Vale ADR, Cl B* | 332,500 | 2,494 | ||||||
Valid Solucoes e Servicos de Seguranca em Meios de Pagamento e Identificacao | 58,500 | 443 | ||||||
Via Varejo | 191,800 | 547 | ||||||
WEG | 69,400 | 320 | ||||||
|
| |||||||
| 34,199 | ||||||||
|
| |||||||
Canada — 0.9% | ||||||||
Africa Oil* | 981,632 | 1,383 | ||||||
First Quantum Minerals | 230,799 | 2,633 | ||||||
Gran Tierra Energy* | 1,378,166 | 3,966 | ||||||
Parex Resources* | 103,500 | 1,350 | ||||||
|
| |||||||
| 9,332 | ||||||||
|
| |||||||
Chile — 0.6% | ||||||||
Banco de Chile | 2,083,209 | 236 | ||||||
Banco Santander Chile | 13,843,205 | 751 | ||||||
| Description | Shares | Market Value ($ Thousands) | ||||||
Forus | 309,820 | $ | 1,022 | |||||
Parque Arauco | 949,702 | 2,175 | ||||||
SONDA | 407,879 | 789 | ||||||
Vina Concha y Toro | 518,110 | 830 | ||||||
|
| |||||||
| 5,803 | ||||||||
|
| |||||||
China — 7.5% | ||||||||
Agricultural Bank of China | 4,106,000 | 1,720 | ||||||
Air China | 1,082,000 | 742 | ||||||
Alibaba Group Holding ADR* | 76,400 | 7,183 | ||||||
Baidu ADR* | 6,700 | 1,119 | ||||||
BYD Electronic International | 2,456,000 | 2,185 | ||||||
Changyou.com ADR* | 65,910 | 1,590 | ||||||
China Biologic Products* | 40,887 | 4,895 | ||||||
China Communications Construction | 2,401,000 | 2,879 | ||||||
China Communications Services | 2,242,000 | 1,321 | ||||||
China Everbright Bank | 2,515,000 | 1,193 | ||||||
China Lodging Group ADR | 28,112 | 1,472 | ||||||
China Petroleum & Chemical | 6,562,000 | 4,585 | ||||||
China Petroleum & Chemical ADR | 15,500 | 1,119 | ||||||
China Railway Construction | 1,418,500 | 2,015 | ||||||
China Railway Group | 1,982,000 | 1,789 | ||||||
Cogobuy Group* (A) | 610,000 | 928 | ||||||
Country Garden Holdings | 1,993,000 | 1,115 | ||||||
Ctrip.com International ADR* | 164,178 | 7,426 | ||||||
Dongfeng Motor Group | 2,654,000 | 2,700 | ||||||
Great Wall Motor* | 456,000 | 429 | ||||||
Guangzhou R&F Properties | 1,661,200 | 2,112 | ||||||
Huaneng Power International | 418,000 | 262 | ||||||
JA Solar Holdings ADR* | 68,500 | 373 | ||||||
Kingdee International Software Group* | 3,026,000 | 1,311 | ||||||
Li Ning* | 1,955,500 | 1,439 | ||||||
Maanshan Iron & Steel* | 5,768,000 | 1,517 | ||||||
NetEase ADR | 26,250 | 5,883 | ||||||
New Oriental Education & Technology Group ADR* | 49,100 | 2,463 | ||||||
PICC Property & Casualty | 846,000 | 1,418 | ||||||
Ping An Insurance Group of China | 290,000 | 1,604 | ||||||
Silergy | 129,947 | 1,983 | ||||||
Sinopec Engineering Group | 1,014,000 | 876 | ||||||
Sinopharm Group | 733,600 | 3,424 | ||||||
TAL Education Group ADR* | 13,212 | 1,011 | ||||||
YY ADR* | 22,700 | 982 | ||||||
Zhejiang Expressway | 2,422,000 | 2,589 | ||||||
|
| |||||||
| 77,652 | ||||||||
|
| |||||||
Colombia — 1.1% | ||||||||
Bancolombia | 49,180 | 401 | ||||||
Bancolombia ADR, Cl R | 119,033 | 3,987 | ||||||
Canacol Energy* | 377,810 | 1,278 | ||||||
Cementos Argos | 133,276 | 477 | ||||||
Cemex Latam Holdings* | 549,295 | 1,995 | ||||||
Constructora Conconcreto | 445,980 | 147 | ||||||
| 1 | SEI Institutional Investments Trust / Semi-Annual Report / November 30, 2016 |
SCHEDULE OF INVESTMENTS (Unaudited)
Emerging Markets Equity Fund (Continued)
November 30, 2016
| Description | Shares | Market Value ($ Thousands) | ||||||
Empresa de Telecomunicaciones de Bogota | 5,146,780 | $ | 943 | |||||
Financiera Colombiana | 51,779 | 597 | ||||||
Grupo Aval Acciones y Valores ADR | 174,094 | 1,320 | ||||||
Interconexion Electrica ESP | 115,718 | 375 | ||||||
|
| |||||||
| 11,520 | ||||||||
|
| |||||||
Czech Republic — 0.2% | ||||||||
CEZ | 37,030 | 601 | ||||||
Moneta Money Bank* (A) | 443,668 | 1,449 | ||||||
|
| |||||||
| 2,050 | ||||||||
|
| |||||||
Egypt — 0.7% | ||||||||
Commercial International Bank Egypt GDR | 424,157 | 1,607 | ||||||
Global Telecom Holding SAE GDR* | 2,454,703 | 4,246 | ||||||
Integrated Diagnostics Holdings (A) | 442,170 | 1,592 | ||||||
|
| |||||||
| 7,445 | ||||||||
|
| |||||||
France — 0.1% | ||||||||
Vicat | 15,485 | 897 | ||||||
|
| |||||||
Georgia — 0.2% | ||||||||
BGEO Group | 62,042 | 2,294 | ||||||
|
| |||||||
Greece — 0.5% | ||||||||
Alpha Bank* | 712,728 | 1,437 | ||||||
Eurobank Ergasias* | 622,000 | 466 | ||||||
JUMBO | 139,784 | 1,990 | ||||||
National Bank of Greece* | 7,307,368 | 1,705 | ||||||
|
| |||||||
| 5,598 | ||||||||
|
| |||||||
Hong Kong — 9.2% | ||||||||
Bank of China | 15,715,000 | 7,152 | ||||||
Chaowei Power Holdings | 1,720,000 | 1,574 | ||||||
China Conch Venture Holdings | 534,000 | 984 | ||||||
China Construction Bank | 17,201,000 | 12,818 | ||||||
China Everbright | 730,000 | 1,474 | ||||||
China Evergrande Group | 913,000 | 624 | ||||||
China Lesso Group Holdings | 1,716,000 | 1,241 | ||||||
China Maple Leaf Educational Systems | 1,106,000 | 702 | ||||||
China Medical System Holdings | 946,000 | 1,578 | ||||||
China Mobile | 223,000 | 2,434 | ||||||
China Mobile ADR | 33,100 | 1,810 | ||||||
China Modern Dairy Holdings* | 6,759,000 | 1,795 | ||||||
China Resources Power Holdings | 982,000 | 1,615 | ||||||
China Southern Airlines | 1,688,000 | 968 | ||||||
China Water Affairs Group | 1,078,000 | 771 | ||||||
GOME Electrical Appliances Holdings | 3,906,000 | 509 | ||||||
Guangzhou Automobile Group | 1,034,000 | 1,354 | ||||||
Guotai Junan International Holdings | 6,134,000 | 2,444 | ||||||
Huaneng Renewables | 3,870,000 | 1,247 | ||||||
Industrial & Commercial Bank of China | 10,894,000 | 6,671 | ||||||
Kingboard Chemical Holdings | 676,500 | 1,897 | ||||||
KWG Property Holding | 1,178,000 | 662 | ||||||
Man Wah Holdings | 2,208,000 | 1,540 | ||||||
Minth Group | 418,000 | 1,369 | ||||||
| Description | Shares | Market Value ($ Thousands) | ||||||
Nexteer Automotive Group | 301,000 | $ | 377 | |||||
O-Net Technologies Group* | 1,936,818 | 1,016 | ||||||
Pacific Basin Shipping* | 10,199,000 | 1,670 | ||||||
Pou Sheng International Holdings | 5,820,000 | 1,778 | ||||||
Regina Miracle International Holdings (A) | 2,284,810 | 2,248 | ||||||
Shanghai Industrial Holdings | 514,000 | 1,448 | ||||||
Shanghai Pharmaceuticals Holding | 804,400 | 2,012 | ||||||
Shenzhen Expressway | 566,319 | 544 | ||||||
Shimao Property Holdings | 1,169,000 | 1,528 | ||||||
Sino-Ocean Group Holding | 1,795,500 | 766 | ||||||
Sinosoft Technology Group | 1,137,000 | 534 | ||||||
SJM Holdings | 2,464,000 | 1,995 | ||||||
Skyworth Digital Holdings | 944,000 | 593 | ||||||
Summit Ascent Holdings* | 3,032,000 | 930 | ||||||
Sunac China Holdings | 682,000 | 518 | ||||||
Sunny Optical Technology Group | 206,000 | 1,037 | ||||||
Tencent Holdings | 614,900 | 15,355 | ||||||
Texhong Textile Group | 1,227,197 | 1,848 | ||||||
Tongda Group Holdings | 7,986,275 | 2,348 | ||||||
TravelSky Technology | 454,000 | 952 | ||||||
Want Want China Holdings | 1,382,000 | 882 | ||||||
|
| |||||||
| 95,612 | ||||||||
|
| |||||||
Hungary — 0.4% | ||||||||
OTP Bank | 23,055 | 621 | ||||||
Richter Gedeon Nyrt | 167,120 | 3,337 | ||||||
|
| |||||||
| 3,958 | ||||||||
|
| |||||||
India — 3.1% | ||||||||
Bajaj Auto | 15,250 | 598 | ||||||
Dr Reddy’s Laboratories ADR | 83,100 | 3,883 | ||||||
HCL Technologies | 330,479 | 3,881 | ||||||
HDFC Bank ADR | 107,986 | 6,967 | ||||||
Hindustan Unilever | 67,497 | 832 | ||||||
ICICI Bank ADR | 419,300 | 3,287 | ||||||
Infosys ADR | 161,600 | 2,340 | ||||||
Infosys Technologies | 302,719 | 4,315 | ||||||
Tata Consultancy Services | 78,701 | 2,617 | ||||||
Tata Motors ADR | 77,900 | 2,576 | ||||||
Wipro | 115,577 | 786 | ||||||
|
| |||||||
| 32,082 | ||||||||
|
| |||||||
Indonesia — 3.9% | ||||||||
Ace Hardware Indonesia | 6,723,900 | 429 | ||||||
Adaro Energy | 14,136,374 | 1,596 | ||||||
Adhi Karya Persero | 4,308,200 | 607 | ||||||
Agung Podomoro Land* | 20,012,500 | 349 | ||||||
Astra Agro Lestari | 411,277 | 502 | ||||||
Astra International | 4,137,800 | 2,305 | ||||||
Bank Central Asia | 2,679,627 | 2,827 | ||||||
Bank Negara Indonesia Persero | 3,845,400 | 1,468 | ||||||
Bank Tabungan Negara Persero | 9,225,000 | 1,123 | ||||||
Ciputra Development | 10,520,582 | 1,048 | ||||||
Gudang Garam | 218,800 | 1,049 | ||||||
| 2 | SEI Institutional Investments Trust / Semi-Annual Report / November 30, 2016 |
SCHEDULE OF INVESTMENTS (Unaudited)
Emerging Markets Equity Fund (Continued)
November 30, 2016
| Description | Shares | Market Value ($ Thousands) | ||||||
Indofood Sukses Makmur | 2,129,800 | $ | 1,191 | |||||
Kalbe Farma | 39,820,195 | 4,407 | ||||||
Link Net | 2,968,000 | 1,084 | ||||||
Malindo Feedmill* | 3,961,500 | 383 | ||||||
Matahari Putra Prima | 5,412,000 | 679 | ||||||
Media Nusantara Citra | 5,956,200 | 763 | ||||||
Pakuwon Jati | 104,712,303 | 5,293 | ||||||
Pan Brothers | 11,885,100 | 391 | ||||||
Surya Citra Media | 11,234,255 | 2,081 | ||||||
Telekomunikasi Indonesia Persero | 9,664,200 | 2,696 | ||||||
Telekomunikasi Indonesia Persero ADR | 90,680 | 2,548 | ||||||
Tower Bersama Infrastructure | 365 | — | ||||||
Ultrajaya Milk Industry & Trading* | 7,850,000 | 2,693 | ||||||
United Tractors | 953,700 | 1,478 | ||||||
Vale Indonesia* | 3,725,400 | 929 | ||||||
Waskita Karya Persero | 4,998,800 | 941 | ||||||
|
| |||||||
| 40,860 | ||||||||
|
| |||||||
Isle of Man — 0.0% | ||||||||
Eros International* | 29,602 | 416 | ||||||
|
| |||||||
Israel — 0.1% | ||||||||
Ceragon Network* | 315,009 | 725 | ||||||
|
| |||||||
Ivory Coast — 0.2% | ||||||||
Societe Generale de Banques en Cote d’Ivoire | 1,120 | 261 | ||||||
Sonatel | 32,578 | 1,264 | ||||||
|
| |||||||
| 1,525 | ||||||||
|
| |||||||
Kashmiri — 0.1% | ||||||||
Advanced Process Systems* | 46,589 | 958 | ||||||
|
| |||||||
Kazakhstan — 0.6% | ||||||||
Halyk Savings Bank of Kazakhstan JSC GDR* | 720,960 | 4,030 | ||||||
KazMunaiGas Exploration Production JSC GDR* | 127,460 | 988 | ||||||
KCell GDR | 270,676 | 853 | ||||||
|
| |||||||
| 5,871 | ||||||||
|
| |||||||
Kenya — 0.4% | ||||||||
ARM Cement* | 10 | — | ||||||
East African Breweries | 167,963 | 409 | ||||||
Equity Group Holdings | 8,068,606 | 2,378 | ||||||
Safaricom | 7,946,290 | 1,553 | ||||||
|
| |||||||
| 4,340 | ||||||||
|
| |||||||
Malaysia — 0.8% | ||||||||
AirAsia | 3,976,600 | 2,457 | ||||||
Axiata Group | 375,800 | 353 | ||||||
CIMB Group Holdings | 798,800 | 817 | ||||||
IHH Healthcare | 2,754,595 | 4,071 | ||||||
Karex | 1,790,162 | 966 | ||||||
|
| |||||||
| 8,664 | ||||||||
|
| |||||||
Mauritius — 0.1% | ||||||||
MCB Group | 244,290 | 1,454 | ||||||
|
| |||||||
| Description | Shares | Market Value ($ Thousands) | ||||||
Mexico — 2.8% | ||||||||
Alfa, Cl A | 503,000 | $ | 669 | |||||
America Movil, Ser L | 630,800 | 384 | ||||||
Arca Continental | 238,802 | 1,270 | ||||||
Banregio Grupo Financiero | 856,980 | 4,611 | ||||||
Controladora Vuela Cia de Aviacion ADR* | 63,007 | 923 | ||||||
Fomento Economico Mexicano | 114,900 | 904 | ||||||
Gentera | 323,600 | 514 | ||||||
Gruma, Ser B, Cl B | 155,255 | 1,866 | ||||||
Grupo Aeroportuario del Centro Norte, Cl B | 109,129 | 517 | ||||||
Grupo Aeroportuario del Pacifico, Ser B, Cl B | 50,200 | 431 | ||||||
Grupo Lala, Cl B | 485,288 | 735 | ||||||
Grupo Mexico, Ser B | 166,300 | 458 | ||||||
Grupo Televisa ADR | 163,798 | 3,402 | ||||||
Inmobiliaria Vesta | 932,385 | 1,119 | ||||||
Kimberly-Clark de Mexico, Cl A | 2,152,445 | 3,785 | ||||||
Megacable Holdings | 375,189 | 1,167 | ||||||
Mexichem | 367,676 | 878 | ||||||
Wal-Mart de Mexico | 3,064,130 | 5,662 | ||||||
|
| |||||||
| 29,295 | ||||||||
|
| |||||||
Morocco — 0.4% | ||||||||
Attijariwafa Bank | 48,430 | 1,889 | ||||||
Ciments du Maroc | 7,180 | 899 | ||||||
Cosumar | 40,420 | 1,113 | ||||||
|
| |||||||
| 3,901 | ||||||||
|
| |||||||
Nigeria — 0.2% | ||||||||
Guaranty Trust Bank | 8,078,095 | 581 | ||||||
Presco | 1,618,660 | 227 | ||||||
SEPLAT Petroleum Development | 734,571 | 801 | ||||||
Zenith Bank | 11,963,979 | 525 | ||||||
|
| |||||||
| 2,134 | ||||||||
|
| |||||||
Oman — 0.1% | ||||||||
Bank Muscat | 1,152,293 | 1,257 | ||||||
|
| |||||||
Pakistan — 1.3% | ||||||||
Bank Alfalah | 4,104,940 | 1,284 | ||||||
DG Khan Cement | 353,090 | 643 | ||||||
Engro Fertilizers | 7,410,000 | 4,554 | ||||||
Habib Bank | 1,491,706 | 3,235 | ||||||
Pak Elektron | 912,200 | 608 | ||||||
PAK Suzuki Motor | 47,519 | 240 | ||||||
Pakistan State Oil | 531,000 | 2,020 | ||||||
United Bank | 625,780 | 1,245 | ||||||
|
| |||||||
| 13,829 | ||||||||
|
| |||||||
Panama — 0.6% | ||||||||
Avianca Holdings ADR | 432,599 | 3,037 | ||||||
Copa Holdings, Cl A | 34,781 | 3,091 | ||||||
|
| |||||||
| 6,128 | ||||||||
|
| |||||||
Peru — 1.3% | ||||||||
Alicorp | 757,698 | 1,631 | ||||||
| 3 | SEI Institutional Investments Trust / Semi-Annual Report / November 30, 2016 |
SCHEDULE OF INVESTMENTS (Unaudited)
Emerging Markets Equity Fund (Continued)
November 30, 2016
| Description | Shares | Market Value ($ Thousands) | ||||||
Cementos Pacasmayo SAA | 1,046,600 | $ | 1,933 | |||||
Cia de Minas Buenaventura ADR | 244,450 | 2,731 | ||||||
Credicorp | 34,668 | 5,432 | ||||||
Ferreycorp | 1,298,960 | 651 | ||||||
InRetail Peru* (A) | 27,646 | 526 | ||||||
Intercorp Financial Services | 17,100 | 540 | ||||||
|
| |||||||
| 13,444 | ||||||||
|
| |||||||
Philippines — 3.2% | ||||||||
Ayala Land | 1,972,800 | 1,307 | ||||||
BDO Unibank | 2,110,881 | 4,749 | ||||||
Cosco Capital | 6,542,000 | 1,115 | ||||||
East West Banking | 2,247,000 | 860 | ||||||
Emperador | 3,491,700 | 498 | ||||||
GT Capital Holdings | 43,850 | 1,022 | ||||||
Jollibee Foods | 576,170 | 2,505 | ||||||
Megawide Construction* | 6,590,000 | 2,009 | ||||||
Megaworld | 15,360,407 | 1,139 | ||||||
Nickel Asia | 6,122,823 | 1,023 | ||||||
Pilipinas Shell Petroleum* | 1,302,000 | 1,754 | ||||||
PNOC Energy Development (Philippines) | 5,939,200 | 612 | ||||||
Puregold Price Club | 1,784,303 | 1,402 | ||||||
Robinsons Land | 5,267,100 | 2,727 | ||||||
Robinsons Retail Holdings | 1,558,270 | 2,267 | ||||||
Security Bank | 334,350 | 1,222 | ||||||
SM Prime Holdings | 2,243,500 | 1,199 | ||||||
Universal Robina | 1,362,315 | 4,664 | ||||||
Xurpas | 4,020,000 | 784 | ||||||
|
| |||||||
| 32,858 | ||||||||
|
| |||||||
Poland — 1.8% | ||||||||
Bank Millennium* | 1,176,556 | 1,488 | ||||||
CCC | 19,489 | 925 | ||||||
Energa | 435,289 | 826 | ||||||
Eurocash | 447,262 | 4,152 | ||||||
Grupa Lotos* | 155,149 | 1,365 | ||||||
Kernel Holding | 80,180 | 1,245 | ||||||
Orange Polska* | 1,050,772 | 1,351 | ||||||
PGE | 305,383 | 676 | ||||||
PKP Cargo* | 114,389 | 1,310 | ||||||
Polski Koncern Naftowy ORLEN | 220,482 | 4,021 | ||||||
Powszechny Zaklad Ubezpieczen | 85,415 | 603 | ||||||
Synthos | 348,546 | 364 | ||||||
|
| |||||||
| 18,326 | ||||||||
|
| |||||||
Qatar — 0.4% | ||||||||
Al Khalij Commercial Bank | 118,280 | 560 | ||||||
Barwa Real Estate | 133,536 | 1,130 | ||||||
Commercial Bank QSC | 42,221 | 383 | ||||||
Qatar Electricity & Water | 14,800 | 866 | ||||||
United Development | 321,820 | 1,625 | ||||||
|
| |||||||
| 4,564 | ||||||||
|
| |||||||
| Description | Shares | Market Value ($ Thousands) | ||||||
Romania — 0.9% | ||||||||
Banca Transilvania | 10,746,043 | $ | 5,953 | |||||
BRD-Groupe Societe Generale | 399,330 | 1,026 | ||||||
OMV Petrom* | 7,374,250 | 400 | ||||||
Societatea Nationala de Gaze Naturale ROMGAZ | 28,914 | 165 | ||||||
Societatea Nationala de Gaze Naturale ROMGAZ GDR | 366,051 | 2,032 | ||||||
|
| |||||||
| 9,576 | ||||||||
|
| |||||||
Russia — 2.8% | ||||||||
Gazprom ADR | 470,323 | 2,182 | ||||||
Gazprom PJSC ADR | 227,612 | 1,049 | ||||||
Globaltrans Investment GDR | 139,415 | 774 | ||||||
Lukoil PJSC ADR | 124,563 | 6,107 | ||||||
Mail.Ru Group GDR* | 43,943 | 791 | ||||||
PhosAgro PJSC GDR | 78,630 | 1,081 | ||||||
Rosneft PJSC GDR | 111,388 | 586 | ||||||
Sberbank of Russia PJSC ADR | 361,404 | 3,623 | ||||||
Sistema GDR | 89,605 | 740 | ||||||
Surgutneftegas ADR | 253,086 | 1,166 | ||||||
Tatneft ADR | 20,770 | 760 | ||||||
Tatneft PJSC ADR | 29,414 | 1,070 | ||||||
X5 Retail Group GDR* | 45,018 | 1,351 | ||||||
Yandex, Cl A* | 392,136 | 7,455 | ||||||
|
| |||||||
| 28,735 | ||||||||
|
| |||||||
Singapore — 0.2% | ||||||||
Yoma Strategic Holdings | 5,030,000 | 2,054 | ||||||
|
| |||||||
South Africa — 2.7% | ||||||||
Barclays Africa Group | 118,524 | 1,329 | ||||||
Barloworld | 372,156 | 2,837 | ||||||
Bidvest Group | 69,199 | 803 | ||||||
FirstRand | 1,122,146 | 4,040 | ||||||
Foschini Group | 35,225 | 373 | ||||||
Liberty Holdings | 85,760 | 677 | ||||||
Life Healthcare Group Holdings | 225,108 | 498 | ||||||
Mediclinic International | 123,000 | 1,094 | ||||||
MMI Holdings | 683,583 | 1,071 | ||||||
Mondi | 17,133 | 346 | ||||||
Nampak* | 463,379 | 522 | ||||||
Netcare | 237,019 | 528 | ||||||
Sasol | 16,245 | 439 | ||||||
Shoprite Holdings | 218,293 | 2,909 | ||||||
Sibanye Gold | 827,518 | 1,721 | ||||||
Sibanye Gold ADR | 49,905 | 415 | ||||||
SPAR Group | 33,118 | 447 | ||||||
Standard Bank Group | 118,504 | 1,276 | ||||||
Steinhoff International Holdings | 303,872 | 1,410 | ||||||
Telkom | 241,052 | 1,196 | ||||||
Tiger Brands | 64,912 | 1,824 | ||||||
Truworths International | 103,446 | 518 | ||||||
Tsogo Sun Holdings | 237,444 | 478 | ||||||
| 4 | SEI Institutional Investments Trust / Semi-Annual Report / November 30, 2016 |
SCHEDULE OF INVESTMENTS (Unaudited)
Emerging Markets Equity Fund (Continued)
November 30, 2016
| Description | Shares | Market Value ($ Thousands) | ||||||
Vodacom Group | 144,943 | $ | 1,496 | |||||
|
| |||||||
| 28,247 | ||||||||
|
| |||||||
South Korea — 7.2% | ||||||||
Amorepacific | 12,443 | 3,491 | ||||||
BNK Financial Group | 85,113 | 652 | ||||||
CJ | 3 | 1 | ||||||
Coway | 14,619 | 1,057 | ||||||
Dongbu Insurance | 26,894 | 1,679 | ||||||
Hana Financial Group | 76,662 | 2,108 | ||||||
Hanwha | 27,152 | 820 | ||||||
Hanwha Techwin | 34,521 | 1,413 | ||||||
Heung-A Shipping, Cl A | 313,605 | 342 | ||||||
Hyosung | 12,474 | 1,483 | ||||||
Hyundai Marine & Fire Insurance | 109,144 | 3,398 | ||||||
Hyundai Mobis | 4,963 | 1,057 | ||||||
Jusung Engineering* | 233,385 | 1,845 | ||||||
Kangwon Land | 37,221 | 1,135 | ||||||
KB Financial Group | 66,102 | 2,381 | ||||||
KEPCO Plant Service & Engineering | 16,497 | 814 | ||||||
Kia Motors | 133,604 | 4,274 | ||||||
Kolon Industries | 17,390 | 1,040 | ||||||
Korea Aerospace Industries | 17,884 | 1,014 | ||||||
Korea Electric Power | 47,929 | 1,907 | ||||||
Korea Electric Power ADR | 170,400 | 3,372 | ||||||
KT&G | 21,220 | 1,906 | ||||||
LG | 39,670 | 1,917 | ||||||
LG Display ADR | 162,200 | 1,927 | ||||||
LG Household & Health Care | 1,076 | 724 | ||||||
LG.Philips LCD | 18,494 | 443 | ||||||
Mando | 11,258 | 2,412 | ||||||
Nong Shim | 2,519 | 701 | ||||||
POSCO ADR | 30,000 | 1,603 | ||||||
Posco Daewoo | 18,516 | 422 | ||||||
Samsung Biologics* | 13,829 | 1,822 | ||||||
Samsung Electronics | 9,296 | 13,884 | ||||||
SIMMTECH | 150,090 | 1,451 | ||||||
SK Hynix | 60,445 | 2,218 | ||||||
SK Innovation | 7,334 | 957 | ||||||
SK Materials | 16,810 | 2,200 | ||||||
SK Telecom | 6,083 | 1,176 | ||||||
SK Telecom ADR | 10,900 | 231 | ||||||
Soulbrain | 37,580 | 1,678 | ||||||
Vieworks | 29,710 | 1,479 | ||||||
|
| |||||||
| 74,434 | ||||||||
|
| |||||||
Switzerland — 0.1% | ||||||||
Wizz Air Holdings* (A) | 56,272 | 1,178 | ||||||
|
| |||||||
Taiwan — 9.2% | ||||||||
Advanced Semiconductor Engineering | 1,213,000 | 1,303 | ||||||
Asia Cement | 1,311,000 | 1,154 | ||||||
Asustek Computer | 155,000 | 1,284 | ||||||
Catcher Technology | 268,000 | 1,947 | ||||||
| Description | Shares | Market Value ($ Thousands) | ||||||
Chailease Holding | 519,000 | $ | 886 | |||||
Chicony Electronics | 289,103 | 681 | ||||||
Chroma ATE | 642,000 | 1,591 | ||||||
Chunghwa Telecom | 275,000 | 928 | ||||||
Compal Electronics | 3,390,000 | 1,930 | ||||||
Coretronic | 929,600 | 992 | ||||||
CTCI | 378,000 | 598 | ||||||
E Ink Holdings | 1,843,000 | 1,315 | ||||||
Eclat Textile | 298,643 | 3,092 | ||||||
Egis Technology* | 304,000 | 2,685 | ||||||
Foxconn Technology | 364,580 | 956 | ||||||
Fubon Financial Holding | 2,135,000 | 3,312 | ||||||
Global PMX | 307,000 | 1,180 | ||||||
Gourmet Master | 158,950 | 1,324 | ||||||
Highwealth Construction | 442,600 | 664 | ||||||
Hon Hai Precision Industry | 2,786,375 | 7,169 | ||||||
Hotai Motor | 74,000 | 851 | ||||||
Inventec | 2,110,000 | 1,427 | ||||||
Lite-On Technology | 1,468,769 | 2,318 | ||||||
Macauto Industrial | 339,000 | 1,835 | ||||||
Mercuries Life Insurance* | 2,115,000 | 1,141 | ||||||
Merida Industry | 279,000 | 1,221 | ||||||
Micro-Star International | 434,000 | 1,157 | ||||||
PChome Online | 265,000 | 2,403 | ||||||
Pegatron | 1,767,000 | 4,208 | ||||||
Phison Electronics | 128,000 | 978 | ||||||
Powertech Technology | 1,667,000 | 4,283 | ||||||
President Chain Store | 54,000 | 406 | ||||||
Silicon Motion Technology ADR | 40,972 | 1,884 | ||||||
Simplo Technology | 479,000 | 1,416 | ||||||
St. Shine Optical | 50,000 | 957 | ||||||
Taishin Financial Holding | 1,695,405 | 622 | ||||||
Taiwan Semiconductor Manufacturing | 852,000 | 4,892 | ||||||
Taiwan Semiconductor Manufacturing ADR | 663,402 | 19,696 | ||||||
TCI | 178,000 | 955 | ||||||
TTY Biopharm | 256,000 | 781 | ||||||
TYC Brother Industrial | 1,096,000 | 1,166 | ||||||
Vanguard International Semiconductor | 395,000 | 745 | ||||||
Win Semiconductors | 360,000 | 1,024 | ||||||
Wistron | 41,729 | 30 | ||||||
Wistron NeWeb | 410,000 | 1,213 | ||||||
WPG Holdings | 2,055,000 | 2,544 | ||||||
|
| |||||||
| 95,144 | ||||||||
|
| |||||||
Thailand — 3.1% | ||||||||
Bangkok Life Assurance | 685,600 | 1,014 | ||||||
Beauty Community | 3,327,700 | 1,026 | ||||||
Charoen Pokphand Foods | 3,170,100 | 2,554 | ||||||
Delta Electronics Thailand | 501,200 | 1,064 | ||||||
Home Product Center | 2,583,600 | 746 | ||||||
IRPC | 4,583,400 | 578 | ||||||
Kiatnakin Bank | 1,274,900 | 1,974 | ||||||
Krung Thai Bank | 1,817,100 | 896 | ||||||
| 5 | SEI Institutional Investments Trust / Semi-Annual Report / November 30, 2016 |
SCHEDULE OF INVESTMENTS (Unaudited)
Emerging Markets Equity Fund (Continued)
November 30, 2016
| Description | Shares | Market Value ($ Thousands) | ||||||
Land & Houses NVDR | 10,820,424 | $ | 2,820 | |||||
Minor International NVDR | 2,659,636 | 2,795 | ||||||
PTT | 660,600 | 6,462 | ||||||
PTT Global Chemical | 476,300 | 834 | ||||||
Sansiri | 11,920,200 | 545 | ||||||
Siam Cement | 98,100 | 1,336 | ||||||
Sino-Thai Engineering & Construction NVDR | 3,999,779 | 3,251 | ||||||
Taokaenoi Food & Marketing | 1,049,600 | 794 | ||||||
Thai Oil | 737,500 | 1,530 | ||||||
Thanachart Capital | 1,492,500 | 1,841 | ||||||
|
| |||||||
| 32,060 | ||||||||
|
| |||||||
Turkey — 1.2% | ||||||||
Coca-Cola Icecek | 416,039 | 3,982 | ||||||
Emlak Konut Gayrimenkul Yatirim Ortakligi | 822,884 | 694 | ||||||
Eregli Demir ve Celik Fabrikalari | 830,686 | 1,141 | ||||||
Ford Otomotiv Sanayi | 49,102 | 413 | ||||||
Selcuk Ecza Deposu Ticaret ve Sanayi A.S. | 358,361 | 332 | ||||||
TAV Havalimanlari Holding | 169,419 | 639 | ||||||
Tekfen Holding | 430,358 | 762 | ||||||
Tupras Turkiye Petrol Rafinerileri | 35,256 | 704 | ||||||
Turkiye Garanti Bankasi | 139,000 | 296 | ||||||
Turkiye Is Bankasi, Cl C | 581,246 | 817 | ||||||
Turkiye Vakiflar Bankasi Tao, Cl D | 1,250,439 | 1,521 | ||||||
Yazicilar Holding, Cl A | 254,763 | 909 | ||||||
|
| |||||||
| 12,210 | ||||||||
|
| |||||||
Ukraine — 0.1% | ||||||||
MHP GDR | 70,521 | 628 | ||||||
|
| |||||||
United Arab Emirates — 2.1% | ||||||||
Aldar Properties PJSC | 4,387,580 | 2,962 | ||||||
DAMAC Properties Dubai | 3,148,565 | 1,886 | ||||||
Dubai Islamic Bank | 2,239,722 | 3,195 | ||||||
Emaar Properties | 3,927,429 | 7,293 | ||||||
Emirates NBD | 300,000 | 660 | ||||||
First Gulf Bank | 443,622 | 1,401 | ||||||
NMC Health | 192,253 | 3,243 | ||||||
Ras Al Khaimah Ceramics | 1,309,459 | 831 | ||||||
|
| |||||||
| 21,471 | ||||||||
|
| |||||||
United Kingdom — 1.2% | ||||||||
Amerisur Resources* | 1,686,221 | 611 | ||||||
Georgia Healthcare Group* (A) | 255,480 | 1,174 | ||||||
KAZ Minerals* | 582,756 | 2,640 | ||||||
MHP GDR | 93,939 | 836 | ||||||
TBC Bank Group* | 186,170 | 3,091 | ||||||
Tullow Oil* | 1,043,800 | 3,884 | ||||||
|
| |||||||
| 12,236 | ||||||||
|
| |||||||
United States — 1.9% | ||||||||
Globant* | 40,382 | 1,383 | ||||||
Kansas City Southern | 54,996 | 4,879 | ||||||
Luxoft Holding, Cl A* | 73,292 | 4,020 | ||||||
Navios Maritime Partners* | 154,194 | 261 | ||||||
| Description | Shares | Market Value ($ Thousands) | ||||||
PriceSmart | 91,950 | $ | 8,395 | |||||
Tahoe Resources | 71,662 | 686 | ||||||
|
| |||||||
| 19,624 | ||||||||
|
| |||||||
Total Common Stock | 845,021 | |||||||
|
| |||||||
| Number of Participation Notes | ||||||||
PARTICIPATION NOTES — 7.5% |
| |||||||
Cayman Islands — 0.3% |
| |||||||
Hemas Holdings, | 688,148 | 440 | ||||||
LAUGFS Gas, Expires 11/16/2018* | 704,271 | 153 | ||||||
Tokyo Cement Lanka, | 456,690 | 186 | ||||||
Vietnam Dairy Products JSC, | 289,077 | 1,762 | ||||||
|
| |||||||
| 2,541 | ||||||||
|
| |||||||
Chile — 0.2% | ||||||||
SACI Falabella, | 298,427 | 2,343 | ||||||
|
| |||||||
China — 0.2% | ||||||||
Huangshan Tourism Development, Expires 11/06/2020* | 665,628 | 1,569 | ||||||
|
| |||||||
Colombia — 0.1% | ||||||||
Baco Davivienda, | 22,810 | 212 | ||||||
Cemex Latam Holdings, | 199,176 | 710 | ||||||
Constructora Conconcreto, | 497,710 | 163 | ||||||
Empresa de Telecomunicaciones de Bogota, Expires 12/05/2018* | 1,784,970 | 324 | ||||||
|
| |||||||
| 1,409 | ||||||||
|
| |||||||
Egypt — 0.3% | ||||||||
Emaar Misr for Development, Expires 05/02/2018* | 8,585,143 | 1,460 | ||||||
Palm Hills Developments, Expires 05/02/2018* | 9,418,487 | 1,638 | ||||||
|
| |||||||
| 3,098 | ||||||||
|
| |||||||
India — 1.5% | ||||||||
Adani Tran, | 1,620,817 | 1,366 | ||||||
Bharat Financial Inclusion, | 25,322 | 273 | ||||||
Biocon, Expires 04/22/2021* | 135,382 | 1,796 | ||||||
Jain Irrigation, Expires 10/05/2021* | 1,321,969 | 1,719 | ||||||
Jamna Auto, Expires 06/17/2021* | 588,070 | 1,515 | ||||||
LIC Housing Finance, Expires 03/08/2019* | 173,372 | 1,426 | ||||||
LIC Housing Finance, Expires 03/28/2019* | 537 | 4 | ||||||
PNC Infratech, Expires 06/01/2021* | 762,735 | 1,213 | ||||||
PVR, Expires 06/19/2020* | 76,113 | 1,266 | ||||||
Rural Electrification, Expires 09/29/2021* | 893,728 | 1,784 | ||||||
SKS Microfinance, Expires 11/05/2018* | 181,956 | 1,962 | ||||||
| 6 | SEI Institutional Investments Trust / Semi-Annual Report / November 30, 2016 |
SCHEDULE OF INVESTMENTS (Unaudited)
Emerging Markets Equity Fund (Continued)
November 30, 2016
| Description | Number of Participation Notes | Market Value ($ Thousands) | ||||||
Voltas, Expires 05/28/2020* | 313,581 | $ | 1,433 | |||||
|
| |||||||
| 15,757 | ||||||||
|
| |||||||
Kuwait — 0.4% | ||||||||
Kuwait Food Americana SAK, Expires 02/14/2019* | 120,850 | 1,032 | ||||||
Mabanee, Expires 08/05/2019* | 374,283 | 1,004 | ||||||
Mabanee SAK, Expires 08/05/2019* | 39,130 | 105 | ||||||
National Bank of Kuwait SAKP, Expires 11/20/2018* | 802,509 | 1,647 | ||||||
|
| |||||||
| 3,788 | ||||||||
|
| |||||||
Pakistan — 0.6% | ||||||||
DG Khan Cement, Expires 01/17/2017* | 581,000 | 1,057 | ||||||
United Bank, Expires 01/17/2017* | 136,660 | 270 | ||||||
United Bank, Expires 10/31/2016* | 2,526,373 | 5,023 | ||||||
|
| |||||||
| 6,350 | ||||||||
|
| |||||||
Saudi Arabia — 1.4% | ||||||||
CO For Cooperative Insurance, Expires 07/31/2017* | 184,712 | 4,951 | ||||||
Fawaz Abdulaziz Al Hokair, Expires 03/02/2017* | 171,140 | 1,586 | ||||||
Mouwasat Medical Services, Expires 09/20/2017* | 11,000 | 396 | ||||||
Mouwasat Medical Services, Expires 09/20/2017* | 59,887 | 2,165 | ||||||
National Industrialization, Expires 07/12/2017* | 591,200 | 2,642 | ||||||
United International Transportation, Expires 02/26/2018* | 191,430 | 1,662 | ||||||
United International Transportation, Expires 07/31/2017* | 154,290 | 1,331 | ||||||
|
| |||||||
| 14,733 | ||||||||
|
| |||||||
Sri Lanka — 0.3% |
| |||||||
Danang Rubber JSC, Expires 06/03/2019* | 26,270 | 36 | ||||||
Hatton National Bank, Expires 08/16/2018* | 753,561 | 1,107 | ||||||
John Keells Holdings, Expires 07/05/2019* | 1,046,495 | 1,041 | ||||||
Military Commercial Joint Stock Bank, Expires 02/12/2018* | 653,688 | 381 | ||||||
Vingroup, Expires 07/31/2019* | 212,236 | 390 | ||||||
|
| |||||||
| 2,955 | ||||||||
|
| |||||||
Turkey — 0.1% | ||||||||
Turkiye Garanti Bankasi, Expires 11/30/2017* | 486,183 | 1,022 | ||||||
|
| |||||||
United States — 1.2% | ||||||||
CitiGroup Global, Expires 04/16/2018* | 1,215,438 | 2,499 | ||||||
East African Breweries, Expires 10/31/2017* | 787,144 | 1,916 | ||||||
FPT, Expires 09/10/2018* | 1,220,890 | 2,314 | ||||||
National Bank of Kuwait, Expires 04/30/2018* | 668,144 | 1,375 | ||||||
| Description | Number of Participation Notes | Market Value ($ Thousands) | ||||||
National Industrialization, Expires 07/12/2017* | 841,331 | $ | 3,764 | |||||
|
| |||||||
| 11,868 | ||||||||
|
| |||||||
Vietnam — 0.9% | ||||||||
Danang Rubber, Expires 06/03/2019* | 600,625 | 822 | ||||||
Hoa Phat Group, Expires 07/24/2018* | 1,277,637 | 2,352 | ||||||
Military Commercial Joint Stock Bank, Expires 04/20/2017* | 1,237,950 | 722 | ||||||
Military Commercial Joint Stock Bank, Expires 02/12/2018* | 1,740,505 | 1,016 | ||||||
Mobile World Investment, Expires 08/15/2017* | 93,570 | 675 | ||||||
Vietnam Dairy Products, Expires 12/05/2016* | 240,898 | 1,468 | ||||||
Vingroup, Expires 07/31/2019* | 501,687 | 921 | ||||||
Vingroup, Expires 01/20/2017* | 920,154 | 1,690 | ||||||
|
| |||||||
| 9,666 | ||||||||
|
| |||||||
Total Participation Notes | 77,099 | |||||||
|
| |||||||
| Shares | ||||||||
EXCHANGE TRADED FUNDS — 6.6% |
| |||||||
United States — 6.6% |
| |||||||
iShares MSCI Emerging Markets Index Fund | 1,577,056 | 55,986 | ||||||
iShares MSCI Frontier 100 ETF | 24,730 | 610 | ||||||
WisdomTree India Earnings Fund | 595,100 | 12,045 | ||||||
|
| |||||||
Total Exchange Traded Funds | 68,641 | |||||||
|
| |||||||
PREFERRED STOCK — 2.0% |
| |||||||
Brazil — 1.5% |
| |||||||
Banco Bradesco* | 193,480 | 1,702 | ||||||
Bradespar* | 87,721 | 388 | ||||||
Braskem | 222,700 | 1,811 | ||||||
Cia Brasileira de Distribuicao | 40,100 | 647 | ||||||
Cia Energetica de Minas Gerais | 335,400 | 783 | ||||||
Cia Paranaense de Energia | 164,900 | 1,411 | ||||||
Itausa - Investimentos Itau | 2,134,390 | 5,433 | ||||||
Suzano Papel e Celulose, Cl A | 702,300 | 2,668 | ||||||
Telefonica Brasil | 63,900 | 853 | ||||||
|
| |||||||
| 15,696 | ||||||||
|
| |||||||
Colombia — 0.4% | ||||||||
Banco Davivienda | 403,031 | 3,780 | ||||||
Bancolombia | 42,105 | 358 | ||||||
Financiera Colombiana | 25,414 | 264 | ||||||
|
| |||||||
| 4,402 | ||||||||
|
| |||||||
| 7 | SEI Institutional Investments Trust / Semi-Annual Report / November 30, 2016 |
SCHEDULE OF INVESTMENTS (Unaudited)
Emerging Markets Equity Fund (Concluded)
November 30, 2016
| Description | Shares | Market Value ($ Thousands) | ||||||
South Korea — 0.1% | ||||||||
LG Chemical | 6,973 | $ | 981 | |||||
|
| |||||||
Total Preferred Stock | 21,079 | |||||||
|
| |||||||
| Number of Rights | ||||||||
RIGHTS — 0.0% |
| |||||||
South Korea — 0.0% |
| |||||||
Heung-A Shipping, Cl A, Expires 12/27/2016* | 61,786 | 6 | ||||||
|
| |||||||
Taiwan — 0.0% | ||||||||
Taishin Financial, Expires 12/23/2016* | 64,349 | — | ||||||
|
| |||||||
Total Rights | 6 | |||||||
|
| |||||||
| Shares | ||||||||
CASH EQUIVALENT — 0.4% | ||||||||
SEI Daily Income Trust, Government Fund, Cl A | ||||||||
0.210%**† | 3,965,930 | 3,966 | ||||||
|
| |||||||
Total Cash Equivalent | 3,966 | |||||||
|
| |||||||
Total Investments — 98.0% | $ | 1,015,812 | ||||||
|
| |||||||
Percentages are based on Net Assets of $1,036,477 ($ Thousands).
| * | Non-income producing security. |
| ** | Rate shown is the 7-day effective yield as of November 30, 2016. |
| † | Investment in Affiliated Security (see Note 6). |
| (A) | Security exempt from registration under Rule 144A of the Securities Act of 1933. These securities may be resold in transactions exempt from registration normally to qualified institutions. On November 30, 2016, the value of these securities amounted to $9,094 ($ Thousands), representing 0.7% of the net assets of the Fund. |
ADR — American Depositary Receipt
Cl — Class
ETF — Exchange Traded Fund
GDR — Global Depositary Receipt
MSCI — Morgan Stanley Capital International
Ser — Series
The following is a list of the level of inputs used as of November 30, 2016, in valuing the Fund’s investments carried at value ($ Thousands).
| Investments in Securities | Level 1 | Level 2 | Level 3 | Total | ||||||||||||
Common Stock | $ | 843,706 | $ | 1,315 | $ | — | $ | 845,021 | ||||||||
Participation Notes | — | 77,099 | — | 77,099 | ||||||||||||
Exchange Traded Funds | 68,641 | — | — | 68,641 | ||||||||||||
Preferred Stock | 20,815 | 264 | — | 21,079 | ||||||||||||
Rights | 6 | — | — | 6 | ||||||||||||
Cash Equivalent | 3,966 | — | — | 3,966 | ||||||||||||
|
|
|
|
|
|
|
| |||||||||
Total Investments in Securities | $ | 937,134 | $ | 78,678 | $ | — | $ | 1,015,812 | ||||||||
|
|
|
|
|
|
|
| |||||||||
For the period ended November 30, 2016, there were transfers between Level 1 and Level 2 assets and liabilities. The primary reason for changes in the classifications between Levels 1 and 2 occurs when foreign equity securities are fair valued using other observable market-based inputs in place of the closing exchange price due to events occurring after the close of the exchange or market on which the investment is principally traded.
For the period ended November 30, 2016, there were no transfers between Level 2 and Level 3 assets and liabilities.
For more information on valuation inputs, see Note 2 — Significant Accounting Policies in Notes to Financial Statements.
Amounts designated as “—” are $0 or have been rounded to $0.
The accompanying notes are an integral part of the financial statements.
| 8 | SEI Institutional Investments Trust / Semi-Annual Report / November 30, 2016 |
CONSOLIDATED SCHEDULE OF INVESTMENTS (Unaudited)
Dynamic Asset Allocation Fund
November 30, 2016
| Description | Shares | Market Value ($ Thousands) | ||||||
COMMON STOCK — 94.9% |
| |||||||
Consumer Discretionary — 11.7% | ||||||||
Adient* | 370 | $ | 20 | |||||
Advance Auto Parts | 8,500 | 1,443 | ||||||
Amazon.com* | 43,300 | 32,500 | ||||||
AutoNation* | 8,500 | 380 | ||||||
AutoZone* | 3,300 | 2,584 | ||||||
Bed Bath & Beyond | 17,100 | 766 | ||||||
Best Buy | 29,100 | 1,330 | ||||||
BorgWarner | 23,500 | 837 | ||||||
Carmax* | 21,800 | 1,260 | ||||||
Carnival, Cl A | 46,600 | 2,396 | ||||||
CBS, Cl B | 44,043 | 2,674 | ||||||
Charter Communications, Cl A* | 23,600 | 6,497 | ||||||
Chipotle Mexican Grill, Cl A* | 3,100 | 1,229 | ||||||
Coach | 32,300 | 1,175 | ||||||
Comcast, Cl A | 264,300 | 18,371 | ||||||
Darden Restaurants | 14,800 | 1,085 | ||||||
Delphi Automotive | 30,000 | 1,920 | ||||||
Discovery Communications, Cl A* | 18,600 | 504 | ||||||
Discovery Communications, Cl C* | 26,800 | 709 | ||||||
Dollar General | 27,900 | 2,157 | ||||||
Dollar Tree* | 26,284 | 2,317 | ||||||
DR Horton | 39,200 | 1,087 | ||||||
Expedia | 13,500 | 1,675 | ||||||
Foot Locker | 14,800 | 1,061 | ||||||
Ford Motor | 429,600 | 5,138 | ||||||
Gap | 26,100 | 652 | ||||||
Garmin | 11,700 | 610 | ||||||
General Motors | 157,500 | 5,438 | ||||||
Genuine Parts | 16,351 | 1,573 | ||||||
Goodyear Tire & Rubber | 27,300 | 838 | ||||||
H&R Block | 21,800 | 483 | ||||||
Hanesbrands | 41,400 | 962 | ||||||
Harley-Davidson | 18,800 | 1,145 | ||||||
Harman International Industries | 7,300 | 798 | ||||||
Hasbro | 12,400 | 1,059 | ||||||
Home Depot | 135,932 | 17,590 | ||||||
Interpublic Group | 46,500 | 1,119 | ||||||
Kohl’s | 18,800 | 1,012 | ||||||
L Brands | 25,700 | 1,805 | ||||||
Leggett & Platt | 14,400 | 692 | ||||||
Lennar, Cl A | 22,000 | 936 | ||||||
LKQ* | 33,600 | 1,103 | ||||||
Lowe’s | 96,500 | 6,808 | ||||||
Macy’s | 33,900 | 1,431 | ||||||
Marriott International, Cl A | 35,620 | 2,806 | ||||||
Mattel | 39,200 | 1,238 | ||||||
McDonald’s | 93,400 | 11,140 | ||||||
Michael Kors Holdings* | 17,500 | 814 | ||||||
Mohawk Industries* | 7,228 | 1,427 | ||||||
NetFlix* | 47,400 | 5,546 | ||||||
Newell Brands | 51,999 | 2,444 | ||||||
| Description | Shares | Market Value ($ Thousands) | ||||||
News | 14,100 | $ | 168 | |||||
News, Cl A | 46,700 | 540 | ||||||
NIKE, Cl B | 149,600 | 7,490 | ||||||
Nordstrom | 13,800 | 772 | ||||||
Omnicom Group | 25,400 | 2,208 | ||||||
O’Reilly Automotive* | 10,700 | 2,937 | ||||||
Priceline Group* | 5,500 | 8,270 | ||||||
PulteGroup | 36,900 | 696 | ||||||
PVH | 9,300 | 985 | ||||||
Ralph Lauren, Cl A | 6,500 | 680 | ||||||
Ross Stores | 42,800 | 2,893 | ||||||
Royal Caribbean Cruises | 19,200 | 1,555 | ||||||
Scripps Networks Interactive, Cl A | 11,300 | 783 | ||||||
Signet Jewelers | 8,400 | 767 | ||||||
Staples | 69,900 | 676 | ||||||
Starbucks | 162,100 | 9,397 | ||||||
Target | 63,600 | 4,912 | ||||||
TEGNA | 23,600 | 529 | ||||||
Tiffany | 11,100 | 915 | ||||||
Time Warner | 86,200 | 7,915 | ||||||
TJX | 73,200 | 5,734 | ||||||
Tractor Supply | 14,700 | 1,103 | ||||||
TripAdvisor* | 13,400 | 647 | ||||||
Twenty-First Century Fox, Cl A | 117,200 | 3,294 | ||||||
Twenty-First Century Fox, Cl B | 55,700 | 1,563 | ||||||
Ulta Salon Cosmetics & Fragrance* | 6,400 | 1,661 | ||||||
Under Armour, Cl A* | 21,900 | 674 | ||||||
Under Armour, Cl C* | 22,336 | 576 | ||||||
Urban Outfitters* | 10,300 | 325 | ||||||
VF | 35,600 | 1,941 | ||||||
Viacom, Cl B | 39,700 | 1,488 | ||||||
Walt Disney | 162,562 | 16,113 | ||||||
Whirlpool | 8,200 | 1,332 | ||||||
Wyndham Worldwide | 12,900 | 929 | ||||||
Wynn Resorts | 8,200 | 836 | ||||||
Yum! Brands | 39,100 | 2,479 | ||||||
|
| |||||||
| 258,367 | ||||||||
|
| |||||||
Consumer Staples — 8.8% | ||||||||
Altria Group | 214,100 | 13,687 | ||||||
Archer-Daniels-Midland | 62,800 | �� | 2,715 | |||||
Brown-Forman, Cl B | 19,000 | 862 | ||||||
Campbell Soup | 22,400 | 1,274 | ||||||
Church & Dwight | 29,500 | 1,292 | ||||||
Clorox | 14,700 | 1,699 | ||||||
Coca-Cola | 427,300 | 17,242 | ||||||
Colgate-Palmolive | 98,600 | 6,432 | ||||||
ConAgra Foods | 47,100 | 1,728 | ||||||
Constellation Brands, Cl A | 19,200 | 2,902 | ||||||
Costco Wholesale | 47,800 | 7,175 | ||||||
Coty, Cl A | 52,579 | 984 | ||||||
CVS Health | 116,700 | 8,973 | ||||||
| 1 | SEI Institutional Investments Trust / Semi-Annual Report / November 30, 2016 |
CONSOLIDATED SCHEDULE OF INVESTMENTS (Unaudited)
Dynamic Asset Allocation Fund (Continued)
November 30, 2016
| Description | Shares | Market Value ($ Thousands) | ||||||
Dr. Pepper Snapple Group | 20,450 | $ | 1,774 | |||||
Estee Lauder, Cl A | 24,900 | 1,935 | ||||||
General Mills | 66,200 | 4,034 | ||||||
Hershey | 15,400 | 1,488 | ||||||
Hormel Foods | 31,200 | 1,068 | ||||||
JM Smucker | 12,982 | 1,635 | ||||||
Kellogg | 27,100 | 1,951 | ||||||
Kimberly-Clark | 40,200 | 4,647 | ||||||
Kraft Heinz | 65,866 | 5,378 | ||||||
Kroger | 106,500 | 3,440 | ||||||
McCormick | 13,100 | 1,195 | ||||||
Mead Johnson Nutrition, Cl A | 20,800 | 1,499 | ||||||
Molson Coors Brewing, Cl B | 20,600 | 2,019 | ||||||
Mondelez International, Cl A | 172,200 | 7,102 | ||||||
Monster Beverage* | 45,720 | 2,046 | ||||||
PepsiCo | 158,262 | 15,842 | ||||||
Philip Morris International | 170,600 | 15,061 | ||||||
Procter & Gamble | 293,836 | 24,230 | ||||||
Reynolds American | 91,142 | 4,931 | ||||||
Sysco | 55,100 | 2,934 | ||||||
Tyson Foods, Cl A | 32,800 | 1,863 | ||||||
Walgreens Boots Alliance | 93,400 | 7,914 | ||||||
Wal-Mart Stores | 165,955 | 11,688 | ||||||
Whole Foods Market | 37,000 | 1,124 | ||||||
|
| |||||||
| 193,763 | ||||||||
|
| |||||||
Energy — 7.2% | ||||||||
Anadarko Petroleum | 61,100 | 4,225 | ||||||
Apache | 42,300 | 2,790 | ||||||
Baker Hughes | 48,100 | 3,094 | ||||||
Cabot Oil & Gas | 52,700 | 1,166 | ||||||
Chesapeake Energy* | 91,100 | 638 | ||||||
Chevron | 207,600 | 23,160 | ||||||
Cimarex Energy | 10,800 | 1,489 | ||||||
Concho Resources* | 15,300 | 2,188 | ||||||
ConocoPhillips | 135,100 | 6,555 | ||||||
Devon Energy | 57,500 | 2,779 | ||||||
EOG Resources | 60,800 | 6,233 | ||||||
EQT | 19,800 | 1,388 | ||||||
Exxon Mobil | 458,000 | 39,983 | ||||||
FMC Technologies* | 26,500 | 908 | ||||||
Halliburton | 94,800 | 5,033 | ||||||
Helmerich & Payne | 12,700 | 961 | ||||||
Hess | 29,900 | 1,673 | ||||||
Kinder Morgan | 214,577 | 4,764 | ||||||
Marathon Oil | 96,700 | 1,746 | ||||||
Marathon Petroleum | 59,610 | 2,803 | ||||||
Murphy Oil | 17,300 | 587 | ||||||
National Oilwell Varco | 42,800 | 1,599 | ||||||
Newfield Exploration* | 22,400 | 1,013 | ||||||
Noble Energy | 45,900 | 1,751 | ||||||
Occidental Petroleum | 84,200 | 6,008 | ||||||
| Description | Shares | Market Value ($ Thousands) | ||||||
ONEOK | 24,300 | $ | 1,335 | |||||
Phillips 66 | 49,200 | 4,087 | ||||||
Pioneer Natural Resources | 19,000 | 3,630 | ||||||
Range Resources | 22,200 | 781 | ||||||
Schlumberger | 152,337 | 12,804 | ||||||
Southwestern Energy* | 56,900 | 646 | ||||||
Spectra Energy | 75,900 | 3,108 | ||||||
Tesoro | 13,000 | 1,058 | ||||||
Transocean | 38,700 | 499 | ||||||
Valero Energy | 51,400 | 3,164 | ||||||
Williams | 77,200 | 2,370 | ||||||
|
| |||||||
| 158,016 | ||||||||
|
| |||||||
Financials — 13.8% | ||||||||
Affiliated Managers Group* | 5,900 | 874 | ||||||
Aflac | 44,500 | 3,176 | ||||||
Allstate | 41,500 | 2,902 | ||||||
American Express | 86,200 | 6,210 | ||||||
American International Group | 112,800 | 7,144 | ||||||
Ameriprise Financial | 17,600 | 2,010 | ||||||
Aon | 29,700 | 3,389 | ||||||
Arthur J Gallagher | 19,400 | 977 | ||||||
Assurant | 5,700 | 492 | ||||||
Bank of America | 1,123,300 | 23,724 | ||||||
Bank of New York Mellon | 117,700 | 5,581 | ||||||
BB&T | 89,500 | 4,050 | ||||||
Berkshire Hathaway, Cl B* | 209,700 | 33,015 | ||||||
BlackRock, Cl A | 13,541 | 5,021 | ||||||
Capital One Financial | 55,000 | 4,622 | ||||||
Charles Schwab | 131,500 | 5,084 | ||||||
Chubb | 50,726 | 6,493 | ||||||
Cincinnati Financial | 17,100 | 1,312 | ||||||
Citigroup | 319,600 | 18,022 | ||||||
Citizens Financial Group | 57,900 | 1,940 | ||||||
CME Group, Cl A | 36,800 | 4,155 | ||||||
Comerica | 20,200 | 1,288 | ||||||
Discover Financial Services | 43,500 | 2,948 | ||||||
E*TRADE Financial* | 30,000 | 1,035 | ||||||
Fifth Third Bancorp | 84,700 | 2,204 | ||||||
Franklin Resources | 37,400 | 1,468 | ||||||
Goldman Sachs Group | 41,200 | 9,035 | ||||||
Hartford Financial Services Group | 43,800 | 2,064 | ||||||
Huntington Bancshares | 121,400 | 1,513 | ||||||
Intercontinental Exchange | 65,845 | 3,648 | ||||||
Invesco | 44,800 | 1,403 | ||||||
JPMorgan Chase | 398,800 | 31,972 | ||||||
KeyCorp | 120,300 | 2,082 | ||||||
Legg Mason | 8,600 | 274 | ||||||
Leucadia National | 38,500 | 848 | ||||||
Lincoln National | 24,900 | 1,596 | ||||||
Loews | 30,500 | 1,362 | ||||||
M&T Bank | 17,321 | 2,493 | ||||||
| 2 | SEI Institutional Investments Trust / Semi-Annual Report / November 30, 2016 |
CONSOLIDATED SCHEDULE OF INVESTMENTS (Unaudited)
Dynamic Asset Allocation Fund (Continued)
November 30, 2016
| Description | Shares | Market Value ($ Thousands) | ||||||
Marsh & McLennan | 56,200 | $ | 3,895 | |||||
MetLife | 119,800 | 6,590 | ||||||
Moody’s | 18,447 | 1,854 | ||||||
Morgan Stanley | 162,800 | 6,733 | ||||||
Nasdaq | 12,300 | 788 | ||||||
Navient | 32,100 | 553 | ||||||
Northern Trust | 24,200 | 1,988 | ||||||
People’s United Financial | 34,100 | 638 | ||||||
PNC Financial Services Group | 54,500 | 6,024 | ||||||
Principal Financial Group | 30,500 | 1,760 | ||||||
Progressive | 65,600 | 2,184 | ||||||
Prudential Financial | 47,500 | 4,779 | ||||||
Regions Financial | 139,600 | 1,890 | ||||||
S&P Global | 29,200 | 3,475 | ||||||
SunTrust Banks | 56,200 | 2,920 | ||||||
Synchrony Financial | 86,811 | 3,000 | ||||||
T. Rowe Price Group | 27,800 | 2,059 | ||||||
Torchmark | 12,300 | 862 | ||||||
Travelers | 31,300 | 3,548 | ||||||
Unum Group | 26,100 | 1,103 | ||||||
US Bancorp | 178,100 | 8,837 | ||||||
Wells Fargo | 500,000 | 26,460 | ||||||
Willis Towers Watson | 14,695 | 1,828 | ||||||
XL Group | 31,400 | 1,135 | ||||||
Zions Bancorporation | 22,900 | 911 | ||||||
|
| |||||||
| 303,240 | ||||||||
|
| |||||||
Health Care — 13.0% |
| |||||||
Abbott Laboratories | 160,400 | 6,106 | ||||||
AbbVie | 178,200 | 10,835 | ||||||
Aetna | 38,118 | 4,987 | ||||||
Agilent Technologies | 34,600 | 1,522 | ||||||
Alexion Pharmaceuticals* | 24,900 | 3,052 | ||||||
Allergan | 41,300 | 8,025 | ||||||
AmerisourceBergen | 17,861 | 1,393 | ||||||
Amgen | 82,000 | 11,814 | ||||||
Anthem | 29,000 | 4,133 | ||||||
Baxter International | 52,738 | 2,340 | ||||||
Becton Dickinson | 23,077 | 3,902 | ||||||
Biogen* | 23,900 | 7,028 | ||||||
Boston Scientific* | 152,600 | 3,122 | ||||||
Bristol-Myers Squibb | 182,800 | 10,317 | ||||||
C.R. Bard | 8,400 | 1,769 | ||||||
Cardinal Health | 35,900 | 2,549 | ||||||
Celgene* | 85,700 | 10,156 | ||||||
Centene* | 19,700 | 1,135 | ||||||
Cerner* | 34,000 | 1,693 | ||||||
Cigna | 27,800 | 3,746 | ||||||
Cooper | 5,500 | 905 | ||||||
Danaher | 67,200 | 5,253 | ||||||
DaVita HealthCare Partners* | 18,500 | 1,172 | ||||||
DENTSPLY SIRONA | 24,800 | 1,443 | ||||||
| Description | Shares | Market Value ($ Thousands) | ||||||
Edwards Lifesciences* | 23,700 | $ | 1,964 | |||||
Eli Lilly | 107,600 | 7,222 | ||||||
Endo International* | 22,700 | 363 | ||||||
Express Scripts Holding* | 69,500 | 5,274 | ||||||
Gilead Sciences | 144,456 | 10,646 | ||||||
HCA Holdings* | 33,300 | 2,361 | ||||||
Henry Schein* | 9,300 | 1,385 | ||||||
Hologic* | 32,000 | 1,225 | ||||||
Humana | 16,600 | 3,530 | ||||||
Illumina* | 16,400 | 2,184 | ||||||
Intuitive Surgical* | 4,300 | 2,768 | ||||||
Johnson & Johnson | 302,100 | 33,624 | ||||||
Laboratory Corp of America Holdings* | 10,854 | 1,366 | ||||||
Mallinckrodt* | 12,200 | 643 | ||||||
McKesson | 25,100 | 3,610 | ||||||
Medtronic | 151,355 | 11,050 | ||||||
Merck | 304,200 | 18,614 | ||||||
Mettler Toledo International* | 3,000 | 1,236 | ||||||
Mylan* | 51,500 | 1,885 | ||||||
Patterson | 8,900 | 345 | ||||||
PerkinElmer | 12,000 | 609 | ||||||
Perrigo | 16,400 | 1,416 | ||||||
Pfizer | 667,596 | 21,457 | ||||||
Quest Diagnostics | 15,300 | 1,338 | ||||||
Regeneron Pharmaceuticals* | 8,300 | 3,148 | ||||||
St. Jude Medical | 32,200 | 2,550 | ||||||
Stryker | 33,700 | 3,830 | ||||||
Thermo Fisher Scientific | 43,000 | 6,025 | ||||||
UnitedHealth Group | 104,700 | 16,576 | ||||||
Universal Health Services, Cl B | 10,400 | 1,279 | ||||||
Varian Medical Systems* | 10,400 | 934 | ||||||
Vertex Pharmaceuticals* | 27,500 | 2,244 | ||||||
Waters* | 8,500 | 1,144 | ||||||
Zimmer Biomet Holdings | 22,600 | 2,302 | ||||||
Zoetis, Cl A | 53,367 | 2,689 | ||||||
|
| |||||||
| 287,233 | ||||||||
|
| |||||||
Industrials — 9.9% | ||||||||
3M | 66,900 | 11,489 | ||||||
Acuity Brands | 4,600 | 1,156 | ||||||
Alaska Air Group | 13,700 | 1,127 | ||||||
Allegion | 11,333 | 758 | ||||||
American Airlines Group | 57,000 | 2,647 | ||||||
Ametek | 26,800 | 1,269 | ||||||
Arconic | 50,267 | 969 | ||||||
Boeing | 63,500 | 9,561 | ||||||
C.H. Robinson Worldwide | 16,500 | 1,235 | ||||||
Caterpillar | 64,300 | 6,144 | ||||||
Cintas | 9,600 | 1,100 | ||||||
CSX | 105,300 | 3,771 | ||||||
Cummins | 17,400 | 2,467 | ||||||
Deere | 32,500 | 3,256 | ||||||
| 3 | SEI Institutional Investments Trust / Semi-Annual Report / November 30, 2016 |
CONSOLIDATED SCHEDULE OF INVESTMENTS (Unaudited)
Dynamic Asset Allocation Fund (Continued)
November 30, 2016
| Description | Shares | Market Value ($ Thousands) | ||||||
Delta Air Lines | 81,100 | $ | 3,907 | |||||
Dover | 17,000 | 1,234 | ||||||
Dun & Bradstreet | 4,500 | 548 | ||||||
Eaton | 49,901 | 3,319 | ||||||
Emerson Electric | 69,800 | 3,940 | ||||||
Equifax | 13,400 | 1,534 | ||||||
Expeditors International of Washington | 19,900 | 1,050 | ||||||
Fastenal | 33,200 | 1,574 | ||||||
FedEx | 27,049 | 5,184 | ||||||
Flowserve | 14,000 | 664 | ||||||
Fluor | 15,200 | 813 | ||||||
Fortive | 34,250 | 1,883 | ||||||
Fortune Brands Home & Security | 16,900 | 932 | ||||||
General Dynamics | 32,000 | 5,611 | ||||||
General Electric | 989,392 | 30,434 | ||||||
Honeywell International | 84,300 | 9,605 | ||||||
Illinois Tool Works | 35,256 | 4,413 | ||||||
Ingersoll-Rand | 28,900 | 2,154 | ||||||
Jacobs Engineering Group* | 12,500 | 775 | ||||||
JB Hunt Transport Services | 9,700 | 925 | ||||||
Johnson Controls International | 102,704 | 4,620 | ||||||
Kansas City Southern | 12,500 | 1,109 | ||||||
L-3 Communications Holdings, Cl 3 | 8,600 | 1,357 | ||||||
Lockheed Martin | 28,024 | 7,433 | ||||||
Masco | 36,300 | 1,149 | ||||||
Nielsen Holdings | 38,200 | 1,646 | ||||||
Norfolk Southern | 31,700 | 3,375 | ||||||
Northrop Grumman | 19,500 | 4,868 | ||||||
Paccar | 37,600 | 2,337 | ||||||
Parker Hannifin | 15,200 | 2,112 | ||||||
Pentair | 19,346 | 1,112 | ||||||
Pitney Bowes | 23,300 | 334 | ||||||
Quanta Services* | 16,600 | 560 | ||||||
Raytheon | 32,800 | 4,905 | ||||||
Republic Services | 24,800 | 1,376 | ||||||
Robert Half International | 14,100 | 633 | ||||||
Rockwell Automation | 14,200 | 1,899 | ||||||
Rockwell Collins | 14,400 | 1,335 | ||||||
Roper Technologies | 11,300 | 2,047 | ||||||
Ryder System | 6,200 | 485 | ||||||
Snap-on | 6,400 | 1,070 | ||||||
Southwest Airlines | 66,900 | 3,118 | ||||||
Stanley Black & Decker | 17,100 | 2,029 | ||||||
Stericycle* | 10,000 | 730 | ||||||
Textron | 29,800 | 1,372 | ||||||
TransDigm Group | 5,700 | 1,433 | ||||||
Union Pacific | 91,000 | 9,221 | ||||||
United Continental Holdings* | 31,600 | 2,179 | ||||||
United Parcel Service, Cl B | 75,600 | 8,764 | ||||||
United Rentals* | 9,000 | 910 | ||||||
United Technologies | 85,100 | 9,167 | ||||||
Verisk Analytics, Cl A* | 17,600 | 1,462 | ||||||
| Description | Shares | Market Value ($ Thousands) | ||||||
Waste Management | 44,000 | $ | 3,059 | |||||
WW Grainger | 6,200 | 1,430 | ||||||
Xylem | 20,800 | 1,073 | ||||||
|
| |||||||
| 219,157 | ||||||||
|
| |||||||
Information Technology — 19.8% |
| |||||||
Accenture, Cl A | 69,100 | 8,253 | ||||||
Activision Blizzard | 73,900 | 2,705 | ||||||
Adobe Systems* | 55,200 | 5,675 | ||||||
Akamai Technologies* | 20,000 | 1,334 | ||||||
Alliance Data Systems | 6,600 | 1,510 | ||||||
Alphabet, Cl A* | 32,545 | 25,251 | ||||||
Alphabet, Cl C* | 32,622 | 24,729 | ||||||
Amphenol, Cl A | 33,300 | 2,273 | ||||||
Analog Devices | 33,200 | 2,465 | ||||||
Apple | 594,000 | 65,649 | ||||||
Applied Materials | 117,100 | 3,771 | ||||||
Autodesk* | 22,300 | 1,619 | ||||||
Automatic Data Processing | 49,600 | 4,763 | ||||||
Broadcom | 43,893 | 7,483 | ||||||
CA | 34,600 | 1,106 | ||||||
Cisco Systems | 553,100 | 16,493 | ||||||
Citrix Systems* | 17,800 | 1,544 | ||||||
Cognizant Technology Solutions, Cl A* | 67,500 | 3,718 | ||||||
Corning | 103,000 | 2,475 | ||||||
CSRA | 14,500 | 464 | ||||||
Dell Technologies, Cl V* | 1 | — | ||||||
eBay* | 113,700 | 3,162 | ||||||
Electronic Arts* | 33,000 | 2,615 | ||||||
F5 Networks* | 7,500 | 1,056 | ||||||
Facebook, Cl A* | 256,500 | 30,375 | ||||||
Fidelity National Information Services | 35,400 | 2,732 | ||||||
First Solar* | 9,700 | 294 | ||||||
Fiserv* | 24,400 | 2,553 | ||||||
FLIR Systems | 13,700 | 492 | ||||||
Global Payments | 17,712 | 1,214 | ||||||
Harris | 13,600 | 1,408 | ||||||
Hewlett Packard Enterprise | 182,800 | 4,351 | ||||||
HP | 192,600 | 2,966 | ||||||
Intel | 520,500 | 18,061 | ||||||
International Business Machines | 95,658 | 15,518 | ||||||
Intuit | 26,900 | 3,058 | ||||||
Juniper Networks | 44,200 | 1,217 | ||||||
Kla-Tencor | 17,900 | 1,429 | ||||||
Lam Research | 18,087 | 1,918 | ||||||
Linear Technology | 27,300 | 1,707 | ||||||
MasterCard, Cl A | 105,000 | 10,731 | ||||||
Microchip Technology | 23,000 | 1,522 | ||||||
Micron Technology* | 111,900 | 2,185 | ||||||
Microsoft | 858,800 | 51,751 | ||||||
Motorola Solutions | 19,067 | 1,530 | ||||||
NetApp | 32,400 | 1,184 | ||||||
| 4 | SEI Institutional Investments Trust / Semi-Annual Report / November 30, 2016 |
CONSOLIDATED SCHEDULE OF INVESTMENTS (Unaudited)
Dynamic Asset Allocation Fund (Continued)
November 30, 2016
| Description | Shares | Market Value ($ Thousands) | ||||||
Nvidia | 58,500 | $ | 5,394 | |||||
Oracle | 329,700 | 13,251 | ||||||
Paychex | 34,500 | 2,034 | ||||||
PayPal Holdings* | 125,200 | 4,918 | ||||||
Qorvo* | 15,200 | 812 | ||||||
QUALCOMM | 163,100 | 11,112 | ||||||
Red Hat* | 19,900 | 1,574 | ||||||
Salesforce.com* | 71,400 | 5,141 | ||||||
Seagate Technology | 31,700 | 1,271 | ||||||
Skyworks Solutions | 21,400 | 1,645 | ||||||
Symantec | 69,800 | 1,702 | ||||||
TE Connectivity | 40,100 | 2,712 | ||||||
Teradata* | 14,700 | 395 | ||||||
Texas Instruments | 109,600 | 8,103 | ||||||
Total System Services | 19,300 | 950 | ||||||
VeriSign* | 9,600 | 757 | ||||||
Visa, Cl A | 207,500 | 16,044 | ||||||
Western Digital | 30,503 | 1,942 | ||||||
Western Union | 55,100 | 1,159 | ||||||
Xerox | 100,300 | 938 | ||||||
Xilinx | 29,000 | 1,565 | ||||||
Yahoo!* | 96,300 | 3,950 | ||||||
|
| |||||||
| 435,678 | ||||||||
|
| |||||||
Materials — 2.8% | ||||||||
Air Products & Chemicals | 23,400 | 3,380 | ||||||
Albemarle | 12,400 | 1,089 | ||||||
Avery Dennison | 10,400 | 749 | ||||||
Ball | 18,500 | 1,389 | ||||||
CF Industries Holdings | 25,000 | 724 | ||||||
Dow Chemical | 123,000 | 6,854 | ||||||
E.I. du Pont de Nemours | 95,400 | 7,022 | ||||||
Eastman Chemical | 16,100 | 1,209 | ||||||
Ecolab | 28,400 | 3,315 | ||||||
FMC | 15,900 | 892 | ||||||
Freeport-McMoRan, Cl B | 131,300 | 2,016 | ||||||
International Flavors & Fragrances | 8,800 | 1,065 | ||||||
International Paper | 46,600 | 2,270 | ||||||
LyondellBasell Industries, Cl A | 38,100 | 3,441 | ||||||
Martin Marietta Materials | 7,200 | 1,580 | ||||||
Monsanto | 48,700 | 5,002 | ||||||
Mosaic | 40,800 | 1,159 | ||||||
Newmont Mining | 59,400 | 1,927 | ||||||
Nucor | 35,900 | 2,233 | ||||||
Owens-Illinois* | 17,100 | 314 | ||||||
PPG Industries | 28,800 | 2,763 | ||||||
Praxair | 31,664 | 3,809 | ||||||
Sealed Air | 21,900 | 999 | ||||||
Sherwin-Williams | 9,075 | 2,438 | ||||||
Vulcan Materials | 14,300 | 1,797 | ||||||
WestRock | 27,341 | 1,400 | ||||||
|
| |||||||
| 60,836 | ||||||||
|
| |||||||
| Description | Shares | Market Value ($ Thousands) | ||||||
Real Estate — 2.6% |
| |||||||
American Tower, Cl A‡ | 46,847 | $ | 4,791 | |||||
Apartment Investment & Management, Cl A‡ | 17,600 | 741 | ||||||
AvalonBay Communities‡ | 15,100 | 2,484 | ||||||
Boston Properties‡ | 17,200 | 2,131 | ||||||
CBRE Group, Cl A* | 35,000 | 1,016 | ||||||
Crown Castle International‡ | 39,200 | 3,272 | ||||||
Digital Realty Trust‡ | 16,000 | 1,477 | ||||||
Equinix‡ | 7,957 | 2,696 | ||||||
Equity Residential‡ | 40,700 | 2,442 | ||||||
Essex Property Trust‡ | 7,400 | 1,598 | ||||||
Extra Space Storage‡ | 14,600 | 1,024 | ||||||
Federal Realty Investment Trust‡ | 8,200 | 1,152 | ||||||
Four Corners Property Trust‡ | 1 | — | ||||||
General Growth Properties‡ | 65,700 | 1,665 | ||||||
HCP‡ | 52,400 | 1,547 | ||||||
Host Hotels & Resorts‡ | 80,785 | 1,441 | ||||||
Iron Mountain‡ | 27,671 | 913 | ||||||
Kimco Realty‡ | 48,200 | 1,231 | ||||||
Macerich‡ | 14,000 | 951 | ||||||
Prologis‡ | 59,000 | 3,003 | ||||||
Public Storage‡ | 16,700 | 3,495 | ||||||
Realty Income‡ | 29,300 | 1,624 | ||||||
Simon Property Group‡ | 34,800 | 6,252 | ||||||
SL Green Realty‡ | 11,000 | 1,159 | ||||||
UDR‡ | 31,000 | 1,055 | ||||||
Ventas‡ | 39,600 | 2,393 | ||||||
Vornado Realty Trust‡ | 18,300 | 1,789 | ||||||
Welltower‡ | 39,500 | 2,480 | ||||||
Weyerhaeuser‡ | 82,027 | 2,529 | ||||||
|
| |||||||
| 58,351 | ||||||||
|
| |||||||
Telecommunication Services — 2.4% | ||||||||
AT&T | 677,416 | 26,169 | ||||||
CenturyLink | 62,000 | 1,458 | ||||||
Frontier Communications | 130,800 | 477 | ||||||
Level 3 Communications* | 31,100 | 1,713 | ||||||
Verizon Communications | 448,700 | 22,390 | ||||||
|
| |||||||
| 52,207 | ||||||||
|
| |||||||
Utilities — 2.9% | ||||||||
AES | 77,600 | 888 | ||||||
Alliant Energy | 25,100 | 901 | ||||||
Ameren | 26,400 | 1,297 | ||||||
American Electric Power | 54,000 | 3,189 | ||||||
American Water Works | 19,400 | 1,406 | ||||||
CenterPoint Energy | 45,300 | 1,081 | ||||||
CMS Energy | 32,100 | 1,291 | ||||||
Consolidated Edison | 34,400 | 2,400 | ||||||
Dominion Resources | 69,800 | 5,116 | ||||||
DTE Energy | 20,200 | 1,880 | ||||||
Duke Energy | 75,130 | 5,542 | ||||||
| 5 | SEI Institutional Investments Trust / Semi-Annual Report / November 30, 2016 |
CONSOLIDATED SCHEDULE OF INVESTMENTS (Unaudited)
Dynamic Asset Allocation Fund (Continued)
November 30, 2016
| Description | Shares | Market Value ($ Thousands) | ||||||
Edison International | 36,300 | $ | 2,496 | |||||
Entergy | 20,400 | 1,402 | ||||||
Eversource Energy | 35,600 | 1,838 | ||||||
Exelon | 100,000 | 3,251 | ||||||
FirstEnergy | 47,800 | 1,496 | ||||||
NextEra Energy | 51,700 | 5,906 | ||||||
NiSource | 37,600 | 825 | ||||||
NRG Energy | 35,100 | 398 | ||||||
PG&E | 55,900 | 3,287 | ||||||
Pinnacle West Capital | 13,100 | 968 | ||||||
PPL | 75,000 | 2,509 | ||||||
Public Service Enterprise Group | 56,600 | 2,338 | ||||||
SCANA | 16,500 | 1,164 | ||||||
Sempra Energy | 27,000 | 2,695 | ||||||
Southern | 108,100 | 5,061 | ||||||
WEC Energy Group | 33,862 | 1,897 | ||||||
Xcel Energy | 56,900 | 2,220 | ||||||
|
| |||||||
| 64,742 | ||||||||
|
| |||||||
Total Common Stock | 2,091,590 | |||||||
|
| |||||||
EXCHANGE TRADED FUND — 0.3% |
| |||||||
SPDR S&P 500 ETF Trust | 33,451 | 7,372 | ||||||
|
| |||||||
Total Exchange Traded Fund | 7,372 | |||||||
|
| |||||||
| Number of Rights | ||||||||
RIGHTS — 0.0% |
| |||||||
Safeway - PDC*‡‡ | 21,800 | 1 | ||||||
Safeway CVR - Casa Ley*‡‡ | 21,800 | 22 | ||||||
|
| |||||||
Total Rights | 23 | |||||||
|
| |||||||
Total Investments — 95.2% | $ | 2,098,985 | ||||||
|
| |||||||
| Contracts | ||||||||
PURCHASED OPTION (A) — 0.3% |
| |||||||
January 2017, EUR Put, USD Call, Expires 01/06/2017, | 369,539,932 | $ | 7,305 | |||||
|
| |||||||
Total Purchased Option | $ | 7,305 | ||||||
|
| |||||||
A list of the open futures contracts held by the Fund at November 30, 2016, is as follows:
Type of Contract | Number of Contracts Long (Short) | Expiration Date | Unrealized Appreciation (Depreciation) ($ Thousands) | |||||||||
S&P 500 Index E-MINI | (481 | ) | Dec-2016 | $ | (1,441 | ) | ||||||
Topix Index | 835 | Dec-2016 | 9,070 | |||||||||
|
| |||||||||||
| $ | 7,629 | |||||||||||
|
| |||||||||||
For the period ended November 30, 2016, the total amount of all open futures contracts, as presented in the table above, are representative of the volume of activity for the derivative type during the period.
A list of the open forward foreign currency contracts held by the Fund at November 30, 2016, is as follows:
| Settlement Date | Currency to Deliver (Thousands) | Currency To Receive (Thousands) | Unrealized Appreciation (Depreciation) ($ Thousands) | |||||||||||||||||
10/19/16-1/9/17 | EUR | 751,773 | USD | 223,643 | $ | 12,451 | ||||||||||||||
1/9/17 | EUR | 11,900 | USD | 12,640 | (11 | ) | ||||||||||||||
1/9/17 | USD | 7,769 | SAR | 29,424 | 74 | |||||||||||||||
1/9/17 | INR | 176,000 | USD | 2,614 | 55 | |||||||||||||||
1/9/17 | USD | 224,882 | INR | 15,199,069 | (3,912 | ) | ||||||||||||||
1/9/17 | SAR | 439,575 | USD | 114,298 | (2,872 | ) | ||||||||||||||
1/9/17 | KRW | 255,561,130 | USD | 228,432 | 10,686 | |||||||||||||||
1/10/17 | JPY | 280,500 | USD | 2,679 | 210 | |||||||||||||||
1/10/17 | JPY | 592,680 | USD | 5,198 | (18 | ) | ||||||||||||||
|
| |||||||||||||||||||
| $ | 16,663 | |||||||||||||||||||
|
| |||||||||||||||||||
A list of the counterparties for the outstanding forward foreign currency contracts held by the Fund at November 30, 2016, is as follows:
| Counterparty | Currency to Deliver ($ Thousands) | Currency to Receive ($ Thousands) | Unrealized Appreciation (Depreciation) ($ Thousands) | |||||||||
Bank of America | $ | (357,288 | ) | $ | 351,109 | $ | (6,179 | ) | ||||
Goldman Sachs | (5,784 | ) | 6,108 | 324 | ||||||||
Jefferies LLC | (200,731 | ) | 211,274 | 10,543 | ||||||||
JPMorgan Chase Bank | (101,484 | ) | 107,418 | 5,934 | ||||||||
Morgan Stanley | (119,351 | ) | 125,249 | 5,898 | ||||||||
Standard Chartered | (17,015 | ) | 17,158 | 143 | ||||||||
|
| |||||||||||
| $ | 16,663 | |||||||||||
|
| |||||||||||
For the period ended November 30, 2016 the total amount of all open forward foreign currency contracts, as presented in the table above, are representative of the volume of activity for the derivative type during the period.
| 6 | SEI Institutional Investments Trust / Semi-Annual Report / November 30, 2016 |
CONSOLIDATED SCHEDULE OF INVESTMENTS (Unaudited)
Dynamic Asset Allocation Fund (Concluded)
November 30, 2016
A list of the OTC swap agreements held by the Fund at November 30, 2016, is as follows:
| Interest Rate Swaps | ||||||||||||||||
| Counterparty | Fund Pays | Fund Receives | Termination Date | Notional Amount ($ Thousands) | Net Unrealized Appreciation ($ Thousands) | |||||||||||
Bank of America | 1.74% | US CPI URBAN CONSUMERS NSA | 8/24/2026 | $ | 17,222 | $ | 876 | |||||||||
BNP Paribas | 1.76% | US CPI URBAN CONSUMERS NSA | 8/26/2026 | 38,102 | 1,862 | |||||||||||
BNP Paribas | 1.76% | US CPI URBAN CONSUMERS NSA | 8/25/2026 | 51,665 | 2,527 | |||||||||||
|
| |||||||||||||||
| $ | 5,265 | |||||||||||||||
|
| |||||||||||||||
For the period ended November 30, 2016, the total amount of all open swap contracts, as presented in the table above, are representative of the volume of activity for this derivative type during the period.
Percentages are based on Net Assets of $2,203,796 ($ Thousands).
| * | Non-income producing security. |
| ‡ | Real Estate Investment Trust. |
| ‡‡ | Expiration date unavailable. |
| (A) | For the period ended November 30, 2016, the total amount of open purchased options, as presented in the Schedule of Investments, are representative of the volume of activity for these derivative types during the period. |
Cl — Class
CPI — Consumer Price Index
EUR — Euro
INR — Indian Rupee
JPY — Japanese Yen
KRW — Korean Won
LLC — Limited Liability Company
NSA — Not seasonally adjusted
OTC — Over the Counter
S&P — Standard & Poor’s
SAR — Saudi Riyal
SPDR — Standard & Poor’s Depository Receipt
USD — United States Dollar
The following is a list of the level of inputs used as of November 30, 2016, in valuing the Fund’s investments and other financial instruments carried at value ($ Thousands):
| Investments in Securities | Level 1 | Level 2 | Level 3 | Total | ||||||||||||
Common Stock | $ | 2,091,590 | $ | — | $ | — | $ | 2,091,590 | ||||||||
Exchange Traded Fund | 7,372 | — | — | 7,372 | ||||||||||||
Rights | — | 23 | — | 23 | ||||||||||||
|
|
|
|
|
|
|
| |||||||||
Total Investments in Securities | $ | 2,098,962 | $ | 23 | $ | — | $ | 2,098,985 | ||||||||
|
|
|
|
|
|
|
| |||||||||
| Other Financial Instruments | Level 1 | Level 2 | Level 3 | Total | ||||||||||||
Purchased Option | $ | 7,305 | $ | — | $ | — | $ | 7,305 | ||||||||
Futures Contracts* | ||||||||||||||||
Unrealized Appreciation | 9,070 | — | — | 9,070 | ||||||||||||
Unrealized Depreciation | (1,441 | ) | — | — | (1,441 | ) | ||||||||||
Forwards Contracts* | ||||||||||||||||
Unrealized Appreciation | — | 23,476 | — | 23,476 | ||||||||||||
Unrealized Depreciation | — | (6,813 | ) | — | (6,813 | ) | ||||||||||
OTC Swaps | ||||||||||||||||
Interest Rate Swaps* | ||||||||||||||||
Unrealized Appreciation | — | 5,265 | — | 5,265 | ||||||||||||
|
|
|
|
|
|
|
| |||||||||
Total Other Financial Instruments | $ | 14,934 | $ | 21,928 | $ | — | $ | 36,862 | ||||||||
|
|
|
|
|
|
|
| |||||||||
| * | Futures contracts, forwards contracts and swaps are valued at the unrealized appreciation (depreciation) on the instrument. |
For the period ended November 30, 2016, there were no transfers between Level 1 and Level 2 assets and liabilities.
For the period ended November 30, 2016, there were no transfers between Level 2 and Level 3 assets and liabilities.
For more information on valuation inputs, see Note 2 — Significant Accounting Policies in Notes to Financial Statements.
Amounts designated as “—” are $0 or have been rounded to $0.
| 7 | SEI Institutional Investments Trust / Semi-Annual Report / November 30, 2016 |
(b) In accordance with Section 13(c) of the Investment Company Act of 1940 the Screened World Equity Ex-US Fund did not hold any divested securities during the six-months ended November 30, 2015.
| Item 7. | Disclosure of Proxy Voting Policies and Procedures for Closed-End Management Investment Companies. |
Not applicable.
| Item 8. | Portfolio Managers of Closed-End Management Investment Companies. |
Not applicable.
| Item 9. | Purchases of Equity Securities by Closed-End Management Company and Affiliated Purchasers. |
Not applicable.
| Item 10. | Submission of Matters to a Vote of Security Holders. |
The Registrant has a standing Governance Committee (the “Committee”) currently consisting of the Independent Trustees. The Committee is responsible for evaluating and recommending nominees for election to the Registrant’s Board of Trustees (the “Board”). Pursuant to the Committee’s Charter, adopted on June 18th 2004, as amended, the Committee will review all shareholder recommendations for nominations to fill vacancies on the Board if such recommendations are submitted in writing and addressed to the Committee at the Registrant’s office.
| Item 11. | Controls and Procedures. |
(a) The Registrant’s principal executive and principal financial officers, or persons performing similar functions, have concluded that the Registrant’s disclosure controls and procedures (as defined in Rule 30a-3(c) under Act (17 CFR 270.30a-3(c))) are effective, based on the evaluation of these controls and procedures required by Rule 30a-3(b) under the Act and Rules 13a-15(b) or 15d-15(b) under the Exchange Act (17 CFR 240.13a-15(b) or 240.15d-15(b)) as of a date within 90 days of the filing date of this report.
(b) There were no changes in the Registrant’s internal control over financial reporting (as defined in Rule 30a-3(d) under the Act (17 CFR 270.30a-3(d)) that occurred during the second fiscal quarter of the period covered by this report that has materially affected, or is reasonably likely to materially affect, the Registrants internal control over financial reporting.
| Items 12. | Exhibits. |
(a)(1) Not applicable for semi-annual report.
(a)(2) A separate certification of each principal executive officer and principal financial officer of the Registrant as required by Rule 30a-2(a) under the Act (17 CFR 270.30a-2(a)), are filed herewith.
(b) Officer certifications as required by Rule 30a-2(b) under the Act (17 CFR 270.30a-2(b)) also accompany this filing as an exhibit.
SIGNATURES
Pursuant to the requirements of the Securities Exchange Act of 1934 and the Investment Company Act of 1940, the registrant has duly caused this report to be signed on its behalf by the undersigned, thereunto duly authorized.
| SEI Institutional Investments Trust | ||||||
| By | /s/ Robert A. Nesher | |||||
| Robert A. Nesher, President & CEO | ||||||
Date: February 8, 2017
Pursuant to the requirements of the Securities Exchange Act of 1934 and the Investment Company Act of 1940, this report has been signed below by the following persons on behalf of the Registrant and in the capacities and on the dates indicated.
| By | /s/ Robert A. Nesher | |||||
| Robert A. Nesher, President & CEO |
Date: February 8, 2017
| By | /s/ James J. Hoffmayer | |||||
| James J. Hoffmayer, Controller & CFO |
Date: February 8, 2017